file copy - world bank documents & reports
TRANSCRIPT
Repcrit No. 519a-NEP FILE COPYAgyricultural Sector Surveyof Nepal: The General Report(In l-wo Volumes)
Volume II: Annexes 1-8Deccmber 20, 1974
South Asia Projects Department
Noit for Public Use
Doclment of the International Bank for Reconstruction and Developmentlnteinational Development Association
This report was prepared for official use only by the Bank Group. It may notbe ptiblished, quoted or cited without Bank Group authorization. The Bank Group doesnot accept responsibility for the accuracy or completeness of the report.
Pub
lic D
iscl
osur
e A
utho
rized
Pub
lic D
iscl
osur
e A
utho
rized
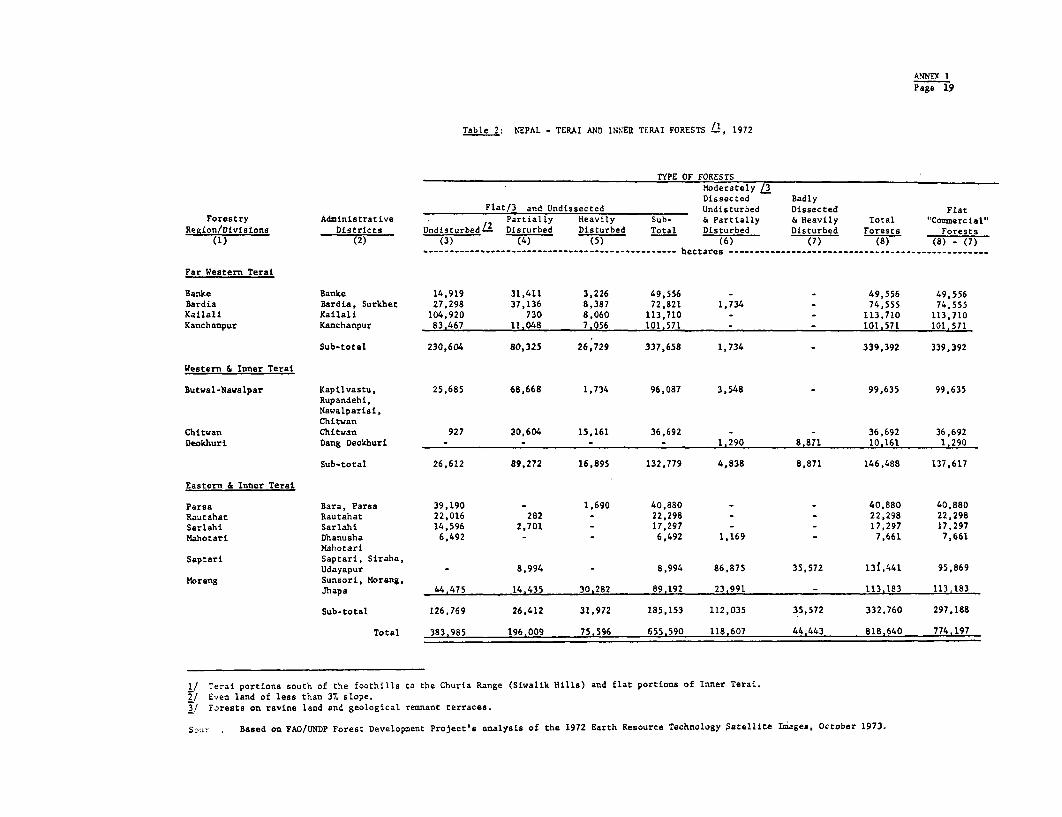
Pub
lic D
iscl
osur
e A
utho
rized
Pub
lic D
iscl
osur
e A
utho
rized
CURRENCY EQUIVALENTS
US$1 = Nepalese Rupees (Rs) 10.56Rs 1 US$0.094
= Indian Rupees (IR) 0.726Rs 1,000,000 = US$94.340
WEIGHTS AND MEASURES
Metric System
1 kilogram (kg) = 2.20 pounds1 quintal = 100 kg = 220 pounds1 metric ton (m ton) = 1,000 kg = 2,204.62 pounds = 0.98 long ton1 meter (m) = 39.37 inches = 3.28 feet = 1.09 yards1 kilometer (km) = 0.62 mile1 bigha = 0.68 ha 2 = 1.7 acres1 hectare (ha) 2 = 10,000 m = 2.47 acres1 square kilometer (km ) = 100 ha = 0.39 square mile
Crop Year: June 1 - May 31 Financial Year: July 16 - July 15(exact dates vary with lunar calendar)
ABBREVIATIONS AND ACRONYMS
ADBN Agricultural Development Bank of NepalANC = Agricultural Marketing CorporationCEDA = Center for Economic 1)evelopment and Administration,
Tribhuvan UniversityDA = Department of AgricultureDF = Department of ForestryDIHM = Department of Irrigation, llydrology and MeteorologyDT = Department of TransportFAMSD = Food and Marketing Services Department, MFAIFMS = Farm Management StudyHMG = Government of NepalIAAS = Institute of Agriculture and Animal Science,
Tribhuvan UniversityJT = Junior Technicians, DAJTA Junior Technical Assistants, DAM = Million
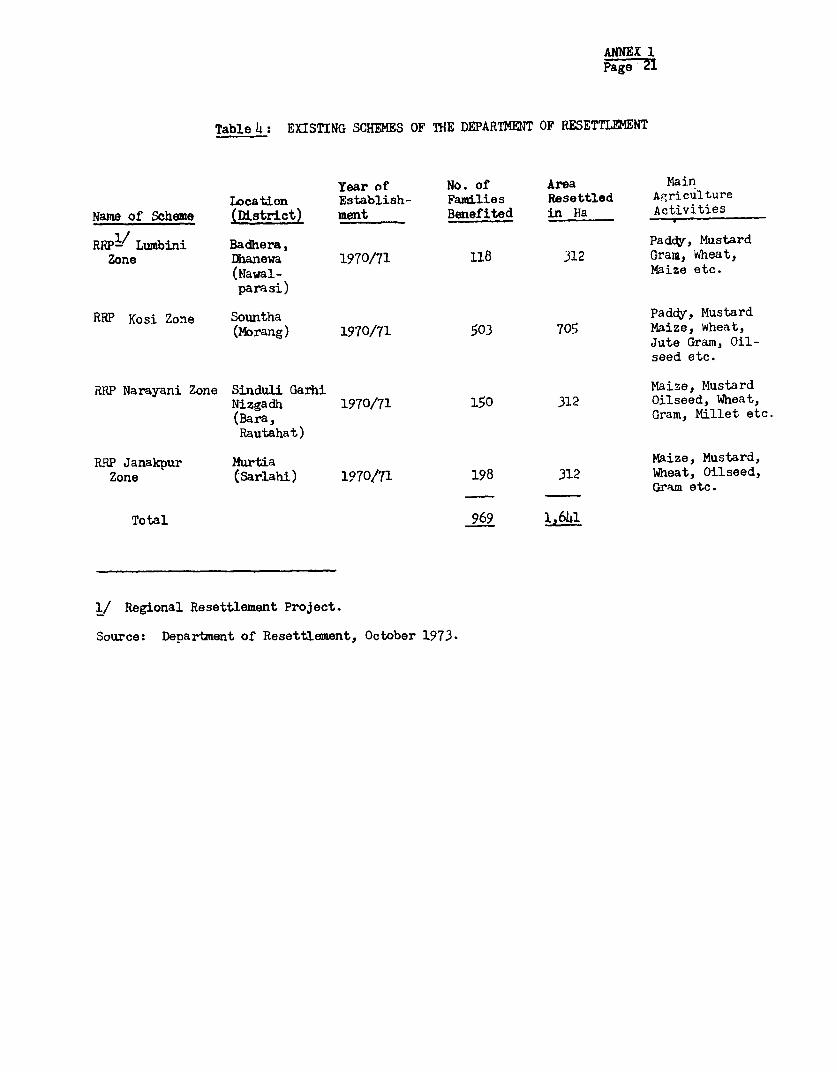
MFAI = Ministry of Food, Agriculture and IrrigationMPP = !finimum Package ProgramNDC = Nepal Dairy CorporationNESP = National Education System PlanNPC = National Planning CommissionNRB = Nepal Ra'stra BankNRC = Nepal Resettlement CompanyVC = Village CommitteesVP = Village Panchayats

NEPAL
AGRICULTURAL SECTOR SURVEY
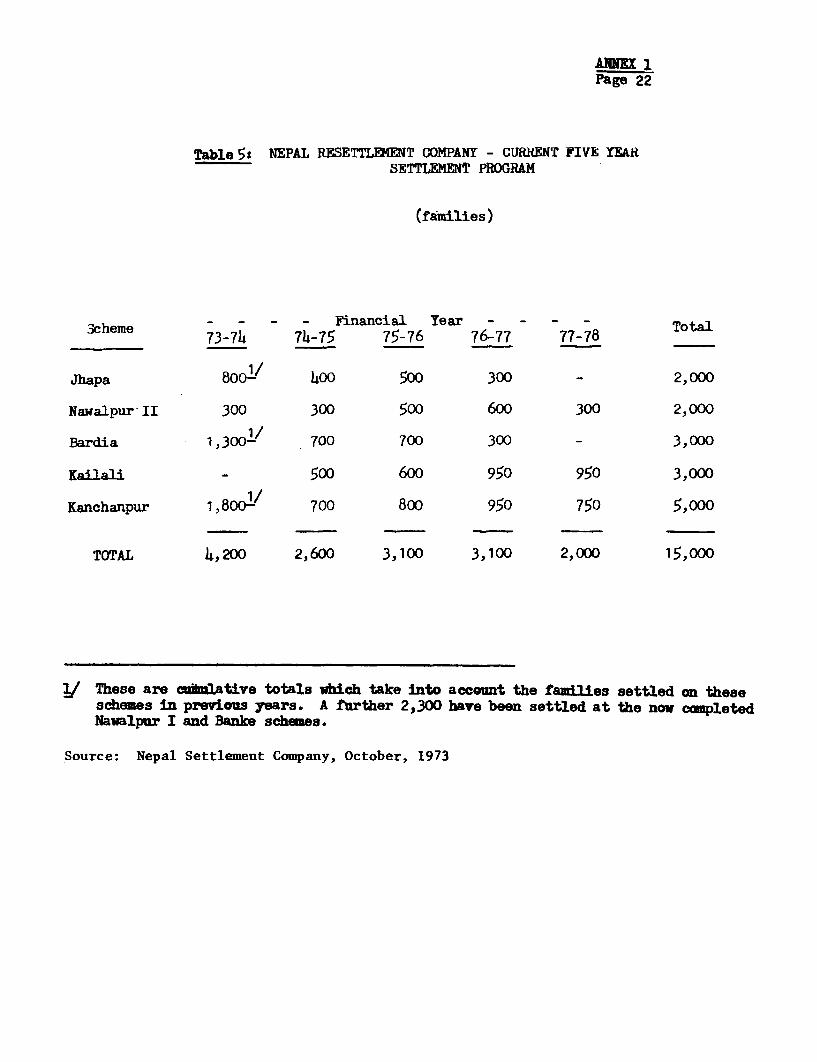
Table of Contents
ParagraphNumber
VOLUME I (GENERAL REPORT)
SUMMARY ........... i - xxxvi
I. INTRODUCTION ................ 1.01 - 1.08
1I. BACKGROUND .................................. 2.01 - 2.26
Natural Resource Base .2.01 - 2.11Socio-Economic Disparity: The Hills and The Terai .. 2.12 - 2.26
III. PRESENT POSITION .3.01 - 3.70
The Principal Agricultural Products ......... ....... 3.01 - 3.30The Institutional Setting ....... .................... 3.31 - 3.70
Ill. A PROPOSED DEVELOPMENT STRATEGY ...... .................... 4.01 - 4.106
Government's Emphasis and Plans ..... ................ 4.01 - 4.03The Basic Strategy ........... ........................ 4.04 - 4.06Agricultural Development in The Hills .... ........... 4.07 - 4.21Agricultural Development in The Terai .... ........... 4.22 - 4.42Linking The Hills to The Terai ...... ................ 4.43 - 4.49Improving Support Services ...... .................... 4.50 - 4.86Reaching The Small Farmer ....... .................... 4.87 - 4.97Programs [or the Development Regions ..... ........... 4.98 - 4.106
V. PROJECTS, PREINVESTMENT REQUIREMENTS AND PROSPECTS ....... 5.01 - 5.23
Project Selection .......... 5.01 - 5.02Present Foreign Assistance and Projects .......... 5.03 - 5.07Proposed Projects for External Financing .......... 5.08 - 5.22Preinvestment Requirements and Studies .......... 5.23
Table 1: Geographic Regions, Climate and AgriculturalLocation.
Table 2: Components for Secondary Roads and Area DevelopmentProjects.
Appendix: Socio-Economic Characteristics of 'i'he Hills andThe Terai.
-2-
VOLUME II (ANNEXES)
Annex 1 - Natural Resource, Land Use and Land SettlementAnnex 2 - Forestry DevelopmentAnnex 3 - Foodgrain ProductionAnnex 4 - Cash Crop DevelopmentAnnex 5 - Livestock and Fodder DevelopmentAnnex 6 - Irrigation and Water Resource DevelopmentAnnex 7 - Credit and CooperativesAnnex 8 - Statistical Annex
MAPS
10906 - Nepal - Geographic Regions and Districts (General Report)10907 - Nepal - Administrative Regions, Zones and
Districts ( " " )10908 - Nepal - Topography, Large Valleys and
River Systems ( " " )10742 - Nepal - Crop Concentration and Land Use ( " " )11172 - Nepal - Remaining Level Forests in Eastern
Terai ( " " )10912 - Nepal - Remaining Level Forests in Western
Terai ( " " )10909 - Nepal - Transportation Infrastructure ( " " )11050 - Nepal - Concentration of Government Agri-
cultural Services ( " )10913 - Nepal - Annual Rainfall (Annex 1)
10741 - Nepal - Geology (Annex 1)
10911 - Nepal - River Basins and Watersheds (Annex 6)
10164 - Nepal - Existing and Proposed Main Irrigation
Projects (Annex 6)
ANNEX 1Page (i)
NEPAL
AGRICULTURAL SECTOR SURVEY
NATURAL RESOURCES, LAND-USE AND LAND SETTLEMENT
ParagraphNumber
A. NATURAL RESOURCES ..................................... 1 - 16
Area and Physical Features .1 - 6Climatic Regions and Agricultural Location ..... 7 - 8The People ..... 9Water and Hydropower Resources ..... 10 - 11Forest Resources ..... 12 - 13Soils ..... 14 - 15The Report's Regional Coverage ..... 16
B. MIGRATION AND LAND-USE ..... 21 - 24
Population Pressure and Migration ..... 17 - 20Land-Use ..... 21 - 24
C. LAND SETTLEMENT ..... 25 - 54
Introduction ..... 25 - 27Nepal Settlement Company ..... 28 - 46Department of Resettlement ..... 47 - 49Proposed Settlement Plan ..... 50 - 54
D. RECOMMENDATION AND PROSPECTS ..... 55
Land-Use Planning ..... 56 - 65Improving Settlement Capacity ..... 66 - 70Spontaneous Settlement and Resettlement
Department's Role . ... ............ 71 - 72
Table 1: Geographic Regions, Climate and Agricultural LocationTable 2: Nepal - Terai and Inner Terai Forests, 1972Table 3: Nepal Resettlement Company - Numbers of Families Resettled
and Land DistributedTable 4: Existing Schemes of the Department of ResettlementTable 5: Nepal Resettlement Company - Current Five Year Settlement Program
ANNEX 1Page (ii)
ANNEX 1: Natural Resources, Land-Use and Land Settlement
Appendix 1: ClimateAppendix.2: Assessment of Soil InvestigationsAppendix 3: Assessment of Land-Use Statistics in Nepal
MAPS:
IBRD 10913 - Nepal - Annual RainfallIBRD 10741 - Nepal - Geology
ANNEX 1Page 1
NATURAL RESOURCES, LAND-USE AND LAND SETTLEMENT
A. Natural Resources
Area and Phyical Features
1. The Kingdom of Nepal is rectangular shaped, with an area ofsome 141,000 km2. Completely landlocked, it is wedged between Tibet tothe North, and India to the South. The physical and ecological featuresplay an eminent role in determining the way of life in Nepal. The topo-graphy is the most varied of any nation. Nepal is roughly 850 km (530miles) long from east to west, and 180 km (110 miles) wide. From theplains and lowlands of the south, about 50 km above sea level, the ter-rain rises in 160 km to the dramatic heights of the world's highest moun-tain, Mount Everest, at 8,850 m.
2. Geographically, the country is divided into three roughly parallelstrips, each running generally east and west. The southernmost strip (about25 km wide) is the Terai, covering about 17% of total area. An extension ofthe Gangetic plain of North India, it consists of generally flat, open coun-try blending into forested hills, and is noted for its heavy jungles and biggame including tigers, rhinoceros, elephants, wild boars and crocodiles. Thenorthernmost strip is about 35 km wide consisting of the great Himalayan Range(4,500 m - 8,850 m) with its perpetually snow-covered panorama. The regionis about 35 km wide, and accounts for about 15% of the total land area. Thecentral strip or the Hills is about 100 km wide, with elevations from 250 m -
3,000 m, covering 68% of the land area.
3. The Hills _/ essentially consists of two ranges:
(a) The Churia Range; and
(b) The Mahabharat Range.
4. The Churia Range consists of narrow steep ridges (The Churia Ridgeor the Siwalik Hills) at its southern edge, and large valleys north of it.The Churia Ridge (Map 10908) extends east to west at an average height of2,510 (760 m) and merges into the Indian border through its extensions atDang (the Dundwa Range) and at Chitwan (the Someswar Range), convenientlydividing the Terai into three parts (Map 10906): (a) Eastern Terai (Eastof Chitwan); (b) Mid-Western Terai (between Chitwan and Dang Deokhuri);(c) Far-Western Terai (West of Dang Deokhuri). The Mahabharat Range mergesclosely into the Churia Range north of Far-Western Terai, Mid-Western Teraiand the far-eastern third of Eastern Terai.
1/ See Maps 10906 and 10908, General Report.
ANNEX 1
Page 2
5. The gap between the Churia Ridge and Mahabharat Range is thegreatest in the Inner Terai districts where large river valleys (calledduns) of the Churia Range are found. 1/ Although the Inner Terai may beconsidered as part of the hills, its valleys are agriculturally similarto the Terai.
6. The transition from the Mahabharat Range to the great HimalayanRange is not so obvious, but most of the Mahabharat is below 3,300 m (theupper limit for successful grain farming). The Hills can therefore bedivided into (a) the Lower Hills (less 3,300 m) and (b) the Upper Hillsor Mountains (Upper Mahabharat and Great Himalayas). 2/
Climatic Regions and Agricultural Location
7. Table 1 illustrates the effects of climate 3/ and topography onthe distribution of crops in each region. The humid subtropical climaticzone (encomposing mainly the Terai and Inner Terai) reaches approximately1,700 m, providing the rainforests, foodgrains (mainly rice, and some maize,wheat and millet), oilseeds, pulses, sugarcane, jute, tobacco and tea. Sincerainfall decreases from about 2,500 mm in the East to about 1,500 mm in theWest, sugarcane, tobacco, jute and tea are more important in Eastern Teraiand Inner Terai; pulses, oilseeds and newly introduced cotton are more im-portant in Far-Western Terai.
8. Each hill area is a micro environment with varying conditionsfor plant growth depending on the elevation, cloud cover the direction ofslopes, etc. The microthermal climate of the Lower Hills supports a widevariety of agricultural enterprises (Table 1) - foodgrains, potatoes,fruits and spices, cattle and buffalo. In the Upper Hills, at subalpineelevations (2,700 - 4,000 m) where the winters are more severe and thesummers are cool, barley and potato cultivation and the grazing of yak,goats and sheep are the main enterprises. The natural vegetation aremainly temperate conifers. Above the 4,600 m treeline, true alpine tunderaconditons of the Himalyan Mountain zone consisting of shrubs and lichensprevail. Lower rainfall in the west gives rise to a higher concentrationof subtropical hill pine (Chir) and savanna in the Lower Hills, and thehigh grasslands of the Upper Hills.
1/ Some of the larger Inner Terai valleys are those associated with the WestRapti and Babai rivers (Dang Deokhuri), Narayani and E. Rapti rivers(Chitwan), Marin Khola (Sindhuli-Makwanpur). Kamla (Sindhuli-Udayapur).
2/ In terms of the availability of statistics, Lower Hills and Mountains aregenerally presented in an aggregated form in this report. The differencesin ecology subsumed in this aggregation should however be borne in mind.
3/ Appendix 1 gives an overview of Nepal's climate.
ANNEX 1Page 3
The People
9. Besides the differences in climate and agricultural productionpotentials, there are also important ethnic and cultural differences.The people of the Terai are predominantly of Aryan stock. Those of themidlands or lower Hills are a blend of Mongoloid (Tibeto-Burman) andAryan stocks, speaking different dialects. The Upper Hills are populatedby Tibeto-Burman speaking Mongoloid peoples Kiratis-Rais and Limbusin the East; Sunuwars, Girels and Temangs in the Near East; and Gurungsand Magars in the Central and West. Over the last 150 years, the UpperHills peoples and the Hill Chetris have traditionally provided the mainsource of recruits for the Gurkha regiments in the British and Indianarmies. Undoubtedly, active service pay and army pensions 1/ have helpedkeep many hill areas, particularly in the Gandaki zone, solvent. Armyreturnees also constitute an important pool of semi-skilled labor whichhas not been fully utilized.
Water and Hydropower Resources -
10. The most important untapped potential in Nepal is the river system.With an average annual river runoff estimated at 124 million acre feet(MAF) and a domestic requirement of only 18.6 MAF, the potential for exportto India after storage in Nepalese reservoirs is tremendous. The Terai,except for its major rivers 3/, has few reliable surface water sources foryear round irrigation. Significant groundwater resources, however couldpermit such irrigation. Two important artesian groundwater areas haverecently been located in the Lumbini and Janakpur zones of the Terai.The Lumbini, with by far the greater potential, is estimated to cover about200,000 ha between Butwal and Bhairawa, and has artesian pressure of up to40 ft.
11. Nepal's potential for hydroelectric power is estimated at 83,000megawatta (MW), equivalent to the combined installed hydroelectric capacityof Canada, the United States and Mexico. A UNDP study 4/ estimated thatthe Karnali Basin alone could provide a capacity of 6,800 MW. Presentinstalled hydroelectric capacity is only 33 MW and Nepal's per capitaconsumption of 6 kwh is among the lowest in the World. 51
1/ Estimated remittances were equivalent to US$5.7 million in 1971/72.2/ A detailed discussions is given in Annex 6, paras 1-22.
3/ For example, Karnali, Sapt Kosi, Narayani, Kankai, Kamla, Bagmati, Rapti,W. Rapti, Babai, Bheri, Mahakali, Seti (See Map 10908).
4/ Nippon Koei, Master Plan For Power Development and Supply, May 1970.5/ For 1964, world average was 807 kwh and the average for a developing
country was 112 kwh.
ANNEX 1
Page 4
Forest Resources
12. The Terai and Inner Terai forests have been the only source ofindustrial timber. They are semi-tropical hardwood, dominated by Sal (50%)and Asna (15%) strongly demanded in both the Nepalese and Indian markets.Other economic (but much less prevalent) species include Khair for manu-facturing of Katha and Kutch (used as "pan" in chewing), and Semal used inmanufacturing matches.
13. Hill forests predominate in the Western region where lesspopulation pressure exists. In the subtropical Hill areas and some highforest valleys on the southern side of the Himalayas, the forests arepotentially commercial, provided they are made more accessible. However,in the larger Hill valleys and less steep areas, much of the forests havealready been lost to settler incursions. The remaining steeper Hillforests consist mainly of indigenous subtropical and temperate pines andoak, used mainly for fuelwood or as loppings for animal fodder or greenmanure.
Soils 2/
14. Soils in Nepal are generally light and permeable because ofthe steep river gradients and particularly in the wetter Eastern Terai,generally acid. Two distinct zones may be identified running East-Westthrough the Nepalese Terai:
(a) The northwest "Bhabar" Zone - consists of relativelycoarse textured soils (usually with less than 20% clay)and often occur as distinctly sandy and gravelly fansat the foothills of the Siwaliks. Very permeable andhighly susceptible to erosion, these soils are theleast fertile and the most difficult to manage.
(b) The southern zone - which is much wider - has largelymedium textured soils. These are also quite permeablesince the predominant clay mineral is kaolinite. Theircropping suitability varies according to relief, withthe lower lands close to rivers possessing a higher watertable (or subject to flooding) especially favored forpaddy and jute cultivation. The higher and dryer landsare slightly less fertile and are more suited to maize,broadcast paddy, followed by mustard, pulses and wheat.The occurrence of remnant terraces (relict uplands)consisting of coarse textured and compacted soils,typically eroded by small ravines, diminish the croppingpotential of this zone.
1/ Forest Resources are detailed in Annex 2, paras 1-11.
2/ An evaluation of soil investigations and more detailed discussions ofNepalese soils are given in Appendix 2.
ANNEX 1Page 5
15. Most of the soils in the Hill valleys are also relatively coarsetextured, particularly those derived from carbonaceous rocks (Map 10741of this Annex). The hill slopes generally have slightly more clay andsilt.
The Report's Regional Coverage
16. This report will attempt to analyze the problems of agriculturein relation to the four agricultural regions (Upper Hills, Lower Hills,Inner Terai and Terai) as much as the limited data allows. Because of thislimitation, the regions will generally be simplified into (a) the Hillsand (b) the Terai. Unless otherwise specified; the Hills includes themountain region and the Terai includes the Inner Terai. The administrativedistricts included in each categroy are listed in Map 10907, GeneralReport.
B. Migration and Land-Use
Population Pressure and Migration
17. Cultivated area in the Hills (comprising 31% of total cultivatedarea) supports 59% of the population, or an equivalent of nine people percultivated hectare (compared to the Terai's average of three). This popula-tion pressure has forced people from the Hills to seek alternative andmore durable economic opportunities in Kathmandu, the Terai and evenoutside Nepal (many through enlistments in the Gurkha regiments of theBritish and Indian armies). Population in the Hills grew by only 1.3% inthe decade of the sixties, while that of Kathmandu and the Terai increasedannually by 7% and 3.3% respectively. A farm management study (FMS) 1/ of10,000 farms in 1968/69 showed average farm size to be only 0.5 ha in theHills, in contrast to 3.0 ha in the Terai, and even these average understatethe small farm disparity between the two regions. Eighty-two percent ofthe farms in Other Hills (hill areas outside Kathmandu Valley) were lessthan one bigha (0.67 ha), but in the Terai the corresponding figure was 24%.
18. With the eradication of malaria since the mid-fifties, migrationinto the Terai and particularly the Inner Terai has accelerated and from1961 to 1971, population pressure in the Hills led an estimated 400,000 mi-grants (about 67,000 families) there. In the last decade, about 180,000 haof forest land in the Terai was alienated for settlements, of which about130,000 ha were illegally settled (Appendix 3).
1/ Economic Analysis and Planning Division (EAPD), Ministry of Food andAgriculture, Farm Management Study in Selected Regions in Nepal, 1968-69,Kathmandu, 1971.
ANNEX 1Page 6
19. Continuing population imbalance in the Hills has increasedpressure for bringing more lands into cultivation, either by moving ontomuch steeper land adjoining farms or by deforestation of nearby steepareas. The result of movement onto such marginal lands has been theprimary cause of yield declines in the Hills (particularly in the East).Livestock pressure in the Hills has also aggravated the situation, causingdeterioration in the quality and sometimes destruction of hill pastures.Forests have also been denuded because of cutting for fuelwood and loppingfor animal fodder or green manure. Consequently, animal productivity,already low, is thought to be declining or at least stagnant, as is thecash income many famers derive from livestock.
20. The combination of (i) fuelwood and fodder extraction in hillforests, and (ii) intensive grazing and improper cultivation on steeperslopes, have increased flooding and crop area destruction in the rivervalleys and their flood plains in the Terai, threatening to reduce evenfurther Nepal's available cultivated lands.
Land-Use
21. The present status of land use is not known with certainty.Information on land use in Nepal is poor, and large discrepanies 1/ occur,depending on the sources of available information used. A reconciliationof available information 2/ gives the following situation (1972);
Land UseMillion ha (%)
Forests 5.0 35.5
Commercial (2.2) (15.6)Non-commercial (2.8) (19.9)
Cultivated Area 2.3 16.3
Grasslands 1.7 12.0
Land Under Snow 2.1 14.9
Other 3.0 21.3
Total Area 14.1 100.0
1/ For example, depending on the source, (i) cultivated area ranges from2 million (Ministry of Agriculture) to 3.2 million hectare (Departmentof Forests) and (ii) forest areas range from 4.5 to 6.4 million ha.
2/ See Appendix 3 for details.
ANNEX 1Page 7
22. From Earth Resource Technology Satellite (ERTS) imagery, only774,000 ha of relatively level commercial forests remain in the Terai andInner Terai in 1972 (Table 2, and General Report - Maps 11172 and 10912).This represents a total loss of about 340,000 ha since 1963 (equivalent toan annual loss of 3 percent). Population pressure in the hills have led tothe settlement of about 180,000 ha of these forests, mainly in the InnerTerai (Dang and Chitwan) and Eastern Terai. Most of the remaining loss wasdue to firewood extraction and livestock grazing of the less agriculturallysuitable forests. Intra-migration within the Terai, and illegal migrationfrom India probably accounted for about 50,000 ha.
23. On the basis of very preliminary pedologic analyses of Teraisoils and field verification in the IDA settlement Project areas, a maxi-mum of 325,000 ha of the remaining 774,000 that Terai forests is expectedto be suitable for agricultural development. This assessment is primarilybased on the probable existence of remnant terrace and Bhabar soils (para 14)in these forests (Maps 11172 and 10912, General Report and Appendix 3, paras12-14). Probably 200,000 ha of the agriculturally suitable level forestsare located in Far Western Terai.
24. This figure of available new agricultural land in the Terai is sub-stantially lower than the 1 M ha presently assumed by the Ministry of Agri-culture and the National Planning Commission. In the Hills, although nearly300,000 ha of flat land 1/ exist in the larger valleys, indications are 2/that most of them (except possibly in Far Western Hills) have already beensettled.
C. Land Settlement
Introduction
25. With the increasing migration, a Land Settlement Unit was estab-lished in the Department of Agriculture (Ministry of Food and Agriculture)to control this spontaneous movement, and to legalize reclaimed land andorganize land settlement on some of the more favorable areas.
26. The first large scheme was at Hetaura, on the Inner Terai close tothe road between Kathmandu and the Indian border. This was followed in themid-nineteen fifties by the Rapti Valley resettlement scheme (Nawalpur) mainlyfor families who had lost their lands as a result of landslides during theparticularly heavy 1954 monsoon.
1/ Land less than 10% slope (Annex 6, para 13).
2/ This needs to be confirmed by a similar analysis of ERTS imagery under-
taken for the Terai.
ANNEX 1Page 8
27. Tne overwhelming demand for places on these and other, smallerschemes, and the rash of illegal settlement which sprang up in many Teraiforest areas in the late nineteen fifties caused HMG to expand its organizedsettlement activities through the creation of the Nepal Resettlement orPunarvas Company (NRC). This corporation was finally established in 1963following acceptance of the recommendations contained in an Israeli report,and it was made responsible for larger settlements. The Department ofAgriculture, to which the NSC was attached, retained responsibility for allsmaller schemes, usually less than 200 families. A Department of Resettlementwas established in 1969 (to undertake Jhora Commission disaster relief forlandless population in the Hills) to reclaim land for small settlements.Coordination between the two official bodies is largely effected through theCommissioner in charge of the Department who is also the Chairman of NRCboard.
Nepal Resettlement Company (NRC)
28. NRC is a private limited company, formed in 1963 under the NepalCompanies Act, with authorized share capital of Rs 2 M (US$0.19 M). It iswholly owned by HMG and is run by a board consisting of the Director-Generalor Commissioner of the Resettlement Department (Chairman), the NRC GeneralManager (Secretary). The other board members consist of the Director-General of the Department of Agriculture; the Chief Conservator of Forests;and representatives from the Ministries of Industry and Commerce, Waterand Power and the Planning Commission.
29. N4RC aims and objectives are to plan and carry out the systematicdistribution of land primarily for landless hill farmers in organized andlegal settlements, and to assist settlers to improve their farming throughprovision of advice and credit.
30. History. The first NRC scheme was inagurated in 1965 in a smallway at Nawalpur, in the Western Terai (Table 3). This was followed in 1968Dy a second scheme, at Banke in the same region. Both these schemes arenow almost completed with about 2,300 families settled. Tnree other schemesat Bardia, Kanchanpur (Western Terai) and Jhapa (Eastern Terai) has settleda further 2,000 families.
31. During the peak development period of the Nawalpur and Banke schemesin 1966-69, the annual intake of settler families averaged 550, but droppedto around 150 in the two subsequent years. In 1971/72, the second phase ofsettlement activity commenced with acceptance of 900 families, followed by1,300 in 1972/73. The NRC achievement of 4,300 families settled in its firsteight years, is equivalent to about 8% of the total number of migrant familiesbelieved to have moved into the Terai during that period. The remaining88X comprise illegal occupiers of forest land scattered over much of the plain,but concentrated especially in the few remaining forest areas of the centraland eastern Terai.
ANNEX 1Page 9
32. Settlement Procedures and Assistance. NRC schemes are designedfor rural families who are victims of natural calamaties, or those orginatingfrom the overcrowded and land-hungry hill regions, who possess no land orhave insufficient land to obtain an adequate living.
33. Prospective settlers must first apply to the chief districtofficer in their home districts. Details on their completed applicationforms are checked by the village panchayats (local councils) in their villagesof residence and, if found satisfactory, are forwarded to the office of thezonal commissioner. Following approval at this level, the applications aresent on to NRC which makes a final selection and allocates the chosen familiesto particular schemes.
34. The basic criteria used for selection include farming experience(usually gained as a farm laborer or unregistered tenant farmer). Applicantsmust be married, and young families are favored. A positive attitudetowards farm work is especially sought, and good health is most important.Selection procedures attempt to avoid those with hidden wealth or who arenot hard-working.
35. About 90X of the settlers in present NRC schemes are from the Hillsand the rest consist of Nepalese refugees from neighbouring countries(especially Burma).
36. Upon selection, the settler must sign a 12-year bond agreeing toabide by the regulations set by the NRC, and he is given a temporary occupa-tion license to his plots. Settlers are expected to purchase their land atthe rate of Rs 300 per bigha (Rs 900 per 2 ha farm). This would be paid,interest free, at the rate of Rs 150 per annum between years 6 and 12,following which a permanent freehold title would be given.
37. Land designated for settlement are supposed to be logged by timbercontractors of the Department of Forestry who have bidded for the area forcommercial extraction. The land is then handed to NRC for distribution tosmallholder.
38. Four bigha (2.7 ha) of land used to be provided for each family inthe early years, but the allocation was later reduced to three bigha (2.0 ha)when experience showed that the larger area was generally too much for theaverage family to manage and the smaller area was sufficient to meet theemployment needs of the average family while providing an adequate living.
39. Settlers are generally expected to take about five years to fullydevelop their land. They arrive with their families during October/December,when weather is cool and land is dry, and they start clearing their 0.8 ha(1 bigha) house lots and building their houses. A small semi-permanentdwelling is normally built within the first three months, using residualtimber from the cleared plot. A more substantial, permanent two-storyhouse is built within eighteen months of arrival.
ANNEX 1Page 10
40. Except for a few vegetables, no substantial area is plantedduring the first six to eight months (October/December-May) which coincideswith the second, and drier, part of the traditional crop year (June-May 31).The remainder of each house lot is usually cleared in time for staple foodcultivation in the following June. The World Food Program usually providesfood to the settlers during their first nine months of settlement. Duringthe dry season of the second year, the settler begins to clear his twobigha (1.36 ha) main farming area, which may not be adjoining his houselot.
41. NRC settlements are usually provided with government servicesfor health, education, water supply (drinking wells). Settlers generallyhave to construct their own schools and community halls. More intensiveagricultural extension service is provided with one JTA to about 100 farmersand cooperatives are assisted by the Agricultural Development Bank whichalso provides credit to farmers.
42. Problems and Constraints. The main problems facing NSC are:
(a) constraints in the choice of scheme sites;
(b) overlap of commercial timber operations with forest clearingand cultivation activities; and
(c) limited implementation capacity.
43. No mechanism exists for a systematic allocation of land for settle-ment. Selection of sites for NRC schemes has been determined largely by theForest Department and, in the case of the most recent schemes, has been limitedto a 3 km zone along the Indian border, declared a high priority area forsettlement largely for security reasons. In effect, NRC has had very limitedchoice in terms of agriculturally suitable sites for settlement.
44. Poor coordination between DF and NRC has resulted in delays of bothtimber exploitation and settlement. In some instances, settlers moved intotheir allocated lands almost immediately, afraid of losing their allocationand thus preventing orderly extraction of the forests. The settlers them-selves do not gain much in the process because their crop yields are muchreduced through excession of shade, root competition and pest damage fromthe forests remaining on the land. In other cases successful bidders usingonly simple hand tools and ox carts take too long to clear the forests.Others changed their minds about the economic feasibility of exploitingtheir auctioned plots (after discovering lower quality timber stands thanexpected) and left settlers with the forest clearing task. In such cases,settlers have taken more than five years to complete clearing their plotsfor cultivation.
ANNEX 1Page 11
45. NRC administrative and junior technical staff are appointed throughthe Public Service Commission while senior technical staff are obtainedthrough short-term secondment from Government departments. Neither of thesemethods are entirely satisfactory for they lead to delay and often result ininappropriate appointments. The practice of obtaining senior agriculturalstaff on short-term secondment is particularly harmful for an organizationwhich depends on a high level of specialized agricultural expertise for itssuccess. At present, staff seconded from the Department of Agriculture spendonly two years with NRC. During this period they gain an understanding ofthe special problems of NRC settlers, who lack experience of the Terai environ-ment; but before they can apply their new knowledge, they revert to theirparent service.
46. The lack of staff has also meant less in-depth screening of potentialsettlers and loose adherence to selection criteria, resulting in the rejec-tion of many needy and qualified settlers in favor settlers who later rentedout their land.
Department of Resettlement
47. The Department of Resettlement (DR), was formed primarily to handledisaster relief and land reclamation for small-scale settlement (less than200 ha) in 1969.
48. Settlement procedures for potential settlers are similar to thatfor NSC except that:
(a) settler lots are smaller (from 1-2 ha depending on familysize); and
(b) supporting government services (drinking water, agriculturalextension, schools, etc) are not normally provided. Settlersnave to do their own land clearing.
49. All the four schemes under the supervision of DR were establishedin 1970/71 in the Terai districts of the Lumbini, Kosi, Narayani and JanakpurZones (Table 4). Nearly 1,000 families have been resettled in 1,641 na.
The Proposed Settlement Plan
50. Recognizing the size of the settlement problem, the hardships andillegalities involved, and the inevitability of the trend, which is likelyto persist until all agriculturally suitable land in the Terai is fullydeveloped, HMG recently proposed a Five Year Settlement Plan 1/ (1973/74-1977/78) for Nepal. Two programs are discussed in the Plan: (a) PlannedSettlement Program, and (b) Program for Control of Spontaneous Settlementin government lands and forests.
1/ NRC, Summary of the Resettlement and Unplanned Occupation Control Programs.
ANNEX 1Page 12
51. The main features of the Planned Settlement Program are:
(a) Settlement target of approximately 3,000 families annuallyfrom 1973/74 to 1977/78 (Table 5);
(b) Guidelines on stricter settler selection 1/ and settlementprocedures and rules (including revenues, record keeping,size of plots, fragmentation); and
(c) Emphasis on agricultural inputs, improving agriculturalmethods and feasibility studies on irrigation.
52. No guidelines on the selection of new settlement areas were given.
53. The Spontaneous Settlement Control Program proposes guidelines on:
(a) areas where settlement will be prohibited 2/ (unstable areaswith loose soils, river banks, etc);
(b) areas where settlement would be assisted (i.e. those whereforests had been settled for 4-5 harvesting seasons anda high school and bazaar has been established); and
(c) procedures for legalizing areas where settlement will beassisted.
No guidelines were provided for forest areas which will be spontaneouslysettled.
54. Regional teams will be set up at each administrative zone throughthe auspices of the Resettlement Department and the Forestry Department,for three years, to undertake "forest preservation and forest-line demarca-tion" as the first step in implementing the spontaneous settler controlprogram. Other members would consist of representatives from the ChiefDistrict Officer's Office, the Department of Land Administration, Police,the District Panchayat, and Chairman of Class Organizations (farmers, youth).
1/ Families are eligible for consideration, only if certified by ChiefDistrict Officers as victims of natural calamaties or landless farmers(with phographic identification). Screening for settler suitabilityinvolves two stages: (i) initially at the zonal commissioner level andat the (ii) NRC (Central Office) level. Initial suitability requiresthat potential settlers be married, has no serious criminal record, isphysically and mentally fit, owns less than 0.5 bigha (0.34 ha) of land.Points are assigned, based on interviews with potential settlers (takinginto account age, family size, agricultural aptitute and size of landowned), and selection is to be based on the highest points obtained.
2/ Spontaneous Settlers in these areas would be forcibly removed.
ANNEX 1Page 13
D. Recoumendations and Prospects
55. Land Use and Land Settlement are closely related. With the in-creasing scarcity of new lands in Nepal, it is of prime importance to ensurel:hat remaining potential agricultural lands are efficiently settled and used.This involves:
(a) more systematic land use-planning and policy guidancein land use; and
(b) strengthening the institutions to face the problemswrought by land pressure and low incomes.
Land-Use Planning
56. We recommend the creation of a Natural Resource and Land-Use Com-uittee or Council (NRLUC) 1/ under the purview of and coordinated by theNational Planning Commission to:
(a) provide guidelines, objectives and priorities forthe survey of existing and potential nationalland-use;
(b) oversee, coordinate and standardize natural resource-use activities, especially the studies and programsof the several agencies reponsible for surveys andcensuses of the land and water resource base;
(c) assess the need for initiating new studies (surveys)or modifying existing ones, where necessary; and
(d) recommend policies consistent with the potential useof the land and water resource, which would involve:(i) the delineation of areas which should be retainedas permanent forest, grazing pasture, national parksor wildlife reserves, or alienated for agricultureand other uses, and (ii) the recommendation of loca-tion and phasing of settlement areas and communications.
57. A professionally-staffed technical sub-committee (The Land-UseTechnical Sub-committee), consisting of senior representatives of technicaldepartments involved in land-use, is required to support the NRLUC in the
1/ Consisting of senior officials from the Ministries of Agriculture,Forestry, Home and Panchayat, Finance, Water and Power, Mines andTransportation, and chaired by the Deputy Chairman, National PlanningCommission.
ANNEX 1Page 14
land-use aspects of (b) and (c) in para 54. In addition, it should: (i)evaluate the results of past and ongoing surveys and censuses for the pur-pose of developing future land-use maps and regional (and national) landdevelopment plans; and (ii) assess the need for foreign assistance to pro-vide the technical support to undertake new surveys or studies.
58. Two types of land-use surveys are required: (i) a Survey ofPresent Land-Use; and (ii) a Potential Land-Use Survey.
59. A Present Land-Use Survey provides information on the extent andlocation of area cropped (annual crops, tree crops, horticulture) forests,grasslands, areas with soil erosion problems, pasture, swamps, settledareas, mining, waste land, areas perpetually under snow, etc. The presentdiscrepancies between cropped and forested areas (Appendix 3) can then beresolved.
60. A Potential Land-Use (Land Capability) Survey provides informa-tion on: (i) areas providing various levels of potential for agriculturein terms of the range of crops which could be grown (tree crops, annualcrops); (ii) areas potentially suitable for grazing, (iii) areas suitablefor commercial forestry; and (iv) areas to be retained as protected forestsand parks.
61. An inventory of the soil resources and soil environmental factorsis fundamental to these surveys (particularly the Land Capability Survey).
62. Firstly, a reconnaissance soil survey is needed to provide relia-ble information on the type of soils (their occurrence and extent), drainingand flooding characteristics, general land capability, and suitability foralternative crop rotations and for sustained year-round irrigation or rain-fed agriculture. Top priority for focusing survey efforts in Nepal shouldbe (in order of importance): (a) the level forest areas in Western Terai(Map 10912, General Report), which would be potentially suitable for futuresettlement 1/; (b) forested areas in Hill valleys; and (c) larger hill val-leys (mainly cultivated) and areas of production potential (Annex 6, Table 3)which would be linked to main roads. A longer term perspective should be toundertake the Reconnaissance Soil Survey countrywide.
63. Secondly, selected areas proposed for development or specificproblems areas which need attention, should be supplemented by more de-tailed soil surveys. It is however important to initially get the broadperspective from reconnaissance soil surveys, so that detailed soil sur-veys would be more efficiently used.
1/ The 1973 IDA Settlement Project has made provisions to undertake sucha study.
ANNEX 1Page 15
64. Two studies to complement soil surveys for land-capability classi-fication are: (i) detailed forest inventory 1/ (to be carried out after soilsurveys are completed in order to avoid unnecessary inventory in areas deemedunsuitable for agriculture development); and (ii) water resource inventories(see Annex 6, para 126).
65. Foreign technical assistance is required in the form of a teamto assist the Land-Use Technical Sub-committee. Specifically, the require-ment is for a Land-Use planner, a team of surveyors and cartographers andvarious specialists on short term consultations. The land-use plannershould have: (a) extensive experience in conducting and directing integratedresource and land-use surveys involving the coordination of multiple govern-ment organizations; and (b) good basic technical qualification in at leastone of the following basic disciplines - soils, land-use, forestry, hydrology.Tne team could undertake analysis of aerial photography, production ofsuitable base maps for field work, field surveys, technical assistance andin-service strengthening of government department involved in such work.
Improving Settlement Capacity
66. Nepal Resettlement Company. Assistance is being given to NRC bythe IDA settlement project to expand its program, and assist in alleviatingthe constraints it faces.
67. The project will finance a reconnaissance soil survey of Far-Western Terai to locate additional areas suitable for land settlement. Tneestablishment of the NRLUC to recommend the location and phasing of settle-ment areas and communication should help ease the problem of settlement siteselection.
68. The project would also ensure that large scale settlements wouldbe integrated with forest extraction and processing through close coordina-tion between the Timber Corporation of Nepal and NRC. 2/ For smaller areas,an improved timber disposal auction system (Annex 2, para 62) should enableless overlap between timber extraction and settlement activities.
69. In order to iacrease NRC's role in land settlement an improvementin implementation capacity is urgently required. Recruitment of local staffcan be improved if NRC is free to hire and fire employees at its discretion,subject only to the control of by its board of directors. A scheme of
1/ To: (a) estimate the total net hoppus cubic feet of sawlogs and totalnumber of poles of all commercial species available within selected areas,and (b) to indicate, by a forest type map, the locations at the principalconcentrations of these commercial stands. (For details see Annex 2of the IDA, Settlement Project Appraisal Report, IDA, Report No. 377-NEP).The general forest inventories undertaken so far (Appendix 3) are notsuitable for this purpose.
2/ A Settlement Coordination Committee will be established for the purpose.
ANNEX 1Page 16
service for agricultural staff comparable with that of the Department ofAgriculture needs to be implemented to enable NRC to attract and hold expe-rienced agriculturists. Organizational and training support for NRC's agri-cultural activities will be provided by an agricultural advisor provided byIDA's settlement project.
70. Despite these favorable developments, it is unlikely that NRC canachieve the Settlement Plan's target of settling about 3,000 families annuallyfrom 1973/74 to 1977/78. This target will most probably be reached by 1977.Although an improvement over previous performance, such settlement rates inthe next five years will represent about 25% of the estimated migration fromthe Hills to the Terai in the 1960's. A reassessment of the spontaneous set-tlement program and how it can be handled should therefore be made.
Spontaneous Settlement and Resettlement Department's Role
71. Some points should be noted concerning the spontaneity of illegalsettlement. Although the "pushing force" of population pressure exists inthe Hills, there has to be an equally important "pulling force" in the Terai.Settlement in the hot forested Terai is difficult if no assistance is givento migrants to clear the forests, develop some transport facilities, andstart their production activities. Despite some pressure of land, familiesin the Far-Western Hills may not be sufficiently motiviated to settle in thehot Terai unless there is a reasonable chance of owning land and obtainingassistance to develop it. A major reason for mass in-flows of families toARC offices and forested areas earmarked for land settlement has been thewide publicity that land can be easily obtained from NRC. The publicitysources have been mainly politicians and some friends and relatives who haverecently acquired land. If such undue publicity can be minimized and thescreening process of potential settlers can be tightened and enforced, valu-able time can be gained to assist organized settlements in Western Terai. 1/
72. Settlement pressure and timber losses from spontaneous settlementwill continue in the Eastern Terai Forests unless action is taken. Pastmeasures for handling spontaneous settlers was either to: (a) repeatedlytry to drive them out of the government forests reserves or (b) legalizetheir settlement where illegal settlement had been established permanently(say over five years) and efforts to move them would be futile. 2/ Bothpractices are unsatisfactory because the former is just prolonging the ine-vitable at no insignificant costs to the Forestry Department (DF), and the
1/ Accessibility to Western Terai from Central and Eastern Hills willstill be relatively difficult as the East-West Highway will not passthrough this region until 1978-80.
2/ About 31,000 hectares has so far been legalized in this manner.(Source: Forestry Department.)
ANNEX IPage 17
latter cannot resolve the problem of timber resource wastage as poison-girdledtrees are left to rot or are burned. In some areas, however, private indiv-iduals have taken the initiative and assisted the settlers in cutting downthe trees, hauled the logs to the nearest river and floated them to Indiawhere they are collected and sold. Although resource waste is avoided insuch cases, potential revenues to HMG are lost. A scheme should be consid-ered whereby such losses can be averted. It appears to be a losing battlefor HMG to use its scarce forestry staff to attempt the protection of allthe highly pressured cultivable forest areas in Eastern Terai against settlerincursions. Its energies should be channelled into assisting the preparationof intensive organized settlements and particularly in regularizing the processof spontaneous settlement.
73. Attempts should be made by the multi-agency teams (para 54) to iden-tify forest areas which have just been, or are on the verge of being, ille-gally settled. These areas should be marked off, and if they are not re-quired to be conserved (para 53a), attempts should be made to regularize theirsettlement concentrating in specific sub-areas. "Settler direction" teamscould, for example, be formed (consisting of representatives from DP. Reset-tlement Department, Department of Land Administration and the District Pan-chayat) with the assistance of a small survey staff to demarcate lots forsettlement. Spontaneous settlers already in the area, or new settlers, asthey arrive, would be registered. Each registered head of a household wouldbe assigned a temporary claim to a marked lot and all able-bodied potentialsettlers would be recruited as hired labor to cut the merchantable trees underthe guidance of specially trained DF forest guards or specially hired contrac-tors. Whether the temporary claim could be converted to a Temporary Occupa-tion Licence, would depend on the verification of the landless (or very minuteholding) status of the registered settlers, and his performance as hired la-borers in logging. In each area, the number of "settlers" to be registeredshould not be permitted to exceed the number of plots demarcated.
74. A jeepable track and possible water supply facilities could be builtas logging operations commence. When the merchantable timber in the area arecut and properly stacked, the registered households (after suitability veri-fication) could then be permitted to commence settlement. The logs would beauctioned and part of the revenues used to pay for the settlement assistanceundertaken. Such "minimum assistance" settlement schemes would be under thejurisdiction of the Resettlement Department, and could then be improved asINHG's settlement capacity improves.
75. The "minimum assistance" settlement approach must be regarded onlyas a stop-gap measure to protect highly pressured forests. Parallel to this,attempts to identify areas for more organized settlement by NRC along IDAProject lines must continue.
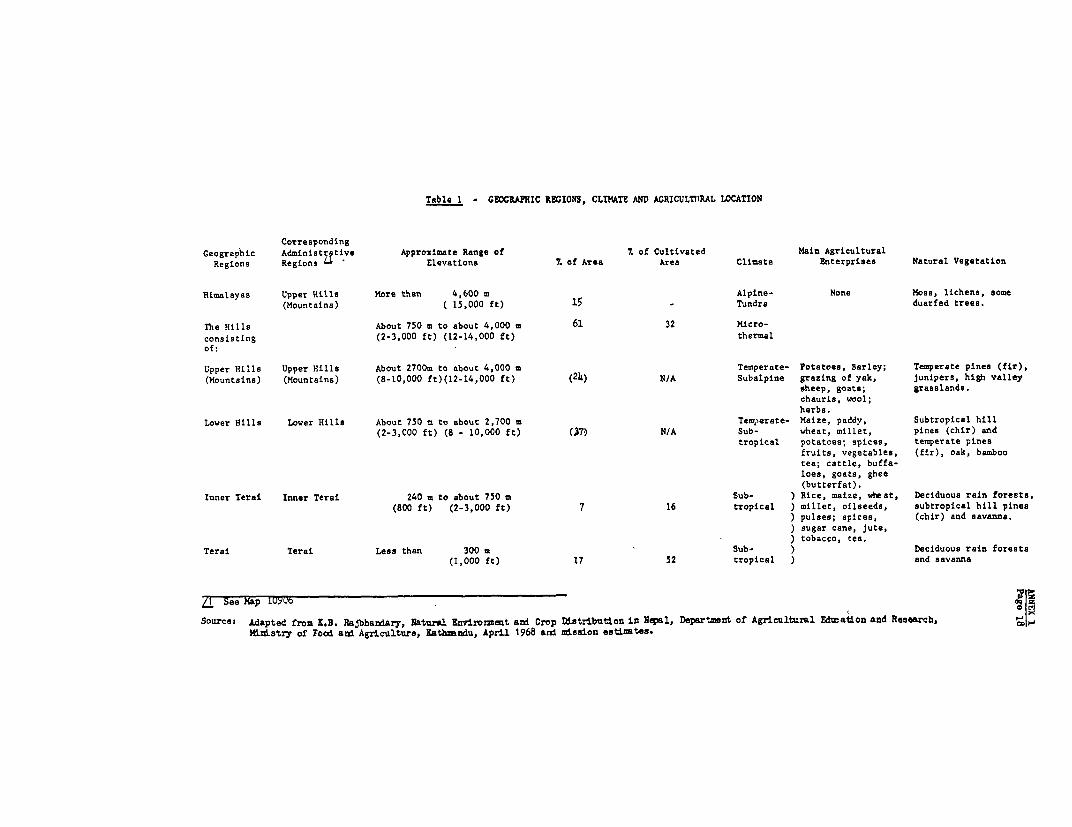
Table 1 - GEOGRAPHIC REGIONS, CLIMATE AND AGRICULTITRAL LOCATION
CorrespondingGeographiic Administ2tivs Approximate Range of % of Cultivated Main Agricultural
Regions Regions Elevations . of Area Area Climate Enterprises Natural Vegetation
Himalayas Upper Hills More than 4,600 m Alpine- None Moss, lichens, some(Mountains) ( 15,000 ft) 15 - Tundra duarfed trees.
The Hills About 750 m to about 4,000 m 61 32 Micro-consisting (2-3,000 ft) (12-14,000 ft) thermalof:
Upper Hills Upper Hills About 2700m to about 4,000 m Temperate- Potatoes, Barley; Temperate pines (fir),(Mountains) (Mountains) (8-10,000 ft)(12-14,000 ft) (2h) N/A Subalpine grazing of yak, junipers, high valley
sheep, goats; grasslands.chauris, wool;herbs.
Lower Hills Lower Hills About 750 m to about 2,700 m Temperate- Maize, paddy, Subtropical hill(2-3,000 ft) (8 - 10,000 ft) (37) N/A Sub- wheat, millet, pines (chir) and
tropical potatoes; spices, temperate pinesfruits, vegetables, (fir), oak, bambootea; cattle, buffa-loes, goats, ghee(butterfat).
Inner Terai Inner Terai 240 m to about 750 m Sub- ) Rice, maize, wheat, Deciduous rain forests,(800 ft) (2-3,000 ft) 7 16 tropical ) millet, oilseeds, subtropical hill pines
) pulses; spices, (chir) and savanna.sugar cane, jute,tobacco, tea.
Terai Terai Less than 300 m Sub- ) Deciduous rain forests(1,000 ft) 17 52 tropical ) and savanna
/1 See Map_lUY
Source: Adapted from L.B. Rajbhandary, Natural Enviromaent and Crop Distribution in Ne1p, Department of Agricultural Edma.tion and Research,Nlristry of Food and Agricultures, Xathbndu, April 1968 and misaion estimtee.
ANINX 1
Page 19
Table 2: NEPAL - TERAI AND INNER TERAI FORESTS L1, 1972
TYPE OF FORESTSModerately /3Dissected Badly
Flat/3 and Undissected Undisturbed Dissected FlatForestry Administrarive Partially Heavily Sub- & Partially & Heavily Total "Commercial"
Region/Divisions Districts Undisturbed 12 Disturbed Disturbed Total Disturbed Disturbed Forests Forests(1) (2) (3) (4) (5) (6) (7) (8) (8) - (7)
------------------------------------------------- hectares --------------------------------------------------
Far Western Terai
Banke Banke 14,919 31,411 3,226 49,556 - - 49,556 49,556Bardia Bardia, Surkhet 27,298 37,136 8,387 72,821 1,734 - 74,555 74,555Kailali Kailali 104,920 730 8,060 113,710 - - 113,710 113,710Kanchanpur Kanchanpur 83,467 11,048 7.056 101.571 - - 101.571 101,571
Sub-total 230,604 80,325 26,729 337,658 1,734 - 339,392 339,392
Western & Inner Terai
Butwal-Navalpar Kapilvastu, 25,685 68,668 1,734 96,087 3,548 - 99,635 99,635Rupandehi,Nawalparisi,Chitwan
Chitwan Chitwan 927 20,604 15,161 36,692 - - 36,692 36,692Deokhuri Dang Deokhuri - - - - 1.290 8,871 10,161 1,290
Sub-total 26,612 89,272 16,895 132,779 4,838 8,871 146,488 137,617
Eastern & Inner Terai
Parsa Bara, Parsa 39,190 - 1,690 40,880 - - 40,880 40,880Rautahat Rautahat 22,016 282 - 22,298 - - 22,298 22,298Sarlahi Sarlahi 14,596 2,701 - 17,297 - - 17,297 17,297Mahotari Dhanusha 6,492 - - 6,492 1,169 - 7,661 7,661
MahotariSaptari Saptari, Siraha,
Udayapur - 8,994 - 8,994 86,875 35,572 131,441 95,869Morang Sunsori, Morang,
Jhapa 44.475 14.435 30,282 89,192 23,991 - 113,183 113.183
Sub-total 126,769 26,412 31,972 185,153 112,035 35,572 332,760 297,188
Total 383,985 196,009 75.596 655,590 118,607 44,443 818,640 774.197
1/ Terai portions south of the foothills to the Churia Range (Siwalik Hills) and flat portions of Inner Terai.2/ Even land of less than 37. slope.3/ Farests on ravine land and geological remnant terraces.
Sour . Based on FAO/UNDP Forest Development Project's analysis of the 1972 Earth Resource Technology Satellite Images, October 1973.
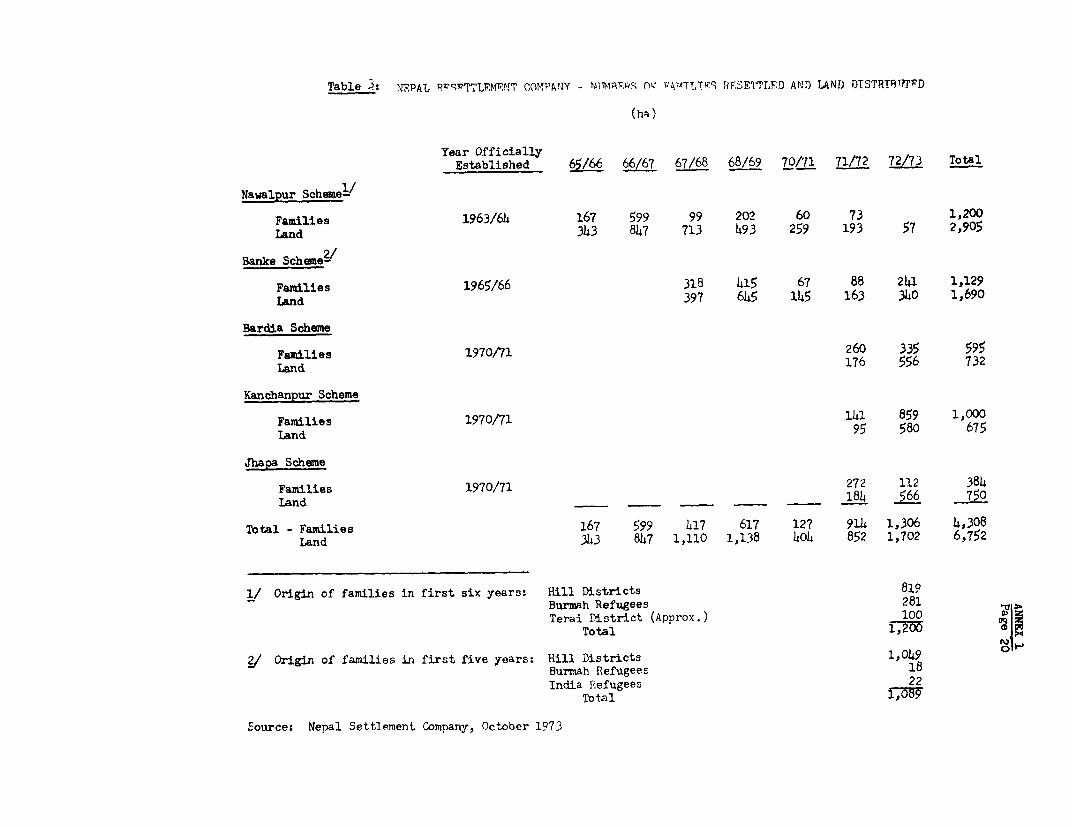
Table 3: N-PAL R SqTrLWM?,WT COMPAVY - IMRRPM nv w4-ATLTP9 PFSE1TTLFD AN'D LAND DTSTRT9IT17D
(ha)
Year OfficiallyEstablished 6/66 66/67 67/68 68/69 70/71 71/72 72/73 Total
Nawalpur Scheme-/
Families 1963/64 167 599 99 202 60 73 1,200Land 343 847 713 493 259 193 57 2,905
Banke Scheme-/
Families 1965/66 318 415 67 88 241 1,129Land 397 645 145 163 340 1,690
Bardia Scheme
Families 1970/71 260 335 595Land 176 556 732
Kanchanpur Scheme
Families 1970/71 141 859 1,000Land 95 580 675
Jhapa Scheme
Families 1970/71 272 112 384Land 184 566 750
Total - Families 167 599 417 617 127 914 1,306 14,308Land 343 847 1,110 1,138 404 852 1,702 6,752
1/ Origin of families in first six years: Hill Districts 819Burmah Refugees 281 t 0Terai District (Approx.) 100 m
Total 1 ,2 00 E/ Origin of families in first five years: Hill Districts 1,049 F
Burmah Refugees 18India Refugees 22
TotSal Nmt y1
Source: Nepal Settlement Company, October 1973
ANNEX 1Page* 21
Table 4 : EXISTING SCHEMES OF THE DEPARTMENT OF RESETTLEMNT
Year of No. of Area MlainLocation Establish- Families Resettled Agriculture
Name of Scheme (District) ment Benefited in Ha Activities
RREPI Lumbini Badhera, Paddy, MustardZone Dhanewa 1970/71 118 312 Gram, Wheat,
(Nlawal- Maize etc.parasi)
RRP Kosi Zone Sountha Paddy, Mustard(Morang) 1970/71 503 705 Maize, Wheat,
Jute Gram, Oil-seed etc.
RRP Narayani Zone Sinduli. Garhi Maize, MustardNizgadh 1970/71 150 312 Oilseed, Wheat,(Bara, Gram, Millet etc.Rautahat)
RRP Janakpur Murtia Maize, Mustard,Zone (Sarlahi) 1970/71 198 312 Wheat, Oilseed,
Gram etc.
Total 969 1,641
1/ Regional Resettlement Project.
Source: Departnent of Resettlement, October 1973.
ANNEX 1Page 22
Table 5: NEPAL RESETTLEMENT COMPANY - CURRENT FIVE YEARSETTLEMENT PROGRAM
(families)
- - - - Financial Year - - - -TotalScheme 73-74 74-75 75-76 76-77 77-78
Jhapa 800-1/ 400 500 300 - 2,000
Nawalpur-II 300 300 500 600 300 2,000
Bardia 1,300-1 700 700 300 - 3,000
Kailali - 500 600 950 950 3,000
Kanchanpur 1,800 1/ 700 800 950 750 5,000
TOTAL 4,200 2,600 3,100 3,100 2,000 15,000
V These are cwiblative totals which take into account the faMlies settled an theseschemes in previous years. A further 2,300 have been settled at the now oompletedNawalpur I and Banke schemes.
Source: Nepal Settlement Company, October, 1973
ANNEX 1Appendix 1Page 1
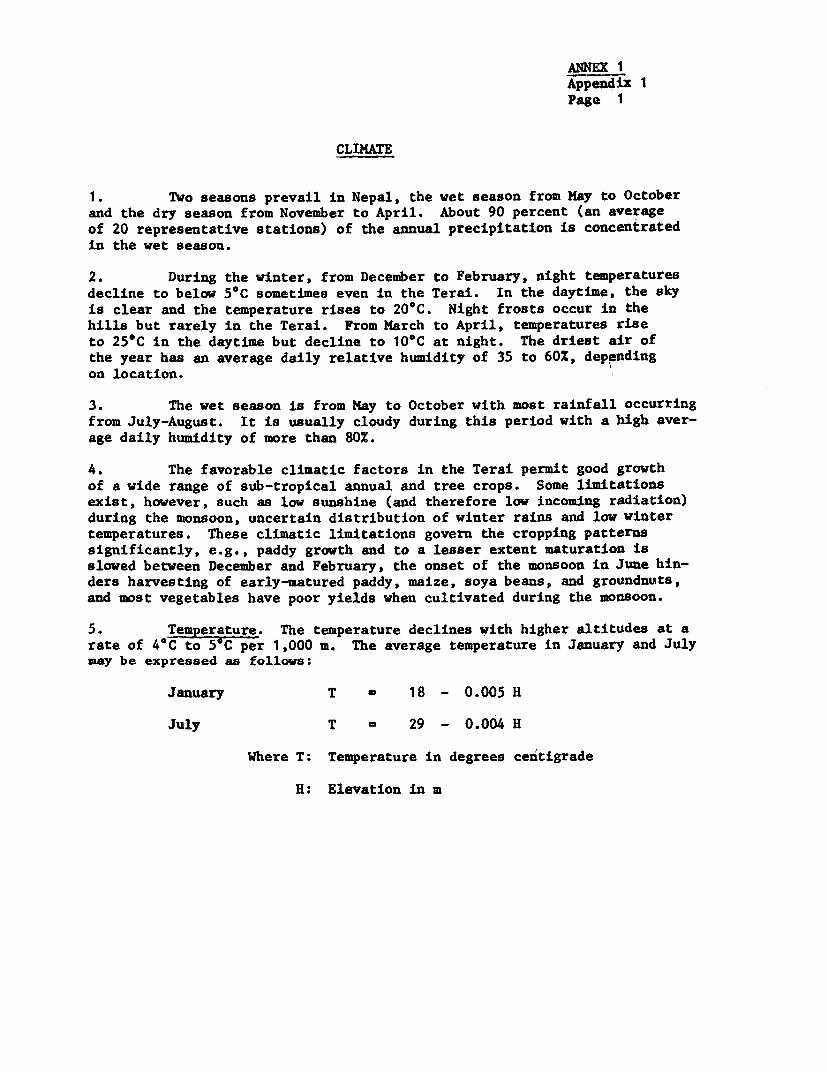
CLIMATE
1. Two seasons prevail in Nepal, the wet season from May to Octoberand the dry season from November to April. About 90 percent (an averageof 20 representative stations) of the annual precipitation is concentratedin the wet season.
2. During the winter, from December to February, night temperaturesdecline to below 5'C sometimes even in the Terai. In the daytime, the skyis clear and the temperature rises to 20'C. Night frosts occur in thehills but rarely in the Terai. From March to April, temperatures riseto 25°C in the daytime but decline to 10C at night. The driest air ofthe year has an average daily relative humidity of 35 to 60%, dependingon location.
3. The wet season is from May to October with most rainfall occurringfrom July-August. It is usually cloudy during this period with a high aver-age daily humidity of more than 80%.
4. The favorable climatic factors in the Terai permit good growthof a wide range of sub-tropical annual and tree crops. Some limitationsexist, however, such as low sunshine (and therefore low incoming radiation)during the monsoon, uncertain distribution of winter rains and low wintertemperatures. These climatic limitations govern the cropping patternssignificantly, e.g., paddy growth and to a lesser extent maturation isslowed between December and February, the onset of the monsoon in June hin-ders harvesting of early-matured paddy, maize, soya beans, and groundnuts,and most vegetables have poor yields when cultivated during the monsoon.
5. Temperature. The temperature declines with higher altitudes at arate of 4C to 5VC per 1,000 m. The average temperature in January and Julymay be expressed as follows:
January T - 18 - 0.005 H
July T - 29 - 0.004 H
Where T: Temperature in degrees centigrade
H: Elevation in m
ANNEX 1Appendix 1Page 2
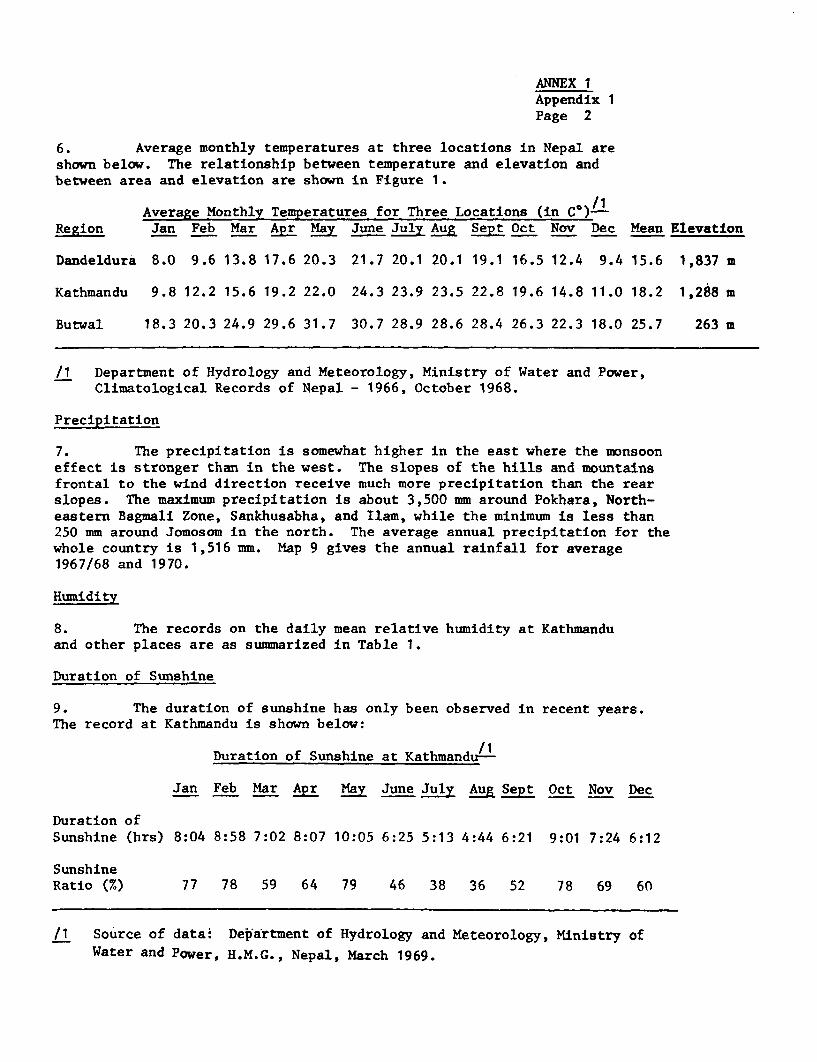
6. Average monthly temperatures at three locations in Nepal areshown below. The relationship between temperature and elevation andbetween area and elevation are shown in Figure 1.
Average Monthly Temperatures for Three Locations (in C°)/Region Jan Feb Mar Apr May June July Aug Sept Oct Nov Dec Mean Elevation
Dandeldura 8.0 9.6 13.8 17.6 20.3 21.7 20.1 20.1 19.1 16.5 12.4 9.4 15.6 1,837 m
Kathmandu 9.8 12.2 15.6 19.2 22.0 24.3 23.9 23.5 22.8 19.6 14.8 11.0 18.2 1,288 m
Butwal 18.3 20.3 24.9 29.6 31.7 30.7 28.9 28.6 28.4 26.3 22.3 18.0 25.7 263 m
/1 Department of Hydrology and Meteorology, Ministry of Water and Power,Climatological Records of Nepal - 1966, October 1968.
Precipitation
7. The precipitation is somewhat higher in the east where the monsooneffect is stronger than in the west. The slopes of the hills and mountainsfrontal to the wind direction receive much more precipitation than the rearslopes. The maximum precipitation is about 3,500 mm around Pokhara, North-eastern Bagmali Zone, Sankhusabha, and Ilam, while the minimum is less than250 mm around Jomosom in the north. The average annual precipitation for thewhole country is 1,516 mm. Map 9 gives the annual rainfall for average1967/68 and 1970.
Humidity
8. The records on the daily mean relative humidity at Kathmanduand other places are as summarized in Table 1.
Duration of Sunshine
9. The duration of sunshine has only been observed in recent years.The record at Kathmandu is shown below:
Duration of Sunshine at Kathmandu-/
Jan Feb Mar Apr Ma June July Aug Sept Oct Nov Dec
Duration ofSunshine (hrs) 8:04 8:58 7:02 8:07 10:05 6:25 5:13 4:44 6:21 9:01 7:24 6:12
SunshineRatio () 77 78 59 64 79 46 38 36 52 78 69 60
/1 Source of data- Depirtment of Hydrology and Meteorology, Ministry ofWater and Power, H.M.G., Nepal, March 1969.
ANNEX 1Appendix 1Page 3
Wind
10. The wind in Nepal is generally moderate but strong wind gusts occuroccasionally in the months March to May. The wind velocity in Kathmanduranges from 0.2 to 0.6 m/sec except for occasional wind gusts. The recordof the wind velocity at Chisapani is given below.
Mean Wind Velocity at Chisapani (m/sec)/1
Jan Feb Mar Apr Ma June July Aug Sept Oct Nov Dec
3.73 3.47 3.51 3.13 2.60 1.81 1.57 1.23 1.70 2.63 3.32 3.70
/1 Source of data: Department of Hydrology and Meteorology, Ministryof Water and Power, H.M.G., Nepal, March, 1969.
Potential Evapotranspiration
11. The Nepalese climate ranges from sub-tropical to alpine accordingto location, and the consumptive use of water by crops varies accordingly.The potential evapotranspiration at three typical locations in Nepal isgiven below.
Potential Evapotranspiration for Three Locations
Location J F M A M J J A S 0 N D Total
Butwal 97 112 144 167 178 133 111 99 98 113 107 92 1,451
Pokhara 69 74 72 119 112 100 96 81 81 89 76 61 1,030
Kathmandu 58 63 64 110 108 98 88 87 79 83 70 53 961
Remarks: Butwal El. 263 m Latitude 28024'Pokhara El. 833 m Latitude 28°11'Kathmandu El. 1,288 m Latitude 27042'
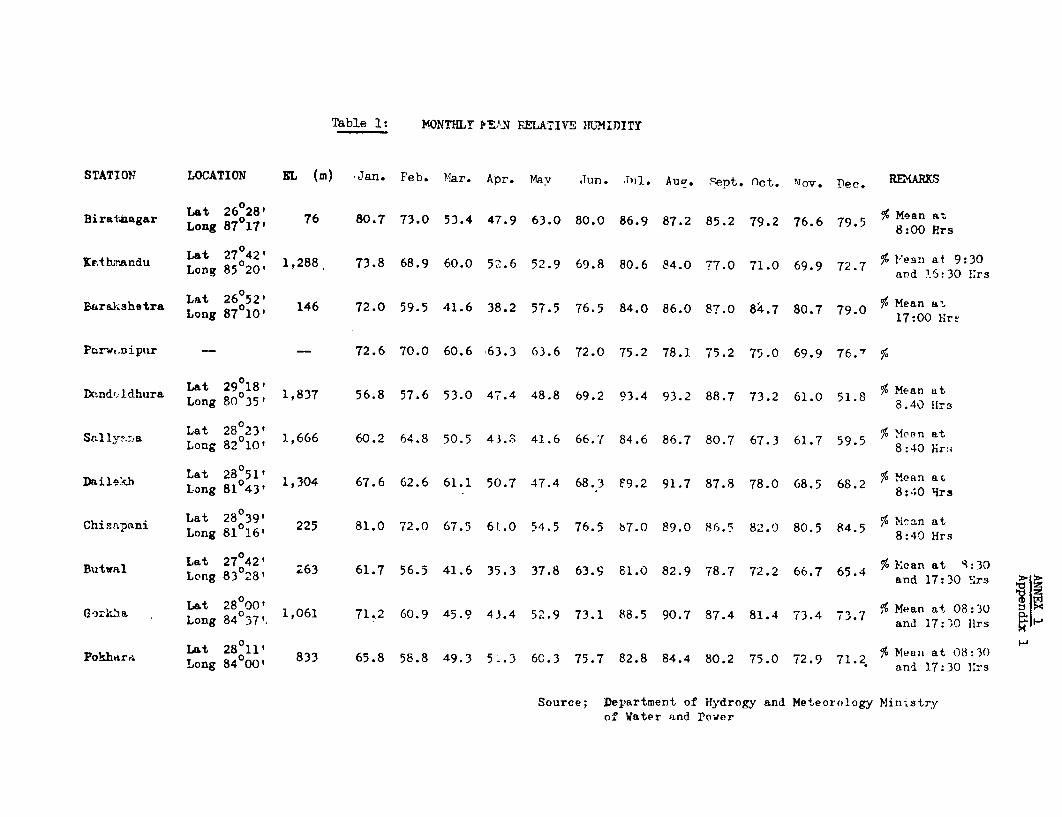
Table 1: MONTHLY PVE N FELA-IVE HUMIDITY
STATIOF LOCATION EL (m) *Jan. Feb. MIar. Apr. Mav Jun. Tul. Aua. 'et. Oct. ,vov. Dec. REM
Birata,agar Long 87017? 76 80.7 73.0 53.4 47.9 63.0 80.0 86.9 87.2 85.2 79.2 76.6 79.5 % Men Hrs
Lat 27 042' % Yes:: af 9:30Kr,thniandu Long 875020, 1,288, 73.8 68.9 60.0 52.6 52.9 69.8 80.6 84.0 77.0 71.0 69.9 72.7 and 16:30 1; s
Bara.kshetra Lat 26 052' ea -Barashatra. Long 87010, 146 72.0 59.5 41.6 38.2 57.5 76.5 84.0 86.0 87.0 84.7 80.7 79.0 % 17a0n ar
Parwi,nipur - -- 72.6 70.0 60.6 63.3 63.6 72.0 75.2 78.1 75.2 75.0 69.9 76.' %
Dt~ndrJdhura Lat 29 018: ,naDondr.Jdhura Long 80035 1,837 56.8 57.6 53.0 47.4 48.8 69.2 93.4 93.2 88.7 73.2 61.0 51.8 % 8Ma aft
Sn1Jy~~a Lat 28023? 8:40 atr:Sr.llys Lon 8200 1,666 60.2 64.8 50.5 43.8 41.6 66.7 84.6 86.7 80.7 67.3 61.7 59.5 O Meon at
Daile-h Lat 28051 1,304 67.6 62.6 61.1 50.7 47.4 68.3 89.2 91.7 87.8 78.0 68.5 68.2 % Mean aTLong 81043? 8:40 1irs
Chisnpani Lat 28039, 225 81.0 72.0 67.5 6..0 54.5 76.5 87.0 89.0 86.5 82.0 80.5 84.5 8 n40 Hat
Butwal ~~Lat 27 0421 % Y:oan at 94:30BiLtwal ong 8028, 263 61.7 56.5 41.6 35.3 37.8 63.9 81.0 82.9 78.7 72.2 66.7 65.4 a 17:30 ;30
i'3rz:a Lat 2800 1061 7102 60.9 45.9 43.4 52.9 73.1 88.5 90.7 87.4 81.4 73-4 737 % Mean at 08:30 2Long 84037,. 101 7~ and 17:,0 lis
Lat 28011 il Meani at 08:3()Pokhara Long 84000, 833 65.8 58.8 49.3 5 .3 6C.3 75.7 82.8 84.4 80.2 75.0 72.9 71.2.% and 1-7:30 13s
Source; Department of Hydrogy and Meteorology Min.stryof Water and Po-wer
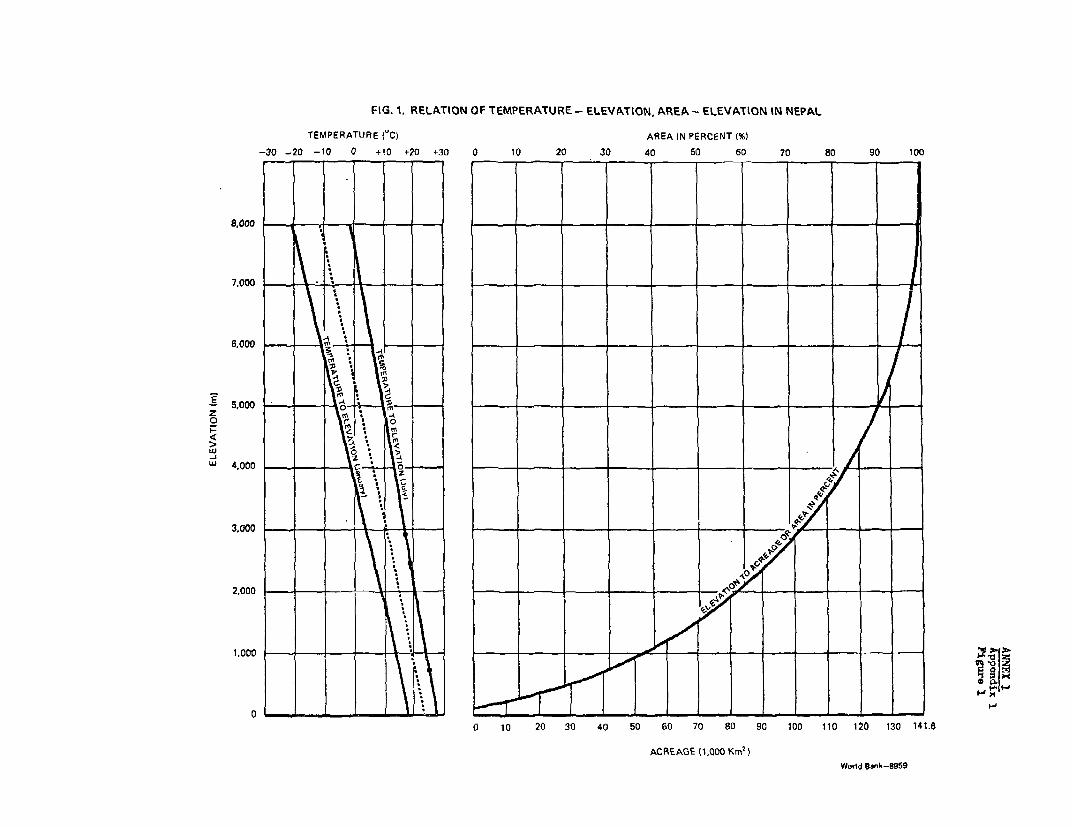
FIG. 1. RELATtON OF TEMPERATURE - ELEVATION, AREA - ELEVATION IN NEPAL
TEMPERATURE ('C) AREA IN PERCENT (%)-30 -20 -l0 0 +10 +20 +30 0 tO 20 30 40 50 60 70 80 90 100
8.000- --- - -- -
7.000
6,000
F-~~~~~~~~~~-
5.000
0 o
0 3O 20 30 40 50 60 70 80 90 100 110 120 130 141.6
AC.0AG0E 1000 Km' )
World Bonk-8959
ANNEX 1Appendix 2Page 1
ASSESSMENT OF SOIL INVESTIGATIONS
Soil Investigations
1. The Department of Agriculture (DA) and the Department of Forestry(DF) are the only government agencies which undertake soil surveys. Thetotal professional staff engaged full time on the work is estimated to beeight soil surveyors and four soil chemists. DA has had little or nosupporting staff such as cartographers, tracers and draughtsmen. The ForestDepartment has had a cartographic section for several years which contractsaerial surveys and prepares and publishes soil maps with the support of USAID.
2. The Department of Agriculture has published a number of reconnaissancesoil survey reports covering some 8,000 square km. The Forest Department haspublished a number of reports covering forest soils in the Janakpur, Narayaniand Bheri areas. A very general survey of the Districts of Saptari, Siraha,Danusha, Mahottari, Sarlahi, Pautahat, Bara and Parsa, comprising 600,000 ha,was published by FAO/Nippon Koei in its Sun Kosi Project in 1970. FAO/NKpublished in 1972 a report on the soil survey in the Birganj-Gandaki IrrigationProject.
3. Methods and procedures followed by the different agencies under-taking soil surveys are often not mentioned (especially chemical analysis).Pedology and soil formation are usually not covered, hence comparison amongstudies are difficult. The mission encountered difficulties in interpretingNippon Koei results because of this problem. Reconnaissance Soil Surveys bythe Department of Agriculture are of limited use mainly because of inadequateand antiquated methods adopted and the lack of suitable base maps for fieldwork.
4. The UNDP/FAO Project NEP-12 is however improving the situation,providing DA with soil survey, soils laboratory and cartographic equipmentand is training four soil analysts and a few assistants. Reconnaissance soilsurveys of the Districts of Rautahat, Parsa and Bara, totaling about 3,800square km are being carried out by the INDP/FAO Project NEP-12 to acceptedup-to-date standards which is a re-survey of some of the area covered byNippon Koei. Reconnaissance and semi-detailed surveys covering about 2,200sq. km have been carried out recently in Nawalparasi District by staff ofthe Directorate of Overseas Survey of Great Britain. The Forest Departmentis presently surveying forest areas in the Mechi Zone.
Generalization of Nepalese Soils -
5. The soils of Nepal have been categorized into four groups, accordingto their formation and modes of deposition, namely:
1/ Adapted from Nippon Koei/DA, Master Plan of Irrigation Development inNepal August 1970, with extensive changes and additions from other sources.
ANNEX 1Appendix 2Page 2
(a) Residual soils and lithosols produced by the weatheringof the rocks which were formed in the tertiary and moreancient geological eras. These soils broadly cover themountainous lands in Nepal.
(b) Diluvial and colluvial soils which cover the hilllands throughout Nepal.
(c) Lacustrine soils, soils settled out of quiet lakewaters, distributed on the valleys, e.g., Kathmandu andthe Terai;
(d) Fluvial soils developed on the Terai plain and Tars.
6. Terai Soils. The fluvial and Lacustrine soils covering most ofthe flat low lands in Terai are divided into four soil groups:
(a) Brown forest soils;
(b) Regosols;
(c) Gray hydromorphic and low humic glei associated soils;
(d) Hydromorphic.
7. The Brown forest soils are found as alluvial fans and as gentleundulations on the belts where the Terai plain comes into contact with theChuria Ridge or the Siwalik Hills. These soils have a thick solum depth,coarse sandy loam texture often mixed with gravels, and medium acid soilreaction. These soils have a high permeability, low water holding capacityand rather low fertility. They cover 420,000 ha of land or about 15% of thetotal Terai.
8. The Regosols are immature soils derived from the recent fluvialdeposits distributed in strips along the rivers in Terai. These soils alsohave a thick solum depth, very coarse, sandy texture and weak acidity. Theyhave a very low fertility, very high permeability, very low water-holdingcapacity and high erodibility. They cover an area of 140,000 ha or only5% of the total Terai area.
9. The term "Bhabar" (or Piedmont) soils as used in Nepal coversthese two categories of soils. They are the least fertile and agriculturallymost difficult to manage.
10. The gray hydromorphic and low humic gley soils are adjacent tothe brown forest soils and are generally lower and flatter. They coverabout 2.0 M ha (70% of the Terai plains), and are the most important agri-cultural lands of Nepal due to their potential for year-round irrigation.
ANNEX 1Appendix 2Page 3
The degree of weathering and profile development depends on land elevation,groundwater depth and fluctuation, and cultivation practices. The effectof cultivation practices is not yet pronounced because most Terai landshave only been used intensively for agriculture over the last 20 to 30years. Areas with relatively shallow water tables have soils with grey,mottled profiles due to hydromorphic weathering processes associated withthe seasonal groundwater fluctuations. The soils have a moderately thicksolum depth, a loamy texture rich in sand and a slightly acid soilreaction. They are of moderate fertility, moderate permeability andmoderate water holding capacity, and are currently used for rainfed paddyculture. While they are highly suitable for year-round irrigation, theydegenerate with prolonged over-irrigation. It is necessary to controlwater applications to sustain and enhance their productivity.
11. A relatively infertile variant of these soils are the relict up-lands, developed over a portion of a former alluvial plain; lying a few metersabove the surface of the present plains. These remnant terraces are unvaria-bly rolling and uneven, in contrast to the almost level, recently formed andmost fertile plain soils. They are covered by rather coarse textured, pale-colored, heavily compacted and strongly leached soils which would be diffi-cult to manage. These remnant teraces are typically eroded by small ravines,indicating a fast rate of geological erosion, even under natural forest cover.The depth to water table appears considerably in these soils, as evident bythe poor quality of natural forest covers and presence of more drought-resist-ing species. Such soils should be used as protective or productive forests,possibly as controlled grazing or firewood reserves. Their extent is proberlyabout 10% of the Terai area.
12. Hydromorphic soils are found on the nearly flat and low landsthat are annually inundated by monsoon floods for periods of four to sevenmonths. The belt along the Indo-Nepal border is generally covered by thesesoils. They comprise 280,000 ha or about 10% of the total Terai. Theseare weak alkaline tropical soils formed from fluvial deposits under theinfluence of the seasonal groundwater fluctuations due to prolongedinundation. They have a thick solum depth, clay loam texture with siltand sand and a mildly to moderately alkaline soil reaction. They havea moderately high fertility, moderate permeability and moderate waterholding capacity. They retain a fairly high productivity with floodirrigation or rice.
13. Two characteristics of the Terai soils should be mentioned. Kaoloniteis the dominant clay mineral--a non-expanding mineral with a low cationexchange capacity (CEC = 10 to 12 meg. for 100 grams of Kaolonite clay). 1/The other is the relatively high infiltration rates of the soils (lowest
1/ FAQ/Nippon Koei, Report on the Soil Survey in Binganj-Gandaki IrrigationProject, June 1972, Appendix on Xray and Thermal Analysis of ClayFraction.
ANNEX IAppendix 2Page 4
observed value is 3 cm. per day), 1/ resulting in high deep percolation losseswith ponded rice cultivation unless the soil is saturated (waterlogged).The adverse effect of nutrient leaching under sustained irrigation has beenestablished in the old Chandra canal project command which has been flood-irrigated for about 40 years. 2/ This raises question as to the wisdom oftwo practices recommended by Nippon Koei, namely (a) rice cultivation withcontinuous ponds on non-saturated soils and (b) provisions of drainagesystems which would decrease subsoil water levels. Both practices increaseleaching of nutrients.
8. Hill Soils. Very little infonnation is available on Hill Soilsespecially for the slopes. Most of the soils in hills and valleys arerelatively coarse, especially those derived from carbonaceous rocks (Map10911). For the slope, textural analyses 3/ point towards medium texturedsoils with a higher clay and silt content than the valley soil and theyshould have a good waterholding capacity. The soil reaction is moderatelyto slightly acid (pH 4.5-6.0). Cation exchange capacities in the A and Bhorizons vary between 8-12 m.e.q./100 g soil although values of 20 and moreare found in topsoils (A horizon) with high organic matter content. Or-ganic matter and nitrogen contents vary from medium to occasionally high,resulting from the lower temperatures at the higher altitudes. AvailableP 05 in the topsoils vary from medium (2 - - 50 kg P205/ha) to high(go -180 kg P20 ) although in Ilam very low values were found. Available(K 0 value vary Krom medium (100 - 250 kg K 0/ha) to high (250 - 450 kg
ha) and occassionally very high as in Iam district.
1/ FAC/Nippon Koei, Report on the General Reconnaissance Soil Survey of theEastern Terai Plain in Nepal, September 1970, and footnote 1/, pp. 30-33.
2/ Nippon Koei, Final Report on the Development of Irrigation in the Centraland Eastern Terai Plain, Nepal, 1972, p. 22.
3/ Final Report of H. C. Dewan, Soil Chemist FAO Nepal-12 Project, Sept. 1973,M.T. Kaddah 1965, Report to the Government of Nepal FAO-EPTA Report No. 2043;II.M.G. DA, Soil Science Section 1965: Soil Survey of Tea Growing Areas ofIlam District Mechi-Zone.
ANNEX 1Appendix 3Page 1
ASSESSMENT OF LAND-USE STATISTICS IN NEPAL
1. The land use picture in Nepal is characterised by conflictingfigures depending on the source of information used. This appendix sum-marises the different sources of information and attempts to assess andreconcile the diverse land use information to obtain a more representa-tive picture for policy analysis.
Sources of Land Use Statistics
They are four basic sources of Land Use information available inNepal:
(a) Forest Invensoty surveys of the Department of Forestry (DF);
(b) Cadastral Surveys of the Survey Department, Ministry ofLand Reform;
(c) Cultivated Area statistics of the Ministry of Food,Agriculture and Irrigation;
(d) Earth Resources Technology Satellite (ERTS) Imagery.
Forestry Surveys
2. A country-wide forest inventory was undertaken by the ForestResource Survey (FRS) Office of the Department of Forestry in cooperationwith USAID/Nepal. The Terai was aerial photographed in 1964 at a scale of1 : 12,000. The area covered the whole of the level Terai, the Churia Rangeand part of the southern exposure of the Mahabharat Range. 1/ In terms ofadministrative districts, this survey does not cover all Inner Terai. 2/ Theresults are published in "Forest Statistics for the Terai and Adjoining Re-gions", 1967. Land Use information for the Hills were compiled from aerialphotographs taken during 1953-58, 1962 and 1967. In 1964-65, a 100% stripsample of the hills were aerial photographed to rectify the earlier compila-tions. The analysis of the information started only in 1968 and the results
1/ Forest Statistics of the Timber Corporation of Nepal (TCN) Area, 1965,covers the area of Chitwan (Inner Terai) omitted in the 1967 report.
2/ Only about 50% of Dang Deokhuri and Udayapur districts are included.The TCN Forest Reserves of Chitwan are excluded. Small portions ofDoti, Surkhet, Argha Kanchi, and Palpa districts are also included.
ANNEX 1Appendix 3Page 2
will be published in a forthcoming report, "Forest Statistics of the HillRegion" (in Press). 1/ A report on the Bheri-Karnali watershed (Far West-ern Hills), based on 1962 aerial photographs has already been publishedseparately in 1969. 2/
Cultivated Area Statistics and Cadastral Surveys
3. Cultivated and cropped area estimates (and estimates for produc-tion and yield) are made by the Ministry of Agriculture through about 660extension workers in 75 districts. The Junior Technicians (JT's) and JuniorTechnical Assistants (JTA's) interivew farmers and also make visual checkson areas under major crops three times a year for each panchayat under theircontrol. These data are scrutinized at the district level and finalized atKathmandu by the Economic Analysis and Planning Department (EAPD). 3/ Cadas-tral surveys in conjunction with the Land Reform Program was initiated forthe Terai in 1967. The results for 16 districts 4/ (mainly in the Terai)were incorporated in the 1970/71 cultivated area statistics published in theAgricultural Statistics of Nepal by EAPD.
Earth Resources Technology Satellite Images
4. The 1972 Earth Resources Technology Satellite imagery provide anup-to-date assessment of the extent of forest areas in Nepal. The FAO/UNDPForestry Department Project in Nepal has analyzed only the forest imagesin the flat portions of the Terai and Inner Terai. The Department of Forestry(DF) more recently analyzed the ERTS images for total forests in the Teraiand some adjoining hill areas, and the Geography Department have just com-pleted a land-use Map of Nepal based largely on DF's analysis. Maps 11172and 10912 (General Report) are based on the results of the FAO/UNDP andGeography Department analyses.
1/ The analysis of the Hills data was hampered by the slow acquisition oftopographic maps, and hand compution and compilation work.
2/ Timber Resources and Development Opportunities in the Lower Bheri andKarnali Watersheds, 1969.
3/ Since 1973, the newly formed Department of Food and Marketing Serviceshas taken over this function as a result of the transfer of the Statis-tics Section from EAPD.
4/ Kathmandu, Bhaktapur, Lalitpur, Jhapa, Sunsari, Morang, Siraha, Saptari,Mahottari, Dhanusha, Bara, Parsa, Rautahat, Kanchanpur, Doti and Achaam.Some of these districts were adjusted on the basis of registrations atthe Land Revenue Offices (Mala).
ANNEX 1Appendix 3Page 3
An Assessment of Land-Use in Nepal
5. Table 1 illustrates the diversity of data on land-use providedby the two basic sources (EAPD and DF) and the missions alternative esti-mates for present land use. Two fundamental differences had to be recon-ciled - (a) forested areas and (b) cultivated areas.
Forested Areas
6. The 1964 total forested area (6.4 M ha) estimated by the Departmentof Forestry remains the only comprehensive source available (Table 1). EAPD's30% downward adjustment of this figure 1/ by 1.9 M ha for 1970/71 (equivalentto about 6% annual loss) appears to have over-estimated the loss of forestarea. A comparison of 1972 ERTS imagery and the 1964 FRS survey resultsprovides a clue to the extent of commercial forest loss in the Terai and partsof Inner Terai 2/over the past decade (Table 2). About 340,000 ha or 31% ofcommercial forests were estimated to be lost - an equivalent of about 4%annually. Some 180,000 ha were lost to colonization (Table 3) and the restwere probably due to illegal commercial felling, forest destruction for fire-wood and livestock grazing. EAPD's total forest area of 4.5 M ha, when com-pared with the 6.4 M ha of FRS is equivalent to unrealistic area losses of33% 3/ for Hill 4/ Commercial Forests and 25% 5/ of all Non-Commercial Forestssince 1964. A more realistic judgement of 5.0 M ha 61 is used by the mission.
1/ Although the source for EAPD's forestry figures were not cited, andno other comprehensive survey has been undertaken by them, it may besafely presumed that their initial basis are the FRS figures.
2/ Mainly Dang-Deokhuri and Chitwan.
3/ Although significant migration into Hill valleys have taken place, pop-ulation statistics indicate that migration has principally been into theTerai and Inner Terai. It is therefore highly unlikely that the per-centage area of commercial forest lost in the Hills will be as high asin the Terai, and Inner Terai. Loss for commercial uses would be mini-mal because of accessibility. Non-commercial losses for firewood andgrazing would generally result in thinning of forest stands rather thanlarge scale forest destruction.
4/ Including the rest of the Inner Terai not covered by ERTS analysis.
5/ Such a figure is unlikely because most of the non-commercial forests areon slopes greater than 45°.
6/ Based on 15% decline of commercial forest in the rest of the Hills and130,000 ha remaining in both the TCN forests in Chitwan and the Bheri-Karneli watershed; and 15% loss of total non-commercial forests.
ANNEX 1Appendix 3Page 4
Cultivated Area
7. The resolution of the 1.2 M ha discrepancy between EAPD figures(2.0 M ha) and DF figures (3.2 M ha) for total cultivated area in Nepalhas to be undertaken as a matter of priority since it has too many policyimplications to be neglected. As the adjustments from cadastral surveyresults for 16 districts have shown, EAPD has tended to under-estimatecultivated areas. (The 1970 adjustment for 16 districts added about 100,000ha.) Although the data is not entirely comparable, the present (1970/71)EAPD's figure of the Terai (excluding Inner Terai) cultivated area (1.2 Mha) is not unduly different from 1.2 M ha (1964) estimated by FRS for theTerai and Adjoining Areas, particularly if allowances are made for thechronological differences, and adjustments for the Adjoining Areas cover-age. 1/
8. The main discrepanies pertair. to the rest of Nepal. We contendthat most of the discrepancies would take place for Inner Terai districtsand hill districts with relatively large valleys. The 1972/73 cadastralsurvey figure for Surkhet of 27,000 ha, for example, was nearly double the1970/71 EAPD cultivated area of 14,800 ha. 2/ Further adjustments on thebasis of cadastral surveys should show similar discrepancies for otherdistricts with relatively large hill valleys (e.g., Kaski, Dhading, Kavre,Nuwakot, Baglung, Gorkha, Tanahu, Palpa, Gulmi, Sallyan, Dailekh) and mostInner Terai districts (Chitwan, Sindhuli, Makwanpur and particularly DangDeokhuri 3/). Pending the outcome of cadastral surveys for these areas(they should be given priority), a crude adjustment by the mission 4/ givesthe following results:
1/ The Adjoining areas in the FRS study consisted of about 50% of DangDeokhuri and Udayapur districts of the Inner Terai; and minor portionsof Doti, Surkhet, Argha Kanchi and Palpa districts of the Hills.
2/ Since cadastral surveys cover only registered areas, the 27,000 ha wouldalso be underestimated.
3/ In Dang Deokhuri, for example, EAPD's cultivated area (55,000 ha) isless than the mission's estimate of level land of 60,400 ha (Annex 6,Table 3). Since ERTS images show that only 1,300 ha of level forestsare left at least 5,000 ha has to be cultivated. With possibly another20,000 ha of cultivated land up to 300 slope (not analyzed from ERTSimages), a 25,000 ha incremental adjustment would not be unrealistic.
4/ Doubling cultivated area in large hill valley districts and increasingunadjusted Inner Terai cultivated areas by 50%. Udayapur figures arenot adjusted because they appear unusually large.
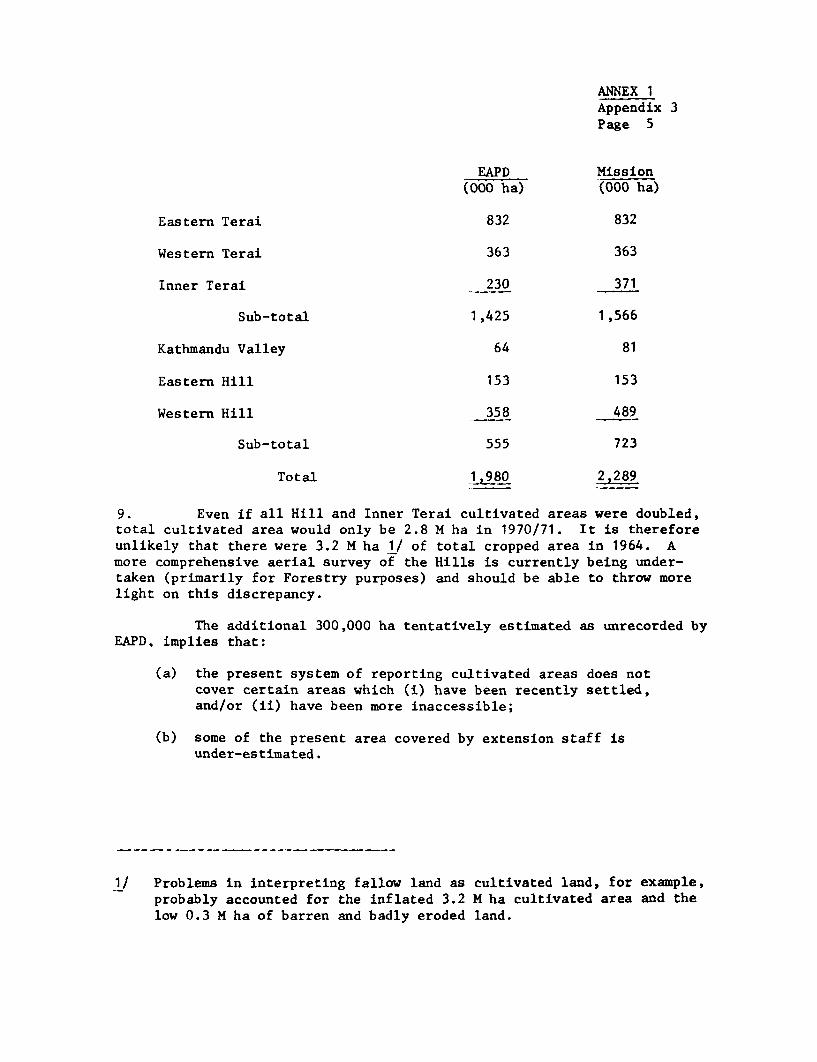
ANNEX 1Appendix 3Page 5
EAPD Mission(000 ha) (000 ha)
Eastern Terai 832 832
Western Terai 363 363
Inner Terai 230 371
Sub-total 1,425 1,566
Kathmandu Valley 64 81
Eastern Hill 153 153
Western Hill 358 489
Sub-total 555 723
Total 1A980 2,289
9. Even if all Hill and Inner Terai cultivated areas were doubled,total cultivated area would only be 2.8 M ha in 1970/71. It is thereforeunlikely that there were 3.2 M ha 1/ of total cropped area in 1964. Amore comprehensive aerial survey of the Hills is currently being under-taken (primarily for Forestry purposes) and should be able to throw morelight on this discrepancy.
The additional 300,000 ha tentatively estimated as unrecorded byEAPD, implies that:
(a) the present system of reporting cultivated areas does notcover certain areas which (i) have been recently settled,and/or (ii) have been more inaccessible;
(b) some of the present area covered by extension staff isunder-estimated.
1/ Problems in interpreting fallow land as cultivated land, for example,probably accounted for the inflated 3.2 M ha cultivated area and thelow 0.3 M ha of barren and badly eroded land.
ANNEX 1Appendix 3Page 6
10. This however does not detract from the use of area, yield and pro-duction data currently compiled by the Ministry of Agriculture for analyzingyear to year changes in crop performance and the factors affecting it. Inabsolute terms however, some implications will have to be noted. For theHill districts, on a normal year, the food deficit situation (especially forWestern Hills) would appear to be less pronounced with an equivalent of about240,000 m tons 1/ of maize not previously recorded). Similarly for the Inner
Terai, and equivalent of about 300,000 m tons of paddy would be available fornearby deficit areas. 2/
11. These figures illustrate the sensitivity of surplus deficit pro-jections to area assumptions. Hence, absolute level comparisons in thecontext of Nepal Agricultural statistics should be regarded only as indica-tive.
Potential Areas for Land Settlement in the Terai
12. An approximate estimate of the potential areas for land settlementin the Terai may be obtained from an assessment of level forests in the Teraiand generalizations from existing lands-use/soil studies and field observations.
13. Total undissected forests in the Terai and Inner Terai (from ERTSimagery analysis) are estimated at 620,000 - 650,000 ha (Table 2 and Appendix3, Table 4 of this annex) 3/. From this, the following should be deducted asthe minimum area that would be unsuitable for agriculture (see Annex 1,para 14):
(a) heavily disturbed areas (Annex 1, Table 2);
(b) forests with piedmont (Bhabar) soils (Annex 1, para 14); and
(c) forests with relict upland (remnant terrace) soils (Annex 1,para 14).
1/ 141,000 ha times 1.7 m tons (av. yield of maize/ha from 1970/71 -1972/73).
2/ Because of the problem of accessibility, relatively small amountsprobably from Chitwan and Dang would have been exported.
3/ For districts in the Terai, the following estimates of level forestswere interpreted from ERTS images:
(a) FAO/UNDP (Appendix 3, Table 4) = 580,000 ha(b) Geog. Dept., Tribhuvan University (October, 1974) - 420,000 ha(c) NPC Task Force for Land Use and Erosion Control (August, 1974)
480,000 ha.
ANNEX 1Appendix 3Page 7
14. Level undissected forests which are heavily disturbed total about76,000 ha in the Terai and Inner Terai (Annex 1, Table 2), leaving about560,000 ha as agriculturally suitable. Relict uplands could not be deline-ated from ERTS images and, from Table 4 and Maps 10912 and 11172 (GeneralReport), only 35,000 ha of undissected level forests are estimated to beBhabar. A UNDP/FAO analysis 1/ of Bardia and Banke (with extensive fieldobservations) found respectively 4,000 ha and 22,000 ha of limited useforests (those with bhabar and relict upland soils) in each of these dis-tricts. 2/ The 1973 IDA settlement mission found that, of the level forest.areas originally allocated for consideration as settlement areas, about 50%were unsuitable for agriculture. It is therefore not unrealistic to expectthat at least (a) 150,000 ha of remaining undissected level forests, and(b) 95,000 ha or half of the undissected level forest which are undisturbed(Annex 1, Table 2), would be unsuitable for agriculture. This leaves amaximum of 325,000 ha for land settlement. Most of this area (Maps 10912and 11172) would be in Far-Western Terai (about 200,000 ha) and Mid-Westernand Inner Terai (about 90,000 ha). In the Eastern Terai, Morang and Baradistricts (Map 11172) 3/ probably have the highest potential for new settlements.
1/ UNDP/FAO, Forest Development Project - Land Use for Bardia and BankeDistricts, FO:SF/NEP 13, Technical Report 1, 1973. (Restricted Draft),Table 1, p 22.
2/ Compared with only 1,000 and 9,000 ha clearly identified as Bhabar forestsin the ERTS imagery analysis of Bardia and Banke respectively (Table 4),either bhabar soils were underestimated or relict upland areas on theselevel forest were about 3,000 ha and 13,000 ha respectively (i.e. nearlytwo to three times larger in extent than Bhabar soils).
3/ Although Jhapa has about 32,000 ha of level undissected forests (Table 4),most of it is heavily disturbed.
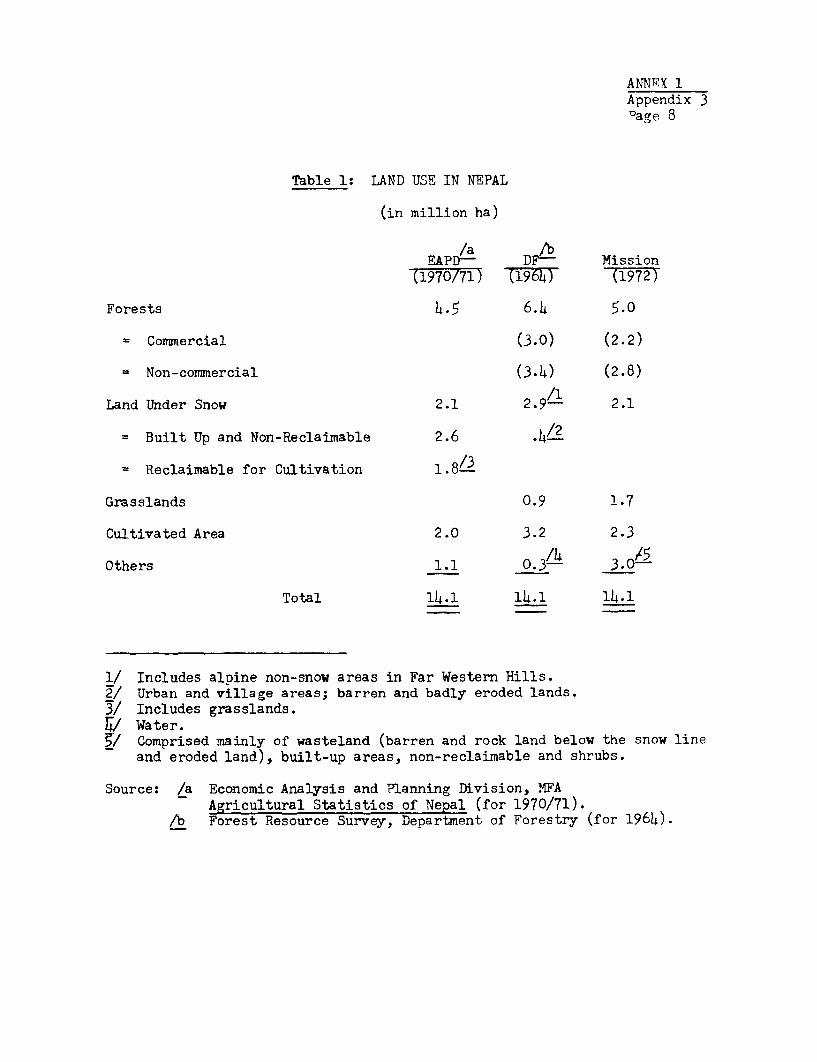
ANNTX 1Appendix 3Dgae 8
Table 1: LAND USE IN NEPAL
(in million ha)
/a ~/bEAPDa DF- Mission
(1970/71) (19610 (1972)
Forests 4 5 6.4 5-°
= Commercial (3.0) (2.2)
= Non-commercial (3.4) (2.8)
Land Under Snow 2.1 2.9- 2.1
= Built Up and Non-Reclaimable 2.6 .4/2
= Reclaimable for Cultivation 1.8/3
Grasslands 0.9 1.7
Cultivated Area 2.0 3.2 2.3
Others 1.1 0.3A 3.0 -
Total 14.1 14.1 14.1
1/ Includes alpine non-snow areas in Far Western Hills.2/ Urban and village areas; barren and badly eroded lands.3/ Includes grasslands.
/ Water.§/ Comprised mainly of wasteland (barren and rock land below the snow line
and eroded land), built-up areas, non-reclaimable and shrubs.
Source: /a Economic Analysis and Planning Division, MFAAgricultural Statistics of Nepal (for 1970/71).
/b Forest Resource Survey, Department of Forestry (for 1964).
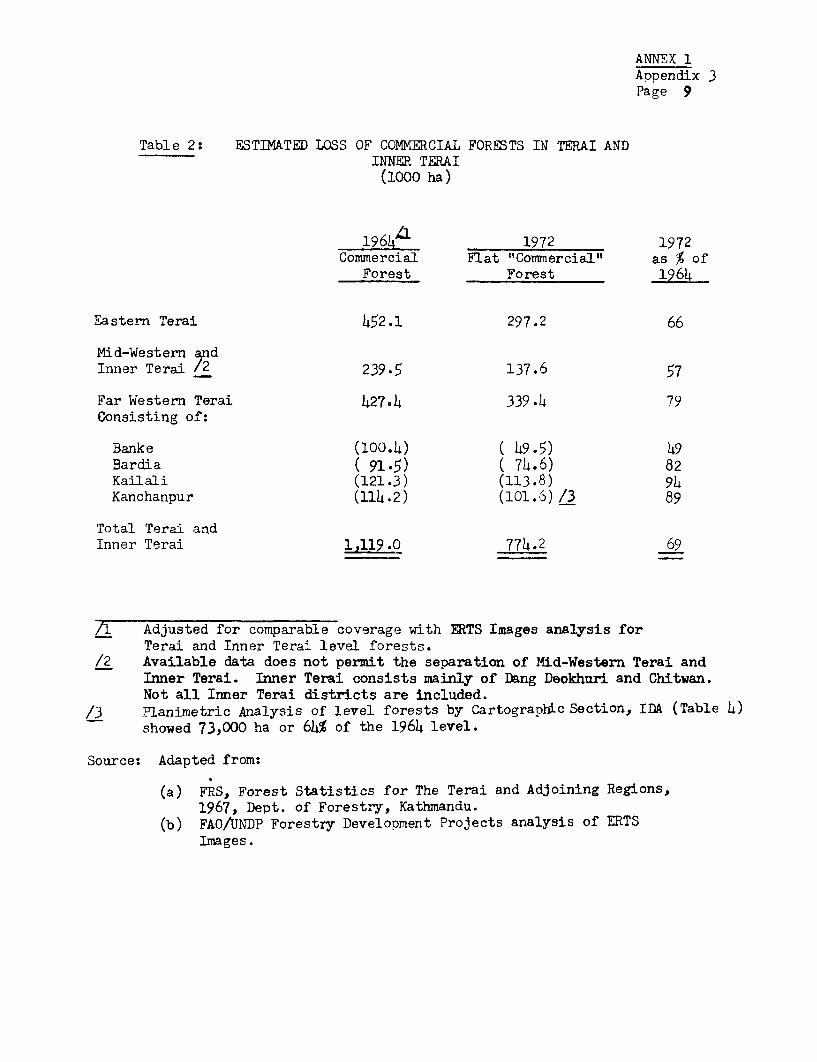
ANNEX 1Aopendix 3Page 9
Table 2: ESTIMATED LOSS OF COMMERCIAL FORESTS IN TERAI ANDINNER TERAI
(1000 ha)
1964 L 1972 1972Commercial Flat "Commercial" as % of
Forest Forest 1964
Eastern Terai 452.1 297.2 66
Mid-Western IndInner Terai /2 239.5 137.6 57
Far Western Terai 427o4 339.4 79Consisting of:
Banke (1004.) ( 49.5) 49Bardia ( 91.5) ( 74.6) 82Kailali (121.3) (113.8) 94Kanchanpur (11h.2) (101.6) /3 89
Total Terai andInner Terai 1,119.0 774.2 69
/1 Adjusted for comparable coverage with ERTS Images analysis forTerai and Inner Terai level forests.
/2 Available data does not permit the separation of Mid-Western Terai andInner Terai. Inner Terai consists mainly of Dang Deokhuri and Chitwan.Not all Inner Terai districts are included.
/3 Planimetric Analysis of level forests by Cartogranhic Section, IDA (Table 4)showed 73,000 ha or 64% of the 1964 level.
Source: Adapted from:
(a) FRS, Forest Statistics for The Terai and Adjoining Regions,1967, Dept. of Forestry, Kathmandu.
(b) FAO/UNDP Forestry Development Projects analysis of ERTSImages.
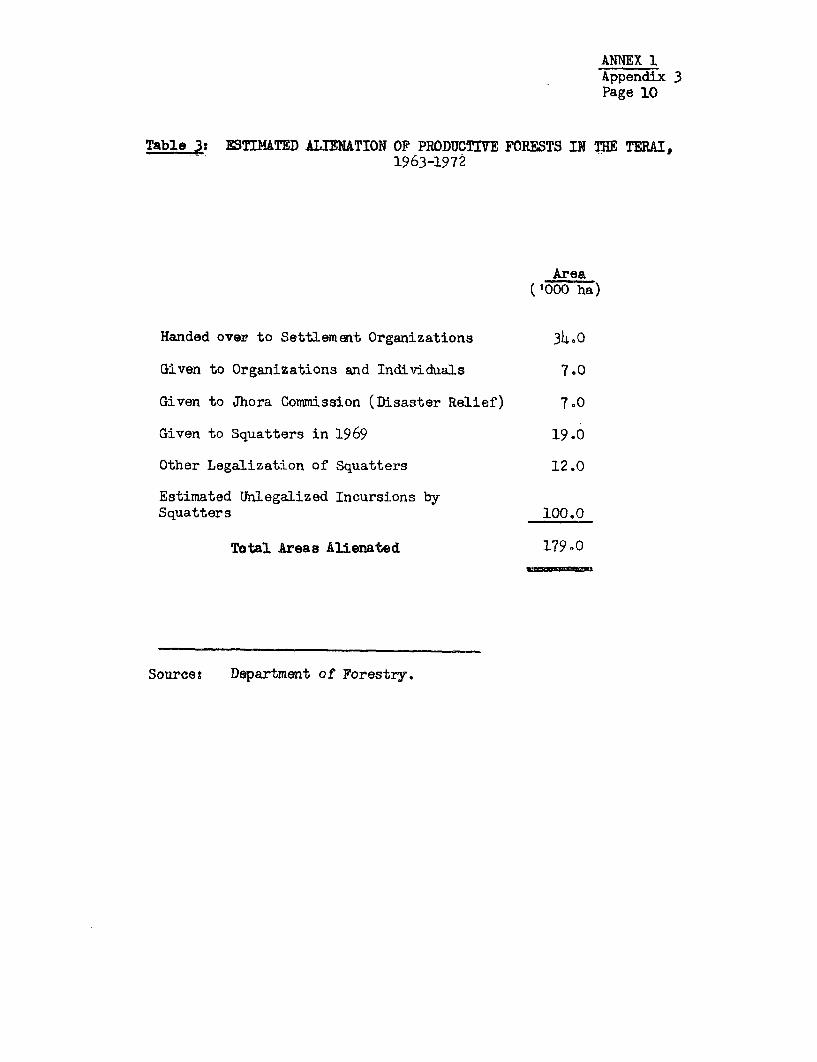
ANNEX 1Appendix 3Page 10
Table 3: ESTIMATED ALIENATION OF PRODUCTIVE FORESTS IN THE TERAI,1963-1972
Area('000 ha)
Handed over to Settlement Organizations 34.0
Given to Organizations and Individuals 7.0
Given to Jhora Commission (Disaster Relief) 7.0
Given to Squatters in 1969 19.0
Other Legalization of Squatters 12.0
Estimated Unlegalized Incursions bySquatters 100.0
Total Areas Alienated 179.0
Sources Department of Forestry.
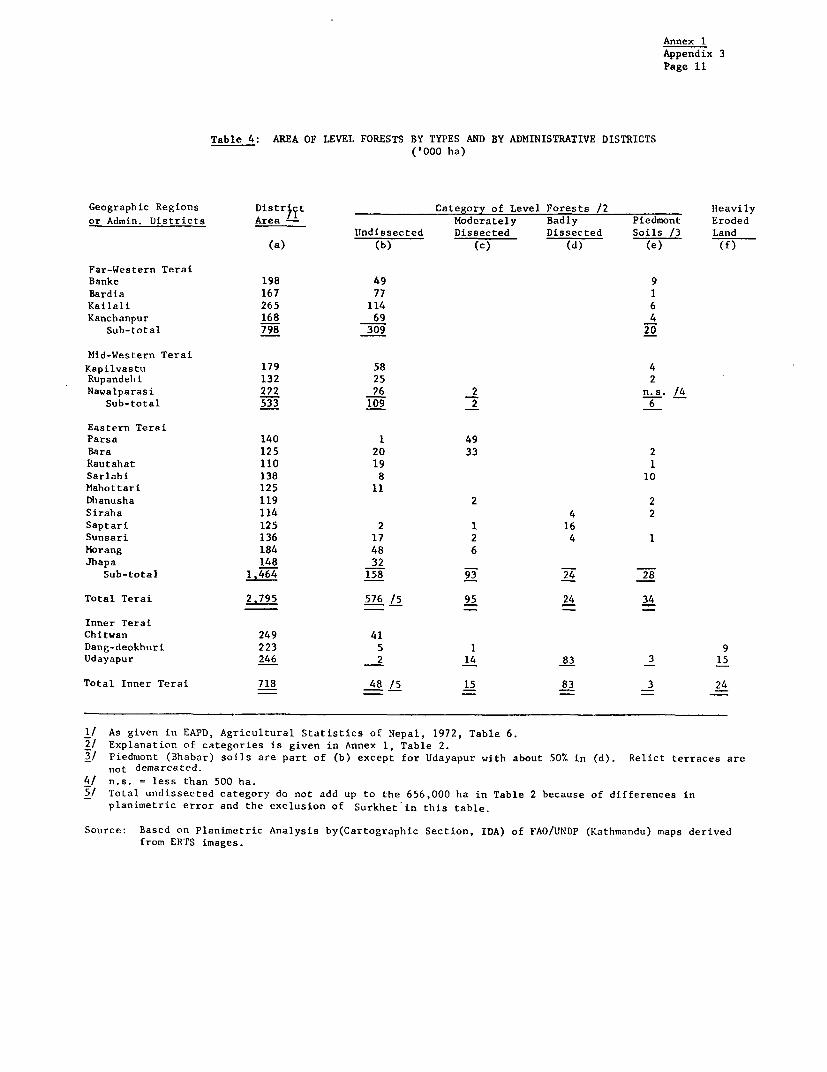
Annex 1Appendix 3Page 11
Table 4: AREA OF LEVEL FORESTS BY TYPES AND BY ADMINISTRATIVE DISTRICTS('000 ha)
Geographic Regions Distr t Category of Level Forests /2 Heavily
or Admin. Districts Area Moderately Badly Piedmont Erodedllndissected Dissected Dissected Soils /3 Land
(a) (b) (c) (d) (e) (f)
Far-Western TeraiBanke 198 49 9Bardia 167 77 1Kailali 265 114 6Kanchanpur 168 69 4
Sub-total 798 309 20
Mid-Western TeraiKapilvastu 179 58 4Rupandehi 132 25 2
Nawalparasi 222 26 2 n.s. /4Sub-total 533 109 2 6
Eastern TeraiParsa 140 1 49Bara 125 20 33 2Rautahat 110 19 1Sarlahi 138 8 10Mahottari 125 11Dhanusha 119 2 2Siraha 114 4 2Saptari 125 2 1 16Sunsari 136 17 2 4 1Morang 184 48 6Jhapa 148 32
Sub-total 1,464 158 93 24 28
Total Terai 2.795 576 /5 95 24 34
Inner TeraiChitwan 249 41Dang-deokhuri 223 5 1 9Udayapur 246 2 14 83 3 15
Total Inner Terai 718 48 /5 15 83 3 24
1/ As given in EAPD, Agricultural Statistics of Nepal, 1972, Table 6.2/ Explanation of categories is given in Annex 1, Table 2.3/ Piedmont (Bhabar) soils are part of (b) except for Udayapur with about 50% in (d). Relict terraces are
not demarcated.4/ n.s. = less than 500 ha.5/ Total undissected category do not add up to the 656,000 ha in Table 2 because of differences in
planimetric error and the exclusion of Surkhet'in this table.
Source: Based on Planimetric Analysis by(Cartographic Section, IDA) of FAO/UNDP (Katlimandu) maps derivedfrom ERTS images.
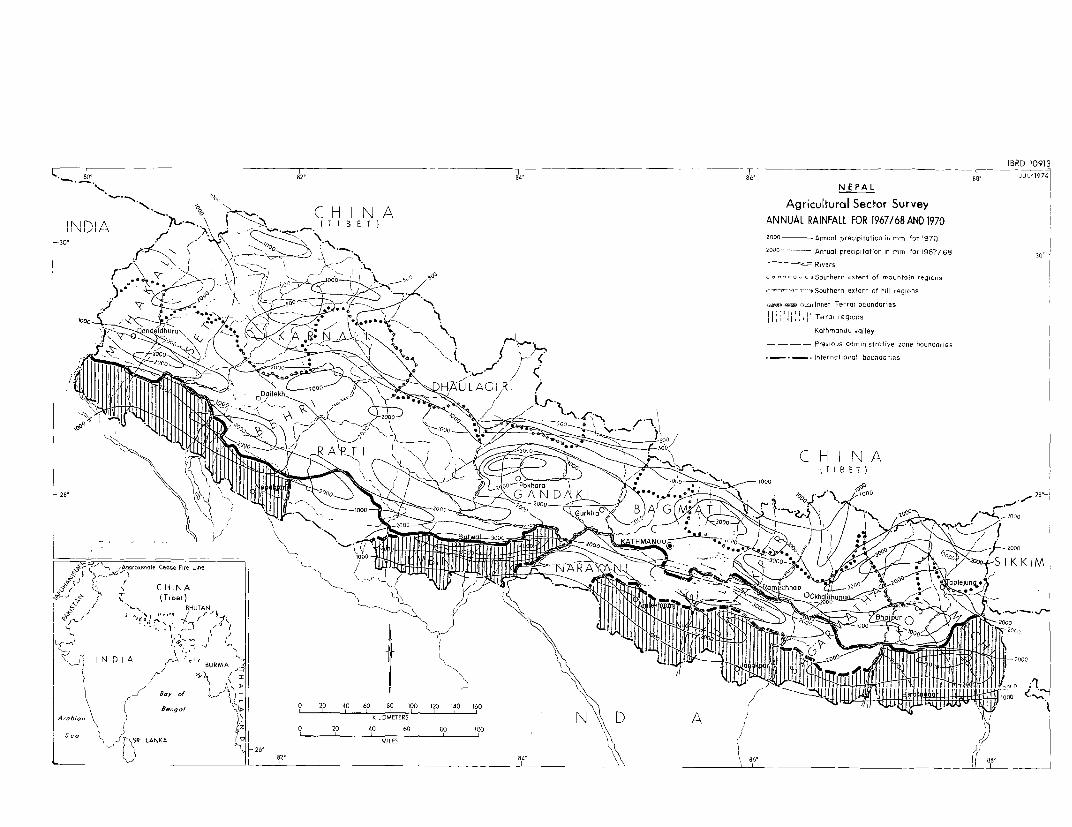
82~~~~~~~~~~~~~~~~~~~~~~~~~~ I~~~~~~~~~~~~~~~~ BRD 10913._ 80' 82'8 8'8 J LY
NE~PAL
_. . -c C H I NAA Agricultural Sector Survey, >lA ~ \ -- > ( r I B E TC ANNUAL RAINFALL FOR 1967/68AND 19700 L-/ I A ., 2000 Arruri prec pitatoin in mm. for 970_
'~~~~~0o " \ 200>----~~~~~~~~~~~~~~~~~~~~~~~~~~~~~- Anr..l precipitofon in root for 967/68 30cr
.2 ~~~~~~~~~~ N.~~~~~~~~~ ~~~~~~ Roero~~~~~~~~~h extent of -- tOintof regions
- - - -) t\s°° sODODO ..... Southern extent of hill regions
-. z Cv° ---- - skooJ / >x c ore lonner Terroi boundaories
000* \ t te @ \ > | |,, i i j, i, 1 | Terroi regions
n ~ ~ ~ ~ 6-Kathmandu valley
Previous odmin strotive zone bouricories
%~~~~~~~~~~~~~~~~~~~~~~~~~~~~~~~~~~~- Internotioool boundaries
H AGI Rrkt0 CI'\s IOO 10
( N benj2o/ j1 ° ~~~~~~~20 40 60 60 100 120 140 160 \(1 Arob;on \ 9 KiO0TR |0 N0 00 A!WSea V ( l Z O 20 40 60 80 100 ! X
Aglkeo _ _ _ _ _ _ _ _ _ _ _ _ _ _ _
-_ _ _ _ _ _ _ _ _ _ _
L8NL
_ _MILES_________________________ ___________84'__'\\___________
00_

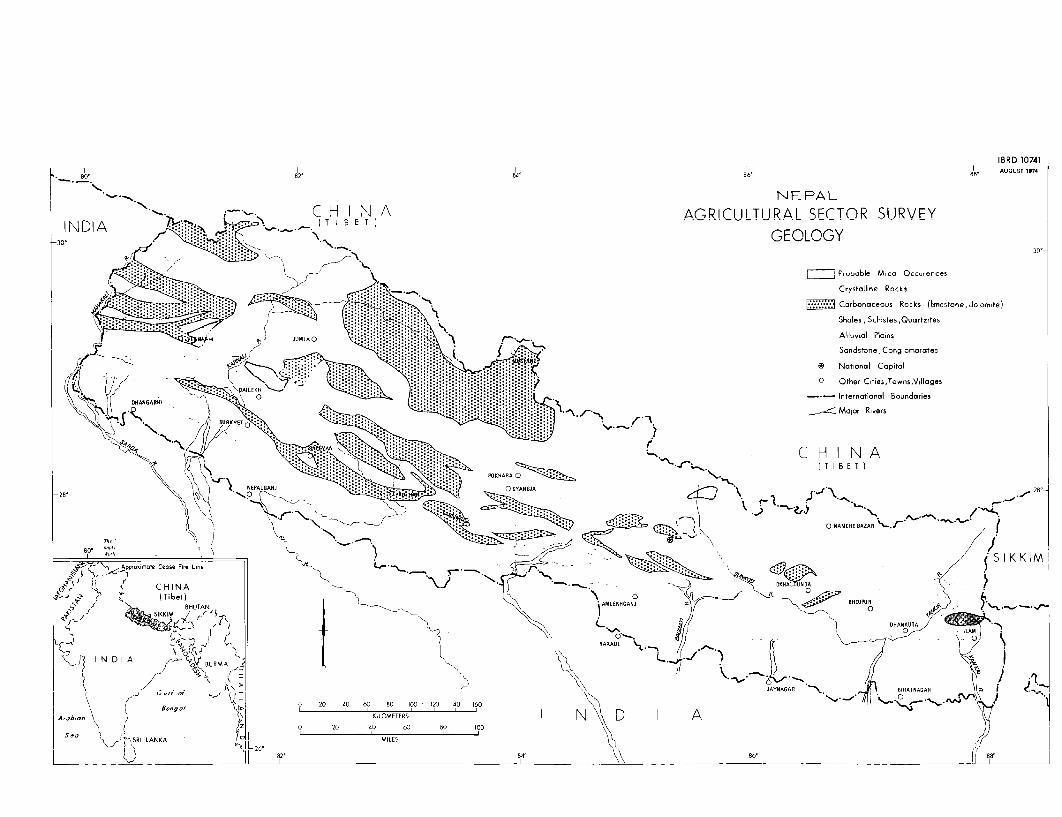
IBRD 10741BIC 80.82 8 85 8 AUGUST1974
I -- CHINA NEPALINDIA .1- .'. TC H I N A AGR!CUL ITUIRAL SECTOR SURVEY
|INDIA r t_ _ (T I B E T)GEL YGEOLOGY
e1 >.30'\ \. 30oO
- 'i A [| zK * .P-oble Mica Occurences
Crystalline RoCks
Carbonaceous Racks (l,mestone, dolom,te)
Shales, Schistes,QuartzitesAlluvial Plains
g $+,zl A JUMLAO 9'- "-'-.,."'t ) g ¢KW Srindstone,Conglomerrates~~~~~~~andsone,Conlomeate
/#s a d I | F | S < m ~~~~~~~~~~~~~~~~~~~~~~~~~~~~~~~~~~~~~~~~Other C,ties,Towns,Vil ages
C H I NAT I B ET)
NEPALGANJ 0 ~~~~~~~~~~~~~~~~~~SYANGJA0
, .0° W < ,, r;; ¢ N S o AMCHE8\ r~--i5-'g/XME
,ISt','- 5IKKpp,oIM~CIM- / Fir L-) IK M
C H I N A DKHALDUNGA
RAXAUL
,Kg J < ) , ] _ < JAYNAGAR NIRATNAGAR
9 g L' L li o; ,, X ~~~~~~~~0 2,0 4dO 60 80) 100 120 1IdO 160 ><t
Aaon\ eg/ KILOM0ETERS t N N\D I AA-b-o 40 I 0
S- f SRI LANKA 26 0 MILES 8, ,
l ) | 82' 8d' \\ 86 il 88'2 B4

ANNEX 2Page (i)
NEPAL
AGRICULTURAL SECTOR SURVEY
FORESTRY DEVELOPMENT
ParagraphNumber
SUMMARY AND CONCLUSIONS ..... .................... i - ix
A. FORESTRY RESOURCES .............................. 1 - 11
B. FORESTRY INDUSTRIES ............................. 12 - 21
1. Logging and Transportation .... ............ 12 - 132. Sawnilling . ............................... 14 - 163. Other Forest Industries ..... .............. 17 - 21
C. MARKET PROSPECTS ................................ 22 - 30
1. The Indian Market ..... .................... 23 - 252. Domestic Market ........................... 263. Prices and Quality ..... ................... 27 - 284. Marketing Constraints in Perspective ...... 29 - 30
D. FOREST ADMINISTRATION ........................... 31 - 52
1. Structure and Number ..... ................. 31 - 382. Forest Education .......................... 39 - 413. Timber Corporation of Nepal .... ........... 42 - 514. Forest Ownership .......................... 52
E. ISSUES AND RECOMMENDATIONS ..... ................. 53 - 75
1. Future Emphasis of Forest Industries ...... 54 - 572. Systems of Log Disposal from Government
Forests . ................................. 58- Timber Disposal for Commercial Use ...... 59 - 64- The Control of Fuelwood .... ............. 65 - 70
3. Management of Forest Estates .... .......... 71 - 724. Competing Uses of Forest Lands .... ........ 73
F. PROJECT POSSIBILITIES ........................... 74 - 75
ANNEX 2(Page ii)
Table 1 - Timber Volumes in the Terai (Excluding Ton Reserve) 1964Table 2 - Estimated Changes in Growing Stock in the Terai, 1964-1973Table 3 - Industrial and Non-Industrial Round Log Requirements for
India, 1970, 1980 and 1990Table 4 - Recorded Production of Wood in India 1955-56 to 1969-70Table 5 - Indian Market - Prices for Logs, 1972/73Table 6 - Indian Market - Prices for Sal Phanta, 1972/73Table 7 - Indian Market - Prices for Sal Gatu, 1972/73Table 8 - Indian Market - Prices for Sal Sleepers, 1972/73Table 9 - Indian Market - Prices for Scantlings and Boards, 1972/73.
Appendix
Past Systems of Log Disposal from Government Forests
ANNEX 2Page i
NEPAL
AGRICULTURAL SECTOR SURVEY
FORESTRY DEVELOPMENT
Summary and Conclusions
L. Present forest area in Nepal is estimated at 5.2 M ha. ExceptEor the Terai, reasonably accurate estimates of productive forests are notavailable. The forests of the Terai and Inner Terai have been the onlyisource of industrial timber. They are semi-tropical hardwood, dominated by,al (Shorea robusta) and to a lesser degree by Asna (Terminalia tormentosa),strongly demanded in both the Nepalese and Indian markets. Other economic(but much less prevalent) species include their (Acacia catechu), used inthe manufacture of Katha (an ingredient of "pan" for chewing), and semal(Salmalia malabancum) for the manufacture of matches.
Li. Hill forests predominate in the Western region where less populationpressure exists. In the subtropical Hill areas and some high forest valleyson the southern side of the Himalayas, the forests are potentially commercial,provided they are made more accessible. However, much of the forests in the:larger hill valleys and less steep areas, have already been lost to settler:lncursions. The remaining steeper Hill forests consist mainly of indigenouseubtropical and temperate pines and oak, used mainly for fuelwood or as:Loppings for animal fodder or green manure. In many areas, denudation fromfuelwood and fodder extraction and intensive grazing on the steep slopes have:led to accelerated erosion. Additionally, improper cultivation on steep:Lands has resulted in the increasing threat of flooding and crop area destruc-tion in the river valleys and their flood plains in the Terai.
iii. The commercially productive forest resources in the Terai have alsobeen denuded. Area losses from the 1.2 M ha of relatively level commercialf-orests existing in 1964 have averaged 3% annually. An analysis of the 1972ELarth Resource Technology Satellite imagery show that only 774,000 ha of:Level commercial forests remain in the Terai. Timber losses have been pro-portionately larger since (i) much of the excised forests have been "creamed" t/(ii) natural regeneration has been slow; and (iii) primarily the loss of com-mercial growing stock from remaining forests, ostensibly for village "house-hold use," pole thefts and grazing, have been increasing. Growing stocklosses of 40% in the past ten years are therefore not unrealistic.
1/ High grade timber has been removed.
ANNEX 2Page ii
iv. An important element in Nepal's strategy for forestry developmentis the delineation of areas which should be retained as protected forests,and those which should be retained for commercial forest production on asustained basis. The Land-use Committee (see Annex 1) will be an importantvehicle for this purpose. In the meantime, a more deliberate policy isrequired to steer forest management from the selection system 1/, based onthe natural regeneration of long maturing (80 years) species, to one whichbetter fits the country's needs. Fast growing species need to be planted forthree important purposes: fuelwood, fodder and construction timber. Fuelwoodshortages in many areas, particularly in the Hills, have resulted in theneed to travel for nearly a day to collect them, and in extreme cases, inthe abandonment of farms. Suitable sites should be selected in and aroundvillages and settlements for the establishing local fuelwood plantations.Larger fuelwood plantations can be established by the Fuelwood Corporationfor the supply of larger consumption centers either as fuelwood or charcoal.In addition, waste areas on farms can be planted with suitable species bothfor fuelwood and fodder. The capacity of the Department of Forestry (DF)to supply growing stock for these purposes should be increased, and theprogram for research and introduction of fast growing species (particularlydual purpose - firewood/fodder trees) should be accelerated.
v. The development of forest industries in Nepal is still rudimentary.Except for the activities of the Timber Corporation of Nepal (TCN), thelogging "industry" uses simple handtools, axes and bullock carts for theiroperations. Although 50-60 sawmills exist, only about half are operating.Other wood-based industries (all minor) include the following factories:two katha and kutch, 2/ six match, numerous furniture, and two small plywoodones opened in early 1973.
vi. Despite its many problems, Nepal should concentrate on developingits sawmilling industry. Not only will it be possible to realize value-added, hitherto accruing mainly to India, it is one of the few primary indus-tries in Nepal where the necessary combination of adequate supplies, markets,technological skills and tood possibilities of a reasonable return on invest-ment exist. However, several actions will be needed to eliminate the basisconstraint facing this industry - the uncertainty of raw material supply.This constraint has resulted primarily from the unsatisfactory and frequentlychanging system of log sales from government forests (see Appendix 1) andthe poor coordination between the DF and the Nepal Settlement Company (NSC).We recommend that the Government reassess Nepal's private sawmilling capacityand formulate guidelines for selecting the efficient mills (or potentiallyefficient over upon rehabilitation) which have a reasonable chance of compet-ing in the Indian market. Concessions should then be granted to these mills.
1/ This essentially involves the removal of mature and overmature trees.
2/ Katha and kutch, extracted from Acacia catechu, is used as a chewing"cake" and an ingredient of pan in Southeast Asia.
ANNEX 2Page iii
The remaining forests earmarked for timber disposal should be sold under amodified auction system. 1/ In addition, all other timber marketing processesshould be reviewed to minimize land settlement delays.
vii. In forest areas earmarked for large scale settlement (like thoseunder the IDA Settlement Project), it is particularly crucial to closely inte-grate forest extraction (and processing) with settlement activities. In theIDA settlement project, a more commercially orientated TCN would undertakeforest extraction and processing, and integration would be expedited througha Settlement Co-ordinating Committee. 2/ Assistance would also be given toTCN in expanding its lumber marketing and exports to India. As TCN's capabi-lity in this field increases, it might act as a marketing agent for privatedomestic sawmillers' exports to India.
viii. Although foreign markets are available, expanding other wood-based industries should be approached cautiously. Expanding the fledglingplywood industry for export is fraught with many difficulties. The onlyspecies sufficiently concentrated to be economical are Sal and Asna. Sal isnot very suitable for plywood because it is hard, heavy, irregular in grain,subject to considerable shrinkage and difficult to peel. Although Asna hasdecorative merits when sliced, its dark color limits its use. Corestockspecies like Semal are of limited availability and required for match manu-facturing. Furthermore bonding resins, purchased through India, are twoto three times world prices and often in short supply.
ix. The pulp and paper industry has few immediate prospects. A viablepulp and paper mill cannot be justified with a domestic paper consumption ofabout 3,000 m tons per year. Government plans for a pulp and paper millbased on rice, waste straw and bamboo, presupposes a lower opportunity costin using rice waste and straw for human and livestock consumption, which ishighly doubtful. As a longer term strategy, however, increasing adaptiveresearch on quick growing species including the local Daphne cannabia and acomprehensive assessment of long term prospects in the India market isrequired.
1/ Which should include among other provisions, a valuation system whichspecifically takes into account sale lot accessibility and fluctuationsin market prices.
2/ 4Comprising representatives from the Ministries of Finance, Industriesand the Planning Commission (who will also sit on the boards of NSCand TCN) and the respective general managers.
ANNEX 2Page 1
NEPAL
AGRICULTURAL SECTOR SURVEY
FORESTRY DEVELOPMENT
A. Forestry Resources
l. Nepal's forests are estimated to cover about 50,000 km (20,000square miles) or nearly one-third of the country, and may be divided intofour zones:
(a) the Terai and Bhabar forests of the plains;
(b) the forests of the Siwalik hills and the lowervalleys of the Mahabharat range;
(c) the forests of the middle zone or the upper heightsof the Mahabharat range; and
(d) the Himalayan forests.
2. The Terai and Bhabar forests are found at altitudes below 300(1,000 ft) on a strip of level alluvial terrain between the Indo-Nepalborder and the main hill region. They occupy about one million hectares.The important timber species in the Terai are Sal (Shorea robusta about57% of total volume, and Asna (Terminalia tomentosa), about 16%. Hardwoodssuitable for furniture manufacture amount to 5%, and include Sissoo (Dalbergiasissoo), Toon (Cedrela toona), Karma (Adina cordifolia) and Chamb (Micheliachampaca). Other species of economic significance are Khair (Acacia catechu)which is used in the manufacture of katha (an ingredient of "pan" for chewing),and Seman (Salmalia malabaricum) used in the manufacture of matches. Coni-ferous woods are represented by Chir pine (Pinus roxburghii), but this isestimated to be only about 0.5% of the Terai's timber volume (Table 1).
3. The forests of the Siwalik hills and the lower valleys of theMahabharat range run east to west across Nepal, between the Terai and themain central mountain mass. They cover about 500,000 ha. The upper altitu-dinal limit of this forest zone is 1,220 m (4,000 ft). The forest cover ischaracterized by Sal and Chir Pine. Valleys, locally known as "duns"occur between the Siwalik hills and the Mahabharat range and contain salforests of great importance and value. Sal also occurs in the lower reachesof the main river valleys which traverse the Mahabharat range.
4. The larger duns in the Inner Terai would be suitable for commercialextraction but, as much of these forests are extremely steep and rugged,conventional timber extraction methods would be inefficient for this zone.
,ANNEX 2Page 2
5. The forest cover of the middle zone or upper Mahabharat to an ele-vation of 1,830 m (6,000 ft) is generally patchy, particularly in the eastand center of Nepal. However, on the southern and higher slopes of theMahabharat range, and in western Nepal, where population density is low,,the stocking volume of trees is relatively high. In the east and center,much of the forest has been cleared, and the steep slopes have been inten-sively terraced for the cultivation of rice, wheat and millet. In addition,cattle, buffalo, sheep and goats graze the remaining scrub and forest areas.The area of forest in this zone has been estimated at about 2.5 M ha.
6. The characteristic forest species are oak (Querous semicarnifolia,Q. incana, Q. flauca), Schima wallichii, Alnus nepalensis, and chir pine.Blue pine (Pinus wallichiana) and hemlock (Tsuga dumosa) , in associationwith the scarlet rhododendron (Rhododendron aroboreum) , occur at higheraltitudes. Much of the oak forest is heavily lopped each year to providegreen manure for the fields and fodder for the animals. Moreover, becauseof intensive grazing on the steep slopes, the area is in a state of accele-rated erosion. As this zone's forests are accessible to the main towns,.they have considerable local commercial importance as a source of timber for
fuelwood. This importance could be increased through scientific forestmanagement and utilization practices, and reforesting denuded areas.
7. The valley forests on the southern side of the Himalayas at an eleva--tion of over 2,440 m (8,000 ft) (covering approximately one million ha) are
composed of the following species: fir (Abies pindrow) hemlock (Tsuga dumosa),spruce (Picea smithiana), cypress (Cupressus torulosa), blue pine (Pinus walli-chiana), juniper (Juniperus recurva) and deodar (Cedrus deodara). On limitedevidence, commercial forests are potentially available provided they are madeaccessible by developing roads in the higher mountain valleys. They are nowan important timber and firewood source for the inhabitants of the mountainvillages.
8. The Terai was surveyed by air in 1964, and a forest inventorycompiled. 1/ Management plans have also been drawn up for the Terai forestdivisions but neither the traditional "selection system", nor the provisionsof the new management plans are presently operational. In the last threeyears, commercial exploitation has been mainly confined to salvaging timberDn land being converted to agriculture 2/ (mainly for resettlement programs).However, unrecorded losses continued on a massive scale, primarily throughillegal squatter settlement (see Annex 1) and the abuse of privileges forremoving timber and fuelwood granted to local villagers.
9. In the absence of a land use policy, with no permanent allocation ofland to commercial forestry and no effective management plans, it is impossible
to provide any long term estimates of future forest production. *Nevertbeless,
l/ HMG/USAID, Forest Statistics of the Terai and Adjoining Regions,Kathmandu, 1967.
/ An important exception is the TCN sawmill which draws logs from areserve set aside for this purpose.
ANNEX 2Page 3
it is both possible and necessary to arrive at an estimate, however approxi-mate, of the present commercial forest resources and their potential output.
10. Estimates of commercial forests in the Terai (see Annex 1, Appendix1) show that only 774,000 ha of relatively level forests are left. This repre-sents an average area loss of about 3% annually in the past decade. Thetimber loss has been proportionately greater than that of forest area because:
(a) Alienated forest land for agriculture also represents thebetter forests;
(b) Loss in the growing stock on remaining forests are increasingdue to pole thefts and grazing damage;
(c) Many forest estates are not growing because losses, as outlinedin (b), restrain natural regeneration and inhibit conversion ofareas under permanent forest estates to higher yielding species.
11. Assuming that losses of growing stock were 40% (about 10% more thanthe loss of commercial forest area since 1964), the remaining growing stocksare estimated to be 1,208 million h ft (Table 2) or 55 m3 .1/ If the samecomposition of species remain, Sal and Asna respectively comprises 57% and16% of total timber volumes.
B. Forest Industries
Logging and transportation
12. Except for the activities of TCN (Timber Corporation of Nepal),a Government corporation, logging and transportation operations in Nepal areprimitive. Simple handtools such as the axe are used for felling and cross-cutting and ox carts are employed in log hauling. By contrast, TCN's opera-tions are heavily mechanized. Trees are felled by chain saws and then hauledby bulldozers up to a distance of 2,000 ft. They are then cross-cut, againby chain saws, and loaded into heavy duty diesel trucks by reel cranes. Thelogs are then transported by trucks for an average distance of 45 miles to thesawmill Hetaura.
13. No logging and transportation operations take place during themonsoon period between June and September. In the Western Terai, at leastfor the month of May and parts of April, the climate is too hot for much workto take place and the effective working period for logging is only sevenmonths. Such breaks in operations disrupt the flow of logs to the sawmills
1/ The IDA Settlement Mission estimates, on the basis of Earth ResourceTechnology Satellite (ERTS) images,that 40 million m3 of merchantabletimber existed in the Terai (excluding the reserves of TCN) in 1972.This implies a loss of 57% of merchantable stock since 1964.
ANNEX 2Page 4
and this is among the reasons for mill owners' failure to utilize the fullcapacity of their conversion plant. During the working seasons, there arealso problems of accessibility to timber areas in order to take advantage ofmodernized log transportation. The building of timber roads in far WesternTerai should be considered in relation to the phasing of land settlements,and their contribution to the establishment of feeder roads linking the East-West Highway to be completed in 1976.
Sawmilling
14. Of the 50-60 sawmills in Nepal only about 25 to 30 are in operation,and all but one (the government mill at Hetaura) are run by the privatesector using semi-portable horizontal band-saw mills manufactured in India.These mills are relatively inexpensive, costing less than Rs 100,000 with arated capacity of 100,000 hoppus (h) ft per year. In practice the capacityis normally between 30,000 and 50,000 h ft annually. The average recoveryrates of these mills are extremely high - about 807. The productivity perunit of labor is low but, in a country with severe unemployment, underemploy-inent and low labor costs, this is not a significant factor. The most impor-tant advantages of these types of mills are:
(a) Nepalese sawmill operators are accustomed to them;
(b) machines and spare parts are generally available inIndia and may be purchased in soft currency;
(c) they are easily operated and maintained;
(d) they are semi-portable;
(e) they can be used in small forest areas;
(f) they are cheap and simple and can survive periods of enforcedidleness better than larger, more sophisticated mills.
15. The basic reason for the idleness of about half the existing sawmillsis the uncertainty both quality and quantity of raw material supply, arisingfrom the system of log disposal and the poor coordination between the DF andthe NSC. This uncertainty has prevented owners from moving their mills towhere timber sales are taking place and has stimulated the export of timberas log exports then as lumber.
16. The advantage which the government mills in Hetaura has over privatemills is their assured source of concession timber within the Hetaura commandarea. Government sawmilling activities at Hetaura basically depend on anAmerican circular sawmill built in 1956, with the assistance of USAID, andeKtended to its present capacity in 1960. Operated by TCN, the installedcapacity (single shift) is about one million h ft of logs per year. The high-est annual conversion rate of logs from round to sawn (in hoppus) is about
ANNEX 2Page 5
70% (55% on the basis of true cu ft). This circular mill is more specializedand difficult to use. More skill is required to operate it, and it is moresuitable for the larger logs (which are getting scarcer). Not only is itexpensive (capital investment is modestly estimated at Rs 6.6 million), italso has a lower lumber output per cu ft of round log. TCN has realizedthis and recently added three Indian-type mills to their operation (one inHetaura and two in the concession areas). The management at the Hetaura andtwo in the concession areas). The management at the Hetaura mills hasimproved in the past few years; they are now successfully running their largeworkshop and have improved coordination between logging and milling operations.
Other Forest Industries
17. Apart from sawmilling, the main forestry industry, Nepal has facto-ries manufacturing katha and kutch (para 18), six match factories, and 14furniture factories, including one which manufactures parquet in Hetaura.A resin and turpentine factory was set up in 1,970/71 but has since been closeddue to the company's reluctance to employ local labor and the mistreatmentof trees. Two small plywood factories were opened in early 1973 (see para 54).
18. The katha and kutch mills are relatively well organized and managed,even though the process of extracting the ingredients from the Acacia catechuwood and preparing the product seems to be more complicated than sawmilling.Katha and kutch are used as a chewing "cake", and ingredient of pan, in South-east Asia. Most of Nepal's production is consumed locally and in India, butsmall amounts are exported to other parts of Asia. The owners of the twomills complain that despite an annual quota of 6,000 trees, amounting tobetween 100,000 and 200,000 h cu ft per year, they could use a higher alloca-tion. The DF, however, maintains that about 9.4 million cu ft of allocationfor these mills are still unused. The DF prefers to sell the acacia trees byauction to buyers from India rather than to increase the allocation to localmills, since the prices obtained across the border (Rs 25.80 per cu ft) arehigher than the royalty rate obtained for these trees (Rs 4.5 per log).
19. Only three of the six match factories are operational mainly be-cause the species used (mainly Semal, and some Gutel and Bhurkul) cannotbe obtained regularly. Although the operational capacity of the matchfactories are small (between 30,000 to 50,000 ha ft of wood per year), theyare not being used to capacity.
20. The main species used by the furniture manufacturers are Adinacortifolia, Cederela toona, Dalbergia sisso, Gmelina arboria, Michelachampaca and Mitragyna parvifolia. Most furniture shops are small and relymainly on manual labor. Much of the furniture is made to order and all ofit is produced for local customers. The prospects of expanding productionfor local and export markets are not very bright, as local furniture demandis not high, and India has a well-established industry of its own.
ANNEX 2Page 6
21. The only parquet flooring factory, established in 1q70 at Hetaura,has an output capacity of 3,000 sq ft per day. Although various wood speciesare used, the main one is Asna (Terminalia tomentosa) because of its combina-tion of reasonable suitability and availability. This factorv has neverbeen in full production, and has relied heavily upon furniture manufacturingas a profit-making sideline. After overcoming initial difficulties in pro-curing raw materials, successful sales of flooring in Kathmandu have virtuallysaturated the market. Export sales have not been actively solicited.
C. Market Prospects
22. Analysis of market prospects for Nepal's timber and timber productsis hampered by scarcity of data (particularly on production and trade) anda significant amount of unrecorded timber traffic between Nepal and India(essentially the only foreign market for Nepal. 1/
The Indian Market
23. Historically, the value of official net exports to India (based oncumulative 1961/62 - 1966/67 figures) have been approximately equal (NRs 2.1M each) for round logs and fuelwood. Nepal is a net importer of plywood.Its timber and timber products marketing channel to India has traditionallybeen dominated by Indian traders from the procurement level right to the finalwholesale level in the larger cities of India. Provisions of the 1971 Tradeand Transit Treaty (to be renegotiated every five years) permit duty andquota exemptions for Nepal's forest products into India which make assess-ment of product flows even more difficult.
24. An indication of prospects in India may be gleaned from the projectedrequirements of raw materials in the Report of the Working Group on Forests,Government of India, October, 1972 (Table 3). The most important industrialconsumer of round logs is She Indian sawn wool industry. In 1970, estimatedrequirements were 9.57 M m , but only 6.3 M m were accounted for by recordedroundwood production. A third of these requirements were therefore non-recorded, obtained from village groves, orchards, and other sources 2/ forwhich future production remains uncertain. Even less information is availableconcerning the sources of round logs for other industrial wood use like panelproducts and pulp and paper. The Indian border states of Bihar and UttarPradesh are expected to require 4 M and 1.6 M transmission poles (respectively)
1/ Bangladesh is deficit in timber and timber products (particularly rail-road sleepers). The present lack of direct rail or road links (whichnecessitates joint trade and transit agreements with India) and Bangla-desh's present shortage of funds for import, suggest that it will remainan insignificant market for Nepal.
2/ Illegal imports of Nepal's timber probably also fall into this category.
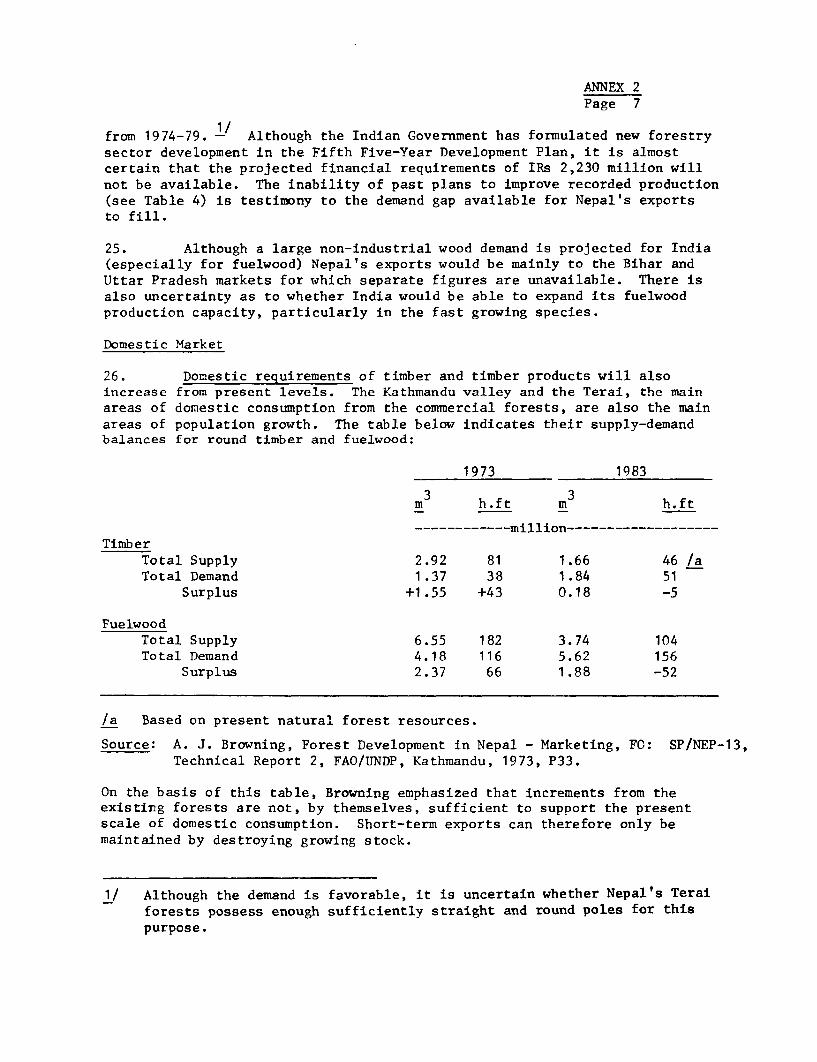
ANNEX 2Page 7
from 1974-79. - Although the Indian Government has formulated new forestrysector development in the Fifth Five-Year Development Plan, it is almostcertain that the projected financial requirements of IRs 2,230 million willnot be available. The inability of past plans to improve recorded production(see Table 4) is testimony to the demand gap available for Nepal's exportsto fill.
25. Although a large non-industrial wood demand is projected for India(especially for fuelwood) Nepal's exports would be mainly to the Bihar andUttar Pradesh markets for which separate figures are unavailable. There isalso uncertainty as to whether India would be able to expand its fuelwoodproduction capacity, particularly in the fast growing species.
Domestic Market
26. Domestic requirements of timber and timber products will alsoincrease from present levels. The Kathmandu valley and the Terai, the mainareas of domestic consumption from the commercial forests, are also the mainareas of population growth. The table below indicates their supply-demandbalances for round timber and fuelw7ood:
1973 1983
m3 h.ft m3 h.ft
------------ million-------------------Timber
Total Supply 2.92 81 1.66 46 /aTotal Demand 1.37 38 1.84 51
Surplus +1.55 +43 0.18 -5
FuelwoodTotal Supply 6.55 182 3.74 104Total Demand 4.18 116 5.62 156
Surplus 2.37 66 1.88 -52
/a Based on present natural forest resources.
Source: A. J. Browning, Forest Development in Nepal - Marketing, FO: SP/NEP-13,Technical Report 2, FAO/UNDP, Kathmandu, 1973, P33.
On the basis of this table, Browning emphasized that increments from theexisting forests are not, by themselves, sufficient to support the presentscale of domestic consumption. Short-term exports can therefore only bemaintained by destroying growing stock.
1/ Although the demand is favorable, it is uncertain whether Nepal's Teraiforests possess enough sufficiently straight and round poles for thispurpose.
ANNEX 2Page 8
Prices and Quality
27. Price trends for timber and timber products will determine thefuture of Nepal's forest industries and its export product mix. Indiantimber are expected to follow world trends. For example, by 1980, worldlog prices are expected to increase by about 45% from present levels. 1/Present prices are given in Table 5.
28. In terms of relative prices of sawn timber, the three most demandedforms of lumber in the Indian market (in order of importance) are (a) phanta,(b) gatu and (c) sleepers. Phanta (specified as 4 in thick, 6-12 in wideand up to 24 ft long) is usually resawn by purchasers into smaller sizes. Itis about the same quality standard as sleepers (i.e. no boxed heart, sapwood,cracks or worms) except that phanta dimensions are more flexible. Any logwhich could produce sleepers could also produce phanta. Present prices(table 6) show that length commands a premium (16 ft earn 20% more per ftthan 8 ft). Gatu lumber (squared beam up to 24 ft long with the centerheart measuring 6 in square or larger) is less valuable than phanta (Table7). Sleepers are specified in more restrictive dimensions (Table 8) andunit prices are less than for gatu and phanta. With these price relation-ships, sleeper quality logs would therefore normally be sawn into phanta orgatu. However, sleeper production has the advantage of potentially obtain-ing long term contracts if these can be negotiated with the Indian RailwayBoard by a government marketing organization like the TCN. Since only portionsof existing forest stands 2/ can be processed 3/ into phanta, gatu or sleepers,prices for scantlings and boards should also be taken into account (table 9).
Marketing Constraints in Perspective
29. The main constraint in marketing Nepal's forest products will bethe ability of exports from its wood based industries (essentially sawmilling)to compete with Indian counterparts in the Indian market.
30. Under existing conditions, this will be difficult. First, logdisposal problems provide viable private sector sawmilling operations withinsufficient incentives (see para 15). While price-cost relationships appearto favor log exports, this is because exported logs have resulted primarilyfrom "creaming" forests. It is illogical for log sale and transportation tobe more favorable than that of lumber, from which waste timber will have been
1/ IBRD, Economic Analysis and Projection Department, January 1974.
2/ For example, in the proposed IBRD Settlement Project in Nepal, from aproject area of 18,600 ha of typical Western Terai forests, it is anti-cipated that the quality of timber stands will permit the followingmixture: gatu - 60%, phanta - 15%; scantlings and boards - 25%; trans-mission poles - 33,100 units.
3/ Because of small logs and remnant portions of larger logs which cannotbe sawn Into phanta, gatu and sleepers.
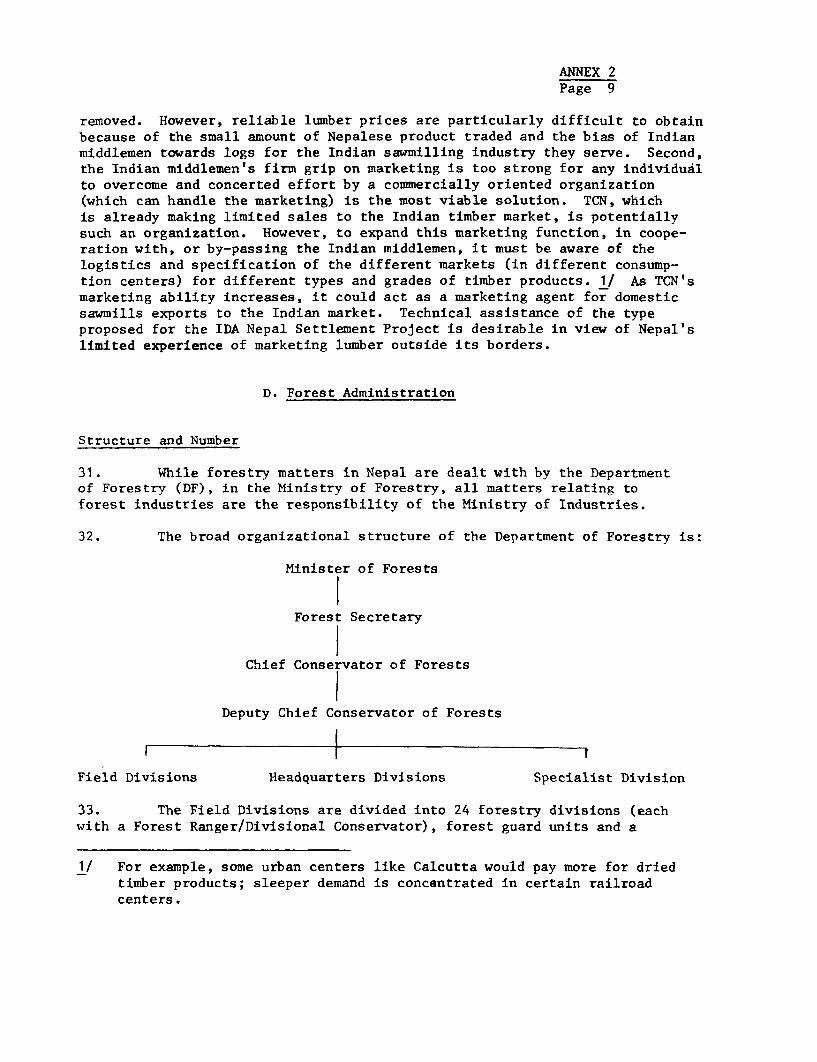
ANNEX 2Page 9
removed. However, reliable lumber prices are particularly difficult to obtainbecause of the small amount of Nepalese product traded and the bias of Indianmiddlemen towards logs for the Indian sawmilling industry they serve. Second,the Indian middlemen's firm grip on marketing is too strong for any individuAlto overcome and concerted effort by a commercially oriented organization(which can handle the marketing) is the most viable solution. TCN, whichis already making limited sales to the Indian timber market, is potentiallysuch an organization. However, to expand this marketing function, in coope-ration with, or by-passing the Indian middlemen, it must be aware of thelogistics and specification of the different markets (in different consump-tion centers) for different types and grades of timber products. 1/ As TCN'smarketing ability increases, it could act as a marketing agent for domesticsawmills exports to the Indian market. Technical assistance of the typeproposed for the IDA Nepal Settlement Project is desirable in view of Nepal'slimited experience of marketing lumber outside its borders.
D. Forest Administration
Structure and Number
31. While forestry matters in Nepal are dealt with by the Departmentof Forestry (DF), in the Ministry of Forestry, all matters relating toforest industries are the responsibility of the Ministry of Industries.
32. The broad organizational structure of the Department of Forestry is:
Minister of Forests
Forest Secretary
Chief Conservator of Forests
Deputy Chief Conservator of Forests
I I I
Field Divisions Headquarters Divisions Specialist Division
33. The Field Divisions are divided into 24 forestry divisions (eachwith a Forest Ranger/Divisional Conservator), forest guard units and a
1/ For example, some urban centers like Calcutta would pay more for driedtimber products; sleeper demand is concentrated in certain railroadcenters.
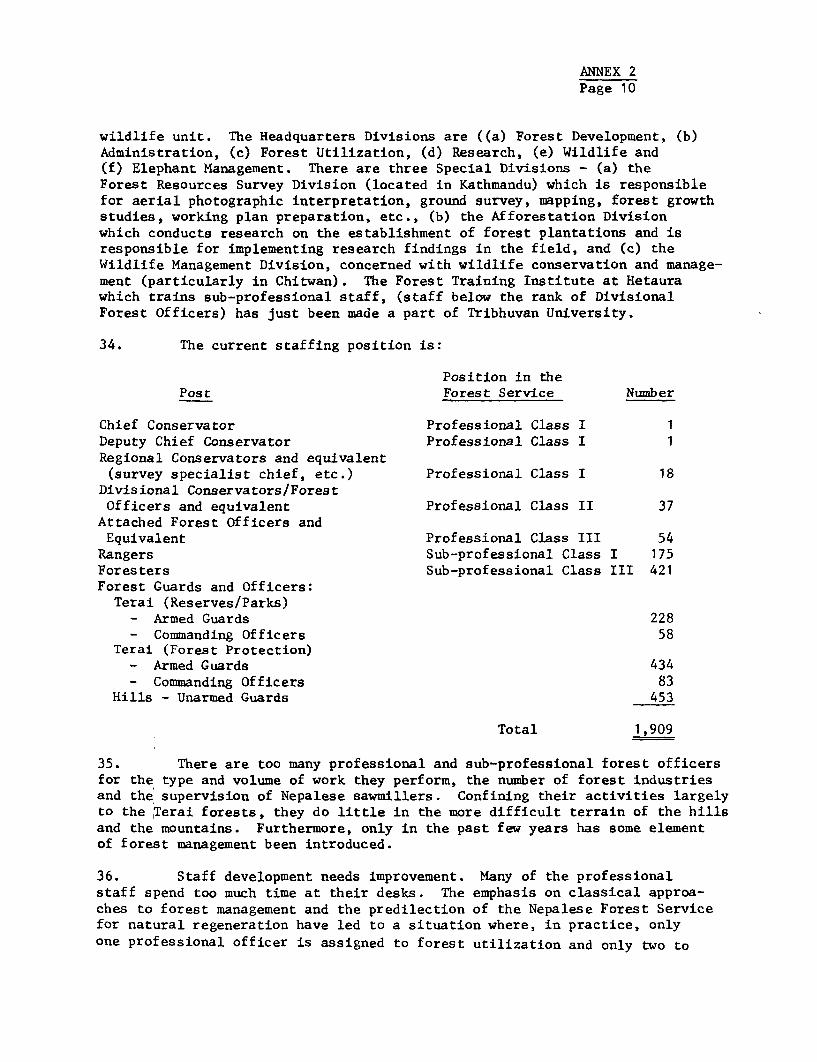
ANNEX 2Page 10
wildlife unit. The Headquarters Divisions are ((a) Forest Development, (b)Administration, (c) Forest Utilization, (d) Research, (e) Wildlife and(f) Elephant Management. There are three Special Divisions - (a) theForest Resources Survey Division (located in Kathmandu) which is responsiblefor aerial photographic interpretation, ground survey, mapping, forest growthstudies, working plan preparation, etc., (b) the Afforestation Divisionwhich conducts research on the establishment of forest plantations and isresponsible for implementing research findings in the field, and (c) theWildlife Management Division, concerned with wildlife conservation and manage-ment (particularly in Chitwan). The Forest Training Institute at Hetaurawhich trains sub-professional staff, (staff below the rank of DivisionalForest Officers) has just been made a part of Tribhuvan University.
34. The current staffing position is:
Position in thePost Forest Service Number
Chief Conservator Professional Class I 1Deputy Chief Conservator Professional Class I 1Regional Conservators and equivalent
(survey specialist chief, etc.) Professional Class I 18Divisional Conservators/ForestOfficers and equivalent Professional Class II 37
Attached Forest Officers andEquivalent Professional Class III 54
Rangers Sub-professional Class I 175Foresters Sub-professional Class III 421Forest Guards and Officers:
Terai (Reserves/Parks)- Armed Guards 228- Commanding Officers 58
Terai (Forest Protection)- Armed Guards 434- Commanding Officers 83
Hills - Unarmed Guards 453
Total 1,909
35. There are too many professional and sub-professional forest officersfor the type and volume of work they perform, the number of forest industriesand the supervision of Nepalese sawmillers. Confining their activities largelyto the Terai forests, they do little in the more difficult terrain of the hillsand the mountains. Furthermore, only in the past few years has some elementof forest management been introduced.
36. Staff development needs improvement. Many of the professionalstaff spend too much time at their desks. The emphasis on classical approa-ches to forest management and the predilection of the Nepalese Forest Servicefor natural regeneration have led to a situation where, in practice, onlyone professional officer is assigned to forest utilization and only two to
ANNEX 2Page 11
afforestation. Yet Nepal needs to concentrate on these areas if thepresent forest resource is to contribute fully to the national economy andbe able to supply Nepal's future demands.
37. Development of the forestry and forest industries sectors issomewhat restricted by their being under separate ministries. All applica-tions for the establishment of forest industries must be sent to the Ministryof Industries, which can grant or refuse applications; in theory, it acts onthe advice of the Ministry of Forests. However, forestry and forest indus-tries are but two facets of one process, and this separation of responsibilitieshas contributed to the imbalanced distribution of sawmills in Nepal. Inaddition, the separation of powers often leads to unnecessary delays inprocessing applications.
38. HMG of Nepal urgently needs a specialist to advise on deployingforestry staff, and who could also advise on integrating those aspects offorest industries dealt with by the Ministry of Industries with the activi-ties of the Ministry of Forests.
Forest Education
39. Ninety four of the professional staff are graduates, mainly withnatural science degrees. Their formal professional forestry educationwas usually obtained at the Dehra Dun Forestry Institute in India, althoughseveral received their first degrees in other countries, such as Burma andGermany. Many received post-graduate education in North America, India andEurope.
40. Most rangers and foresters are trained at the Nepal Forest Instituteat Hetaura, which also offers refresher courses to sub-professional forestofficers. Forest guards are given on-the-job training.
41. By any standard, the training given Nepalese forest officers isgood. However, because most professional forest officers are trained atDehra Dun, a most conservative and conservationist institution, they tend notto be very development-oriented. In particular, an absence of training inforest economics becomes evident when examining forest management plans andprovisions for forestry in the fourth Five-Year Plan. It would thereforeseem appropriate for selected Nepalese forest officers to receive post-graduate training in forest economics in suitable universities.
Timber Corporation of Nepal (TCN)
42. TCN is a public limited company, formed in 1960 under the NepalCompanies Act, with authorized share capital of NR 10 M (US$0.9 M) in 100,000shares of NR 100 each. Wholly owned by His Majesty's Government of Nepal(HMG), its shares are held nominally by various HMG Departments and Officials,principally the Ministry of Industry and Commerce and the Ministry of Forests,with a small holding (9%) by HMG Nepal Industrial Development Corporation(NIDC). The Directors, a minimum of five, are appointed by the shareholdersin general meeting. The Chairman of the Board (elected by the Directors) is
ANNEX 2Page 12
the Secretary, Ministry of Forests. The other four members are now: aMinistry of Finance representative; Director, Department of Industry; ChiefConservator of Forests; General Manager, NIDC. A non-Government director isto be added, but no appointment has yet been made.
43. TCN has a lumber extraction concession for about 100,000 ha of theHetaura and Chitwan Forest Reserves (see map) of which about 58,000 ha arecommercially exploitable, and owns a sawmill complex at Hetaura. It doesnot operate in other parts of the country, but has been asked to help NSCwith timber removal from settlement sites.
44. TCN operations originated from a sawmill established under a USAIDprogram to provide lumber for rebuilding houses destroyed by the catastrophic1954 flood. TCN mills were managed by a U.S. sponsored sawmilling managementteam from 1960 to 1968 when it transferred full management to the Nepalese.After initial teething problems (TCN incurred losses for the first timeduring the takeover year), the situation has improved considerably since1970/71 when a new general manager was appointed, and in 1972/73 recordedprofits reached Rs 1.1 M.
45. TCN faces four major problems: (a) the limited size of theconcession; (b) the effect of four to five months monsoon on forestryoperations; (c) the capacity of the Nepalese haulage industry to carrylumber; and (d) Public Service Commission intervention in appointments.
46. While no estimate of the amount of timber remaining in the TCNconcession is available, a large part (285 km2) of the most easily accessiblesouthern area was recently declared the Chitwan Wildlife National Park.TCN's management is concerned that working in the northern area will be-come more costly and that future production expansion to meet growing de-mand and exports will be inhibited.
47. Rains quickly impede log haulage and TCN has not yet been able tostockpile sufficient logs to keep the main sawmill going throughout the Juneto October rainy season.
48. HMG's requirement that the local market (mainly Kathmandu) begiven priority, has meant hauling lumber some 100 miles from Hetaura toKathmandu over a difficult road, instead of the shorter stretch across theIndian border. TCN has been unable to find enough private haulage capacity,but now has some relief through operation of its own trucks.
49. TCN's obligation to ask the Public Service Commission to fillvacancies at all levels has caused it great inconvenience through delay,and sometimes inappropriateness, of appointments. TCN has had to hire manyemployees on temporary contract, sometimes for a year or more, with noassurance that their appointments would be confirmed. TCN should be freeto hire and fire employees at its discretion, subject only to control byits Board of Directors.
ANNEX 2Page 13
50. Despite many difficulties, TCN is operating successfully withoutoutside help, and to the considerable benefit of HMG. Its staff has longexperience in logging and sawmilling and has been designated to take on theforestry operations of the IDA Nepal Settlement Project. TCN could, however,benefit from some temporary guidance on operating winch lorries for timberextraction, which are new to Nepal, and on installing Indian-type sawmills,which it has not previously undertaken without help. One of the importantcontribution of the IDA Settlement Project will be to undertake theseoperations through TCN. In addition, large export sales would be developedin the Indian market, with which TCN is not very familiar, and TCN would alsobe assisted by the project in developing that market.
51. It is also important that TCN be free to make direct contact withits customers, as an independent commercial enterprise, without referenceto HMG (subject only to normal policy direction by its board), and that itbe free to sell logs or lumber, at its discretion, in Nepal or elsewhere asmarket conditions dictate.
Forest Ownership
52. HMG owns all forest land in Nepal. However, certain individualsor groups may obtain fuelwood and timber for home use from the forest estate,either free or at nominal cost. Under this 'concessionary sales' system,the appropriate forest authority provides a villager with a permit to felland remove a certain quota of firewood and timber for specific purposes. 1/However, as no record of actual removals is kept, there is no means of check-ing whether the villager removes more than his entitlement. Moreover, thereis no system of checks to ensure that the forest produce removed is utilizedpersonally, as is intended, and not sold to third parties. Because felledtrees are not checked, the high quality and large timbers which command highprices in the commercial market are felled for "personal" uses which do notwarrant the large size felled.
E. ISSUES AND RECOMMENDATIONS
53. Issues in Forestry subsector revolve around (a) future emphasisfor forest industries; (b) appropriate systems for disposal of governmentforests (including the control of fuelwood); (c) management of forestestates; and (d) competing use of forest lands.
1/ Local communities have the privilege of removing wood for the followingpurposes: (a) timber and poles for building and repairing houses (125h ft every three years and not more than 50 h ft of Sal); (b) fuelwoodconsumption (250-500 h ft/family year); (c) ox-cart ploughs and otherfarm implements (minute quantities).
ANNEX 2Page 14
Future Emphasis of Forest Industries
54. Forest industries development in Nepal is still rudimentary, withsawmilling constituting the only activity of any real significance. TheFourth Five-Year Plan has targeted the creation of a 15,000 tons capacitypulp and paper mill and a plywood mill with a capacity of 19.2 million sq ft.None of these have materialized except for two small plywood factories 1/not originally included in the Plan. Establishing a plywood industrv inNepal, particularly for the export market, is fraught with many difficulties.Only Sal and Asna are concentrated in any significant amounts and being hard,heavy, irregular in grain, subject to considerable shrinkage and hard to peel,they are not particularly suitable for plywood. Although Asna has somedecorative merits when sliced, its dark color limits its application. Theavailability of species suitable for corestock production, like Semal, islimited. Comprising the main species for match manufacturing, it is alreadyin short supply for that industry. The cost of bonding resins purchasedthrough India are two to three times world prices and often in short supply.The only future for the plywood industry in Nepal appears to be for thedomestic market, which is limited 2/ and this industry would be economicallyviable only if sufficient wood can be obtained in concentrated locations.
55. The pulp and paper industry has few prospects in the immediatefuture. The proposed mill under the Fourth Plan (based on rice, waste strawand bamboo) presupposes a lower opportunity cost in using rice and waste strawfor human and livestock consumption. There is presently no pulp and papermill but one cannot be justified on the basis of a domestic paper consump-tion of only about 3,000 m tons annually, of which about 400 tons is hand-made from the bark of Daphne cannabia with small admixtures of straw, grassand waste paper. Although an NIDC feasibility study for a pulp and paperfactory indicates that India's present demand for paper exceeds its supply,longer term prospects in the Indian market (including their plans for capacityexpansion) should be assessed before developing a pulp and paper industry inNepal.
56. In the immediate future, Nepal should concentrate on developingits sawmilling industry, for this is one of the few primary industries for
1/ The Nepal Plywood and Bobbin Company's factory in Biratnagar (12,500sq ft of 3/16 inch plywood per day) opened only in February, 1973, al-though the machinery was imported in 1967. The delay was primarily dueto arrangements for wood supply with HMG. The United Mission's 4.4 Msq ft annual capacity plywood mill in Butwal started limited productiononly in early 1973 despite virtual completion at the end of 1971. Thedelay in this case was due to the formalities and arrangements requiredto finalize HMG participation.
2/ Only 70,000 sq ft of plywood was imported in 1967/68 for example. Asfor the Indian market, the country has a well-established plywood industrywhich presently operates below capacity. This is primarily due to theshortage of raw materials which may be partially overcome by increasedimports from the Andaman Islands.
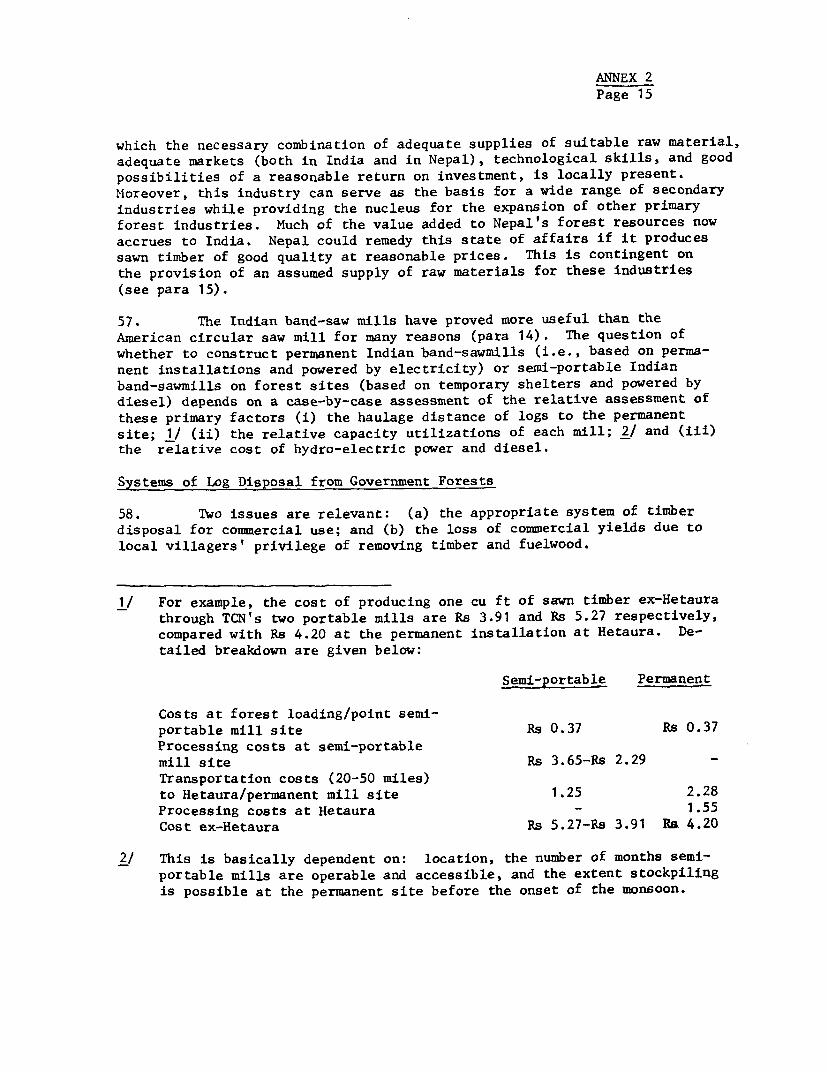
ANNEX 2Page 15
which the necessary combination of adequate supplies of suitable raw material,adequate markets (both in India and in Nepal), technological skills, and goodpossibilities of a reasonable return on investment, is locally present.Moreover, this industry can serve as the basis for a wide range of secondaryindustries while providing the nucleus for the expansion of other primaryforest industries. Much of the value added to Nepal's forest resources nowaccrues to India. Nepal could remedy this state of affairs if it producessawn timber of good quality at reasonable prices. This is contingent onthe provision of an assumed supply of raw materials for these industries(see para 15).
57. The Indian band-saw mills have proved more useful than theAmerican circular saw mill for many reasons (para 14). The question ofwhether to construct permanent Indian band-sawmills (i.e., based on perma-nent installations and powered by electricity) or semi-portable Indianband-sawmills on forest sites (based on temporary shelters and powered bydiesel) depends on a case-by-case assessment of the relative assessment ofthese primary factors (i) the haulage distance of logs to the permanentsite; 1/ (ii) the relative capacity utilizations of each mill; 2/ and (iii)the relative cost of hydro-electric power and diesel.
Systems of Log Disposal from Government Forests
58. Tlwo issues are relevant: (a) the appropriate system of timberdisposal for commercial use; and (b) the loss of commercial yields due tolocal villagers' privilege of removing timber and fuelwood.
1/ For example, the cost of producing one cu ft of sawn timber ex-Hetaurathrough TCN's two portable mills are Rs 3.91 and Rs 5.27 respectively,compared with Rs 4.20 at the permanent installation at Hetaura. De-tailed breakdown are given below:
Semi-portable Permanent
Costs at forest loading/point semi-portable mill site Rs 0.37 Rs 0.37Processing costs at semi-portablemill site Rs 3.65-Rs 2.29 -Transportation costs (20-50 miles)to Hetaura/permanent mill site 1.25 2.28Processing costs at Hetaura - 1.55Cost ex-Hetaura Rs 5.27-Rs 3.91 Ra 4.20
2/ This is basically dependent on: location, the number of months semi-portable mills are operable and accessible, and the extent stockpilingis possible at the permanent site before the onset of the monsoon.
ANNEX 2Page 16
59. Timber Disposal for Commercial Use. The Nepalese Forest Serviceseems, over less than twenty years, to have tried most of the known systemsof forest allocation and disposal of timber (see Appendix). Instead ofattempting to remedy the defects of a particular system, an entirely newmethod of sale was embarked upon and in turn abandoned when difficultiesarose or pressure groups exerted their influence. Very frequently the trialperiods were too short to allow an adequate assessment of the practice beingtested (see Appendix).
60. The present system is by auction, reintroduced in 1972/73. In thelast five years, DF auctions only forest areas released for settlement; therest has remained commercially unproductive. The auction procedures consist,initially, of DF valuation of potential sale lots based on species androyalty rates. A minimum of 21 days notice of the auction date is givenin the news media; sales are held in Kathmandu. Although thes noticesspecify the number of trees (by species), the volumes or values are keptsecret. Potential buyers have to travel to the lot locations to evaluatethe lots for themselves and return to Kathmandu for the auction. Adisquieting feature is that no officially specified criteria are used fordeciding on the successful bid. For example, many of the highest biddershave been unsuccessful. Numerous lots remain unsold (despite re-auctioninglater in the season). Many factors have contributed to this situation.Overevaluation by DF and secrecy of bids, for example, has resulted in bidsfalling short of the government's secret figure. The present system oftimber valuation makes no allowance for accessibility (transport costs).
61. Valuations become unrealistic as poor planning and the consequentlengthy time-lags (between the marking of sale lots and the buyers' actualassessment) result in timber losses through theft and destruction. Revalua-tions and re-auctioning often result in the timber being available too latefor exploitation in the season. Bidders are also wary of the poor coordina-tion between DF and NSC which has resulted in settlers moving into soldtimber lots to stake their claims before timber felling had even commenced.Well intentioned stipulations (like stiffer payment terms for timber salesto non-Nepalese) to protect domestic sawmillers and contractors have notsucceeded to any noticeable degree in encouraging Nepalis to deal in timber 1/,but only resulted in discouraging reputable Indian contractors from partici-pating in timber sales.
62. The mission recommends that HMG reassess Nepal's private sawmillingcapacity and formulate some guidelines for selecting efficient mills (orpotentially efficient mills upon rehabilitation) which have a reasonablechance of competing in the Indian market. Concessions should then be
1/ There are problems in assessing who are Nepalese contractors since manyNepalese citizens are of Indian origin and some foreign contractorsemploy Nepali "front men" to buy timber for them.
ANNEX 2Page 17
allocated to these mills. 1/ If necessary, the possibility of abolishingexport duties on sawn timber and other wood manufacture should be considered.The rest of the timber available should be sold under a modified auctionsystem which has the following provisions:
(a) A valuation system which (i) simplifies marking and volumeestimation, 2/ (ii) takes into account accessibility of saleslots (considering for example nearest railroad heads acrossthe Indian border) and fluctiations in market prices;
(b) Public knowledge of government's estimates of volume andvalue of sales lots;
(c) Decentralized public auction sales under the charge ofterritorial conservators; and
(d) Abolition of sales rules imposing unfavorable contract termsto foreigners.
63. In addition, all other processes involved in timber marketingshould be reviewed with the aim of selling timber the first time and mini-mizing delays for the land settlement program.
64. With regard to the 'specialist' industries (those relying on parti-cular species), a careful assessment should be made of the existing rawmaterial resource, and of the growth rates of the required species. Thesedata should then be compared with the capacity of the existing mills. Ifit is possible to increase the allowable cut to meet the capacity of the mills,this should be done. If this is not possible there should be a deliberate
1/ As has been shown (see appendix) this system was introduced at a timewhen the Forest Service was small and its experience minimal. At thattime it might have been more appropriate to sell trees through a systemof short-term felling and extraction permits. Now, however, not onlyis there need for the forest industrialist to be assured of an adequateand continuous supply of timber for at least the amortization period ofhis conversion plant, but the Nepalese Forest Service is in a positionto control the operation of such an agreement. A system of forestleases should therefore be evolved which would ensure that conversionplants are 'tied' to forests of adequate size and volume. Technicalassistance may be required in the drafting of these agreements, forcomplex considerations such as royalty rates, duration of leases, areaof forest to be leased, capacity of plant, penalties for breach, etc.,have to be taken into account. It must be emphasized, however, thatunless Nepal's timber disposal policies and practices are drasticallyaltered, there will be little hope for forest industries developmentin the country.
2/ As recommended by A. J. Browning, op. cit., p. 60.
ANNEX 2Page 18
policy of restricting the number of match factories and katha mills in thecountry. However, data now available suggest that this latter step shouldnot be necesssary. There appears to be a sufficient volume of Acacia catechuand Semal, for example, to warrant an increase in cut. It is the longrotations and the uncritical acceptance of the principle of sustained yieldwhich impede the development of these forest industries.
65. The control of fuelwood. Fuelwood consumption is very high inNepal because other types of fuel are either too costly for the averageNepalese, or unavailable in certain localities. The result is considerablepressure on forests throughout the country.
66. Unfortunately the DF seems to have exerted little control overthe trees and species to be felled (and of the location of their felling).Usually, the consequence has been thinned forest lands in many parts of thecountry but the Hills have been laid bare by fuelwood cutters, and manytrees and species suitable for more remunerative uses have been utilizedfor fuel. HMG's estimate of a three million ft (worth Rs 10 M) annualremoval from the Terai is modest compared with the FAO/UNDP Forestry Deve-lopment Project's figure of 37 M h ft. In the Kailali Division, forexample, FAO/UNDP found that villagers had been issued "legitimate" permitsto remove 855,000 h ft, representing 1/3 of the Division's total yields and71% of Sal yields, leaving only 342,000 h ft for commercial sale.
67. In an attempt to reduce illegal tree felling for fuelwood supplyin the Terai and the Kathmandu valley, HMG established a Fuelwood Corpora-tion. The Corporation is to collect, distribute and sell dead trees, thebranches and tops of trees felled for other purposes, sawmill waste, etc.,to consumers and no live trees may be felled solely for the production offuelwood in these areas. With the limited capacity of the Fuelwood Corpora-tion, these rules, of course, have not been enforced throughout the affectedareas. The costs of this rather dispersed operation are also somewhat high,since fuelwood prices are rising, and consequently the incentives forillegal felling have increased. The problem of fuelwood felling in theHills with its contribution to increasing erosion has been convenientlyignored.
68. These defects could be improved by instituting a system of checksto prevent extensive abuse of the villagers' entitlement. This may be doneby a) including in the felling and removal document a column (or columns) inwhich the Forest Guard could record any removals made by the villager andmaking it an offence for a villager to fell and remove timber without aForest Guard's permission; and b) by ensuring that those trees which thevillager is permitted to fell would not command a ready sale to thirdparties (in other words, there should be size and quality control). Admitted-ly, control will be difficult and ultimately the success of any such arrange-ments would depend upon the integrity and authority of DF staff. As thereis no dearth of Forest Guards, from the point of view of numbers, control
ANNEX 2Pagoe 19
could be reasonably effective 1/. Unfortunately, it is not. A ccuibieicnof incentives to Forest Guards, more regular field checks by senior off4cers,
and the imposition of penalties on venal Forest Guards may well result itremoving most of the abuses to which the system of concessiojiv, s:Les L-subject.
69. The above proposal, even if implemented, only corrects the sywptonsbut not the basic cause of the problem, i.e. shortages of fuelwood in localareas. Suitable sites should be selected in and around villages andments for establishing local fuelwood plantatiors. 2/ DF should ,and distribute the seedlings for these plantations at nominal charge. Thsavillagers would tend the plantations themselves on advice sup<l.ied by DYstaff. This system has been used with some success in Ethiopia. In waste areas on farms can be planted with suitable species both for -iusLwocdas well as animal fodder. The urgent need is to increase the rate cf ndopt±veresearch in this area.
70. Larger plantations should be established by the Fuelwood Cerporationto supply fuelwood in those areas in which wood is in short supply or wherait would be inadvisable, for protective purposes, to fell trees. The fuelwoodplantations can be used to make charcoal to supply the larger consunptiziareas. Problems may arise with storage and transport, and because a larresegment of the population are used to wood as fuel, but these p-roblems arenot insurmountable and the Fuelwood Corporation should be given the lndatcto look tnto the feasiblity of manufacturing charcoal, S±mple char^zoJl kilnsare already avaiiable to villages use and an extension of their a
is also required.
Management of Forest Estates
71. As proposed in the Working Plans for Forestry under tihe PourthDevelopment Plan, Forest estates are to be managed on the slect-'c system,which essentially entails the removal of mature, over-mature and defectivetrees. However, in practice, trees still of vigorous growth have beentaken away, and in many areas the over-mature and defective trees have beenleft. As a result there is a virtual absence of certain size clasees inthe forests. Yet existing management plans call for their rzturel :- .
They propose that the rotation period for all forest species in th7 TerLi(with the exception of Semal which is to be regenerated in 40 yucrs) >3houldbe 80 years. Such a long gestation period will obviously yield a erv lcwinternal rate of return to the economy. It is also doubtful whet'her ttie
1/ Terai forest guards for example should also be trained !n th.- 4
differentiation of permitted sizes.
2/ There is no intrinsic reason why live trees from the natural f3rcestsshould not be felled for fuel, provided that the trees so fellaid 'tWithrespect to species, quality and size) would not have giveni higher re-turns if otherwise utilized. These areas could then be replaatz- ;4ith
quick growing species for the same use.
ANNEX 2Page 20
main species to be naturally regenerated, Sal would be in great demand bvthe middle of the next century 1/. Such proposals would have been difficultand costly to implement even if the stocking and composition of the forestswith respect to vigorous trees were more favorable. In the present circum-stances, they appear to be little more than unrealistic hopes.
72. The important point, however, is the assumption in the working plansthat the species now found in the forest should be regenerated. No alternativemethod to natural regeneration has been considered nor has any real attemptbeen made, if only in view of the inevitable contraction of the forest estate,to see if by introducing faster growing and higher yielding species, produc-tion could be maintained and improved on a reduced area. The present area offorest plantations (about 4,000 ha) have increased by little, even though atarget of 1,600 ha has been set annually for the Fourth Plan. Some of theplots are for experimental purposes, and others are for the provision offuelwood. The plantations are mainly located in the central zone (in boththe Hills and the Terai). They are young, generally under six years old.The main exotic species are Eucalyptus spp., Pinus patula, P. tadea, andTectona grandis. The main indigenous species are Alnus nepalensis, Micheliechampeca, Pinus longifolia and Schima wallichii. The program for introducingfast growing species in both the Hills and the Terai for three purposes (fuel-wood, fodder and construction wood) should be accelerated. New fodder treespecies like "kairals" (Bauhinia variegata) and mulberry, presentlytried in Lumle should also be considered. The staff for forest utilizationand reforestation should be increased and technical assistance for planningand implementing of forest estates based on fast growing species should besouglht.
Competing Uses of Forest Lands
73. Discussions on the relative returns and employment effects inevaluating the extent forests should be retained for forestry or alienatedfor agriculture appear somewhat obtuse in the Nepalese context with itshigh rate of forest encroachment. The magnitude of the problem is not aslarge as may be commonly believed since competition exists essentially inforest areas on relatively good agricultural lands. Such lands (determinedby slope, types of soil, climate) are however quite limited (Annex 1).Where good agricultural land is available, crop production outcompetespresent forestry uses based on long term natural regeneration. Priorityshould however be given to assessing the competitive use between forestmanagement of fast growing species and agriculture. This has not beendone because experience in the former has been limited in Nepal.
1/ Sal owes its present popularity mainly to the fact it is naturallyresistant to insect and fungal attack. It has, however, already beendemonstrated in many parts of the world that it is more economic toapply preservative treatment to fast-growing species rather than toutilize slow-growing but naturally resistant species. It is conceivablethat wood preservation plant could be available in Nepal by the year2050, and that species other than sal could therefore be utilized.
ANNEX 2Page 21
F. Project Possibilities
74. A project is proposed for foreign financing with the followingcomponents:
(a) expansion of the Department of Forestry's program inthe research, production and distribution (para 69)of quick-growing timber species for (i) fuelwood (includingthose which can be used for browsing) primarily in theHills; and (ii) for construction timber, primarily inthe Terai.
(b) improvement of the Fuelwood Corporation's capacity toestablish plantations for fuelwood and charcoalproduction; and
tc) reforestation and/or pasture improvement 1/ of denudedgovernment forests.
75. Technical assistance is required to prepare a feasibility studywhich should include an assessment of:
(a) the location of forests which can be exploited andreforested into quick-growing species for commercialuse (e.g. construction timber);
(b) the location of denuded government forests suitable forfuelwood reforestation and pasture improvement (includingalternative arrangements for combining the two activities;
(c) the demand pattern for fuelwood and charcoal (for house-hold, industrial and tobacco curing);
(d) the optimal location of fuelwood plantations;
(e) the feasibility of adapting and/or extending simplecharcoal kilns to farmers or farmers groups.
The estimated financing cost for the project is US$5.0 million.
1/ Pasture improvement is included as a joint activity because the problemsof reforestation cannot be separated from livestock grazing and fodderuse of these government forests.
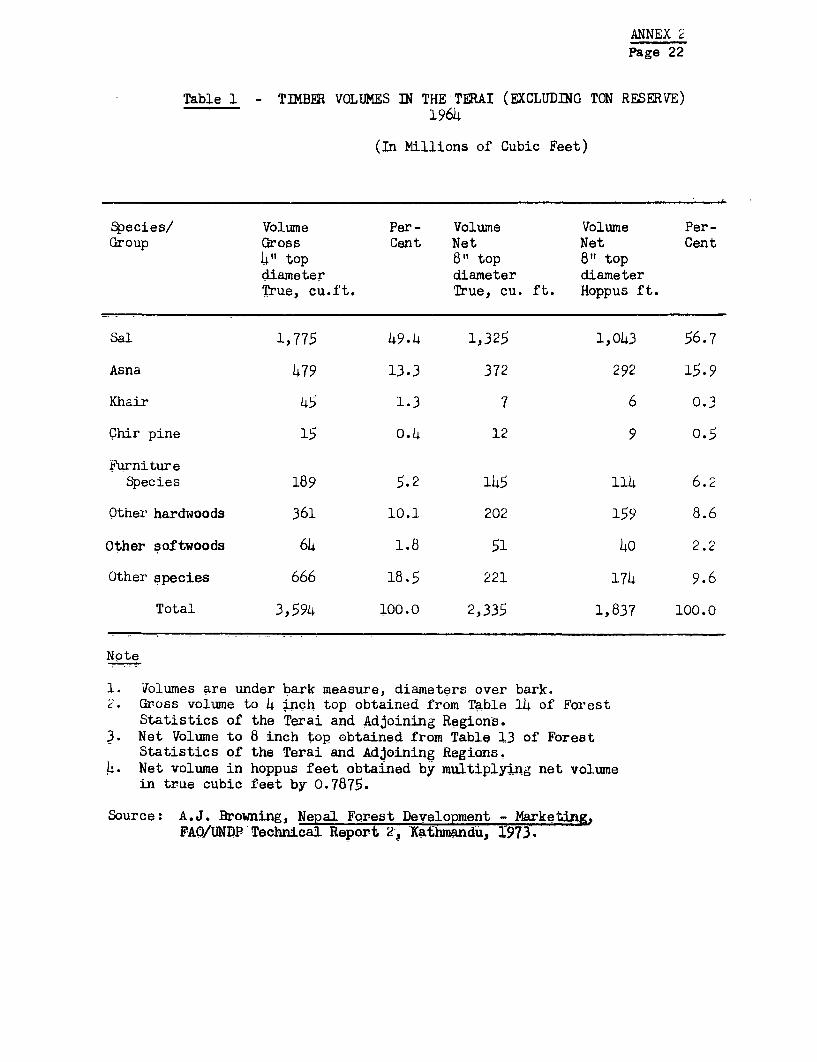
ANNEX 2Page 22
Table 1 - TIMBER VOLUMES IN THE TERAI (EXCLUDING TON RESERVE)1964
(In Millions of Cubic Feet)
Species/ Volume Per- Volume Volume Per-Group Gross Cent Net Net Cent
4" top 8" top 8" topdiameter diameter diameterTrue, cu.ft. True, cu. ft. Hoppus ft.
Sal 1,775 49.4 1,325 1,043 56.7
Asna 479 13.3 372 292 15.9
Khair 45 1.3 7 6 0.3
Chir pine 15 0.4 12 9 0.5
FurnitureSpecies 189 5.2 145 114 6.2
Other hardwoods 361 10.1 202 159 8.6
Other softwoods 64 1.8 51 40 2.2
Other species 666 18.5 221 174 9.6
Total 3,594 100.0 2,335 1,837 100.0
Note
1. Volumes are under bark measure, diameters over bark.Z. Gross volume to 4 inch top obtained from Table 14 of Forest
Statistics of the Terai and Adjoining Regions.3. Net Volume to 8 inch top obtained from Table 13 of Forest
Statistics of the Terai and Adjoining Regions.4. Net volume in hoppus feet obtained by multiplying net volume
in true cubic feet by 0.7875.
Source: A.J. Browning, Nepal Forest Development - Marketing,FAO/UNDP Technical Report 2, Kathmandu, 1973.
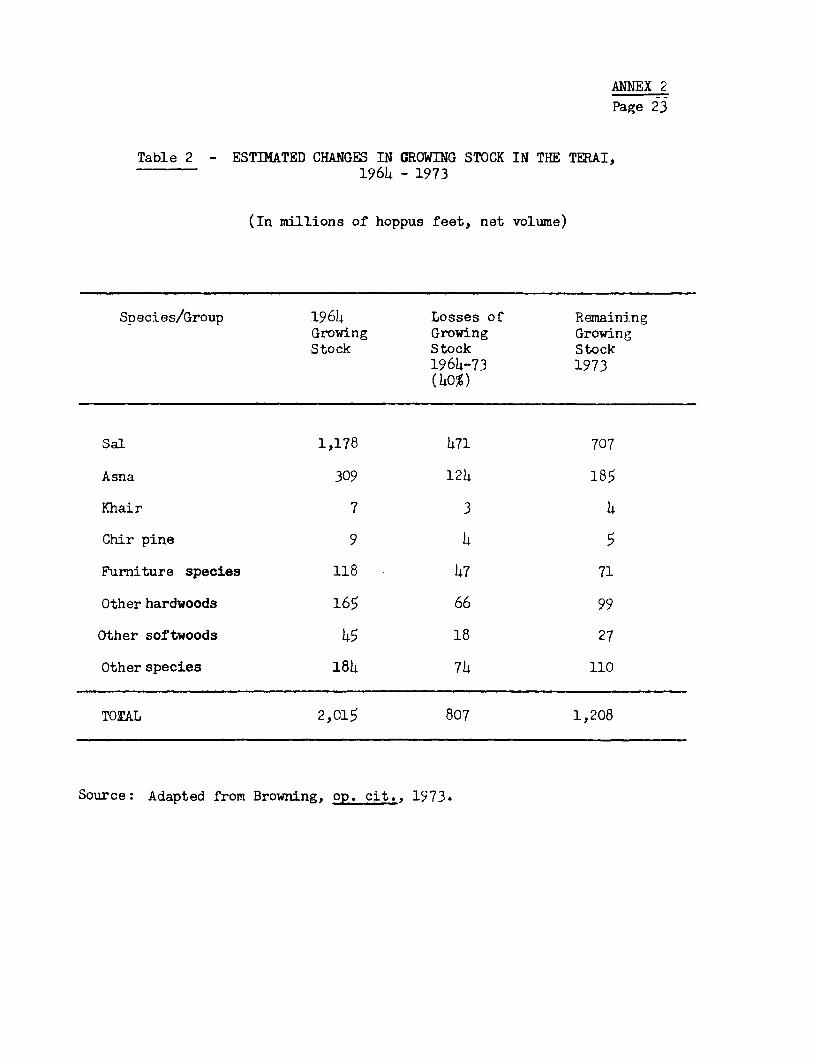
ANNEX 2Page 23
Table 2 - ESTIMATED CHANGES IN GROWING STOCK IN THE TERAI,1964 - 1973
(In millions of hoppus feet, net volume)
Species/Group 1964 Losses of RemainingGrowing Growing GrowingStock Stock Stock
1964-73 1973(40%)
Sal 1,178 471 707
Asna 309 124 185
Khair 7 3 4
Chir pine 9 4 5
Furniture species 118 47 71
Other hardwoods 165 66 99
Other softwoods 45 18 27
Other species 184 74 110
TOTAL 2,015 807 1,208
Source: Adapted from Browning, op. cit., 1973.
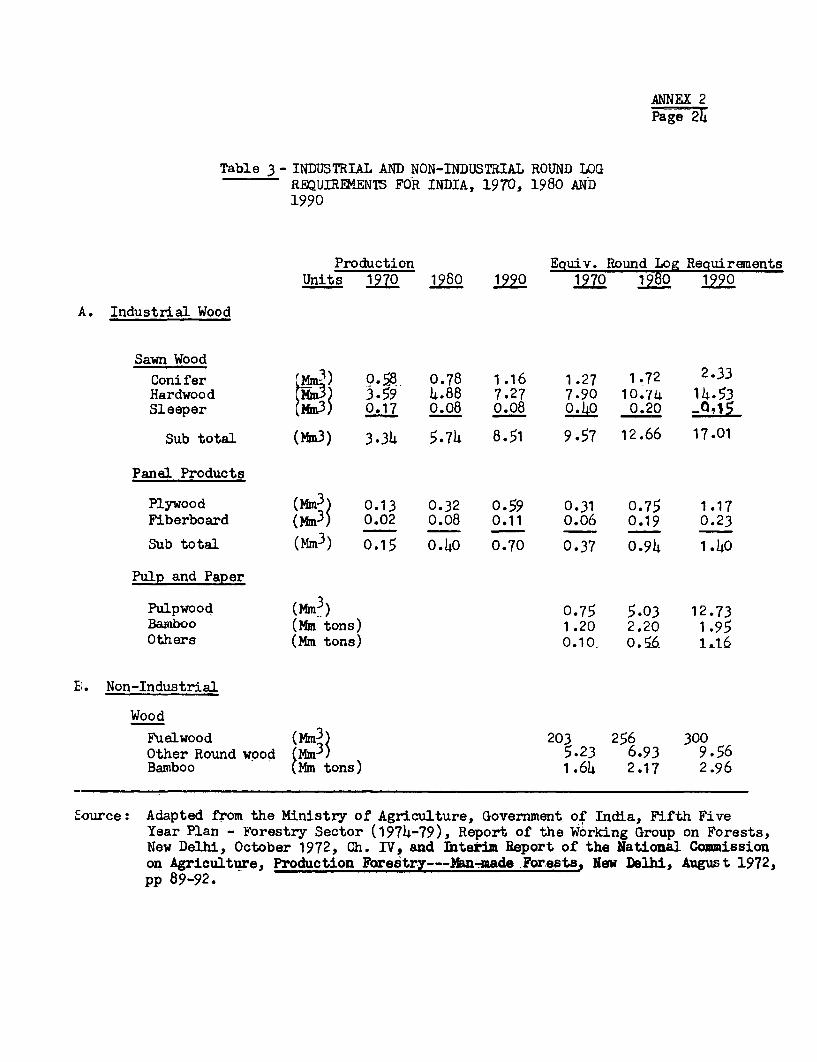
ANNEX 2Page 24
Table 3 - INDUSTRIAL AND NON-INDUSTRIAL ROUND LOGREQUIREMENTS FOR INDIA, 1970, 1980 AND1990
Production Equiv. Round Log RequirenentsUnits 10 18 10 1970 1980 1990
A. Industrial Wood
Sawn WoodConifer M3) 0.58 0.78 1.16 1.27 1.72 2.33Hardwood F ) 59 4.88 7.27 7.90 10.74 14.53Sleeper O o.17 0.08 0.o8 0.40 0.20 _04i5
Sub total (Mm3) 3.34 5.74 8.51 9.57 12.66 17.01
Panel Products
Plywood (Mm3 0.13 0.32 0.59 0.31 0.75 1.17Fiberboard (Mm3) 0.02 0.08 0.11 0.06 0.19 0.23
Sub total (Mm3) 0.15 0.4o 0.70 0.37 0.94 1.40
Pulp and Paper
Pulpwood (Mm3) 0.75 5.03 12.73Bamboo (Mm tons) 1.20 2.20 1.95Others (Mm tons) 0.10. 0.56 1.16
El. Non-Industrial
Wood
Fuelwood (Mm3) 203 256 300Other Round wood (Mm3) 5.23 6.93 9.56Bamboo (Mm tons) 1.64 2.17 2.96
'ource: Adapted from the Ministry of Agriculture, Government of India, Fifth FiveYear Plan - Forestry Sector (1974-79), Report of the Working Group on Forests,New Delhi, October 1972, Ch. IV, and Interim Report of the National Commissionon Agriculture, Production Forestry---Man-made Forests, New Delhi, August 1972,pp 89-92.
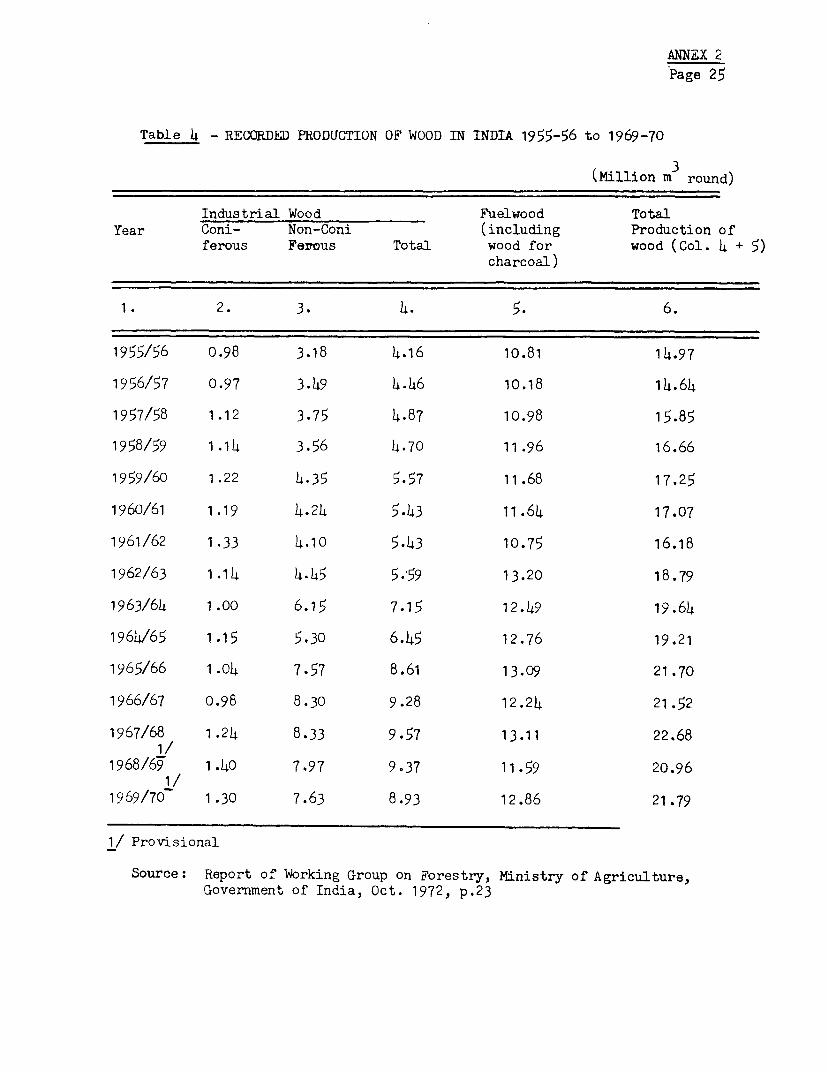
ANNEX 2
Page 25
Table 4 - RECORDED PRODUCTION OF WOOD IN INDIA 1955-56 to 1969-70
(Million m3 round)
Industrial Wood Fuelwood TotalYear Coni- Non-Coni (including Production of
ferous Ferous Total wood for wood (Col. 4 + 5)charcoal)
1. 2. 3. 4. 5. 6.
1955/56 0.98 3.18 4.16 10.81 114.97
1956/57 0.97 3.49 4.46 10.18 14.64
1957/58 1.12 3.75 4.87 10.98 15.85
1958/59 1.14 3.56 4.70 11.96 16.66
1959/60 1.22 4.35 5.57 11.68 17.25
1960/61 1.19 4.24 5.43 11.64 17.07
1961/62 1.33 4.10 5.43 10.75 16.18
1962/63 1.14 4.45 5.59 13.20 18.79
1963/64 1.00 6.15 7.15 12.49 19.64
1964/65 1.15 5.30 6.45 12.76 19.21
1965/66 1.04 7.57 8.61 13.09 21.70
1966/67 0.98 8.30 9.28 12.24 21.52
1967/68 1.24 8.33 9.57 13.11 22.681/
1968/69 1.40 7.97 9.37 11.59 20.96
1969/70- 1.30 7.63 8.93 12.86 21.79
1/ Provisional
Source: Report of Working Group on Forestry, Ministry of Agriculture,Government of India, Oct. 1972, p.23
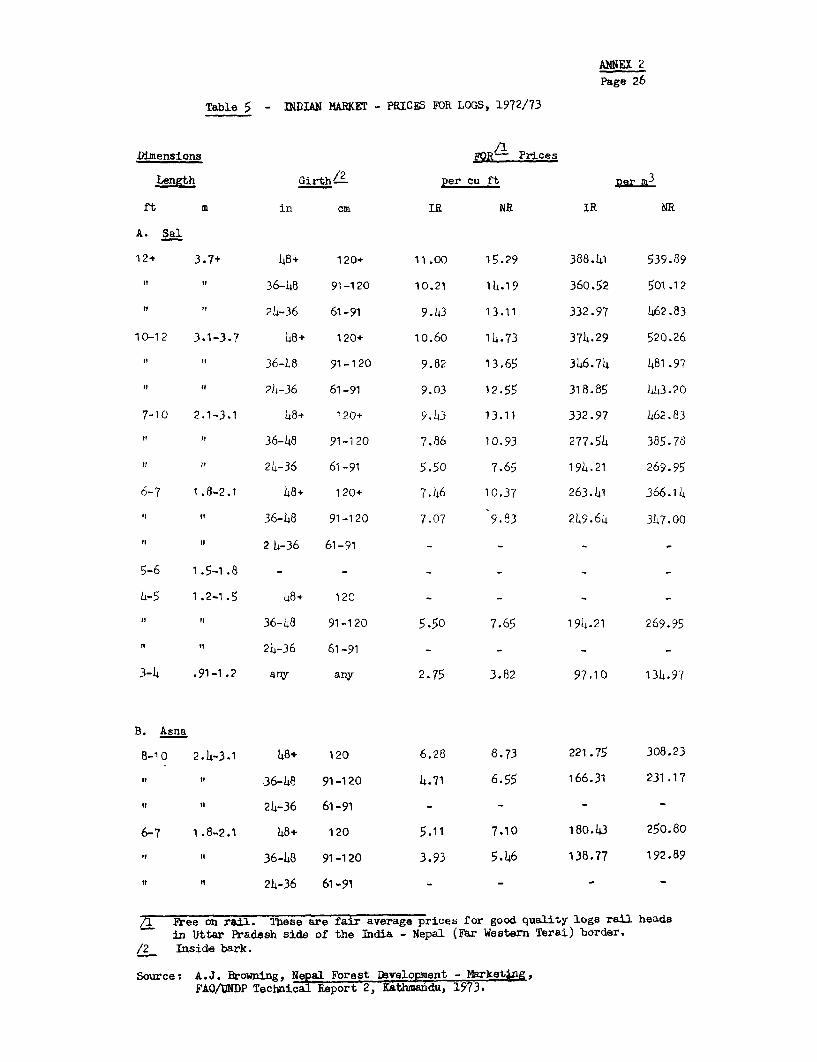
ANNEX 2
Page 26
Table 5 - INDIAN MmT - PRnCES FOR LOGS, 1972/73
Dimensions FOR/1 Pries
Length Girth12 per cu ft
ft m in cm IR UR IR UR
A. Sal
12+ 3.7+ 48+ 120+ 11.00 15.29 388.41 539.89
of 36-4B 91-120 10.21 14.19 360.52 501.12
if 24-36 61-91 9.43 13.11 332.97 462.83
10-12 3.1-3.7 48+ 120+ 10.60 14.73 374.29 520.26
II it 36-48 91-120 9.82 13.65 346.74 481.97
if ItU 2b-36 61-91 9.03 12.55 318.85 4h3.20
7-10 2.1-3.1 48+ 120+ 9.43 13.11 332.97 462.83
IF "f 36-48 91-120 7.86 10.93 277.54 385.78
if ?r 24-36 61-91 5.50 7.65 194.21 269.95
6-7 1.8-2.1 48+ 120+ 7.46 10.37 263.41 366.14
I U1 36-48 91-120 7.07 9.83 2L9.64 3h7.00
i " 2 L-36 61-91 - - - -
5-6 1.5-1.8 - - _ _ _ _
4-5 1.2-1.5 48+ 120 - -
"1 "36-48 91-120 5.50 7.65 194.21 269.95
t1 2L-36 61-91 - - - -
3-4 .91-1.2 arny any 2.75 3.82 97.10 134.97
B. Asna
B-10 2.4-3.1 48+ 120 6.28 8.73 221.75 308.23
36-48 91-120 4.71 6.55 166.31 231.17
I' 24-36 61-91 - - - -
6-7 1.8-2.1 48+ 120 5.11 7.10 180.43 250.80
36-4B 91-120 3.93 5.46 138.77 192.89
't " 24-36 61 -9i - - - -
Al Free on rail. These are fair average prices for good quality logs rail headsin Uttar Pradesh side of the India - Nepal (Far Western Terai) border.
/2 Inside bark.
Source: A.J. Browning, Neal Forest ,avelop4ent - Mrket4ng,FAO/UNDF Technical Report 2, Kathmandu, 1973.
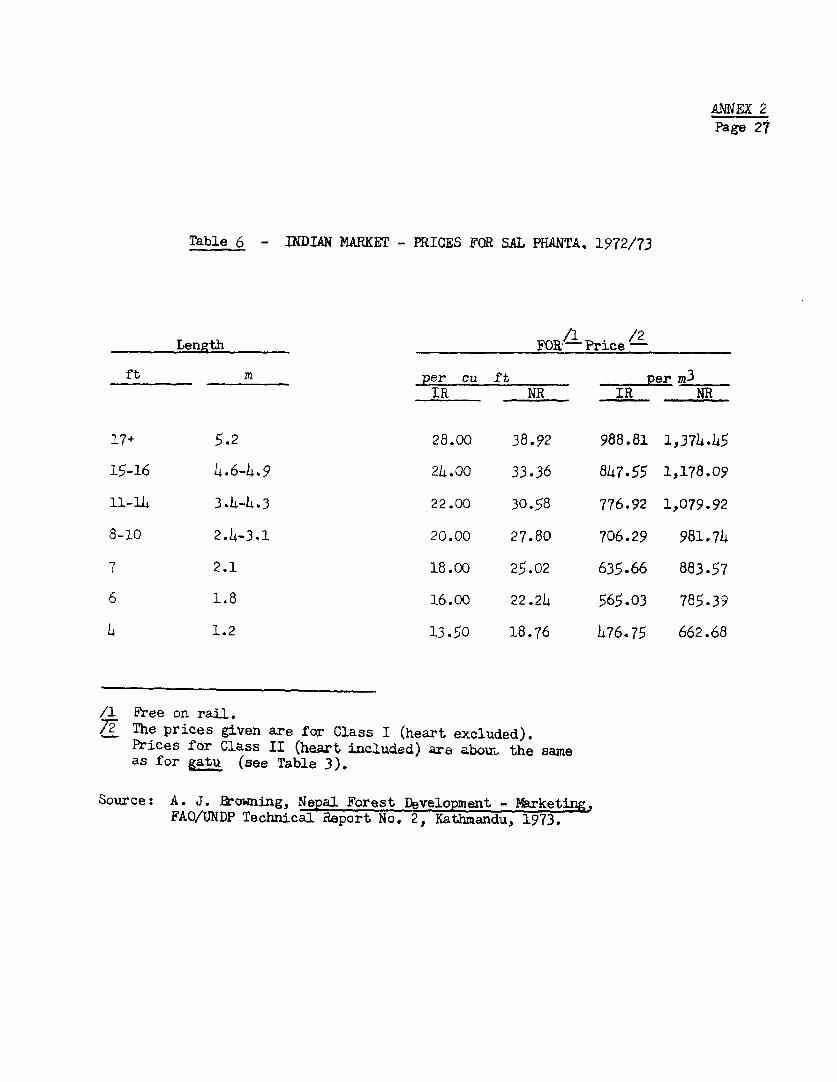
ANNEX 2Page 21
Table 6 - INDIAN MARKET - PRICES FOR SAL PHANTA. 1972/73
Length FOR/ Price -
ft m per cu ft Ear__IR NR IR KR
17+ 5.2 28.00 38.92 988.81 1,374.45
15-16 4.6-4.9 24.00 33.36 847.55 1,178.09
11-14 3.4-4.3 22.00 30.58 776.92 1,079.92
8-10 2.4-3.1 20.00 27.80 706.29 981.74
71 2.1 18.00 25.02 635.66 883.57
6 1.8 16.00 22.24 565.03 785.39
4 1.2 13.50 18.76 476.75 662.68
/1 Free on rail.72 The prices given are for Class I (heart excluded).
Prices for Class II (heart included) are about the sameas for g:tu (see Table 3).
Source: A. J. Browning, Nepal Forest Development - Marketing,FAQ/UNDP Technical Report No. 2, Kathmandu, 1973.
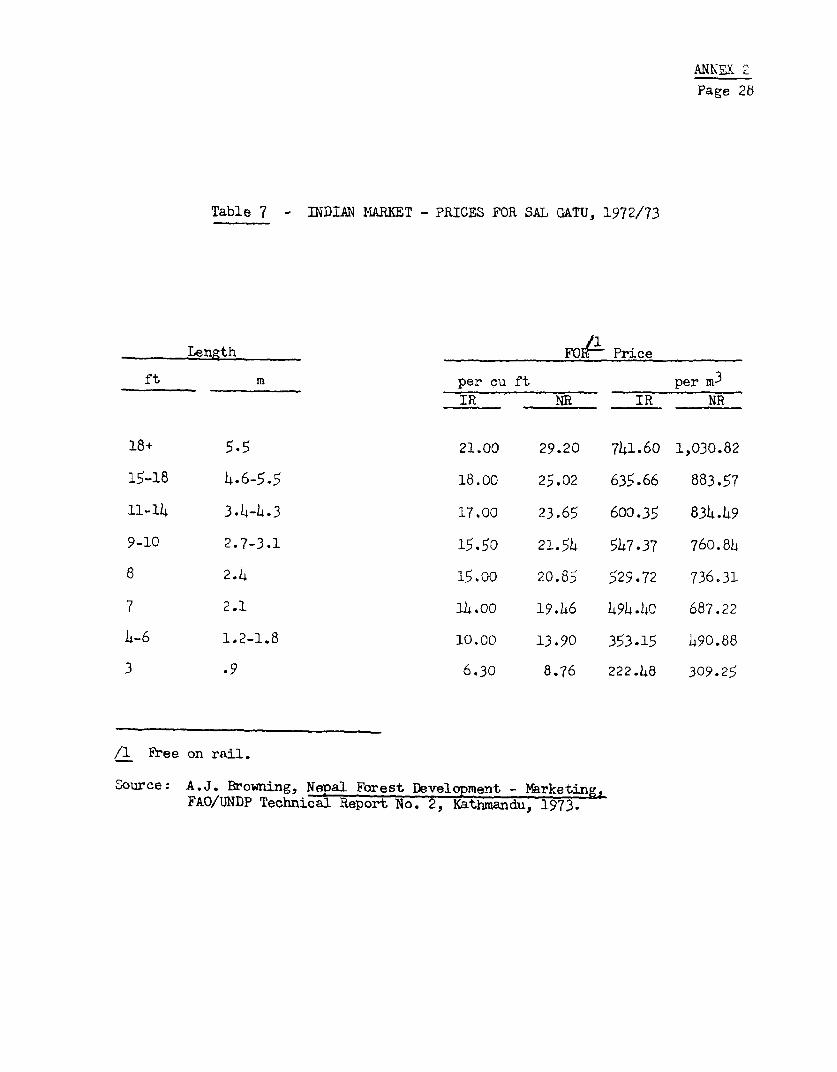
ANNEX 2
Page 25
Table 7 - INiDIAN 1 MARET - PRICES FOR SAL GATU, 1972/73
Length FO0 Price
ft m per cu ft per m3
IR NR IR NR
18+ 5.5 21.00 29.20 741.60 1,030.82
15-18 4.6-5.5 18.00 25.02 635.66 883.57
11-114 3.4-4.3 17.00 23.65 600.35 834.49
9-10 2.7-3.1 15.50 21.54 547.37 760.84
8 2.4 15.00 20.85 529.72 736.31
7 2.1 114.00 19.46 494.40 687.22
4-6 1.2-1.8 10.00 13.90 353.15 1490.88
3 .9 6.30 8.76 222.48 309.25
/1 Free on rail.
Source: A.J. Browning, Nepal Forest Development - Marketing,FAQ/UNDP Technical Report No. 2, Kathmandu, 1973.
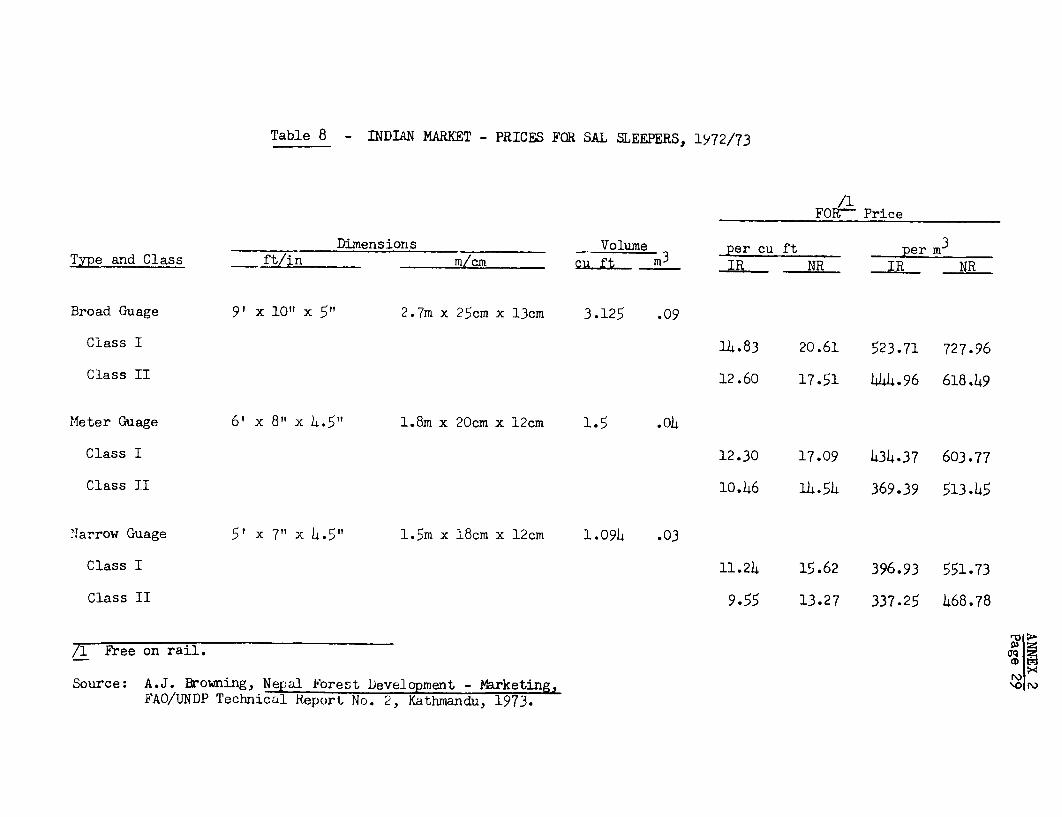
Table 8 - INDIAN MARKET - PRICES FOR SAL SLEEPERS, 1972/73
/1FO1- Price
Dimensions Volume per cu ft per m3Type and Class ft/in mrcm cu ft m IR NR IR NR_
Broad Guage 9' x 10" x 5" 2.7m x 25cm x 13cm 3.125 .09
Class I 14.83 20.61 523.71 727.96
Class II 12.60 17.51 444.96 618.49
MIeter Guage 6' x 8" x 4.5" 1.8m x 20cm x 12cm 1.5 .04
Class I 12.30 17.09 434.37 603.77
Class II 10.46 1L4.54 369.39 513.45
Narrow Guage 5' x 7" x 4.5" 1.5m x 18cm x 12cm 1.094 .03
Class I 11.24 15.62 396.93 551.73
Class II 9.55 13.27 337.25 468.78
/1 Free on rail. o
Source: A.J. Browning, Nepal Forest Development - Marketing, \o NFAO/UNDP Technical Report No. 2, Kathmandu, 1973.
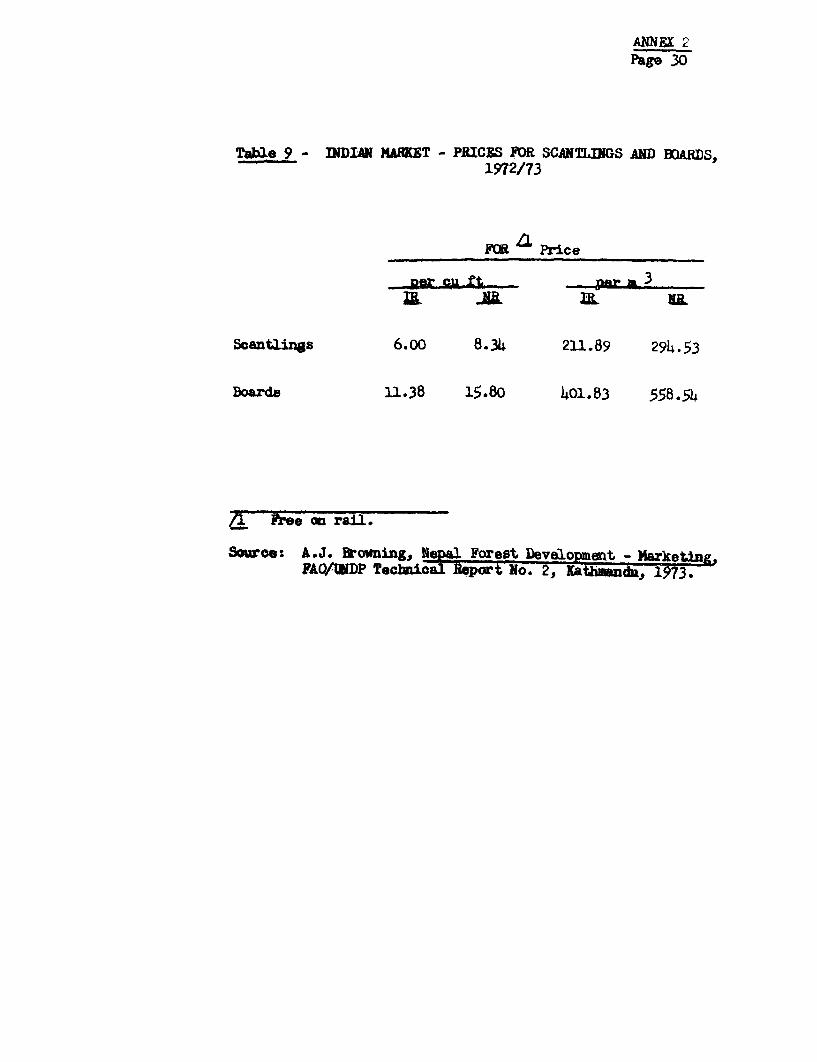
ANNEL 2Page 30
Table 9 - DIMN MAET - PRICES FRM SCANTLINGS AN1) BOARDS,1972/73
FM la Price
necf U p arn3
Scantlings 6.oo 8.34 211.89 294.53
Boards 11.38 15.80 401.83 558 54
a Pree ;o rail.
Soswct A.J. Brmoing, N oe_ etingFADWP Tecbical Report No. 2, L97 -
ANrNEX 2AppendixPage I
PAST OSYt2D_F LOG DISP)SAL FROM GOVER FORSTS
1. The granting of forest concessions, in which long-term leases
were given to concessionaires, was the first method of timber disposal
attempted in Nepal. It was unfortunate that this type of forest marketing
system whieh .dema.+id5 relatlvely hlgh expertise in the drafting of clauses,
the fixing of royalty rates, etc., and wihich requires a competent field
inspection staff to enforce some of the clauses, should have been attempted
in Nepal at a time when their Forest Service was somewhat embryonic. Not
surprisingly, there were frequent disputes between HMG and the concession-
aires over th' interpretation and implementation of clauses.
2. It was therefore, decided to replace this system with two others
which were to operate concurrently: an auction and a quota system. Blocks
of forests -ere auctioned and sold to the highest bidders. Generally these
were not sawmillers but speculators who exported logs to India, In order
to cater for the small sawmill industry then in the country$ a certain
quota of trees (2,200 m3 N was supplied to each sawmiller on payment of a
fee equivalent to the prevailing royalty rates. HMG soon realized that its
revenues from auctions were higher than those it obtained from the quota
system. It therefore abandoned the quota system and all cotmercial timber
in Nepal was sold by auction. The auction system was in turn abandoned in
1969, presumab.y because sawmillers complained of their inability to compete
with log exporters in the open market.
3. Timber disposal ill 1969/70 was changed to the "valuation" system.
Estimates were made of the volume of the standing commercial trees in the
forests to be nut up for sale. A monetary value based on existing royalty
rates, were then placed on these forests. This was the sale price which was
advertised locally. There was no bidding and the prices were fixed. Nepal-
ese sawmillers were given first priority, then Nepali log merchants and
finally Indian log merchants. Applicants may apply for one or more of the
areas to be sold. There was, of course, no guarantee that a sawmlller will
obtain the area for which he has applied. In fact, many sawmillers applied
for certain areas which were either well stocked or in close proximity to
their mills while in a considerable number of areas, there have been no
applicants for other forests. In any case, the selection of successful
applicants was arbitrary. The net result has been that only a small propor-
tion of the forests put up for sale were sold, while most sawmills continue
to operate below capacity for want of wood. Despite the lack of success,
the valuation system continued for another year through 1970/71. Difficul-
tle8 arising from delays in renewing the Trade and Transit Agreement with
India, resulted in a further drop in timber revenues (see Table .. ).
4. In the 1971/72 season DF decided to switch to the "tender" system
with restrictive couditions (an amount of deposits and stringest time of
payment) placed on foreign contractors. Unfortunately, the first sale was

ANNEX 2AppendixPage 2
not instituted until 1972. Local sales by auction were later permitted.although a proper evaluation of the tender method is not possible due tothe delay in implementation, forest revenues did increase to Rs 20.2 M.
5. For the 1972/73 season DF decided to revert back to the auctionsystem. Nearly 62% of the 338 lots offered were sold. Forest revenue was atan all time high of Rs 35.2 M.
ANNEX 3Page (1)
NEPAL
AGRICULTURAL SECTOR SURVEY
FOODGRAIN PRODUCTION
ParagraphNumber
A. INTRODUCTIONBackground ..................................... 1 - 3Past Performance .4 - 6
B. PRESENT POSITIONProductive Inputs. 7
Improved Seeds . 8- 9Fertilizer Use .10 -12Mechanization .13Irrigation .14Credit .15
ResearchBackground .16 -19Research Results and Improved Technology
Rice .20 -24Maize .25 -31Wheat .32 -33
Extension .............. 34 -38
C. RECOMMENDATIONSImproving Agricultural Practices .39 -44Research EmphasisVarieties .45 -50Integration with Livestock Research .51 -52Fertilizer Research .53 -57Pest and Diseases .58
Improving Production Support Services ...... . 59Adaptive Research .60 -61Seed Supply .62 -64Fertilizer Use .65 -66Extension .67 -71
D. PROJECT POSSIBILITIES ................................. 72 -74
ANNEX 3Page (ii)
ParagraphNumber
Table 1: Area Under Major Foodgrains, 1972Table 2: Area, Production, Yields of Major
Foodgrains, by RegionsTable 3: Area Under Improved Foodgrain VarietiesTable 4: Rice High Yielding Varieties
Appendix 1: Foodgrain Cropping Practices 1 - 9Appendix 2: Research Results for Foodgrains 1 -23
Figure 1: Organization of the Ministry of Food,Agriculture and Irrigation
Figure 2: Nitrogen Fertilizer Response forImproved Paddy (IR20), 1971-72
Figure 3: Nitrogen Fertilizer Response forImproved Local Maize, 1971-72
Figure 4: Nitrogen Fertilizer Response forImproved Wheat (S331), 1971-72
ANNEX 3Page 1
NEPAL
AGRICULTURAL SECTOR SURVEY
FOODGRAIN PRODUCTION
A. INTRODUCTION
Background
1. Foodgrains constitute about 60% of agricultural GDP and 80% oftotal cropped area in Nepal. Developments affecting foodgrains will there-fore affect Nepalese agriculture. Paddy, maize and wheat account for 96% ofall cereals produced in Nepal. The minor foodgrains are millet and barley.
2. Paddy, the most important foodgrain is cropped in 1.2 M ha. Near-ly 80% is found in the Terai, concentrated in the Eastern part (Table 1)where annual rainfall is highest. In the Hills, paddy is mainly found inthe valleys. Although maize is the most important Hill crop and is princi-pally grown on the slopes of the Lower Hills (750 m - 2,700 m elevation),its distribution is less concentrated than paddy (Table 1). Except for themonoculture of paddy (mainly in Eastern and Mid-Western Terai), these twofoodgrains are usually grown in rotation with other crops, particularlywheat and potatoes. In Western Terai, oilseeds (particularly mustard) andwheat are also commonly grown as a second crop after rice or maize. In theUpper Hills, maize or upland paddy followed by potatoes, millet, wheat orbarley are the common rotations.
3. Cropping practices for the major foodgrains are given in Appendix 1for the main agricultural regions.
Past Performance
4. The production of major foodgrains (paddy, maize and wheat) grewat an annual rate of 0.7% from average 1967 to average 1972 (Table 2) com-pared with the population growth of 2%. This growth was achieved despitean annual yield decline of 1%.
5. The overall decline in foodgrain yields was basically the resultof declines in the Hills (particularly for paddy and maize in the EasternHills). Kathmandu Valley was the only region where overall foodgrain yieldsincreased by as much as 1% annually and Terai yields were stagnant.
ANNEX 3Page 2
6. Yield declines in the Hills were primarily the result of (a) con-tinued cultivation on existing scarce arable land without sufficient nutrientcompensation; (b) degeneration of seed used; and (c) increasing expansioninto areas of marginal productivity (waste land and steep slopes). In thecase of wheat, an additional reason for overall yield decline was overly fastexpansion of total area cropped (nearly 11% annually) which resulted in theinability for farmers to procure reliable quality seeds. For maize, partic-ularly in the Eastern Hills, increasing incidence of insect infestation wasan additional reason.
B. PRESENT POSITION
Productive Inputs
7. With the exception of Kathmandu Valley, foodgrain production inNepal is characterized by low input use (fertilizers, improved seed, agri-cultural chemicals, irrigation and mechanical power).
Improved Seeds
8. Improved paddy and maize seeds cover only 4% of their total croppedarea and only 1% of the hill areas outside Kathmandu (Table 3). The Agricul-tural Marketing Corporation or AMC (and its predecessor the AgriculturalSupply Corporation) which is responsible for commercial multiplication andimport of seeds for distribution to farmers, supplied only a small fractionof the area under improved foodgrain seeds. The relevant figures for improvedpaddy is presented below:
AMC Improved Area Covered Actual Area UnderYear Seed Sales Seed rate by AMC Seeds Improved Paddy
(kg) (kg/ha) (ha) (ha)
1967/68 232,000 55 4,218 26,1111970/71 102,000 55 1,854 68,2851971/72 555,000 55 10,090 81,627
On the average, only about 9% of total improved seeds were from AMC.Private sources (especially farmer-to-farmer sales) constituted the mainsource of seeds. The source of government's improved seed procurement(cumulative 1968/69 - 1972/73) is given below: 1/
1/ Source: Annex 8, Table 24.
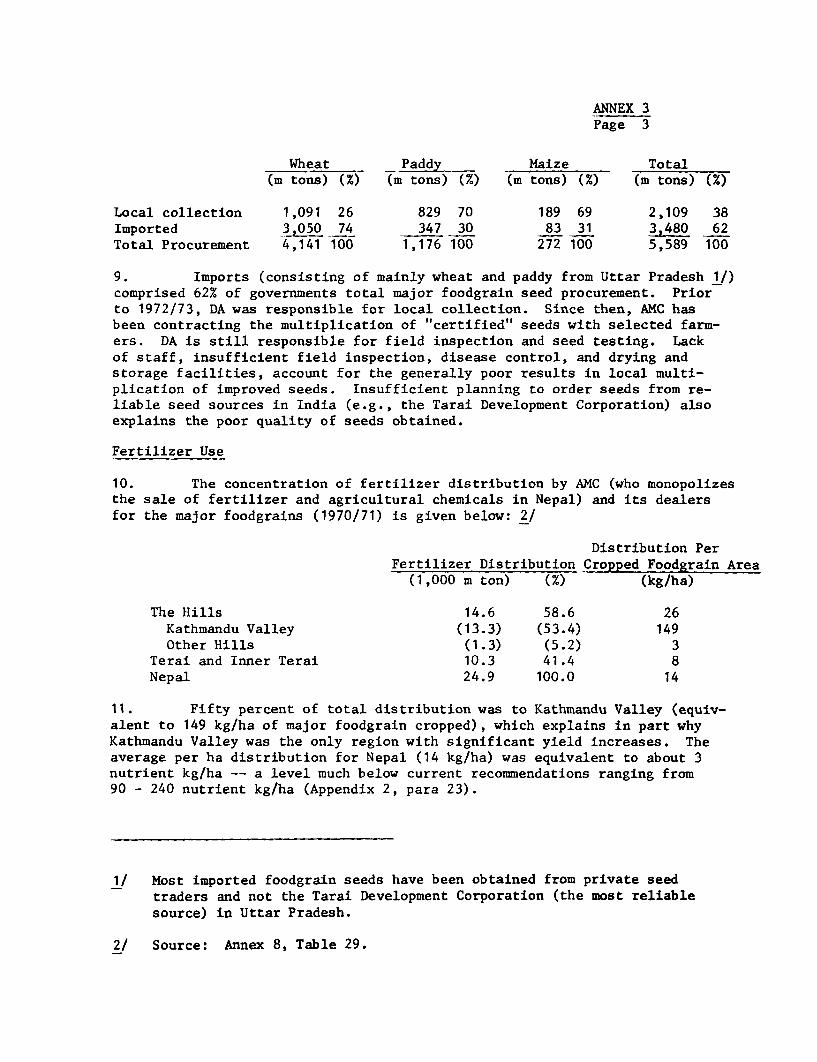
ANNEX 3Page 3
Wheat Paddy Maize Total(m tons) (Z) (m tons) (%) (m tons) (%) (m tons) (%)
Local collection 1,091 26 829 70 189 69 2,109 38Imported 3,050 74 347 30 83 31 3,480 62Total Procurement 4,141 100 1,176 100 272 100 5,589 100
9. Imports (consisting of mainly wheat and paddy from Uttar Pradesh 1/)comprised 62% of governments total major foodgrain seed procurement. Priorto 1972/73, DA was responsible for local collection. Since then, AMC hasbeen contracting the multiplication of "certified" seeds with selected farm-ers. DA is still responsible for field inspection and seed testing. Lackof staff, insufficient field inspection, disease control, and drying andstorage facilities, account for the generally poor results in local multi-plication of improved seeds. Insufficient planning to order seeds from re-liable seed sources in India (e.g., the Tarai Development Corporation) alsoexplains the poor quality of seeds obtained.
Fertilizer Use
10. The concentration of fertilizer distribution by AMC (who monopolizesthe sale of fertilizer and agricultural chemicals in Nepal) and its dealersfor the major foodgrains (1970/71) is given below: 2/
Distribution PerFertilizer Distribution Cropped Foodgrain Area
(1,000 m ton) (%) (kg/ha)
The Hills 14.6 58.6 26Kathmandu Valley (13.3) (53.4) 149Other Hills (1.3) (5.2) 3
Terai and Inner Terai 10.3 41.4 8Nepal 24.9 100.0 14
11. Fifty percent of total distribution was to Kathmandu Valley (equiv-alent to 149 kg/ha of major foodgrain cropped), which explains in part whyKathmandu Valley was the only region with significant yield increases. Theaverage per ha distribution for Nepal (14 kg/ha) was equivalent to about 3nutrient kg/ha -- a level much below current recommendations ranging from90 - 240 nutrient kg/ha (Appendix 2, para 23).
1/ Most imported foodgrain seeds have been obtained from private seedtraders and not the Tarai Development Corporation (the most reliablesource) in Uttar Pradesh.
2/ Source: Annex 8, Table 29.
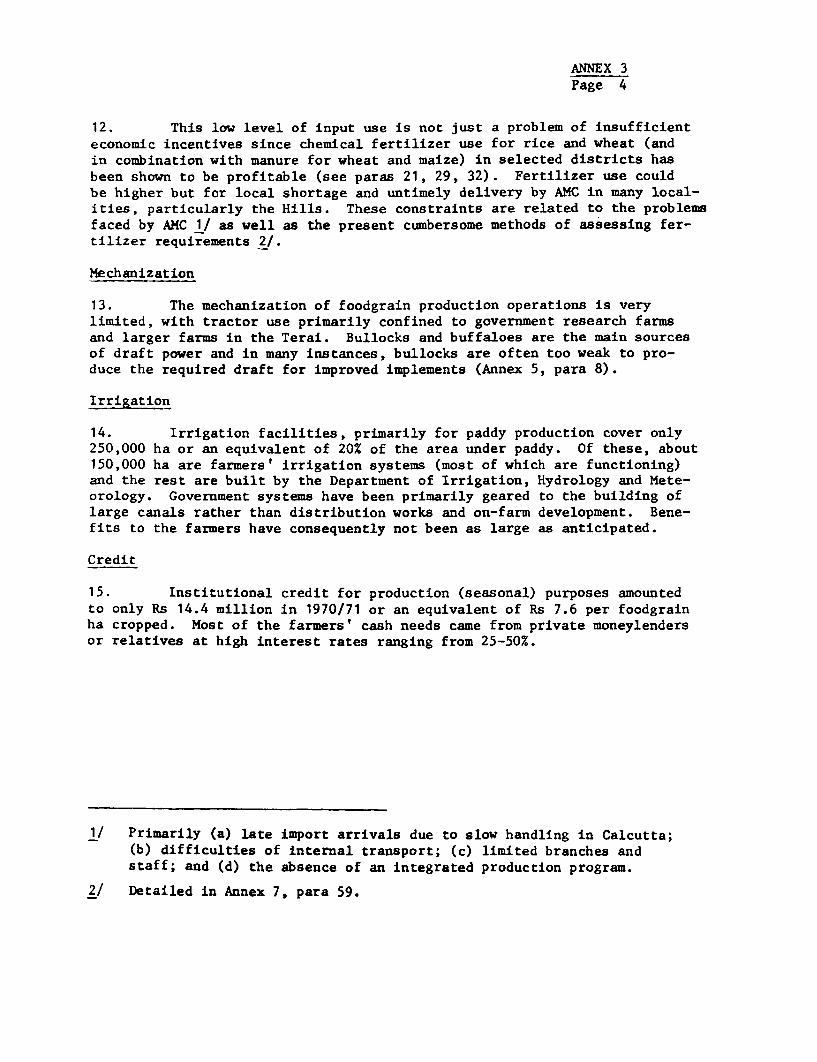
ANNEX 3Page 4
12. This low level of input use is not just a problem of insufficienteconomic incentives since chemical fertilizer use for rice and wheat (andin combination with manure for wheat and maize) in selected districts hasbeen shown to be profitable (see paras 21, 29, 32). Fertilizer use couldbe higher but for local shortage and untimely delivery by AMC in many local-ities, particularly the Hills. These constraints are related to the problemsfaced by AMC 1/ as well as the present cumbersome methods of assessing fer-tilizer requirements 2/.
Mechanization
13. The mechanization of foodgrain production operations is verylimited, with tractor use primarily confined to government research farmsand larger farms in the Terai. Bullocks and buffaloes are the main sourcesof draft power and in many instances, bullocks are often too weak to pro-duce the required draft for improved implements (Annex 5, para 8).
Irrigation
14. Irrigation facilities, primarily for paddy production cover only250,000 ha or an equivalent of 20% of the area under paddy. Of these, about150,000 ha are farmers' irrigation systems (most of which are functioning)and the rest are built by the Department of Irrigation, Hydrology and Mete-orology. Government systems have been primarily geared to the building oflarge canals rather than distribution works and on-farm development. Bene-fits to the farmers have consequently not been as large as anticipated.
Credit
15. Institutional credit for production (seasonal) purposes amountedto only Rs 14.4 million in 1970/71 or an equivalent of Rs 7.6 per foodgrainha cropped. Most of the farmers' cash needs came from private moneylendersor relatives at high interest rates ranging from 25-50%.
1/ Primarily (a) late import arrivals due to slow handling in Calcutta;(b) difficulties of internal transport; (c) limited branches andstaff; and (d) the absence of an integrated production program.
2/ Detailed in Annex 7, para 59.
ANNEX 3Page 5
C. RESEARCH
Background
16. Foodgrain research in Nepal initially started at the Departmentof Agriculture (DA) Research Station in Kumaltar (Kathmandu) and with USAIDassistance (in the past six years) has expanded to research stations andresearch farms in Rampur (Chitwan) and Parwanipur (Central Terai); Janakpurand Biratnagar (Eastern Terai); and Bhairawa and Nepalganj (Western Terai).Although the major part of agricultural research is still concentrated atKumaltar, DA decided to decentralize some of its research work with theresult that Parwanipur (located near Birganj) in Parsa District became therice research center, Rampur became the maize research center, and wheatresearch remained in Kumaltar. In 1972/73, crop development coordinatorswere appointed for each major foodgrain. Their duties are to: (a) coor-dinate the trials undertaken at the various research stations and farms 1/with those initiated by the subject matter-oriented research sections (agro-nomy, soil science, etc. -- see Figure 1) of DA; (b) supervise the multipli-cation of breeder and foundation seeds; and (c) disseminate research informa-tion to the extension service.
17. Nepal is fortunate in that much of the research developments inUttar Pradesh, India are generally applicable to the Terai and Inner Terai(especially Western Terai where conditions are very similar). The largestsearch gap is Hill agricultural research. Local variations, particularlyin the Hills, necessitate increased research adapted to local conditions.
18. Most of the field research undertaken by DA are conducted in re-search stations and experimental farms. Except for the trials undertakenwith FAO assistance, few systematic experiments are conducted in farmer'sfields. Research experiments have emphasized complicated statistical de-signs rather than simple experiments which can be easily replicated underfarmer conditions. Researchers are generally very conservative and reluctantto release prospective varieties for extension until after protracted testingand research.
19. Except for maize, past foodgrain research has emphasized mainlybreeding lines from exotic varieties. Little emphasis has been given toincorporating fodder crops as part of an integrated livestock-foodcrop
1/ Other agencies also involved in adaptive field research on foodgrainare: (a) the FAO Project for the Increased Use of High Yielding CropVarieties and Fertilizers, Central Nepal; (b) the Nepalese-GermanGandaki Agricultural Development Project; (c) Hardinath Pilot Demon-stration Farm, Janakpur (run by Nippon Koei consultants); and (d)British-Gurkha Ex-Servicemen Re-integration Training Scheme at Lumle.
ANNEX 3Page 6
farming system. Fertilizer trials have been virtually restricted to chem-ical fertilizers, and improved rice varieties have been limited to thosewhich require irrigation or at least areas with high water table and goodpossibilities for water retention.
Research Results and Improved Technology
Rice
20. High yielding varieties (HYV) have been released for irrigatedareas and areas with high water table during monsoon and less permeablesoils. In the Hill valleys, recommended improved "japonica" varieties(Chainan 242, Taichung 176 and Chainan 2) can outyield local varietiesby 80-100%. In addition to Taichung 1, Jaya and CH 45, the IRRI varie-ties (IR 8, IR 20, IR 22 and very recently Parwanipur 1 (selected withinIR 400) with yield potentials double that of local varieties) have beenreleased for the Terai and Inner Terai.
21. Improved rainfed varieties have yet to be developed for releaseto farmers. However, fertilizer experiments on farmers' fields, conductedin 6 districts by DA/FAO 1/ showed that IR 20 performed reasonably welleven under rainfed conditions (Figure 2). Fertilizer application (140 kgof N2 - 50 kg of P205 - 20 kg of K20) gave yields from 4-6 m tons, and at1971/72 prices gave added revenue/fertilizer cost ratios of about 2:1 2/or better as shown below:
1/ P. J. C. Damen, DA/FA0, Preliminary Statistical and Economical Analysisof Fertilizer experiments on Paddy, Maize, and Wheat, 1971/72 (revised),May 1973.
2/ The standard commonly used to measure the profitability of applyingfertilizer in order to justify the added risks involved.
ANNEX 3Page 7
/1 PaddyRevenue/Cost Ratios/ Farm Price/3
/2 /270 kg N-/ 140 kg NF- (Rs/kg)
Kavre (Hills) 2.11:1 2.36:1 1.16Nuwakot (Hills) 2.92:1 2.41:1 0.94Makwanpur (Inner Terai) 5.29:1 5.59:1 1.26Chitwan (Inner Terai) 1.89:1 2.00:1 0.72Bara (Terai) 2.08:1 2.98:1 0.88Parsa (Terai) 1.58:1 1.94:1 0.70
/1 Value of increased yields divided by incremental cost of fer-tilizer application.
/2 With 50 kg P205 and 20 kg K2 0 per ha.
/3 At harvest.
Source: Damen (DA/FAO), op. cit.
22. At lower N levels (70 kg), fertilizer application is much lessattractive for Bara and Parsa. Locally selected HYV's like Parwanipur 1,Mansuli and Marinda should replace IR 8 and IR 5 in rainfed areas of East-ern Terai, because if planted late, IR 8 and IR 5 have limited yields andoften do not enable the planting of a second crop of wheat or mustard(Appendix 2, para 4).
23. Improved husbandry practices for paddy cultivation can also improveyields significantly. Irrigated yields of improved varieties in the Teraiincreased 88 percent when paddy was sown in March instead of May (Appendix 2,para 4). Present irrigation facilities (even those constructed for supple-mentary monsoon irrigation) will however not permit the benefits from suchearly sowings to be realized. More year round irrigation is therefore im-portant, not only in increasing rice cultivation intensity, but in permittingearlier planting.
24. From above, improvements in the technology of rice mono-cultureare available in the form of improved varieties, improved husbandry prac-tices and fertilizer use. Complementary improvements from crop rotationand integration with livestock and fodder are discussed in Annex 5.
Maize
25. Selection among local varieties has produced the following varie-ties (with about 50% higher yield potentials) for three altitude zones: (a)High altitude (over 6,000 ft) - Kakani Yellow; (b) Middle and low altitudeHills and Terai - Hetaura Composite and Kumaltar Yellow; and (c) Low altitudeTerai and Inner Terai - Rampur Yellow. The extension of these varieties hashowever been very slow primarily because of some undesirable agronomic quali-ties and limited economic gains from chemical fertilizer use.
ANNEX 3Page 8
26. The agronomic disadvantages are: (a) 20-25 days longer durationthan the local varieties making them unsuitable for intensive cropping pat-terns; (b) cobs located high on stalks making them susceptible to lodging;and (c) open husks during maturing and storage which lead to infiltrationby rain making them more prone to attacks by birds and insects.
27. Fertilizer trials with these varieties (mainly Kumaltar Yellow andRampur Yellow) were conducted in six districts by DA/FAO 1/ (1970/71). Theresults showed that average yields increased by about 40%, and average ni-trogen efficiencies (Figure 3) ranged from 9-15 kg of maize per kg of N ex-cept in the case of Chitwan (5.9 kg) and Rautahat (2.3 kg).
28. The added revenue/cost ratios from applying fertilizer were how-ever not much more than 2:1 except for Kavre and Nuwakot in the Hills (andpossibly Bara in the Terai) as shown below:
Maize /2Revenue/Cost Ratios Farm Price-
70~ kg1 140 kg N-1 Rs/kg
Kavre (Hills) 2.37:1 2.62:1 1.16Nuwakot (Hills) 4.63:1 3.25:1 2.00Makwanpur (Inner Terai) 1.96:1 2.01:1 0.73Chitwan (Inner Terai) 1.48:1 1.31:1 1.00Bara (Terai) 2.12:1 2.13:1 0.82Rautahat (Terai) 0.24:1 2.02:1 0.70
/1 With 45 kg P205 and 30 kg K20 per ha.
/2 At harvest.
Source: Damen, op. cit.
Since fertilizer costs are standardized in Nepal the main determinant ofrelative profitability was the farmgate price for maize.
29. When manure was combined with chemical fertilizer in two districtsof the Gandaki Zone (Hills), yields increased an average of 85% (Appendix 2,para 15). Such a level of response improves the profitability of fertil-izer use. With CIMMYT assistance, seven improved synthetic varieties withhigh lysine content have been developed. Consisting of the Indian varie-ties Ganesh 1 and 2, Thai Composite 1, Philippine DMR 2 and 3, Hard Endo-sperm Opaque 2 and Cuperico x Flint Compuesto, they come closer to meetingfarmers' requirements for short duration and lodging resistance than thepreviously recommended improved varieties and have comparable yields under
1/ Damen, op. cit., 1971-72.
ANNEX 3Page 9
average farm conditions (2.5 m ton/ha). Although their relative profitabil-ities and fertilizer responses have yet to be tested under farmer's fieldconditions and their multiplication has been limited (and both these activ-ities should be expanded as top priority), researchers are confident thattheir economic performance will be better than the local improved varieties.
30. Insect pests (primarily cutworms and stemborers) have caused lossesof up to 50% 1/ of the standing maize crop in numerous hill localities. Pre-liminary indications (Appendix 2, para 17) show that if yield improvements ofmore than 20% can be obtained, it would be profitable to apply three roundsof 5% BHC dust at 40 kg/ha.
31. Improved technology for maize consisting of (a) improved highlysine maize, (b) fertilizer - manure application and (c) pesticides appli-cation therefore exists.
Wheat
32. Improved varieties for wheat exist in the form of RR 21 (Sonalika),S308, S331 and Pitic 62 2/ obtained from Uttar Pradesh, India. Their yieldpotentials are more than double those of local varieties. Research results 3/for these varieties (mainly S331) show that under farmers' conditions (rain-fed), fertilizer application at 120 kg N, 60 kg P205, 40 kg K20 per ha isprofitable at 1971/72 fertilizer prices (with the exception of Chitwan andpossibly Parsa districts).
Wheat /2Revenue/Cost Ratios Farm Price-60 kg 1 120 kg /1
Kavre (Hills) 1.65 2.27 1.15Nuwakot (Hills) 4.92 4.35 1.50Makwanpur (Inner Terai) 2.63 3.61 1.40Chitwan (Inner Terai) 1.68 1.79 1.03Bara (Terai) 2.62 3.60 1.20Parsa (Terai) 1.58 2.05 0.77
/1 With 50 kg P205 and 20 kg K20/ha.
/2 At harvest.
1/ Source: Maize Coordinator, DA and information supplied by variousDADO's visited by the mission.
2/ These have replaced the Mexican dwarf varieties (Lerma Rojo, KolyanSona and Sonora 64).
3/ Damen, op. cit.
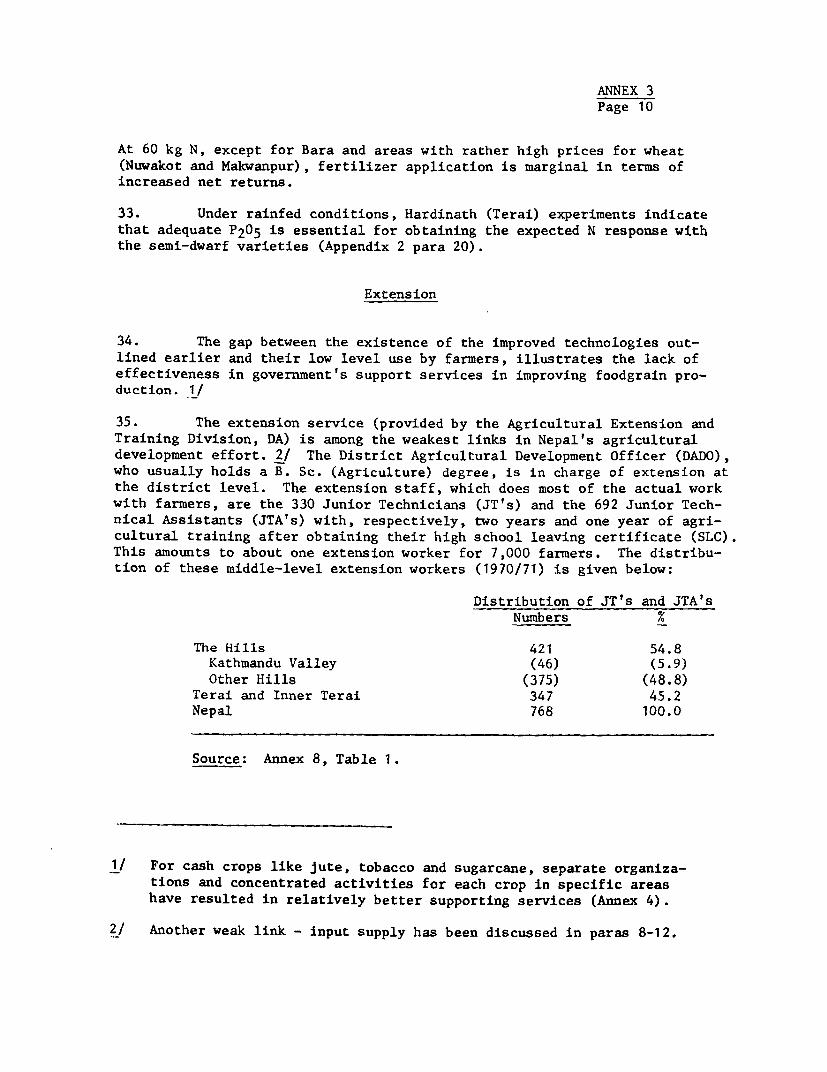
ANNEX 3Page 10
At 60 kg N, except for Bara and areas with rather high prices for wheat(Nuwakot and Makwanpur), fertilizer application is marginal in terms ofincreased net returns.
33. Under rainfed conditions, Hardinath (Terai) experiments indicatethat adequate P2 05 is essential for obtaining the expected N response withthe semi-dwarf varieties (Appendix 2 para 20).
Extension
34. The gap between the existence of the improved technologies out-lined earlier and their low level use by farmers, illustrates the lack ofeffectiveness in government's support services in improving foodgrain pro-duction. 1/
35. The extension service (provided by the Agricultural Extension andTraining Division, DA) is among the weakest links in Nepal's agriculturaldevelopment effort. 2/ The District Agricultural Development Officer (DADO),who usually holds a B. Sc. (Agriculture) degree, is in charge of extension atthe district level. The extension staff, which does most of the actual workwith farmers, are the 330 Junior Technicians (JT's) and the 692 Junior Tech-nical Assistants (JTA's) with, respectively, two years and one year of agri-cultural training after obtaining their high school leaving certificate (SLC).This amounts to about one extension worker for 7,000 farmers. The distribu-tion of these middle-level extension workers (1970/71) is given below:
Distribution of JT's and JTA'sNumbers %
The Hills 421 54.8Kathmandu Valley (46) (5.9)Other Hills (375) (48.8)
Terai and Inner Terai 347 45.2Nepal 768 100.0
Source: Annex 8, Table 1.
1/ For cash crops like jute, tobacco and sugarcane, separate organiza-tions and concentrated activities for each crop in specific areashave resulted in relatively better supporting services (Annex 4).
2/ Another weak link - input supply has been discussed in paras 8-12.
ANNEX 3Page 11
36. Contrary to common belief, more extension workers are located inthe Hills than in the Terai. However, these extension workers are concen-trated in Kathmandu, the German Gandaki agricultural development project,and government research stations and research farms. The number of exten-sion workers serving the Hill farmers is effectively negligible.
37. The lack of effectiveness in agricultural extension is due notonly to the small number of available middle-level extension staff, butalso to: (a) the high turnover rate and low prestige position; (b) insuf-ficient support both in terms of (i) the absence of a readily extendableimproved production package, and (ii) negligible transportation facilitiesand allowances; (c) lack of training and capacity to handle practical agri-cultural problems (especially in the Hills); (d) the unwillingness of exten-sion workers (primarily from the Terai) to work in the Hills; and (e) theresponsibilities to other government organizations 1/ which may detract theextension worker from his field extension and demonstration duties.
38. The poor link between research and extension is primarily due tothe lack of adaptive research and a systematic arrangement to disseminatethe knowledge of existing improved technology to the extension worker.
C. RECOMMENDATIONS
Improving Agricultural Practices
39. Feasible improvements in foodgrain production practices involveimproving (a) soil preparation, (b) cropping patterns (including foddercrop production), (c) production and use of animal manure, and (d) on-farmstorage.
40. Seedbed preparation, especially for wheat can be greatly improvedby the use of steel soil-inverting plows. These plows may require moredraft than many farm animals in their present condition can supply. Con-current improvements in livestock, feeding and breeding are, therefore,necessary (see Annex 5 for details).
41. Integrating fodder legumes with traditional cereal cropping canbe further expanded. With prior phosphate fertilization, intersowing withpulses (sunhemp, cowpeas, mung beans, rice beans, soybeans) between paddyand maize towards the end of the monsoon (late August/early September) andharvesting at late October/early November could produce sufficient green
1/ For example, in preparation of farm plans one JTA or JT is assigned toeach of the 147 guided cooperatives and 434 guided village committeesto assess input requirements.
ANNEX 3Page 12
fodder to feed 1.5 - 2 milk buffaloes or a pair of bullocks adequately(Annex 5, para 58). This practice of intercropping with fodder pulses(particularly for maize) would be mnore suited for the Hills because themain crop is usually planted earlier. The additional advantage againsterosion by keeping the slopes under more intensive cover is also important.
42. As a result of fodder crop production and better feeding, highquality manure could be produced if care is taken to collect not only themanure but also the urine (Annex 5, para 55). Farmyard manure has an im-portant role as a source of nitrogen 1/ and potassium, particularly in theHills, where accessibility and soil permeability problems predominate. Itsimportant role has not been sufficiently emphasized but the soaring costsof inorganic fertilizers and the need for a readily available substitute,now make it imperative to do so. If proper care is taken to conserve manure,improved leguminous fodder availability could meet 25-50% of N and P and 100%of K fertilizer recommended rates for foodgrains 2/.
43. The interrelatedness of fodder, foodgrain and livestock activitiesshould be noted. For instance, the importance of shorter duration grain
varieties and improved ploughing (especially for seedbed preparation) wouldpermit better accommodation of fodder crops. In addition, stall feedingwould be more feasible as more fodder is available on the farm, making iteasier to conserve manure.
44. In the Terai, the threshed paddy and wheat is usually stored onthe farm in grain bins constructed of mud and bamboo and covered with thatch.The grain losses during farm storage in the Terai due to insects and moulds
are estimated to be about 5%. Similar losses in the Hills are much higherand vary from 15-25% 3/. The storage methods there consist of placing thepanicles or ears tied in bundles on raised platforms and covering them withstraw or placing them in mud and bamboo bins. An on-farm storage programwas started in 1972/73 by USAID in Chitwan consisting of the constructionof concrete bins with concrete roofs (capacity 2-4 m tons), financed throughthe Agricultural Development Bank (ADBN). The construction costs were Rs 1,500
1/ As a source of nitrogen, farmyard manure is more bulky, slower in its
action and less effective than nitrogen available in inorganic fertil-izers. Its soil improving properties are however particularly impor-tant in lighter soils and in cooler Hill conditions where less leach-ing results. When used as basal dressing it enhances the response to
inorganic fertilizer.
2/ Ranging from nutrient levels of 40-120 kg N, 30-80 kg P2 05 and 20-40 kgK20 (with rice and wheat at the lower levels and maize at the higherlevels).
31 Estimates from mission's field trips.
ANNEX 3Page 13
- 2,000 cash, repayable in 4 years. Complaints have been made concerning con-siderable temperature build-up in these bins resulting in a rapid increase ofgrain moisture content. These problems and the construction costs could bereduced with a modified and simpler design. For example, with the use oflocally made bricks, costs may be reduced to about Rs 800 each. 1/ Mediumterm ADBN credit should be supplied to promote this type of storage. Alter-natively, improvement of present methods can be made by constructing simplegrain bins made of hollow bricks covered with lids and thatch roofs to pro-vide shading of the walls. The hollow bricks and the thatch shade providesufficient insulation and shade to prevent high temperature build-up in thebins.
Research Emphasis
Varieties
45. The development of short duration rainfed rice varieties for theEastern Terai and Hill Valleys should have the highest priority in DA's cropimprovement programs since the limited irrigation facilities and climatolog-ical factors do not permit optimal performance of the introduced IRRI varie-ties. Although the expansion of irrigation and rehabilitation of existingschemes will be increasing, the majority of rice areas will have to rely onrainfed husbandry. For the rainfed conditions in Eastern Terai, varietiessuch as Ch 45, Padma, Ratna, Jabarmati, Pussa 22-1 in addition to short dura-tion local varieties such as Mansuli and Marinda offer a source of geneticmaterial for further varietal selection. The emphasis in varietal develop-ment should be on selection rather than on cross-breeding as the first wouldresult in quicker results.
46. Varietal development for the hill valleys should concentrate onthe selection and evaluation of local genetic materials. Field testing of10-15 selected varieties should be initiated under actual farming condi-tions country-wide using simple non-replicated farmers plots but with asufficiently large number within each locality (or ecological unit) to per-mit statistical analysis of the results. After the first year of fieldtesting, the number of varieties could be reduced to 6-10 varieties to beevaluated in the second year. The same procedure bUL possibly with a lowernumber of selected varieties should be repeated in the third year. Seedmultiplication of outstanding varieties in specific ecological zones shouldstart after the second year of field testing. The exrtension service andprogressive farmers should be made responsiole for the implementation ofthis testing program since they are in a position tc evaluate farmers'acceptance.
1/ Estimates by R. B. Shresta, Farm Manager at Kumaltar.
ANNEX 3Page 14
47. For the irrigated areas, the present rice HYV's offer sufficientvarietal choice both from local stock and from new varieties developed byUPAU at Patnagar, India (See Table 4).
48. Field testing of promising varieties for local adaptability shouldtake place initially at the regional crop development centers (para 60) fol-lowed by testing of the most promising varieties on farmers fields in adja-cent areas. This procedure in combination with local seed multiplicationof those varieties (by contracts with farmers) would lead to much fasterintroduction than the present system, with new varieties tested only on DAexperimental stations and farms.
49. The variable performance of the "japonica" rice varieties in theHills (Appendix 2, para 6) also warrants more extensive testing in farmerfields for key rice growing areas. Nepal should not develop its own breed-ing program for new wheat varieties, but rely on the introduction and eval-uation of genetic material from CIMMYT, UPAU and Pakistan. Maize researchhas reached the stage where extensive field testing of the improved high-lysine varieties are required.
50. Attempts should be made to assess the performance of improvedvarieties under actual farm conditions. Where the distribution of fertil-izers and improved seeds cover the same area, an analysis of the yieldsthrough crop cuttings at harvest may be undertaken by DA in conjunctionwith the preparation of farm plans by the extension staff for ADBN. Thisevaluation of actual performance would be particularly useful for guidingresearch and seed multiplication policy.
Integration with Livestock Research
51. The use of improved varieties may not result in significant food-grain yield increases if not accompanied by fertilizer use and proper crophusbandry. The prospect of high imported fertilizer prices and the reflec-tion of Nepal's ruggedness and landlocked position in high transportationcosts necessitates: (a) priority attention to integrating nitrogen-fixingfodder with foodgrains and to improving production, collection and use ofhigh quality manure (see Annex 4, Appendix 3 for details); and (b) focus onthe economics of chemical fertilizer use (particularly in combination withmanure) under various ecological and local conditions.
52. Research for integrating foodgrain with livestock/fodder produc-tion should be undertaken at the proposed livestock development centers(Annex 5, para 67) established in conjunction with the crop developmentcenters, and in farmers' fields.
Fertilizer Research
53. Research results show that although wide ranges of fertilizer re-quirements occur in different ecological zones, the DA's recommendations offertilizer requirements for the major foodgrains are generally appropriate
ANNEX 3Page 15
except for possible underestimation of N requirements in some areas (Appen-dix 2, para 23).
54. With the internal transportation and distribution problems, DAand AMC should seriously consider concentrating on two types of fertilizerfor research and distribution--namely a 20-20-10 complex and urea. Whenapplied at the rate of 200 kg/ha, this complex fertilizer should meet thebasal requirements for nitrogen and all the phosphorus and potassium re-quirements. Emphasis on top dressings with nitrogen, which are essentialon Nepalese soils, should be on urea. DA should also evaluate the agronomicand economic advantages of sulphur coated urea over ordinary area both forirrigated and rainfed rice. Sulphur coated urea has a real potential forincreasing the effectiveness of applied nitrogen where flooding is delayedor intermittent and the use of other nitrogen carriers results in high lossesdue to volatilization and leaching. 1/
55. In order to demonstrate the effects of fertilizers and to assessnitrogen response for rice similar to that shown in Figure 2 (with calcula-tions of benefit/cost ratios), attention should be focused on non-replicatedtrials on farmers' fields within each identifiable ecological unit, testing2 or 3 rates of complex 20-20-10 in combination with topdressing of 1 or 2levels of urea. The number of plots in each of these trials should not bemore than 5 or 6 so that they can be easily handled by the extension serv-ice, who should have the responsibility for implementing this program. Pro-gressive farmers can play a key role in undertaking these trials on theirfields. Because of its simplicity, the advantages of basic NPK applicationsand incremental N applications are easily demonstrated. Feedback of yielddata and other relevant information by extension workers and progressivefarmers participating in this program will enable the research workers toestablish the optimal N response curve for each ecological zone. The presentregional research farms and the proposed regional crop development centersshould have staff directly responsible for the planning and implementationof these farmers' trials.
56. DA should pay greater research attention to the possible N supplyfrom green manures grown during the dry season to provide cattle with fod-der such as berseem clovers, sunhemp, mung and rice beans. Maize researchshould emphasize: (a) legume intercropping (such as soybeans, mungbeansand cowpeas) and rotation with legume crops (such as sunhemp and field peas)should be studied from the standpoint of cattle fodder and soil N supply;(b) the production and preparation of animal manure and compost, and theirability to supply various nutrients; and (c) basal applications of 20-20-10
1/ Source: International Rice Commission, Thirteenth Session of theWorking Party on Rice Soils, Water and Fertilizer Practices, Bangkok,October 30 - November 3, 1972.
ANNEX 3Page 16
complex fertilizers at rates of 100 and 200 kg/ha in non-replicated trialson farmers' fields (in order to test the N response curve and N efficien-cies) for the various ecological zones.
57. Fertilizer research for wheat should be based on the use of farm-yard manure and fertilizers following the farmers' plot technique outlinedfor rice and maize.
Pest and Diseases
58. An indicative survey to determine the extent and magnitude ofinfestations by stemborers and soil insects in maize is urgently needed.This survey should make an inventory of the entomological work undertakenso far in maize. As part of this survey, extension personnel should beinstructed in the identification and epidemiology of these major pests.Simple trials testing a limited number (3 to 4) of chemicals should beset up on the regional crop development centers and farmers' fields. Em-phasis should be given to granular or dust formulated insecticides thatare relatively easy to apply. Although chemical control may be feasiblefor some pest infestations, major emphasis in developing resistant varie-ties is still required for most maize diseases.
Improving Production Support Services
59. Improving research and the development of improved varieties canonly benefit the small farmer if the research is adapted to farmers' con-ditions, and the recommended improved technology can be packaged and dis-seminated to the farmer through improved supporting activities.
Adaptive Research
60. Adaptive research for local conditions is more important in theHills than in the Terai because of the higher variability in the former.Research in the Hills will be further supported by a UNDP Hill AgricultureDevelopment Project (pending government 's approval) through the establish-ment of a Hill Agricultural Development Center to coordinate and dissemi-nate information relevant to Hill agriculture. Decentralizing adaptiveresearch to the four development regions for each of the three ecologicalzones (Upper Hills or Mountains, Lower Hills and the Terai) can be done byselectively expanding and strengthening (both with staff and facilities)existing research stations or farms in most of the sub-regions into theplanned regional crop development centers. Testing of adapted varietiesand fertilizer rates could then be conducted simultaneously by these re-gional centers and by progressive farmers on demonstration plots (paras 46and 55).
ANNEX 3Page 17
61. At the district level, consideration should be given to selective-ly activating district coordination committees 1/ as a forum to discuss theappropriateness of distributing or testing improved production technology.Periodic crop conferences at the regional directorate level attended bydistrict level research and extension officers, farm leaders and villagecommittee mpmbers, would also be useful in assessing the effectiveness ofresearch recommendations.
Seed Supply
62. A National Seed Committee was formed in 1973 (with AMC and DA com-prising the key members) to: (a) decide on variety recommendations; (b) pre-pare the program for seed multiplication and (c) guarantee purity and qualityof multiplied and imported seeds (primarily foodgrain). AMC will be responsi-ble for the certified seed multiplication program, while seed inspection willbe handled by the Botany Section, DA at Kumaltar. With the UNDP/FAO-assistedseed processing plant being constructed in Hetaura and an FAQ seed specialistto be assigned there, seed testing should be transferred to Hetaura.
63. In view of AMC's limited capacity, timely negotiations should bestarted with TDC 2/ to supply the Nepalese Terai requirement of rice varie-ties like IR 8, Jaya, IR 24, IR 20, Patna and Ratna, wheat varieties likePR 21 (Sonalika), S 308, S 331 and Pitic 62, and selected oilseeds andpulses. Nepal will still have to provide its maize seeds countrywide; wheatand rice (particularly the "Japonica" varieties) seeds for the Hills; andrainfed rice varieties for the Terai. Expansion of local seed multiplica-tion capacity is therefore necessary. Where possible, breeder and founda-tion seed requirements should be obtained from UPAU. Despite the construc-tion of a seed processing plant in Hetaura, the needs of the Hill areas lessaccessible to Hetaura, requires an assessment of the feasibility of settingup regional multiplication centers attached to the regional crop developmentcenters proposed for extension and adaptive research (para 60).
64. An improvement of AMC's capacity to handle certified seed multi-plication is urgently needed. Selection and field supervision of contractgrowers remain the most important activity in seed multiplication. We re-commend the establishment of a Seeds Division in AMC to primarily undertake
1/ Comprising tne Secretary of tile Ministry of Food, Agriculture and Irri-gation (Chairman), the general manager of ADBN (coordinator), tile direc-tor generals of DA, DIiIM, and FAMSD, the general manager of AMC, taeRegistrar of Cooperatives, representatives of Ministry of Finance anda few advisors.
2/ If sufficient notice (at least one year) is given, TDC can provide therice varieties. It is questionable whether TDC has the export capacityfor certified wheat seeds.
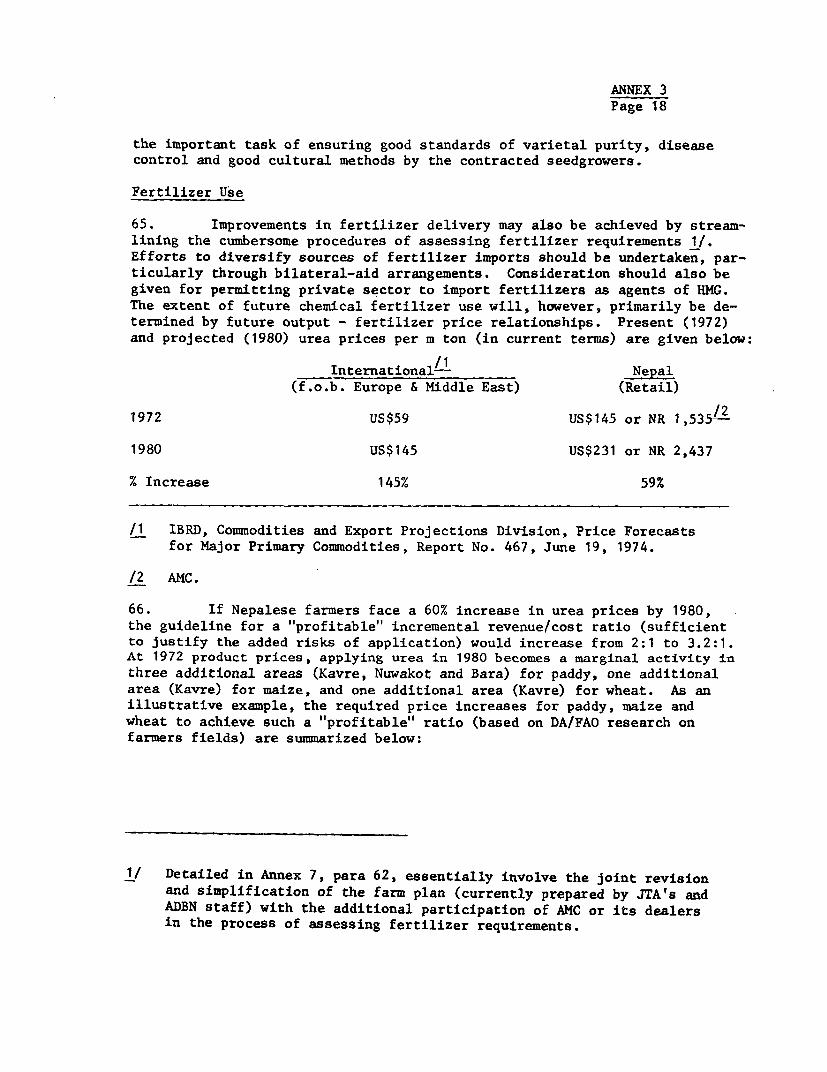
ANNEX 3Page 18
the important task of ensuring good standards of varietal purity, diseasecontrol and good cultural methods by the contracted seedgrowers.
Fertilizer Use
65. Improvements in fertilizer delivery may also be achieved by stream-lining the cumbersome procedures of assessing fertilizer requirements 1/.Efforts to diversify sources of fertilizer imports should be undertaken, par-ticularly through bilateral-aid arrangements. Consideration should also begiven for permitting private sector to import fertilizers as agents of HMG.The extent of future chemical fertilizer use will, however, primarily be de-termined by future output - fertilizer price relationships. Present (1972)and projected (1980) urea prices per m ton (in current terms) are given below:
International/ Nepal(f.o.b. Europe & Middle East) (Retail)
1972 US$59 US$145 or NR 1,535/
1980 US$145 US$231 or NR 2,437
% Increase 145% 59%
/1 IBRD, Commodities and Export Projections Division, Price Forecastsfor Major Primary Commodities, Report No. 467, June 19, 1974.
/2 AMC.
66. If Nepalese farmers face a 60% increase in urea prices by 1980,the guideline for a "profitable" incremental revenue/cost ratio (sufficientto justify the added risks of application) would increase from 2:1 to 3.2:1.At 1972 product prices, applying urea in 1980 becomes a marginal activity in
three additional areas (Kavre, Nuwakot and Bara) for paddy, one additionalarea (Kavre) for maize, and one additional area (Kavre) for wheat. As anillustrative example, the required price increases for paddy, maize andwheat to achieve such a "profitable" ratio (based on DA/FAO research onfarmers fields) are summarized below:
1/ Detailed in Annex 7, para 62, essentially involve the joint revisionand simplification of the farm plan (currently prepared by JTA's andADBN staff) with the additional participation of AMC or its dealersin the process of assessing fertilizer requirements.
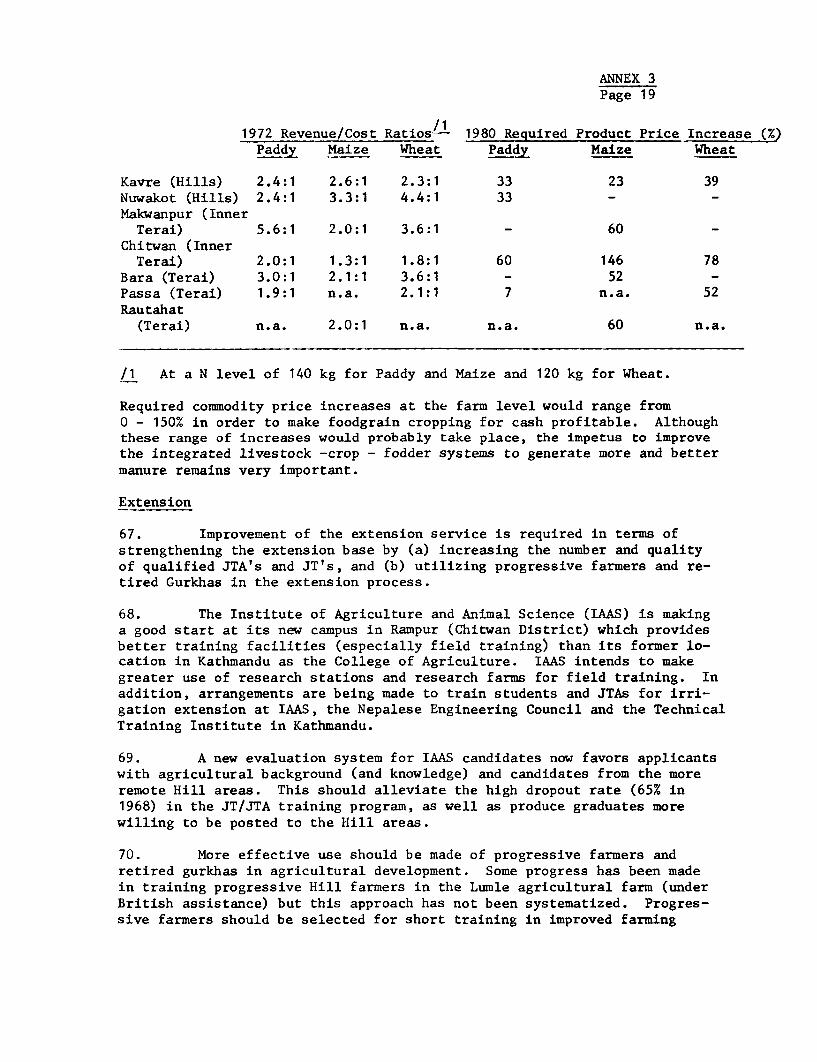
ANNEX 3Page 19
1972 Revenue/Cost Ratios/ 1980 Required Product Price Increase ()Paddy Maize Wheat Paddy Maize Wheat
Kavre (Hills) 2.4:1 2.6:1 2.3:1 33 23 39Nuwakot (Hills) 2.4:1 3.3:1 4.4:1 33 - -Makwanpur (Inner
Terai) 5.6:1 2.0:1 3.6:1 - 60 -Chitwan (Inner
Terai) 2.0:1 1.3:1 1.8:1 60 146 78Bara (Terai) 3.0:1 2.1:1 3.6:1 - 52 _Passa (Terai) 1.9:1 n.a. 2.1:1 7 n.a. 52Rautahat
(Terai) n.a. 2.0:1 n.a. n.a. 60 n.a.
/1 At a N level of 140 kg for Paddy and Maize and 120 kg for Wheat.
Required commodity price increases at the farm level would range from0 - 150% in order to make foodgrain cropping for cash profitable. Althoughthese range of increases would probably take place, the impetus to improvethe integrated livestock -crop - fodder systems to generate more and bettermanure remains very important.
Extension
67. Improvement of the extension service is required in terms ofstrengthening the extension base by (a) increasing the number and qualityof qualified JTA's and JT's, and (b) utilizing progressive farmers and re-tired Gurkhas in the extension process.
68. The Institute of Agriculture and Animal Science (IAAS) is makinga good start at its new campus in Rampur (Chitwan District) which providesbetter training facilities (especially field training) than its former lo-cation in Kathmandu as the College of Agriculture. IAAS intends to makegreater use of research stations and research farms for field training. Inaddition, arrangements are being made to train students and JTAs for irri-gation extension at IAAS, the Nepalese Engineering Council and the TechnicalTraining Institute in Kathmandu.
69. A new evaluation system for IAAS candidates now favors applicantswith agricultural background (and knowledge) and candidates from the moreremote Hill areas. This should alleviate the high dropout rate (65% in1968) in the JT/JTA training program, as well as produce graduates morewilling to be posted to the Hill areas.
70. More effective use should be made of progressive farmers andretired gurkhas in agricultural development. Some progress has been madein training progressive Hill farmers in the Lumle agricultural farm (underBritish assistance) but this approach has not been systematized. Progres-sive farmers should be selected for short training in improved farming
ANNEX 3Page 20
methods so that they can be engaged as village level extension workers("leader farmers") and be paid for their assistance in extension. Manygurkha army returnees trained in mechanical and agricultural skills areineligible to join government services because they are over the thirty-five year age limit set by the Public Service Commission. These rulesshould be changed but, in the meantime, alternative ways of using thisuntapped resource should be assessed. They could, for example, be usedas paid "leader farmers" and quasi-government corporations should be en-couraged to give priority to their recruitment.
71. In addition to greater use of research stations for training, amore viable link between agricultural research and extension requires animprovement of Nepal's agricultural information service.
D. PROJECT POSSIBILITIES
72. A comprehensive Seeds Development 1/ Project is proposed for for-eign financing. In addition to the breeding, multiplication and storage ofseeds, this project would support adaptive research to select improved seedvarieties suitable for various ecological zones and selected localities inthe Hills. The project would involve:
(a) infrastructure support for (i) the proposed cropdevelopment centers of DA and (ii) seed testing,storage and distribution facilities for improvedseeds to be distributed by AMC:
(b) technical assistance to improve the breeding andmultiplication program of DA and AMC respectively.
73. A study is required to: (i) review research and other availabledata on the most promising varieties of seeds in major production areas andHill valleys (including their deterioration under storage); (ii) review thepresent seed production, storage and distribution systems and their defects;and (iii) assess the regional seed requirements, and the need, feasibilityand possible location of seed multiplication and storage centers in additionto that in Hetaura.
74. A separate agricultural research framework study is also requiredto determine the framework for national crop/livestock and farming systemsresearch which would include the analysis of Nepal's agricultural research
1/ Although foodgrain seed development is the major activity, potatoes,oilseeds and fodder seeds should be included.

ANNEX 3Page 21
structure and research programs relevant to accelerating agricultural pro-duction. This study should lead to: (i) the preparation of a long-termmaster plan for foodgrain and other agricultural research, and (ii) recom-mendations on short and medium term emphases which can lend itself to in-corporation into proposed projects with large agricultural production com-ponents.
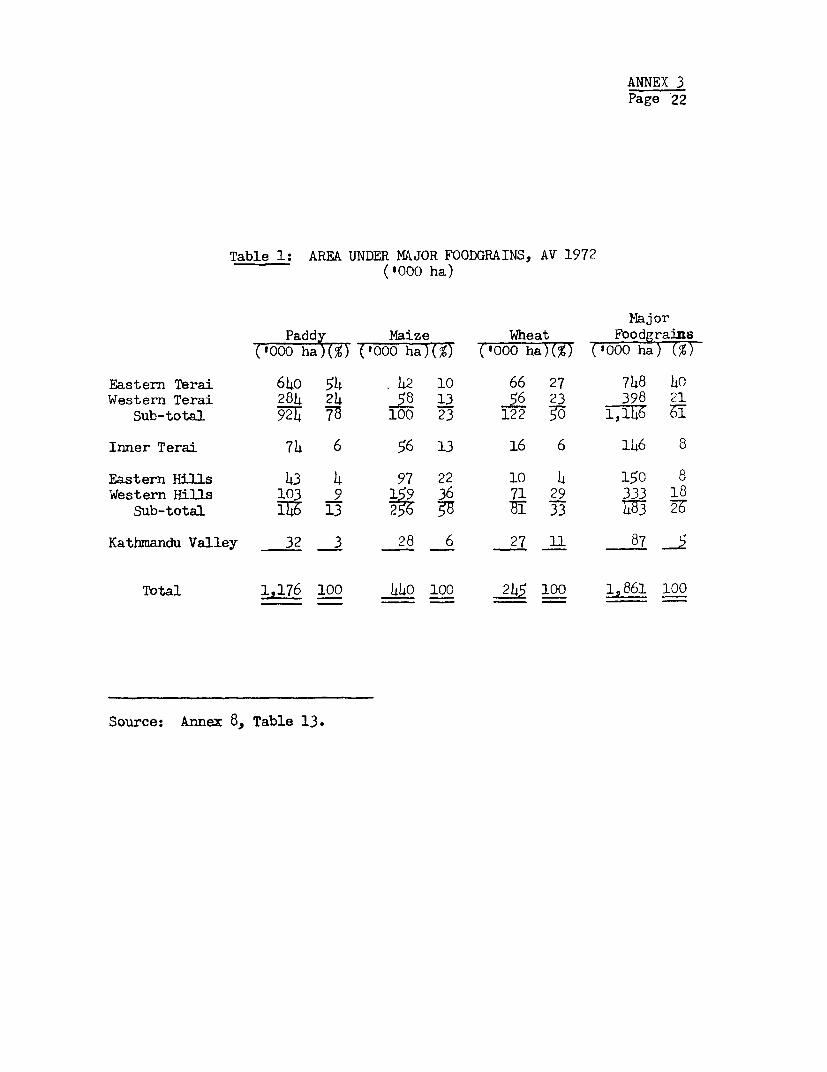
ANNEX 3Page 22
Table 1: AREA UNDER MAJOR FOODGRAINS, AV 1972('000 ha)
MajorPaddy Maize Wheat Fbodgrains
(1000 ha)(%) ('000 ha)(%) ('000 ha)(%) ('OO ha)(%)
Eastern Terai 640 54 . 42 10 66 27 748 hoWestern Terai 284 24 5p 13 56 23 398 21
Sub-total _92 78 100 23 122 3 0 ,1h6 SE
Inner Terai 74 6 56 13 16 6 146 8
Eastern Hills 43 4 97 22 10 4 150 8Western Hills 103 9 159 36 71 29 333 18
Sub-total T1 13 256 3B S T33 M3 7
Kathmandu Valley 32 3 28 6 27 11 87 _
Total 1,176 100 440 100 245 100 1861 100
Source: Annex 8, Table 13.
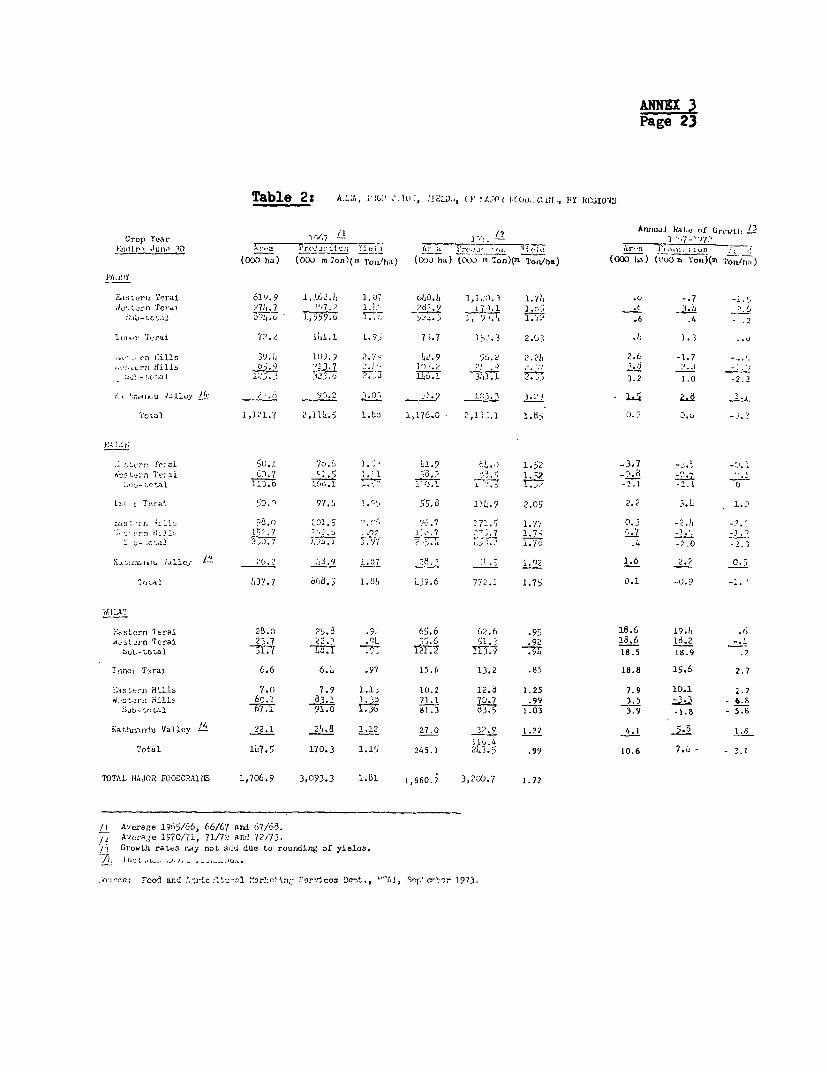
ANNII 3Page 23
Table 22 A L.1., (i' C. I(0. :.LD.., CP I.:O 1.(Oo.: c:l ., IrY M:fiONS
Crop Year I -7 L. [Anytual Ral.e Of Grc,wth .3Crop Ycax ~ ~ ~ ~ _______ 1 "77_3/ .- *''-'2'/2
71 r-AIv"1rJu?', 3 L,O ;r a Q:. : i' *
(0(Xt) ha) (0Do m 2on)(a lorvha) (>)J ha) (0t, . .on)(m Ton/h.) (oOD ha) (QuO ra Ton)Qar4 o'7J)
PA .Xl
Eastcrnl Terai 619.9 1,162.L 1.07 640.14 1, 1. 1 1.71) .0 -.7 _1.
LVc .crn Tc-<l ,~~~~~~7;,. 7 I'17.; .1. _' ,.9 1 7 r.1 1.'5.t1
l7.7 1,559.t. 1.;-. J, I, 2 1.r? .6 .4 9
l,,.- T,rai 72.2 ih1.i l.9i 9 7 7 15'3 2.03 .1. 1.3 .0
.A- rn 8i1ls 39.1, 1i13.3 2.7: )Lz. 9 5D. 2.21. 2.6 -1.7 -_
.. rrl Hi lls D j .9 1 3 2 * I 371.? 22.0 ."1. 2 .8 _.
- ,ct-alI 1,.>. .2 :i23. o 773 l.Thi.A .v 3.2 1.0 -2.2
.'/ r,,u 75-A Oll vy /14 7".( 97~.2 2.05 . _ 9 173 . 3.23 *& ll i 2
a I I 1,1. 7 2,11L.5 1.60 1,176.0 2,1i '1- 1.8j )? Dl
l50.1 7b.6 1.;' 11.9 ^l. 1.52 -3.7 -° -0tie5 rn te!ai [7/ t).7 .1 7 .? 3.5 1.:.2 - a '.7
!-:.ctal YY I -)D 77 61 W 2.1 -2. 1 0
Ii.: Terai 50.n 97.6 12. 55.d 11lj9 2.05 2.2 3.1, 1.>'
is s1.: 'kils 98.7 201 5 D i 27.7 171. 5 1.77 0.3 -7.1
-'r 'n 1r '. ' _ 3Hi. 7 ..7 1. 7 -*.. 3_ D - .C v d 1 2, .1. 7 i; 1 ,97 . u X > 3 -- 4 T- 2. 0 - .
XA Idle; 26.2 65l , e .9 1 8.-7 L1 . 1. 2 9 Q2 1.6 2.? 0.5
i,37.7 bo.d 1 1.W! L39.6 772. 1.75 0.1 -0.9 -.
F.,stern Terai 2B.0 25. 8 9 65.6 62.6 .95 18.6 19.. .6
.i,strn Terai 23.7 22.' '1L ,.6 S1. .92 18.6 18.2 -.L
"It-total L Q.1 72T:t 7 Y 7 TM I IXI 18. 5 1 89 .2
Irtnmi Tsrai 6.6 6. .97 15.6 13.2 .85 18.8 15.6 2.7
;as.e-n Htlls 7.0 7.9 1.1, 10.2 12.8 1.25 7.9 10.1 2
J_2tCP4I Hills 60.1 83.1 1.3 71.1 7 .99 3.5 3 - 6.S
.u4. t tl. ' 67.1 91.0 1. 8.3 3 1.03 3.9 -1.8 - 5.6
6atlu;sr.Au Valley L 22.1 2!,8 1.12 27.0 3?.9 1.22 4.1 5-. I5
1 1G.4Total 1L7.5 170.3 1.1S 245.1 21.3.5 .99 10.6 7.- - -3.
TOTAL. MIAJOR FOODCRAI1S 1,706.9 3,093.3 1.81 1,860.7 3,200.7 1. 72
/I Average 1965/66, 66/67 ard 67/68./ Average 1970/71, 71/72 and 72/73.75 Growth rates may not add due to rounding of yielaos.
.-A 9 ici-to ar. -,i cl, a,1
Ftre ood ar.d .. lc't-l"rlct-roriccs Dent., 'lI,! S,rm':-r 1973.
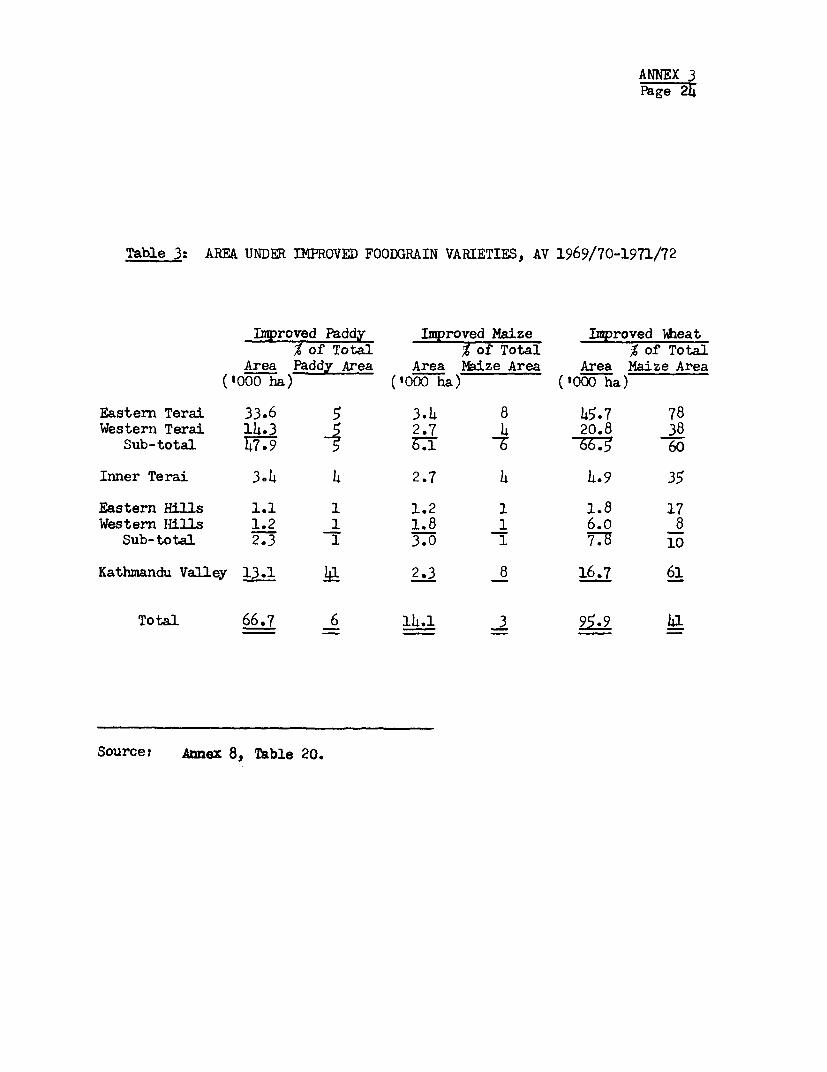
ANNEX 3Page 24
Table 3: AREA UNDER IMPROVED FOODGRAIN VARIETIES, AV 1969/70-1971/72
Improved Paddy Improved Maize Improved Aeat% of Total % of Total % of Total
Area Paddy Area Area Maize Area Area Maize Area('o0o ha) ('000 ha) ('000 ha)
Eastern Terai 33.6 5 3.4 8 45.7 78Western Terai 14.3 2.7 4 20.8 38
Sub-total 5 7.9 T. 66.5 60
Inner Terai 304 4 2.7 4 4.9 35
Eastern Hills 1.1 1 1.2 1 1.8 17Western Hills 1.2 1 1.8 1 6.o 8
Sub-total 2.3 1 3.0 1 7-T 10
Kathmandu Valley 13.1 41 2.3 8 16.7 61
Total 66.7 6 14.1 3 95.9 41
Source: Annex 8, Table 20.
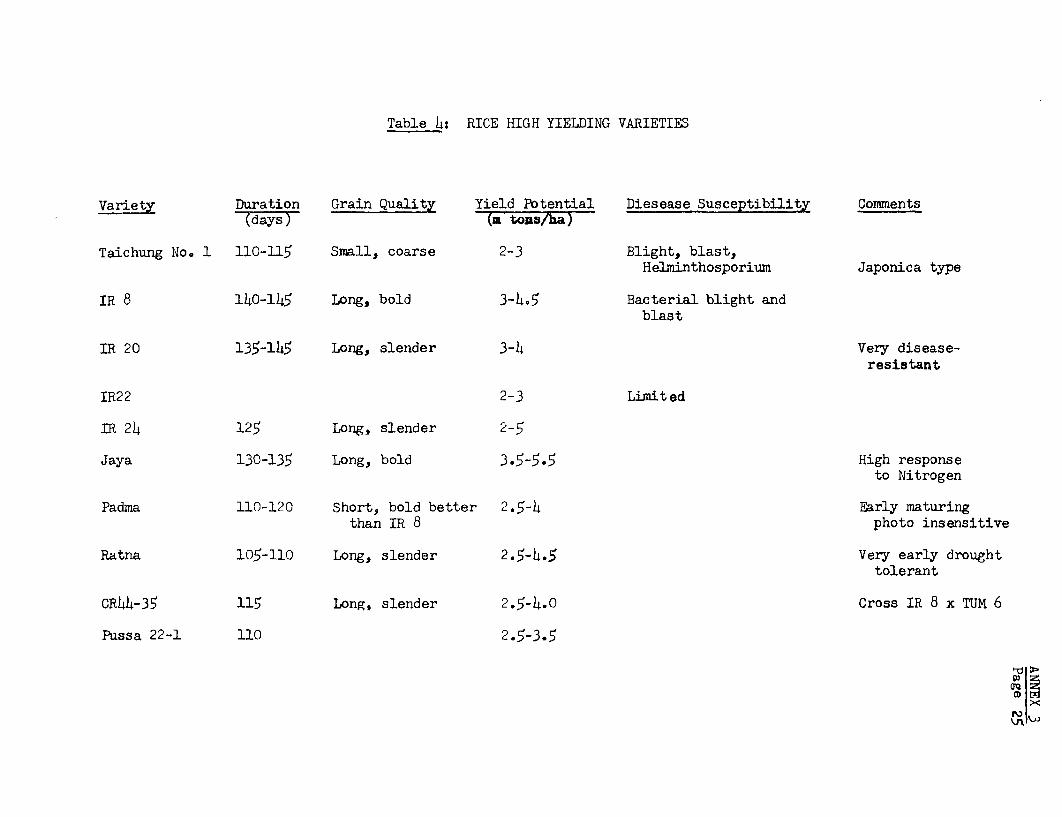
Table 4: RICE HIGH YIELDING VARIETIES
Variety Duration Grain Quality Yield Potential Diesease Susceptibility Comments(days) (m tona/ha)3
Taichung No. 1 110-115 Small, coarse 2-3 Blight, blast,Helminthosporium Japonica type
IR 8 140-145 Long, bold 3-4.5 Bacterial blight andblast
IR 20 135-145 Long, slender 3-4 Very disease-resistant
IR22 2-3 Limited
IR 24 125 Long, slender 2-5
Jaya 130-135 Long, bold 3.5-5.5 High responseto Nitrogen
Padma 110-120 Short, bold better 2.5-4 Early maturingthan IR 8 photo insensitive
Ratna 105-110 Long, slender 2.5-4.5 Very early droughttolerant
CR44-35 115 Long, slender 2.5-4.0 Cross IR 8 x TUM 6
Passa 22-1 110 2.5-3.5
CD
PO VIx
ANNEX 3Appendix 1Page 1
FOODGRAIN CROPPING PRACTICES
Terai
1. During the main (monsoon) season paddy is the predominant crop,consisting usually of the long duration varieties (more than 130 days)planted in May-June and harvested in September-October. Grown mainly oninundated areas near rivers, land prepration consists of plowing (3-4 times)and crossplowing by bullocks and planking the land for breaking and level-ing the large clods. Local manures are applied during the plowing opera-tions usually 2-3 cartloads (2-3 tons) per ha. Chemical fertilizer use isstill very limited consisting mainly of nitrogenous fertilizer. Seedlingsare raised on nursery beds, or more often on levelled and well preparedland. On the onset of the monsoon rain, the field is puddled for trans-planting. The first weeding is carried out 3-4 weeks after transplantingand the 2nd weeding 8 weeks. Estimates for mandays spent of weeding varyfrom 10-30 mandays per ha.
2. In areas with water control, double cropping of paddy is practicedwith a 100-110 day duration rice crop planted in April-May and harvested inearly August. Cropping practices are similar except land preparation startin March-April. For the second paddy crop, land preparation takes place inearly August, usually consisting of not more than 2 plowings followed byplanking. Harvesting takes place at the end of October.
3. Maize planting in the Terai takes place in May-June on the higherfree-draining lands. The land is ploughed several times and the seed iseither broadcast or dibbled in the furrow. Seedrates are high, usuallyaround 20 kg/ha. When the seed is dibbled in lines, the seed is spaced at4-5 cm. The initial plant populations are 50-60,000 plants/ha. Usuallymaize receives most of the farmyard manure produced on the farm. This canvary from 5-10 tons/ha but depends on the number of farm animals per house-hold, and local manure availability.
4. Field preparation for wheat consists mainly of plowing the maizeor rice stubble land once or twice and broadcasting the seed on the roughtilth at rates varying between 60-100 kg/ha. Little weeding is done. Farm-yard manure is applied, if it is available, at variable rates.
5. In the Western Terai, where only one rice crop is grown, thefield preparation and planting dates are usually one month later than inthe Eastern Terai. Difficulty may be experienced in sowing the wheat ontime if the monsoon starts late, which delays the planting and harvestingof rice.
ANNEX 3Appendix 1Page 2
Hill Valleys
6. In Kathmandu Valley little animal plowing is done for rice. Soiltillage is usually by means of a hoe throwing up ridges of 1-2 feet wide onwhich the seedlings are transplanted.
7. Seedlings are grown on raised nursery beds. In the case of rain-fed paddies on which the water is retained by bunding and terracing, trans-planting is done in July. Very oftern farmers try to grow an early maizecrop before rice if the rains come early in April. Much labor is put intoland preparation, transplanting and weeding in the Hills (average 190 man-days in the Hills compared with 100 mandays in the Terai). Chemical fertil-izers are still little used outside Kathmandu Valley. Terraced irrigationis commonly practiced in the Hills. Most of this is a "water retention"type irrigation with the water flowing from the higher to the lower fields.Where possible, farmers construct simple local diversion structures to bringsupplementary irrigation water to their fields.
8. Wheat is sown mainly in the Terai and Valleys in October - November.It takes about 180-200 days to mature. Soil preparation consists of 1 or 2plowings at the most and the wheat is broadcast at a seedrate of 80-100 kg/ha.Little or no weeding is carried out. Occasionally barley or peas might begrown instead of wheat.
Hill Slopes
9. On the hill slopes maize is often grown as a mixed crop eitherwith soybean or other pulses sown simultaneously, or with finger-milletseedlings that are transplanted in July-August when the maize crop is stillstanding in the field. This interplanting is possible because the originalplant population will often be naturally thinned out to 20,000-25,000 plantsper ha by heavy insect attacks. The ripening period of maize depends on al-titude, rainfall and varieties but is usually in the range of 90-120 days inthe hills. Land preparation consists of manure spreading and intensive bul-lock plowing during the month of February. Maize planting starts in mid-February in the Upper Hills and up to the end of March or April in the LowerHills and Kathmandu Valley, depending upon the weather and elevation. Theharvested maize is usually stored on the cob by tying the cobs to a pole.Maize is followed bv either millet planted in July-August or wheat or mus-tard sown in October-November. In the Upper Hills wheat is sown as a secondcrop as early as September and October and takes longer to mature than in theLower Hills. Potatoes may be planted instead of wheat particularly in theEastern Hills.
ANNEX 3Appendix 2Page 1
RESEARCH RESULTS FOR FOODGRAINS
Rice
1. The present rice research program comprises: (a) introduction,selection and breeding of new varieties; and (b) field testing of selectedvarieties (primarily in the form of fertilizer trials), disease and pestsusceptibility, and planting dates.
2. New Varieties. This activity is closely linked with IRRI. Theprogram receives F4 and F5 lines of promising new IRRI crosses for selec-tion under local conditions and participates in the International BlastNursery, and Cooperative Variety Trials. In 1972, about 150 local varie-ties were selected for evaluating performances in yield, plant type, durationand grain characteristics. These varieties are being tested and evaluatedboth at Parwanipur and at IRRI. DA also maintains contact with the All IndiaCoordinated Rice Improvement Program at Hydrabad and with Uttar Pradesh Agri-cultural University (UPAU) at Patnagar, India for the supply of new varie-ties for breeding. These trials have resulted in the release of IR400 asParwanipur 1 for irrigated areas and areas with high water-table and lesspermeable soils in the Terai and Inner Terai. Extensive trials for recom-mendation to areas other than those corresponding to Parwanipur conditionshas yet to be undertaken.
3. Variety Tests. The IRRI varieties recommended for the Terai andInner Terai (IR 8, IR 5, IR 20), although with a potential for high yields,have three main limitations compared with local varieties:
(a) longer maturation which limits performance andprevents double cropping with late monsoon;
(b) susceptibility to bacterial blight disease;
(c) lower straw yields.
4. Sowing date experiments 1/ with improved varieties showed highyields with early sowing, but sharply reduced yields with later sowingsas shown below:
1/ Based on data in Annual Report No. 2 (1970/71) on Hardinath PilotDemonstration Farm, Sun Kosi Terai Project, Nippon Koei Co. Ltd.
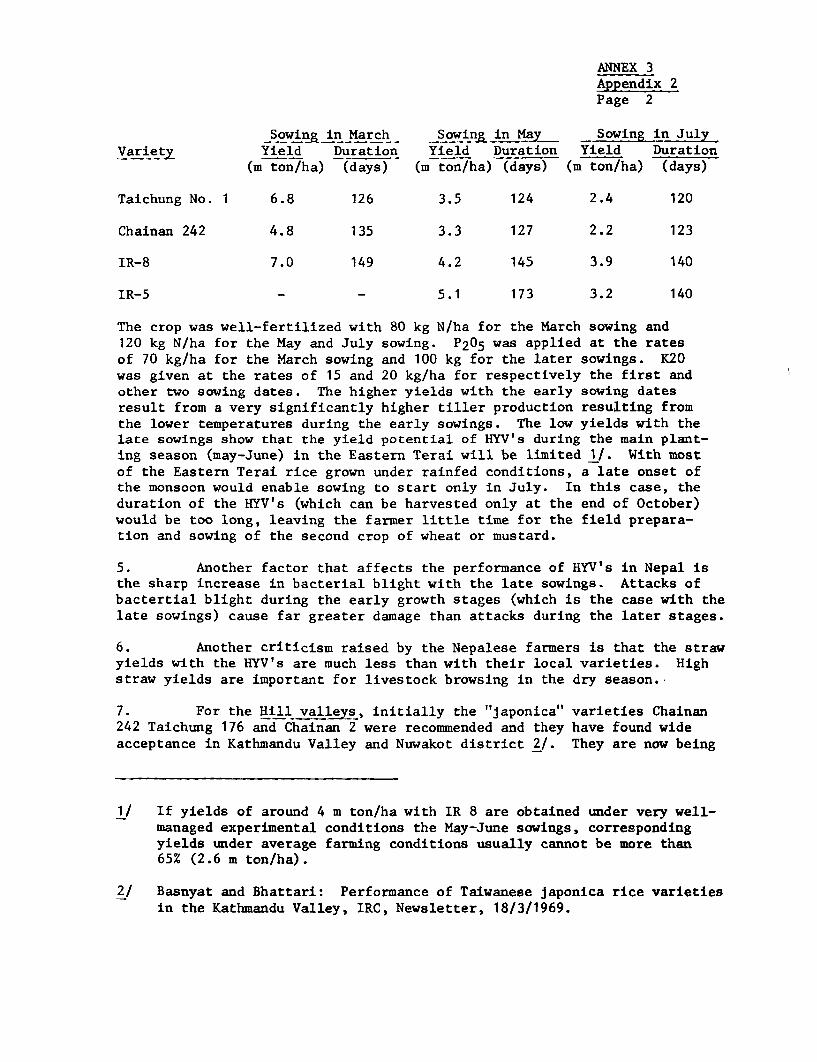
ANNEX 3Appendix 2Page 2
_Sowing in March Sowin in Sowing in JulyVariet Yield Duration Yield Duration Yield Duration
(m ton/ha) (days) (m ton/ha) (days) (m ton/ha) (days)
Taichung No. 1 6.8 126 3.5 124 2.4 120
Chainan 242 4.8 135 3.3 127 2.2 123
IR-8 7.0 149 4.2 145 3.9 140
IR-5 - - 5.1 173 3.2 140
The crop was well-fertilized with 80 kg N/ha for the March sowing and120 kg N/ha for the May and July sowing. P2 05 was applied at the ratesof 70 kg/ha for the March sowing and 100 kg for the later sowings. K20was given at the rates of 15 and 20 kg/ha for respectively the first andother two sowing dates. The higher yields with the early sowing datesresult from a very significantly higher tiller production resulting fromthe lower temperatures during the early sowings. The low yields with thelate sowings show that the yield potential of HYV's during the main plant-ing season (may-June) in the Eastern Terai will be limited 1/. With mostof the Eastern Terai rice grown under rainfed conditions, a late onset ofthe monsoon would enable sowing to start only in July. In this case, theduration of the HYV's (which can be harvested only at the end of October)would be too long, leaving the farmer little time for the field prepara-tion and sowing of the second crop of wheat or mustard.
5. Another factor that affects the performance of HYV's in Nepal isthe sharp increase in bacterial blight with the late sowings. Attacks ofbactertial blight during the early growth stages (which is the case with thelate sowings) cause far greater damage than attacks during the later stages.
6. Another criticism raised by the Nepalese farmers is that the strawyields with the HYV's are much less than with their local varieties. Highstraw yields are important for livestock browsing in the dry season.
7. For the Hill val , initially the "Japonica" varieties Chainan242 Taichung 176 and Chainan 2 were recommended and they have found wideacceptance in Kathmandu Valley and Nuwakot district 2/. They are now being
1/ If yields of around 4 m ton/ha with IR 8 are obtained under very well-managed experimental conditions the May-June sowings, correspondingyields under average farming conditions usually cannot be more than65% (2.6 m ton/ha).
2/ Basnyat and Bhattari: Performance of Taiwanese japonica rice varietiesin the Kathmandu Valley, IRC, Newsletter, 18/3/1969.
ANNEX 3Appendix 2Page 3
replaced by newer "japonica" releases Chainan 1, Taichung 75 and IR 20. The"Japonica'" varieties, however, require high fertilizer levels for optimalperformance and appear to be susceptible to nematodes, Relminthosporium,false smut and blast 1/. Their duration makes them suited for either double-cropping or a maize-rice-wheat rotation as is often practiced. In general,under well fertilized conditions, they can outyield local short duration var-ieties by 80-100%. However, trials on farmers fields conducted in the Gandakizone 2/ with local and recommended "Japonica" varieties highlighted two dis-advantages of the new "Japonica" varieties:
(a) Performance was variable. There were places where oneimproved variety proved to be greatly superior to others,while in other places local varieties did much better.Micro-climate and soil conditions vary considerably inthe hill valleys and the range of improved varieties wasprobably not wide enough to suit local conditions.
(b) The improved varieties generally demand a higherstandard of cultivation and plant protection. Beingearlier maturing they are more prone to heavy attacksby insects and birds than local varieties.
8. The research program at Parwanipur has made crosses of IRRIvarieties with selected local hill varieties of which the F5 and F6 gen--erations look very promising. It is expected within 2 years time a num-ber of high yielding varieties with local adaptability will be availablefor extensive field testing and may be released in five years. Meanwhile,the "japonica" varieties and IR 20 are the only improved varieties avail-able for the Hills.
9. Fertilizer Trials with IR8 conducted in the Eastern Terai 3/over 2 years during the monsoon season showed that 120 kg N/ha and 60 kg P 0P205 raised yields by about 1500 kg paddy over the unfertilized plot yields(2,400 kg/ha). The efficiency of N was 12.5 kg paddy/ha N.
10. Two-year results with IR 20 on farmers' fields in six districtsconducted by DA/FAO 4/ showed linear response up to 140 kg N/ha, significant
1/ Verbal information by Dr. Sai, Rice Coordinator, DA.
2/ Source: Nepalese - German Gandaki Agricultural Development Project,1969-1971.
3/ Sun Kosi Terai Project, Nippon Koei, Ltd.
4/ Source: P. Y. C. Damen: Preliminary Statistical and EconomicalAnalysis of Fertilizer Experiments on Paddy, Maize and Wheat (in-terim report UNDP/FAO-NEP 70/512) Verbal information by FAQ team.
ANNEX 3Appendix 2Page 4
response with moderate application (50 kg) of P205 and slight but no signif-icant increases from K20 applications. The response curves and N efficienciesfound in the various experiments are shown in Figure 2. Nitrogen efficienciesranged from 10-28 kg paddy per kg of N.
11. Local varieties appear to respond well to medium N-applicationin the hills. Fertilizer demonstrations with local varieties conducted in4 districts of the Gandaki zone 1/ demonstrated that yields of 4.8 m ton/hacould be obtained with application of 40 kg N and 30 kg P205 per ha comparedwith yields of 3.6 m ton/ha on non-fertilized plots.
Maize
12. Maize research is being conducted in the following locations,corresponding to lower altitudes (Terai and Inner Terai), mid altitudes(Lower Hills) and high altitudes (Upper Hills):
Low-altitude - Rampur, Parwanipur, Janakpur,Nepalganj, Doti, Sarlahi
Mid-altitude - Kumaltar, Khairamitar, Dhankuta, Surhet
High-altitude - Kakani, Jiri, Jumla, Daman and Palpa.
Most of the breeding and selection work will continue to be undertaken atRampur, Kumaltar and Kakani while other stations will mainly be used forvariety testing. The programme has received much technical assistancefrom USAID in the form of material and personnel (including a CIMMYT maizespecialist assigned to assist the program and particularly to introduce anddevelop high lysine maize varieties).
13. Results of two years of fertilizer experiments on farmers fieldswith local improved varieties (mainly Kumaltar yellow and Rampur yellow)conducted in six districts showed 2/ generally linear responses up to 140 kgN/ha although the slope of the response curves showed considerable variationfrom one district to the other (Figure 3). Yield increment above 140 kg N/hawas usually smaller. In most locations, responses to applications of P205ranged from 35 to 90 kg/ha with exception of Chitwan where no response wasfound. Responses to about 30 kg K20 occurred in three districts.
1/ Gandaki Project, 1969-71, op. cit.
2/ Damen, op. cit.,
ANNEX 3Appendix 2Page 5
14. Experiments in the high altitude Kakani farm showed increasedKakani Yellow yields of about 83% (with 40 kg N, 40 kg P2 05 and 40 kg K20)above unfertilized yields (1971/72). 1/ Higher N. P, and K levels did notproduce significantly higher yields.
15. Fertilizer demonstrations with a 60-60-0 (N-P-K) in some 50 vil-lages in two hill districts in the Gandaki zone 2/ showed the followingresponses:
Minimum Maximum Average
Yields without fertilizer (kg/ha) 1540 2800 2100
Yields with fertilizer (kg/ha) 2800 4900 4060
The mean increase in yield from applying fertilizer with manure (at farmerstraditional rates) was 85.3% (100 demonstrations). Preliminary trials alsoshowed that 16 tons cow manure alone increased the yield about 2.5 timesover the unmanured control.
16. Little research has been undertaken in chemical control of stem-borers, despite problems with this pest in Hill areas. Chemical controlwith DDT, BHC or carbaryl has been found to be very effective in India andcan result in yield increases of 100-250%. 3/
17. In addition to these results obtained from India, there aresufficient indications that insecticide application in Nepal can resultin large yield increases. Maize grown in the winter season with lowincidence of pests and diseases nearly doubled its yield. 4/ Controlyields in fertilizer experiments in Terai and Inner-Terai where insecti-cides were applied were considerably higher than the average yields. 5/
1/ Source: G. P. Deo, Effect of Different Combinations of NPK fertilizerson the Grain Yield of Maize under Kakani (Hill) Condition, Crop ScienceConference 1973, Lalitpur.
2/ Gandaki Project, 1969-71, op. cit.
3/ J. H. Stapley & F. C. H. Gayner, World Crop Protection Vol. 1, Pestsand Diseases, London 1969. M. G. J. Jotwani & W. R. Young, Sorghuminsect control in India, World Farming 13 (9) 1971 D. B. Reddy, PlantProtection in India, Bombay, 1968.
4/ Source: Verbal information Maize Coordinator, DA; Development Potentialof the Nawalparasi Area of Nepal, Foreign Comm. Overseas Dev. Adminis-tration, 1972.
5/ Damen (1970/71), op. cit.
ANNEX 3Appendix 2Page 6
With the present prices of insecticides and maize (both at (about 1 Rs/kg)the costs of insecticides application can be covered by a yield increaseof 7-10% from the present average (150-200 kg/ha). 1/ Dusting with DDT 5%dust (in the leaf sheath) would probably be the most suitable way to con-trol stemborers since it does not require any equipment on the part offarmers.
18. Soil insects like army and cutworms are the major pest at higherelevations and may cause heavy damage in the hills. They can also be con-trolled quite effectively with products like DDT, BHC, clordane and aldrin. 2/The problem with these pests is that one cannot forecast the timing and ex-tent of their attacks. Preventive spraying under Nepalese conditions should,therefore, not be recommended.
Wheat
19. Results obtairked with variety trials conducted at the HardinathPilot Farm 3/ showed the following yields:
Variety Local Lerma Rojo 64 Ssnora 64 S 227 Pitic 62 Ciano C 306
Yield (mtons/ha) 1.88 3.79 3.55 4.55 3.82 4.10 3.80
S 227 gave the highest yield followed by Ciano, Pitic 62, Lerma Rojo 64 andC 306. C 306 lodged heavily when fertilized and Sonara 64 proved susceptibleto smut. In other trials, RR 21 (Sonalika) and S 227 showed highest yieldsof respectively 4.27 and 4.04 m ton/ha. The superior performance of S 224Lerma Rojo 64 and Sonalika was confirmed in a coordinated variety trial withDA.
20. Fertilizer experiments conducted at Hardinath Farm 4/ with the var-iety S 227 showed the following results:
1/ For instance three rounds of dusting with BHC dust 5% at 40 kg/ha whichprovides an effective control of Chilo zonellus would cost about 120 Rsin materials. D. B. Reddy, Plant Protection in India, Bombay, 1968;M. G. Jotwani & W. R. Young, Sorghum insect control in India, WorldFarming 13 (9) 1971.
2/ J. H. Stapley & F. C. H. World Crop Protection Vol. 1, Pest and Diseases,London 1969; T. K. Mukundan Plant Protection Principles and Practices.
3/ Nippon Koei, Hardinath 1970/71, op. cit.
4/ Ibid.
ANNEX 3Appendix 2Page 7
Nutrient Rates Yield(kg/ha) (m ton/ha)
nil 0.83
10ON - 70P - OK 3.43
10ON - OP - 30K 2.72
ON - 70P - 30K 1.19
10ON - 70P - 30K 3.61
The experiments also showed that the standard dose of fertilizers necessaryto obtain a target yield of 3.0 m ton/ha was 120 kg N/ha, 45 kg P205/ha and7 kg K20/ha. Results with various N and P rates indicated that adequateP205 was essential for N response and that 100 kg N/ha and 60 kg P205 wasthe most economic rate. With 60 kg P205/ha the N response was linear (11.8kg wheat per kg N applied).
21. The results of the DA/FAO fertilizer trials with the wheat varietyS 331 broadcast at a seed rate of 120 kg/ha and conducted on non-irrigatedfarmers fields 1/ showed general linear responses up to the maximum N rateof 120 kg/ha (see Fig. 4). The response to P205 varied with location althoughin the majority response diminished above 60 kg/ha. The availability of soilphosphate and the response to applied P205 appears to be dependent on the soilacidity and the subsequent phosphate fixation. 2/ Responses to applied K20did not increase yields significantly above 40 kZg/ha. The N efficienciesexpressed as kg wheat produced per added kg N (fig. 4) vary considerably andare influenced by the organic matter and nitrogen content of the soils. Inthe case of Kavre (Kathmandu Valley) and Chitwan the values are low becausein both locations the soil N supply is quite adequate. 3/
Range of Fertilizer Requirements
22. A perusal of the limited fertilizer research results allows thefollowing generalizations on the range of fertilizer requirements for themajor foodgrains in Nepal: (a) 40-60 kg P205/ha; (b) 0-40 kg K20/ha; and
1/ Ibid.
2/ R. K. Sharma & H. C. Dewan: Chemical Characteristics of Soils and TheirResponses to Added Fertilizers under Wheat (interim paper 1973).
3/ Ibid.
ANNEX 3Appendix 2Page 8
(c) Nitrogen requirements vary widely with the ecological zones and thecrop (40-180 kg/ha). A more precise figure can be worked from simple testplots in farmers' fields. 1/
23. These ranges compare favorably with the official rates of fer-tilizer recommendations (as shown below) with the exception that in cer-tain areas nitrogen requirements may be significantly higher and K20 re-quirements much lower.
N P205 K20
-------------(kg/ha)--------------
Paddy Terai 80-100 40-60 30-40Hills 40- 60 30-40 20-30
Maize/ 120 80 40
/1Wheat-/ 80-100 40-60 30-40
Sources: /1 DADO's visited by the Mission.
/2 Maize Coordinator, DA (Personal communication).
1/ Various levels of sophistication could be used. Under present condi-tions in Nepal, nitrogen requirements can be assessed by taking aver-age zonal yields as receiving negligible nitrogen. The expected yieldincreases can be calculated by applying the estimated nitrogen effi-ciencies which have been generally found (DA/FAO) to be linear up to70 kg N. Based on actual and projected farmgate prices, revenue costratios may then be obtained.
M -I ii ORGANIZATION OF THE MINISTRY OF FOOD. AGRICULTURE & IRRIGATION
EVALUATIO
PLANNING P.OJ.CTs~~~~~~~~~~~~~~~~~~~~~FOJCSDLSI IVSO
JMNT BLICAFTA~~~~~~~~~~~~~~!' z-.;a~~~~~~~~~ F- DIVMO~~~~~~~~~ ~~~INTSECREIARIJONTSEREARADVISERS ~ ~ ~ ~ ~~~~~~~flTSECRETARY
DEPARWENT OF AGRICULTI~~~~RE. DEPARTMIENT aFIROTO DEPARTMEN, OF FOOD DO EOTMN PROSOEINDEPARTMENT OF AGRICULTURE_ HYDRO -METnOROLCGY DEPARNRENT IOF RE
SINSCIOR GENERA ~~~~~~~~~~~~~DIRECTOR OFRERAL DIEC7OR GENERAL
CROP RSESARCH DIVISION IDEPUTY DIRECTOR GENERAL HYORO -MEEOROLOY DIVISION FOOD RESEAROD DVISIOPI
AGRONIOMY SECTION [ ROTOMOLOGY SEnONDEPUTY DIRECTOR DENEDAL CHIEF RESEARCH OFFICEARAaRON04 Y sECTION ENTGMDLOGY sEcmoN ~ ~ ~ ~ ~ ~ ~ ~ ~ ~ ~ ~ ~ ~ ~ ~ ~ ~ ~~~~~ECIO
BOTANYSECTION SS. "ENCESECTON HYDROLOGY BECON QUALITYGONTROSCCTIDVEGETA BE DGV DECTON COORDINATROCROP OROLOGY EcTRITION RESAR SECTIN
FRIPLAN OIN j O NIREIGSCTPMATEROLOGGYECTONCT OOD RECS-ML .SECTIONPLANT PATSOIOGY SECT S DEVELOPMENT PROGR. FOOD TESTING LABORATORY
ANIMAL RESEARCH DIVISION IRRIGATION PLANNING A DESIGN DIVISION MARKETING SERVICES OIVISIONOEPLTY DIRECTOR GENERAL DEPUTY DIRECVOA GENERAL CHIEF MARKETING OFFICER
MINOR LIVESTOCK SECT, CENTRAL zoo PROJECTS SECLON I MARKET1NO ANALYSIS S DEVELOPMENT SECrIONVETERIN ARY SECTION IFEAZSIBLITY ETU ESSSeCTION F OGOSDIT0AT N ANALDIOECTION
AGHO ENINN TANN DIVISION' EIIETO AGR STATISTICS DIVISOR,
DEPUTY Dlqf.CrOR GENERAL lRArGjio coNsTRucTloN olVISIo. CHIE AGR 7STCAIS >CIA.ODEPUTY DIREcToR GENERAL
ASR EXTENSION SECT RURAL VYGTr SECTION CROP STATISTICS SEFCTROAHOR INFORMATION SECT.TER ANIMA STATISTICSSECTION
ACR lNFoRMATnoNEECT I ATEE USECTION STATISTIC METOMCS N ANALYSIS SECTION
PLANNING N ADMAINISTRATION DIVISIONDEPUrY DIRECTOR GENERAL' ECONOMIC ANALYSID DISISION
ADMINISTRATION SECTION CHIEF AGR ECONDMIST
PLANNINGJEVALUATION SECTION, FINANCIAL SECTON PRODUCTION ECONOSIC SECTIONA.MIN. SECTION RUC ECONDMICS SECTION
_9. AOfNwSDRATnON SECTION
REGIONAL I RiSiRIAL REGIONAL ROEGIOAL REGIONAL REGIONAL REGIONAL REDIONALDIRECTORATE DIRECTORATE DIRECTORATE 0GRCCTORATE DIRECTORATE DlRECToRATE DIRECTORATE DIRECTORATE
LURKHET POXHARA KATHMANOU OHANKUTA SARKHAT POKHARA KATHMANDO DRANAUTAREO DIRECTOR RAG. DIRECTOR REG DIRRECTOR RED DIRECTOR R T E. DIRECTOR RED DRECT REG DIRECTOR( AGRICULTURE AoRlCULTuRE AGRICUTLURE AGRICULTURE IRRIGATION IRRIGATION IRRIGATION IRRIGATION
DAIRY DEVELOPNENT CUAPORaTION |GVICULTIURE ..RKETINGCORPORATION AGRICULTURE OE.ELOP-ENV SANK NEPAL REDEYLECMERYOMPASY
GENERALMANAGER GENERAL MANAGER H GNNERALAANA(R
1RANCA MANAGERS BRANCH MANAGERS SRANCH MANAGERS
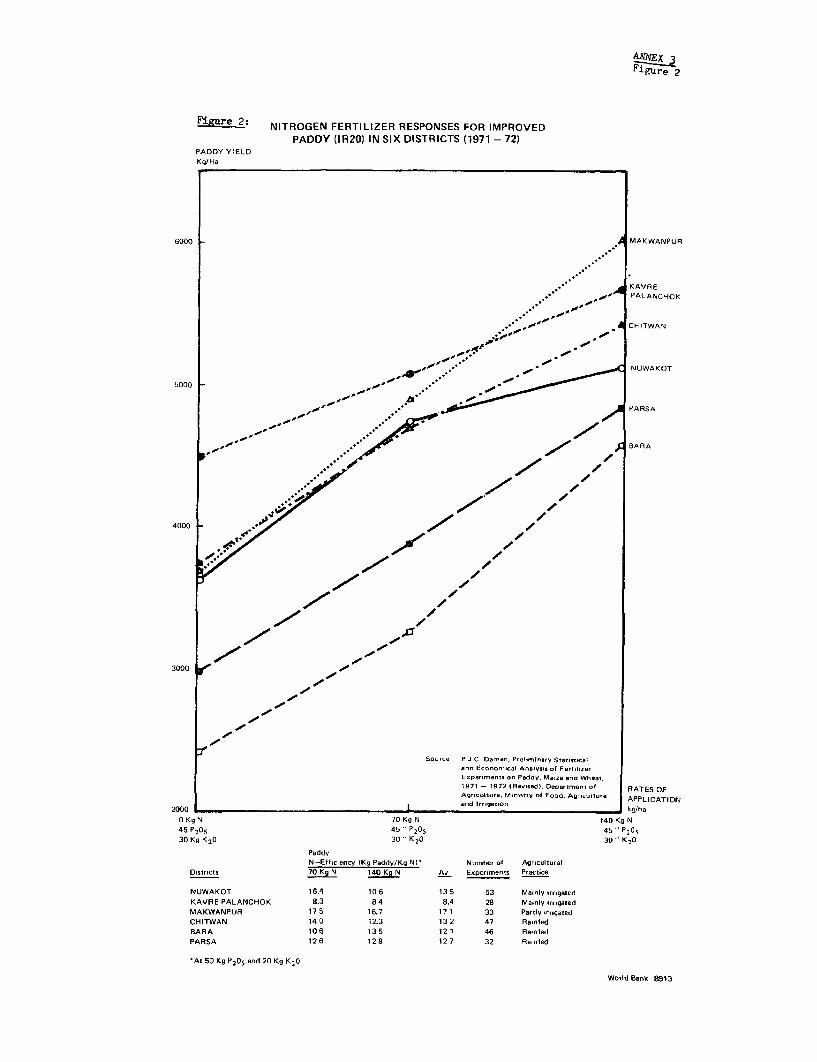
Figure 2
FiL'ure 2: NITROGEN FERTILIZER RESPONSES FOR IMPROVEDPADDY (IR20) IN SIX DISTRICTS (1971 - 72)
PADDY YIELD
Kg/Ha
6000 A MAKWANPUR
KAVRE--- PALANCHOK
* a' ~~~~CHITViAN
5000 a /- NUVVAKOT
3000 --
/////~~~~~~00~~~~~~~~-
S-ur- P J C Damen, P-el-i-av Stat.vt.caland EcnmclA..Iy,., of F.mtl.-erE.P.riments .- PeddY. M.- te ad Wh-at,l971 - t972 Hei R-edJE D.p.,".-n of RATES OF
2000 -gdutr 51nsr fFod eeutr kg/ha
O Kg N 70 Kg N 140 Kg N
45 P205 45 '' P205 45 - P2O5
30 Kg K20 30 - K20 30 '' K20
PaddyN-rEff.c,e.cy (Kg Paddy/Kg N)- N.mtbe, of Ag,...lt.ral
D,sri,cts 70 ICg N 140 Kg N Av Experjrments Practice
NUWAKOT 16.4 106 13 5 53 Ma.My w.rgated
KAVRE PALANCHOK 8.3 84 8.4 28 Mamniy Irr,gated
MAKWANPUR 17 S 16.7 17 1 33 Partly -rr.gated
CHITWAN 14 0 12.3 13 2 47 Ramined
BARA 10 6 13 5 121 46 Ra,nfed
PARSA 12 6 128 127 32 Ra, nfed
'At 50 Kg P20s and 20 Kg K20
Wodid Eank-3913
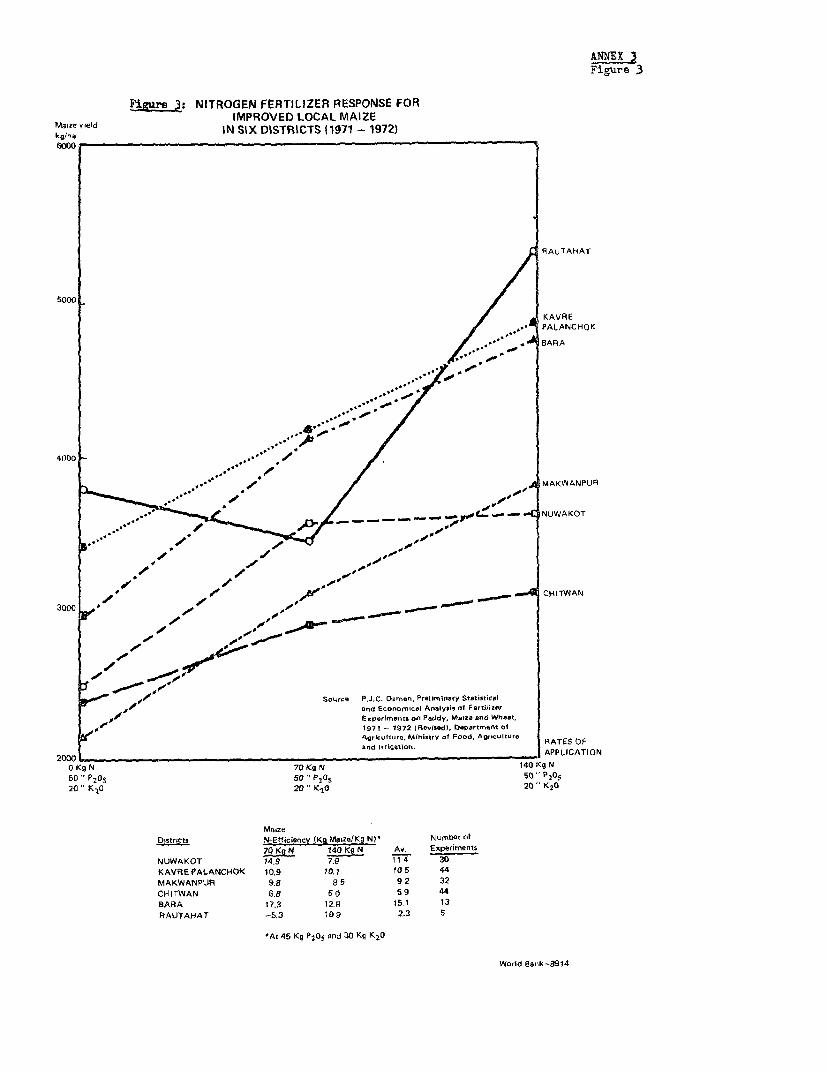
ANNEX 3Figure 3
I %re 3: NITROGEN FERTILIZER RESPONSE FORMaizelYield IMPROVED LOCAL MAIZEkar eld IN SIX DISTRICTS (1971 1972)
6000
RfAUTAFIAT
5000 _ 0
P MAKW ANPUR
*~~~~0 S _ _ Ht_C~ NUWVAKOT
3000 lt of ,/ _ _ _ _ ~~~~~~~~~~CHITiNAN
.00~~~~~~~~~S
too
W-00 00f A SoA,ce P.J.C. Dcmen, Prelimifla(y StalisticaJo ~~~~~~~~~~~~~~~and Econromical An-alysis of Fertsflzer
JO Ex vfyl-ents on Parddy, Mnlze nnc Wheat,io, 1971t-t1972 0Feiel tapstman, o1be Agricufture, Ministfy .1 Food, Agroc.ltur. AESO
2000 an _-t APPtICATION
O KgN 70 Kg N 140Kg9N5C -P2OS 5i° " P2°s 'iO -P20520 "KIC 20 "Ks,0 20 -K20
Districts N-Efflcienty (K(Imatze/KgNJ' NumtOr Of
70 Kg N 140 ICS N Av, Experinents
NUWAKOT 14.9 7.17 1 4 30 NKAVREfiALANCHOK 10,9 10.1 f0S 44tMAKWANPUR G.B S 5 9 2 32CFI ITWAN 6.8 5 0 5 9 44BARA 17.3 12,i3 15,t 13RAUTAHAT -S.3 109 2.3 5
'At 45 Kg P205 and 3 Kg K20
--D~~~~~~~~~~~~~~~~Wrl ak81
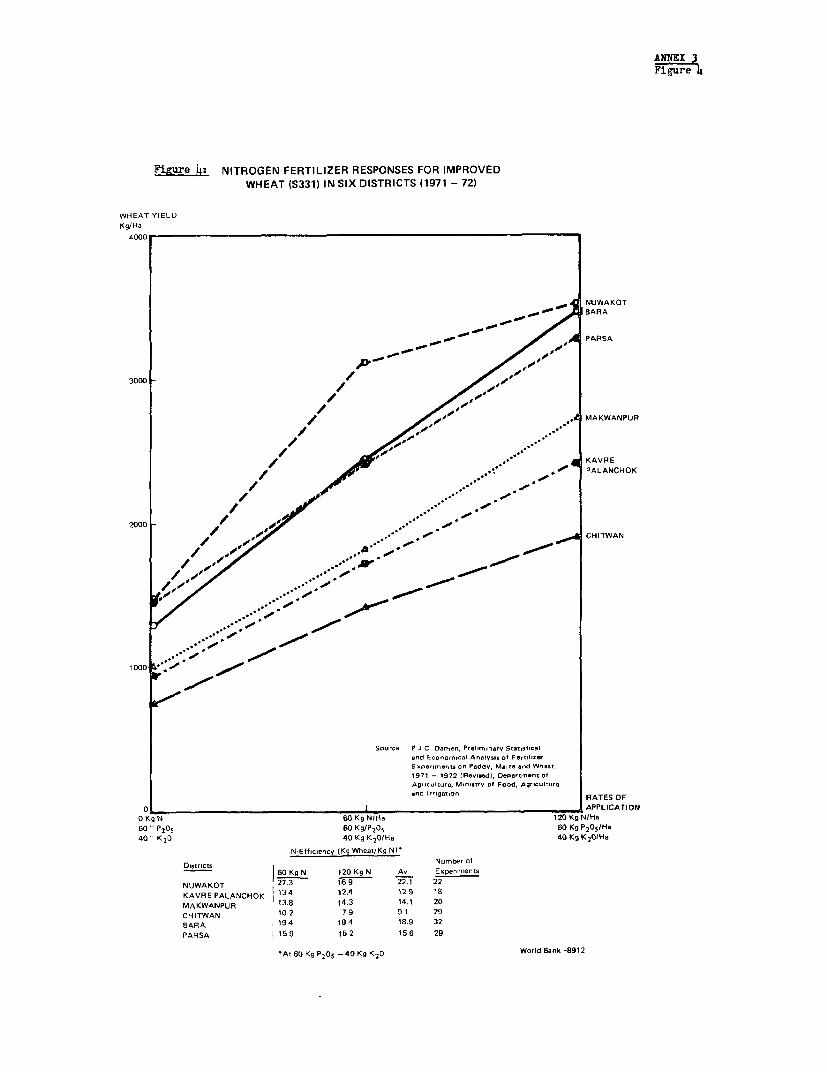
ANNEX3Figure 4
Fi&!e 43 NITROGEN FERTILIZER RESPONSES FOR IMPROVEDWHEAT (S331) IN SIX DISTRICTS (1971 - 72)
WHEAT YIELDKg/Ha
4000C
NUWAKOT_ > B~ARA
PARSA
3000 o
o MAKWANPUR
KAVRE*'"' PALANCHOK
0, ~~~~~~CHITWAN
1000 ^,* j /~0
Source P J C flaten, Preliminary Statisticaland Economical Analysis of FertlizerE p-rimants on Paddy, Maize and Wheat,1971 - 1972 Revimedll Department of
Agriculture., Mnistrv of Food, Agricultureand Irrigation RATES OF
0 1 I , _ _ i APPLICATION0 Kg N 60 Kg NIHa 120 Kg NJHa
60- P2 05 60 Kg/P 205 60 Kg P205 /Ha40 " K20 40 Kg K20(Ha 40 Kg K2 0IHa
N-Efficiency (Kg Wheat/Kg N)
D)stricts Number ol60 Kg N 120 Kg N Av Exerprments
NUWAKOT 27.3 169 22.1 22
KAVREPALANCHOK 134 12.4 12 9 18
MAKWANPUR 13.8 14.3 14.1 20
CHITWAN 10 2 79 9.1 29
SARA 194 184 18.9 32
PARSA | 159 152 156 29
'At 60 Kg P205 -40 Kg K2 0 World Eank-8912
ANNEX 4Page (i)
NEPAL
AGRICULTURAL SECTOR SURVEY
CASH CROP DEVELOPMENT
ParagraphNumber
A. INTRODUCrION ......... ................................ 1 - 2
B. OILSEEDS ........... .................................. 3 - 12
Pungent Oilseeds ................................ 4 - 10Non-pungent Oilseeds ............................ 11 - 12
C. JUTE . ................................................. 13 - 29
Jute Production ............... .................. 13 - 14Marketing and Trade ........... .. ................ 15 - 19Relative Profitability of Jute and Paddy ........ 20Problems and Constraints ......... .. ............. 21 - 25Prospects .................. ..................... 26 - 29
1). POTATOES ........... .................................. 30 - 31
E. SUGARCANE .......... .................................. 32 - 42
Production Performance .......... .. ............. 33Processing Consumption .......... .. ............. 34 - 36Production Practices and Potentials ..... ........ 37 - 38Supporting Services ...... ....................... 39 - 40Recommendations ............... .................. 41 - 42
F. TOBACCO ........... ................................... 43 - 58
Tobacco Manufacturing and Requirements .... ...... 44 - 46Production ...................................... 47 - 49Curing and Marketing ............................ 50 - 52Relative Profitability of Tobacco .... ........... 53Potentials ...................................... 54 - 56Recommendations ................................. 57 - 58
ANNEX 4Page (ii)
ParagraphNumber
G. TEA . ................................................ 59 - 66
Structure and Production of the Tea Industry ... 59 - 61Demand Prospects ............................... 62 - 63Production Prospects ........................... 64 - 65A Policy for Tea Development .... ............... 66
H. HORTICULTURAL CROPS ................................. 67 - 74
Production ..................................... 68Marketing and Processing ....................... 69Potentials ..................................... 70 - 72Future Development ............................. 73 - 74
I. COTTON ............ .................................. 75
J. PROJECT POSSIBILITIES AND STUDIES .... ............... 76 - 82
Table 1 - Area, Production and Yield of Jute (1965/66 - 1970/71).Table 2 - Export of Jute and Jute Goods from Biratnagar (By Country
in 1970/71).Table 3 - Production of Bags and Hessians by Jute Mills (1965/66 -
1970/71).Table 4 - Average Prices of Nepalese Raw Jute (lightning in Internal
and International Markets (Ks/m ton).Table 5 - Sugarcane Production, Area and Yields.Table 6 - Sugar and Sugarcane Exports and Imports.Table 7 - Total Tobacco Requirement, 1970/71 - 1972/73.Table 8 - Tea Estates - Estimated Area and Production, 1970/71.Table 9 - Per Capita Consumption of Tea In Nepal.Table 10 - Projected Production from Available Tea Areas at Full
Maturity.
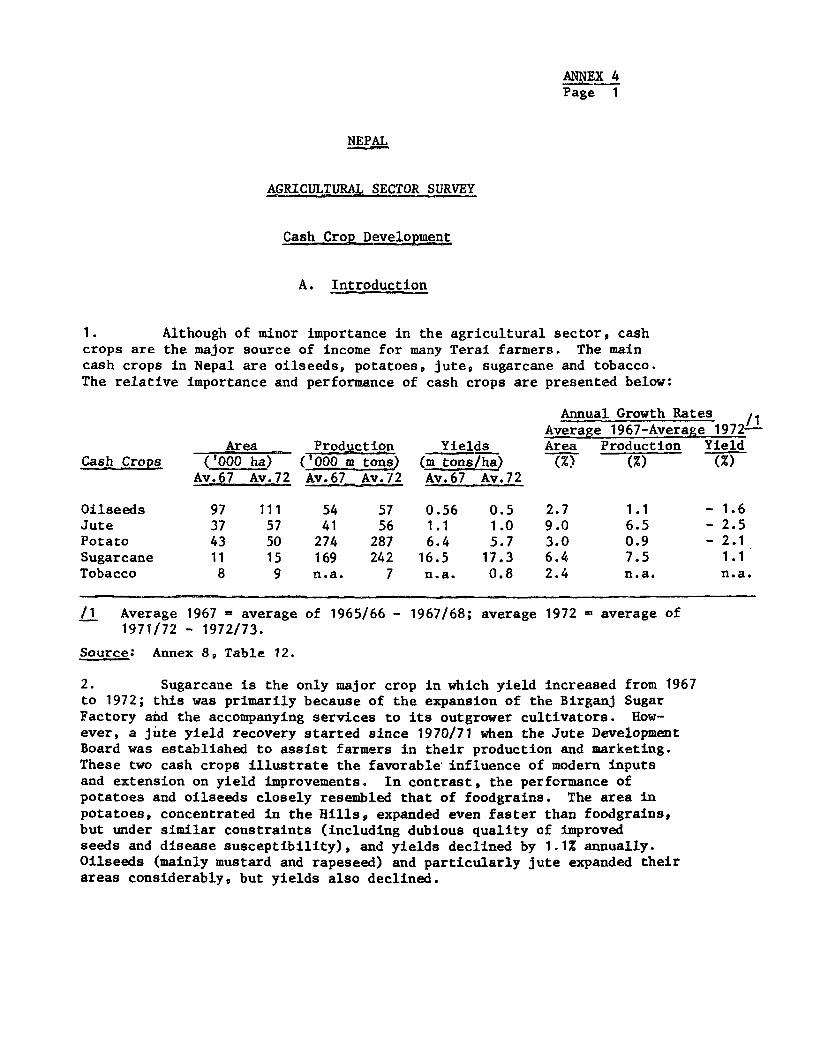
ANNEX 4Page 1
NEPAL
AGRICULTURAL SECTOR SURVEY
Cash Crop Development
A. Introduction
1. Although of minor importance in the agricultural sector, cashcrops are the major source of income for many Terai farmers. The maincash crops in Nepal are oilseeds, potatoes, jute, sugarcane and tobacco.The relative importance and performance of cash crops are presented below:
Annual Growth RatesAverage 1967-Average 1972"
Area Production Yields Area Production YieldCash Crops (000 m ton (m tons/ha) (%? (%) (%)
Av.67 Av.72 Av.67 Av.72 Av.67 Av.72
Oilseeds 97 111 54 57 0.56 0.5 2.7 1.1 - 1.6Jute 37 57 41 56 1.1 1.0 9.0 6.5 - 2.5Potato 43 50 274 287 6.4 5.7 3.0 0.9 - 2.1Sugarcane 11 15 169 242 16.5 17.3 6.4 7.5 1.1Tobacco 8 9 n.a. 7 n.a. 0.8 2.4 n.a. n.a.
/1 Average 1967 = average of 1965/66 - 1967/68; average 1972 average of1971/72 - 1972/73.
Source: Annex 8, Table 12.
2. Sugarcane is the only major crop in which yield increased from 1967to 1972; this was primarily because of the expansion of the Birganj SugarFactory and the accompanying services to its outgrower cultivators. How-ever, a jute yield recovery started since 1970/71 when the Jute DevelopmentBoard was established to assist farmers in their production and marketing.These two cash crops illustrate the favorable influence of modern inputsand extension on yield improvements. In contrast, the performance ofpotatoes and oilseeds closely resembled that of foodgrains. The area inpotatoes, concentrated in the Hills, expanded even faster than foodgrains,but under similar constraints (including dubious quality of improvedseeds and disease susceptibility), and yields declined by 1.1% annually.Oilseeds (mainly mustard and rapeseed) and particularly jute expanded theirareas considerably, but yields also declined.
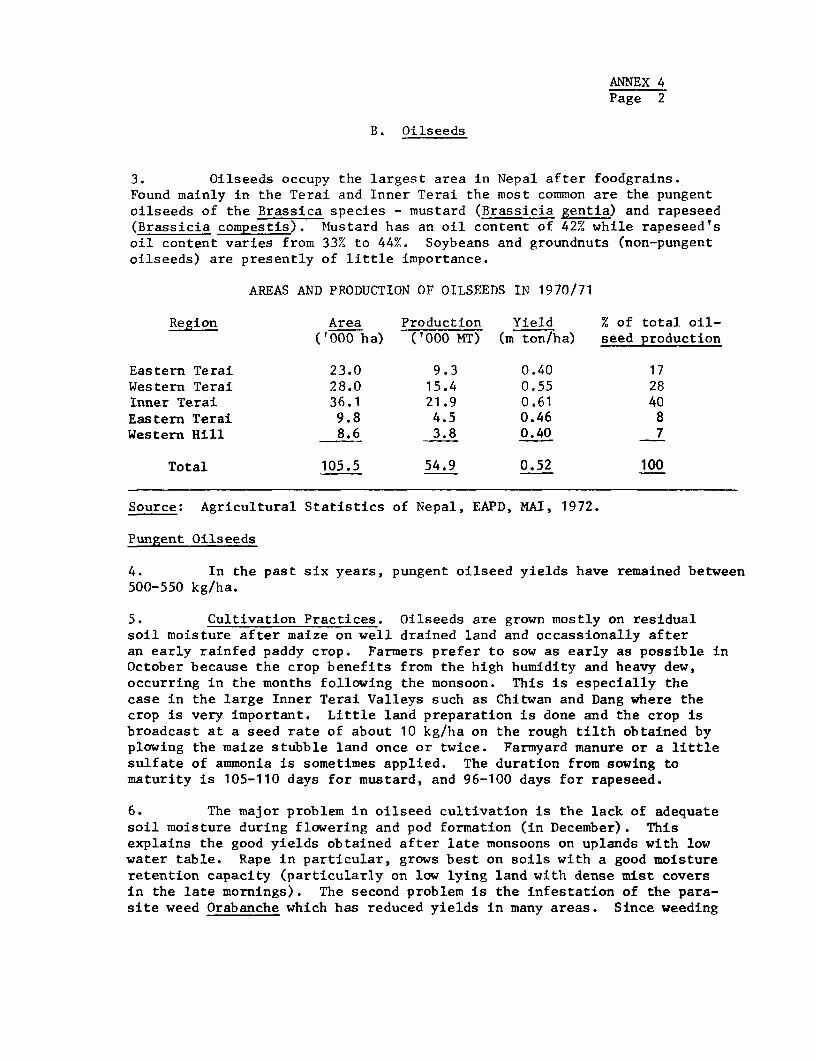
ANNEX 4Page 2
B. Oilseeds
3. Oilseeds occupy the largest area in Nepal after foodgrains.Found mainly in the Terai and Inner Terai the most common are the pungentoilseeds of the Brassica species - mustard (Brassicia gentia) and rapeseed(Brassicia compestis). Mlustard has an oil content of 42% while rapeseed'soil content varies from 33% to 44%. Soybeans and groundnuts (non-pungentoilseeds) are presently of little importance.
AREAS AND PRODUCTION OF OILSEEDS IN 1970/71
Region Area Production Yield % of total oil-('000 ha) ('000 MT) (m ton/ha) seed production
Eastern Terai 23.0 9.3 0.40 17Western Terai 28.0 15.4 0.55 28Inner Terai 36.1 21.9 0.61 40Eastern Terai 9.8 4.5 0.46 8Western Hill 8.6 3.8 0.40 7
Total 105.5 54.9 0.52 100
Source: Agricultural Statistics of Nepal, EAPD, MAI, 1972.
Pungent Oilseeds
4. In the past six years, pungent oilseed yields have remained between500-550 kg/ha.
5. Cultivation Practices. Oilseeds are grown mostly on residualsoil moisture after maize on well drained land and occassionally afteran early rainfed paddy crop. Farmers prefer to sow as early as possible inOctober because the crop benefits from the high humidity and heavy dew,occurring in the months following the monsoon. This is especially thecase in the large Inner Terai Valleys such as Chitwan and Dang where thecrop is very important. Little land preparation is done and the crop isbroadcast at a seed rate of about 10 kg/ha on the rough tilth obtained byplowing the maize stubble land once or twice. Farmyard manure or a littlesulfate of ammonia is sometimes applied. The duration from sowing tomaturity is 105-110 days for mustard, and 96-100 days for rapeseed.
6. The major problem in oilseed cultivation is the lack of adequatesoil moisture during flowering and pod formation (in December). Thisexplains the good yields obtained after late monsoons on uplands with lowwater table. Rape in particular, grows best on soils with a good moistureretention capacity (particularly on low lying land with dense mist coversin the late mornings). The second problem is the infestation of the para-site weed Orabanche which has reduced yields in many areas. Since weeding
ANNEX 4Page 3
of dry season crops is seldom practiced, harvesting is done by uprooting and
the pods are dried for 2-3 days on a drying floor and threshed (by handbeating or treading by builocks).
7. Marketing and Processing. The seed is dried to about 14% moistureand then sold to middlemen wbo grade them and pay the farmers accordingto the graded quality. Farmgate prices vary from Rs 2/kg at harvest toRs 2.6 in June, the seed prices being mainly determined by the prevailingretail prices for mustard oil, Locally consumed oil is processed in small
primitive village mills. Most of the exports consist of seed (and someoil or seed cake) to India. Annual seed exports fluctuate considerably
but is estimated to be more than 10% of production. Seed cake is retained
by the mill owners as payment for the milling. Oil milling is not a
specialized activity and many rice mills also crush oilseeds. The exported
seed goes to such towns as Hetaura, Kathmandu, Birganj, Bhairawa, Nenalganj
or to India directly. In these towns the seed may be processed and sold as
unrefined mustard oil whose pungency is highly preferred by the Nepaleseconsumer. Because of its high oil (about 15%) and glucoside content resulting
from the primitive extracting methods, the mustard seed cake is usually fed
to cattle mixed with straw or lentil hay. It is however not very suitable
for commercial feed production. Better extraction techniques would enhance
the feed value and the durability of the seed cake during storage.
8. Recommendations. Because of the population's preference for
pungent oils, the demand for pungent vegetable oil estimated at 3.0 kg per
capita, is likely to growv with increasing incomes and population. There is
also an expanding market, particularly for seed in India. Improved extrac-
tion by modern oil crushing plants will enhance the acceptability of these
oil seed cakes for the commercial feed industry both in Nepal and India.Caution should however be taken in building further solvent extraction mills
(including that planned for Nepalganj) 1/ without realistically assessingthe likely availability of raw materials and the possibilities of improvingthe efficiency of the small domestic mills. These domestic mills can extractconsiderably more oil at a higher throughput if they were better maintained. 2f
The processors are however paid on the basis of the amount of seed processed
rather than on the oil produced. Consequently, they are reluctant to spendextra to achieve good maintenance. Some commercial pressure could be applied
by the mandatory display of oil content on the sacks of the final oil cakes.
1/ The planned canacity of the oilseed processing plant in Nepalganj is60-90,000 m tons of oil per year or a requirement of 170-260,000 m tonsof oilseeds (equivalent to four times present production).
2/ Simple changes like (a) seed cleaning before processing to reduce
machine wear; and (b) flaking of seed between rollers can improveeffective capacity by 20% and reduce final oil-in-cake content from
16% to 8%.
ANNEX 4Page 4
9. Although research started only recently, results with good seedbedpreparation and line sowing instead of broadcasting and moderate fertilizerapplications (40 kg N, 30 kg P205 and 20 kg K20 per ha) have given yield levelsof 1,200 kg/ha in Chitwan with local varieties. The increased use of farmyardmanure and green manures on the maize fields to increase the soil moistureretention capacity will increase yields even further.
10. Research for improved varieties should concentrate on selectionof local or Indian varieties with a shorter duration as this would resultin early flowering and pod formation at higher soil moisture levels.Intercropping of maize with legumes like soybeans or cowpeas during themonsoon will reduce the Orabanche infestation.
Non pungent oilseeds
11. Although soybeans are widely grown in the hills on the bunds ofthe terraces or occasionally intercropped with maize, their utilization isalmost entirely for home consumption of the seeds or the green pods. Thestraw is utilized as cattle forage. Research has just started selecting andidentifying local varieties. The experience in cultivating soybeans foroil extraction is limited although the climatic and soil conditions in theWestern Terai appears suitable for soybeans to be grown either in rotationwith maize or as an intercrop. Since all the soybean cake requirement forthe feed industry and the vegetable oil requirement for the local soapindustry are met by imports, feasible local production for such use shouldbe encouraged particularly in Chitwan and Makwanpur where a solvent extractingoilseed plant is being constructed. The incorporation of soybeans in thecropping patterns on Settlement Schemes should be studied. Local trialswith U.S. varieties such as Hardy and Bragg gave yield levels of 1,500-1,600kg/ha. Their relative profitability, especially in rotation with improvedrice is worth investigating. 1/
12. Another non-pungent oilseed which is probably more suitable toNepal's light soils is groundnut. Preliminary trials with varietiessuch as Grant Dixie and B4 showed yield levels of 1,700 and 2,400 kg/hashelled nuts respectively. The soil and climatic conditions in the WesternTerai and Inner Terai are suitable. Research for including groundnuts inthe cropping pattern with maize or upland paddy is needed.
1/ Studies conducted in Uttar Pradesh, India, by I. J. Singh &D. Ramakrishnaiah, Economics of Soybean Production in India, WorldCrops 24 (2) 1972: 79-81, gave yield levels from 1600-2000 kg/haand that the cultivation of Bragg soybean and IRRI rice varietieswere the most profitable farm activities.
ANNEX 4Page 5
C. Jute
Jute Production
13. Although jute production is scattered over the Terai, its com-mercial production of about 55,000 tons (1970/71) is virtually confinedto Morang and Jhapa (contributing about 71% of production), Saptari andSunsari districts of Eastern Terai. By 1970/71, the area under jute hasvirtually doubled (table 1) since 1965/66 (most of which took place in 1967/68),but yields have declined mainly from expansion to less suitable areas.
14. The "Tita" or "Sada" (Corchurus Capsularis) varieties of jute occupyabout 90% of cultivated area because it is suitable for both light and heavysoils. Although it is suitable for early sowing (in February), it is gen-erally planted in April-May because of the lack of irrigation. The "Tossa"variety (C. clitorious) which can only be sown after mid-April occupy about5% of cultivated area. Jute is therefore usually a main season crop,harvested in August-November, followed by wheat in October-November. Bullocksare usually used for land preparation. Larger landowners use tractors andsome small farmers contract-plough their land.
Marketing and Trade
15. The marketing of jute passes through the village dealers, thesecondary agents and wholesale stockists (usually located at the terminalmarket at Biratnagar). Grading for the local and overseas markets is doneby the stockists who also has the storage facilities. He is usually theexporter and finances most of the jute marketing system.
16. A bonus voucher system was introduced under the Exchange Entitle-ment Scheme (EES) in 1963 which succeeded in diversifying exports (previouslyto India) to Europe (mainly U.K., W. Germany and Poland) and U.S.S.R. (table2). The incentive for exports overseas was the EES which allocated aportion of the export proceeds in foreign exchange to the exporter who coulduse it to import goods approved by the Department of Commerce. The latestexchange entitlements are listed below:
Revised Previous(Oct. 1971)
Raw Jute 20% 30%Jute Cuttings 60% 90%Bags 60% 70%Hessian 50% 60%Twins 60% 90%Caddies 60% 90%
17. In 1971/72 there were altogether 479 registered exporters of juteand jute goods (compared with 20 exporters in 1968/69) but only 300 exportersreceived export licenses for jute and Jute goods.
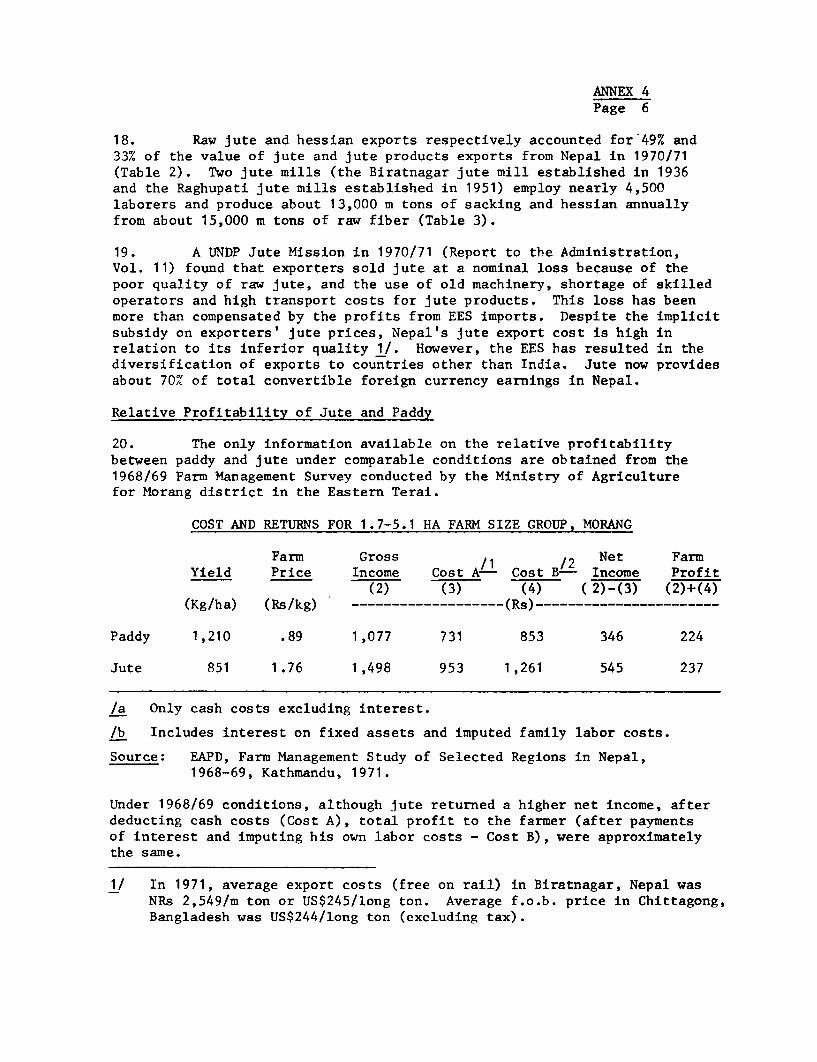
ANNEX 4Page 6
18. Raw jute and hessian exports respectively accounted for 49% and33% of the value of jute and jute products exports from Nepal in 1970/71(Table 2). Two jute mills (the Biratnagar jute mill established in 1936and the Raghupati jute mills established in 1951) employ nearly 4,500laborers and produce about 13,000 m tons of sacking and hessian annuallyfrom about 15,000 m tons of raw fiber (Table 3).
19. A UNDP Jute Mission in 1970/71 (Report to the Administration,Vol. 11) found that exporters sold jute at a nominal loss because of thepoor quality of raw jute, and the use of old machinery, shortage of skilledoperators and high transport costs for jute products. This loss has beenmore than compensated by the profits from EES imports. Despite the implicitsubsidy on exporters' jute prices, Nepal's jute export cost is high inrelation to its inferior quality 1/. However, the EES has resulted in thediversification of exports to countries other than India. Jute now providesabout 70% of total convertible foreign currency earnings in Nepal.
Relative Profitability of Jute and Paddy
20. The only information available on the relative profitabilitybetween paddy and jute under comparable conditions are obtained from the1968/69 Farm Management Survey conducted by the Ministry of Agriculturefor Morang district in the Eastern Terai.
COST AND RETURNS FOR 1.7-5.1 HA FARM SIZE GROUP, MORANG
Farm Gross /1 /2 Net FarmYield Price Income Cost A - Cost B- Income Profit
(2) (3) (4) (2)-(3) (2)+(4)(Kg/ha) (Rs/kg) -------------------(Rs)-----------------------
Paddy 1,210 .89 1,077 731 853 346 224
Jute 851 1.76 1,498 953 1,261 545 237
/a Only cash costs excluding interest.
/b Includes interest on fixed assets and imputed family labor costs.
Source: EAPD, Farm Management Study of Selected Regions in Nepal,1968-69, Kathmandu, 1971.
Under 1968/69 conditions, although jute returned a higher net income, afterdeducting cash costs (Cost A), total profit to the farmer (after paymentsof interest and imputing his own labor costs - Cost B), were approximatelythe same.
1/ In 1971, average export costs (free on rail) in Biratnagar, Nepal wasNRs 2,549/m ton or US$245/long ton. Average f.o.b. price in Chittagong,Bangladesh was US$244/long ton (excluding tax).
ANNEX 4Page 7
Problems and Constraints
21. The poor quality of Nepalese jute is due to:
(a) lack of price differentials and quality standardsto provide sufficient incentives for quality improve-ment;
(b) poor retting practices due to scarcity of water 1/
(c) poor supporting services.
22. A US$4 million loan by the Asian Development Bank in 1971 ishelping to improve supporting services and facilities for retting. A JuteDevelopment Board (JDBN) became operational in 1971 to regulate, promoteand supervise the cultivation, marketing and trade in jute and jute products.It supervises and coordinates: (i) credit and input supply (through ADBN,AMC and cooperatives), (ii) research and extension (through the Departmentof Agriculture), and (iii) marketing and exports. Its regulatory functionsinclude the issuance of permits for commercial storage, milling and exportsas well as price stabilization and buffer stock operations. JDBN alsocollects and publishes production and trade statistics.
23. Through the Asian Development Bank project, the jute developmentprogram focuses on the distribution of improved varieties of seeds (JRO 632,JRO 878, JRC 212, JRC 321), fertilizers and insecticides through four jutedevelopment centers and thirty sub-centers. 2/ The use of insecticides iscompulsory to those farmers who purchase improved seeds from JDBN or borrowfrom ADBN. ADBN also provides loans for the construction of flowing rettingponds. JDBN has also provided incentives for seed growers through loansand guaranteed prices announced well ahead of the sowing period. Researchat the Tahara Agricultural Station, Sunsari is also being strengthened. Theloan also covers modernization of the Raghupati jute mill.
24. The low average yield situation (0.9 m ton compared with 1.4 mton/ha in Bangladesh) is being improved mainly through the import of Indianvarieties. However, they are disadvantaged by early flowering and suscepti-bility to hairy caterpillar and stem rot attack compared with local varieties.The growing environment in the jute areas of Nepal are also different fromthose prevailing in India and Bangladesh. Soils tend to be more sandy, thedaylength, although greater in summer, falls below the desirable minimumearlier (at the start of winter) and the rainfall distribution is substantiallydifferent from India and Bangladesh. These conditions necessitates increasedadaptive local research for jute, combining local selections with importedvarieties.
1/ For the jute planted in February-March, additional reason is the competingclaims on farm labor for paddy planting and jute retting usually resultsin the sacrifice of the latter.
2/ Each sub-center covers 2-5 village panchayats.
ANNEX 4Page 8
25. The primary constraint in jute development is marketing andtrade. Because of the profitability introduced by the EES, various methodswere used to obtain higher exchange entitlements like reshipping the Nepalesejute en-route for export from India (or even importing Indian jute for thepurpose). To reduce such development, the National Trading Company Limited(NTC) was established as the sole exporter of raw jute and jute cuttings in1971. Due to the relative inexperience of NTC, some exporters were initiallylicenced as its exporting agents, and the private sector continued to handleabout 80% of the jute trade. However, no export licences had been issuedin October 1973 for the 1973/74 season. The uncertainty has dissuadedprivate traders from purchasing for the season and has left many farmerswithout a market channel for their jute.
Prospects
26. With the assistance of the Asian Development Bank, through thejute development program (para 22), jute production should continue toimprove. A decision has to be made concerning the role of the NepalTrading Company (NTC) in order to alleviate the problems in marketing(para 25). A re-examination of NTC's role in jute marketing is required.The role of NTC is being duplicated with the formation of the Jute Devel-opment Board (JDBN) and its designated functions of supervising jute pro-duction, marketing and trading activities (para 22). Consideration shouldbe given to JDBN taking over NTC's activities and appointing privatetraders as its agents so that the expertize of the private exporters andtraders will not be wasted.
27. World consumption for jute and jute products for the seventiesare projected to only increase between 0.6 and 1.2 percent per annum,despite the assumption of a much improved price relationship between juteand synthetics 1/.
28. World prices (in constant terms) for jute are expected to decline(from 1972-73 levels) by about 19% in 1980 2/. Because of the small amount
1/ The increase in the market price in crude oil is not likely to give jutemuch relief since synthetic production is three steps removed from therefinery level and increased costs will likely be cushioned through theprocess from oil (or gas) to chemical feedstocks, to the resins and finallyto synthetic fibers or fabrics. (Source: Jute and the Synthetics, IBRDStaff Working Paper No. 171, January 1974).
2/ From US$376/m ton (av 1972-73) to US$305/m ton (in constant 1974 pricesfor Bangladesh white D. f.o.b. Chittagong Chalna). Source: Commoditiesand Export Projections Division, Price Forecast for Major Primary Com-modities, IBRD Report No. 467, June 19, 1974.
ANNEX 4Page 9
of exports 1/, Nepal should not find much difficulty in selling its juteproducts, provided it is willing to continue taking some discount on theprices it receives in the international market. The EES will continueto make it worthwhile for private traders to export jute since theirprimary gains will be from importing. Special care should however be takenby JDBN to ensure that export final destinations provide the best marketfor Nepal's imports, otherwise greater discounts would be translated intoeven lower prices for the jute producer.
29. The relative price of jute and rice in Nepal would be the keyfactor in influencing the expansion of jute production. Projections to1980 (in constant 1974 dollars) indicate that world jute/rice price ratiowould decline from 1.4 (av. 1967-69) to 1.1 (1980). 21 Assuming the sametrend (21% decline) for jute/rice price ratios in the Nepalese Terai (Morang),the relative price changes could reverse the farm profitability of paddyin relation to jute (para 20) and make the former more profitable.
D. Potatoes
30. The cultivation of potatoes has been a traditional cash cropsactivity particularly in the Eastern Hills where they provide farmers withan important source of income. Farmers carry most of the surplus potatoesin their winter migration to Indian border trading posts (Jobari, Sanichare)to be ultimately sold as "seed" potatoes in Bihar, where the market isvery good. Terai potatoes are usually sold for direct consumption. Highyielding disease-resistant potato varieties have been developed, but thearea under them is limited. "Improved varieties" 3/ have benefitted onlyKathmandu and the Terai. The remaining Hill area, which account for 67%of the total area under potatoes, have received little. Consequently,productivity in the Hills is low (4 m tons/ha compared to the nationalaverage of 5.6 m tons/ha). The traditional varieties are deteriorating ingenetic quality and subject to large losses from insects and blight diseases.
31. An important requirement in expanding the potato industry isthe multiplication and distribution of improved potatoes in conjunctionwith other input services and the provision of marketing facilities (including
1/ Nepal's 1970/71 exports of 46,000 m tons represents only 2% of world netimports of jute and jute products.
2/ From US$495/m ton (av. 1967-69) to US$300/m ton (in constant 1974 pricesfor Bangladesh white F. f.o.b. Chittagong Chalna) for jute and fromUS$347 to US$265 (in constant 1974 prices, f.o.b. Bangkok) for 5% rice.(Source: Commodities and Export Projections Division, Price Forecast forMajor Primary Commodities, IBRD Report No. 467, June 19, 1974).
3/ Only 30 m tons of these varieties have been distributed by DA annually.Yet 4,000 ha was claimed by EAPD, Agricultural Statistical 1972 to beunder "improved varieties".
ANNEX 4Page 10
cold storage, where feasible). The joint location of potato marketingfacilities with potato seed and input (including credit) supply facilitieswould enable farmers to take advantage of higher prices and permit a moreeffective distribution of improved seeds, fertilizers and credit by AMCand ADBN at less cost. The feasibility of such a joint location offacilities should be assessed in the Ilam area where a secondary road tothe East-West Highway has been identified for external financing.
E. Sugarcane
32. Although sugarcane is found in the Terai and lower Hill Valleys,about 80% of production is concentrated in about 11,600 ha of the Teraiin the Narayani and the Lumbini Zones. The sugarcane is either processedlocally into brown sugar or sugar candy (ghur) or processed by threeTerai mills.
Production Performance
33. Sugarcane production increased by about 7.6% annually (1967/68-1972/73) from 169,000 m tons to 246,000 m tons (table 5). This growthwas primarily due to expansion of harvested area (6.2% annually). Sugar-cane was one of few cash crops to experience a yield increase (1.4%annually). Of the 3,875 ha increase in total harvested area in the pastfive years, 2,650 ha took place in Eastern Terai primarily from areaexpansion of the Birganj Sugar Factory (BSF).
Processing and Consumption
34. The first sugarmill to be established was the Morang Sugar Millat Biratnagar with a capacity of 250 m tons cane/day. The other sugarmills are the Mahendra Sugar and General Industries at Bhairawa (750 m tonsof cane per day) and the Birganj Sugar Factory (BSF) established withUSSR financial aid in 1964 (1,000 m tons of cane per day). The capacityof BSF will be raised to 1,500 tons per day within two years and improve-ment of the other two mills are also planned.
35. The BSF receives its cane under contract from 12,600 farmers inBara, Parsa and Rautahat districts. In the 73/74 season, the contractarea was 5,765 ha. The sugarcane is either brought in by the farmers them-selves or by factory transport from 9 collecting stations. Average sugarcontent from this mill is 11-12%, and the cutting and milling seasonstarts from October for about 4-5 months.
36. The average annual production of refined sugar from these mills 1/from 1969/70-1970/71 was about 15,000 m tons. The total sugar production
1/ Prospects of Industrial Investment in Nepal, NIDC, 1973, P. 120.
ANNEX 4Page 11
(in sugar equivalent at 10% recovery rates) is estimated at 24,000 m tons.Up to date trade data is not available, but annual net imports in the late1960's was estimated at about 10,000 m tons. Nepal is therefore sugardeficit and per capita consumption of sugar (1970) is about 3 kg/capita.
Production Practices and Potentials
37. Sugarcane is mainly grown on Terai levee soils which are oftenmarginal in fertility. Although some sugarcane growers use green manures(Sesbania and Chickpea) in rotation with sugarcane, nitrogen supply isgenerally inadequate without supplementing with chemical fertilizers 1/.In 1970/71 and 1971/72 only 58 m tons and 336 m tons were respectivelyapplied on about 7,000 ha in the Eastern Terai, equivalent to an averageof 28 kg/ha 2/.
38. Sugarcane is usually ratooned 2-3 times, the cycle for eachcrop being about 12 months. Although some tractors are used by the largerfarmers who also contract-plough for the smaller farmers, soil prepara-tion is mostly done by bullock. Improved planting material is littleused, and little weeding is done in maintaining the crop. Despite sugarcane yield increases, the present average of about 17 m tons/ha is verylow compared with the potentials under similar conditions 3/. Progressivefarmers south of Bhairawa in Uttar Pradesh have obtained yields greaterthan 60 m tons per hectare as a result of regular weeding, some irrigationand manuring. A new variety CO-1158 is able to produce 98.8 m tons can/hafor the planted crop and 74 m tons/ha for the first ratoon under experimentalconditions.
Supporting Services
39. Credit was initially provided by the mill (BSF) 4/ to purchasefertilizers, insecticides, tractors upon the recommendations of eitherDA or BSF agronomists. About Rs 17.7 million have so far been disbursedand recovery rates have averaged about 91%. About 100 tractors have alsobeen purchased with BSF credit by large farmers (those with 16 ha ormore).
1/ Many marginal level areas showed visual symptons of nitrogent deficiency.
2/ Fertilizer recommendations for the Indo-Gangetic alluvium of North India(generally more fertile than Nepalese Terai soils) ranges from 100-200 kgN and 0-100 kg for both P205 and K20 per hectare respectively.
3/ A 1971 study by Nippon Noei (Sun Kosi Terai Project) showed that 4 TeraiVillages could produce an average of 33.6 m tons ha, and average caneyields in Bihar, Uttar Pradesh and total India were respectively 30.3,33.0 and 39.8 m tons respectively.
4/ ADBN has now assumed responsibility for providing credit to sugarcaneproducers.
ANNEX 4Page 12
40. Limited research on sugarcane is presently undertaken in onlyone station (Parwanipur) which also multiplies seedsets for distribution tofarmers. The limited capacity at Parwanipur has resulted in shortfalls forimproved seedsets distribution 1/.
Recommendations
41. Expansion in the adaptive research of the high yielding varietiesfound in neighboring Indian districts, and varieties from other countriesshould be undertaken to diversify the source of improved material. TheResearch and Development Program undertaken by DA at Parwanipur needs tobe expanded, and guidance for external aid should be sought. Varietytesting should be extended to cover production areas other than Parwanipur.An arrangement should be made between the Department of Agriculture andthe Sugar Mills to improve the multiplication and distribution capacityof available high-yielding material. Improved seedsets can potentiallyyield 30 m tons of cane/ha under general farm conditions.
42. The expansion program for BSF and rehabilitation of the othertwo mills should proceed. The concept of smallholder outgrower operationstied to production and credit assistance by the sugarmill (in cooperationwith ADBN) appears to be working in the case of BSF, and should beexpanded.
F. Tobacco
43. Tobacco is mainly grown in the Eastern Terai (particularly inthe districts of Saptari, Mahottari, Dhanusha and Sarlahi) which accounts for852 of the 6,900 m tons of tobacco production in 1970/71. 2/
Eastern Western Inner Eastern WesternTerai Terai Terai Hills Hills
Area (ha) 7,500 600 500 100 400Production (000 kg) 5,800 400 400 100 200% 85 6 5 1 3Yield (kg/ha) 773 667 800 1,000 500
Sun cured "natu" tobacco (Nicotiana tobacum or N. rustica) grown for theproduction of low quality pipe tobacco ("hookha") and cigarettes ("bidi")account for 75% of total tobacco production. The rest (about 1,700 m tons)consists primarily of flue-cured tobacco (mainly Virginia Gold).
1/ In 1970-71 only 133 tons of a targeted 566 m tons of improved seedsetswas distributed at Parwanipur.
2/ Source: EAPD, Agricultural Statistics of Nepal.
ANNEX 4Page 13
Tobacco Manufacturing and Requirements
44. Tobacco requirements for the two largest factories in Nepal (theJanakpur Cigarette Factory and Nepal Tobacco Company) 1/ are given in Table 7.In 1972/73, these two factories had to import about 20% of their totaltobacco requirements of 2,317 m tons. Of the 457 m tons imported, 397 mtons consisted of imported Virginia flue-cured tobacco. Their import require-ments of Virginia flue-cured have increased despite the introduction of localproduction of flue-cured since 1967. This increase is due to increaseddomestic demand and the fact that local manufacturers use only 50-60% ofNepalese flue-cured tobacco in their blends.
45. Because of itnport restrictions, the existing three tobacco andcigarette factories provide virtually all 2/ the tobacco and cigarettesconsumed in Nepal. Of the current local production of 2,300 million sticksof cigarettes annually, about 90% is manufactured by the Janakpur CigaretteFactory (JCF) established in 1959 with USSR financial assistance. The restis supplied by two other factories (Nepal Tobacco Company and Nepal CigaretteFactory) in Birganj and Hetaura, respectively.
46. Nepal's flue-cured tobacco grown on light textured soils producesa light, low nicotine leaf. The local preference however is for strongtasting cigarettes and, for this purpose, high nicotine flue-cured tobaccofrom USA, Mozambique and some burley from Brazil and USA are imported by JCF.The other two cigarette factories import raw tobacco from India and thirdcountries (Virginia flue-cured as well as air-cured) to be blended with localflue-cured and Natu tobacco.
Production
47. Assistance in tobacco development is provided by the TobaccoDevelopment Board (TDB), created in 1971. TDB acts as an intermediary amongthe manufacturers, the producers and government service agencies. Itcontracts manufacturers requirements with producers, co-ordinate input,credit 3/ and seed requirements with AMC, ADBN, and DA respectively, andundertakes the development and extension of technology for production andcuring.
1/ No information is available for the Nepal Cigarette Factory.
2/ Except for high quality tobacco and cigarettes consumed by the diplomaticcommunity.
3/ After approval by TDB, farmers receive (i) a first installment of860 Rs/bigha consisting of Rs 500 in cash and Rs 360 in kind (fertilizers);and (ii) a second installment of Rs 600 in cash and Rs 40 in kind(insecticides).
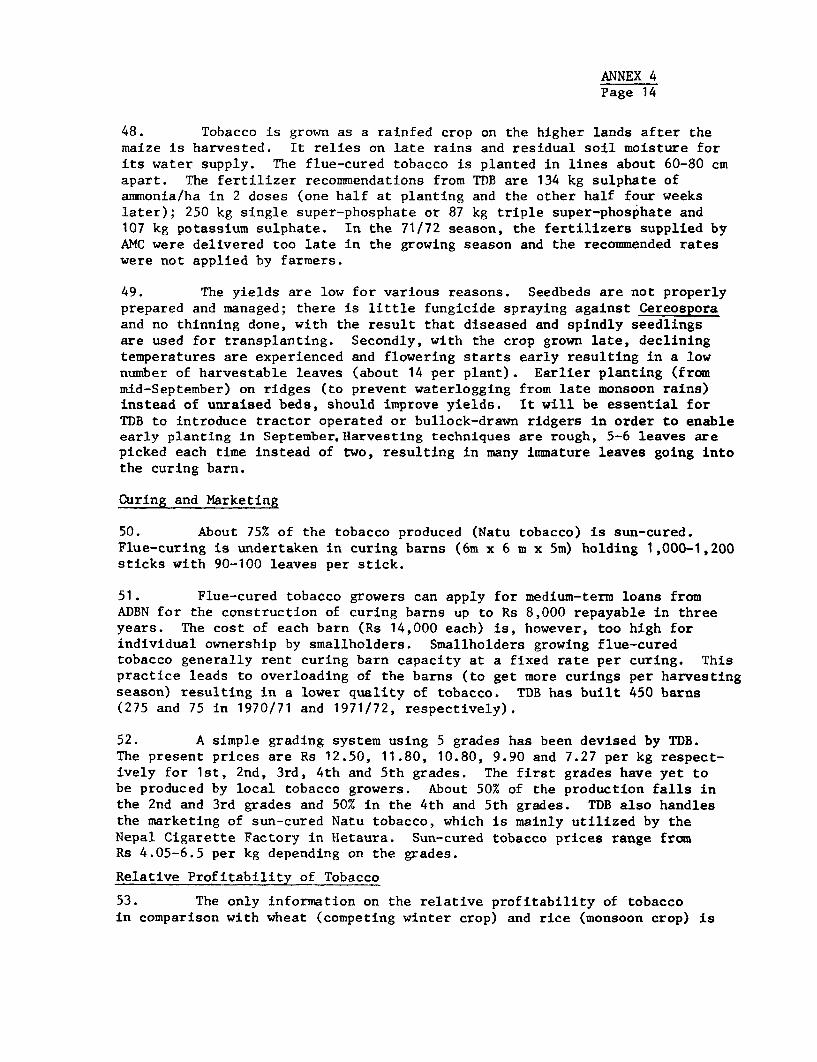
ANNEX 4Page 14
48. Tobacco is grown as a rainfed crop on the higher lands after themaize is harvested. It relies on late rains and residual soil moisture forits water supply. The flue-cured tobacco is planted in lines about 60-80 cmapart. The fertilizer recommendations from TDB are 134 kg sulphate ofammonia/ha in 2 doses (one half at planting and the other half four weekslater); 250 kg single super-phosphate or 87 kg triple super-phosphate and107 kg potassium sulphate. In the 71/72 season, the fertilizers supplied byAMC were delivered too late in the growing season and the recommended rateswere not applied by farmers.
49. The yields are low for various reasons. Seedbeds are not properlyprepared and managed; there is little fungicide spraying against Cereosporaand no thinning done, with the result that diseased and spindly seedlingsare used for transplanting. Secondly, with the crop grown late, decliningtemperatures are experienced and flowering starts early resulting in a lownumber of harvestable leaves (about 14 per plant). Earlier planting (frommid-September) on ridges (to prevent waterlogging from late monsoon rains)instead of unraised beds, should improve yields. It will be essential forTDB to introduce tractor operated or bullock-drawn ridgers in order to enableearly planting in September.Harvesting techniques are rough, 5-6 leaves arepicked each time instead of two, resulting in many immature leaves going intothe curing barn.
Curing and Marketing
50. About 75% of the tobacco produced (Natu tobacco) is sun-cured.Flue-curing is undertaken in curing barns (6m x 6 m x 5m) holding 1,000-1,200sticks with 90-100 leaves per stick.
51. Flue-cured tobacco growers can apply for medium-term loans fromADBN for the construction of curing barns up to Rs 8,000 repayable in threeyears. The cost of each barn (Rs 14,000 each) is, however, too high forindividual ownership by smallholders. Smallholders growing flue-curedtobacco generally rent curing barn capacity at a fixed rate per curing. Thispractice leads to overloading of the barns (to get more curings per harvestingseason) resulting in a lower quality of tobacco. TDB has built 450 barns(275 and 75 in 1970/71 and 1971/72, respectively).
52. A simple grading system using 5 grades has been devised by TDB.The present prices are Rs 12.50, 11.80, 10.80, 9.90 and 7.27 per kg respect-ively for 1st, 2nd, 3rd, 4th and 5th grades. The first grades have yet tobe produced by local tobacco growers. About 50% of the production falls inthe 2nd and 3rd grades and 50% in the 4th and 5th grades. TDB also handlesthe marketing of sun-cured Natu tobacco, which is mainly utilized by theNepal Cigarette Factory in Hetaura. Sun-cured tobacco prices range fromRs 4.05-6.5 per kg depending on the grades.
Relative Profitability of Tobacco
53. The only information on the relative profitability of tobaccoin comparison with wheat (competing winter crop) and rice (monsoon crop) is
ANNEX 4Page 15
the 1968/69 Farm Management Survey. Results for Dhanusha District, EasternTerai (given below) shows the extreme high profitability of tobacco culti-vation.
COST AND RETURNS FOR 1.7-5.1 HA FARM SIZE GROUP, DEANUSHA
Farm Gross /1 /2 Net FarmYield Price Income Cost A- Cost B - Income Profit
(kg/ha) (Rs/kg) ----- (Rs)------- …
Tobacco 1,063 6.95 7,386 757 1,815 6,629 5,571
Wheat 760 1.33 1,010 716 1,097 294 -87
Paddy 1,116 0.95 1,060 700 905 360 155
/1 Only cash costs excluding interest.
/2 Includes interest on fixed assets and imputed family labor costs.
Source: EAPD, Farm Management Survey of Selected Regions in Nepal, 1968-69,Kathmandu 1971.
Potentials
54. Agriculturally, the potential for tobacco expansion is very largewith an estimated 122,540 ha of Eastern Terai found to be very suitable fortobacco 1/ and its main use as a winter crop rather than as a monsoon crop incompetition with paddy or maize. Prospects of expansion to accommodate domes-tic demand increases will, however, not enable this potential area to be usedfor tobacco production.
55. For example, plans are underway to expand the capacity of JCF from2,000 m tons to 2,800 m tons by 1975, the possible expansion of area under flue-cured tobacco cultivation for this increased capacity is only 800 ha 2/. TDBhas 5,443 flue-cured growers registered in 1970/71, but had to reduce thenumber in 1971/72 to 3,469 because of JCF's limited absorptive capacity andincreased yields by some growers.
1/ The good tobacco soils in Dhanusha (soil survey of tobacco growing areasof Dhanusha District, DA) are characterized by dark brown, deep and welldrained sandy loam with an average PH of 5-6 (generally low in organicmatter, nitrogen and phosphorous, but high in potassium). These arefound in the Bakeya and Jimum soil series and the loams (silty clay tosilty loams) which are the most suitable, occupy 122,540 ha in EasternTerai (Report on General Reconnaissance Soil Survey of the E.stern TeraiPlain, Nippon Koei, Tokyo, Sept. 1970).
2/ Only about 60% of the expansion requires Neplaese flue-cured tobacco;yields are assumed to be 750 kg/ha.
AiiŽ4EX 4Page 16
56. In order to significantly extend the high income benefits associatedwith tobacco production, a re-orientation towards overseas export is required.Jepalese flue-cured tobacco nas a golden-yellow, bright orange color with alight texture and a good burn and aroma. It's quality is relatively good(between Malawi and Korean flue-cured) and much higher than the Indian flue-cured. It's low nicotine content is also nighly demanded and evaluation ofthe samples sent to EEC countries have been very favorable. Its quality andmoderate price (US$1.90/kg for Nepalese top grade in Nepal compared withUS$3.06/kg for U.S. flue-cured in EEC) indicates a favorable competitivenessin the EEC market.
Recommendations
57. Tne limited impact of expanding tobacco production for local consump-tion and the indicative international competitiveness of Nepal's low nicotineflue-cured tobacco requires that TDB assign top priority to exploring thepossibilities of export especially to the EEC.
58. Technical assistance is required to strengthen the fledgling TDBnot only for export development but also in extension, curing and research.With limited small farm participation (para 51) consideration should also begiven to the feasibility of expanding the role of cooperatives in tobaccoproduction and the possibility of TDB undertaking curing for smallholders.Otherwise the remunerative cultivation of tobacco will reach only a fewlarge farmers.
G. Tea
Structure and Production of the Tea Industry
59. The tea industry in Nepal consists only of estates located in theFar Eastern Region of Nepal. Two of these (Ilam and Soktim) are managed bytne Nepal Tea Development Corporation (NTDC) and the other five (in theinadrapur area) are private. Except for the NTDC estates, the existing teaestates aave only been started after 1962. These new estates were set upprimarily in anticipation of the Land Reform Act of 1964 which limited privateland noldings to a maximum of 28 bighas (19 ha) except for estate crops liketea. Tne quality of teas from these estates are low, suitable mainly for thelocal market. The bulk of tea exported consists of the high quality teasfrom Ilam. Exports of these teas are still very low (14 m tons in 1970) andare mainly destined for W. Europe.
60. In 1971, the Ilam and Soktim estates account for 33% of Nepal'sestimated tea production of 45.5 m tons (Table 8). The five private teaestates located in Jhapa district have a combined area of about 520 ha with316 ha still immature and 405 ha yet to be developed. Because of higher
ANNEX 4Page 17
altitude and better quality, the yield 1/ from Ilam are about two-thirds ofSoktim's estimated yield of 354 kg/ha. Other estates which produce lowlandtea have lower yields primarily because of poor establishment and poor manage-ment. Even the "mature areas" are often not mature. These yields are verylow compared with the average of 1,000 kg (made tea)/ha obtained from old,non-irrigated estates in the Indian Tarai. Commercial estates with newerplanting material (and no irrigation) are averaging 1,600 kg/ha. Part of theproblem in Nepal is that old paddy areas of poor fertility have been plantedto tea in many of these estates. Although some have suitable tea areas, siteselection nas been rather ad hoc. Nurseries are far from the water sourcesand areas to be planted. Trees have been planted with little considerationof prevailing winds and no drains have been built. Other poor husbandrypractices are evident from the insufficient and improper use of manure andinsecticides agd defective pruning. Estate managers, (some expatriate) arein general of dubious quality, and their salaries provide even less incentivesfor performance. The problem of semi-skilled labor availability is parti-cularly difficult since reliance has to be placed on Indian labor who preferthe nigher salaries and better facilities (housing, medical, education, etc.)available in India. The NTDC estates and Mittal are the only estates withsuch facilities to attract permanent labor.
61. In most of these estates, little can be done to boost the produc-tivity of their poorly planted trees. Some salvation from better managementcould be obtained if the owners are willing to invest on capable staff, liftpumps and modernization of factory facilities. Since 1971, the AgriculturalDevelopment Bank (ADBN) has been lending to tea estates for modernizationof factories, purchases of pump sets and expansion of their tea gardens. Itis Aowever unclear whether tecnnical assessment has been made of the feasibi-lity of these investments since NTDC assistance was not actively sought intne evaluation process.
Demand Prospects
62. The internal market is selective and is accustomed to low qualitytea (especially CTC tea and tea dust), preferring color and strength toother characteristics. The mission estimates that per capita consumptionincreased 7.8% annually from an estimated 28 gm in 1962 to 55 gm in 1971(See table 9). These per capita consumption figures are much lower thantne 0.3 kg and 0.2 kg for India and Pakistan respectively in 1965. 2/ If thesame trends continue, total consumption in Nepal will reach 1,469 m tons in1980 and 3,801 m tons in 1990. These figures could be under-estimated ifdevelopment of the hills proceed at a quicker pace. Tea is presently drunkonly in the main population centers, which, except for the Kathmandu Pokharavalleys, are in the Terai. North-South feeder roads should open an untouched
1/ Unless otherwise specified, tea yields are for made tea.
2/ FAO, Agricultural Commodity Projections, 1970-1980, Vol. I, Rome, 1971.
AiNEX 4Page 18
market in the hills and in the 1980's, per capita tea consumption may wellincrease by 12% annually. Total tea consumption in 1990 will tnen be 5,561m tons. 1/ Per capita consumption in Nepal under this assumption would beequivalent to India's level in the sixties.
63. Foreign demand for high quality tea equivalent to those foundin the Darjeeling area provides a potentially better market for Nepal's tea.Ilam tea, for example, is the highest priced tea in the London Auction. 2/Supply from the Darjeeling area has declined (due to the landslide loss ofabout 3,000 ha about three years ago) and the possibility of recovery is re-mote unless the whole area is replanted. There is a wealth of new technologyconsisting primarily of improved planting materials developed in that areawhich cannot be fully utilized in India because of shortage of new areas forexpansion. The opportunity for identifying suitable areas in Nepal similarto Darjeeling conditions to take advantage of these developments should bepursued. The demand for these high quality teas is still very strong andthe inability of India to cater for this demand gives Niepal a potentialadvantage it should exploit.
Production Prospects
64. In addition to about 23 hectares to be developed in the NTDCestates at Ilam and Soktim, land has been acquired in Kanyam near the EasternHills border. The Kanyam area has conditions similar to Darjeeling. Becauseof unanticipated submergence of the Chillimkote area (in the Siwaliks nearSoktim) by the Kankai Irrigation project, two new areas in Tokla and Baradasi(in Jnapa) have been allocated. Each of these areas have an alleged 160 hlasuitable for locally consumed tea. Under British bilateral assistance asmallholder settlement project nas been proposed in the Nawalpur area inCentral Terai where 4,700 ha suitable for tea has been identified. As afirst phase however, a preliminary report 3/ has recommended the planting ofonly 890 ha where surface irrigation can be provided.
65. By 1980, under the assumptions that (a) existing private estatesdevelop all their remaining areas and improve their yields to 361 kg/ha and(b) NTDC estates at Soktim and Ilam improve their yields to an average of440 kg/ha, the total production of 385 m tons will only cover 26% of projecteddomestic requirements. If the newly acquired NTDC areas (Kanyam, Tokla and
1/ In 1971, M.K. Prossor, Colombo Plan Tea Advisor to Nepal, projectedinternal demands of 3,500 and 10,900 m tons for 1980 and 1990 respectively.He applied an annual growth rate of 17.5% in per capita tea consumptionderived basically from import trends from 1962-1965. These trends havesince not materialized.
2/ The 1973 London Auction prices (new pence/kg) were: All teas 43.3;Nepal - 55.3; Sri Lanka - 45.4; N. India (including Darjeeling) - 45.7;S. India - 37.8; Kenya - 44.3.
3/ Foreign and Commonwealth Office Overseas Development Administration,Development Potential of the Nawalparasi, Area of Nepal, 1972.
AkNNEX 4Page 19
j3aradasi) achieve the yields projected by NTDC 1/ and the Nawalpur projectacnieves its projected yields, total production of tea at full maturity in1990 will reach only 2,521 m tons (table 10). A deficit of 1,280 or 3,040m tons would arise depending on the demand assumptions. The mission howeverfeels that without careful study of the new areas, and the provision ofbetter management and supporting services, the assumed NTDC yields will notbe achieved.
A Policy for Tea Development
66. Although deficits for tea in Nepal will remain in the future,expansion of tea production in Nepal has to be selective. Preliminary indi-cations are that Terai tea yields of 1,500 - 1,750 kg/ha will have to beachieved before production costs are about competitive with Indian tea imports.Past mistakes of the Government in permitting the establishment of privatetea estates without properly assessing their suitability and capability shouldnot De repeated. There has been insufficient assessment of the comparativeadvantage of growing tea in potential areas versus otner activities. 2/ Kanyamand its adjacent areas appears to be suitable for nigh quality tea develop-ment, but further studies are required to verify this, and in particular, toevaluate the feasibility of smallholder participation. Tokla and Baradasishould first be studied for their technical suitability for tea and economicadvantage over other crops. Top priority should be placed on strengtheningiiTDC so that it can more effectively support the tea industry. The Board ofNTDC should have professional representation to (a) provide technical supportfor policy decisions; and (b) establish closer liaison between the board inKathmandu and field operations. A suitably staffed adaptive research andextension unit should be set up by NTDC as expansion in tea proceeds.
H. Horticultural Crops
67. Selected sub-regions in the Hills are eminently suitable for horti-cultural crops. Horticultural crops in Nepal include fruits, vegetables,and spices. Although a wide range 3/ of fruits and vegetables are pro-duced throughout most of the country, because of the scarcity of facilities
1/ NTDC, Note on Future Expansion, August 1971, Soktim.
2/ There is of course the possibility of increasing import duties onimported tea to make the local tea industry competitive. This snouldonly be explored after comparative costs of alternative uses to theseareas have been studied.
3/ Fruits consist of bananas, mangoes, papayas, oranges, apples, guavas,pears, peaches, cherries, apricots, plums, lychees, jackfruit, lime,grapres and pineapples; and vegetables consist of onions, radish, beans,peas, carrots, turnip, spinach, okra, egg plant, tomatoes, peppers,cabbage and cauliflower.
ANNEX 4Page 20
for transport, marketing and storage, their consumption is usually limitedto local markets and very short seasons. Furthermore, because of limitedorientation towards commercial horticulture and poor technical support,quality is invariably poor. The only fruits of general commercial importanceare oranges and mangoes. Oranges are concentrated in the lower hills ofFar Western and Eastern Nepal; commercial mango production is concentrated inEastern Terai; spices (particularly ginger and cardamum) are important inthe Sallyan - Syangja areas and the Western Hills.
Production
68. Tne Department of Agriculture's horticultural efforts have beenmainly in the distribution of fruit trees, especially citrus. No extensionservice for horticulture exists. Nurseries are Government owned and theirgrafting, breeding and budding techniques require substantial improvement.Modern orchard cultivation methods (spraying, thinning, etc.) and are notpracticed. Rootstock quality is invariably poor and diseased, adverselyaffecting yields and prolonging their gestation period. Apples, for example,do not come into bearing until the 8th compared with 4th - 5th year in theUnited States, Western Europe, Korea and Chile. Disease (die-back) has reducedthe production of citrus, particularly in the Mid-Western Hills. In thePokihara Valley, citrus area declined snarply from 4,000 ha to 1,200 ha; andefforts are being made to control this disease. "Commercial" temperatefruit production in Nepal is at an infant stage. Between 1970-73 about 200 hawere brought under apples, pears and peaches benefitting 800 farmers inMakwanpur District. Mortality rates (during first year's planting) for thesefruit trees average about 25% (15% in India) and existing and expected yieldsare low (less than 10 m tons/ha).
Marketing and Proccessing
69. Organized marketing does not exist. Farmers may either carry theirproduce to nearby urban centers or, more usually, bring their crops to mainnignways for sale to middlemen. Farmers receive less than 30% of the retailprices. Most of the fruit is marketed in fresh form; very little is processed.There are only four cottage-sized, privately owned, processing facilitieswhich pack mango and pineapple juices or slices for the domestic market.These plants are poorly equipped and follow outdated processing techniquesresulting in inferior quality, lower canned yields and high costs.
Potentials
70. For a number of fresh fruits (eg. grapes, citrus) and vegetables,market availability is not a serious constraint. In the Indian market, Nepalhas a seasonality advantage in the summer months, where Indian fresh pro-duction is very limited (particularly in the Northern Plains). Nepal's
AiJEX 4Page 21
domestic and tourist 1/ market is also expanding, requiring a number of fruitsand vegetables in fresii (eg. apples, peacnes, grapes, walnuts, almonds, tomatoes,cucumbers) and processed (eg. mango and pineapple slices, jams, peas) forms.Presently, iNepal's canned fruits, fruit juices, and vegetables are importedfrom India. Highi value foreign markets are available for sniitake (driedoak mushroom), and flower and vegetable seeds, for which selected areas in.4epal are suitable. These products are labor intensive, require only simpleprocessing, can be easily stored and shipped in bulk to profitable exportmarkets.
71. Production problems of late gestation or alternate bearing, pooryields may be solved witlh technical assistance and the importation ofsource materials from temperate countries who have successfully overcomethese problems. Grafting regular rootstock for apples witii the spur varietycould, for example, achieve bearing in the fourth year, with 2.5 m tons perha yields (or about 15 m tons/ha by the 10thi year), 2/ providing substantialfinancial gains for the grower. Almond and walnut varieties which maturein 5-6 years compared witlh the present 15 years are also available fromtne United States.
72. Inaccessibility, thie small size and subsistence nature of farms,and the poor supporting services for production, marketing and processingwill continue to constrain large scale expansion of iorticultural pro-duction. A shift from subsistence farming on small holdings to norticulturemay oe difficult, but some examples of tne willingness of farmers to trynorticulture on their marginal lands provides optimism for potential success.In certain accessible areas, close to government horticultural farm (eg. nearDam.an in :iakwanpur), numerous hill farmers with less than 0.8 ha aavedevoted a small portion of their land (tile very marginal areas whicn barelyproduce any maize or millet crop) to temperate fruits. In suchi areas"orcnard" development costs would De low since terraces are often alreadyestablisned. Witn improved nusbandry methods, combined with marketing andorganizational support (through technical assistance), these enterprisescould oe substantially improved, and expansion to other areas could result.
Future Development
73. Future development in horticultural production should be along thefollowing lines:
(a) Reiiabilitation of existing rootstocks on farms with highyielding, quick maturing and disease resistant grafts. (Forcitrus, suchi a development could be undertaken in about2,000 ha located in Kaski, Diiankuta and Ilam districts.)
1/ The numbers of tourists visiting Nepal is expected to at lease doublefrom its present level of 0.5 million by 1980.
2/ Professor Robert Carlson, Micnigan State University.
ANidEX 4Page 22
(b) Expansion of area under existing fruits and vegetables.
(c) Expansion of area under new fruits and vegetables. (Selectedareas could develop grapes, flower and vegetable seeds orshiitake.)
To ensure the success of these production programs, external assistance isrequired for nursery improvement and management, for importing suitable diseasefree rootstocks and new varieties, and for assisting LlMG in diversifyingits horticultural research and strengthen its extension capability.
74. Improvements in marketing infrastructure, including tne packingand grading of selected horticultural products and the organization offarmers sniould also be undertaken. Possibilities for integrating productionwith processing exist in the development of simple processing facilities forextracting ginger and orange oils. These coomodities nave very good exportpossibilities.
I. Cotton
75. Cotton is currently grown only under experimental conditions ingovernment farms and settlement schemes under Israeli and FAO/UiiDP assistancein Western Terai. Short duration Australian varieties have been used wnichnave overcome previous problems of nigh humidity and cloudiness on flower-shedding. Adaptive researcn is required over more diversified areas and withother varieties before large scale expansion can be considered. Tne appro-priate areas for initial pilot projects would be in Sepal Settlement Companysettlement areas where the possibility of better control of the plantingprocess exists.
J. Project Possibilities and Studies
76. A Cash-Crop Development Project is proposed consisting of thefollowing components:
(a) sugar development - comprising (i) improvements inplanting material and diversifying its sources forresearch and distribution to smalliiolders and (ii)expansion and/or renabilitation of sugar mills indiratnagar and Birganj tied to expanded smallholderoutgrower schemes.
(b) tobacco development - involving the strengthening ofTDB in its research and extension assistance to smallfarmers including the development of curing capacity
AiNNEX 4Page 23
for their use (para 58). An important prerequisite isa detailed study of the prospects and requirements forexpanding Nepal's flue-cured tobacco exports particularlyin the EEC market.
77. Financing cost for this project is estimated at US$8.0 million.
78. A Tea Development Project is proposed for the high quality teaareas of Kanyam (and possibly Lumle) and the low quality tea areas of Toklaiand Baradasi pending a feasibility study of the possibilities for tea produc-tion through smallholder development (para 66). British technical assistancenas been offered by ODM for feasibility studies and implementation of a teaproject, and the above emphasis is suggested by the mission. Financingcosts would probably be about US$4 million.
79. A horticultural development project is proposed primarily toincrease the income opportunities of hill farmers and diversify Nepal'sexport base. Project preparation would consist of: (i) reviewing and evalua-ting past studies, research, existing schemes, marketing infrastructure anddemand of selected horticultural crops, (ii) define criteria for selectingareas for horticultural development; (iii) identify prospective areas for afirst phase development program and the required research support; (iv) spellout the prerequisites (in production, marketing and processing) and requiredinstitutional changes to ensure success, and (v) explore interrelationshipswith other agricultural enterprises and possibilities of their integrationinto area development projects.
80. A pilot project for cotton development is proposed as the basis fora gradual introduction of commercial cottoin production in Nepal. It wouldconsist of: (i) selected production on farmer's fields in the areas wherecotton research has been undertaken by the 4epal Settlement Company or the,jepartment of Agriculture; and (ii) expansion of cotton trials in other areasof W4estern Terai. bilateral assistance would be very suitable for thisproject.
61. Otiner possibilities for cash crop development would be as componentsof area development projects (e.g. horticultural development in the Trisuli,Nuuwakot area in conjunction with a rural development project; spice and chillipepper development in the Sallyan area as part of the East-West highway Sallyanroad).
82. Commodity Studies are required on:
(a) tne marketing systems (including processing), pricing andexport potential of fruits and vegetables;

ANNEX 4Page 24
(b) local and foreign demand for cotton;
(c) the prospects for introducing treenuts (like cashew and Mlacadamia)and expansion of native nut production (walnut, almonds); and
(d) the prospects for introducing pyretnrum.
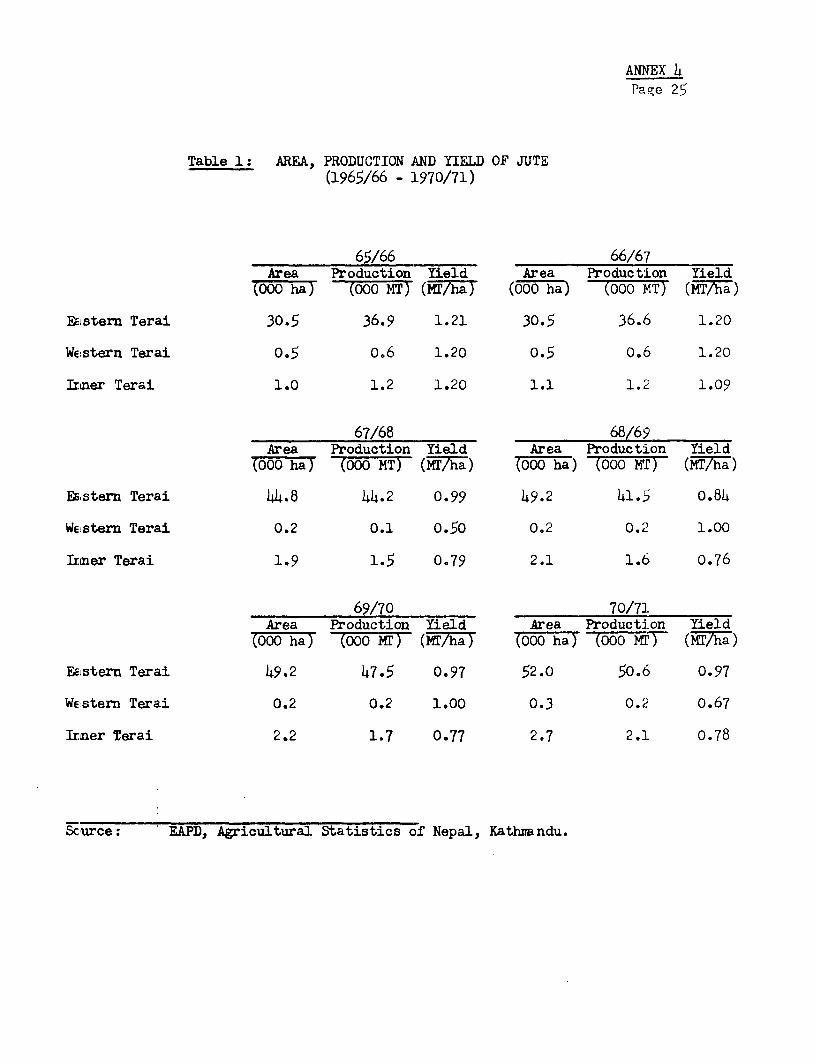
ANNEX 4Page 25
Table 1: AREA, PRODUCTION AND YIELD OF JUTE(1965/66 - 1970/71)
65/66 66/67Area Production Yield Area Production Yield
(000 ha) (000 MT) (MT/ha) (000 ha) (000 MT) (MT/ha)
EELstern Terai 30.5 36.9 1.21 30.5 36.6 1.20
Western Terai 0.5 o.6 1.20 0.5 0.6 1.20
Irner Terai 1.0 1.2 1.20 1.1 1.2 1.09
67/68 68/69Area Production Yield Area Production Yield
(000 ha) (000 MT) (MT7/h) (000 ha) (000 MT) (MT/ha)
EEstern Terai 44.8 44.2 0.99 49.2 41.5 0.84
We!stern Terai 0.2 0.1 0.50 0.2 0.2 1.00
Irner Terai 1.9 1.5 0.79 2.1 1.6 0.76
69/70 70/71Area Production Yield Area Production Yield
(000 ha) (000 NT) (NT/ha) (000 ha) (000 NT) (MT/ha)
EELstern Terai 49.2 47.5 0.97 52.0 50.6 0.97
Western Terai 0.2 0.2 1.00 0.3 0.2 0.67
Irner Terai 2.2 1.7 0.77 2.7 2.1 0.78
Scurce: EAJPD, Agricultural Statistics of Nepal, Kathnmndu.
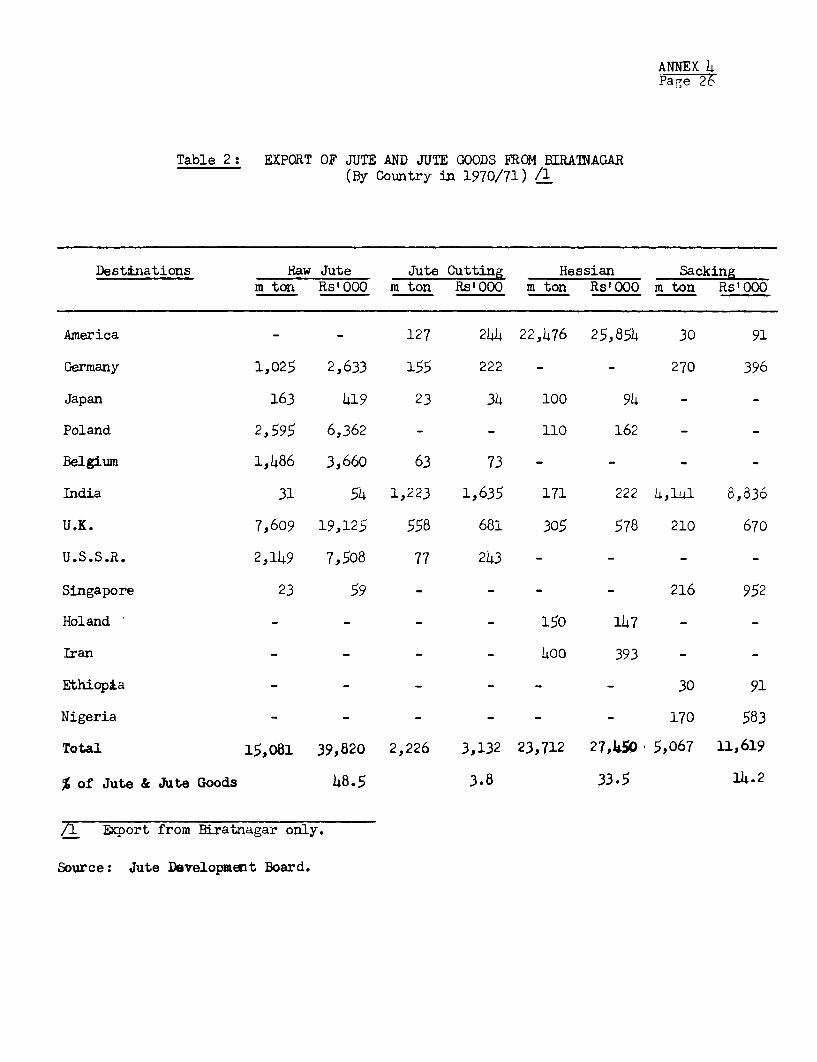
ANNEX 4Page 26
Table 2: EXPORT OF JUTE AND JUTE GOODS FROM BIRATNAGAR(By Country in 1970/71) /1
Destinations Raw Jute Jute Cutting Hessian Sackingm ton Rs'OOO m ton Rs'OOO m ton Rs'O0O m ton Rs'OOO
America - - 127 244 22,476 25,854 30 91
Germany 1,025 2,633 155 222 - - 270 396
Japan 163 419 23 34 100 94 - -
Poland 2,595 6,362 - - 110 162 - -
Belgium 1,486 3,660 63 73 - - _ -
India 31 54 1,223 1,635 171 222 4,14'1 8,836
U.K. 7,609 19,125 558 681 305 578 210 670
U.S.S.R. 2,149 7,508 77 243 - - - -
Singapore 23 59 - - - - 216 952
Holand _ _ _ _ 150 147 - -
Iran _o0 393 - -
Ethiopia - -- 30 91
Nigeria - - - - - - 170 583
Total 15,081 39,820 2,226 3,132 23,712 27,450Q 5,067 11,619
% of Jute & Jute Goods 48.5 3.8 33.5 14.2
/1 Export from Biratnagar only.
Source: Jute Development Board.
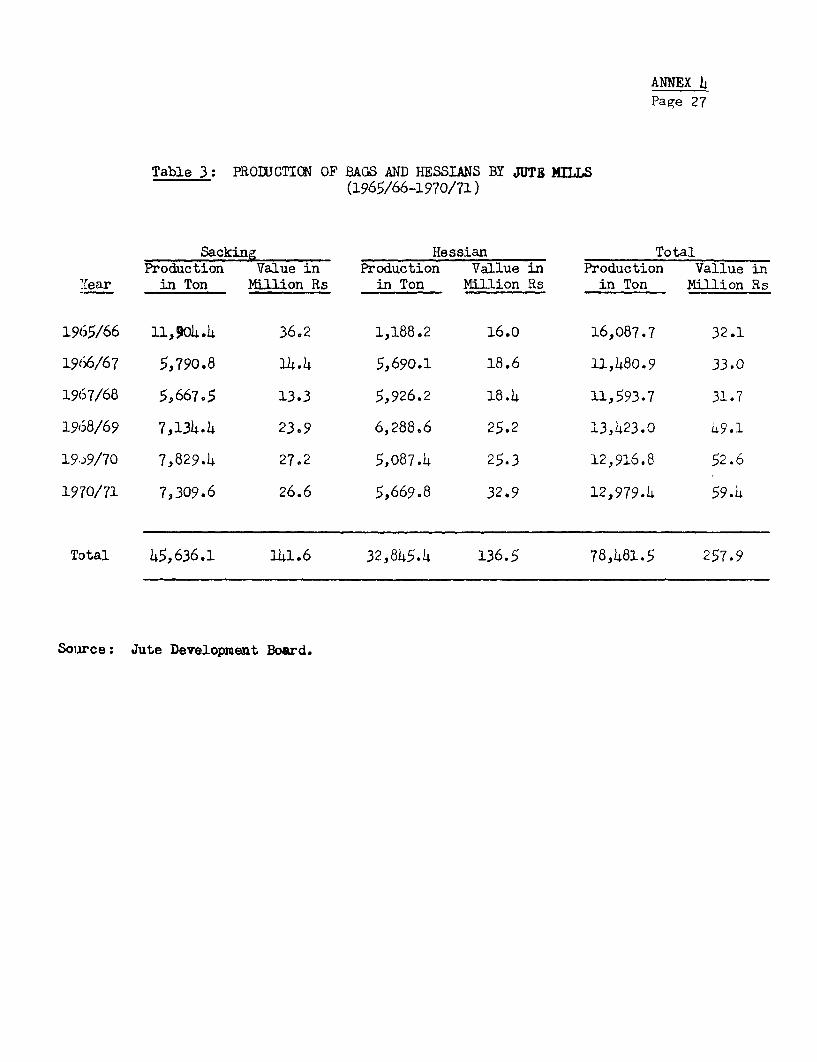
ANNEX 4Page 27
Table 3: PRODUCTION OF BAGS AND HESSIANS BY JUTE MILLS(1965/66-1970/71)
Sacking Hessian TotalProduction Value in Production Vallue in Production Vallue in
YCear in Ton Milion Rs in Ton Million Rs in Ton Million Rs
1965/66 11,904.4 36.2 1,188.2 16.0 16,087.7 32.1
1966/67 5,790.8 14.4 5,690.1 18.6 11,480.9 33.0
1967/68 5,667.5 13.3 5,926.2 18.4 11,593.7 31.7
19658/69 7,134.4 23.9 6,288.6 25.2 13,423.0 49.1
19.9/70 7,829.4 27.2 5,o87.4 25.3 12,916.8 52.6
1970/71 7,309.6 26.6 5,669,8 32.9 12,979.4 59.4
Total 45,636.1 141.6 32,845.4 136.5 78,481.5 257.9
Source: Jute Development Board.

Table 4: AVERAGE PRICES OF NEPALESE RAW JUTE (LIGHTNING) IN INTERNAL AND INTERNATIONAL MARKETS
(Rs/m ton)
Months/Year 1968 1969 1970 1971 1972Internal/l International/2 Internal International Internal International Internal International Internal International
J/F 2615 3158 3040 3787 2674 3388 2209 3364 3346 4187
F/M 2316 3122 2923 3775 2617 3400 2151 3379 3580 4216
M/A 2348 3086 2648 3812 2679 3436 2443 3412 3484 4107
A/M 2513 3061 2675 3836 2703 3491 2560 3465 3242 -
M/J 2635 3061 2583 3787 2732 3533 2584 3482 3336 -
J/J 2660 3098 2792 3691 2658 3618 2686 3594 3007 -
J/A 2651 3162 2760 3497 2570 3654 2713 3642 2975 -
A/S 2822 3279 2391 3364 2717 3485 2553 3582 2850 3550
S/O 2988 3340 2190 3340 2610 3372 2507 3551 2775 3550
O/N 3237 3557 2247 3328 2585 3560 2641 3501 2845 3550
N/D 3248 3787 2399 3388 2497 3340 2715 3752 2950 3550
D/J 3304 3812 2627 3412 2305 3364 2827 3879 n.a 3550
Average 2778 3294 2606 3585 2612 3470 2549 3550 3126 3783
/1 Free on rail, Biratnagar./2 C.i.f., United Kingdon.
Source: T.N. Pant, "The Jute Development Programme," Vyapar Patrika Vol. 10 No. 2 1972, .
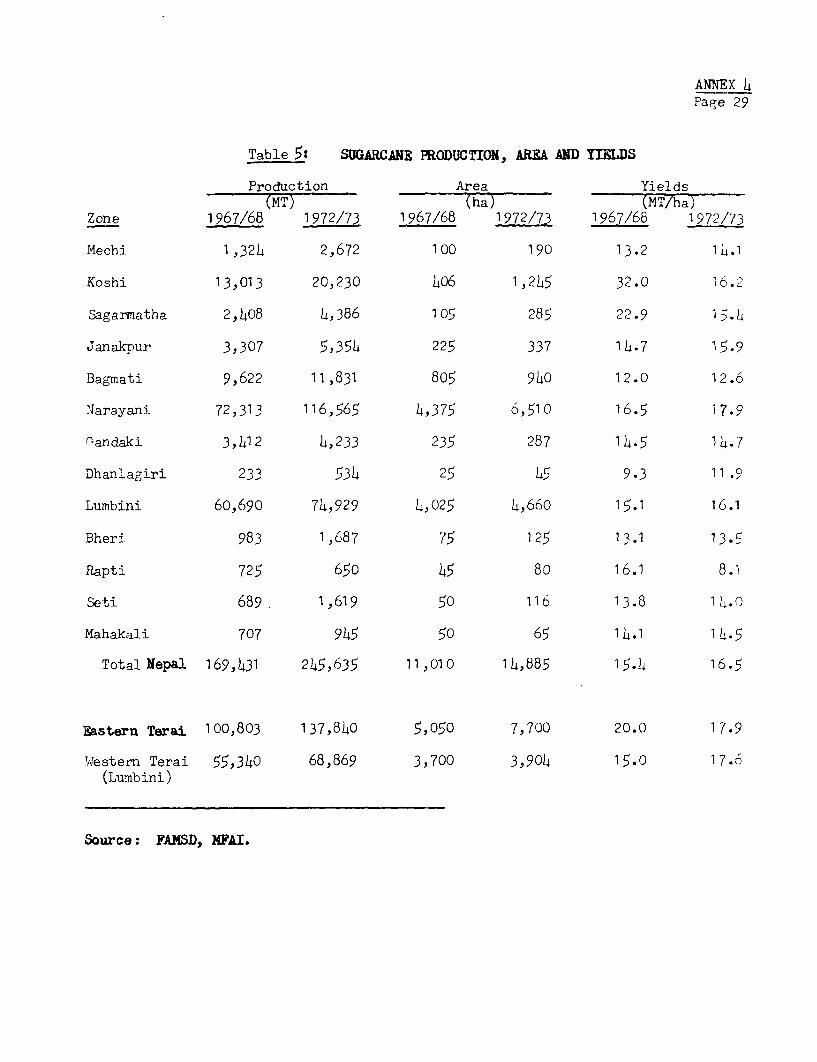
ANNEX Page 29
Table 5: SUGARCANE PRODUCTION, AREA AND YIELDS
Production Area Yields(MT) (ha) (MT/ha)
Zone 1967/68 1972/73 1967/68 1972/73 1967/68 1972/73
Mechi 1,324 2,672 100 190 13.2 1L.1
Koshi 13,013 20,230 h06 1,2!5 32.0 16.2
Sagarmatha 2,408 4,386 105 285 22.9 15.h
Janakpur 3,307 5,35h 225 337 1..7 15.9
Bagmati 9,622 11,831 805 940 12.0 12.6
Narayani 72,313 116,565 4,375 6,510 16.5 17.9
nandaki 3,412 4,233 235 287 1L.5 14.7
Dhanlagiri 233 534 25 45 9.3 11.9
Lumbini 60,690 74,929 4,025 4,660 15.1 16.1
Bheri 983 1,687 75 125 13.1 13.5
Rapti 725 650 45 80 16.1 8.1
Seti 689 1,619 50 116 13.8 14.0
Mahakali 707 945 50 65 14.1 14.5
Total Nepal 169,431 245,635 11,010 14,885 15.4 16.5
Eastern Terai 100,803 137,840 5,050 7,700 20.0 17.9
W1estern Terai 55,340 68,869 3,700 3,904 15.0 17.6(Lumbini)
Source: FAMSD, NFAI.
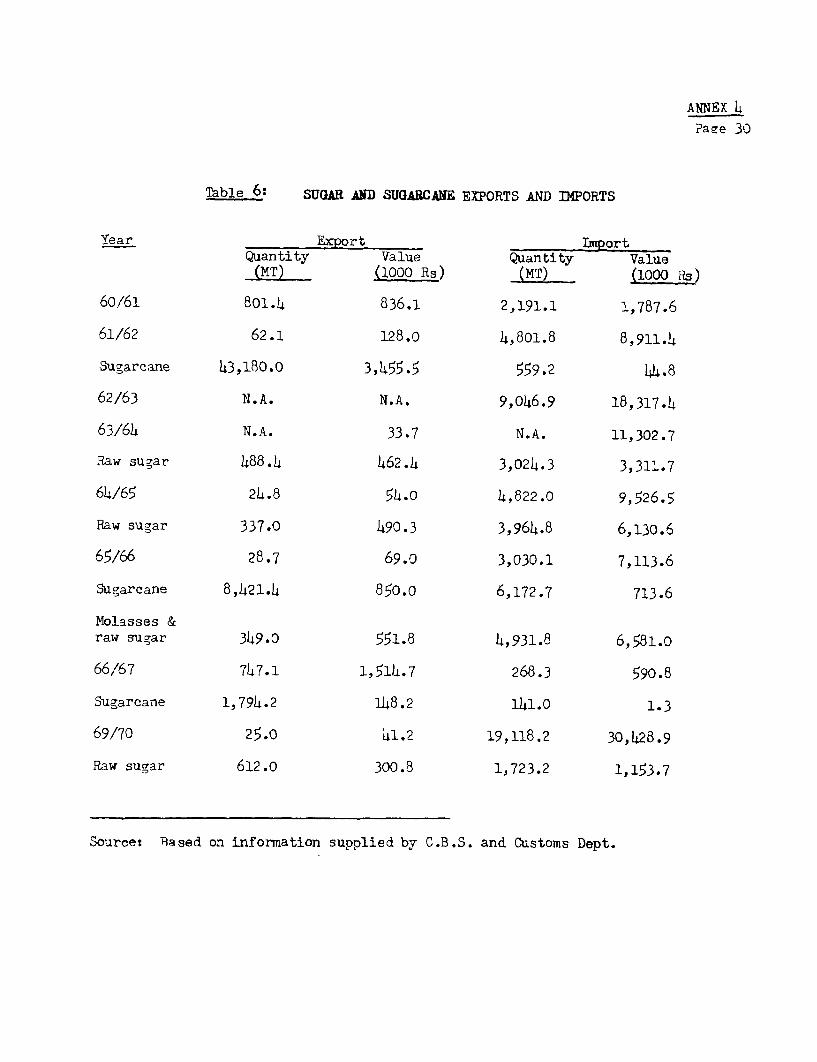
ANNEX 4
Page 30
Table 6: SUGAR AND SUGARCANE EXPORTS AND IMPORTS
Year Export ImportQuantity Value Quantity Value(MT) (1000 Rs) (MT) (1000 Rs)
60/61 801.4 836.1 2,191.1 1,787.6
61/62 62.1 128.0 4,8o1.8 8,911.4
Sugarcane 43,180.O 3,455.5 559.2 44.8
62/63 N.A. N.A. 9,046.9 18,317.4
63/64 N.A. 33.7 N.A. 11,302.7
Raw sugar 488.4 462.4 3,024.3 3,311.7
64/65 24.8 54.o 4,822.0 9,526.5
Raw sugar 337.0 490.3 3,964.8 6,130.6
65/66 28.7 69.0 3,030.1 7,113.6
Sugarcane 8,421.4 850.o 6,172.7 713.6
Molasses &raw sugar 349.0 551.8 4,931.8 6,581.o
66/67 747.1 1,514.7 268.3 590.8
Sugarcane 1,794.2 148.2 141.0 1.3
69/70 25.0 41.2 19,118.2 30,428.9
Raw sugar 612.0 300.8 1,723.2 1,153.7
Souree: Based on information supplied by C.B.S. and Customs Dept.
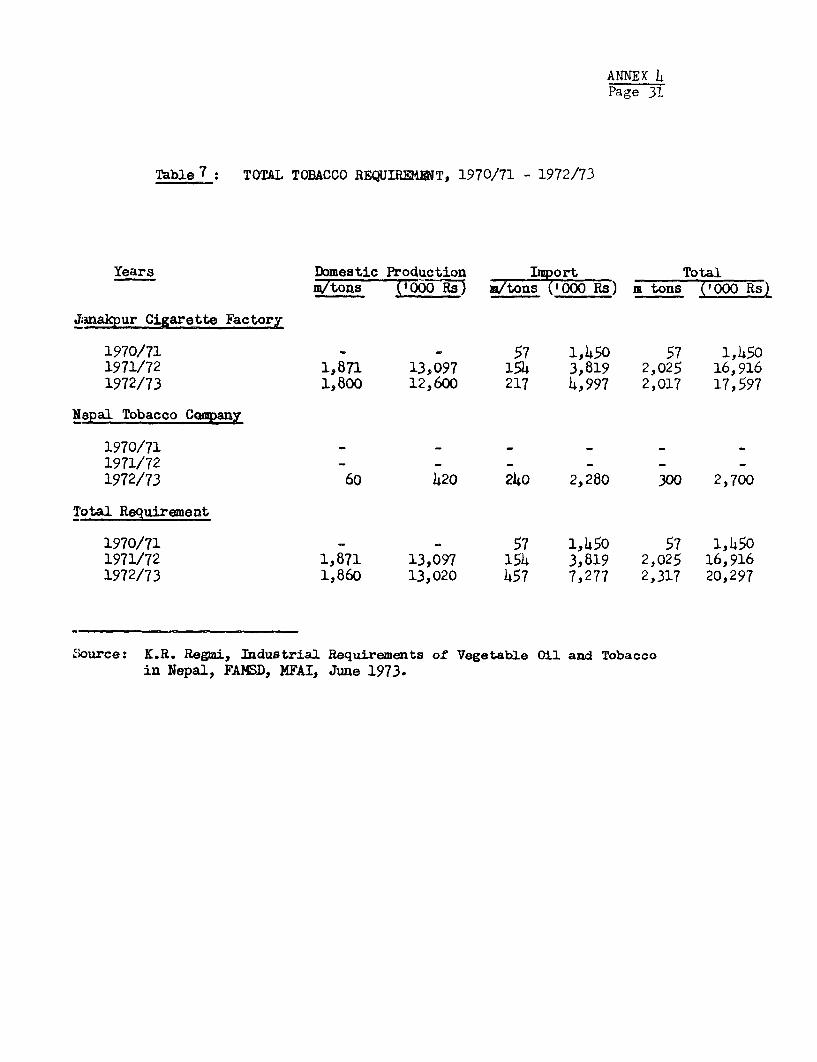
ANNEX 4Page 31
Table 7 : TOTAL TOBACCO REQUIREMMT, 1970/71 - 1972/73
Years Domestic Production Import TotalM7tons (OO0 Rs) /tons ('000 Rs) m tons ("000 Rs)
ZJ;nakpur Cigarette FactorZ
1970/71 - - 57 1,450 57 1,4501971/72 1l871 13,097 154 3,819 2,025 16,9161972/73 1,800 12,600 217 4,997 2,017 17,597
Nepal Tobacco CQany
1970/71 - - - - - -1971/72 - - - - -1972/73 60 420 240 2,280 300 2,700
Total Requirement
1970/71 - - 57 1,450 57 1,4501971/72 1,871 13,097 154 3,819 2,025 16,9161972/73 1,860 13,020 457 7,277 2,317 20,297
Source: K.R. Regini, IndustriaJl Requirements of Vegetable Oil and Tobaccoin Nepal, FAMSD, MFAI, June 1973.
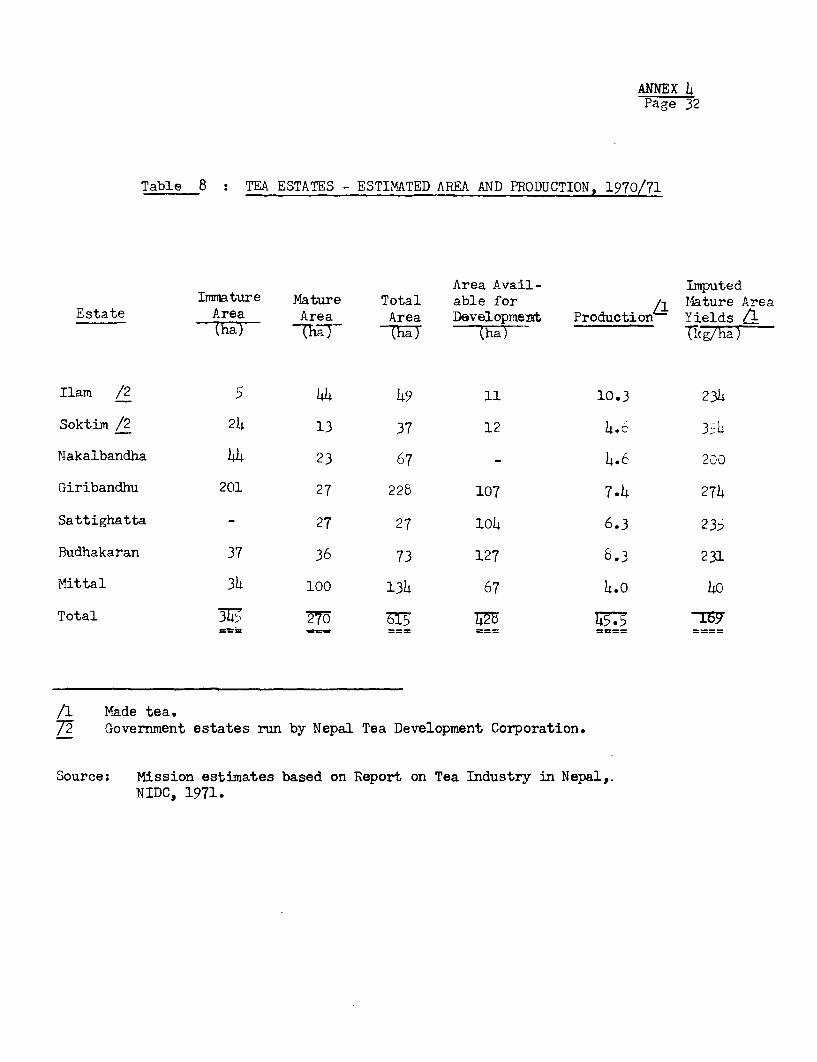
ANNEX 4Page 32
Table 8 : TEA ESTATES - ESTIMATED AREA AND PRODUCTION, 1970/71
Area Avail- ImputedImmature Mature Total able for 1Mature Area
Estate Area Area Area Developnent Production Yields /(ha) a,F (ha) (ha) Thcgha)
Ilam /2 5 44 49 11 10.3 234
Soktim /2 24 13 37 12 4.o 3.L
Nakalbandha 44 23 67 - 4.6 200
Giribandhu 201 27 228 107 7.4 274
Sattighatta - 27 27 104 6.3 235
Budhakaran 37 36 73 127 8.3 231
Mittal 34 100 134 67 4.0 40
Total 3vs 7FO E:;
/1 Made tea.7D Government estates run by Nepal Tea Development Corporation.
Source: Mission estimates based on Report on Tea Industry in Nepal,.NIDC, 1971.
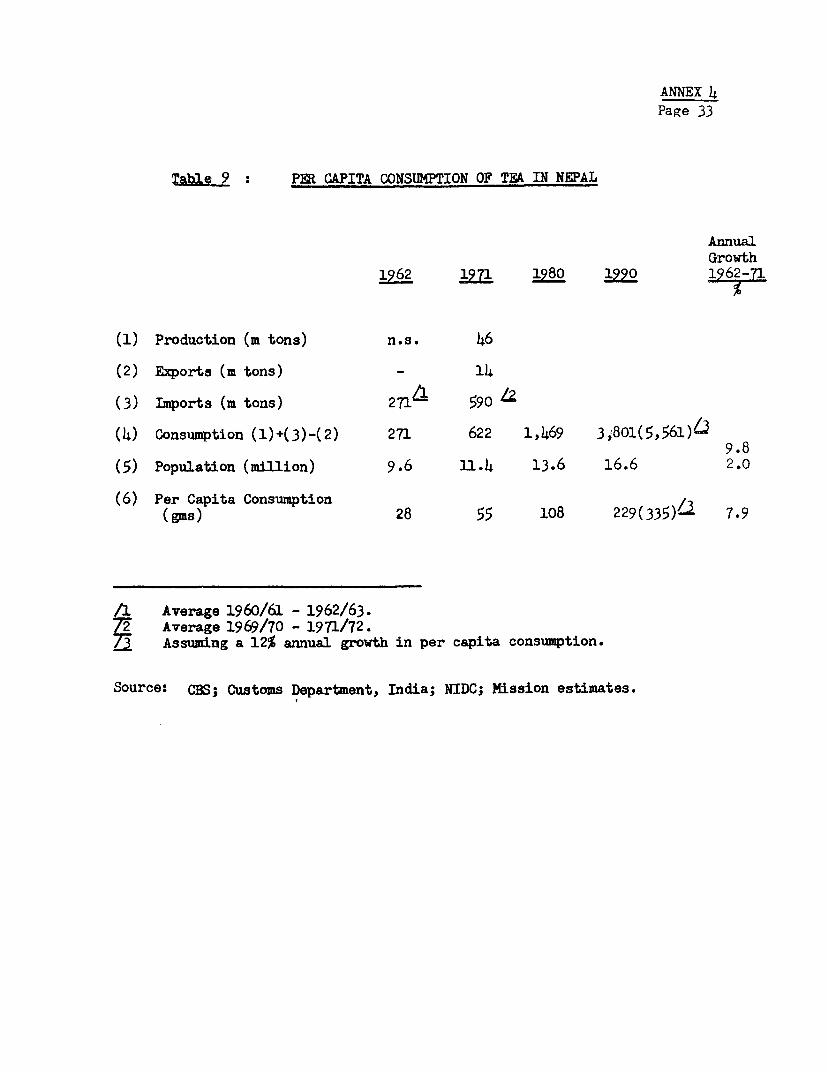
ANNEX 4Page 33
Q2:l& 9 PER CAPITA CONSUMPTION OF TEA IN NEPAL
AnnualGrowth
1962 19 1980 1990 1962-71
(1) Production (m tons) n.s. 46
(2) Exports (m tons) - 14
(3) Imports (m tons) 271 590
(4) Consumption (1)+(3)-(2) 271 622 1,469 3,801(5,561)/'9.8
(5) Population (million) 9.6 11.4 13.6 16.6 2.0
(6) Per Capita Consumption(gus) 28 55 108 229(335)L 7.9
/ Average 1960/61 - 1962/63.7 Average 1969/70 - 1971/72./3 Assuming a 12% annual growth in per capita consumption.
Source: CBS; Customs Department, India; NIDC; Mission estimates.
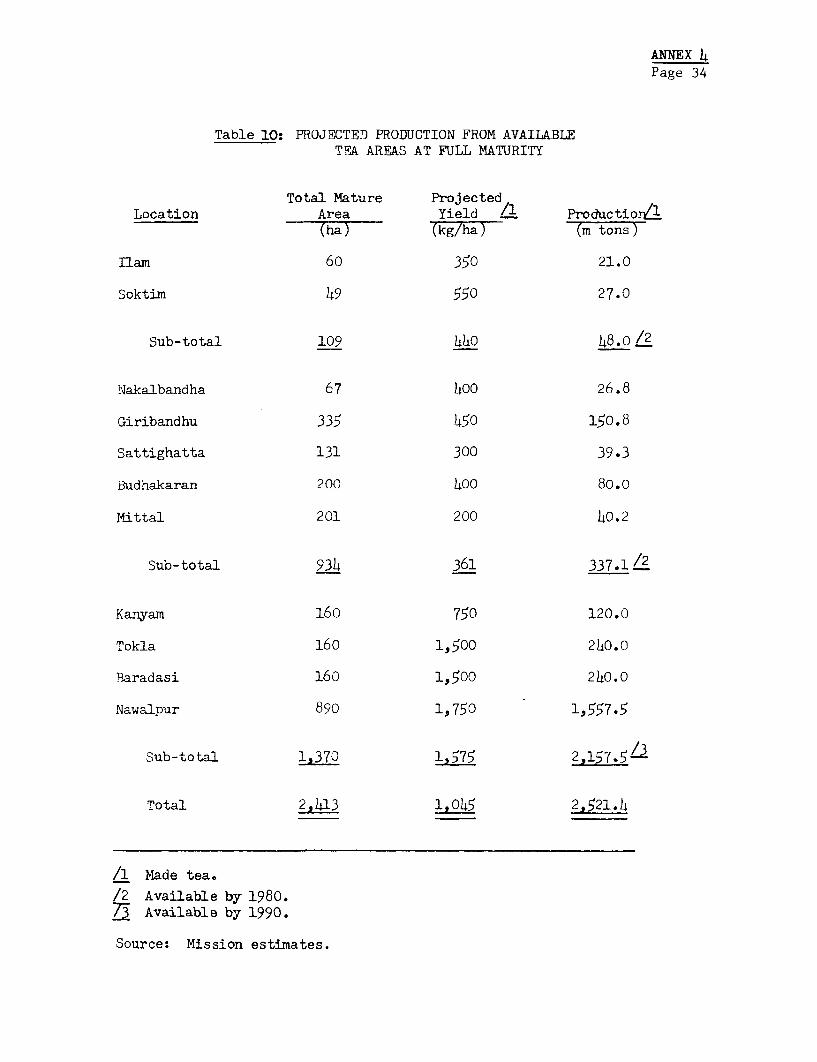
ANNEX 4Page 34
Table 10: PROJECTED PRODUCTION FROM AVAILABLETFA AREAS AT FULL MATURITY
Total Mature ProjectedLocation Area Yield / ProductiorZ/.
(ha) (kg/ha) (m tons)
llam 60 350 21.0
Soktim 49 550 27.0
Sub-total 109 44o 48.o /2
Nakalbandha 67 h00 26.8
Giribandhu 335 h50 150.8
Sattighatta 131 300 39.3
Budhakaran 200 400 80.0
Mittal 201 200 40.2
Sub-total 934 361 337.1 /2
Kanyam 160 750 120.0
Tokla 160 1,500 240.0
Baradasi 160 1,500 240.0
Nawalpur 890 1,750 1s557.5
Sub-total 1,370 1,575 2,157.5Z/
Total 2,L3 1,0_5 2,521_.
/1 Made tea.
/2 Available by 1980.J Available by 1990.
Source: Mission estimates.
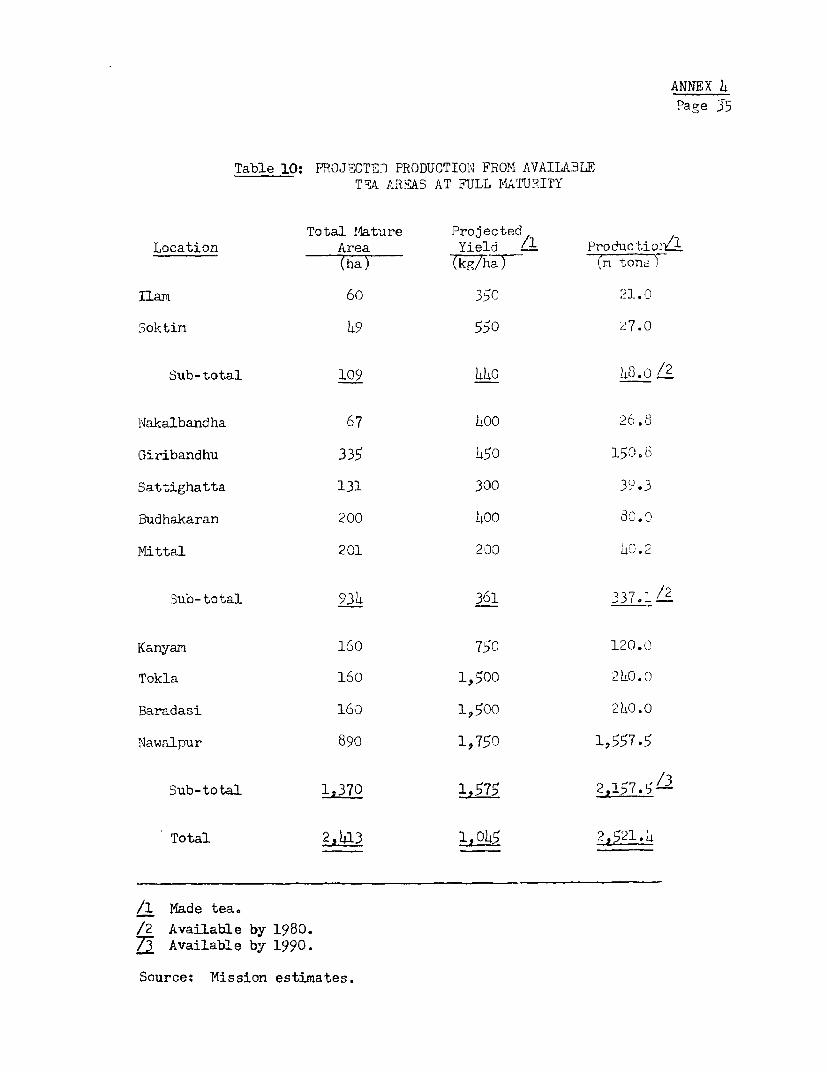
ANNEX 4Page 5
Table 10: PROJ;CTE_ PRODUCTION FROM AVAILABLET;A 3REAS AT FULL MATIJ?ITY
Total Mature ProjectedLocation Area Yield /l ProductiorZa
(ha) (kg/ha) (m tone
Ilam 60 35C 21.n
SDoktim 49 550 27
Sub-total 109 440 18.,3 /2
Nakalbandha 67 400 26.8
Giribandhu 335 450 150.6
Sattighatta 131 300 39.3
Budhakaran 200 400 30.0
Mittal 201 230 83.2
Sub-total 934 361 337.1l /2
Kanyam 160 750 120.0
Tokla 160 1,500 2L0.0
Baradasi 160 1,500 2h0.0
Nawalpur 890 1,750 1,557.5
Sub-total 1,575 2,157.5/3
Total 2,413 1.045 2 521.h
/A Made tea.
/2 Available by 1980.7 Available by 1990.
Source: Mission estimates.

ANNEX 5Page (i)
NEPAL
ACRICULTURAL SECTOR SURVEY
LIVESTOCK AND FODDER DEVELOPMENT
Paragraph
Number
SUThIARY AND CONCLUSIONS ............................. 1 - xiii
A. INTRODUCTION ........................................ 1 - 4
Livestock Production and Consumption .... ....... 5 - 7
B. LIVESTOCK HIUSBANDRY AND PRODUCTION
Productivitv of Buffaloes and Cattle .... ....... 8 - 11Yak and Chauri ....... .......................... 12 - 13Sheep and Goats ....... ......................... 14 - 17Pigs ........................................... 18Animal Nutrition ....... ........................ 19Grazing ........................................ 20Feed Requirements and Availability .... ......... 21 -- 23Animal Husbandry Research ..... ................. 24 - 25
C. LIVESTOCK PPODUCTS - "ARKETING AND I'TPOVEMENTS
Livestock Trading and Slaughter ..... ........... 26 - 30-ilk .. 31 - 34Ghee .. 35Wool . . 36
D. A STRATEGY FOR IMPROVING LIVESTOCK PRODUCTION ....... 37 - 38
Reduction of Animal Numbers .................. 39 - 40Improvement of Genetic Stock .... ............... 41 - 44Improverment of Pastures ..... ................... 45 - 50Improvement of Fodder Availability on Farms .... 51 - 53Yield Increases and Farmyard Manure .... ........ 54 - 56Integrating Fodder Crops with Existing Cropping
Patterns ........ .......................... 57 - 65
ANNEX 5Page (ii)
Paragrap-h
Number_
F. PROJECT POSSIBILITIES ............................... 66
Buffalo Breeding and Disrr-buton . ....... 67Fodder Crops and Livestock Ii:zeraciorL
Research and Exrensi.n .................. .. 68Processing of Livestock Prodlucts and Feed ...... 69 - 70Pig Development ................. 71Estimated Costs ................. .,.,, 79
Table 1. EstiTnates of Livestock Populatio.nTable 2. Cattle and Buffalo Ponulation per Hiusehod, ills and TraiaiTable 3. Estimates of Livestock Production
Appendix 1. Concentrate Production and UtilizationApDendix 2. Common Crop Rotations and The'iir Ability to Provid.e tre
Feeding Requirements of a tilicig gufffaloAnoendix 3. Alternative A.Droaches in Croppinn- Patterns to Integrate
Livestock with Crop Production
ANNEX 5Page i
NEPAL
AGRICULTURAL SECTOR SURVEY
LIVESToCK AND FODDER DEVELOPMENT
Summary and Conclusions
Livestock and Fodder Production
i. Llxestock, particularly cattle and buffalo, plays an importantrole in che way o, life in rural Nepal. Most livestock are reared for multi-tlurpcse use. Sheep, yak and chauries 1/ are important in the mountainre?.tiL. Alt.hough bullocks are particularly useful for draft and trans-P.,zrt4tion ir. the Teral., mules, horses, buffaloes and sheep are importantmea:-j of transoort in the Hills. The female bovine (especially the she-buff at,) lc an integral part of the farm household, providing possibly theoLy) source of animal protein, from its milk (or ghee), and dung for manureand fuel. Although cattle accounts for about 65% of the estimated bovinepo-)ilaticn of 9.7 M, the population of cows and she-buffaloes are approxi-matnly equal (3 M each). The livestock sector accounts for 15% of GDP.Nepal is, however, a net importer of live animals (mainly buffalo) forslaughter.
ii. The basic problem in improving the production of livestock andlivestock products is the livestock population pressure on existing fodderresources. The bovine (cattle and buffalo) population per holding (5.4) inNepal 2/ is nearly double the 3.9 for India. The pressure on forests andnatural pastures (particularly in the dry season) has been so great thatthe over grazed vegetation is hardly able to regenerate 3/. This problemis aggravated by the high percentage of unproductive animals (nearly 50% ofcattle are unproductive and the general low productivity of the productiveanimals 4/. The main causes for high livestock population pressure and the
1/ The chauries are off-springs from mountain cattle and yak. The femaleis used for milk production, and the male (which is sterile) is usedfor draught and transport.
21 The corresponding figures for Terai and Hills are respectively 6.24.4. This implies a bovine population per cultivated ha of 1.6 and8.8 respectively for the Terai and Hills. The latter figure is undulylarge as no account of hill and forest pasture grazing has been takendue to unavailability of data.
3/ The closure of stummer grazing areas in Tibet has aggravated theSituation even further.
4/ She-buffaloes average about 2 liters of milk/day, and local cowsyield only 0.7 liters/day. Bullocks are often too weak to produceth.e required dzaught for improved implements.
ANNEX 5Page ii
high percentage of unproductive cattle are the religious and legal prohibi-tion of cattle slaughter and the religious taboos associated with theslaughter of other female animals (especially buffalo).
iii. Within the religious context and the small farming system inNepal, improving the milk production of bovines should be the priorityconcern, rather than meat production. Not only are milk and ghee (butter-fat) production traditional activities, but the prospects of generatingsurpluses and improved incomes are greater.
iv. The low milk production of cattle and buffaloes is not only dueto competition between non-productive and productive animals for fodderand lack of improved breeds, but also to poor management and insufficientefforts to improve fodder availability. Productivity improvements shouldbe made at the following levels:
(a) Selective reduction of animal production.
(b) Improvement of genetic stock.
(c) Improvement of fodder availability.
v. Mass castration of inferior bulls and the prohibition of serviceto inferior cows is one solution frequently prescribed for the selectivereduction of animal population. Successful implementation is howeverconstrained by religious resistance and the difficulty of demonstratingthe economic advantages to the farmer. Even if such a scheme is implemented(para 40), some mechanisms have to be developed to prevent the rejectedanimals from grazing competively with "superior" animals and to provide dis-incentives to feed the unproductive animals by: (a) charging of differentialgrazing fees in village controlled grazing areas, and (b) increasing theprice for milk (which would probably be more feasible).
vi. We support the 1971 UNDP/FAO/SATA Livestock Development Missionsrecommendation that HMG concentrate its limited manpower resources inimproving the buffalo stock, particularly in the Lower Hills. With the pos-sibility of buffaloes replacing bullocks for draft in the Hills (particularlysince they utilize the available low quality feed more efficienty), HMG'sbuffalo breeding program should also breed for draft in addition to milkproduction. Other breeds like the Nili, Randi and the Kundu should also betried in addition to the Murrah.
vii. The improvement of forest and alpine pastures is virtuallyimpossible except in areas commonly grazed by a village or villages. Ex-cept in the Far Western Hills (and other areas where population densityis low), a large part of accessible Hill forests and forest pasture (of-ficially government) are claimed by villages for grazing. In these areas,village panchayats could, for example, be given legal rights to chargegrazing fees with unproductive animals having to pay higher fees. Inselected forest pastures where over-grazing is critical, rotational grazing
ANNEX 5Page iii
should be demonstrated and implemented through the village panchayat. Inregeneration areas, grazing should be prohibited for the period seedlingsneed to be established.
viii. W4ith the small holdings and relatively low foodgrain yields, it isgenerally unrealistic to expect the establishment of permanent pastures onfarms or even the substitution of part of the cropland for fodder production.Feasible changes can only be made with minimum competition for land underexisting or improved cropping systems. Livestock fodder on farm is pri-marily obtained by grazing on the residual straw of paddy - wheat or maize- fallow rotations. Under average yield conditions, the straw from paddy-wheat rotations (per ha) can supply all the dry matter (DM) and 84% of thetotal digestible nutrients (TDN) and about 16% of digestible crude protein(DCP) required for the maintenance of a milking buffalo. However, to pro-duce the increments to TDN and DCP required for milk production, averagegrain yield increases of about 40% and the supplementation of leguminousfodder, oilseed cake or concentrates are required l/.
ix. Integrating fodder legumes with traditional cereal cropping canbe further expanded 2/. WN'ith some prior phosphate fertilization, intersowingwith pulses (sunhemp, cowpeas, mung beans, rice beans, soybeans) betweenpaddy and maize and harvested with the grain crop followed by a second pulse,rop, one ha could produce sufficient roughage and green fodder to feed 1.5 -
2 milk buffaloes. This practice of intercropping with fodder pulses (part-:Lcularly for maize) followed by a second pulse crop would be more suited for!:he Hills because the main crop is usually planted earlier. The additionaladvantage against erosion by keeping the slopes under more intensive cover:'s also relevant.
'K. Insufficient emphasis has been placed in more extensive introduc-,ion and improvement of local fodder sources. The greatest potential comesFrom the production of turnips or radishes (Brassica spp) in the Hills. InJiri, 30 tons of roots were obtained from a ha of unfertilized radishes,sufficient to meet the annual needs for 2 milking buffaloes.
xi. Another advantage of increasing fodder availability is the in-,reased production of farmyard manure. Farmyard manure has an important:role as a source of nitrogen 3/ and potassium, particularly in the Hills,
I/ For the maize-wheat rotation (per ha) all requirements for milkingbuffalo are fulfilled except for 95 kg of DCP.
'/ In many hill areas, intercropping with soybean and some pulses ispractised, but primarily seeds.
3/ As a source of nitrogen, farmyard manure is more bulky, slower in itsaction and less effective than nitrogen available in inorganic ferti-lizers. Its soil improving properties are however particularly import-ant in lighter soils and in cooler Hill conditions where less leachingresults. INThen used as basal dressing it enhances the responise toinorganic fertilizer.
ANNEX 5Page iv
where accessibility and soil permeability problems predominate. Itsimoortance has not been sufficiently emphasized but the soaring costs ofinorg,anic fertilizers and the need for readily available substitute, makesit now imperative to do so. If proper care is taken to conserve manure,improved leguminous fodder availability could meet 25 - 50% of N and P and100% of K fertilizer recommended rates for foodgrains 1/.
xii. A number of important corollaries to fodder/livestock/crop cycleshould be noted. For instance, the irmportance of shorter duration grainvarieties and ploughing (especially for seedbed preparation) would permitbetter accommodation of fodder crops. In addition, stall feeding would benore feasible as more fodder becomes available on the farm itself, making iteasier to conserve manure. Any trade-off between using manure for fertilizerrather than for fuel can be resolved in favor of the former, as fuelwood isgenerally more available than fertilizer. With the introduction of fastgrowing species for fuelwood in waste areas of the farm (without competingwith present crops), the problem would also be less critical. Seed multi-plication and distribution of leguminous and root fodder should receive ashighi a priority as foodgrains. Initial dairy improvement programs shouldbe located around the centers programmed for processing plants for milkproducts. The establishment of processing units (particularly small gheeprocessing plants) should be considered as an important pre-requisite forproviding an improved marketing infrastructure for the improvement oflivestock production and integration with crops.
xiii. A livestock project is proposed, consisting of (a) buffalo breedingand distribution, (b) research and extension development for integratingfodder crops and livestock with foodcrops, (c) processing livestock productsand feed, and (d) poultry and pig development around key urban centers.
1/ Ranging from 50 - 150 kg N, 40 - 80 kg P2 05 and 20 - 40 kg K20 (with
rice and wheat at the lower levels and maize at the higher levels).
ANNNEX 5Page 1
NEPAL
AGRICULTURAL SECTOR SURVEY
LIVESTOCK AND FODDER DEVELOPMENT
A. INTRODUCTION
1. Livestock plays an important role in the way of life of rural Nepal.Although it is not regarded as an important source of income, in the Terai,it is an important and often the only source of cash income in the Hills.Livestock raising is a traditionally integrated part of the farm operationsin Nepalese agriculture. Oxen and, to a lesser extent, buffaloes providepower for the farm work. Bullocks are the major means of transportation inthe towns and rural areas of Terai, Inner Terai and Hill valleys. Mules, yaks,horses and even sheep are used for "trekking" in the Hills.
2. Cattle and buffaloes provide the major source of milk and dairyproducts. Rearing of milk animals, particularly she-buffaloes, is an in-tegral part of agriculture in the Hills as well as in the Terai. The milkis used for domestic consumption or sold as fresh milk. The major part ofthe milk production is converted into ghee, some of which is consumed locallyand some also exported to India.
3. Poultry and goats are important sources of meat throughout thecountry and are a source of cash income for the small farmers, expeciallyin the Terai and lower and middle Hills. In the mountain regions, sheep andyaks produce wool that is mainly used for clothing and blankets but surplusesare traded in the Terai or sold to the local cottage carpet industry. Poultryhusbandry is basically a backyard activity for egg and meat production,based on the feeding of farm by products and wastes.
4. Estimates of the livestock population (shown in Table 1) are notvery reliable but show an upward trend which is believed to be continuing 1/.This increase is expected because of the religious and legal prohibitionagainst killing cattle and she-buffaloes. The total cattle and buffalopopulation is 9.7 million head, of which 6.2 million is cattle. This cor-responds to about 5.4 2/ bovines (cattle and buffalo) per holding which isnearly double the 3.9 heads of bovines per holding in India. Numerous
1/ K. Pandey, Livestock Officer, Department of Agriculture.
2/ On the basis of the farm management study (1968/69) average numbers ofcattle and buffaloes per household in the Hills and the Teral wererespectively 4.4 and 6.2 (Table 2). Since the average size of holdingswere respectively 0.5 and 2.6 ha, apparent bovine population pressureper hectare were 8.8 and 2.4 respectively for the Hills and the Terai.
ANNEX 5Page 2
landlords, with large holdings, keep large numbers of cattle, not for econo-mic purposes but for religious and prestigious reasons. The unusually highproportion of female buffaloes (86%) reflects the religious taboos againsttheir slaughter and their economic value to the farm household as providersof milk and ghee (butterfat) for food, and dung for manure and fuel.
Livestock Production and Consumption
5. Because of heavy domestic consumption by farm families, the totalproduction of animal products is difficult to assess and the estimates shownin Table 3 should only be used as indications of trends.
6. The livestock sector contributes about 15% of GDP. The value ofmilk and milk products (Rs 955 million) was 68% of the total value of live-stock production in 1968/69 1/ (Annex 8, Table 4). In 1966/67 1/ the propor-tion of livestock animal products in total agricultural exports was 7%.About 1,700 m tons of ghee valued at Rs 20 M were exported to India 2/. Nepalis however a net importer of livestock and livestock products valued at aboutRs 108 million, comprising mainly live animals. About 160,000 heads of liveanimals, of which about 50,000 are buffaloes and 50,000 are goats, areimported annually from India. Most are transported on hoof via the Hetauraroad to Kathmandu for slaughter 3/. Because of lower feed availabilities,buffaloes from India are offered at competitive prices in Nepal.
7. Annual per capita consumption of meat in Nepal is estimated 4/ tobe 5.2 kg in 1970. Buffalo (2.7 kg/capita) and poultry (1.5 kg/capita)are the main sources of animal proteins. Sheep and especially goats (0.6kg/capita) are popular during festivals. Nepal's per capita milk consump-tion of 60 kg compares very favorably with the average consumption of 30 kg/capita in Asia and the Far-East 5/.
B. LIVESTOCK HUSBANDRY AND PRODUCTION
Productivity of Buffaloes and and Cattle
8. The productivity of a pair of bullocks at the plough varies from0.8 - 3.2 ha ploughing per day. The bullocks are often too weak to produce
1/ The latest year for which data was available.
2/ Statistical Annex, Table 37.
3/ UNDP/FAO/SATA, Report of the Nepal Livestock Mission, Rome, 1971;C.Y. Lee Marketing of Livestocks and Livestocks Products in Nepal, 1971.
4/ Given the date base, these figures are considered indicative. Thederivation is given in the Statistical Annex, Table 32.
5/ FAO, Agricultural Commodity Projections, 1970-1980, Rome, 1971.
ANNEX 5Page 3
the required draft for improved ploughs or other improved implements. Onthe average, but varying according to farm size, the number of bullocks andshe-buffaloes kept per holding is generally higher in the Terai than in thehill districts. In the Kathmandu Valley, where most of the soil preparationis still done by hand 1/, the bullock population for draught purposes is verylow and draft buffaloes are relatively few.
9. The milk yield of she-buffaloes is reported to average about 2liter/day or between 400-500 kg per lactation, to which 300 kg should beadded as consumed by the sucking calf. Daily production of 4-5 liter/dayduring a 300 day lactation have been reported (mainly for larger farmers)with access to credit and feed purchases). Butterfat content varies from7.5-8% and the average lactation period is from 8-10 months. The localcattle reportedly yield only 0.7 liter/day which is about a third of theyield of buffaloes, with a much lower butterfat content 2/. The 3.2 millioncows are estimated to produce 178,000 m tons of milk versus 400,000 m tonsproduced by 2.9 million she-buffaloes 3/.
10. With the present composition of the cattle population, where noculling and slaughter is permitted in either sex, cows are generally veryinefficient and uneconomical milk producers. The low productivity of cattleand buffaloes is not only due to age and poor genetic make-up of the avail-able breeds, but also to poor management and insufficient feeding. Animalslive mainly on paddy straw supplemented with green roughage during the mon-soon are not suitable for intensive production and become vulnerable to manydiseases. Although buffaloes generally receive more care and better feedingthan cattle, even their nutrition leaves much to be desired.
11. Except for the importation of Murrah buffaloes from India, littlehas been done to improve the genetic potential of local milk producinganimals. However, livestock development farms have been set up at Lalitupur,Rampur, Biratnagar, Nepalganj and Pokhara and the Swiss Association forTechnical Assistance (SATA) Rural Development Project at Jiri also breedsimproved Murrah buffaloes for distribution to the farmers. The demand byfarmers near these stations greatly exceeds the potential supply of thebreeding herds.
Yaks and Chauri
12. Yaks and naks (female yaks) are high altitude animals which livein the Himalayan zone at an altitude of about 3,000 m. Yaks and naks aremated with local mountain cattle to produce Urang Chauries, Dimzo Chauries,respectively, for milk production. The male offspring are sterile and areused for ploughing the potato and barley fields and as pack animals. The
1/ Farm Management Study of Nepal 1968/69, EAPD, 1971. DADO, Kathmandu(Personnel Communication).
2/ FAO, International Scheme for Coordination of Dairy Development, Nepal,AGA/Misc/yl/33, September 1972.
3/ Report Nepal Livestock Development Mission - UNDP/FAO/SATA, Dec. 1971.
ANNEX 5Page 4
main breeding season is July to August. The estimated calving percentageof naks and chauries is 60-70%. The age of naks and chauries at firstbreeding varies from 3 - 3-1/2 years. Both have lactations from 6-9 months.Estimated yields are 1.5 liter/day at 7-9% butterfat and 2.5 liter/day at5-8% butterfat for naks and chauries, respectively 1/.
13. Families who live in the high mountain regions may own 6-30 yaksand chauries, along with some sheep. An individual chauri-keeper generallymaintains 10-20 animals; less than 10 is considered uneconomic. A herd ofthis size will carry one or two bulls. The sole objective of mating is toproduce a lactation. The chauri calves are allowed to die. Transhumanceis commonly practiced. The migration starts early April and the herds movefrom pasture to pasture and reach the summer pastures near the snow-line inabout 2 months. Each family has a permanent camping summer grazing areas.The animals return to the camps in the evening for milking. Chaurieslet down their milk without being stimulated by a sucking calf. Cheesefactories have been established by the Nepal Dairy Corporation (NDC) atLangtang, Thodung and Pike to collect milk from the surrounding camps andto process it into semi-herd and hard cheese and butter. In areas wherethere are no cheese factories, the milk is converted into ghee. Duringwinter they are driven to lower altitudes where they have to survive onleaves from evergreens.
Sheep and Goats
14. About 2 M sheep are kept throughout Nepal, 75% of which aremountain sheep living up to altitudes of 18,000 feet in summer and at loweraltitudes in winter, sometimes as low as 1,000 - 2,000 feet. Kage sheep areprimarily raised for meat. In the Terai, adult rams and ewes weigh about23 and 15 kg respectively, but in the Hill valleys their weights tend to belower. Despite very low fleece weight (less than 1 kg from a mature ewe)shearing of Kage sheep is practised, and the coarse wool is used locallyfor the weaving of carpets. Instead of being raised in large flocks, theyare kept in small numbers by farmers and graze on wayside grasses and onpaddy bunds. At night they are kept inside for manure production. Theylamb twice a year. Wethers are sold for slaughter at 1 - 1-1/2 years ofage 2/.
15. There are several breeds of mountain sheep of which the Baruwalor Tibetan sheep is predominant in the Alpine region. Baruwal are kept toprovide wool, meat and manure. They produce a much finer quality wool thanthe Kage sheep. Shorn twice a year (March and October), a mature ewe yieldsabout 1 kg of wool. This wool is used mainly for the weaving of garments,blankets and carpets. Surpluses are however "exported" to the High valleysand Terai. The liveweight of the Baruwal rams and ewes average about 40 kg
1/ UNDP/FAO/SATA, Nepal Livestock Development Mission Report, Rome, 1973.
2/ R. B. Griffiths, Nepal Animal Husbandry, Production and HealthCountry Study 1966, FAO, Rome, 1967.
ANNEX 5Page 5
and 25 kg respectively. Transhumance of the Baruwal flocks is practised.A single family may own 20-30 sheep, but the sheep are gathered into flocksof 200-300 head herded by each of the owners in rotation. In winter theflocks are grazed at 6,000-7,000 feet or even lower, where wheat and barleyfarmers encourage grazing on the stubble on the fallow cereal land. LMostewes lamb only once annually (mainly in December-January). Wethers aresold for slaughter at about 1-1/2 years. Culled ewes are usually kilLedand the mortality of the lamb herd is very high (70-85%) due to attacks byjackals and leopards or grazing on poisonous plants.
16. Goats are maintained throughout Nepal mainly for meat purposes.Their population is estimated at 2.2 million. Their conception-rate isabout 3 times in 2 years. The mortality rate of the kids is about 50%.They reach their full liveweight of 35-40 kg in about 2 years after whichthey are killed. Their carcass weight is around 15 kg.
17. The increasing use of arable land for winter cropping restrictswinter grazing and creates problems in transhumance operations due to dis-ruption of the migration routes and decrease of pasturage along these routes.The present production of the sheep and goat industry is estimated at 2,700tons of mutton, 2,900 tons of goat meat and 3,600 tons of greasy wool. Theestimated annual off-take (slaughter) from the national sheep and goat flocksis low at respectively 8.5 and 10.8%. The country also imports about24,000 goats for slaughtering and 300 tons of good quality carpet wool tomeet present requirements 1/.
pigs
18. The total pig population is estimated at 300,000 of which morethan 95% are of the Susvittatus type (wild pig of East Asia). They areusually raised in backyards and fed on farm waste and allowed to scavengeon village garbage. Some commercial production of pigs are undertaken inKathmandu and the larger Terai towns (e.g., Birganj, Janakpur).
Animal Nutrition
19. The most serious constraint on livestock husbandry and productionis the scarcity of adequate feed. Overpopulation of animals and almostcomplete absence of systematic fodder production and proper pasture manage-ment have led to a countrywide shortage of roughage. Except on Governmentfarms,.there are few enclosed pastures. The existing pastures are justsufficient to feed the cattle during the rainy season between July andSeptember. Thereafter only coarse grasses are available. All cultivableland is used for food crop production and fodder crops are hardly grown.Ruminant stock subsist very largely on crop stubbles, wasteland and forestgrazing. Sometimes hay of soybeans, field peas or lentils (cut at the greenstage) may be fed to milk animals. The feeding of concentrates is not widely
1/ Report Nepal Livestock Development Mission UNDP/FAO/SATA, Rome,Dec. 1971.
ANNEX 5Page 6
practised 1/. Some mustard cake and maize is fed with rice straw to draftanimals and milk buffaloes during the dry season, but the major part of thecattle population does not receive concentrate feed. Feed mixing plants inNepal have an annual capacity of only 10,000 tons per year (primarily fromthe government-owned plant in Hetaura) and are producing mainly poultry feed.Paddy and wheat straw are the main source of roughage during the dry seasonin the Terai as well as in the lower and middle Hills for milk cows andshe-buffaloes, whereas during the monsoon they feed on coarse grass andweeds cut from roadsides or walls and terraces above the reach of grazinganimals.
Grazing
20. In the Terai and Inner Terai, large herds of cattle and buffaloesgraze the forests. The burning of the grasses at the end of the dry seasonto stimulate new growth is practised indiscriminately, often causing damageto trees and preventing satisfactory generation of perennial grasses. Thesituation is further aggravated by the lack of common herding of stock inthe grazing areas. Numerous herds ranging from 50 to several hundred headsgraze haphazardly. Forest grazing takes place in the Hill regions but ithas been so abused that the combined effects of overgrazing, lopping ofbranches and uncontrolled cutting for firewood have led to the disappearanceof some forest stands in the Churia and Mahabharat Ranges 2/, particularly inthe valleys and watersheds. Conditions are also serious in some of the higherconiferous forests between 8,000 - 10,000 feet, where the chauries aregrazed in the winter. More care seems to be taken in the Khumbu regionwhere the Sherpa villages appoint a "forest ranger," who is responsible forthe forests and use of pastures. Although the forests are declared nationalforests by the Forest Act of 1961, the Forestry Department is generally un-able to control the use of hill forests. The villages regard them as villageproperty and common grazing ground. The pressure exerted on both forest andpasture especially for cattle (roughly 50% of which is unproductive) is sogreat that the over-grazed vegetation is hardly able to regenerate. Thecritical grazing period is between January and April in the high mountainsand from January to June at lower altitudes. The situation has been consider-ably aggravated within the last few years by the increased cattle numbers inthe South and by the closure of the traditional summer grazing areas in Tibet.
Feed Requirements and Availability
21. No work has been undertaken in Nepal to determine the feed require-ments of the various types of animals for optimal performance and production.With an average daily maintenance of 5 kg green fodder, 12.5 dry fodder and
1/ Details on concentrate production and utilization are given inAppendix 1.
2/ R. B. Griffiths, Nepal Animal Husbandry, Production and Health,Country Study 1966, FAO 1967.
ANNEX 5Page 7
0.5 kg oilcakes per day 1/, the annual requirements for the present 9.7 mil-lion head of cattle and buffaloes would be 19.4, 62.5 and 1.9 million m tons,respectively 2/.
22. Even with optimistic assumptions, the amount of straw (dry fodder)produced from 1.9 million ha cereal land is estimated at only 3.5 million mtons. Assuming a yield figure of 5 m tons green roughage/ha from the 4.5
million ha forest land, 22.5 million m tons green roughage is available. Theproduction (60,000 m tons) of oilseeds 3/, mainly mustard, will yield about35-40,000 m tons of oilseed cake. These calculations clearly show the ln-adequacy of the present farming system and feed resources to maintain thepresent livestock population, let alone increase the production of milk anddraft power.
23. Although the use of feed-mixing units is increasing, they will notbe able to satisfy total requirements. With the present efficiency of milkinglivestock, providing the necessary nutrients for maintenance and basic pro-duction in the form of concentrates is marginally economic 4/.
Animal Husbandry Research
24. Research on animal husbandry, and pasture and fodder is of recentorigin and is seriously handicapped by shortage of funds and experiencedstaff. Most of the activities consist of rearing improved milk buffaloesand cows on government farms for distribution to farmers. For this purpose,a number of Murrah bulls and Haryana bulls have been imported from India.The cost of the improved she-buffaloes to the farmers varies betweenRs 1,230-1,470 5/. The demand for improved she-buffaloes far outstripspotential supplies from government farms.
25. Screening of suitable pasture and fodder species started some yearsago and is conducted at Rampur, Kumaltar, Pokhara and Lantang. Some yielddata are available but the nutritive value has not been determined. Researchinto the feeding requirements of milk and draught animals has yet to bestarted. Pasture species under investigation that hold some promise areTeosinte (Sorghum bicolor), Dichanthium annulatum, Botriochloa pectusa,Cenchrus cilliaris , paragrass (Brachiaria sp), Hybrid Napier (Pennisetumpurpureum) for the Terai and lower altitudes up to 6,000 ft. Ryegrass,cocksfoot and white clover (Langtang, Jiri) are being tested at higher
1/ R. 0. Whyte & M. L. Mathur, The Planning of Milk Production in India.
2/ The requirements of small animals like goats and sheep should beadded to these estimates.
3/ Agricultural Statistics of Nepal EAPD, MAI, 1972.
4/ For example, 1 kg of concentrate mixture sold at Rs 1.45/kg (1972 price)will produce an additional amount of about 2.0 kg milk valued atRs 1.50-1.86 per liter (6% butterfat) in the Kathmandu Dairy. Source:C.Y. Lee Marketing of Livestocks and Livestock Products in Nepal EAPD,June 1971.
5/ ADBN Impact of Bank Loan on Dairy Enterprise and Financing Programmeover 1973/74-1979/80, March 1973.
ANNEX 5Page 8
altitudes. The problem with temperate grasses and legumes so far tested isdormancy and slow growth in winter and their reseeding capacity.
C. LIVESTOCK PRODUCTS - MARKETING AND IlIPROVEMENTS
Livestock Trading and Slaughter
26. Except for a few places like Jitpur (near Birganj in CentralTerai) for buffaloes, and Khumbu, Rollwalling and Rasuwa (in the Himalayanregion) for chauries and yaks, there are no organized marketing centers forspecific livestock types.
27. Cows and bullocks are very commonly traded, but they are generallylimited to the same locality or district. In the case of chauries and yaks,there exists a definite marketing channel starting with the trader, whocollects the sterile male offspring of cross-breds between yaks and mountain-cattle and sells these in the adjoining areas of Tibet in exchange for naks(female yaks). These naks are sold to the breeding centers in Nepal wherethey are crossed with "jollung" bulls to produce chauries. She-buffaloes aremarketed purely for milking purposes and they move from the Nepal and IndiaTerai into the Hills districts, although in many hill districts replacementstock is reared locally. The trade is more or less confined to the samedistrict 1/.
28. Although locally reared male buffalo calves are traded forslaughtering, he-buffaloes for the Kathmandu market are largely importedfrom India, because of high calf mortality. Sheep normally are not tradedfor meat except for the Dashahara festival. Sales of flocks of sheep occurin the mountain areas. There is no organized pig trading.
29. The present marketing channels for buffaloes and goats are dis-organized and unregulated. Although about 60,000 buffaloes and 50,000goats are traded annually through the Birganj-Kathmandu road, there are noorganized livestock trading centers. The market value of each animal isdetermined by inspection and guesswork whereby the price is negotiatedbetween seller and buyer. The buyer is the middleman who sells to thebutchers. The butchers, who have a meat selling license, slaughter in openplaces or backyards and sell the meat themselves or to the retailers.
30. As long as the killing of cattle is not permitted, meat consumptionwill be mainly limited to goat and buffalo meat although pig and poultrymeats are becoming increasingly popular. Organized slaughter is still at aninfant stage. A slaughter-house and meat processing plant is under construc-tion at Hetaura with a planned capacity of 50 buffaloes, 50 pigs and 800 heads
1/ R. M. Upadhyaya, Marketing of livestock and livestock products inNepal, Agricultural Marketing Conference, Kathmandu, 1973.
ANNEX 5Page 9
of poultry per day. It is estimated that this plant will have a productionof 1,700 m tons buffalo meat, 1,100 m tons pig meat and 135 m tons chicken and165 m tons duck meat 1/. This slaughterhouse will draw its main supply fromcentral Terai and Chitwan, and plans to eventually have its own farm for theraising and fattening of buffalo calves. It will be operated as a limitedcompany, with the Nepal Industrial Development Corporation (NIDC) as majorshare holder. Buffaloes will be purchased on liveweight basis and a priceRs 0.70 per kg liveweight has been fixed. This arrangement is aimed atsubstituting for imports of buffaloes and goats from India. Cold storagefacilities exist in Kathmandu and Birganj. A cold storage plant is underconstruction in Biratnagar and similar plants are planned for Janakpur andNepalganj. An assessment of the feasibility of simple slaughterhouses inthese towns should be made, especially for the slaughtering of small farmanimals such as goats and pigs. In most areas, the installation of simpleslaughter sheds would be sufficient.
Milk
31. Milk and milk products are the most acceptable source of animalprotein in Nepal. The potential gains from expansion of dairy developmentand marketing provide an important means for increasing farm income. Allfarmers keep buffaloes for milk production, and surpluses above their ownrequriement are sold as liquid milk or converted into ghee (see para 35).In Kathmandu, a special bonus is paid to those who deliver their milk to theNepal Dairy Corporation (NDC), but competition with private vendors is quitekeen. These vendors of raw milk collect their supplies from individualproducers within a radius of 5-6 miles of the towns. The Central Dairy inKathnandu has a pasteurization plant and a chilling tank with a capacity of3,000 liter and a bottling machine. The milk is standardized at 2.5% butter-fat and 9% non-fatty solids by partial skimming and reconstitution withskimmed milk. Cream and butter are manufactured as by-products. There aremore than 20 milk collecting centers spread in the peripheral rural areasof Kathmandu, Lalitpur, Bhaktapur and Kavre districts. It is estimated thatDDC receives less than 25% of all the milk consumed in the Kathmandu Valley 2/.From the point of view of product outturn, the operation in Kathmandu hasbeen quite successful.
1/ Nepal Industrial Development Corporation.
2/ UNDP/FAO/SATA, op. cit.
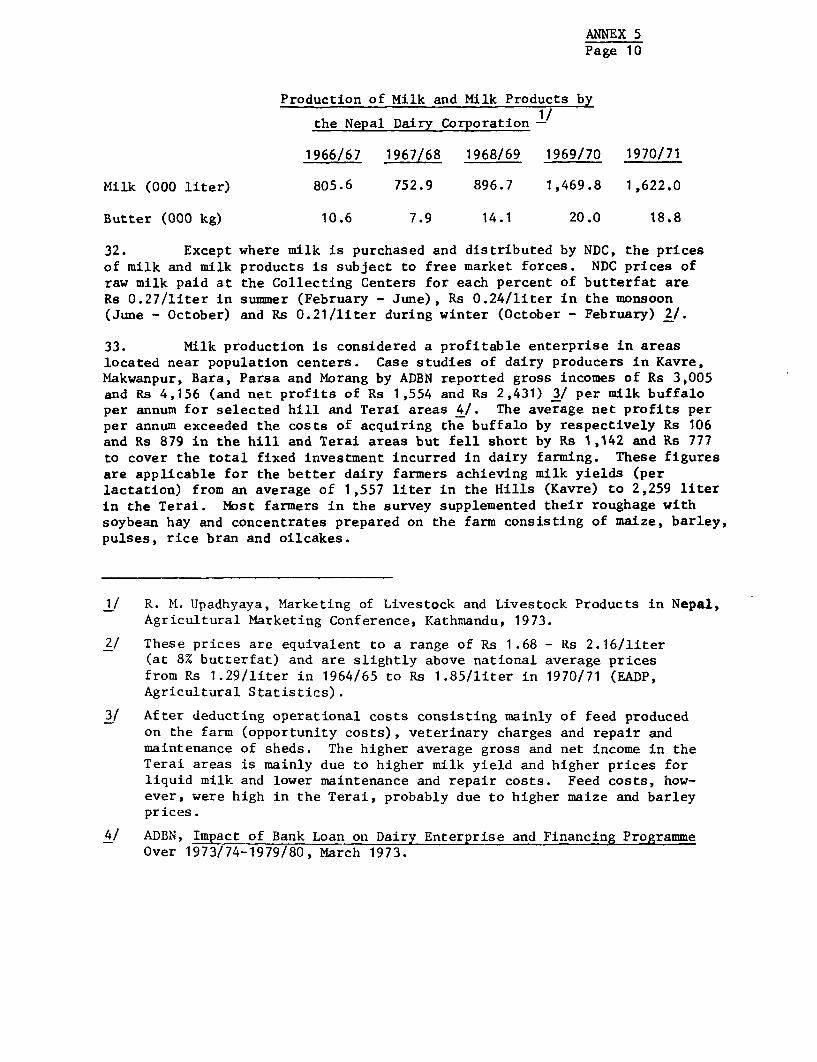
ANNEX 5Page 10
Production of Milk and Milk Products by
the Nepal Dairy Corporation -/
1966/67 1967/68 1968/69 1969/70 1970/71
Milk (000 liter) 805.6 752.9 896.7 1,469.8 1,622.0
Butter (000 kg) 10.6 7.9 14.1 20.0 18.8
32. Except where milk is purchased and distributed by NDC, the pricesof milk and milk products is subject to free market forces. NDC prices ofraw milk paid at the Collecting Centers for each percent of butterfat areRs 0.27/liter in summer (February - June), Rs 0.24/liter in the monsoon(June - October) and Rs 0.21/liter during winter (October - February) 2/.
33. Milk production is considered a profitable enterprise in areaslocated near population centers. Case studies of dairy producers in Kavre,Makwanpur, Bara, Parsa and Morang by ADBN reported gross incomes of Rs 3,005and Rs 4,156 (and net profits of Rs 1,554 and Rs 2,431) 3/ per milk buffaloper annum for selected hill and Terai areas 4/. The average net profits perper annum exceeded the costs of acquiring the buffalo by respectively Rs 106and Rs 879 in the hill and Terai areas but fell short by Rs 1,142 and Rs 777to cover the total fixed investment incurred in dairy farming. These figuresare applicable for the better dairy farmers achieving milk yields (perlactation) from an average of 1,557 liter in the Hills (Kavre) to 2,259 literin the Terai. Most farmers in the survey supplemented their roughage withsoybean hay and concentrates prepared on the farm consisting of maize, barley,pulses, rice bran and oilcakes.
1/ R. M. Upadhyaya, Marketing of Livestock and Livestock Products in Nepal,Agricultural Marketing Conference, Kathmandu, 1973.
2/ These prices are equivalent to a range of Rs 1.68 - Rs 2.16/liter(at 8% butterfat) and are slightly above national average pricesfrom Rs 1.29/liter in 1964/65 to Rs 1.85/liter in 1970/71 (EADP,Agricultural Statistics).
3/ After deducting operational costs consisting mainly of feed producedon the farm (opportunity costs), veterinary charges and repair andmaintenance of sheds. The higher average gross and net income in theTerai areas is mainly due to higher milk yield and higher prices forliquid milk and lower maintenance and repair costs. Feed costs, how-ever, were high in the Terai, probably due to higher maize and barleyprices.
4/ ADBN, Impact of Bank Loan on Dairy Enterprise and Financing ProgrammeOver 1973/74-1979/80, March 1973.
ANNEX 5Page 11
34. In the Fourth Five Year Plan, most of the increase in milk pro-duction is planned to come from the buffalo herd; buffalo milk output is torise by 25% to 500,000 MT by 1974/75, while the country's cattle herd of 6.2million head (nearly double that of the buffalo herd) accounts for less thanone third of the total milk production in Nepal. Establishment of new dairiesis included in Fourth Five Year Plan for Pokhara, Janakpur, Bhairawa andNepalganj. Because distribution of liquid milk will be limited to the largertowns, only the farmers around these towns will benefit from this development.For the farmers who are outside the larger towns but in areas which arereadily accessible, the possibility of establishing cheese, butter and gheeprocessing plants should be explored (particularly in the Hills). NDC hasassigned priority for upper Hills (para 13). Limited financial resources willprevent the realization of dairy development potentials in the Lower Hills.External assistance should be provided as top priority.
Ghee
35. Annual domestic consumption of ghee is about 4,000 m tons andexports to India are approximately 3,500 tons 1/. About 20% of all the milkproduced is converted to ghee. Although ghee is generally produced in areasnot easily accessible to population centers, it is also produced from unsoldsurplus milk in more accessible areas. Ghee is marketed after paddy isharvested. It is taken to the market in tin cans, containing about 16 kgof ghee. Ghee has distinctly defined marketing centers which are mostlysituated near the Indian markets. The important ghee producing areas aremainly in the Western Hills (Surkhet, Sallyan, Pyuthan, Dailekh, Baglung,Doti, Syangja and Dang Deokhuri). The most important trading center forexport to India is Nepalganj. The major part of the ghee produced in Nepalis done by the traditional method of souring the milk, churning to make butter("nauri") and boiling the butter to turn it into ghee. It is estimated thatabout 60% of the butterfat is recovered by this method 2/. Because of unfavor-able price differentials between milk and ghee, the latter is always producedas a residual 3/. Better quality ghee could be produced with small ghee pro-cessing plants. Their feasibility should be explored.
Wool
36. For farmers in the subalpine and alpine regions, wool constitutesan important supplement to dairy as sources of income. The main tradingcenters for coarse (local) wool are Dimbha and Solukumbu in the Eastern Hillsand Jumla in the W4estern Hills. Wool of the Tibetan sheep which is finer in
1/ International Scheme for Coordination of Dairy Development Nepal, FAQ,1,972.
2/ Ibid., p. 9.
3/ At 1970/71 prices (Rs 1.85/liter or Rs 2.15/kg for milk and Rs 14.47/kgof ghee), 18 kg of milk would yield Rs 38.70 compared with 1 kg ofghee at Rs 14.47.
ANNEX 5Page 12
quality and has a longer fiber (about 12 inches) is mainly used in the woolencarpet industry. The Tibetan carpet industry in Nepal appears able to absorb(through the HMG-owned National Trading Company) increasing quantities ofmore high quality wool such as produced by the Tibetan mountain sheep. Importsof Tibetan wool have increased from 200 m tons in 1967 to 544 m tons in 1970.The 1970 import figure represents a production from about 270,000 sheep. Abreeding programme for the selection and breeding of sheep with higher woolproduction combined with better quality has been started by the Departmentof Agriculture (DA) recently with technical assistance by FAO. We recommendan expansion of this programme to more hill stations to establish breedingherds for the distribution of improved stock. Funds and staff are lacking.Greater use should be made of progressive farmers (with adequate supervision)to specialize in sheep breeding, otherwise progress is likely to remain slow.
D. A STRATEGY FOR IMPROVING LIVESTOCK PRODUCTION
37. The low productivity of livestock in Nepal is due not only to thecompetition between non-productive and productive animals for scarce fodderand the lack of improved breeds, but also to poor management and insufficientefforts to improve fodder availability. Productivity improvements can bemade at the following levels:
(a) selective reduction of animal population;
(b) improvement of genetic stock;
(c) improvement of fodder availability.
38. In addition, the necessary supporting services to distributeimprove animals (para 67) and the provision of marketing facilities toimprove the processed products (paras 30 and 35) are required.
Reduction of Animal Numbers
39. Mass castration of inferior bulls and the prohibition of serviceto inferior cows have been recommended by various Aid Missions. Such aprogram would require a tremendous effort by the Veterinary staff and strongreligious resistance can be expected from certain ethnic groups. Even ifthe reproduction rate of the current bovine generation were to be reduced,the rejected cows and bulls would still be allowed to graze and compete forfeed with the genetically superior young animals. However, a program toreduce animal numbers might meet with success if the advantages of greatlyimproved production and income from fewer but more productive animals werewell demonstrated.
40. An initial step could be taken in selected areas to reduce thebovine population by restricted breeding. After registering the "commercial"cows or the buffaloes, the less productive males would be castrated andsubstitute breeding arrangements could concurrently be made (e.g. maintainingof stud bulls and introduction of artificial insemination).
ANNEX 5Page 13
Improvement of Genetic Stock
41. Better management and feeding of average genetic material isgenerally uneconomic and inadequate to raise the average millk yield perlactation to a satisfactory level. Local buffaloes in Jiri Governmentfarm yielded 332 liters per lactation versus 832 liters and 525 liters forMurrah and Murrah x local cross 1/. The highest yields recorded for Murrahbuffaloes at Kumaltar were 1,749 liters per lactation and lowest yields were1,000 liters. The yield of the local buffaloes with the same feeding stand-ards was only 467 liter per lactations 2/. The mission supports the views ofUNDP/FAO/SATA Nepal Livestock Development Mission, that HMG should con-centrate its limited resources on improving the buffalo stock 3/ since thelimited feed resources (especially in the Hills) would be better utilized.Selection should not only be based on milk production, but also on draftperformance, since the latter could alleviate the need for bullocks in fieldpreparation, especially in the hills, below 6,000 feet. In these areas, therelative slowness of buffaloes for transport is less important than theirability to utilize the available low quality feed better than cattle. Alsofemale buffaloes can be used for draft in contrast with cows, which areseldom used for that purpose 4/. More attention should be paid to theBhadawari and Jaffarabadi breeds from India. A dual purpose buffalo wouldappear to be the best approach as a medium term policy. For the hill areasabove 6,000 ft, efforts should be focused on cattle, yak and chauries.
42. Cattle with high milk potential are located on larger farms nearthe dairy centers. Because buffaloes are superior to cattle in convertingthe low quality fodder to milk, they are the obvious choice for dairy animalsup to 6,000 ft. Intensification of the government's bull breeding and dis-tribution program should lead to limitation on imports of nondescript buffaloesfor breeding purposes. The government should also explore other breeds fortheir stock (like Nili, Randi, Surti and Kundu) in addition to the Murrah.
43. We recommend a coordinated program to provide: (a) buffalo andcattle breeding farms and artificial insemination (Al) centers in the Hillswhere road access is available; (b) credit for the purchase of improvedbovines; and (c) market outlets for the increased milk production.
44. We support the recommendation by the Nepal Livestock DevelopmentMission for establishing a yak and chari improvement station in Langtang
1/ Farm Manager Jiri Experimental Farm.
2/ K. Pandey Livestock Officer, D.A.
3/ Report Nepal Livestock Development Mission UNDP/FAO/SATA, 1971.
4/ H. C. Pant & A. Roy in R. E. McDowell, Improvement of LivestockProduction in Warm Climates, 1972.
ANNEX 5Page 14
to evaluate the milk production potential of chauries (under improved feedingand management conditions) and to carry out intra-herd selection at variouslocations. The development of the high mountain areas depends largely onthe improvement of chauries, sheep and goats and their feed resources.
Improvement of Pastures
45. Although livestock is grazed on fallow land and wasteland near thefarms, forest and mountain pastures are also important sources of grazingfodder. Improvement of the alpine pastures may be technically feasible byoversowing with improved leguminous and gramineous pasture species andfertilization. Because these pastures are communally and nomadically grazed,the costs of developing such a program will be high.
46. More efficient and less costly approaches should be sought. Tech-nical assistance should be sought for the selection of winterhardy whiteclover species, that could be oversown from the air using the lime pellet-ting technique. With this technique the nodulation of the clover is assuredand no further liming of the pastures is required to get the full benefitof the nitrogen-fixed capacity of the clover.
47. Rotational grazing in the vicinity of a village community mightoffer a practical solution for the alpine pasture lands. The organizationand the management of such grazing is highly dependent on the support of thevillage or panchyat. Rotational grazing of the more remote grazing landsbeyond the immediate control of the villages would be impossible to implement.The most acute and detrimental fodder shortage occurs during the winterseason when chauries and sheep are taken down the valleys in the forests.
48. Forest grazing is a common practice in the Terai, Inner Teraiand the Hill districts at middle and lower altitude. With the exceptionof the Hill area containing low population density (particularly the FarWestern Hlills), government forests are generally claimed by the villagesas grazing land. As the villages, in practice, control the hill forests,the most effective way to arrest further deterioration and to controlgrazing practices is through the village-panchyat. If the village-panchyatis given the full responsibility for the grazing in the forest areas, varioussolutions may be attempted to check overgrazing. A grazing fee could belevied in exchange for grazing permit. Fees could be fixed according tothe economic importance of the grazing animal and the amount of destructionthey cause and fees for male buffaloes (e.g. high fees for unproductive cattle).Goats that are particularly destructive should be reared in confinement on forestloppings, for which permits could also be issued. More importantly, reforestationwith quick-growing fodder trees need to be undertaken (Annex 2, para 72), since treeloppings often provide the major source of winter fodder in many hill areas.
49. Seriously overgrazed forest pastures would require more compre-hensive approaches. In selected areas, where this situation is critical,a number of alternatives exist. These would entail a change from a year-round grazing system to a system based primarily on hand feeding, in drylots or yards with controlled grazing on a restricted area for a verylimited period. One alternative could be to close one-tenth of the villagegrazing area (with adequate shade) to all grazing for one year, transforming
ANNEX 5Page 15
it into a dry lot. The grass could then be cut after maturity, when the seedshave shattered. This grass or hay could be rationed or sold to the farmersfor stall feeding or stored for use during the dry season. In each of thefollowing three years, another tenth of the grazing area could be added tothe first and treated in the same way. When a third of the area has beenreclaimed, the improved area could be reopened to controlled grazing on apermit or block system. This procedure could be repeated until the entiregrazing area of the village had been reconditioned.
50. Another alternative would be to transform the remaining nine-tenths of the grazing area for pasture management. Useless bunch grasseswould be cleared; contour farrowing and planting of suitable foddertreesor sowing of suitable pasture grasses and legumes by the village communitycould be carried out. Within a period of three years following this con-centration of stock and the adoption of hand feeding, the whole pasturewould be considerably improved and would provide more fodder in a cuttingregion than by the former haphazard grazing. These methods would notrequire a large cash outlay. They could only be successful if there werecomplete cooperation among the livestock owners of a village to undertakethe key provision - common feeding in dry lots or yards. Most farmers fullyrealize that many of their livestock are not worth the effort of handfeeding and this method might induce farmers to dispose of their unproductiveanimals.
Improvement of Fodder Availability on Farms
51. With small farm holdings and relatively low yields, the majorityof the Nepalese farmers need all their land for food grain or cash crop pro-duction. It is, therefore, unrealistic to expect farmers to devote part oftheir crop land exclusively to fodder production. Improvements will have tostart with the existing livestock feeding system, and particularly in theHills, livestock production must be viewed as an integral part of the farmsystem.
52. Cattle fodder on farm consists of paddy and wheat straw or, ingrazing of harvested maize areas. The importance of this system of feedingshould not be underestimated. Cattle utilize unused crop residues, and perhectare residues from an average per ha paddy-wheat rotation 1/ could supplyall the dry matter (DM) and 84% of the total digestible nutrients (TDN) andapproximately 16% of digestible crude protein (DCP) required for the main-tenance of a 450 kg milking buffalo (Appendix 2).
53. Supplemental feeding is required (in the paddy-wheat rotation) toprovide, on the average, an additional 440 kg TDN and about 120 kg of DCP to
1/ For the maize-wheat rotation (per ha), all requirements for a milkingbuffalo are fulfilled except for 95 kg of DCP (Appendix 2).
ANNEX 5Paoe 16
fulfill the requirements for milk production. The more productive farms(with yields more than 40% above average), which supplement their strawfodder with mustard oil cakes or soybean and field pea hay, provide suf-ficient feed for milk production (Appendix 2, para 2). This practice,though not very widespread, is used mainly for the she-buffalo. Alternativecropping patterns which can both improve yield and supplment the deficit DCPin present crop residues are, therefore, very important (paras 58-62). Thereis a need to examine economic ways of increasing concentrate availability tosmall farmers. Feasibility of feed mills, and incentives for local ricemillers to undertake seed mixing should also be explored.
Yield Increases and Farmyard Manure
54. The impact of increased inorganic fertilizers and HYV 's on yieldhas already been discussed in Annex 3. The use of organic fertilizer orfarmyard manure in the cropping system needs further emphasis, especiallywith the increasing scarcity and soaring costs of inorganic fertilizer.
55. As a source of nitrogen, farmyard manure is considerably slowerin its action and less effective than equivalent amounts of niv:rogen avail-able in concentrated forms of inorganic fertilizers. However, its soilimproving properties make it excellent on the predominantly lig,ht soils inNepal and used as basal dressing enhances the response to inorganic fertil-izers. Their contribution to increasing soil fertility can therefore bevery significant if proper care is taken in the collection and productionof manure. The quantity of manure collected from one bullock, cow orbuffalo, is estimated at two tons 1/. This figure could be doubled withproper bedding, manure conservation and improved feeding 2/. If this manureis well prepared with deep bedding (preferably of rice or wheat straw) sothat the animal urine will not be lost and the manure is properly stored incompacted heaps under shelter, about 70 percent of the P and K and about 50%of the nitrogen contrained in the feed is potentially available for returnto the land 3/. The attainable annual production of one milk buffalo underthese conditions with adequate feeding will be about 20-25 kg of N, 10-12.5
1/ India's Manurial Resources, Kurukshetra 5 (4) 1957; and R. B. Milford,IBRD (Personal Communication).
2/ R. Hamon, Agronomie Tropicale 27 (5) 1972: 592-607.
3/ F. B. Morrison, Feeds and Feeding, 1961.
ANNEX 5Page 17
kg of P20 5 and 40-50 kg of k20 1/. This would cover roughly 25% of the N andP requirement and 100% of the K requirement of a rice-wheat crop rotationyielding three tons of grains per ha (present yield levels). Additional Nand P for high food grain production would have to be supplied in the formof inorganic fertilizers or green manures. If two buffaloes could be main-tained and fed with the crop residues and legume hay from one ha, which isfeasible (see para 58), 50% of the N and P requirement could eventually becovered by farmyard manure.
56. Stall feeding (currently practised only for milk animals), in amanner to efficiently collect livestock manure, will be increasingly import-ant to the farming system. There is, however, a trade-off between the useof manure as fertilizer and its use as fuel. As mentioned in Annex 2, quickgrowing fuelwood species can be grown on farms on either the steeper slopesor on wasteland, and should, therefore, be used as fuel or for fodder ratherthan manure. Within the livestock/manure/fodder/livestock cycle, the contri-bution of nutrients is dependent on the livestocks' manure productivity whichin turn is dependent on fodder availability 2/. Present cropping systems canimproved by integrating fodder crops.
Integrating Fodder Crops with Existing Cropping Patterns 3/
57. Integrating fodder crops into the existing cropping patterns canonly be achieved if it is profitable and marketing support is available.The small farm in Nepal is subjected to high risks of crop failure whichhe can ill afford. A more diversified production base is essential andimproved buffalo dairy production provides the best opportunity for diversi-fication and improved cash income, particularly for the Hill farmer. Inte-grating fodder crops must be undertaken within this context, and croppingpatterns can be intensified as outlined below.
1/ Assuming a manure production of 4 tons/buffalo per annum with average.N, P and K contents of respectively 1.0, 0.5 and 2.0% produced incovered stalls. NB. Determinations of the contents of the majornutrients N, P and K of dry farmyard manure made in tropical countriesshow a wide variation of respectively 0.3-2.0% N, 0.1-0.6% P and0.2-3.4% K. Source: Efficient Use of Fertilizers, FAQ AgriculturalStudies No. 43, 1962; R.A. Wood, Tropical Agriculture, Trinidad 40 (4)1963: 269-273; R. Hamon: op. cit.; A. Jacob en H. von Uexkull,Fertilizer Use, Nutrition and Manuring of Tropical Crops, 1960.
2/ Concentrate feeding is seldom used. Among the larger farmers, wheresome concentrate mixing is done, combinations of rice bran, maize orbarley, and pulses like khesari (Lathyrus sativus) or soybeans, areused.
3/ Detailed discussion is presented in Appendix 3.
ANNEX 5Page 18
58. For early planted rice crops 1/ located on relatively high watertables, but where risks of growing a second rice crop is great 2/ the pos-sibility exists for intersowing legumes (like sun hemp, lentils, cowpeas,mung beans and rice beans) between the paddy before harvest (usually at theend of August or early September). Residual soil moisture at the end ofthe monsoon would enable the catch crop to be cut for green fodder at theend of October or early November. With green fodder yields of 12-15 m tons/ha (phosphate fertilization of the preceding rice crops is required), andgrazing on the rice straw residues, sufficient nutrients can be provided tofeed 1.5 - 2 milk buffaloes.
59. Larger farmers with productive milk animals and good marketingoutlets could reorientate their cropping pattern to plant selected grasses likeNapier, guinea grass or silage maize. For these farmers, winter cropping withgreen fodder crops (mentioned above) for dairy, in half of the winter wheatareas each alternate year could return competitive and less risky incomes andimprove wheat productivity at the same time. An assessment of the economicfeasibility is required.
60. Intercropping of maize with soybean and other pulses, alreadypractised in many hill areas should also be introduced in the Terai andInner Terai, for both forage and seeds. Forage yields of 4-5 m tons/ha(particularly from cowpeas and mung beans) and the maize crop residues canprovide adequate feed supply for 1-1.5 milk buffaloes. Instead of justleaving the land for fallow and grazing after maize harvest, a secondsowing of pulses (like peas or sum hemp) would enable the harvesting of avaluable green fodder 3/ at about the end of October. This practice andthe practice of intercropping cowpeas, soybeans, or dry beans have betterchances of success in the Hills because maize is generally planted earlier.
61. Improved rotations and the intensification of cropping patternssuggested for maize farms on hill slopes would greatly reduce erosion fromthe hill terraces, and the land would be under close cover through most ofthe monsoon period. In the dry season, improvement of local fodder cropsand feeding methods should be given more prominance. The biggest potentialcomes from turnip or related Brassica species or varieties. In Jiri, forexample, unfertilized radishes yielded about 30 m tons of roots/ha, suffi-cient to meet the annual requirements for maintenance and milk productionfor 2 milk buffaloes. A selection and improvement program for Brassicaspecies should be initiated by DA.
62. In the higher subalpine and alpine regions, barley and potatoesare grown on soils which are nitrogen short, relatively acid and of lowfertility, emphasis should be shifted from clover (currently grown ingovernment experimental stations farms) to winter hardy white clover (para
1/ Of short duration HYVs.
2/ Due to insufficient soil moisture after the monsoon.
3/ Phosphate fertilization of the maize crop is necessary.
ANNEX 5Page 19
46) and other winter hardy legumes to provide the nitrogen for barley andpotatoes because they can tolerate these soil conditions as well as drought.
63. The recommendations set out above can only be achieved if thefoodgrain improvement programmes are integrated with fodder production.Without the benefits of fodder crop production in the form of an increasedsupply of farmyard manure and residual nitrogen effects of leguminous crops,increase in foodgrain-production will rely largely on fertilizer inputswhich are scarce and very expensive. It is estimated that 25-50% of therecommended N and P requirement per ha for foodgrains (50-150 kg N and40-80 kg P205) and 100% of K20 requirement (20-40-kg K20) could be met byincluding leguminous fodder crops and the return of increased nutrients(removed by the crop residues) in the form of farmyard manure.
64. We recommend that fodder crop agronomists should be stationed inthe proposed Regional Crop Development Centers. They should work in colla-boration with the foodgrain agronomist, to develop and extend a completepackage of crop and livestock husbandry according to the cropping patternsoutlined above. The necessity of short duration rice, wheat and maizevarieties to accommodate fodder crops in the cropping patterns is obvious.Also improved plows and improved draft animals will be required to reducethe time of seedbed preparation. Seed multiplication and distribution ofleguminous and root fodder crops should receive a high priority next to thedistribution of foodgrain seeds.
65. This program should be phased and located in coordination withthe programme for dairy and milk processing plants and the breeding anddistribution of improved livestock.
F. PROJECT POSSIBILITIES
66. A livestock project is proposed for Nepal with the followingcomponents: (a) Buffalo breeding and distribution; (b) fodder crops andlivestock integration research and extension; (c) processing of livestockproducts and feed; and (d) pig development.
(a) Buffalo Breeding and Distribution
67. i The importance of buffalo as a source of milk and milk products,and its efficiency in utilizing feed (particularly in the Hills) necessi-tates priority programs for their improvement and distribution. Buffalodevelopment centers will be established in the livestock research centersin buffalo-concentrated areas to undertake (a) upgrading of the localbuffalo with imported breeds; (b) providing artificial insemination (AI)services which would include an AI center, and mobile veterinary units(where applicable); and (c) construction of bullsheds for direct servicingin less accessible areas.
ANNEX 5Page 20
(b) Fodder Crops and Livestock Integration Research and Extension
68. Research on fodder crops and its integration into the farmingsystem (paras 58-62) should be conducted, either at the livestock develop-ment centers or at HMG's crop development centers which will be associatedwith the livestock development centers. The production and distribution ofappropriate fodder seeds should also be undertaken, including demonstrationcourses for extension personnel including "leader farmers" assisting theextension activity.
(c) Processing of Livesotck Products and Feed
69. Corresponding marketing support for livestock improvement anddistribution programs in buffalo concentrated areas is essential. Thefeasibility of milk processing plants (and associated chilling stations)for milk, cheese, butter, and/or ghee production should be explored,especially the construction of small ghee processing plants in the Hillsin relation to secondary road development. Preinvestment studies arerequired to examine these processing alternatives as well as to study the.marketing and pricing of these milk products in conjunction with thedomestic and the Indian markets.
70. In view of the need to supplement on-farm feeding for milk pro-duction (para 53), the feasibility of establishing new feed mills versusthe possibility of using existing private grain mills to produce con-centrates (from rice bran, surplus maize, wheat bran, etc.) should alsobe explored.
(d) Pig and Poultry Development
71. Pig development in rural areas around Biratnagar, Janakpur, andNepalganj (para 30) may be assisted by the provision of assistance inpurchase and distribution of pigs (including AI service) and the establish-ment of minor slaughter houses. Outgrower schemes for pig and poultryproduction in Chitwan and Makwanpur to provide meat for the slaughter-houseand meat processing plant in Hetaura (para 30) is also required.
Estimated Costs
72. The estimated project cost for components (a) and (b) in sixdevelopment centers is about US$2.5 M. Milk processing facilities wouldrequire about US$1.5 M (and if feed mills are required a further US$1 M)to serve the command areas corresponding to the six centers. Total costsfor external financing would probably be about US$4 M (Including technicalassistance). The pig development component which could be assisted as aseparate project will cost at most US$1.5 M.
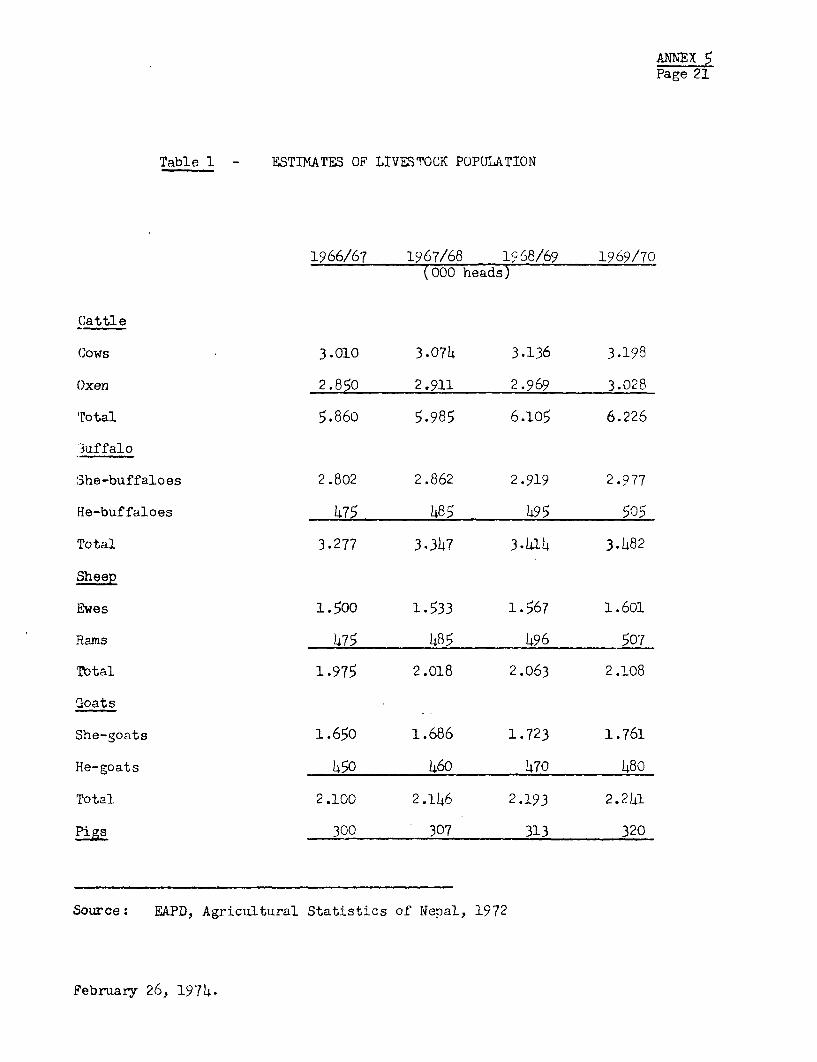
ANNEX 5Page 21
Table 1 - ESTIMATES OF LIVESTOCK POPILATION
1966/67 1967/68 1568/69 1969/70(000 heads)
Cattle
(ows 3.010 3.074 3.136 3.198
Oxen 2.850 2.911 2.969 3.028
'Total 5.860 5.985 6.105 6.226
3uffalo
She-buffaloes 2.802 2.862 2.919 2.977
He-buffaloes 475 485 495 505
Total 3.277 3.347 3.414 3.482
Sheep
Ewes 1.500 1.533 1.567 1.601
Rams 475 485 496 507
Total 1.975 2.018 2.063 2.108
Goats
She-goats 1.650 1.686 1.723 1.761
He-goats 450 460 470 480
Total 2.100 2.146 2.193 2.241
Pigs 300 307 313 320
Source: EAPD, Agricultural Statistics of Nepal, 1972
February 26, 1974.
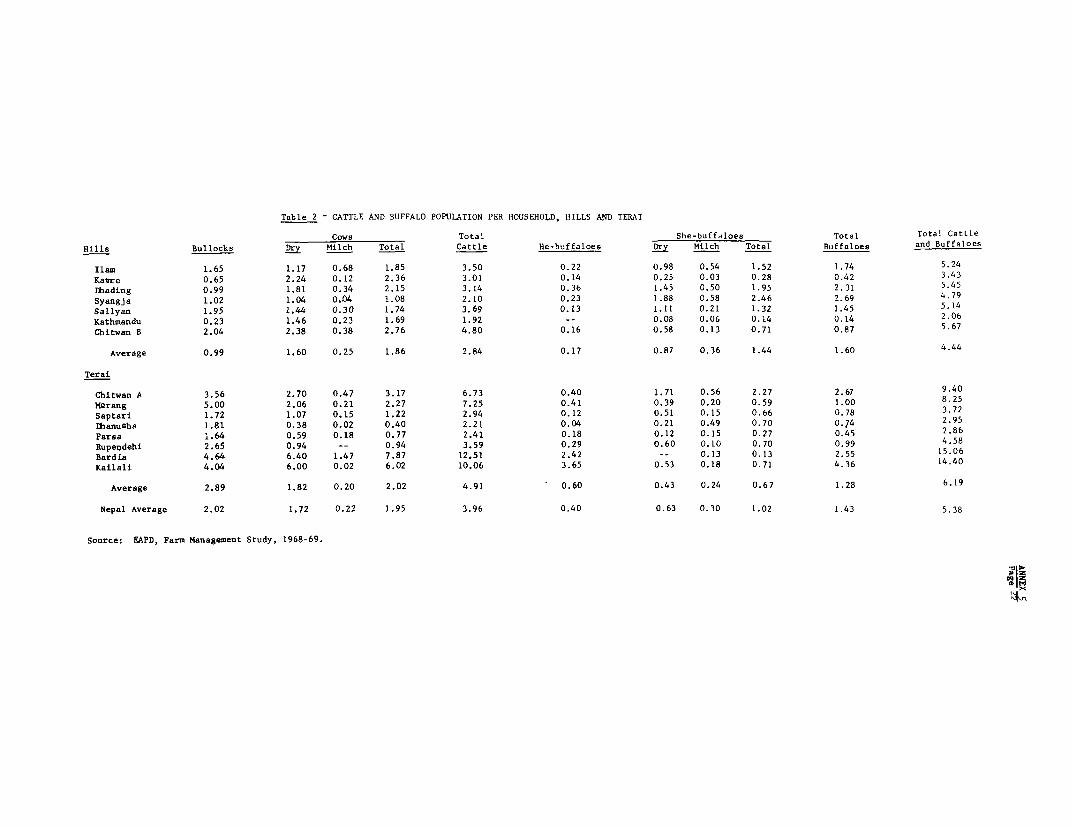
Table 2 - CATTLE AND BUFFALO POPUIATION PER HOUSEHOLD. HILLS AND TERAI
Cows Total She-buffdloe6 Total Total CattleHills Bullocks Dry Milch Total Cattle He-buffaloes Drv Milch Total Buffaloes and Buffaloes
Ilam 1.65 1.17 0.68 1.85 3.50 0.22 0.98 0.54 1.52 1.74 5.24Kafbre 0.65 2.24 0.12 2.36 3.01 0.14 0.25 0.03 0.28 0.42 3.431hading 0.99 1.81 0.34 2.15 3.14 0.36 1.45 0.50 1.95 2.31 5.45Syangja 1.02 1.04 0.04 1.08 2.10 0.23 1.88 0.58 2.46 2.69 4.79Sallyan 1.95 1.44 0.30 1.74 3.69 0.13 1.11 0.21 1.32 1.45 5.14Kathmandu 0.23 1.46 0.23 1.69 1.92 -- 0.08 0.06 0.14 0.14 2.06Chitwan B 2.04 2.38 0.38 2.76 4.80 0.16 0.58 0.13 0.71 0.87 5.67
Average 0.99 1.60 0.25 1.86 2.84 0.17 0.87 0.36 1.44 1.60 4.44
Terai
Chitwan A 3.56 2.70 0.47 3.17 6.73 0.40 1.71 0.56 2.27 2.67 9.40MQrang 5.00 2.06 0.21 2.27 7.25 0.41 0.39 0.20 0.59 1.00 8.25Saptari 1.72 1.07 0.15 1.22 2.94 0.12 0.51 0.15 0.66 0.78 3.72EhanuAha 1.81 0.38 0.02 0.40 2.21 0.04 0.21 0.49 0.70 0.74 2.95Parsa i.64 0.59 0.18 0.77 2.41 0.18 0.12 0.15 0.27 0.45 2.86Ruper;dehi 2.65 0.94 -- 0.94 3.59 0.29 0.60 0.10 0.70 0.99 4.58Bardia 4.64 6.40 1.47 7.87 12.51 2.42 -- 0.13 0.13 2.55 15.06Kailali 4.04 6.00 0.02 6.02 10.06 3.65 0.53 0.18 0.71 4.36 14.40
Average 2.89 1.82 0.20 2.02 4.91 0.60 0.43 0.24 0.67 1.28 6.19
Nepal Average 2.02 1.72 0.22 1.95 3.96 0.40 0.63 0.30 1.02 1.43 5.38
Source: EAPD, Farm Management Study, 1968-69.
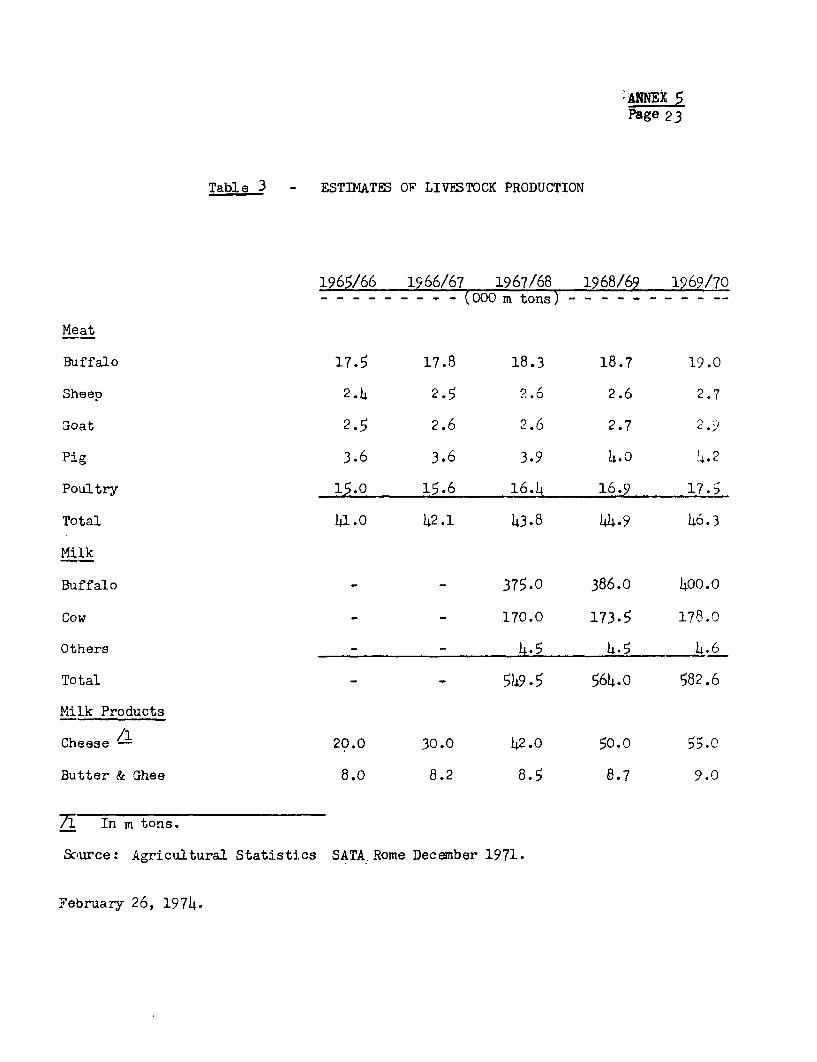
Page 23
Table 3 - ESTIMATES OF LIVESTOCK PRODUCTION
1965/66 1966/67 1967/68 1968/69 1969/70- - - - - - - - - (000 m tons) - - - - - - - - - --
Meat
Buffalo 17.5 17.8 18.3 18.7 19.0
Sheep 2.4 2.5 2.6 2.6 2.7
2oat 2.5 2.6 2.6 2.7 2.9
Pig 3.6 3.6 3.9 4.0 .2
Poultry 15.0 15.6 16.4 16.9 17.5
Total 41.0 42.1 43.8 44.9 46.3
Milk
Buffalo - - 375.0 386.0 400.0
Cow - - 170.0 173.5 17.0
Others - - 4.5 4.5 4.6
Total - - 549.5 564.o 582.6
Milk Products
Cheese A 20.0 30.0 42.0 50.0 55.0
Butter & Ghee 8.0 8.2 8.5 8.7 9.0
Tl In m tons.
Scurce: Agricultural Statistics SATA Rome December 1971.
February 26, 1974.
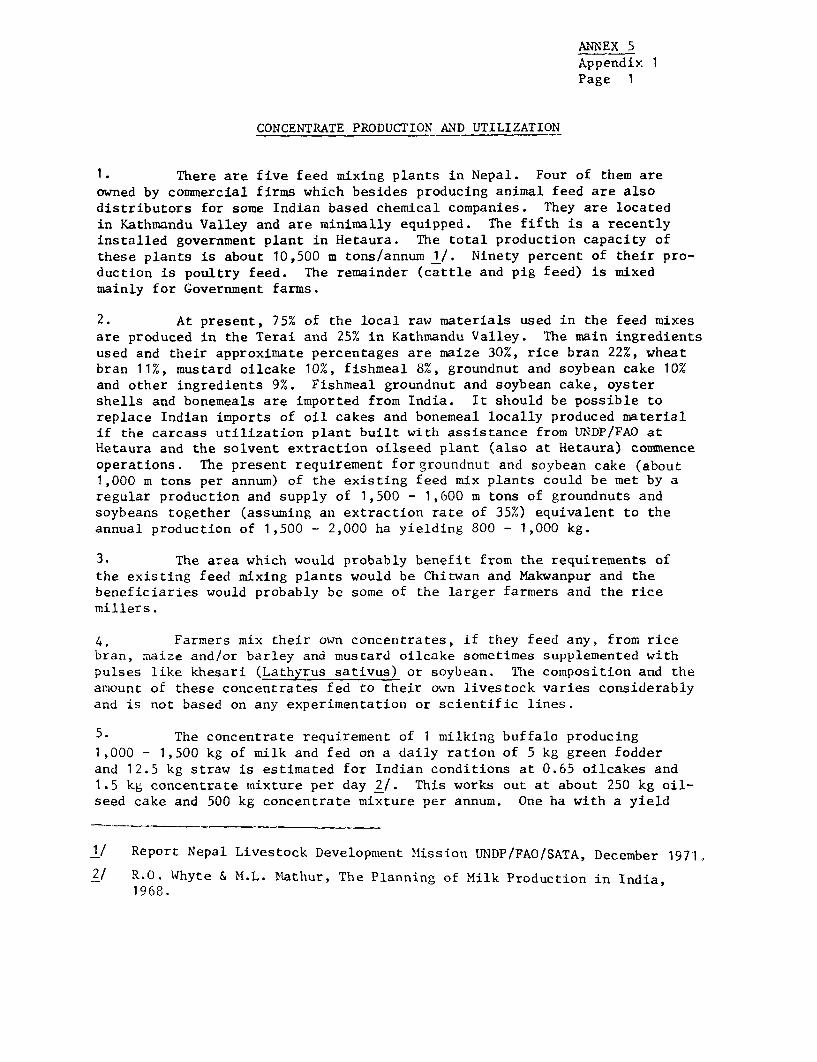
ANNEX 5Appendix 1Page 1
CONCENTRATE PRODUCTION AND UTILIZATION
1. There are five feed mixing plants in Nepal. Four of them areowned by commercial firms which besides producing animal feed are alsodistributors for some Indian based chemical companies. They are locatedin Kathmandu Valley and are minimally equipped. The fifth is a recentlyinstalled government plant in Hetaura. The total production capacity ofthese plants is about 10,500 m tons/annum 1/. Ninety percent of their pro-duction is poultry feed. The remainder (cattle and pig feed) is mixedmainly for Government farms.
2. At present, 75% of the local raw materials used in the feed mixesare produced in the Terai and 25% in Kathmandu Valley. The main ingredientsused and their approximate percentages are maize 30%, rice bran 22%, wheatbran 11%, mustard oilcake 10%, fishmeal 8%, groundnut and soybean cake 10%and other ingredients 9%. Fishmeal groundnut and soybean cake, oystershells and bonemeals are imported from India. It should be possible toreplace Indian imports of oil cakes and bonemeal locally produced materialif the carcass utilization plant built with assistance from UNDP/FAO atHetaura and the solvent extraction oilseed plant (also at Hetaura) commenceoperations. The present requirement forgroundnut and soybean cake (about1,000 m tons per annum) of the existing feed mix plants could be met by aregular production and supply of 1,500 - 1,600 m tons of groundnuts andsoybeans together (assuming an extraction rate of 35%) equivalent to theannual production of 1,500 - 2,000 ha yielding 800 - 1,000 kg.
3. The area which would probably benefit from the requirements ofthe existing feed mixing plants would be Chitwan and Makwanpur and thebeneficiaries would probably be some of the larger farmers and the ricemillers.
4. Farmers mix their own concentrates, if they feed any, from ricebran, maize and/or barley and mustard oilcake sometimes supplemented withpulses like khesari (Lathyrus sativus) or soybean. The composition and theamount of these concentrates fed to their own livestock varies considerablyand is not based on any experimentation or scientific lines.
5. The concentrate requirement of 1 milking buffalo producing1,000 - 1,500 kg of milk and fed on a daily ration of 5 kg green fodderand 12.5 kg straw is estimated for Indian conditions at 0.65 oilcakes and1.5 kg concentrate mixture per day 2/. This works out at about 250 kg oil-seed cake and 500 kg concentrate mixture per annum. One ha with a yield
1/ Report Nepal Livestock Development Mission UNDP/FAO/SATA, December 1971.
2/ R.O. Whyte & M.L. Mathur, The Planning of Milk Production in India,1968.
ANNEX 5Appendix 2
COMMON CROP ROTATIONS AND ThEIR ABILITY TOPROVIDE THE FEEDING REQUIREMENTS OF A MILKING BUFFALO
1. Table 1 presents the requirements of a due milking buffalo of400-500 kg liveweight both for maintenance and for milk production (equiv-alent to 1,000 liter of 7% butterfat milk per lactation). The supply ofnutrients from the fodder (straw) obgained from common rotations practisedin Nepal (paddy-wheat and maize-fallow) under average yield conditions arealso presented.
2. A one hectare paddy-wheat rotation provides sufficient dry matter(DM) and 84% of the total digestible nutrients (TDN) and 16% of digestiblecrude proteins (DCP) for maintenance; and only sufficient DM for milk pro-duction (Table 1). The rotation provides about 75% of TDN and 15% of DCPneeded for maintenance plus milk production of 1,000 liter location. If theaverage yields for paddy and wheat were increased by 40%, all the DM and% of the TDN needed for both maintenance and milk production would be obtained(Appendix 2, Table 1). Supplementation with concentrates or high qualitypireen fodder is required to fulfill the DCP requirements. In the case ofthe maize-fallow rotation, the dry maize stalks can almost provide the TDNrequirements for maintenance and DM requirements for both maintenance andmilk production. A higher percentage (28% and 27% respectively) of themaintenance and milk production requirements for DCP are however obtained,than from paddy-wheat rotation. A maize-wheat rotation under average yieldconditions could potentially provide all the DM, TDC, and 32% of the DCPrequirements for one milking buffalo. Supplementation with about 95 kg DCPfrom concentrates and/or high quality green fodder would still be required.
ANNEX 5Appendix 1Page 2
potential of 3 ton of paddy in sumn.er and 0.5 ton of rape or other oilseedsand 0.8 ton of wheat (assuming that half is sown under oilseed ind theother half wheat) would produce about 300 kg oilseed cake (extraction 35%oil), 150 kg of rice bran (5% of paddy) and 130 kg wheat bran (17% of wheat).Thus the oilseed cake requirement could be met for one milk buffalo, butthe concentrate production would fall short by 50% unless foodgrains areused in concentrate mixtures. This will be unlikely in the case of riceand wheat, but is more likely for barley and maize. It is obvious that thepresent population of she-buffaloes in milk production (estimated to beroughly 1.5 million heads) cannot cover the optimal requirements unless apart of the foodgrain production is diverted for that purpose. The mostlikely source could be eventually maize if maize yields can be rufficientlyincreased to generate surpluses at the farm level.
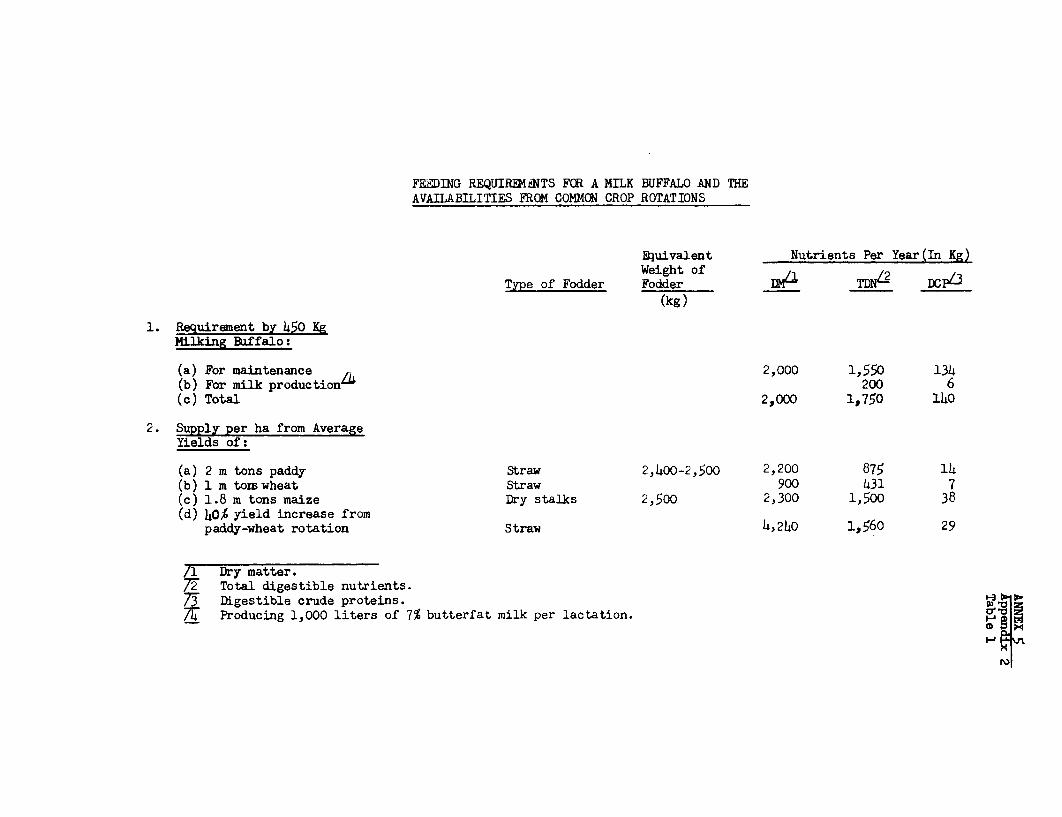
FEDING REQUIREMaNTS FOR A MILK BUFFALO AND THEAVAILABILITIES FROM COMMON CROP ROTATIONS
Equivalent Nutrients Per Year(In Kg)Weight of
Type of Fodder Fodder of__ TD____ _DCp_3
(kg)
1. Requirement by 450 KgMilking Buffalo:
(a) For maintenance 2,000 1,550 134(b) For milk productionL 200 6(c) Total 2,000 1,750 140
2. Supply per ha from AverageYields of:
(a) 2 m tons paddy Straw 2,400-2,500 2,200 875 14(b) 1 m tom wheat Straw 900 431 7(c) 1.8 m tons maize Dry stalks 2,500 2,300 1,500 38(d) 40% yield increase from
paddy-wheat rotation Straw 4,240 1,560 29
/1 Dry matter.7T Total digestible nutrients.73 Digestible crude proteins.7w Producing 1,000 liters of 7% butterfat milk per lactation.
ANNEX 5Appendix 3Page 1
ALTERNATIVE APPROACHES IN CROPPING PATTERNSTO INTEGR.ATE LIVESTOCK WITH CROP PRODUCTION
1. This appendix spells out in detail, the alternative changes incropping pattern to integrate livestock with crop production.
Cropping Pattern for Rice Farms
2. On the irrigated farms in the Terai and Hill Valleys or on thefarms with high watertable land in the Eastern Terai, where single or doublecropping with rice is practised during the monsoon, followed by wheat orwheat/khesani or mustard, the monsoon period leaves little room for inter-cropping or a catchcrop. An exception could be an early planted rice cropon high-watertable lands which could be followed by sunhemp (Crotalariajuncea) intersown between the paddy before it is harvested, when the soilstill retains ample moisture. Other leguminous crops that could be sown atthe same time are cowpeas (Vigna sinensis), mung (Phaseolus mungo) or ricebean (Phaseolus calcaratus). This practice should be recommended on thosefarms where the risks of growing a second rice crop are great, due toinsufficient soil moisture after the monsoon. When sown at the end ofAugust or early September, the crop can be cut as green fodder in an earlystage at the end of October or beginning November. Green fodder yieldsof 12-15 m tons/ha should be obtainable if the preceding rice crop is adequate-ly fertilized with phosphate (50-60 kg p2 05 /ha) 1/. Assuming DCP contentsof 2-3'% and TDN contents of 10-12%, it would provide 240-450 kg DCP and1200-1800 kg TDN/ha which would permit the farmer to feed 1.5-2 milk buffaloes,when fed in combination with the rice straw from the preceding rice crop 2/.This would require a short duration high yielding rice crop (3 m tons/ha) wellfertilized. This foddercrop could well be followed by wheat, barley orpotatoes as wintercrops which will benefit from the small amount of nitrogensupplied by the preceding leguminous crops. Another crop that could be con-sidered for the paddy areas which is already grown in Nepal is lentils(Lens esculenta). The seed can be sown after the preparation of the paddyfields and will pass the rainy season ungerminated. It will germinatewhen the paddy fields are allowed to dry up. Grain yields and straw yieldsof 6-8 quintal/ha each should be obtainable 3/. Especially on the badlydrained lands in the Eastern Terai solely used for single or double croppingwith paddy, this crop should be considered. After the harvest of the latepaddy crop the fields should be ploughed once or twice, after which lentilscan be low seeded or broadcast.
1/ M. R. Reddy Indian Farming 18 (6) 1968: 45-46, B.R. Majumdar, S. Sen &S. R. Roy Indian Farming 18 (6) 1968: 29-30.
2/ F. B. Morrison, Feeds and Feeding, 1968.
3/ D. M. Mauyra, Indian Farming 18 (18) 1968: 23-24.
ANNEX 5Appendix 3Page 2
3. The planting of foddergrasses as such on the paddy farms couldonly be done on the well drained lands. This method of fodder productionis recommended for the larger farmers with productive milk animals andgood marketing outlets for their milk. Good fodder production of 40-50 mtons green roughage with high protein content can be expected from selectedNapiergrasses (Pennisetum purpureum), Guinnea grass (Panicum maximum), Signalgrass (Brachiaria mutica) and silage maize especially if they are intercroppedwith creeping legumes such as cowpeas or Desmodium species.
4. During the winter season, when a considerable amount of paddy landis under wheat, a reorientation of cropping pattern is recommended by halvingthe wheat area, intensifying the wheat cultural methods and fertilizerapplications and sowing the other half under pulses like gram, mung, andin the hill valleys more cold tolerant crops like mixtures of oats and peasor oats and berseem clover (Trifolium alexandrium). Green fodder yieldsof 15-20/m tons/ha could be expected under unfertilized conditions producing300-400 kg DCP and 2000-2500 kg TDN 1/. The following year the other halfof the wheat land should be grown under fodder crops. As wheat is a relativelynew crop with considerable hazards due to the climatic conditions, this formof land use in winter might prove acceptable. In the Terai areas near urbancenters with good outlets for milk production, this investment in foddercropproduction that could enable the farmer to produce an average addition of1000-1500 liters pf milk and enable fodder production for milk to competeincome-wise with wheat growing 2/. The production of green foddercrops ismuch less influenced by weather conditions than production of grains.Alternate rotation of wheat and green fodder crops would also increase wheatyields.
Cropping Patterns for Maize Farms
5. In the maize areas in the Terai and Inner Terai more opportunitiesare available for intercropping during the monsoon. Intercropping with soy-beans and other pulses is already practised in many places in the Hills.This method should be improved by selection and distribution of improvedvarieties (see section on oilseeds). Yields of maize will only be slightlyless than compared with monocropping of maize 3/. The pulsecrop could be
1/ L. L. Relwani, Indian Farming 20 (3) 1968: 23-24.
2/ Under 1970/71 average wheat yields of 500 kg/half ha. and average priceof Rs 1.5/kg, net returns to labor (above production cost of Rs 250/halfha) would be Rs 500. At average yields of 1,000 liter/buffalo of newmilk production and Rs 1.9/liter (1970/71 prices) for example, netreturns (to estimated costs of Rs 1,400) would also be about Rs 500per milk buffalo per half ha.
3/ S. D. Narang, Indian Farming 19 (6) 1969: 21. S. B. Roy & M. N.Ihahani, The Allahabad Farmer 54 (1-2) 1970.
ANNEX. 5Appendix 3Page 3
harvested for seed and the remainders fed with the maize stalks as a valuablehay, considerably richer in digestible protein and total digestible nutrientsthan ma:bze stalks alone. Alternatively, if the pulse crap is not harvestedfor seed but cut together with the maize stalks after harvest of the maizecobs at the end of August, a very valuable hay is obtained. Cowpeas andmung bean would be particularly suitable since they produce considerablequantities of forage. Total forage yields of 4-5 m tons/ha containing250-350 kg DCP and 2000-2500 kg TDN can by produced in this way guarantee-ing an adequate feed supply for 1-1.5 milk buffalo on the residues of themaize crop 1/. The investment would only be the purchase of pulse seed.
6. The availability of improved legume seeds thtough multiplicationand distribution would be a major step towards improved animal feeding.After the maize harvest, the land is usually left fallow for some months andis allowed to be grazed by the cattle. A more sensib'Te practice would be toimmediately sow a pulse crop like peas or sunhemp in Adgust and harvest itat the end of October for an additional supply of valuable hay. Yields of12-15 tons green fodder can be expected if the preceding maize crop iswell supplied with phosphate. The key to the success of maize-legume inter-cropping or 'legume cropping after maize is an ample phosphate fertilizationand short duration maize varieties.
7. For the wheat crop following maize,,the same practice can berecommended as mentioned earlier for wheat grown after paddy. Alternating'wheat in the first winter season with a fodder crop of peas .+ oats or peas+ barley in the second winter season would proably produc~e.fodder yields of15-20 m tons/ha under unfertilized conditions resulting in an additionalamount of 300-400 kg DCP and 2000-2500 kg TDN 2/. There is also potentialfor high quality fodder production on the maize farms by growing a mixedcrop of fodder maize and pulses cut in the green stage early August forensiling. This would allow ample time to grow a leguminous crop for hayproduction before land preparation and sowing of wheat or mustard in November.
8. What has been said for the mWize farmers in the Terai and InnerTerai certainly applies to the maize farmers in the Hills w4ere maize isgenerally planted earlier than in the Terai. In the Eastern and CentralHills, as is already practised, maize should be intercropped with cowpeasor soybeans for consumption of the green pods. In the Mid-Western and FarWestern Hills, climatic conditions are generally more suitable for the pro-duction at the dry beans.
9. The relatively larger farms in the Western Nepal would be morefavorable for the production of fodder crops, particularly sorghum. Pre-sently, composite varieties would be more advisable than hybrid sorghum
1/ Same sources as Footnote 3, p. 3.
2/ L. L. Relwani Indian Farming 20 (9) 1970: 26-31.
ANNEX 5Appendix 3Page 4
because of the complexity of hybrid seed production. Contacts should be
made with the Rockefeller Foundation and the Tarai Development Corporation
in Uttar Pradesh for the production of sorghum composite seeds. With N
applications of 60 kg/ha and P applications of 30 kg/ha grain yields of
5-6 m tons/ha are reported from the seedcrop and 3 m tons/ha of the ratoon-crop with m 17 ton of fodder 1/.
10. The intensification of the cropping patterns recommended for the
maize farms on the hill slopes for the monsoon period would greatly reduce
erosion from the hill terraces because the land is kept under a closed cropcover for most of the monsoon period. For the dry season, when eitherwheat, barley or potatoes are grown (and very often the land is fallowed),
a number of alternatives exist. They are: growing mixtures of barley or
oats/peas; fodder radishes, forage rape (Brassica napus); Italian ryegrass
and turnips. Most of these fodder crops are not new to Nepal and are
already grown and used as cattle fodder in some areas 2/. Instead of con-
centrating on ryegrasses and especially white clovers, which grow little
in winter, D.A. should improve on already existing local fodder crops and
feeding methods. Winterhardy clovers should be introduced and selected for
oversowing of perennial pastures in the higher Hills.
11. Yields of 30 tons/ha roots have been obtained with unfertilizedradishes grown in Jiri Experimental Farm 3/. This represent roughly yields
of 4500 kg DM/ha consisting of 900 kg DCP and 3600 kg TDN 4/, sufficient to
meet the annual requirements for maintenance and a 100 liter milk produc-
tion of 2 milk buffaloes. There is a wealth of indigenous Brassica species
and varieties 5/ and a selection and improvement program to be initiated by
D.A. would be highly rewarding.
Cropping Patterns for High Altitudes
12. There remains the fodder problem for the Sub-Alpine and Alpine
regions where the fodder shortage during the winter season is most acute
and aggrevates the already serious overgrazing in the forest pastures at
1/ r. 0. Whyte Land, Livestock and Human Nutrition, 1968.
2/ Observations made during field trips and discussions with District
Agricultural Officers.
3/ Farm Manager, Jiri.
4/ F. B. Morrison Feeds and Feeding, 1961.
5/ S. Kitamura, Fauna and Flora of Nepal Himalaya. Scientific results
of the Japanese Expedition to Nepal Himalaya 1962-1953, Vol. I, Kyoto
University; personal observations during field trips.
ANNEX 5Appendix 3Page 5
lower altitudes. What little cropping practised consists mainly of,potatoesand barley for human consumption. Both crops have very low yield levels(respectively 4-5 m tons/ha for potatoes and 0.9-1.0 m ton/ha for barley).Increases in productivity for potatoes would lead to more exports outside thearea, particularly in the Eastern Hills. Increases in barley yield woulddefinitely affect the fodder situation as this crop is already partly usedfor livestock feeding. Barley yields could be raised by better varietalmaterial and applications of manure and fertilizer. In view of the N shortagein the soil and the low financial returns from fertilizer applications in theseareas, the N supply of this crop should be sought in winterhardy leguminouscrops, which can be grown on acid soils of low fertility and possess droughttolerance.
13. "lovers currently grown on some government experimental farmsare not so suitable as they require lime for nodulation and phosphorousfertilization for optimum production. Efforts should be concentrated onlegumes such as hairy vetch (Vicia villosa), horse beans (Vicia faba),Phasemy bean (Phoseolus bathyroides), perennial lespedeza (Lespedezacumeata), Korean lespedeza (L. stipulacea) and Common lespedeza (L. striata).
14. These crops could be intersown in between the barley about a monthbefore harvest. They will continue their growth until December and couldprovide substantial grazing or green fodder. The potato crop planted inJanuary - February would benefit from the N residues supplied by these crops.Some of the perennial species could remain on the land during the winterand could be cut for green fodder until the following spring.
15. Good results can be expected from rootcrops like winter hardyforage rapes and turnips to be sown after the barley harvest in August.Yields of 25-30 m tons/ha are recorded in temperate countries 1/. Whenharvested before snowfall and heavy frost, they could be easily and cheaplystored in trench silos covered with earth. Apart from the seed costs andfamily labour input, no investments are involved. The cropping patternsproposed for the Alpine Regions, however, represents a great change inpopulation habits since it involves a change from semi-nomadic life tosedentary farming. No results are known of the production performance ofchauries when kept on stall feeding during winter time. The advantages ofcollecting stable manure with stall feeding during winter time, which ishighly desirable, for the growing of potatoes and turnips are clear.
1/ R. D. Toosey. Profitable foddercroping, Farming Press Ltd. 1972.
ANNEX 6Page (i)
NEPAL
AGRICULTURAL SECTOR SURVEY
IRRIGATION AND WATER RESOURCE DEVELOPMENT
Table of Contents
ParagraphNumber
SUMMARY AND CONCLUSIONS ....... ......................... i - xiv
A. THE WATER RESOURCE BASE
1. Major River Systems and Their Discharge .... ........ 1 - 112. Irrigable Areas ........ ............................ 12 - 133. Hydropower Resource . ............................... 14 - 184. Groundwater Resource ....... ........................ 19 - 22
B. PAST IRRIGATION PROGRAMS AND EMPHASIS
1. Short History of Schemes ........................... 23 - 302. Past Policies and their Effects ..... ............... 31 - 353. Performance of Irrigation Systems ..... ............. 36 - 374. Recent Changes ......... ............................ 38 - 39
C. WATER RESOURCE DEVELOPMENT POSSIBILITIES AND CONSTRAINTS 40
1. Surface Water Irrigation and Hydropower .... ........ 41 - 442. Groundwater Irrigation ...... ....................... 453. Developing Water Resources in the Hills
General ............ ............................... 46 - 50Expansion of Hill Irrigation ..... ................. 51 - 54Types of Hill Irrigation Projects ........ ......... 55Constraints and Requirements in Developing HillIrrigation .......... ............................. 56 - 60
Need for Improved Water Management .... ............ 61 - 67
,D. ORGANIZATION FOR WATER RESOURCE DEVELOPMENT
1. Organization and Staffing .......................... 68 - 762. Development Planning and Institutional Development . 77 - 80
ANNEX 6Page (ii)
ParagraphNumber
E. FUTURE IRRIGATION POLICY EMPHASES 81 - 83
1. Improved Functioning of Operating Projects ......... 84 - 862. Improving Water Management and Supporting Services . 87 - 923. New Projects of Short Gestation and High Payoffs ... 93 - 94
Low-lift Pumps .. 95Tubewell Programs .96 - 100Policy Guidelines for Groundwater Development . 101 - 106
4. Irrigation at or near Food Deficit Hill Areas ...... 107 - 110Policy Guidelines for Minor Hill IrrigationProjects ......................................... t11 - 113
F. ISSUES
1. Geographical Concentration ........ 114 - 1152. Small vs Large Projects ........ 116 - 1173. Water Charges ........ 118 - 1204. Erosion Control ........ 121 - 122
G. RECOMMENDED PROGRAMS AND STUDIES 123
1. Quick Payoff Programs ... .. ... 1242. Longer Gestation Programs ... .. ... 1253. Inventory Surveys ........ 1264. Investigation Programs ... .. ... 1275. Studies ... ..... 1286. Technical Assistance ... .. ... 129
H. PROJECT POSSIBILITIES FOR EXTERNAL FINANCING
1. Key Projects Supporting the Development of theGandaki Corridor ........ 130The Lumbini Groundwater Project .... 131 - 135Pilot Project in Water Management (Pokhara Valley). 136
2. Other Irrigation Projects ........ 1373. Minor Irrigation Projects ........ 138
BIBLIOGRAPHY
FIGURES
Figure 1: Basin-wise distribution of Theoretical Water Power Potentialityof Nepalese Rivers
Figure 2: Department of Irrigation, Meteorological and Hydrology -General Office Organization (Present)
Figure 3: Regional Directorate for Irrigation, Hydrology and Meteorology(Present)
Figure 4: Proposed Reorganization of Planning Section, DIMH
ANNEX 6Page (iii)
TABLES
Table 1: Monthly Mean Rainfall in NepalTable 2: Monthly Runoff of Nepalese RiversTable 3: Major Level Areas in Inner Terai and Hill DistrictsTable 4: Areas Irrigated by 1970Table 5: Areas Irrigated by 1973 and 1974 and Areas Being Developed for
IrrigationTable 6: Minor Irrigation Projects Completed by 1973.
Appendix 1: Assessment of Meteorological and Hydrological InvestigationsAppendix 2: Selected Projects in the Current Irrigation ProgramAppen'dix 3: Assessment of Available Planning Studies
Addendum I - Rainfall recharge in Birganj, Butwal and Bhairawa
ANN'EX 6Page i
IRRIGATION AND WATER RESOURCE DEVELOPMENT
SUIIARY AND CONCLUSIONS
i. Irrigation is needed in TNepal to overcome the uncertainties of themonsoon and to extend the growing season beyond the four-month monsoon periodduring which SM0% of the annual rain occurs. Some 250,nOO ha of a total ir-rigable area of 1.3 million ha has been developed so far. Only a minorportion of the potential benefits are being realized because of incompletedistribution systems, poor water management and the absence of year-roundirrigation.
WAater and Hydropower Resources
ii. The annual runoff of the rivers constitutes a great underdevelopedresource of the nation. It can cover Nepal's irrigable area of 3.3 millionacres with some 38 feet of water annuallv against an Irrigation requirerentof only about 5 feet. With storage for regulation, some P5 percent of theriver water (over 100 ?TAF) is in principle available for export.
iii. Nepal's hydroelectric potential is estimated to be as high asP3,noo nMW (comparable to the combined installed hydroelectric capacitv ofCanada, the U.S.A. and lexico). Nepal cannot use the vast quantities ofpower that can be produced cheaply (e.g. 1.15 ITS cents per KWH estimated inthe Karnali basin), but can sell it to its neighbors -- principally to Indiawhere powqer demands are great. Fconomies of scale are significant in hydro-Dower generation and transmission generally, and this is also true in Nepal.Both countries can therefore profit from cooperative ventures in developingthe viable Nepalese hydropower sites.
iv. Significant groundwater resources have been established in theTerai and Kathmandu Valley. Two artesian areas have been located at theLumbini and Janakpur Zones of the Terai. The former has by far the great-est potential. It consists of an extensive area (200,000 ha) of high arte-sian pressure (up to 40 ft), located between Butwal and Bhairawa.
Past emphasis of Programs and Projects
v. Past emphasis of government programs have been characterised bythe building of large canals, regional concentration in Kathmandu Valley,Eastern and Nlid-Western Terai, and inadequate pricing of water. Many ofthese irrigation facilities have had minor impacts in relation to anti-cipated benefits. Major constraints in expanding the impact of irrigationhave been linked primarily with Nepal's virtual dependence on India, poorutilization of existing capacity due to lack of coordination between en-gineering and agricultural groups; emphasis on supnlementarv monsoon ratherthan year-round irrigation; emphasis on large canals without the essentialon-farm distribution works; lack of water control; and shortage of skilled
ANNEX 6Page ii
manpower. In the hills, the instability of hillsides and the lack of know-ledge of the nicro-environment (particularly in the smaller hill valleys)have meant that many hill irrigation projects have incurred much higheroperation and maintenance costs than that of building these schemes.
vi. New starts have recently been made to resolve these problems.The Department of Irrigation, Hydrology and Meteteorology (DIHM) has beentransferred from the Ministry of Water and Power to the Ministry of Food,Agriculture and Irrigation (MFAI) in 1972. The new foreign assisted proj-ects (ADB in Kankai and Chitwan Valley, IDA in Birganj) are designed to:(a) ensure that the previous functional isolation between agriculture agen-cies and water-engineering groups can be considerably reduced; (b) providefor optimum water management and multiple cropping; (c) provide for adequatepricing policies for water which should ensure that total maintenance costsand part of the capital costs will be covered by revenues from water charges.
vii. Within the next Five Year Plan, we recommend that Nepal's policythrust be reorientated to:
(a) complete promising irrigation systems (similar toIDA's Birganj Project) which have not generated an-ticipated benefits because of the lack of minorcanals or on-farm development;
(b) focus on new projects of short gestation and high pay-offs relative to additional financial and manpowerresources invested; 1/
(c) improvement of water management and anciliary support-ing services;
(d) irrigation at or near deficit areas in the Hills tomeet requirements for income distribution and increasedfood production.
viii. An action program to implement (a) and (b) would require:
(i) an initial inventory of the existing "completed" projectsto select those for abandonment (e.g. Tinao), completionor rehabilitation (e.g. Chandra Canal);
(ii) the selection of river systems in Hills (as well as theTerai and Inner Terai) where year round irrigation fromlow lift pumps are possible; the river valleys withextensive flat lands like Barigad, Kaligandaki would beprime candidates;
1/ These would consist primarily of tubewells and low lift pumps.
ANNEX 6Page iii
(iii) initiation of preparation for a tubewell project inLumbini on the basis of the IISAID/USGS/HIG groundwaterstudy of the W4estern Terai.
ix. Irrigation projects practising continuous ponding of water onpermeable soils have resulted in extensive leaching of nutrients leadingto long term paddy yield decline. The experience of the 50 year oldChandra Canal 1/ illustrates the importance of water management on per-meable soils. An action program for water management is needed at boththe organizational front (training of irrigation extension workers) andthrough the initiation of pilot projects in farmers' field, particularlyin areas where soil permeability problems (hill valleys) exist. In addi-tion to research, these projects can be used to, not only introduce betterdistribution systems and irrigation practices, 2/ but also to demonstratethe gains from integrating credit, input - supply and improved crop husbandrvwith water management. We propose the location of these pilot projects inhill valleys where paddy will continue to be important (primarily because oftaste or lack of alternative crops) like Pokhara, Surkhet, Palpa, Baglung,Jumla, Gorkha; and Inner Terai Valleys in Dang, Makwanpur and Chitwan. Watermanagement in the Chandra Canal area could be part of a rehabilitation proj-ect.
x. An action program for the hills should start with the valleys andtars. 3/ Case by case studies will have to be made, initially in the largerhill valleys (e.g. in Pokhara, Baglung, Surkhet), for alternatives 4/ to thetraditional diversion structures which are frequently damaged by large boul-ders moving with flood flows. Further water storage projects in the hillsshould be preceded by a multidisciplinary approach (using geologists, en-gineers, land use specialists, soil scientists and agronomists) to identifyareas where slope stabilitv problems and interference with flood flows canbe kept to a minimum. For minor irrigation projects (particularly in thesmaller valleys where accessibility is more difficult), local participationin construction and maintenance is essential.
Issues
xi. The acceptance of the above strategy will resolve many of theissues facing the irrigation subsector. The issue of what region to con-centrate irrigation activities would be resolved in favor of the selection
1/ Pre-irrigation paddy yields were 2 m tons/ha. Upon completion of theproject irrigated yields were 3 m tons/ha for about 10 years. The yieldhas since declined to the present yield of about 2 m tons/ha.
2/ For example, independent inlet systems for field channels, puddling ofsoil prior to transplanting and intermittent irrigation for paddy.
3/ Tars are raised flat lands along rivers.
4/ Like diversions from underground water traps; lift pumps; tubewells.
ATNEX 6
Page iv
of programs which can fulfill the criteria for policv emphasis alreadvoutlined. Programs for irrigation rehabilitation, extension and upqrading,and groundwater, should remain in the Terai and Inner Terai where the onpor-tunities exist. Irrigation programs in the hills for water management, liftpumps and selected studies should also he concurrently encouraged. Fven inthe Terai past investments have been made in Fastern ard Central Terai, pri-marily in response to locations where population and political influencehave been concentrated. We recommend that increased emphasis be given tolWestern Terai because of (a) the groundwater potential, and (b) climatically(in terms of lower and less dependable rainfall) the need is greater. In-creasing migration pressure in Western Nlepal and the fact that it is thelast stronghold of unsettled flat forest land necessitates concurrentattempts to combine irrigation with settlement programs there.
xii. The issue of large vs small irrigation projects is, in our judge-ment, a problem of timing. The tremendous potentials for foreign exchangegains in the export of hydropower and irrigation water to India and theimportance of irrigating the Inner Terai Valley are important reasons forlarge irrigation projects. Our suggested re-emphasis on quicker gestationand relatively small projects in the next five years is dictated by thenecessity to realize projected benefits and the constraint on Nepal's imple-mentation capacity. In the longer term (by 1980), with the strengtheningof Nepal's obsorptive capacity, developing large multi-purpose (hydropower-irri&ation projects) projects would be more appropriate. Because theprimary consumer of Nepal's excess hydropower and irrigation water fromsuch projects would be India, it would be mutually beneficial for dialogueto be initiated between Nepal and India.
xiii. Given the traditional long gestation periods in preparing suchprojects, it is not too early to decide whiich of the identified largeirrigation-hydropower projects need to he studied further. W4e recommendthe Bhagmati project as the prime candidate since initial background workis completed; the lessons from Birganj would he annlicable; it is relativelyunemcumbered by previous works or agreements; it would be large enough tohave important impact and would not be too large to overwhelm the scarcemanpower available.
Improving Planning and Imnlementation CapacitY
xiv. In the past, the planning and construction of several major proj-ect have been left to the countries providing the assistance, and littleattention was paid to exploring and assessing alternative irrigation possi-bilities for NTepal's benefit. HMG realises that it has to pav greaterattention in systematically planning for projects. We recommend that tech-nical'assistance be requested for a senior water resource planner who willbe a joint advisor to the Planning Commission and DIHM, and a supportingteam (attached to DIP!). This group would assist 1IMG in (i) evaluatingwater'resource potentials and their multipurpose uses; (ii) assessing theresults of past studies and implementing further studies; (iii) developingguidelines for the review and improvement of existing prolects.
ANNEX 6Page 1
IRRIGATION AND WATER RESOURCE DEVELOPMENT
A. THE WATER RESOURCE BASE -/
Major River Systems and Their Discharge
Major River Basins and Sources
1. The major river basins (Map 1) are: The Karnali in the far west-ern part of the country, the Gandaki in the west and center and the Sapt Kosiin the eastern part 9f the country. The total drainage area of these threerivers is 125,000 Km including the portions lying in the territory of thePeople's Republic of China.
2. Nepalese rivers may be classified into three types -/ according totheir source of dry-season discharge, as follows:
(a) The Snow and Glaciers in the Himalayas. The snow and glaciershave a reservoir function which is the reason why the Karnali,Narayani and Sapt Kosi rivers carry significant flows in thedry season (Table 1). This makes them attractive sources ofwater supply for irrigation with several promising sites forrun-of-the river power generation such as Chisapani, Lakarpata,Kaligandaki, Barakshetra, in their basins.
(b) The Mahabharat Range below the Snow Line. Rivers originatingthere are fed by groundwater regeneration, including springs,and do not dry up in the low flow season. Rivers of this typea reKankai Mai, Kamla, Bagmati, Rapti, Babai, and Manharirivers. Many feasible hydropower sites are found or expectedin these river basins such as Kulikhani, Mainachuli, Kamla,Sarada-Babai, Babai-Rapti, etc.
3. The Siwalik Hills. Rivers originating in the Siwalik Hills aredry in the low-flow season and unsuitable for perennial irrigationand hydropower generation without surface storage.
1/ Principal sources used are: (a) DIHM/USGS, 1969; (b) FAO/NK, October 1969(c) HMG/NK, August 1970; and (d) HMG/NK, May 1970. (See Bibliography forcomplete reference).
2/ HMG/NK, May 1970 (Chapter 4).

ANNEX 6Page 2
Hydrology 1/
4. The average annual precipitation in Nepal is 1,516 mm or about61 inches. 2/ The average annual runoff coefficient is 71.1 pe5cent, andth Sotal annual runoff from the territory of Nepal is 152.6 km (152.6 x10 m or 124 mill ion acre feet); the average annual discharge of the majorrivers is 4,840 m /sec or 171,000 cfs. About 90 percent of the precipita-tion is concentrated in the wet season. Table shows that 79 percent of theannual runoff of the ten major rivers in Nepal occurs in 6 months from Juneto November, and 21 percent in the remainini 6 months. The monthly riverflowdeclines to its minimum in March of 1,050 m /jec (2.7 x 10⁹m3 9is the month)and reaches its maximum in August of 15,450 m /sec (40.0 x 10 9m in themonth).
Floods
5. The mountainous terrain of northern and central Nepal combineswith the southwestern monsoon to produce disastrous floods annually. Inaddition to these floods, the rivers are subject to landslides, which fre-quently block narrow gorges temporarily, and then upon collapse release thewater quickly, causing floods. During floods most rivers also move largeboulders (the Tinao river moves particularly large boulders, up to 20 tonsin weight, which have caused serious damage to the Indian-built barrage nearButwal).
Silt & Bed Loads
6. Suspended material in surface water and sediment loads transportedby the rivers of Nepal also have a direct effect on the feasiblity and costof water resources development. The unusually large quantities of bed loadmaterials moved in streams during the monsoon markedly limit the useful lifeof reservoirs and river control structures. As the river discharge increases,the silt content also increases, sometimes up to 1.5% of the river water.With an average silt content of 0.25%, the totgl3silt volume removed by theKarnali River, for example, amounts to 75 x 10 m annually. This volume isequivalent to a top soil layer of 1.7 mm bein removed from the catchmentarea, and Nepal is losing as much as 240 x 10m 3 of soil annually. 3/
1/ HMG/NK, August 1970, page 4.
2/ Details for different stations are given in Table 1.
3/ HMG/NK, August 1970, p. 7.
ANNEX 6Page 3
7. Light soils are generally found on Tars and Hill Valleys due toprevailing steep river gradients resulting high-velocity flood flows prevent-ing deposition of suspended materials. The river gradients vary from 0.7and 0.006 averaging about 0.04, or 364, 31 and 208 ft per mile respectively,for the major rivers, while the slopes of smaller streams are even greater. 1/With these steep gradients fine suspended materials are carried into theflatter Ganges plains after some deposition in the Terai where the gradientsare much less steep but still high in terms of Ganges basin gradients.
Other Problems
8. Other problems exist that must be overcome before the water re-sources potentials can be developed. There are serious problems in trans-portation, communications, financing, and the availability of constructionmaterials. Concerted solution of these problems is a primary requirementfor the overall development of the country.
Water Availability for Export
9. The annual runoff of the streams of Nepal constitutes a greatunderdeveloped resource of the nation. The average annual discharge ofthe major rivers of 171,000 cfs to the Ganges River in India is equiv-alent to enough water to cover all of Nepal to a depth of 44 inches. Withan average annual runoff of 124 million acre feet (MAF) and a potentiallyirrigable area of 1.3 million hectares or 3.3 million acres, availableriver flows could cover this irrigable area with some 38 feet of wateragainst an annual irrigation requirement of some 5 feet (or 14 percent ofthe average annual flows in the main rivers). Furthermore, several 100,000 hacan be irrigated by tubewells, which will more than compensate for domestic,municipal and industrial water supply requirements. The total volume of sur-face water required for consumptive use in Nepal will therefore not exceed15 percent of the average annual river flows. This means that, with storagefor regulation, some 85 percent of the river water (or some 100 MAF) is inprinciple available for export to India.
The Value of Irrigation Water
10. Berger 2/ has determined that the annual net farm benefits fromirrigation 3/ in the Lumbini zone are NRs. 2,770 per hectare or Rs. 1,110per acre for two rice crops. If 4 feet of irrigation water is used, the
1/ This compares to average gradients of the Indus and its tributaries inthe Pakistan Punjab of 1 to 1.5 ft per mile and Ganges gradients of 0.3to 0.4 ft Der mil in Rwnplatipsh.
2/ Berger, 1972 (p. 46).
3/ i.e. net returns to the farmers exclusive of irrigation project costs.
ANNEX 6Page 4
value of water would be Rs 280 or US$28 per acre foot (AF); with 5 feetof water the value would be Rs 220 or US$22/AF. Berger's analysis is madefor average yields over a period of some 25 years, i.e. lower returns ini-tially which increase gradually with time.
11. Kamla and Bagmati reservoirs have live storage capacities of0.85 and 1.26 million acre feet (MAF) and their estimated costs are US$32.7million and US$38 million, respectively. 1/ This means a capital cost perAF of storage of US$38.5 for Kamla and US$30 for Bagmati. The useful livesof these reservoirs are not known but the above figures for the annual valueof water (US$28 or 22/AF) and the capital cost for storage (US$38.5 and 30/AF)indicate that surface water storage can be very attractive, particularly ifthe stored water is used in existing canal systems for irrigation intensifi-cation in either Nepal or India.
Irrigable Areas
12. Farmlands in Nepal are distributed over three categories of land,i.e. on the slopes and flat lands (Tars and river valleys) of the Hills,and on the Terai and Inner Terai. Terai and Inner Terai have the greatestirrigation potentials. This area occupies 26.8 percent of Nepal and in-cludes an estimated irrigable area of 1,050,000 ha 2/. It has ample waterresources, a climate suitable for a wide variety of crops, and a fairlyfavorable soil fertility. The Terai area has also ready market channelsfor most agricultural products. In view of these conditions, the emphasiswith respect to irrigation must remain in the Terai and Inner Terai, whilesupporting selective expansion of irrigation in the Hills.
13. The total area of relatively flat lands in the Hills is estimatedto be:
1/ FAO/NK, Final Report, 1972.
2/ FAO/NK, August 1970, Table 5.1, p. 63.
ANNEX 6Page 5
('000 ha)
For lands up to 5,000 ft elevationwith slopes of 10% or less 255with slopes between 10 and 30% 50
305
For lands with elevations between5,000 and 12,000 ft and slopesbetween 0 and 30% 115
Total 420 1/
The 420,000 ha area is a gross area including villages, streams, forests,areas with uneven micro-topography, etc. Probably not more than 70 percent(about 300,000 ha) can be developed for irrigation. Some valleys are alreadyreceiving supplementary irrigation (e.g. most of Pokhara Valley). A summaryof the flat lands in the Hill region is given in Table 3.
Hydropower Resource
Potentials
14. Nepal, although a small country, is one of the few in the worldwith a very high but still undeveloped hydroelectric potential, 2/ Esti-mates of this potential are as high as 83,000 MW, 3/ which is comparable
1/ This figure does not include Kathmandu Valley of 25,000 ha. Only thefirst area, with slopes of 10% of less and below 5,000 ft elevation, hasactually been measured from topographic maps prepared by the Survey ofIndia to a scale of 1:63,360 or one-inch-to-one mile, having contourintervals of 100 ft. The other acreages have been estimated by inspec-tion of a 1:506,880 scale topographic map prepared by the Ministry ofDefence of the United Kingdom.
2/ The causes for the high hydropower potentials are the high river flows(Table 1) combined with steep river gradients. These gradients varyfrom 0.07 to 0.006 averaging about 0.04, which are equivalent to dropsof 364, 31 and 208 ft per mile respectively, for the major rivers; thegradients of smaller streams are even steeper.
3/ HMG, "Water Power Potentiality of Nepal", by Dr. H.M. Shrestha, Electri-city Department, Ministry of Water and Power, 21 pages, 1971 (It is notknown what percentage of this potential can be economically developed).
ANNEX 6Page 6
to the combined installed hydroelectric capacity of Canada, the U.S.A. andMexico. Only the Karnali River basin has so far been systematically ex-plored. A study of this basin, financed by UNDP, was undertaken during1963-66 and the report identified ten possible schemes, with potentialcapacities ranging from 18 MW to 1,800 MW and a total capacity of 6,800 MW.The study demonstrated that vast quantities of power could be produced atlow cost -- e.g., eight billion KWH annually at less than 3.5 Nepalesepaisa (0.3 US cents) per KWH. 1/
15. Nepal's geographic features offer potentials for large, mediumand small hydropower projects. The country slopes down from an averagealtitude of 7,000 meters to 200 meters. Three large drainage areas cover80 percent of the country, and feed three major tributaries of the GangesRiver: The Kosi with 1,930 cubic meters per second, the Narayani with283 cubic meters per second, and the Karnali with 510 cubic meters persecond, average flow. These large quantities of water with tremendousfall imply huge quantities of hydropower if they can be harnessed (Figure 1).Most power developments so far are run-of-the-river plants. The problemsof containing the tremendous volumes of water by dams, providing for spill-way capacity for maximum storms, and finding suitable abutments and materialsfor dams, remain yet to be resolved.
16. Several medium and small-size run-of-the-river hydropower possi-bilities are currently under study by HMG Electricity Department. Some powerpotentials become attractive with surface storage reservoirs built for irri-gation, e.g., the Kamla Storage Project, Bagmati Storage project and SunkosiHigh Dam project which can have firm power outputs of 10, 40 and 200 MW,respectively. 2/
17. Despite its enormous hydroelectric potential, Nepal's per capitapower production and consujmption are among the lowest in the world and 40percent of existing electric plants consists of steam and diesel unitswhich are dependent upon coal and diesel fuel imported from India. Thepresent total installed generating capacity is about 55 MW. Total generated
1/ A recent desk study (Nepal: Karnali Hydroelectric Project, S. AsiaPrograms Dept., December 1973) indicated that at 10X return on capital,power from the project can be sold at 1.15 US cents (12.14 Nepalesepaisa) per KWH. This level is still low compared with current costs andcharges for generation, transmission and distribution (IBRD, Report No.125a-NEP, June 1973, Volume III, Power):
Bhairawa Kathmandu--------(in NRs)------
Cost per KWH without interest charges 0.43 0.60Tariff rate per KWH 0.50 0.20
The value of power for a 200 MW thermal power plant presently under con-struction near Delhi is about 1.36 US cents per KWH, assuming a 10%return on capital.
2/ FAO/NK, October 1969; different figures are given in HMG/NK, May 1970.
ANNEX 6Page 7
power in 1972/73 was about 104 million KWH corresponding to a per capitafigure of less than 9 KWH per annum. This compares with 20 KWH and 120 KWHin Bangladesh and India respectively.
18. Nepal cannot use the vast quantities of power that can be producedcheaply, e.g., in the Karnali basin and elsewhere, but can sell it to itsneighbors -- principally to India where power demands are great. Economicsof scale are significant in hydropower generation and transmission generally,and this is also true in Nepal. Both countries can therefore profit fromcooperative ventures in developing the viable Nepalese hydropower sites.
Groundwater Resource -/
19. Emphasis to date has been on investigations rather than develop-ment of groundwater in Nepal because little was known about potentials.However, the presence of significant ground water resources has now beenfirmly established in the Western, Central, Eastern and Far Eastern Teraiand in Kathmandu Valley, where several 100,000 ha can be irrigated fromtubewells.
20. Prospects for tubewell development in other valleys and tars alsoappear promising. In order for such development to proceed effectively,exploration and basic geohydrologic studies have been undertaken on acontinuing basis to establish the physical limits of underground reservoirsand their potential for development.
21. Two extensive artesian areas have been located and can be devel-oped; one in the Terai of the Lumbini Zone and the other in the Terai ofthe Janakpur Zone. The former has by far the greatest potential. It con-sists of an extensive area (about 200,000 ha) of high artesian pressure(up to 40 ft) and high transmissivities 2/ located between the towns ofButwal and Bhairawa.
22. No inventory of existing tubewells is available for Nepal. It isknown that in 1968 3/ more than 1,000 dug wells and well points were in usein the Terai for village water supply and irrigation. A recent field in-ventory 4/ showed that nearly 1,000 dug wells and 8 old tubewells were in
1/ The geohydrologic, hydrologic, meteorologic investigation programs aredescribed in Appendix 1.
2/ The transmissivities vary between 60,000 and 400,000 averaging 160,000US/gal/dry/ft or 750, 5,000 and 2,000 m3/day/m respectively.
3/ Swarzenski, W.V. and Babcock, H.M., June 1968.
4/ HMG/USAID, January 1973.
ANNEX 6Page 8
use in the Lumbini Zone. Private irrigation tubewells are being installedin several areas, particularly in the artesian groundwater areas of Lumbiniand Janakpur (about 300 in each as of September 1968) and elsewhere 1/. Somewells are being used for highly profitable fish-farming near the towns ofJanakpur, Birganj and Bhairawa. Some 39 deep tubewells (120 to 150 meters)have already been provided by the Government for irrigation in the Birganj,Malangwa and Siraha areas (22, 10 and 7 respectively). In the Lumbini Terai,14 investigation wells are completed and suitable for irrigation or publicwater supply.
B. PAST IRRIGATION PROGRAMS AND EMPHASES
Short History of Schemes
Past Programs and Projects
23. The farmers of Nepal have in the past developed their own irriga-tion systems, and although detailed records are absent, total acreage isestimated at 155,400 ha. 2/ Prior to 1950 and before the launching ofNepal's first five-year plan, no substantial irrigation works had beenundertaken by the Government. An area of 14,700 ha was irrigated by fourprojects (13,000 ha by the Chandra Canal Project, Saptari).
24. During the First and Second Development Plans -/ (1957-62 and1962-65 respectively), medium to small irrigation facilities covering43,700 ha, were built in Kathmandu and Pokhara valleys, and the Terai.In the Third Plan (1965-70) a minor irrigation program was launchedcountry-wide in 1966/67.
4/Current Programs and Projects -
25. For the Fourth Five-Year Plan (1970-75), the target was to pro-vide irrigation facilities for 183,632 ha of land (Table 5). During thefirst two years of the plan, most irrigation projects continued to remainin the construction stage. In 1972, a Two-Year Plan (1972-74) was launchedas part of the original Five-Year Plan. The area proposed for irrigation
1/ Information provided by G. C. Tibbitts, Jr., Chief, USGS Field Partyin Nepal.
2/ Ministry of Agriculture Food and Irrigation, September 1973.
3/ Details are given in Table 4.
4/ As of September, 1973.
ANNEX 6Page 9
was increased to 240,014 ha of which major, minor and tubewell schemesaccounted for 239,550, 5,924 and 3,540 ha respectively. Project works tobe completed within the two-year plan would provide irrigation facilitiesfor 79,714 ha of land in one major, 3 medium, 17 minor and some tubewellprojects. Most of the area proposed for development would be in the Terai.
Minor Irrigation Schemes
26. A program for the construction of minor irrigation projectsstarted on a country-wide basis in 1966/67 to encourage greater farmerparticipation. A Central Board for Minor Irrigation was establishedunder the chairmanship of the Minister of Water and Power. In addition,every district had a Committee for Minor Irrigation Project Development.
27. The aims were (a) rapid expansion of irrigation and, (b) maximumparticipation by farmers. Project size was limited by funding (less thanNR 2.5 lakhs per project). This arbitrary limitation led to partially com-pleted structures and canals. The program included canal diversion projects(in the Hills and the Terai), and tubewell irrigation (in the Terai).
28. In the first year (1966/67), 125 projects were taken up on a cam-paign basis and it was claimed that 100,000 new acres had been put underirrigation. However, the projects had not been investigated properly (hy-drological studies were particularly inadequate), the construction was ofpoor quality, and many were as yet incomplete by the end of the first year.Other projects had high 0 & M costs. In the second year, it was found thatthe farmers would not maintain the irrigation systems. The Board stoppedtaking on new projects and worked on completing and improving the firstyear's projects. Some projects could be rehabilitated but many requiredtoo much investment. A separate minor irrigation department was createdin 1970 to sort out the problems and was merged with DIHM in 1971. Theminor irrigation schemes "completed" to date are listed in Table 6.
29. Private tubewells were installed in the groundwater areas ofJanakpur and Bhairawa (about 300 in each area as of September 1973). Gov-ernment tubewells were installed in the Birganj groundwater area whereseveral of the 22 wells continued to pump sand because wrong slot sizeshad been selected. Public tubewell construction was stopped completelyin 1969 and DITHM switched to medium-sized canal projects, mainly in theTerai.
30. In 1972/73 four Regional Directorates were established by DIHM -
and minor irrigation projects are now under the control of the regionaloffices. Project investigations have improved but are still incomplete.The principal problems and uncertainties with respect to Hill irrigationprojects relate to: (a) landslides; (b) poor water management; and (c)costly maintenance.
1/ The regional offices are located in Kathmandu, Pokhara, Nepalganj andBiratnagar.
ANNEX 6Page 10
Past Policies and their Effects
31. The main features of past irrigation policy are: (a) poor utili-zation of existing capacity, because of lack of coordination between engineer-ing and agriculture groups and poor water management, (b) emphasis on "sup-plementary irrigation", (c) inadequate pricing of water, and (d) limitedirrigation expansion in the Hills.
Lack of Coordination between Engineering and Agriculture
32. Irrigation programs to date have emphasized preinvestment surveys,large-scale projects and construction of large canals while distribution net-works (channels of 4 cusecs and less) and on-farm development have been neg-lected. As a result, increased irrigation capacity has been translated onlypartially into actual utilization. The causes for this ineffective use ofirrigation capacity are diverse. With some exceptions, the major concernhas been with the engineering aspects which is only part of irrigationdevelopment. There has been no combined action of agriculture and water-engineering groups. This lack of coordination among agencies which shouldhave been closely associated, make difficult the design and construction ofdetailed networks of tertiary and on-farm channels for water distribution.Project selection was not always optimal. Most major projects were locatedin the vicinity of the Indian border and the closer the location of the canalto the border the smaller the command area tended to become.
Supplementary Irrigation
33. Until recently, the underlying philosophy behind public irrigationdevelopment has not been multiple cropping but provision of supplementarywater to the wet-season rice crop. All completed projects and almost allongoing ones were based on this "supplementary irrigation" concept. Thisapproach does not provide for optimal water management. Present systemscan be useful for supplying irrigation water at two critical times: theseeding and transplanting, and the reproductive stages of paddy. The re-productive stage of rice takes place some time in the monsoon months ofJune to September when the rainfall is two to four times the evapotranspi-ration and hardly any irrigation applications are needed. The more criticalstage is at seeding (from March-April) to which supplementary irrigation hastraditionally been geared. In many schemes, even this supplementary use hasnot been achieved.
Inadequate Water Charges
34. The fourth characteristic of public irrigation development hasbeen'the inadequate pricing of water. At present, farmers are charged onlyabout Rs 19 per crop per ha, with the result that revenue from water chargesamounts to a small and declining fraction of maintenance expenditures forirrigation (7 percent in 1972/73). 1/
1/ R.B. Pradhan, Public Sector Enterprises and Pricing of Products andServices, January 1973.
ANNEX 6Page 11
Slow Irrigation Expansion in Hills
35. The fifth characteristic of public irrigation policy has been thedifficulties encountered in expanding irrigation in the Hill areas with theexception of Kathmandu Valley. Local irrigation works, such as tanks, wellsand small drains and channels constructed by the farmers themselves (both inthe Terai and in the Hills), supply water to some 154,000 ha.
Performance of Irrigation Systems
36. Nepalese farmers are irrigation conscious and keen to get irriga-tion water either by their own efforts or from government projects. Farm-ers' irrigation systems presently irrigate some 154,000 ha mainly in theHills but also in the Terai, while government systems cover some 150,000 ha,mainly in the Terai. Practically all irrigation projects are based on run-of-the-river diversions from streams and have not come up to expectations.They have proved difficult to maintain, owing to repeated damage to head-works and to heavy sediment deposition at barrages and in canals duringmonsoon floods.
37. The main weaknesses of existing schemes are:
(a) Rapidly decreasing amounts of water available in the riveras the dry season progresses.
(b) High seepage losses underneath several existing river weirsand high seepage losses from canals.
(c) No minor distribution systems (with capacities of 4 to 5cusecs and less) are provided within irrigation command areas.
(d) Inadequate control structures in canals for maintainingwater levels high enough to allow field diversions ascanal supplies decrease.
(e) Lack of drainage systems.
(f) Lack of routine operations and maintenance.
Recent Changes
38. New starts have recently been made which aim at resolving theproblems referred to above. The Department of Irrigation, Hydrology andMeteorology (DIHM) has been transferred from the Ministry of Water and Powerto the Ministry of Agriculture and Irrigation (MAI) in 1972. In addition,
ANNEX 6Page 12
HMG has recently signed loan agreements with the Asian Development Bank fortwo projects: one in the Kankai Area (5,000 ha) in the Eastern Terai andanother in the Chitwan Valley (11,000 ha). A third one, the Birganj Irriga-tion Project (31,400 ha) is receiving financial support from the World BankGroup.
39. In common, these three projects are designed to ensure that theprevious functional isolation between agriculture agencies and water-engineering groups is brought to an end, recognizing that water supply isonly one, albeit fundamental, aspect of agricultural development policy.The three projects are also designed for optimum water management and mul-tiple cropping. Similarly, these projects will provide for adequate pricingpolicies for water which should ensure that total maintenance costs and partof the capital costs will be covered by revenues from water charges.
C. WATER RESOURCES DEVELOPMENT POSSIBILITIES AND CONSTRAINTS
40. With the assistance mainly of India and also of USAID, DIHM hasgained considerable experience in designing and executing weir-diversioncanal projects. However, several weirs have been built across streamsthat carry little or no water during the dry season; others are locatedon highly permeable subsoils causing the dry season flows to disappearunderground; some weirs are subject to frequent damage by the huge bouldersmoving with flood flows; and finally, some large costly weirs have beenbuilt to irrigate small areas of only a few hundred acres. DIRM is awareof these problems and realizes that its water development program must bediversified. There are many and varied opportunities for water develop-ment in Nepal which are discussed below.
Surface Water Irrigation and Hydropower
41. Streamflow data produced by the Hydrology Section of DIHM clearlyindicate the areas where surface water is available for irrigation and hydro-power. In the Terai Belt, with the exception of the major rivers that crossthe belt (para 2), there are practically no reliable surface-water sourcesfor year-round irrigation.
Large Low-Lift Pumping Stations
42. Terai areas adjacent to the large rivers can be brought underirrigation most easily by using large low-lift pumping stations for divert-ing river-water into feeder canals. Construction of diversion weirs onthese large rivers can thus be avoided or delayed until the irrigated areais large enough to make the weirs worthwhile. Some pumping plants couldthen be moved to other sites. Substantial pumping plants are included inthe ADB-financed Kankai and Chitwan projects.
ANNEX 6Page 13
Small-Capacity Low-Lift Pumps
43. In addition to large permanent pumping stations, there are manyopportunities for small-capacity low-lift pump units. These units can beused to pump water from rivers, creeks, ponds, irrigation canals and drains.They can also perform a useful function in (a) expanding the irrigated areaand (b) lengthening the period of irrigation in canal areas with defectiveor inadequate delivery systems. About one thousand small pump units of 0.7to 1.5 cusec capacity have been imported and there appears to be a potentialfor several thousand more. This potential should be assessed by determin-ing the surface water supplies available from all sources during the dryseason from (a) the stream flow records of the Hydrology Section and (b)field inspections and surveys.
Surface Storage for Irrigation and Power
44. The tremendous potentials for foreign exchange gains in the exportof hydropower and irrigation water to India and the importance of irrigatingthe Inner Terai are compelling reasons for large hydropower and irrigationprojects. Although field studies of surface storage and hydropower poten-tials are available, no comprehensive inventory is as yet available of theoverall surface storage potentials of Nepal for either irrigation on low-costhydro-power generation. Considerable data and information are now availableregarding the river regime, rainfall and meteorologic conditions which wouldalso permit an assessment of low lift pump possibilities. Assistance isrequired to analyse these data and undertake supplemental studies forpolicy planning and programming (see para 80). An important prerequisitefor these projects is the agreement with India on water rights.
Groundwater Irrigation
45. Tubewells provide a year-round water supply and have the advantagethat they can be designed and constructed at all scales and levels of invest-ment, ranging from a few tens of tubewells to several hundreds or more. Con-straints are related to the lack of capacity in Nepal to develop and main-tain them and the legal aspects of ownership rights need to be reviewed(paras 97-106).
Developing Water Resources in the Hills
General
46. In the Hill regions there are about 600,000 ha of crop lands ofwhich 150,000 ha are paddy fields. 1/ The remaining 450,000 ha are com-prised of upland terraces on which maize and wheat are the principal crops.
1/ HMG/NK, August 1970.
ANNEX 6Page 14
The cultivated lands in the Hill regions may be grouped in the followingthree types:
(i) terraced fields on steep hill sides (with slopes of 20to 80%, most having slopes of 50% or more);
(ii) cultivated fields on tars (with slopes of 5 to 20%); and
(iii) cultivated fields on valleys (with slopes of 2 to 10%).
47. The terraced fields occupy about 450,000 ha. The steep hillslopes have been terraced to prevent the loss of the top soil due to ero-sion by rainfall, to maintain soil fertility and to conserve rainwater.To irrigate hill terraces, long canals would be needed for gravity diver-sion or provision of high pump lifts. Both methods are costly and haveonly limited application.
48. Tar lands, commonly defined as flat lands along rivers, aregenerally well developed along the larger rivers and have slopes between5% and 20%. Some tars occupy only 10 ha and others have more than 5,000 ha.
49. There are many valleys scattered over the Hill territory (Table 3);some are large such as the Valleys of Kathmandu (25,000 ha) and Pokhara(13,000 ha) and there are several smaller valleys such as the one nearTansing of 2,000 ha.
50. The paddy fields are mostly found on tars and in the valleys ofwhich some 130,000 ha are receiving supplementary irrigation, mainly fromirrigation systems built by the farmers. These paddy fields receive waterduring the wet season but very little water is being diverted in the dryseason because most smaller rivers run dry and the farmers' diversion worksare primitive.
Expansion of Hill Irrigation
51. The term "Hill irrigation", as used in Nepal, is not clear butrefers mainly to the irrigation of relatively low-lying, flat lands thatoccur among the Hills. These lands occupy an area of about 420,000 ha dis-tributed over many tars and valleys of which probably some 300,000 ha canbe irrigated. Some higher lands are irrigated from the many springs whosedischarge is high during and immediately after the monsoon and whose flowsdecline as the dry season progresses. The best opportunities for irriga-tion expansion exist in the larger Valleys: the Surkhet, Pokhara, Kathmandu,Tansing, Chitwan, West Rapti, Palpa and Dang Valleys, and on the larger tars.These should have the high priority assigned to them by DIHM wherever thesoils are suitable for sustained irrigation. The combination of irrigationand horticulture on the higher terraces and tars will become possible onlywhen hydraulic lifts can be provided economically using low-cost hydropower.
ANNEX 6Page 15
52. In the dry season, the small rivers and streams near tars areusually dry. It is generally possible to pump water from the larger rivers,but the required pump lifts are often high. Construction of farm ponds forirrigation water storage will be preferable in several cases. Groundwaterutilization is another promising method for Tars and valleys. This requires
a case-by-case evaluation of the subsurface conditions.
53. If the catchment areas are sufficiently large, small reservoirs
can be constructed to provide irrigation water in the dry season. The re-quired capacity of these small reservoirs ranges from a unit capacity of
8,000 to 10,000 m3 per ha. With an average water depth of 5 m in a smallreservoir, one reservoir with a water surface of 20 ha will be needed forevery 100 ha of command area. The silt runoff from catchments must be
determined to ascertain the reservoir life. Since they require littleforeign exchange if constructed under a labor-intensive rural works program,
reassessment of selected projects should be undertaken to determine the eco-nomic costs and benefits to the economy.
54. Pump irrigation is indicated where a stream or river has suffi-
cient discharge in the dry season and pump lifts are within economic limits.Studies of the potentials for tubewells, pumps and farm pond irrigationsystems should be initiated, and detailed plans and designs developed and
analyzed for each area before construction is undertaken.
Types of Hill Irrigation Projects
55. There are six principal types of Hill irrigation projects:
(a) Diversion Projects: this is the only type used to date inthe Hills and ranges from simple and cheap to very complexand costly. Principal problems are costly diversion structuresfor small command areas and contour canals cut into hill slopes(several of which are unstable). The diversion structure isfrequently damaged by large boulders moving with flood flowsand the countour canals are subject to landslides due to slopecutting and seepage above and below the canal.
(b) Diversion from Underground Watertraps (trenches and thrash racks):same type as above except that there is no superstructure above
the riverbed inhibiting boulder movement. Particularly suitablefor rivers at boulder stage, river flows are trapped into
trenches through thrash racks (free from heavy silt andcarried into clhannels). One such structure is already inoperation in Bagmati Zone.
(c) Pumplifts: pumplifts can be used in areas witlh hill slopesunsuitable for contour canals. Pumps are particularlyattractive if electric power is available either from exist-ing power lines or nearby micro-hydropower units.
ANNEX 6Page 16
(d) Minor Storage Reservoirs: The geology and topography are suchthat minor storages can be provided economically in severallocations. This makes it also possible to combine micropowerunits with pumplifts downstream. Several small lakes existin the Hills of which the level (and storage) can be raisedby levees (e.g. Begnas Tal, a lake of about 700 acres nearPokhara, can be raised by some 20 ft with a levee of 3/4 milelength).
(e) Tubewells: tubewells will have application in Hill valleys,their potential appears promising but access with drillingequipment is generally difficult and impossible in many cases.
(f) Improvement of Farmers' Irrigation Systems: improved structuresfor diversion and distribution would increase water suppliesand double cropping, and expand irrigated areas. Other areascould profit from improved drainage in the hill slopes above thecanals thus preventing landslides.
Constraints and Requirements in Developing Hill Irrigation
56. Access. Access to Hill projects is usually difficult and severaldays of foot travel is required for inspection purposes. Survey equipmentand construction materials must frequently be carried to the site on animalor human backs on foot paths across steep hills. Roads and cableways willimprove development opportunities.
57. Farmers' Participation and Ownership of Minor Projects. Farmersoperate and maintain the old private systems and even have 24-hour surveil-lance during heavy rains to prevent damage from becoming serious. The ex-perience from past programs (para 28) indicate the need for minor irrigationprojects to be built only with farmers' participation and a contract betweenthe farmers and HMG regarding financing, ownership, construction and opera-tion and maintenance (para 112). The same applies to dispersed tubewellsand small-capacity low-lift pumps which are to be owned and operated byprivate farmers (paras 97-98). ADBN is successfully financing tubewellsand pumps and could participate in the funding of minor surface water proj-ects as well.
58. Role of DIHM. Traditionally the farmers have been able to oper-ate and maintain their own projects. We agree with DIHM that it is in noposition to operate and maintain minor projects (say, less than 1,000 ha)particularly in the Hills because access to Hill projects is too difficult,DIHM lacks staff and does not yet have a functional irrigation extensionservice.
59. The role of DIRM with respect to minor projects must be definedbut should be limited to survey, design and supervision of construction.Construction supervision should be limited to normal engineering layout of
ANNEX 6Page 17
channels which would mainly be dug by the future owners of the project.External skilled labor would be brought in only for structures and othercomplex construction items that may occasionally be required. Ideally DIHMwould function as the consulting engineer to the financing authority deal-ing with the farmers (e.g. ADBN or the Village Panchayat).
60. Lack of Inventory and Detailed Knowledge of Hill Projects. Thereis an urgent need for an inventory survey of irrigation opportunities in theHills and feasibility analyses for individual projects. With the experiencegained thus far and with some intensive survey work, and technical assist-ance (para 115) DIHM should soon be in a position to advise Government whatHill irrigation projects can be undertaken.
Need for Improved Water Management
61. Two good opportunities exist for making more dependeable suppliesof water available to larger areas in existing canal projects. These are:(a) reducing present excessive water supplies to field plots by controllingirrigation applications and (b) reducing water losses from existing irriga-tion delivery systems thus increasing dry-season water supplies. Functionaldrainage systems are required in irrigated areas for the removal of excessrainwater and irrigation wastes.
62. There are two levels where improved water management should beimplemented. First is the village and farm level where the following con-ditions prevail: (a) heavy over-irrigation during the monsoon; (b) inadequateor no water in the dry season; (c) inability of the individual operator tocontrol or depend on his water supply unless he owns a tubewell or pump;(d) lack of people trained in the basic elements of water management; (e)high seepage losses from canals with little or no information concerningquantities lost and alternative means for reducing losses (costs); (f) lackof maintenance of irrigation and drainage facilities; and (g) systems ofpricing and schedules for delivering water than encourage inefficient wateruse practices from a village and national point of view.
63. Second is the government level. The Government must become moreattuned to agricultural needs and requirements. Irrigation projects shouldhave delivery systems capable of supplying sufficient water when needed.Such a system is commonly called a demand system -- a system which can re-spond to farmers' needs. This cannot be achieved by rigid rotation or con-tinuous overland flow.
64. Continuous overland flow of water from one paddy field onto thenext is however the usual method of irrigation distribution. Under Nepal's
ANNEX 6Page 18
soil conditions -/ this method causes (a) excessive water losses due todeep percolation, (b) slow water distribution particularly in the periodof land preparation and (c) leaching of soil nutrients due to prevailinghigh infiltration rates and deep groundwater levels before the onset ofthe monsoon.
65. Several measures can be tried to improve the irrigation efficiencyunder Nepal conditions. The feasibility of providing an independent inletfrom a field channel or watercourse to each field plot needs investigation.The soil can be puddled prior to transplanting to reduce percolation lossesif the infiltration rate is high. The fields can be irrigated intermittentlyand continuous ponding of paddy land should be practiced only if (a) theinfiltration rate of the natural or puddled soil is low (say, less than 0.01to 0.02 ft/day) or (b) the groundwater level is at shallow depth below landsurface. With higher infiltration rates and deep groundwater levels, paddycan only be grown as an upland crop; under these conditions, except for tastepreference reasons, alternative to rice should be sought.
66. Growing irrigated rice without continuous water ponding is unfami-liar to Nepalese farmers to date but its introduction into most valleys inthe Hills, Inner Terai and in large areas of the Terai may be necessary be-cause of the soil conditions. Improved irrigation therefore requires notonly better water distribution systems but also changes in irrigation prac-tices on the farm. The latter will take time and intensive extension efforts.
67. There will be large areas in Nepal where paddy will continue to begrown because of taste (Surkhet, Jumla, Gorkha) or because there may be nofeasible alternatives (Pokhara, Baglung, Dang, Makwanpar, Chitwan). It isin these areas that water management efforts should be concentrated.
1/ High infiltration rates and deep water tables are common in Nepal,resulting in the irrigation of small acreages per unit of discharge assupported by the following observations:
(a) The lowest measured infiltration rate in the Birganj and the SunKosi Terai Projects is 3 cm/day or 90 cm/month (FAO/NK, September1970 and June 1972).
(b) DIHM observations in Pokhara Valley have established that onecusec is used to irrigate 10 to 12 acres compared to 50 to 60acres for rice on good paddy land.
(c) Serious soil degradation and loss of fertility have occurred inthe 50 year old Chandra Project in the Eastern Terai where currentirrigated paddy yields are 0.5 tons/ha while yields in adjacentnon-irrigated areas have remained 2 tons/ha (HMG/NK, August 1970,p. 26).
(d) Ponded rainwater disappears rapidly in Terai areas where groundwaterlevels are deep (Berger, 1972, and observations by mission members).
ANNEX 6Page 19
D. ORGANIZATION FOR WATER RESOURCES DEVELOPMENT
Organization and Staffing
Ministry
68. The Ministry of Water and Power used to have two independentdepartments: an Irrigation Department and a Department of Hydrology andMeteorology. These departments were combined in 1972 to form the Depart-ment of Irrigation, Hydrology and Meteorology (DIHM) which was then trans-ferred to the Ministry of Food, Agriculture and Irrigation (MFAI). Thistransfer facilitates the integration of the engineering and agriculturalaspects of irrigation projects. Continued contact between DIRM and theMinistry of Water and Power will, however, remain necessary for (a) multi-purpose projects involving hydropower generation and irrigation for Nepaland/or exports of water or electricity to India and (b) assessment and co-ordination of requirements for power requiring irrigation projects (e.g.Lumbini groundwater).
Present Organization and Suggested Changes
69. The present organization of DIHM is depicted in Figures 2 and 3.Two points deserve special mention: (a) Four regions have been establishedwith offices in Surkhet, Pokhara, Kathmandu and Dhankuta, and (b) the organi-zation is beginning to show differentiation in tasks.
70. The groundwater resources and meteorological sections (Figure 2)have reasonable technical competence but the surface water resources, specialstudies and climatology sections are weak and need strengthening. The soilsurvey section of the Department of Agriculture is also small and weak. Thepresent budgets of the meteorology and groundwater survey sections are NRs.1.3 million and NRs. 2.0 million, respectively. Current studies and surveysand associated technical assistance requirements are discussed in Appendix II.
71. The present planning and design division (Figure 2) has nine sec-tions directed mainly to the preparation of routine weir-diversion canalprojects with which DIHM has gained considerable experience. Diversifica-tion towards pumplifts, tubewells, minor storage reservoirs, river stabili-zation and drainage projects is essential for both Terai and Hill projects.A revised organization is suggested in Figure 4 for the planning sectiontogether with a definition of the principal aspects to be considered byeach subsection.
72. An outline of the regional directorates is given in Figure 3.The size of each regional organization depends on the number of projectsunder construction and required repairs on old projects. Figure 3 indicates

ANNEX 6Page 20
the strong emphasis on engineering and the total absence of project opera-tions following completion of projects. The maintenance and repair sectionshould be replaced by an operation and maintenance section whose principalfunctions would be: (a) Headworks and canal operations, (b) controlledwater distribution, (c) agriculture and irrigation extension, (d) main-tenance, and (e) recovery of water levies.
Staffing
73. DIHNI has one Director General, three Deputy Director Generals,four Regional Directors, some 40 professionals and 130 junior professionals(mainly engineers), and overseers. The academic qualifications are generallyadequate but many lack in-depth work experience. This substantial number ofpartially-trained staff needs advice, guidance and supervision by trainedexperts. DIIIM lacks qualified staff in agricultural economics, engineeringgeology, soil and water conservation, and operation and maintenance ofprojects.
Internationally-Financed Projects
74. Three canal irrigation projects (Birganj, Chitwan and Kankai) arebeing constructed under Development Boards supported by expatriate consult-ants, and DIHM should now gain the experience required to profit fully fromyear-round irrigated agriculture. Considering the extensive groundwater poten-tials of the country, DIHM should next be assisted in developing the high-pressure artesian area in the Lumbini Terai.
Implementation of Program for Minor Irrigation
75. DIHM has received some 1,100 requests for minor irrigation projectsfrom farmers' groups. Most of these projects are located in the Hills. DIHMknows where they are and needs a breathing spell to sort them out. The Depart-ment is being pressed by the Planning Commission to take up a large numberof specific projects immediately. We recommend that DIHM be given policyguidelines only and that selection of projects for execution be left to DIHMas the technical arm of HMG.
76. Departmental operation and maintenance of minor projects is clearlynot possible because of access difficulties and staffing problems and thefarmers must be made fully responsible for minor projects. They should ownthe minor projects and manage operations themselves.

ANNEX 6Page 21
Development Planning and Institutional Development
Planning Practices
77. The problem of planning for the specific water and power projectsis important and deserves close attention. The only organizations authorizedto deal with major planning in the country are the Electricity Department (ED)for power projects and DIHM for irrigation projects. No organization existsthat is authorized to deal with multi-purpose projects such as Bagmati, Kamla,or the Sun Kosi High Dam project. This has resulted in the various planningreports 1/ which fail to give a clear picture of the functional aspects ofeach of the purposes or their integration.
78. The personnel of DIHM is responsible for project management, cons-tructidn, operation and maintenance, in addition to project and program plan-ning for irrigation and planning development of the vast water resources ofthe country, including water export to India. With all these tasks to perform,DIHM's limited personnel is over-burdened and as a result great difficultyis experienced in properly fulfilling some of these responsibilities.
79. In the past, water resource planning has not been properly under-taken in relation to the needs of the country. All aspects of the planningand construction of several major projects have been left to donor countriese.g. Chatra Canal (67,000 ha), Gandak East and West Canals (38,000 ha), Tinao(14,100 ha) and Sirsia (1,350 ha). However, Nepal has now reached the stagewhere systematic planning is of great importance. Detailed surveys of alter-native irrigation development possibilities should be undertaken as soonas possible. Existing projects should be critically reviewed to improvetheir performance and agricultural output. These surveys and reviews shouldbe followed by a ranking study of development possibilities to determine themost economical sequence of projects and programs. Once a tentative programhas been drawn up, detailed feasibility studies of individual projects andprograms (such as distribution of pumps and private well drilling) shouldfollow. The existing "Master Plans" are no more than project lists together
1/ Different figures are given for the installed generation capacitiesbetween reports. HMG/NK, May 1970, Plate 4-2, shows an output of 60 MWfor the Kamla Dam Project while FAO/NK, Final Report, 1972, page 38,states that firm power will be as low as 8.5 MW and that the installedcapacity may go as high as 30 MW; comparable figures for Bagmati arenot given but for the Sun Kosi High Dam project HMG/NK, May 1970, gives180 MW for the peak power output and FAO/NK, 1972, page 39, suggests apossible installed capacity of 360 MW. There are several other discre-pancies. IDA has been requested to consider the initial phases ofthese projects for immediate financing. However, both require furtherpreparation. Bagmati probably needs another two years and Kamla onemore year before an acceptable project analysis can be ready.

ANNEX 6Page 22
with some of their characteristics. They are based mostly on very preliminaryreconnaissance and map studies and do not consider the relative merits ofthe projects. Present "planning" activities focus only on project feasibilitystudies which have been selected almost arbitrarily (see Appendix 3 for anevaluation of water resource planning studies).
Recommendations
8U. Because of the importance of the water resource potential(both for irrigation and hydropower) we recommend thiat HMG request (frominternational sources) for a senior water resource evaluation and planning(WREP) advisor 1/ and a small supporting team 2/ to assist government in itswater resource evaluation and planning. The senior water resource evaluationand planning advisor should have a dual role as advisor to the NationalPlanning Commission (where he should be attached) and advisor to DIHM. Atthe NPC level, he would assist in co-ordinating the requirements needed toplan for, and evaluate multipurpose projects among ministries and foreignassistance agencies. At the DIHM level, he would assist in the review ofexisting projects, and how to implement the required surveys and studies.
1/ DIHM has already requested for such an advisor from UNDP. We recommend thatthis advisor, if approved, should be given the role outlined in this para.
2/ This team, to be attached to DIHM, should consist of (i) a water resourceeconomist, (ii) a hydrologist knowledgeable in meteorology, and (iii) asoil and water conservation specialist with knowledge of hill erosioncontrol and river stabilization - for three to four year terms. Withshort term assistance from specialized expertise (like engineeringgeologist, foundation engineer, structural engineer, power systems ana-lyst, electrical transmission engineer) to be determined by the SeniorWREP advisor. The team could (a) make an inventory of the surface-storage and hydropower potentials; (b) determine local-use and exportpotentials for both water and power; (c) conduct and supervise hydrolo-gic studies from existing data and assist the hydrologic and meteorolo-gic division of DIHM to gather additional data as necessary; (d) preparepreliminary designs for dams and hydropower plants for cost estimatingand economic analyses at the pre-feasibility level. The effects of thegeologic and seismic instabilities in the region and the locally-severehill erosion problems would be included as part of the analysis.
ANNEX 6Page 23
E. FUTURE IRRIGATION POLICY EMPHASES
81. DIHM is aware of the fact that the overall impact of irrigationon crop production has been minor and even harmful where heavy over-irriga-tion has taken place for several years. Major constraints to expandingbeneficial year-round irrigation are linked primarily with Nepal's dependenceon Indian-aided projects, emphasis on supplementary rather than distributionworks, lack of water control, inadequate project preparation and follow-up,and shortage of construction materials and experienced manpower.
82. Realization of projected agricultural benefits from operating projectsrequires change to year-round irrigation where feasible, multi-cropping,improved water control and increased use of agricultural inputs other thanwater (e.g. improved seeds, fertilizers and pesticides).
83. Given the wide scope and need for proper irrigation, and theneed to stay within the country's financial and manpower capacity, a reorienta-tion of policy emphasis is necessary. The mission recommends that the thrustof irrigation policy for the Fifth Five Year Plan 1/ should be towards -
(a) Improvement of the functional aspects of operating projects;
(b) Improvement of water management and supporting services;
(c) Concentration of new projects of short gestation and high pay-offs;and
(d) Irrigation at or near food deficit areas in the Hills.
Improved Functioning of Operating Projects
84. The objective is to provide the physical facilities needed toimprove the functioning of operating projects thus creating an environmentin which agricultural production can be increased.
85. An inventory and analysis is needed of the current irrigation pro-gram, i.e. of all projects, to determine priorities for rehabilitation ofexisting projects works, construction of minor irrigation channels (of lessthan 4 cusec capacity) and drainage systems (where needed), provision of addi-tional control structures in larger canals, controlled irrigation outletsand expanded 0 & M procedures including periodic clearing of existing chan-nels. DIHM knows that, in addition to rehabilitating projects, some should
1/ Longer term strategy is discussed in para 116.
ANNEX 6Page 26
94. Low-lift pumps, tubewells and minor irrigation projects are cur-rently in great demand. Many of the wells and pumps are paid by the farmers,and ADBN is providing credits for tubewells and pumps. DIHM has constructedseveral minor irrigation projects in the Hills and the Terai and sometubewells in the Terai.
Low-Lift Pumps
95. The numerous opportunities for low-lift pumps (para 43) requiresclose cooperation between DIHM and the Credit institutions (ADBN, villagecommittees) and the extension service. Small-capacity pump sets and spareparts can be imported by a suitable public or private agency and sold to thepublic with1 ADBN credits as required. DIHM could be the initiator and tech-nical advisor on a small-capacity low-lift pump program but should not beinvolved in pump sales. The distribution and sales of pump units can bemanaged by the importer and the agricultural-cum-irrigation extension servicecan function as advisor to the farmers. The program can be large or small,and should be limited to areas in which (a) water sources have been identi-fied and (b) fuel or electric energy is available.
Tubewell Programs
96. About 1,000 irrigation wells have been installed in the NepaleseTerai over the last few years for private farmers by Indian contractors.These contractors should be allowed to continue because there are no otherswho can meet the existing demand for irrigation wells. There is little pub-lic or private Nepalese well-drilling capacity and H1MG has as yet no exper-ience in groundwater development. Pending the inclusion of a training compo-nent in future groundwater projects (like the Lumbini Project), trainingcould also be included in the USGS - type investigative projects presentlyundertaken in Nepal.
97. Development of the groundwater potential requires two approaches:(i) under international contracts (say, 600 to 1,000 wells) for contiguousareas with high potentials in order to make optimum use of the artesianpressures in recovering the groundwater with minimum losses in water andpressures and (ii) by developing private or semi-public capacity for welldrilling in the other groundwater areas.
98. Concentrated tubewell projects (e.g. for the high-pressure artesianLumbini area or the Birganj area are justified if (a) the local groundwaterresources are extensive, (b) there is a general demand for irrigation wells,(c) conditions are favorable for the construction of standardized wells(economies of scale), and/or (d) special electric distribution systems arerequired. Programs for constructing individual wells are indicated if (a)the demand for wells is spotty (an individual farmer or small groups of smallfarmers), and (b) the groundwater source is isolated and small (tars andsmall river valleys). Large-scale contracts for well projects and individualwell construction both have a place and require separate programs.
ANNEX 6Page 27
99. It is important that simple well drilling techniques and cheap wellmaterials be developed for Nepal so that farmers can profitably irrigate fromtheir own wells preferably constructed by Nepalese well drillers. Severalof these techniques and materials are readily available in India and Pakis-tan. HMG (Nepal) should look into these and arrange for assistance in deve-loping private well-drilling capacity.
100. An additional approach could be to establish a government corpora-tion which would own large capacity tubewells for use by the farmers againstpayment of an equitable charge per hectare.
Policy Guidelines for Groundwater Development
101. Groundwater is a valuable and large resource in Nepal and policyguidelines are necessary at this time to accelerate its development.
102. HMG must decide on the extent of its involvement (financially,managerially and operationally) in well development before embarking on largegroundwater programs. Several approaches are possible (paras 97-100)for which the financial and economic implications and the management andoperational requirements have yet be determined.
103. Other important issues are:
Drilling Code: Well drilling as currently practised in the artesianzones should be forbidden artesian pressures are being dissipated and morethan half the water wasted. These practices must be discontinued immediately.A primary requirement is that HMG/USGS develop a drilling code for the Terai,applicable to both Indian and prospective Nepalese well-drilling contractors.This will ensure that farmers get wells of acceptable quality. A few staffmembers of the existing DIUIM groundwater section could be trained to becomedrilling inspectors on behalf of DIHM who would log the drill holes and con-duct an acceptance test on the completed wells.
104. Availability of Tubewell Material: No groundwater program or drill-ing can be successful in Nepal unless HMG ensures unimpeded importation ofessential supplies such as well piping, screens and pumps. Stockpiles ofthese should be available in several centers in the Terai.
105. Control of Overpumping. The water volumes pumped should not exceedthe average annual recharge. This can be enforced by developing guidelinesfor a given area after determining the total average recharge and calculatingthe number of wells needed for removing this volume, assuming average-capacitywells at optimal spacings operating at normal utilization for normal per-hectare water consumption. These initial calculations are to be followed byregular phreatic and pressure-level observations in the area after wellscome into operation, enabling adjustments in the guidelines from time to timeas appropriate.
ANNEX 6Page 28
106. Data on Groundwater Conditions and Development. DIHM already hasregular groundwater and water-pressure level observations for limited areas.This program should be expanded to include (a) all areas where extensivewell development takes place, (b) performance surveys of private wells, and(c) occasional water quality observations. Well drillers should be requiredto submit a log of each well drilled to DIHM.
Irrigation at or near Food Deficit Hill Areas
107. The objective is to increase agricultural production near fooddeficit hill areas to provide additional employment on farms and reducethe need to seasonally migrate for food.
108. In the Hill region, difficulties have been encountered with the weir-diversion projects with contour canals cut into hill slopes. Other projecttypes, such as underground water traps, tubewells, minor storages and elec-trically-driven pump lifts (para 55) must be given more attention. Initialemphasis should be on irrigation development in the larger Hill valleys: theSurkhet, Pokhara, Tansing, Chitwan, West Rapti, Palpa and Dang Valleys and thelarger tars. Some pilot projects should be initiated to gain experience inalternative approaches to hill irrigation.
109. The lack of inventory and analysis of potential minor projects (para60) will initially inhibit program development and engineers alone will notbe sufficient to develop a viable program. Hill irrigation poses very differentproblems from these encountered in flat land areas such as the Terai. Theseproblems result from variable geologic makeup of the Hills, the land-usepatterns above and below the proposed canal alignment and the flood and low-flow regimes of the rivers from which water is drawn. In evaluating anddesigning potential projects; particularly storage projects in the smallervalleys, a multidisciplinary group approach is required. Technical assistanceis needed in the form of qualified manpower, helicopters and survey equipment.Two to three years of assistance by such a group (which would include anirrigation engineer, a soil and water conservationist, an engineering geologist,an irrigation agriculturist and a project economist) is needed.
110. Meanwhile, preparations should proceed in the development of Hillirrigation programs particularly in (a) assessing lift pump possibilitiesand the development of the larger valleys and pilot projects to gain expe-rience in alternative approaches to Hill irrigation (para 55); and (b)undertaking an inventory analysis of existing minor Hill project.
Policy Guidelines for Minor Hill Irrigation Projects
111. HMG should develop policies that will ensure (a) farmers' participa-tion in project construction, (b) local ownership of the project, (c) project
ANNEX 6Page 29
operation and maintenance by the farmers, and (d) partial or complete recov-ery of project costs.
112. Farmers' Participation. Further project should not be undertakenunless the majority of the beneficiaries want them. A written agreement shouldbe prepared by DIHM and signed by the farmers whenever possible. The agree-ment would spell out (a) the farmers' responsibilities in construction, opera-tion and maintenance, (b) the ownership of the project and (c) project costsand repayment requirements. Import of labor should be limited to essentialskills such as equipment operators, masons, etc. The project beneficiariesshould do all routine work, even if this slows down project construction.
113. Financing of Minor Projects. HMG should develop methods forfinancing and repayment. Ideally the financing and cost recovery would bedone e.g. through the ADBN in the same way it handles the purchase of equip-ment, pumps and wells, with a reasonable repayment period of, say, 10 to15 years. This would simplify government operations and provide incentivefor increasing production by beneficial use of project facilities. Subsi-dies could be provided in the form of low interest loans, equipment, cementor payment of labor, for which definitive guidelines must be developed onthe basis of financial and economic analyses, taking into account familyincome objectives and prevailing socio-economic conditions in the projectareas.
F. ISSUES
Geographical Concentration
114. Implementation of the strategies suggested in Chapter E will resolvemany of the issues facing the irrigation subsector. The issue of geographi-cal concentration of irrigation activities would be resolved in favor of theselection of programs which can fulfill the criteria for policy emphasis out-lined in Chapter E. This implies that the focus of future irrigation programsshould remain in the Terai and Inner Terai given the availability of landssuitable for sustained irrigation and the substantial opportunities for smallpumps and tubewells.
115. Even in the Terai itself, past investments have been made mainlyin the Eastern and Central Terai, primarily in locations where populationand political influence have been concentrated. The mission recommendsthat increased emphasis be given to Western Terai because (a) the tremen-dous groundwater resource potential, and (b) the greater need in terms ofclimate (lower and less dependable rainfall). Increasing migration pressurein Western Nepal and the fact that it is the last stronghold of unsettledflat forest land necessitates concurrent attempts to combine irrigation withsettlement programs there.
ANNEX 6Page 30
Small Prolects Vs. Large Projects
116. The issue of the extent to pursue large irrigation projects is, inour judgement, a problem of timing. The tremendous potentials for foreignexchange gains in the export of hydropower and irrigation water to India andthe importance of irrigating the Inner Terai Valley are compelling reasonsfor large irrigation projects. Our suggested emphasis on quicker gestationand relatively small projects in the next five years is dictated by (a) thenecessity to realize projected benefits from operating projects, (b) themany profitable opportunities that exist for irrigation expansion by smallpump units and tubewells and (c) Nepal's limited implementation capacity.In the longer term (by 1980), the outlook for large irrigation and hydro-power projects would be more favorable with:
(a) the strengthening of Nepal's planning and implementationcapacity in water resource development; 1/
(b) the programs underway for irrigation expansion by smallpumps, tubewells and other small-scale projects;
(c) the experience gained from IBRD-financed irrigation andsettlement projects;
(d) the worsening land pressure and food deficit problems inNepal;
Because the primary consumer of excess hydropower from such projects wouldbe India, it would be mutually beneficial for dialogue to be initiatedbetween Nepal and India.
117. Given the traditional long gestation periods in preparing suchprojects, it is not too early to decide which of the identified large irriga-tion hydropower projects need to be studied further. We recommend the Bag-mati irrigation project as the prime candidates, since initial backgroundwork is completed; the project is relatively unencumbered by previous worksor agreements; they would be large enough to have an important impact onirrigation expansion and low-cost hydropower generation: and they would notbe too large to overwhelm the scarce manpower available.
Water Charges
118. Pricing of irrigation water is a difficult exercise, particularlyfor supplementary irrigation without adequate distribution systems and with-out guaranteed water deliveries. DIHM is receiving only seven percent of its
1/ As detailed in Chapter D of this Annex.
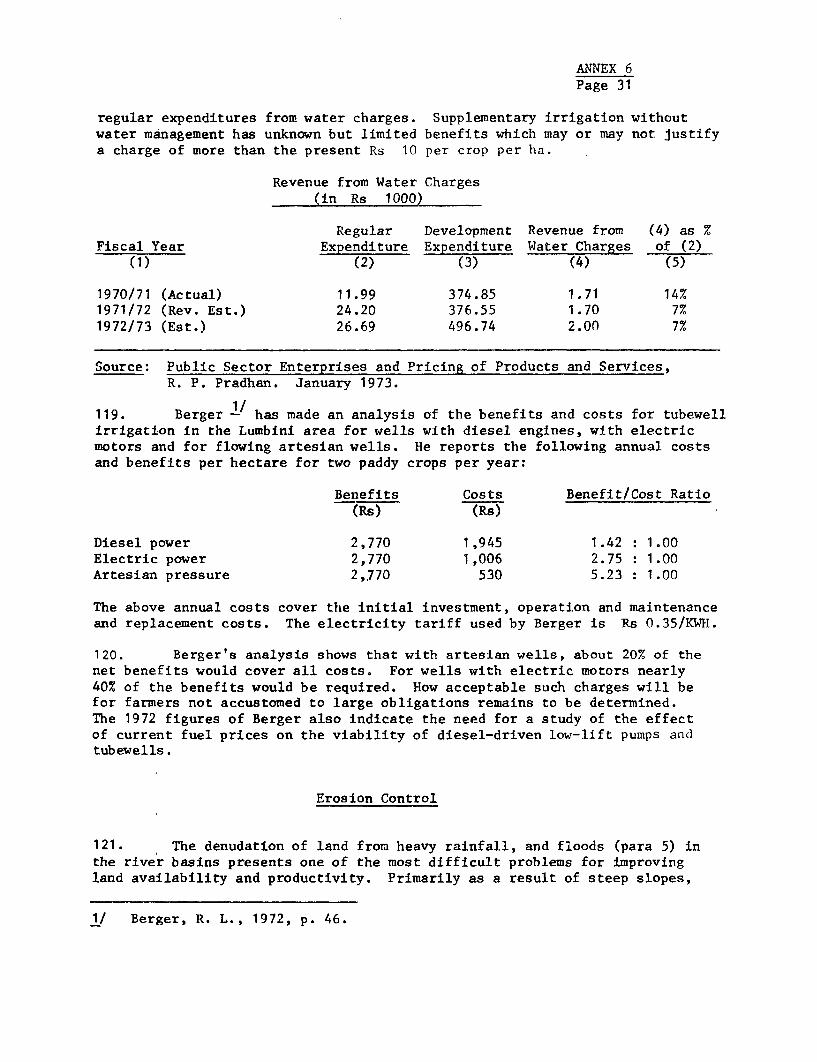
ANNEX 6Page 31
regular expenditures from water charges. Supplementary irrigation withoutwater management has unknown but limited benefits which may or may not justifya charge of more than the present Rs 10 per crop per ha.
Revenue from Water Charges(in Rs 1000)
Regular Development Revenue from (4) as %Fiscal Year Expenditure Expenditure Water Charges of (2)
(1) (2) (3) (4) (5)
1970/71 (Actual) 11.99 374.85 1.71 14%1971/72 (Rev. Est.) 24.20 376.55 1.70 7%1972/73 (Est.) 26.69 496.74 2.00 7%
Source: Public Sector Enterprises and Pricing of Products and Services,R. P. Pradhan. January 1973.
119. Berger -/ has made an analysis of the benefits and costs for tubewellirrigation in the Lumbini area for wells with diesel engines, with electricmotors and for flowing artesian wells. He reports the following annual costsand benefits per hectare for two paddy crops per year:
Benefits Costs Benefit/Cost Ratio(Rs) (Rs)
Diesel power 2,770 1,945 1.42 : 1.00Electric power 2,770 1,006 2.75 : 1.00Artesian pressure 2,770 530 5.23 : 1.00
The above annual costs cover the initial investment, operation and maintenanceand replacement costs. The electricity tariff used by Berger is Rs 0.35/KWH.
120. Berger's analysis shows that with artesian wells, about 20% of thenet benefits would cover all costs. For wells with electric motors nearly40% of the benefits would be required. How acceptable such charges will befor farmers not accustomed to large obligations remains to be determined.The 1972 figures of Berger also indicate the need for a study of the effectof current fuel prices on the viability of diesel-driven low-lift pumps andtubewells.
Erosion Control
121. The denudation of land from heavy rainfall, and floods (para 5) inthe river basins presents one of the most difficult problems for improvingland availability and productivity. Primarily as a result of steep slopes,
1/ Berger, R. L., 1972, p. 46.
ANNEX 6Page 32
deforestation and cultivation expansion to marginal and less stable farm landsin the Hills (Annex 1), the result has been the loss of cultivated land dueto sand coverage in the Terai and Inner Terai served by the larger rivers(particularly in the southeastern Terai).
122. In practical terms, it is not feasible to undertake a generalprogram of erosion control particularly in the larger hill valleys, becauseunless very high cost protection is provided, protection efforts would beineffective. HMG has to decide on a priority basis which areas need to beprotected, and such protection when undertaken should be in conjunction withrural development or production programs or projects.
G. RECOMMENDED PROGRAMS AND STUDIES
123. The programs and projects recommended in this Annex are summarizedbelow.
Quick Payoff Programs -
124. There are opportunities for these in both the Terai and the Hills.
A. In Terai and Larger Valleys:
(a) Sales program for low-lift pumps of small capacity; 2/
(b) Program for providing dispersed tubewells; 2/
(c) Program for improving operating projects (para 84);
(d) Well project for the Lumbini artesian zone; (paras 21and 131).
B. In Hills:
Diversified program of minor irrigation projects (paras 55and 109).
Longer Gestation Program
125. More time will be needed to achieve results with:
(a) Year-round irrigation with new canal systems (Appendix 2) asexemplified by:
1/ Programs which can be completed within the Fifth Five Year Plan(1975/76-1980/81).
2/ Private sector or credit and extension agencies participating throughpanchayats or village committees (para 95).
ANNEX 6Page 33
(i) Kankai (HMG/ADB)
(ii) Chitwan (HMG/ADB)
(b) Year-round irrigation in the larger hill valleys (e.g.Barigad, Kali Gandaki);
(c) Water management programs to reduce soil deterioration inoperating projects including introduction of an irrigationextension service (paras 87 - 92);
(d) Medium size canal projects from perennial rivers in theTerai with permanent pumping stations, preferably in theWestern Terai; (para 42).
Inventory Surveys
126. Five inventory surveys are required:
(a) Potential hill irrigation projects (para 109);
(b) Potential for low-lift pumps (paras 44 and 110);
(c) Rehabilitation requirements of operating projects (para 85);
(d) Surface storage and hydropower potentials (para 44);
(e) Soil and land resources (see Annex 1).
Investigation Programs
127. Investigations are underway on soils, hydrology, hydrogeology andmeteorology. The program for soils is discussed in Annex 1, and the othersare discussed in Appendix 1 of this Annex where it is noted that they needstrengthening and reorientation. Several proposals for this purpose are al-ready with HMG and DIHM which should be reviewed and implemented.
Studies
128. Several studies are needed in connection with the suggested deve-lopment program, and background papers should be prepared on:
1. Approaches to improvement and rehabilitation of operatingprojects;
2. Approaches to improving water management in irrigatedareas;
ANNEX 6Page 34
3. Government approach to private tubewell development;
4. Approaches to expanding Hill irrigation, and
5. Analysis of water charges for functioning projects.
Technical Assistance
129. The technical assistance program needs to be expanded to overcomecurrent institutional limitations and lack of planning and implementationcapacity. New requirements are:
1. Senior Water Resources Planner who will be joint advisor to NPCand DIHM and a supporting team to assist HMG in ti) evaluatingwater resource potentials and their multipurpose uses, (ii)assessing the usefulness of past studies and implementingfurther study needs including foreign assistance; (iii) review-ing existing projects and required improvements (para 85);
2. Assistance in developing the Hill irrigation program (para109);
3. Assistance in developing well-drilling capacity and preparationof a drilling code (paras 96 and 103);
4. Assistance in developing new approaches to project repaymentand water and land taxation (para 120);
5. Consultants to complete feasibility studies for the Bagmatiproject (para 117).
H. PROJECT POSSIBILITIES FOR EXTERNAL FINANCING
Key Projects Supporting the Development of the Gandaki Corridor
130. Two projects in irrigation can be undertaken by foreign assistanceas part of the governments corridor development strategy. Possibilitiesexist in the Bhairawa - Syangja - Pokhara corridor 1/ for the development oftwo projects suitable for foreign assistance:
1/ Also called the Gandaki Corridor, it has substantial agriculturalresources (the larger hill valleys occur in Tansing, Syangja, andPokhara), hydropower, forests and trained manpower (retired Gurkhasoldiers and graduates trained by the Butwal Technical Instituteestablished and run by the United Mission).
ANNEX 6Page 35
(a) The Lumbini Groundwater Project
(b) Pokhara Valley - Pilot Project in Water Management
The Lumbini Groundwater Project
131. The high-pressure portion of the Lumbini artesian area (para 21)can be developed for year-round irrigation with very low energy requirementsfor pumping. The project size is flexible but could consist of 1,200 wellsor even more. The artesian wells must be constructed under internationalcontract because there is no well drilling experience in Nepal.
132. Status of Groundwater Investigations. DIHM/USGS/USAID -/ have pre-pared a report on the groundwater investigations in the Lumbini Terai. Thereport summarizes the data collected between April 1969 and June 1972 onthe groundwater potential conclusions regarding the occurrence, hydrologyand chemical quality of groundwater.
133. Special construction methods must be followed in the high pressureartesian area, as described in the interim report. The aquifer data showthat large areas of the Lumbini artesian area have equal or higher transmis-sivities than the Birganj tubewell area. The chemical data show that thewater quality is generally good and is suitable, with few exceptions, for dom-estic supply, livestock and irrigation. Most water analyses indicate a lowto very low sodium hazard and a low salinity hazard.
134. An economic study of the economics of tubewells and water use hasbeen undertaken by a consultant to the United Missions in 1973. 2/ An up-dating of this study will probably be required.
135. A feasibility analysis of this project should include the follow-ing:
(a) Reconnaissance soil surveys, development of croppingpatterns, and determination of irrigation requirements;
(b) An analysis of the groundwater potentials for differentintensities of development;
(c) Definition of the works required in sufficient detailto allow reliable cost estimation. These works wouldinclude the tubewells, irrigation and power distributionworks, and the drainage works.
(d) Evaluation of the economic benefits and internal rates ofreturn, determination of repayment requirements and recom-mendations on repayment policies.
I/ DIHM/USGS/USAID, 1973.
2/ Berger, R. L., 1973.
ANNEX 6Page 36
Pilot Project in Water Management - Pokhara Valley
136. An investigation into the feasibility of irrigation improvement andexpansion in Pokhara Valley should also be considered. This valley of13,300 ha (gross) has already 7,000 ha (net) under irrigation and some2,000 ha (net) do not yet have a canal system. The soils are generally sandy,infiltration rates are high, the groundwater table is deep, and the canalsserve only 10 to 12 acres per cusec (compared to 50 to 60 acres per cusec forrice on good paddy land). A water management scheme involving some redesignof existing canal systems, provision of additional control structures incanals, measures field diversions, and the introduction of intermittentirrigation may be possible.
Other Irrigation Projects
137. Other projects (similar to the Birganj Irrigation Project) involving(a) the completion and/or extension of existing systems of supposedly completedprojects (along the lines of Birganj Project), (b) rehabilitation of pastschemes, can be identified pending inventory of past projects (para 85). Inaddition to that recommended for Pokhara Valley, other pilot projects shouldalso be considered in other relatively large hill valleys in Sukhet, Sallyan,Palpa, Baglung, and in Inner Terai Valleys in Dang, lMakwanpur and Chitwan.
Minor Irrigation Projects
138. The low-lift pump and private tubewell programs and the program forminor irrigation projects in the Hills (para 124) may become attractive forexternal financing after DIHM has developed organized approaches for them.With the cooperation of the Agricultural Extension Service and Credit Agenciesthey could be considered as part of Integrated Rural Development Programs.

ANNEX 6Page 38
BIBLIOGRAPHY
Berger, R.L., "Appraisal of Alternatives, Butwal Area",United Mission to Nepal, mimeo. report, 57 pages, 1972.
Bower, C.A., and Maasland, M., "Sodium Hazard of Punjab Ground Waters".Symposium on Water logging and Salinity in West Pakistan, GoldenJubilee Session of West Pakistan Engineering Congress, pages 49-61,1963.
DIHM/USGS, "Hydrology and Water Resources Development in Nepal",94 pages, 1969.
DIHM/USGS/USAID, "Groundwater Resources Investigations in Lumbini Zone,Western Terai, Nepal", Interim Report, by G.C. Tippetts and W. Ogilbeeof USGS and C.K. Sharma and staff of DIHM (Nepal), in press with USGS(Washington), 200 pages, 1973.
FAO/Nippon Koei Co., Ltd., "Report on the Soil Survey in Birganj-GandakIrrigation Project (with Soil and Land Capability Maps)", June 1972.
FAO/Nippon Koei Co., Ltd., "Annual Report No. 2 (1970/71) on Hardinath PlotDemonstration Farm Sun Kosi Terai Project", October 1971.
FAO/Nippon Koei Co., Ltd., "Irrigation Development Study in the Central andEastern Terai Plain, Nepal, Feasibility of a Combined Surface andGroundwater Project in the Birganj Area", Main Report (with separateAnnexes), August 1971.
FAO/Nippon Koei Co., Ltd., "Report on the General Reconnaissance Soil Surveyof the Eastern Terai Plain in Nepal", September 1970.
FAO/Nippon Koei Co., Ltd., "Interim Report on Feasibility Study on Sun KosiTerai Project", (Draft), October 1969.
FAO/Nippon Koei Co., Ltd., "Final Report on the Development of Irrigationin the Central and Eastern Terai Plain, Nepal", 1972.
HMG/Nippon Koei Co., Ltd., "Master Plan for Power Development and Supply",May 1970.
HMG/Nippon Koei Co., Ltd., "Master Plan for Power Development and Supply",May 1970.
HMG/USAID, "Joint HMG/USGS/USAID Evaluation of Groundwater Investigationin the Western Terai, Nepal", mimeo. report, 8 pages, 1 App., Kathmandu,January 1973.

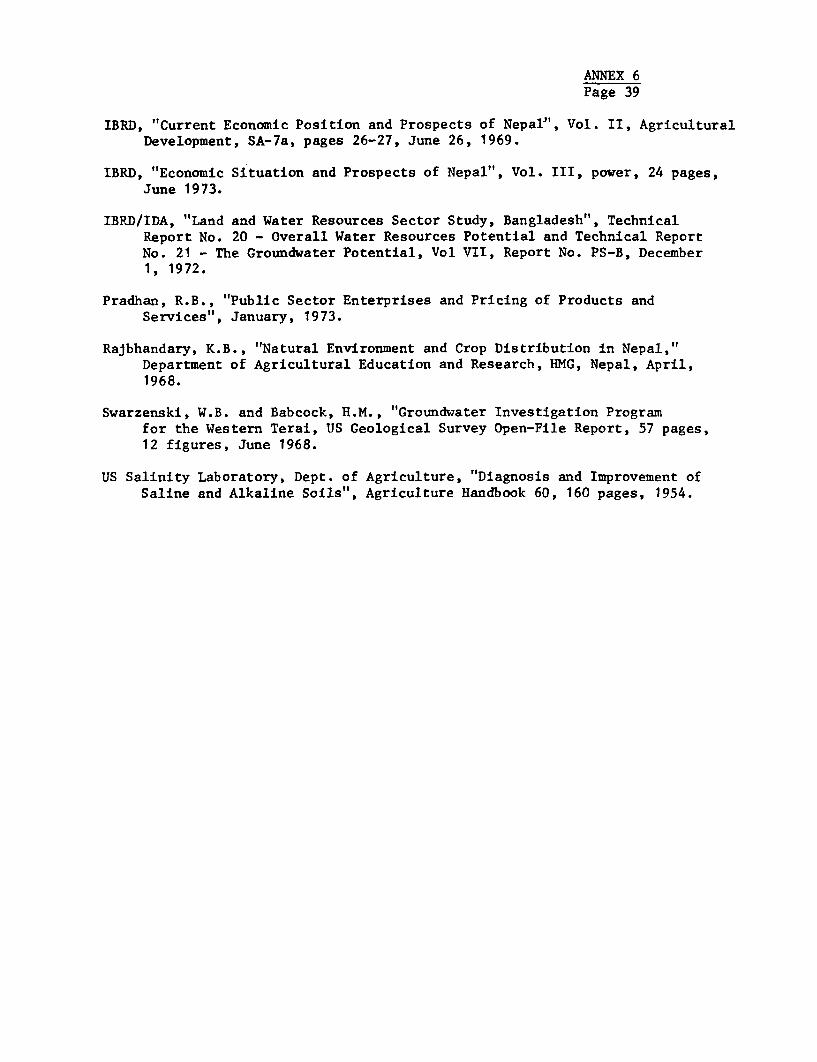
ANNEX 6Page 39
IBRD, "Current Economic Position and Prospects of Nepal!', Vol. II, AgriculturalDevelopment, SA-7a, pages 26-27, June 26, 1969.
IBRD, "Economic Situation and Prospects of Nepal", Vol. III, power, 24 pages,June 1973.
IBRD/IDA, "Land and Water Resources Sector Study, Bangladesh", TechnicalReport No. 20 - Overall Water Resources Potential and Technical ReportNo. 21 - The Groundwater Potential, Vol VII, Report No. PS-B, December1, 1972.
Pradhan, R.B., "Public Sector Enterprises and Pricing of Products andServices", January, 1973.
Rajbhandary, K.B., "Natural Environment and Crop Distribution in Nepal,"Department of Agricultural Education and Research, HMG, Nepal, April,1968.
Swarzenski, W.B. and Babcock, H.M., "Groundwater Investigation Programfor the Western Terai, US Geological Survey Open-File Report, 57 pages,12 figures, June 1968.
US Salinity Laboratory, Dept. of Agriculture, "Diagnosis and Improvement ofSaline and Alkaline Soils", Agriculture Handbook 60, 160 pages, 1954.
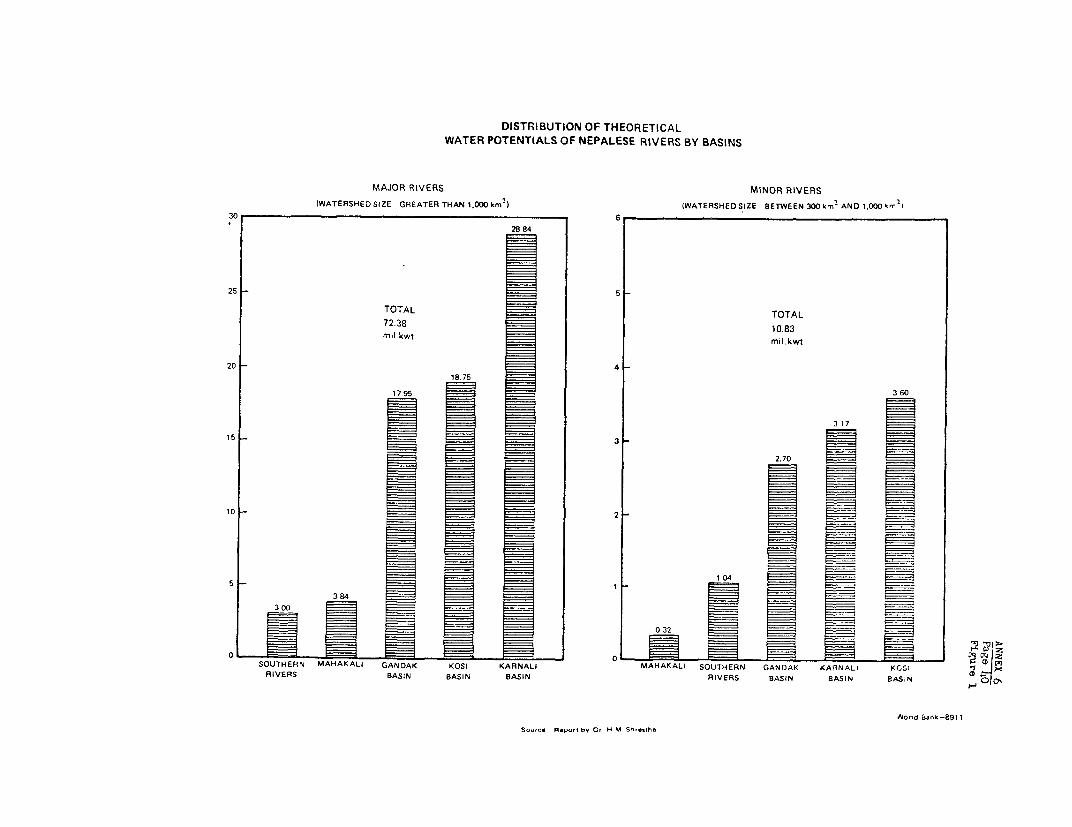
DISTRIBUTION OF THEORETICALWATER POTENTIALS OF NEPALESE RIVERS BY BASINS
MAJOR RIVERS MINOR RIVERS
(WATERSHED SIZE GREATER THAN l,000 km2I IWATERSHE0 SIZE BETWEEN 300 kEm
2AND 1,000 km
2)
30628894
25 5-
TOTAL TOTAL
72.38 10.83mil kwt mil .kwt
20 418,75
1795 360
_ m _ ~~~~~~~~~~~~~~~~~~~~~~~~~~~3 1 7
15 37 7
1S _ _ S _ 3 ~~~~~~~~~~~~~~~~~~~~~~~~~~~~ ~2.70
10 2
s5_ 3 2 1 _ 104 I384
t3000 32
OL- ot,~~~~~~~-
SOUTHERN MAHAKALI GANDAK KOSI KARNALI MAHAKALI SOUTHERN GANDAK KARNALI KCSIRIVERS BASIN BASIN BASIN RIVERS BASIN BASIN BASIN P ° (
Fdo,ud Elank-2911
Sourc- R.port bV 0D H M Sh,.,th.
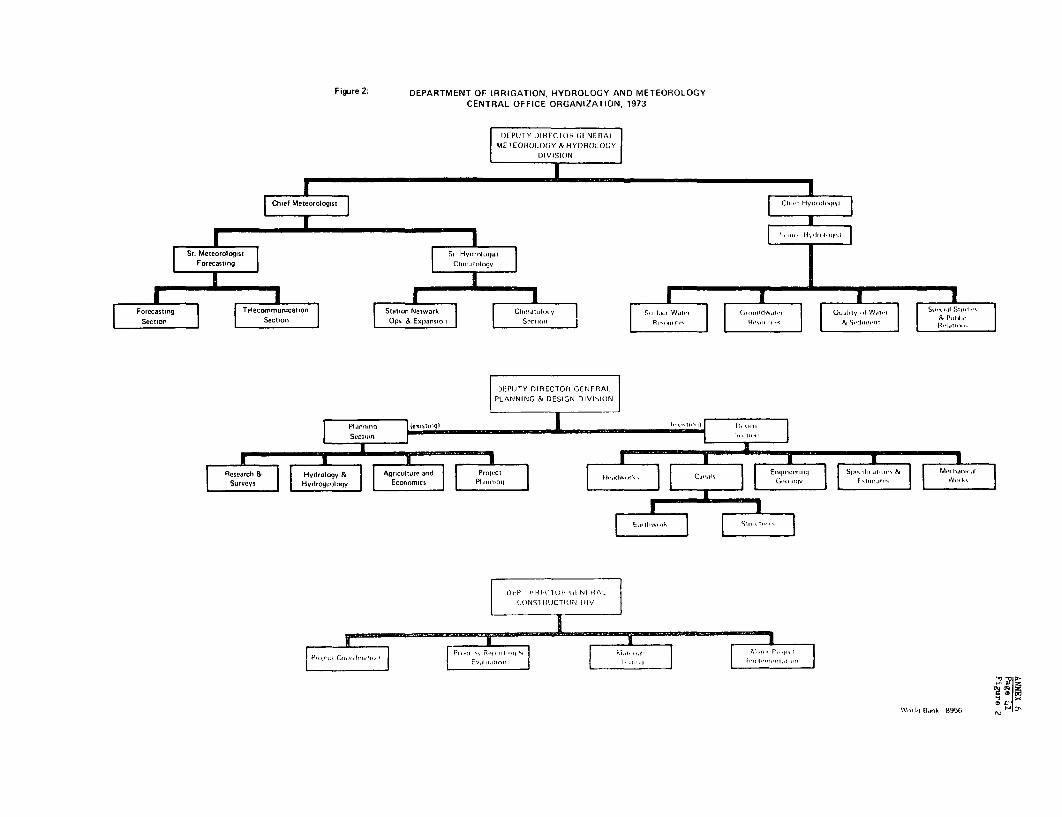
Figure 2: DEPARTMENT OF IRRIGATION, HYDROLOGY AND METEOROLOGYCENTRAL OFFICE ORGANIZATION, 1973
IDtFPUTY DIRECIOH GLNERAI.METEOROILt)(Y & HYDROLOGY
I)IVISI()N
Chief Meteorolog,st || Ch'.-f Hyd-l"hylo |
*~~~~~~~~~~~~~~~~~~~~~~~~~~~~~~~~~~~~~~~~~~~~~~~~~~~~I" .. * ."
Sr. Meteorologist S| Hyd-I, IstrForecasting C iir,irrlrniv
Forecasting Telecommusnicatio,tton Netmork ln.i,riyS w. G iI rIwriSi iSii,,Section Section s & Expan- nn Syuli iiit I |i
SUrve-s Hydrogeoloqy Economics PldR . | |..&il
PLANNINGS&RDESION DIVIl)
Wiil B-nk 8956
Figure 3: DIRECTORATE OF IRRIGATION, HYDROLOGY AND METEOROLOGY
| D I RECTOR l
PRELIMINARY PROJECT PROJECT IMPLEMENTATION MAINTENANCE HYDROLOGICAL GENERAL ADMINISTRATIOPLANNING AND EVALUATION AND REPAIRS SU1.RVEY
SECTION OFFICERDIVISIONAL ENGINEER HYDROLOGIST NAUBSUBUR
SUPERINTENDING ENGINEER SUPERINTENDING ENGINEER ENGINEER OVERSEER KHARIDARDIVISIONAL ENGINEER OVERSEER TYPISTOVERSEERDRAFTSMAN PROJECT IMPLEMENTATION PEON/CHOWKIDARTRACER
DIVISIONAL ENGINEERENGINEEROVERSEER SENIOR ACCOUNTANT
W.rd ACCOUNTANTPROGRESS REFPORTING lSUB-ACCOUNTANT
_ AND EVALUATO |
DIVISIONAL ENGINEERENGINEEROVERSEER
IRRIGATION PROJECTS||PROJECT CHIEFSl
World Bank-8955
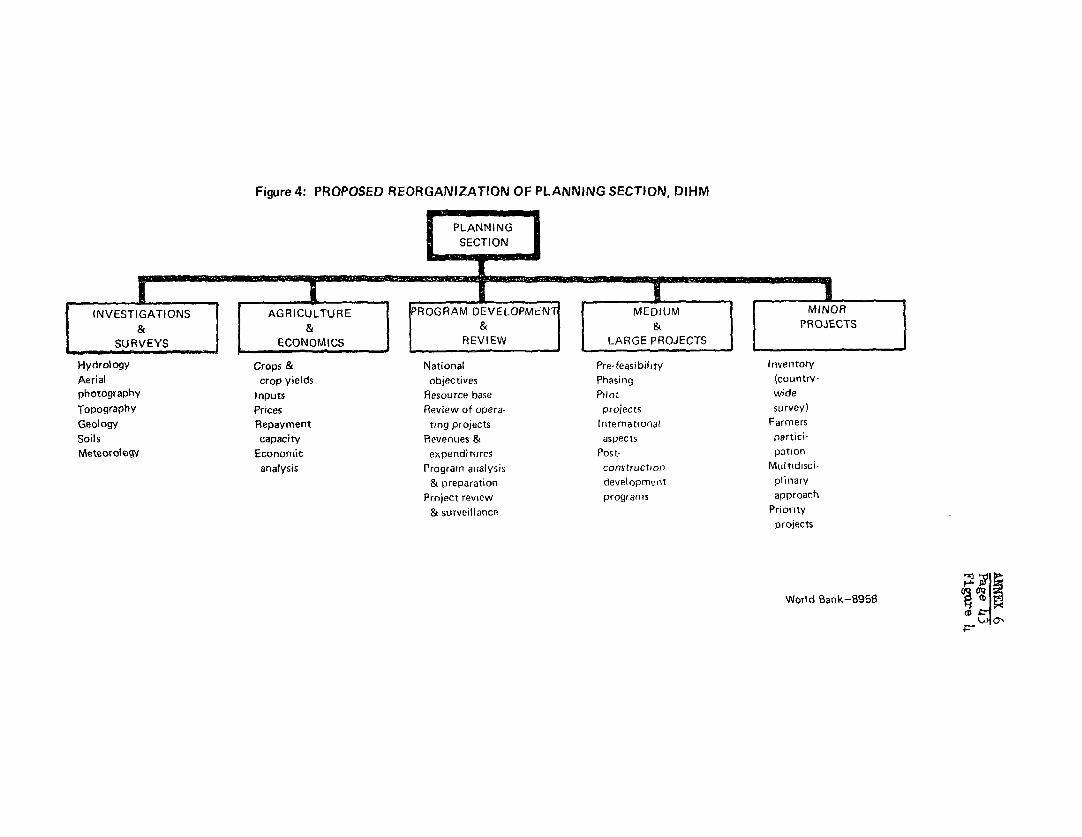
Figure 4: PROPOSED REORGANIZATION OF PLANNING SECTION, DIHM
PLANNINGiSECTION|
INVESTIGATIONS AGRICULTURE PROGRAM DEVELOPMi&N MEDIUM MiNOR& &S| & & PROJECTS
-SURVEYS ECONOMICS IREVIEW LARGE PROJECTS
Hydrology Crops & National Pre-feasibility InventoryAerial crop yields objectives Phasing (country-photography Inputs Resource base Pilot wideTopography Prices Review of opera- projects survey)Geology Repayment ting projects International FarmersSoils capacity Revenues & aspects partici-Meteorology Economic expenditures Post- pation
analysis Program analysis construction Multidisci-& preparation development plinary
Project review programs approach& surveiilance Priority
projects
World Bank-8958
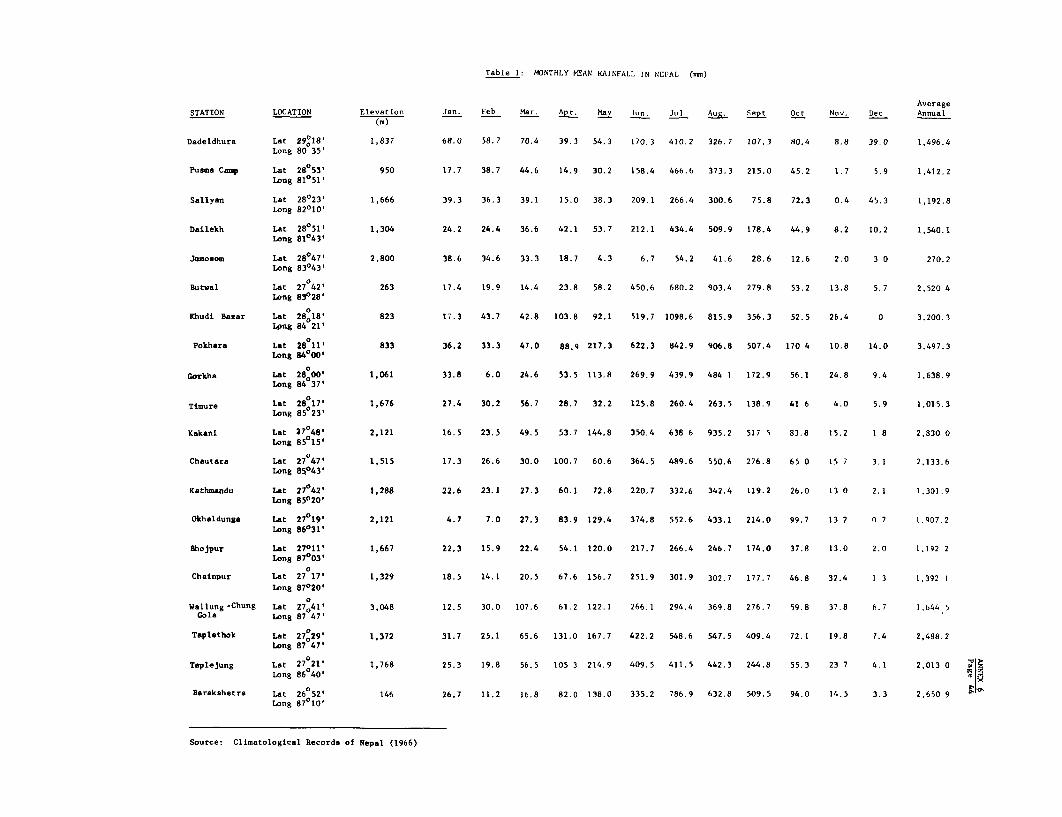
Table 1: MONTHLY MEAN RAINFALL IN NEIAL 6ac)
AverageSTATION LOCATION Elevation Jan. Feb Mar. Apr. Mav lun. Jh Aug. Sept Oct Nov. Dec Annual
(ma)
Dadeldhura Lat 29'18' 1,837 68.0 58.7 70.4 39.3 54.3 170.3 410.2 326.7 107.3 nO.4 8.8 39.0 1,496.4Long 80 35'
Pusma Camp Lat 28 53' 950 17.7 38.7 44.6 14.9 30.2 158.4 466.6 373.3 215.0 45.2 1.7 5.9 1,412.2Long 81051,
Sallyan Let 28023' 1,666 39.3 36.3 39.1 15.0 38.3 209.1 266.4 300.6 75.8 72.3 0.4 45.3 1,192.8Long 82010'
Dailekh Lat 28'51' 1,304 24.2 24.4 36.6 42.1 53.7 212.1 434.4 509.9 178.4 44.9 8.2 10.2 1,540.1Long 81043'
JQmosom Let 280473 2.800 38.6 34.6 33.3 18.7 4.3 6.7 54.2 41.6 28.6 12.6 2.0 3 0 270.2Long 83043'
Butwal Lat 27 42' 263 17.4 19.9 14.4 23.8 58.2 450.6 680.2 903.4 279.8 53.2 13.8 5.7 2,520 4
Khudi Bazar Lat 28018' 823 17.3 43.7 42.8 103.8 92.1 519.7 1098.6 815.9 356.3 52.5 26.4 0 3,200.3
Pokhara Lat 28 11' 833 36.2 33.3 47.0 88.9 217.3 622.3 842.9 906.8 507.4 170 4 10.8 14.0 3,497.3Long 84000,
0Gorkhe Lat 28000' 1,061 33.8 6.0 24.6 53.5 113.8 269.9 439.9 484 1 172.9 56.1 24.8 9.4 1,638.9
Long 84037'
Timure Let 285 17' 1,676 27.4 30.2 56.7 28.7 32.2 125.8 260.4 263.5 138.9 41 6 4.0 5.9 1,015.3iLong 8523'
Kakani Lat 27048' 2,121 16.5 23.5 49.5 53.7 144.8 350.4 638 6 935.2 517 5 83.8 15.2 1 8 2,830 0Long 85015,
Chautara Lat 27 47' 1,515 17.3 26.6 30.0 100.7 60.6 364.5 489.6 550.6 276.8 65 0 15 7 3.1 2,133.6Long 850431
Kathmandu Let 27042' 1,288 22.6 23.1 27.3 60.1 72.8 220.7 332.6 342.4 119.2 26.0 13 0 2.1 1,301.9Long 85020'
Okhaldunga Let 270198 2,121 4.7 7.0 27.3 83.9 129.4 374.8 552.6 433.1 214.0 99.7 13 2 0 7 1.907.2Long 86031'
Ehojpur Let 27011' 1,667 22.3 15.9 22.4 54.1 120.0 217.7 266.4 246.7 174.0 37.8 13.0 2.0 1,192 2Long 87003'
Chainpur Let 27 17' 1,329 18.5 14.1 20.5 67.6 156.7 251.9 301.9 302.7 177.7 46.8 32.4 1 3 1,392 1Long 870201
Wallung-Chung Lat 27041' 3,048 12.5 30.0 107.6 61.2 122.1 266.1 294.4 369.8 276.7 59.8 37.8 6.7 1,644 5Cola Long 87 47'
Taplethok Let 27429' 1,372 31.7 25.1 65.6 131.0 167.7 422.2 548.6 547.5 409.4 72.1 19.8 7.4 2,488.2Long 87 47'
Taplejung Let 27 21' 1,768 25.3 19.8 56.5 105 3 214.9 409.5 411.5 442.3 244.8 55.3 23 7 4.1 2,013 0 tLong 860401
Barakshetra Let 26521' 146 26.7 11.2 16.8 82.0 138.0 335.2 786.9 632.8 509.5 94.0 14.5 3.3 2,650 9Long 87010,
Source: Climatological Records of Nepal (1966)
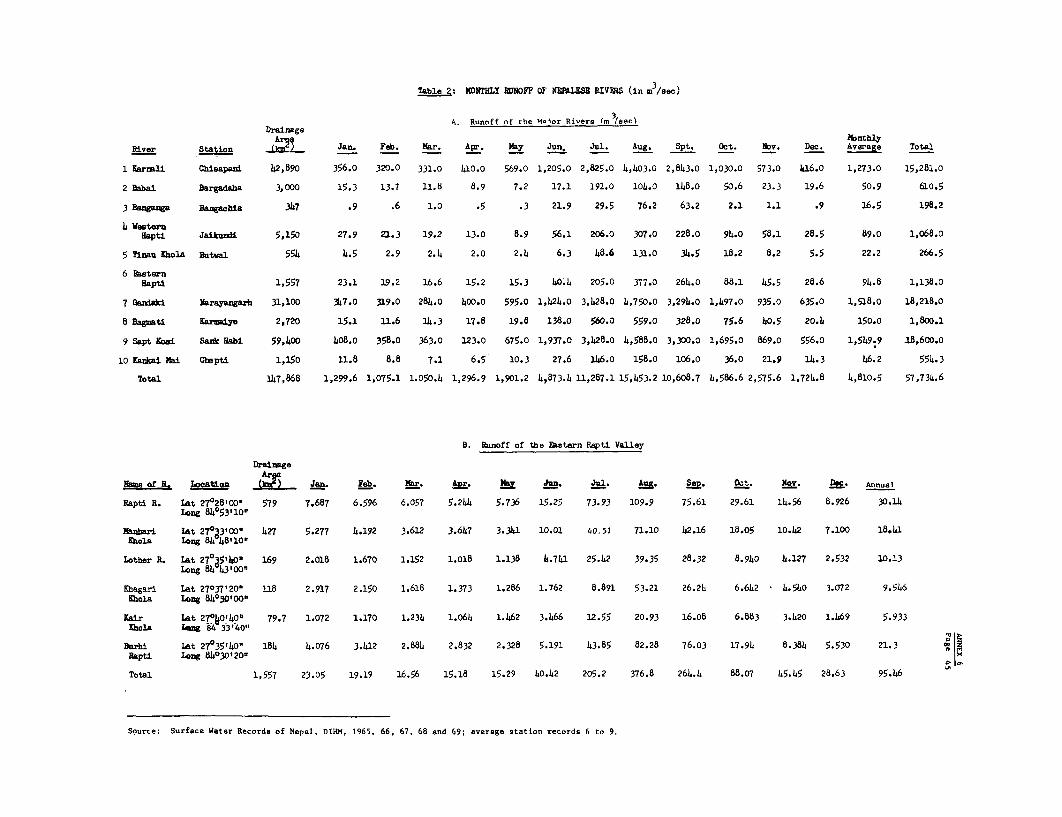
Table 2: IDNTHLY RU1NOFF OF NEPALESE RIVERS (in m 3/sec)
A. Runoff nf the M.jor Rivers (m (eec)Drainage
kr" No~~~~~~~~~~~~~~~~~~~~~~~nthIyRiver Station -LISAU Jan. Feb. ?Ir. Apr. May Jun, Jul. Aug. Spt. Oct. Nov. Dec. Aveage Total
1 Krnmll Cbisapani 42,890 356.0 320.0 331.0 410.0 569.0 1,205.0 2,825.0 4,403.0 2,843.0 1,030.0 573.0 416.0 1,273.0 15,281.0
2 Babai Bargadaha 3,000 15.3 13.7 11.8 8.9 7.2 17.1 191.0 104.0 148.0 50.6 23.3 19.6 50.9 610.5
3 Bangaga hs-gachia 347 .9 .6 1.0 .5 .3 21.9 29.5 76.2 63.2 2.1 1.1 .9 16.5 198.2
4 WesternBapti Jaikundi 5,150 27.9 21.3 19.2 13.0 8.9 56.1 206.0 307.0 228.0 94.0 58.1 28.5 89.0 1,068.0
5 Tinanu lhola Butmal 554 4.5 2.9 2.4 2.0 2.4 6.3 48.6 131.0 34.5 18.2 8.2 5.5 22.2 266.5
6 asternHapti 1,557 23.1 19.2 16.6 15.2 15.3 40.4 205.0 377.0 264.0 88.1 45.5 28.6 94.8 1,138.0
7 Gadaki Darayangarh 31,100 347.o 319.0 284.0 400.0 595.0 1,424.0 3,428.0 4,750.0 3,294.0 1,497.0 935.0 635.0 1,518.0 18,218.o
8 BagmatU Eaaiyo 2,720 15.1 11.6 14.3 17.8 19.8 138.0 560.0 559.0 328.0 75.6 40.5 20.4 150.0 1,800.1
9 Sept Kosi Sank Babi 59,400 408.0 358.0 363.0 123.0 675.0 1,937.0 3,428.0 4,588.0 3,300.0 1,695.0 869.0 556.o 1,549.9 .18,600.o
10 Farka Mai Cbepti 1,150 31.8 8.8 7.1 6.5 10.3 27.6 146.0 158.0 106.0 36.0 21.9 14.3 46.2 554.3
Total 147,868 1,299.6 1,075.1 1.050.4 1,296.9 1,901.2 4,873.4 11,287.1 15,453.2 10,608.7 4,586.6 2,575.6 1,724.8 4,810.5 57,734.6
B. Runoff of the Eaetern Rapti Valley
DrainageAr~e
Name of R. Location Jan. Feb. Mar. r. N Jun. Jl. An. Sep. Ot. lov. Dec. Annual
Rapti R. Lat 27028'00" 579 7.687 6.596 6.057 5.244 5.736 15.25 73-93 109.9 75.61 29.61 14.56 8.926 30.14Long 84°53'10"
MAnhari Lat 270J3'00" 427 5.277 4.192 3.612 3.647 3.341 10.01 40.51 71.10 42.16 18.05 10.42 7.100 18.41Xo1la Long 84 48110"
Lothar R. Lat 27og5'40,, 169 2.018 1.670 1.152 1.018 1.138 4.741 25.42 39.35 28.32 8.940 4.127 2.532 10.13Long 84 43'00'
MIagari Lat 27037'20" 118 2.917 2.150 1.618 1.373 1.286 1.762 8.891 53.21 26.24 6.642 4.540 3.072 9.546Khola Long 8403,000.
Kair Let 27ro'40" 79.7 1.072 1.170 1.234 1.064 1.462 3.466 12.55 20.93 16.08 6.883 3.420 1.469 5.933Mhola Lang 84 f3'40"
Borhi tat 27o35,40o 184 4.076 3.412 2.884 2.832 2.328 5.191 43.85 82.28 76.03 17.94 8.384 5.530 21.3&Apti Long 84030120"
Total 1,557 23.05 19.19 16.56 15.18 15.29 40.42 205.2 376.8 264.4 88.07 45.45 28.63 95.46
Source: Surface Water Records of Nepal, DIHM, 1965, 66, 67, 68 and 69; average station records 6 to 9.
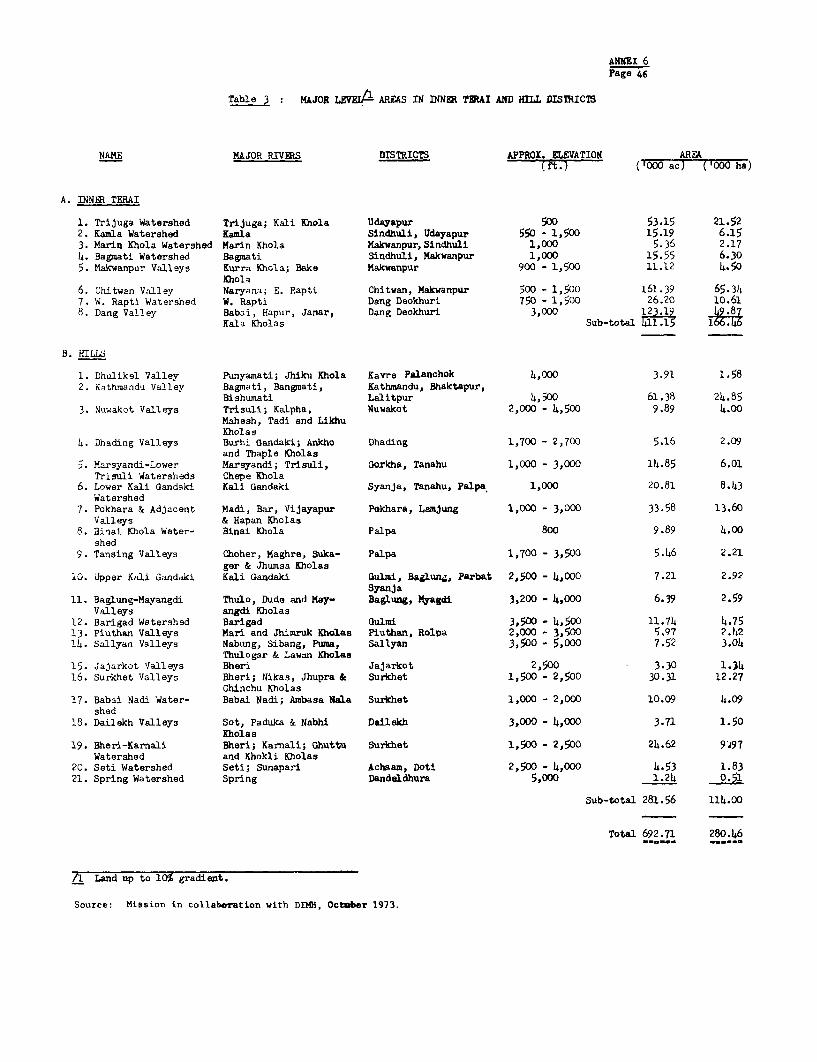
ANx 6Page 46
Table 3 : MAJOR LEVEDA AREAS IN INNER TERAI AND HILL DISTRICTS
NAME MAJOR RIVERS DISTRICTS APPROX. ELEVATION AREA(ft.) (F000 ac) ('000 ha)
A. INNE TERAI
1. Trijuga Watershed Trijuga; Kali Khola Udayapur 500 53.15 21.522. Kamla Watershed Kamla Sindhuli, Udayapur 550 - 1,500 15.19 6.153. Marin Khola Watershed Marin Khola Makwanpur,Sindhuli 1,000 5.36 2.174. Bagnati Watershed Bagmati Sindhuli, Makwanpur 1,000 15.55 6.305. Makwanpur Valleys Kurra Khola; Bake Makwanpur 900 - 1,500 11.12 4.50
Khola6. Chitwan Valley Naryana; E. Rapti Chitwan, Makwanpur 500 - 1,500 161.39 65.347. W. Rapti Watershed W. Rapti Dang Deokhuri 750 - 1,500 26.20 10.618. Dang Valley Babai, Hapur, Janar, Dang Deokhuri 3,000 121. 42.87
Kala Kholas Sub-total 1411.15 166.4
S. HILLS
1. Dhulikel Valley Punyamati; Jhiku Khola Kavre Palanchok 4,000 3.91 1.582. Kathmandu Valley Bagmati, Bangmati, Kathmandu, Bhaktapur,
Bishumati Lalitpur 4,500 61.38 24.853. Nuwakot Valleys Trisuli; Kalpha, Nuwakot 2,000 - 4,500 9.89 4.00
Mahesh, Tadi and LikhuKholas
4. Dhading Valleys Burhi Gandaki; Ankho Dhading 1,700 - 2,700 5.16 2.09and Thaple Kholas
5. Marsyandi-Lower Marsyandi; Trisuli, Gorkha, Tanahu 1,000 - 3,000 14.85 6.01Trisuli Watersheds Chepe Khola
6. Lower Kali Gandaki Kali Gandaki Syanja, Tanahu, palpa 1,000 20.81 8.43Watershed
7. Pokhara & Adjacent Madi, Bar, Vijayapur P&khara, Lamjung 1,000 - 3,000 33.5B 13.60Valleys & Hapan Kholas
8. 3inai Khola Water- Binai Khola Palpa 800 9.89 4.00shed
9. Tansing Valleys Choher, Maghre, Suka- Palpa 1,700 - 3,500 5.46 2.21ger & Jhumsa Kholas
10. Upper Kali Ganddki Kali Gandaki Gulmi, Bajlung, Parb&t 2,500 - 4,000 7.21 2.92Syanja
11. Baglung-Mayangdi Thulo, Dude and May- Bagluzg, Myagdi 3,200 - 4,000 6.39 2.59Valleys angdi Kholas
12. Barigad Watershed Barigad Gulmi 3,500 - 4,500 11.74 4.7513. Piuthan Valleys Mari and Jhimruk Kholas Piuthan, Rolpa 2,000 - 3,500 5.97 ?.14214. Sallyan Valleys Nabung, Sibang, Puma, Sallyan 3,500 - 5,000 7.52 3.04
Thulogar & Lawan Kholas15. Jajarkot Valleys Bheri Jajarkot 2,500 3.30 1.3416. Surkhet Valleys Bheri; Nikas, Jhupra & Surkhet 1,500 - 2,500 30.31 12.27
Chinchu Kholas17. Babai Nadi Water- Babai Nadi; Ambasa Nala Surkhet 1,000 - 2,000 10.09 4.09
shed18. Dailekh Valleys Sot, Paduka & Nabhi Dailekh 3,000 - 4,000 3.71 1.50
Kholas19. Bheri-Karnali Bheri; Karnali; Ghuttu Surkhet 1,500 - 2,500 24.62 9i97
Watershed and Khokli Kholas20. Seti Watershed Seti; Sunapari Achaam, Doti 2,500 - 4,000 4.53 1.8321. Spring Watershed Spring Dandeldhura 5,000 1.24 0.51
Sub-total 281.56 114.00
Total 692.71D 280.-46
_ Land up to 10% gradient.
Source: Mission in collaboration with DINH, October 1973.
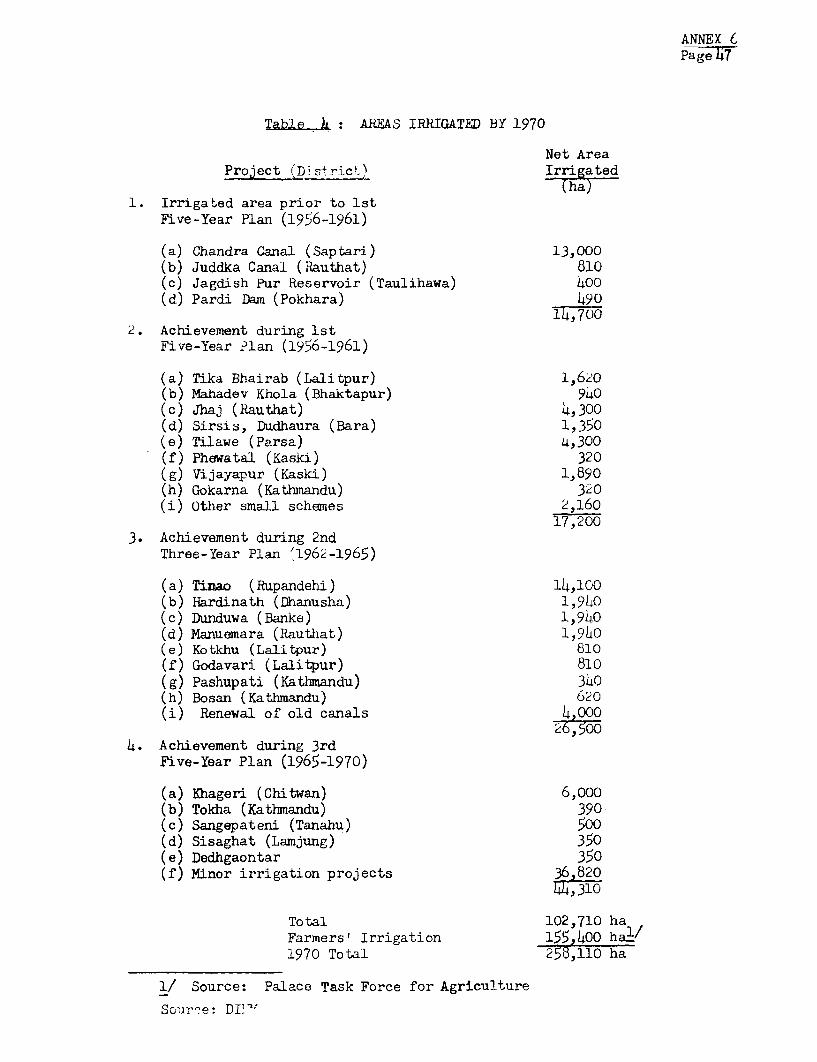
ANNEX 6pa7eTT
Table AREAS IRRIGATED BY 1970
Net AreaProject (Dis+rict. riRted
(ha)1. Irrigated area prior to 1st
Five-Year Plan (1956-1961)
(a) Chandra Canal (Saptari) 13,000(b) Juddka Canal (Rauthat) 810(c) Jagdish Pur Reservoir (Taulihawa) 400(d) Pardi Dam (Pokhara) 490
14,7002. Achievement during 1st
Five-Year Plan (1956-1961)
(a) Tika Bhairab (Lalitpur) 1,6zo(b) Mahadev Khola (Bhaktapur) 940(c) Jhaj (Rauthat) 4,300(d) Sirsis, Dudhaura (Bara) 1,350(e) Tilawe (Parsa) 4,300(f) Phewatal (Kaski) 320(g) Vijayapur (Kaski) 1,890(h) Gokarna (Kathmandu) 320(i) Other small schemes 2,160
17,2003. Achievement during 2nd
Three-Year Plan '1962-1965)
(a) Tinao (Rupandehi) 14,100(b) Hardinath (Dhanusha) 1,940(c) Dunduwa (Banke) 1,940(d) Manuemara (Rauthat) 1,940(e) Kotkhu (Lalitpur) 810(f) Godavari (Lalitpur) 810(g) Pashupati (Kathmandu) 3L0(h) Bosan (Kathmandu) 620(i) Renewal of old canals 4,000
7P,5004. Achievement during 3rd
Five-Year Plan (1965-1970)
(a) Khageri (Chitwan) 6,000(b) Tokha (Kathmandu) 390-(c) Sangepateni (Tanahu) 500(d) Sisaghat (Lanjung) 350(e) Dedhgaontar 350(f) Minor irrigation projects 36 820
Total 102,710 haFarmers' Irrigation 155,400 hal/1970 Total 258,110 ha
1/ Source: Palace Task Force for Agriculture
Scurc'e: DI",
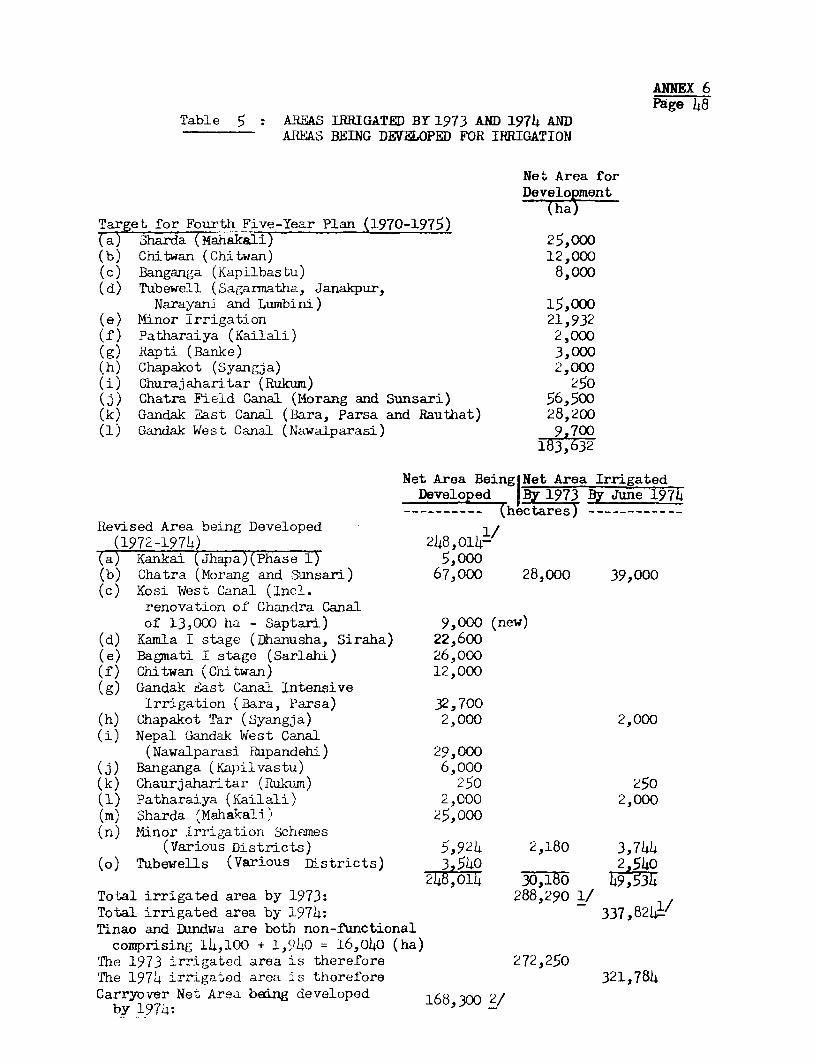
ANNEX 6Page 48
Table 5 : AREAS IRRIGATED BY 1973 AND 1974 ANDAREAS BEING DEVELOPED FOR IRRIGATION
Net Area forDevelopment
(ha)Target for Fourth Five-Year Plan (1970-1975)
a Sharda (Mahakali) 25,000(b) Chitwan (Chitwan) 12,000(c) Banganga (Kapilbastu) 8,000(d) Tubewell (Sagarmatha, Janakpur,
Narayani and Lumbini) 15,000(e) Minor Irrigation 21,932(f) Patharaiya (Kailali) 2,000(g) Rapti (Banke) 3,000(h) Chapakot (Syangja) 2,000(i) Churajaharitar (Rukum) 250(j) Chatra Field Canal (Morang and Sunsari) 56,500(k) Gandak East Canal (Bara, Parsa and Rauthat) 28,200(1) Gandak West Canal (Nawalparasi) 9,700
183,632
Net Area BeinglNet Area IrrigatedDeveloped |By 1973 By June 1974------- (hectares) ------------
Revised Area being Developed 1/(1972-1974) 248,014-
(a) Kankai (Jhapa)(Phase 1) 5,000(b) Chatra (Morang and Sunsari) 67,000 28,000 39,000(c) Kosi W4est Canal (Incl.
renovation of Chanclra Canalof 13,000l ha - oaptari) 9,000 (new)
(d) Kamla I stage (Dhanusha, Siraha) 22,600(e) Bagmati I stage (Sarlahi) 26,000(f) Chitwan (Chitwan) 12,000(g) Gandak East Canal Intensive
Irriga-tion (Bara, Parsa) 32,700(h) Chapakot Tar (Syangja) 2,000 2,000(i) Nepal Gandak West Canal
(Nawalparasi Rupandehi) 29,000(j) Banganga (Kapilvastu) 6,000(k) Chaurjaharitar (,Rukwn) 250 250(1) Patharaiya (Kailali) 2,000 2,000(m) Sharda (Mahakali) 25,000(n) Minor Irrigation Sche-mes
(Various Districts) 5,924 2,180 3,744(o) Tubewells (Various Districts) 3 540 2,540
24B,o14 30,180 49,5345Total irrigated area by 1973: 288,290 1/Total irrigated area by 1974: 337,8241./Tinao and Dundwa are both non-functional
comprising 14,100 + 1,940 = 16,040 (ha)The 1973 irrigated area is therefore 272,250The 1974 irrigated area is therefore 321,784Carryver Net Area be.ng developed 168,300 2/
by .197Th:
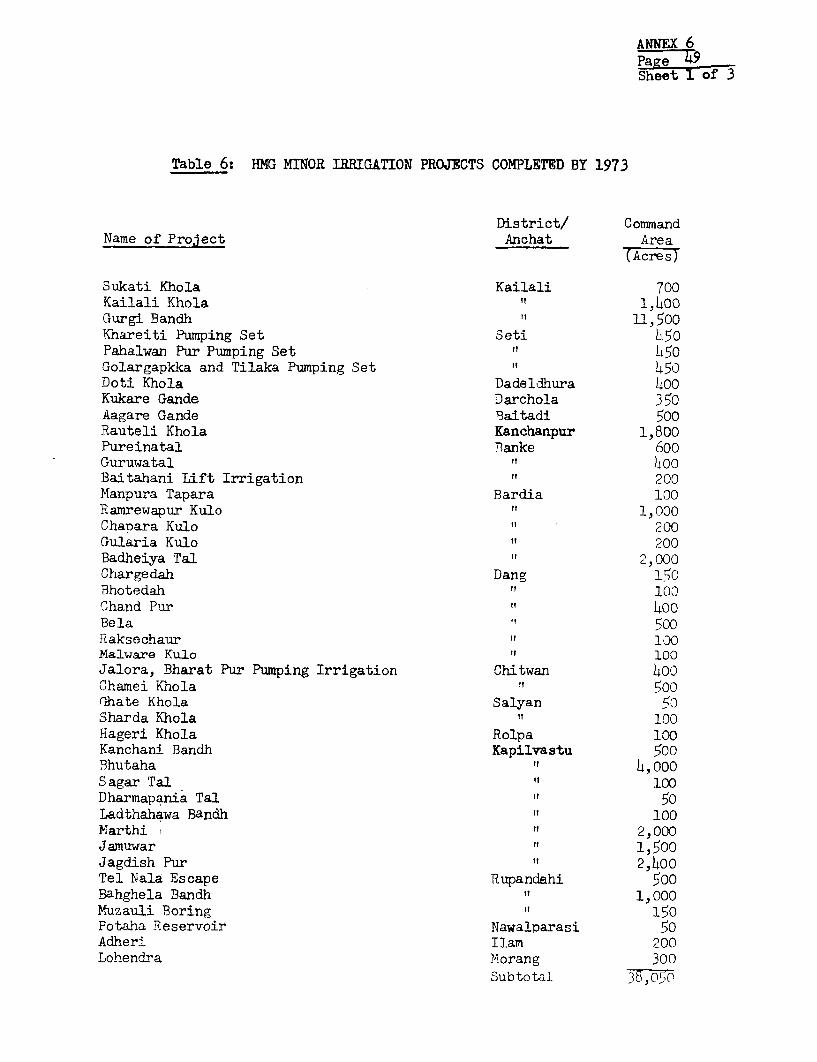
ANNEX 6
heet of 3
Table 6: HMG MINOR IRRIGATION PROJECTS COMPLETMD BY 1973
District/ CommandName of Project Anchat Area
TA (Acres)
Sukati Khola Kailali 700Kailali Khola t 1,400Gurgi Bandh if 11,500Khareiti Pumping Set Seti 50Pahalwan Pur Pumping Set "i 50Golargapkka and Tilaka Pumping Set i t50Doti Khola Dadeldhura h00Kukare Gande Darchola 350Aagare Gande 9aitadi 500Rauteli Khola Kanchanpur 1,800Pureinatal Banke 6ooGuruwatal It hooBaitahani Lift Irrigation " 200Manpura Tapara Bardia 100Ramrewapur Kul.o " 1,000Chapara Kulo 200Gularia Kulo " 200Badheiya Tal " 2,000Chargedah Dang 150Bhotedah VT 100Chand Pur "o00Bela 500Raksechaur "10Malware KulJo 100Jalora, Bharat Pur Pumping Irrigation Chitwan 400Chamei Khola "500Grhate Khola Salyan 50Sharda Khola " 100Hageri Khola Rolpa 100Kanchani Bandh Kapilvastu 500Bhutaha " 4,o00Sagar Tal 100Dharmapania Tal " 50Ladthahawa Bandh 100Marthi 2,000Jamuwar 1,500Jagdish Pur 2,4ooTel Nala Escape Rupandahi 500Bahghela Bandh 1,000Muzauli Boring it 150Potaha Reservoir Nawaliarasi 50Adheri Ilam 200Lohendra Morang 300
Subtotal 7,-0
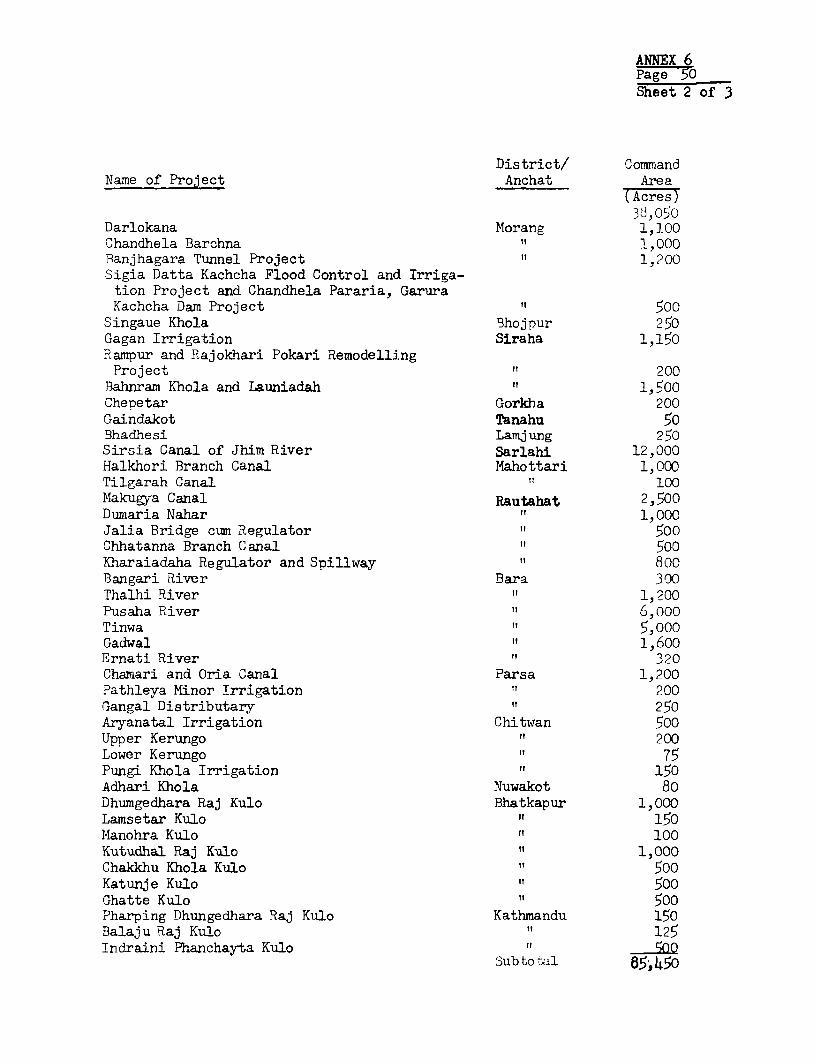
ANNEX 6Page -50Sheet 2 of 3
District/ CommandName of Project Anchat Area
(Acres)3d,050
Darlokana Morang 1,100Chandhela Barchna "I 1,000Banjhagara Tunnel Project it 1,200Sigia Datta Kachcha Flood Control and Irriga-tion Project and Chandhela Pararia, GaruraKachcha Dam Project It 500
Singaue Khola Bhojpur 250Gagan Irrigation Siraha 1,150Rampur and Rajokhari Pokari RemodellingProject " 200
Bahnram Khola and Launiadah 1,500Chepetar Gorkha 200Gaindakot Tanahu 50Bhadhesi Lamjung 250Sirsia Canal of Jhim River Sarlahi 12,000Halkhori Branch Canal Mahottari 1,000Tilgarah Canal . 100Makugya Canal Rautahat 2,500Dumaria Nahar " 1,000Jalia Bridge cum Regulator 500Chhatanna Branch Canal 500Kharaiadaha Regulator and Spillway " 800Bangari River Bara 300Thalhi River " 1,200Pusaha River " 6,000Tinwa " 5,000Gadwal " 1,600Ernati River " 320Chamari and Oria Canal Parsa 1,200Pathleya Minor Irrigation " 200Gangal Distributary " 250Aryanatal Irrigation Chitwan 500Upper Kerungo "I 200Lower Kerungo " 75Pungi Khola Irrigation " 150Adhari Khola Nuwakot 80Dhumgedhara Raj Kulo Bhatkapur 1,000Lamsetar Kulo " 150Manohra Kulo " 100Kutudhal Raj Kulo "I 1,000Chakkhu Khola Kulo " 500Katunje Kulo " 500Ghatte Kulo it 500Pharping Dhungedhara Raj Kulo Kathmandu 150Balaju Raj Kulo it 125Indraini Phanchayta Kulo "00
oubtotal 85,450

ANNEX 6Page 51Sheet 3 of 3
District/ CommanclName of Project Anchat Area
(Acres)
Tahachal Raj Kulo Kathmandu 300Layaku Kulo 25°Pharping Power House "30Kamdu Kulo Lalitpur 195Lele Kulo U 62Ekudha Kulo it 300Aphal Kulo it 625Sanagaon Kulo " 1,625!'Iakkhu Kulo " 125Kammeswar Kulo 187Lubhu Kulo 1 5
'Potal 90,279 A if'mor 16, 111 lI.>.t -

ANNEX 6Appendix 1Page 1
AN ASSESSMENT OF METEOROLOGICAL ANDHYDROLOGICAL INVESTIGATIONS I/
Meteorology
1. There are about 200 rainfall stations in the country of which 150were established by the Indian Meteorological Department in the late fortiesand early fifties. The records for these Indian stations run from 1955, butthe data area are sent directly to New Delhi and are only made available toNepal after a delay of about two years.
2. The Nepal Meteorological Service was established in 1965 and sincethen about 170 rainfall stations have been established. Many of these areadjacent to the Indian stations most of which have been duplicated by now.
3. Six synoptic weather stations have been established as well ascomplete aeronautical weather stations at the airfields at Kathmandu andBiratnagar. Other stations record temperature, sunshine hours, evaporation,soil temperatures and wind speed and direction.
4. Data are published in "The Climatological Records of Nepal", issuedannually by the Department of Hydrology and Meteorology of the Ministry ofWater and Power. The 1970 records were issued in 1973. Monthly isohytal mapsfor the whole country have been prepared.
5. While the meteorological records span comparatively short periodsof time, the main centers of agricultural development are included and thecoverage is increasing. Technical assistance is being provided by the WorldMeteorological Organization (WMO) and should be increased as proposed by thesenior WM1O advisor.
6. The main weaknesses of the Meteorological Service in Nepal are asfollows:
(a) The service has not enough qualified, trained and experiencedmeteorological and telecommunication staff. Training of meteorological per-sonnel in different fields of specialization is urgently needed.
(b) The network of climatological, agrometeorological and synopticstations needs further expansion specially in the western and hill areas.The supervision of the network has to be improved and consolidated. A radiosondestation for measurement of temperature, humidity and wind in the upper airshould be established near Kathmandu Airport.
I/ An assessment of Soil Investigations is given in Annex 1.
ANNEX 6Appendix 1Page 2
(c) There are no workshop facilities and no instrument specialists inthe Meteorological Service.
(d) The increasing amount of climatological data needs better facilitiesfor more efficient data processing and storage.
(e) The Telecommunication Section has to be strengthened considerablyto improve the reliability of collection and transmission of meteorologicaldata. The existing facilities for repair of telecommunication equipmentshould be improved.
(f) The present organizational structure for the MeteorologicalService as a small unit within the Department of Irrigation, Hydrology andMeteorology makes the administration of the service extremely unwieldy. Asthe only meteorological authority in the country, as the meteorological agencyto serve all sectors of development and economic activities in Nepal and asthe meteorological organization to represent Nepal internationally, theMeteorological Service has to be given a more independent administrative andorganizational status.
Surface Water Hydrology
7. The network of river gauging stations was established between 1961and 1968 with the assistance of the USGS. About 100 stations were installed,some 20 of them with automatic water level recorders. The USGS support pro-gram was suspended in 1968 and activities have since been confined to datacollection. The Hydrological Section of DIHM is responsible for the operationand maintenance of the gauging stations, the collection and processing ofdata and publishing the results. However, the Director of the Section andone other engineer are the only trained hydrologists and the quantity andquality of output are severely affected by the lack of trained staff.
8. The river flow data are published in "Surface Water Records ofNepal" issued by the Ministry of Water and Power. The first issue datedFebruary 1967 is "The Compilation of Surface Water Records of Nepal throughDecember 31, 1965," and was prepared in cooperation with USAID. SupplementNo. 1, is for 1966; Supplement No. 2 for 1967 and Supplement No. 3 for 1968.In total, six Supplements have now been published for 1966-71. The recordscover stations on the main stems and principal tributaries of the basins ofthe Karnali River, West Rapti River, Harayani River, Bagmati River, Sapti Kosiand Kankai Mai. Also included are some discharge measurements made at partial-record gauging stations in these basins and discharge measurements made atmiscellaneous sites during the low flow season.
9. It is understood that the accuracy of the records has declined since1968, and that no analyses have yet been made of the relationship between thedischarges at major gauging stations and the discharges of lower order tribu-taries. Rainfull-river runoff correlation studies are also not being made, andthe detailed water resources picture remains therefore unclear.
ANNEX 6Appendix 1Page 3
10. If the land resources of Nepal are to be exploited to the full, thesurface water resources must be assessed with accuracy, particularly for themonths just prior to and following the monsoon. There is an urgent need fortechnical assistance, scientific equipment, and additional training in riverhydrology.
Groundwater Hydrology -/
11. The subsurface conditions of large areas of the Central andEastern Terai have been investigated by DIHM/FAO/Nippon Koei (NK) and inten-sive groundwater investigations are currently underway in the Western Teraiby DIHM/USGS/USAID 2/. The latter investigation includes an important train-ing on the component and establishment of a permanent Groundwater Section inDIEM, staffed with Nepalese personnel trained on the project and overseas,to carry out continuing groundwater investigations throughout Nepal andhydrologic monitoring required for groundwater development and management.
12. The areas that have been or are being investigated include 3/:
(a) in the Central and Eastern Zones, the Terai areas of theNarayani and Janakpur Zones and part of the SagarmathaZone. No investigation work has been done or is currentlyplanned for the Terai areas of the Koshi and Mechi Zones;
1/ HMG/USGS/USAID, Evaluation of Groundwater Investigation in the WesternTerai, Nepal, mimeographed report, Kathmandu, 10 p., 1973.
2/ Both investigations are of good quality and have yielded important results.
3/ Much of the available information and data are with the HMG Departmentsand their consultants. Nippon Koei (UK) Co., Ltd., with FAO as theExecuting Agency on behalf of UNDP, has submitted the following reportson groundwater
(a) Report on the General Reconnaissance Groundwater Survey, March1968 (not available in Washington);
(b) Report on Geophysical Investigations for Sun Kosi Terai Project,December 1969 (not available in Washington);
(c) Feasibility Report on a Combined Surface and Groundwater Projectin the Birganj Area with Annexes, August 1971;
(d) Report on the Groundwater Investigation in the Sun Kosi TeraiProject, October, 1971 (not available in Washington).
DIHM/USGS/USAID have prepared an interim report, "Groundwater ResourcesInvestigations in Lumbini Zone, Western Terai, Nepal", 200 pages, by G. C.Tippetts and W. Ogilbee of USGS and C.K. Sharma and Staff of DIHM (Nepal),1973.
ANNEX 6Appendix 1Page 4
(b) in the Western and Far Western Zones, the Terai areas of theLumbini, Rapti and Beri Zones. Field investigations in theLumbini and Rapti Zones have largely been completed andinvestigations are underway in the Terai areas of the Setiand Mahakali Zones;
(c) the groundwater potentials of Kathmandu Valley are beingevaluated by HMG/UNDP/Binnie & Partners on behalf of theWater Supply Department of the Ministry of Water and Power.
DIHM/USGS intend to investigate the groundwater potentials of the Dang andChitwan Valleys upon completion of their work in the Western Terai.
13. The present DIHM/USAID Groundwater Investigation Project in theWestern Terai is based on recommendations contained in a report by Messrs.Swarzenski and Babcock. 1/ They proposed a phased program of groundwaterinvestigations first in the Bhairawa area (Lumbini Zone), and then in theNepalganj and Dhanghari areas of the Western Terai. The basic elementsof their proposal included: (a) exploratory drilling or about 180 testholes together with appropriate hydrologic analysis and interpretation ofthe data obtained from drilling; (b) construction of about 32 complete tube-wells to determine the hydraulic characteristics of the alluvial aquifers; (c)assignment of two groundwater hydrologists from the U.S. Geological Survey(USGS) and one well-drilling specialist from USAID, as advisors to the project;(d) training of a Nepalese staff of geologists, engineers, and well-drillingpersonnel in the field and office fundamentals of groundwater investigationsand in the maintenance of drilling equipment; and (e) most important, estab-lishment of a permanent Groundwater Section in DTHM staffed with Nepalesepersonnel trained on the project, to carry out continuing groundwater inves-tigations throughout Nepal and hydrologic monitoring required for groundwater development and management.
14. The investigation program covers four major areas:
(a) The Lumbini Terai comprising 4,000 sq kilometers of gentlysloping cultivated land and dry jungle lying between theChuria Hills on the North and the Indian border on the South;
(b) The Terai of the Bheri and Rapti Zones around Nepalganj;
(c) The Terai of the Mahakali and Seti Zones; and
(d) The Dang and Chitwan Valleys.
1/ Swarzenski, W.V. and Babcock, H.M., Groundwater Investigations Programfor the Western Terai: U.S. Geological Survey Open-File Report, 57pages, 12 figures, June 1968.
ANNEX 6Appendix 1Page 5
15. A report on the Lumbini Zone has been completed. 1/ Initial fieldstudies in the area around Nepalganj have been completed, and field wfork inthe Mahakali and Seti Terai will be taken up this year (1973/74). A waterquality laboratory was established in DIHM at Kathmandu, as part of projectactivities, in the spring of 1971. Since project initiation, 253 water sam-ples have been collected in the field and analyzed in this laboratory.
16. During operations in the Lumbini Zone drilling was carried out ona grid with centers approximately 6 miles apart on east-west lines and 3 to 4miles apart on north-south lines.
17. As of the end of the 1971-72 field season all exploratory drillingfor a total of 41,715 feet had been completed in the Lumbini Zone. In severalactivity categories, i.e., the drilling of test holes and test wells, actualaccomplishments exceeded project goals by as much as 20 to 25 percent. Thetechnical phase of the Groundwater Investigations Project, thus far in itshistory, has met and in some cases exceeded project goals.
18. The principal objective of the USAID/DIHM Groundwater InvestigationsProject has been the establishment of a permanent Groundwater Section in DIHM,staffed with Nepalese personnel trained on the project, to carry out continu-ing groundwater investigations throughout Nepal and the hydrologic monitoringrequired for a national program of groundwater development and management.Following completion of the current investigations in the Western Terai inthe next one and one-half years, there will still be a need to assess andmanage the groundwater resources of the Eastern Terai (except certain areasaround Birganj and Janakpur already investigated by FAO/NK), the east andwest Rapti Valleys, and Dang, Chitwan, Pokhara and Surkhet Valleys -- indeedalmost any accessible area in Nepal. Given these facts and the clear progressmade to date towards the establishment of a professionally competent ground-water investigations organization, the mission agrees with DIHM that a perma-nent Groundwater Section should be formally established and that the USGSshould be requested to continue its support for several years.
19. Although water utilization is outside the scope of the currentUSAID/DIHM project, it is of concern to Nepal as it moves into the nextstage of development, and as such is related to the present investigationprogram.
1/ USGS/DIHM, Ground Water Resources Investigations in Lumbini Zone,Western Terai, Nepal, 200 pages, by G.C. Tibbitts and W. Ogilbee ofUSGS and C.K. Sharma and staff of DIHM (Nepal).
ANNEX 6Appendix 1Page 6
20. There is a need for an extensive hydrologic monitoring and researchprogram with external assistance. This is necessary to ensure the mosteconomic and beneficial development of Nepal's most important basic resource --
water. Solutions must be found to the problems arising from water develop-ment. Such questions as: What changes will occur in the soil and in thequality of surface and ground waters as a result of irrigation? How muchwater can be withdrawn from a particular groundwater basin without depletingthe supply? Will land subsidence occur in a particular area as a result ofdeveloping artesian aquifers? What is the useful life of a production well?
Would surface water or groundwater development or a combination of both bemost beneficial in a given area? What types of crops are best suited for the
quality of water available for irrigation? There are only a few samples ofthe many questions which must be answered as water development proceeds.
Requirements for Technical Assistance
21. Continued technical assistance will be required for several yearsfor soils, meteorological and surface- and ground-water hydrological investi-gations. Additional scientific equipment and additional training are alsoneeded. Institutions in Nepal are being created by aid donor agencies bymeans of rapid and strong inputs. These inputs are then withdrawn just asrapidly, leaving the newly created agency floundering, e.g. the surface waterhydrology section. The problems created by this pattern are especially criti-
cal in land and water resources agencies, where technical applications arecomplex and sophisticated, and where two or three years of inputs are usually
insufficient to accomplish the goals which HMG and the donor agency have inmind. Sustained efforts over a longer period are required. The USGS shouldbe requested to resume its technical support in surface water hydrology andto continue its assistance in groundwater hydrology well beyond the presentcontract period ending mid-1975. Assistance in meteorology, should be expand-ed as proposed by the senior WMO advisor. Support in soil surveys should be
expanded greatly by FAO, so that current land resources evaluations can becompleted and land soil surveys for proposed irrigation projects can beconducted by 1MG staff. Proposals for continued technical assistance are
available with HMG and the aid donors for all programs except for soil surveys.Two programs should be prepared for surveying the soil and land resources asindicated in para 4 of this note and implemented at an early date.
ANNEX 6Appendix 2Page 1
SELECTED PROJECTS IN THE CURRENT IRRIGATION PROGRAM
The more important projects listed in Tables 3 and 4 of this Annexare discussed below:
1. The Birganj project is being financed by IDA 1/. The projectwill complete the construction of a canal distributary system to irrigate28,700 ha with water supplied from a barrage on the Gandak River on theIndia-Nepal border and a main canal constructed by the Government of India(GOI), and a tubewell irrigation scheme to irrigate a net area of 2,700ha in an adjoining area. It includes drainage, on-farm development, serviceroads, agricultural extension, research and cooperative services to provideinputs and credits to farmers providing an integrated approach to the agricul-tural development of the project area. In addition it will also providefor the preparation of feasibility studies for a small pumping scheme anda surface irrigation project. The project will be executed by the NarayaniZone Irrigation Development Board (NZIBD) recently established as an autono-mous government agency, having jurisdiction over an area encompassing fiveadministrative districts. The staff of NZIBD will be trained by a consultantteam in the planning, design, construction, operation, maintenance andmanagement of both the surface and groundwater irrigation systems as well asin agricultural development. Since NZIDB is a new agency, drawing its keystaff from several ministries, its success in implementing and managing theproject depends on strong support from HMGN as well as on the assistanceand training of NZIDB staff by the consultants.
2. The Kankai Project in the extreme east of the Terai is reportedto have a gross commanded area of 51,000 ha. A feasibility study for theADB was completed by Nippon Koei, Ltd. In 1971 H.M.G. has signed a loanagreement with the Asian Development Bank for Stage I of the project (5,000ha net) which will consist of diversion from the Kankai river; irrigationand drainage networks; demonstration of irrigation practices and irrigatedagriculture under a project authority for management and 0 & M assisted byconsultants. Pre-qualification tenders have already been invited. Thisproject provides for year-round irrigation.
3. T Citajroect in the Chitwan valley of the Inner Terai of12,000 ha net will also be developed by HMG with an ADB loan. The loanconditions for this project are similar to those for the Kankai Project.
1/ IDA, Report No. PA 146a, March 1973.
ANNEX 6Appendix 2Page 2
4. The Chatra Canal Project (96,000 ha gross and 67,000 ha net) lieson the left bank of the Sapt Kosi on the Nepal/India border. It consists ofa head regulator, a main canal and distributaries. This is an Indian-aidedproject for which the G.O.I. has undertaken to finance and construct allworks down to 5 cusec turnouts. Expenditures to date on the main-works isreported to be Rs 18 crores (Nepal currency), about US$18 million. GOIhas allocated Rs 3.5 crores in this financial year for this project. TheChatra canal is designed for 1,600 cusecs and 1973 - diversions have been900 cusecs. The offtake is some 10 miles to the north of the existing barr-age near the Indo-Nepal border. The headworks which must include silt ejec-tors, have not yet been completed and a dredger is maintaining the roverchannel at the diversion point. HMG has currently budgeted Rs 7.5 millionfor the minor and field channels.
5. The main canal immediately downstream of the offtake is 90 feetdeep and there are still some seepage problems to be solved. Other stretchesof the main canal are also subject to seepage hazards bank failures. Althoughcompleted many of the main canal structures require extensive repairs to makethem to operational standard.
6. It is clear that significant financial and technical assistance willbe required to make the project fully functional when the works are completedto GOI standards. This large project will be a logical choice for interna-tional assistance for a project to rehabilitate some of the major works, toprovide drainage, farm roads, other rural infrastructure, farm credits, on-farm development, agricultural extension etc.
7. The Mahakali (Sharda) project in the Terai of the westernmost MahakaliZone is another project to which HMG is committed. There exists a 53-year oldIndo-Nepal agreement which promises Nepal 450 to 1,000 cusecs for paddy irri-gation -- the actual volume to depend on water availability. However, Nepalalso needs an agreement as to the amount available in the dry season toenable multiple cropping.
8. The West Kosi Canal Project, totalling 22,000 ha (net), includesthe 50-year old Chandra canal project of 13,000 ha. In the latter, yieldswere about 2 tons of paddy per ha before irrigation; upon completion of theproject the irrigated crop yields were 3 tons/ha for 10 years. Since thenyields have declined rapidly and are now only 0.5 tons/ha while in adjacentnon-irrigated areas yields have remained 2 tons/ha to this date. (NK, August1970 Page 26). Soil rehabilitation will be difficult and costly, and requirestechnical assistance.
9. The Bagmati and Kamla projects belong to the category or projectsrequiring surface storage for irrigation, hydropower and flood control. Thesemultipurpose projects are discussed in Chapter D, section "Available PlanningStudies".
ANNEX 6Appendix 3Page 1
ASSESSMENT OF AVAILABLE PLANNING STUDIES
I. Pre-feasibility studies for irrigation development were carriedout for an area of 540,000 ha in the Central and Eastern Terai by FAO/NipponKloei. A number of major projects for both surface and ground water wereidentified as technically feasible including the Kamla and Bagmati irrigationprojects. A final report was published by FAO/NK 1/ in 1972 in which eightprojects with a net irrigable area of 310,000 ha were identified for part ofche Central and Eastern Terai including a first evaluation of their relative'priorities.
2. A perspective plan for irrigation development 2/ for the wholecountry was published in 1970 by DIHM with the assistance of NK. The Elec-tricity Department of the Ministry of Water and Power published a perspectiveplan for power development 3/ in August 1970 with the assistance of NK. Large-scale irrigation projects can be undertaken in the vast tracts of the Teraiplain.
3. For the Terai FAO/NK and HMG/NK have considered tubewells only forareas which are difficult to irrigate by canal systems due to topographic orsurface water supply limitations. In addition, the introduction of well irri-gation in these areas is deferred to the years 1990 and beyond in these reports.The advantages of wells, i.e., year round water supply, quick construction,quick payoff and early farmers' training in perennial irrigation have not beenconsidered in developing the irrigation program. The use of small-capacitylow-lift pumps has also been ignored. The reports referred to above containuseful information, data and development principles. The irrigation reportsemphasize correctly year-round irrigation, on-farm development, need fordetailed distribution systems for and within 30 to 40 hectare blocks, agricul-tural credits, inputs and extension, establishment of pilot projects and expe-rimental farms, etc. Shortcomings are:
1. Lack of proposals for stimulating private initiatives andexclusive emphasis on government actions.
2. Emphasis on large-scale canal and surface storage projects.Twelve projects are proposed by HMG/NK for an area ofmore than one million hectares in the Terai and the Inner
1/ FAO!Nippon Koei Co., Ltd. Final Report on the Development of Irrigationin the Central and Eastern Terai Plain, Nepal, 1972.
2/ 1HMG/Nippon Koei Co., Ltd., Master Plan of Irrigation Development inNepal, August 1970.
3/ HMG/Nippon Koei Co., Ltd., Master Plan for Power Development and Supply,May 1970.
ANNEX 6Appendix 3Page 2
Terai (the Dang and Chitwan Valleys). Irrigation develop-ment is proposed on a block-by-block basis for this one-million hectare area and minor projects for the HillValleys and tars. Phasing of implementation is proposedfor the very large units but the program lacks flexibility,especially in the initial phase of irrigation development.
3. Deforestation is implied but is not accounted for in eitherproject phasing or the economic analysis. Some irrigationschemes include extensive areas requiring deforestation;e.g., the Mahakali project has an existing cultivated areaof 10,000 ha and the proposed commanded area is 55,000 ha,for the Chitwan project the figures are 20,000 and 24,000 ha,etc. 1/
4. Use of groundwater is limited to areas where surfacewater alternatives are impossible or difficult. Verycostly tubewells are proposed which are to be built,owned and operated by HMG 2/. It is suggested to delaytheir construction until after hydro-electric poweris generated in Nepal for these wells rather than buyingsome power for this purpose from India (see section onelectric power policies of Nepal).
5. Despite the high infiltration rates observed 3/, highrunoff values of 50% or more are assumed, leading totheoretically high irrigation requirements and lowrainfall recharge (see Addendum). No soil moisturebalance studies are made and the presence of bundsaround paddy fields is ignored in the studies. Theresulting farm irrigation efficiency and monsoon re-charge are both very low. The implied practice of monsoonirrigation in months with rainfall exceeding evapotrans-piration by two or four times, will cause high nutrientlosses and soil deterioration as has already occurred inthe 50-year old Chandra canal command.
1/ HMG/NK, August 1970, page 63.
2/ FAO/NK, August 1971, Annex III.
3/ FAO/NK, September 1970 and June 1972 (Sections on infiltration rates);see also Chapter D, Section "Need for Improved Water Management"Annex 1.
ANNEX 6Appendix 3Page 3
6. Irrigation and power benefits in India are not accountedfor in the economic analyses even though these are verysubstantial in the case of the Bagmati, Kamla and theSun Kosi High Dam projects. No quantitative values areassigned to either water or power as export commoditiesto India.
7. The economic analyses do not include shadow pricing and donot reflect the true costs and benefits of the projects tothe nation.
8. The maximum rate of implementation is held at less than20,000 ha annually for irrigation for the period 1970-2000 because of constraints manpower, financing andoperation and maintenance. Limitations certainly existnow but their continued existence beyond the next sevento ten years is doubtful.
9. It is not clear how the gross area of 540,000 ha in theCentral and Eastern Terai has been reduced to a net irri-gable area of only 310,000 ha 1/. Some soils are deletedon the basis of low water retention capacities whilereported figures indicate acceptable values. Reportedcation exchange capacities (CEC) and base saturationpercentages (BSP) of soils appear incorrect; the relation-ship between CEC and the clay fraction varies widely eventhough the humus contents are low and the clay mineralanalyses show little variation and the relationshipbetween pH and BSP is opposite to normal (e.g. BSP valuesof over 100 percent for acid soils). 2/ Reportedlaboratory data appear of little value for irrigabilitydeterminations.
1jf FAO/NK, Final Report, 1972.
2/ FAO/NK, September 1970 and June 1972.


ANNEX 6Appendix 3AddendumPage 1
RAINFALL RECHARGE IN BIRGANJ PROJECT, BUTWAL AND BHAIRAWA
1. FAO/NK 1/ has calculated the average aerial rainfall recharge for thewet season of the 1970 high rainfall year, for the Parnanipur station inthe Birganj tubewell area using an assumed surface runoff of 50 percent andcalculates the rainfall recharge to be 2.4 million cubic meters (MCM) per1,000 ha for the Siraha rainfall station.
2. The assumed 50% surface runoff cannot be supported by either therainfall intensity or observed infiltration rates. Moreover, for a tubewellproject it is of interest to determine first the average annual groundwaterrecharge from the average rainfall in the wet season and subsequently to ana-lyze the long-term effect of possible over- and under-pumping for a succes-sion of years with varying rainfalls. The 1970 monsoon rainfall was 45 percenthigher than the 18-year average rainfall.
3. Terminal infiltration rates (after 24 to 40 hours of continuedtesting) for Birganj project soils are given by FAO/NK 2/ (pp. 30-32) and varyfrom 140 to 30 mm per day, while one soil type (sandy topsoil on sandy sub-soil) has a final infiltration rate of 500 mm per day.
4. Field bunds of, say, 9 inches or some 22 cm create a substantialbasin for rainfall retention on the farmers field. An infiltration rateof 3 cm per day means that -- with continuous ponding -- the potentialdeep percolation losses over the four-month wet season would be 3.5 metersof water unless the subsoil would become saturated thus inhibiting or reject-ing further downward percolation. The combination of field bunds and infil-tration will prevent significant runoff from paddy fields. Bangladesh hasa similar rainfall distribution and a daily soil moisture balance study hasshown 3/ that hardly any runoff will occur there with infiltration rates of0.01 and 0.02 ft per day or 0.3 and 0.6 cm per day, i.e., ten times lessthan those observed for the Terai clay soils. It is also clear that, withtubewell irrigation, continuously ponded paddy fields will lead to high pump-ing costs to cope with excessive groundwater recirculation. Ponded paddyfields would probably prove to be undesirable and costly in tubewell areasin the Terai.
1/ FAO/Nippon Koei Co., Ltd., August 1971 (Annex V).
2/ FAO/Nippon Koei Co., Ltd., June 1972.
3/ IBRD/IDA, Land and Water Resources Study, Bangladesh, Technical ReportNo. 20 - Overall Water Resources Potential and Technical Report No. 21 -The Groundwater Potential, Vol. VII, Report No. PS-13, December 1972.
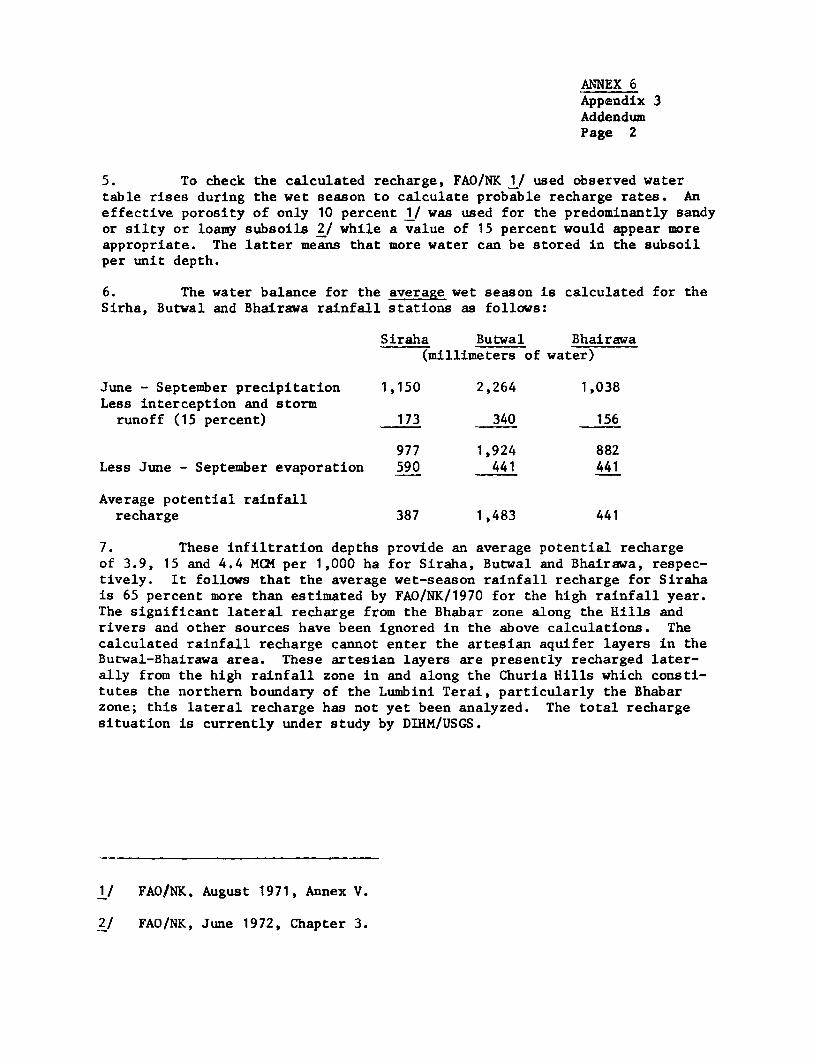
ANNEX 6Appendix 3AddendumPage 2
5. To check the calculated recharge, FAO/NK 1/ used observed watertable rises during the wet season to calculate probable recharge rates. Aneffective porosity of only 10 percent 1/ was used for the predominantly sandyor silty or loamy subsoils 2/ while a value of 15 percent would appear moreappropriate. The latter means that more water can be stored in the subsoilper unit depth.
6. The water balance for the average wet season is calculated for theSirha, Butwal and Bhairawa rainfall stations as follows:
Siraha Butwal Bhairawa(millimeters of water)
June - September precipitation 1,150 2,264 1,038Less interception and storm
runoff (15 percent) 173 340 156
977 1,924 882Less June - September evaporation 590 441 441
Average potential rainfallrecharge 387 1,483 441
7. These infiltration depths provide an average potential rechargeof 3.9, 15 and 4.4 MCM per 1,000 ha for Siraha, Butwal and Bhairawa, respec-tively. It follows that the average wet-season rainfall recharge for Sirahais 65 percent more than estimated by FAO/NK/1970 for the high rainfall year.The significant lateral recharge from the Bhabar zone along the Hills andrivers and other sources have been ignored in the above calculations. Thecalculated rainfall recharge cannot enter the artesian aquifer layers in theButwal-Bhairawa area. These artesian layers are presently recharged later-ally from the high rainfall zone in and along the Churia Hills which consti-tutes the northern boundary of the Lumbini Terai, particularly the Bhabarzone; this lateral recharge has not yet been analyzed. The total rechargesituation is currently under study by DIHM/USGS.
1/ FAO/NK. August 1971, Annex V.
2/ FAO/NK, June 1972, Chapter 3.
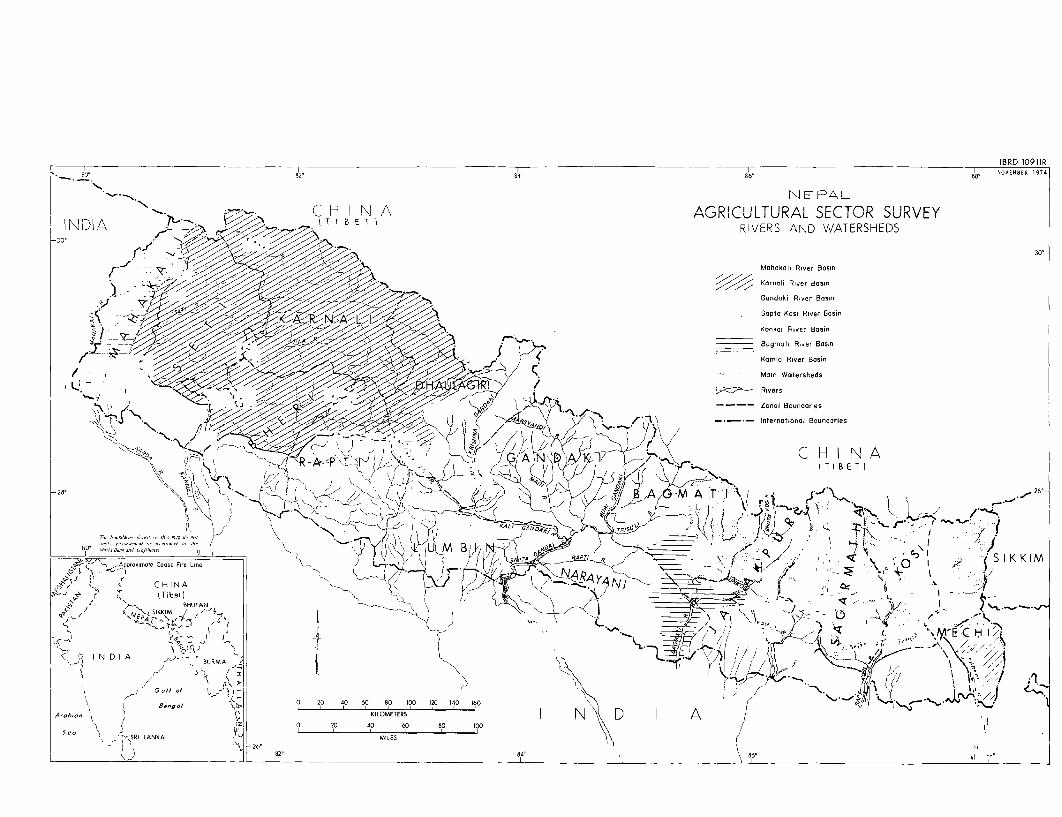
_______________________________ IBRD 10911R~~~~~~~~~~~~~~~~~~~~~~~~~~~~~~~~~~~~~~BR) 091
80o 82e 34 8'. =8
- ~~~~~~~~~~~~~NEPAL' . ,. C H I N A AGRICULTURAL SECTOR SURVEY
INDIA >-iO ,/X X n a T B ET) R VERS AND WATERSHEDS
305 /X<> 30°2~~~~~~~~~~~~~~~~~~~~~~~~~~~~~~~~~~~~~~~~~~~~~~~~~~~~~~~~~~~~~~~~~~~~~~~~~~~~~~~0
Mahakol River Basin
Karnali River Basin
Gandaki River Basin
Sapta Kosi River Basin
Kankai River Basin
______ Bagn-ati River Bosin
Kamla River Basin
ti ~~~~~~~~~~~~~~~~~~~~~~~~~~~~~~~~~~~~~~~~~~Main Watersheds
~7 - Rivers
Zonal Baandaries- International Boundaries
Nn C H I N Aj R~ f . A N0 40 60 80 100\'\/ITIBET
28 2'8'' 6 1 ' 28
-~~ ,fl~~~ v~
<7 ~~~~ L/~~'--Weo ;
~~~~~~~u M B V/~~~~~~~~~~~~~~~~~~~~~~~~~~~~~~~~~~~~~~~~~~~~~2
C H I N A N-~~~~~~~~~~~~~~ I(Tibet~~~~~~~~~~~~~~~~~~~~~~~~~~~~~~~~~~~~~~~~~~~~~~~~~~~~~~~~~~~~~~~5
I N D I
A-b 8- .CHINA ' 608--0 I 14-0 160__
'~' I e~.\LANKA AN6i '80 11
U I' 0 SiKK(~ *r ''n~ 2~i26' U
0K~N/ ~ .~AJ 1 /2 -Ir

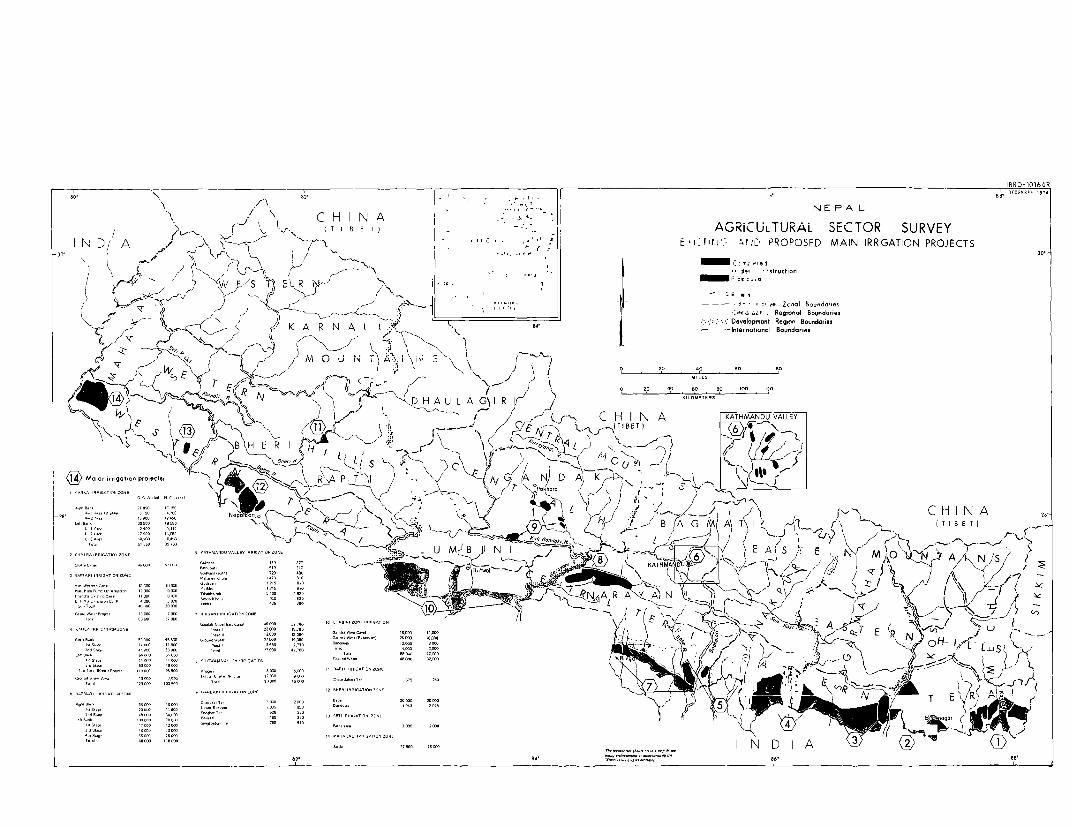
I DECEM~~~~~~~~~~~~~~~~~~~~~~~~~~~~~~~~~IBER D101642
T IBED I) AGRiCULTURAL SECTOR SURVEY
IN D,tI A AN $ E' C - I F ir j r C- PROPOSED MAIN IRRIGATION PROJECTS
kl~~~~~~~ N 1 m c:o
K I- <KARNALI~~~~~~~~~~~~~~~~~~~- f IKTMAD VLE
cm ~ ~ ~ ~ ~~~~N C H I N A NI W-<0 i0 20 40 60 8H' 2))/ N,$ ~ -k 0'0 2 0 0 10 2
N\ . x L.,,r'-. C H I N A KA~~~~~~~~~~~~~~~~~~~THMND VALLIEYE
>8-i --C - Y C 1- NEu M IE AlSt
p N ~~~~~~~Pok0aoa ION~~~~~~~~~~A I> -t-' 8
/7008000-0/ - ~ ~ ~ 11- 1 -- T--
0/0 0/ KATHMAN ''~~~~~ ~ N NDA 1IN/
08008, ~-4~'-'~ Bo2ol -/ - 816-801 6 8- - '


ANNEX 7Page (i)
NEPAL
AGRICULTURAL SECTOR SURVEY
AGRICULTURAL CREDIT AND COOPERATIVES
NumwrerP
SUMMARY AND CONCLUSIONS ......................... i - xv
OVERVIEW OF THE PRESENT AGRICULTURALCREDIT SITUATION IN NEPAL ...................... 1 - 3
The Role of Institutional Credit .. . 4 - 6
CREDIT INSTITUTIONS, COOPERATIVES AND THEIRPROGRAMS ......... 7 - 62
Cooperative Credit Societies and the CooperativeBank ...... . 7
Land Reform Credit Program . , .. . 8- 15Loan Interception . .9 - 11Compulsory Savings Scheme .......... ........... 12 - 15Institutional Credit Programs Under LandReform .... 16 -- 21Ward and Village Committees ....... ......... 16 - 17Land Reform Savings Corporation (LRSC) 18 - 21
The Agricultural Development Bank of Nepal (ADBN) 22 - 41Introduction .................................. 22 - 25Lending Policies and Procedures ....... ........ 26 - 30Program Emphasis .............. ................ 31Staff Organization and Training .............. . 32 - 35Resources ..................................... 36 -38Loan Performance .............................. 39 -41
The Nepal Rastra Bank (NRB) .......... ........... 42 -4i
Commercial Banks ................................ 46 -47Cooperatives .................................... 48 - 57Coordination Among Government Agencies .. ......... 58 - 62
ANNEX 7Page (ii)
ParagraphNumber
III. PLANS AND PROSPECTS ...... ...................... 63 - 82
Credit Requirements and Issues for the Future 63 - 66Fourth Five Year Plan Targets and Achievements 67 - 68Future Availability of Financial Resources 69 - 71Role of Village Committees . .72Future Emphasis of ADBN. 73 - 82
Table 1 - Farm Borrowings by Loan Volume and Farm Families, 1969/70Table 2 - Institutional and Private Agricultural Credit by Purpose, 1969/70Table 3 - Cooperative Bank - Cumulative Resources and Loan Disbursements,
FY Ending 1964-1967Table 4 - Annual Loans made by the ADB to Cooperatives and Individuals
1963/64 - 1972/73Table 5 - Total Compulsory Savings CollectedTable 6 - Loans Advanced and Recovered by Ward/Village CommitteesTable 7 - Cumulative Loans Advanced and Recovered by Ward/Village Committee,
By Regions, 1964/65 - 1970/71Table 8 - Compulsory Savings Deposited in Land Reform Savings Corporation,
and Loans Disbursed and RecoveredTable 9 - Loans Disbursed by LRSC for Various PurposesTable 10 - ADBN Interest Rate Structure and Rastra Bank Refinance Rates
in the Agricultural SectorTable 11 - ADB Summarized Balance Sheets at July 15Table 12 - ADB Summarized Actual and Forecast Profit and Loss Accounts
(Years Ended/Ending July 15)Table 13 - Relevant Ratios from Aden AccountsTable 14 - ADB Status of Loan (Cumulative by Type of Borrower)Table 15 - ADB Loan Delinquencies by Type and LengthTable 16 - ADB Loan Disbursement by Term and SectorTable 17 - ADB Loan Disbursement by PurposeTable 18 - Interest Rate Structure of Commercial BanksTable 19 - NRB - Annual Refinance to ADB and Land Reform Savings Corporation
1970/71 - 1972/73
Figure 1: Organization of ADBN in Kathmandu
ANNEX 7Page i
AGRICULTURAL CREDIT AND COOPERATIVES
SUMMARY AND CONCLUSIONS
i. Institutional credit for Agriculture in Nepal has a history ofonly ten years. Besides conventional banking and cooperative credit underthe Agricultural Development Bank of Nepal (ADBN), institutional credit,includes lending for agriculture under the Land Reform Program by (i) wardand village committees and the (ii) Land Reform Savings Corporation (LRSC) 1/.All these institutions supplied 21% of all agricultural credit, and reached18% of all farms in 1969/70. The rest was mainly provided by moneylenders,friends and relatives. Institutional agencies, however, provided financingfor 91% of farm purchases of fertilizers, improved seeds, and agriculturalchemicals and all the financing for heavy machinery purchase.
ii. The Agricultural Development Bank (ADBN) was established inOctober 1967, taking over the assets and liabilities of the Cooperative Bank,primarily to diversify lending. Under a broader mandate, ADBN's lending toindividuals quickly outstripped its lending to cooperatives, and since 1968/69,lending to cooperatives has comprised less than half of its loans, as shownbelow:
ADBN Annual Loans to: 67/68 68/69 69/70 70/71 71/72 72/73----------------- Rs million ------------------
Cooperatives 3.6 4.6 5.1 2.2 4.1 14.5Individuals and Others - 3.5 8.6 17.0 19.3 21.1Cooperatives as % of Total 100 57 37 12 18 41
However, with the implementation of the Cooperative Revitalization Program 2/in 1971/72, the share of credit to cooperatives has againi increased. Forty-five percent of all loans have been for agricultural production (shortterm loans), 34 percent for farm improvement (including agri-businesses)and irrigation, and 19 percent for marketing and agro-industries. Recoveryrates from 1967/68 - 1972/73 averaged about 85% of demand 3/.
iii. 1 Recognizing the importance of an alternative source of credit,other than the moneylender (who was often the landlord), the 1964 LandsAct initiated a system of agricultural credit which had the following com-ponents:
I
1/ LRSC was merged into ADBN in July 1973.
2/ Cooperatives run by ADBN appointed managers.
3/ Repayments and interest falling due during the year plus overdues fromprevious years.
ANNEX 7Page ii
(a) the "interception" of outstanding agricultural loans,assessment of usury practices and reduction of "excessive" 1/loan repayments;
(b) a compulsory savings scheme to mobilize resources fromthe agricultural sector for lending to small farmers andfinancing of storage, marketing and agro-industries.
iv. Except for some interest rate reduction in a few Hill areas, thesuccess of loan interception was dismal. Only 476,000 debtors requestedthe Land Reform office for debt determination. Of these, 68% did not tryto get their debts scaled down, reflecting the pressures from conventionalsources of credit.
v. Under the Compulsory Savings Scheme, landlords and tenants wererequired to deposit annually, a fixed portion of their farm produce as aloan to government. The deposit, in cash or kind, was made with the WardCommittee, 2/ and was assessed at roughly 7 percent of cereal crops and atabout 9 percent for cash crops (collected in cash except for jute and sugar-cane which were collected in kind). Repayment was to be made after fiveyears with 5% annual interest. In addition to collecting the savings, theWard Committee was responsible for the storage of the savings collected inkind, for the supply and recovery of short-term credit (for production orconsumption) charged at 10 percent. The lending record is shown below:
Loans Advanced by Ward 64/65 66/67 68/69 69/70 70/71 71/72 73/74and Village Committees -------------------- Rs million ---------------
In Cash 0.5 4.7 1.7 1.5 1.6 1.1 0.9In Kind (estimated value) 7.2 48.0 13.5 9.8 5.2 5.6 1.8Total Value 7.7 52.7 15.2 11.3 6.8 6.7 2.7
Information on repayment rate varies from 46% - 87% for ward and villagecommittees. 3/
vi. Despite teething troubles, especially related to the collectionof payments in kind (changed to total cash collections in 1968), drought in1967/68 and administrative cumbersomeness, Rs 121 million were collected from
1/ Generally those greater than 10% interest per annum.
2/ Each of the 3,800 village Panchayats is divided into 9 Wards. Each ofthe 33,300 Ward Committees has 3 members. A Ward has a population ofroughly 300.
3/ The actual rate will be known when the audit of the ward and villagecommittees (see below) are completed.
ANNEX 7Page iii
1964 to July 1969. Collection has been suspended since then and a programof consolidation and auditing was initiated for two reasons:
(a) The collected savings were thought to be generallysufficient to meet farmers' demand for commercial credit(under existing technology and supporting infrastructure).
(b) Streamlining of the administrative structure and acloser monitoring of the savings was required.
vii. LRSC was formed in 1967 to (i) provide wider use of savings(particularly for the centralized purchase of inputs through AIC and financingagro-industries) and (ii) increase lending to certain village committee whichare short of funds for input loans. Because of overlapping functions LSRCwas merged into ADBN in July 1973.
viii. Except for the continued expansion of guided cooperatives, HMG hasnot developed a definitive policy on the future roles of each of these sourcesof institutional credit and the reactivation of the compulsory savings scheme.Future demand for institutional credit will be multiples of the presentcapacity. The primary question is, how can the credit system be more respon-sive to the needs of the substantial segment of small farmers who are mar-ginally self-sufficient, but can be moved into a higher economic status withimproved technology and its associated credit needs?
ix. A credit survey by the Nepal Rastra Bank (NRB) showed that of thelending to "small" farmers (those with less than 4 bighas or 2.7 ha) in1969/70, only 15% were from institutional sources, and that 71% of this(or 11% of total "small" farmer credit) was from the ward and villagecommittees and none was from ADBN. The ward and village committees thereforedid have a useful role to play in assisting credit needs of small farmers.The record since then (para v) show that annual disbursements of loans bythe ward and village committees have declined drastically to a value of onlyR 2.7 million by 1972/73. ADBN's lending to guided cooperatives ("small"and "medium" sized farmers cultivating less than 6.7 ha) have increased toR 14 million (para ii) primarily through the absorption of successful villagecommittees.
x. ADBN's guided cooperatives program should indeed be supported.Changes 'in emphasis to further assist the small farmer are already underwaywith:
(a) reduction of security requirements to a pledge on thestanding crop;
(b) consideration is being given to restricting theeligibility for cooperative loans to farmers withless than 2.7 ha; and
ANNEX 7Page iv
(c) nine out of ten branch offices to be established by1977/78 will be located in the Hills.
Firm directives should also be given to ADBN branch offices to improve theirperformance on the volumes of loans and on the number of farmers reached(particularly in the less than 4 bigha category).
xi. The village committees should also continue to play a role in theprovision of institutional credit since about 90% of the country is yet tobe reached by guided cooperatives. Besides, village committees comprisethe future source of guided cooperatives. A minimum package program workingthrough the village committees and government agency representatives (seegeneral report) may be a feasible alternative to supply production inputs(a necessary complement to credit provision) more efficiently.
xii. Future constraints (financial and implementation) in the expansionof guided cooperatives and guided village committees will have to be tackled.ADBN should continue to operate on a self-financing basis. As it expandsto achieve the targeted 300 guided cooperatives and 150 guided villagecommittees in its first 10 years of operation, its already high administrativecosts (at 6.8% of the loan portfolio), due largely to its cooperative manage-ment activities, will be proportionately higher. Interest rate for productionloans increases to 12% or 14% (for short term loans) may therefore benecessary and should be considered. 1/ It will also enable ADBN to betterattract deposits from the rural sector, and compared to the present ratescharged by moneylenders (25-50%), should not defeat the purpose of institu-tional credit. Farmers are less concerned about marginal increments in therate of interest charged, than the adequacy, timeliness and ease of avail-ability of loans.
xiii. With AIA"n Tew.1- ,i-nt Bank assistance, ADBN is one of the mosteffective government agencies in Nepal. Before the Cooperative Revitaliza-tion Program, it tripled lending in three years and was able to make personneladjustments with little difficulty. The recent absorption of LRSC staff intoADBN, should further strengthen its capacity, especially at the central officeand main branch levels. An important gap will, however, exist at the guidedcooperative and guided village committee level where the supply of managers,JTAs and field supervisors is inadequate. We recommend the adoption of ascheme whereby (a) cooperative managers also assume responsibility forpreparation of farm plans and (b) ADBN district loan officers (with fewerJTAs) will act as farm plan auditors for a number of cooperatives and guidedvillage committees. This scheme would have the additional effect of con-serving JTA requirements for agricultural extension work.
xiv. The reactivation of the compulsory savings scheme depends on theresults of audits of the ward and village committees, which is 85% complete.
1/ The whole interest rate structure needs to be rationalized in termsof the opportunity cost for various uses.
ANNEX 7Page v
These audits can help resolve the following basic issues: (a) the extentto which village committees can be self-financing (e.g. what are the actualadministrative costs of the program); (b) the extent to which the pool ofdisbursed loanable funds (estimated at R 80 million) actually exists; (c) theabsorptive capacity of small farmer clientele; and (d) the need for LRSC,now merged with ADBN, to continue its assistance of village committees.
xv. A thorough analysis, of the audit and the assessment of theseissues will have to be undertaken (possibly by a working committee consist-ing of representatives from the planning commission; Ministries of Land Reform,Home and Panchayats Finance, or Agriculture; ADBN and NRB), before a decisionon the reactivation of the Compulsory Savings Scheme can be made. Considera-tion should also be given to the possibility of increasing interest ratespaid on compulsory savings, otherwise it would in effect be an agriculturaltax. ADBN should continue to at least use some of its former LRSC staff forthis activity since it is to its own interest that it strengthens these"potential guided cooperatives." The prospects for expanding assistance tothem with the Land Reform Department acting as "lending intermediaries" (sincethe latter has a very comprehensive staff network in non-ADBN areas), shouldbe actively pursued.
ANNEX 7Page 1
NEPAL
AGRICULTURAL SECTOR SURVEY
AGRICULTURAL CREDIT AND COOPERATIVES
I. OVERVIEW OF THE PRESENT AGRICULTURAL CREDIT SITUATION IN NEPAL
1. Since July 16, 1973, there has been just one official rural creditinstitution in Nepal--The Agricultural Development Bank of Nepal (ADBN).This single agency emerged from a consolidation of the "old" ADBN (the 1967successor to the Cooperative Bank) with the Land Reform Savings Corporation(LRSC) created in 1966. The Agricultural Development Bank will continue itsown basic lending program under which it made production credit availablethrough a growing network of multi-purpose cooperatives and direct loans toindividuals and institutions for major agricultural development purposes.It will assume the lending program of LRSC which also made loans direct toindividuals and institutions but made credit available at the local level 1/through a vast system of Ward and Village Committees under a program establishedby the Land Reform Program of 1964.
2. The merger of these two agencies brings under one head the variouslending programs that have been supplying about 75% of all institutionalcredit to agriculture. Commercial banks and small cooperative societiesaccount for the remaining 25%.
3. This merger was one of a number of actions recommended by the Agri-cultural Survey Board, a unit commissioned by the Nepal Rastra Bank (TheCentral Bank of Nepal) to survey agricultural credit in Nepal, interpret theresults and recommend improvements in the nation's rural credit structure,The Board's report was released officially in 1972 2/ and the results, whik iprovide a good overview of Nepal's credit situation are given below.
The Role of Institutional Credit
4. Institutional credit agencies play a minor role in supplying credit,21% 3/ of agricultural credit, reaching only 18% of all farmers in 1969/70(Table 1). Larger farmers benefited more from institutional credit, small
1/ Local level: The area of actual agricultural activities includingthe cooperative, Ward, Village level and the neighborhood of theindividual farmers themselves, to distinguish from the district,regional or central level.
2/ Agricultural Credit Survey, Nepal, Nepal Rastra Bank, 4 volumes, 1972.The results however apply to 1969/70.
3/ A 1972 study by the Department of Land Reform (see Zaman, Evaluationof Land Reform, Kathmandu, 1973) reported 22.4% of credit from samplehouseholds came from institutions.
ANNEX 7Page 2
farmers were supplied with only 9% of their credit needs by institutions,reaching 15% of small farmers. The Ward and Village Committees (created bythe Land Reform Program) were the most important source of institutional creditto the small farmer. Moneylenders and friends/relatives were the most effec-tive in extending credit to 46% and 33% of all small farmers.
5. Institutional agencies, nevertheless, provided 91% of the totalfinancing for fertilizer, agricultural chemicals and improved seeds, and allthe financing for heavy machinery purchase. Private sources accounted for77% of the financing for livestock purchases, 60% of other medium-term credit,86% of the credit for the purchase of land, 74% for the repayment of old debtsand slightly over 85% of the credit for consumption purposes (Table 2).
6. The average borrowing ranged from Rs 245 (30% gross farm income)for small households (less than 2.7 ha) to Rs 1,123 (32% of gross farm income)for large households. On a regional basis, average borrowing per farm householdwas Rs 383 in the Hills while it was Rs 504 in the Terai. On the other hand,the outstanding debt was higher in the Hills (Rs 938) than in the Terai(Rs 604). In the Hills, more than 90 percent of the total loan was obtainedfrom the village moneylenders, friends and relatives, while in the Terai 51percent of the loans were institutional. Interest rates were annual equiv-alents of 25 to 50 percent for private credit and 9 to 10 percent for institu-tional sources.
II. CREDIT INSTITUTIONS, COOPERATIVES AND THEIR PROGRAMS
Cooperative Credit Societies and Cooperative Banks
7. Institutional agricultural credit in Nepal started in 1953 withthe creation of the Department of Cooperatives, to form cooperative creditsocieties as a means of easing farmers' indebtedness to private moneylenders. Despite the Cooperative Societies Act in 1959. The movementremained insignificant during the early 1960's despite an amendment to andthe creation, in 1962, of the Cooperative Development Fund to finance theestablishment and operation of cooperatives, little progress was made. In1963 another act established the Cooperative Banks, thus providing thevehicle to extend credit to the few cooperatives then in existence. Re-gistered cooperative societies consequently mushroomed to 1,400 in the late1960's, but only a small fraction of them were actually functioning. Aftera slow start while the collection of loans was being improced, lending in1965/66 tripled that of the previous two years (Tables 3 and 4). In 1967the Cooperative Bank was transformed into the Agricultural Development Bankand lending to cooperatives reached Rs 5 million in 1970. However these
ANNEX 7Page 3
cooperative credit societies manage to reach only 3% of small farmers 1/ by1969/70 2/ and covered less than 1% of their credit needs.
The Land Reform Credit Program
8. The first effort on a major scale to develop an agricultural creditsystem for every section of the country grew out of the Lands Act in 1964which represented the core of the Land Reform Program. The credit andcooperatives component of the Program consisted of:
(a) the interception 3/ of certain outstanding agriculturalloans and focusing on assisting smaller farmers inproduction, marketing, consumption and small scaleagro-industries;
(b) a compulsory savings system; and
(c) an institutional credit program.
The Land Reform Program was carried out at the local level by Ward Committees 4/and at the district level by the Land Reform Office.
Loan Interception
9. The loan interception provisions were enacted to assist farmersimpossibly indebted to the local moneylender or a landlord. The steps involvedwere to (a) determine outstanding debts, (b) adjust for excessive debts byscaling down outstanding debts, (c) intercept the repayment of adjustedagricultural debts, and (d) release "qualified" land from further mortgage.
10. The outstanding debt was determined by the District Land Reform Officeof the Land Reform Ministry on the basis of debtors' and creditors' state-ments filed with the Land Reform Office. Upon request from a debtor, theLand Reform Office would review information submitted by him and his creditorsto determine if he was being, or had been charged, usurous rates of intereston loans outstanding. Such excessive charges (defined by the Land ReformOffice as over 10% per annum) would be applied to the unpaid principle of theloan thus adjusting (reducing) the outstanding balance. If excessive interest
1/ Farms with 4 bigha (2.7 ha) or less.
2/ See Table 1.
3/ Prevention of repayments lent at usurious rates.
4/ The Wards (about 9 in each village panchayat) were designated asminimum units for collecting compulsory savings. Each Ward Committeesconsists of three members.
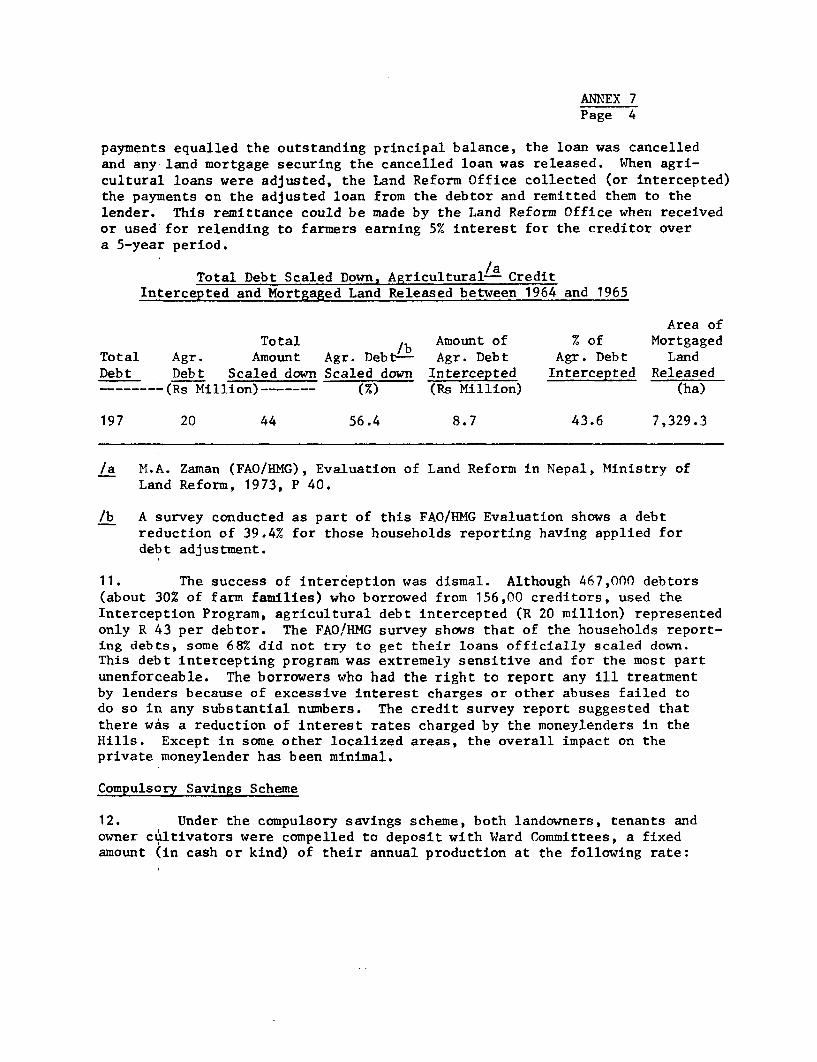
ANNEX 7Page 4
payments equalled the outstanding principal balance, the loan was cancelledand any land mortgage securing the cancelled loan was released. When agri-cultural loans were adjusted, the Land Reform Office collected (or intercepted)the payments on the adjusted loan from the debtor and remitted them to thelender. This remittance could be made by the Land Reform Office when receivedor used for relending to farmers earning 5% interest for the creditor overa 5-year period.
/aTotal Debt Scaled Down, Agricultural- Credit
Intercepted and Mortgaged Land Released between 1964 and 1965
Area ofTotal /b Amount of % of Mortgaged
Total Agr. Amount Agr. Debt- Agr. Debt Agr. Debt LandDebt Debt Scaled down Scaled down Intercepted Intercepted Released------ (Rs Million) …--- (x) (Rs Million) (ha)
197 20 44 56.4 8.7 43.6 7,329.3
/a M.A. Zaman (FAO/HMG), Evaluation of Land Reform in Nepal, Ministry ofLand Reform, 1973, P 40.
/b A survey conducted as part of this FAO/HMG Evaluation shows a debtreduction of 39.4% for those households reporting having applied fordebt adjustment.
11. The success of interception was dismal. Although 467,000 debtors(about 30% of farm families) who borrowed from 156,00 creditors, used theInterception Program, agricultural debt intercepted (R 20 million) representedonly R 43 per debtor. The FAO/HMG survey shows that of the households report-ing debts, some 68% did not try to get their loans officially scaled down.This debt intercepting program was extremely sensitive and for the most partunenforceable. The borrowers who had the right to report any ill treatmentby lenders because of excessive interest charges or other abuses failed todo so in any substantial numbers. The credit survey report suggested thatthere was a reduction of interest rates charged by the moneylenders in theHills. Except in some other localized areas, the overall impact on theprivate moneylender has been minimal.
Compulsory Savings Scheme
12. Under the compulsory savings scheme, both landowners, tenants andowner cultivators were compelled to deposit with Ward Committees, a fixedamount (in cash or kind) of their annual production at the following rate:
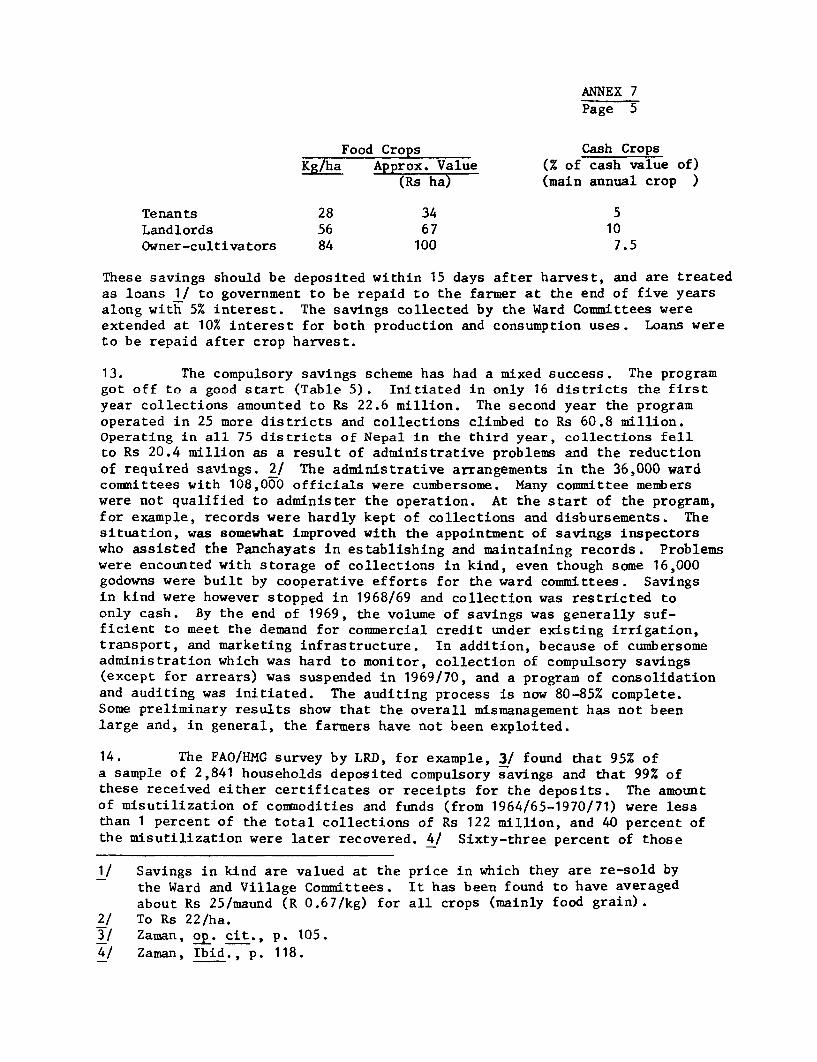
ANNEX 7Page 5
Food Crops Cash CropsKg/ha Approx. Value (X of cash value of)
(Rs ha) (main annual crop )
Tenants 28 34 5Landlords 56 67 10Owner-cultivators 84 100 7.5
These savings should be deposited within 15 days after harvest, and are treatedas loans 1/ to government to be repaid to the farmer at the end of five yearsalong with 5% interest. The savings collected by the Ward Committees wereextended at 10% interest for both production and consumption uses. Loans wereto be repaid after crop harvest.
13. The compulsory savings scheme has had a mixed success. The programgot off to a good start (Table 5). Initiated in only 16 districts the firstyear collections amounted to Rs 22.6 million. The second year the programoperated in 25 more districts and collections climbed to Rs 60.8 million.Operating in all 75 districts of Nepal in the third year, collections fellto Rs 20.4 million as a result of administrative problems and the reductionof required savings. 2/ The administrative arrangements in the 36,000 wardcommittees with 108,000 officials were cumbersome. Many committee memberswere not qualified to administer the operation. At the start of the program,for example, records were hardly kept of collections and disbursements. Thesituation, was somewhat improved with the appointment of savings inspectorswho assisted the Panchayats in establishing and maintaining records. Problemswere encounted with storage of collections in kind, even though some 16,000godowns were built by cooperative efforts for the ward committees. Savingsin kind were however stopped in 1968/69 and collection was restricted toonly cash. By the end of 1969, the volume of savings was generally suf-ficient to meet the demand for commercial credit under existing irrigation,transport, and marketing infrastructure. In addition, because of cumbersomeadministration which was hard to monitor, collection of compulsory savings(except for arrears) was suspended in 1969/70, and a program of consolidationand auditing was initiated. The auditing process is now 80-85% complete.Some preliminary results show that the overall mismanagement has not beenlarge and, in general, the farmers have not been exploited.
14. The FAO/HMG survey by LRD, for example, 3/ found that 95% ofa sample of 2,841 households deposited compulsory savings and that 99% ofthese received either certificates or receipts for the deposits. The amountof misutilization of commodities and funds (from 1964/65-1970/71) were lessthan 1 percent of the total collections of Rs 122 million, and 40 percent ofthe misutilization were later recovered. 4/ Sixty-three percent of those
1/ Savings in kind are valued at the price in which they are re-sold bythe Ward and Village Committees. It has been found to have averagedabout Rs 25/maund (R 0.67/kg) for all crops (mainly food grain).
2/ To Rs 22/ha.3/ Zaman, op. cit., p. 105.4/ Zaman, Ibid., p. 118.
ANNEX 7
interviewed in the FAO/HMG survey favored revival of the compulsory scheme andsaid that the scheme would "save" them from private moneylenders; Only 22.3%Zhowever, thought that the scheme was helpful in modernizing tIiir farms byenabling them to obtain production inputs through AMC. Those Who opposed therevival of the scheme mainly voiced misgivings about its management and thepersonal hardship of being required to contribute to a hew scheme. The NepalRastra Bank (NRS) Credit Survey 1/ found that ih 1969/70, 87 percent of3,021 respondents were satisfied with the scheme and the credit programresulting from it. The survey also found that 74 percent of the 266 committeesinterviewed felt that (a) the compulsory savings programi adfi its associatedcredit scheme reduced the importance of moneylenders; (b) tenants w'iir themost important beneficiaries since they had hitherto not had a source' ofinstitutional credit.
15. The compulsory savings scheme appears to have had a more favorabieimpact on the Hills where 86%0 of households interviewed favored the revivalof the scheme. The reduction of the dependence on moneyl'enders was alsd moreeffective in the Hills. This differential success among the regions is notvery surprising since the Hill area is largely the small farm area and itsrelative inaccessibility has meant a monopsony situation with respect to thesupply of credit to farmers by moneylenders.
Institutional Credit Programs Under Land Reform
16. Ward and Village Committees. The loan operations of the Land ReformProgram were first carried out at the Ward Committee level. In' 1969/70,Village Committees were set up to replace the cumbersome Ward Committees.These Village Committees consist of 11 members, on'e from each o'f the nineWards plus two additional at-large members (usually the chairman atnd- vicechairman of the village panchayat). Ward/Village Committees make' se'a'sonalloans to farmers in cash or in kind for both producti'on and consumpt-io'n at10% interest 2/. From 1964-65 and 1972-73, they advanced the equivalent ofR 166.4 million in loans throughout the country (Table 6). For 19604f65 -1970/71 the FAO/HMG study found that seventy' two percent £f lToans were- givenin the Terai (Table 7) where the Land Reform, Program- was- most acti've. Da'ta''on collection rate is somewhat conflicting with ranges' from 8,7% (Tab,le 6)'to 46% (Table 7). Despite the apparent concentfAti'6n o6f lending to thelarger farm region (Terai), the NRS Survey in 1970', however,_showed thatcredit from Ward/Village Committees, on an individual' rather than a lown'volume basis, accounted for over 70% of insti-tuti'onal c'reidlt or 1167% .of total
1/ Nepal Rastra Bank, Agricultural Credit Survey, 1972, Volume' IEI, p.. 351.
2/ The 5% margin between the borrowing cost (5Z)' and interest charged (10%)by the ward and village committees is broken dbwn, as' followsi - -1'12as service payment to the committee,. 1/2% for secretarial and sun-drysupport and 2%; to be deposited in a credit/emergency fund (mainly tooffset bad debts). The ward and vi-llage. coimmiittee aiidl,ts should revealthe extent of actual administrative and collection costs.. In theearly stages, collection costs must have been high, wi'th poor collectionrates (Tables 6 and 7). The ward and village committees have only
recently begun to repay the 5% interest on compulsory' savings in a fewdistricts.
ANNEX 7Page 7
credit (Table 1) to the small farmer (defined as one cultivating less than4 bigha or 2.7 ha).
17. In volume terms, the large farmers received 9.3% of their totalloans (while the small farmers received only 6.6% of theirs) from the Wardand Village Committees.
18. Land Reform Savings Corporation. Early in the operations of thecompulsory savings and credit programs at the Ward Committee level it becameapparent that some areas were collecting more than they could lend while otherscould lend more than they were collecting. In addition, much of the farmers'production inputs had to be imported. In order to give the program moreflexibility at the local level and achieve the centralization needed tofinance imports and agro-industries, the Land Reform Savings Corporation(LRSC) was established in 1966. The objectives of the LRSC were to:
(a) Coordinate and supervise the collection of savingscountrywide;
(b) Finance farmers' procurement of agricultural inputs;and
(c) Finance and invest in agro-trade and agro-industries.
19. To carry out the objectives of the LRSC it was first necessary toconvert to cash some of the compulsory savings that had been collected in kind.First, a committee was created to set Lhe price of the products received assavings. The disposal and management of the sales were the responsibilityof the District Land Reform Office (DLRO), which allocated appropriateamounts for use at the Ward and Village level and deposited any excess withthe LRSC. Cummulative deposits from 1966/67 - 1971/72 totalled Rs 42.8(Table 8). LRSC granted short-term loans to the Ward and Vil'lage Committeesto provide funds to the farmers for the procurement of fertilizers, seeds,small tools, pesticides, etc. The Ward and Village Committees subwittelapplications through the District Land Reform Office (DLRO) supported byrecommendation by the District Agricultural Officer and his Junior TechnicalAssistants. After the loans were approved, the DLRO issued coupons on theAgricultural Supply Corporation (ASC), the predecessor to the present 'i-cultural Marketing Corporation, to supply the required inputs to the respec-tive Ward and Village Committees for distribution among the borrowing farmers.The ASC cashed in the coupons with the LRSC upon delivery of the inputs tothe farmer. This was, in effect, a supervised loan program and, pending theestablishment of guided cooperatives in the wards and villages, will continueto be the primary source of credit to the farmers in many areas.
20. The LRSC also granted loans to individuals for agricultural develop-ment and production, for financing agro-trade and agro-industries includingrice mills, the procurement of tractors and pumpsets, poultry farming andwarehousing. LRSC also granted short-term loans direct to the institutions
ANNEX 7Page 8
serving agriculture such as ASC, FMC, and later AMC. Loans were granted tothis latter group mostly to procure agricultural inputs and foodstuffs (Table 9).
21. The recovery rate on loan disbursed (taken cumulatively from1966/67 - 1971/72) was only about 56%. Insufficient information was howevergiven to the mission to examine the recovery record by types of loan.
The Agricultural Development Bank of Nepal, ADBN
Introduction
22. The Agricultural Development Bank of Nepal, ADBN, was establishedon October 29, 1967, and took over the assets and liabilities of the Agri-cultural Cooperative Bank that had been operating since 1963. The new Bankhad wider lending authority and ten times the authorized capital of theCooperative Bank. The Cooperative Bank was authorized only to lend tocooperatives, but ADBN can loan directly to individuals.
23. ADBN is an autonomous and corporate body with an authorized capitalof Rs 50 million with HMG as majority shareholder. Its Board of Directorsconsists of a chairman-cum-general manager (appointed by HMG for four-years)and eleven members. One member is designated by each of the followinginstitutions: The Nepal Rastra Bank, the Nepal Bank, Ltd., the Rastra BanijyaBank (the latter two commercial banks) and Kishan Sangathan (farmers'organization). HMG names two members from among the shareholders of theBank, one from the cooperative societies, and four at large.
24. The ADBN is authorized by the Act to: 1/
(a) to provide short, medium and long term credit to individualfarmers, cooperatives, and corporate bodies engaged inagricultural development;
(b) to provide loans directly to farmers for the purchase offertilizers, insecticides, farm machinery, irrigation pumps,etc., required for agricultural production;
(c) to invest in small scale industries engaged in processingfarm products and manufacturing goods required in agriculture;and
(d) to provide banking facilities in those areas where commercialbanks are not established.
25. With the merger of the Land Reform Savings Corporation into ADBNin July 1973, an amendment to the Act authorized ADBN to carry out thefollowing former LRSC activities:
1/ Agricultural Development Bank Act.
ANNEX 7Page 9
(a) provide production and marketing loans through Ward andVillage Committees;
(b) be a depository for compulsory savings collected by HMGand make payment of interest on the amount deposited; and
(c) provide loans to the tillers for the purchase of land.
Lending Policies and Procedures
26. ADBN specifies standard terms and conditions for different types ofloans (Table 10), the most important being short-term cereal production loans(up to 18 months). They are almost all based on standard per hectare farmplans, worked out by the branch for the particular area and crop and approvedby the head office. Up to 50% of a farmer's expected crop proceeds (net ofrent), valued at the previous season's average prices, may be borrowed; theinterest rate is 10% per annum. The loan is repayable within 30 days ofharvest and is secured by the crop. Production loans are made, mostly inkind, by issuing vouchers against the Agricultural Marketing Corporation (orits authorized dealers) for inputs, such as seed, fertilizer, pesticide, andsmall farm tools and equipment. Cash loans are by installments againstpayment of such specified items, such as, irrigation charges and transplantingexpenses. Borrowers must be members of a recognized cooperative (usuallyADBN managed) and the loan is made through the cooperative, which is charged7% annual interest. The maximum loans are based on standard farm plans forcrop and area (not exceeding 6.7 ha).
27. ADBN, through cooperatives which it manages, will also advance upto 25% of the estimated value of the crop in the field, and will make thisup to 60% of the actual value of crop delivered, if producers wish to storethe crop at co-operative warehouses to sell later in the harvesting seasonat a higher price. These percentages are inclusive of, not in addition to,any production loan a borrower may have for the same crop. Security forthese marketing loans is the crop, plus a bond from the borrowing cooperativeand plus a farm mortgage for loans to individual farmers. Interest is 10%to the farmer, 7% to the cooperative; and repayment is within 120 days,extended to 180 days if justified. Loans are also made to approved dealersand ADBN-managed cooperatives for purchase and stocking of inputs, up to80% value, repayable within 30 days of input sale at an annual interest of10% for dealers, and 7% for cooperatives, secured by a lien on inputs pluscooperative bond or a dealer mortgage.
28. Another important category is bullock loans to cooperatives or tofarmers with at least 1.3 ha in the Terai (less in the Hills). Repaymentis over three years at 10% for individuals, 6% for cooperatives; securityis a cooperative bond or farm mortgage. Standard rates of interest for ADBNshort, medium and long term credit are shown in Table 10. These rates arefixed by NRB which allows higher rates for short term lending because ofthe higher cost per loan of recording and supervising the general smallershort term loans, and the greater risk they may entail.
ANNEX 7Page 10
29. ADBN allows a rebate of 0.5% for early repayment, by at least onemonth, of medium and long term instalments. Penalties are charged fordelinquent instalments; for short term loans, 2% per annum for the firstmonth; 3.5% for the next five months and 5% thereafter. For medium and longterm loans, 2% per annum for the first three months; 3.5% for three monthsand 5% thereafter.
30. For direct loans to individuals, prospective borrowers must purchaseone share of ADBN stock at Rs 100 for loans of Rs 2,001 to Rs 10,000, andanother share for each additional Rs 10,000. Cooperatives are required topurchase only one Rs 100/share in ADBN while cooperative members are requiredto pay Rs 50 for shares in their cooperative, before becoming eligible forloans.
Program Emphasis
31. It is the responsibility of ADBN to tailor its lending operationsto support HMG's agricultural development plans. The priorities for assistingproduction of cereals and cash crop 1/ are:
(a) Cereal
Loans for the purchase of agricultural inputs, laborexpenses, bullocks, tractors, pumpsets, tubewells andpower tillers will be available to farmers. ADBNbranches will make individual and cooperative loans.The cooperatives will provide credit, inputs, technicaland marketing services to small and medium farmers.In the Hills, focus will primarily be on food deficitareas and that have suitable agro-climatic conditions,relatively developed infrastructure and supporting services.Supporting programs for increasing cereals and cash cropproduction will include:
(i) Farm Mechanization and Irrigation to provide loansfor tractors and pumpsets to support cereal andcash crop production;
(ii) Marketing and Warehousing Program. Loans made tocooperatives for storage facilities and marketingactivities and to individuals for on-the-farm storage.
(b) Cash Crops
(i) Horticulture, Livestock Poultry and Fisheries. Loansprimarily to small farmers in Hills and Valley Districtswhere reasonable developed infrastructure and supportingservices are available.
1/ ADBN, Agricultural Development Program and Budget, 1973-74. Thesepriorities are not listed in order of importance.
ANNEX 7Page 11
(ii) Tea Estates. An ongoing program of medium to long-termfinancing of tea expansion and improvement in fareastern Nepal.
(iii) Cardamum and Ginger. Loans for cardamum in Ilam Districtand ginger in the Gandaki Project are being made on aselective basis in feasible areas. Mostly small andmedium farmers are being assisted under the program.
(c) Land Purchase by Tenant Farmers. This function previouslypart of the LRSC program will now be the responsibility ofthe ADBN. The Bank Act has been amended to authorize theADBN to provide this type of financing. There is no evidencethat it ever got really started under LRSC and it is likelyto be quite sometime before ADBN operates extensively in thisarea.
(d) Financing of Agriculture Graduates for Mechanized CustomService Unit. An experimental program that will provide creditto agricultural graduates to purchase and operate custommachinery services for land preparation, seeding, threshing,and transportation on contract basis at reasonable rates tobe fixed by the Bank. It is designed primarily to providesmall farmers the use of equipment that will enable them toimprove their farming operations. The services will be locatedat or near cooperatives.
(e) Supervised Credit through Area Project Approach. Continuationof a program launched in 1972/73. Farmers living in theproject area receive production and marketing credit throughtheir cooperatives tied with medium-term loans for dairy,poultry, piggery and small agro-processing plants made throughthe district offices of the ADBN.
(f) Cooperative Revitalization Program (detailed in para 48) consistsof the formation of guided cooperatives (those with managersappointed by ADBN) to serve as the primary source of creditto the small and medium-size 1/ farmers. One of the majoraims of this program is to upgrade Village Committees byconverting them to guided Village Committees with supervisorsappointed by ADBN and paid for under government subsidy untilthey become self-reliant.
Staff Organization and Training
32. ADBN has a central office and 44 district field offices. The organi-zation of the central office is shown in Chart I. District offices are
1/ Those with less than 10 bighas (6.7 ha).
ANN[X 7Page 12
designated as branch offices and sub-branch or agent offices under the branchoffices (see map 11050, General Report).
33. Until the Bank initiated the Cooperative Revitalization Program ithad no representative in residence below the district level. It is nowrepresented by bank-appointed managers or supervisors at the guided coopera-tive and guided Village Committee level (see para 46). In 1972/73, 40 (31%)of the existing 130 guided cooperatives and guided Village Committees werelocated in the Hills (of which 13 were in Kathmandu Valley) and 90 (69%) inthe Terai. Branch, sub-branch and agent office personnel are responsiblefor making loans, disbursement and collection of loan funds, checking andverification of operations and general program supervision. this is doneby visits to the cooperatives and to individual borrowers from the districtoffice level. ADBN is also expected to assist the LRD with the non-guidedWard and Village Committee credit programs (see para 16).
34. Prior to the merger with LRSC, the ADBN staff totaled 451, with 349stationed in the district offices. Planned requirements for the new combinedprogram for 1973/74 total 632 (475 to be located in the districts) with LRSCstaff accounting for most of this increase. 1/ During the 1973/74 fiscalyear, the Bank will b-e assuming responsibility for a nu'mber of the 434 VillageCommittees expected to come under the guided Village Committee program. Themanagers and supervisors for the guided programs are selected and trainedby the Bank, with the assistance of the Department of Cooperatives, but thepersonnel are not designated as Bank personnel. The -Bank 'currently pays about40 percent of their salaries with the other 60 percent .coming as ra,subsidyfrom HMG. The cooperatives and Village Committees are 'expected to developtheir financial capacity and assume full responsibility for ihese personnelcosts in five years.
35. Technical assistance has been successfully provided by the AsianDevelopment Bank in program development and training. ADBN has expandedits training program for its district -and central office staff to betterprepare them to handle the expanding *lending operations of the Bank.. Seminarsand refresher courses will be held for those already on the jdb and newpersonnel will be given pre-service training before assignment and on-the-jobtraining and supervision while on the job. Funds have ailso been provided forthe training of selected personnel in India for loan processing and projectappraisal.
Resources
36. ADBN is well supported by government financially, and throughrediscount faci-li-ties by NRB. Balance sheets and profit and loss accountsfor the last five years are shown in Tabl'es 11 and 12. An analysis of the1972/73 accounts shows that of assets totalling NR 82.3'M (US$7.8 !), theloan portfolio represented 70%, receivables 16% and other assets 14%. Thesewere financed by share capital and reserves (5'8%)., borrowing (27%), deposits
I/ ADBN appointed managers for guided cooperatives are not Included i-n
the above.
ANNEX 7Page 13
(6%) and other sources (9%). The Asian Development Bank has lent US$2.4million in 1970/71 and has just approved a loan of US$3 million. 1/ Anencouraging feature is the increase in deposits from NR 3.7 million in1968/69 to NR 5.8 million in 1972/73. ADBN is not required to paydividends and retains all surpluses. It is required to place a minimum20% of its net profit in a Reserve Fund.
37. ADBN usually covers its expenses but does not earn much on itsequity capital (Table 13). ADBN is subsidized to the extent that its capitalearns little return. The debt/equity ratio has been reasonable but willrise sharply with the takeover of the LRSC portfolio and the consequent extradebt financing under special low cost and guarantee arrangements withgovernment.
38. Administration cost is high (6.8% of loan portfolio in 1972/73),largely because of cooperative management costs, which ADBN bears. A morenormal percentage would be 3-3.5% (e.g. agricultural development banks inUttar Pradesh and Bihar).
Loan Performance
39. ADBN's first year was restricted to continuing loans to cooperatives(as was done by its predecessor, the Cooperative Bank). After an initialdecline in disbursements (Table 4), loans to cooperative credit societiesincreased to a maximum of Rs 5.1 million in 1969/70. After that, in 1970/71,loans to cooperatives were halved and loans to individuals more than doubled,from Rs 8.6 million to Rs 17.0 million. However, the Cooperative Revitali-zation Program, first implemented in 1971/72, brought an upswing in coop-erative loans to Rs 4.1 million in 1971/72 and a further tripling to Rs 144.8million in 1972/73. Loans to individuals in the meantime levelled off toan annual increase of only 14 percent, reaching Rs 21.2 million in 1972/73.Since small and medium-sized farmers are served by cooperatives, an initialtrend towards increasing share to large farmers (through individual loans)appears to have been reversed since 1970/71 (Table 4). With the assumptionof the LRSC lending program in 1973/74 (which included loans to Ward andVillage Committees), 2/ ADBN lending to and through cooperative societiesand Ward and Village Committees combined (tentatively estimated at Rs 107.7million) exceeds the direct lending to individuals.
1/ Comprising of lending for storage facilities (including cold storage),importation of tractors (for Terai) and power tillers (for the Hills).An additional US$140,000 will be spent on technical assistance toimprove ADBN's implementation capacity.
2/ ADBN lends to guided cooperatives and guided village committees.LRSC's production loans are primarily to individuals through "non-guided" Ward and Village committees.
ANNEX 7Page 14
40. The annual recovery rate on loans by ADBN improved from its firstyear's performance of 80.3 percent of demand 1/ to 88.9 percent in 1969/70when cooperative lending peaked (see Table 14w. Since then as loans to indi-viduals overshadowed cooperative lending and total loans disbursed nearlyquadrupled, the annual recovery rate has dropped to 79 percent. Cooperativestend to, be more delinquent with longer term loans (2 years or more) whileindividuals were particularly delinquent with the very short term loans ofless than 90 days (see Table 15). A large proportion of the present loandelinquency is due to carryovers from the Cooperative Bank and ADBN lendingprior to the Cooperatives Revitalization Program.
41. From 1969/70 to 1972/73, short-term loans increased the fastest(Table 16) as a result of the acceleration of agricultural production loans(Table 17). Long-term loans declined substantially since 1970/71 (Table 16)because lending for resettlement ceased and loans for tea expansion declined(Table 17). Medium-term loans gradually increased primarily because of farmmechanization loans (for importing tractors and pumpsets).
The Nepal Rastra Bank (NRB)
42. NRB controls credit under a general regulation of 1966 by:
(a) fixing rates of interest for particular purposes;
(b) providing rediscount facilities, up to certain limits,at rates related to development priorities;
(c) requiring banks to lend not more than prescribed propor-tions of amounts for various purposes (e.g. 60% for imports,or a "margin" of 40%).
43. Although ADBN lending rates (para 26 and Table 10) and commercialbank rates (Table 18) are approximately in line for comparable categories,such a wide variation in lending rates between 6.5% (for export bill credit)and 13% (for non-domestic hire purchase) needs to be rationalized. 2/
44. An important role of the NRB has been to greatly increase thefinancial support to ADBN and LRSC. As of July 15, 1973, NRB had paid upequity shares totaling Rs 5 million in the ADBN for refinancing (doublethat the previous year). NRB's annual refinancing of ADBN more than tripledfrom RsI3 million in 1970/71 to Rs 10.4 million in 1972/73 (Table 18),
1/ Demand: repayments and interest falling due during the year, plusoverdues (and interest from previous years).
2/ For example, in short term credit to individuals, it is not clearwhy there should be a 1-1/2% interest rate differential between creditto farmers compared with credit to dealers for fertilizers, pesticidesand seeds.
ANNEX 7Page 15
resulting primarily from increases for production loans, irrigation and teainvestments. NRB refinanced food marketing loans through 1971/72 andwarehouse construction in 1972/73 through LRSC (Table 18). NRB rediscountrates are given in Table 10. An Agricultural Credit Survey, undertaken bya specially created Survey Board, was started in 1969 and took three yearsto complete. Recommendations were made by the Board throughout this periodand many were implemented before the survey report was published in 1972.Ninety different recommendations were made for improving the agriculturalcredit system in Nepal. Thirteen of these dealt with the role of the NepalRastra Bank in the new system.
45. One of the first recommendations to be implemented was the settingup of an Agricultural Credit Department (ACD) in the Rastra Bank. ThisDepartment makes recommendations to the Rastra Bank and HMG regarding agri-cultural credit policies and allocation of resources for agricultural creditand in general helps coordinate agricultural credit policies with other agenciesand institutions of the Government. Both the Director and Deputy Directorof this Department are experienced agricultural credit specialists. ACDappears to have considerable influence on the shape of the emerging new system,one objective being to increase the importance of institutional credit inagriculture.
Commercial Banks
46. There are two commercial banks in Nepal. The Nepal Bank Limited isthe larger (with 62 branches), and the Rastriya Vanijya Bank has 35 branches.HMG provides financial assistance to these Banks through (i) compensationfor any loss incurred by branches established under the Compensatory FinanceScheme, and (ii) interest free loans to new branches opened under theDevelopment Banking Scheme. These two schemes are aimed at encouraging com-mercial banks to open branches in some of the more isolated agriculturaland less profitable areas. They have resulted in the creation of a bankingnetwork covering most of the nation. The number of branches increasedfrom 82 in FY 1971/72 to 97 by the end of FY 1972/73. 1/
47. The Rastra Credit Survey conducted interviews 2/ with 32 branches ofthe commercial banks. Twenty-nine branches were found to have extended loansagainst agricultural products during the year of the survey and 23 branchesextended credit against gold and silver for agricultural purposes. Of 1,544commercial bank borrowers reported to have received "agricultural credit" 3/
1/ Nepal Rastra Bank Quarterly Report, Mid April, 1973.
2/ Nepal Rastra Bank, Agricultural Credit Survey, 1972, Vol. II, pp. 512-515.
3/ In practice, borrowers lending on gold/silver as security haveflexibility in the use of their borrowed funds.
ANNEX 7Page 16
56 percent were traders, 31 percent mill-owners and 13 percent were "indi-viduals" (mainly commercial farmers in the Terai). The only beneficiaries ofcommercial bank loans in the Hills were traders. Commercial banks made noimpact on small farmers in 1970. Commercial banks indicated 1/ that theywould open branches (and supply credit) in areas where present agriculturalcredit institutions are absent, only if subsidized to do so. 2/ The CreditSurvey Board suggested that commercial banks should lend to marketinginstitutions for warehouse construction and that they should grant loans tofarmers against the warehouse receipts. These recommendations have notbeen implemented.
Cooperatives
48. Because of the limited success with cooperatives in the past, dueprimarily to poor management, HMG started the Cooperative RevitalizationProgram in 1971. The primary objective of the program was to implement asystem that will provide credit, technical assistance, agricultural inputs,and marketing and storage facilities for the farmers under good management.To provide good management, ADBN started to form guided cooperatives andguided Village Committees by assigning managers and Field Supervisors (orAssistant Field Supervisors) to actively work with selected Village Com-mittees. ADBN and HMG are subsidizing the salaries of the Managers and FieldSupervisors.
49. The program, limited to the 28 districts of the Intensive Agri-cultural Development Program (Map 11050, General Report), grew from aninitial 130 guided cooperatives to 147 by 1972/73. A Cooperative RevitalizationSection in ADBN's central office operates the program under the directionof the General Manager.
50. Guided Cooperatives have the following functions: 3/
(a) To provide timely loans to members for seed, fertilizer,pesticides, bullocks, small agricultural implements andhired labor costs;
(b) To sell agricultural inputs as above;
(c) To make necessary arrangement for marketing of agriculturalproduce of members; and
(d) If appropriate, to operate a small consumer goods store.
1/ Mission interviews with the general manager.
2/ In these areas they would act as agents for ADBN.
3/ Agricultural Development Bank, Cooperative Manual, June, 1973.

ANNEX 7Page 17
51. Technical and other support to be provided guided cooperativesincludes:
(a) the assignment of a JTA to each cooperative society tohelp prepare farm plans for farmer members and to providetechnical guidance at the farm level;
(b) the Agricultural Marketing Corporation will provide theagricultural inputs to its members and at the same timehave an income from commissions on sales; and
(c) financial support from the Government for warehouseconstruction.
The Department of Cooperatives (Ministry of Land Reform), handles theinspection and auditing services for the cooperatives and in collaborationwith ADBN and conducts training programs for cooperative personnel and membersof the advisory committees. Cooperative Advisors/Auditors are stationedat the district level and provide direct supervision to the cooperatives intheir area.
52. The Ministry of Land Reform has a training center in Kathmandu andholds regular training courses for new cooperative personnel includingmanagers, auditors and supervisors, and gives refresher courses as well.There is generally close coordination between Cooperative Department personneland ADBN at the central and district level.
53. Each guided cooperative has a nine-member advisory committee selectedby the society members. The advisory committee meets at least once a monthto review the program and progress of the cooperative society. The Committeeadvises the manager, assists in formulation of programs and budgets, assessesthe credit requirements of cooperative members, and recommends loans.
54. Lending terms and policies for guided cooperatives are covered inparas 26 - 28. Cooperative loan procedures start with the JTA helping thecooperative member prepare an individual farm plan. The plan is supposed todetail his farming operations including plans for using improved practices,his income and expense, and repayment ability. The applicant complCes .-Iloan application form (equivalent to a promissory note) and provides thedocumentation required to show right of possession of the property beingfarmed. If the Cooperative Manager considers the application complete andthe loan sound, he presents it to the cooperative advisory committee forreview. All such applications passed by the advisory coimmittee are summarizedas to amount and purpose and forwarded to the appropriate District Officeof ABDN. The Loan Officer of the Bank will review the summnary informationsubmitted by the cooperative and make field checks on the farm of at least10 percent of the applicants listed to make a detailed analysis of theinformation submitted. If the loan officer is satisfied with his spotcheck, he approves the loan in total to the cooperative either in cash or
ANNEX 7Page 18
in kind, as appropriate. For production inputs, ABDN will issue couponsto the cooperative for delivery to the borrowing member who exchanges thecoupons for the approved inputs from AMC, a Cooperative Union or AMC dealers.In some instances, disbursement will be on the installment plan with thesecondiand subsequent releases, if any, being contingent upon fulfillingobligations up to that point.
55. The success of the Cooperative Revitalization Scheme is evidentfrom the reversal of the declining trend of cooperatives' share of totalloans (vis-a-vis private loans) disbursed annually by ADBN (Table 4). Theprogram also enabled cooperatives to achieve a better repayment record thanthat of individual loans (Table 14). 1/ Some cooperatives started with lowmembership, but substantially increased their membership in the second yearas shown below.
First and Second Years' Operations of 68 Guided Cooperatives-
FY 1971/72 FY 1972/73
Number of members 13,388 17,651Total Volume of Business Rs 17,476,564 Rs 33,304,438Net Profit Rs 451,590 Rs 1,019,179Profit as % of Volume 2.5% 3.1%Business per Member Rs 1,300 Rs 1,900
/a 130 cooperatives were in the program by the end of 1971/72and 147 by the end of 1972/73.
Source: Agricultural Development Bank, September 1973.
56. The amount of business done through the cooperatives also increasedsubstantially during the second year of operations as shown above. Profitper unit volume increased from 2.5% to 3.1% and individual loan volumeincreased by 46%.
57. A number of factors favor the success of the guided cooperativesystem. The managers assigned to the cooperatives are college graduates(although not necessarily from agricultural colleges). Many have some practicalcooperative experience. As a group they appear to be eager, dedicated andaccepted in the neighborhood where assigned. The cooperatives are givenpriority by AMC in procuring the appropriate agricultural inputs and a2 percent commission advantage over other dealers. The conventional coop-erative Board of Directors has been replaced by an Advisory Board to themanager. The manager and the ADBN staff set cooperative policy (within thelegal authority of the Cooperative Act). This reduces the opportunity for abig farmer (or political) take over of cooperative policies and operations,one of the criticisms of earlier cooperative programs.
1/ All but eight of the 130 guided cooperatives increased their grossbusiness (many as much as 300-400%) by the second year of operations.
ANNEX 7Page 19
Coordination Among Government Agencies
58. The success of credit provision and the cooperative system dependson its coordination with other government agencies or departments. Theextension service provides specific technical assistance through assignmentof JTAs to prepare farm plans (para 53). AMC delivers inputs to cooperativesthrough its branch offices or through agents and is supposed to assist inmarketing. Specialized agencies like the Jute Board provide both productionand marketing services. Weaknesses in any of these vital links will affectthe effectiveness of ADBN's role in making guided cooperatives effective.
59. One particular weakness is the cumbersome method by which inputand credit requirements are assessed for production loans which results inuntimely and often insufficient arrivals of inputs.
60. The source of production loans for a cooperative member is ADBN(through his cooperative), while individuals apply directly or throughhis village committee to LRSC. In either case, a prerequisite is thecertification of a farm plan by a JTA which is basically an estimation ofhis input requirements. At the guided cooperatives level, this certificationin practice 1/ comprises of the farmer telling the JTA how much land heintends to plant under a particular crop; the JTA automatically calculateshis input requirements by referring to a table of recommended fertilizerrates. For individual loans directly or through village committees, sinceon the average, a JTA covers about 2 - 5 villages (each with an averageof 2,000 farm households), the frequent practice is for the District LandReform Officer (or sometimes other cooperatives' officials) to fill thefarm plans for the JTAs to sign.
61. After the farm plan is certified by the JTAs, the assessmentsof requirements 2/ are passed through the offices of the District Agricul-tural Development Officer (DADO), District Land Reform Officer (DLRO), ADBNBranch (or LRSC representative) for review before submitting to the AMCsales office. Such a protracted process involving 5 government agenciesoften results in requirements arriving late to the AMC office and theconsequent delay in delivery. 3/ This process is also of little use sinceAMC usually adjusts the estimates downwards4/ in order not to be stranded withleftover stocks.
1/ C. Y. Lee, Marketing of Fertilizers in Nepal.
2/ Depending on whether the application is through the cooperatives orvillage committees (individual loans).
3/ Other constraints facing AMC shortages of supply due to slow handlingof imports in Calcutta; difficulties of internal support; lack ofstorage facilities; (limited branches and staff) are also responsiblefor untimely delivery.
4/ In numerous cases, AMC dealers overadjust, causing shortages atdelivery time.
ANNEX 7Page 20
62. We suggest that AMC or its dealers should participate in the processof assessing input requirements with either the JTAs or ADBN loan supervisorsat the guided cooperatives or village committee level. A revision of thefarm plan format should be made by ADBN in consultation with AMC and theDepartments of Agriculture and Land Reform. With both AMC (through itsdealers 1/ or branches) and ADBN (through its JTAs or loan supervisors)simultaneously agreeing on the input requirements, loan processing andorders for inputs can proceed immediately. Priority deliveries for farmerswho deposit a token amount (say 10% of value) for their inputs at least oneseason ahead would ensure less shortfall of requirements.
III. PLANS AND PROSPECTS
Credit Requirements and Issues for the Future
63. Estimates of credit requirements for the decade ending in 1981/82have been worked out by the Nepal Rastra Bank survey. The cumulative grossdisbursement of medium-and long-term loans in the next 10 years stands inthe neighborhood of Rs 770 million. Of this, not more than 25 percent isexpected to be recovered within that period and outstanding loans wouldamount to about Rs 580 million by the end of 1981/82. With regard to short-term credit, by the fiscal year 1981/82, the lending institutions will haveto disburse annually Rs 350 millicn. Such a high credit need is probablyunrealistic. It assumes that all farmers to whom institutional credit ismade available will apply for the optimum amount of credit required to maximizeproduction. It assumes further that improved technology will be employed on33 percent of the total cropped area by 1981/82. Irrespective of the precisefigure, it will undoubtedly be multiples of the present (1971/72) annualinstitutional credit disbursement of Rs 67.5 million 2/.
64. The relevant questions are:
(a) how can the institutions increase their lendingactivities to keep up with potential needs (bothin value and beneficiaries)?
(b) what should be HMG's strategy regarding the futureroles and emphases of ADBN and the Land ReformProgram in the provision of institutional credit?
65. As a greater proportion of the more accessible (and larger) farmer'sneeds are supplied, larger proportions of demand for credit will come from
1/ In numerous cases, AMC dealers overadjust, causing shortages atdelivery time.
-2/ Comprising of Rs 6.5 M from village committees, Rs 37.4 M from LRSC andRs 23.4 M from ADBN.
ANNEX 7Page 2
sources which will be more difficult to service, but which cannot be ignored.A substantial segment of the smaller farmers who are marginally self-sufficient,can be moved into a higher economic status with improved technology and itsaccompanying credit needs. At present they are mainly dependant on informalsources of credit (particularly moneylenders) at exhorbitant interest rates.The extent to which present institutional lending agencies can reach thesefarmers, and the needs to modify present lending policies are important.
66. This section focusses on these questions and attempts to draw onlessons of the past in making a realistic assessment of the future rolesof these credit agencies.
Fourth Five-Year Plan Targets and Achievements for Agricultural Credit
67. Despite rather ambitious targets, ADBN managed to exceed its firstthree years' loan targets, set under the Fourth Five Year Plan, as shownbelow. The inability of LRSC to achieve its target, mainly reflects overlyoptimistic assessments of lending possibilities.
Cumulative70/71 71/72 72/73 70/71-72/73 73/74 74/75
… ---------(Rs Million) ------------------
ADBN
Targets 12.5 20.0 30.0 62.5 45.0 65.0Achievements 19.2 23.4 35.9 78.5
LRSC
Targets 34.4 46.4 58.2 139.0 73.1 90.5Achievements 20.6 37.4 40.0 98.0
/a Estimate.
68. ADBN also exceeded its targets for accumulation of funds. By 1972/73,ADBN was targeted to receive Rs 64,000 M from different sources (as shown below)and achieved Rs 123,400 M.
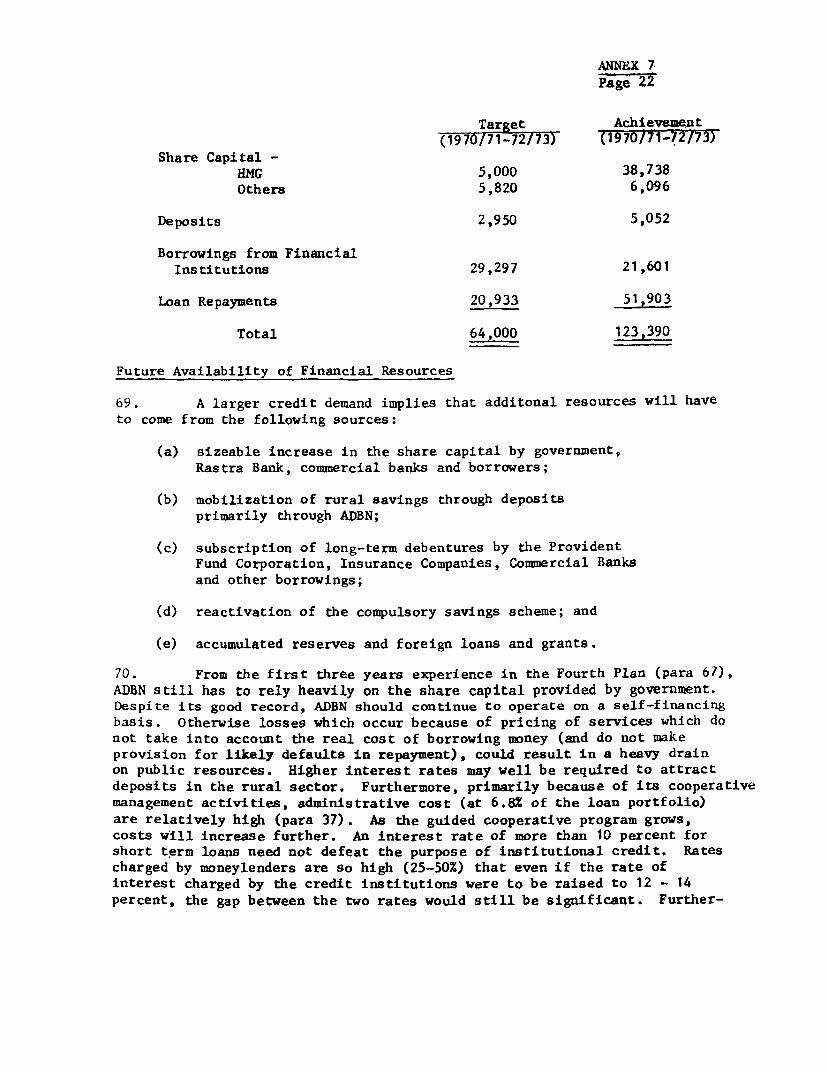
ANNEX 7Page 22
Target Achievement(1970/71-72/73) (1970/71-72/73)
Share Capital -HMG 5,000 38,738Others 5,820 6,096
Deposits 2,950 5,052
Borrowings from FinancialInstitutions 29,297 21,601
Loan Repayments 20,933 51,903
Total 64?000 123,390
Future Availability of Financial Resources
69. A larger credit demand implies that additonal resources will haveto come from the following sources:
(a) sizeable increase in the share capital by government,Rastra Bank, commercial banks and borrowers;
(b) mobilization of rural savings through depositsprimarily through ADBN;
(c) subscription of long-term debentures by the ProvidentFund Corporation, Insurance Companies, Commercial Banksand other borrowings;
(d) reactivation of the compulsory savings scheme; and
(e) accumulated reserves and foreign loans and grants.
70. From the first three years experience in the Fourth Plan (para 67),ADBN still has to rely heavily on the share capital provided by government.Despite its good record, ADBN should continue to operate on a self-financingbasis. Otherwise losses which occur because of pricing of services which donot take into account the real cost of borrowing money (and do not makeprovision for likely defaults in repayment), could result in a heavy drainon public resources. Higher interest rates may well be required to attractdeposits in the rural sector. Furthermore, primarily because of its cooperativemanagement activities, administrative cost (at 6.8% of the loan portfolio)are relatively high (para 37). As the guided cooperative program grows,costs will increase further. An interest rate of more than 10 percent forshort term loans need not defeat the purpose of institutional credit. Ratescharged by moneylenders are so high (25-50%) that even if the rate ofinterest charged by the credit institutions were to be raised to 12 - 14percent, the gap between the two rates would still be significant. Further-
ANNEX 7Page 23
more, farmers are less concerned with the rate of interest charged than withthe adequacy, timeliness and easy availability of the short-term loans.
71. Whether the compulsory savings scheme should be reactivated as asource of credit funds, depends primarily on the results of the audit of wardand village committees presently being completed by the Department of LandReform (para 13). One of the primary reasons for the suspension of compulsorysavings was that the volume collected was considered generally sufficientto meet the demand for commercial credit under existing levels of technologyand infrastructure support (para 13). If the audit verifies this, it impliesthat the absorptive capacity of credit by farmers is in fact the realconstraint and efforts to improve their absorptive capacity should be theprimary focus. If the collection of compulsory savings were self-financing(which is unlikely), the pool of loanable funds, estimated to be aboutRs 80 M 1/ at the end of 1971/72, equal to ADBN's cumulative loan recordfrom 1970/71 - 1972/73), may indeed be sufficient for lending to farmers 2/.The audit should reveal how much is in fact available for future lending.
Role of Village Committees
72. The village committees should continue their roles as institutionallenders to farmers. They have been the only institutions which have madesignificant progress in reaching the small farmer (para 16) and they arethe "raw materials" of future guided cooperatives. The village committeeaudits should enable a thorough assessment of the present situation ofrepayments, actual administrative costs and the necessary ingredients tomake lending through village committees more successful 3/.
Future Emphases of ADBN
73. ADBN intends to expand its Cooperative Revitalization Program toultimately encompass 500 to 600 cooperatives, serving the whole of Nepal.The target for the first ten years (ending 1981) is about 300 cooperativesand 150 guided village committees operating in all major producing areas. Thepresent number of guided village committees would be reduced by consolidationand transformation into cooperatives. The rate of expansion of this programwill be dependant on (a) the acceptance by the farmers; (b) the rate at whichfuture village committees can be readied for conversion to guided coopera-tives; (c) the implementation capacity of ADBN.
1/ Total savings (both cash and kind) collected cumulatively valuedat Rs 123.55 M by 1972 and total amounts deposited into LRSC inthe same period were Rs 42.82 M (see Tables 5 and 8).
2/ Only Rs 4.2 million have so far been repayed in the form of interest.This amDunt and remaining repayments will have to be deducted from it.
3/ An improved system of assisting village committees through the LandReform Department is given in para 80.
ANNEX 7Page 24
74. The acceptance by farmers is evident by the success of the guidedcooperatives themselves. A sample of 68 cooperatives (para 53) showed anincrease of 32% in membership in its second year. The rate at which futurevillage' committees can be converted to either guided village committees orcooperatives will undoubtedly be slower since the most progressive groupshave already been converted.
75. ADBN is one of the most effective government agencies in Nepal.Before the Revitalization Program, its training program and timely staffexpansion enabled ADBN to handle a tripling of lending in three years.About 100 of its staff have overseas training in credit, including cooper-ative credit. With the merger, 201 employees (reasonably experienced inagricultural credit), were transferred from LRSC to ADBN. Since the opera-tions of the two agencies were different and agency loyalties tend to persist,the adjustment process is proceeding, albeit with some teething problems.The merger of LRSC into ADBN undoubtedly implies a potentially poorer per-formance with LRSC's poorer repayment record of about 56% (from 1966/67 -1971/72) compared with ADBN's recovery rate of 84%; and its inability tomeet past targets (para 67).
76. No particular difficulty is expected in filling additional staffpositions at the central and district level as ADBN has traditionally beena preferred employer. The critical area is at the guided cooperative andguided village committee level where both managers, JTAs and Field Supervisorsmust be provided. To date ADBN has been able to recruit and train, with theDepartment of Cooperative's assistance, the required number of qualifiedcooperative managers. Assistance is however required to increase the capacityof the Training Institute run by the Department of Cooperatives in the Minis-try of Land Reform. Managers and Field Supervisors are not consideredcareer ADBN employees, but their attachment to ADBN and the comparativelygood salary has been enough to attract good people for these assignments.Junior Technical Assistants (JTAs) are assigned to the guided cooperativeand guided village committees by the Extension Service but remain on theExtension staff (receiving comparatively lower salaries). It is thereforequite surprising that the JTAs have in general provided a useful input inthese operations. The assignment of enough JTAs to meet the needs of theexpanding ADBN program at the cooperative and village committee level willhowever place an even 'greater burden on the Extension Service in carryingout its own program 1/.
78. A modification of the existing system to better use ADBN's personnelis required. Since the ultimate success of the credit program depends on howwell it is administered, supervised and able to reduce loan processing time to
1/ The Extension Service presently has 692 JTAs on its staff. With 192guided cooperatives and 434 Village Committees in the credit system,626 JTAs would be needed to assign one to each guided cooperativeand Village Committee.
ANNEX 7Page 25
an acceptable level, adequate contact must be maintained between the districtand local levels. This is important not only for the staff working directlywith the guided cooperative and guided Village Committees, but also for contactsbetween the District Office and individual borrowers in the case of directloans. During the lending season, district loan officers face the difficultrequirement of spot-visits to at least 10% of cooperative-loan applicantsand all individual-loan applicants. Consideration should be given toincreasing the number of assistant loan officers or loan supervisors in theDistrict Office and assigning them to sub-districts, the size dependingon the extent of guided cooperatives and guided village committees and thetransportation problems involved. They would work with the cooperativemanager and village committee supervisors during the period of loanapplication and perform the functions now performed by the district loanofficer in spot-checking cooperative loan applications or servicing directindividual loans. They would report back to the District Office periodicallyand thus provide the link between the the District Office and the field.Loan officers will then have a primarily supervisory function both forfinancial as well as from plan auditing. The loan officer should be givenloan approval authority 1/ at the cooperative and village committee levelwhich would help speed up loan processing operations considerably.
79. Managers and field supervisors of cooperatives and village committeesshould be given training in JTA responsibilities 2/ so that in the absence ofJTAs (or in rush periods), they would be qualified to complete the farmers'farm plans and loan applications. 3/ The local loan supervisors would beavailable, on a scheduled basis, to assist in preparing loan applications,and follow-up loan supervisions. It is not suggested that Extension JTAsno longer be used in the ADBN Credit Program but that they should only beattached to the larger cooperatives with large lending programs. Periodicconsultation between District Agricultural officers and ADBN Branch Managerson where JTA needs are greatest should be initiated. For the smaller units,a JTA can then be assigned to several cooperatives or village committees
1/ At a minimum the area loan office should be authorized to approveproduction loans made through the cooperatives to their members.
2/ This would probably entail an extra month or two in the trainingprogram.
3/ With efforts to simplify the present farm plan (para 62), the jobshould be easier.
ANNEX 7Page 26
within his geographic area of responsibility. Fewer JTAs would be required 1/since ADBN personnel would be qualified to complement the JTAs assigned tothe cooperatives and village committees.
80. An added complication in the merger of LRSC and ADBN is the formerLRSC activity of lending to the district land reform offices and the Ward/Village Committees for production loans to farmers. The Bank Act has beenamended to authorize ADBN lending to Ward/Village Committees, but there aresome 3,000 of them located throughout the country, mostly in areas whereADBN branches are not yet established. ADBN is understandably apprehensivesince this new mandate is pushing ADBN into a more unconventional bankingactivity. It is however an activity which needs to be supported 2/. Thisactivity can still be partially handled by the absorbed LRSC staff. Moreefforts 'should be made to use the land reform departments as "loan processingintermediaries" since they have the staff 3/ at the local level in thedistricts where ADBN activities are minimal.
81. ADBN is changing its emphasis to assist the small farmer with:
(a) the reduction of security requirement to just a pledge onthe standing crop;
(b) the expansion program in guided cooperatives (para 68) 4/
(c) expanding 90% of its branches from 1973/74 - 1977/78 intothe Hills 5/.
These moves, although creditable, will still not have the impact on smallfarmers that can be gained by the continued support of the former LRSC'sactivities in lending to the Ward/Village Committees through the Land ReformDepartment.
1/ As ADBN staff develops the capacity to provide technical assistance inloan making and servicing, the number of JTAs required from the ExtensionService could be reduced. It is suggested that only about 150 JTAs withsome training in credit as well as extension work be assigned to workwith ADBN at the cooperatives and village committees.
2/ Unless the Ward/Village Committee audits (para 13) show that they canbe completely self-financing.
3/ Their non-gazetted second class officers (JTA level) number 1,900(compared with 692 JTAs in the extension serzvice).
4/ Beneficiaries of guided cooperatives lending also includes medium sized-farmers (i.e. those with less than 6.7 ha). However,, "active considera-tion" is being given to restrict the beneficiaries- to farmers with. less-than 2.7 ha.
5/ However, only 10 new branches are expected to be opened during thisperiod.
ANNEX 7Page 27
Program Emphasis Summary
82. The Program emphasis for Agricultural Credit in Nepal may besummarized as:
(a) continuation of ADBN's conventional lending to individualsand organizations for agricultural production, agri-business,marketing and agro-industries (para 31);
(b) expansion of the guided cooperative program with greateremphasis on (i) reaching the small farmers (both in theTerai and Hills) and (ii) more efficient use of districtstaff (loan officers, loan supervisors, cooperative managersand JTAs);
(c) a thorough analysis (possibly through a joint workingcommittee 1/) of the Ward/Village Committee audits (in 23districts) to evaluate the need of reaciivating the com-pulsory savings scheme and how village committee lending canbe improved; and
(d) support of former LRSC-type lending to village committees(para 80) should be given by ADBN, using the Land ReformDepartment as a "lending intermediary".
1/ Consisting of the representatives from the National Planning Commission;Ministries of Land Reform, Finance, Agriculture, and Home and Panchayats;ADBN; and Nepal Rastra Bank.
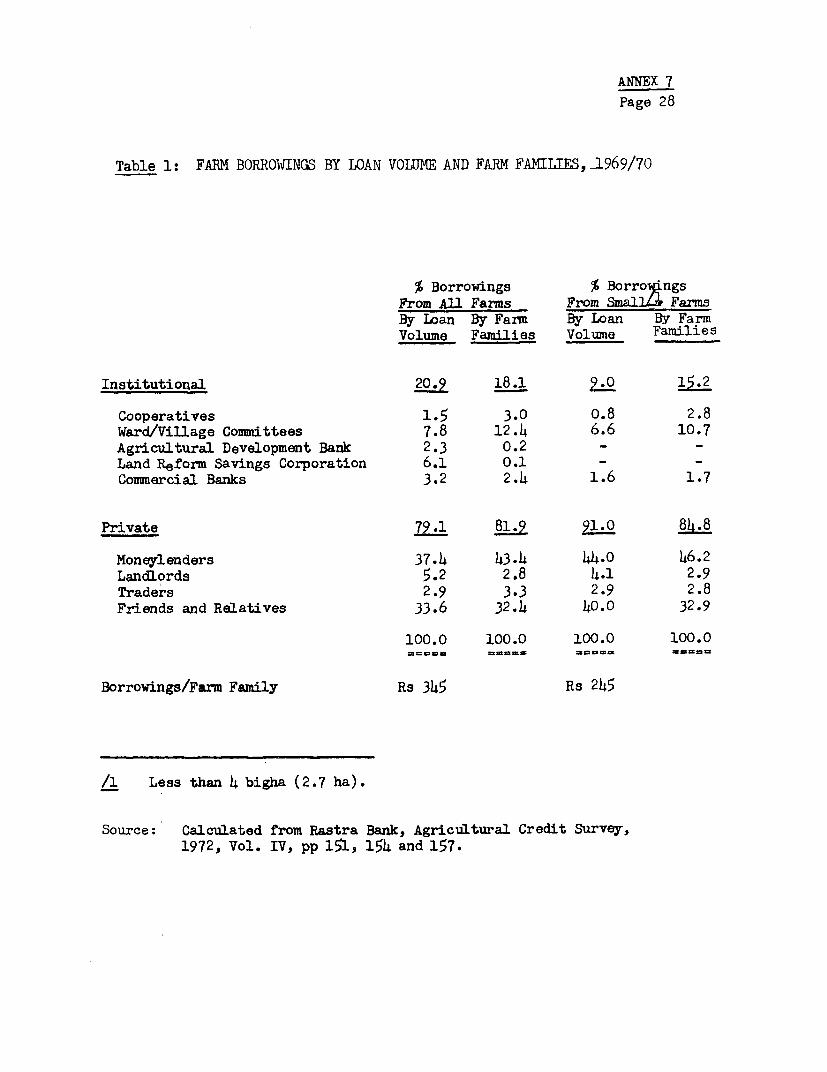
ANNEX 7Page 28
Table 1: FARM BORROWINGS BY LOAN VOLIME AND FARM FAmLES, 1%969/70
% Borrowings % Borro 'ngsFrom All Farms From SmallLa FarmsBy Loan By Farm By Loan By FarmVolume Families Volume Families
Institutional 20. 18.1 2:0 15.2
Cooperatives 1.5 3.0 0.8 2.8Ward/Village Committees 7.8 12.4 6.6 10.7Agricultural Development Bank 2.3 0.2 - -Land Reform Savings Corporation 6.1 0.1 - -Conmiercial Banks 3.2 2.4 1.6 1.7
Private 79.1 81.9 91.0 84.8
Moneylenders 37.4 43.4 44.0 46.2Landlords 5.2 2.8 4.1 2.9Traders 2.9 3.3 2.9 2.8Friends and Relatives 33.6 32.4 40.0 32.9
100.0 100.0 100.0 100.0
Borrowings/Farm Family Rs 345 Rs 245
/1 Less than 4 bigha (2.7 ha).
Source: Calculated from Rastra Bank, Agricultural Credit Survey,1972, Vol. IV, pp 151, 154 and 157.
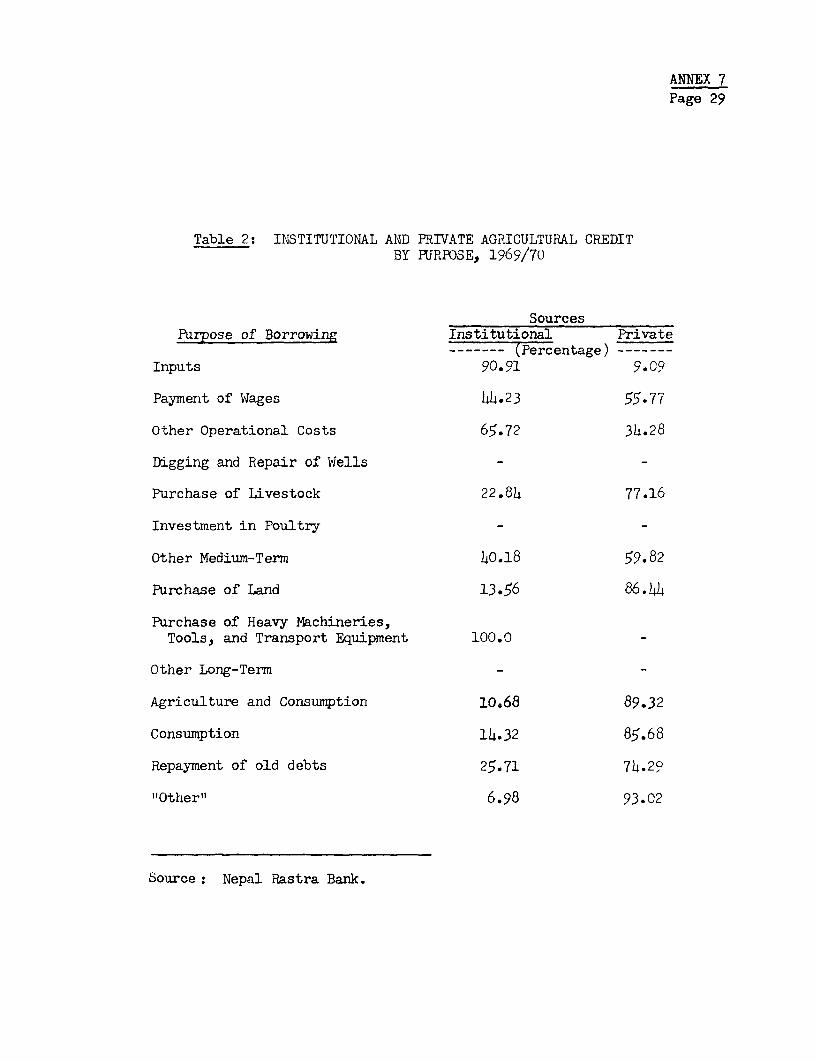
ANNEX 7Page 29
Table 2: INSTITUTIONAL AND PRIVATE AGRICULTURAL CREDITBY PURPOSE, 1969/70
SourcesPurpose of Borrowing Institutional Private
------- (Percentage) -------Inputs 90.91 9.C9
Payment of Wages 44.23 55.77
Other Operational Costs 65.72 34.28
Digging and Repair of Wells - -
Purchase of Livestock 22.84 77.16
Investment in Poultry - -
Other Medium-Term 40.18 59.82
Purchase of Land 13.56 86.414
Purchase of Heavy Machineries,Tools, and Transport Equipment 100.0 -
Other Long-Term - -
Agriculture and Consumption 10.68 89.32
Consumption 14.32 85.68
Repayment of old debts 25.71 74.29
"Other" 6.98 93.02
Source: Nepal Rastra Bank.
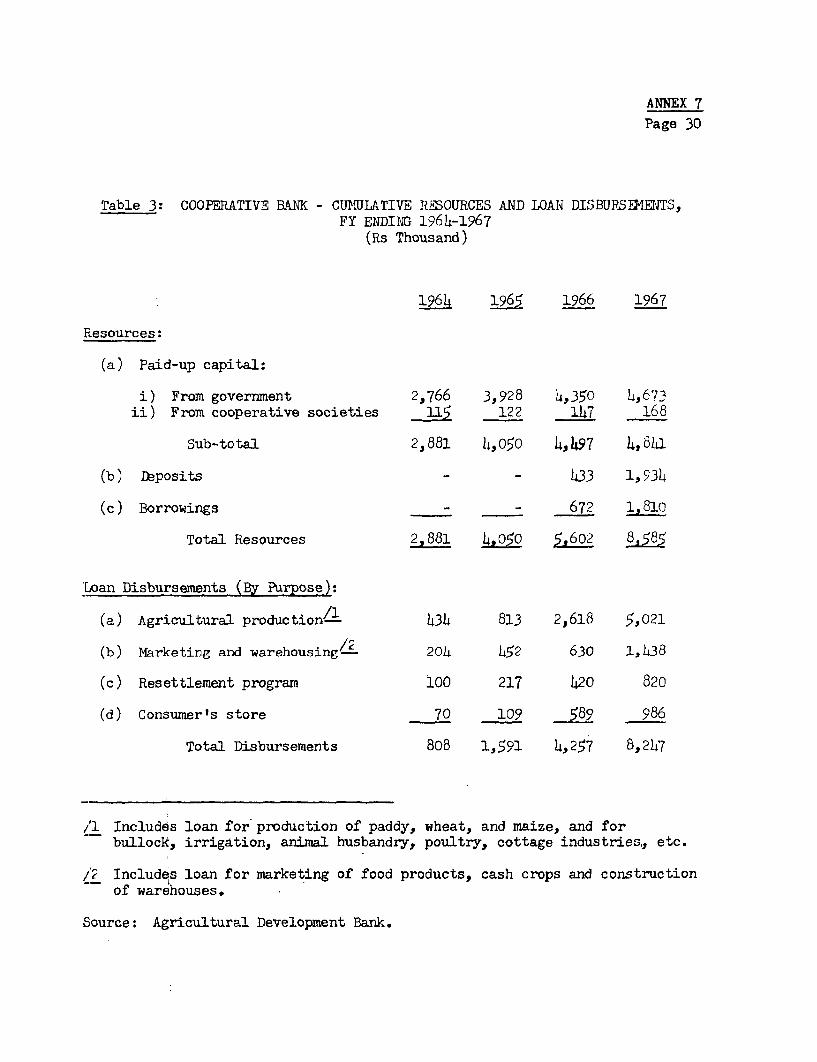
ANNEX 7
Page 30
Table 3: COOPERATIVE BANK - CUMULATIVE RESOURCES AND LOAN DISBURS E}iETS,FY ENDING 1964-1967
(Rs Thousand)
1964 1L965 1966 1967
Resources:
(a) Paid-up capital:
i) From government 2,766 3,928 4,350 4,673ii) From cooperative societies 115 122 1h7 168
Sub-total 2,881 4,050 4,497 4sh61
(b) Deposits - - 433 1,934
(c) Borrowings - 672 1,810
Total Resources 2,881 4,050 5,602
Loan Disbursements (By Purpose):
(a) Agricultural production/a 434 813 2,618 5',021
(b) Marketing and warehousing-2 204 452 630 1,h38
(c) Resettlement program 100 217 420 820
(d) Consumer's store 70 109 589 986
Total Disbursements 808 1,591 4,257 8,2h7
/1 Includes loan for production of paddy, wheat, and maize, and forbullock, irrigation, animal husbandry, poultry, cottage industries,, etc.
/2 Includes loan for marketing of food products, cash crops and constructionof warehouses.
Source: Agricultural Development Bank.
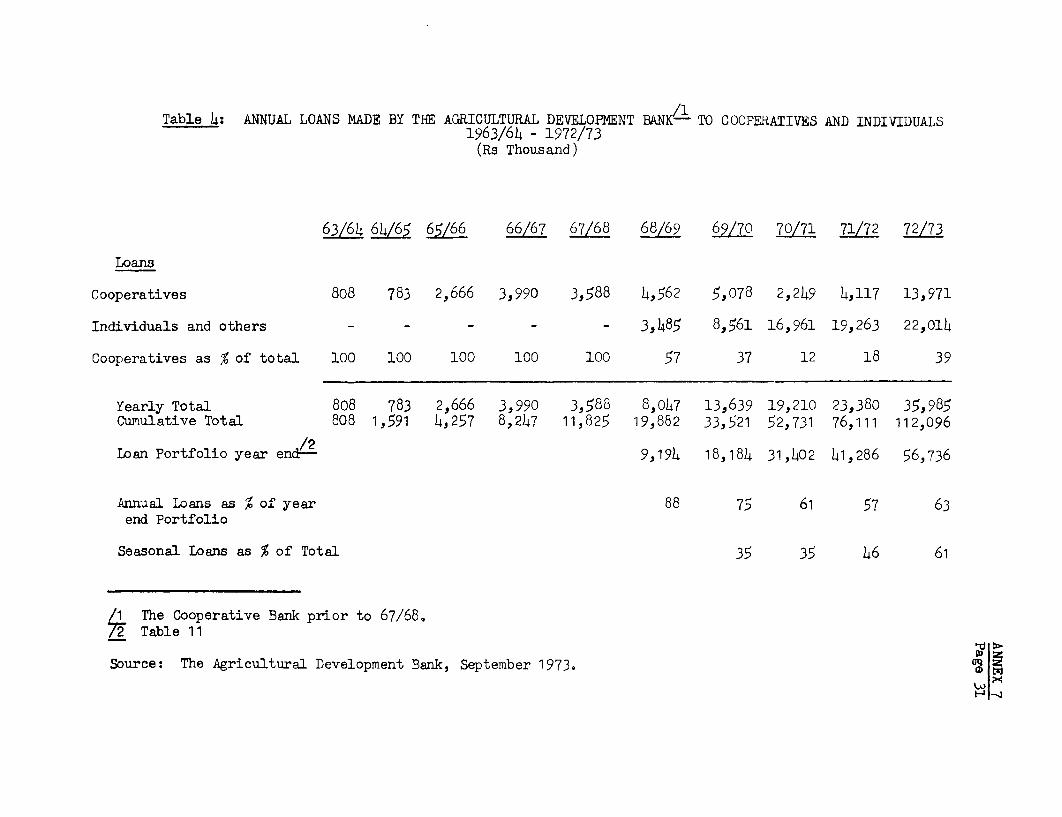
Table 4: ANNUAL LOANS MADE BY THE AGRICULTURAL DEVELOPMENT BANK - TO COOPERATIVES AND INDIVIDUALS1963/64 - 1972/73
(Rs Thousand)
63/64 6h/65 65/66 66/67 67/68 68/69 69/70 70/71 71/72 72/73
Loans
Cooperatives 808 783 2,666 3,990 3,588 4,562 5,078 2,249 4,117 13,971
Individuals and others - - - - - 3,485 8,561 16,961 19,263 22,014
Cooperatives as % of total 100 100 100 100 100 57 37 12 18 39
Yearly Total 808 783 2,666 3,990 3,588 8,047 13,639 19,210 23,380 35,985Cumulative Total 808 1,591 4,257 8,247 11,825 19,882 33,521 52,731 76,111 112,096
Loan Portfolio year end- 9,194 18,184 31,402 41,286 56,736
Annual Loans as % of year 88 75 61 57 63end Portfolio
Seasonal Loans as % of Total 35 35 46 61
/1 The Cooperative Bank prior to 67/68.72 Table 11
Source: The Agricultural Development Bank, September 1973C
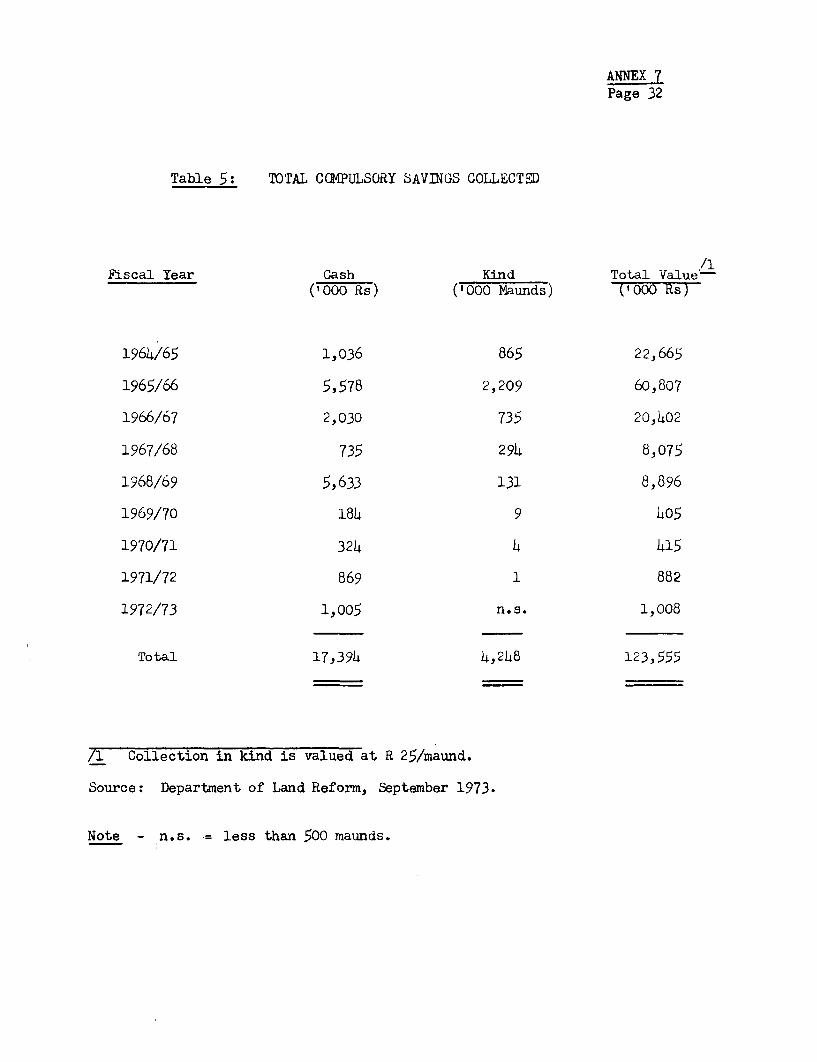
ANNEX 7Page 32
Table 5: TOTAL COMPULSORY SAVINGS COLLECTED
Fiscal Year Cash Kind Total Value/-(1000 Rs) ('000 Maunds) ('000 Rs)
1964/65 1,036 865 22,665
1965/66 5,578 2,209 60,807
1966/67 2,030 735 20,402
1967/68 735 294 8,075
1968/69 5,633 131 8,896
1969/70 184 9 405
1970/71 324 4 415
1971/72 869 1 882
1972/73 1,005 n.s. 1,008
Total 17,394 4,248 123,555
/1 Collection in kind is valued at R 25/maund.
Source: Department of Land Reform, September 1973.
Note - n.s. - less than 500 maunds.
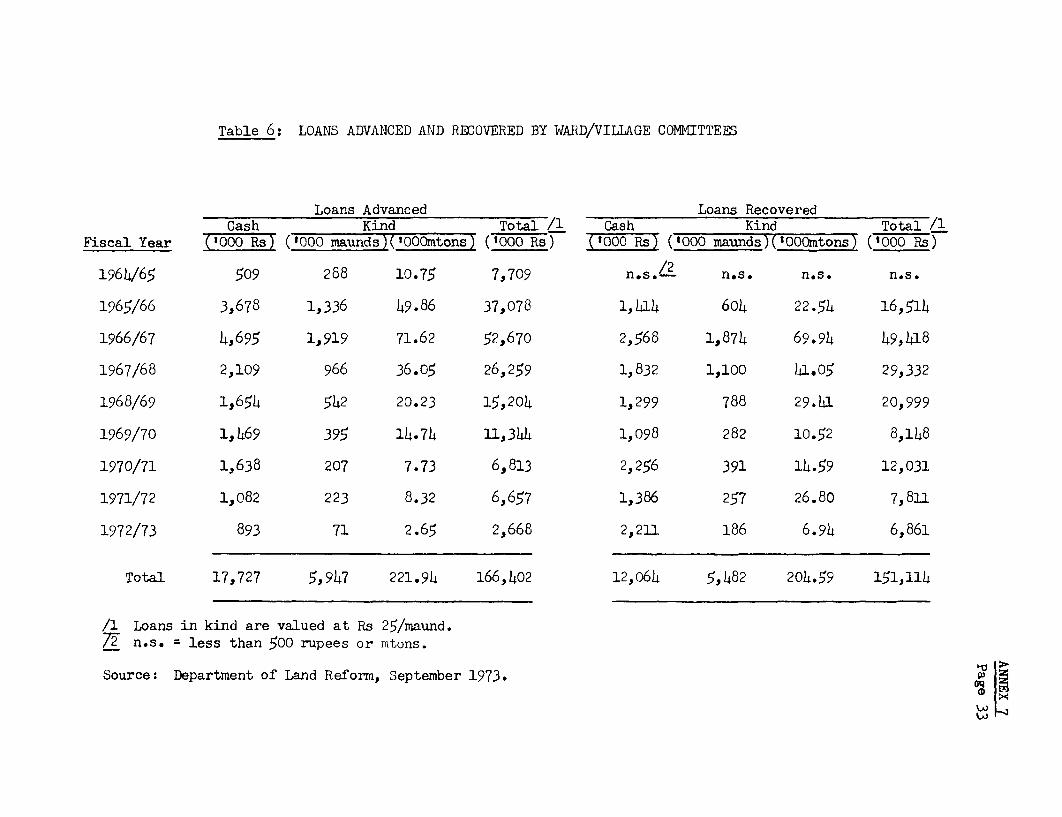
Table 6: LOANS ADVANCED AND RECOVERED BY WARD/VILLAGE COMMITTEES
Loans Advanced Loans RecoveredCash Kind Total /1 Cash Kind Total /1
Fiscal Year '000 Rs ('000 maunds)( OQOitons ('00 R000 R0s) ('000 maunds)(00mtons) ('OOO Rs)
1964/65 509 288 10.75 7,709 noso/2 n.s. nos, n.s.
1965/66 3,678 1,336 49.86 37,078 1,414 604 22.54 16,514
1966/67 4,695 1,919 71.62 52,670 2,568 1,874 69.94 49,418
1967/68 2,109 966 36.05 26,259 1,832 1,100 41.05 29,332
1968/69 1,654 542 20.23 15,204 1,299 788 29.41 20,999
1969/70 1,469 395 14.74 11,344 1,098 282 10.52 8,148
1970/71 1,638 207 7.73 6,813 2,256 391 14.59 12,031
1971/72 1,082 223 8.32 6,657 1,386 257 26.80 7,811
1972/73 893 71 2.65 2,668 2,211 186 6.94 6,861
Total 17,727 5,947 221.94 166,402 12,064 5,482 204.59 151,114
/1 Loans in kind are valued at Rs 25/maund.v_ n.s. = less than 500 rupees or mtons.
Source: Department of Land Reform, September 1973.
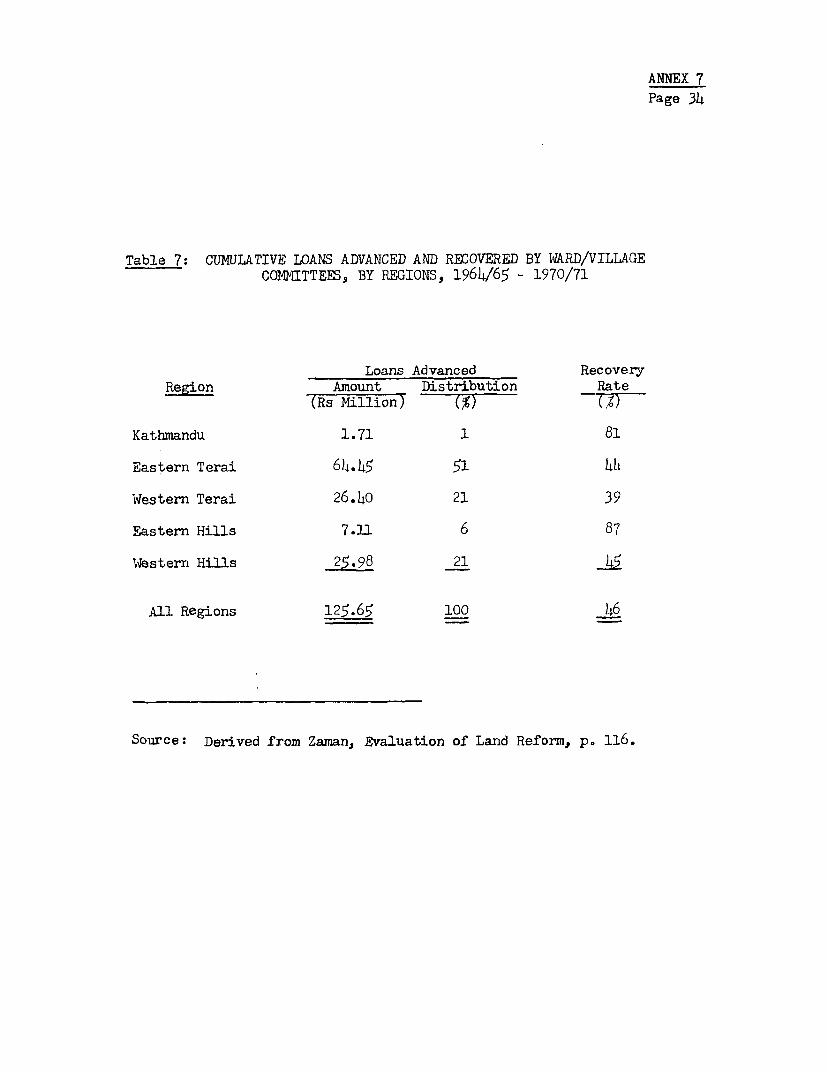
ANNEX 7Page 34
Table 7: CUMULATIVE LOANS ADVANCED AND RBCOVERED BY WARD/VILLAGECONNITTEES, BY REGIONS, 1964/65 - 1970/71
Loans Advanced RecoveryRegion Amount Distribution Rate
(Rs Million) M T%Y
Kathmandu 1.71 1 81
Eastern Terai 64.45 51h
Western Terai 26.40 21 39
Eastern Hills 7.1U 6 87
lWestern Hills 25.98 21 5
All Regions 125.65 100 46
Source: Derived from Zaman, Evaluation of Land Reform, p. 116.
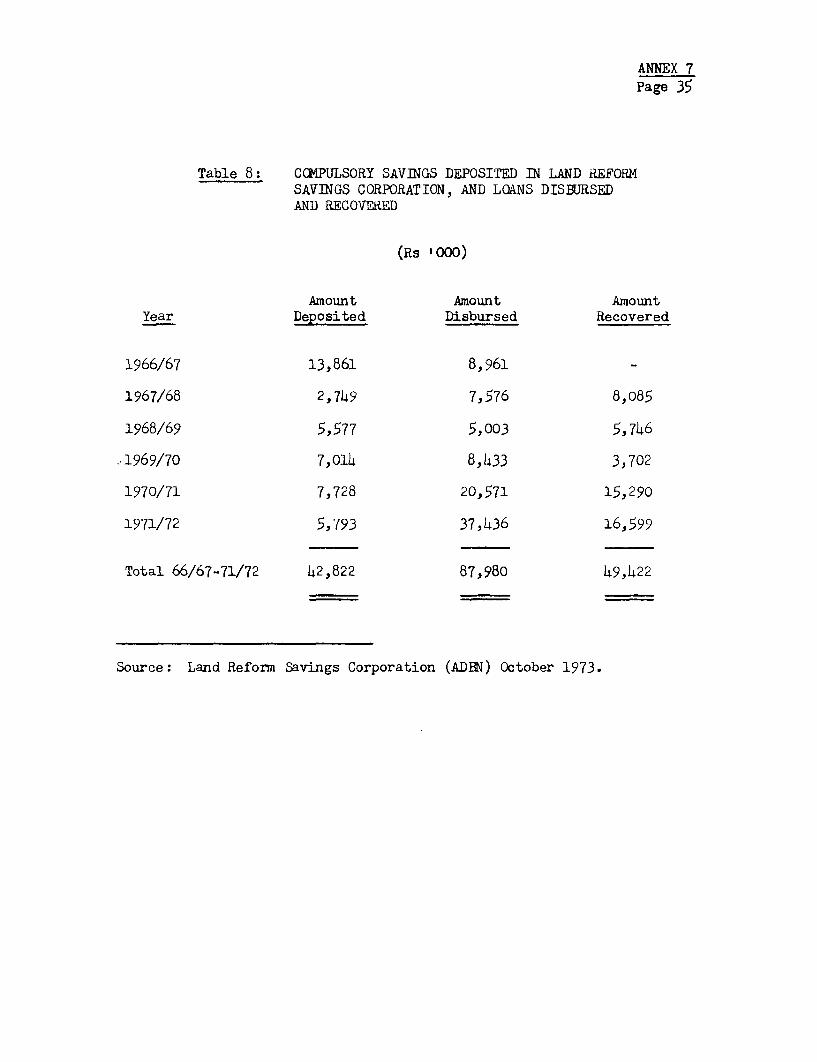
ANNEX 7Page 35
Table 8: CCMXPULSORY SAVINGS DEPOSITED IN LAND REFORMSAVINGS CORPORATION, AND LOANS DISBURSEDAND RECOVERED
(Rs '000)
Amount Amount AmountYear Deposited Disbursed Recovered
1966/67 13,861 8,961
1967/68 2,749 7,576 8,085
1968/69 5,577 5,003 5,746
1969/70 7,014 8,433 3,702
1970/71 7,728 20,571 15,290
1971/72 5,793 37,436 16,599
Total 66/67-71/72 42,822 87,980 49,422
Source: Land Reform Savings Corporation (ADBN) October 1973.
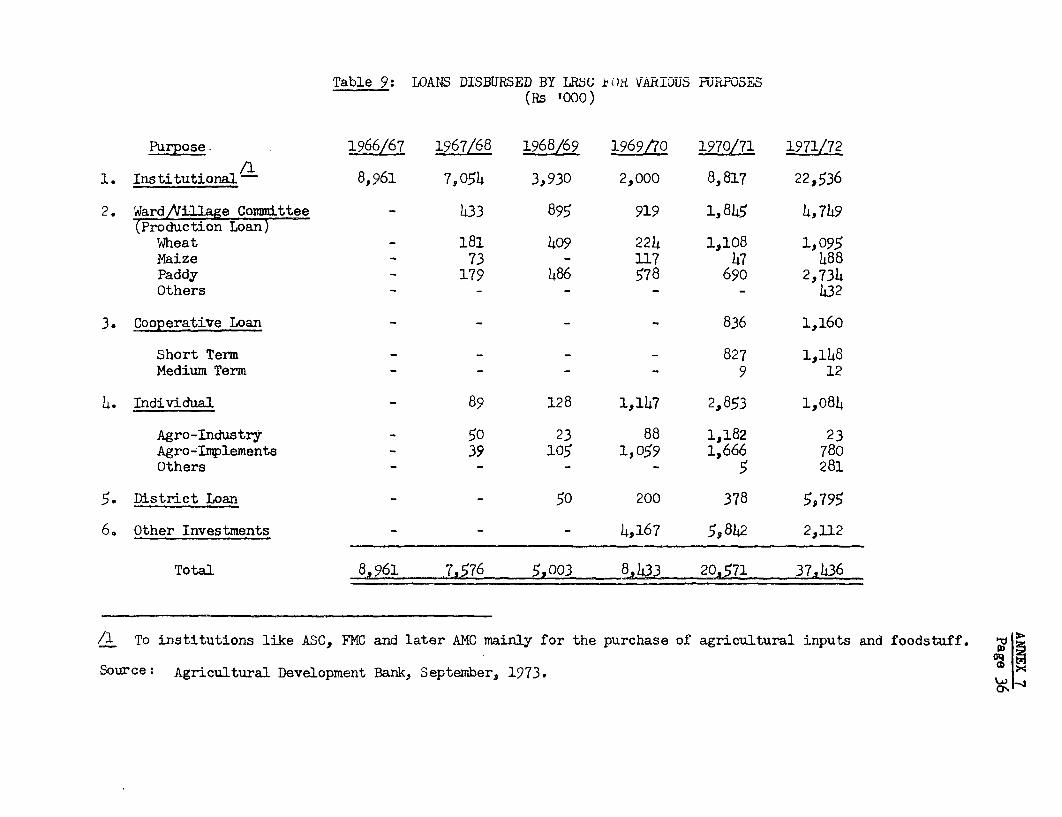
Table 9: LOA14S DlSBURSED BY LRSO VA1IvU-tS FiruRrOSES(Rs '000)
Purpose- 1966/67 1967/68 1968/69 1969/70 1970/71 1971/72
1. Institutional - 8,961 7,054 3,930 2,000 8,817 22,536
2. Ward/Tillage Committee - 433 895 919 1,845 4,749(Production Loan)
Wheat - 181 409 224 1,108 1,095Maize - 73 - 117 47 488Paddy - 179 486 578 690 2,734Others - - - - - 432
3. Cooperative Loan - - - 836 1,160
Short Term - - - - 827 1,148Medium Term - - - - 9 12
4. Individual - 89 128 1,147 2,853 1,084
Agro-Industry - 50 23 88 1,182 23Agro-Imiplements - 39 105 1,059 1,666 78oOthers - - - - 5 281
5. District Loan - - 50 200 378 5s795
6. Other Investments - - - 4,167 5,842 2,112
Total 8,961 7s576 5,003 8 433 20,571 37,h36
/1 To institutions like ASC, FMC and later AMC mainly for the purchase of agricultural inputs and foodstuff.
Source: Agricultural Development Bank, September, 1973.
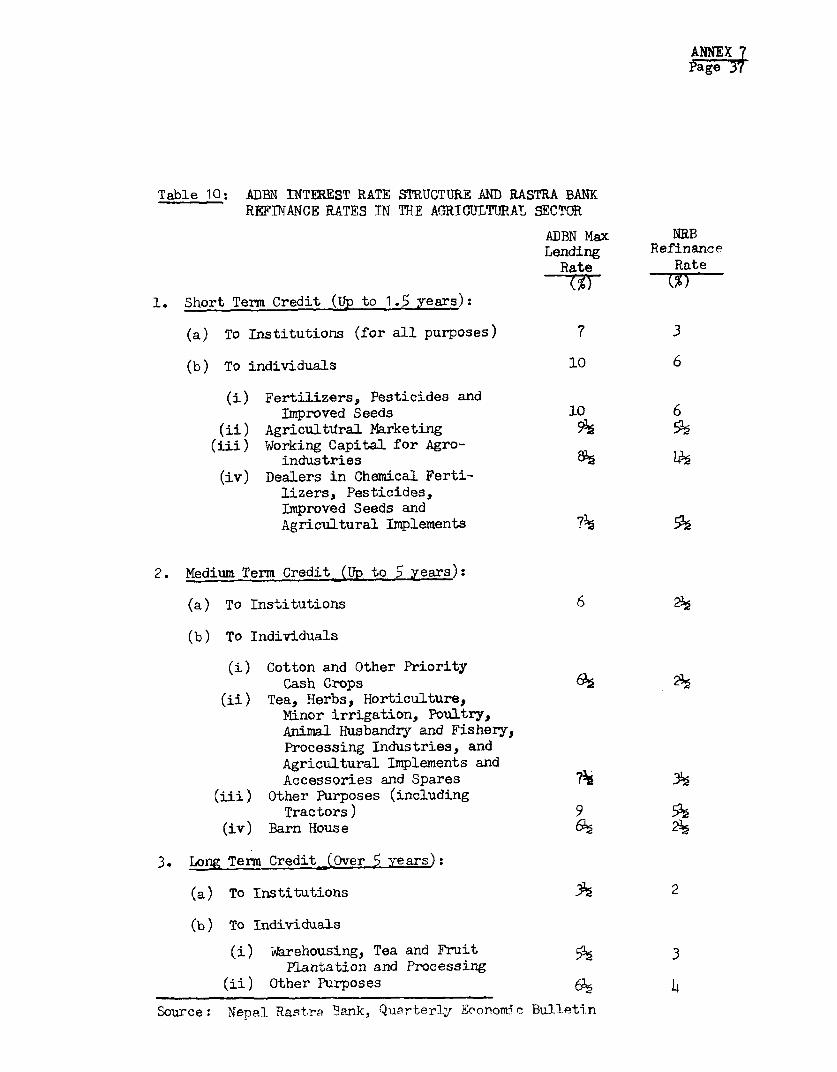
ANNEX 7Page 37
Table 10: ADBN INTEREST RATE STRUCTURE AND RASTRA BANKREFINANCE RATES TN THE AGRICULTURAL SECTOR
ADBN Max NRBLending Refinance
Rate Rate
1. Short Term Credit (UP to 1.5 years):
(a) To Institutions (for all purposes) 7 3
(b) To individuals 10 6
(i) Fertilizers, Pesticides andImproved Seeds 10 6
(ii) Agricultitral Marketing 9½ 5½(iii) Working Capital for Agro-
industries 8 4i(iv) Dealers in Chemical Ferti-
lizers, Pesticides,Improved Seeds andAgricultural Implements 7½ *5
2. Medium Term Credit-(Up to 5 years):
(a) To Institutions 6 2½
(b) To Individuals
(i) Cotton and Other PriorityCash Crops * 2!
(ii) Tea, Herbs, Horticulture,Minor irrigation, Poultry,Animal Husbandry and Fishery,Processing Industries, andAgricultural Implements andAccessories and Spares 7½ 3
(iii) Other Purposes (includingTractors) 9 5½
(iv) Barn House O 2
3. Long Term Credit (Over 5 years):
(a) To Institutions ½ 2
(b) To Individuals
(i) Warehousing, Tea and Fruit 3Plantation and Processing
(ii) Other Purposes 6 4
Source: Nepal Rastra Bank, Quarterly SvonoTnCc Bulletin
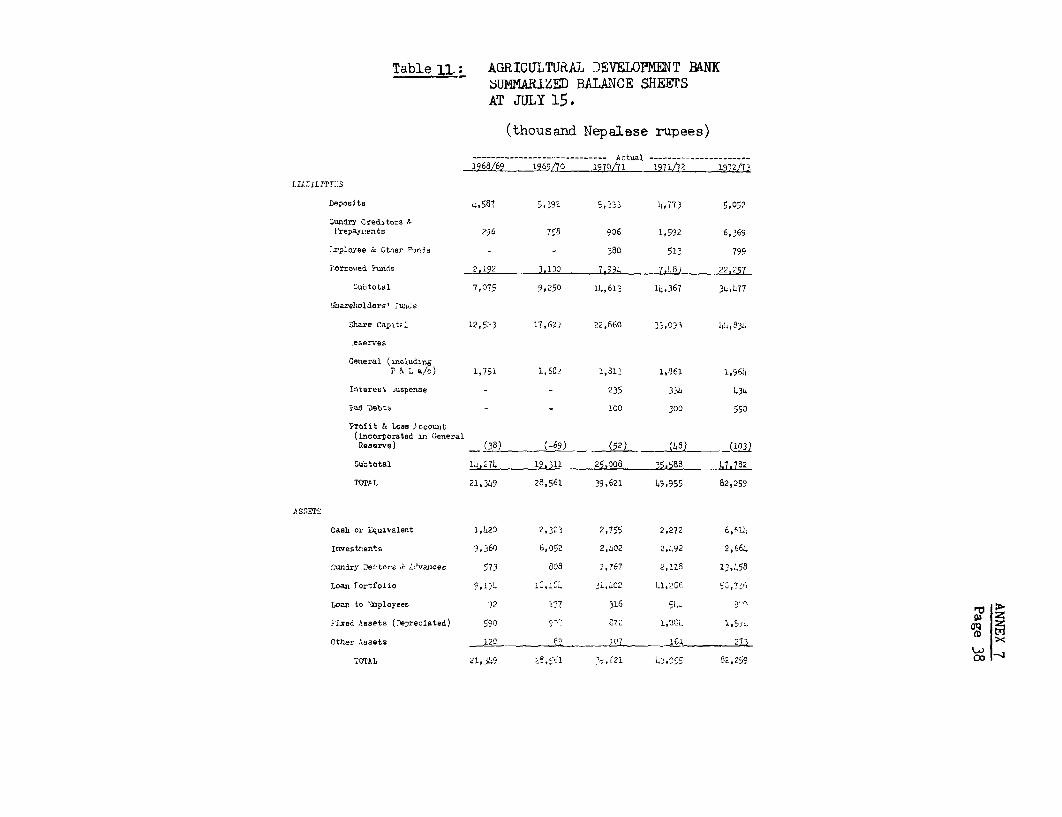
Table 11.: AGRICUILTURAJ DEVELOPMENT BANKSUMMARIZED BALANCE SHEhTSAT JULY 15.
(thousand Nepalese rupees)
- ctual ---------------1968/69 - 969Z70 1970/71 1971/? _1972/73
L2,.IIITI:;S
Deposits 4,587 5,'92 S,3 4,773 5,052
Sundry Creditoras IrepayL!ents 296 7r8 906 1,592 6,369
:rployee & Gtner bSus - _ 380 51' 799
Forroied Punds _2,192 3.130 7.9i4 7.4a7_ 22,257
Subtotal 7,075 9,250 14,613 14,367 34,177
b7ahareholders' thriis
Share Capaldt 12,523 17,623 22,660 33,O03 4L, 34
,eserv,es
General ( IncludrngP & L a/c) 1,751 1,69? 1,813 1,861 1,964
Interest '.uspense - - 235 334 434
lad 'ebts - - 100 ,00 550
1rno it & LosB Jtccount(Incorporated in GeneralReserve) (38) (-69) (52) (48) 10(3
Subtotal 14,274 19,311 25,008 39,588 47.782
floAL 21,349 28,561 39,621 49,955 82,259
A. SOThS
Cash or Equivalent 1,420 2,3.3 2,755 2,272 6,414
Inveatrents 9,360 6,o92 2,402 2,492 2,664
Sundry lle Stors & .dvances 573 803 2,767 2,118 13,498
Loan Fortfolic 9,134 12,124 31,02 41,2Sf 52,737
Loan to 'aployees 32 137 316 Sl *')
Fixed Assets (Depreciated) 590 9t 87^ 1,01 .
Other Assets 120 8? 107 161 27
TOTAL 21,349 £3,s%1 ' ,621 43.299 82,259 --I
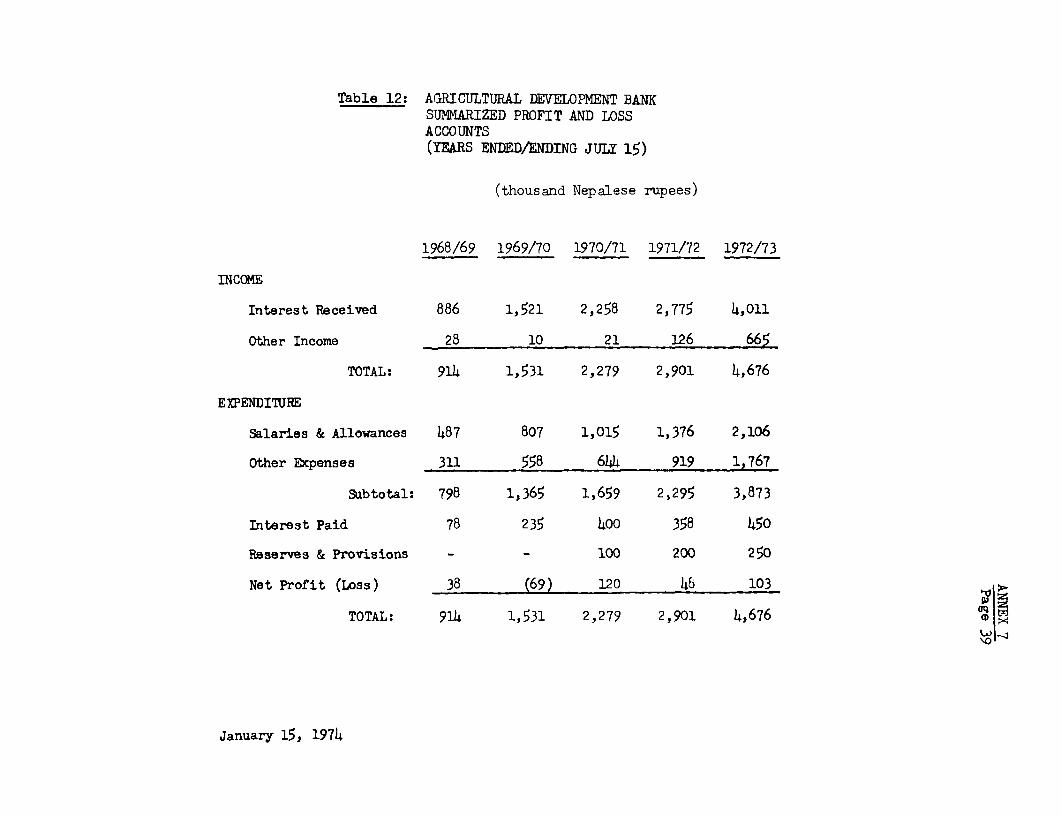
Table 12: AGRICULTURAL DEVELOPMENT BANKSUMMARIZED PROFIT AND LOSSACCOUNTS(YEARS ENEDA/NDING JULY 15)
(thousand Nepalese rupees)
1968/69 1969/70 1970/71 1971/72 1972/73
INCOME
Interest Received 886 1,521 2,258 2,775 4,011
Other Income 28 10 21 126 665
TOTAL: 914 1,531 2,279 2,901 4,676
EXPENDITURE
Salaries & Allowances 487 807 1,015 1,376 2,106
Other EXpenses 311 558 644 919 1,767
Subtotal: 798 1,365 1,659 2,295 3,873
Interest Paid 78 235 400 358 450
Reserves & Provisions - - 100 200 250
Net Profit (Loss) 38 (69) 120 46 103
TOTAL: 914 1,531 2,279 2,901 4,676
January 15J 1974
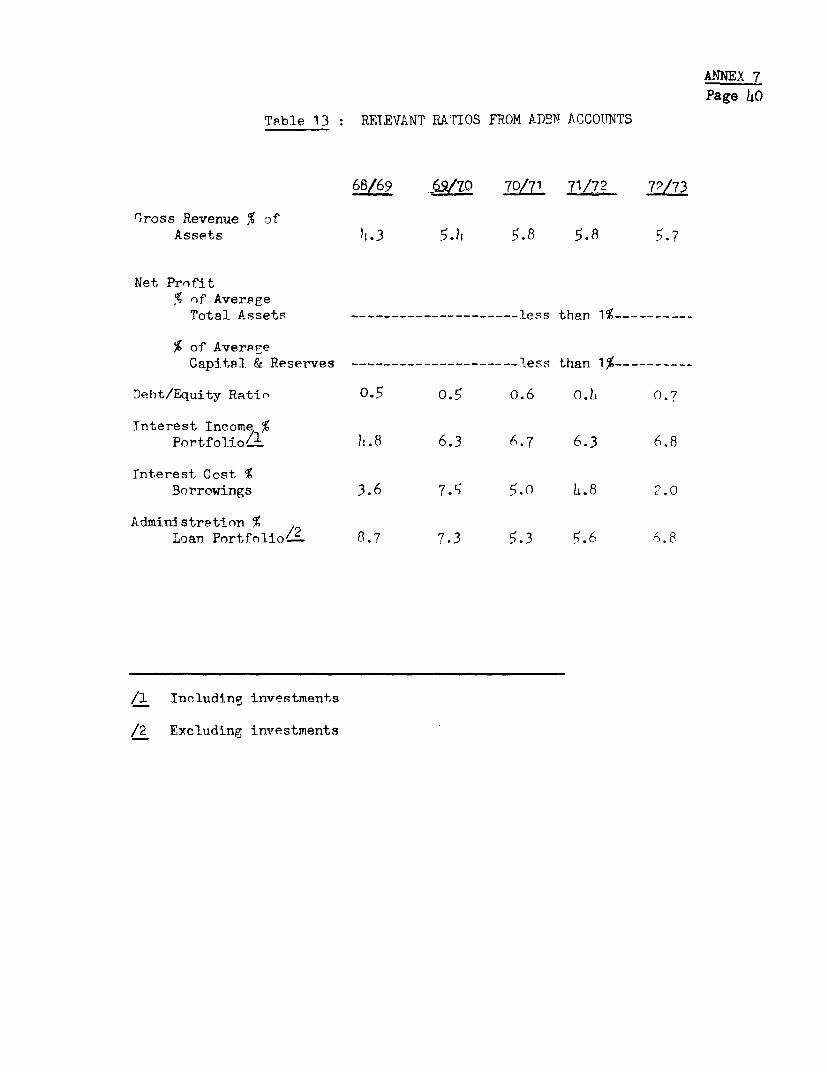
ANNEX 7
Page 40
Table 13 : RELEVANT RATIOS FROM ADEN ACCOTNTS
68/69 62/m7 70/71 71/7? 7?/73
Gross Revenue % ofAssets ),.3 5.)i 5.8 5.8 5.7
Net Profit
% of Average
Total Assets -------- less than 1 -----
% of Averppe
Capital & Reserves ---------------------less than 1%----------
Debt/Equity Ratio °.5 o.5 o.6 o.l, 0.7
Interest Income %
Portfoliol )t.8 6.3 6.7 6.3 6.8
Tnterest Cost fBorrowings 3.6 7.5 5.0 h.8 ?.0
Administration %Loan Portfolio/2 8.7 7.3 5.3 .6 .8
/1 Including investments
/2 Excluding investments
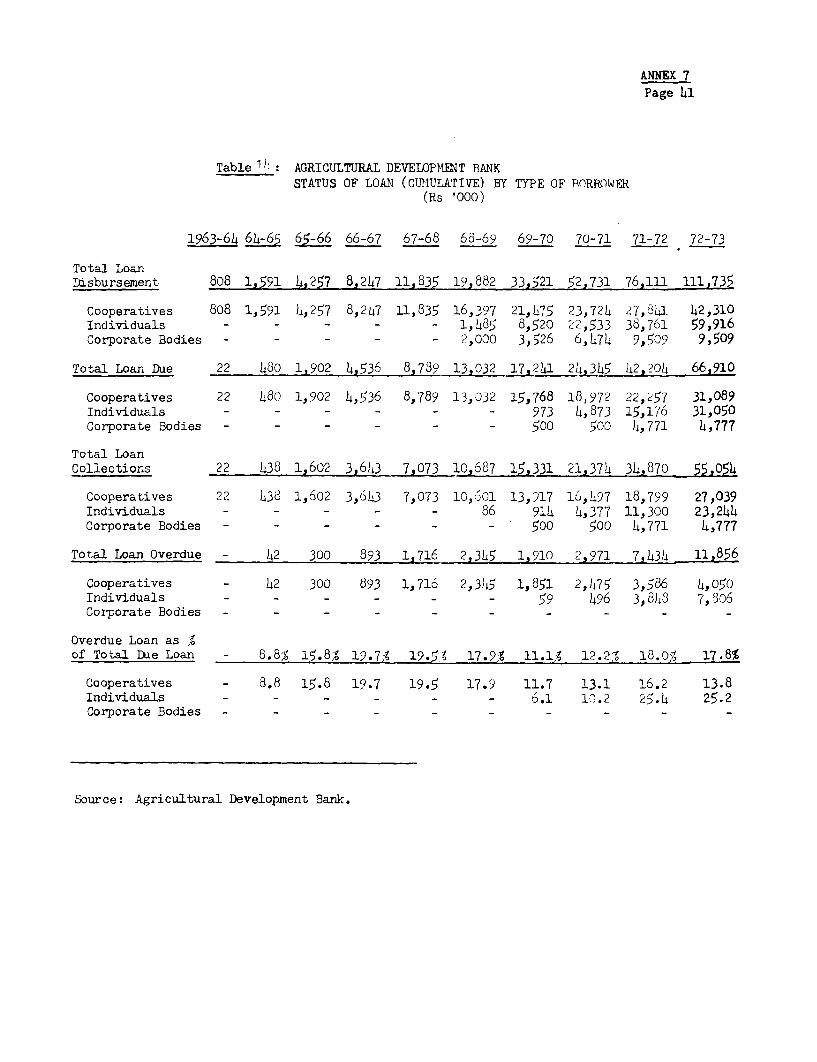
ANNEX 7Page 41
Table 1 ! AGRICULTURAL DEVELOPMENT BANKSTATUS OF LOAN (CUIULATIVE) BY TYPE OF BORROWER
(Rs '000)
1963-64 64-65 65-66 66-67 67-68 68-69 69-70 70-71 71-72 72-73
Total LoanDisbursement 808 1,591 4,257 8,247 11,835 19,882 33,521 52,731 76,111 111,735
Cooperatives 808 1,591 4,257 8,2147 11,835 16,397 21,075 23,724 2Ž7,611 42,310Individuals - - - - 1,1485 8,520 22,533 36,761 59,916Corporate Bodies - - - - - 2,000 3,526 6,474 9,509 9,509
Total Loan Due 22 480 1,902 4,536 8,789 13,032 17,2131 24jh5 142,204 66,910
Cooperatives 22 1480 1,902 4,536 8,789 13,032 15,768 18,972 22,257 31,089Individuals - - - - - - 973 4,873 15,176 31,050Corporate Bodies - - - - - - 500 500 4,771 4,777
Total LoanCollections 22 438 1,602 3,6,43 7,073 10,687 15,331 21,374 34,870 55,054
Cooperatives 22 438 1,602 3,643 7,073 10,601 13,M17 16,497 18,799 27,039Individuals - - - - - 86 914 4,377 11,300 23,244Corporate Bodies - - - - - - 500 500 4,771 4,777
Total Loan Overdue - 42 300 893 1,716 2,345 1,910 2,971 7,434 11,856
Cooperatives - 42 300 893 1,716 2,345 1,851 2,475 3,586 4,050Individuals - - - - - - 59 496 3,031 7,806Corporate Bodies - - - - - - - - - -
Overdue Loan as %of Total Due Loan - 8.8% 15.8% 19.7% 19.5, 17.9% 11.1% 12.2% 18. 0 17.8%
Cooperatives - 8.8 15.8 19.7 19.5 17.9 11.7 13.1 16.2 13.8Individuals - - - - - - 6.1 10.2 25.4 25.2Corporate Bodies - - _- -
Source: Agricultural Development Bank.
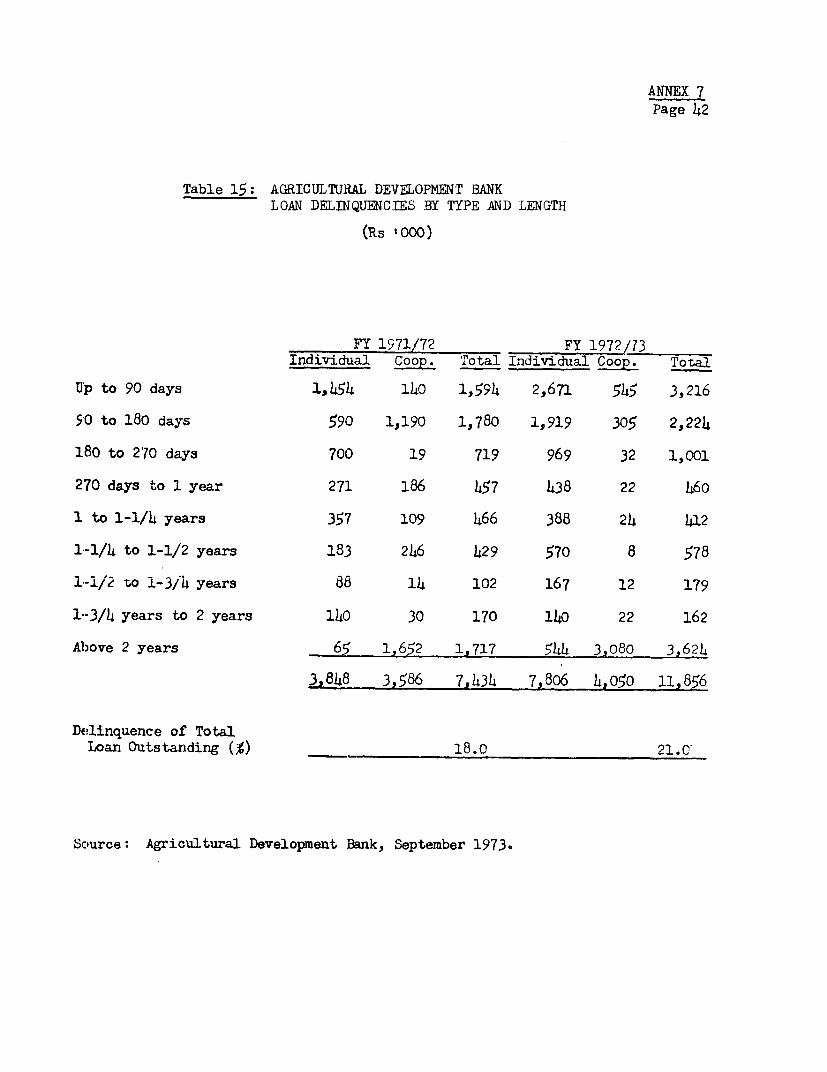
ANNEX 7Page 42
Table 15: AGRICULTURAL DEVELOPMENT BANKLOAN DELINQUENCIES BY TYPE AND LENGTH
(Rs '000)
FY 1971/72 FY 1972/73Individual Coop. Total Individual Coop. Total
Up to 90 days 1,454 140 1,594 2,671 545 3,216
90 to 180 days 590 1,190 1,780 1,919 305 2,224
180 to 270 days 700 19 719 969 32 1,001
270 days to 1 year 271 186 457 438 22 460
1 to 1-1/4 years 357 109 466 388 24 412
1-1/4 to 1-1/2 years 183 246 429 570 8 578
1-1/2 to 1-3/4 years 88 14 102 167 12 179
1--3/4 years to 2 years 140 30 170 140 22 162
Above 2 years 65 1,652 1,717 544 3,080 3,624
3,848 3,586 7,434 7,806 4,050 11,856
Delinquence of TotalLoan Outstanding (%) 18.0 21.C
Sciurce: Agricultural Development Bank, September 1973.
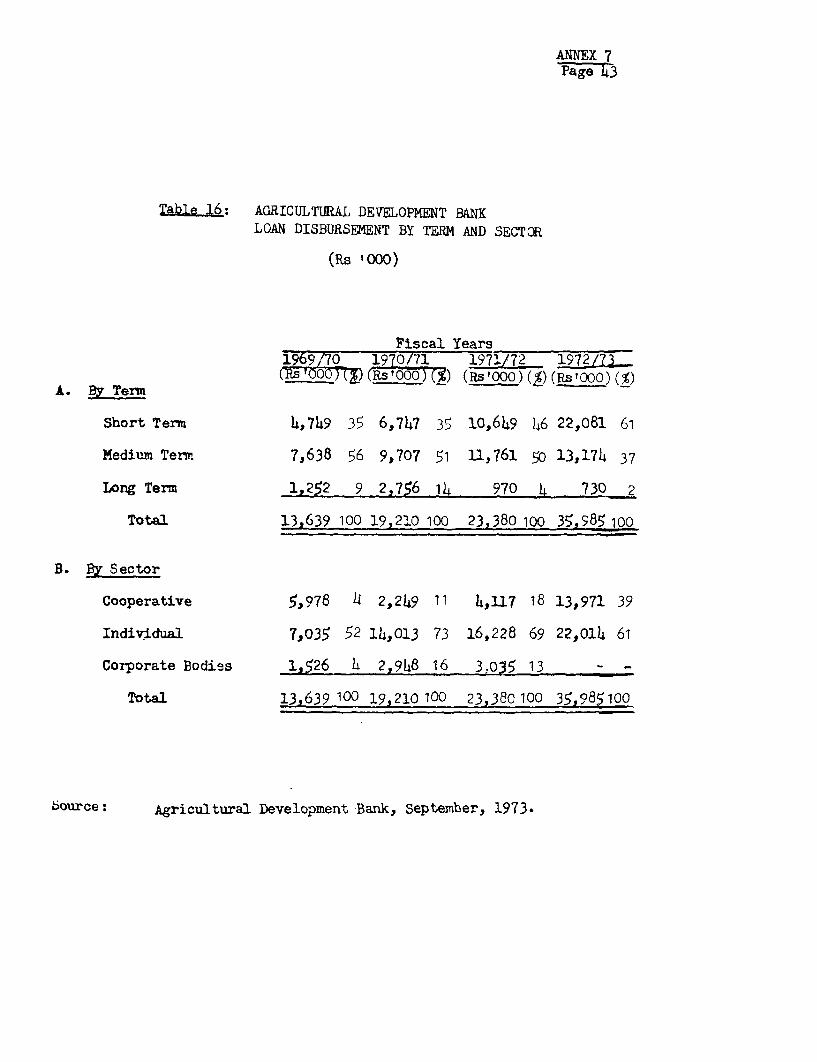
ANNEX 7Page 4
able 16: AGRICULTURAL DEVELOPMENT BANKLOAN DISBURSE;MENT BY TERM AND SECTOR
(Rs '000)
Fiscal Years196Q/70 1970/71 1971/72 19T2/1 3
jf f(Rs tOOOTm ( (Rs'OOO) (%)(RsO00) (%A. By Term
Short Term ,7h9 35 6,7h7 35 10,649 46 22,081 61
Medium Term 7,638 56 9,707 51 11,761 5o 13,174 37
Long Term 1,252 9 2,756 14 970 4 730 2
Total 13,639 100 19,210 100 23,380 100 35,985 100
B. By Sector
Cooperative 5,978 ) 2,249 11 4L,117 18 13,971 39
Individual 7,3035 52 14,013 73 16,228 69 22,ol4 61
Corporate Bodies 1,526 h 2,948 16 3z0U 13 - -
Total 13,639 100 19,210 100 23,380 100 35,985100
Source: Agricultural Development Bank, September, 1973.
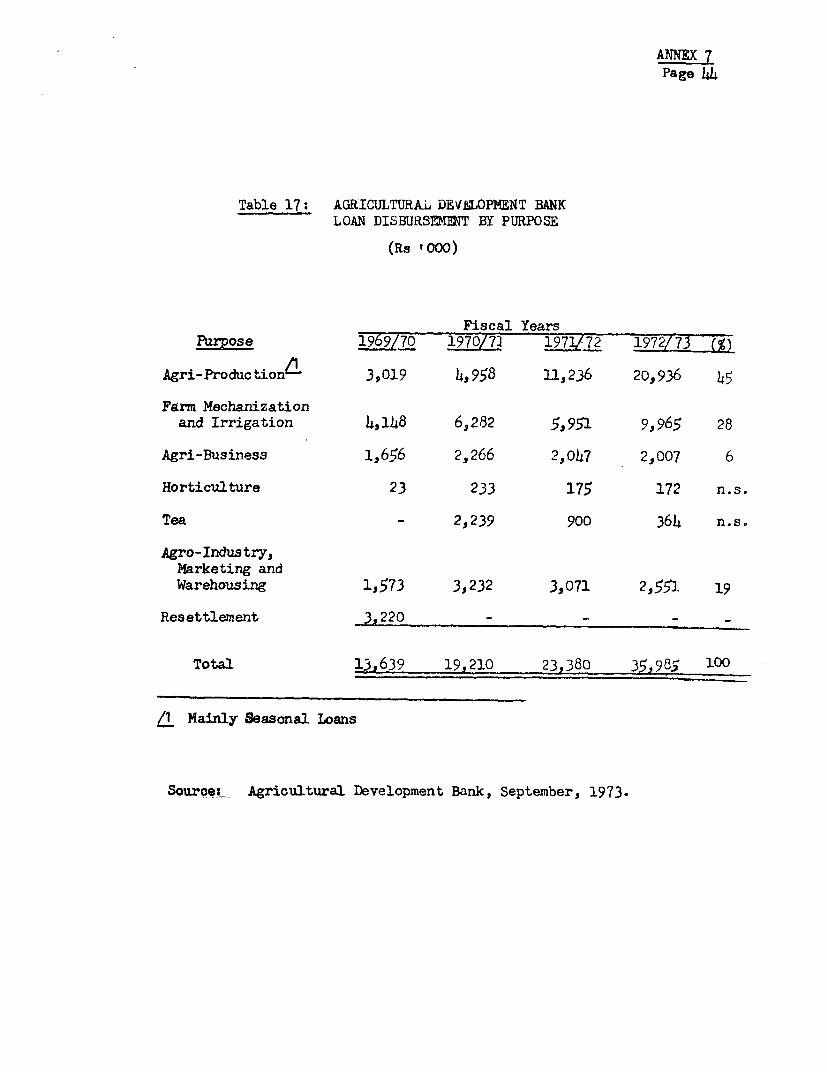
ANNEX] 7
Page 44
Table 17: AGRICULTURAL DEVLOPnENT BANKLOAN DISBURSEME2= BY PURPOSE
(Rs t 000)
Fiscal YearsPFurpose 1969/70 1970/71 197)17 2 1972173 N)
Agri-ProductionP 3,019 4.,958 11X236 20,936 45
Farm Mechanizationand Irrigation 4,148 6,2,82 5,951 9,965 28
Agri-Business 1,656 2,266 2,047 2,007 6
Horticulture 23 233 175 172 n.s.
Tea - 2,239 900 364 n.s.
Agro-Industry,Marketing andWarehousing 1,573 3,232 3,071 2,551. 19
Resettlement 3,220 - - -
Total 13,639 19,210 23,380 35,985 100
/1 Mainly Seasonal Loans
Source:_ Agricultural Development Bank, September, 1973.
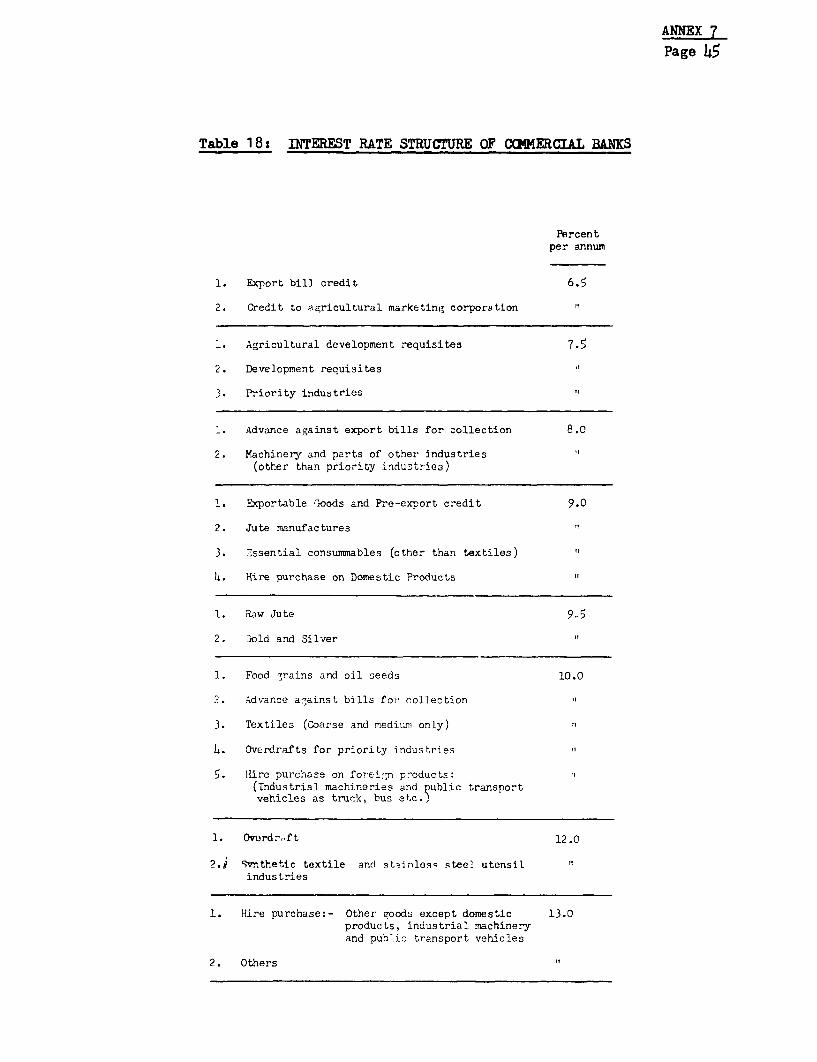
ANNEX 7
Page 45
Table 18: INTEREST RATE STRUCTURE OF CQMKERCIA BANKS
Percentper annum
1. Export bill credit 6.5
2. Credit to agricultural marketing corporation "
1. Agricultural development requisites 7.5
2. Development requisites
3. Priority industries
1. Advance against export bills for collection 8.0
2. Machinery and parts of other industries t(other than priority industries)
1. Exportable floods and Pre-export credit 9.0
2. Jute manufactures "
3. Essential consummables (other than textiles) "
h. Hire purchase on Domestic Products i
1. Raw Jute M
2. jold and Silver "
1. Food grains and oil seeds 10.0
2. Advance against bills for collection
3. Textiles (Coarse and mediunm only)
4. Overdrafts for priority industries
5. Hire purchase on foreign products:(Industrial machineries and public transportvehicles as truck, bus etc.,
1. Ovurdr.ft 12.0
2.2 9vnthetic textile and st:ninlea' steel utensilindustries
1. Hire purchase:- Other goods except domestic 13.0products, industrial machineryand public transport vehicles
2. Others
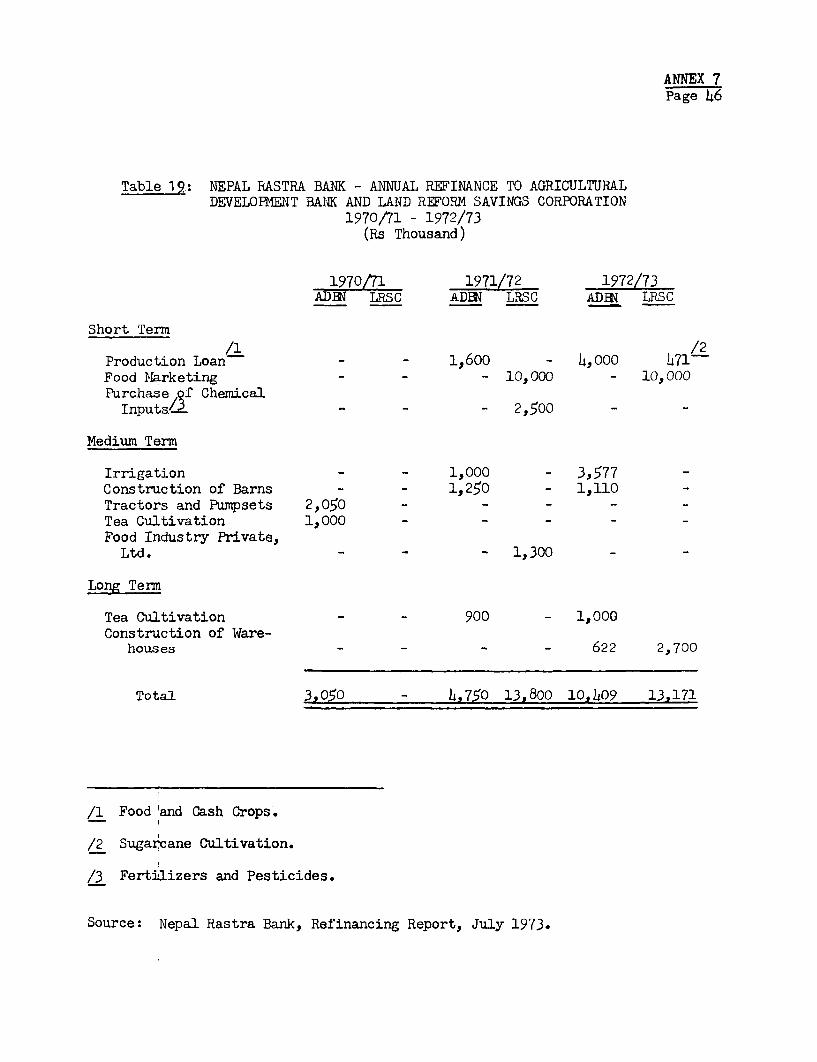
ANNEX 7Page 46
Table 19.: NEPAL RASTRA BANK - ANNUAL REFINANCE TO AGRICULTURALDEVELOPMENT BANK AND LAND REFORM SAVINGS CORPORATION
1970/71 - 1972/73(Rs Thousand)
1970/71 1971/72 1972/73ADEN LRSC ADEN LRSC ADEN LRSC
Short Term
Production Loan - - 1,600 - 4s,000 471/2Food PIarketing - - - 10,000 - 10,000Purchase of Chemical
Inputs/3 - - - 2,500 -
Medium Term
Irrigation - _ 1,000 - 3,577Construction of Barns - - 1,250 - 1,110Tractors and Pumpsets 2,050 - - -Tea Cultivation 1,000 - - -Food Industry Private,
Ltd. - - - 1,300 -
Long Ter
Tea Cultivation - - 900 - 1,000Construction of Ware-
houses - - - - 622 2,700
Total 3,050 - 4,750 13,800 10,409 13,171
/1 Food and Cash Crops.
/2 Sugar,cane Cultivation.
/3 Fertilizers and Pesticides.
Source: Nepal Rastra Bank, Refinancing Report, July 1973.
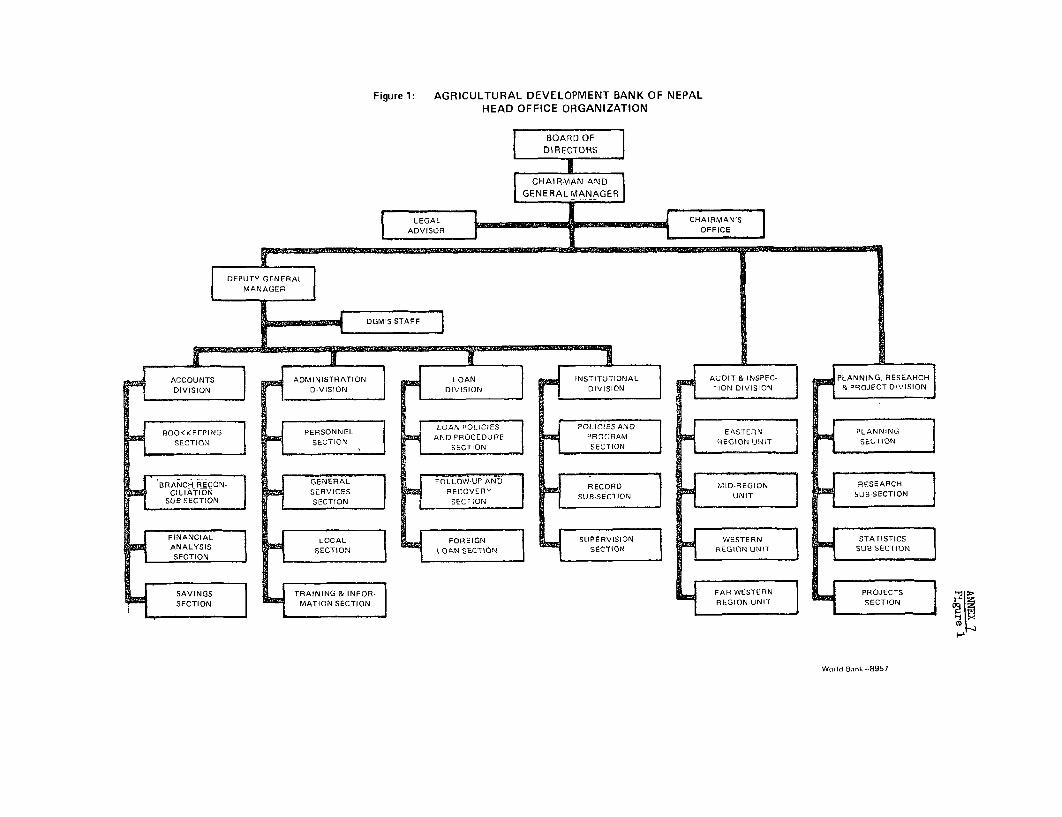
Figure 1: AGRICULTURAL DEVELOPMENT BANK OF NEPALHEAD OFFICE ORGANIZATION
| BOARD OF |DIRIECTORS J
lCHAIRMAN AND|
GENRA G GENERAL ER A
ADAIR OFFICE |
MANAGER
sUE-SECTlON SECTIONTAE
SECTION L~ ~~OAN SECTIO
SAVIUNGS TRADMINISTRATION TUTIONAL AT& INSPEC-R~~~~~~~DIVISION _DIVISION DIVIINOv15 IONDVSION & POET DIlls
SLB-SECTIN } | i RCOVERYNL LOANETIN P" EU,ENI PL RSANNIN
~~~~~~~FICtN ANDCIALLCL4REIG JDURE R VSO 1 SATITIC
SECTION T R MATION SECTIONUNiTREECTION
ID-REGIONod ~,k -85
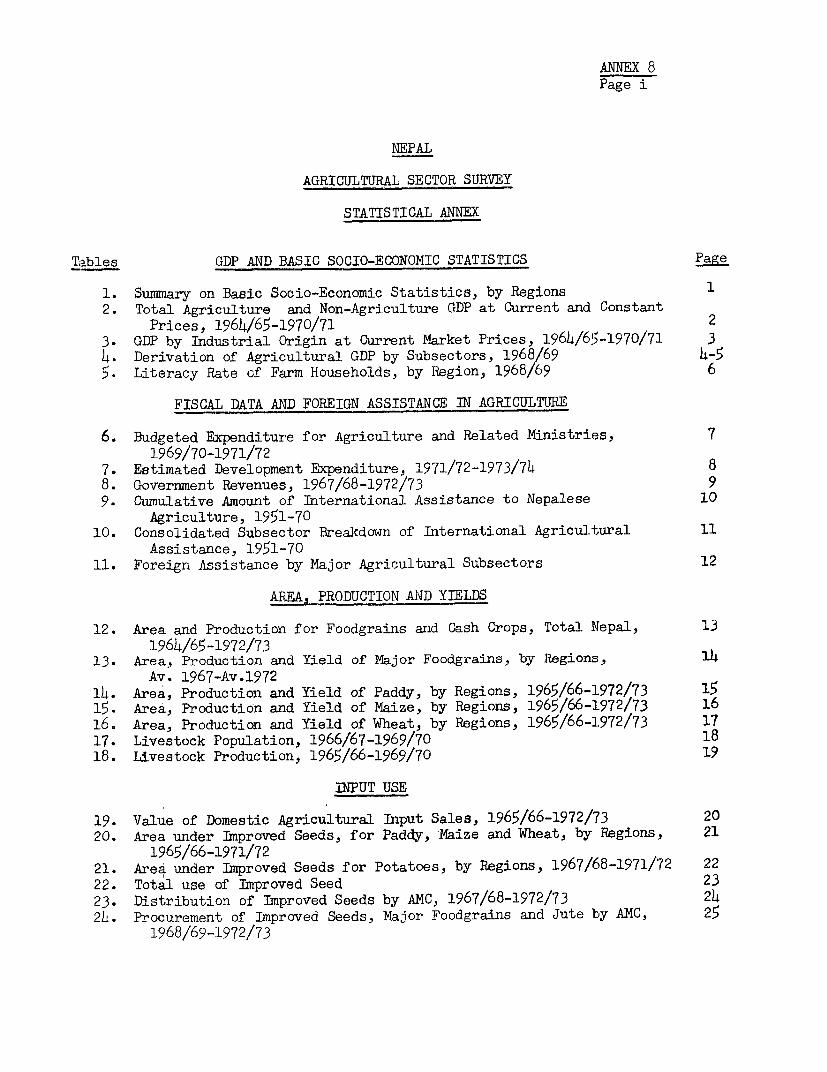
ANNEX 8Page i
NEPAL
AGRICULTURAL SECTOR SURVEY
STATISTICAL ANNEX
Tables GDP AND BASIC SOCIO-ECONOMIC STATISTICS Page
1. Summary on Basic Socio-Economic Statistics, by Regions 12. Total Agriculture and Non-Agriculture GDP at Current and Constant
Prices, 1964/65-1970/71 23. GDP by Industrial Origin at Current Market Prices, 1964/65-1970/71 34. Derivation of Agricultural GDP by Subsectors, 1968/69 4-55. Literacy Rate of Farm Households, by Region, 1968/69 6
FISCAL DATA AND FOREIGN ASSISTANCE IN AGRICULTURE
6. Budgeted Expenditure for Agriculture and Related Ministries, 71969/70-1971/72
7. Estimated Development Expenditure, 1971/72-1973/74 88. Government Revenues, 1967/68-1972/73 99. Cumulative Amount of International Assistance to Nepalese 10
Agriculture, 1951-7010. Consolidated Subsector Breakdown of International Agricultural 11
Assistance, 1951-7011. Foreign Assistance by Major Agricultural Subsectors 12
AREA, PRODUCTION AND YIELDS
12. Area and Production for Foodgrains and Cash Crops, Total Nepal, 131964/65-1972/73
13. Area, Production and Yield of Major Foodgrains, by Regions, 14Av. 1967-Av.1972
14. Area, Production and Yield of Paddy, by Regions, 1965/66-1972/73 1515. Area, Production and Yield of Maize, by Regions, 1965/66-1972/73 1616. Area, Production and Yield of Wheat, by Regions, 1965/66-1972/73 1717. Livestock Population, 1966/67-1969/70 1818. Livestock Production, 1965/66-1969/70 19
INPUT USE
19. Value of Domestic Agricultural Input Sales, 1965/66-1972/73 2020. Area under Improved Seeds, for Paddy, Maize and Wheat, by Regions, 21
1965/66-1971/7221. Area under Improved Seeds for Potatoes, by Regions, 1967/68-1971/72 2222. Total use of Improved Seed 2323. Distribution of Improved Seeds by AMC, 1967/68-1972/73 2424. Procurement of Improved Seeds, Major Foodgrains and Jute by AMC, 25
1968/69-1972/73
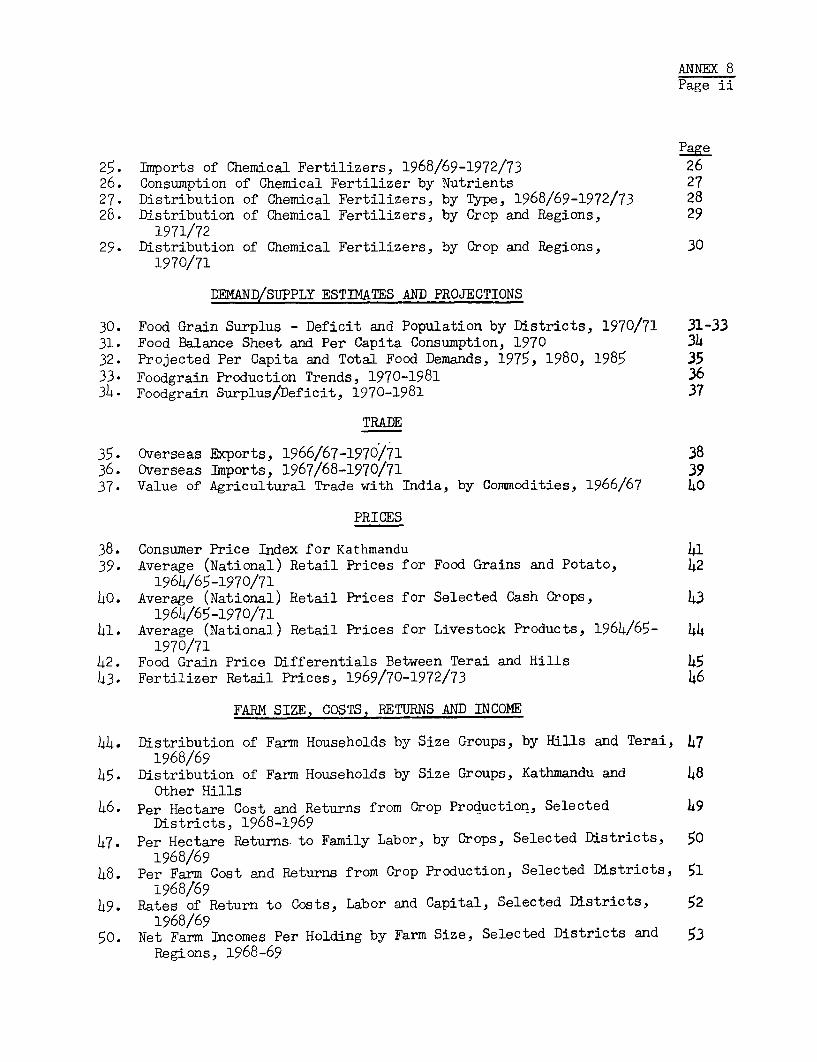
ANNEX 8Page ii
Page
25. Imports of Chemical Fertilizers, 1968/69-1972/73 2626. Consumption of Chemical Fertilizer by Nutrients 2727. Distribution of Chemical Fertilizers, by Type, 1968/69-1972/73 2828. Distribution of Chemical Fertilizers, by Crop and Regions, 29
1971/7229. Distribution of Chemical Fertilizers, by Crop and Regions, 30
1970/71
DEIAND/SUPPLY ESTIMATES AND PROJECTIONS
30. Food Grain Surplus - Deficit and Population by Districts, 1970/71 31-3331. Food Balance Sheet and Per Capita Consumption, 1970 3432. Projected Per Capita and Total Food Demands, 1975, 1980, 1985 3533- Foodgrain Production Trends, 1970-1981 3634. Foodgrain Surplus/Deficit, 1970-1981 37
TRADE
35. Overseas Exports, 1966/67-1970/71 3836. Overseas Imports, 1967/68-1970/71 3937. Value of Agricultural Trade with India, by Commodities, 1966/67 40
PRICES
38. Consumer Price Index for Kathmandu 4139. Average (National) Retail Prices for Food Grains and Potato, 42
1964/65-1970/7140. Average (National) Retail Prices for Selected Cash Crops, 43
1964/65-1970/7141. Average (National) Retail Prices for Livestock Products, 1964/65- 44
1970/7142. Food Grain Price Differentials Between Terai and Hills 4543. Fertilizer Retail Prices, 1969/70-1972/73 46
FARM SIZE, COSTS, RETURNS AND INCOME
44. Distribution of Farm Households by Size Groups, by Hills and Terai, 471968/69
45. Distribution of Farm Households by Size Groups, Kathmandu and 48Other Hills
46. Per Hectare Cost and Returns from Crop Production, Selected 9Districts, 1968-1969
47. Per Hectare Returns- to Family Labor, by Crops, Selected Districts, 501968/69
48. Per Farm Cost and Returns from Crop Production, Selected Districts, 511968/69
49. Rates of Return to Costs, Labor and Capital, Selected Districts, 521968/69
50. Net Farm Incomes Per Holding by Farm Size, Selected Districts and 53Regions, 1968-69
ANNEX 8Page iii
Page
51. Average Income of Farm Families, Small Size Group, Selected 54Districts, 1969/70
52. Average Income of Farm Families, Medium Size Groups, Selected 55Districts, 1969/70
53. Average Income of Farm Families, Large Size Groups, Selected 56Districts, 1969/70
54. Farm Size Distribution and Incomes, Hills and Terai, 1968/69 5755. Farm Size Distribution and Incomes, Kathniandu, 1968/69 58
MISCELLANEOUS
56. Conversion Tables - Land Measurements 5957. Conversion Tables - Weight Measurements 60
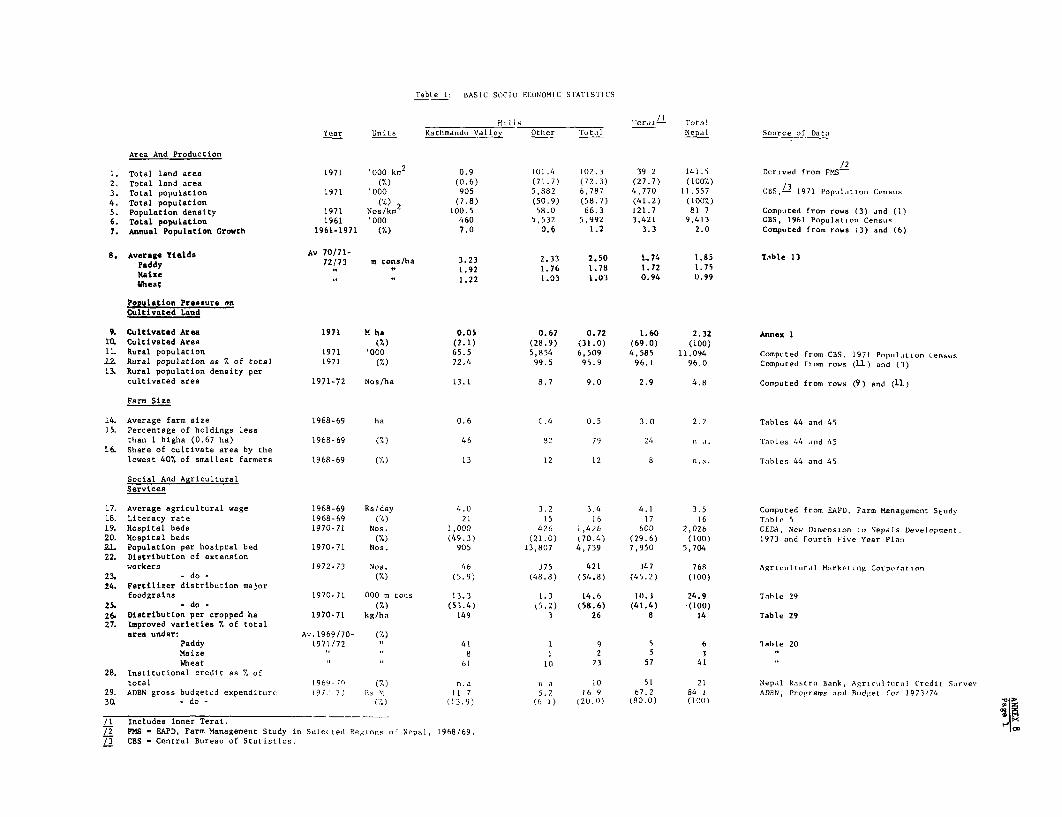
Table i: BASIC SOCIo ECONOMIC STATISTICS
Hills ','erai- TotalYear Units Kathmandsl Valley Other TotalI Nepal Souirce of Data
Area And Production
1. Total land area 1971 '000 km2 0.9 101.4 102.3 39 2 141.5 Derived from FMS
2. Total land area (7) (0.6) (71.7) (72.3) (27.7) (100%)3. Total population 1971 '000 905 5,882 6,787 4,770 11.557 CBS,- 1971 Popiul.,tio, C-nsos
4. Total population (71) 2 (7.8) (50.9) (58.7) (41.2) (1007/.)5. Population density 1971 Nos/km 100.5 58.0 66.3 121.7 81 7 Computed from rows (3) dnd (1)6. Total population 1961 '000 460 5,532 5,992 3,421 9,413 CBS, 1961 Populatiom Census
7. Annual Population Growth 1961-1971 (7.) 7.0 0.6 1.2 3.3 2.0 Computed from rows (3) and (6)
8. Average Yields Av 70/71- t3i2 2.33 2.50 1.74 1.85 Table 13Paddy 72/73 m tons/ha 3.323 2.0 17 1.5Tbe1
Maize ~~~~~~~~~~ ~~~~~ ~~~~~ ~~~~~~~1.92 1.76 1.78 1.72 1.75Vhea, 1.22 1.03 1.03 0.94 0.99
Population Pressure onCultivated Land
9. Cultivated Area 1971 M ha 0.05 0.67 0.72 1.60 2.32 Annex I10. Cultivated Area (7) (2.1) (28.9) (31.0) (69.0) (100)11. Rural population 1971 '000 65.5 5,854 6,509 4,585 11,094 Computed from CBS, 1971 Pol1ul.ltion (.enss
iv Rural population as 1 of total 1971 (7.) 72.4 99.5 95.9 96.1 96.0 Computed from rows (U ) and (3)
13. Rural population density percultivated area 1971-72 Nos/ha 13.1 8.7 9.0 2.9 4.8 Computed from rows (9) and (11)
Farm Size
14. Average farm size 1968-69 ha 0.6 0.4 0.5 3.0 2.2 Tables 44 and 45
15. Percentage of holdings lessthan I bigha (0.67 ha) 1968-69 (71) 46 82 79 24 n .a. Tanles 44 nd 45
16. Share of cultivate area by thelowest 40% of smallest farmers 1968-69 (71) 13 12 12 8 n.a. Tables 44 and 45
Social And AgriculturalServices
17. Average agricultural wage 1968-69 Rs/day 4.0 3.2 3.4 4.1 3.5 Computed from fAPD, Farm Management Study
18. Literacy rate 1968-69 (%) 21 15 16 17 16 Ta,ble 5
19. Hospital beds 1970-71 Nos. 1,000 426 1,426 600 2,026 CEDA, New Dimension in Nepals Development,
20. Hospital beds (.) (49.3) (21.0) (70.4) (29.6) (100) 1973 and Fourth Five Year Plum
21. Population per hosiptal bed 1970-71 Nos. 905 13,807 4,759 7,950 5,70422. Distribution of extension
workers 1972-73 Noa. 46 .75 421 347 768 Agric-l ii,r.lI Markel 1mg Corpor.it on
23. - do - (-/) (5.9) (48.8) (54.8) (45.2) (100)14. Fertilizer distribution major
foodgrains 1970- 71 000 m tols 13.3 1.3 14.6 10.J 24.9 Table 29
25. - do - (7.) (53.4) 5.2) (58.6) (41.4) -(100)26. Distribution per cropped ha 1970 71 kg/ha 149 3 26 8 14 Table 2927. Improved varieties % of total
area under: Av.1969/70- (7.)Paddy 19711/2 " 41 1 9 1 6 lable 20Maize . 8 1 2 5 3Wheat ' 61 10 23 57 41
28. Institutional credit as 7. oftotal 1969 i'' (/.) n.a s a 10 51 21 Nepil R-stra Bank, Agric-l tural Credit S-,rvev
29. ADBN gross budgeted expenditure 1972 7; Ris 11 7 5.2 16 9 t7.2 84 1 ADBN, Programs and Budget for 1973/7430. - do - (71) (13.9) (6 1) (20.0) (80.0) (100)
/1 Includes Inner Terai. C..
/2 PM8 - EAPD, Farm Management Study in Sele ted Regions of Nepal, 1968/69./3 CBS 5 Central Bureau of Statistics.
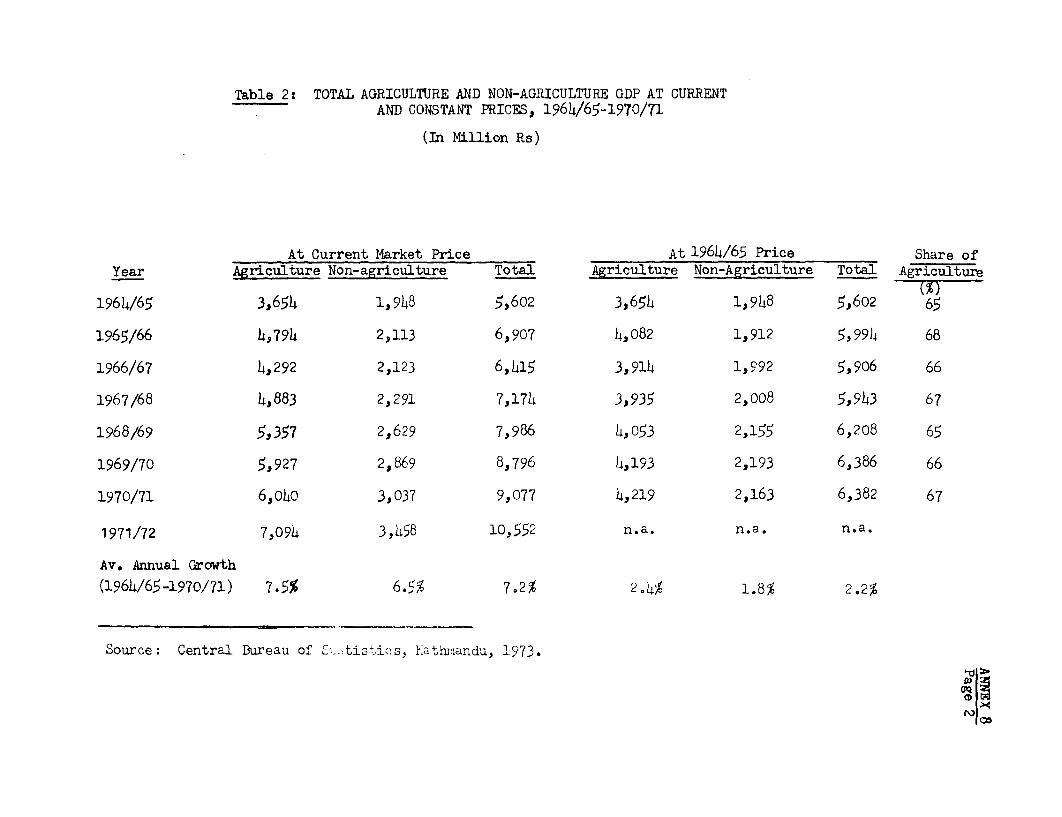
Table 2: TOTAL AGRICULTURE AND NON-AGRICULTURE GDP AT CURRENTAND CONSTANT PRICES, 1964/65-1970/71
(In Million Rs)
At Current Market Price At 1964/65 Price Share ofYear Agriculture Non-agriculture Total Agriculture Non-Agiculture Total Agcultue
1964/65 3,654 1,948 5,602 3,654 1,9h8 5,602 65
1965/66 4,794 2,113 6,907 4,o82 1,912 5,99h 68
1966/67 4,292 2,123 6,115 3,914 1,992 5,906 66
1967/68 4,883 2,291 7,174 3,935 2,008 5,943 67
1968/69 5,357 2,629 7,986 4,053 2,155 6,208 65
1969/70 5,927 2,869 8,796 4,193 2,193 6,386 66
1970/71 6,oho 3,037 9,077 4,219 2,163 6,382 67
1971/72 7,094 3,458 10,552 n.a. n.a. n.a.
Av. Annual Growth
(1964/65-1970/71) 7.5% 6.5% 7.2% 2.4% 1.8% 2.2%
Source: Central Bureau of S--itistics, 4 i'atbmandu, 1973.
ICO
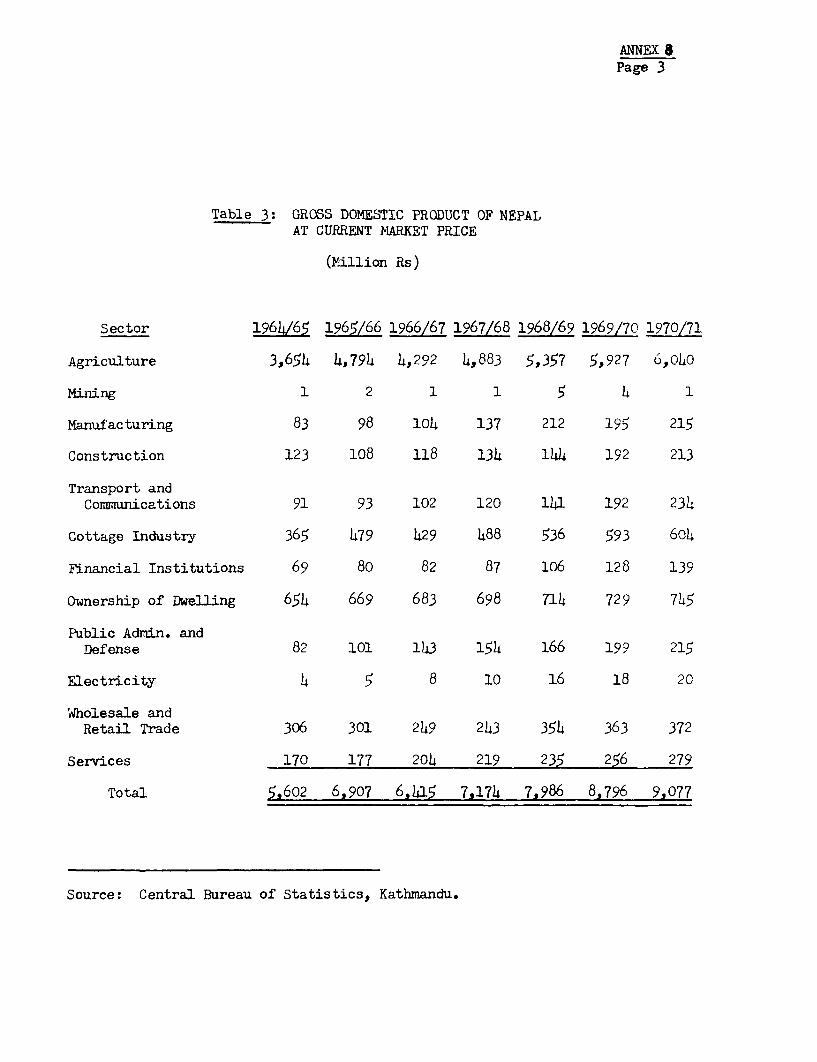
ANNEX 8Page 3
Table 3: GROSS DOMESTIC PRODUCT OF NEPALAT CURRENT MARKET PRICE
(Million Rs)
Sector 1964/65 1965166 1966/67 1967/68 1968/69 1969/70 1970/71
Agriculture 3,654 4,794 4,292 4,883 5,357 5,927 6,040
Mining 1 2 1 1 5 4 1
Manufacturing 83 98 104 137 212 195 215
Construction 123 108 118 134 144 192 213
Transport andCormunications 91 93 102 120 141 192 234
Cottage Industry 365 479 429 488 536 593 604
Financial Institutions 69 80 82 87 106 128 139
Ownership of Dwelling 654 669 683 698 714 729 745
Public Adrin. andDefense 82 101 143 154 166 199 215
Electricity 4 5 8 10 16 18 20
Wholesale andRetail Trade 306 301 249 243 354 363 372
Services 170 177 204 219 235 256 279
Total 5,602 6,907 6,45 7,174 7,986 8,796 9,077
Source: Central Bureau of Statistics, Kathmandu.
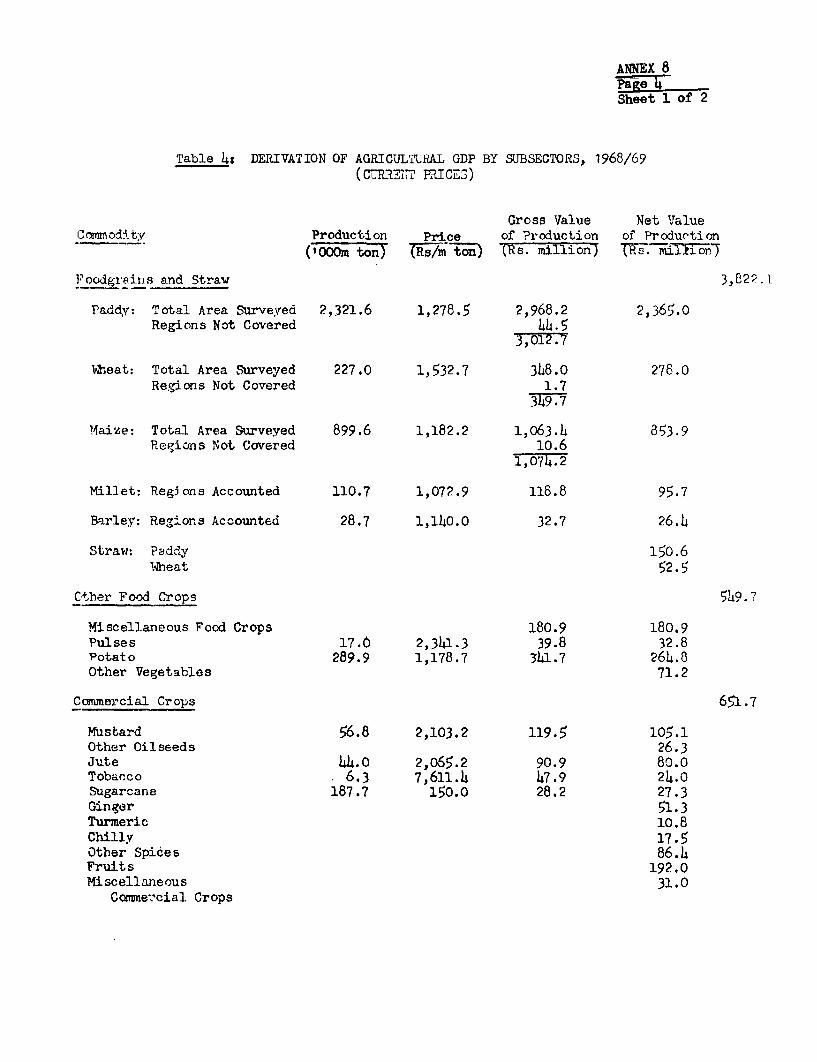
ANNEX 8Page LiSheet 1 of 2
Table 4: DERIVATION OF AGRICULTURAL GDP BY SUBSECTORS, 1968/69(CURJ. 7 P.ICE3)
Gross Value Net ValueC'omnodiUtv Production Price of ?roduction of Production
('OOOm ton) (s/m ton (Rs. millionn (Rs. millionr
'oodgrain.s and Straw 3,B2?.I
Paddy: Total Area Surveyed 2,321.6 1,278.5 2,968.2 2,3665.0Regions Not Covered 44.5
3,012.7
Wheat: Total Area Surveyed 227.0 1,532.7 348.0 278.0Regions Not Covered 1.7
349.7
Maize: Total Area Surveyed 899.6 1,182.2 1,063.4 853.9Regions Not Covered 10.6
1,071.2
Millet: Regjons Accounted 110.7 1,072.9 118.8 95.7
Barley: Reg-ons Accounted 28.7 1,140.0 32.7 26.4
Straw: P?addy 150.6Nheat 52.5
Cther Food Crops 5149.7
Miscellaneous Food Crops 180.9 180.9Pulses 17.0 2,341.3 39.8 32.8Potato 289.9 1,178.7 341.7 264.8Other Vegetables 71.2
Canmercial Crops 651.7
Mustard 56.8 2,103.2 119.5 105.1Other Oilseeds 26.3Jute 44.o 2,065.2 90.9 80.0Tobacco 6.3 7,611.4 47.9 24.0Sugarcane 187.7 150.0 28.2 27.3Ginger 51.3Turmeric 10.8Chilly 17.5Other Spices 86.4Fruits 192.0Miscellaneous 31.0
Comme-~cial Crops
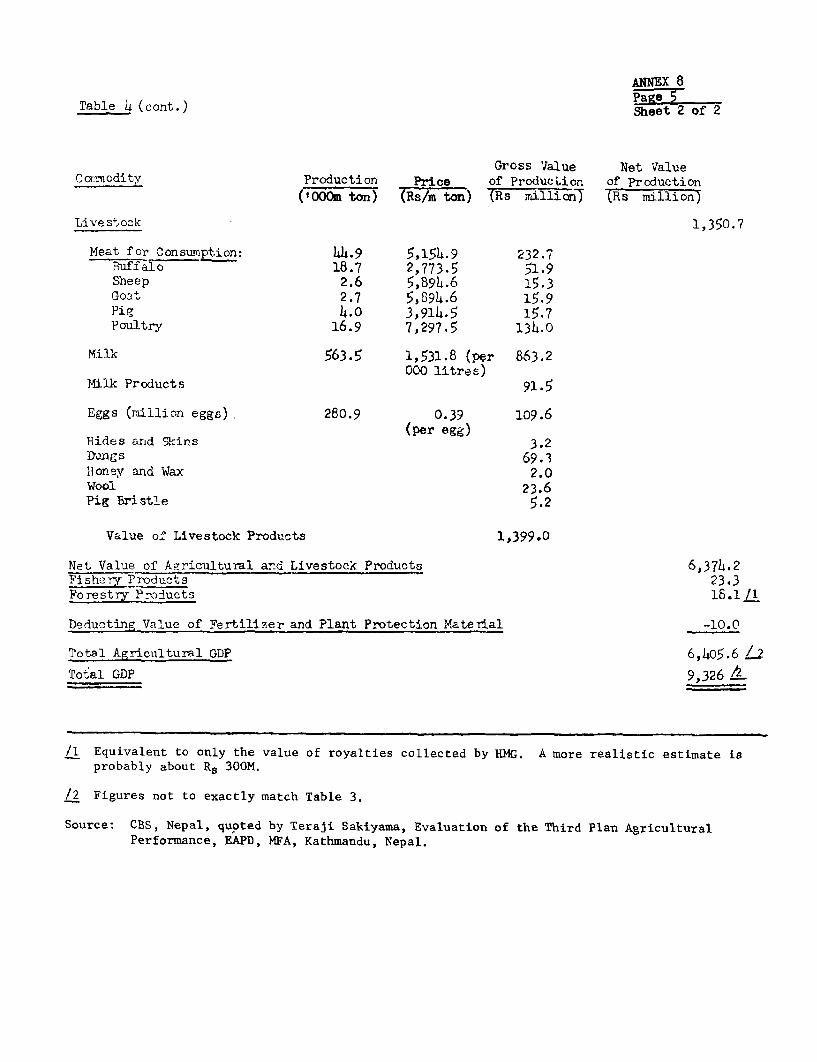
Table 4 (cont.) sheet 2 of 2
Gross 'Value Net ValueCa.modity Production Price of ProducLion of Production
(OOOm ton) (Rs/m ton) (Rs tillicVn (Rs million)
Live s+ock 1,350.7
Meat for Consumption: 44.9 5,154.9 232.7Buffalo 18.7 2,773.5 51.9Sheep 2.6 5,894.6 15.3Goat 2.7 5,S94.6 15.9Pig 4.0 3,914.5 15.7Poultry 16.9 7,297.5 134.0
Milk 563.5 1,531.8 (pQr 863.2000 litres)
Milk Products 91.5
Eggs (million eggs) 280.9 0.39 109.6(per egg)
Hides and 5kins 3.2Bangs 69.3Itoney and Wax 2.0Wool 23.6Pig Bristle 5-2
Value of Livestock Products 1,399.0
Net Value of Agricultural and Livestock Produots 6,374.2Fishery Products 23.3Forestry Products 18.1 A
Deducting Value of Fertilizer and Plant Protection Material -10.0
Total Agricultural GD?P 6,405.6 L2Total GDP 9,326 k
/1 Equivalent to only the value of royalties collected by HMG. A more realistic estimate isprobably about Rs 300M.
/2 Figures not to exactly match Table 3.
Source: CBS, Nepal, quoted by Teraji Sakiyama, Evaluation of the Third Plan AgriculturalPerformance, EAPD, MFA, Kathmandu, Nepal.
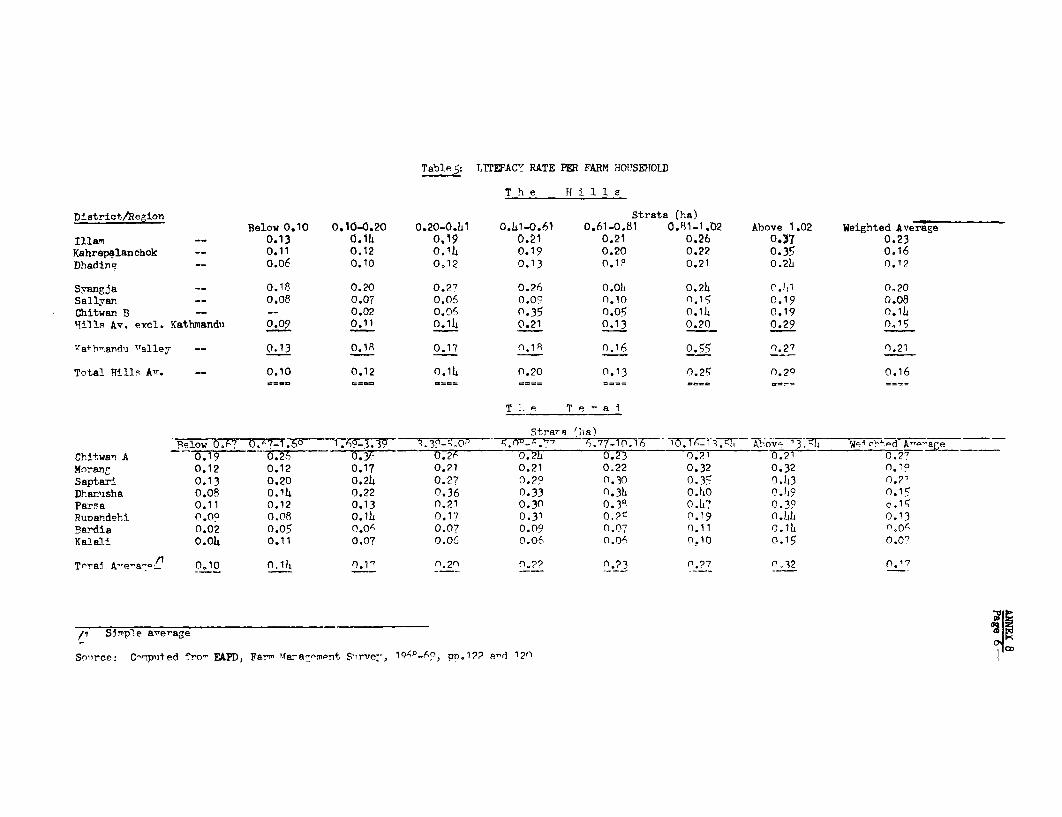
Table 5: LITIEFACMf RATE PER FARM HOTPSEHOLD
T h e H lls 1 S
District/Region Strata (ha)Below 0.10 0.10-0.20 0.20-0.41 0.41-0.61 0.61-0.81 0.91-1.02 Above 1.02 Weighted Average
IMlan __ 0.13 0.14 0.19 0.21 0.21 0.26 0.37 0.23Kahrepalanchok -- 0.11 0.12 o.14 0.19 0.20 0.22 0.35 0.16
Dhadinp __ o.o6 0.10 0.12 0.13 0.10 0.21 0.2h 0.12
Syang4a -- 0.18 0.20 0.27 0.26 0.0L 0.2h 0.1l1 0.20Sallyan -- 0.08 0.07 0.06 0.09 0.10 n.15 0.19 0.08Chitwan B -- -- 0.02 0.06 0.35 0.05 0.14 0.19 0.1hMills Av. excl. Kathmandu 0.09 0.11 0.14 0.21 0.13 0.20 0.29 0.15
Va+1,-and1 "alley -- 0.13 0.18 0.17 n.1R 0.16 0.55 0.27 0.21
Total Hlls Av. _ 0.10 0.12 0.14 0.20 0.13 0.25 0.29 0.16
T h e T erat
Stratr ___a_
Relow 0.67 0.47_1. 33 , s f-; A.7 4.7710.1- 1T.3T1W Abov<T !h W3F Wo t __ ___
Chitwan A 0.19 0.2. 0.2: 0.2L 0.23 0.21 0.2 0
Moranr 0.12 0.12 0.17 0.21 0.21 0.22 0.32 0.32 0 9Saptari 0.13 0.20 0.24 0.27 0.29 0.30 0.35 0.43 0.2'Dhan'isha 0.08 0.14 0.22 0.36 0.33 n.3lk o.lko 0.I49 0.15Parsa 0.11 0.12 0.13 0.21 0.30 0.3R o.L7 0.39 e.11RuDandehi 0.09 0.08 0.14 0.17 0.31 0.pt 0.19 o.hlh 0.13Ba-dia 0.02 0.05 0.04 0.07 0.09 0.07 0.11 0.1h (.04Kalali 0.04 0.11 0.07 0.06 0.06 0.06 0.10 0.15 0.07
T#rai A e-a-'^ 0.10 O.1h 0.*' (X2) o.?? .23 0.27 0, 32 0.17
/ e S Cviplee avera-Fe
Somirce: C-ipilted °ro- EAPD, Far uAaa-mollnt S1rIve,- IQfSP-A°, pp.12?1 srr 12n
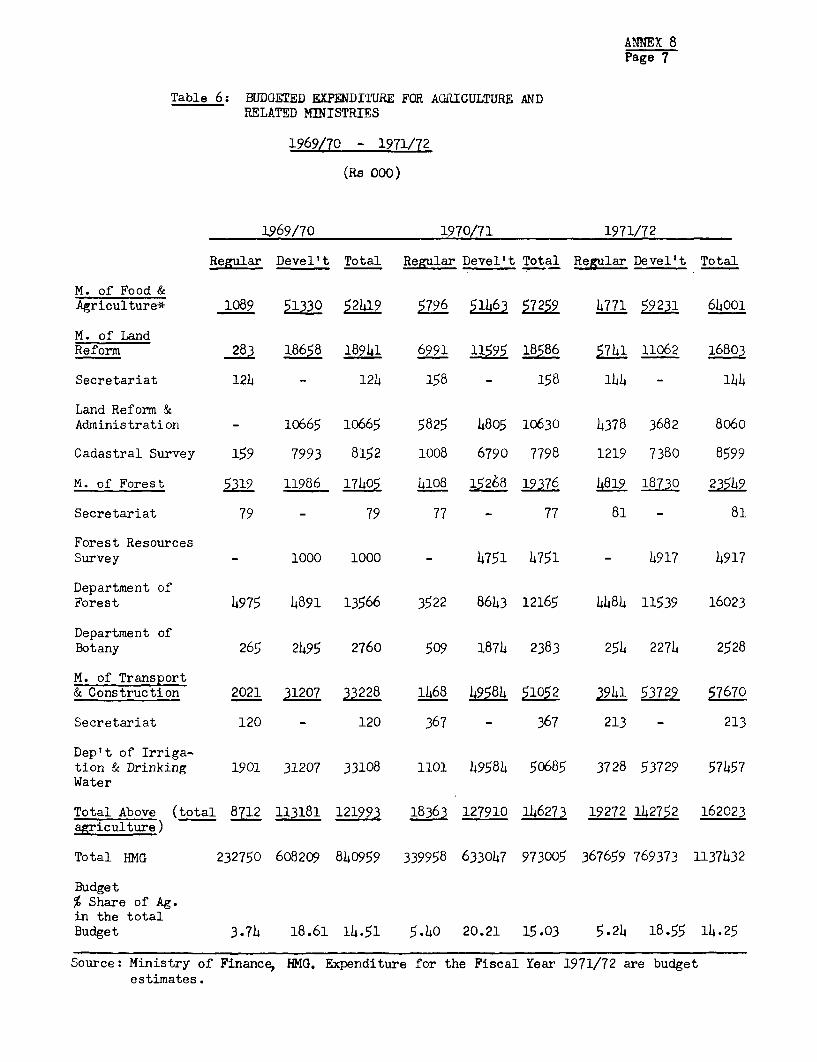
ANNEX 8Page 7
Table 6: BUDGETED EXPENDI'ITRE FOR AGRICULTURE ANDRELATED MINISTRIES
1969/70 - 1971/72
(Rs 000)
1969/70 1970/71 1971/72
Regular Devel't Total Regular Devel't Total Regular Devel't Total
M. of Food &Agriculture* 1089 51330 52419 5796 51-463 57259 4771 59231 64001
M. of LandReform 283 18658 18941 6991 11595 18586 5741 11062 16803
Secretariat 124 - 124 158 - 158 144 - 144
Land Reform &Administration - 10665 10665 5825 4805 10630 4378 3682 8060
Cadastral Survey 159 7993 8152 1008 6790 7798 1219 7380 8599
M. of Forest 5319 11986 17405 4108 12L 19376 4819 18730 23549
Secretariat 79 - 79 77 - 77 81 - 81
Forest ResourcesSurvey - 1000 1000 - 4751 4751 - 4917 4917
Department ofForest 4975 4891 13566 3522 8643 12165 4484 11539 16023
Department ofBotany 265 2495 2760 509 1874 2383 254 2274 2528
M. of Transport& Construction 2021 31207 33228 1468 _49584 51052 3941 53729 57670
Secretariat 120 - 120 367 - 367 213 - 213
Dep't of Irriga-tion & Drinking 1901 31207 33108 1101 49584 50685 3728 53729 57457Water
Total Above (total 8712 113181 121993 18363 127910 146273 19272 1142752 162023agriculture)
Total HMG 232750 608209 840959 339958 633047 973005 367659 769373 1137432
Budget% Share of Ag.in the totalBudget 3.74 18.61 14.51 5.40 20.21 15.03 5.24 18.55 14.25
Source: Ministry of Financew HMG. Expenditure for the Fiscal Year 1971/72 are budgetestimates.
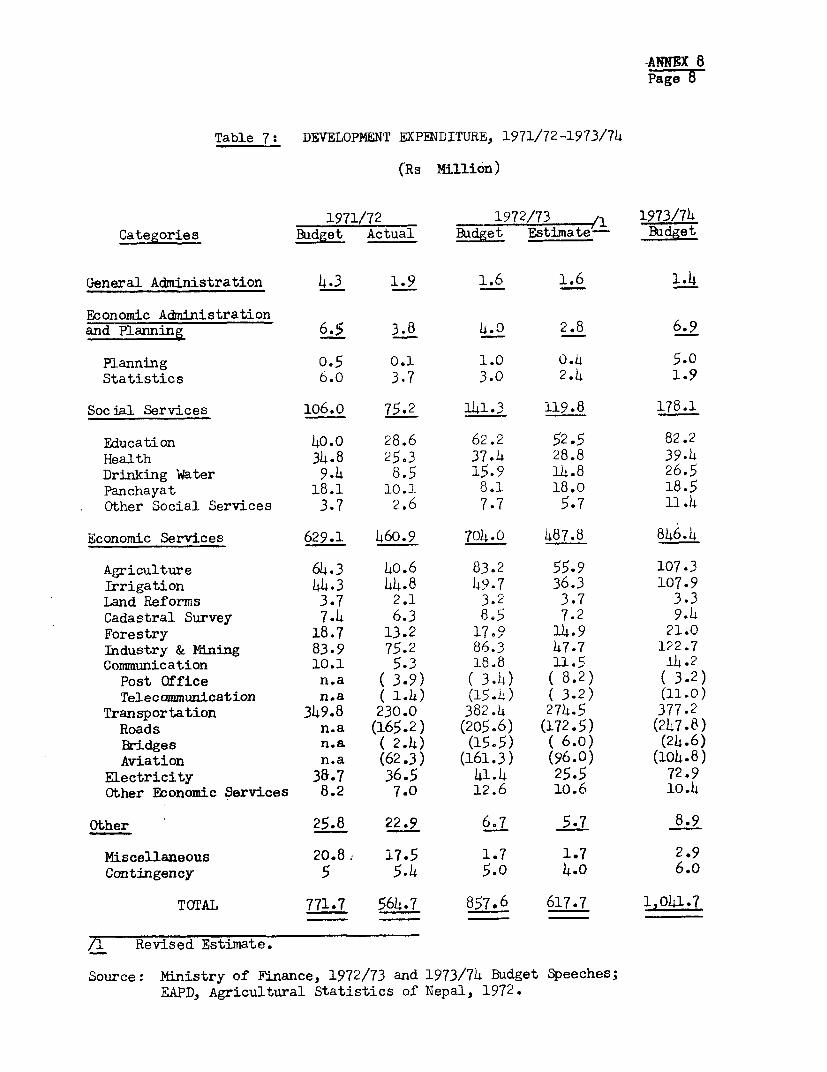
-ANNBX 8Page8
Table 7: DEVELOPMENT EXPENDITURE, 1971/72-1973/74
(Rs Million)
1971/72 1972/73 '1 1973/74Categories Budget Actual Budget Estimate'- Budget
General Administration 4.3 1.9 1.6 1.6 1.4
Economic Administrationand Planning 6.5 3.8 4.0 2.8 6.9
Planning 0.5 0.1 1.0 0.4 5.0Statistics 6.0 3.7 3.0 2.4 1.9
Social Services 1o6.o 75.2 141.3 119.8 178.1
Education 40.0 28.6 62.2 52.5 82.2Health 34.8 25.3 37.4 28.8 39.4Drinking Water 9.4 8.5 15.9 14.8 26.5Panchayat 18.1 10.] 8.1 18.0 18.5Other Social Services 3.7 2.6 7.7 5.7 11.4
Economic Services 629.1 460.9 704.0 487.8 846.4
Agriculture 64.3 40.6 83.2 55.9 107.3Irrigation 44.3 44.8 49.7 36.3 107.9Land Reforms 3.7 2.1 3.2 3.7 3.3Cadastral Survey 7.4 6.3 8.5 7.2 9.4Forestry 18.7 13.2 17.9 14.9 21.0Industry & Mining 83.9 75.2 86.3 47.7 122.7Communication 10.1 5.3 18.8 11.5 14.2
Post Office n.a ( 3.9) ( 3.4) ( 8.2) ( 3.2)Telecommunication n.a ( 1-4) (15-4) ( 3.2) (11.0)
Transportation 349.8 230.0 382.4 274.5 377.2Roads n.a (165.2) (205.6) (172.5) (247.8)Bridges n.a ( 2.4) (15.5) ( 6.0) (24.6)Aviation n.a (62.3) (161.3) (96.0) (104.8)
Electricity 38.7 36.5 41.4 25.5 72.9Other Economic Services 8.2 7.0 12.6 10.6 10.4
Other 25.8 22.9 6.7 5.7 8.9
Miscellaneous 20.8, 17.5 1.7 1.7 2.9Contingency 5 5.4 5.0 4.0 6.o
TOTAL 771.7 564.7 857.6 617.7 1,041.7
/1 Revised Estimate.
Source: Ministry of Finance, 1972/73 and 1973/74 Budget Speeches;EAPD, Agricultural Statistics of Nepal, 1972.
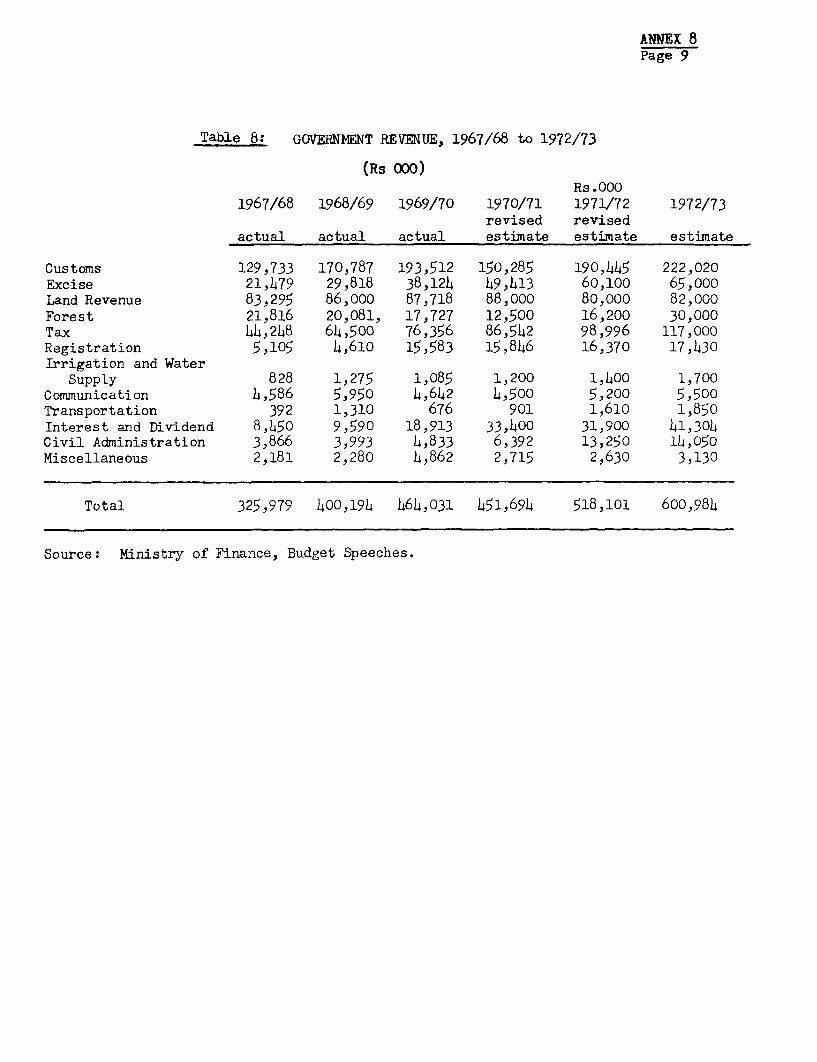
ANNEX 8Page 9
Table 8: GOVERNNENT REVENUE, 1967/68 to 1972/73
(Rs 000)Rs .000
1967/68 1968/69 1969/70 1970/71 1971/72 1972/73revised revised
actual actual actual estimate estimate estimate
Customs 129,733 170,787 193,512 150,285 190,445 222,020Excise 21,479 29,818 38,124 49,413 60,100 65,000Land Revenue 83,295 86,ooo 87,718 88,000 80,000 82,000Forest 21,816 20,081, 17,727 12,500 16,200 30,000Tax 44,248 64,500 76,356 86,542 98,996 117,000Registration 5,105 4,610 15,583 15,846 16,370 17,430Irrigation and Water
Supply 828 1,275 1,085 1,200 1,400 1,700Communication 4,586 5,950 4,642 4,500 5,200 5,500Transportation 392 1,310 676 901 1,610 1,850interest and Dividend 8,450 9,590 18,913 33,400 31,900 41,304Civil Administration 3,866 3,993 4,833 6,392 13,250 14,050Miscellaneous 2,181 2,280 4,862 2,715 2,630 3,130
Total 325,979 400,194 464,031 451,694 518,101 600,984
Source: Ministry of Finance, Budget Speeches.
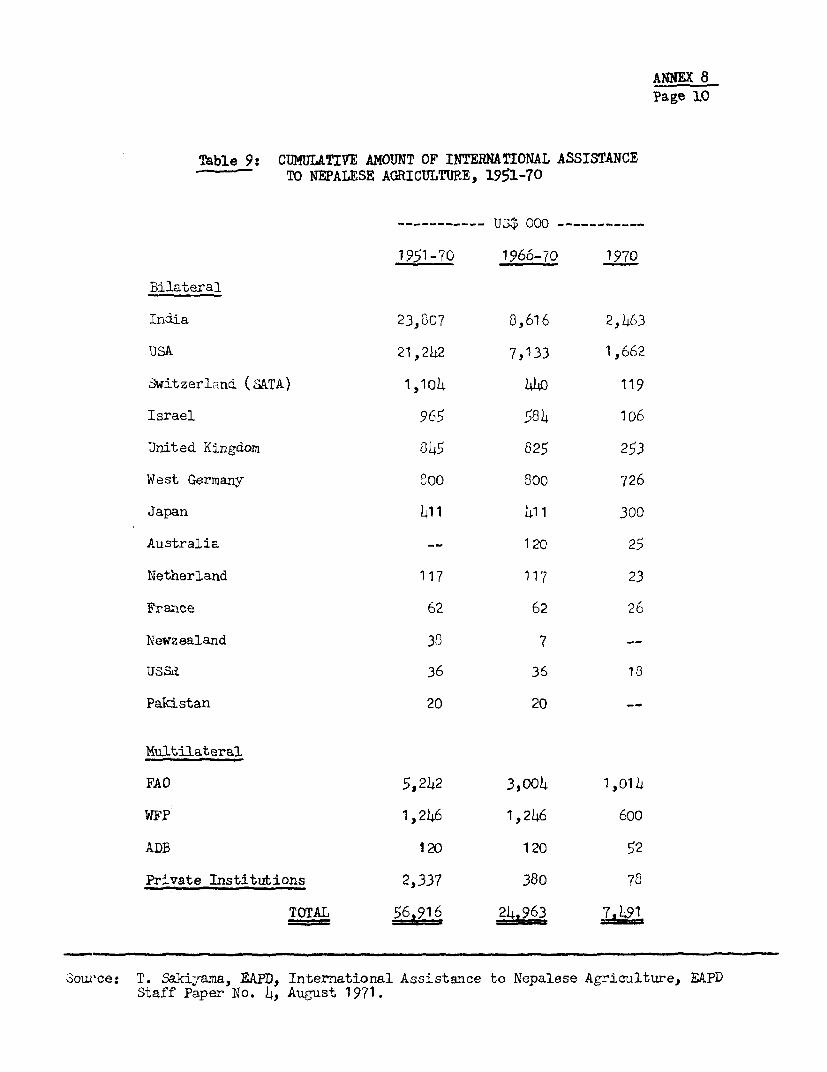
ANNEX 8Page 10
Table 9: CUMULATIVE AMOUNT OF INTER1fiONAL ASSISTANCETO NEPALESE AGRICULTURE. 1951-7O
-- - - - - uolp C OO ----------- _
19$1-70 1966-70 1970
Bilateral
India 23,S07 8,616 2,h63
USA 21 , 242 7,133 1,662
Switzerland (sSATA) 1, 1o h1 1 119
Israel 965 584 1o6
United Kingdom 945 825 253
West Germany o00 800 726
Japan L11 411 300
Australia -- 120 22
Netherland 117 117 23
France 62 62 26
Newzealand 3Z3 7 --
USSLd 36 36 13
Pakistan 20 20 --
Mu.t1tilateral
FAO 5,242 3,oo4 1,01T
WFP 1, 246 1,246 600
ADD 120 120 52
Private Institiuions 2,337 380 78
TOTAL 56 916 2h963 7
Couwce: T. Sakiyana, EAPV, International Assistance to Nepalese Agriculture, EAPDStaff Paper No. 4, August 1971.
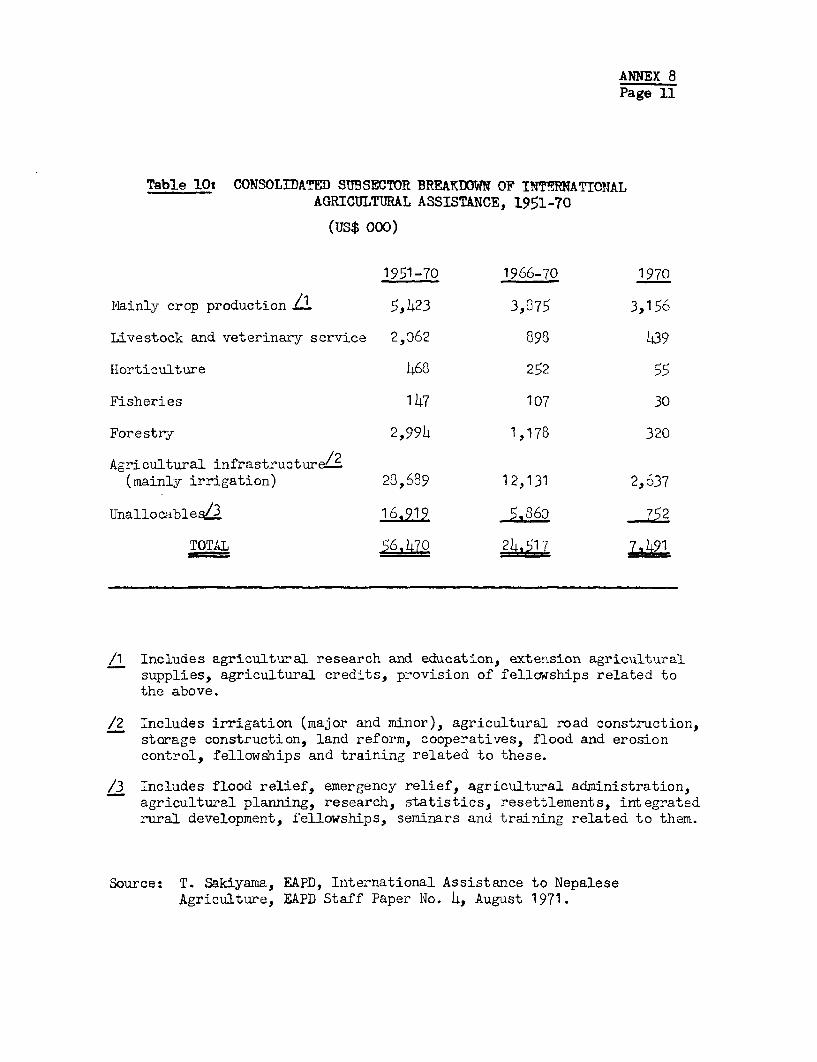
ANNEX 8Page 11
Table lOt CONSOLIDATED SUB SECTOR BREAKDOWN OF INTERNATTONALAGRICULTURAL ASSISTANCE, 1951-70
(US$ 000)
1951-70 1966-70 1970
Plainly crop production /1 5,423 3,275 3,156
Livestock and veterinary service 2,062 898 439
Horticulture 68 252 55
Fisheries 147 107 30
Forestry 2,99h 1,178 320
Agricultural infrastructure/2(mainly irrigation) 23,689 12,131 2,637
Unallocables/3 16,919 5.860 752
TOTAL 56.470 2h.517 7,L91
/1 Includes agricultural research and education, extension agriculturalsupplies, agricultural credits, provision of fellawships related tothe above.
/2 Includes irrigation (major and minor), agricultural road construction,storage construction, land reform, cooperatives, flood and erosioncontrol, fellowships and training related to these.
/3 Includes flood relief, emergency relief, agricultural administration,agricultural planning, research, statistics, resettlements, integratedrural development, fellowships, seminars and training related to them.
Source: T. Sakiyama, EAPD, International Assistance to NepaleseAgriculture, EAPD Staff Paper No. 4, August 1971.
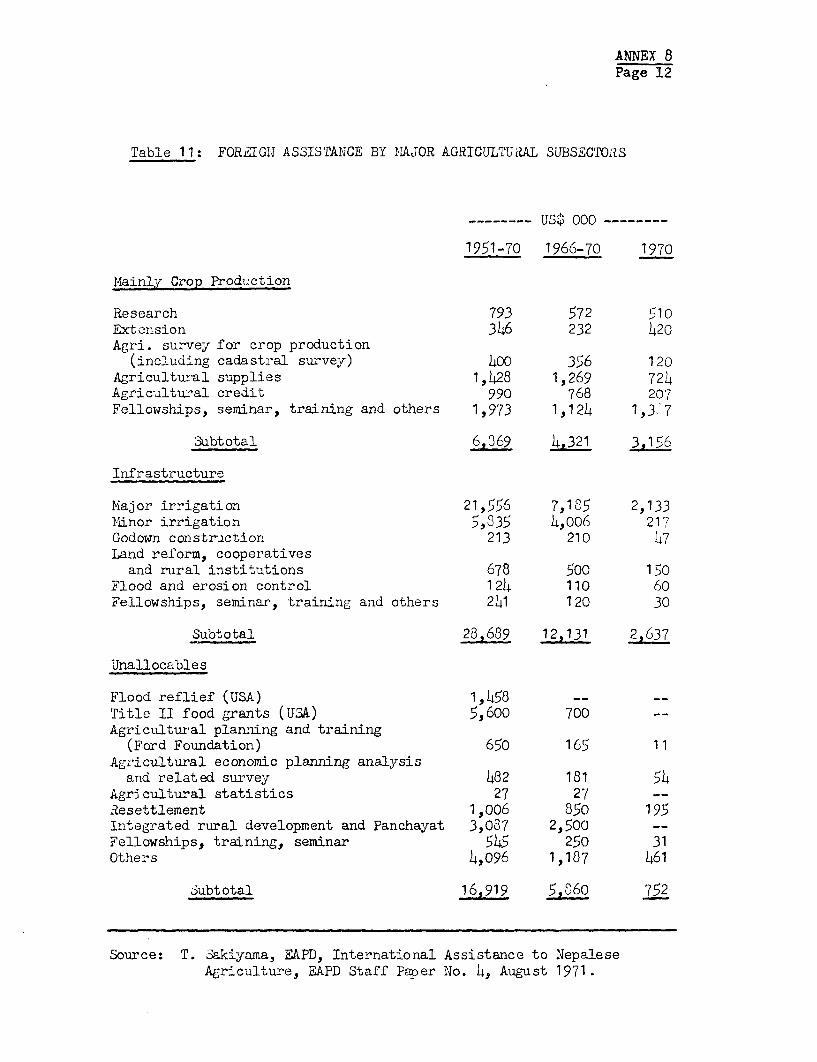
ANNEX 8Page 12
Table 11: FORZTGN ASSISTANCE BY MAJOR AGRICULTUIL SUBSECTOiRS
----- us$ ooo --------
1951-70 1966-70 1970
Mlainly Crop Production
Research 793 572 51oExtenision 346 232 420Agri. survey for crop production
(includlng cadastral survey) 400 356 120Agricultural supplies 1,1428 1,269 724Agricultural credit 990 768 207Fellowships, seminar, training and others 1 ,973 1 ,124 1),3)7
Subtotal 6,369 4,321 3,156
Infrastructure
Major irrigation 21,556 7,185 2,133Minor irrigation 5,335 4,006 217Godown construction 213 210 47Land reform, cooperatives
and rural institutions 678 500 150Flood and erosion control 124 110 60Fellowships, seminar, training and others 241 120 30
Subtotal 28,689 12,131 2,637
Unallocables
Flood reflief (USA) 1,458 -- --
Title II food grants (USA) 5,600 700 --Agricultural planning and training
(Ford Foundation) 650 165 11Agricultural economic planning analysis
and related survey 482 181 54Agricultural statistics 27 27 --
Resettlement 1,006 850 195Integrated rural development and Panchayat 3,087 2,500 --Fellowships, training, seminar 545 250 31Others 4,o96 1,187 461
Subtotal 16,919 5,660 752
Source: T. Sakiyama, EAPD, International Assistance to NepaleseAgriculture, EAPD Staff Paper No. 4, August 1971.
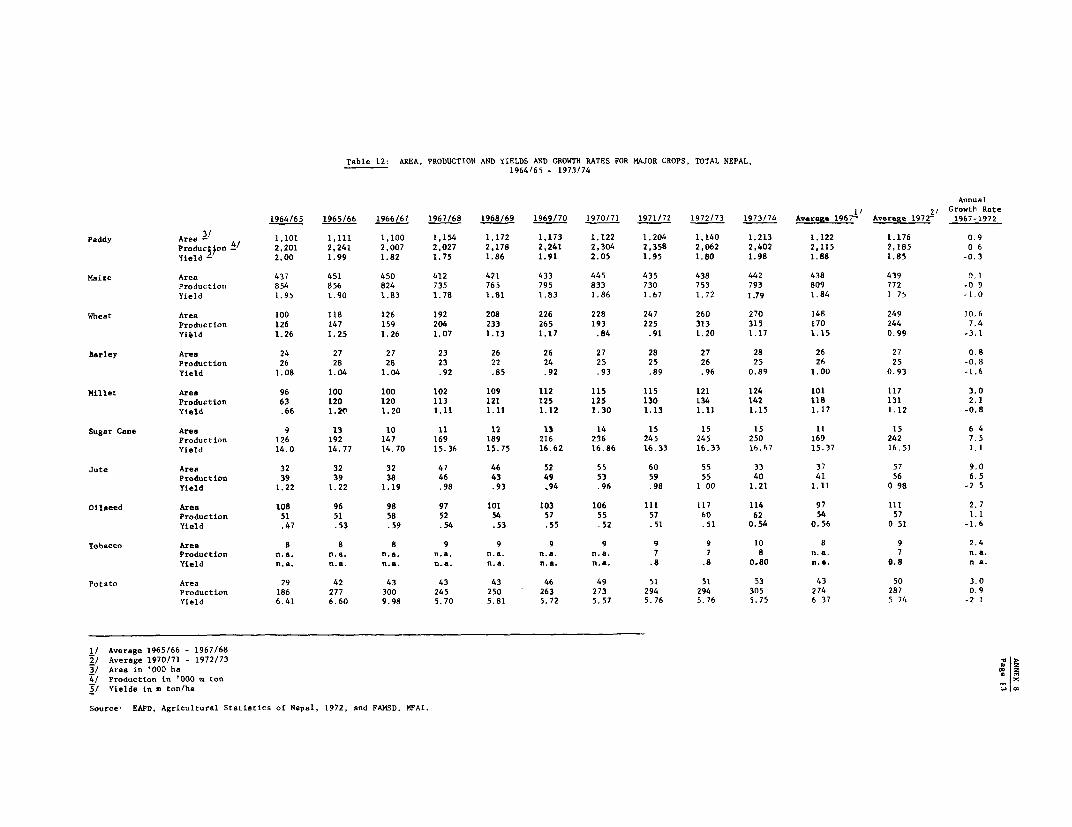
Table 12: AREA. PRODUCTION AND YIELDS AND GROWTIi RATES FOR MAJOR CROPS, TOTAL NEPAL,1964/65 - 1973/74
Annual
1964/65 1965166 1966/67 1967/68 1968/69 ~ ~ ~ ~ ~ ~ ~ ~ ~ ~ ~ 1,2/ Growth Rate1964/65 1965/66 1966/67 1967/68 1968/69 1969/70 1970/71 1971/72 1972/73 1973/74 Average 196. Average 1972- 1967-1972
Paddy Area - 1,101 1,111 1,100 1,154 1,172 1,173 1,122 1,204 1,140 1,213 1,122 1.176 0.9Producton 4/ 2 201 2,241 2,007 2,027 2,178 2,241 2,304 2,358 2,062 2,402 2,115 2,185 0 6Yield- 2.00 1.99 1.82 1.75 1.86 1.91 2.05 1.95 1.80 1.98 1.88 1.85 -0.3
Maize Area 437 451 450 412 421 433 445 435 438 442 438 439 0.1Production 854 856 824 735 765 795 833 730 753 793 809 772 -0 9Yield 1.95 1.90 1.83 1.78 1.81 1.83 1.86 1.67 1.72 1.79 1.84 1 75 -1.0
Wheat Area 100 118 126 192 208 226 228 247 260 270 148 249 10.6Production 126 147 159 204 233 265 193 225 313 315 170 244 7.4Yi6ld 1.26 1.25 1.26 1.07 1.13 1.17 .84 .91 1.20 1.17 1.15 0.99 -3.1
Barley Area 24 27 27 23 26 26 27 28 27 28 26 27 0.8Production 26 28 28 23 22 24 25 25 26 25 26 25 -0.8Yield 1.08 1.04 1.04 .92 .85 .92 .93 .89 .96 0.89 1.00 0.93 -1.6
Millet Area 96 100 100 102 109 112 115 115 121 124 101 117 3.0Production 63 120 120 113 121 125 125 130 134 142 118 131 2.1Yield .66 1.2p 1.20 1.11 1.11 1.12 1.30 1.13 1.11 1.15 1.17 1.12 -0.8
Sugar Cane Area 9 13 10 11 12 13 14 15 15 15 11 15 6 4Production 126 192 147 169 189 216 236 245 245 250 169 242 7.5Yield 14.0 14.77 14.70 15.36 15.75 16.62 16.86 16.33 16.33 16.67 15.37 16.51 1.1
Jute Area 32 32 32 47 46 52 55 60 55 33 37 57 9.0Production 39 39 38 46 43 49 53 59 55 40 41 56 6.5Yield 1.22 1.22 1.19 .98 .93 ,94 .96 .98 1 00 1.21 1.11 0 98 -2 5
Oilseed Area 108 96 98 97 101 103 106 111 117 114 97 111 2.7Production 51 51 58 52 54 57 55 57 60 62 54 57 1.1Yield .47 .53 .59 .54 .53 .55 .52 .51 .51 0.54 0.56 0 51 -1.6
Tobacco Area 8 8 8 9 9 9 9 9 9 10 8 9 2.4Production n.a. n.a. n.a, n.a. n.a. n.a. n.a. 7 7 8 n.a. 7 n.a.Yield n.a. n.a. n.a. n.a. n.a. n.e. n.e. .8 .8 0_80 n.a. 0.8 n a.
Potato Area 29 42 43 43 43 46 49 51 51 53 43 50 3.0Production 186 277 300 245 250 263 273 294 294 305 274 287 0.9Yield 6.41 6.60 9.98 5.70 5.81 5.72 5.57 5.76 5.76 5.75 6 37 5 74 -2 1
1/ Average 1965/66 - 1967/682/ Average 1970/71 - 1972/733/ Area in '000 ha b4/ Production in '000 m ton5/ Yields in m ton/ha
C
Source EAPD, Agricultural Statistics of Nepal, 1972, and FAMSD, MFAI.
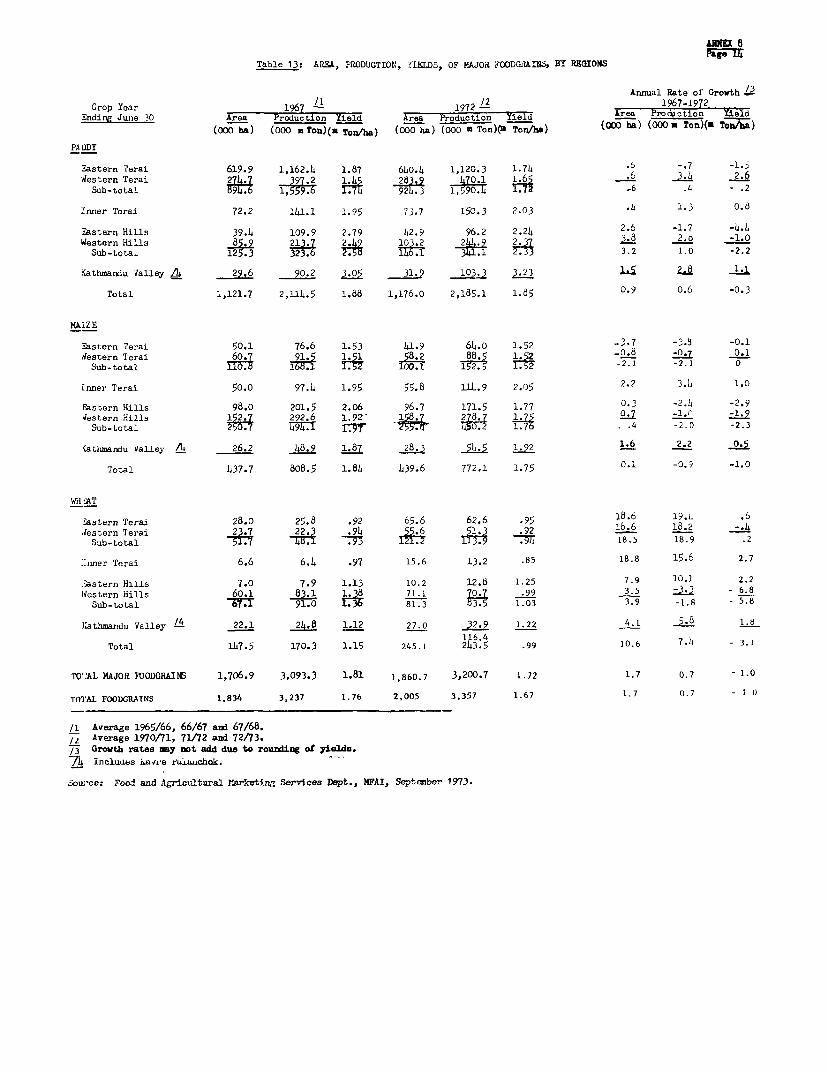
Table 13: AREA, PRODUCTION, TIELDS, OF MAJOi FOODGRAIIS, BY REGIONS
Annual Rate of Grovth LCrop Year 1967 - 1972 L2
Ending Junle 30 ProductionYisldArea Production Yield Area Production Yield(000 ha) (000 m Ton)(m Ton/ha) (000 ha) (000 3 Ton)(f Ton/ha) (000 ha) (000 * Ton)(3 Tonba)
PA DDY
Eastern Terai 619.9 1,162.4 1.87 640.4 1,120.3 1.74 .6 -.7 -1.5destern Terai 274.7 397.2 1.45 263.9 470.1 1.65 .6 3.4 2.6
Sub-total o 94.6 1 3,75 926. 1,590.4 .72 .6 .4 - .2
Inner Terai 72.2 141.1 1.95 73.7 150.3 2.03 . 1.3 0.6
Eastern Hills 39.4 109.9 2.79 42.9 96.2 2.24 2.6 -1.7 -4.LWestern Hills 3 249 103.2 244.9 2.37 3. 2.d -1.0
Sub-total 12.3 323.6 238 3flI 3 2.33 3 .2 1.0 -2.2
Kathmaodu Valley A 29.6 90.2 3.05 31.9 103.3 3.23 Li 2. a. 1
Total 1,121.7 2,114.5 1.88 1,176.0 2,185.1 1.65 0.9 o.6 -0.3
MAIZE
Eastern Terai 50.1 76.6 1.53 41.9 64.o 1.52 -3.7 -'.S -0.1destern Terai 60. 91,§ 1.51 58.2 88.5 1.52 _o.8 -0.7 0.1Sub-total 110.8 SgY4i 1.52 100.1 78. 5 -2.1 -2.1 0
Inner Terai 50.0 97.4 1.95 55.8 114.9 2.05 2.? 3.4 1.0
Eastern Hills 98.0 201.5 2.06 96.7 171.5 1.77 0.3 -2.4 -2.9Western Hills 152.7 292.6 1.92- 10.7 278.7 1.75 -1.0 1.9Sub-total f77 45 Ii0.2 1.76 .4 -2.D -2.3
fathmandu Valley A 26.2 40.9 1.87 28.3 5 1.92 1.6 2.2 0.5
Total 437.7 808.5 1.84 439.6 772.1 1.75 0.1 -O.i -1.0
WH AT
3astern Terai 28.0 25.8 .92 65.6 62.6 .95 18.6 19.81 .6festern Terai 23.7 22.3 .94 55.6 51.3 .92 10.6 18.2 -.4Sub-total 51.7 4d. .79 121.2 113. 797 18.5 18.9 .2
:nner Terai 6.6 6.4 .97 15.6 13.2 .85 18.8 15.6 2.7
.?astern Hills 7.0 7.9 1.13 10.2 12.8 1.25 7.9 10.1 2.2lWestern Hills 60.1 83.1 1.38 71.1 70-7 .99 3.5 3 - 6.8
Sub-total 67. 91.0 1.36 81.3 °3.5 1.03 3.9 -1.8 - 5.8
Jathmandu Valley /4 22.1 24.8 1.12 27.0 32.9 1.22 4.1 5.a 1.8116.4
Total 167.5 170.3 1.15 245.1 263.5 .99 10.6 7.4 - 3.1
To'`AL MAJOR FOODGRAINS 1,706.9 3,093.3 1.81 1,860.7 3,200.7 1.72 1.7 0.7 - 1.0
TOT'AL FOODGRATNS 1,834 3,237 1.76 2.005 3,357 1.67 1.7 0.7 - 1 I
/1 Average 1965/66, 66/67 and 67/68./2 Average 1970t71, 71/72 and 72/73./3 Growth rates my mnt add due to rounding of yields.74 Incluues Nsavre reaachok.
Sowuce: Food and Agricultural merketing Services Dept., MFAI, September 1973.
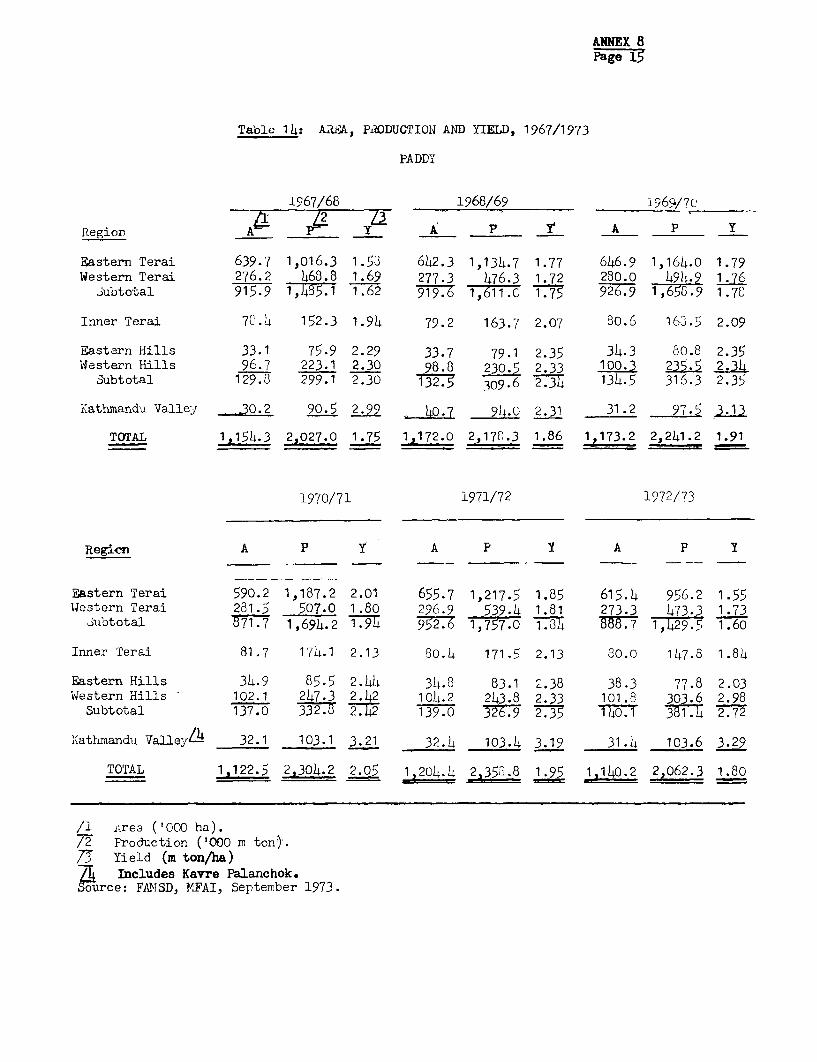
ANNEX 8Page 15
Table 14: AREvA, PRODUCTION AND YTIELD, 1967/1973
PADDI
1567/68 1968/69 19966/7c
Region A _ F- _Y A P _ A P Y
Eastern Terai 639.7 1,016.3 1.53 642.3 1,134.7 1.77 646.9 1,164.0 1.79Western Terai 276.2 468.8 1.69 277.3 476.3 1.72 280.0 494.9 1.76
jubtotal 915.9 1,435.1 1.62 919.6 1,611.0 1.75 1,658.9 1.70
Inner Terai 7£.4 152.3 1.94 79.2 163.7 2.07 30.6 163.5 2.09
Eastern Hills 33.1 75.9 2.29 33.7 79.1 2.35 34.3 80.8 2.35Western Hills 96.7 223.1 2.30 98.£ 230.5 2.33 100.3 235.5 2.3
Subtotal 129.3 299.1 2.30 309-6 2.34 134.5 316.3 2.35
Kathmanda Valley 30.2 90.5 2-99 40.7 94.0 2.31 31.2 97.5 3 1j
TOTAL 1,154.3 2,027.0 1.75 1,172.0 2,17£.3 1.86 1,173.2 2,241.2 1.91
1970/71 1971/72 1972/73
Regicn A P A P Y A P I
Eastern Terai 590.2 1,187.2 2.01 655.7 1,217.5 1.85 615.4 956.2 1.55Western Terai 281.5 507.0 1.80 296.9 539.4 1.81 273.3 473.3 1.73
Jubtotal 1,694.2 1.94 92. 1,757.0 1.34 1,429.5 1 .
Inner Terai 81.7 174.1 2.13 80.4 171.5 2.13 80.0 147.8 1.84
Eastern Hills 34.9 85.5 2.44 34.8 83.1 2.38 38.3 77.8 2.03Western Hills - 102.1 247.3 2.42 104.2 243.8 2.33 101.8 303.6 2.98
Subtotal 137.0 332.8277 139.0 327.9 2.35 140.1 381.4 2.72
Kathmandu Valle I 32.1 103.1 3.21 32.4 103.4 3.19 31.4 103.6 3.29
TOTAL 1,122.5 2,304.2 2.05 1,204.4 2,358.3 1.95 1,140.2 2,062.3 1.80
/1 area ('000 ha).75 Production ('000 E ton)).ZT Yield (m ton/ha)7 Includes Kavre Palanchok.Source: FAMSD, IMFAI, Septenber 1973.
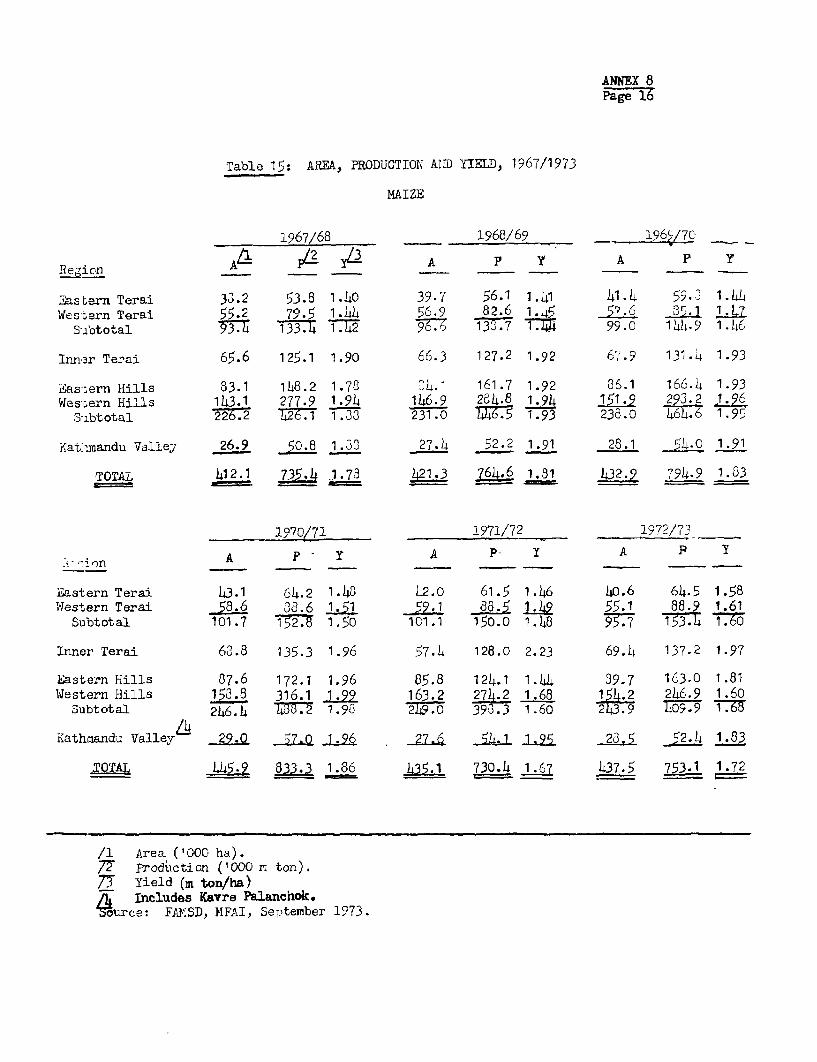
ANNEX 8Page 16
Table 15: AREA, PRODUCTION A1.D YIELD, 1967/1973
MAIZE
1967/68 1965/69 _ 196/7C
Region AA y A P Y A P Y
E astern Terai 3v3.2 53.8 1.40 39.7 56.1 1.41 41.4 59.3 1.4. 4
Western Terai 55.2 79.5 1.44 56.9 82.6 157.6 35.1 1j7
STbtotal 93.4 133. -1.2 96.6 133.7 1.44 99.0 144.9 1.46
Innar Terai 65.6 125.1 1.90 66.3 127.2 1.92 6'.9 131.4 1.93
E:astern Hills 83.1 148.2 1.73 34.1 161.7 1.92 86.1 166.4 1.93
Western Hiills 143.1 277.9 1.94 146.9 2S48 1.94 151.9 293 .96Slubtotal 226.2 726.1 133 231.0 74.5 1.93 238.0 464.6 1.95
Xatlimandu Valleyj 26.9 50.8 1.38 27.4 52.2 1.91 28.1 54.0 1.91
TOTAL 412.1 735.4 1.73 421.3 764.6 1.81 432.9 794.9 1.53
1970/71 1971/72 _ 9Q72/73
on A PA P- Y A P I
iastern Teral 43.1 64.2 1.43 42.0 61.5 1.46 40.6 64.5 1.58W4lestern Terai 58.6 33.6 1.51 59 88.5 1.49 55.1 88.9 1.61
Subtotal 101.7 152.8 1.50 101.1 150.0 1.48 4957- 153.4 1 .O
Inner Terai 63.8 135.3 1.96 57.4 128.0 2.23 69.4 137.2 1.97
Eastern Hills 37.6 172.1 1.96 85.8 124.1 1.44 39.7 163.0 1.81
Western Hills 153.8 316.1 1.92 163.2 274.2 1.68 154.2 246.9 1.60
Subtotal 246.h = 1.93 249.0 3 3 1.60 09.9 =1
Katheandu ValleyA 29.0 57-0 1.96 27. - 1..25. 23.5 52.4 1.83
s'oTAL ~445-Z 833.3 1.86 435.1 730.4 1.67 437.5 753. 1.72
/1 Area. (1000 ha).75 'rodLiction (1000 n ton).7T Yield (in ton/ha)fh Includes Kavre Palanichok.
o0urce: FARISD, MFAI, September 1973.
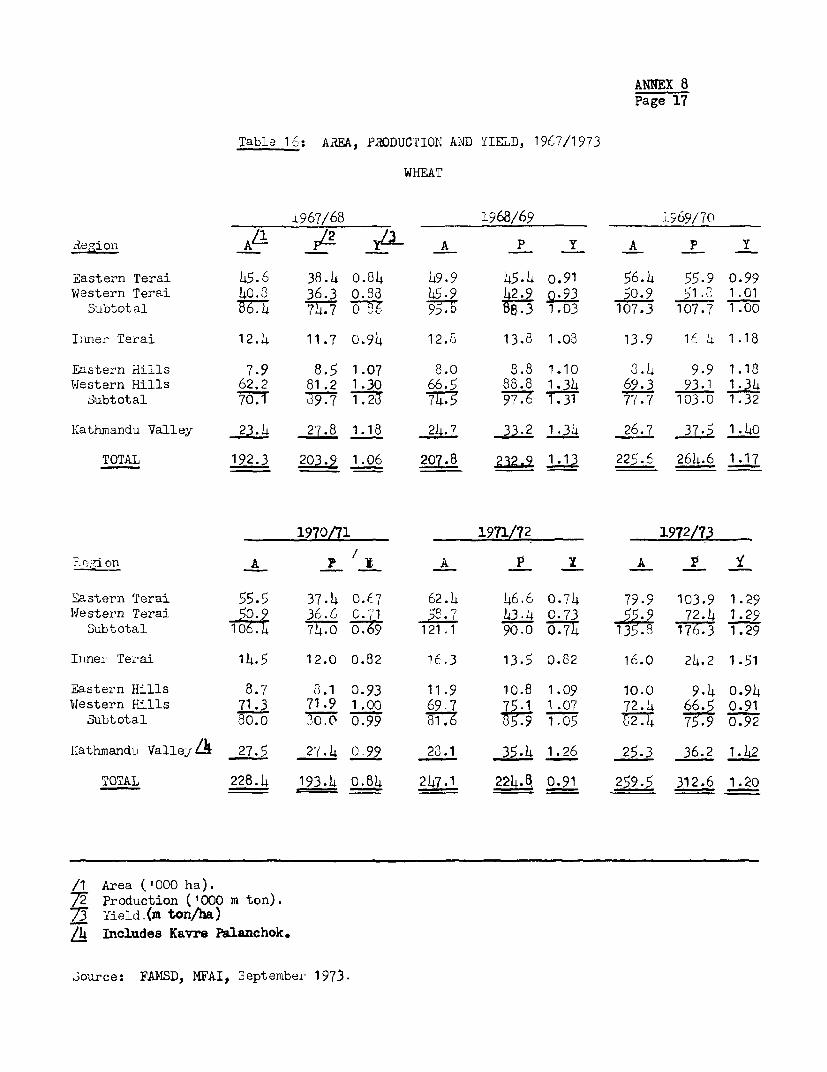
ANNEX 8Page 17
Table 1c,: AUEA, PRODUCTION AND YIELD, 1967/1973
WHEAT
i967/68 1968/69 1969/70
.ieaiolA A ___ A P Y A P Y
Eastern Terai 45.6 38.4 0.04 49.9 45.4 o.91 56.4 55.9 0.99Western Terai 40.8 36.3 0.83 45.9 42-9 p.93 50.9 -2.:, 1.01
Subtotal 74 .7 0 36 98.3 1.03 107.3 107.7 1.00
Inner Terai 12.4 11.7 0.94 12. 13.8 1.08 13.9 16 4 1.18
Eastern Hills 7.9 8.5 1.07 8.0 8.8 1.10 3.4 9.9 1.13Western Hills 62.2 81.2 1.30 66.5 88.8 1.34 69.3 93.1 1.34
Subtotal 70.1 771.275 7. 1?F 77 103.0 1.32
Kathmandu Valley 23.4 27.8 1.18 226.7 33.2 1-34 267 37.5 1.40
TOTAL 192.3 203.,9 1.06 2_ 232.9 1.13 225.6 264.6 1.17
1970/71 1971/72 1972/73
____ onA P I A P Y A _ _
Eastern Terai 55.5 37.4 0.,7 62.4 46.6 0.74 79.9 103.9 1.29Western Terai 5o.9 36.6 0.71 58._ 7 43.4 0.73 55. 9 72.4 1.29
Subtotal 10 7T74.o 0o.69 121.1 90.0 0.77 135.3 t76 1.29
Irinel' Terai 14.5 12.0 0.82 16.3 13.5 0.52 16.0 24.2 1.51
Eastern Hills 8.7 3.1 0.93 11.9 10.8 1.09 10.0 9.4 0.94Western Hills 71.3 71.9 1.00 69 7 75.1 1.07 72.4 66.5 0.91
Subtotal 7ThT7 0.99 81.6 35.9 1.05 72. 79 0.92
Kathmanduj Valley A 27.5 27.4 0 99 23.1 35.4 1.26 25.3 36.2 1.42
TOTAL 228.4 193.4 0.84 247.1 224.8 0.91 259.5 312.6 1.20
/1 Area ('000 ha).7T Production ('000 m ton).B 'Yield.(m ton/ha)/4 Includes Kavre Palanchok.
3ource: FAMSD, 1AFAI, September 1973.
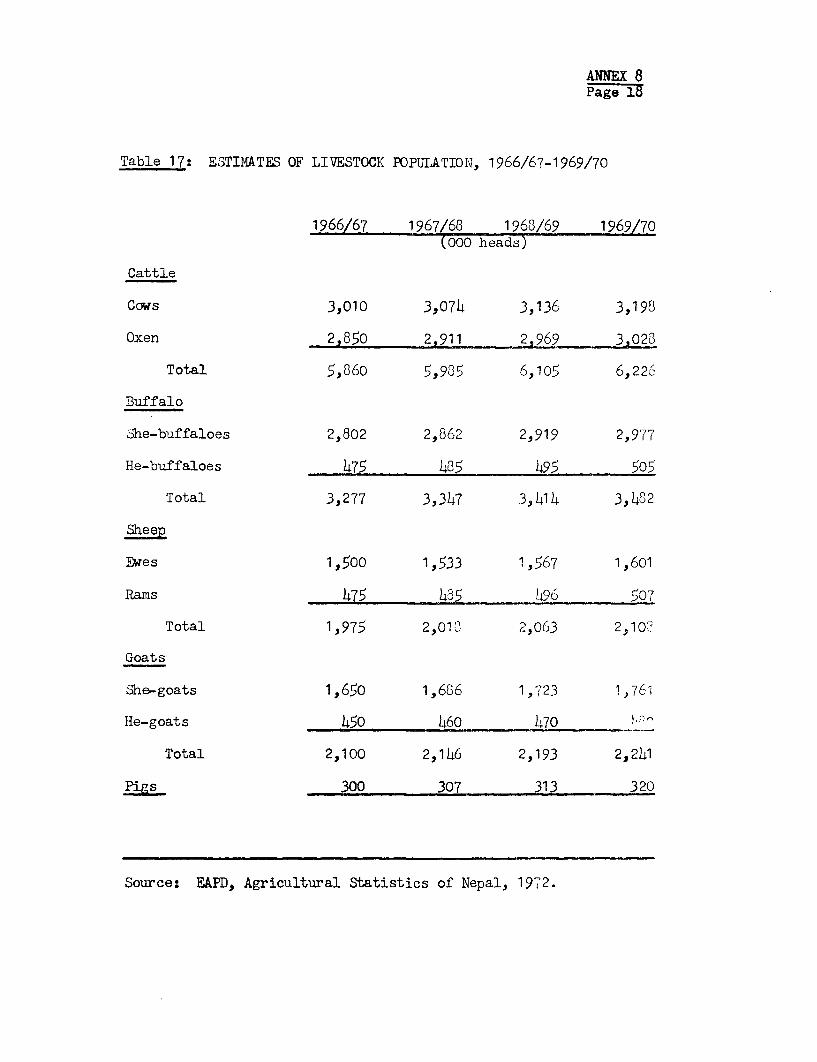
ANNEX 8Page 18
Table 17: ESTIMATES OF LIVESTOCK POPULATION, 1966/67-1969/70
1966/67 1967/68 1968/69 1969/70(000 heads)
Cattle
Cows 3,010 3,074 3,136 3,198
Oxen 2,850 2,911 2,969 3,102
Total 5,860 5,935 6,105 6,226-S
Buffalo
-he-buffaloes 2,802 2,862 2,919 2,977
He-buffaloes 475 485 495 505
Total 3,277 3,347 3,414 3,482
Sheep
Ewes 1,500 1,533 1,567 1,601
Rams 475 485 496 507
Total 1,975 2,012 2,063 2,102
Goats
She-goats 1,650 1,686 1,723 1,761
He-goats 450 460 470
Total 2,100 2,146 2,193 2,241
Pigs 300 307 313 320
Source: EAPD, Agricultural Statistics of Nepal, 1972.
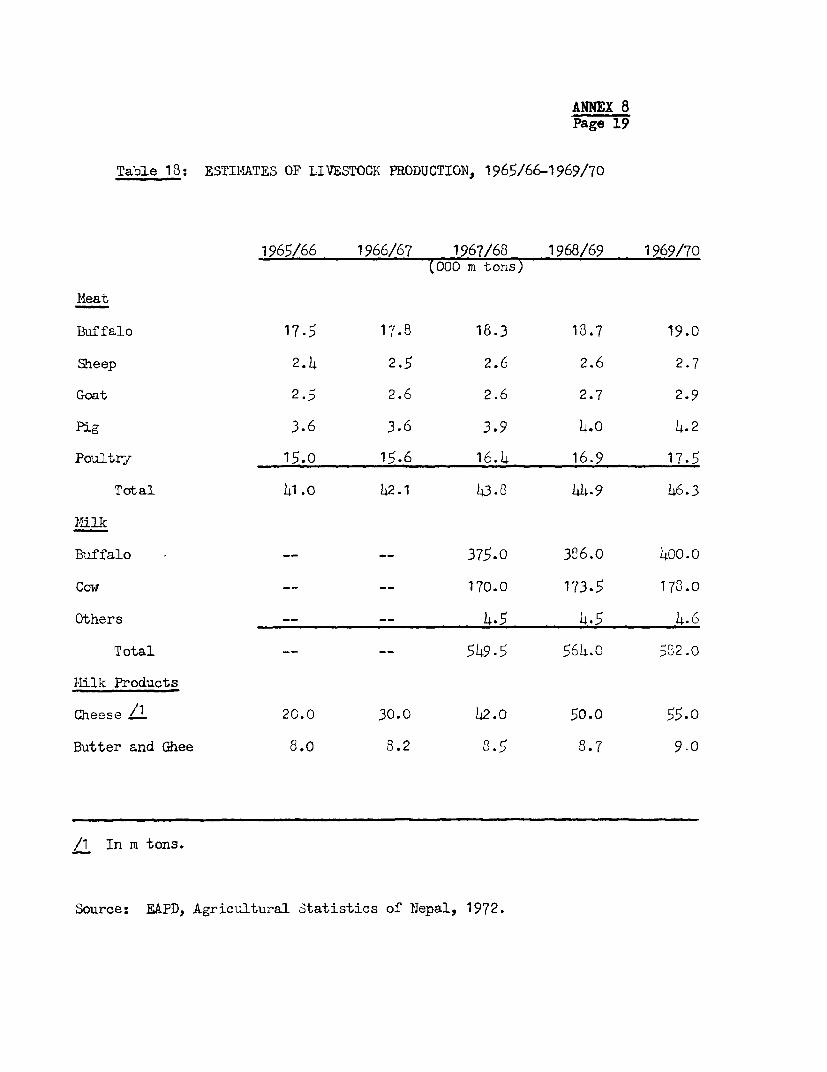
ANNEX 8Page 19
Table 13: ESTIRATES OF LIVESTOCK PRODUCTION, 1965/66-1969/70
1965/66 1966/67 1967/68 1968/69 1969/70(000 m tons)
Meat
Buffalo 17.5 17.8 18.3 18.7 19.0
Sheep 2.4 2.5 2.6 2.6 2.7
Goat 2.5 2.6 2.6 2.7 2.9
Pig 3.6 3.6 3.9 4.0 4.2
Poultry 15.0 15.6 16.4 16.9 17.5
Total 41.0 42.1 43.8 44.9 46.3
Milk
Buffalo -- -- 375.0 326.0 400.0
Cow -- -- 170.0 173.5 173.0
Others -- -- 4.5 4.5 4.6
Total -- -- 549.5 564.0 5'i2.0
lilk Products
Cheese /1 20.0 30.0 42.0 50.0 55.0
Butter and Ghee 8.0 3.2 8.5 8.7 9.0
/1 In m tons.
Source: EAPD, Agricultural Statistics of Nepal, 1972.
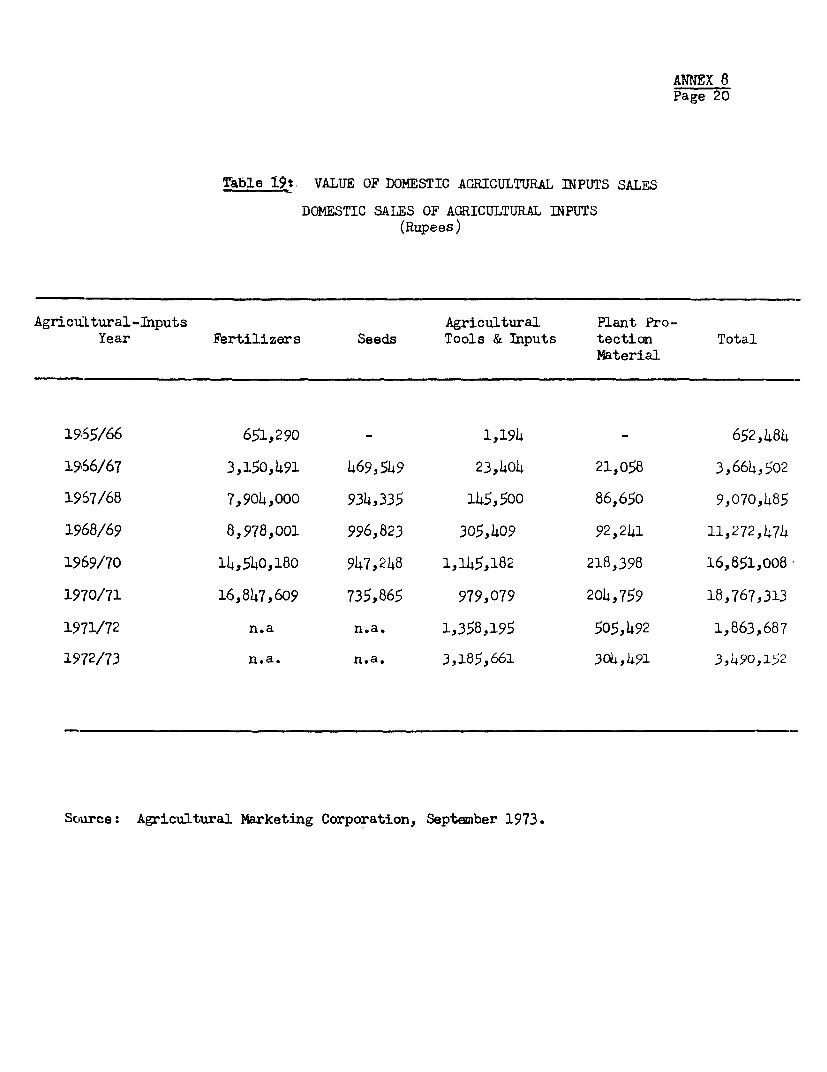
ANNEX 8Page 20
Trable 19: VALUE OF DOMESTIC AGRICULTURAL INPUTS SALES
DOMESTIC SALES OF AGRICULTURAL INPUTS(Rupees)
Agricu.Ltural-Inputs Agricultural Plant Pro-Year Fertilizers Seeds Tools & Inputs tection Total
Material
19655/66 651,290 - 1,194 - 652,484
19656/67 3,150,491 469,549 23,404 21,058 3,664,502
1967/68 7,904,000 934,335 145,500 86,65o 9,070,485
1968/69 8,978,001 996,823 305,409 92,241 11,272,474
1969/70 14,540,180 947,248 1,145,182 218,398 16,851,008
1970/71 16,847,609 735,865 979,079 204,759 18,767,313
1971/72 n.a n.a. 1,358,195 505,492 1,863,687
1972/73 n.a. n.a. 3,185,661 304,491 3,490,152
Scurce: Agricultural Marketing Corporation, September 1973.
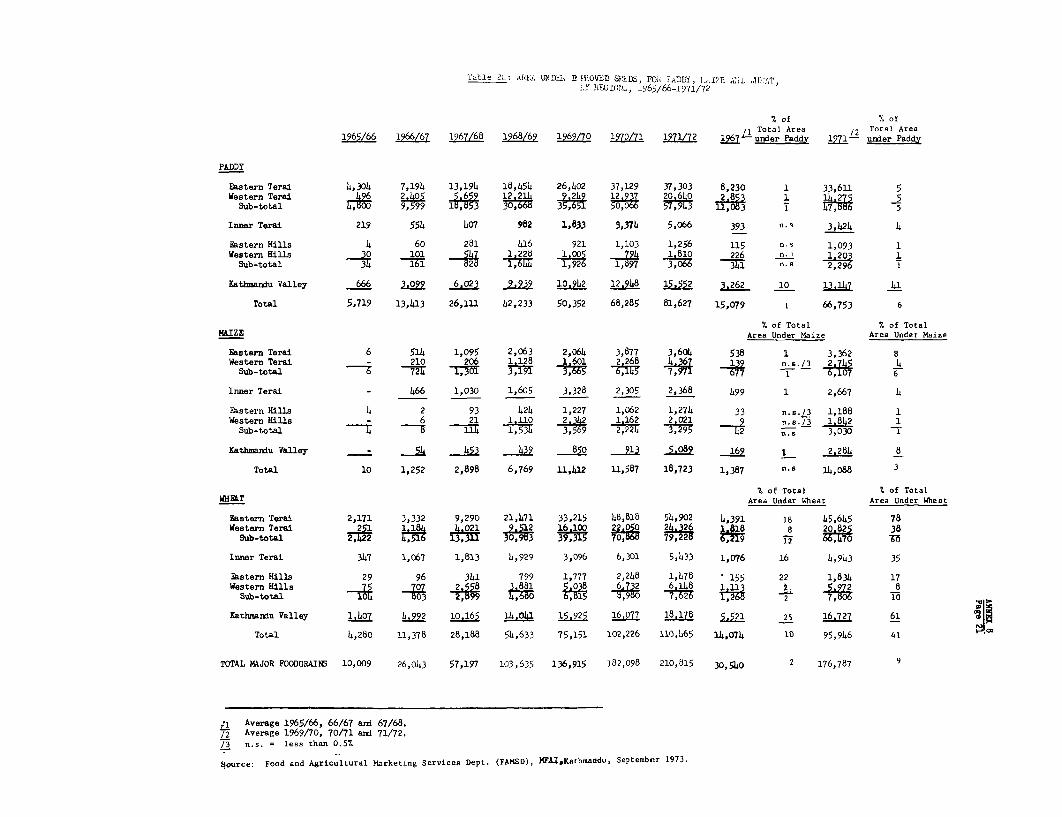
Table 2c: ARE,0 UN!Mfll fl HIiOVED SF0DS, Fo8 IjDIY, 1,,IE AdiD 4H!D.AT.
I.Y REG1Iolu, g965/66-i971/72
% of % of/1 Total Area /2 Total Area
1965/66 1966/67 1967/68 1968/69 1969/70 1970/71 1971/72 1%7 under Paddy 1971- under Paddy
PADDY
Eastern Terai 4,304 7,194 13,194 18,454 26,402 37,129 37,303 8,230 1 33,611 5Western Terai 496,B40 595992_14 3 0 1,04 2060 5 1 1.7
Sub-total l i 7790- 9,9 I1F 3,M 33M 5, 7 97 1203 7 W5
Inner Terai 219 554 407 982 1,833 3,374 5,066 393 n.s 3,424 4
Eastern Hills 4 60 281 416 921 1,103 1,256 115 n.s 1,093 1Western Hills 101 541 1.228 l.OD 194 1.810 226 n. 1 20 1
Sub-total 31 161 828,2Sub~~~~~-to t a 34 1 61 1, 6 1,926 1,B597 341 n.s8229
Kathmazsdu Valley 666 30 6.023 9.939 10.942 12.948 1 52 3.262 10 13.147 41
Total 5,719 13,413 26,111 42,233 50,352 68,285 81,627 15,079 1 66,753 6
X of Total % of TotalMAIZE Area Under Maize Area Under Maize
Eastern Terai 6 514 1,095 2,063 2,064 3,877 3,604 538 1 3,362 8Western Terai - 210 206 1 128 1 601 2 268 4,367 139 4.s./3 2,745 4
Sub-total 6 7240 1,0 3,19 3 6,14 7,971 6,1fi
Inner Terai - 466 1,030 1,605 3,328 2,305 2,368 499 1 2,667 4
Eastern Hills 4 2 93 424 1,227 1,062 1,274 33 n.s./3 1,188 1Western Hills - 6 21 1 ,110 1 162 2 0 n.s./3 1,8 42 1
Sub-total 4 114 1,534,3,59 4.s 3,030 .L
Kathmarnlu Valley - 54 453 4J392 _8L 913 5.089 169 _ 2.284 8
Total 10 1,252 2,898 6,769 .11,412 11,587 18,723 1,387 n.s 14,038 3
7. of Total 7. of TotalWHE1T Area Under Wheat Area Under Wheat
Eastern Tersi 2,171 3,332 9,290 21,471 33,215 48,818 54,902 4,391 18 45,645 78Western Terai 2 1184 4,021 9.i2 16.100 2. 2436 1B18 8 20.825 38
Sub-total 2,2 13,311 30,983 379, 0, j2 66;4970 2
Inner Terai 347 1,067 1,813 IJ,929 3,096 6,301 5,433 1,076 16 4,943 35
Eastern Hills 29 96 341 799 1,777 2,248 1,478 155 22 1,834 17Western Hills 758707 2 A5 586 l 1 .8F8 12 6148 1 .111 2 5972 8
Sub-total 0 86 8i57 7, 280
Kathmandu Valley 1.407 4.992 10165 14,041 15925 16077 8,178 5.521 25 16,727 61
Total 4,280 11,378 28,188 54,633 75,151 102,226 110,465 14,074 10 95,946 41
TOTAL MAJOR FOODGRAINS 10,009 26,043 57,197 103,635 136,915 182,098 210,815 30,540 2 176,787
r Average 1965/66, 66/67 arnl 67/68./2 Average 1969/70, 70/71 ands 71/72./3 n.s. = less than 0.5%
Source: Food and Agricultural Marketing Services Dept. (FAMSD), KFAI,Kathmandu, September 1973.
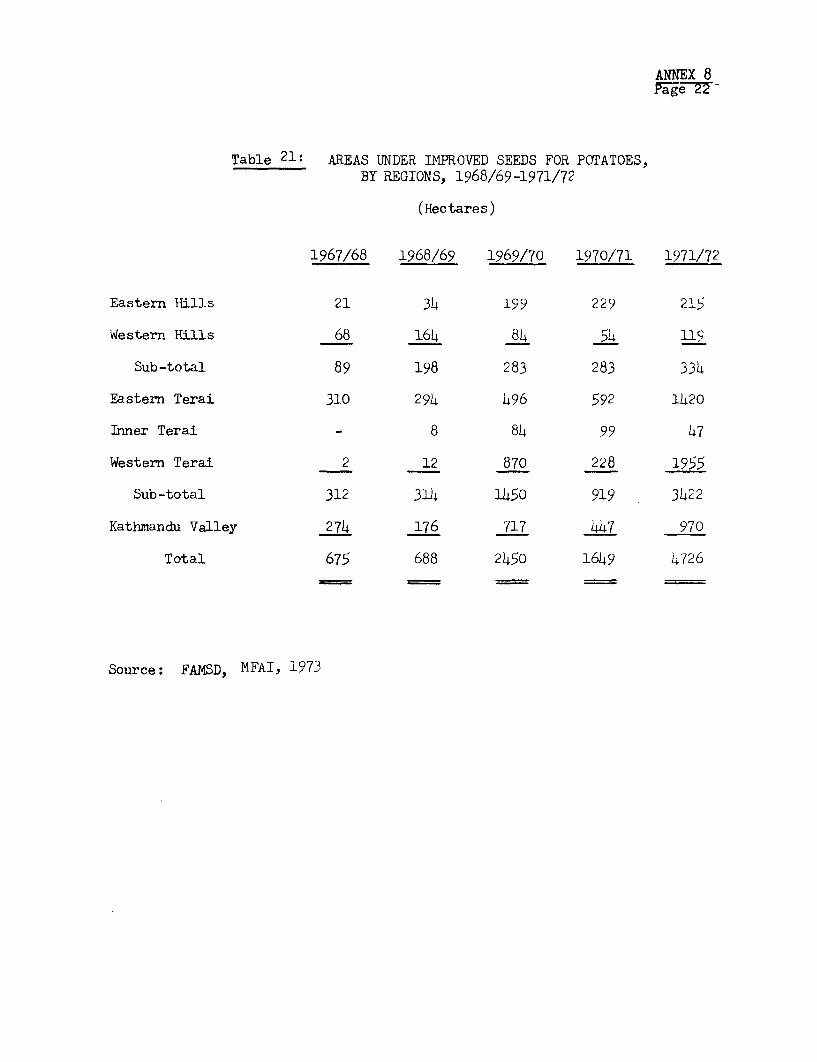
ANNEX 8
Table 21: AREAS UNDER IMPROVED SEEDS FOR POTATOES,BY REGIONS, 1968/69-1971/72
(Hectares)
1967/68 1968/69 1969/70 1970/71 1971/72
Eastern Hills 21 34 199 229 215
Western Hills 68 164 84 54 llS
Sub-total 89 198 283 283 334
Eastern Terai 310 294 496 592 1420
Inner Terai - 8 84 99 47
Western Terai 2 12 870 228 1955
Sub-total 312 314 1450 919 3422
Kathmandu Valley 274 176 717 447 970
Total 675 688 2450 1649 4726
Source: FAMSD, MFAI, 1973
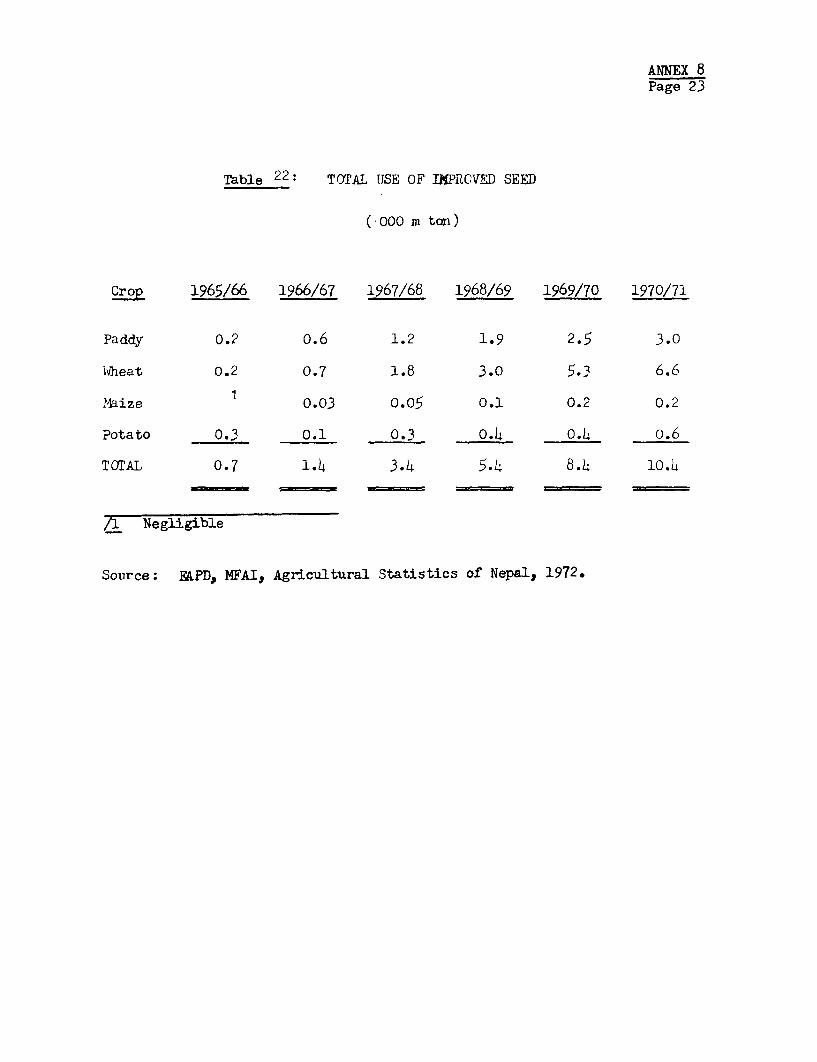
ANNEX 8Page 23
Table 22: TOTAL IJSE OF IMPROVED SEED
(o000 m ton)
CroP 1965/66 1966/67 1967/68 1968/69 1969/70 1970/71
Paddy 0.2 0.6 1.2 1.9 2.5 3.0
Wheat 0.2 0.7 1.8 3.0 5.3 6.6
Maize 1 0.03 0.05 0.1 0.2 0.2
Potato 0.3 0.1 0.3 0.4 0.4 o.6
TOTAL 0.7 1.4 3.4 5.4 8.4 10.4
/1 Negligible
Source: EAPDq MFAIS, Agricultural Statistics of Nepal, 1972.
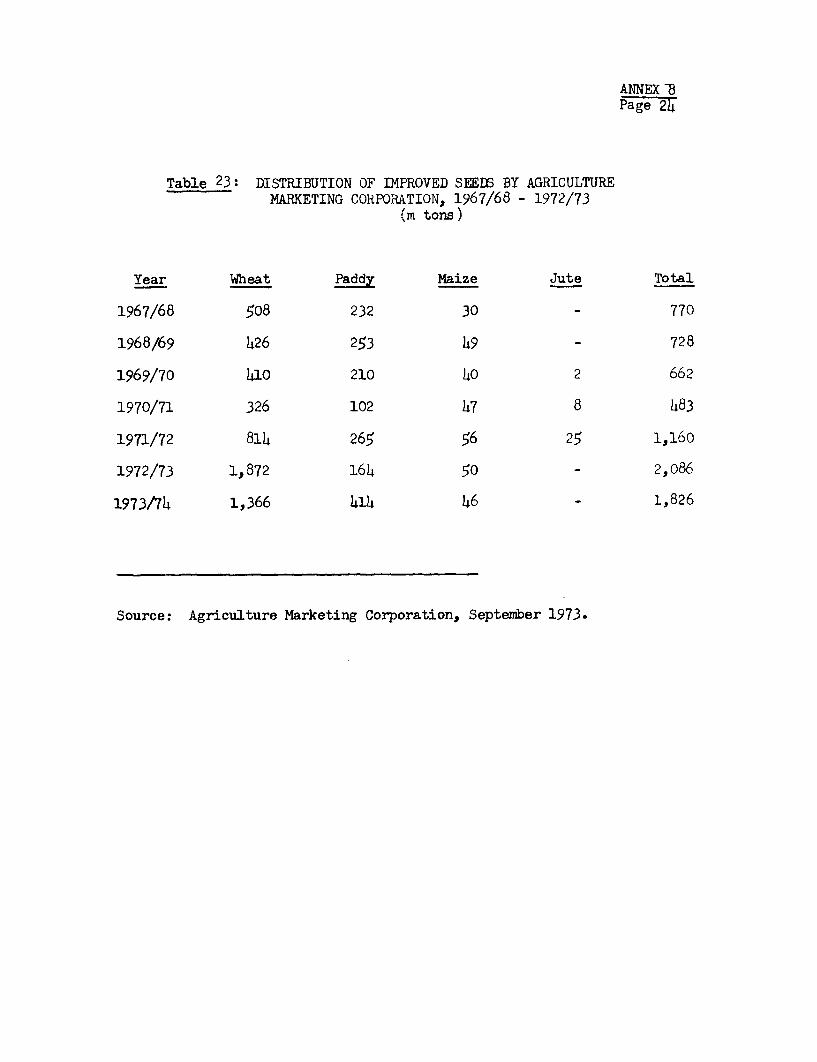
ANNEX 8Page 24
Table 23: DISTRIBUTION OF IMPROVED SEEDS BY AGRICULTUREMARKETING CORPORUTION, 1967/68 - 1972/73
(m tons)
Year Wheat Paddy Maize Jute Total
1967/68 508 232 30 - 770
1968/69 426 253 49 - 728
1969/70 410 210 40 2 662
1970/71 326 102 47 8 1483
1971/72 814 265 56 25 1,160
1972/73 1,872 164 50 - 2,086
1973/74 1,366 414 46 - 1,826
Source: Agriculture Marketing Corporation, September 1973.
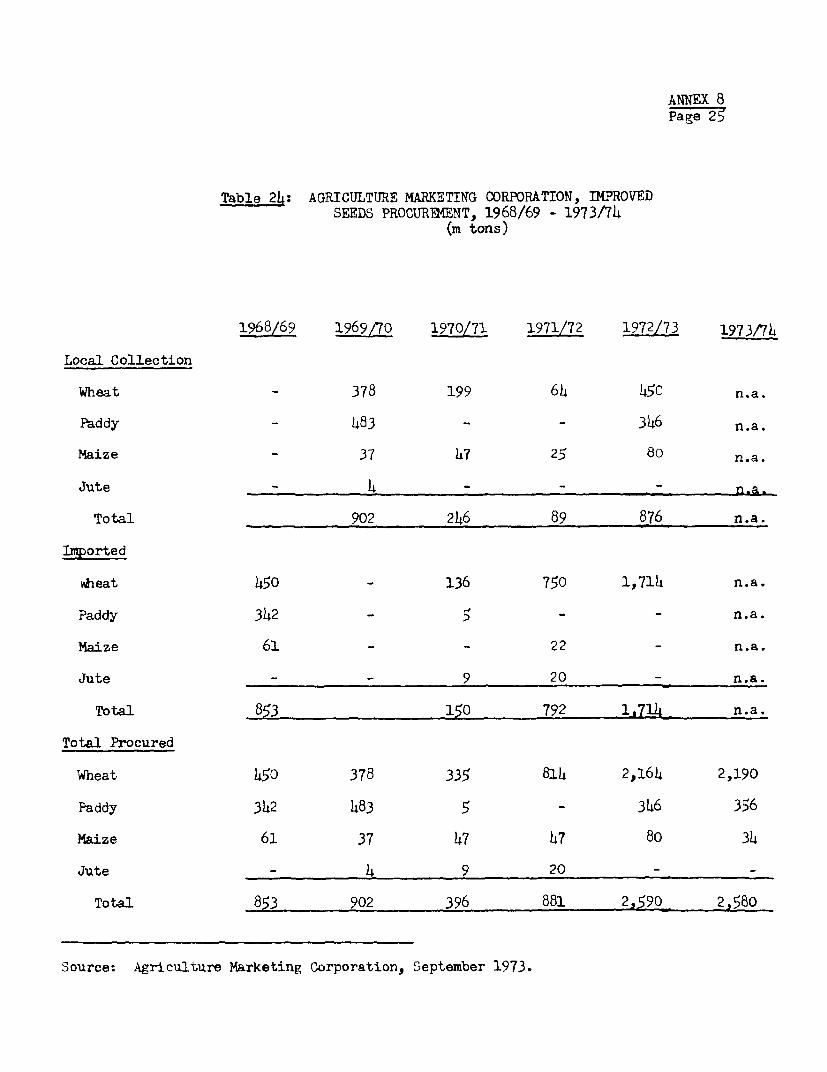
ANNEX 8Page 25
Table 24: AGRICULTURE MARKETING OORPORATION, IMPROVEDSEEDS PROCUREMENT, 1968/69 - 1973/74
(m tons)
1968/69 1969/70 1970/71 1971/72 1972/73 1973/7
Local Collection
Wheat _ 378 199 64 450 n.a.
Paddy - 483 -- 346 n.a.
Maize - 37 47 25 80 n.a.
Jute 4 - - - n.a.
Total 902 246 89 876 n.a.
Imported
Wheat 450 - 136 750 1,714 n.a.
Paddy 342 - 5 - - n.a.
Maize 61 - - 22 - n.a.
Jute - - 9 20 - n.a.
Total 853 150 792 1,714_ n.a.
Total Procured
Wheat h50 378 335 814 2,164 2,190
Paddy 342 483 5 - 346 356
Maize 61 37 47 47 80 34
Jute - 4 9 20 - -
Total 853 902 396 881 2,590 2,580
Source: Agriculture Marketing Corporation, September 1973.
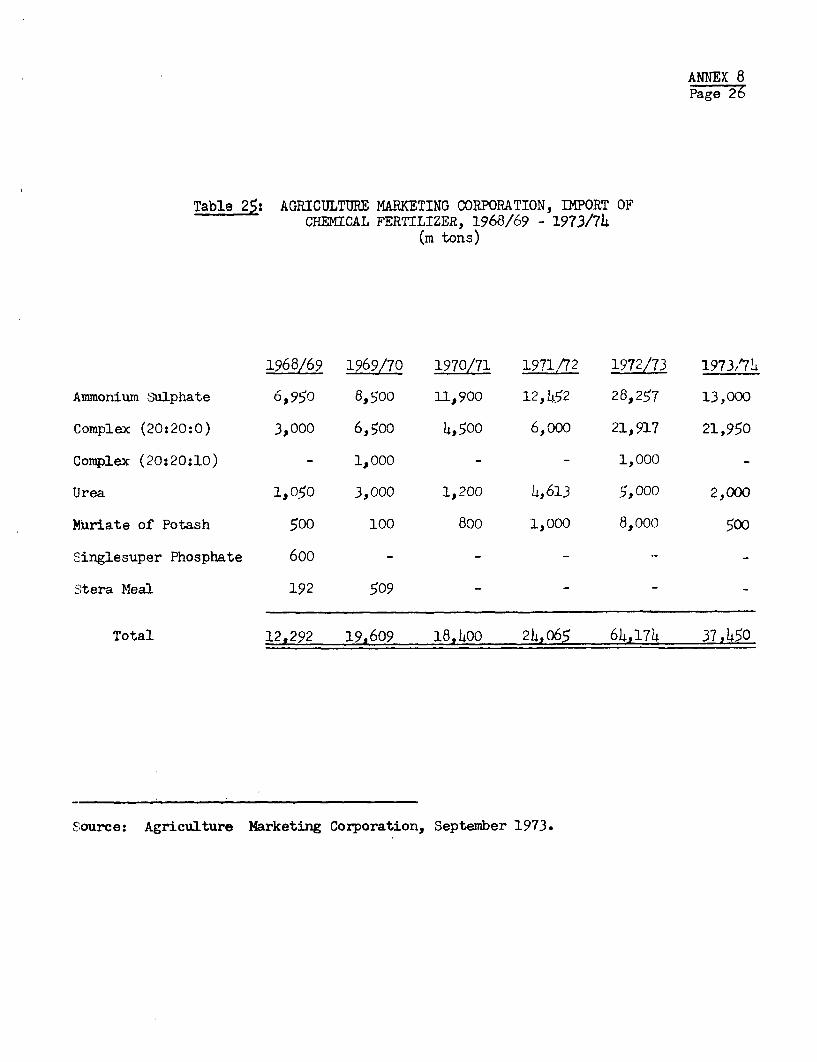
ANNEX 8Page 26
Table 25: AGRICULTURE MARKETING CORPORATION, IMPORT OFCHEMICAL FERTILIZER, 1968/69 - 1973/74
(m tons)
1968/69 1969/70 1970/71 1971/72 1972/73 1973,74
Ammonium Sulphate 60950 8,500 11,900 12,_52 28,257 13,000
Complex (20:20:0) 3,000 6,500 4,500 6,000 21,917 21,950
Complex (20:20:10) - 1,000 - - 1,000 -
Urea 1,05O 3,000 1,200 4,613 5,000 2,000
Muriate of Potash 500 100 800 1,000 8,000 500
Singlesuper Phosphate 600 - - -
Stera Meal 192 509 - -
Total 12,292 19,609 18,h00 24,o65 64,174 37,450
Source: Agriculture Marketing Corporation, September 1973.
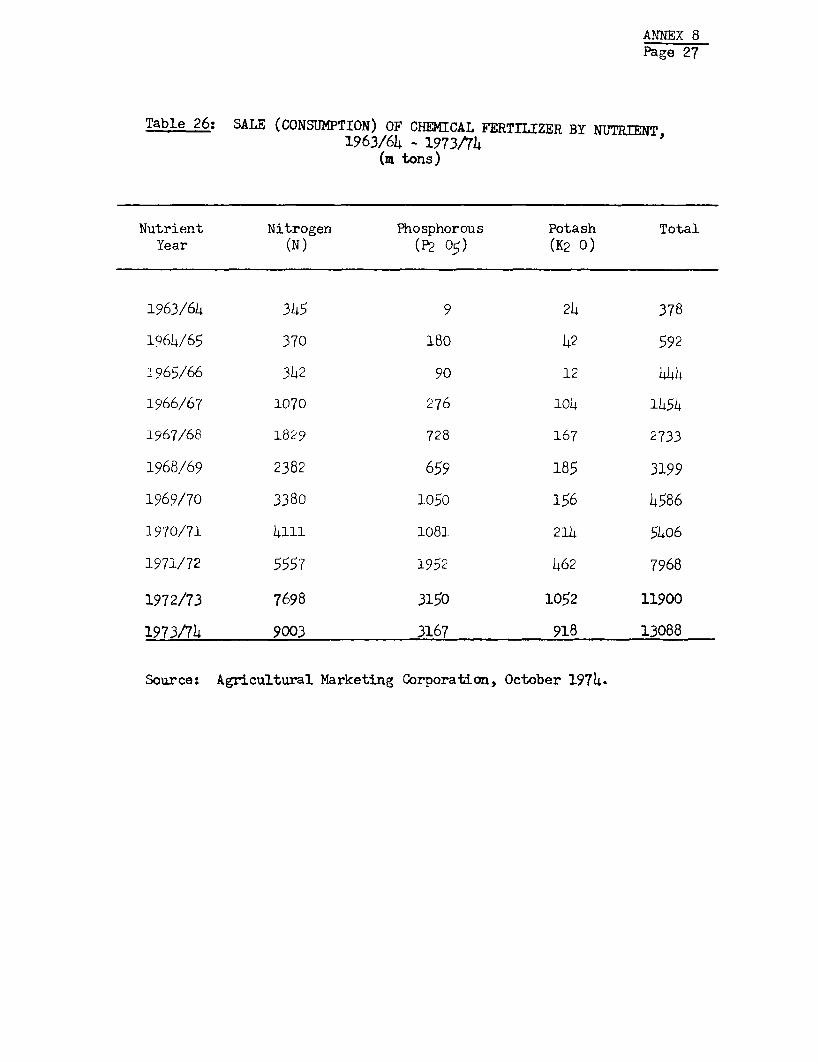
ANNEX 8Page 27
Table 26: SALE (CONSUMPTION) OF CHEMICAL FERTILIZER BY NUTRIENT,1963/64 - 1973/74
(m tons)
Nutrient Nitrogen Phosphorous Potash TotalYear (N) (P2 05) (K2 0)
1963/64 345 9 24 378
1964/65 370 180 42 592
1965/66 342 90 12 444
1966/67 1070 276 104 1454
1967/68 1829 728 167 2733
1968/69 2382 659 185 3199
1969/70 3380 1050 156 4586
1970/71 4111 1081 214 5406
1971/72 5557 1952 462 7968
1972/73 7698 3150 1052 11900
1973/74 9003 3167 918 13088
Source: Agricultural Marketing Corporation, October 1974.
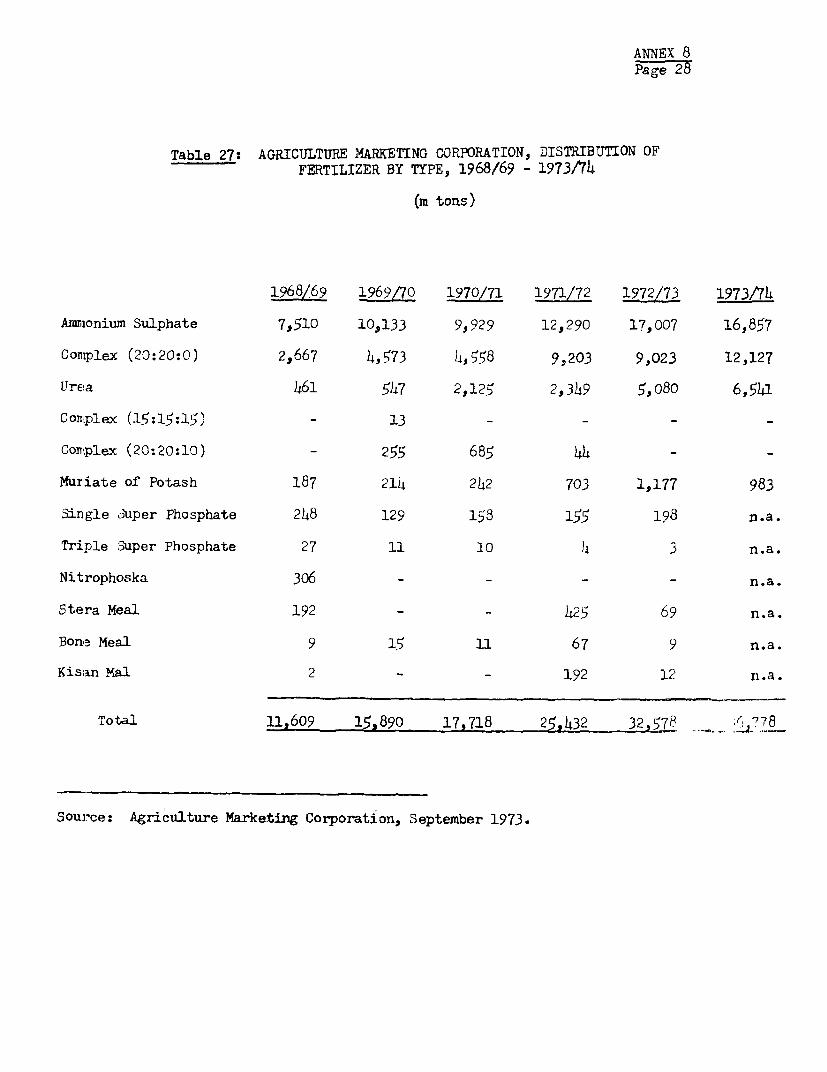
ANNEX 8Page 28
Table 27: AGRICULTURE MARKETING GORPORATION, DISTRIBUTION OFFERTILIZER BY TYPEs 1968/69 - 1973/74
(m tons)
1968/69 1969/70 1970/71 1971/72 1972/73 1973/74
Anionium Sulphate 7,510 10,133 9,929 12,290 17,007 16,857
Complex (20:20:0) 2,667 4,573 4,558 9,203 9,023 12,127
Ure!a 461 5h7 2,125 2,3h9 5,o80 6,51
Complex (15:15:15) - 13 - - - _
Complex (20:20:10) - 255 685 44 -
Muriate of Potash 187 214 242 703 1,177 983
Single ouper Phosphate 248 129 158 155 198 n.a.
Triple oSuper Phosphate 27 11 10 4 3 n.a.
Nitrophoska 306 - - - - n.a.
Stera Meal 192 - - 425 69 n.a.
Bone Meal 9 1 11 67 9 n.a.
Kisan Mal 2 - - 192 12 ii.a.
Total 11,609 15,890 17718 25, 432 325~78 78
Source: Agriculture Marketing Corporation, September 1973.
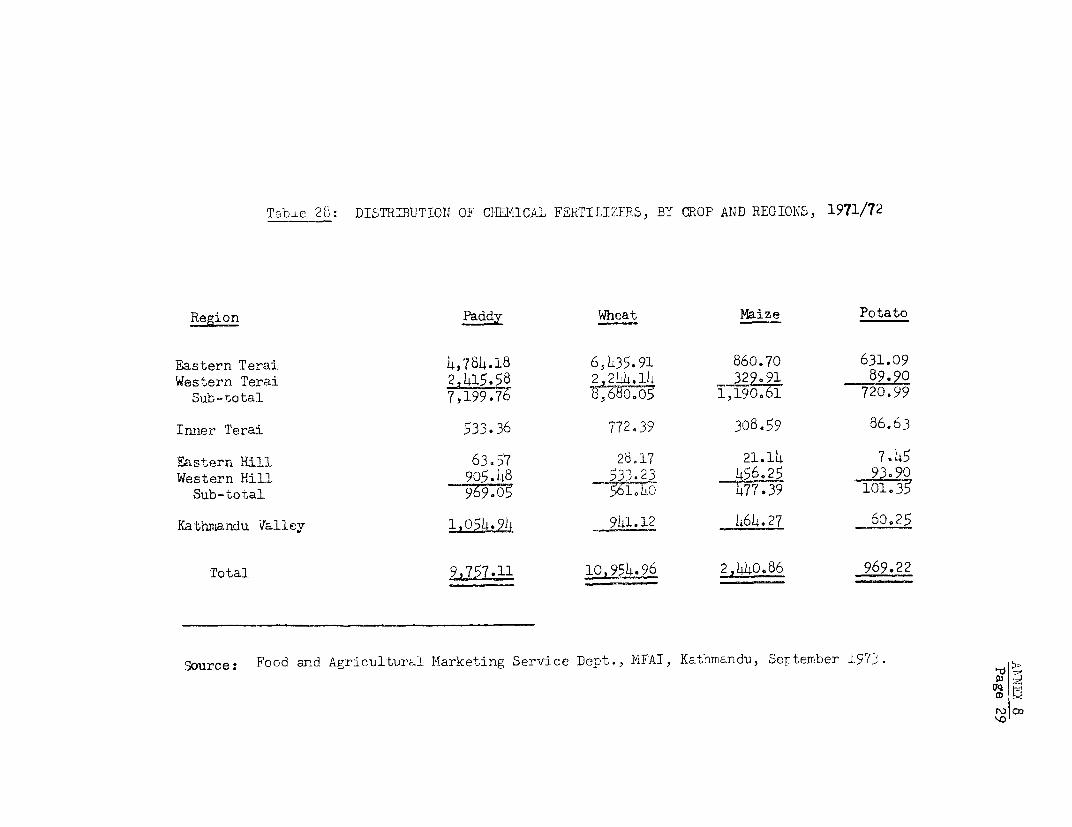
Tabie 20: DISTRIBUTION OF CHE]MICAL FERTILIZERS, BY CROP ANiD REGIONS, 1971/72
Region Paddy Wheat Maize Potato
Eastern Terai 4,784.18 6,L35.91 860.70 631.09Western. Terai 224~1558 2 24~4.314 329.91 599.0
Sub-total 7,199.76 5,680 . 196 720.99
Inner Terai 533.36 772.39 308.59 86.63
Eastern Hill 63.57 28.17 21.14 7,45W-estern Hill 905.48 533.23 456.25930
Sub-total 969.03 56.35
Kathniardu Valley 042 941.12 464.27 60,25
Total 9,757.11 L4.96 2,440,56 969.22
Source: Food and Agricultural Marketing Service Dept., FiFAI, Kathnandu, Septem,ber 197,.
\1I
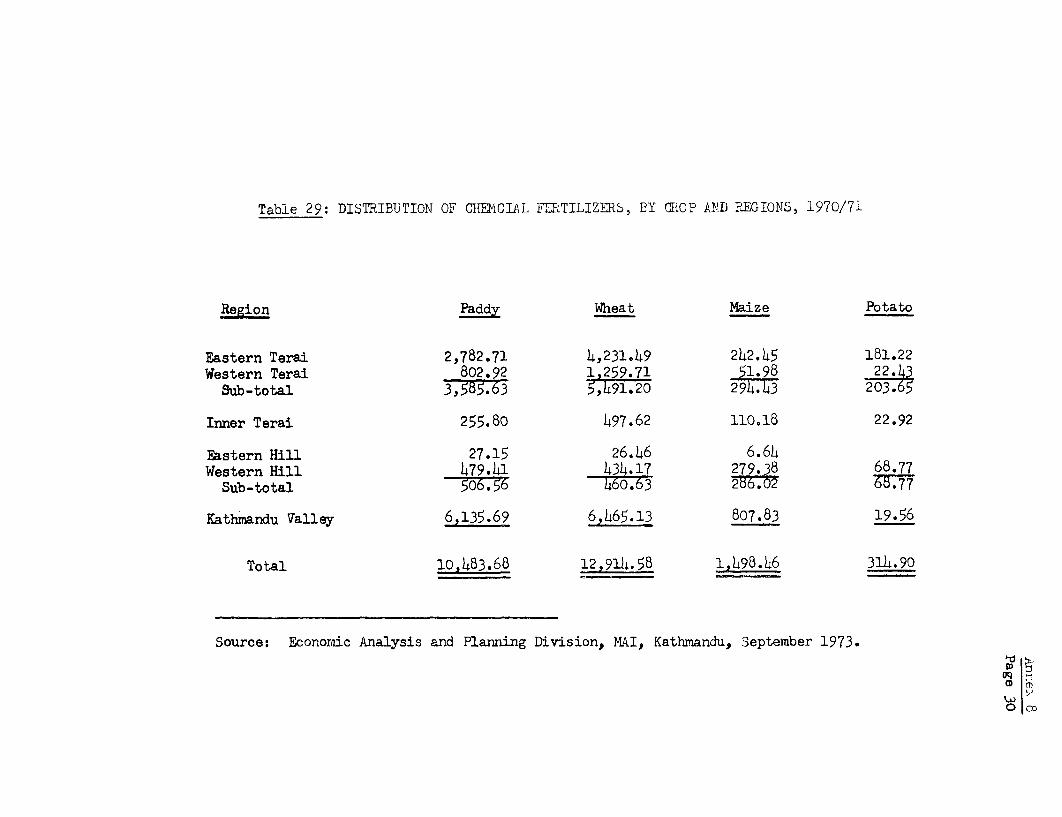
Table 29: DISTRIBUTION OF CH=CIAL Fa=TILIZERS, BY CROP kND REGIONS, 1970/71
Region Paddy Wheat Maize Potato
Eastern Terai 2,782.71 4,231.49 242.45 181.22Western Terai 802.92 1 259.71 51.98 22.43
Sub-total 3,585.63 5,491.20 294.43 203.65
Inner Terai 255.80 497.62 110.18 22.92
Eastern Hill 27.15 26.46 6.64Western Hill 479.41 434 17 279.38 68.77
Sub-total 460.63 2b6.52
Kathmandu Valley 6,135.69 6,465.13 807.83 19.56
Total 104B83.68 12,914h58 1,h498. 46 314.90
Source: Economic Analysis and Planning Division, MAI, Kathmandu, September 1973.
CDOD O
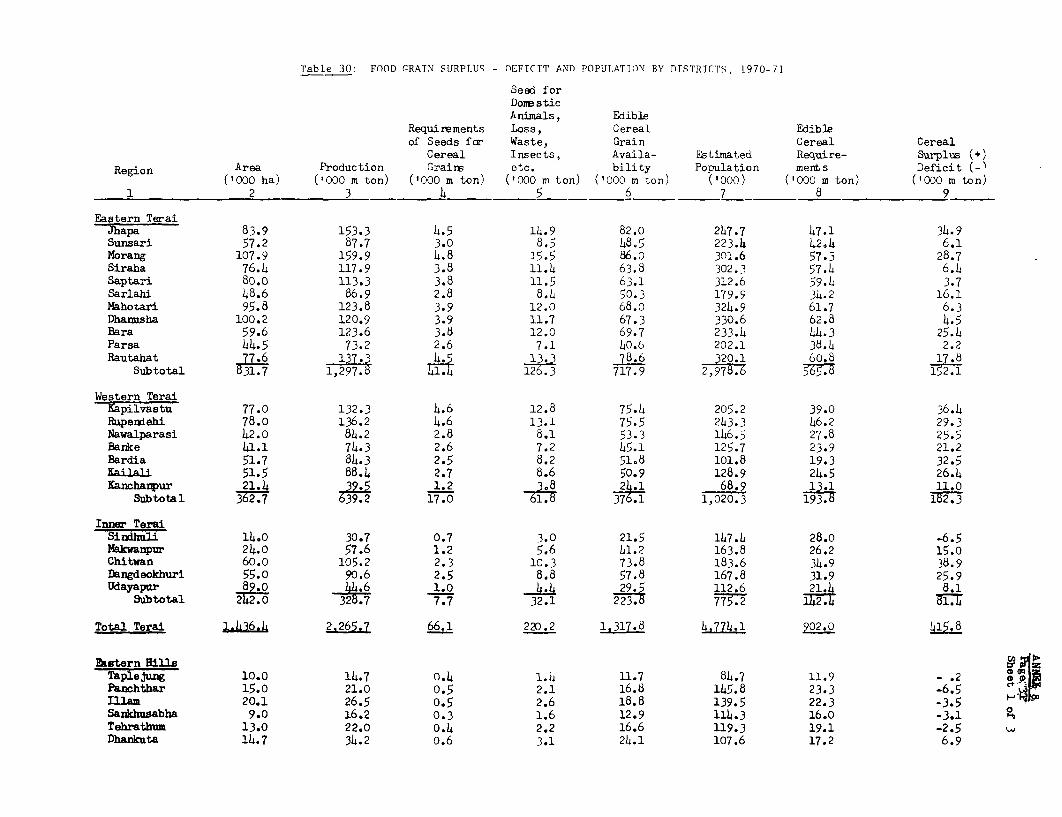
Table 30: FOOD GRAIN SURPLUS - DEFICIT ANO POPULATION 13Y DTSTRICTS, 1970-71
Seed forDore sticAnimals, Edible
Requirements Loss, Cereal Edibleof Seeds far Waste, Grain Cereal Cereal
Cereal Insects, Availa- Estimated Require- Surplus (+)
Region Area Production Grairr, etc. bility Population merts Deficit (-8('000 ha) ('000 m ton) ('000 m ton) ('000 m ton) ('000 m ton) ('000) ('000 m ton) ('000 m ton)
1 2 3 I4 5 6 7 8 9
Eastern TeraiJhapa 83.9 153.3 4.5 14.9 82.0 247.7 47.1 34.9Sunsari 57.2 87.7 3.0 8.5 48.5 223.4 42.4 6.1Norang 107.9 159.9 4.8 15.5 86.o 301.6 57.3 28.7Siraha 76.4 117.9 3.8 11.4 63.8 302.3 57.4 6.4Saptari B0.0 113.3 3.8 11.5 63.1 312.6 59.4 3.7Sarlahi 48.6 86.9 2.8 8.4 50.3 179.9 3 4 .2 16.1Mahotari 95.8 123.8 3.9 12.0 68.0 324.9 61.7 6.3Dhanasha 100.2 120.9 3.9 11.7 67.3 330.6 62.8 4.5Bara 59.6 123.6 3.8 12.0 69.7 233.4 44.3 25.4Parsa 44.5 73.2 2.6 7.1 40.6 202.1 38.4 2.2Rautahat 77.6 137.3 4- 1 78.6 60.8 17.8
Subtotal 831.7 1,297.8 126.3 717.9 2,978.6 565. 152.1
Western TeraiKapilvasE7 77.0 132.3 4.6 12.8 75.4 205.2 39.0 36.4Rapendehi 78.0 136.2 4.6 13.1 75.5 243.3 4
6.2 29.3
Nawalparasi 42.0 84.2 2.8 8.1 53.3 146.5 27.8 25.5Banke 41.1 74.3 2.6 7.2 45.1 125.7 23.9 21.2Bardia 51.7 84.3 2.5 8.2 51.8 101.8 19.3 32.5Kaila i 51.5 88.4 2.7 8.6 50.9 128.9 24.5 26.4Kanchanpur 21.4 39.5 1.2 a 24.1 68.9 1111.0
Subtotal 362.7 639.2 17.0 61.8 376.1 1,020.3 193.8 182.3
Inner TeraiSindhu1i 14.o 30.7 0.7 3.0 21.5 147.4 28.0 _6.5Makwanpur 24.0 57.6 1.2 5.6 41.2 163.8 26.2 15.0Chitwan 60.o 105.2 2.3 10.3 73.8 183.6 34.9 38.9Dangdeokhuri 55.0 90.6 2.5 8.8 57.8 167.8 31.9 25.9Udayapur 8g.0 44.6 1.0 4.4 29.5 112.6 21.4 8.1
Subtotal 2h. 328.7 7.7 32.1 223.8 775.2 1U2.4 81.4
Total Terai l.h36.4 2.265.7 66.1 220.2 1.317.8 9.774.1 202.0 415.8
Eastern HillsTaplejung 10.0 14.7 0.4 1.4 11.7 84.7 11.9 - .2 PPanchthar 15.0 21.0 0.5 2.1 16.8 145.8 23.3 -6.5 5TIlAi 20.1 26.5 0.5 2.6 18.8 139.5 22.3 -3.5
0Sankhusabha 9.0 16.2 0.3 1.6 12.9 114.3 16.0 -3.1Tehrathum 13.0 22.0 0.4 2.2 16.6 119.3 19.1 -2.5Dhankuta 14.7 34.2 o.6 3.1 24.1 107.6 17.2 6.9
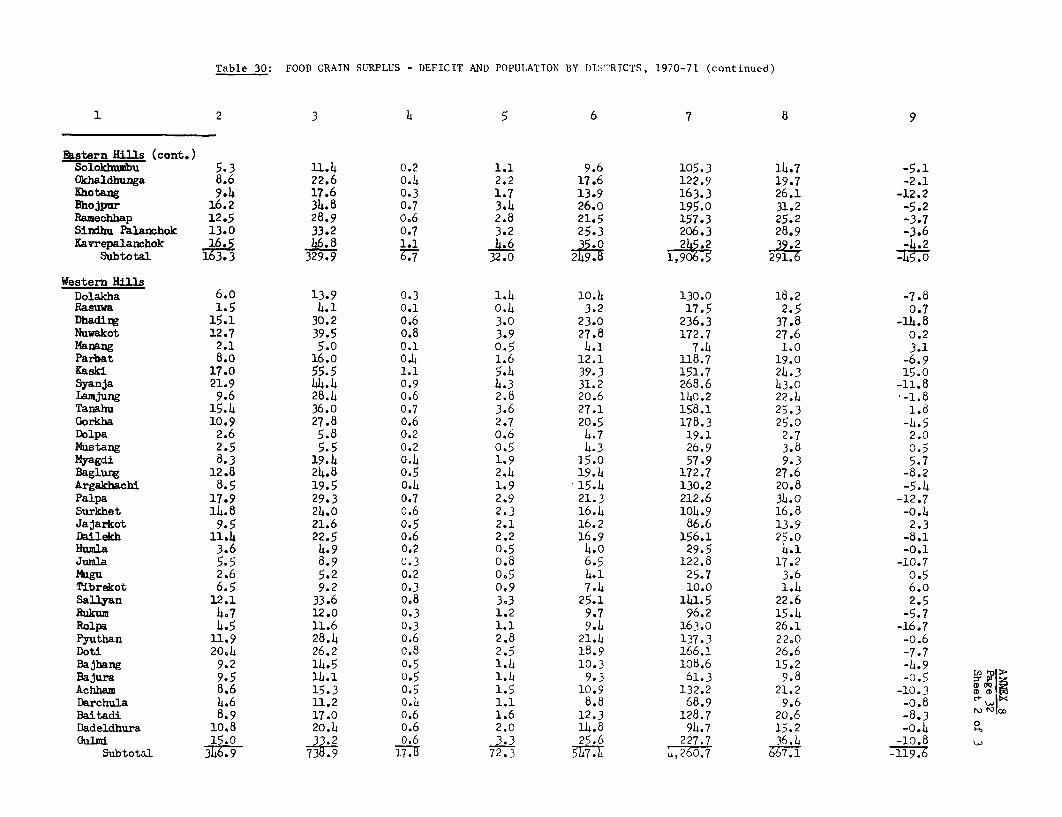
Table 30: FOOD GRAIN SURPLUS - DEFICIT AND POPULATION BY DIsTRICTS, 1970-71 (continued)
1 2 3 4 5 6 7 8 9
Ekstern Hills (cont.)Solokhumbu 5.3 11.4 0.2 1.1 9.6 105.3 14.7 -5.1Okhaldhunga 8.6 22.6 0.4 2.2 17.6 122.9 19.7 -2.1rhotang 9.4 17.6 0.3 1.7 13.9 163.3 26.1 -12.2Bhojpwr 16.2 34.8 0.7 3.4 26.0 195.0 31.2 -5.2Ramechhap 12.5 28.9 o.6 2.8 21.5 157.3 25.2 -3.7Sindhu Palanchok 13.0 33.2 0.7 3.2 25.3 206.3 28.9 -3.6Kavrepalanchok _16 1.1 4 245.2 32.2 -4.2
Subtotal 163.3 329.9 77 32.0 249.8 1,906.5 91.6 -45io
Western HillsDolakha 6.o 13.9 0.3 1.4 10.4 130.0 18.2 -7.8Rasuwa 1.5 4.1 0.1 0.4 3.2 17.5 2.5 0.7Dhading 15.1 30.2 o.6 3.0 23.0 236.3 37.8 -14. 8
Nuwakot 12.7 39.5 0.8 3.9 27.8 172.7 27.6 0.2Manang 2.1 5.0 0.1 0.5 4.1 7.4 1.0 3.1Parbat 8.0 16.0 0.4 1.6 12.1 118.7 19.0 -6.9Kaski 17.0 55.5 1.1 5.4 39.3 151.7 24.3 15.0Syanja 21.9 44.4 0.9 4.3 31.2 268.6 43.0 -11.8Lampung 9.6 28.4 0.6 2.8 20.6 140.2 22.4 -1.8Tanahu 15.4 36.0 0.7 3.6 27.1 158.1 25.3 1.8Gorkha 10.9 27.8 o.6 2.7 20.5 178.3 25.0 -4.5Dolpa 2.6 5.8 0.2 o.6 4.7 19.1 2.7 2.0Mustang 2.5 5.5 0.2 0.5 4.3 26.9 3.8 0.5Myagdi 8.3 19.4 0.4 1.9 15.0 57.9 9.3 5.7Baglung 12.8 24.8 0.5 2.4 19.4 172.7 27.6 -8.2Argakhachi 8.5 19.5 0.4 1.9 15.4 130.2 20.8 -5.4Palpa 17.9 29.3 0.7 2.9 21.3 212.6 34.o -12.7Surkhet 14.8 24.0 o.6 2.3 16.4 104.9 16.8 -o.4Jajarkot 9.5 21.6 0.5 2.1 16.2 86.6 13.9 2.3Dailekh 11.4 22.5 o.6 2.2 16.9 156.1 25.0 -8.1Humla 3.6 4.9 0.2 0.5 4.o 29.5 4.1 -0.1Jumla 5.5 8.9 0.3 0.8 6.5 122.8 17.2 -10.7Mugu 2.6 5.2 0.2 0,5 4.1 25.7 3.6 0.5Tibrekot 6.5 9.2 0.3 0o9 7.4 10.0 1.4 6.oSallyan 12.1 33.6 0,8 3.3 25.1 141.5 22.6 2.5Rukum 4,7 12.0 0.3 1.2 9.7 96.2 15.4 -5.7Rolpa 4.5 11.6 0.3 1.1 9.4 163.0 26.1 -16.7Pyuthan 11.9 28.4 o.6 2.8 21.4 137.3 22,0 -o.6Doti 20,4 26.2 0.8 2.5 18.9 166.1 26.6 -7.7Bajhang 9.2 14.5 0.5 1.4 10.3 108.6 15.2 -4.9Bajura 9.5 14.1 0.5 1.4 9.3 61.3 9.8 -0.5Achham 8.6 15.3 0.5 1.5 10.9 132.2 21.2 -10.3 C MINDarchula 4.6 11.2 0.4 1.1 8.8 68.9 9.6 -0.8 C+wBaitadi 8.9 17.0 o.6 1.6 12.3 128.7 20.6 -8.3 ODadeldhura 10.8 20.4 o.6 2.0 14.8 94.7 15.2 -0.4Gulmi 15.0 2 o.6 303 25.6 227.7 36.4 -10.8
Subtotal 346.9 738.9 177 72.3 547.4 4,260.7 667.1 7-1976

Table 30: FOOD GRAIN SURPLUS - DEFICIT AND POPULATION BY DISTRICTS, 1970-71 (continued)
1 2 3 5 6 7 8 9
Kathandu Valle-Kat.hWAr e 24.9 73.0 1.7 7.1 47.1 353.8 56.6 -9.5Bhaletapur 8.6 32.0 0.8 3.1 20.3 110.2 17.6 2.7Lalitpur 14.3 42.7 1.0 4.2 29.5 .0 24.8 4.7
Subtotal 1777 3 4 7 .i5 96.9 699.0 -2,1
Total Hill 558.0 1.216.5 35.7 1187 894.1 6,786.2 1,o6o.8 -166.7
Grand Total 1,994.4 3,482.2 101.8 338.9 2,211.9 11,560.3 1,962.8 249.1
Source: Derived from T. Sakiyam, Evaluation of the Third Five-Year Plan Economic Analysis and Planning Division, MFAI, HiMG, Nepal, andupdated Population Census data from CBS.
Notes on Table 30.
1. Crops Seed rateslV98s
a. paddy 55b. maize 30c. wheat 66d. millet, buckwheat 25e. oats 40
2. It is assumed that the amount of foodgrains used in non-humans consumptidn, viz. feeds for cattle and other domestic animals and birds,and the loss due to insects and pests, will be 10 percent of the total gross foodgrain production.
3. It is assumed that of the total gross foodgrain production, 40 percent wilI be lost in dehuasking of rice anr 3 percent will be lostin milling of other foodgrains like maize, wheat, millets, etc.
4. The amount of edible foodgrains required per head, per annum has been assumd to be 190 kgs in case of Terai Region, 160 kgs in caseof Hilly regions and 140 &s in case of the remote Hills areas where food shortage is perpetual.
5. The total cultivated area of the countr was estimated to be 1,845 000 ha. But, the cultivated areas of the following districts havebeen changed on the basis of the data obtained from the Cadastral Survey and on the basis of registration at the reverm offices (Mals).The districts (16) are: KathmandLi, Bhaktapur, Lalitpur, Jhapa, Sunsari, Morang, Siraha, Saptari, Mahottari, Dhanusha, Bara, Parsa, ErRautahat, Kanchapur, Doti, and Achham, Hence the figure of 1.98 million ha. , ° B
6. The population figures have been taken from the Second Population Census, 1970/71, made by CBS, HHG. wIi0
7. The balance ---- (+) Surplus and (-) Deficit ---- of edible foodgrairn refers to the amount obtained by deducting the edible quantityrequired for human consumption from the total availability of edible foodgrairw .
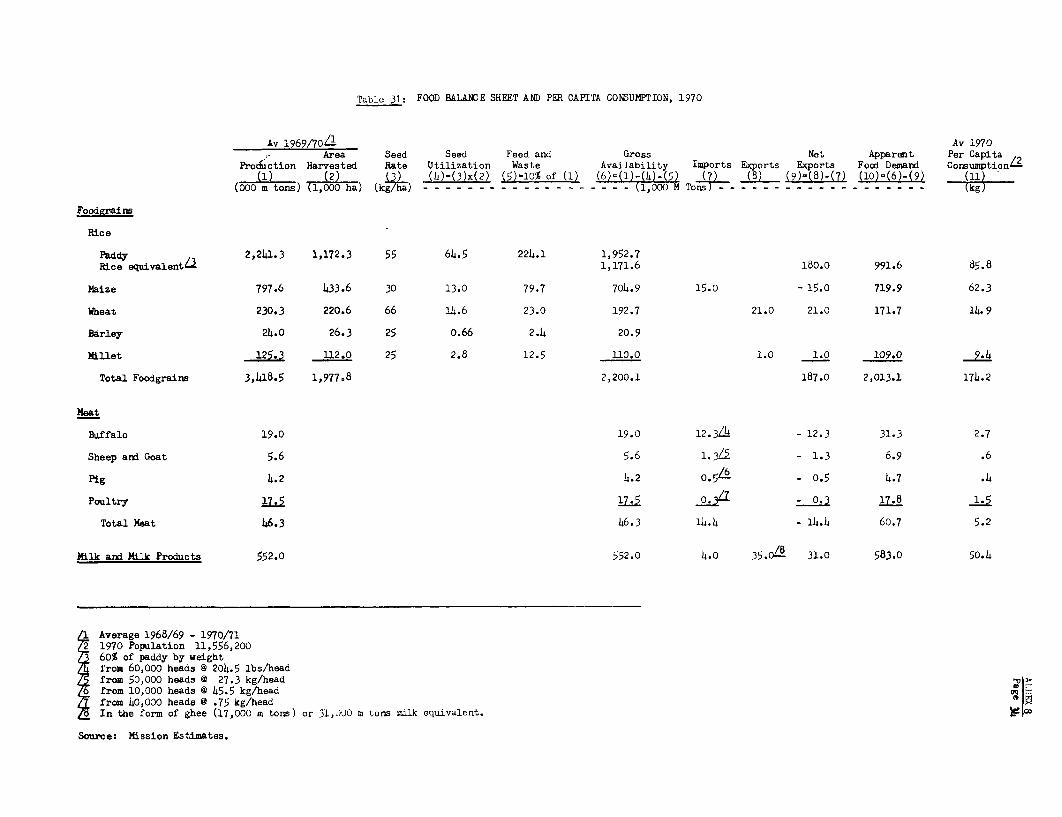
Table 31 : FOOD BATLAND E SHEET AND PEE CAPITA CONSUMPTION, 1970
Av 1969/7oL' Av 1970Area Seed Seed Feed and Gross Net Apparent Per Capita L
Procfuction Harvested Rate Utilization Waste Availability Imports Exports Exports Food Demandr Cormumpti-onL(1) (2) (3) (14-3x(2) (5)=10% of (1) (6.±Z)4)5) (B) (9)-(8)-(7) Cl0ThC6)-(9) (11'
(000 m tons) (1,000 ha) (kg/g) --------------- -- --(1,000 M To-nsYP--- - -- - -- - -- - - - -- - - - (g
Foodgzrains
Rice
Paddy 2,2141.3 1,172.3 55 614.5 2214.1 1,952.7
Rice equi.valentL3 1,171.6 180.0 991.6 85.8
Maize 797.6 1433.6 30 13.0 79.7 70o4.9 15.0 - 15.0 719.9 62.3
Wheat 230.3 220.6 66 114.6 23.0 192.7 21.0 21.0 171.7 14. 9
Barley 214.0 26.3 25 0.66 2.4 20.9
Millet 125.3 1.12.0 25 2.8 12.5 110.0 1.0 1.0 109.094
Total FoodgrainB 3,1418.5 1,977.8 2,200.1 187.0 2,013.1 1714.2
Meat
Bu~ffalo 19.0 19.0 12.3-/4 - 12.3 31.3 2.7
Sheep and Goat 5.6 5.6 l3 - 1.3 6.9 .6
Pig 14.2 14.2 0-5/6 - 0.5 14.7 .1A
Poultry 17.5 is- -- -03 78A.
Total Heat 4j6.3 146.3 114.14 -114.14 60.7 5.2
Milk andi Milk Products 552.0 552.0 14.0 3501 31.0 583.0 50.14
1 Average 1968/69 - 1970/7121970 Population 11,556,20060% of pddy by weight
/4fro m 60,7000 heads @ 2014.5 lbs/headfrom 50,000 heads @ 27.3 kg/head ~from 10,000 heads 0 145.5 kg/head 0Hfrom 140,000 heads 0 .75 kg/headIn the form. of ghee (17,000 m tons) or 31,300 m tons nilk equivalent.
Source: Mission Estimates.
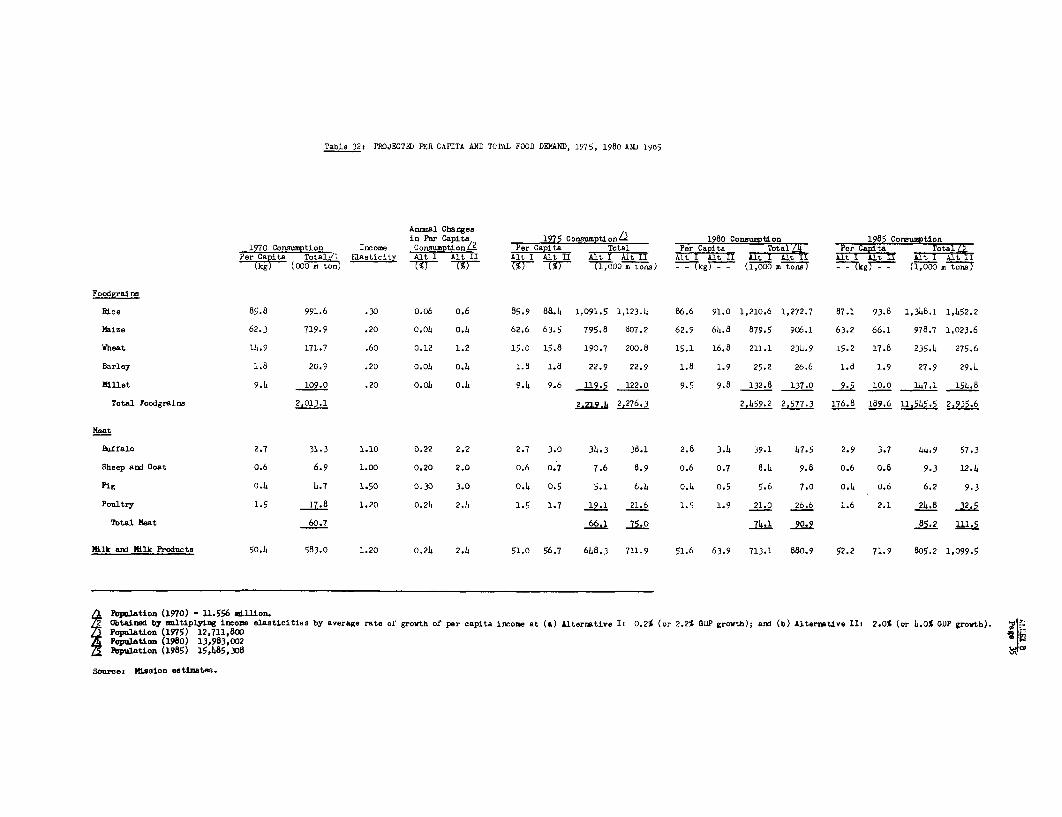
Table 32t PROJECTED PER CAPITA AND TOTAL FOOD DEM'AND, 1975, 1980 AND 19d5
Anmial Changesin Per Capita 1975 Consfomptionli 1980 conmmap n 1o8' Con3urption
1970 Consumption Income ConsumptionL Per Capita Total Per Capita Total aP. C ta TotalPer Ca ita Total ELasticity Alt I Alt II Alt I Alt II Alt I Alt I Alt I hit I Alt I II t+ klt I klt II AtTIAl7t2
(kg ton(n) 7S ) MF T (1,000 m toe TkgT 1 ( ii0 tons) - - kg -- (1,000 st-
Foodgrains
Rice 85.8 991.6 .30 o.o6 o.6 85.9 88.4 1,091.5 1,123.4 86.6 91.0 1,210.6 1,272.7 87.1 93.8 1,348.1 1,452.2
Maize 62.3 719.9 .20 0.04 0.4 62.6 63.5 795.8 807.2 62.9 64.8 879.5 906.1 63.2 66.1 978.7 1,023.6
Wheat 14.9 171.7 .60 0.12 1.2 15.0 15.8 190.7 200.8 15.1 16.8 211.1 234.9 15.2 17.8 235.4 275.6
Barley 1.8 20.9 .20 o.o0 0.4 1.8 1.8 22.9 22.9 1.8 1.9 25.2 26.6 1.d 1.9 27.9 29.4
Millet 9.4 109.0 .20 o.o4 0.h 9.4 9.6 119.5 122.0 9.5 9.8 132.8 137.0 9.5 10.0 147.1 154.8
Total Foodgrains 2,013.1 3...1L 2,276.3 2,.459.2 2,577.3 176.8 189.6 11,545.5 2 S35.6
Meat
rffa1o 2.7 31.3 1.10 0.22 2.2 2.7 3.0 34.3 38.1 2.8 3.4 39.1 47.5 2.9 3.7 4)..9 57.3
Sheep and Goat o.6 6.9 1.00 0.20 2.0 0.6 0.7 7.6 8.9 o.6 0.7 8.4 9.8 0.6 0.8 9.3 12.4
Pig 0.4 4.7 1.50 0.30 3.0 0.1 0.5 5.1 6.4 o.4 o.5 5.6 7.0 0.4 0.6 6.2 9.3
Poultry 1.5 17.U. 1.20 0.21. 2.4_ 1.5 1.7 19.1 21.6 1.5 1.9 21.0 26.6 1.6 2.1 24.8 32.5
Total Meat 60.7 66,1 .o 74.1 90.9 8_.2 lad
Milk and Milk Products 50.4 583.0 1.20 0.24 2.4 51.0 56.7 648.3 711.9 51.6 63.9 713.1 880.9 52.2 71.9 805.2 1,099.5
Pepulation (1970) - 11.556 dillion.PObtained by mltiplying incoe elasticities by average rate of growth of per capita income at (a) Alternative I: 0.2% (or 2.2% GODP growth); and (b) Alternrtive II: 2.0% (or .0% GOP growth).Population (19y75) 12,711,800Popultion (1980) 13,983,002Population (1985) 15,485,308
Soures Mission estimates.
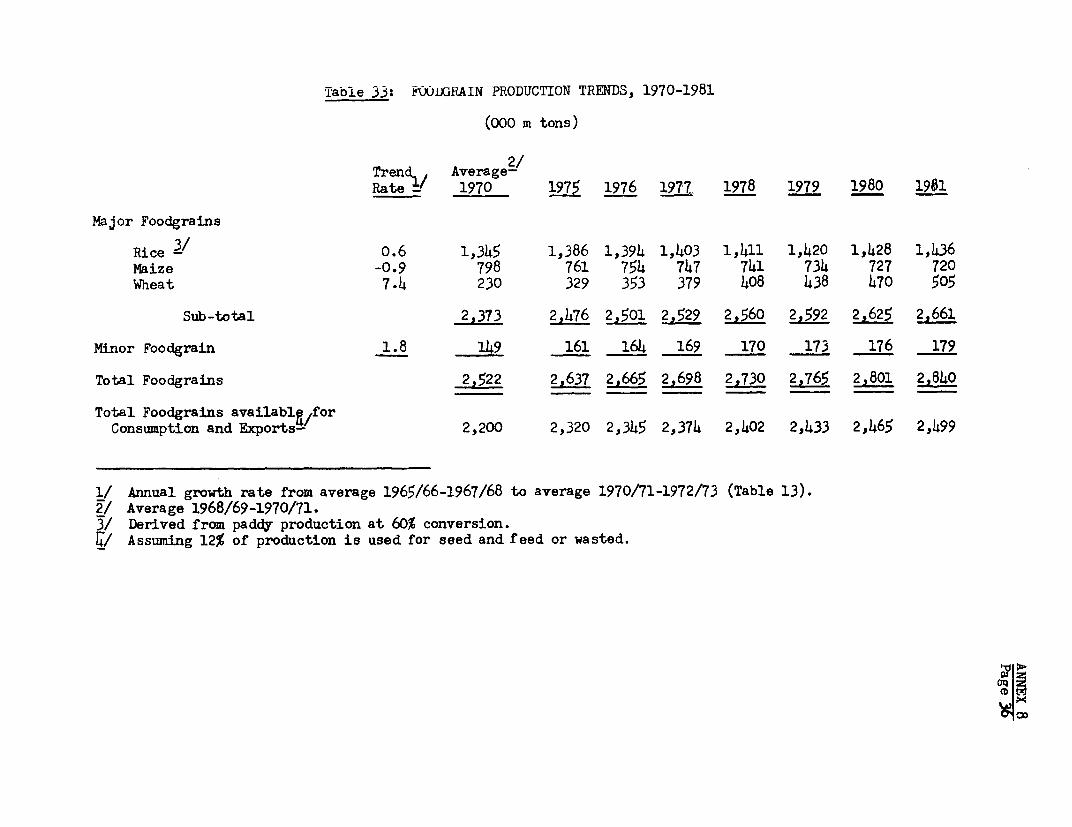
Table 33: F WUURAIN PRODUCTION TRENDS, 1970-1981
(000 m tons)
Trend,, Average 2/
Rate - 1970 1975 1976 1977- 1978 1979 1980 1981
Major Foodgrains
Rice 31 0.6 1,345 1,386 1,394 1,403 1,411 1,420 1,428 1,436Maize -0.9 798 761 754 747 741 734 727 720Wheat 7.4 230 329 353 379 408 438 470 505
Sub-total 2,373 2,476 2,501 2,529 2,560 2,592 2,625 2,661
Minor Foodgrain 1.8 149 161 164 169 170 173 176 179
Total Foodgrains 2,522 2,637 2,665 2,698 2;730 2,765 2,801 2.840
Total Foodgrains avai1ablg/forConsumption and Exports- 2,200 2,320 2,345 2,374 2,402 2,433 2,465 2,499
1/ Annual growth rate from average 1965/66-1967/68 to average 1970/71-1972/73 (Table 13).2/ Average 1968/69-1970/71.3/ Derived from paddy production at 60% conversion.4r/ Assuming 12% of production is used for seed and feed or wasted.
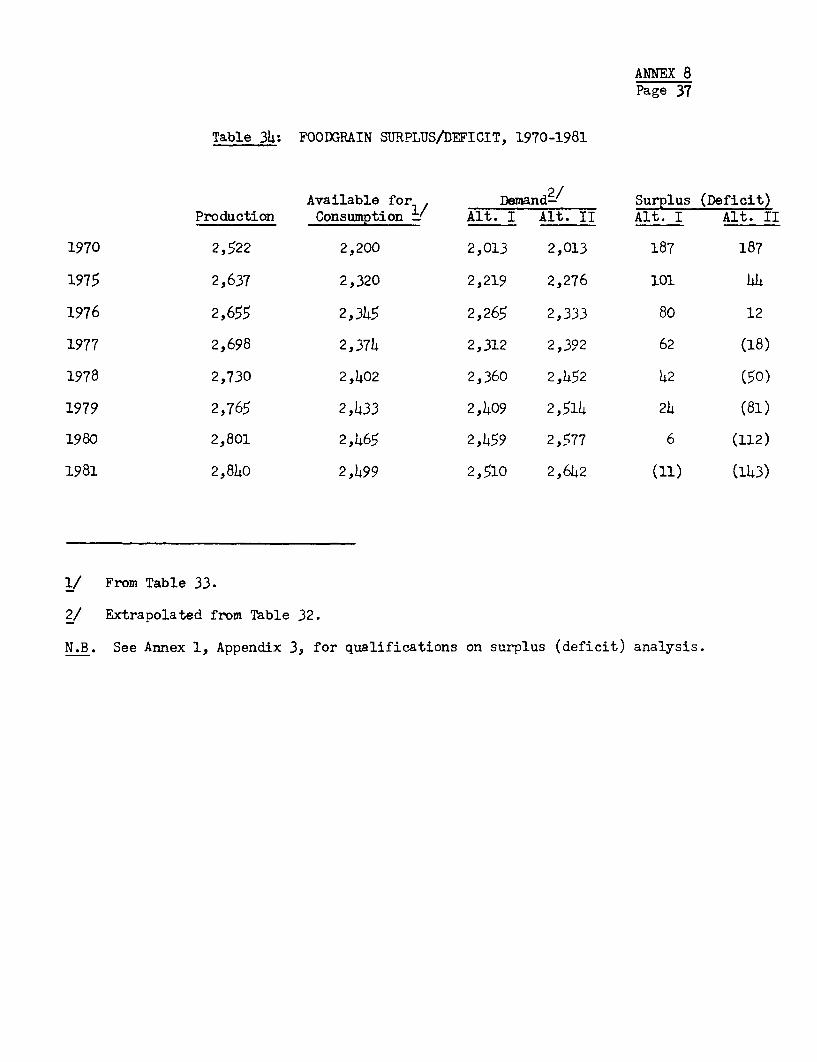
ANNEX 8Page 37
Table 34: FOODGRAIN SURPLUS/DEFICIT, 1970-1981
Available for Demand-/ Surplus (Deficit)Production Consumption / Alt. I Alt. II Alt. I Alt. II
1970 2,522 2,200 2,013 2,013 187 187
1975 2,637 2,320 2,219 2,276 101 44
1976 2,655 2,345 2,265 2,333 80 12
1977 2,698 2,37h 2,312 2,392 62 (18)
1978 2,730 2,,402 2,360 2,152 42 (50)
1979 2,765 2,433 2,409 2,514 24 (81)
1980 2,801 2,465 2,459 2,577 6 (112)
1981 2,840 2,499 2,510 2,6h2 (11) (t43)
1/ From Table 33.
2/ Extrapolated from Table 32.
N.B. See Annex 1, Appendix 3, for qualifications on surplus (deficit) analysis.
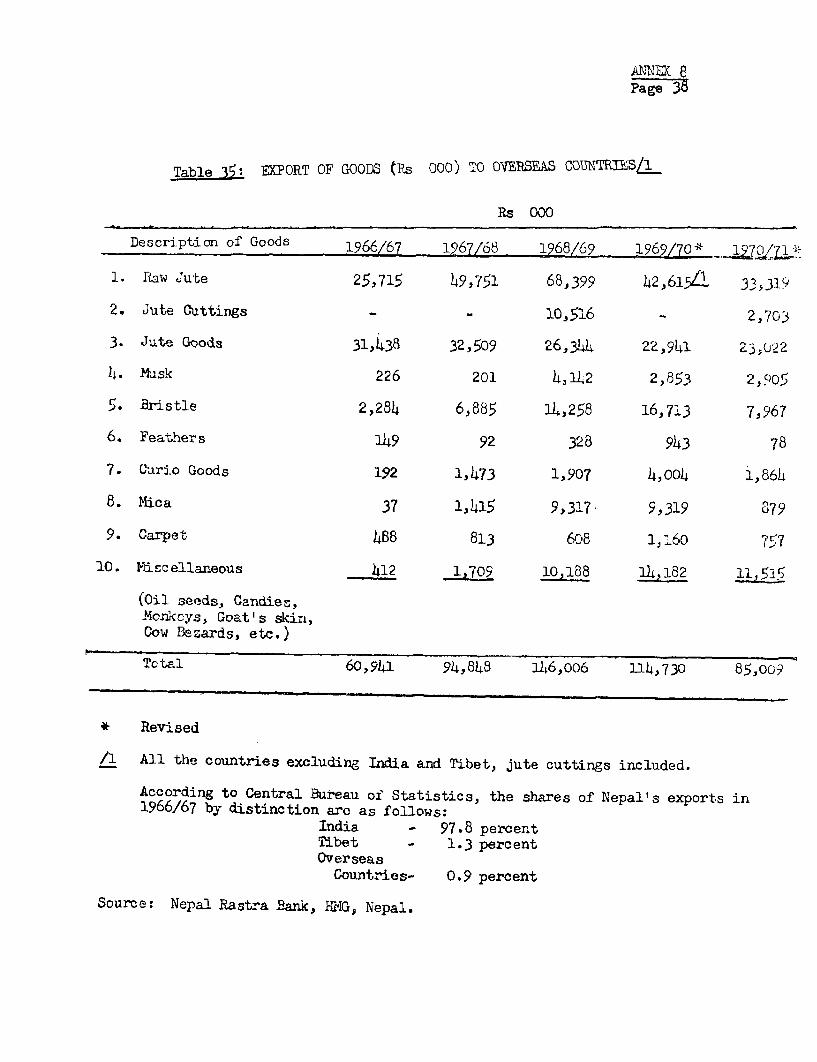
AldNEXl 6Page 38
Table 35: EXPORT OF GOODS (Rs 000) TO OVERSEAS COUNTMSLL
Rs 000
Description of Goods 1966/67 1267/68 1968/69 1962/70* '
1. Ptaw Jute 25,715 149,751 68,399 42,61 5LV.. 33,319
2. Jute CDttings - - 10,516 2,703
3. Jute Goods 31,438 32,509 26,3414 22,94iL 23,U22
14. Hask 226 201 4,112 2,853 2,905
5. Bristle 2,284 6,885 14,258 16,713 7,967
6. Feathers 149 92 328 943 78
7. Curio Goods 192 1,473 1,907 4,004 1,864
8. Mica 37 1,415 9,317. 9,319 o79
9. Carpet 468 813 608 1,160 757
10. Miscellaneous 412 1,709 10,188 1142182 51
(Oil seeds, Candies,Mlorcoys, Goat' s skin,Cow Bezards, etc.)
Total 6o,941 94,848 XL46,oo6 114,730 85,009
* Revised
/1 All the countries excluding India and Tibet, jute cuttings included.
According to Central Bureau oI' Statistics, the shares of Nepal's exports in1966/67 by distinction are as follows:India - 97.8 percentTibet - 1.3 percentOverseas
Countries- 0.9 percent
Source: Nepal Rastra Bank, MiG, Nepal.
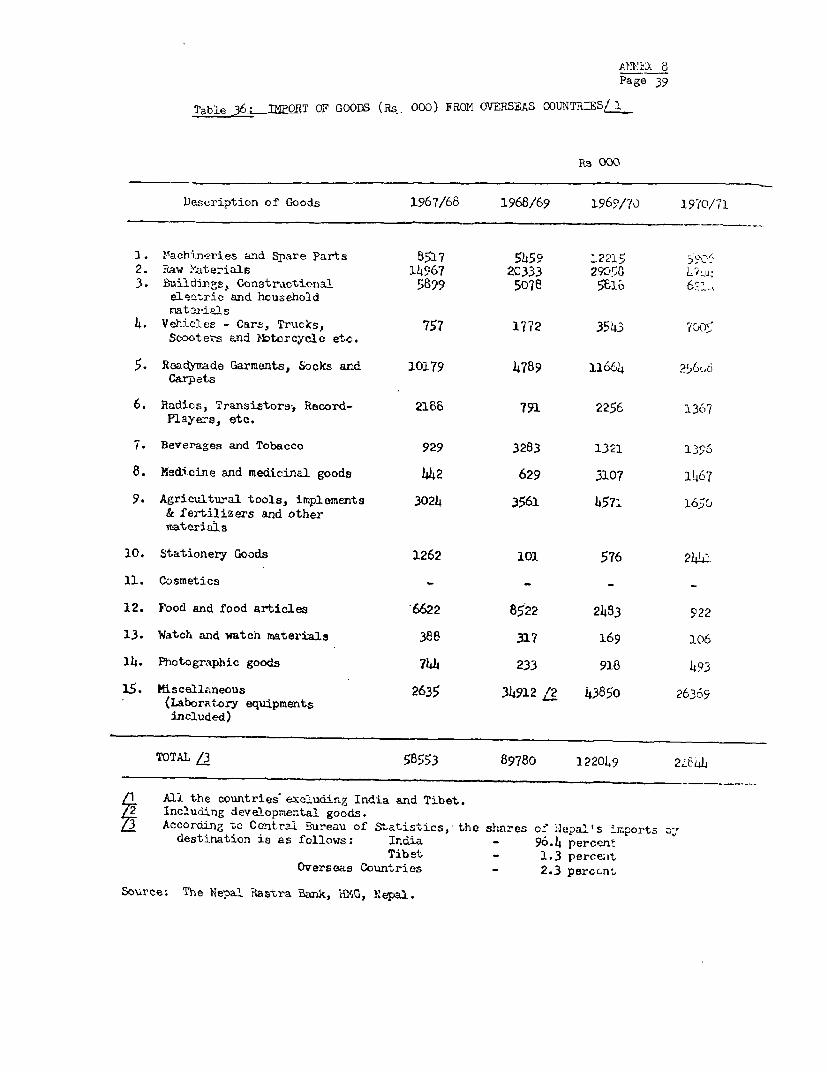
Page 39
Table 36I-ImPOI T OF GOODS (Rs 000) FROM OVERSEAS COUNTRIESL_.,
Rs Oo
Description or Goods 1967/68 1968/69 1969/70 1970/71
1. ^eachin-ries and Spare Parts 8517 5459 1221 52. Raw Materials 14S967 20333 29CwG3. Buildinpgs Constructional 5899 507e 581l 6-L..
electrie and householdmatavrials
4. Vehicles - Cars, Trucks, 757 177 2 3543 710•Scooter-s and lbtercycle et c.
5. Readyrade Garments, Socks and 10179 4789 11664 ?56>,oCarpets
6. Radios, Transistors, Record- 2186 791 2256 1367Players, etc.
7. Beverages and Tobacco 929 3283 1321 13-S
8. Medicine and medicinal goods 442 629 3107 1467
9. Agricultural tools, implenents 3024 3561 4571 165t& fertilizers axid otherinaterials
10. Stationery Goods 1262 101 576 2441
11. Cosmetics
12. Food and food articles 6622 8522 2483 922
13. Watch and watch materials 388 317 169 106
14. Photographic goods 744 233 918 493
15. Miscellaneous 2635 34912 ,2 43850 26369(Laboratory equipmentsincluded)
TOTAL 13 58553 89780 1220L9 2,L644
LI All the cQuntries excluding India and Tibet.2 Including developmental goods.f3 According to Ccntral Bureau of Statistics, the shares o: jLepa1ls m'-ports s'
destination is as follows: India - 96.4 percentTibet - 1.3 perce;it
Overseas Countries - 2.3 perccnnt
Source: The Nepal Rastra Bank, vG, Nepal.
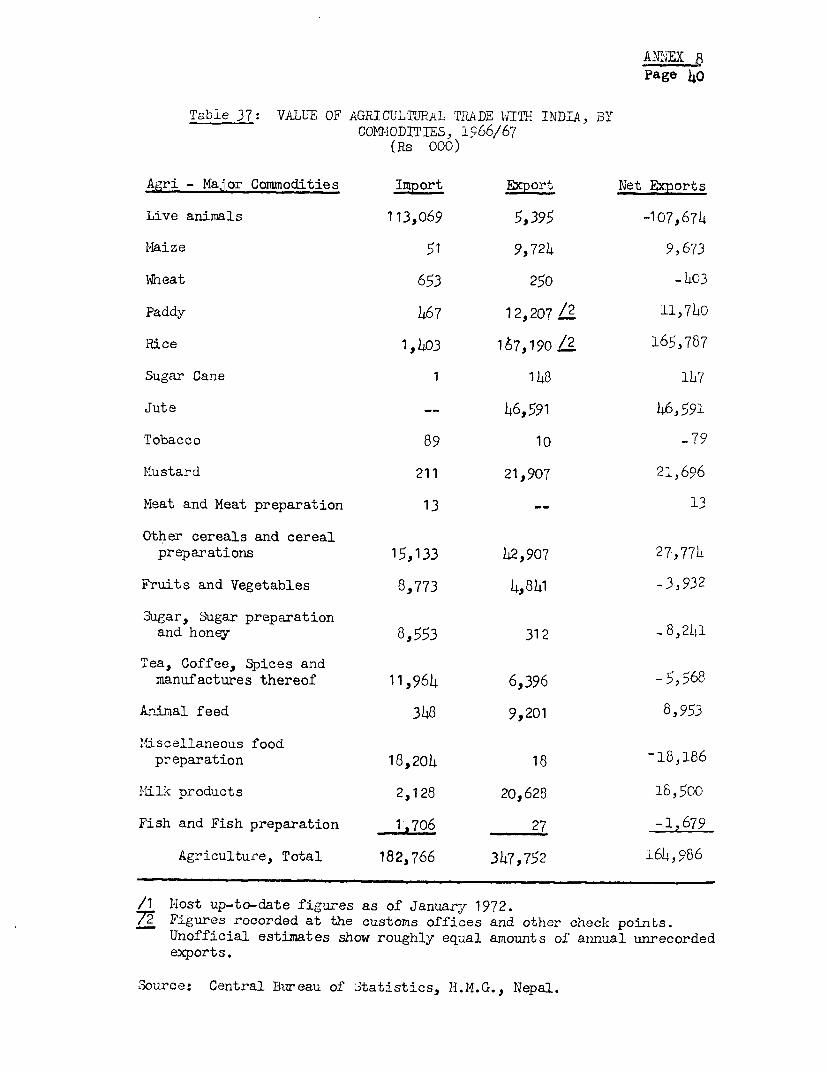
Ah13EX Bpage 4o
Table 37: VALUE OF AGRICULTURAL TRADE WITh INDIA, BYCOMIODITIES, 1566/67
(Rs 000)
Agri - Major Commodities Import Export Net Exports
Live animals 113,069 5,395 -107,674
Maize 51 9,724 9,673
Th eat 653 250 -1403
Paddy 467 12,207 /2 11,7140
Rice 1,1403 167,190 /2 165,787
Sugar Cane 1 148 147
Jute 46,591 146,591
Tobacco 89 10 -79
IMustard 211 21,907 21,696
Meat and Meat preparation 13 __ 13
Other cereals and cerealpreparations 15,133 42.,907 27,7714
Fruits and Vegetables 8,773 4,8141 3,932
3ugar, 3ugar preparationand honey 8,553 312 8,21
Tea, Coffee, Spices andmanufactures thereof 11,964 6,396 -5,568
Animal feed 348 9,201 8,953
Miscellaneous foodpreparation 18,204 18 -8,l86
KiLk products 2,128 20,628 15,500
Fish and Fish preparation 1,706 27 -1,679
Agriculture, Total 182,766 3147,752 161L,966
/1 Host up-to-date figures as of January 1972.77 Figures recorded at the customs offices and other check points.
Unofficial estimates show roughly equal amounts of annual unrecordedexports.
Source: Central Bureau of btatistics, H.M.G., Nepal.
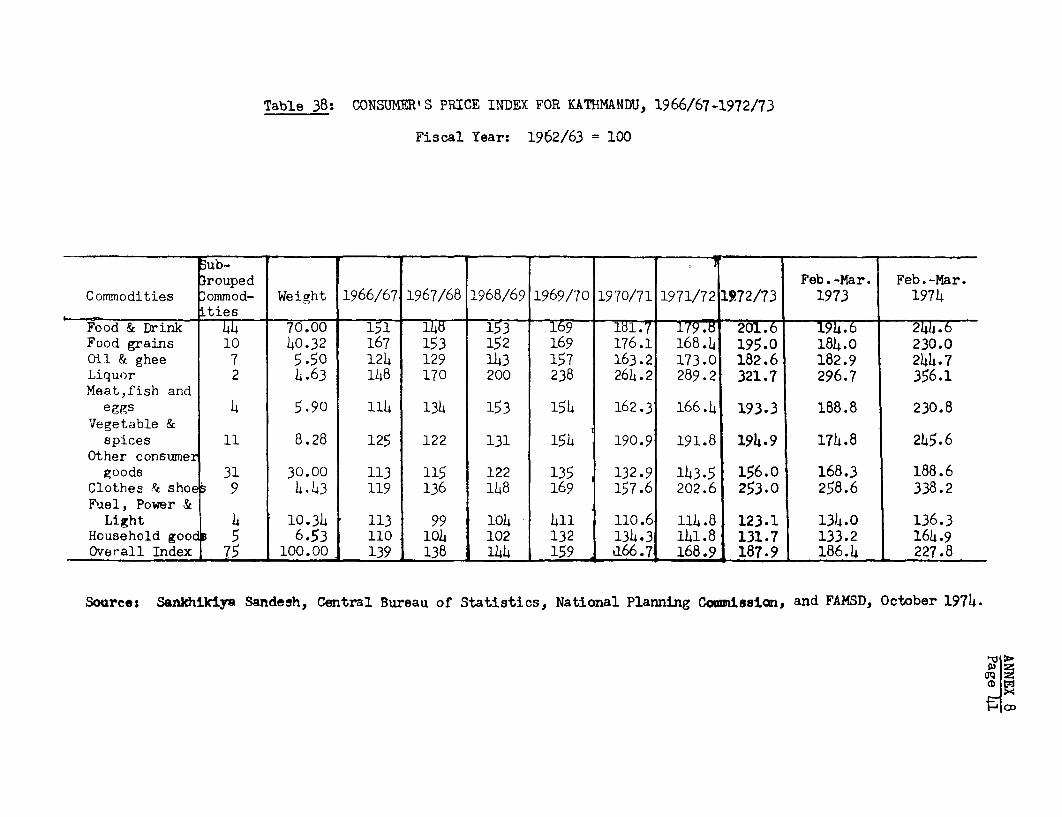
Table 38: CONSUMER'S PRICE INDEX FOR KATHMANDU, 1966/67-1972/73
Fiscal Year: 1962/63 = 100
ub-rouped Feb.-Mar. Feb.-Mar.
Commodities ommod- Weight 1966/67 1967/68 1968/69 1969/70 1970/71 1971/721972/73 1973 1974ties _____
Food & Drink 44 70.00 151 14T 153 169 - t 179.7 201.6 194.6 244.6Food grains 10 40.32 167 153 152 169 176.1 168.4 195.0 184.0 230.0Oil & ghee 7 5.50 124 129 143 157 163.2 173.0 182.6 182.9 244.7Liquor 2 4.63 148 170 200 238 264.2 289.2 321.7 296.7 356.1Meat,fish and
eggs 4 5.90 114 134 153 154 162.3 166.4 193.3 188.8 230.8Vegetable &spices 11 8.28 125 122 131 154 190.9 191.8 194.9 174.8 245.6
Other consumergoods 31 30.00 113 115 122 135 132.9 143.5 156.0 168.3 188.6
Clothes & shoe 9 4.43 119 136 148 169 157.6 202.6 253.0 258.6 338.2Fuel, Power &
Light 4 10.34 113 99 104 411 110.6 114.8 123.1 134.0 136.3Household goods 5 6.53 110 104 102 132 134.3 141.8 131.7 133.2 164.9Overall Index 75 100.00 139 138 144 159 166.7 168.9 187.9 186.4 227.8
Sources Sankhikiy. Sandesh, Central Bureau of Statistics, National Planning Comuission, and FAMSD, October 1974.
o1I.
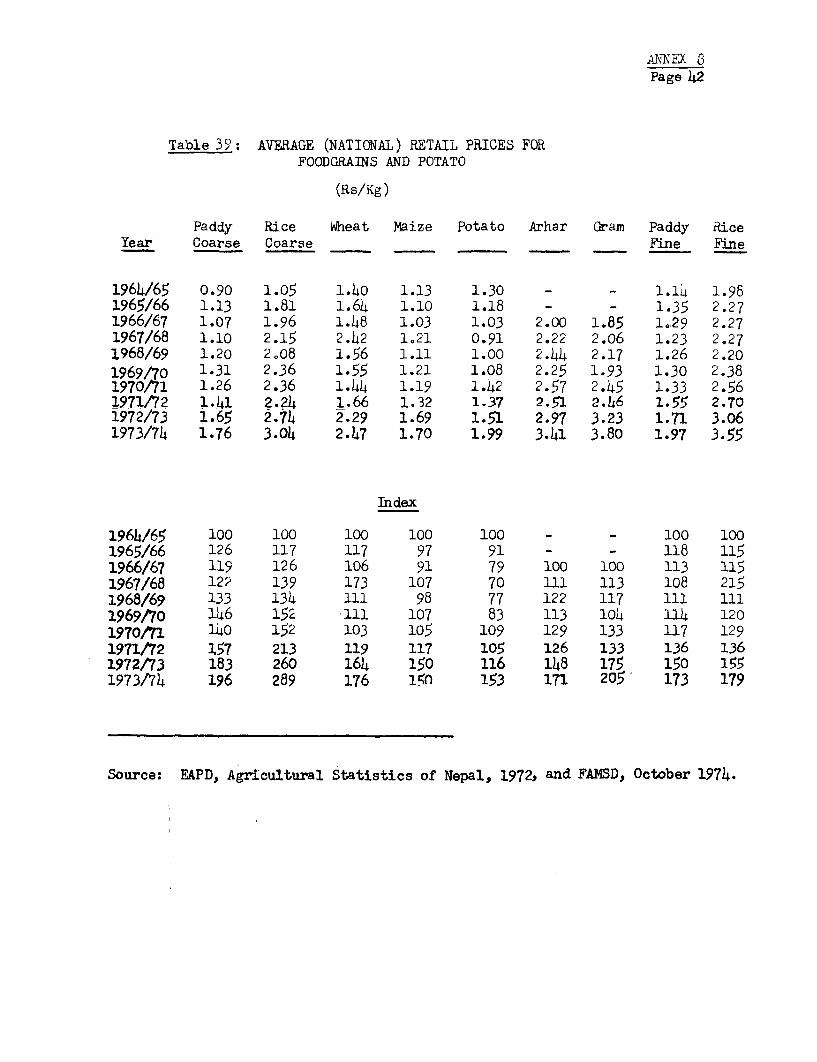
A\TNa aPage 42
Table 3°: AVERAGE (NATIONAL) RETAIL PRICES FORFOODGRAINS AND POTATO
(Rs/Kg)
Paddy Rice Wheat Maize Potato Arhar Gram Paddy RiceYear Coarse Coarse Fine Fine
1964/65 0.90 1.05 1.40 1.13 1.30 - - 1.14 1.961965/66 1.13 1.81 1.64 1.10 1.18 - - 1.35 2.271966/67 1.07 1.96 1.48 1.03 1.03 2.00 1.85 1.29 2.271967/68 1.10 2.15 2.42 1.21 0.91 2.22 2.06 1.23 2.271968/69 1.20 2.08 1.56 1.11 1.00 2.44 2.17 1.26 2.201969/70 1.31 2.36 1.55 1.21 1.08 2.25 1.93 1.30 2.381970/71 1.26 2.36 1.44 1.19 1.42 2.57 2.45 1.33 2.561971/72 1.41 ?2?4 1.66 1.32 1.37 2.51 2.46 1.55 2.701972/73 1.65 2.74 2.29 1.69 1.51 2.97 3.23 1.71 3.061973/74 1.76 3.04 2.47 1.70 1.99 3.41 3.80 1.97 3.55
Index
1964/65 100 100 100 100 100 - - 100 1001965/66 126 117 117 97 91 - - 118 1151966/67 119 126 106 91 79 100 100 113 1151967/68 122 139 173 107 70 111 113 108 2151968/69 133 134 111 98 77 122 117 111 1111969/70 146 152 111 107 83 113 104 114 1201970m1 140 152 103 105 109 129 133 117 1291971/72 2.57 213 119 117 105 126 133 136 1361972/73 183 260 164 150 116 148 175 150 1551973/74 196 289 176 150 153 171 205 173 179
Source: EAPD, Agricultural Statistics of Nepal, 1972, and FAMSD, October 1974.
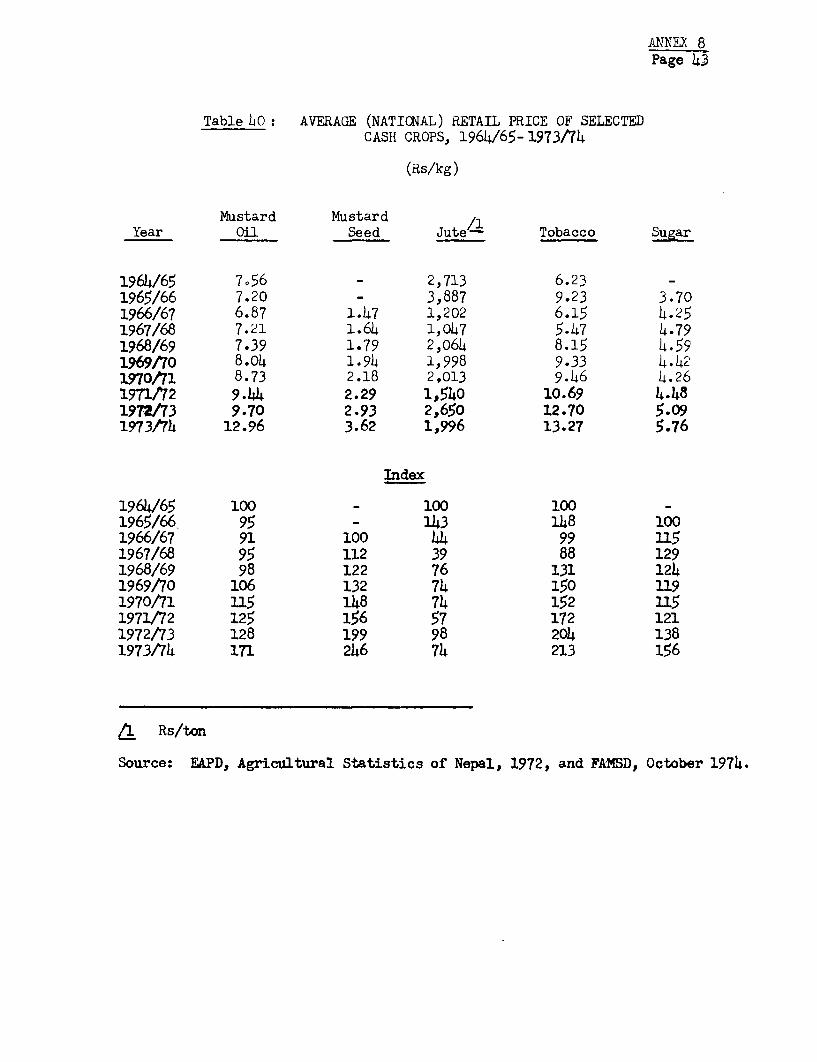
ANNEX 8Page 43
Table bo: AVERAGE (NATICNAL) RETAIL PRICE OF SELECTEDCASH CROPS, 1964/65-1973/74
(Rs/kg)
Mustard Mustard /1Year Oil Seed Jute- Tobacco Sugar
1964/65 756 - 2,713 6.23 -
1965/66 7.20 - 3,887 9.23 3.701966/67 6.87 1.47 1,202 6.15 4.251967/68 7.21 1.64 1,047 5.47 4.791968/69 7.39 1.79 2,064 8.15 4.591969/70 8.04 1.94 1,998 9.33 4.421970o1 8.73 2.18 2,013 9.46 4.261971t12 9.44 2.29 1,540 10.69 4.481972/73 9.70 2.93 2,650 12.70 5.091973/74 12.96 3.62 1,996 13.27 5.76
Index
1964/65 100 - 100 1001965/66- 95 - 143 148 1001966/67 91 100 44 99 1151967/68 95 112 39 88 1291968/69 98 122 76 131 1241969/70 106 132 74 150 1191970/71 U5 148 74 152 1151971/72 125 156 57 172 1211972/73 128 199 98 204 1381973/4 171 246 74 213 156
/ Rs/ton
Source: EAPD, Agricultural Statistics of Nepal, 1972, and FAflD, October 1974.
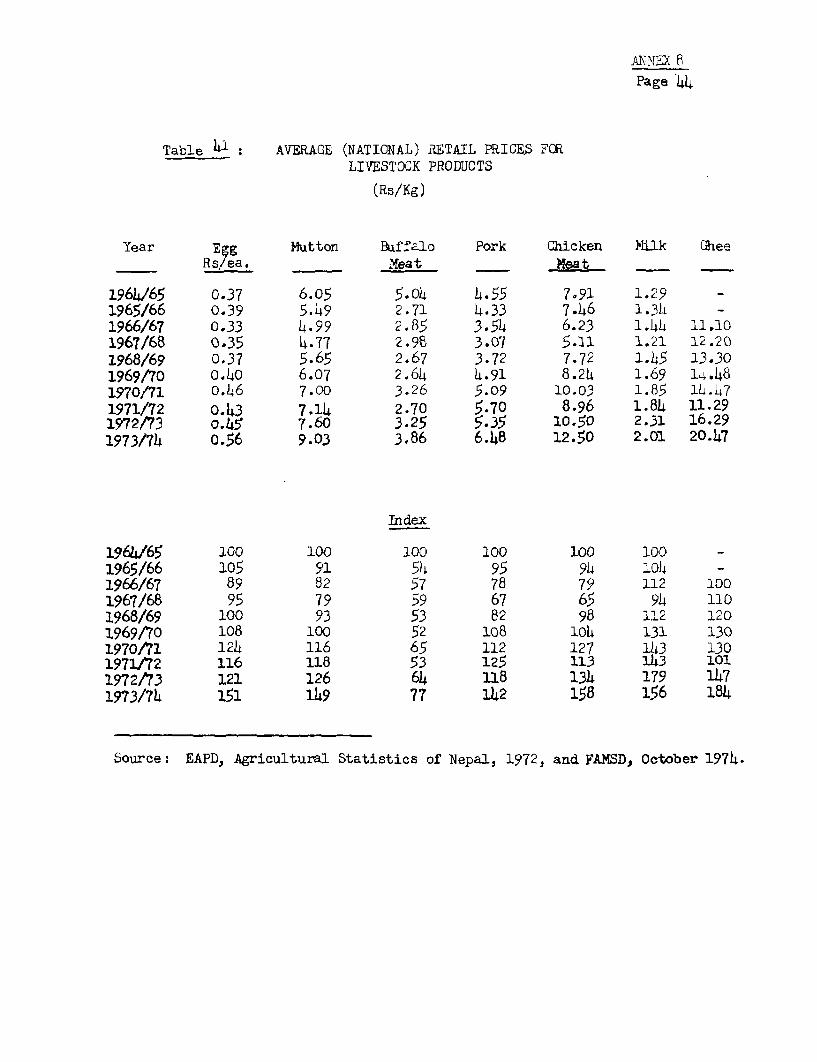
AKNTAX 8
Page .44
Table 41: AVERAGE (NATIONAL) RETAIL PRICE.S FORLIVESTOCK PRODUCTS
(Rs/Kg)
Year Egg Mutton Buffalo Pork Chicken }ilk GheeRs/ea. Meat _ - -
1961465 0.37 6.05 5.04 4.55 7.91 1.29 -
1965/66 0.39 5.49 2.71 4.33 7.46 1.314 -1966/67 0.33 4.99 2.85 3.54 6.23 1.h4 11.101967/68 0.35 4.77 2.98 3.07 5.11 1.21 12.201968/69 0.37 5.65 2.67 3.72 7.72 1.45 13.301969/70 0.40 6.07 2.64 4.91 8.24 1.69 14.481970/71 o.46 7.00 3.26 5.09 10.03 1.85 14.471971/72 0.43 7.14 2.70 5.70 8.96 1.84 11.291972/73 o.45 7.60 3.25 5.35 10.50 2.31 16.291973/74 o.56 9.03 3.86 6.48 12.50 2.01 20.47
Index
1964/65 100 100 100 100 100 100 -1965/66 105 91 54 95 94 104 -
1966/67 89 82 57 78 79 112 1001967/68 95 79 59 67 65 94 1101968/69 100 93 53 82 98 112 1201969/70 108 100 52 108 lo0 131 1301970/71 124 116 65 112 127 143 1301971/72 116 118 53 125 113 13 1011972/73 121 126 64 118 134 179 1471973/74 151 149 77 142 158 156 184
Source: EAPD, Agricultural Statistics of Nepal, 1972, and FAMSD, October 1974.
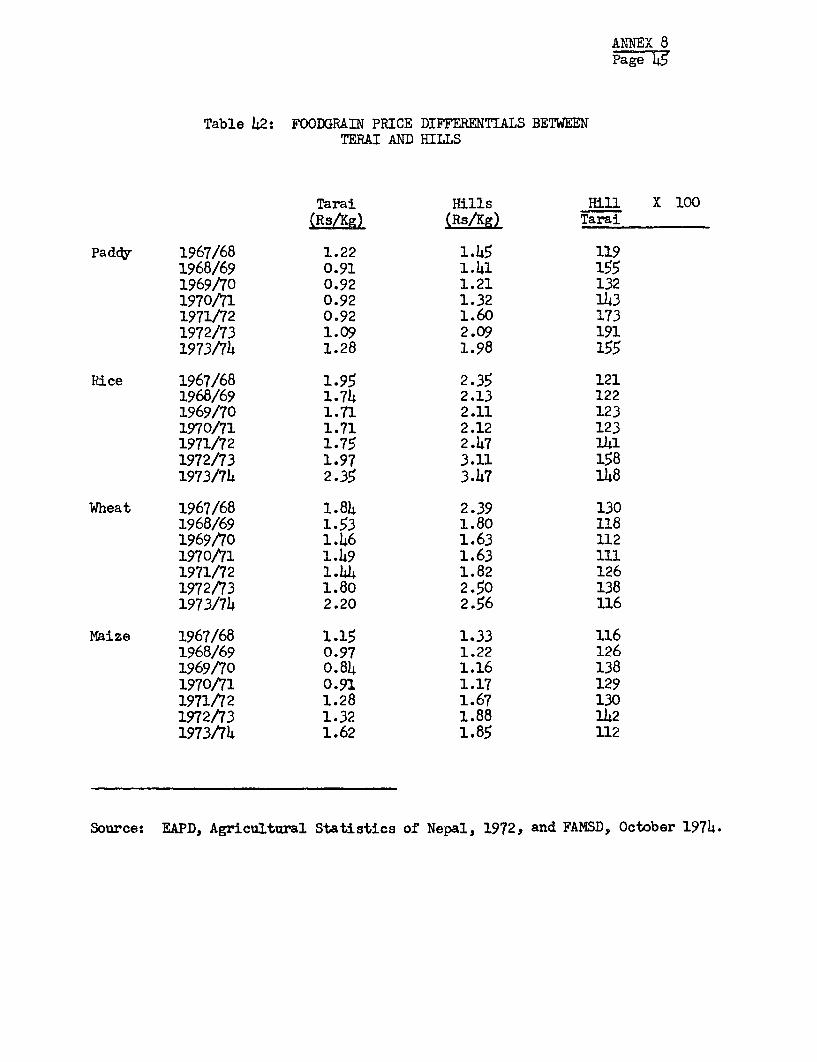
ANNEX 8Page 4 5
Table 42: FOODGRAIN PRICE DIFFERENTIALS BETWEENTERAI AND HILLS
Tarai Hills Hill X 100(Rs/Ag) (Rs/Ag) Tarai
Padc 1967/68 1.22 1.45 1191968/69 0.91 1.41 1551969/70 0.92 1.21 1321970/71 0.92 1.32 1431971/72 0.92 1.60 1731972/73 1.09 2.09 1911973/74 1.28 1.98 155
Rice 1967/68 1.95 2.35 1211968/69 1.74 2.13 1221969/70 1.71 2.11 1231970/71 1.71 2.12 1231971/72 1.75 2.47 1411972/73 1.97 3.11 1581973/74 2.35 3.47 148
Wheat 1967/68 1.84 2.39 1301968/69 1.53 1.80 1181969/70 1.46 1.63 1121970/71 1.49 1.63 1111971/72 1.44 1.82 1261972/73 1.80 2.50 1381973/74 2.20 2.56 116
Maize 1967/68 1.15 1.33 1161968/69 0.97 1.22 1261969/70 0.84 1.16 1381970/71 0.9'1 1.17 1291971/72 1.28 1.67 1301972/73 1.32 1.88 1421973/74 1.62 1.85 112
Source: EAPD, Agricultural Statistics of Nepal, 1972, and FAMSD, October 1974.
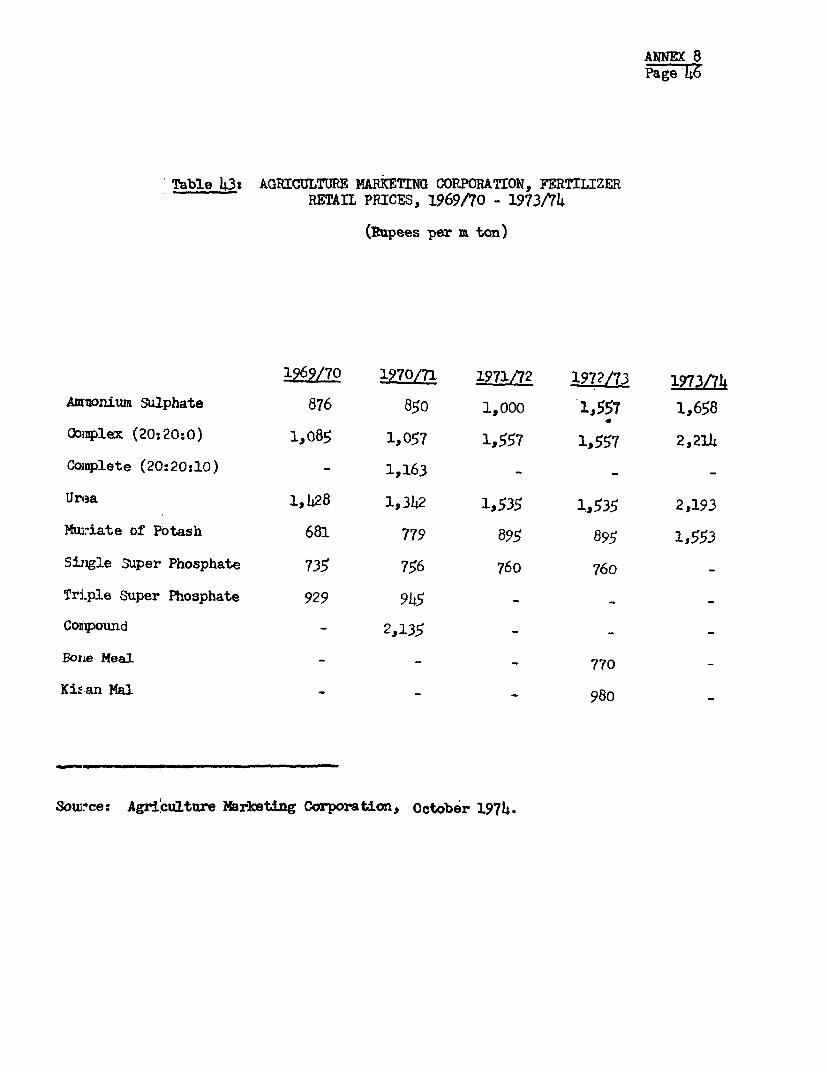
ANNEX 8Pa-ge 46
Table 43s AGRICULTURE MARETING CORPORATION, FERTILIZERRETAnI PRICES, 1969/70 - 1973/4
(Rupees per m ton)
12 L0 1570/71 1 /72 1972/73 1973/74
Aumwonium Sulphate 876 850 1,000 1,557 1,658Cobplex (20:20:0) 1,085 1,057 1,557 1,557 2,214
Colnplete (20:20:10) - 1,163 - - -
Unaa 1,428 1,312 1,535 1,535 2,193
?ftwiate of Potash 681 779 895 895 1,553
Sijgle S-uper Phosphate 735 756 760 760
Tri.ple Super Phosphate 929 945 - -
ComWound - 2,135
Bone Meal - - 770
Kisan Mal - 980
Source: Agriculture Marketing Corporation, October 197?.
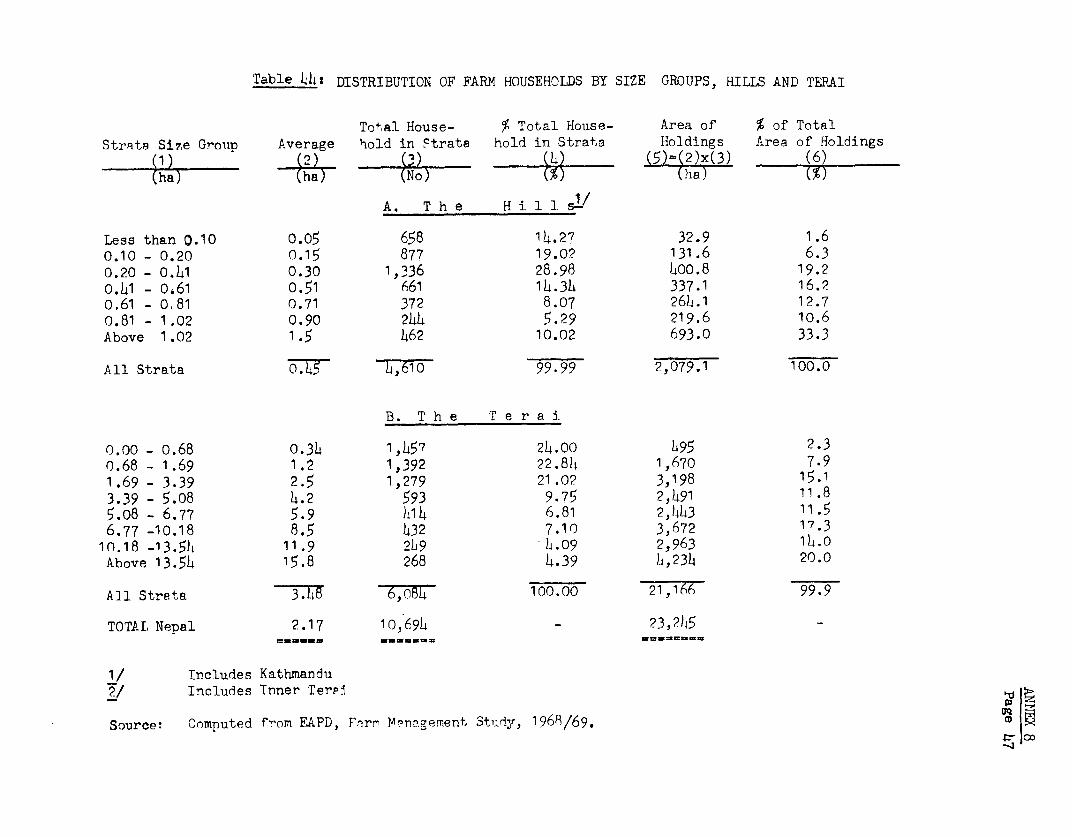
Table U4t DISTRIBUTION OF FARM HOUSEHOLDS BY SIZE GROUPS, HILLS AND TERAI
Total House- % Total House- Area of % of TotalStrRte Si7e Group Average hold in Ftrate hold in Strata Holdings Area of Holdings
h1) (2) - ( -) (4- (5-2)x(3) _(6)(ha) (ha) (No) (% ('aa) (%
A. T h e H i 1 1 s..
Less than 0.10 0.05 658 14.27 32.9 1.60.10 - 0.20 0.15 877 19.02 131.6 6.30.20 - 0.41 0.30 1,336 28.98 WLoo.8 19.20.41 - 0,61 0.51 661 14.3h 337.1 16.20.61 - 0.81 0.71 372 8.07 26)4.1 12.70.81 - 1.02 0.90 244 5.29 219.6 10.6Above 1.02 1.5 462 10.02 693.0 33.3
All Strata 0.7- b,610 99.99 2,079.1 100.0
B. T h e T e r a i.
0.00- 0.68 0.34 1,457 24.oo h95 2.30.68 - 1.69 1.2 1,392 22.81 1,670 7.91.69 - 3.39 2.5 1,279 21.02 3,198 15.13.39 - 5.08 4.2 593 9.75 2,491 11.85.08 - 6.77 5.9 hi 4 6.81 2,443 11.56.77 -10.18 8.5 432 7.10 3,672 17.3
1n.18 -13.54 11.9 2k9 -1.09 2,963 11.0Above 13.54 15.8 268 4.39 h,234 20.0
All Strata 3.h8 6,084 100.00 21,166 99.9
TOTAL Nepal 2.17 10,69h - 23,21h5
1/ Tncludes Kathmandu2/ Includes Tnner Terni
Source: Computed from EAPD, Fnrm M,?nagement Study, 1968/69.
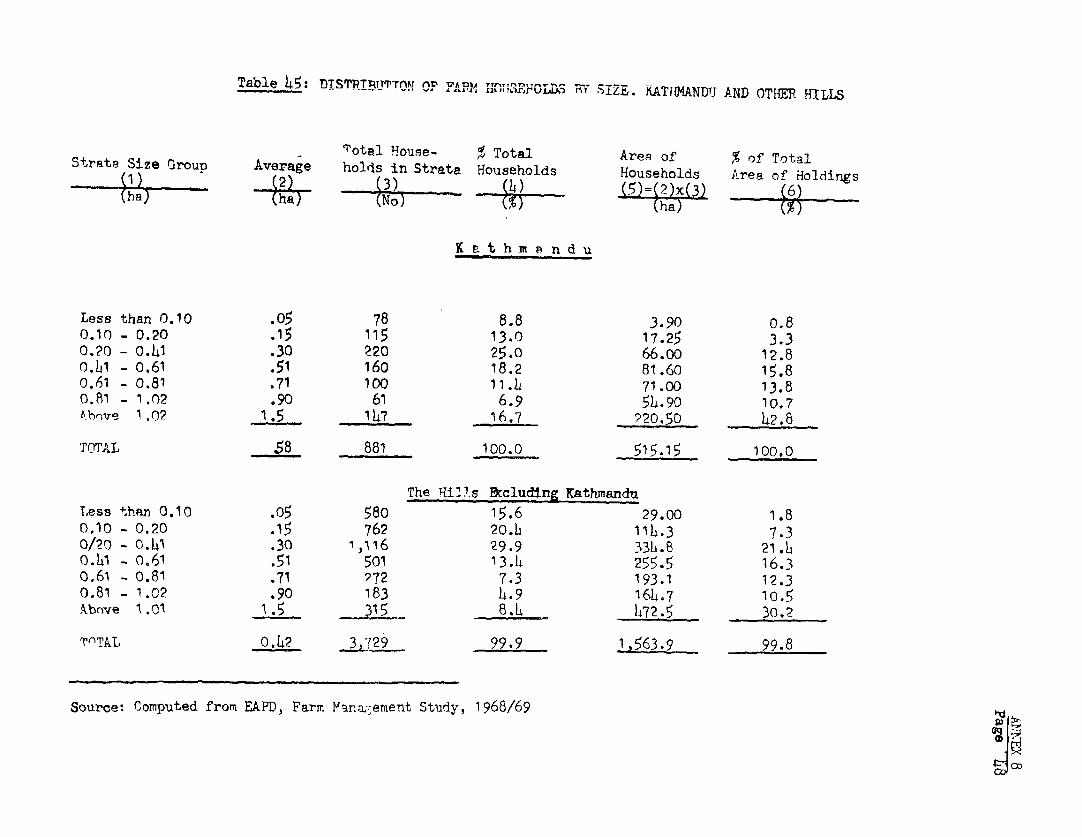
Table 145: DTSTRTPiTTTTTM OCT rAi.r. nv>TtnzrJrOIIn n; *S1ZA. KATHANDTJ AND OTHER WfILLS
Total WouSe- % Total Area of % of TotalStrata Size Group Average holds in Strata Households Households Area of Holdings
(ha) +6h;- _ (ha )x
K a t hmandu
Less than 0 .10 .05 78 8.8 3.90 0.8
0.10 - 0.20 .15 115 13.0 17.25 3.3
0.20 - 0.141 .30 220 25.0 66.oo 12.8
o.bi 0.61 .51 160 18.2 81.60 15.8
0.61 _ 0.81 .71 100 11.L 71.00 13.8
0.81 _ 1.02 .90 61 6.9 5h.90 10.7
Abhove 1 .02 1.5 1147 16.7 220.50 142.8
TOTAL 58 881 100.0 515.15 100.0
Trhe Iill-s cluding Kathmandu
Less than 0.10 .o5 580 15.6 29.00 1.8
0.10 - 0.20 .15 762 20.L 114.3 7.3
0/20 - o0.41 .30 1016 29.9 33h.8 21.6
0.L1 - 0,61 .51 501 13.41 255.5 16.3
0.61 - 0.81 .71 ?72 7.3 193.1 12.3
0.81 - 1.02 .90 183 4.9 164.7 10.5
Akbove 1.01 1.5 8.4 1072.5 30.2
T('TkL 0.42 3,729 99.9 1,5'63.9 99.8
Source: Computed from FEAPD, Farm Mana:,ement Study, 1968/69
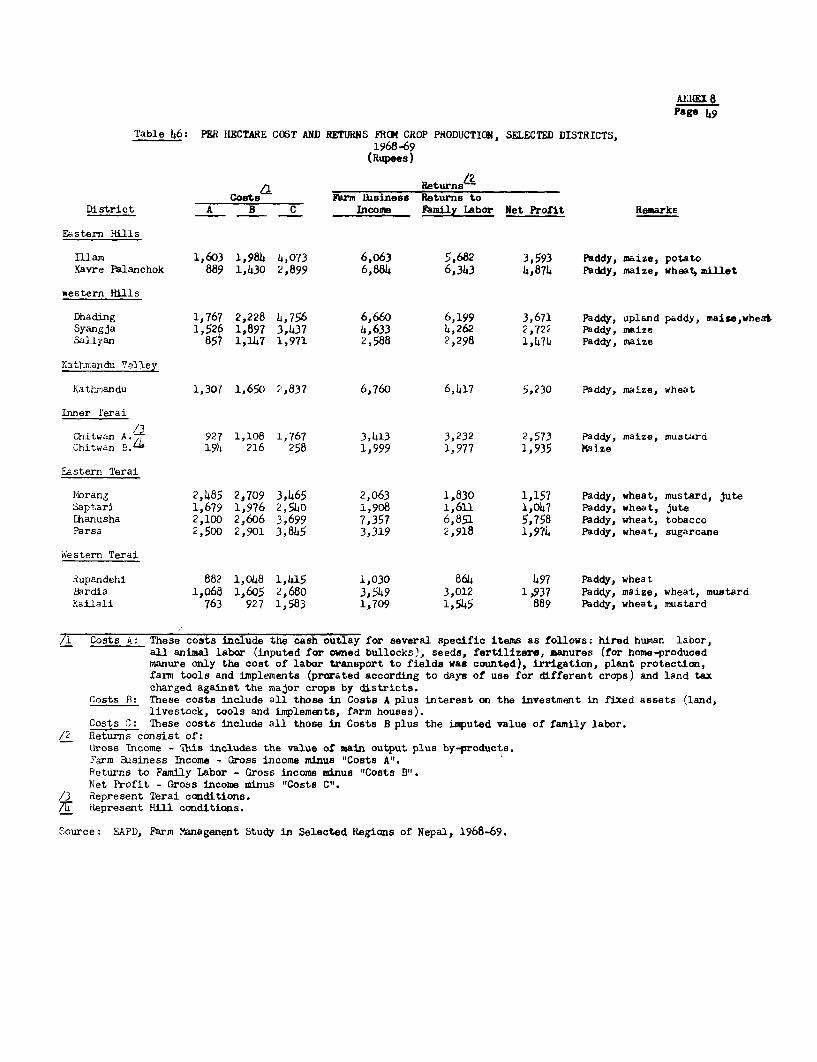
A.IMEI 8Page 49
Table 46: PER HECTARE COST AND RETURNS FRCO CROP PRODUCTION, SELECTED DISTRICTS,1968-69
(Rupees)
ReturnsL2Costats Ym Business Returns to
District A B C Income Famzily Labor Net Profit RemarkE
Eastern Hills
Illam 1,603 1,984 4,073 6,063 5,682 3,593 paddy, maize, potatoKavre Palanchok 889 1,430 2,899 6,884 6,343 4,874 Paddy, maize, wheat, millet
hsestern Hills
Dhading 1,767 2,228 4,756 6,660 6,199 3,671 Paddy, upland paddy, maise,wheatSyangja 1,526 1,897 3,437 4,633 4,262 2,722 Paddy, maizeSallyan 857 1,147 1,971 2,588 2,298 1,474 Paddy, maize
Kathrnandu Valley
Kathiandu 1,307 1,650 2,837 6,760 6,417 5,230 Paddy, maize, wheat
Inner 1erai
Chitwan A. 927 1,108 1,767 3,413 3,232 2,573 Paddy, maize, mustardChitwan E./4 194 216 258 1,999 1,977 1,935 Maize
Eastern Terai
Morang 2,485 2,709 3,465 2,063 1,830 1,157 Paddy, wheat, mustard, juteSaptari 1,679 1,976 2,540 1,908 1,611 1,047 Paddy, wheat, juteDhanusha 2,100 2,606 3,699 7,357 6,851 5,758 Paddy, wheat, tobaccoParsa 2,500 2,901 3,845 3,319 2,918 1,974 Paddy, wheat, sugarcane
Western Terai
Rupandehi 882 1,048 1,415 1,030 864 497 Paddy, wheatBardia 1,068 1,605 2,680 3,549 3,012 1,937 Paddy, maize, wheat, mustardKailali 763 927 1,583 1,709 1,545 889 Paddy, wheat, mustard
/1 Costs A: These costs include the cash outlay for several specific items as follows: hired human labor,all animal labor (inputed for owned bullocks), seeds, fertilizer", manures (for home-producedmanure only the cost of labor transport to fields was counted), irrigation, plant protection,fanm tools and implements (prorated according to days of use for different crops) and land taxcharged against the major crops by districts.
Costs B: These costs include all those in Costs A plus interest on the investment in fixed assets (land,livestock, tools and implements, farm houses).
Costs C: These costs include all those in Costs B plus the imputed value of family labor./2 Returns consist of:
Gross Income - This includes the value of main output plus by-products.Farm Business Income - Gross income minus "Costs A".Returns to Family Labor - Gross income minus "Costs B".Net Profit - Gross income minus "Costs C".
/3 Represent Terai conditions.7U Represent Hill conditions.
Source: EAPD, Farm Management Study in Selected Regions of Nepal, 1968-69.
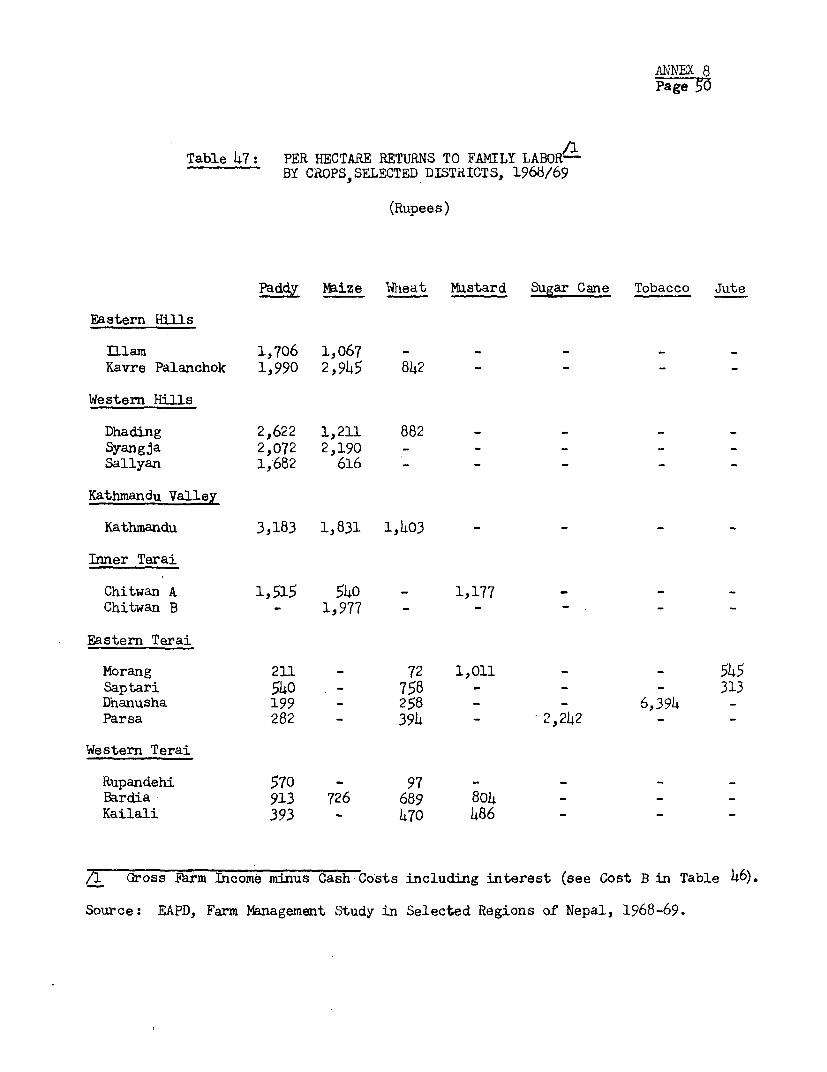
ANNTEX 8Page 5O
Table 47: PER HECTARE RETURNS TO FANILY LABOR-BY CROPS,SELECTED DISTRICTS, 1968/69
(Rupees)
Paddy Maize Wiheat Mustard Sugar Cane Tobacco Jute
Eastern Hills
nilam 1,706 1,067 -Kavre Palanchok 1,990 2,945 842
Western Hills
Dhading 2,622 1,211 882Syangja 2,072 2,190 -Sallyan 1,682 616 -
Kathmandu Valley
Kathmandu 3,183 1,831 1,403 -
Inner Terai
Chitwan A 1,515 540 - 1,177Chitwan B - 1,977 - - -
Eastern Terai
Morang 211 - 72 1,011 - - 545Saptari 540 . - 758 - _ - 313Dhanusha 199 - 258 - - 6,394 -
Parsa 282 - 394 - 2,242 -
Western Terai
Rupandehi 570 - 97 - -
Bardia 913 726 689 804Kailali 393 - 470 486 -
/I Gross P-rm Income minus Cash Costs including interest (see Cost B in Table 46).
Source: EAPD, Farm Management Study in Selected Regions of Nepal, 1968-69.
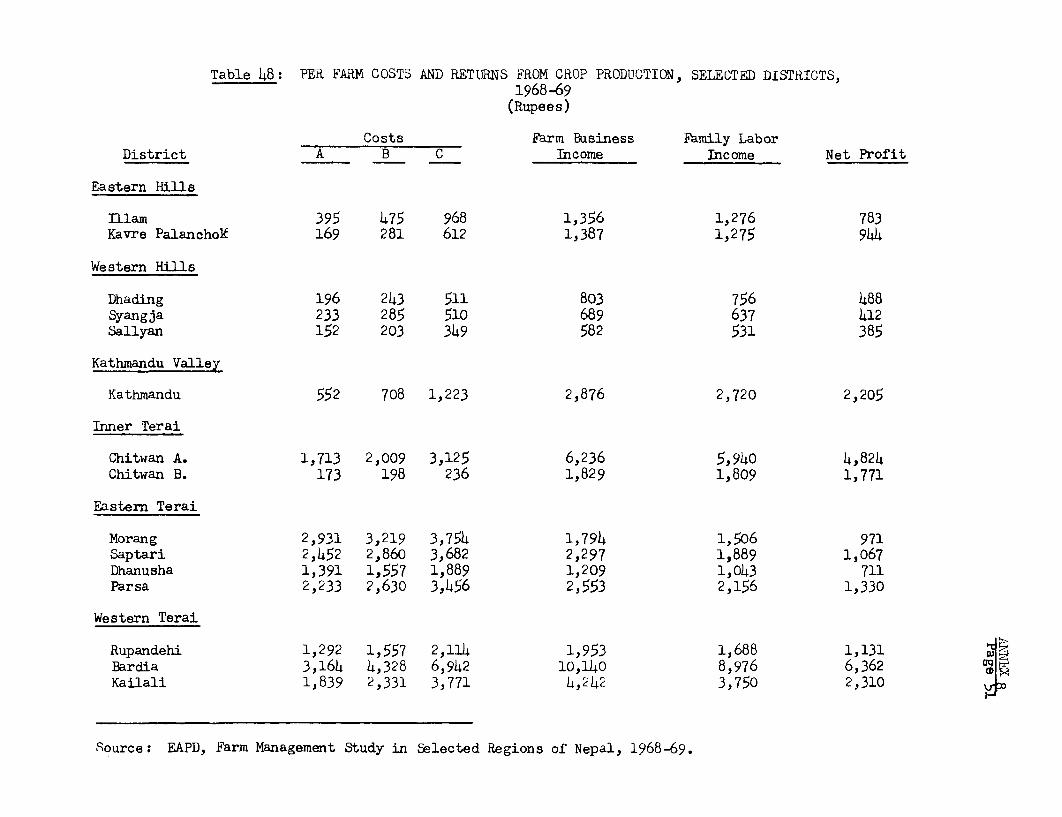
Table 48: PERi FARM COSTS AND RETURNS FROM CROP PRODUCTION, SELECTED DISTRICTS,1968-69
(Rupees)
Costs Farm Business Family LaborDistrict A B C Income Income Net Profit
Eastern Hills
Il1am 395 475 968 1,356 1,276 783Kavre Palanchok 169 281 612 1,387 1,275 944
Western Hills
Dhading 196 243 511 803 756 488Syangja 233 285 510 689 637 412Sallyan 152 203 349 582 531 385
Kathmandu Valley
Kathmandu 552 708 1,223 2,876 2,720 2,205
Inner Terai
Chitwan A. 1,713 2,009 3,125 6,236 5,940 4,824Chitwan B. 173 198 236 1,829 1,809 1,771
Eastern Terai
Morang 2,931 3,219 3,754 1,794 1,506 971Saptari 2,452 2,860 3,682 2,297 1,889 1,067Dhanusha 1,391 1,557 1,889 1,209 1,043 711Parsa 2,233 2,630 3,456 2,553 2,156 1,330
Western Terai
Rupandehi 1,292 1,557 2,114 1,953 1,688 1,131 Bardia 3,164 4,328 6,942 10,140 8,976 6,362 m C
Kailali 1,839 2,331 3,771 4,242 3,750 2,310 v >
Source: EAPD, Farm Management Study in Selected Regions of Nepal, 1968-69.
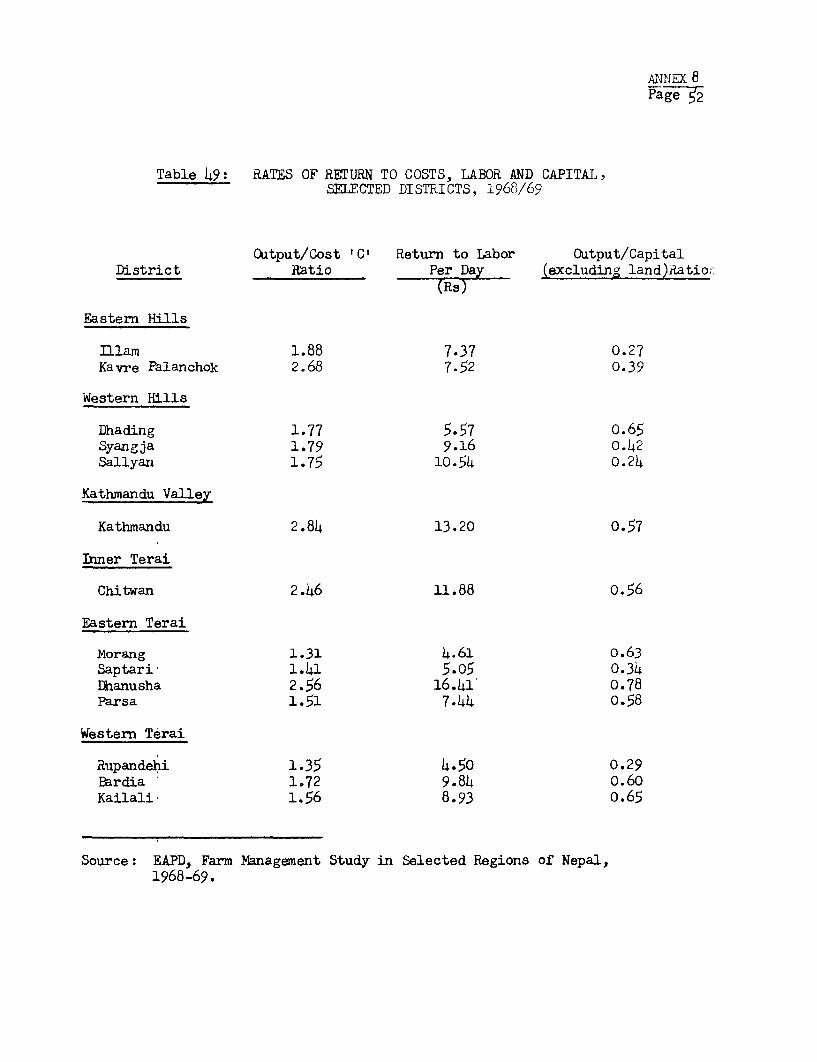
Page 5,2
Table 49: RATES OF RETURN TO COSTS, LABOR AND CAPITAL,SELECTED DISTRICTS, 1968/69
Output/Cost IC' Return to Labor Output/CapitalDistrict Ratio Per Day (excluding 1and)Ratio;.
(Rs)
Eastern Hills
Illam 1.88 7.37 0.27Kavre Palanchok 2.68 7.52 0.39
Western Hills
Dhading 1.77 5.57 o.65Syangja 1.79 9.16 o.42Sallyan 1.75 lo.54 0.24
Kathmandu Valley
Kathmandu 2.84 13.20 0.57
Inner Terai
Chitwan 2 .46 11.88 0.56
Eastern Terai
Morang 1.31 4.61 o.63Saptari 1.41 5.05 0.34Dhanusha 2.56 16.41 0.78Parsa 1.51 7.44 o0.58
Western Terai
Rupandehi 1.35 4.50 0.29Bardia 1.72 9.84 o.60Kailali 1.56 8.93 o.65
Source: EAPD, Farm Management Study in Selected Regions of Nepal,1968-69.
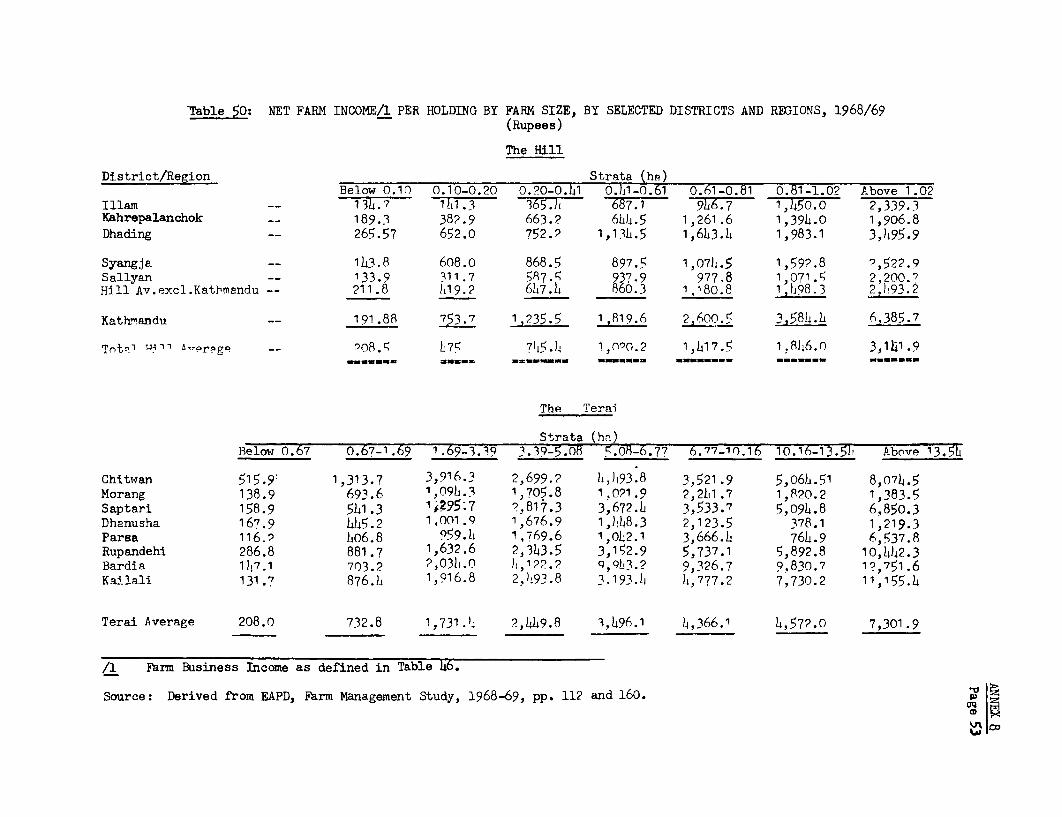
Table 50: NET FARM INCOMEB PER HOLDING BY FARM SIZE, BY SELECTED DISTRICTS AND REGIONS, 1968/69(Rupees)
The Hill
District/Region Strata (he)Below 0.10 0.10-0.20 0.°0-0.41 0.I41-0.61 0.61-0.81 0.81-1.02 Above 1.02
Illam __ 134.7 11ul.3 365.)i 687F1 qt6.7 1,450.0 2,339.3Kahrepalanchok __ 189.3 382.9 663.2 64h.5 1,261.6 1,394.0 1,906.8
Dhading -- 265.57 652.0 752.? 1,13h.5 1,643.4 1,983.1 3,495-9
Syangja -- 143.8 608.0 868.5 897.5 1,074.5 1,59?.8 ?,522.9Sallyan -- 133.9 311.7 587.'i 937.9 977.8 1,071.5 ?,200.7Hill Av.excl.Katkmandu -- 211.8 l119.2 647.L 860.3 1,180.8 1.j_8.3 2,)!93.2
Kath"'andu -- 191.88 753.7 1,935.5 119. 2,600. 3,5814
Tntn1 '4"11 8,,crrgp -_ '08. L,7 ?jS ) 1,n090.2 1,417.5 1.846 . 3,141.9
The Terai
Strata (hn)Belmo 0.67 0.67-1.69 1.69-3.39 3.39-5.08 5.08-6.77 6.77-lo.16 10.16-13.51? Above 13754
Chitwan 515.9: 1,313.7 3,916.3 2,699.? )j,)i93.8 3,521.9 5,06)h.51 8,074.5Morang 138.9 693.6 1,09L.3 1,705.8 1.0?1.9 2,2hl1.7 1,R20.2 1,383.5Saptari 158.9 541.3 1P295.7 9,817.3 3,672.4 3,533.7 5,094.8 6,850.3Dhanusha 167.9 44;5.2 1,0019. 1,676.9 1,448.3 2,123.5 378.1 1,219.3Parsa 116.2 0o6.8 959.1I 1,769.6 1,042.1 3,666.4 764.9 6,537.8Rupandehi 286.8 881.7 1,632.6 2,343.5 3,152.9 5,737.1 5,892.8 10,442.3Bardia 1417.1 703.2 2,034.0 ht,1?2.2 9,9L3.? 9,326.7 9,830.7 19,751.6Kailali 131.7 876.h 1,916.8 2,493.8 3. 193.4 4,777.2 7,730.2 11,155.4
Terai Average 208.0 732.8 1,731.)k 2,449.8 3,496.1 4,366.1 4,572.0 7,301.9
/1 Farm Business Income as defined in Table 46.
Source: Derived from EAPD, Farm Management Study, 1968-69, pp. 112 and 160. j
Aco
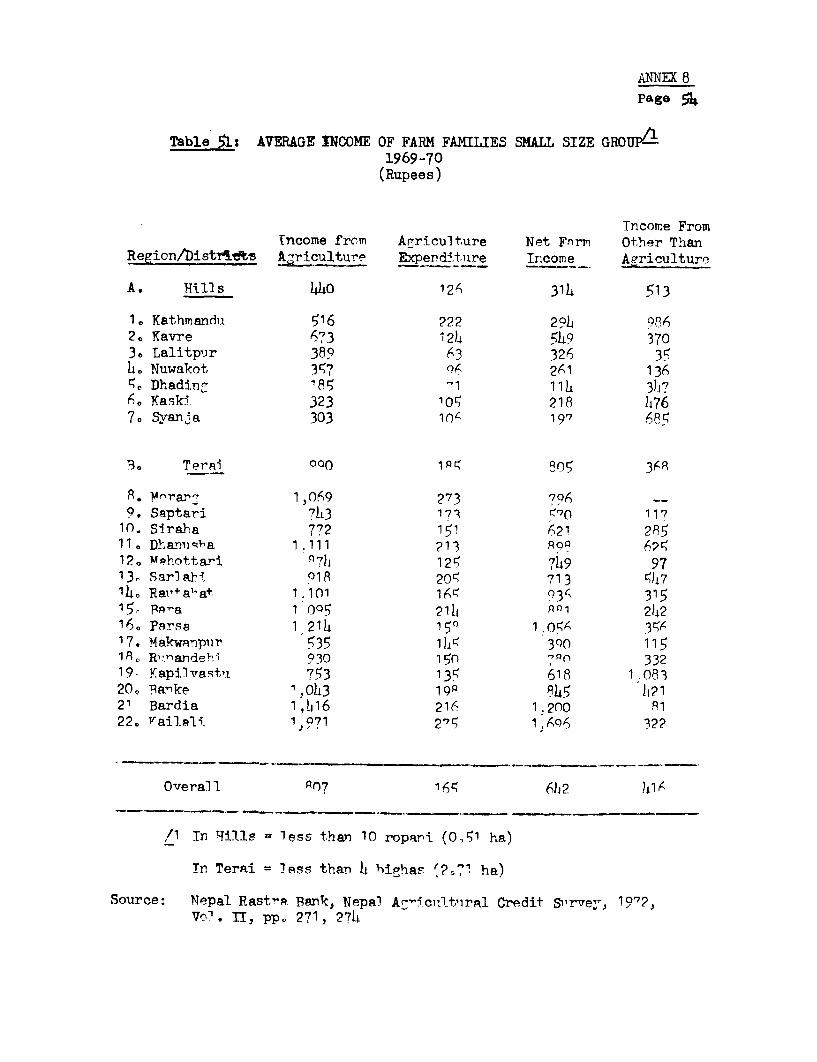
ANNEX 8
Page 54
Table 51: AVERAGE INCOME OF FARM FAMILIES SMALL SIZE GRO Pg1969-70(Rupees)
Tncome Fromrncome from Arriculture Net Fnrm Other Than
Region/bistT.tts U culture Eimend!tiire Income Apriculturc
A. Hills 44o 12I 31L 513
1. Kathmandui 516 222 29b 98,620 Kavre 673 12)4 549 3703. lalitp')r 389 53 326 35h0 Nuwakot 357 q6 2(1 136N Dhadin,, 185 7 1 111 3V750 KaskT. 323 10 218 h767. Syan-a 303 10n 197 "95
.3. TerRi 000 1pQt 905 35R
S. Ynrar- 1,)69 273 796 --0. Saptari 713 171 ?570 117
10. Siraha 772 1t1 621 295110 Dhaniq'ria 1.111 213 P2q120 Mphottari A 7h 125 719 9713, SarlaM- 018R 20' 713 W)1714. Rai,+ aa+t 1.101 1(1 135 31515i P-ra 1 Q05 21 R1 2142160 Prrsa 1 214 159 1 0R5( 3qx17. Makwan.pur 535 1 hl 300 1151. R,o R'andteW, 930 15n 7Qn 33219 4 apilvrastu 753 135 618 1.08320" Parke I 'oh3 19P 45 112121 Bardia 1,1b16 216 1,.20O 9122. raijpli 1,971 2"N 14A06 32?
Overall Q07 16A 6h2 41(1
/1 Tn Uills = 1ess than 10 roparn (0,51 ha)
In Terai = less than h highas '?Q71 ha)
Source: Nepal Rastra Bank, Nepal A'nIc.ultirRl Credit Slirve:r, 197?,Vo'. IT, pp. 271, 274
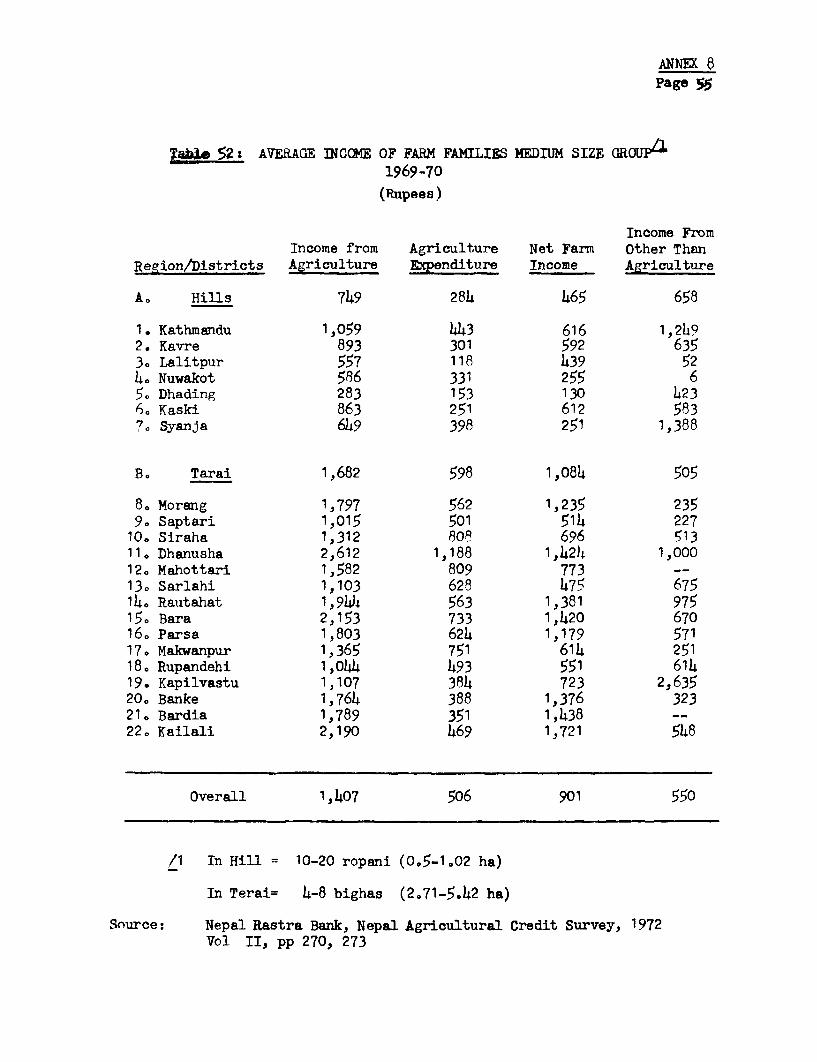
ANNEX 8
Page 55
laL 5s2: AVERAGE INCCKE OF FARM FAMILIES MEDIUM SIZE GROUPa1969-70
(Rnpees)
Income FromIncome from Agriculture Net Farm Other Than
Region/Districts Agriculture Expenditure Income Agriculture
A. Hills 749 284 465 658
1. Kathmandu 1,059 443 616 1,2492. Ravre 893 301 592 6353. Lalitpur 557 118 439 524. Nuwakot 586 331 255 65. Dhading 283 153 130 4236. Kaski 863 251 612 5837. Syanja 649 398 251 1,388
B. Tarai 1,682 598 1,084 505
8. Morang 1,797 562 1,235 2359. Saptari 1,015 501 514 227
10. Siraha 1,312 80.9 696 51311. Dhanusha 2,612 1,188 1,424 1,00012. Mahottari 1,582 809 773 --13. Sarlahi 1,103 628 475 67514. Rauitahat 1,9144 563 1,381 97515. Bara 2,153 733 1,420 67016. Parsa 1,803 624 1,179 57117. Makwanpur 1,365 751 614 25118. Rupandehi 1,0o44 493 551 61419. Kapilvastu 1,107 384 723 2,63520. Banke 1,764 388 1,376 32321, Bardia 1,789 351 1,438 --22. Kailali 2,190 469 1,721 548
Overall 1,407 506 901 550
/1 In Hill = 10-20 ropani (005-1.02 ha)
In Terai= 4-8 bighas (2.71-5,42 ha)
Snurce: Nepal Rastra Bank, Nepal Agricultural Credit Survey, 1972Vol II, pp 270, 273
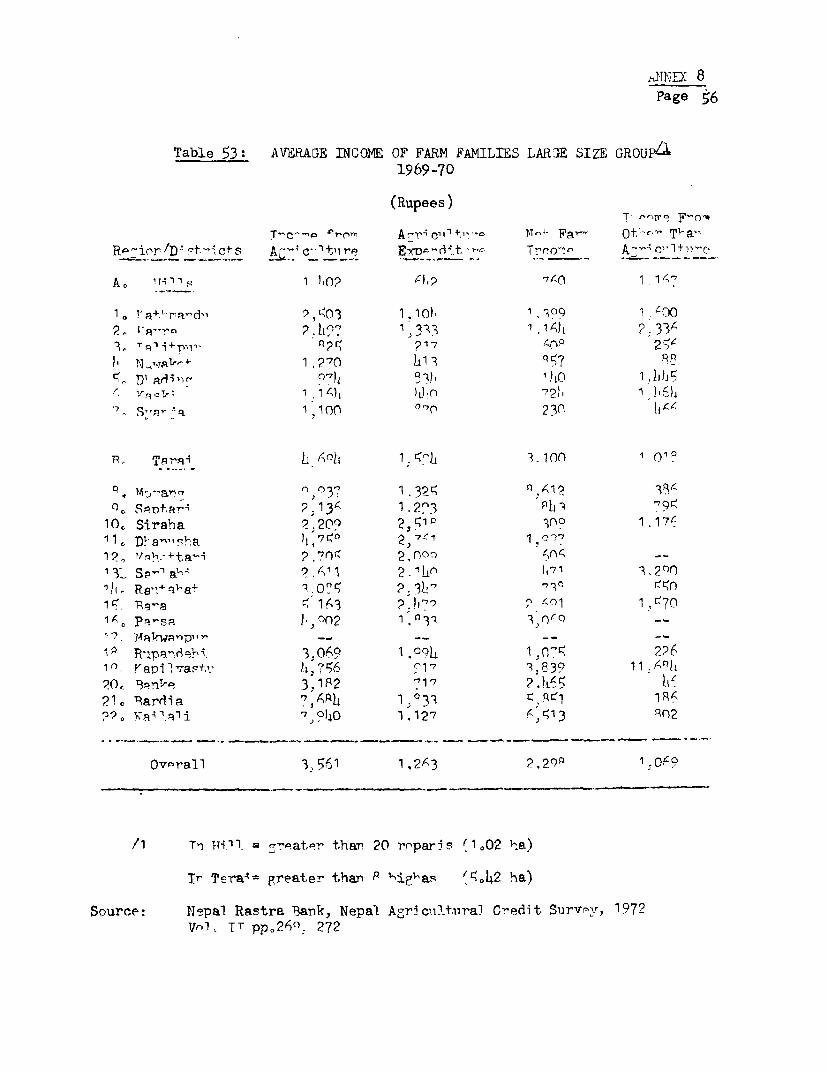
aRUlIND 8
Page 56
Table 53: AVERAGE INCOME OF FARM FAMILIES LARGE SIZE GROUPa1969-70
(Rupees)T
A~ O Tt; l S 1 10? 4I2 T 1 r1m Pa
1 0 T a+r. r'd' 9,( f3 1,.10) 13094 1 )0O
A, 'TIrI 1 91,n 57 4J
{~~~~~~~ ~~~~ Enc(o; 1 i4 lo), ont ,>
'o ,S'-a' -''i 1,;100 "'0 231 254P N a 1 ?70 (131lltn
* 0j,--a^^ ^,°37 1.32' Q,1? 33R0Q Ssr,1-i 2, 1 34 1 .23 2`9
1(0 Siraha 2.202? 21 300 1. 17'11 D-a--O1a 1 7C 2 7'* 1 e?'1?,, t a- 2 ?.70r, 2.000 -_
13L S-, aY' 2 1)171 13 200
1¢, Raa ' 163 2 '°1 1,f701(. P-sa )>002 1 3 3) 0C) __n " . lmakwn"p -- pi,
10 R-pa,-'; 3,069 1.°QL 1,n' 2261, 4api7va5+.t' h,7<6 V17 3,83° 11 4Qh?0) VsV 31P2 t71 7 2 ?4 l21. 1Rardl a 7 (,RP1;hRURN 9
Ka9 -I. R<'•i 7 ,)30 1.127 )513 Rn2
Ovwrall 3,561 1,2A3 2, 2QP 1,049
/1 Tn 14. 1, _/ratpr than 20 roparis (1 oO2 ha)
Ir Tera'= greater than P l4gias 'U 042 ha)
Source: Nepal Rastra Bank, Nepal Agricullt.ural Credit Survry, 1972TO . TT ppo2 60 272
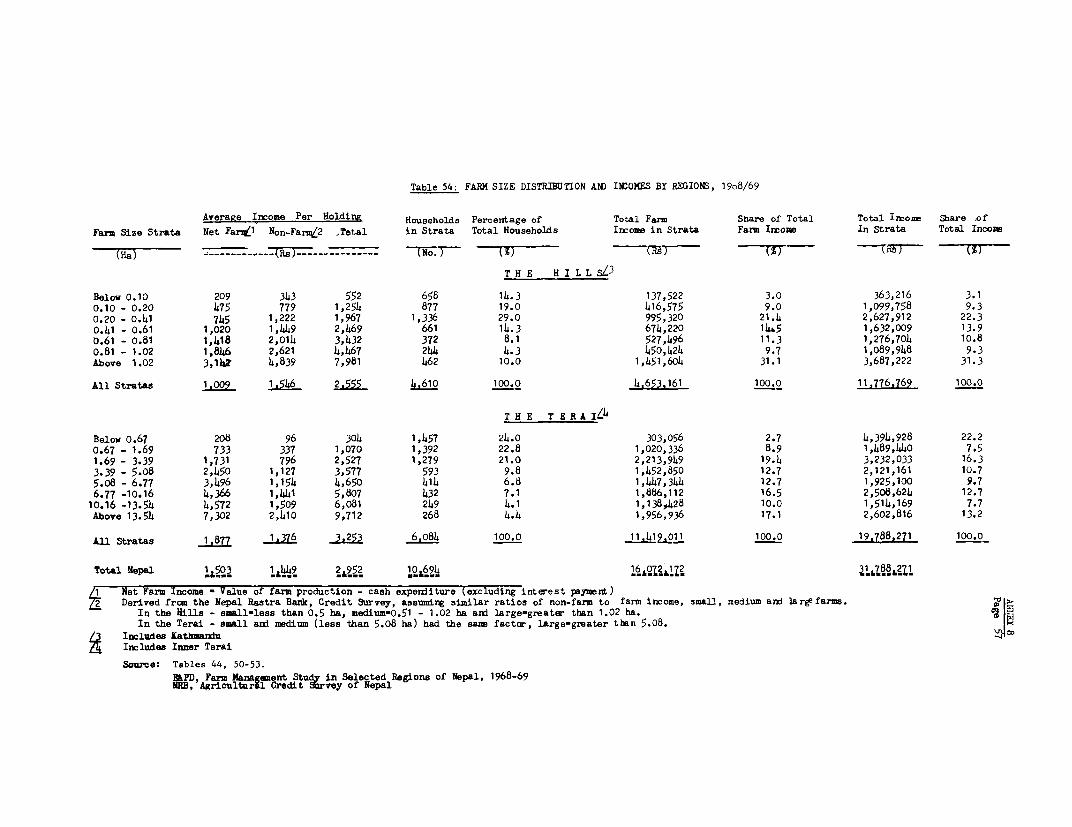
Table 54: FARM SIZE DISTRIBUTION AND INCOMS BY REGIONS, 19o8/69
Averaae Income Per Holding Households Percentage of Total Farm Share of Total Total Imuome Share .ofFarm Size Strata Net Farril Non-FarmZ2 ,Tetal in Strata Total Households Income in Strata Farm Income In Strata Total Incoze
(Ha) ,------------ 7---------------- -7No.T ) T-T S) ( ( -T-
T H E H I L L S13
Below 0.10 209 343 552 658 14.3 137,522 3.0 363,216 3.10.10 - 0.20 475 779 1,254 877 19.0 416,575 9.0 1,099,758 9.30.20 - o.41 745 1,222 1,967 1,336 29.0 995,320 21.4 2,627,912 22.30.41 - 0.61 1,020 1,449 2,469 661 14.3 674,220 1465 1,632,009 13.90.61 - 0.81 1,418 2,014 3,432 372 8.1 527,496 11.3 1,276,704 10.80.81 - 1.02 1,846 2,621 4,467 244 4.3 450,424 9.7 1,089,948 9.3Above 1.D2 3,11,Z 4,839 7,981 462 10.0 1,451,604 31.1 3,687,222 31.3
All Stratas 1009 1.546 2.555 4.610 120.2 4,653.161 100.0 11.776.769 100.0
THE TERAIL4
Below 0.67 208 96 304 1,457 24.0 303,056 2.7 4,394,928 22.20.67 - 1.69 733 337 1,070 1,392 22.8 1,020,336 8.9 1,489,440 7.51.69 - 3.39 1,731 796 2,527 1,279 21.0 2,213,949 19.4 3,232,033 16.33.39 - 5.o8 2,450 1,127 3,577 593 9.8 1,452,850 12.7 2,121,161 10.75.08 - 6.77 3,496 1,154 4,650 414 6.8 1,447,344 12.7 1,925,100 9.76.77 -10.16 4,366 1,441 5,807 432 7.1 1,886,112 16.5 2,508,624 12.7
10.16 -13.54 4,572 1,509 6,081 249 4.1 1,138428 10.0 1,514,169 7.7Above 13.54 7,302 2,410 9,712 268 4.4 1,956,936 17.1 2,602,816 13.2
All Stratas 1.877 1.376 3.253 6.084 100.0 11.419.0j1 100.0 19.788.271 100.0
Total Nepal 425O3 i^4.4 22952 1019,4, 161 0t2&1Z2
1 Net Farm Income - Value of farm production - cash expenditure (excluding interest payment)&2 Derived from the Nepal Rastra Bank, Credit Survey, assuming similar ratios of non-farm to farm income, small, medium and largefarms.
In the Hills - sall-less than 0.5 ha, medium-0.51 - 1.02 ha and large-greater than 1.02 ha.In the Terai - small and medium (less than 5.08 ha) had the sama factar, large-greater than 5.08.
L3 Includes Kathmandu COIncludes Inner Terai
Source: Tables 44, 50-53.&PM, Farm Managsment Study in Selected Regions of Nepal, 1968-69NRB, AgricultarU Credit 9rvey of Nepal
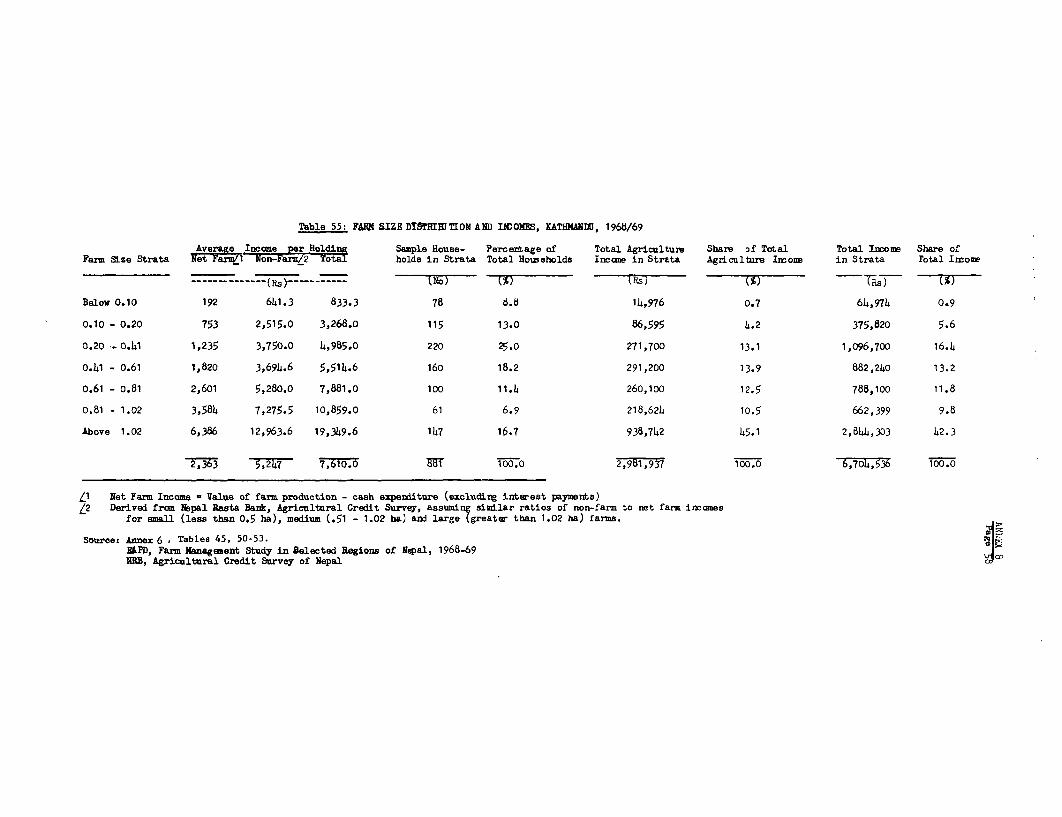
Table 55: FA1M SIZE D`19MIIT fON AND I1COMM, X&TIHHAND, 1968/69
Averag e n H ldir Sampple House- Percentage of Total Agriculture Share of Total Total Income Share ofFarm Size Strata Net 7Fia J on 2 otha holds in Strata Total Households Incie in Strata Agricultare Irrcoae in Strata Total Irmom
-- -R----- J) M -(%R%Below 0.10 192 641.3 833.3 78 l8. 14,976 0.7 64,974 0.9
0.10 - 0.20 753 2,515.0 3,268.o 115 13.0 86,595 4.2 375,820 5.6
0.20 - 0.41 1,235 3,750.0 is,985.0 220 25.0 271,700 13.1 1,096,700 16.4
0.41 - 0.61 1,820 3,694.6 5,514.6 160 18.2 291,200 13.9 882,24z0 13.2
0.61 - 0.81 2,601 5,280.0 7,881.0 100 11.4 260,100 12.5 788,100 11.8
0.81 - 1.02 3,584 7,275.5 10,859.0 61 6.9 218,624 10.5 662,399 9.8
Above 1.02 6,386 12,963.6 19,349.6 147 16.7 93 8 ,74t2 45.1 2,844,303 42.3
5,247 7,610.0 T7o 2,981,937 100.0 6,7oIt,536
ll Net Farm Income - Value of farm production - cash expenditure (excludirg interest payments)L2 Derived from Nepal Rasta Bank, Agricultural Credit Survey, assuming similar ratios of non-farm to net farm incomes
for -sl1 (less than 0.5 ha), medium (.51 - 1.02 ha) and large (greater than 1.02 ha) farms.
Souroe: Annex 6 . Tables 45, 50-53.WPD, Farm Managenent Study in Felected Regions of Nepal, 1968-69
NRB, Agricultural Credit Survey of Nepal
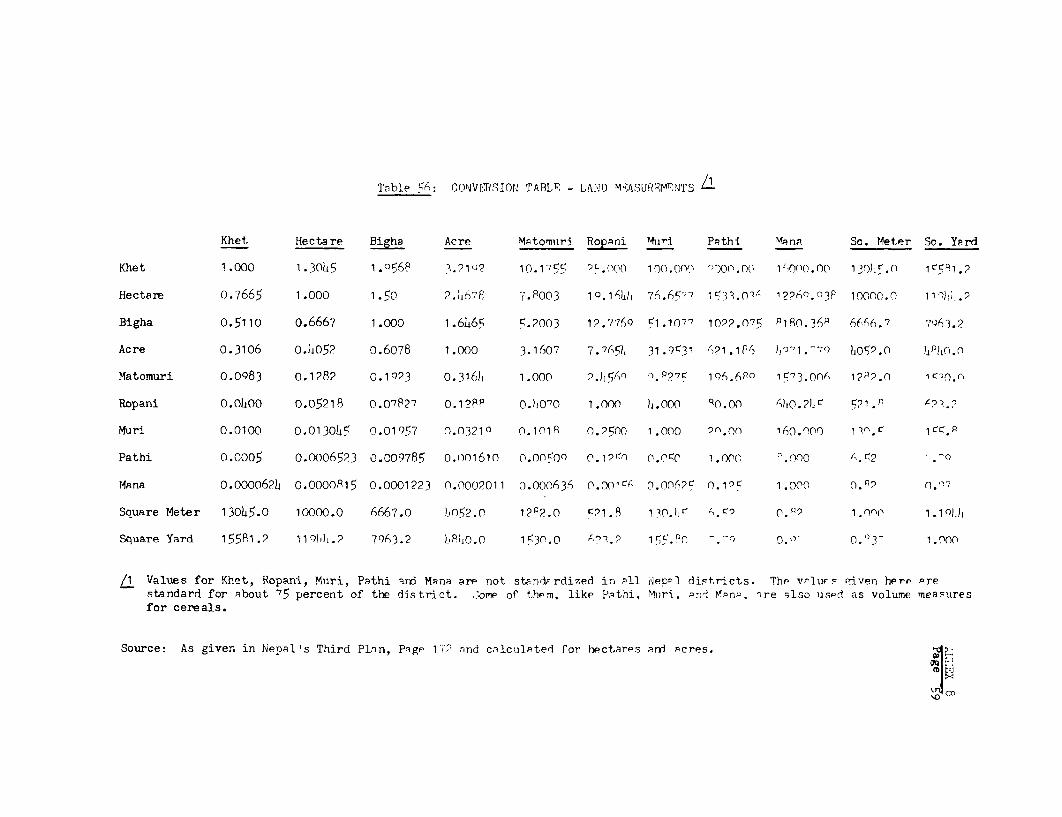
Table 56: CONVERSIOTN TABLE - LAN\1D M-ASUREF11ETS L
Khet Hectare Bigha Acre Matomuri Ropani Muri Psthi MPna So. Meter So. Yard
Khet 1.000 1.30LL5 1.o56e I.2102 10.17CC ' E-.000 100. onr t'r)00.C(' 1r0 0o.n0 1 3).0 1r..n 1 ?
Hectame o.7665 1.000 1.50 6467 P 7.P003 1 c.1 1th)l 7 r' . 1032o 122(0'. 03P 1000no.0 11'ThK2.
Bigha 0.5110 o.6667 1.000 1.6465 5.2003 12.7769 C1.1077 1099.075 P180.36fS 6666.7 7963.2
Acre 0.3106 0.A052 0.6078 1.000 3.1607 7.765$)i 31.9C31 ' ?1.1P', ),'71.-70 hO0,l1 0 !Ph0.0
Matomuri 0.0983 0.1282 0.1°23 0.316)i 1.000 ?21-h5 o,P97C 1Q6.6P 1 1573,OnO 1292.0 i¢00
Ropani o.OL,oo 0.05218 0.07827 0.19?8P 0.)10'0 1.000 h.000 q0.00 ,',0)IoJ. 5?t.° P
Muri 0.0100 0.013045 0.01957 o.03210 O.101B 0. 2 ,O( 1.000 9.00n 160.000 j 1C%P
Pathi 0.00 0.0006oo523 0.009785 0.10161in o0.0050Q 0. Il .o,oo 1.000 3.000 4'.2
Mana 0.000062h 0.000O015 0.0001223 0.0002011 0.000636 ' 0 l0 0 1 t(I 0.0062 0n1?F 1.000 0.P9 n.-,
Square Meter 13045.0 10000.0 6667.0 0'n52.0 12P2.0 521.R 130CJY ZK,'9 0.02 1.Ono 1.l0)1 h
Square Yard 155R1.2 1191,J1.2 7963.2 LP)4o0 1530.O '2 1 ;i5.9n 70 0. o' 0.° "3 1.Ooo
/1 Values for Khet, Ropani, Muri, Pathi anrd Mna are not stndF-rdized in all N*eppPl dist.ricts. The vfflurs -4ven here -restandard for about 75 percent of the district. :ormOe of them, like Pnthi, Nunri, Pnl Manp. -re nlso usPd as volume mneasuresfor cereals.
Source: As given in Nepql's Third Plan, Page 172 nnd calclqted for hectqrps arfl -cres.
Table 57s CONVERSION TABLE WEIGHT MEASUREMENTS USED IN NEPAI
Long -
fj Seer CileO) D Seer (Teraei Kaimd Po--d TO DL tlogram ouintal Metric Ton
1. Pau 1.00 0.25 0.08333 0.213762 0.00534405 0.439712 0.0001963 0.1994508 0.0019945 (-.0C019945
!. Seer (Hills) 4.63 10 C 0.33333 0.855049 0.0213762 1.7568S8 0.0007852 0.7978032 0.01'79i3 0.5007'J78
Dharni 12.CO 3.CC 1.00 2.245148 0.0641257 5.276544 0.0)'355S 2.39340i6 0 023934 0 OD239'J4
Seer (Terai) 4.6785 1.169625 0.389175 i. 0 0.025 2.07717 00091S375 0.9331 0.003331 0.OG.09231
. Ma.nd 187.11. 46.7es 15.-;5 40.00 1.00 82 2868 0.036735 37.3242 0.373242 0.C373242
. P.ond 2.3741992 0.5685496 0.163,1.66 0.4;e61 0.012153 1.00 0.03044643 0.4563 0.004535 0 00W,53i
L tong Ton 5094.2062 1273.551552 424.'171^4 IOS8.68 27.222 2240.00 1.00 101;.05 10.1605 i.0'605
. Kilogram 5.013769 1.253442 0..4178 4 1.07169 0.02:7Q2 2.20463 0.00098421 1.00 0.01 O.OC1
Quintal 501.3768 125.3442 41.7814 107.169 2.6792 220.463 0.098421 100.00 1.00 0.1
Metric Ton 513.768 1253.442 417.814 1071.69 26.792 2204.63 0.98421 1000.00 10.0 1.00
ourae: A,xn.xl Report, L.md Refrrr, Agric.Ature and Ford l;'n1st'y, 19i7-C3 (TranslAted)