evaluation of negative skin friction effects in pile foundations using 3d nonlinear analysis
TRANSCRIPT
www.elsevier.com/locate/compgeo
Computers and Geotechnics 32 (2005) 210–221
Evaluation of negative skin friction effects in pile foundationsusing 3D nonlinear analysis
Emilios M. Comodromos *, Spyridoula V. Bareka
Department of Civil Engineering, University of Thessaly, Pedion Areos, 383 34 Volos, Greece
Received 20 February 2004; received in revised form 5 January 2005; accepted 25 January 2005
Available online 29 March 2005
Abstract
The aim of this paper is to evaluate the influence of negative skin friction in pile foundations. Three dimensional nonlinear anal-
yses for a single pile and pile groups were carried out for a specific case and some case studies as well. Contrary to simplified con-
ventional analysis in which the predictions are usually overestimated and could be considered as an upper limit, it was found that the
dragload of a pile in a group depends on the surface load, the pile configuration, the pile position in a group, the ultimate skin fric-
tion and the interface stiffness. It has been demonstrated that for fixed-head friction pile groups the dragload group effect is signif-
icantly greater than in the case of free-head end-bearing pile groups. Moreover, predictions for internal piles have shown
considerably smaller dragloads for fixed-head piles, which is in accordance with experimental findings. It has also been demonstrated
that when the construction of an embankment precedes the application of the foundation working load, the effect of negative skin
friction is considerably smaller than in the reverse case.
� 2005 Elsevier Ltd. All rights reserved.
Keywords: Negative skin friction; 3D numerical analysis; Soil–structure interaction; Pile group response
1. Introduction
As a result of fill placement or even lowering of phre-
atic surface, the soil surrounding the piles of pile foun-
dations in soft ground settles more than the piles. In
that case, negative skin friction occurs, producing pile
settlement (downdrag) and additional compressive force
(dragload) due to the hanging effect around the pile. Theuse of closed-form equations resulting from conven-
tional analysis [1–4] for estimating dragload assumes
that the negative skin friction is fully mobilised above
the neutral plane (point at which the relative movement
between the pile and the surrounding soil is zero). The
application of this approach leads to exaggerated drag-
loads since large settlements may be needed to fully
mobilise the negative skin friction on a pile. On the
0266-352X/$ - see front matter � 2005 Elsevier Ltd. All rights reserved.
doi:10.1016/j.compgeo.2005.01.006
* Corresponding author. Tel.: +30 421 74143; fax: +30 421 74169.
E-mail address: [email protected] (E.M. Comodromos).
other hand, large settlements are not necessarily needed
to initiate slippage at the interface between soil and pile.
For an accurate evaluation of both downdrag and drag-
load the pile–soil interaction should be taken into ac-
count in the analysis. Therefore, the ultimate skin
friction, the interface stiffness, the soil strength and stiff-
ness as well as the pile group configuration must be ta-
ken into consideration. In the case of a pile group theeffect of soil–pile interaction is more complicated due
to the presence of adjacent piles which tends to reduce
the soil settlement within the group [5]. Thus, the inter-
nal piles of a fixed-head pile group undertake smaller
dragload, while in the case of a free-head pile group they
experience smaller downdrag. These tendencies have
been revealed by the experimental work of Shibata
et al. [6] who demonstrated that dragload on individualpiles in a group is smaller than that on an isolated pile
and that the internal piles are subjected to smaller loads
than the external piles.

E.M. Comodromos, S.V. Bareka / Computers and Geotechnics 32 (2005) 210–221 211
To analyse the effect of negative skin friction in end-
bearing pile groups Poulos and Davis [7] proposed a
simplified method based on the solution of a point load
in an elastic half-space. At a later stage Kuwabara and
Poulos [5] developed a simplified boundary element
method in which the soil is assumed to be an elastic con-tinuum and slip is allowed at the pile–soil interface. Sim-
ilar approach has been applied by Teh and Wong [8] to
estimate dragload in end-bearing pile groups. A simpli-
fied approach providing a methodology for estimating
the negative friction effect in both end-bearing and fric-
tion piles was also proposed by Poorooshasb et al. [9].
The above methods require idealisations of soil profile
but, in most cases, are able to estimate the effect of neg-ative skin friction at an acceptable level. However, for
important projects where strict criteria of serviceability
are imposed or when the super-structure is sensitive to
differential settlements, a more accurate approach is
necessitated. This approach should provide the ability
of taking into account the ultimate skin friction, the
interface stiffness, the soil strength and stiffness as well
as the particular geometry of the foundation. In such acase, a three dimensional (3D) nonlinear analysis is re-
quired for the prediction of dragload, downdrag and
stiffness reduction factor. According to Lee et al. [10],
although the behaviour of piles in a group is obviously
a 3D problem, until 2002 there was only one reported
3D finite element analysis of the behaviour of a pile
group in the literature [11] which neglected however,
the soil slip at the pile–soil interface and therefore re-ported very large group effects. Lee et al. [10] performed
a 3D finite element analysis for single pile and pile
groups in a simplified soil profile consisting of soft clay
overlying a dense sandy layer. They also carried out
numerical analyses on some case studies of pile groups
taking the effect of soil slip at the pile–soil interface into
account. When comparing the results with those of pre-
vious research works significantly smaller group effectswere found.
In this paper, a 3D numerical analysis is initially used
to estimate the effects of negative friction for a single pile
in a multilayered soil profile. The analysis is then ex-
tended to pile groups and the behaviour of piles consti-
tuting a group is contrasted to that of a single isolated
pile. The effect of the construction sequence (application
Table 1
Material properties used in the analysis by Lee et al. (2002)
Material Model E (kPa) c (kPa)
Concrete pile Isotropic elastic 2,000,000
Soft clay Mohr–Coulomb 5000 3
Bearing sand 50,000 0.1
Notes: Groundwater table is located on the top of the soft clay layer.
Hydrostatic water pressure distribution is assumed.
of the foundation working load prior to or after the con-
struction of the embankment) to the foundation stiffness
and the undertaken load is also investigated and
quantified.
2. Single pile analysis
2.1. Simplified case study
A simplified soil profile was used by Lee et al. [10] in
order to investigate the effect of negative skin friction to
the anticipated dragload and downdrag. The pile was ta-
ken to be 0.5 m in diameter and 20 m long. The upper
soil layer consists of soft clay down to the pile tip, while
the underlying bearing layer is composed of sandy soil.
The material properties used in that analysis are summa-
rised in Table 1. In order to investigate the distributionof shear stress and dragload in the case of a friction pile
in their analysis, Lee et al. [10] took the bearing layer
stiffness to be equal to that of the soft clay, while in
the case of an end-bearing pile, the bearing layer stiffness
was taken 1000 times the soft clay stiffness. In their anal-
ysis the pile was considered as linear elastic material
while for soil layers the Mohr–Coulomb nonassociated
flow rule was adopted. The Coulomb frictional lawwas also used for the interface modelling. The results,
provided using the 3D finite element code ABAQUS,
are shown in Fig. 1, together with the results of the pres-
ent analysis, which are presented below.
Three dimensional nonlinear long-term analysis was
carried out using the finite difference code FLAC3D
[12] to solve the same problem. Fig. 2 illustrates a
cross-section at y = 0.0 m of the finite difference meshutilised in the present analysis, consisting of 2648 finite
difference elements and 3116 nodes. Along the pile
1732 interface elements were used to simulate the pile–
soil interaction. The dimension of the grid is 26 m in
the x and y directions and 25 m deep. At the bottom
plane of the grid all movements are restrained. The lat-
eral sides of the mesh were taken far enough from the
piles to avoid any boundary effect. The planes atx = �13.0 m and x = +13.0 m are free to move in the
y and z directions but not in the x direction. Similarly,
the planes y = �13.0 m and y = +13.0 m are free to
m u (�) w (�) Ko c (kN/m3)
0.3 1.0 25
0.3 20 0.1 0.65 18
0.3 45 10 0.5 20

S = slider
T = tensile strength
D = dilation
k = shear stiffness
k = normal stiffnessP
k
D
T
S ks
n
n
s
target face
3D
0
5
10
15
20
0 100 200 300 400 500 600 700
Dragload (kN)
Dep
th (
m)
-30 -20 -10 0 10 20 30 40
Shear stress (kPa)(a) (b)
End-bearing pile, FLAC 3D
Friction pile, FLAC 3D
End-bearing, Lee et al.(2002), ABAQUS
Friction pile, Lee et al.(2002), ABAQUS
Fig. 1. (a) Dragload and (b) shear stress distributions for the simplified single case analysis.
X
Y
Z
20 m
5 m
26 mSand
Soft Clay
Fig. 2. Finite difference mesh of single pile in simplified soil profile
(FLAC3D).
212 E.M. Comodromos, S.V. Bareka / Computers and Geotechnics 32 (2005) 210–221
move in the x and z directions but not in the y direction.
In order to accelerate calculations the benefit of symme-
try on the vertical plane y = 0.0 m has been adopted and
thus the half grid defined by y P 0 was finally used. The
other half was removed using the �model null� statement
and the boundary conditions were modified accordingly.
Similar boundary conditions are applied for single pileand pile group analyses presented hereafter.
The constitutive model of the interface elements in
FLAC3D is defined by the following linear Coulomb
shear-strength criterion, which limits the shear force act-
ing at an interface node:
F smax ¼ caAþ tanuðF n � uAÞ; ð1Þ
where Fsmax is the limiting shear force at pile–soil inter-
face; ca, adhesion between pile and soil; u, angle of fric-tion between pile and soil; Fn, normal force at pile–soil
interface; u, pore pressure; A, contact area associated
with an interface node.
Fig. 3 illustrates the components of the constitutive
model acting at an interface node. The interface ele-ments are allowed to separate if tension develops across
the interface and exceeds the limit tension of the inter-
face. Once gapping is formed between the pile–soil inter-
face, the shear and normal forces are set to zero.
The shear force Fsi that describe the elastic interface
response at an interface node is determined at calcula-
tion time (t + Dt) using the following equation:
F ðtþDtÞsi ¼ F ðtÞ
si þ ksDuðtþ0:5DtÞsi A; ð2Þ
where Fsi is the shear force; ks, shear stiffness; A, contact
area associated with an interface node; Dusi, incremental
relative shear displacement vector.
When |Fsi| = Fsmax sliding is assumed to occur.
According to the guidelines of FLAC3D user manual
Fig. 3. Components of the interface constitutive model in FLAC .

E.M. Comodromos, S.V. Bareka / Computers and Geotechnics 32 (2005) 210–221 213
the appropriate minimum value of shear stiffness ksshould be ten times the equivalent stiffness of the stiffest
neighbouring zone when the limiting displacement
needed to fully mobilise the interface shear strength is
very small. Application of the above guidelines lead to
a value of 107 kPa/m for ks. Higher values could be alsoused with no effect to numerical results, but slowing
down the solution convergence. The strength parameters
of the interface elements were taken as ca = 0 and
u = 16.7�, equal to those used in the analysis with ABA-
QUS. Predicted shear stress and dragload versus depth
are plotted in Fig. 1, demonstrating similar values and
distribution along the pile for both analyses. It may be
noted however that according to Lee et al. [10], theapplication of no-slip linear elastic finite element analy-
sis or simplified linear elastic analysis [13,14] overesti-
mates the dragload. This is mainly due to the fact that
the FLAC3D analysis is able to take into account any
partial mobilisation of skin friction above and below
the neutral plane, contrary to simplified methods in
which the shear strength is assumed to be reached along
the entire length of the pile or the entire length above theneutral point.
Fig. 4. Soil profile and design parameters for the single pile analysis in
multilayered soil.
2.2. Single pile in multilayered soil
The soil profile used in this case corresponds to that
of the area of the new wharf at the harbour of Thessa-
loniki. At this location the subsoil is very compressible
and has very low shear strength. The upper layer, as-
signed as layer A, consists of soft clayey soil with thin
layers of sand, underlying highly plastic soft clay, layer
B. Under layer B, at the level of �18.0 m a layer of med-
ium stiff clay, layer C, of medium plasticity was located,extending down to �42.0 m. From that level to the end
of the borehole, very dense sandy gravel with clay was
detected. The main soil properties of each soil layer de-
rived by the geotechnical investigation are presented in
Fig. 4. Due to the poor soil properties the access road
to the wharf comprises a bridge based on a pile
foundation.
Given the magnitude and the importance of the pro-ject a pile load test was decided to be carried out includ-
ing both vertical and horizontal loading. The influence
of the interaction between the test pile and the reaction
piles has been evaluated using 3D nonlinear back-anal-
ysis and the single pile response has been assessed by
Comodromos et al. [15]. Furthermore, the effect of the
interaction between the piles in a free-head group was
quantified and the bearing capacity and stiffness effi-ciency factors were estimated for various pile configura-
tions. Similar analysis has been carried out by
Comodromos [16] in the case of fixed-head pile groups,
in which the influence of the number of piles, the spacing
and the deformation level to the group response is dis-
cussed. In addition, the contribution of the piles consti-
tuting the group to the total group resistance was
examined, its variability with the settlement level was
established and a relationship allowing a reasonable re-
sponse prediction of a fixed-head pile groups wasproposed.
Following the above referenced process the pile
group response to externally applied axial load can be
numerically assessed with the required level of accuracy.
For the outer abutment, however, where bridge ap-
proach embankments were foreseen, the crucial effect
of negative skin friction should also be taken into ac-
count. At this location downdrag and dragload may cre-ate serviceability problems and they should be taken
into account when evaluating the bearing capacity and
the stiffness of the pile foundation. To estimate this ef-
fect a 3D analysis was carried out initially for a single
isolated pile. The problem has been solved for various
surface loads corresponding to different heights of
embankment. Figs. 5 and 6 illustrate the distribution
of the interface shear stress and the dragload along thepile predicted by the FLAC3D nonlinear analysis. Even
0
10
20
30
40
50
-30 -20 -10 0 10 20 30 < positive friction Shear stress (kPa) negative friction >
Dep
th (
m)
S.L.= 5 kPa S.L.=10 kPa
S.L.=25 kPa S.L.=50 kPa
S.L.=75 kPa S.L.=100 kPa
S.L.=50 kPa, P.A.L.=4500 kN P.A.L.=4500 kN
P.A.L.=4500 kN, S.L.=50 kPa Shear strength
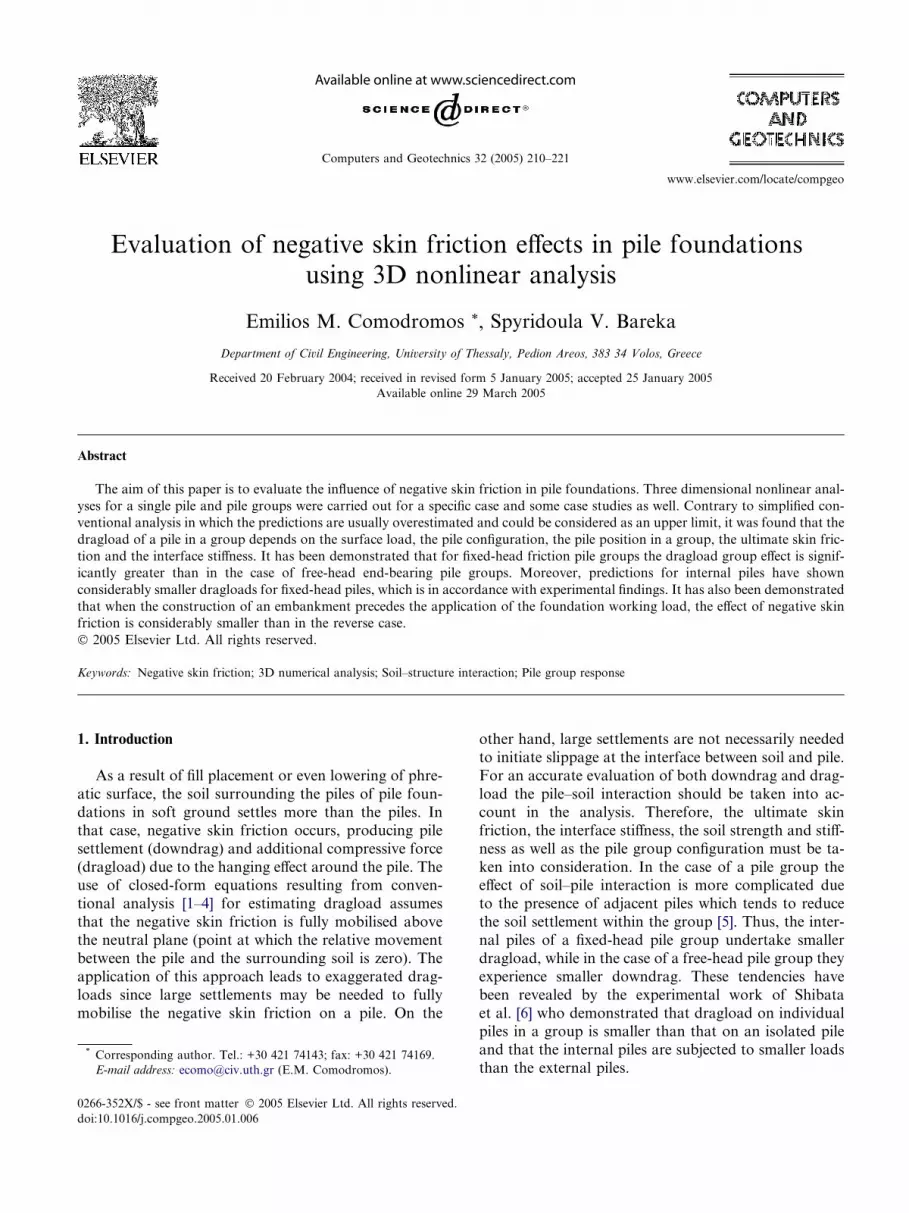
Fig. 5. Interface shear stress distribution along the single pile for various surface loads (SL) and pile axial load (PAL).
0
10
20
30
40
0 1 2 3 4
Dragload (MN)
Dep
th (
m)
S. L.=5 kPa
S. L.=10 kPa
S. L.=25 kPa
S. L.=50 kPa
S. L.=75 kPa
S. L.=100 kPa
Fig. 6. Dragload distribution along the single pile for various surface loads (SL).
214 E.M. Comodromos, S.V. Bareka / Computers and Geotechnics 32 (2005) 210–221
for the relatively small surcharge load of 10 kPa the
dragload attained the value of 1.56 MN. It takes its
maximum value of 3.7 MN when a surcharge load of
100 kPa is applied. In that case the appearance of the
distribution along the pile approaches the appearance
of an end-bearing pile. From Fig. 7(a) it can be seen that
the neutral plane is located approximately at the depth
of 30 m even for the relatively small surcharge load of5 kPa. This can be attributed to the fact that the pile
is founded on a very stiff material while the surrounding
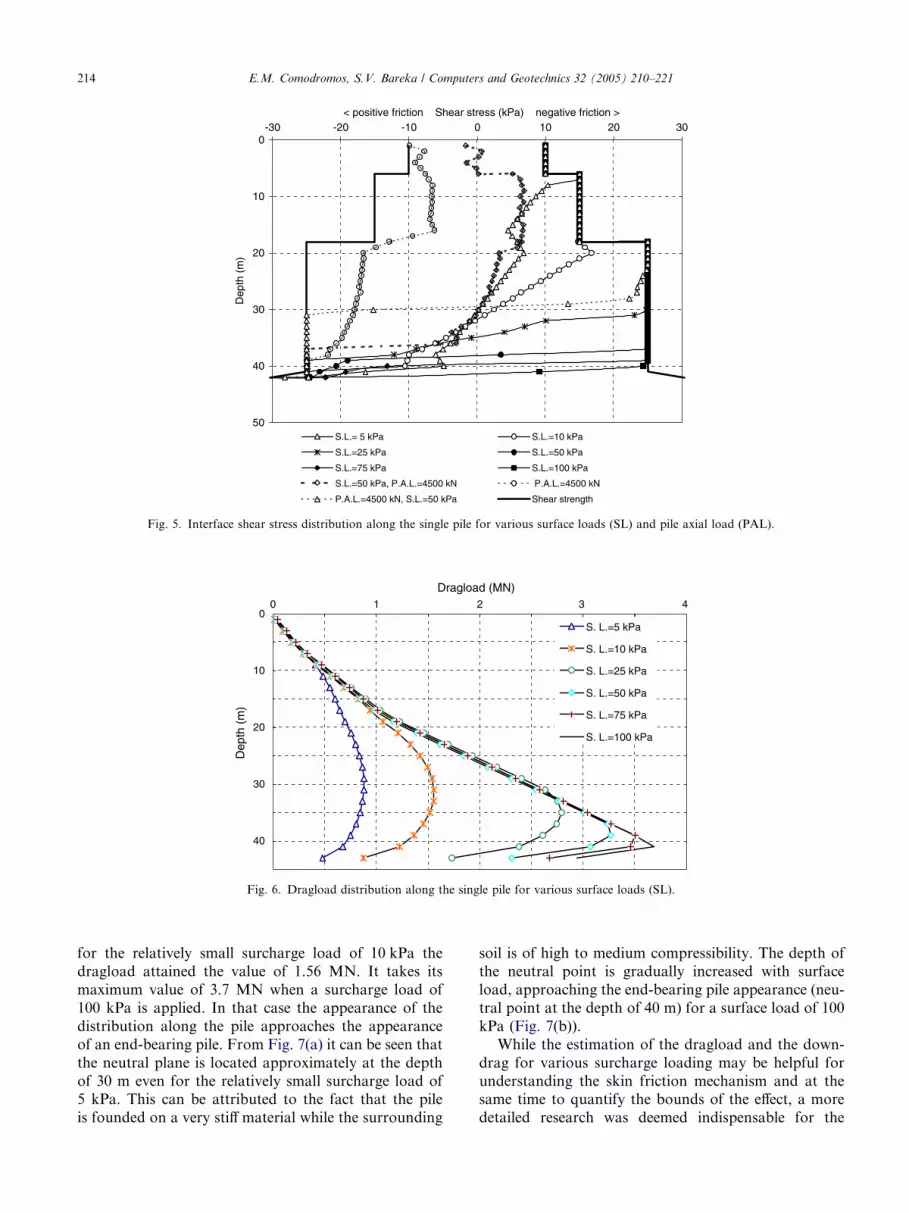
soil is of high to medium compressibility. The depth of
the neutral point is gradually increased with surface
load, approaching the end-bearing pile appearance (neu-
tral point at the depth of 40 m) for a surface load of 100
kPa (Fig. 7(b)).
While the estimation of the dragload and the down-
drag for various surcharge loading may be helpful for
understanding the skin friction mechanism and at thesame time to quantify the bounds of the effect, a more
detailed research was deemed indispensable for the
Surface Load= 100kPa
0 50 100 150 200 250 300
Settlement (mm)
neutral point
Surface Load= 5 kPa
-45
-40
-35
-30
-25
-20
-15
-10
-5
00 2 4 6 8 10
Settlement (mm)
Dep
th (
m)
pile settlement
soil settlement
neutral point
(a) (b)
Fig. 7. Pile and surrounding soil settlements for a surface load of: (a) 5 and (b)100 kPa.
E.M. Comodromos, S.V. Bareka / Computers and Geotechnics 32 (2005) 210–221 215
combination of the working load (pile axial load,
PAL = 4.5 MN) and the specific surcharge load of 50
kPa, corresponding to the surcharge load of the bridge
approach embankment. Often for practical reasons, it
is not possible to construct the embankment prior to
the installation of the piles. In that case, the construc-tion of the bridge and the approach embankment fol-
low that of the piles. The sequence of these two
construction stages is important for the development
of negative skin friction. It is widely accepted that
the effect of negative skin friction decreases when
embankment construction precedes the construction
of the bridge, i.e. the working load is applied when
the subsoil has already undergone settlement due tothe construction of the bridge approach embankment.
0
10
20
30
40
0 1 2 3 4 5 6 7 8
Pile axial force (MN)
Dep
th (
m)
P.A.L.= 4.5 MN
Superposition of S.L. =50kPa and P.A.L= 4.5 MNS.L=50 kPa + P.A.L.= 4.5 MN
P.A.L.= 4.5 MN + S.L.=50kPa
Fig. 8. Dragload distribution along the single pile for combinations of
pile working load and surface load.
Fig. 8 illustrates the dragload distribution along the
pile for the following characteristic case loading; (a)
application of the working load (PAL = 4.5 MN) with-
out any surcharge load, (b) application of the working
load and then application of the surcharge load, (c)
application of the surcharge load and then applicationof the working load, (d) superposition of the results of
load case (a) with those of the surcharge load (50 kPa).
In case (c) the construction of the embankment pre-
cedes that of the bridge, while case (d) corresponds
to the reverse case. In cases (b) and (c) the simulation
is carried out in two sequential stages within the same
numerical process. On the contrary, case (d), presented
for comparative reasons, arises from the superpositionof the two aforementioned solutions. As anticipated,
the combination of the working load with the surface
load leads to an increase of the axial force of the pile.
More specifically load case (b) provides a considerably
greater axial force than case (c); 6.7 MN for the former
and 4.94 MN for the latter. In case (b) the additional
axial force is 2.2 MN (almost 50% of the working
load), while in case (c) is limited to 0.44 MN (10% ofthe working load).
The pile settlement due to the application of the
working load without any surcharge load is 6.5 mm,
while in case (c) is 28.6 mm and in case (d) is 37.8
mm. Consequently, for the same working load the se-
cant pile stiffness becomes 0.69, 0.12 and 0.16 GN/m
for cases (a), (b) and (c), respectively. The stiffness
reduction factor resulting from the effect of the negativefriction is 82% and 76% for case (b) and (c), respectively.
Given the influence of the secant stiffness on the design
of the superstructure it can be seen that the appropriate
value must be adopted according to the construction
sequence.

Fig. 10. Dragload distribution along the single pile and the charac-
teristic piles of Combarieu�s case study.
216 E.M. Comodromos, S.V. Bareka / Computers and Geotechnics 32 (2005) 210–221
3. Pile group analysis
3.1. Combarieu�s case study
Prior to a 3D analysis of the specific bridge founda-
tion a well known case study was considered, in orderto compare the response of predicted dragloads and
group effects. The example analysed by Combarieu [3]
was chosen mainly for its simplicity and the fact that
it was the subject of many previous research works.
The pile group configuration is shown together with
the soil profile properties in Fig. 9.
In their analysis for the above case study, Lee et al.
[10], took the Young�s modulus E of the clay equal to10 MPa, the interface friction coefficient l = 0.4 (inter-
face angle of friction d = 21.8�), while the Poisson�s ra-tio, m, was taken to be 0.35. For comparative reasons
the same values for the above case study are adopted
in the present analysis with FLAC3D. Three dimen-
sional analysis has been carried out for the group and
the single pile as well, in conjunction with a surface
load (SL) of 200 kPa. Fig. 10 shows the predicted drag-loads for the single pile and the three characteristic
piles (interior, corner and perimeter) in the group. It
can be seen that the interior and the perimeter pile car-
ry almost the same dragload while the curve of the cor-
ner pile approaches that of the single pile. This is
mainly due to the very large surface loading. It can
be attributed to a similar conclusion regarding the
group effect for pile groups under vertical loading byComodromos et al. [15], stating that the maximum
group effect is observed for small loads when no plastic
yielding occurs. Reduction of dragload group effect
starts when the yielding of the soil surrounding the piles
begins to take place. Using 3D analysis and taking the
effect of soil slip into account, Lee et al. [10] predicted a
Fig. 9. Soil profile and pile group configuration by Combarieu [3].
dragload of 1.558 MN, which, as they mentioned, is
considerably smaller than the value of 2.640 MN, pre-
dicted from conventional approaches or 3D analysiswith no slip model. The prediction of the present study
for the single pile dragload is 1.588 MN, i.e. very close
to that of Lee et al. [10]. However, an important differ-
ence can be observed when comparing the response of
the characteristic piles of the group. As shown in Table
2 the dragload group effect, defined as the reduction in
maximum dragload compared with an isolated pile car-
rying the same load, is 9%, 20% and 24% for the cor-ner, the perimeter and the interior pile while the
corresponding values predicted by Lee et al. [10] is
5%, 6% and 7%, respectively. When applying a consid-
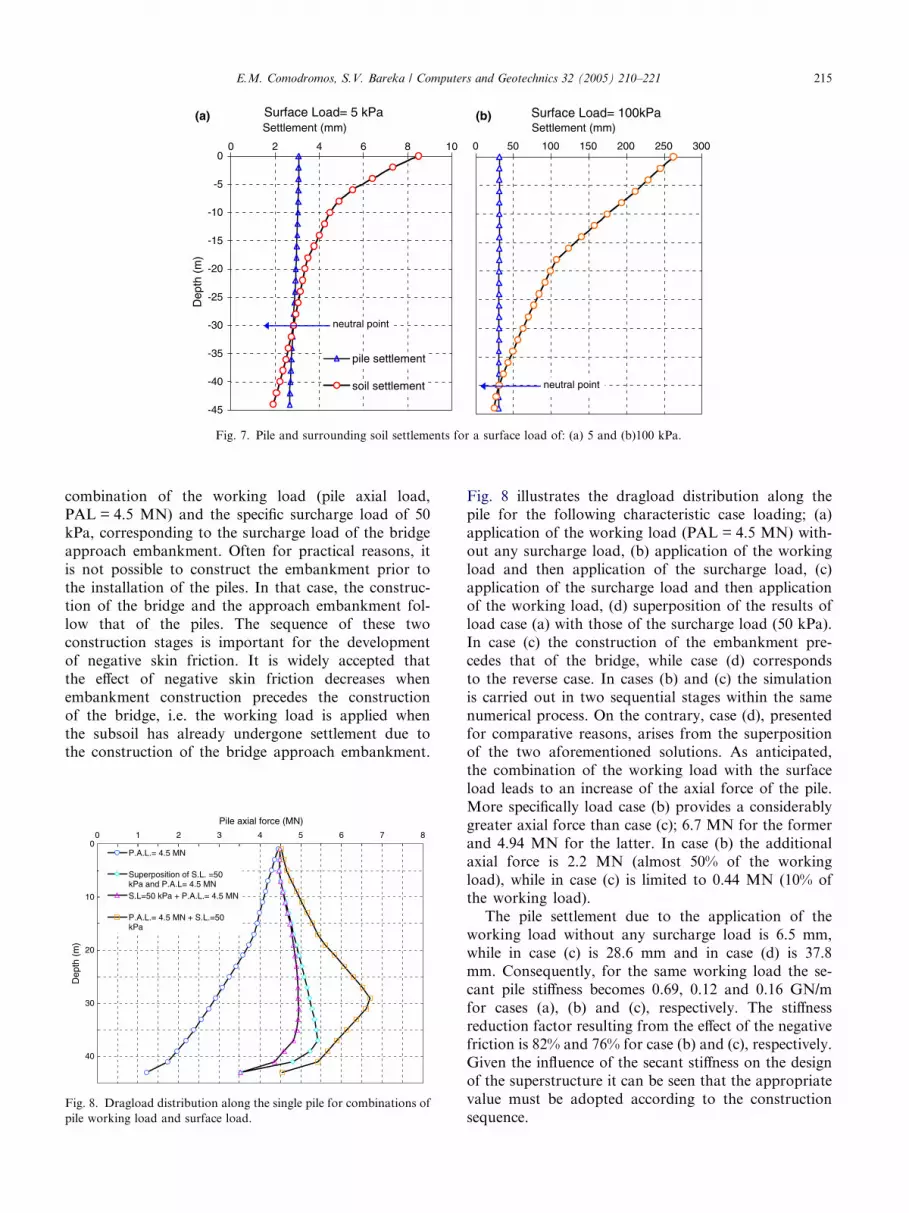
erably smaller surface load (20 kPa) the dragload pre-
diction for the isolated pile is 0.760 MN. Fig. 11(a)
illustrates the dragload distribution curve for the differ-
ent piles in the group. The dragload group effect for the
same piles is now 43%, 58% and 73%, considerablygreater than in the case of 200 kPa surface load. When
applying a surface load of 50 kPa the dragload for the
isolated pile increases to 1.078 MN. Fig. 11(b) illus-
trates the dragload distribution curve for the character-
istic piles in the group. The dragload group effect for
these piles is now 26%, 38% and 56%. It can be seen
that as the value of surface load increases the dragload
group effect decreases.Based on the fact of similar single pile dragload pre-
diction of the present study and that of Lee et al. [10]
and despite the fact of slightly different dragload group
effect, the same conclusion can be drawn for free head
end-bearing piles:
(a) Conventional design methods usually overestimate
dragload providing values which may be consid-ered as the upper-bound estimate.
Table 2
Predicted dragload and group effect for piles in a free-head pile group
Case Group dragload (MN) Dragload (MN) and group effect (%) Single pile (MN)
Corner Perimeter Interior
Combarieu (1985) (surface load 200 kPa) 10.448 1.265 0.758 0.420 2.640
52% 71% 84%
Lee et al. (2002) (surface load 200 kPa) 17.618 1.486 1.465 1.442 1.558
5% 6% 7%
Present study (surface load 200 kPa) 15.784 1.446 1.264 1.205 1.588
9% 20% 24%
Present study (surface load 20 kPa) 4.060 0.436 0.319 0.201 0.760
43% 58% 73%
Present study (surface load 50 kPa) 8.018 0.799 0.665 0.497 1.078
26% 38% 56%
Fig. 11. Dragload distribution along the single pile and the characteristic piles of Combarieu�s case study for a surface load of 20 and 50 kPa.
E.M. Comodromos, S.V. Bareka / Computers and Geotechnics 32 (2005) 210–221 217
(b) For elastic-perfectly plastic soil the group effect
depends on the level of surface loading and the
yielding of the soil surrounding the piles. Conven-
tional design methods are usually unable to takethese factors into account and therefore they over-
estimate the group effect.
(c) Three dimensional nonlinear analysis, when taking
the pile–soil interaction into account, provides rel-
atively small group effect for considerable surface
loads, which is consistent with experimental
research work [6].
3.2. Response of fixed-head friction pile group
In order to investigate the effect of negative friction to
the foundation of the outer abutment of the bridge,
where an approach embankment is to be constructed,
a 3D numerical analysis was carried out. The piles of
the groups examined were identical to those of the single
pile, having a diameter D = 1.50 m and a length of 45 m.
The soil profile is presented in Section 2.2. Two cases of
a 3 * 3 configuration were considered; in the first case
the pile spacing was taken as 3.0D, while in the secondthe spacing was increased to 6.0D. In both cases, the
piles were considered as fixed in the pile head. The finite
difference mesh was extended far enough from the piles
in order to avoid any boundary effects. The bottom ele-
vation of the mesh was taken at z = �80.0 m, consider-
ably deeper than the level of the tip of the piles
(z = �45.0 m). At that plane all movements are re-
strained. The lateral sides of the mesh were also taken23.5 m from the central pile. The planes x = �23.5 m
and x = +23.5 m are free to move in the y and z direc-
tions but not in the x direction. Similarly, the planes
y = �23.5 m and y = +23.5 m are free to move in the
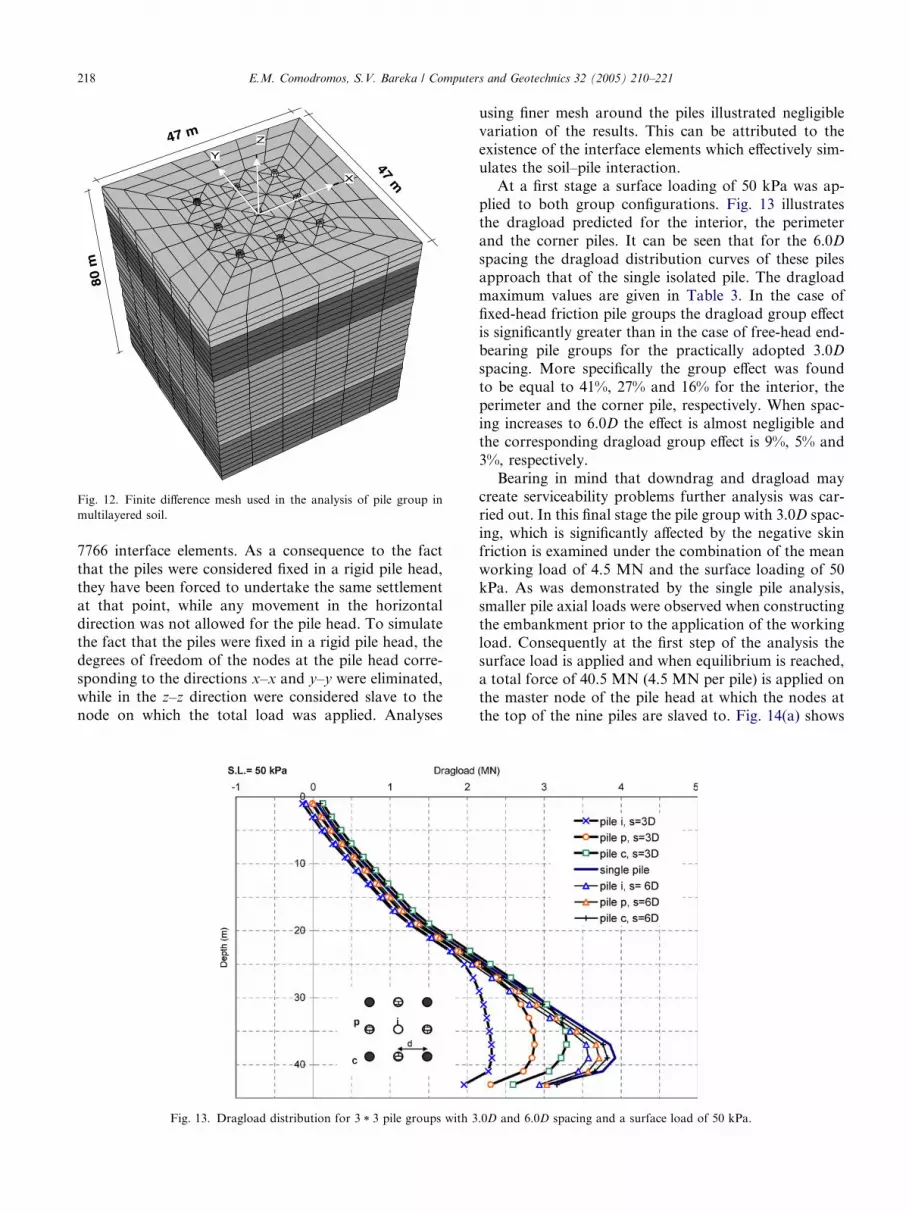
x and z directions but not in the y direction. Fig. 12 illus-
trates the finite difference mesh utilised in the analysis,
consisting of 8712 brick elements, 9961 nodes and
X
Y
Z47 m
47 m
80 m
Fig. 12. Finite difference mesh used in the analysis of pile group in
multilayered soil.
218 E.M. Comodromos, S.V. Bareka / Computers and Geotechnics 32 (2005) 210–221
7766 interface elements. As a consequence to the fact
that the piles were considered fixed in a rigid pile head,
they have been forced to undertake the same settlement
at that point, while any movement in the horizontal
direction was not allowed for the pile head. To simulatethe fact that the piles were fixed in a rigid pile head, the
degrees of freedom of the nodes at the pile head corre-
sponding to the directions x–x and y–y were eliminated,
while in the z–z direction were considered slave to the
node on which the total load was applied. Analyses
Fig. 13. Dragload distribution for 3 * 3 pile groups with 3
using finer mesh around the piles illustrated negligible
variation of the results. This can be attributed to the
existence of the interface elements which effectively sim-
ulates the soil–pile interaction.
At a first stage a surface loading of 50 kPa was ap-
plied to both group configurations. Fig. 13 illustratesthe dragload predicted for the interior, the perimeter
and the corner piles. It can be seen that for the 6.0D
spacing the dragload distribution curves of these piles
approach that of the single isolated pile. The dragload
maximum values are given in Table 3. In the case of
fixed-head friction pile groups the dragload group effect
is significantly greater than in the case of free-head end-
bearing pile groups for the practically adopted 3.0Dspacing. More specifically the group effect was found
to be equal to 41%, 27% and 16% for the interior, the
perimeter and the corner pile, respectively. When spac-
ing increases to 6.0D the effect is almost negligible and
the corresponding dragload group effect is 9%, 5% and
3%, respectively.
Bearing in mind that downdrag and dragload may
create serviceability problems further analysis was car-ried out. In this final stage the pile group with 3.0D spac-
ing, which is significantly affected by the negative skin
friction is examined under the combination of the mean
working load of 4.5 MN and the surface loading of 50
kPa. As was demonstrated by the single pile analysis,
smaller pile axial loads were observed when constructing
the embankment prior to the application of the working
load. Consequently at the first step of the analysis thesurface load is applied and when equilibrium is reached,
a total force of 40.5 MN (4.5 MN per pile) is applied on
the master node of the pile head at which the nodes at
the top of the nine piles are slaved to. Fig. 14(a) shows
.0D and 6.0D spacing and a surface load of 50 kPa.
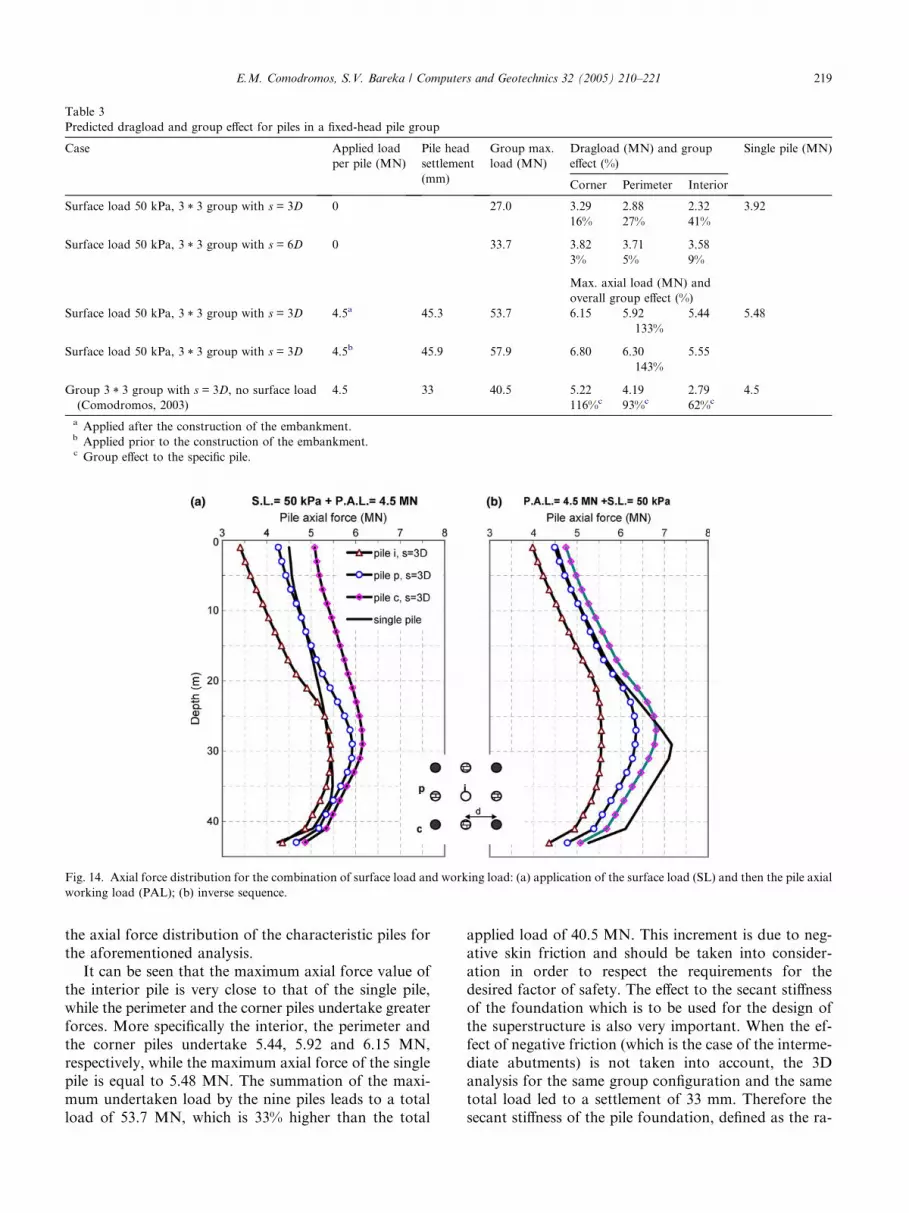
Table 3
Predicted dragload and group effect for piles in a fixed-head pile group
Case Applied load
per pile (MN)
Pile head
settlement
(mm)
Group max.
load (MN)
Dragload (MN) and group
effect (%)
Single pile (MN)
Corner Perimeter Interior
Surface load 50 kPa, 3 * 3 group with s = 3D 0 27.0 3.29 2.88 2.32 3.92
16% 27% 41%
Surface load 50 kPa, 3 * 3 group with s = 6D 0 33.7 3.82 3.71 3.58
3% 5% 9%
Max. axial load (MN) and
overall group effect (%)
Surface load 50 kPa, 3 * 3 group with s = 3D 4.5a 45.3 53.7 6.15 5.92 5.44 5.48
133%
Surface load 50 kPa, 3 * 3 group with s = 3D 4.5b 45.9 57.9 6.80 6.30 5.55
143%
Group 3 * 3 group with s = 3D, no surface load
(Comodromos, 2003)
4.5 33 40.5 5.22 4.19 2.79 4.5
116%c 93%c 62%c
a Applied after the construction of the embankment.b Applied prior to the construction of the embankment.c Group effect to the specific pile.
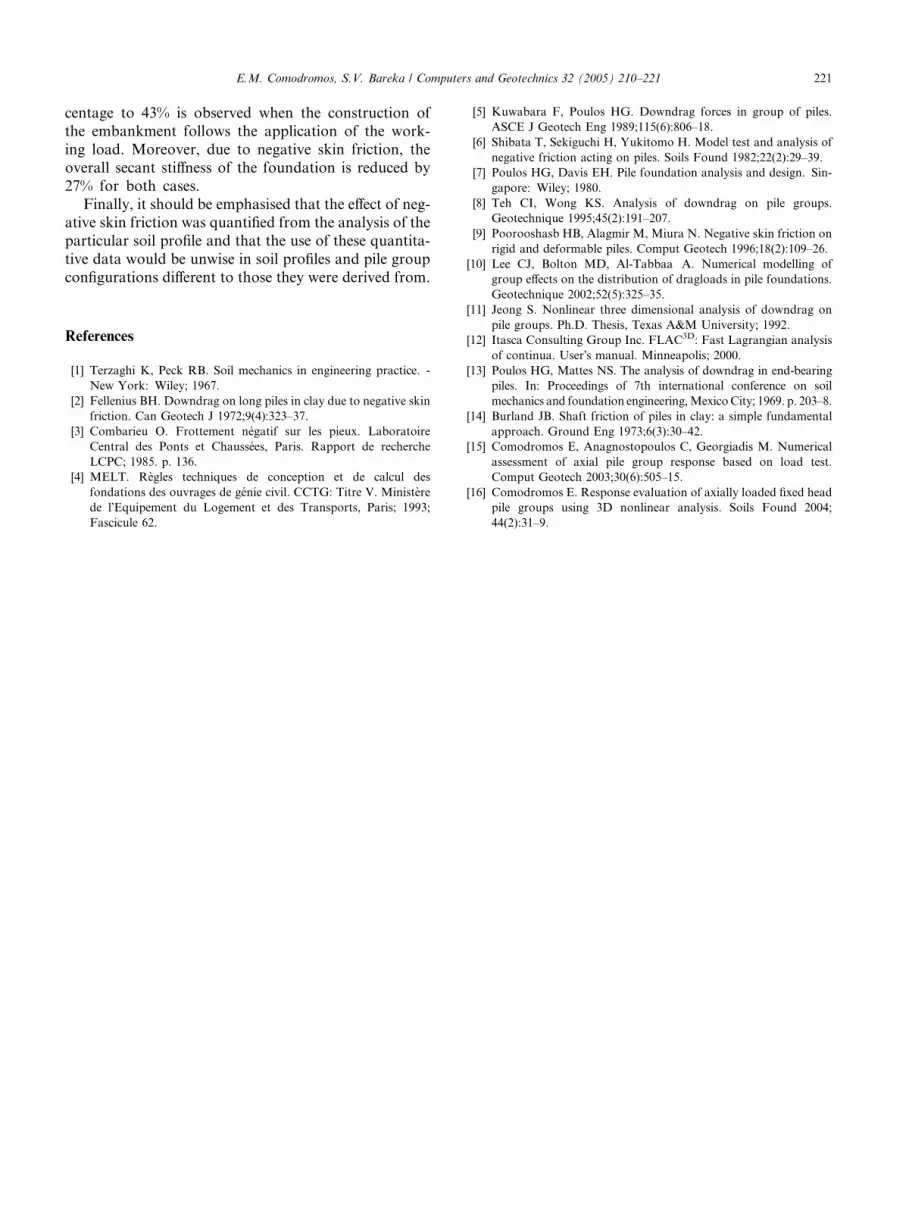
Fig. 14. Axial force distribution for the combination of surface load and working load: (a) application of the surface load (SL) and then the pile axial
working load (PAL); (b) inverse sequence.
E.M. Comodromos, S.V. Bareka / Computers and Geotechnics 32 (2005) 210–221 219
the axial force distribution of the characteristic piles for
the aforementioned analysis.
It can be seen that the maximum axial force value of
the interior pile is very close to that of the single pile,
while the perimeter and the corner piles undertake greater
forces. More specifically the interior, the perimeter and
the corner piles undertake 5.44, 5.92 and 6.15 MN,
respectively, while the maximum axial force of the singlepile is equal to 5.48 MN. The summation of the maxi-
mum undertaken load by the nine piles leads to a total
load of 53.7 MN, which is 33% higher than the total
applied load of 40.5 MN. This increment is due to neg-
ative skin friction and should be taken into consider-
ation in order to respect the requirements for the
desired factor of safety. The effect to the secant stiffness
of the foundation which is to be used for the design of
the superstructure is also very important. When the ef-
fect of negative friction (which is the case of the interme-
diate abutments) is not taken into account, the 3Danalysis for the same group configuration and the same
total load led to a settlement of 33 mm. Therefore the
secant stiffness of the pile foundation, defined as the ra-

220 E.M. Comodromos, S.V. Bareka / Computers and Geotechnics 32 (2005) 210–221
tio of the applied load divided by the corresponding set-
tlement, is equal to 1.23 GN/m. When negative friction
takes place due to the presence of the embankment sur-
face load of 50 kPa, the estimated pile head settlement is
45 mm and the corresponding overall secant stiffness of
the foundation is 0.9 GN/m. Therefore the stiffness to beused for the foundation of the outer abutments is 27%
smaller than that of the intermediate abutments for
the same value of working load. It may be noted that
the effect of negative friction to the stiffness of the pile
group is considerably smaller (reduction factor 27%)
than in the case of the single pile where the reduction
factor attains the value of 76%.
The situation is aggravated for both the pile groupand the single pile when the working load is applied
prior to the construction of the embankment. In that
case the interior, the perimeter and the corner piles
undertake 5.55, 6.30 and 6.80 MN, respectively, as
shown in Fig. 14(b). The undertaken total load increases
to 57.95 MN, which is 43% higher than the total applied
load of 40.5 MN. However, the settlement of the pile
group remains unchanged (45.3 and 45.9 mm; see Table3). This can be attributed to the fact that the difference
between axial loads at the pile tips is less than 5% no
matter the sequence of loading. More specifically for
internal piles the base load is 4.35 MN (embankment
prior to load) and 4.36 (load prior to embankment).
For perimeter piles the corresponding values are 4.67
and 4.78, while for corner piles the values are 4.86 and
5.07, respectively.It must be also mentioned that in the case of piles
with no negative friction effects the maximum axial
load is acting at the pile head and a gradual decrease
is observed with depth. On the contrary, the pile axial
load increases with depth until the neutral point is
encountered, when negative skin friction occurs. More-
over, it can be also observed that when the working
load is applied after the construction of the embank-ment (Fig. 14(b)) the maximum difference in the axial
load between the piles of the group is encountered at
the point of the neutral point. In the reverse sequence
of loading (Fig. 14(a)) the maximum difference in the
axial load between the piles of the group is observed
at the pile head.
Based on the results and the comparisons from the
analysis for a fixed-head friction pile group the follow-ing conclusions can be drawn:
(a) For spacings greater than 6.0D, the dragload
group effect is negligible (3–9% at 6.0D) and the
dragload value can be considered as equal to the
single isolated pile case.
(b) For spacings of 3.0D, the dragload group effect is
significantly greater than in the case of free head
piles, varying from 41% (interior pile) to 16% (cor-ner pile).
(c) As a result of the negative friction the total under-
taken load was increased by 33%, while an overall
secant stiffness reduction factor of 27% is pre-
dicted. This is valid in the case where the construc-
tion of the embankment precedes the application
of the working load. When the reverse sequenceis followed the effect increases and the axial load
increases by a factor of 43%.
4. Conclusions
In this paper, the effects of negative skin friction in
pile foundations were examined. The case of a single iso-
lated pile in a simplified soil profile was initially exam-
ined and compared with previous research. Good
agreement was observed between the results of the cur-
rent study and those of a similar three dimensional anal-ysis. Further analysis of the effect of the combination of
negative skin friction with the application of the work-
ing load demonstrated that when the construction of
the embankment precedes the application of the work-
ing load, the effect of negative skin friction is consider-
ably smaller than in the reverse case.
Three dimensional nonlinear analysis of pile groups
verified the conclusion drawn from the single pile anal-ysis for overestimation of dragloads when using simpli-
fied elastic approaches. It was also found that the
dragload group effect is significantly higher for fixed
head than free head piles for the practically adopted
spacing of 3.0D. The maximum group effect was ob-
served to be 41% on central pile, whereas the minimum
group effect obtains on the corner piles was 16%. When
spacing increased to 6.0D the effect was almost negligi-ble, varying from 3% to 9%.
The evaluation of the results of the analysis examin-
ing the effect of the construction sequence to the overall
response of pile foundations demonstrated that the neg-
ative friction effect increases when the construction of
the embankment follows the application of the working
load. From the single pile analysis, the additional axial
force due to the negative friction effect was almost50% of the working load. On the contrary, when the
construction of the embankment precedes the applica-
tion of the working load, the additional load is limited
to 10% of the working load. The effect of negative skin
friction to the secant stiffness of the single pile is consid-
erably greater. A stiffness reduction factor of the order
of 80% is observed for the above case.
Similar conclusions can be drawn for the specificfixed-head pile group. More specifically when the con-
struction of the embankment precedes the application
of the working load the effect of the negative skin
friction is minimised. The total undertaken load is
increased by 33%. Further enlargement of this per-
E.M. Comodromos, S.V. Bareka / Computers and Geotechnics 32 (2005) 210–221 221
centage to 43% is observed when the construction of
the embankment follows the application of the work-
ing load. Moreover, due to negative skin friction, the
overall secant stiffness of the foundation is reduced by
27% for both cases.
Finally, it should be emphasised that the effect of neg-ative skin friction was quantified from the analysis of the
particular soil profile and that the use of these quantita-
tive data would be unwise in soil profiles and pile group
configurations different to those they were derived from.
References
[1] Terzaghi K, Peck RB. Soil mechanics in engineering practice. -
New York: Wiley; 1967.
[2] Fellenius BH. Downdrag on long piles in clay due to negative skin
friction. Can Geotech J 1972;9(4):323–37.
[3] Combarieu O. Frottement negatif sur les pieux. Laboratoire
Central des Ponts et Chaussees, Paris. Rapport de recherche
LCPC; 1985. p. 136.
[4] MELT. Regles techniques de conception et de calcul des
fondations des ouvrages de genie civil. CCTG: Titre V. Ministere
de l�Equipement du Logement et des Transports, Paris; 1993;
Fascicule 62.
[5] Kuwabara F, Poulos HG. Downdrag forces in group of piles.
ASCE J Geotech Eng 1989;115(6):806–18.
[6] Shibata T, Sekiguchi H, Yukitomo H. Model test and analysis of
negative friction acting on piles. Soils Found 1982;22(2):29–39.
[7] Poulos HG, Davis EH. Pile foundation analysis and design. Sin-
gapore: Wiley; 1980.
[8] Teh CI, Wong KS. Analysis of downdrag on pile groups.
Geotechnique 1995;45(2):191–207.
[9] Poorooshasb HB, Alagmir M, Miura N. Negative skin friction on
rigid and deformable piles. Comput Geotech 1996;18(2):109–26.
[10] Lee CJ, Bolton MD, Al-Tabbaa A. Numerical modelling of
group effects on the distribution of dragloads in pile foundations.
Geotechnique 2002;52(5):325–35.
[11] Jeong S. Nonlinear three dimensional analysis of downdrag on
pile groups. Ph.D. Thesis, Texas A&M University; 1992.
[12] Itasca Consulting Group Inc. FLAC3D: Fast Lagrangian analysis
of continua. User�s manual. Minneapolis; 2000.
[13] Poulos HG, Mattes NS. The analysis of downdrag in end-bearing
piles. In: Proceedings of 7th international conference on soil
mechanics and foundation engineering,MexicoCity; 1969. p. 203–8.
[14] Burland JB. Shaft friction of piles in clay: a simple fundamental
approach. Ground Eng 1973;6(3):30–42.
[15] Comodromos E, Anagnostopoulos C, Georgiadis M. Numerical
assessment of axial pile group response based on load test.
Comput Geotech 2003;30(6):505–15.
[16] Comodromos E. Response evaluation of axially loaded fixed head
pile groups using 3D nonlinear analysis. Soils Found 2004;
44(2):31–9.