evaluation of geotechnical parameters for urban site in southern khamis mushait city, southwest...
TRANSCRIPT
ORIGINAL PAPER
Evaluation of geotechnical parameters for urban site in southernKhamis Mushait city, southwest Saudi Arabia, using seismicrefraction method
SattamAlmadani &AbdullahAl-Amri &Mohamed Fnais &
Kamal Abdelrahman & Elkhedr Ibrahim &
Essam Abd El-Motaal
Received: 17 May 2014 /Accepted: 1 September 2014# Saudi Society for Geosciences 2014
Abstract This study includes the determination of the engi-neering physical parameters of a proposed urban expansionsite at Khamis Mushait city, SW Saudi Arabia. The seismicrefraction survey as a noninvasive seismic technique was usedto determine the P wave velocity profile of the soil section inthe studied site. This method provides a simplified character-ization of subsurface in two-dimensional depth-velocity pro-files. Seismic records obtained were processed and analyzedby SeisImager software to obtain one-dimensional P wavevelocity (Vp) distribution. The measured P wave velocitieswere used to estimate relative density, N value, modulus ofelasticity, uniaxial compression strength, ultimate tensilestrength, ultimate bearing capacity, allowable bearing capaci-ty, Poisson’s ratio, and rock quality designation. The resultsindicate that the investigated site is composed mainly of twosoil layers. The top layer is interpreted as loose incompetentsoil sediments (alluvial sediments) to the depth of 5 m with Vp
ranging between 300 and 880 m/s. This layer is underlain bythe second competent soil layer with thickness reaching 18 mand Vp ranging between 1,097 and 2,626 m/s. The second
layer is considered as the foundation layer, and its determinedengineering physical parameters are vital information for theengineers in construction and urban development of this site.
Keywords Pwave . Engineering parameters . Urban site .
Saudi Arabia
Introduction
Seismic refraction method, as a nondestructive and low cost-effective geophysical method, is commonly used in variousfields such as mining, civil, and geotechnical engineeringworks that interact with rock of underground structures, dams,foundations, rock slopes, tunnels, deep trenches, caverns…etc. This method is frequently employed to investigate phys-ical and mechanical properties of rocks (D’andrea et al. 1965;Deere and Miller 1966; Youash 1970; Gardner et al. 1974;Lama and Vutukuri 1978; Inoue and Ohomi 1981; Gaviglio1989; Yasar and Erdogan 2004; Khandelwal and Ranjith2010). The quality of some rock materials is sometimes relat-ed to their elastic stiffness so that measurement of P wavevelocity in such materials can often be used to indicate theirquality as well as to determine elastic properties, since theseismic velocity depends on the elasticity and density of thematerial through which the energy is passing.
The main objective of this study is to evaluate the engi-neering parameters such as N value, rock quality, relativedensity, uniaxial compressive strength (UCS), ultimate tensilestrength (UTS), and modulus of elasticity for the sedimentaryoverburden using seismic P wave velocity. The estimation ofsuch parameters is important in engineering perspective espe-cially for soil sediments in an urban expansion site that lies tothe south of Khamis Mushait City, Asir region (Fig. 1). These
S. Almadani (*) :A. Al-Amri :M. Fnais :K. Abdelrahman :E. Ibrahim : E. A. El-MotaalGeology and Geophysics Department, College of Science, KingSaud University, Riyadh, KSA, Saudi Arabiae-mail: [email protected]
K. AbdelrahmanSeismology Department, National Research Institute of Astronomyand Geophysics, Helwan, Cairo, Egypt
E. IbrahimGeology Department, Faculty of Science, Mansoura University,Mansoura, Egypt
E. A. El-MotaalGeology Department, Faculty of Science, Al-Azhar University,Cairo, Egypt
Arab J GeosciDOI 10.1007/s12517-014-1615-4

parameters can be taken into consideration before makingimportant decision for civil construction in this site.
Geological setting
Our investigated site is located south of Khamis Mushait cityin Asir province in the southwest of Saudi Arabia (Fig. 1). Themajor portion of the studied site is underlain by KhamisMushait Gneiss that covered with thick alluvial sedimentarysoil section. Khamis Mushait Gneiss represents the mainbasement unit in the area that crop out along the southern,southeastern, and western sides of the investigated site(Fig. 2). These rocks are composed of banded orthogneiss,migmatite with minor amphibolite, and paragniess. This unitis invaded by numerous pegmatite dikes. The basementGneiss rocks are covered with a thick section of alluvial soilthat is composed of pebbles, gravels, sands, and clays. Thealluvium soil has been transported to the investigated site byrunning water from the upstream and surrounding weatheredGneiss uphills through incised network of narrow and activechannels.
Data acquisition and processing
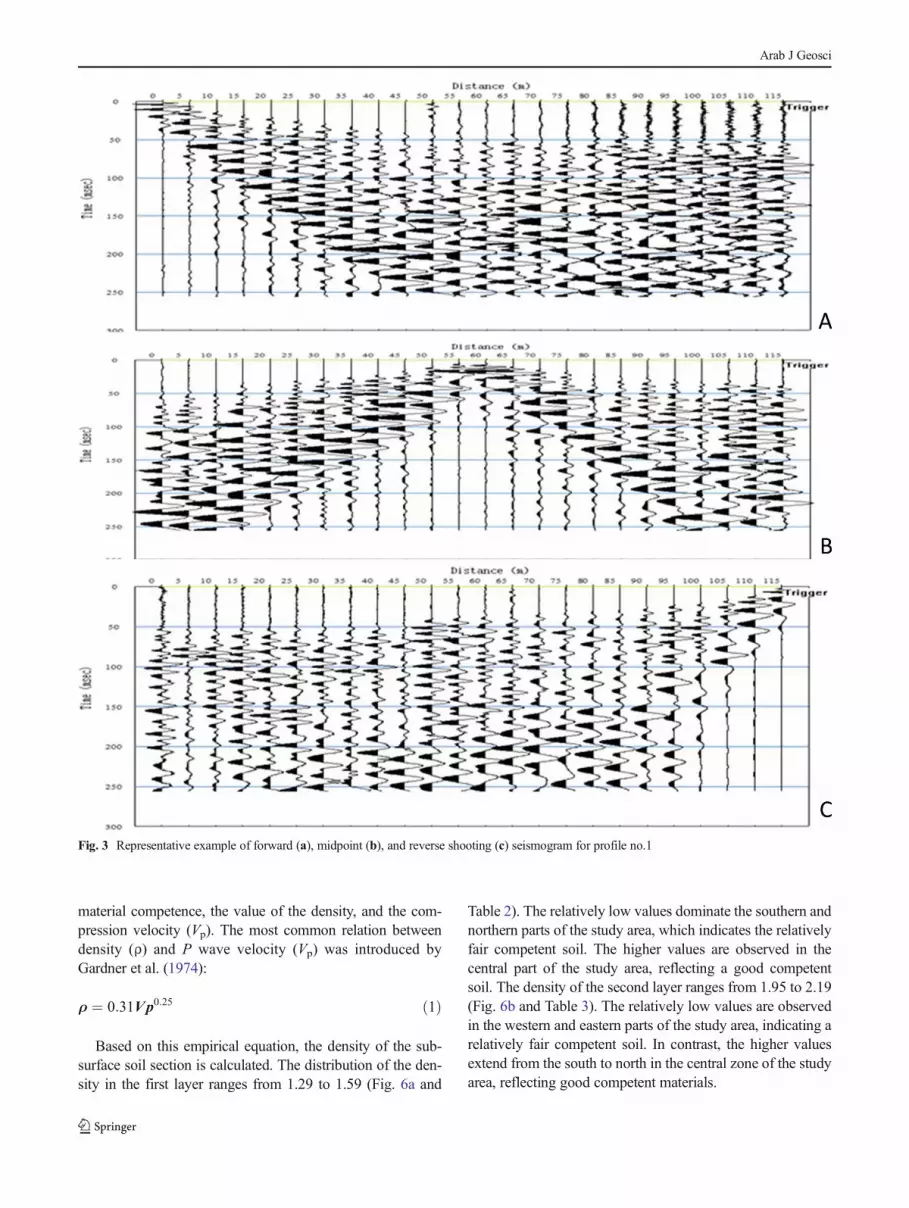
Shallow seismic refraction technique was applied at the studyarea to determine the dynamic properties of soil and founda-tion rocks. The data have been acquired along 31 shallowseismic refraction profiles (Fig. 1) using 24 channel signalenhancement seismograph “GEOMETRICS SMARTSEIS”with 5-m geophone spacing and total length of 115m. SeismicP waves have been generated using a sledgehammer 10 kg atthree shot points for each profile, at the 1st geophone (forwardshooting), midpoint shooting (between geophones 12 and 13),and at the 24th geophone (reverse shooting). The refractedseismic waves are returned to the ground surface and recordedat the geophone points. Seismic signals were stacked at leastthree times for each source. Figure 3 shows a representativeexample of the measured raw data.
The acquired seismic row data have been processedthrough SeisImager/2D software Version 3.14 (GeometricsCompany 2009). The collected data are first plotted and thenfiltered using a band-pass filter. The first arrivals are picked,and all picked first arrival travel times are used to constructtravel time-distance curve for each profile. Accordingly, the
Fig. 1 Location map of the studied site and the location of seismic refraction profiles
Arab J Geosci

subsurface layers have been assigned, and then, the corre-sponding velocity-depth model has been generated.
Results and interpretation
Seismic velocities and soil strata
Shallow seismic refraction method gives information aboutthe subsurface structures in terms of seismic velocities andlayer thicknesses (Table 1). These velocities are directly relat-ed to the quality, hardness, compaction, and water content ofthe medium (Altindag 2012; Khandelwal 2013). However, asqualitative classification, seismic velocities are classified intothree velocity ranges that are used for identifying the subsur-face rock layers in terms of the compaction and stiffness of thesoil sediments and hard bedrock (Table 2). In this study, theconstructed depth-velocity model clarified three subsurfacelayers; the surface layer exhibits a P wave velocity of about
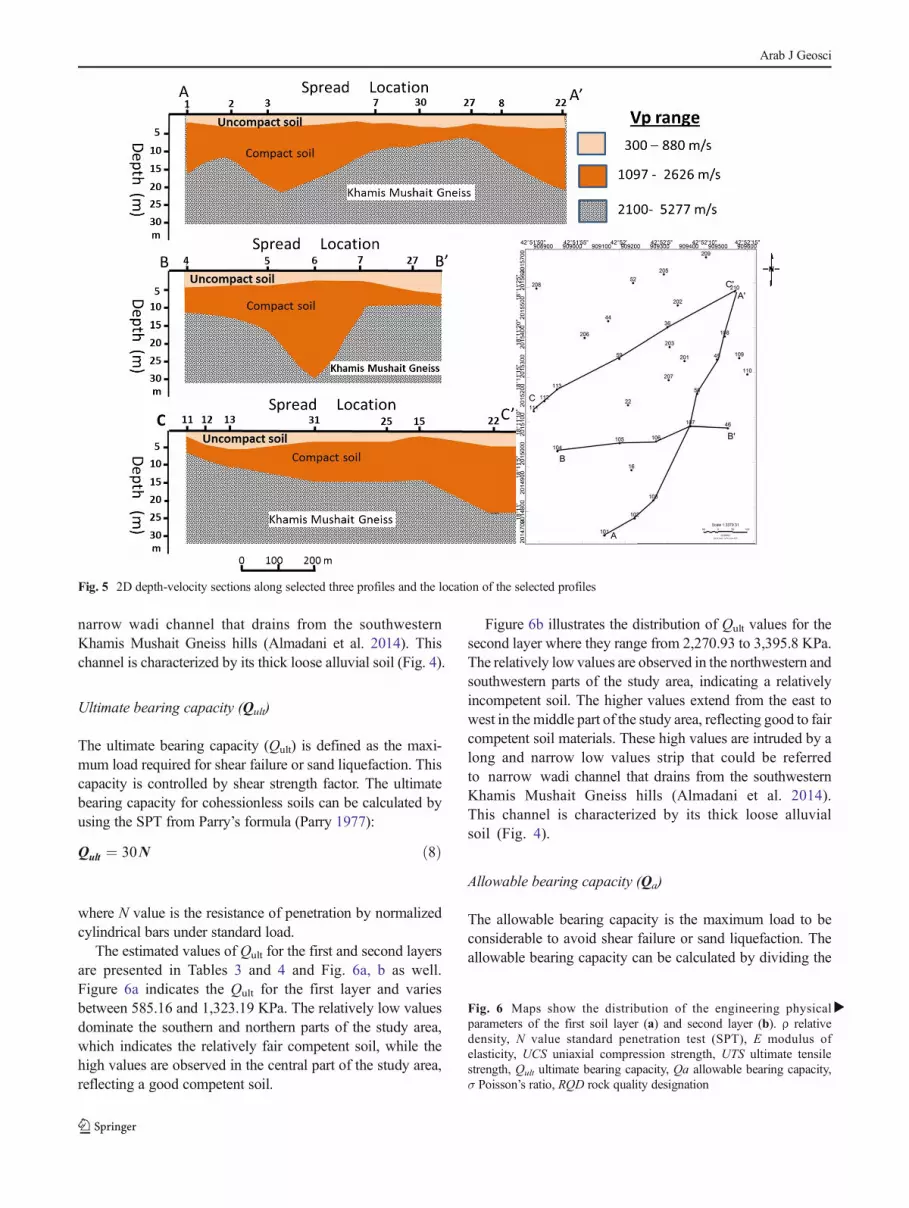
300 to 880 m/s, these velocities correspond to the surfaceloose sediment zone with thickness that varies from 1 to5 m. The second layer shows that P wave velocity rangesfrom 1,097 to 2,490 m/s that could be correlated to compactsediments with thickness that varies between 3 and 28 m. Thethird layer shows a P wave velocity between 2,100 and5,277.5 m/s that could be assigned for Khamis MushaitGneiss. The calculated thickness and velocities of theinterpreted seismic layers are listed in Table 1, displayed onmaps (Fig. 4) and plotted in 2D cross sections showing thedistribution of the subsurface layers (Fig. 5).
Geotechnical parameters
Relative density
The relationship between P wave velocity and rock densityhas been investigated by many researchers (e.g., Brich 1960;Kopf et al. 1985). There is a direct relation between the
Fig. 2 Geologic map for thestudied area
Arab J Geosci
material competence, the value of the density, and the com-pression velocity (Vp). The most common relation betweendensity (ρ) and P wave velocity (Vp) was introduced byGardner et al. (1974):
ρ ¼ 0:31Vp0:25 ð1Þ
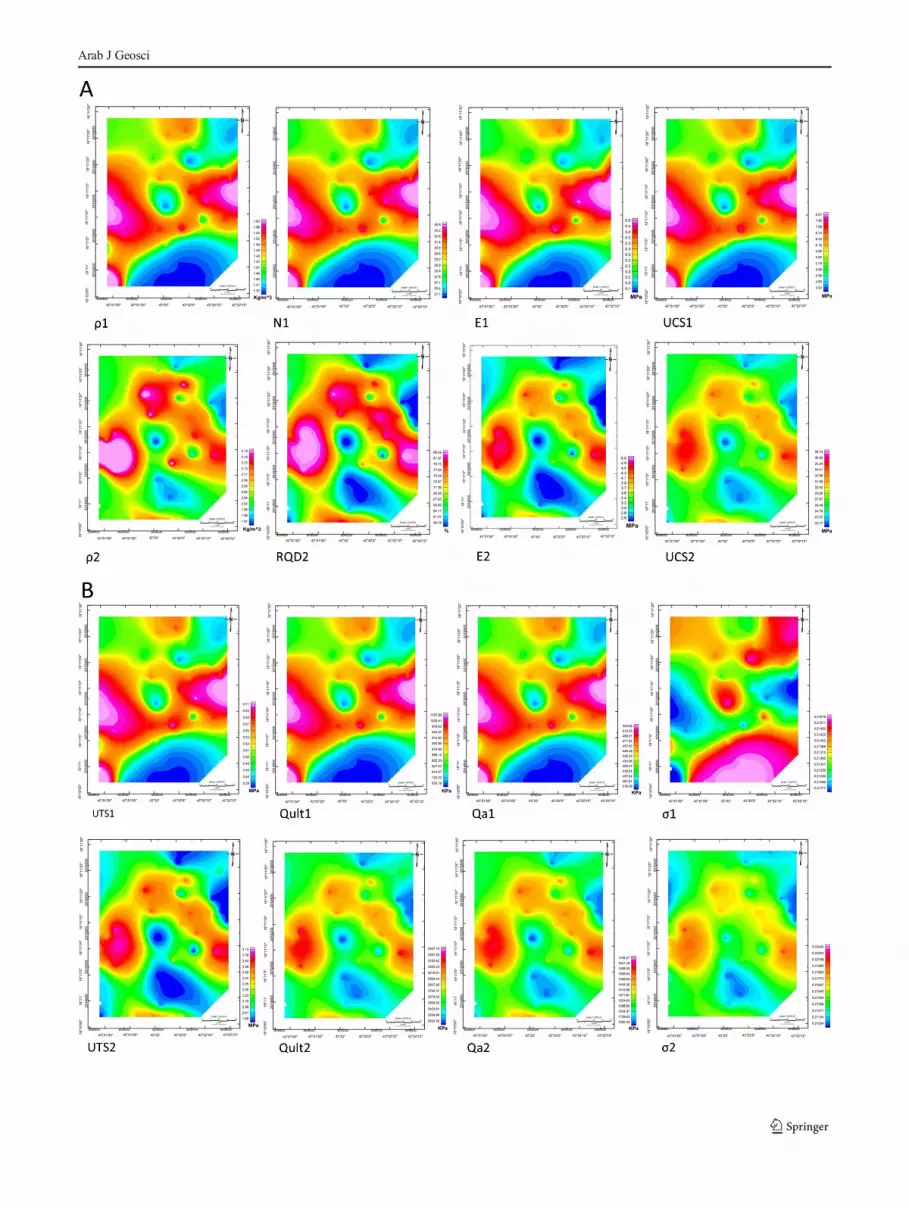
Based on this empirical equation, the density of the sub-surface soil section is calculated. The distribution of the den-sity in the first layer ranges from 1.29 to 1.59 (Fig. 6a and
Table 2). The relatively low values dominate the southern andnorthern parts of the study area, which indicates the relativelyfair competent soil. The higher values are observed in thecentral part of the study area, reflecting a good competentsoil. The density of the second layer ranges from 1.95 to 2.19(Fig. 6b and Table 3). The relatively low values are observedin the western and eastern parts of the study area, indicating arelatively fair competent soil. In contrast, the higher valuesextend from the south to north in the central zone of the studyarea, reflecting good competent materials.
Fig. 3 Representative example of forward (a), midpoint (b), and reverse shooting (c) seismogram for profile no.1
Arab J Geosci

Standard penetration test (SPT)
SPT test (or N value) is a dynamic test that measures thedensity of the soil. Several relationships have been establishedbetween P wave velocity and SPT. In the present study, theempirical equation of Bery and Saad (2012) has been used forN value estimation for the first layer based on Pwave velocityvalues for soil materials as follow:
Vp ¼ 23:605 Nð Þ−160:43 ð2Þ
The estimated N value for the first layer (Fig. 6a andTable 2) varies from 21 to 34. The relatively low valuesdominate the southern and northern parts of the study area,
which indicates the relatively loose soil materials. The highervalues are observed in the central part of the study area,reflecting fair dense materials in this part of the study area.The value of N is calculated for the surface soil layer onlybecause the N value of the second layer exceeds 50 (Table 3),indicating a soft rock according to Table 4.
Rock quality designation (RQD)
RQD forms a basic element in some of the most used rockmass classification systems: Rock Mass Rating system(RMR) and Q-system. RQD is defined in equation as
RQD ¼ l sum of 100
ltot core run
� �� 100% ð3Þ
where lsum of 100=sum of length of core sticks longer than100 mmmeasured along the center of the core and ltot core run=total length of core run.
In this study, P wave velocity that estimated from seismicsurvey has been used to calculate the RQD for the secondlayer using the equation of Bery and Saad (2012) with regres-sion of 0.8377 (83.77 %) as follows:
Vp ¼ 21:951 RQDð Þ þ 0:1368 ð4Þ
According to Table 3 and Fig. 6b, RQD values for thesecond layer more than 75 % indicate that this layer is com-posed of a rock of good quality (Table 3).
Uniaxial compression strength (UCS)
There are many relationships between UCS and P wavevelocity (Mccann et al. 1990; Cheng and Hu 2003; Entwisleet al. 2005; Singh and Kripamoy 2005; Chary et al. 2006;Sharma and Singh 2008). The majority of the equations yieldlinear and power relationships between the UCS and P wavevelocity. A power correlation was found between the UCS andP wave velocity for the entire dataset. According to Altindag(2012), the values of UCS have been calculated using thefollowing equation:
UCS ¼ 12:743 Vp1:194 ð5Þ
where UCS is the uniaxial compressive strength (MPa) and Vpis the P wave velocity (km/s). The correlation coefficient ofthe relationship is 0.76.
The distribution of the UCS values of the first layer rangesfrom 3.2 to 8.3 MPa (Fig. 6a and Table 2). The relatively lowvalues dominate the southern and northern parts of the studyarea, which indicates the relatively fair competent soil. Thehigher values are observed in the central part of the study area,reflecting a good competent soil. Figure 6b illustrates thedistribution of UCS for the second layer that ranges from
Table 1 Interpreted seismic P wave velocities and thicknesses of theinterpreted seismic layers
Line no. First layer Second layer Third layer
Vp1 m/s h1 (m) Vp2 m/s h2 (m) Vp3 m/s
1 300 2.4 2,093.6 14 5,189.6
2 300 3 1,586.7 9 5,065.3
3 261.8 3 1,365.8 18 5,277.5
4 675.4 4.5 2,432.3 7 5,003
5 617.2 3.8 1,801.4 12 4,831
6 708.3 2 2,114.3 28 5,000
7 433.5 2 1,360.4 6.5 4,827
8 482.4 3 1,306.7 10 4,531
9 541.8 2 1,441.1 9 4,937
10 880.7 3 1,547.1 11 4,720.2
11 732.9 1 2,241 5 4,643
12 659 4 2,103 4 4,001
13 601 5 2,490 5 3,974
14 555.5 2.2 2,250 6.9 5,000
15 521.6 1 2,249.3 13 3,986.5
16 539.3 3.4 2,184 11 3,652
17 600 1.8 1,300 9 3,600
18 528 2.1 2,045 14 4,673
19 632 1 2,142 8 3,892
20 500 3 1,800 3 2,100
21 433.4 3 1,679 7 3,730
22 361.2 4 1,893.7 19 3,671.8
23 530 3.5 1,400 9 2,130
24 300 2 1,097 8.5 2,542.9
25 300 3 1,577 10 2,439
26 479.7 2 2,392.2 18 4,183
27 586.5 2 2,156.8 5 4,216.9
28 603.8 5 2,489.7 3 4,986.3
29 563.4 1.6 1,895.9 11 4,101.6
30 711.3 2.7 2,292 5 4,379
31 573.8 3.2 2,283 10 4,739
Arab J Geosci
22.36 to 38.98 MPa (Table 3). The relatively low values areobserved in the northeastern and southeast parts of the studyarea, indicating a relatively incompetent soil, while the highervalues extend from the east to west in the middle part of thestudy area, reflecting good to fair competent materials. Thesehigher values are intruded by a long and narrow low valuestrip that could be referred to narrow wadi channel that drainsfrom the southwestern Khamis Mushait Gneiss hills(Almadani et al. 2014). This channel is characterized by itsthick loose alluvial soil (Fig. 4).
Ultimate tensile strength
The UTS of a material is the limit stress at which the materialactually breaks, with sudden release of the stored elastic
energy. The relation between tensile strength versus Vp canbe expressed by the following equation (Altindag 2012):
UTS ¼ 1:0562Vp1:1222 ð6Þ
where UTS is the tensile strength (MPa) and Vp is the P wavevelocity (km/s). The correlation coefficient of the relationshipis 0.77.
The UTS estimated values are shown in Tables 2 and 3 andFig. 6a, b for the first and second interpreted layers. Figure 6aindicates the UTS for the first layer and varies between 0.2 and0.7 MPa. The relatively low values dominate the southern andnorthern parts of the study area, which indicates the relativelyfair competent soil, while the high values are observed in the
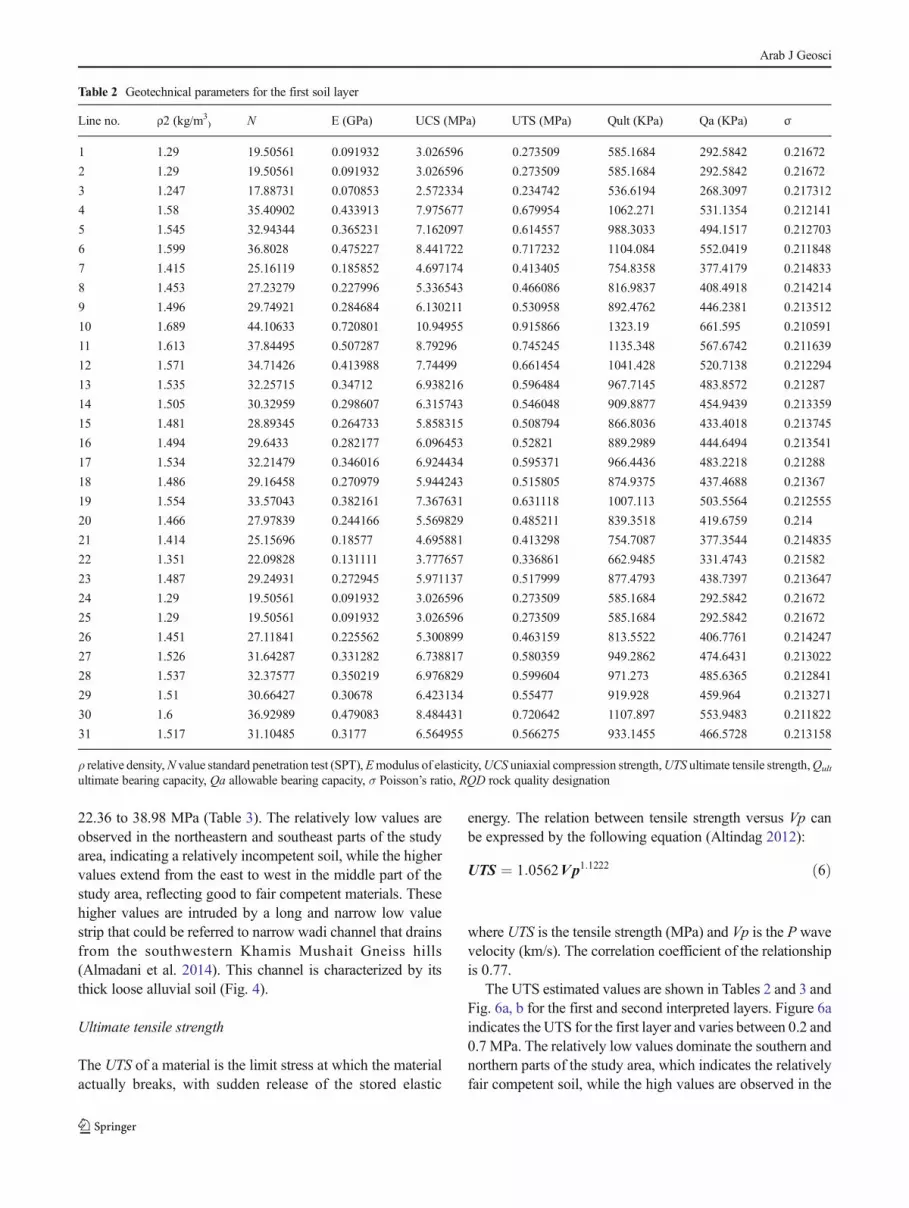
Table 2 Geotechnical parameters for the first soil layer
Line no. ρ2 (kg/m3) N E (GPa) UCS (MPa) UTS (MPa) Qult (KPa) Qa (KPa) σ
1 1.29 19.50561 0.091932 3.026596 0.273509 585.1684 292.5842 0.21672
2 1.29 19.50561 0.091932 3.026596 0.273509 585.1684 292.5842 0.21672
3 1.247 17.88731 0.070853 2.572334 0.234742 536.6194 268.3097 0.217312
4 1.58 35.40902 0.433913 7.975677 0.679954 1062.271 531.1354 0.212141
5 1.545 32.94344 0.365231 7.162097 0.614557 988.3033 494.1517 0.212703
6 1.599 36.8028 0.475227 8.441722 0.717232 1104.084 552.0419 0.211848
7 1.415 25.16119 0.185852 4.697174 0.413405 754.8358 377.4179 0.214833
8 1.453 27.23279 0.227996 5.336543 0.466086 816.9837 408.4918 0.214214
9 1.496 29.74921 0.284684 6.130211 0.530958 892.4762 446.2381 0.213512
10 1.689 44.10633 0.720801 10.94955 0.915866 1323.19 661.595 0.210591
11 1.613 37.84495 0.507287 8.79296 0.745245 1135.348 567.6742 0.211639
12 1.571 34.71426 0.413988 7.74499 0.661454 1041.428 520.7138 0.212294
13 1.535 32.25715 0.34712 6.938216 0.596484 967.7145 483.8572 0.21287
14 1.505 30.32959 0.298607 6.315743 0.546048 909.8877 454.9439 0.213359
15 1.481 28.89345 0.264733 5.858315 0.508794 866.8036 433.4018 0.213745
16 1.494 29.6433 0.282177 6.096453 0.52821 889.2989 444.6494 0.213541
17 1.534 32.21479 0.346016 6.924434 0.595371 966.4436 483.2218 0.21288
18 1.486 29.16458 0.270979 5.944243 0.515805 874.9375 437.4688 0.21367
19 1.554 33.57043 0.382161 7.367631 0.631118 1007.113 503.5564 0.212555
20 1.466 27.97839 0.244166 5.569829 0.485211 839.3518 419.6759 0.214
21 1.414 25.15696 0.18577 4.695881 0.413298 754.7087 377.3544 0.214835
22 1.351 22.09828 0.131111 3.777657 0.336861 662.9485 331.4743 0.21582
23 1.487 29.24931 0.272945 5.971137 0.517999 877.4793 438.7397 0.213647
24 1.29 19.50561 0.091932 3.026596 0.273509 585.1684 292.5842 0.21672
25 1.29 19.50561 0.091932 3.026596 0.273509 585.1684 292.5842 0.21672
26 1.451 27.11841 0.225562 5.300899 0.463159 813.5522 406.7761 0.214247
27 1.526 31.64287 0.331282 6.738817 0.580359 949.2862 474.6431 0.213022
28 1.537 32.37577 0.350219 6.976829 0.599604 971.273 485.6365 0.212841
29 1.51 30.66427 0.30678 6.423134 0.55477 919.928 459.964 0.213271
30 1.6 36.92989 0.479083 8.484431 0.720642 1107.897 553.9483 0.211822
31 1.517 31.10485 0.3177 6.564955 0.566275 933.1455 466.5728 0.213158
ρ relative density,N value standard penetration test (SPT), Emodulus of elasticity,UCS uniaxial compression strength,UTS ultimate tensile strength,Qult
ultimate bearing capacity, Qa allowable bearing capacity, σ Poisson’s ratio, RQD rock quality designation
Arab J Geosci

central part of the study area, reflecting a good competent soil.Figure 6b illustrates the distribution of UTS values for thesecond layer where they range from 1.78 to 3.01 MPa. Therelatively low values are observed in the northwestern andsouthwestern parts of the study area, indicating a relativelyincompetent soil, while the higher values extend from the eastto west in the middle part of the study area, reflecting good tofair competent soil materials. This high values are intruded bya long and narrow low values strip that could be referred tonarrow wadi channel that drains from the southwesternKhamis Mushait Gneiss hills (Almadani et al. 2014). Thischannel is characterized by its thick loose alluvial soil (Fig. 4).
Modulus of elasticity (E)
There is a power relationship between modulus of elasticity(E) and P wave velocity (Altindag 2012):
E ¼ 0:919Vp1:9122 ð7Þ
where E is the modulus of elasticity (GPa) and Vp is the Pwave velocity (km/s). The correlation coefficient of the rela-tionship is 0.79.
The estimated values of modulus of elasticity for first andsecond layers are presented in Tables 2 and 3 and Fig. 6a, b aswell. Figure 6a indicates the E for the first layer and variesbetween 0.07 and 0.72 GPa. The relatively low values dom-inate the southern and northern parts of the study area, whichindicates the relatively fair competent soil. While the highvalues are observed in the central part of the study area,reflecting a good competent soil.
Figure 6b illustrates the distribution of E values for thesecond layer which ranges from 1.09 to 7.66 GPa. The rela-tively low values are observed in the northwestern and south-western parts of the study area, indicating a relatively incom-petent soil. While the higher values extend from the east towest in the middle part of the study area, reflecting good to faircompetent soil materials. These higher values are intruded bya long and narrow low values strip that could be referred to
Fig. 4 Maps show the distribution of the seismic velocities and thicknesses of the two soil layers. Vp1, Vp2, and Vp3 are the P wave velocities of thefirst, second, and third layers. H1 and H2 are the thicknesses of the first and second layers
Arab J Geosci
narrow wadi channel that drains from the southwesternKhamis Mushait Gneiss hills (Almadani et al. 2014). Thischannel is characterized by its thick loose alluvial soil (Fig. 4).
Ultimate bearing capacity (Qult)
The ultimate bearing capacity (Qult) is defined as the maxi-mum load required for shear failure or sand liquefaction. Thiscapacity is controlled by shear strength factor. The ultimatebearing capacity for cohessionless soils can be calculated byusing the SPT from Parry’s formula (Parry 1977):
Qult ¼ 30N ð8Þ
where N value is the resistance of penetration by normalizedcylindrical bars under standard load.
The estimated values of Qult for the first and second layersare presented in Tables 3 and 4 and Fig. 6a, b as well.Figure 6a indicates the Qult for the first layer and variesbetween 585.16 and 1,323.19 KPa. The relatively low valuesdominate the southern and northern parts of the study area,which indicates the relatively fair competent soil, while thehigh values are observed in the central part of the study area,reflecting a good competent soil.
Figure 6b illustrates the distribution of Qult values for thesecond layer where they range from 2,270.93 to 3,395.8 KPa.The relatively low values are observed in the northwestern andsouthwestern parts of the study area, indicating a relativelyincompetent soil. The higher values extend from the east towest in the middle part of the study area, reflecting good to faircompetent soil materials. These high values are intruded by along and narrow low values strip that could be referredto narrow wadi channel that drains from the southwesternKhamis Mushait Gneiss hills (Almadani et al. 2014).This channel is characterized by its thick loose alluvialsoil (Fig. 4).
Allowable bearing capacity (Qa)
The allowable bearing capacity is the maximum load to beconsiderable to avoid shear failure or sand liquefaction. Theallowable bearing capacity can be calculated by dividing the
Fig. 5 2D depth-velocity sections along selected three profiles and the location of the selected profiles
�Fig. 6 Maps show the distribution of the engineering physicalparameters of the first soil layer (a) and second layer (b). ρ relativedensity, N value standard penetration test (SPT), E modulus ofelasticity, UCS uniaxial compression strength, UTS ultimate tensilestrength, Qult ultimate bearing capacity, Qa allowable bearing capacity,σ Poisson’s ratio, RQD rock quality designation
Arab J Geosci
Arab J Geosci

ultimate bearing capacity value (Qult) by suitable factor ofsafety (Abd Elrahman 1989) as follows:
Qa ¼Qult
Fð9Þ
The safety factor (F) equals 2 when the soil is cohessionlessmaterial. The calculated values of Qa for first and sec-ond layers are presented in Tables 3 and 4 andFig. 6a, b as well. Figure 6a indicates the Qa for thefirst layer that varies between 302.06 and 545.54 KPa.The relatively low values dominate the southern andnorthern parts of the study area, which indicates therelatively fair competent soil, while the high values are ob-served in the central part of the study area, reflecting a goodcompetent soil.
Figure 6b illustrates the distribution of Qa values for thesecond layer where they range from 1,113.74 to1,718.38 KPa. The relatively low values are observed in thewestern and eastern parts of the study area, indicating arelatively fair competent soil, while the higher values extend
Table 3 Geotechnical parameters for the second sedimentary layer
Line no. ρ2 (kg/m3) N E (GPa) UCS (MPa) UTS (MPa) Qult (KPa) Qa (KPa) σ RQD
1 2.096936 95.48951 3.7751 30.79064 2.42021 2864.685 1432.343 0.215193 78.3823
2 1.956525 74.01525 2.221783 22.11376 1.773134 2220.458 1110.229 0.210407 55.28995
3 1.884553 64.65706 1.668026 18.48945 1.498572 1939.712 969.856 0.209607 45.22663
4 2.177038 109.8382 5.02872 36.82783 2.863747 3295.145 1647.573 0.220683 93.81212
5 2.019595 83.11078 2.832 25.7318 2.044522 2493.323 1246.662 0.211932 65.07083
6 2.1021 96.36645 3.846796 31.15449 2.44708 2890.993 1445.497 0.215476 79.32531
7 1.882688 64.4283 1.655438 18.4022 1.491925 1932.849 966.4245 0.209598 44.98063
8 1.863827 62.15336 1.532735 17.53823 1.425997 1864.601 932.3004 0.209526 42.53427
9 1.910008 67.84707 1.848291 19.71299 1.591595 2035.412 1017.706 0.209792 48.657
10 1.944202 72.33764 2.11696 21.45639 1.723549 2170.129 1085.065 0.210206 53.48594
11 2.132908 101.734 4.299624 33.39637 2.612234 3052.019 1526.009 0.217357 85.09725
12 2.099286 95.88774 3.807578 30.95578 2.432408 2876.632 1438.316 0.215321 78.81052
13 2.189836 112.2826 5.259299 37.87335 2.940093 3368.477 1684.239 0.221801 96.4407
14 2.135046 102.1152 4.332703 33.55657 2.624009 3063.457 1531.728 0.2175 85.50726
15 2.13488 102.0856 4.330126 33.54411 2.623093 3062.567 1531.284 0.217489 85.47537
16 2.119214 99.31921 4.092931 32.38466 2.537789 2979.576 1489.788 0.216479 82.50056
17 1.861434 61.86952 1.517742 17.43091 1.417795 1856.086 928.0428 0.20952 42.22905
18 2.084659 93.43063 3.609302 29.93915 2.357253 2802.919 1401.459 0.214556 76.16827
19 2.108951 97.53993 3.943742 31.64245 2.483086 2926.198 1463.099 0.215865 80.58721
20 2.019202 83.05147 2.827793 25.70793 2.042739 2491.544 1245.772 0.21192 65.00705
21 1.984378 77.92544 2.475469 23.65823 1.889288 2337.763 1168.882 0.210972 59.49477
22 2.044982 87.02097 3.115946 27.31374 2.162443 2610.629 1305.315 0.212815 69.27565
23 1.896242 66.10591 1.748806 19.04358 1.540746 1983.177 991.5886 0.20968 46.78465
24 1.784076 53.26965 1.09698 14.23241 1.171834 1598.089 799.0447 0.209687 32.98118
25 1.953528 73.60432 2.195883 21.95244 1.760974 2208.13 1104.065 0.210355 54.84806
26 2.168009 108.1394 4.871381 36.10405 2.810818 3244.181 1622.091 0.219937 91.98532
27 2.112585 98.16691 3.996012 31.90367 2.502347 2945.007 1472.504 0.216078 81.26144
28 2.18977 112.2699 5.258088 37.8679 2.939696 3368.096 1684.048 0.221795 96.42703
29 2.045576 87.11417 3.122872 27.35164 2.165263 2613.425 1306.713 0.212837 69.37587
30 2.144941 103.8945 4.488672 34.30583 2.679039 3116.835 1558.418 0.218186 87.42061
31 2.142832 103.5132 4.455029 34.14505 2.667236 3105.397 1552.699 0.218037 87.01061
ρ relative density,N value standard penetration test (SPT), Emodulus of elasticity,UCS uniaxial compression strength,UTS ultimate tensile strength,Qult
ultimate bearing capacity, Qa allowable bearing capacity, σ Poisson’s ratio, RQD rock quality designation
Table 4 Relationship between RQD and N value (Bery and Saad 2012)
Rock quality description RQD (%) N value
Very poor Less than 25 50–65
Poor 25–50 65–70
Fair 50–75 70–75
Good 75–85 75–85
Excellent Over 85 Over 85
Arab J Geosci

from the south to north in the central zone of the study area,reflecting good competent soil materials.
Poisson’s ratio (σ)
It is a fundamental parameter usually estimated in engineeringstudies as a ratio between the fractional transverse contractionand the fractional longitudinal extension (Bowles 1984). Asuggested range for the values of Poisson’s ratio is from 0.0for very hard material to 0.5 for liquids and about (0.25) forelastic material (Sjogren 1984). In soil mechanics, thePoisson’s ratio often ranges between 0.2 and 0.4 and about(0.5) for saturated soil (Hunt 1986).
The values of Poisson’s ratio are calculated according to itsrelation with the P wave velocity (Khandelwal 2013) by thefollowing equation:
σ ¼ 8 � 10−9 � Vp
� �2−2 � 10−5 � Vp
� �þ 0:222 ð10Þ
The values of Poisson’s ratio for the first and second layersare illustrated in Tables 3 and 4 and Fig. 6a, b. Figure 6a showsthe distribution of Poisson’s ratio (σ) values for the first layerwhich is characterized by wide range of values of Poisson’sratio lies in the range between 0.212 and 0.217 kg/m3 becauseof the lithological changes and the variations in degree ofconsolidation. This range indicates that the sediments of thislayer lie between fairly to moderate competent soil.
Figure 6b illustrates the distribution of σ values for thesecond layer that ranges from 0.211 to 0.225 kg/m3. Therelatively low values are observed in the northwestern andsouthwestern parts of the study area, indicating a relativelyincompetent soil, while the higher values extend from the eastto west in the middle part of the study area, reflecting good tofair competent soil materials. These high values are intrudedby a long and narrow low values strip that could be referred tonarrow wadi channel that drains from the southwesternKhamis Mushait Gneiss hills (Almadani et al. 2014). Thischannel is characterized by its thick loose alluvial soil (Fig. 4).
Discussions and conclusions
In this study, three seismic layers have been assigned at thesite of interest from seismic refraction survey. The first andsecond layers represent the sedimentary overburden thatcovers Khamis Mushait Gneiss. This sedimentary overburdenvaries in thickness and velocity laterally through the area ofstudy. The change in the thickness of this sedimentary covercould be referred to the variation in the surface topography ofthe Gneiss. In addition, the small wadi channels that cross thestudied sites and convey water and sediments to the site fromthe surrounding hills play a great role in these lateral varia-tions. The lateral change in the seismic P wave velocitiescould be related to the heterogeneity of the alluvial sediments.
Fig. 7 Geotechnical zonationmap according to the RQD values(Table 4) for the second layer
Arab J Geosci

The geotechnical parameters have been calculated for the firstand second sedimentary layers based on the Pwave velocities.According to these parameters, the second layer represents thefoundation layer. This layer can be classified into three differ-ent zones according to the rock quality assessment (Fig. 7).The good competent material zone extends across the centralpart of the study area, representing a suitable part for engi-neering purposes. The north- and south-eastern parts of thesite are characterized by poor rock quality and incompetentmaterial that is considered not suitable for construction pur-poses. These two zones are separated and bounded by a thirdzone that is characterized by a fair rock quality and faircompetent materials.
Acknowledgements The authors would like to extend their sincereappreciation to the Deanship of Scientific Research at king Saud Universityfor funding this Research group No. RG -1435-035.
References
Abd ElrahmanMM (1989) Evaluation of the kinetic moduli of the surfacematerials and application to engineering geologic maps atMa’Barrisabah area (Dhamar Province), Northern Yemen. Egypt JGeol 33:228–252
Almadani S, Ibrahim E, Abdelrahman K, Al-Bassam A, Al-Shmrani A(2014) Magnetic and seismic refraction survey for site investigationof an urban expansion site in Abha district, south west Saudi Arabia.Arab J Geosci. doi:10.1007/s12517/014/1342/x
Altindag R (2012) Correlation between P-wave velocity and some me-chanical properties for sedimentary rocks. J South Afr Inst MinMetall 112:229–237
Bery AA, Saad R (2012) Correlation of seismic P-wave velocities withengineering prameters (N value and rock quality) for tropical envi-ronmental study. Int J Geosci 3:749–757
Bowles JE (1984) Physical and geotechnical properties of soils. McGraw-Hill International Book Company, London, 578p
Brich F (1960) The velocity of compressional waves in rocks to 10 kbars:part 1. J Geophys Res 65:1083–1102
Chary KB, Sarma LP, Lakshmi KJP, Vijayakumar NA, Lakshmi VN, RaoMV (2006) Evaluation of engineering properties of rock usingultrasonic pulse velocity and uniaxial compressive strength.Proceedings of the National seminar on Non-destructive evaluation,Hyderabad, pp 379–385
Cheng H, Hu ZY (2003) Some factors affecting the uniaxial strength ofweak sandstone. Bull Eng Geol Environ 62:323–332
D’andrea DV, Fischer RL, Fogelson DE (1965) Prediction of compressivestrength from other rock properties. US Bur Min Rep Invest 6702:23
Deere DU, Miller RP (1966) Engineering classification and index prop-erties for intact rock. Air Force Weapons Laboratory TechnicalReport, AFWL-TR 65–116, Kirtland Base, New Mexico
Entwisle DC, Hobbs PRN, Jones LD, Gunn D, Raines MG (2005)The relationships between effective porosity, uniaxial compres-sive strength and sonic velocity of intact Borrowdale volcanicgroup core samples from Sellafield. Geotech Geol Eng 23:793–809
Gardner GHF, Gardner LW, Gregory AR (1974) Formation velocity anddensity: the diagnostic basis for stratigraphic traps. Geophysics 39:770–780
Gaviglio P (1989) Longitudinal wave propagation in a limestone: therelationship between velocity and density. RockMechRock Eng 22:299–306
Geometrics Company (2009) SeisImager 2D software version 3.14Hunt RE (1986) Geotechnical engineering analysis and evaluation.
McGraw Hill-Ryerson, 729pInoue M, Ohomi M (1981) Relation between uniaxial compressive
strength and elastic wave velocity of soft rock. Proceedings of theInternational Symposium on Weak Rock, Tokyo, pp 9–13
Khandelwal M (2013) Correlating P-wave velocity with the physico-mechanical properties of different rocks. Pure Appl Geophys 170:507–514
Khandelwal M, Ranjith PG (2010) Correlating index properties of rockswith P-wave measurements. J Appl Geophys 71:1–5
KopfM, Müller HJ, Gottesmann B (1985) Correlation between pyroxenecontent and Vp and Vs under high pressure. Kapicka, A.,Kropacek, V., Pros, Z. (eds.). Physical properties of the mineralsystem of the Earth’s Interior. Union Czech. Math. Phys.,Prague, pp. 168–172
Lama RD, Vutukuri VS (1978) Handbook on mechanical properties ofrocks. Trans. Tech. Publications, Clausthal, vol. 2, Germany
MccannDM, CulshawMG,Northmore KJ (1990) Rock mass assessmentfrom seismic measurements, Field Testing in Engineering Geology.Bell, Culshaw, Cripps, and Coffey (eds.). Geological SocietyPublishing House, London, vol. 6,pp. 257–266
Parry RHC (1977) Estimating bearing capacity of sand from SPT values.JGED ASCE 103:1013–1045
Sharma PK, Singh TN (2008) A correlation between P-wave velocity,impact strength index, slake durability index and uniaxial compres-sive strength. Bull Eng Geol Environ 67:17–22
Singh TN, Kripamoy S (2005) Geotechnical investigation of Amiyanlandslide hazard zone in Himalayan region. GeotechnicalEngineering for Disaster Mitigation and Rehabilitation, Uttaranchal
Sjogren B (1984) Shallow refraction seismics. Champman and Hall,London, 270p
Yasar E, Erdogan Y (2004) Correlating sound velocity with density,compressive strength and Young’s modulus of carbonate rocks. IntJ Rock Mech Min Sci 41:871–875
Youash Y (1970) Dynamic physical properties of rocks: part 2, experi-mental result. Proceedings of the 2nd Congress of the InternationalSociety for Rock Mechanics, vol. 1, Privredni Pregled, Beograd,Yugoslavia, pp. 185–195
Arab J Geosci