evaluation of alginate/chitosan nanoparticles as antisense delivery vector: formulation,...
TRANSCRIPT

Carbohydrate Polymers 77 (2009) 599–606
Contents lists available at ScienceDirect
Carbohydrate Polymers
journal homepage: www.elsevier .com/locate /carbpol
Evaluation of Alginate/Chitosan nanoparticles as antisense delivery vector:Formulation, optimization and in vitro characterization
Tarane Gazori a, Mohammad Reza Khoshayand b, Ebrahim Azizi c, Parisa Yazdizade d,Alireza Nomani a,e, Ismaeil Haririan a,f,*
a Department of Pharmaceutics, Faculty of Pharmacy, Tehran University of Medical Sciences, Enghelab Street, Tehran 14155-6451, Iranb Department of Drug and Food Control, Faculty of Pharmacy and Pharmaceutical Research Center, Tehran University of Medical Sciences, Tehran, Iranc Cellular and Molecular Laboratory, Department of Toxicology, Faculty of Pharmacy, Tehran University of Medical Sciences, Tehran, Irand Azad University, Pharmaceutical Sciences Branch, Tehran, Irane School of Pharmacy, Zanjan University of Medical Sciences, Zanjan, Iranf Biomaterial Research Center (BRC), Tehran, Iran
a r t i c l e i n f o a b s t r a c t
Article history:Received 22 December 2008Received in revised form 26 January 2009Accepted 2 February 2009Available online 24 February 2009
Keywords:ChitosanAlginateNanoparticlesPregel preparing methodEGFR antisenseOptimizationExperimental design
0144-8617/$ - see front matter Crown Copyright � 2doi:10.1016/j.carbpol.2009.02.019
* Corresponding author. Address: Department oPharmacy, Tehran University of Medical Sciences, En6451, Iran. Tel./fax: +98 21 66482607.
E-mail address: [email protected] (I. Haririan).
Nanoparticles comprising Alginate/Chitosan polymers were prepared by pregel preparation methodthrough drop wise addition of various concentrations of CaCl2 to a defined concentration of Sodium Algi-nate. Then, Chitosan/Antisense solution with a certain N/P ratio was added to the pregel to make thenanoparticles. The effect of such parameters as polymer ratio, CaCl2/Alginate ratio and N/P ratio on theparticle size distribution and loading efficacy was studied. The optimum conditions were 1:1 (w/w) Algi-nate to Chitosan ratio, 0.2% CaCl2/Alginate ratio and N/P ratio of 5 at pH 5.3. The resulting nanoparticleshad a loading efficacy of 95.6% and average size of 194 nm as confirmed by PCS method and SEM imagesshowed spherical and smooth particles. The zeta potential of optimized nanoparticles prepared by thismethod was about +30 mV which could result in good stability of nanoparticles during manipulationand storage.
Crown Copyright � 2009 Published by Elsevier Ltd. All rights reserved.
1. Introduction
The use of natural biopolymers specifically polysaccharides indrug delivery has attracted particular interest due to their desir-able biocompatible, biodegradable, hydrophilic and protectiveproperties (Barichello, Morishita, Takayama, & Nagai, 1999). Theinteraction between biodegradable cationic and anionic biopoly-mers leads to the formation of polyionic hydrogels, which havedemonstrated favorable characteristics for drug entrapment anddelivery (Chellat et al., 2000).
Chitosan and Alginate are two biopolymers that have receivedmuch attention and been extensively studied for such a use.Entrapment in biopolymers of therapeutic agents including: pep-tides, proteins and polynucleotides have been shown to maintaintheir structure and activity and protect them from enzymatic deg-radation (Madan et al., 1997). Moreover, many of these polymers,
009 Published by Elsevier Ltd. All r
f Pharmaceutics, Faculty ofghelab Street, Tehran 14155-
particularly hydrogels, are naturally hydrophilic, which is advanta-geous since this property is thought to contribute to longer in vivocirculation times and allows encapsulation of water-soluble bio-molecules (Douglas & Tabrizian, 2005).
Chitosan is a natural cationic polysaccharide obtained by the N-deacetylation of chitin, a product found in the shells of crustaceans.It is widely used as a carrier in gene delivery, oral protein deliveryand controlled release systems (Borchard, 2001; Mansouri et al.,2004).
Alginate is an anionic polysaccharide consisting of linearcopolymers of a-L-guluronate and b-D-mannuronate residues. Algi-nates which are a group of hemocompatible polymers have notbeen found to accumulate in any major organs and have shownevidence of in vivo degradation (Mi, Sung, & Shyu, 2002). In thepresence of Calcium ions, ionic interactions between the divalentCalcium ions and the guluronic acid residues cause Alginates toform gels. The properties of Calcium–Alginate gel beads makethem one of the most widely used carriers for controlled releasesystems (Fundueanu, Nastruzzi, Carpov, Desbrieres, & Rinaudo,1999). Coating of these beads with other polymers including Chito-san has been shown to improve their stability during (shelf-life)storage and their half life in biological fluids.
ights reserved.
Table 1Variables used in Box–Behnken experimental design.
Independent variables Symbol Levels
�1 0 1
Polymer A 0.5 0.75 1.0CaCl2 B 0.1 0.2 0.3N/P C 5 15 25
Dependent variables Units Constraints
Y1 = particle size nm MinimizeY2 = loading % Maximize
600 T. Gazori et al. / Carbohydrate Polymers 77 (2009) 599–606
Alginate–Chitosan polyionic complexes form through ionicgelation via interactions between the carboxyl groups of Alginateand the amine groups of Chitosan. The complex protects theencapsulant, has biocompatible and biodegradable characteristics,and limits the release of encapsulated materials more effectivelythan either Alginate or Chitosan alone (Yan, Khor, & Lim, 2001).A further advantage of this delivery system is its non-toxicity,which permits its administration to be repeated as a therapeuticagent. Alginate–Chitosan (Alg/Chi) microspheres or beads havebeen widely studied for the encapsulation of drugs, oligonucleo-tides, proteins and cells, with promising results (De and Robinson,2003). Despite the attractive properties of this system, its develop-ment and application in the submicron scale has rarely been stud-ied (Douglas & Tabrizian, 2005).
Because of the desirable characteristics and demonstrated suc-cess of the Alg/Chi system, the development and use of this systemon the submicron scale and its potential use as a gene carrier needsto be evaluated. Therefore, the purpose of this study was to opti-mize a method for the preparation of Alg/Chi nanoparticles bythe use of Box–Behnken methodology to design the most appropri-ate preparation method.
Antisense oligonucleotides (ODNs) targeted to the epidermalgrowth factor receptor (EGFR) was chosen as a single strand nu-cleic acid model which were entrapped in these optimized nano-particles; a receptor tyrosine kinase proto-oncogene that plays acentral role in the initiation and development of several humanmalignancies, notably breast, brain, and lung tumors (Arteaga,2002). For this purpose, Alg/Chi nanoparticles were prepared usingSodium Alginate and Calcium Chloride and adding Chitosan/Anti-sense solution to the pregel for preparing nanoparticles. The influ-ence of various experimental parameters on the formation ofnanoparticles, including different ratios of the biopolymers, Cal-cium Chloride/Alginate (CaCl2/Alg %) and N/P ratios (the stoichiom-etric ratio of antisense phosphate groups; P to Chitosan aminegroups; N) have been investigated. N/P ratio can affect zeta poten-tial, particle size, loading efficacy and also transfection efficacy ofantisense oligonucleotides (Kim & Kim, 2007), the subject is in pro-gress in my study and will be reported in our future paper. Thenanoparticulate formulation of EGFR antisense was optimizedusing design of experiments by employing response surfacemethodology.
Response surface methodology determines the optimum levelof each factor by building a mathematical model. Optimization ofparticle size and loading efficacy as the responses were carriedout by Box–Behnken response surface methodology.
2. Materials and methods
2.1. Materials
Sodium Alginate (BDH Co., UK), low molecular weight Chitosan(Sigma–Aldrich Co., Germany), and Calcium Chloride (Merck KGaACo., Germany), EGFR Phosphorothioated 21 mer antisense 50 (TTTCTT TTC CTC CAG AGC CCG) 30 (TIB MOL BIOL� GmbH, Germany)were purchased and used as received.
2.2. Nanoparticle preparation
2.2.1. Stock solutionsStock solution of Sodium Alginate and Calcium Chloride was
prepared by dissolving 500 mg of each material in 50 ml of deion-ized water, respectively. Five hundred milligrams of Chitosan wasthen dissolved in 50 ml of 1% (V/V) acetic acid. Freeze dried powderof EGFR antisense was dissolved with DEPC (diethylpyrocarbonate)treated water to make a 100 lM stock solution. All the stock solu-tions were filtered (0.22 lm syringe filter) prior to use.
2.2.2. Pregel preparation methodWith respect to Alg/Chi ratio a certain amount of Sodium Algi-
nate stock solution was diluted with 10 ml of filtered deionizedwater. Then 1 ml of Calcium Chloride solution adjusted to Ca/Alg% ratio was added drop wise to above solution while stirring. Theprepared Ca/Alg pregel was stirred for a further 10 min. Chitosansolutions were prepared according to N/P ratios and differentAlg/Chi ratios, as listed in Table 1. Then 5 ll of 100 lM of EGFRantisense solution was added to it. It was stirred for 10 min to becomplexed, then added drop wise to Calcium Alginate pregel, whilestirring. In cases where the pregel had large aggregates these werebroken up using bath sonicator. The pH of solution was adjusted to5.3 using 0.1 N NaOH solution, and was stirred for further 30 min.All samples were centrifuged at 1100 rpm for 15 min to removeany large aggregates prior to analysis. Centrifugation under theseconditions allowed aggregates to form pellet, leaving nanoparticlessuspended in the supernatant. The particle suspension was thencentrifuged at 25 �C in the Amicon� Ultra-15 (Ultracel-100K) cen-trifuge tube with 100 kDa cut off at 5000 rpm for 20 min to sepa-rate free polymers from nanoparticles. Nanoparticles in thedialysis tube were evaluated for their size and zeta potential. Thesolution collected in the outer tube was analyzed spectrophoto-metrically for loading efficacy.
2.3. Particle characterization
Nanoparticles size and zeta potential were assessed by photoncorrelation spectroscopy (PCS) using a Malvern zeta sizer ZS seriesand Scattering Particle Size Analyzer (Malvern Co., UK). For this, asample of 2 ml was sonicated for 2 min in the bath sonicator,placed in the analyzer chamber and measured immediately.
Nanoparticles morphology such as shape and occurrence ofaggregation phenomena was studied by SEM. For this, samples ofnanoparticles were mounted on metal stubs, plating coated undervacuum and then examined on a LEO1455 VP (10 kV Cambridge)scanning electron microscopy.
2.4. Loading efficacy
For quantitative determination of ODNs loading, samples werecentrifuged in an Amicon� Ultra-15 (Ultracel-100K Millipore Co.,USA) with a molecular weight cut off of 100 kDa to remove freemolecules of polymer and ODNs as well, which are not loaded inthe particles. The placebo particles were prepared separately touse as blank solution in subsequent spectrophotometrical analysis.Samples were centrifuged in Amicon� Ultra-15 (Ultracel-100K) for20 min at 5000 rpm, and then the absorbance of the solutions inthe tubes was measured at 260 nm using a UV/VIS spectrophotom-eter (Jasco V-530, Jasco Co., Japan). The amount of ODN associatedwith the nanoparticles was calculated by the difference betweenthe initial amount of ODN added to the Chitosan and the amountmeasured in the supernatant. The following equation was used todetermine the loading efficacy of the nanoparticles:

T. Gazori et al. / Carbohydrate Polymers 77 (2009) 599–606 601
Loading efficacy ðLE%Þ ¼ ODNtotal � ODNsupernant
ODNtotal� 100 ð1Þ
Douglas and Tabrizian (2005).
2.5. FTIR analysis
FTIR spectra were obtained using 8400S (Shimadzu Co., Japan)FTIR- spectrometer. Samples were dried in a vacuum desiccator,mixed with micronised KBr powder and compressed into discsusing a manual tablet press.
2.6. DSC analysis
DSC thermograms were obtained using (Shimadzu Co., Japan)DSC-60 system. Samples were dried in a vacuum desiccator,2.0 mg of the dried powder crimped in a standard aluminum panand heated from 20 to 350 �C at a heating rate of 10 �C/min underconstant purging of nitrogen.
2.7. Experimental design
Response surface methodology (RSM) as a statistical and math-ematical method fit the experimental data to the model for optimi-zation processes (Myers & Montgomery, 2002). A response surfacemethod, Box–Behnken experimental design (Box & Behnken, 1960)can be used to evaluate the relationship between the independentvariables and their responses as well as their interactions in aneffective model. In addition, this kind of experimental design candetect the curvature in the response, appropriately. Box–Behnkendesign needs only three levels in comparison to five levels of cen-tral composite design. Therefore, less experiment needs to be car-ried out.
Independent variables, including (Alg/Chi) ratio (A), CaCl2/Alg(%) (B) and N/P ratio (C) were defined in three levels (low, basaland high) coded: (�,0,+). According to the Box–Behnken designgenerated by Design-Expert (Version 7.0.0, Stat-Ease, Inc., Minne-apolis, MN, USA), 17 experiments including 12 factorial points withfive replicates at the center point for estimation of pure error sumof squares were employed. The codes, ranges of levels of the inde-pendent variables and the design matrix in coded were shown inTables 1 and 2, respectively. In Table 2, the values (Y1) and (Y2)for each run are the average of three responses.
Table 2Box–Behnken experimental design in various runs and the correspondent response.
Run no. Independent variables Dependent variables
A B C Y1 Y2
Particle size (nm) Loading efficacy (%)
1 0 0 0 906 46.72 0 �1 1 1090 44.53 1 0 �1 888 37.34 1 1 0 721 70.35 �1 1 0 315 97.86 �1 0 1 194 95.67 1 0 1 430 66.58 0 �1 �1 749 97.89 0 0 0 448 100.0
10 0 1 �1 414 98.911 0 0 0 1435 75.812 �1 0 �1 439 100.013 1 �1 0 800 85.214 0 0 0 548 85.715 0 0 0 777 83.016 �1 �1 0 954 81.317 0 1 1 750 83.5
The mathematical relationship of the responses (Y1,Y2) (particlesize and loading efficacy) and the independent variables (Xi) weremodeled by a second-order polynomial function as follows:
Y ¼ b0 þ b1X1 þ b2X2 þ b3X3 þ b11X21 þ b22X2
2 þ b33X23
þ b12X1X2 þ b13X1X3 þ b23X2X3 ð2Þ
where Y is the predicted response, b0, intercept, b1, b2 and b3, linearcoefficients, b11, b22 and b33, squared coefficients and b12, b13 andb23, the interaction coefficients of the equation and X1, X2 and X3
are the independent variables. Using this equation, it is possibleto evaluate the linear, quadratic and interactive effects of the inde-pendent variables on the responses appropriately.
The statistical analysis of the data through regression modeland plotting the response surface graphs were achieved by De-sign-Expert. ANOVA through Fisher’s test evaluated the significanteffect of the independent variables on the responses and fitted byp-value <0.05. The quality indicators for the fitness of the second-order polynomial model equation evaluated by multiple correla-tion coefficients (R2) and adjusted R2. In order to show the relation-ship and interaction between the coded variables and the responsegraphically, the three-dimensional surface plot or contour plotswere employed in this study. Both numerical and grid searchesin whole experimental regions were employed to find the opti-mized formulations by considering the constraints in which theparticle size is in its minimum and loading efficacy (%) in maxi-mum levels. Consequently, five optimized checkpoint formulationswere prepared and the experimental responses were compared bythe predicted values obtained by the equation to evaluate the pre-cision of the model.
3. Results and discussion
3.1. Nanoparticle size
Nanoparticles ranging from 194 to 1435 nm were obtainedthrough different 17 designed experiments in this study (Table2). SEM of spherical nanoparticles is shown in Fig. 1.
Nanoparticles were prepared by three different ratios of Alg/Chi,Calcium Chloride/Alginate (CaCl2/Alg) and N/P whilst pH was set at5.3 in all the experiments as Chitosan is intrinsically poorly watersoluble at neutral or alkaline pH, so its solution was prepared inacidic pH. Chitosan is likely to precipitate out from solution uponaddition of an Alginate in higher pH, resulting in less Chitosanavailable for nanoparticles formation. While the pKa of Chitosanis known to be 6.5 (Chellat et al., 2000), an Alginate solution of neu-tral pH, upon addition, would result in the majority of aminegroups of Chitosan being unprotonated and, therefore, unable toparticipate in ionic interactions with Alginate. A few protonatedgroups available for interaction would result in weaker electro-static interactions with the Alginate gel, leading to larger particlesizes to be produced. Using an Alginate solution with a slightlylower pH 5.3 resolves these problems by allowing a stronger inter-action between Chitosan and Alginate, leading to the formation ofmore compact nanoparticles (Douglas & Tabrizian, 2005). Someother researchers investigating Chitosan for the preparation ofnanoparticles, microparticles and polyionic systems have reportedworking around the same pH (5.0–6.3) (Barichello et al., 1999;Chellat et al., 2000; Douglas & Tabrizian, 2005).Within this rangethe carboxyl group of the Alginate is ionized and the amine groupof the Chitosan is protonated, which is most important for opti-mum interaction and the polyionic complex formation. Similarobservations have been reported in the formation of other polyion-ic complexes containing Chitosan (Sarmento, Ferreira, Veiga, &Ribeiro, 2006).

Fig. 1. SEM micrographs of Alginate/Chitosan nanoparticles produced with Alg/Chiratio of 1, CaCl2/Alg ratio of 0.2% and N/P ratio of 5 at pH 5.3.
602 T. Gazori et al. / Carbohydrate Polymers 77 (2009) 599–606
3.2. Determination of zeta potential
The stability of many colloidal systems is directly related to themagnitude of their zeta potential. In general, if the value of the par-ticle zeta potential is large, the colloidal system will be stable. Con-versely, if the particle zeta potential is relatively small, thecolloidal system will agglomerate. The surface charge of the parti-cles is of substantial importance in all the production steps of theseparticles because the efficiency of the different steps is directly re-lated to the establishment of electrostatic interactions.
Zeta potential of all the nanoparticles prepared was measuredby Malvern zeta sizer ZS (data not shown). Nanoparticles whichwere prepared by Alg/Chi ratio 1:1 showed zeta potential of about+30 mV. This relatively high positive value was due to cationic nat-ure of Chitosan and Alg/Chi ratio (De and Robinson, 2003; Douglas& Tabrizian, 2005).
Thus it has been suggested that the nanoparticles which wereprepared in optimum condition and mentioned above may be agood candidate for the delivery of oligonucleotide molecules be-cause of their positive zeta potential leading them to bind withthese molecules.
Table 3The analysis of variance table for particle size as the response (Y1).
Source Sum of squares df
Model 1312840.518 5B-CaCl2 250986.125 1C-N/P 353640.5 1BC 231361 1B2 161200.6579 1C2 340200.5329 1Residual 256633.7171 11Lack of fit 172232.9171 7Pure error 84400.8 4Cor. total 1569474.235 16
R2 0.84Adj. R2 0.76
a Significant at 0.05 level.
3.3. Box–Behnken design and response surface methodology
The Response surface methodology followed by Box–Behnkendesign was applied to find optimal level of independent vari-ables including Alg/Chi ratio, Ca/Alg (%) and N/P ratio shownin Table 2. The Design-Expert was used to design the matrixand statistical analysis. Table 1 represents factors in codedforms, the particle size and loading efficacy as the response.According to the data obtained by this design, the range of par-ticle size was found in the range of 194–1435 (nm) and the load-ing efficacy was 37–100%, respectively. To choose the best modelmatched with the data, the analysis of variance by calculating F-value was employed. As a result, for both responses a full qua-dratic second-order polynomial equation was fitted to the dataappropriately. The lack of fit F-value of 0.4673 and 0.4436 im-plied that the lack of fit was not significant in both responses,due to the pure error and showed adequacy of the models (Ta-bles 3 and 4). The multiple regression analysis by the softwareshowed that all the linear, squared and interaction coefficientsof the independent factors including Ca/Alg (%) and N/P ratiowere significant (p < 0.05) when particle size is considered asthe response (Table 3). Therefore, the equation fitted to the datawas presented as follows:
Y1 ¼ 739:16� 177:13X2 þ 210:25X3 � 240:50X2X3
þ 195:39X22 � 283:86X2
3 ð3Þ
where Y1 is the particle size, X2 and X3 are CaCl2/Alg and N/P ratio,respectively. As Table 3 shows, the coefficient of determination(R2) and adjusted R2 of this model were 0.84 and 0.76, respec-tively. This means that, 84% variability in the response will be ex-plained by this model. When loading efficacy was considered asthe response the results were much better. R2 and adjusted R2 ofthis model were 0.996 and 0.992, respectively (Table 4). Therefore,the similarity between R2 and adjusted R2 shows the adequacy ofthe model to predict the response by optimization process. Thepredicted R2 with the value of 0.972 showed very good agreementbetween the predicted value using the model and the experimen-tal data. In addition, the coefficient value of variation (CV% = 2.27)which was an estimate of the standard deviation associated withexperiment around the mean, showed more precision and reliabil-ity of the model. The plot of studentized residual versus the valuespredicted by the model showed no trend which indicating thehomogeneity of variance in the data and absence of outliers inthe experimental data (not shown). Hence, it can be concludedthat the following full quadratic second-order polynomial equationwas adequate to model the loading efficacy over the independentvariable ranges in this study:
Mean square F-Value p-Valuea Prob > F
262568.1036 11.25436 0.0005250986.125 10.75793 0.0073353640.5 15.15797 0.0025231361 9.916744 0.0093161200.6579 6.909487 0.0235340200.5329 14.58189 0.002823330.3379224604.70244 1.166089 0.467321100.2

Table 4The analysis of variance table for loading efficacy as the response (Y2).
Source Sum of squares df Mean square F-Value p-Valuea Prob > F
Model 6581.427551 9 731.2697279 224.2802 <0.0001A-polymer 449.2503125 1 449.2503125 137.785 <0.0001B-CaCl2 196.02 1 196.02 60.11928 <0.0001C-N/P 341.2578125 1 341.2578125 104.6637 <0.0001AB 309.76 1 309.76 95.00331 <0.0001AC 281.400625 1 281.400625 86.3055 <0.0001BC 160.0225 1 160.0225 49.07886 <0.0002A2 1544.699533 1 1544.699533 473.759 <0.0001B2 933.681375 1 933.681375 286.3598 <0.0001C2 2599.310059 1 2599.310059 797.2077 <0.0001Residual 22.823625 7 3.260517857Lack of fit 10.360625 3 3.453541667 1.108414 0.4436Pure error 12.463 4 3.11575Cor. total 6604.251176 16
R2 0.996Adj. R2 0.992Predicted R2 0.972
a Significant at 0.05 level.
T. Gazori et al. / Carbohydrate Polymers 77 (2009) 599–606 603
Y2 ¼ 83:72þ 7:49X1 þ 4:95X2 � 6:53X3 þ 8:80X1X2
þ 8:39X1X3 þ 6:32X2X3 � 19:15X21 � 14:89X2
2
þ 24:85X23 ð4Þ
where Y2 is loading efficacy, X1 is the polymer ratio, X2 is the CaCl2/Alginate (%) and X3 is the N/P ratio.
The 3D response surfaces plotted by Design-Expert software ofthe independent variables on both responses (Y1 and Y2) are shownin Figs. 2 and 3a–c. In each plot, the interaction of two variables wasinvestigated simultaneously while the third one was in its middlelevel value. As a result, in Fig. 2a, the response surface showed a cur-vature along the CaCl2 axis which indicates the statistical signifi-cance of quadratic coefficients of CaCl2/Alg in the model, whilethe polymer ratio seems to have no significant effect on the particlesize. The reduction of particle size with increasing CaCl2 amount re-acted with Alginate, from 0.1% to 0.2% was in line with the initialhypothesis and can be explained by what is known about the inter-action between Alginate and divalent cations. These cations bindpreferentially with guluronic acid blocks of the Alginate macromol-ecule due to their ‘‘Zig-Zag” structure that can more readily accom-modate those (Cafaggi et al., 2007). De and Robinson (2003)reported that insufficient interaction occurred below a mass ratioof (CaCl2/Alg 0.2%) to cause detectable gelation or microparticle for-mation occurred. In their study the mass ratio region of 0.2–0.6%,there was a sigmoidal increase in turbidity this is the region wheremaximum aggregation and gelation occurs due to cooperative bind-ing between Calcium ions and the Guluronic and Mannuronic acidresidues. While this weight ratio region is necessary to preparemicrospheres, it prevented the formation of nanospheres. It hasbeen postulated that the pregel state was necessary to enable theionic interactions between Alginate and Chitosan to form nano-sphere. Formation of nanospheres required a low concentration ofCaCl2 (less than 0.2% mass ratio) to form the negatively charged,Calcium Alginate pregel that was subsequently enveloped by thepositively charged Chitosan. Cationic polymers restrict furthercooperative binding between Calcium and Alginate ions.
As shown in Fig. 2b, the minimum levels of particle size weremeasured near low levels of both Alg/Chi and N/P ratio. IncreasingN/P ratio from 5 to 25 led to an increase in particle size from 315to749 nm. The zeta potential of nanoparticles at N/P ratio of 5was 25 mV. It was also reported that the zeta potential of nanopar-ticles increases in an N/P ratio-dependent manner. Briefly, all thenanoparticles appeared to have a positive surface charge and thezeta potential value above an N/P ratio of 5 was saturated. They re-ported that at N/P ratio of 5, ODN molecules were completely con-
densed (Kim & Kim, 2007). Saturation of nanoparticles withpositive surface charge may be the cause of increasing size of nano-particles with increasing N/P ratios. Kim and Kim also reportedthat in the case of water soluble Chitosan-based nanoparticlesloaded with IL-5 AS-ODN, particle size increased with increasingN/P ratio from 1 to 10.
The effect of Alg/Chi ratio and interaction effect of Alg/Chiand N/P ratios was not statistically significant (p > 0.05)(Fig. 2a). For the preparation of nanoparticles, polymers weightratios were selected according that reported by Douglas andco-workers (2005) to ensure that all batches of Alg/Chi nano-spheres had submicron size with the smallest possible size(Alg/Chi ratios of 1, 0.75 and 0.5). Within this range the func-tional groups of the polymers were coincided to their stoichiom-etric proportion. It was also reported that molecular weight ofpolymers had a great influence on particle size and that the1:1 polymer ratio at pH 5.3 could result in the smallest nanopar-ticle size. Furthermore, the 1:1.5 and 1.5:1 ratios also resulted insmall size compared to the other ratios they used, but in thisstudy there was no significant difference between the ratios of1, 0.75 and 0.5.
In Fig. 2c the curvature in both variables was quite obviouswhile, the direction of these curvatures was different. This couldbe predicted from the sign of X2
2 and X32 in Eq. (1). The convex
shape of the plot shown in Fig. 3a indicates that we could findthe optimum value (maximum value) for the response in the rangeof variables studied. The loading efficacy increased when both Alg/Chi ratio and CaCl2/Alg % increase to reach a maximum and thendecreased at the combination of the high level of variables. Thisobservation may be caused by decreasing capacity of nanoparticlesto encapsulate ODNs. Reducing the Alg/Chi ratio could causedecreasing electrostatic attraction and increasing Alg/Chi ratiocould lead to aggregation, so the optimum ratio needs to be foundto obtain the highest loading efficacy.
Motwani et al. (2008) also reported that Chitosan concentrationhad a negative effect on the loading efficacy, because at higher con-centrations Chitosan led to the formation of aggregates upon addi-tion of Alginate.
Fig. 3b shows that N/P ratio also affected the loading efficacy;it means that loading efficacy could be decreased from 97.8 to66.45 (%) with increasing the N/P ratio from 5 to 25. This maybe due to increasing particle size with increasing N/P ratio whichwas discussed above. With particle size reduction, the effectivesurface area increases, resulting in ODNs binding more efficientlyto the particles and leading to improvement in the loadingefficacy.
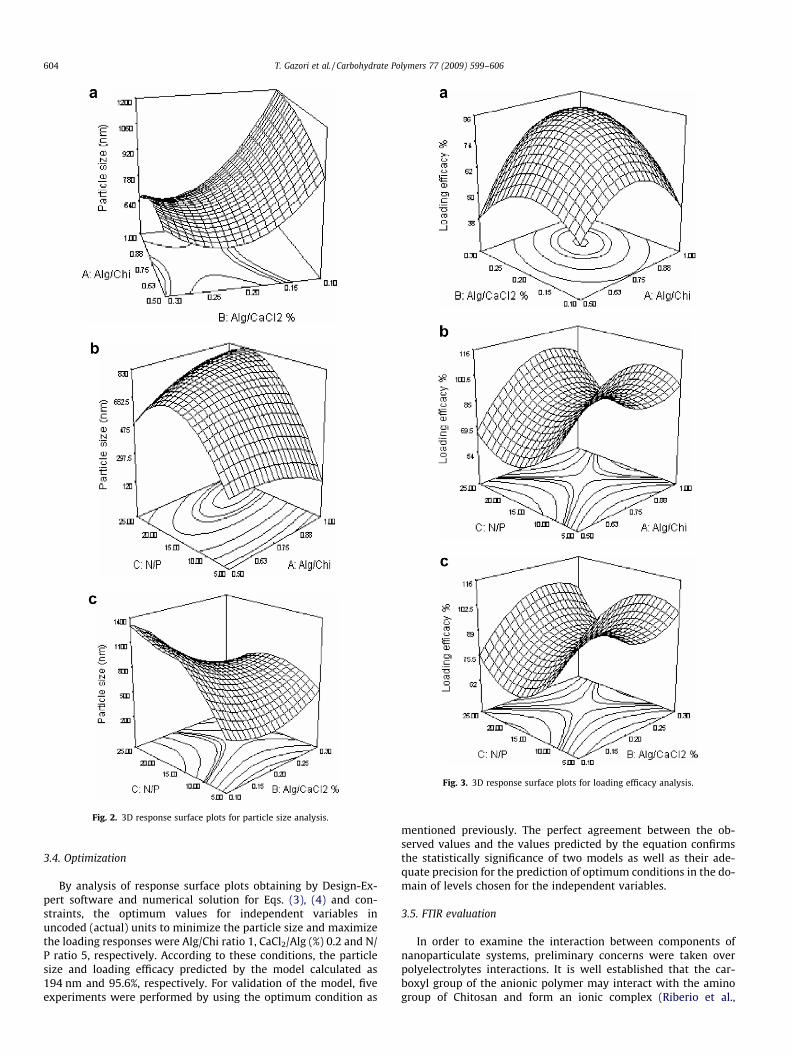
Fig. 2. 3D response surface plots for particle size analysis.
Fig. 3. 3D response surface plots for loading efficacy analysis.
604 T. Gazori et al. / Carbohydrate Polymers 77 (2009) 599–606
3.4. Optimization
By analysis of response surface plots obtaining by Design-Ex-pert software and numerical solution for Eqs. (3), (4) and con-straints, the optimum values for independent variables inuncoded (actual) units to minimize the particle size and maximizethe loading responses were Alg/Chi ratio 1, CaCl2/Alg (%) 0.2 and N/P ratio 5, respectively. According to these conditions, the particlesize and loading efficacy predicted by the model calculated as194 nm and 95.6%, respectively. For validation of the model, fiveexperiments were performed by using the optimum condition as
mentioned previously. The perfect agreement between the ob-served values and the values predicted by the equation confirmsthe statistically significance of two models as well as their ade-quate precision for the prediction of optimum conditions in the do-main of levels chosen for the independent variables.
3.5. FTIR evaluation
In order to examine the interaction between components ofnanoparticulate systems, preliminary concerns were taken overpolyelectrolytes interactions. It is well established that the car-boxyl group of the anionic polymer may interact with the aminogroup of Chitosan and form an ionic complex (Riberio et al.,
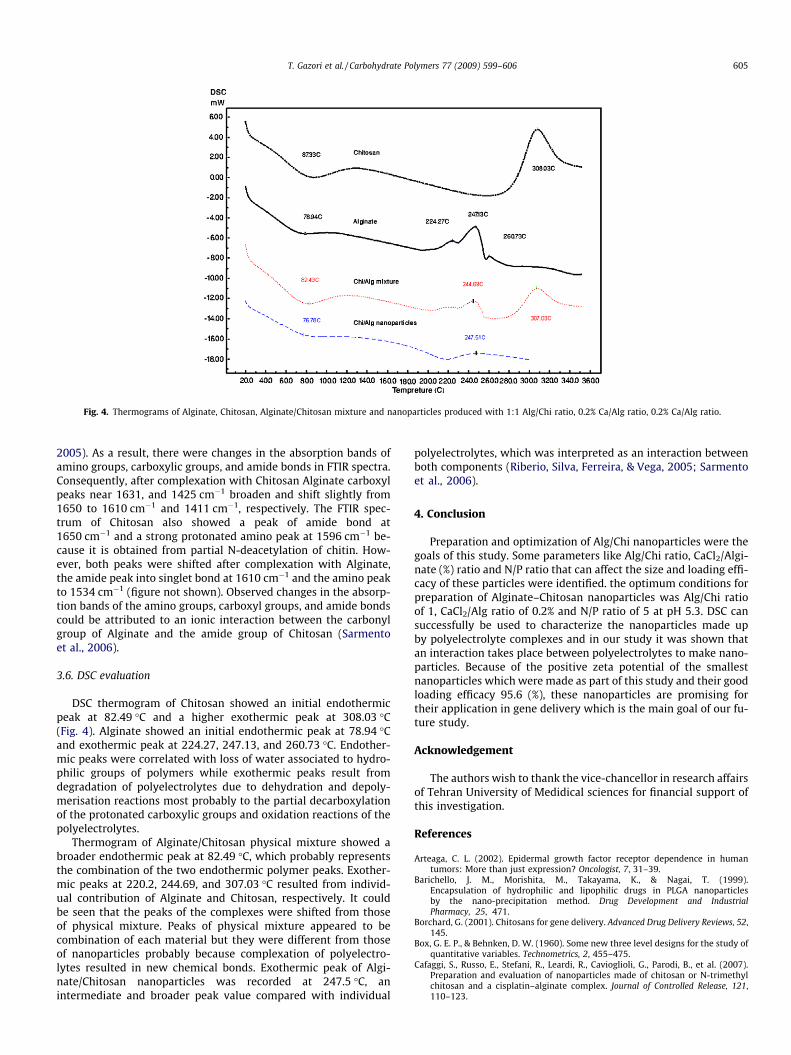
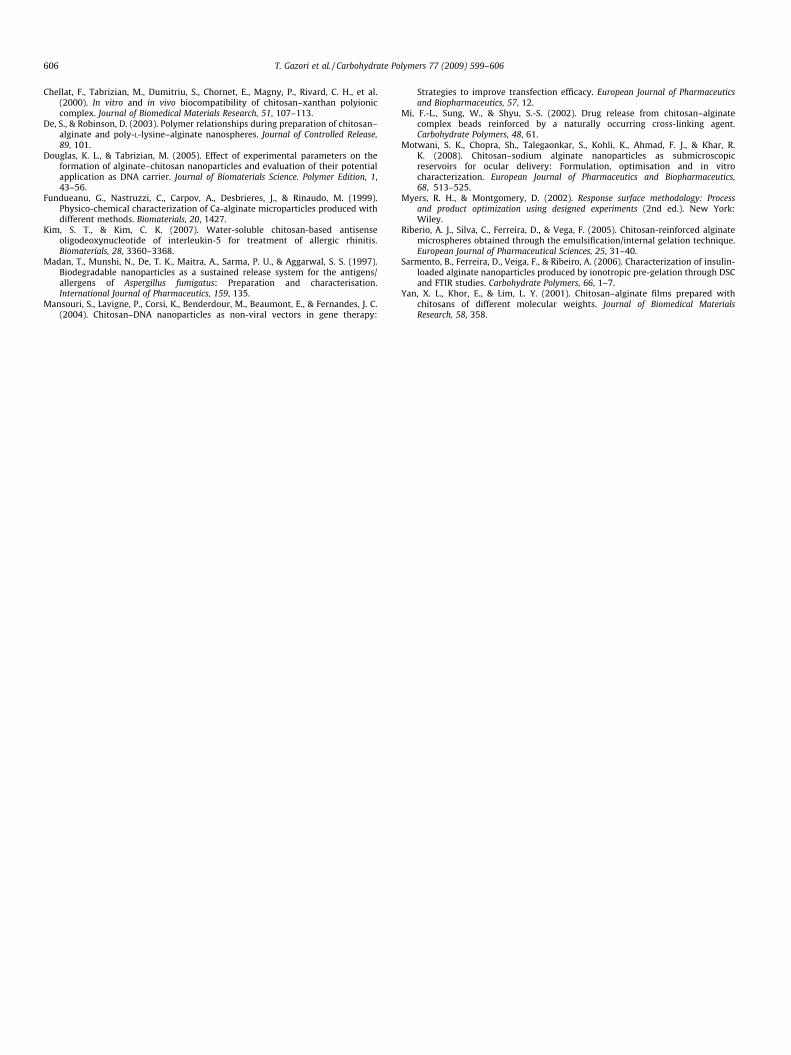
Fig. 4. Thermograms of Alginate, Chitosan, Alginate/Chitosan mixture and nanoparticles produced with 1:1 Alg/Chi ratio, 0.2% Ca/Alg ratio, 0.2% Ca/Alg ratio.
T. Gazori et al. / Carbohydrate Polymers 77 (2009) 599–606 605
2005). As a result, there were changes in the absorption bands ofamino groups, carboxylic groups, and amide bonds in FTIR spectra.Consequently, after complexation with Chitosan Alginate carboxylpeaks near 1631, and 1425 cm�1 broaden and shift slightly from1650 to 1610 cm�1 and 1411 cm�1, respectively. The FTIR spec-trum of Chitosan also showed a peak of amide bond at1650 cm�1 and a strong protonated amino peak at 1596 cm�1 be-cause it is obtained from partial N-deacetylation of chitin. How-ever, both peaks were shifted after complexation with Alginate,the amide peak into singlet bond at 1610 cm�1 and the amino peakto 1534 cm�1 (figure not shown). Observed changes in the absorp-tion bands of the amino groups, carboxyl groups, and amide bondscould be attributed to an ionic interaction between the carbonylgroup of Alginate and the amide group of Chitosan (Sarmentoet al., 2006).
3.6. DSC evaluation
DSC thermogram of Chitosan showed an initial endothermicpeak at 82.49 �C and a higher exothermic peak at 308.03 �C(Fig. 4). Alginate showed an initial endothermic peak at 78.94 �Cand exothermic peak at 224.27, 247.13, and 260.73 �C. Endother-mic peaks were correlated with loss of water associated to hydro-philic groups of polymers while exothermic peaks result fromdegradation of polyelectrolytes due to dehydration and depoly-merisation reactions most probably to the partial decarboxylationof the protonated carboxylic groups and oxidation reactions of thepolyelectrolytes.
Thermogram of Alginate/Chitosan physical mixture showed abroader endothermic peak at 82.49 �C, which probably representsthe combination of the two endothermic polymer peaks. Exother-mic peaks at 220.2, 244.69, and 307.03 �C resulted from individ-ual contribution of Alginate and Chitosan, respectively. It couldbe seen that the peaks of the complexes were shifted from thoseof physical mixture. Peaks of physical mixture appeared to becombination of each material but they were different from thoseof nanoparticles probably because complexation of polyelectro-lytes resulted in new chemical bonds. Exothermic peak of Algi-nate/Chitosan nanoparticles was recorded at 247.5 �C, anintermediate and broader peak value compared with individual
polyelectrolytes, which was interpreted as an interaction betweenboth components (Riberio, Silva, Ferreira, & Vega, 2005; Sarmentoet al., 2006).
4. Conclusion
Preparation and optimization of Alg/Chi nanoparticles were thegoals of this study. Some parameters like Alg/Chi ratio, CaCl2/Algi-nate (%) ratio and N/P ratio that can affect the size and loading effi-cacy of these particles were identified. the optimum conditions forpreparation of Alginate–Chitosan nanoparticles was Alg/Chi ratioof 1, CaCl2/Alg ratio of 0.2% and N/P ratio of 5 at pH 5.3. DSC cansuccessfully be used to characterize the nanoparticles made upby polyelectrolyte complexes and in our study it was shown thatan interaction takes place between polyelectrolytes to make nano-particles. Because of the positive zeta potential of the smallestnanoparticles which were made as part of this study and their goodloading efficacy 95.6 (%), these nanoparticles are promising fortheir application in gene delivery which is the main goal of our fu-ture study.
Acknowledgement
The authors wish to thank the vice-chancellor in research affairsof Tehran University of Medidical sciences for financial support ofthis investigation.
References
Arteaga, C. L. (2002). Epidermal growth factor receptor dependence in humantumors: More than just expression? Oncologist, 7, 31–39.
Barichello, J. M., Morishita, M., Takayama, K., & Nagai, T. (1999).Encapsulation of hydrophilic and lipophilic drugs in PLGA nanoparticlesby the nano-precipitation method. Drug Development and IndustrialPharmacy, 25, 471.
Borchard, G. (2001). Chitosans for gene delivery. Advanced Drug Delivery Reviews, 52,145.
Box, G. E. P., & Behnken, D. W. (1960). Some new three level designs for the study ofquantitative variables. Technometrics, 2, 455–475.
Cafaggi, S., Russo, E., Stefani, R., Leardi, R., Cavioglioli, G., Parodi, B., et al. (2007).Preparation and evaluation of nanoparticles made of chitosan or N-trimethylchitosan and a cisplatin–alginate complex. Journal of Controlled Release, 121,110–123.
606 T. Gazori et al. / Carbohydrate Polymers 77 (2009) 599–606
Chellat, F., Tabrizian, M., Dumitriu, S., Chornet, E., Magny, P., Rivard, C. H., et al.(2000). In vitro and in vivo biocompatibility of chitosan–xanthan polyioniccomplex. Journal of Biomedical Materials Research, 51, 107–113.
De, S., & Robinson, D. (2003). Polymer relationships during preparation of chitosan–alginate and poly-L-lysine–alginate nanospheres. Journal of Controlled Release,89, 101.
Douglas, K. L., & Tabrizian, M. (2005). Effect of experimental parameters on theformation of alginate–chitosan nanoparticles and evaluation of their potentialapplication as DNA carrier. Journal of Biomaterials Science. Polymer Edition, 1,43–56.
Fundueanu, G., Nastruzzi, C., Carpov, A., Desbrieres, J., & Rinaudo, M. (1999).Physico-chemical characterization of Ca-alginate microparticles produced withdifferent methods. Biomaterials, 20, 1427.
Kim, S. T., & Kim, C. K. (2007). Water-soluble chitosan-based antisenseoligodeoxynucleotide of interleukin-5 for treatment of allergic rhinitis.Biomaterials, 28, 3360–3368.
Madan, T., Munshi, N., De, T. K., Maitra, A., Sarma, P. U., & Aggarwal, S. S. (1997).Biodegradable nanoparticles as a sustained release system for the antigens/allergens of Aspergillus fumigatus: Preparation and characterisation.International Journal of Pharmaceutics, 159, 135.
Mansouri, S., Lavigne, P., Corsi, K., Benderdour, M., Beaumont, E., & Fernandes, J. C.(2004). Chitosan–DNA nanoparticles as non-viral vectors in gene therapy:
Strategies to improve transfection efficacy. European Journal of Pharmaceuticsand Biopharmaceutics, 57, 12.
Mi, F.-L., Sung, W., & Shyu, S.-S. (2002). Drug release from chitosan–alginatecomplex beads reinforced by a naturally occurring cross-linking agent.Carbohydrate Polymers, 48, 61.
Motwani, S. K., Chopra, Sh., Talegaonkar, S., Kohli, K., Ahmad, F. J., & Khar, R.K. (2008). Chitosan–sodium alginate nanoparticles as submicroscopicreservoirs for ocular delivery: Formulation, optimisation and in vitrocharacterization. European Journal of Pharmaceutics and Biopharmaceutics,68, 513–525.
Myers, R. H., & Montgomery, D. (2002). Response surface methodology: Processand product optimization using designed experiments (2nd ed.). New York:Wiley.
Riberio, A. J., Silva, C., Ferreira, D., & Vega, F. (2005). Chitosan-reinforced alginatemicrospheres obtained through the emulsification/internal gelation technique.European Journal of Pharmaceutical Sciences, 25, 31–40.
Sarmento, B., Ferreira, D., Veiga, F., & Ribeiro, A. (2006). Characterization of insulin-loaded alginate nanoparticles produced by ionotropic pre-gelation through DSCand FTIR studies. Carbohydrate Polymers, 66, 1–7.
Yan, X. L., Khor, E., & Lim, L. Y. (2001). Chitosan–alginate films prepared withchitosans of different molecular weights. Journal of Biomedical MaterialsResearch, 58, 358.