employee retention: causal analysis for non-profit ... - thaijo
TRANSCRIPT
121Employee Retention: Causal Analysis for Non-Profit Organizations in Thailand
* This paper is a part of the research ‘Employee Retention: Causal Analysis for Non-Profit Organizations in Thailand’** Graduate School of Public Administration, National Institute of Development Administration (NIDA).E-mail: [email protected]
Employee Retention: Causal Analysis for Non-Profit Organizations in Thailand*
Natthayanee Chantaplaboon**
Abstract
The purpose of this study is to explore the factors affecting employee’s intent to stay to work
for non-profit organizations. The studied employed documentary research and survey research methods.
The data was collected from 453 full-time employees who work in non-profit organizations. Majority
of employees work in non-profit organizations for about 4-6 years. Main income of the organizations
that the data was collected were from donation, others, government and fundraising activities in order
of the most to the least. The studied variables of human resource practices were opportunities for
learning, relationship with colleagues and supervisors, participation, job stress, and mission attachment.
They were found to relate with employee engagement and intent to stay. Employee engagement was
studied to be the mediated variable to intent to stay, and intent to stay as the dependent variables.
The causal model showed that opportunities for learning, relationship with colleagues and supervisors,
participation, job stress, mission attachment, and employee engagement had direct effect to intent
to stay. Opportunities for learning, relationship with colleagues and supervisors, participation, and
job stress had indirect effect to intent to stay through employee engagement. Most variables had a
positive relationship with total effect, while job stress had a negative effect. These relationships
suggested an organization to manage effectively in terms of job assignment and support. Organizations
should assign their employees jobs and tasks that are suitable for them. They should also enhance
their employees’ skills and knowledge by job performance and other training. Moreover, the feedback
is also important. It enhances the employees’ engagement as well as perception of being importance
in the organization. These practices were recommended in order to increase the employees’ intent
to stay. While doing the research, it was found that non-profit organizations are privately manage
accordingly to its mission and that are the reasons that lead an organization to administrate in certain
way. Future research hence can focus on types of non-profit organizations in Thailand. These different
types of organizations can also be further studied extensively in terms of factors affecting employees’
intent to stay.
Keywords: Non-profit organization, retention, human resource, engagement
122 วารสารการจดการภาครฐและภาคเอกชน
* บทความนเปนสวนหนงของงานวจยภาษาองกฤษ เรอง “Employee Retention: Causal Analysis for Non-Profit Organizations in Thailand”** คณะรฐประศาสนศาสตร สถาบนบณฑตพฒนบรหารศาสตรอเมล: [email protected]
การธำารงรกษาเจาหนาท: การวเคราะหเชงสาเหตในองคกรไมแสวงหากำาไรในประเทศไทย*
ณฏฐญาณ จนทพลาบรณ**
บทคดยอ
การศกษาเรอง “การธำารงรกษาเจาหนาท: การวเคราะหเชงสาเหตในองคกรไมแสวงหากำาไรในประเทศไทย”
มวตถประสงคเพอศกษาปจจยทสงผลตอความตงใจในการคงอยของเจาหนาทในองคกรไมแสวงหากำาไร การศกษาครง
นใชวธการวจยเอกสารและการวจยเชงสำารวจ เกบขอมลจากกลมตวอยาง 453 คน ซงเปนเจาหนาทประจำาในองคกร
ไมแสวงหากำาไร ผลการสำารวจพบวา กลมตวอยางสวนมากทำางานในองคกรไมแสวงหากำาไรนน ๆ มา 4-6 ป รายไดหลก
ขององคกรเรยงลำาดบจากมากไปหานอย มาจากการบรจาค รายไดอน ๆ รฐบาล และกจกรรมระดมทน ปจจยท
ศกษาสำาหรบการบรหารทรพยากรมนษยในองคกร ไดแก โอกาสในการเรยนร ความสมพนธทดกบเพอนรวมงานและ
ผบงคบบญชา การมสวนรวม ความเครยดในการทำางาน และความผกพนตอพนธกจ ปจจยเหลานสงผลตอความผกพน
ของเจาหนาท และความตงใจในการคงอยในองคกร ผลการวเคราะหโมเดลเชงสาเหตพบวา โอกาสในการเรยนร ความ
สมพนธทดกบเพอนรวมงานและผบงคบบญชา การมสวนรวม ความเครยดในการทำางาน และความผกพนตอพนธกจ
มความสมพนธทางตรงกบความตงใจในการคงอยของพนกงาน โอกาสในการเรยนร ความสมพนธทดกบเพอนรวมงาน
และผบงคบบญชา การมสวนรวม และความเครยดในการทำางาน มผลทางออมตอความตงใจในการคงอยของพนกงาน
จากความสมพนธดงกลาวสามารถเสนอแนวทางการบรหารงานองคกรไมแสวงหากำาไรไดโดยการมอบหมายงานและการ
สนบสนน การมอบหมายงาน ควรมอบหมายงานทเหมาะสมกบเจาหนาท สนบสนนใหเกดการพฒนาความรและทกษะ
ตาง ๆ สงเหลานจะชวยใหพนกงานมความประสงคจะอยในองคกรตอไป ซงระหวางการศกษาพบวา ลกษณะขององคกร
ไมแสวงหากำาไรนนมความหลากหลาย เนองจากเปนองคกรทดำาเนนการตามพนธกจเปนหลก ซงพนธกจของแตละองคกร
มความแตกตางกน สงนจงเปนประเดนทควรใหการศกษาอยางละเอยดตอไป
คำาสำาคญ: องคกรไมแสวงหากำาไร การธำารงรกษา ทรพยากรมนษย ความผกพน
123Employee Retention: Causal Analysis for Non-Profit Organizations in Thailand
Introduction
Employee retention is the most discussed topics in human resource management. It was long
studied in the field of business and for-profit organizations (e.g. Ramlall, 2004; Samuel & Chipunza,
2009). Later on, the topic was widely discussed in other professional career such as teacher retention
(e.g. Shen, 1997; Inman & Marlow, 2004), doctor retention (e.g. Hoyal, 1995), nurse retention (e.g.
Shields & Ward, 2001; Cangelosi, Markham, & Bounds, 2008), and those of public sector (e.g. Samuel &
Chipunza, 2009; Sadangharn, 2010). As this can be seen, employee retention is very important to the
organization because the cost of turnover is high to the organization. For examples, the organization
loses knowledge, skills, and experiences that the employee brings with them, and the cost to seeking
new employee as well as training.
Non-profit organization is similar to other sectors – they need human resource to perform
the organizational tasks. Moreover, non-profit organizations are playing important roles to society
recently. It serves as a gap filler to public services. For example, in Thailand, the foundations such
as Ruamkatanyu Foundation, Poh Teck Tung Foundation are often seen to help with the accidents.
Non-profit organizations also help to enhance people’s quality of life such as granting scholarships
for the good students to be able to study in higher education, the poor gets help with the food they
need. Having said this, non-profit organizations’ importance cannot be denied. In Thailand, the
number of non-profit organizations increased 17.2 percent in accordance with the last two surveys
(National Statistical Office, 2013). Even though the number caused interest and its important cannot be
denied, number of people working for non-profit organizations is going down (Armstrong et al., 2009).
The reasons from previous studied showed that the main income of the organizations were from
fundraising activities and donation. That forced non-profit organizations to operate in certain way,
and their main expense must be for the benefits of the public than the administration cost. Therefore,
it was perceived employees who work for non-profit organization work under stress and receive
low wages, and hence lead to turnover. This became challenges for non-profit organizations to retain
their staff. Since the roles of non-profit organizations become very important as it contributes benefits
to the society and enhances quality of lives, that is why employees in non-profit organizations should
be retained.
Objectives of the Study
1. To explore the current status of non-profit organizations in Thailand – that is to survey on
employees who work in non-profit organizations and the sources of organizational income.
2. To study factors affecting employees’ intent to stay focusing on human resource practices
and employee engagement.
124 วารสารการจดการภาครฐและภาคเอกชน
3. To develop a causal model of particular human resource practice – namely opportunities
for learning, relationship with supervisors and colleagues, participation, job stress, and mission
attachment; employee engagement; and intent to stay.
4. To suggest human resource practices that increase the level of employees’ intent to stay.
Literature Review
Employees retention in an organization was studied for a long time. It was studied in business
firms, in public organization, as well as non-profit organizations. To begin with, the idea of non-profit
organizations and its management are explained.
Different countries defined non-profit organizations in accordance with the countries’ laws
and regulations. In Thailand, the Office of the National Economic and Social Development Board (2010)
defined non-profit organizations as any entity or institution that operate for the public benefits. It must
be separate from the government although it can receive financial support for the government. It must
be self-governing and non-compulsory for their members to commit with time and money by laws.
According to the definition provided, non-profit organizations can be non-government organizations
(NGOs), arts and culture organizations, sports clubs, advocacy groups, foundations, community based
or grass roots associations, political parties, social clubs, unions, business and professional associations,
and religious congregations.
As stated earlier, non-profit organizations operate for the public benefits. Most of their
income must spend for charitable purposes. That forces non-profit organizations to manage differently,
in comparison to business firms or public organizations. There are three main types of employees in
non-profit organizations – paid employees, volunteers, and others (National Statistical Office, 2013).
Paid employees are employees who receive payment for their work (Leete, 2006). There
are three types of paid employees (National Statistical Office, 2013). First, full-time employees who
receive pay for their work continuously at the same time. The type of work done are routine. Second,
priests who receive position allowance. Third, employees who work temporarily and receive pay for
their performance.
Volunteers are the main resources of non-profit organizations (Worth, 2012). They are anyone
who devotes time, labor, knowledge, skills or money to the organization without getting financial
benefits in return. Worth (2012) classified two types of volunteers. First, volunteers who serve as
members such as governing board who help the organization without receiving any pay. The other
type is those who deliver services or programs without pay – so called service volunteer.
125Employee Retention: Causal Analysis for Non-Profit Organizations in Thailand
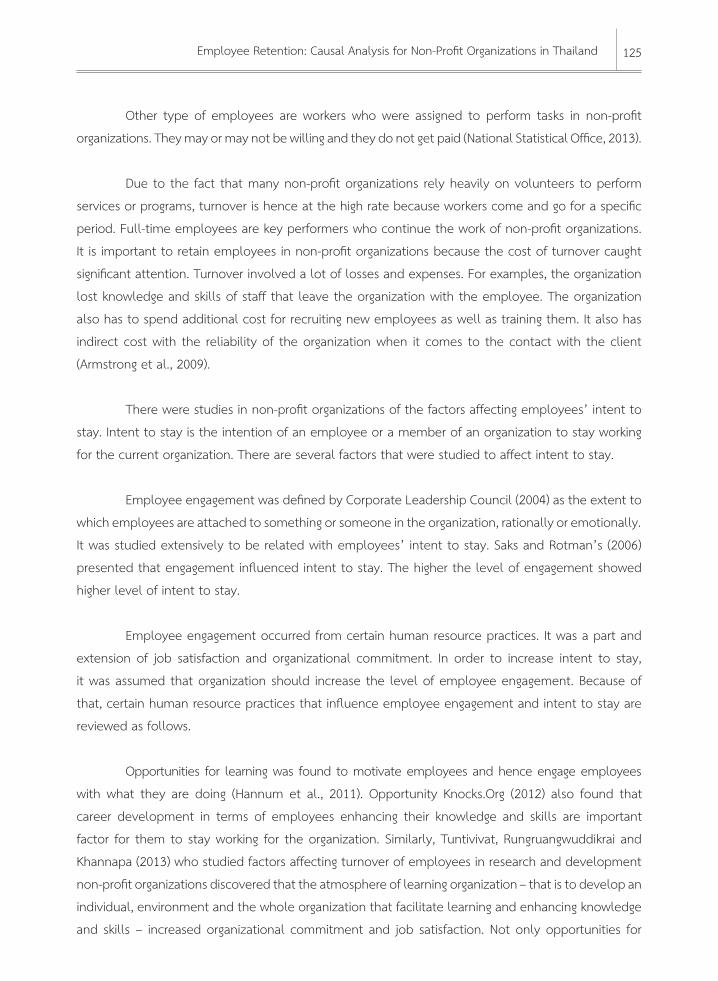
Other type of employees are workers who were assigned to perform tasks in non-profit
organizations. They may or may not be willing and they do not get paid (National Statistical Office, 2013).
Due to the fact that many non-profit organizations rely heavily on volunteers to perform
services or programs, turnover is hence at the high rate because workers come and go for a specific
period. Full-time employees are key performers who continue the work of non-profit organizations.
It is important to retain employees in non-profit organizations because the cost of turnover caught
significant attention. Turnover involved a lot of losses and expenses. For examples, the organization
lost knowledge and skills of staff that leave the organization with the employee. The organization
also has to spend additional cost for recruiting new employees as well as training them. It also has
indirect cost with the reliability of the organization when it comes to the contact with the client
(Armstrong et al., 2009).
There were studies in non-profit organizations of the factors affecting employees’ intent to
stay. Intent to stay is the intention of an employee or a member of an organization to stay working
for the current organization. There are several factors that were studied to affect intent to stay.
Employee engagement was defined by Corporate Leadership Council (2004) as the extent to
which employees are attached to something or someone in the organization, rationally or emotionally.
It was studied extensively to be related with employees’ intent to stay. Saks and Rotman’s (2006)
presented that engagement influenced intent to stay. The higher the level of engagement showed
higher level of intent to stay.
Employee engagement occurred from certain human resource practices. It was a part and
extension of job satisfaction and organizational commitment. In order to increase intent to stay,
it was assumed that organization should increase the level of employee engagement. Because of
that, certain human resource practices that influence employee engagement and intent to stay are
reviewed as follows.
Opportunities for learning was found to motivate employees and hence engage employees
with what they are doing (Hannum et al., 2011). Opportunity Knocks.Org (2012) also found that
career development in terms of employees enhancing their knowledge and skills are important
factor for them to stay working for the organization. Similarly, Tuntivivat, Rungruangwuddikrai and
Khannapa (2013) who studied factors affecting turnover of employees in research and development
non-profit organizations discovered that the atmosphere of learning organization – that is to develop an
individual, environment and the whole organization that facilitate learning and enhancing knowledge
and skills – increased organizational commitment and job satisfaction. Not only opportunities for
126 วารสารการจดการภาครฐและภาคเอกชน
learning engaged employees, it increases the tendency of working for the organization of employees.
As the Opportunity Knocks.Org (2012: 4) stated that ‘[n]on profit employees want to work in a place
where they can advance and develop skills’. Tuntivivat and Piriyakul (2015) also found out in their
study of 344 generation X workers of 32 nonprofit organizations within Bangkok metropolitan areas
that there was a direct effect between learning opportunities of employees in terms of learning
organization culture and intent to stay. The higher level of opportunities an employee has, the higher
their intent to stay.
Relationship with colleagues and supervisors were also important that will engage
employees and employees’ intent to stay. As Opportunity Knocks.Org (2012) found out that a positive
relationship in the organization highlighting the direct supervisor related positively to employee engagement.
Kim and Lee (2007) also found in their study that positive relationship and communication with
supervisor and co-worker will increase happiness of an employee which then leads to higher intent
to stay.
Participation refers to the practice that the organization encourages employees to be a
part of their work, of the organization. For example, employees take part in giving suggestions and
comments, decision making. That also include receiving feedback in what they do. Different scholar
used different terms for this such as Sweeney and McFarlin (1997) defined as ‘performance appraisal
and achievement’, while Kim and Lee (2007) defined as ‘feeling of appreciation’. They studied that
this practice engages employees and employees are likely to stay working for the organization.
Job stress was found to reduce the level of employee engagement and intent to stay.
Sarti (2014) reviewed the relationship between job stress and burnout and engagement. The author
presented that there was a negative relationship between them. The higher the job stress was
shown, the lower level of engagement. Supported by a study by the Association of Fundraising
Professionals (AFT) (2007), the organization demonstrated that stress from the demands of the job
determined employees to leave the organization. Likely, Armstrong, Bluitt-Fisher, Lopez-Newman, Paul
and Paul (2009) stated that working in non-profit organizations is stressful. The job itself is hard and
the demand of the job is high. The demand from the board, president and clients is high (Association
of Fundraising Professionals, 2007; Armstrong et al., 2009).
Mission attachment is the extent to which an employee attaches to the mission of the
organization. There were many studies that found the relationship of mission attachment to employee
engagement and intent to stay. For example, the Opportunity Knocks.Org (2012) found the significant
relationship between engagement and mission attachment. Brown and Yoshioka (2003) found out
that mission attachment increase employees’ intent to stay. The finding was confirmed by Kim and
127Employee Retention: Causal Analysis for Non-Profit Organizations in Thailand
Lee (2007) who replicated the study but used different sample group. Their finding demonstrated that
higher level of mission attachment increased employees’ intent to stay.
There were other factors that were found to be related with employee engagement and
employees’ intent to stay such as salary and benefits. Although it could not be denied that salary
and benefits were related to the employee engagement and intent to stay (Brown & Yoshioka, 2003;
Kim & Lee, 2007), it did not show either positive relationship. In other words, more salary and benefits
an employee received did not increase employee’s engagement or intent to stay. It was rather the
matter of there was or there was not, enough or not enough (Opportunity Knocks.Org, 2012).
Research Process
This study applied an obtrusive research method by first gathering data from various
sources such as library, online library, and so on. Then the researcher reviewed relevant documents
to obtain variables by grouping and categorizing variables. First, opportunities for learning included
in-house and outside training, the work environment that allow employees to enhance own skills,
as well as the job itself that challenges employee to develop oneself. Second, relationship with
colleagues and/or supervisors is the extent to which an employee receives support from colleagues
and/or supervisors including the level of positive personal relationship with them. Third, participation
can be work environment, management style that involve employee in a part of important decision-
making, a perception that an employee has of being a part of an organization through receiving
feedback. Fourth, job stress referred to work overload, responsibilities that an employee has to take
and emotional exhausted. Mission attachment referred to an emotional attachment towards the
mission of his or her organization. By that, she or he understands and believes in the organizational
mission. Employee engagement referred to the extent to which an employee attaches to both job and
organization, the willing to challenge something for the organization. Intent to stay referred to the
tendency of an employee to stay working for the organization. It involved the behavior of searching
for new jobs. Salary and benefits were not included in the study because it did not show the positive
or negative relationship between it and employee engagement or intent to stay. As stated earlier,
more salary and benefit an employee received did not increase the level of employee engagement
or intent to stay. It was rather the matter of enough or not enough. Therefore, the factor was not
included in this study.
Apart from grouping into variables, their relationships were also analyzed and the causal was
proposed as presented in the figure shown below.
128 วารสารการจดการภาครฐและภาคเอกชน
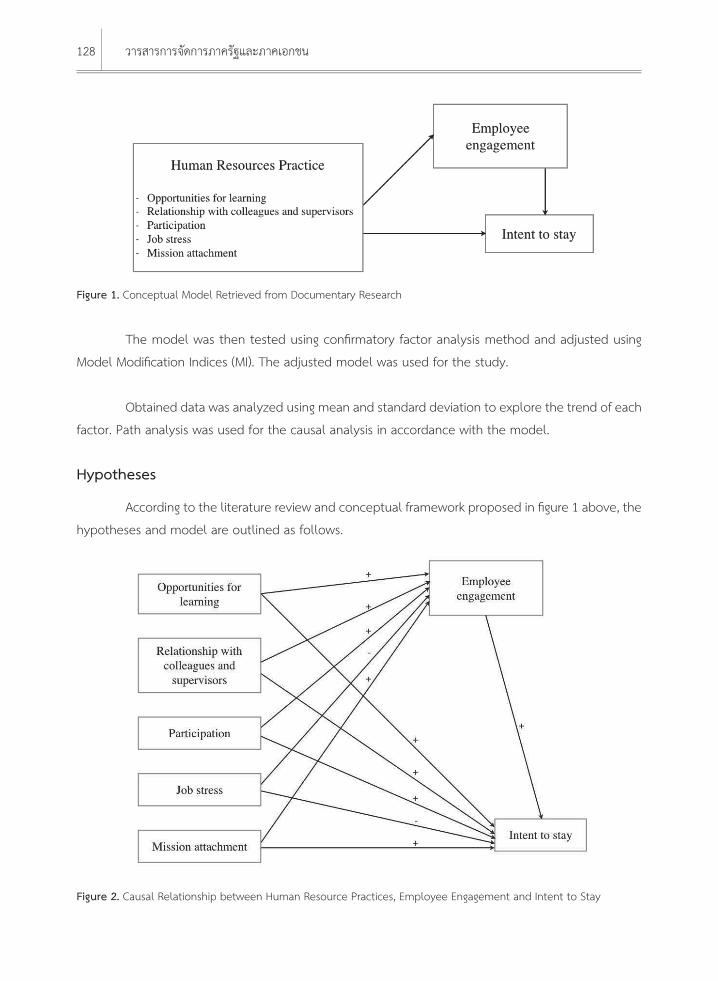
Figure 1. Conceptual Model Retrieved from Documentary Research
The model was then tested using confirmatory factor analysis method and adjusted using
Model Modification Indices (MI). The adjusted model was used for the study.
Obtained data was analyzed using mean and standard deviation to explore the trend of each
factor. Path analysis was used for the causal analysis in accordance with the model.
Hypotheses
According to the literature review and conceptual framework proposed in figure 1 above, the
hypotheses and model are outlined as follows.
7
Figure 1. Conceptual Model Retrieved from Documentary Research.
The model was then tested using confirmatory factor analysis method and adjusted using Model Modification Indices (MI). The adjusted model was used for the study.
Obtained data was analyzed using mean and standard deviation to explore the trend of each factor. Path analysis was used for the causal analysis in accordance with the model.
Hypotheses
According to the literature review and conceptual framework proposed in figure 1 above, the hypotheses and model are outlined as follows.
Figure 2. Causal Relationship between Human Resource Practices, Employee Engagement and Intent to Stay.
Figure 2. Causal Relationship between Human Resource Practices, Employee Engagement and Intent to Stay
129Employee Retention: Causal Analysis for Non-Profit Organizations in Thailand
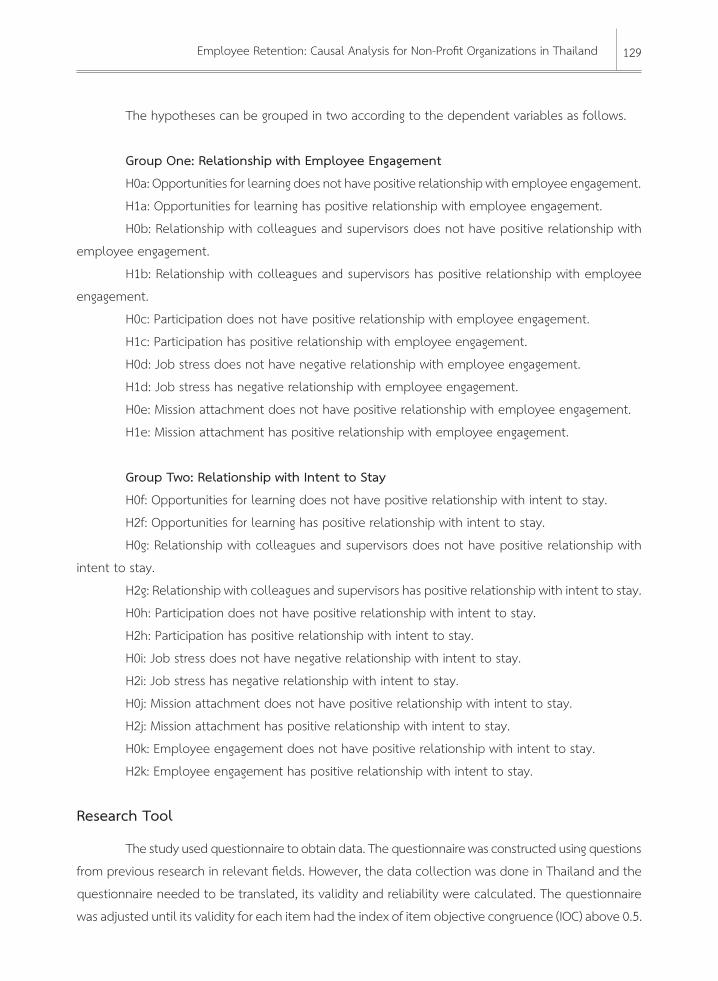
The hypotheses can be grouped in two according to the dependent variables as follows.
Group One: Relationship with Employee Engagement
H0a: Opportunities for learning does not have positive relationship with employee engagement.
H1a: Opportunities for learning has positive relationship with employee engagement.
H0b: Relationship with colleagues and supervisors does not have positive relationship with
employee engagement.
H1b: Relationship with colleagues and supervisors has positive relationship with employee
engagement.
H0c: Participation does not have positive relationship with employee engagement.
H1c: Participation has positive relationship with employee engagement.
H0d: Job stress does not have negative relationship with employee engagement.
H1d: Job stress has negative relationship with employee engagement.
H0e: Mission attachment does not have positive relationship with employee engagement.
H1e: Mission attachment has positive relationship with employee engagement.
Group Two: Relationship with Intent to Stay
H0f: Opportunities for learning does not have positive relationship with intent to stay.
H2f: Opportunities for learning has positive relationship with intent to stay.
H0g: Relationship with colleagues and supervisors does not have positive relationship with
intent to stay.
H2g: Relationship with colleagues and supervisors has positive relationship with intent to stay.
H0h: Participation does not have positive relationship with intent to stay.
H2h: Participation has positive relationship with intent to stay.
H0i: Job stress does not have negative relationship with intent to stay.
H2i: Job stress has negative relationship with intent to stay.
H0j: Mission attachment does not have positive relationship with intent to stay.
H2j: Mission attachment has positive relationship with intent to stay.
H0k: Employee engagement does not have positive relationship with intent to stay.
H2k: Employee engagement has positive relationship with intent to stay.
Research Tool
The study used questionnaire to obtain data. The questionnaire was constructed using questions
from previous research in relevant fields. However, the data collection was done in Thailand and the
questionnaire needed to be translated, its validity and reliability were calculated. The questionnaire
was adjusted until its validity for each item had the index of item objective congruence (IOC) above 0.5.
130 วารสารการจดการภาครฐและภาคเอกชน
Then its reliability was tested with 50 employees who fitted the same criteria as the sample but were
not included in the sample group. The result of reliability test showed Cronbach’s Alpha level of .897.
The questionnaire consisted of three parts. First part was to obtain general information in
order to analyze the status of the employees in non-profit organizations in Thailand. It contained two
questions regarding working tenure and source of main income of the organization. Second part was to
obtain information regarding employees’ perception and feelings on human resource practices, their
engagement and intent to stay. There were total of seven factors with thirty-seven items – eight of
them were reverted scale. The questionnaire used five point Likert scale from five (strongly agree) to
one (strongly disagree). Third part was open-ended questions consisting of three questions in regards
to other reasons that an employee wants or not want to work in the organization as well as other
comments.
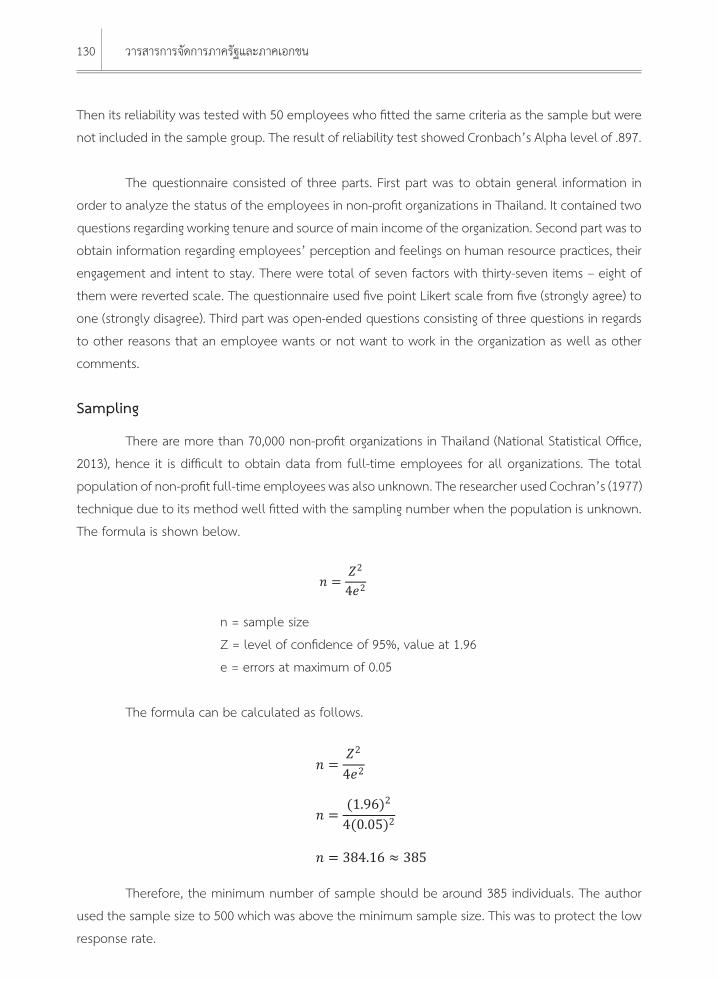
Sampling
There are more than 70,000 non-profit organizations in Thailand (National Statistical Office,
2013), hence it is difficult to obtain data from full-time employees for all organizations. The total
population of non-profit full-time employees was also unknown. The researcher used Cochran’s (1977)
technique due to its method well fitted with the sampling number when the population is unknown.
The formula is shown below.
9
H2k: Employee engagement has positive relationship with intent to stay.
Research Tool
The study used questionnaire to obtain data. The questionnaire was constructed using questions from previous research in relevant fields. However, the data collection was done in Thailand and the questionnaire needed to be translated, its validity and reliability were calculated. The questionnaire was adjusted until its validity for each item had the index of item objective congruence (IOC) above 0.5. Then its reliability was tested with 50 employees who fitted the same criteria as the sample but were not included in the sample group. The result of reliability test showed Cronbach’s Alpha level of .897.
The questionnaire consisted of three parts. First part was to obtain general information in order to analyze the status of the employees in non-profit organizations in Thailand. It contained two questions regarding working tenure and source of main income of the organization. Second part was to obtain information regarding employees’ perception and feelings on human resource practices, their engagement and intent to stay. There were total of seven factors with thirty-seven items – eight of them were reverted scale. The questionnaire used five point Likert scale from five (strongly agree) to one (strongly disagree). Third part was open-ended questions consisting of three questions in regards to other reasons that an employee wants or not want to work in the organization as well as other comments.
Sampling
There are more than 70,000 non-profit organizations in Thailand (National StatisticalOffice, 2013), hence it is difficult to obtain data from full-time employees for all organizations. The total population of non-profit full-time employees was also unknown. The researcher used Cochran’s (1977) technique due to its method well fitted with the sampling number when the population is unknown. The formula is shown below.
𝑛𝑛 𝑍𝑍𝑒𝑒
n = sample size Z = level of confidence of 95%, value at 1.96 e = errors at maximum of 0.05
The formula can be calculated as follows.
𝑛𝑛 𝑍𝑍𝑒𝑒
𝑛𝑛
𝑛𝑛 ≈
Therefore, the minimum number of sample should be around 385 individuals. The author used the sample size to 500 which was above the minimum sample size. This was to protect the low response rate.
n = sample size
Z = level of confidence of 95%, value at 1.96
e = errors at maximum of 0.05
The formula can be calculated as follows.
9
H2k: Employee engagement has positive relationship with intent to stay.
Research Tool
The study used questionnaire to obtain data. The questionnaire was constructed using questions from previous research in relevant fields. However, the data collection was done in Thailand and the questionnaire needed to be translated, its validity and reliability were calculated. The questionnaire was adjusted until its validity for each item had the index of item objective congruence (IOC) above 0.5. Then its reliability was tested with 50 employees who fitted the same criteria as the sample but were not included in the sample group. The result of reliability test showed Cronbach’s Alpha level of .897.
The questionnaire consisted of three parts. First part was to obtain general information in order to analyze the status of the employees in non-profit organizations in Thailand. It contained two questions regarding working tenure and source of main income of the organization. Second part was to obtain information regarding employees’ perception and feelings on human resource practices, their engagement and intent to stay. There were total of seven factors with thirty-seven items – eight of them were reverted scale. The questionnaire used five point Likert scale from five (strongly agree) to one (strongly disagree). Third part was open-ended questions consisting of three questions in regards to other reasons that an employee wants or not want to work in the organization as well as other comments.
Sampling
There are more than 70,000 non-profit organizations in Thailand (National StatisticalOffice, 2013), hence it is difficult to obtain data from full-time employees for all organizations. The total population of non-profit full-time employees was also unknown. The researcher used Cochran’s (1977) technique due to its method well fitted with the sampling number when the population is unknown. The formula is shown below.
𝑛𝑛 𝑍𝑍𝑒𝑒
n = sample size Z = level of confidence of 95%, value at 1.96 e = errors at maximum of 0.05
The formula can be calculated as follows.
𝑛𝑛 𝑍𝑍𝑒𝑒
𝑛𝑛
𝑛𝑛 ≈
Therefore, the minimum number of sample should be around 385 individuals. The author used the sample size to 500 which was above the minimum sample size. This was to protect the low response rate.
Therefore, the minimum number of sample should be around 385 individuals. The author
used the sample size to 500 which was above the minimum sample size. This was to protect the low
response rate.
131Employee Retention: Causal Analysis for Non-Profit Organizations in Thailand
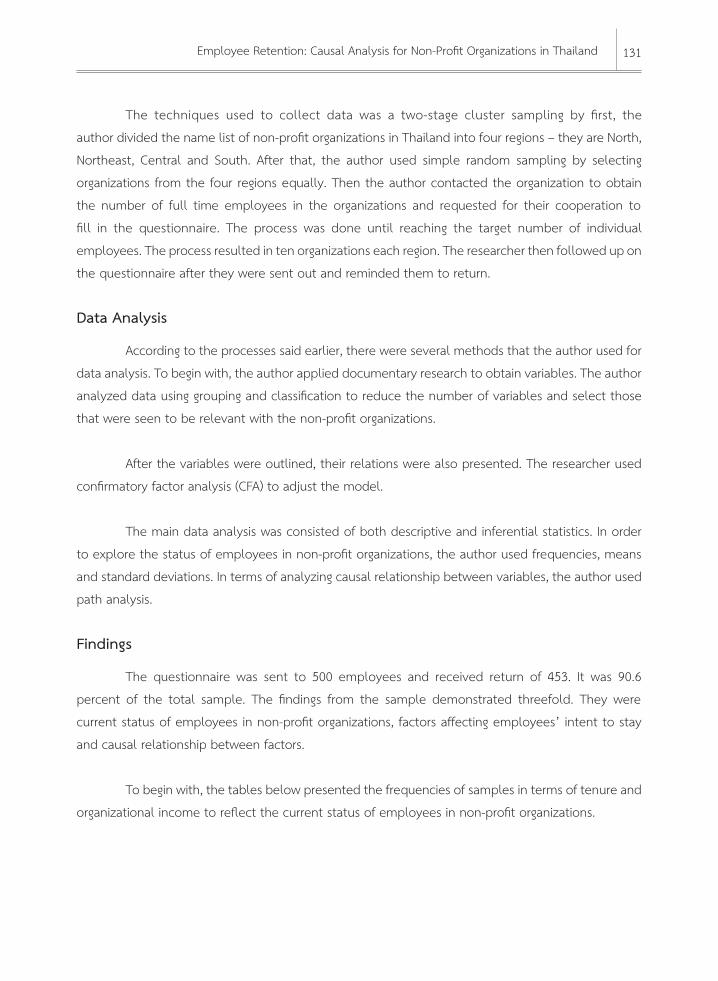
The techniques used to collect data was a two-stage cluster sampling by first, the
author divided the name list of non-profit organizations in Thailand into four regions – they are North,
Northeast, Central and South. After that, the author used simple random sampling by selecting
organizations from the four regions equally. Then the author contacted the organization to obtain
the number of full time employees in the organizations and requested for their cooperation to
fill in the questionnaire. The process was done until reaching the target number of individual
employees. The process resulted in ten organizations each region. The researcher then followed up on
the questionnaire after they were sent out and reminded them to return.
Data Analysis
According to the processes said earlier, there were several methods that the author used for
data analysis. To begin with, the author applied documentary research to obtain variables. The author
analyzed data using grouping and classification to reduce the number of variables and select those
that were seen to be relevant with the non-profit organizations.
After the variables were outlined, their relations were also presented. The researcher used
confirmatory factor analysis (CFA) to adjust the model.
The main data analysis was consisted of both descriptive and inferential statistics. In order
to explore the status of employees in non-profit organizations, the author used frequencies, means
and standard deviations. In terms of analyzing causal relationship between variables, the author used
path analysis.
Findings
The questionnaire was sent to 500 employees and received return of 453. It was 90.6
percent of the total sample. The findings from the sample demonstrated threefold. They were
current status of employees in non-profit organizations, factors affecting employees’ intent to stay
and causal relationship between factors.
To begin with, the tables below presented the frequencies of samples in terms of tenure and
organizational income to reflect the current status of employees in non-profit organizations.
132 วารสารการจดการภาครฐและภาคเอกชน
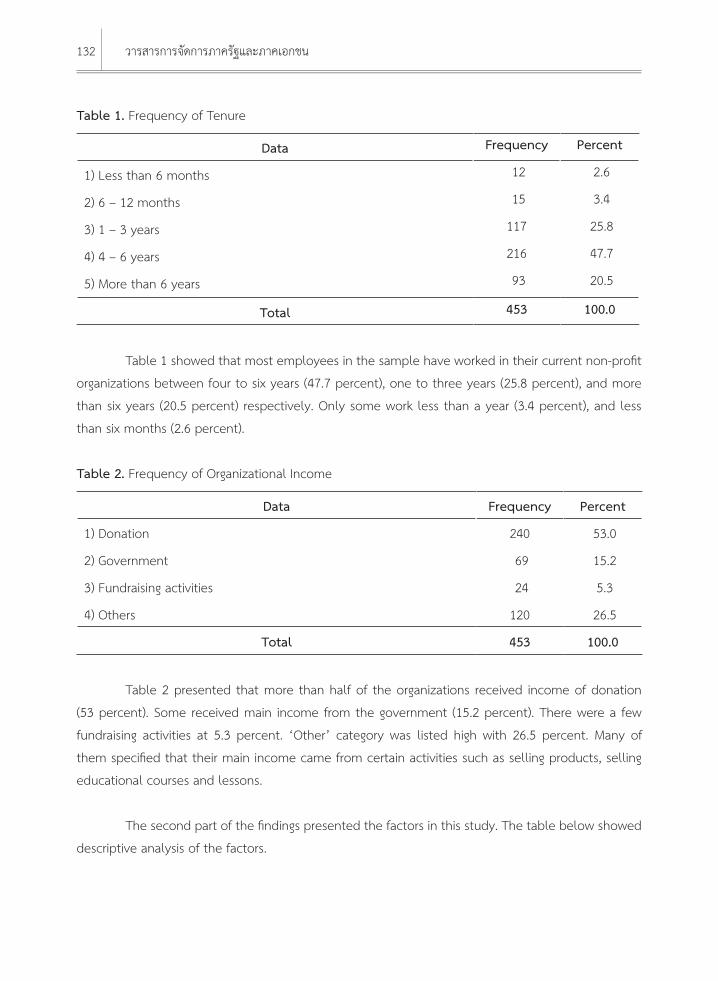
Table 1. Frequency of Tenure
Data Frequency Percent
1) Less than 6 months 12 2.6
2) 6 – 12 months 15 3.4
3) 1 – 3 years 117 25.8
4) 4 – 6 years 216 47.7
5) More than 6 years 93 20.5
Total 453 100.0
Table 1 showed that most employees in the sample have worked in their current non-profit
organizations between four to six years (47.7 percent), one to three years (25.8 percent), and more
than six years (20.5 percent) respectively. Only some work less than a year (3.4 percent), and less
than six months (2.6 percent).
Table 2. Frequency of Organizational Income
Data Frequency Percent
1) Donation 240 53.0
2) Government 69 15.2
3) Fundraising activities 24 5.3
4) Others 120 26.5
Total 453 100.0
Table 2 presented that more than half of the organizations received income of donation
(53 percent). Some received main income from the government (15.2 percent). There were a few
fundraising activities at 5.3 percent. ‘Other’ category was listed high with 26.5 percent. Many of
them specified that their main income came from certain activities such as selling products, selling
educational courses and lessons.
The second part of the findings presented the factors in this study. The table below showed
descriptive analysis of the factors.
133Employee Retention: Causal Analysis for Non-Profit Organizations in Thailand
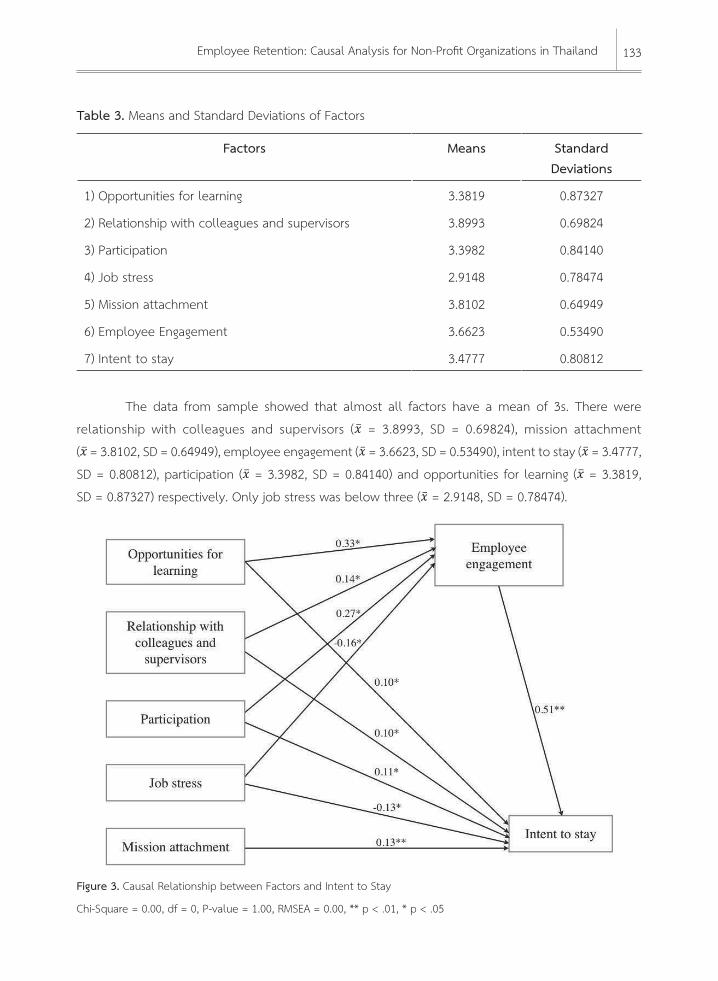
Table 3. Means and Standard Deviations of Factors
Factors Means Standard Deviations
1) Opportunities for learning 3.3819 0.87327
2) Relationship with colleagues and supervisors 3.8993 0.69824
3) Participation 3.3982 0.84140
4) Job stress 2.9148 0.78474
5) Mission attachment 3.8102 0.64949
6) Employee Engagement 3.6623 0.53490
7) Intent to stay 3.4777 0.80812
The data from sample showed that almost all factors have a mean of 3s. There were
relationship with colleagues and supervisors (
11
Table 2. Frequency of Organizational Income Data Frequency Percent
1) Donation 240 53.02) Government 69 15.23) Fundraising activities 24 5.34) Others 120 26.5
Total 453 100.0
Table 2 presented that more than half of the organizations received income of donation (53 percent). Some received main income from the government (15.2 percent). There were a few fundraising activities at 5.3 percent. ‘Other’ category was listed high with 26.5 percent. Many of them specified that their main income came from certain activities such as selling products, selling educational courses and lessons.
The second part of the findings presented the factors in this study. The table below showed descriptive analysis of the factors.
Table 3. Means and Standard Deviations of Factors Factors Means Standard
Deviations1) Opportunities for learning 3.3819 0.873272) Relationship with colleagues and supervisors 3.8993 0.698243) Participation 3.3982 0.841404) Job stress 2.9148 0.784745) Mission attachment 3.8102 0.649496) Employee Engagement 3.6623 0.534907) Intent to stay 3.4777 0.80812
The data from sample showed that almost all factors have a mean of 3s. There were relationship with colleagues and supervisors (𝑥𝑥𝑥 = 3.8993, SD = 0.69824), mission attachment (𝑥𝑥𝑥= 3.8102, SD = 0.64949), employee engagement (𝑥𝑥𝑥 = 3.6623, SD = 0.53490), intent to stay (𝑥𝑥𝑥 =3.4777, SD = 0.80812), participation (𝑥𝑥𝑥 = 3.3982, SD = 0.84140) and opportunities for learning (𝑥𝑥𝑥 = 3.3819, SD = 0.87327) respectively. Only job stress was below three (𝑥𝑥𝑥 = 2.9148, SD = 0.78474).
= 3.8993, SD = 0.69824), mission attachment
(
11
Table 2. Frequency of Organizational Income Data Frequency Percent
1) Donation 240 53.02) Government 69 15.23) Fundraising activities 24 5.34) Others 120 26.5
Total 453 100.0
Table 2 presented that more than half of the organizations received income of donation (53 percent). Some received main income from the government (15.2 percent). There were a few fundraising activities at 5.3 percent. ‘Other’ category was listed high with 26.5 percent. Many of them specified that their main income came from certain activities such as selling products, selling educational courses and lessons.
The second part of the findings presented the factors in this study. The table below showed descriptive analysis of the factors.
Table 3. Means and Standard Deviations of Factors Factors Means Standard
Deviations1) Opportunities for learning 3.3819 0.873272) Relationship with colleagues and supervisors 3.8993 0.698243) Participation 3.3982 0.841404) Job stress 2.9148 0.784745) Mission attachment 3.8102 0.649496) Employee Engagement 3.6623 0.534907) Intent to stay 3.4777 0.80812
The data from sample showed that almost all factors have a mean of 3s. There were relationship with colleagues and supervisors (𝑥𝑥𝑥 = 3.8993, SD = 0.69824), mission attachment (𝑥𝑥𝑥= 3.8102, SD = 0.64949), employee engagement (𝑥𝑥𝑥 = 3.6623, SD = 0.53490), intent to stay (𝑥𝑥𝑥 =3.4777, SD = 0.80812), participation (𝑥𝑥𝑥 = 3.3982, SD = 0.84140) and opportunities for learning (𝑥𝑥𝑥 = 3.3819, SD = 0.87327) respectively. Only job stress was below three (𝑥𝑥𝑥 = 2.9148, SD = 0.78474).
= 3.8102, SD = 0.64949), employee engagement (
11
Table 2. Frequency of Organizational Income Data Frequency Percent
1) Donation 240 53.02) Government 69 15.23) Fundraising activities 24 5.34) Others 120 26.5
Total 453 100.0
Table 2 presented that more than half of the organizations received income of donation (53 percent). Some received main income from the government (15.2 percent). There were a few fundraising activities at 5.3 percent. ‘Other’ category was listed high with 26.5 percent. Many of them specified that their main income came from certain activities such as selling products, selling educational courses and lessons.
The second part of the findings presented the factors in this study. The table below showed descriptive analysis of the factors.
Table 3. Means and Standard Deviations of Factors Factors Means Standard
Deviations1) Opportunities for learning 3.3819 0.873272) Relationship with colleagues and supervisors 3.8993 0.698243) Participation 3.3982 0.841404) Job stress 2.9148 0.784745) Mission attachment 3.8102 0.649496) Employee Engagement 3.6623 0.534907) Intent to stay 3.4777 0.80812
The data from sample showed that almost all factors have a mean of 3s. There were relationship with colleagues and supervisors (𝑥𝑥𝑥 = 3.8993, SD = 0.69824), mission attachment (𝑥𝑥𝑥= 3.8102, SD = 0.64949), employee engagement (𝑥𝑥𝑥 = 3.6623, SD = 0.53490), intent to stay (𝑥𝑥𝑥 =3.4777, SD = 0.80812), participation (𝑥𝑥𝑥 = 3.3982, SD = 0.84140) and opportunities for learning (𝑥𝑥𝑥 = 3.3819, SD = 0.87327) respectively. Only job stress was below three (𝑥𝑥𝑥 = 2.9148, SD = 0.78474).
= 3.6623, SD = 0.53490), intent to stay (
11
Table 2. Frequency of Organizational Income Data Frequency Percent
1) Donation 240 53.02) Government 69 15.23) Fundraising activities 24 5.34) Others 120 26.5
Total 453 100.0
Table 2 presented that more than half of the organizations received income of donation (53 percent). Some received main income from the government (15.2 percent). There were a few fundraising activities at 5.3 percent. ‘Other’ category was listed high with 26.5 percent. Many of them specified that their main income came from certain activities such as selling products, selling educational courses and lessons.
The second part of the findings presented the factors in this study. The table below showed descriptive analysis of the factors.
Table 3. Means and Standard Deviations of Factors Factors Means Standard
Deviations1) Opportunities for learning 3.3819 0.873272) Relationship with colleagues and supervisors 3.8993 0.698243) Participation 3.3982 0.841404) Job stress 2.9148 0.784745) Mission attachment 3.8102 0.649496) Employee Engagement 3.6623 0.534907) Intent to stay 3.4777 0.80812
The data from sample showed that almost all factors have a mean of 3s. There were relationship with colleagues and supervisors (𝑥𝑥𝑥 = 3.8993, SD = 0.69824), mission attachment (𝑥𝑥𝑥= 3.8102, SD = 0.64949), employee engagement (𝑥𝑥𝑥 = 3.6623, SD = 0.53490), intent to stay (𝑥𝑥𝑥 =3.4777, SD = 0.80812), participation (𝑥𝑥𝑥 = 3.3982, SD = 0.84140) and opportunities for learning (𝑥𝑥𝑥 = 3.3819, SD = 0.87327) respectively. Only job stress was below three (𝑥𝑥𝑥 = 2.9148, SD = 0.78474).
= 3.4777,
SD = 0.80812), participation (
11
Table 2. Frequency of Organizational Income Data Frequency Percent
1) Donation 240 53.02) Government 69 15.23) Fundraising activities 24 5.34) Others 120 26.5
Total 453 100.0
Table 2 presented that more than half of the organizations received income of donation (53 percent). Some received main income from the government (15.2 percent). There were a few fundraising activities at 5.3 percent. ‘Other’ category was listed high with 26.5 percent. Many of them specified that their main income came from certain activities such as selling products, selling educational courses and lessons.
The second part of the findings presented the factors in this study. The table below showed descriptive analysis of the factors.
Table 3. Means and Standard Deviations of Factors Factors Means Standard
Deviations1) Opportunities for learning 3.3819 0.873272) Relationship with colleagues and supervisors 3.8993 0.698243) Participation 3.3982 0.841404) Job stress 2.9148 0.784745) Mission attachment 3.8102 0.649496) Employee Engagement 3.6623 0.534907) Intent to stay 3.4777 0.80812
The data from sample showed that almost all factors have a mean of 3s. There were relationship with colleagues and supervisors (𝑥𝑥𝑥 = 3.8993, SD = 0.69824), mission attachment (𝑥𝑥𝑥= 3.8102, SD = 0.64949), employee engagement (𝑥𝑥𝑥 = 3.6623, SD = 0.53490), intent to stay (𝑥𝑥𝑥 =3.4777, SD = 0.80812), participation (𝑥𝑥𝑥 = 3.3982, SD = 0.84140) and opportunities for learning (𝑥𝑥𝑥 = 3.3819, SD = 0.87327) respectively. Only job stress was below three (𝑥𝑥𝑥 = 2.9148, SD = 0.78474).
= 3.3982, SD = 0.84140) and opportunities for learning (
11
Table 2. Frequency of Organizational Income Data Frequency Percent
1) Donation 240 53.02) Government 69 15.23) Fundraising activities 24 5.34) Others 120 26.5
Total 453 100.0
Table 2 presented that more than half of the organizations received income of donation (53 percent). Some received main income from the government (15.2 percent). There were a few fundraising activities at 5.3 percent. ‘Other’ category was listed high with 26.5 percent. Many of them specified that their main income came from certain activities such as selling products, selling educational courses and lessons.
The second part of the findings presented the factors in this study. The table below showed descriptive analysis of the factors.
Table 3. Means and Standard Deviations of Factors Factors Means Standard
Deviations1) Opportunities for learning 3.3819 0.873272) Relationship with colleagues and supervisors 3.8993 0.698243) Participation 3.3982 0.841404) Job stress 2.9148 0.784745) Mission attachment 3.8102 0.649496) Employee Engagement 3.6623 0.534907) Intent to stay 3.4777 0.80812
The data from sample showed that almost all factors have a mean of 3s. There were relationship with colleagues and supervisors (𝑥𝑥𝑥 = 3.8993, SD = 0.69824), mission attachment (𝑥𝑥𝑥= 3.8102, SD = 0.64949), employee engagement (𝑥𝑥𝑥 = 3.6623, SD = 0.53490), intent to stay (𝑥𝑥𝑥 =3.4777, SD = 0.80812), participation (𝑥𝑥𝑥 = 3.3982, SD = 0.84140) and opportunities for learning (𝑥𝑥𝑥 = 3.3819, SD = 0.87327) respectively. Only job stress was below three (𝑥𝑥𝑥 = 2.9148, SD = 0.78474).
= 3.3819,
SD = 0.87327) respectively. Only job stress was below three (
11
Table 2. Frequency of Organizational Income Data Frequency Percent
1) Donation 240 53.02) Government 69 15.23) Fundraising activities 24 5.34) Others 120 26.5
Total 453 100.0
Table 2 presented that more than half of the organizations received income of donation (53 percent). Some received main income from the government (15.2 percent). There were a few fundraising activities at 5.3 percent. ‘Other’ category was listed high with 26.5 percent. Many of them specified that their main income came from certain activities such as selling products, selling educational courses and lessons.
The second part of the findings presented the factors in this study. The table below showed descriptive analysis of the factors.
Table 3. Means and Standard Deviations of Factors Factors Means Standard
Deviations1) Opportunities for learning 3.3819 0.873272) Relationship with colleagues and supervisors 3.8993 0.698243) Participation 3.3982 0.841404) Job stress 2.9148 0.784745) Mission attachment 3.8102 0.649496) Employee Engagement 3.6623 0.534907) Intent to stay 3.4777 0.80812
The data from sample showed that almost all factors have a mean of 3s. There were relationship with colleagues and supervisors (𝑥𝑥𝑥 = 3.8993, SD = 0.69824), mission attachment (𝑥𝑥𝑥= 3.8102, SD = 0.64949), employee engagement (𝑥𝑥𝑥 = 3.6623, SD = 0.53490), intent to stay (𝑥𝑥𝑥 =3.4777, SD = 0.80812), participation (𝑥𝑥𝑥 = 3.3982, SD = 0.84140) and opportunities for learning (𝑥𝑥𝑥 = 3.3819, SD = 0.87327) respectively. Only job stress was below three (𝑥𝑥𝑥 = 2.9148, SD = 0.78474).
= 2.9148, SD = 0.78474).
12
Figure 3. Causal Relationship between Factors and Intent to Stay. Chi-Square = 0.00, df = 0, P-value = 1.00, RMSEA = 0.00, ** p < .01, * p < .05
The figure above demonstrated the causal relationship between factors and intent to stay. The model, however, was adjusted and removed the line that did not show significant relationship. That was the relationship between mission attachment to employee engagement. Goodness of fit statistics showed chi-square of 0.00, df = 0, P-value = 1.00, RMSEA = 0.00, that were in line with the accepted criteria (chi-square > 0.05, df = < 3, P-value > 0.05, RMSEA < 0.06 as stated in Hair et al, 2005). The ** showed significance level at .01, and * indicated significance level at .05. The model was fitted.
Table 4. Path Coefficient, Direct, Indirect and Total Effects to Employees’ Intent to Stay.Causes Direct
EffectIndirect Effect
Total Effect
1) Opportunities for learning 0.10 0.17 0.272) Relationship with colleagues and supervisors 0.10 0.07 0.173) Participation 0.11 0.14 0.254) Job stress -0.13 -0.08 -0.215) Mission attachment 0.13 - 0.136) Employee Engagement 0.51 - 0.51
The table above demonstrated that there are six factors that had direct effect to employees’ intent to stay. Five of them had positive relationship and one had negative relationship. The positive relationship presented employee engagement (0.51), mission attachment (0.13), participation (0.11), opportunities for learning and relationship with
Figure 3. Causal Relationship between Factors and Intent to Stay
Chi-Square = 0.00, df = 0, P-value = 1.00, RMSEA = 0.00, ** p < .01, * p < .05
134 วารสารการจดการภาครฐและภาคเอกชน
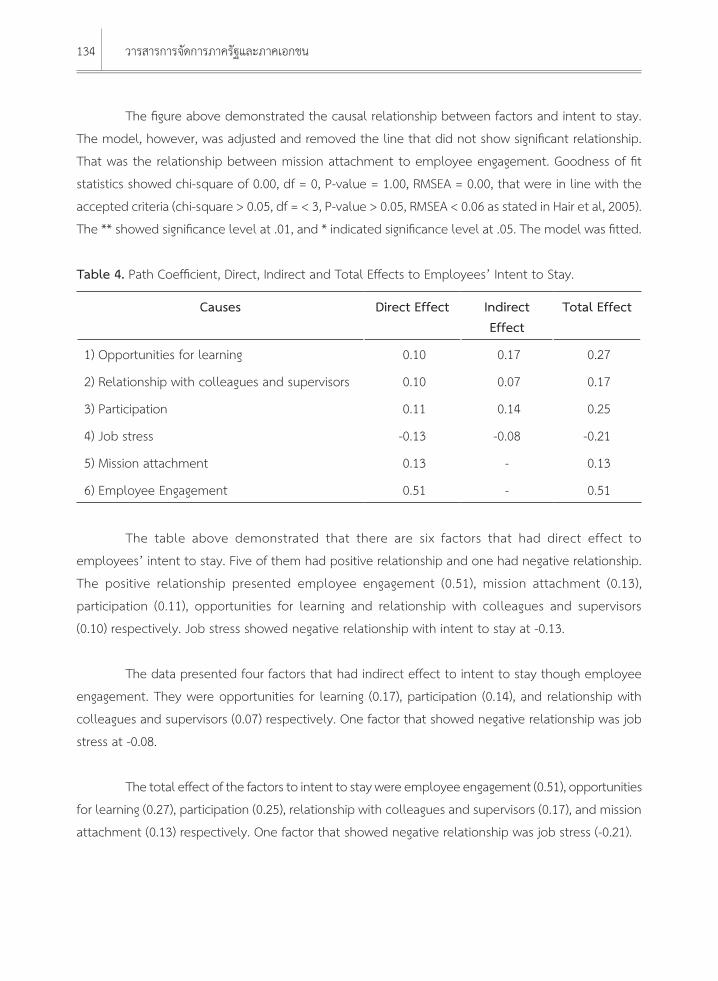
The figure above demonstrated the causal relationship between factors and intent to stay.
The model, however, was adjusted and removed the line that did not show significant relationship.
That was the relationship between mission attachment to employee engagement. Goodness of fit
statistics showed chi-square of 0.00, df = 0, P-value = 1.00, RMSEA = 0.00, that were in line with the
accepted criteria (chi-square > 0.05, df = < 3, P-value > 0.05, RMSEA < 0.06 as stated in Hair et al, 2005).
The ** showed significance level at .01, and * indicated significance level at .05. The model was fitted.
Table 4. Path Coefficient, Direct, Indirect and Total Effects to Employees’ Intent to Stay.
Causes Direct Effect Indirect Effect
Total Effect
1) Opportunities for learning 0.10 0.17 0.27
2) Relationship with colleagues and supervisors 0.10 0.07 0.17
3) Participation 0.11 0.14 0.25
4) Job stress -0.13 -0.08 -0.21
5) Mission attachment 0.13 - 0.13
6) Employee Engagement 0.51 - 0.51
The table above demonstrated that there are six factors that had direct effect to
employees’ intent to stay. Five of them had positive relationship and one had negative relationship.
The positive relationship presented employee engagement (0.51), mission attachment (0.13),
participation (0.11), opportunities for learning and relationship with colleagues and supervisors
(0.10) respectively. Job stress showed negative relationship with intent to stay at -0.13.
The data presented four factors that had indirect effect to intent to stay though employee
engagement. They were opportunities for learning (0.17), participation (0.14), and relationship with
colleagues and supervisors (0.07) respectively. One factor that showed negative relationship was job
stress at -0.08.
The total effect of the factors to intent to stay were employee engagement (0.51), opportunities
for learning (0.27), participation (0.25), relationship with colleagues and supervisors (0.17), and mission
attachment (0.13) respectively. One factor that showed negative relationship was job stress (-0.21).
135Employee Retention: Causal Analysis for Non-Profit Organizations in Thailand
Discussion and Conclusion
This research aimed to explore the current status of non-profit organizations in Thailand.
It also aimed to study factors affecting employees’ intent to stay and develop a causal model of the
factors. Finally, the study intended to suggest human resource practices for non-profit organizations.
To begin with, the findings above showed that almost half of the sample have worked for
non-profit organizations between four to six years. Main source of organization’s income was mainly
from donation. Although ‘other’ income was found to be the second source in place, sample group
stated that their income was mainly from selling products, selling educational courses and lessons,
doing campaigns and so on. These can also be interpreted as ‘fundraising’ activities. As Andreasen
and Kotler (2008) gave the definition of fundraising as an activity that an organization implement to
collect financial resources. If adding the percentage of other source of income to fundraising activities,
it will be the second main source of income. The sample matched the survey of National Statistical
Office’s (2013) survey – saying that most non-profit organizations received income from donation in
which can be money, assets or other things.
Each factor presented similar average in the sample group, specifically around three from the
scale of five. To repeat, the average of opportunities for learning demonstrated 3.3819, relationship
with colleagues and supervisors was 3.8993, participation was 3.3982, job stress was 2.9148, mission
attachment was 3.8102, employee engagement was 3.6623, and intent to stay 3.4777. From the
numbers, it can be concluded that employees in non-profit organizations had good relationship with
colleagues and supervisors. They also attached to the organization’s mission and engaged with the
organization. They received respect and had an opportunity to participate actively in the organization.
They also had opportunities for learning while they work for the organization. However, employees
in the sample group was found to be little stressful. Overall, they intended to stay working for their
organization.
As for the developed model, the model was fitted with the empirical data – that is human
resource practices have causal relationship with employee engagement as well as intent to stay.
Level of human resource practices influence the level of employee engagement and intent to stay
accordingly. Employee engagement also causes employees’ intent to stay.
Human resource practices studied in this research were opportunities for learning, relationship
with colleagues and supervisors, participation, job stress and mission attachment. Opportunities for
learning, relationship with colleagues and supervisors and participation had positive relationship with
employee engagement. Job stress was found to have negative relationship as the literature was
136 วารสารการจดการภาครฐและภาคเอกชน
14
relationship as the literature was shown. Mission attachment, however, did not show to have significant relationship with employee engagement. This was possibly because the definition is between mission attachment and employee engagement overlapped. Ferrer (2005: 11) defined as the ‘[f]eelings of being valued and involved, a sense of loyalty, connection and identification with the organisation and the extra effort on behalf of the organisation’. By that, it included the notion of mission attachment, job attachment, beliefs and loyalty. Similarly, the Opportunity Knocks.Org (2012: 3) described employee engagement as ‘an individual employee’s attitudes and disposition towards the employer, the employer’s mission and the content of an employee’s work)’. Due to the stated definitions, mission attachment can be seen as a part of employee engagement, therefore it can be concluded that mission attachment is not a cause of employee engagement.
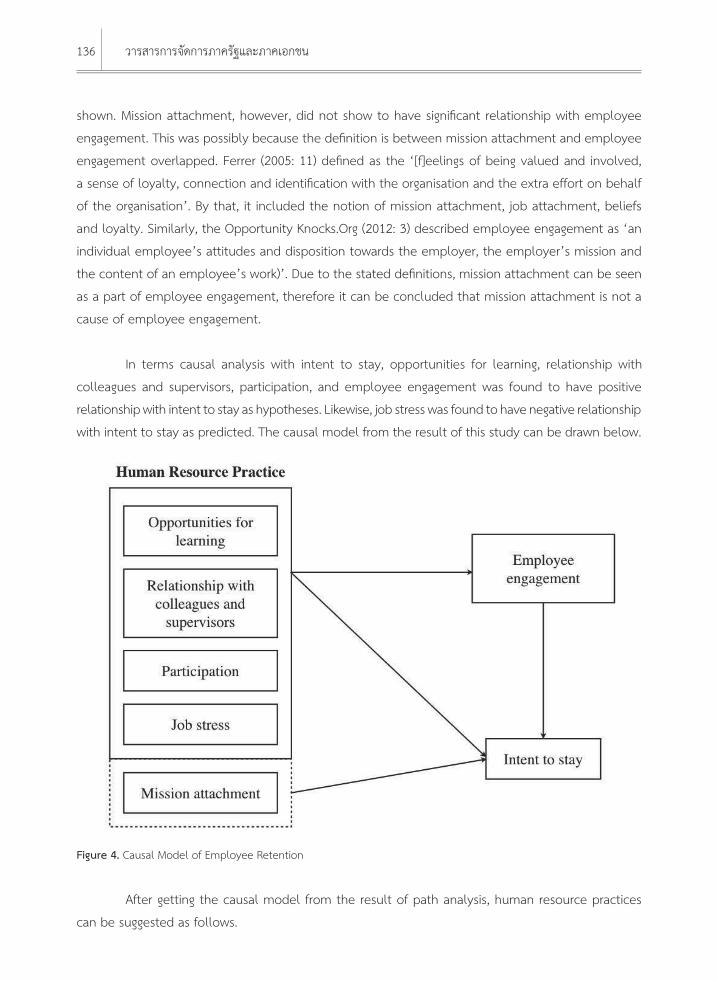
In terms causal analysis with intent to stay, opportunities for learning, relationship with colleagues and supervisors, participation, and employee engagement was found to have positive relationship with intent to stay as hypotheses. Likewise, job stress was found to have negative relationship with intent to stay as predicted. The causal model from the result of this study can be drawn below.
Figure 4. Causal Model of Employee Retention.
After getting the causal model from the result of path analysis, human resource practices can be suggested as follows.
Firstly, opportunities for learning, the organization should support their employees to enhance and develop their knowledge and skills. As Tuntivivat, Rungruangwuddikrai and Khannapa (2013) found out that employees who works in non-profit organizations especially in research and development wanted to enhance their knowledge and skills. The opportunities for learning does not only refer only to training both from the organization and be trained elsewhere, but challenging job and job rotation can also enhance employees’ skills. Ho, Chang, Shih and Liang (2009) stated that job rotation can enhance employees’ skills and knowledge. Employees can earn new skills and learn new things by doing new job. Challenging job can also push
shown. Mission attachment, however, did not show to have significant relationship with employee
engagement. This was possibly because the definition is between mission attachment and employee
engagement overlapped. Ferrer (2005: 11) defined as the ‘[f]eelings of being valued and involved,
a sense of loyalty, connection and identification with the organisation and the extra effort on behalf
of the organisation’. By that, it included the notion of mission attachment, job attachment, beliefs
and loyalty. Similarly, the Opportunity Knocks.Org (2012: 3) described employee engagement as ‘an
individual employee’s attitudes and disposition towards the employer, the employer’s mission and
the content of an employee’s work)’. Due to the stated definitions, mission attachment can be seen
as a part of employee engagement, therefore it can be concluded that mission attachment is not a
cause of employee engagement.
In terms causal analysis with intent to stay, opportunities for learning, relationship with
colleagues and supervisors, participation, and employee engagement was found to have positive
relationship with intent to stay as hypotheses. Likewise, job stress was found to have negative relationship
with intent to stay as predicted. The causal model from the result of this study can be drawn below.
Figure 4. Causal Model of Employee Retention
After getting the causal model from the result of path analysis, human resource practices
can be suggested as follows.
137Employee Retention: Causal Analysis for Non-Profit Organizations in Thailand
Firstly, opportunities for learning, the organization should support their employees to
enhance and develop their knowledge and skills. As Tuntivivat, Rungruangwuddikrai and Khannapa
(2013) found out that employees who works in non-profit organizations especially in research and
development wanted to enhance their knowledge and skills. The opportunities for learning does not
only refer only to training both from the organization and be trained elsewhere, but challenging job
and job rotation can also enhance employees’ skills. Ho, Chang, Shih and Liang (2009) stated that
job rotation can enhance employees’ skills and knowledge. Employees can earn new skills and learn
new things by doing new job. Challenging job can also push employees to find out the ways to the
solutions and that enhance the experiences for employees, as well as decrease boredom and job
stress in particular works.
Secondly, employees who work in non-profit organizations were found to work with their
personal attitudes with public service minds. Lipsky and Smith (1990) presented that workers in
non-profit organizations even work during their days off because of their commitment and their willing
to help their clients. Alatrista and Arrowsmith stated that non-profit organizations cannot compete with
other sectors due to their nature in payment that is lower than other sectors. Therefore, the personal
relationship with others is important. The authors stated that the relationship with managers will
increase the attitudes of employees toward the organization and lead to the organizational commitment.
Thirdly, employees who work in non-profit organization was shown that they do not need
career advancement in the organization but they want to be someone in the organization (Garner &
Garner, 2010). Therefore, the organization should give a chance to their employees to be the leaders,
or participate actively in the organizational performance, project and be a part of its achievement
and success. This can be done by job assignment and giving responsibility as well as giving feedback
as feedback can give staff a perception of being importance to the organization.
Fourthly, job assignment should be suitable for the time and skills of an employee to leave
them enough time to work happily as well as the kinds of the job assign should be suitable to the
individual, for instance, matching an employee’s education and experiences to avoid stress.
Finally, matching job with individual style is also important. The personal value towards job
assigned and missions given can increase mission attachment to the employee.
138 วารสารการจดการภาครฐและภาคเอกชน
Contribution and Recommendation
The study so far has put the readers’ attention to the field of human resource management
in non-profit organizations. It also contributes the model for employee retention in non-profit sectors.
In terms of practice, this current study has suggested human resource practices that can be practically
applied to the non-profit organizations.
However, the causal model should be used with caution. Although the current study has
done accordingly to the typical research method, it was found out that there were many types of
non-profit organizations that may affect the employee intent to stay in particular to the types of
organizations in which the current study did not take into account. See below for the limitation and
suggestions for the future research.
Limitation and Suggestions for the Future Research
According to the limitation of the current study that it had limited time in doing the
research as well as the limited literature in relevant to Thai context, this study did not do the thorough
studies in terms of the types of non-profit organizations. In other words, non-profit organizations
in Thailand are privately managed accordingly to their own missions. By that, each organization
manages differently. Some rely heavily on volunteers, some hire a lot of employees depending on the
management styles and sources of income. For examples, if the main source of income came from a
single donor, the management style may be motivated or influence by that donor unlike those that
receive from various donors, the management style is likely to be motivated by their clients, the actual
benefits to the target groups. Having said this, the future research may study thoroughly on the types
of non-profit organizations in Thailand, possibly classify by their missions, legal statuses, sources of
income, and so on. Future papers can study management styles of each type of the organizations as
well as factors affecting employees’ intent to stay in those organizations. The study of comparisons
may also be worth discussing in future research.
139Employee Retention: Causal Analysis for Non-Profit Organizations in Thailand
References
Andreasen, A. R., & Kotler, P. T. (2008). Strategic Marketing for Nonprofit Organizations. Upper Saddle
River, NJ: Prentice Hall.
Armstrong, L., Bluitt-Fisher, J., Lopez-Newman, L., Paul, D. R., & Paul, K. R. (2009). Nonprofits in Crisis:
How to Retain Employees in the Nonprofit Sector. Retrieved from http://digitalscholarship.
unlv.edu/thesesdissertations/810/.
Association of Fundraising Professionals. (2007). Fundraisers More Committed to Causes Than
Organizations? Retrieved March 2015 from http://www.afpnet.org/Audiences/ReportsResearch
Detail.cfm?ItemNumber=2107.
Brown, W. A., & Yoshioka, C. F. (2003). Mission attachment and satisfaction as factors in employee
retention. Nonprofit Management and Leadership, 14(1), 5-18.
Cangelosi, J. D. Jr, Markham, F. S., & Bounds, W. T. (2008). Factors related to nurse retention and
turnover: An updated study. Health Marketing Quarterly, 15(3), 25-43.
Cochran, W. G. (1977). Sampling Techniques. 3rd Edition. New York: John Wiley and Sons.
Corporate Leadership Council. (2004). Driving Performance and Retention Through Employee
Engagement. Washington D.C.: Corporate Executive Board.
Ferrer, J. (2005). Employee Engagement: Is It Organizational Commitment Renamed? Working Paper
Series, Victoria University, Melbourne, Australia.
Garner, J. T., & Garner, L. T. (2010). Volunteering an opinion: Organizational voice and volunteer
retention in nonprofit organizations. Nonprofit and Voluntary Sector Quarterly, 40(5), 813-828.
Hair, J. F., Black, B., Babin, B., Anderson, R. E., Tatham, R. L. (2005). Multivariate Data Analysis. New
Jersey: Pearson.
Hannum, K. M. et al. (2011). Emerging Leadership in Nonprofit Organization: Myths, Meaning, and
Motivations. Greensboro, NC: Center for Creative Leadership.
Ho, W., Chang, C. S., Shih, Y., & Liang, A. R. (2009). Effects of job rotation and role stress among nurses
on job satisfaction and organizational commitment. BMC Health Services Research, 9(8).
Retrieved March 2016 from http://bmchealthservres.biomedcentral.com/articles/
10.1186/1472-6963-9-8.
Hoyal, F. M. D. (1995). Retention of rural doctors. The Australian Journal of Rural Health, 3(1), 2-9.
Inman, D., & Marlow, L. (2004). Teacher Retention: Why do Beginning Teachers Remain in the
Profession? Education, 124(4), 605-614.
Kim, S. E., & Lee, J. W. (2007). Is mission attachment an effective management tool for employee
retention? An empirical analysis of a nonprofit human services agency. Review of Public
Personnel Administration, 27(3), 227-248.
Leete, L. (2006). Work in the nonprofit sector. In Powell, W. W., & Steinberg, R. (2006). The Nonprofit
Sector: A Research Handbook. 2nd ed. New Haven, CT: Yale University Press.
140 วารสารการจดการภาครฐและภาคเอกชน
Lipsky. M., & Smith, S. R. (1990). Nonprofit organizations, government, and the welfare state. Political
Science Quarterly, 104(4), 625-648.
National Statistical Office. (2013). The 2013 Non-Profit Organization Survey. Retrieved April 28, 2015
from http://service.nso.go.th/nso/nsopublish/service/survey/nonProfitFull56.pdf.
Office of the National Economic and Social Development Board. (2010). Non-Profit Institutions
Satellite Account of Thailand. Retrieved April 20, 2014, from http://www.nesdb.go.th/Portals/0/
eco_datas/account/NPI/data/NPI_SA_BOOK_Eng.pdf.
Opportunity Knocks.Org. (2012). Engaging the Nonprofit Workforce: Mission, Management and
Emotion. Retrieved March 2015. from http://www.gcn.org/sites/default/files/ctools/OK_
Engaging_the_Nonprofit_Workforce_Report.pdf.
Ramlall, S. (2004). A review of employee motivation theories and their implications for employee
retention within organizations. The Journal of American Academy of Business, Cambridge,
September(2004), 52-63.
Sadangharn, P. (2010). The Determinants of Talent Retention in the Thai Public Sector. Ph.D. Thesis.
Doctor of Philosophy (Development Administration), School of Public Administration,
National Institute of Development Administration. Retrieved April 2016, from http://libdcms.
nida.ac.th/thsis6/2010/b166707.pdf.
Saks, A. M., & Rotman, J. L. (2006). Antecedents and consequences of employee engagement. Journal
of Managerial Psychology, 21(7), 600-619.
Samuel, M. O., & Chipunza, C. (2009). Employee retention and turnover: Using motivational variables
as a panacea. African Journal of Business Management, 3(8), 410-415.
Sarti, D. (2014). Job resources as antecedents of engagement at work: Evidence from a long-term care
setting. Human Resource Development Quarterly, 25(2), 213-237.
Shen, J. (1997). Teacher retention and attrition in public schools: Evidence from SASS91. The Journal
of Edcuational Research, 91(2), 81-88.
Shields, M. A., & Ward, M. (2001). Improving nurse retention in the national health service in England:
The impact of job satisfaction on intentions to quit. Journal of Health Economics, 20(5),
677-701.
Sweeney, P. D., & McFarlin, D. B. (1997). Process and outcome: Gender differences in the assessment
of justice. Journal of Organizational Behavior, 18(1), 83-98.
Tuntivivat, S., & Piriyakul, M. (2015). The mediating effect of job satisfaction on learning organization
culture and turnover intention among generation x workers of nonprofit organizations in
Thailand. International Journal of Behavioral Science, 10(1), 35-46.
Tuntivivat, S., Rungruangwuddikrai, N., & Khannapa, N. (2013). Structural Equation Modeling of Turnover
Intention in Non Profit Research and Development Organizations in Thailand. Proceedings of
Global Business and Finance Research Conference. Howard Civil Service International House, Taipei,
Taiwan. October 28-29, 2013.

141Employee Retention: Causal Analysis for Non-Profit Organizations in Thailand
Worth, M. (2012). Nonprofit Management: Principles and Practice. 2nd Edition. Thousand Oaks, CA: SAGE
Publications, Inc.

142 วารสารการจดการภาครฐและภาคเอกชน