emissions of no from alfalfa and soybean crops in eastern canada
TRANSCRIPT
Emissions of N2O from Alfalfa and Soybean Crops in Eastern Canada
Philippe Rochette,* Denis A. Angers, Gilles Belanger, Martin H. Chantigny,Danielle Prevost, and Gabriel Levesque
ABSTRACT in soils by excreting N compounds from nodules and bythe decomposition of dead tissues in soils. Similarly,There is considerable uncertainty relative to the emissions of N2OMayer et al. (2003) reported that faba bean (Vicia fabafrom legume crops. A study was initiated to quantify N2O fluxes from
soils cropped to alfalfa (Medicago sativa L.) and soybean (Glycine L.) could release 13% of their fixed N as rhizodeposi-max L.), and to improve our understanding of soil and climatic factors tion. Denitrification by N-fixing bacteria can be anothercontrolling N2O emissions from these crops. Measurements were made source of N2O in legume stands (O’Hara and Daniel,on three soils cropped to alfalfa, soybean, or timothy (Phleum pratense 1985). Breitenbeck and Bremner (1989) observed thatL.), a perennial grass used as a control. In situ soil-surface N2O emis- free-living cells of soybean rhizobia (Bradyrhizobiumsions (FN2O) were measured 47 times during the 2001 and 2002 growing japonicum) can denitrify nitrate under anaerobic condi-seasons. Soil water, NH4–N, NO3–N, and N2O contents, and soil tem-
tions but concluded that the population of these bacteriaperature were also determined to explain the variation in gas fluxes.is likely too small to influence the rate of denitrificationEmissions of N2O were small under the grass where very low soilin soils.mineral N content probably limited denitrification and N2O produc-
The fraction of the N2 fixed by legume crops that istion. Soil mineral N contents under legumes were up to 10 timesgreater than under timothy. However, soil mineral N contents and converted to N2O is not well documented and the IPCCFN2O were not closely related, thus suggesting that the soil mineral N greenhouse gas inventory methodology proposes forpool alone was a poor indicator of the intensity of N2O production this source the same emission factor as for mineral fertil-processes. Higher FN2O were measured under legume than under timo- izers (1.25%) (IPCC, 1997). Moreover, N2O emissionsthy in only 6 out of 10 field comparisons (site-years). Moreover, the from legume species used as forage crops (e.g., alfalfa,emissions associated with alfalfa (0.67–1.45 kg N ha�1) and soybean clover [Trifolium sp.]) are not included in the IPCC meth-(0.46–3.08 kg N ha�1) production were smaller than those predicted
odology. Our limited knowledge of the contribution ofusing the emission coefficient proposed for the national inventory oflegume crops to N2O emissions results in considerablegreenhouse gases (alfalfa � 1.60–5.21 kg N ha�1; soybean � 2.76–4.97uncertainty for the Canadian inventory of agriculturalkg N ha�1). We conclude that the use of the current emission coeffi-N2O emissions. Alfalfa and soybean are grown on 0.8cient may overestimate the N2O emissions associated with soybean
and alfalfa production in eastern Canada. and 1.0 million ha, respectively in eastern Canada, andmore accurate estimates of their contribution to N2Oemissions are necessary. The objectives of this studywere to quantify N2O fluxes during the growing seasonThe atmospheric concentration in N2O, a very potentfrom soils cropped to alfalfa and soybean, and to im-greenhouse gas, is increasing at a rate of 0.25%prove our understanding of soil and climatic factorsannually (IPCC, 2001). In Canada, agricultural sourcescontrolling N2O emissions from legume crops.are estimated to emit approximately 80 Mg N2O-N yr�1
or 60% of the total anthropogenic emissions (Janzen etal., 1999). These N2O emissions are largely attributed MATERIALS AND METHODSto nitrification and denitrification of N that is added to
Field Sitesthe soil to sustain crop productivity. Soil N sources thatcan result in N2O production and emission include min- The study was conducted at the Chapais (2001) and Harlaka
(2001 and 2002) research farms of Agriculture and Agri-Fooderal fertilizer, manure, crop residues, and biological fixa-Canada, located 3 and 20 km southeast of Quebec City, respec-tion of atmospheric N2 by legume crops (Bremner, 1997).tively (46�46�N; 71�19� W). At the Chapais site, the soil wasSymbiotic N2 fixation by legumes, such as soybeana St-Pacome sandy loam (loamy, mixed, frigid Umbric Dystro-and pulse crops, is estimated to account for 22% ofchept) (Table 1) and the experimental design consisted ofagricultural N2O emissions in Canada (Desjardins andrandomized complete blocks with crops of alfalfa, soybean,Riznek, 2000). Despite the magnitude of this estimate, and timothy as treatments repeated four times in 0.9 by 3 m
there is limited direct empirical data on the N2O produc- plots. Alfalfa (Medicago sativa L., cv. AC Caribou) and timo-tion associated with symbiotic N2 fixation. The presence thy (Phleum pratense L., cv. Champ) were established in 1998of legumes could stimulate N2O emissions by increasing as part of another study on winter survival of perennial forageN inputs into soils, thus providing additional substrates crops. Soybean (Glycine max L., cv. Gentleman) was seeded
on 22 May 2001 in plots where orchardgrass (Dactylis glo-for nitrification and denitrification. Ta et al. (1986)merata L.) had been grown during the three previous years.showed that alfalfa contributes to raise N concentrationSeeds were treated with a commercial inoculum (HiStick �532C strain, Becker Underwood, Ames, IA) and seeded at aSoils and Crops Research and Development Centre, Agriculture and
Agri-Food Canada, 2560 Hochelaga Blvd., Sainte-Foy, QC, Canada, rate of 85 kg ha�1 with 18-cm interrows. Soybean receivedG1V 2J3. Received 5 May 2003. *Corresponding author (rochettep@ 62.2 kg K ha�1 and 16.1 kg P ha�1 before planting and wasagr.gc.ca). harvested on 4 Oct. 2001. Timothy was used as a nonlegume
Published in Soil Sci. Soc. Am. J. 68:493–506 (2004). Soil Science Society of America Abbreviations: DM, dry matter, WEOC, water-extractable organic
carbon.677 S. Segoe Rd., Madison, WI 53711 USA
493
Published March, 2004
494 SOIL SCI. SOC. AM. J., VOL. 68, MARCH–APRIL 2004
Table 1. Characteristics of the soils at the Chapais and Harlaka lated using the following equation (Rochette and Hutchin-sites measured at the onset of the study. son, 2004):
Soil-site Sand Silt Clay Total C Total N pH FN2O � �C/�t (V/A) Mm/Mv (1 � ea/P)g g�1 mg g�1
where the rate of change of chamber N2O concentration (�C/Sandy loam-Chapais 0.70 0.11 0.19 19.9 1.8 5.8�t) is determined in dry air samples, V is the chamber volume,Clay-Harlaka 0.07 0.16 0.77 36.1 2.4 6.2
Loam-Harlaka 0.44 0.34 0.22 17.9 1.2 5.9 A is the soil area covered by the chamber, Mm is the molecularweight (44 g), Mv is the molecular volume at predeploymentair temperature (0.0224–0.024 m3 mol�1), ea (kPa) is the prede-control to estimate background N2O emissions; for this reason,ployment partial pressure of water vapor in air, and P (kPa)it was not fertilized in 2001.is the barometric pressure.At the Harlaka site, plots were initiated in 2001 on a St-
Cumulative N2O-N losses were calculated by linearly inter-Andre loam (coarse-loamy, mixed, frigid Sombric Fragior-polating N2O emissions between sampling dates, assuming thatthod) and a Kamouraska clay (fine, mixed, frigid Typic Huma-measurements made between 1000 and 1200 h provided aquept) (Table 1) in fields located approximately 200 m apart.valid estimation of average daily FN2O. The IPCC procedureThe experimental design on the two soils was similar at thewas used as recommended for pulse crops and for N fertilizerChapais site except for the larger plot dimensions (3.1 � 8 m).applications, and adapted for alfalfa to estimate annual N2OAlfalfa (cv. Apica; 12 kg ha�1; commercial inoculum: Nitraginemissions: timothy � N fertilizer rate � 1.25%; alfalfa N[Balzac strain], Nitragin, Brookfield, WI) and timothy (cv.fixation � harvested N � 1.25%; soybean N fixation � {grainChamp; 10 kg ha�1) were seeded between 18 and 22 MayN � [2.1 � grain dry matter (DM) � 0.03 kg N kg�1 DM]} �2001. Oat (Avena sativa L., cv. AC Baton; 80 kg ha�1) was1.25%; soybean crop residues � (2.1 � DM � 0.03 kg Nunderseeded with timothy. Soybean (cv. Gentleman; 85 kgkg�1 DM) � 1.25%, for a soybean residue/crop ratio of 2.1ha�1; 18-cm interrows; commercial inoculum: HiStick � [532C(IPCC, 1997).strain], Becker Underwood, Ames, IA) was seeded on 21 May
Concentrations of O2, CO2, and N2O in the soil profile were2001 and 22 May 2002. Preplanting fertilization of all cropsmonitored simultaneously with flux measurements by takingwas 62.2 kg K ha�1 and 16.1 kg P ha�1. Timothy plots receivedsoil air samples within 2 m of chamber frames using gas probes.30 kg N ha�1 only after the harvest of 31 July 2001 to improveThe probes were made of plastic mesh cylinders (10-cm length;establishment. Weeds were controlled by manual weeding and3.5-cm diameter) containing 3-mm glass beads. The cylindersby use of herbicides.were inserted horizontally at a depth of 7.5 cm and connectedto the surface using plastic tubes (Bev-a-line IV, Ryan HercoSoil-Surface Gas FluxIndustrial Plastics, Seattle, WA) (0.60-m length; 6.35-mm o.d.;
At the Chapais site, in situ soil–surface gas fluxes were 3.18-mm i.d.) with two-way Luer-type stopcock valve (Colemeasured 20 times from 23 May to 22 Oct. 2001 in the alfalfa Parmer, Vernon Hills, IL) and a polyisoprene septum (maleand timothy plots, and from 27 June to 22 Oct. 2001 in the luer-lock stopper with injectable membrane, Vygon, Ecouen,soybean plots. Measurements on the two soils at the Harlaka France) at the surface end. Air samples were collected withsite were made 10 times from 4 July to 24 Oct. 2001. The later a 20-mL polypropylene syringe after expelling 20 mL of airstarting date for measurements at the Harlaka than at the from the tubes to account for the dead volume of the tubes.Chapais site was to allow for a good crop establishment before Samples were stored at 200 kPa in vials and handled as theinserting the chamber frames in the soil. In 2002, measure- chamber air samples.ments were made only at the Harlaka site and covered the Chamber and soil air samples were analyzed for N2O con-entire snow-free period from 17 Apr. to 23 Oct. (29 sampling centrations within 2 wk of sampling by means of a gas chro-dates). Measurements were made weekly except during the matograph fitted to electron capture detector (Model 3800.weeks following alfalfa and timothy harvests when fluxes were Varian, Walnut Creek, CA) equipped with a headspace auto-measured three times. Two clear acrylic frames (0.55 by 0.55 m; injector (Combi Pal, CTC Analytics, Zurich, CH). Concentra-0.14-m height; 6.35-mm wall thickness) were inserted to a tions in O2 and CO2 were also determined in the soil airdepth of 0.10 m in each plot 24 h before the first measurement. samples on the same instrument using thermal conductivityThe frames were left at the same locations for the duration and flame ionization detectors (Rochette and Hutchinson,of the experiment. The frames height was measured at regular 2004).intervals during the experiment (48 measuring points per Soil temperature and moisture were measured next to eachframe) to account for variations in headspace due to soil frame at the time of the N2O flux measurements. Soil tempera-settling. ture at 7.5 cm was monitored using copper-constantan thermo-
Soil-surface N2O fluxes were measured by the nonflow- couples. Average soil moisture in the top 10 cm was measuredthrough nonsteady-state chamber method (Livingston and with 15-cm three-bar time domain reflectometry probes in-Hutchinson, 1995). At sampling time, the frames were covered serted in soil at a 45� angle and read at every sampling dateby a vented insulated square acrylic plastic chamber (height: with a cable tester (model 1502B, Tektonix Inc, Beaverton,0.31 m) covering the same area as the frames. During each OR). Water-filled pore space (WFPS) was calculated usingN2O flux measurement, the chamber was fixed to a frame and measured bulk soil densities and assuming a mineral particleair samples were taken through a rubber septum at regular density of 2.65 g cm�3. Rainfall was measured daily with stan-intervals (0, 25, 50, and 75 min after deployment in 2001 and dard rain gages at the Harlaka site.0, 12, 24, and 35 min after deployment in 2002). Air sampleswere taken using a 20-mL polypropylene syringe (Becton Soil AnalysesDickinson, Rutherford, NJ) and pressurized (200 kPa) intopre-evacuated vials (12-mL Exetainer, Labco, High Wycombe, Soil samples (0–15 cm) were collected weekly and kept at
4�C until analyzed. Soil mineral N content was measured byUK) in which 3 mg of magnesium perchlorate were placed toabsorb water vapor. shaking 25 g of field-moist soil samples with 100 mL of 1 M
KCl for 60 min. The slurry was then centrifuged (3000 � g,Measurements were always made between 1000 and 1200 h(Eastern Standard Time) and fluxes of N2O (FN2O) were calcu- 10 min) and filtered (Whatman no. 42). Ammonium concen-
ROCHETTE ET AL.: EMISSIONS OF N2O FROM ALFALFA AND SOYBEAN CROPS 495
tration in the extracts was determined by the salicylate method ture, and soil water, WEOC, and mineral N content was per-formed for each sampling date using the General Linear Mod-by flow injection analysis on a flow injection analyzer (Model
QuickChem 8000, Lachat Instruments Division, Zellweger els (GLM) procedure of SAS (SAS Institute Inc., 1990 p.1686).All experimental error variances were tested for homogeneityAnalytics, Inc., Milwaukee, WI), whereas NO3
� was detectedin the UV radiation at 214 nm using a liquid chromatograph using Bartlett’s test and values of N2O flux and soil atmo-
spheric composition were log-transformed to achieve normal-(Model 4000i, Dionex Corp., Sunnyvale, CA). Water-extract-able organic carbon (WEOC) was obtained by shaking 6.25 g ity. Treatment effects were considered statistically significant
at P � 0.05.of field-moist soil in 20 mL of distilled water for 30 min. Theextracts were centrifuged at 16000 � g and filtered at 0.45�m. Soluble C was determined using a Formaacs Combustion
RESULTS AND DISCUSSIONTOC Analyzer (Skalar Analytical, De Breda, The Nether-lands). A fraction of the soil samples was air-dried and sieved Soil Temperature and Water Contentat 2 mm for the determination of soil pH (CaCl2 0.01 M).
Mid-summer soil temperatures at 7.5 cm remainedTotal C and N contents were measured by dry combustion(CNS-1000, LECO Corp., St. Joseph, MI) on finely ground between 15 and 25�C in all plots in 2001 and 2002 (data(0.15 mm) soil samples. Soil N and C values were expressed not shown). Differences in soil temperature betweenper unit of soil area using measured bulk soil densities. crop types were only occasionally 2�C even if often
statistically significant. The clay was generally slightlyCrop Dry Matter and Nitrogen Yields cooler than the loam and sandy loam soils. A very dry
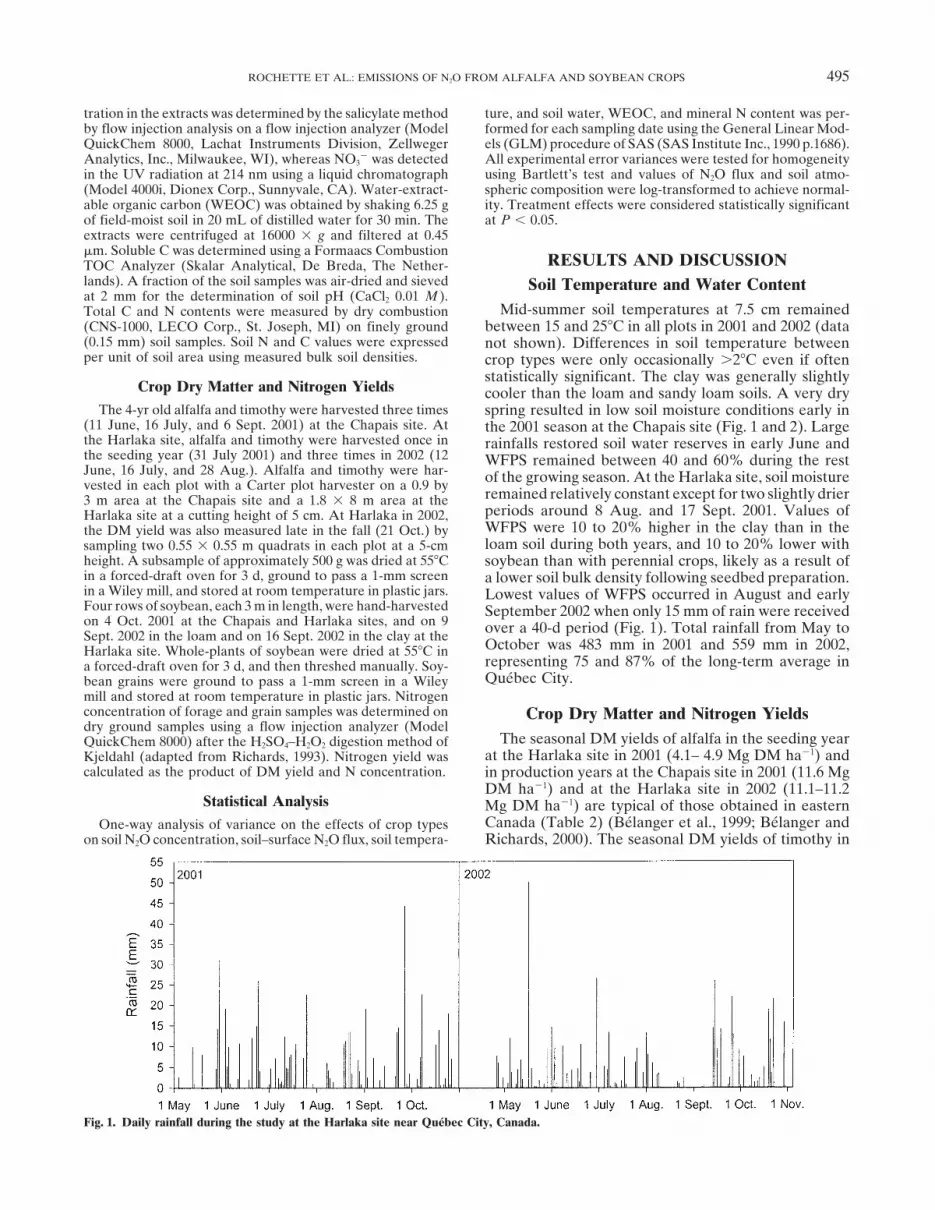
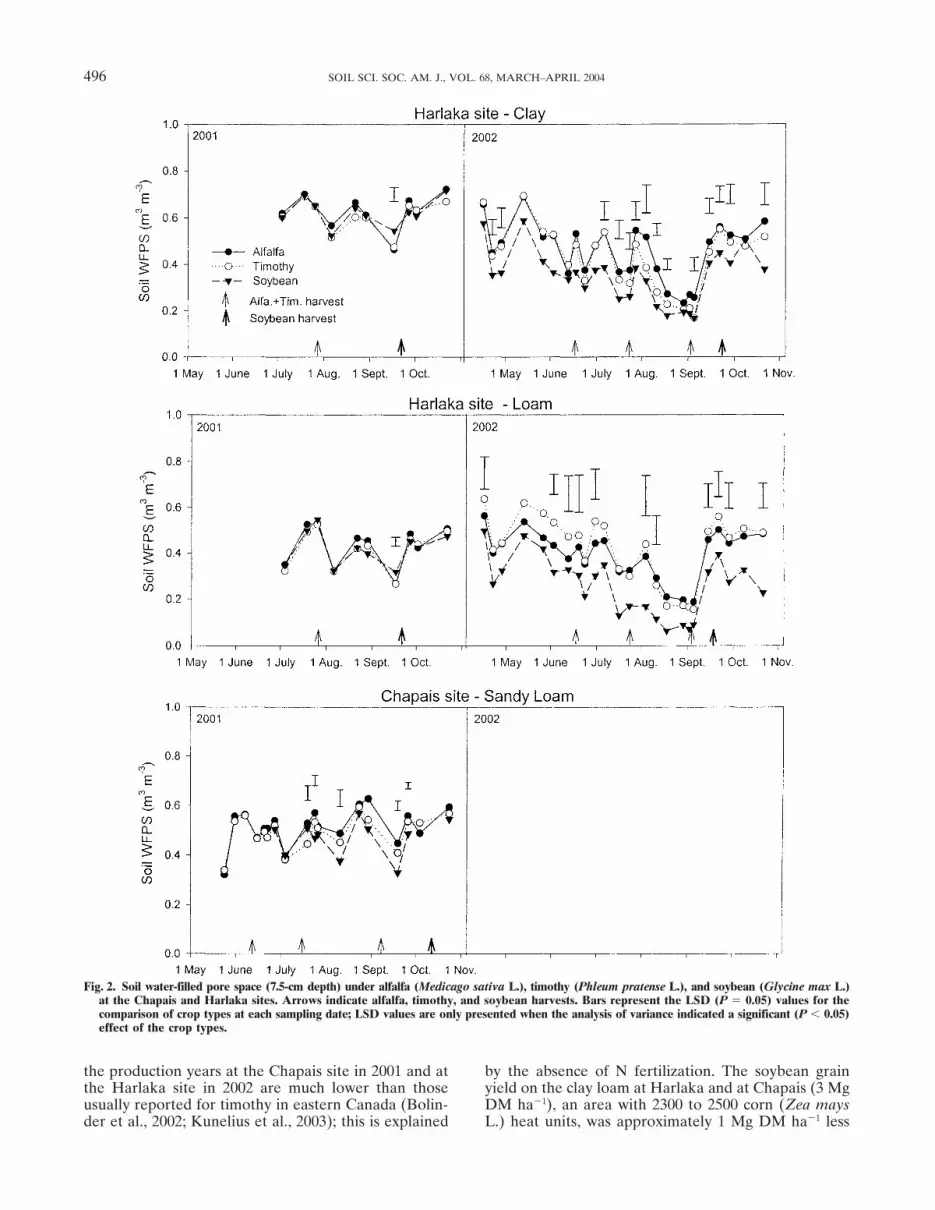
The 4-yr old alfalfa and timothy were harvested three times spring resulted in low soil moisture conditions early in(11 June, 16 July, and 6 Sept. 2001) at the Chapais site. At the 2001 season at the Chapais site (Fig. 1 and 2). Largethe Harlaka site, alfalfa and timothy were harvested once in rainfalls restored soil water reserves in early June andthe seeding year (31 July 2001) and three times in 2002 (12 WFPS remained between 40 and 60% during the restJune, 16 July, and 28 Aug.). Alfalfa and timothy were har- of the growing season. At the Harlaka site, soil moisturevested in each plot with a Carter plot harvester on a 0.9 by
remained relatively constant except for two slightly drier3 m area at the Chapais site and a 1.8 � 8 m area at theperiods around 8 Aug. and 17 Sept. 2001. Values ofHarlaka site at a cutting height of 5 cm. At Harlaka in 2002,WFPS were 10 to 20% higher in the clay than in thethe DM yield was also measured late in the fall (21 Oct.) byloam soil during both years, and 10 to 20% lower withsampling two 0.55 � 0.55 m quadrats in each plot at a 5-cm
height. A subsample of approximately 500 g was dried at 55�C soybean than with perennial crops, likely as a result ofin a forced-draft oven for 3 d, ground to pass a 1-mm screen a lower soil bulk density following seedbed preparation.in a Wiley mill, and stored at room temperature in plastic jars. Lowest values of WFPS occurred in August and earlyFour rows of soybean, each 3 m in length, were hand-harvested September 2002 when only 15 mm of rain were receivedon 4 Oct. 2001 at the Chapais and Harlaka sites, and on 9 over a 40-d period (Fig. 1). Total rainfall from May toSept. 2002 in the loam and on 16 Sept. 2002 in the clay at the
October was 483 mm in 2001 and 559 mm in 2002,Harlaka site. Whole-plants of soybean were dried at 55�C inrepresenting 75 and 87% of the long-term average ina forced-draft oven for 3 d, and then threshed manually. Soy-Quebec City.bean grains were ground to pass a 1-mm screen in a Wiley
mill and stored at room temperature in plastic jars. Nitrogenconcentration of forage and grain samples was determined on Crop Dry Matter and Nitrogen Yieldsdry ground samples using a flow injection analyzer (Model
The seasonal DM yields of alfalfa in the seeding yearQuickChem 8000) after the H2SO4–H2O2 digestion method ofat the Harlaka site in 2001 (4.1– 4.9 Mg DM ha�1) andKjeldahl (adapted from Richards, 1993). Nitrogen yield was
calculated as the product of DM yield and N concentration. in production years at the Chapais site in 2001 (11.6 MgDM ha�1) and at the Harlaka site in 2002 (11.1–11.2
Statistical Analysis Mg DM ha�1) are typical of those obtained in easternCanada (Table 2) (Belanger et al., 1999; Belanger andOne-way analysis of variance on the effects of crop types
on soil N2O concentration, soil–surface N2O flux, soil tempera- Richards, 2000). The seasonal DM yields of timothy in
Fig. 1. Daily rainfall during the study at the Harlaka site near Quebec City, Canada.
496 SOIL SCI. SOC. AM. J., VOL. 68, MARCH–APRIL 2004
Fig. 2. Soil water-filled pore space (7.5-cm depth) under alfalfa (Medicago sativa L.), timothy (Phleum pratense L.), and soybean (Glycine max L.)at the Chapais and Harlaka sites. Arrows indicate alfalfa, timothy, and soybean harvests. Bars represent the LSD (P � 0.05) values for thecomparison of crop types at each sampling date; LSD values are only presented when the analysis of variance indicated a significant (P � 0.05)effect of the crop types.
the production years at the Chapais site in 2001 and at by the absence of N fertilization. The soybean grainyield on the clay loam at Harlaka and at Chapais (3 Mgthe Harlaka site in 2002 are much lower than those
usually reported for timothy in eastern Canada (Bolin- DM ha�1), an area with 2300 to 2500 corn (Zea maysL.) heat units, was approximately 1 Mg DM ha�1 lessder et al., 2002; Kunelius et al., 2003); this is explained
ROCHETTE ET AL.: EMISSIONS OF N2O FROM ALFALFA AND SOYBEAN CROPS 497
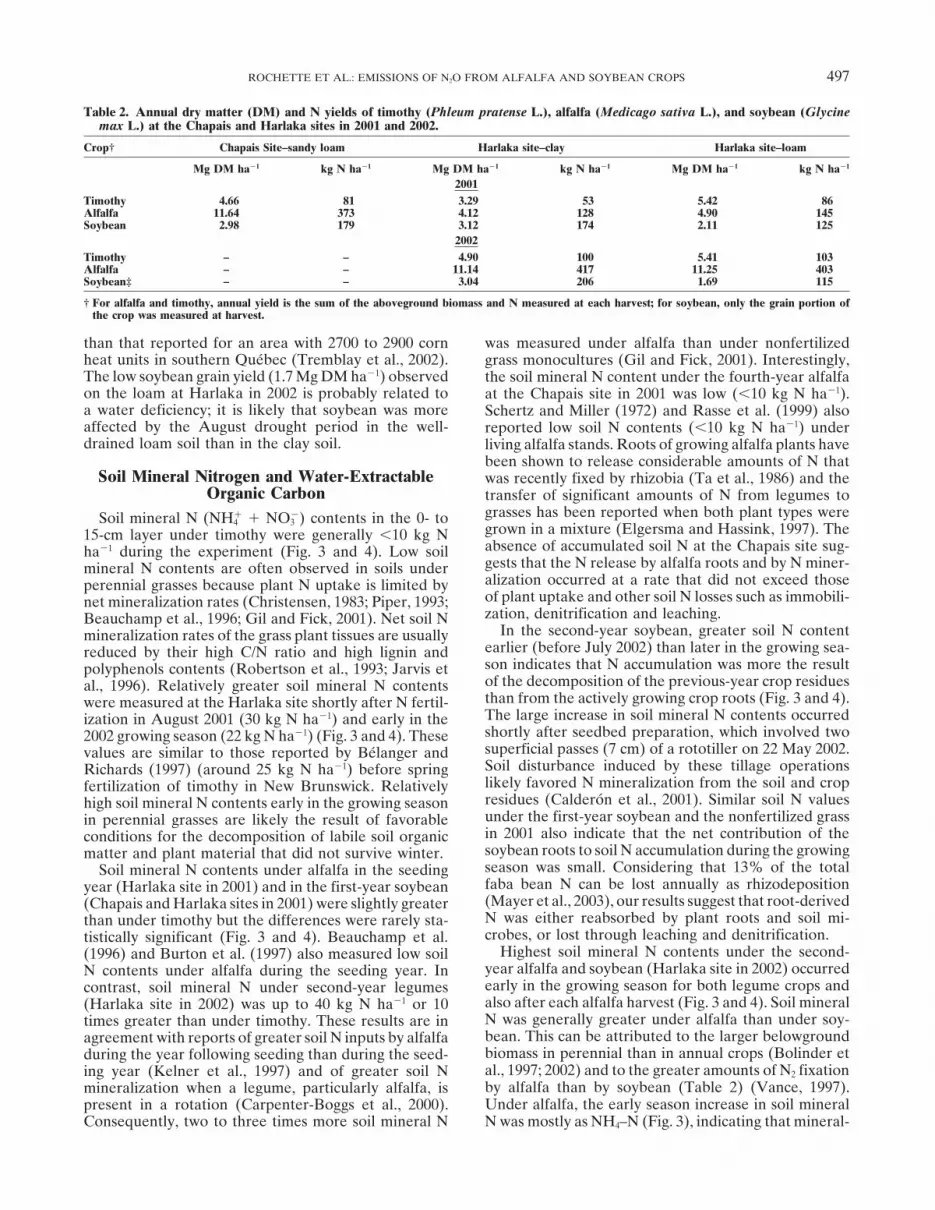
Table 2. Annual dry matter (DM) and N yields of timothy (Phleum pratense L.), alfalfa (Medicago sativa L.), and soybean (Glycinemax L.) at the Chapais and Harlaka sites in 2001 and 2002.
Crop† Chapais Site–sandy loam Harlaka site–clay Harlaka site–loam
Mg DM ha�1 kg N ha�1 Mg DM ha�1 kg N ha�1 Mg DM ha�1 kg N ha�1
2001Timothy 4.66 81 3.29 53 5.42 86Alfalfa 11.64 373 4.12 128 4.90 145Soybean 2.98 179 3.12 174 2.11 125
2002Timothy – – 4.90 100 5.41 103Alfalfa – – 11.14 417 11.25 403Soybean‡ – – 3.04 206 1.69 115
† For alfalfa and timothy, annual yield is the sum of the aboveground biomass and N measured at each harvest; for soybean, only the grain portion ofthe crop was measured at harvest.
than that reported for an area with 2700 to 2900 corn was measured under alfalfa than under nonfertilizedheat units in southern Quebec (Tremblay et al., 2002). grass monocultures (Gil and Fick, 2001). Interestingly,The low soybean grain yield (1.7 Mg DM ha�1) observed the soil mineral N content under the fourth-year alfalfaon the loam at Harlaka in 2002 is probably related to at the Chapais site in 2001 was low (�10 kg N ha�1).a water deficiency; it is likely that soybean was more Schertz and Miller (1972) and Rasse et al. (1999) alsoaffected by the August drought period in the well- reported low soil N contents (�10 kg N ha�1) underdrained loam soil than in the clay soil. living alfalfa stands. Roots of growing alfalfa plants have
been shown to release considerable amounts of N thatSoil Mineral Nitrogen and Water-Extractable was recently fixed by rhizobia (Ta et al., 1986) and the
Organic Carbon transfer of significant amounts of N from legumes tograsses has been reported when both plant types wereSoil mineral N (NH4
� � NO3�) contents in the 0- to
grown in a mixture (Elgersma and Hassink, 1997). The15-cm layer under timothy were generally �10 kg Nabsence of accumulated soil N at the Chapais site sug-ha�1 during the experiment (Fig. 3 and 4). Low soilgests that the N release by alfalfa roots and by N miner-mineral N contents are often observed in soils underalization occurred at a rate that did not exceed thoseperennial grasses because plant N uptake is limited byof plant uptake and other soil N losses such as immobili-net mineralization rates (Christensen, 1983; Piper, 1993;zation, denitrification and leaching.Beauchamp et al., 1996; Gil and Fick, 2001). Net soil N
In the second-year soybean, greater soil N contentmineralization rates of the grass plant tissues are usuallyearlier (before July 2002) than later in the growing sea-reduced by their high C/N ratio and high lignin andson indicates that N accumulation was more the resultpolyphenols contents (Robertson et al., 1993; Jarvis etof the decomposition of the previous-year crop residuesal., 1996). Relatively greater soil mineral N contentsthan from the actively growing crop roots (Fig. 3 and 4).were measured at the Harlaka site shortly after N fertil-The large increase in soil mineral N contents occurredization in August 2001 (30 kg N ha�1) and early in theshortly after seedbed preparation, which involved two2002 growing season (22 kg N ha�1) (Fig. 3 and 4). Thesesuperficial passes (7 cm) of a rototiller on 22 May 2002.values are similar to those reported by Belanger andSoil disturbance induced by these tillage operationsRichards (1997) (around 25 kg N ha�1) before springlikely favored N mineralization from the soil and cropfertilization of timothy in New Brunswick. Relativelyresidues (Calderon et al., 2001). Similar soil N valueshigh soil mineral N contents early in the growing seasonunder the first-year soybean and the nonfertilized grassin perennial grasses are likely the result of favorablein 2001 also indicate that the net contribution of theconditions for the decomposition of labile soil organicsoybean roots to soil N accumulation during the growingmatter and plant material that did not survive winter.season was small. Considering that 13% of the totalSoil mineral N contents under alfalfa in the seedingfaba bean N can be lost annually as rhizodepositionyear (Harlaka site in 2001) and in the first-year soybean(Mayer et al., 2003), our results suggest that root-derived(Chapais and Harlaka sites in 2001) were slightly greaterN was either reabsorbed by plant roots and soil mi-than under timothy but the differences were rarely sta-crobes, or lost through leaching and denitrification.tistically significant (Fig. 3 and 4). Beauchamp et al.
Highest soil mineral N contents under the second-(1996) and Burton et al. (1997) also measured low soilyear alfalfa and soybean (Harlaka site in 2002) occurredN contents under alfalfa during the seeding year. Inearly in the growing season for both legume crops andcontrast, soil mineral N under second-year legumesalso after each alfalfa harvest (Fig. 3 and 4). Soil mineral(Harlaka site in 2002) was up to 40 kg N ha�1 or 10N was generally greater under alfalfa than under soy-times greater than under timothy. These results are inbean. This can be attributed to the larger belowgroundagreement with reports of greater soil N inputs by alfalfabiomass in perennial than in annual crops (Bolinder etduring the year following seeding than during the seed-al., 1997; 2002) and to the greater amounts of N2 fixationing year (Kelner et al., 1997) and of greater soil Nby alfalfa than by soybean (Table 2) (Vance, 1997).mineralization when a legume, particularly alfalfa, isUnder alfalfa, the early season increase in soil mineralpresent in a rotation (Carpenter-Boggs et al., 2000).
Consequently, two to three times more soil mineral N N was mostly as NH4–N (Fig. 3), indicating that mineral-

498 SOIL SCI. SOC. AM. J., VOL. 68, MARCH–APRIL 2004
Fig. 3. Soil ammonium content (7.5-cm depth) under alfalfa (Medicago sativa L.), timothy (Phleum pratense L.), and soybean (Glycine max L.)at the Chapais and Harlaka sites. Arrows indicate alfalfa, timothy, and soybean harvests. Bars represent the LSD (P � 0.05) values for thecomparison of crop types at each sampling date; LSD values are only presented when the analysis of variance indicated a significant (P � 0.05)effect of the crop types.
ization of organic N was occurring at a higher rate than not survive winter. This hypothesis is reinforced by thesimilar NH4–N increase under the perennial grass (Fig. 3).those of nitrification and plant uptake. This increase
coincided with the early season soil warming and the Following the alfalfa harvests, both NH4–N andNO3–N tended to increase (Fig. 3 and 4). Harvestingmajor source of ammonium N was likely the mineraliza-
tion of above and belowground plant tissues that did alfalfa modifies several source-sink relationships, and

ROCHETTE ET AL.: EMISSIONS OF N2O FROM ALFALFA AND SOYBEAN CROPS 499
Fig. 4. Soil nitrate content (7.5-cm depth) under alfalfa (Medicago sativa L.), timothy (Phleum pratense L.), and soybean (Glycine max L.) atthe Chapais and Harlaka sites. Arrows indicate alfalfa, timothy, and soybean harvests. Bars represent the LSD (P � 0.05) values for thecomparison of crop types at each sampling date; LSD values are only presented when the analysis of variance indicated a significant (P � 0.05)effect of the crop types.
consequently could impact on soil N contents. Following alfalfa after plants were harvested and Vance et al.(1979) reported a senescence of alfalfa nodules follow-harvest, N2 fixation and soil mineral N uptake are con-
siderably reduced, and N is remobilized from taproots ing harvest that may contribute to N release from theroot system. Belowground alfalfa tissues are rich in Nto new shoots (Kim et al., 1991). Ta et al. (1986) mea-
sured an increase in N exudates from the nodules of (Walley et al., 1996) and their decomposition following
500 SOIL SCI. SOC. AM. J., VOL. 68, MARCH–APRIL 2004
harvest of the aboveground biomass likely led to an resulted from a combination of reduced gas diffusivityand greater denitrification rate of soybean crop residueincrease in soil mineral N.
The agronomic effects of soil residual N during the N that had mineralized and nitrified after crop senes-cence. However, there was no simultaneous rise in soilyear after cultivation of soybean have been well docu-
mented. For example, Staggenborg et al. (2003) esti- mineral N or WEOC (Fig. 3, 4, and 5). A similar situa-tion was observed under the fourth-year alfalfa at themated that the apparent supply of N to a wheat crop
following soybean was approximately 21 kg N ha�1. The Chapais site where the highest soil N2O concentrationswere also recorded in absence of measurable increaseshigh contents of soil NO3–N (up to 30 kg N ha�1) early
in the growing season under second-year soybean agree in soil N and C pools. Moreover, the opposite situationoccurred at Harlaka in 2002 when very high soil mineralwith these estimates of the contribution of soybean resi-
dues to the N requirements of the following crop in N contents were reached under legumes with no in-crease in N2O accumulation even after high rainfalls.the rotation.
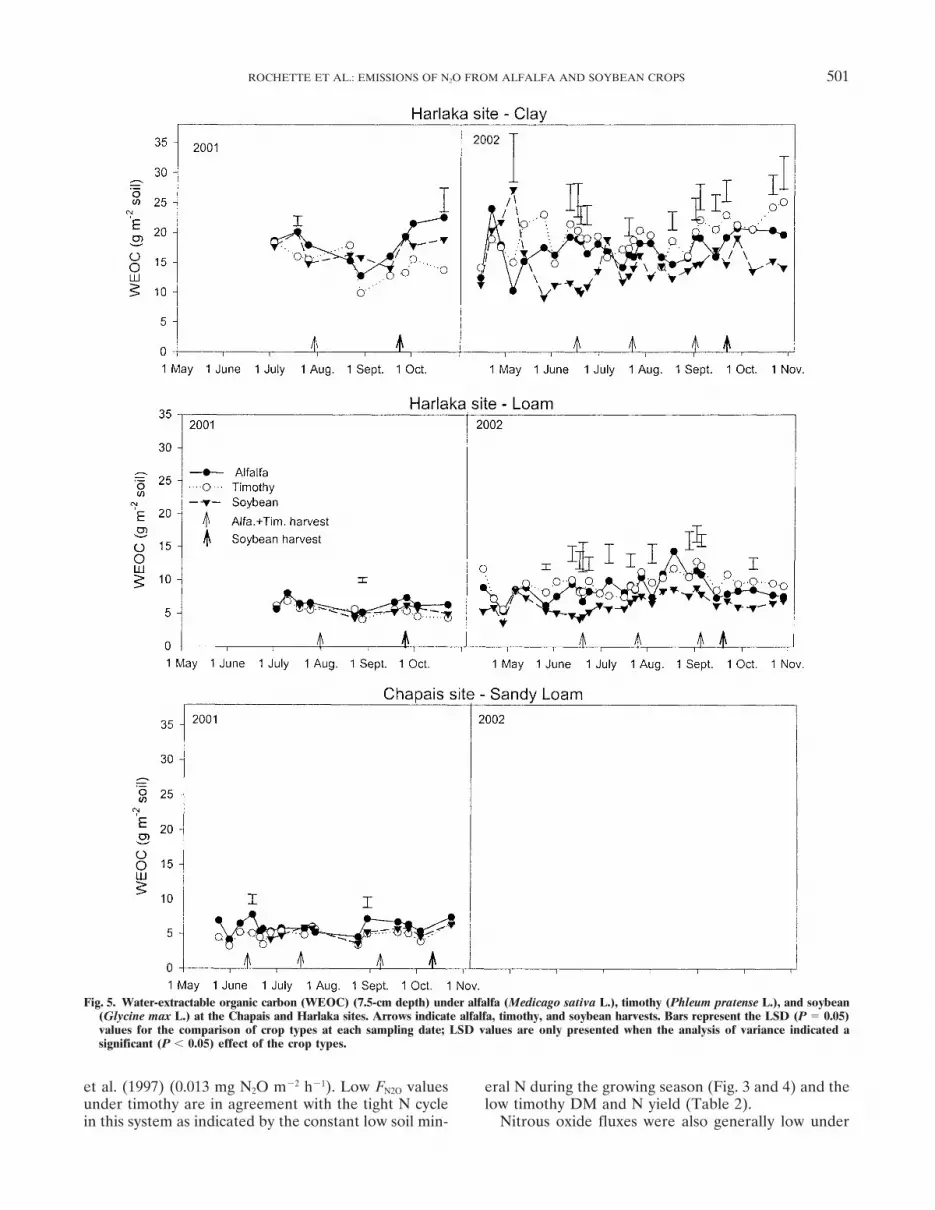
Water-extractable soil organic C contents were three These observations are in agreement with the statementthat variations in the size of soil N pools are imperfectto four times greater in the clay than in the loam and
sandy loam soils (Fig. 5), likely as a result of the higher indicators of the rates at which N transformations occurin soils (Jarvis et al., 1996).C content of the clay soil (Table 1). There was no clear
temporal variation pattern in WEOC during the grow- Some very small differences in soil N2O concentrationbetween crop types (15–50 nmol mol�1) were found toing season, indicating that neither harvesting nor crop
growth patterns had a major impact on WEOC contents. be statistically significant at sampling dates when N2Oconcentrations were near ambient levels (Harlaka siteDifferences in WEOC between crop types were small
in both soils at the Harlaka site in 2001, but the WEOC in 2002) (Fig. 6). On those sampling dates, coefficientsof variation of mean soil N2O concentrations were oftencontents under alfalfa and timothy were consistently
greater than under soybean in 2002. Contents of WEOC �3% (data not shown) and resulted in statistical signifi-cance of very small differences between crop types. Thein soils are usually related to vegetation type and
amounts of plant litter returned to the soil (Chantigny, lowest N2O concentrations were never found under al-falfa on any of those sampling dates and the highest2003). The higher WEOC contents in soils under peren-
nial crops likely reflect their greater root biomass and values were nearly always found under legume crops(21 of the 24 dates) (Fig. 6). These results suggest thatbelowground C inputs compared to annual crops (Bolin-
der et al., 1997, 2002). the presence of legumes induced slightly higher back-ground soil N2O concentrations than timothy either di-rectly by rhizobia denitrification (O’Hara and Daniel,Nitrous Oxide Concentration in Soil1985) or indirectly by increasing inputs of N to the soil
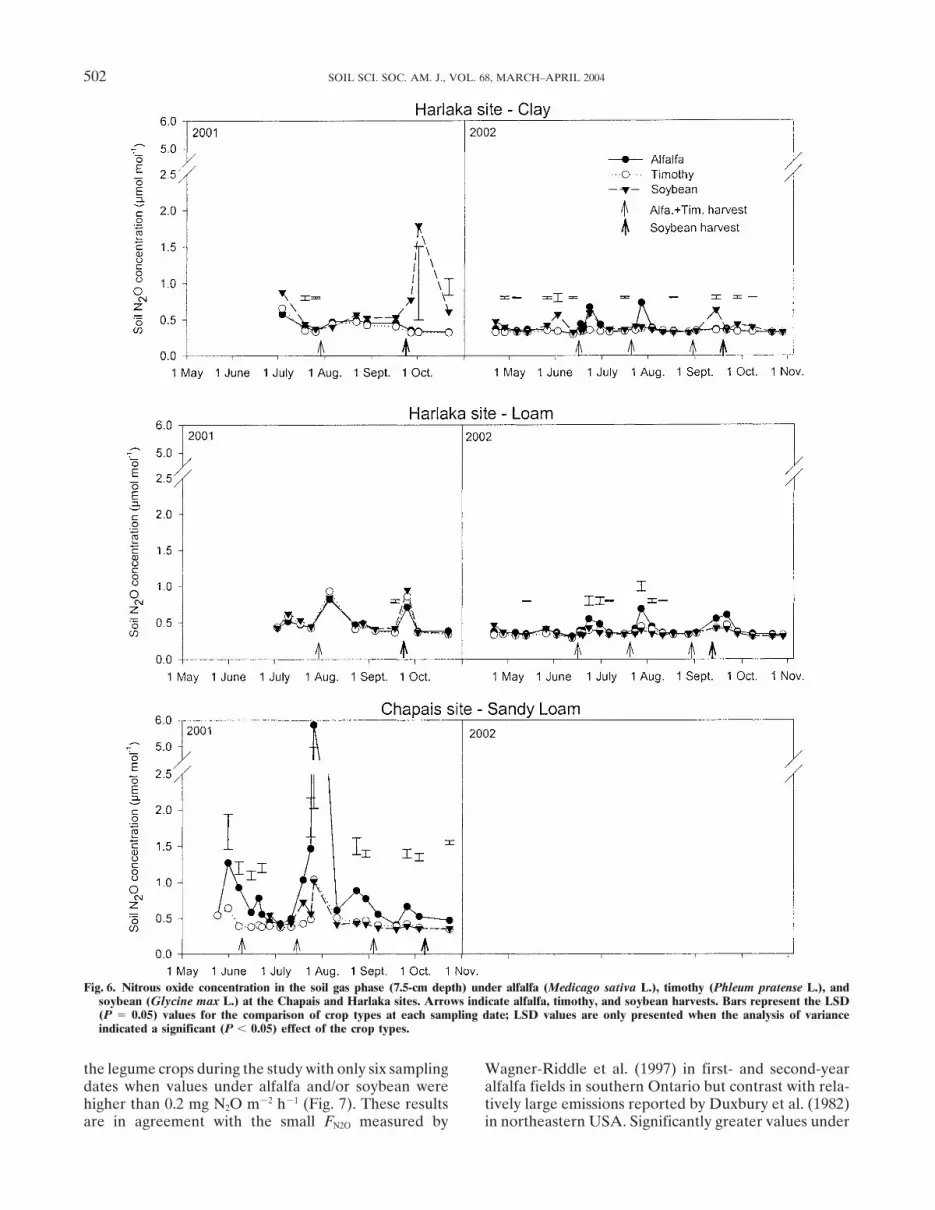
Accumulation of soil N2O at a given location occurs (Ta et al., 1986). However, the ecological significancewhen the rates of N2O reduction and net transport are of this small increase in N2O concentration for the Nlower than those of N2O production, mostly by nitrifica- cycling in the soil–plant–atmosphere system remains totion and denitrification. Soil N2O concentrations were be demonstrated.low during most of the study under all crops, except Soil N2O concentrations under alfalfa were increasedfor occasional increases under the legumes, particularly by approximately two-fold following the first two har-under the fourth-year alfalfa (Chapais site in 2001) vests in 2002 at the Harlaka site (Fig. 6). Increases inwhere the concentration reached 6�mol mol�1 after the soil N2O often occurred shortly after alfalfa harvests,first harvest (Fig. 6). Burton et al. (1997) also reported thus suggesting that crop harvest had an effect ongenerally low soil N2O concentrations under first-year sources of N2O in the soil–alfalfa system. However,alfalfa except for two short periods of higher concentra- these values were not significantly different from thosetions (up to 200 �mol mol�1 at 10 cm) following precipi- under the other two crops because of a high variabilitytation events. They attributed the higher N2O concentra- among replications on those sampling dates. We suggesttion under alfalfa than under fallow to the contribution that the large spatial heterogeneity of N2O formationof the legume crop to soil C and N throughout the soil and consumption processes in soils is such that statisti-profile; this input of N and C substrates at depth resulted cally significant differences were more difficult to obtainin increased N2O concentrations when the infiltration in periods of increased N2O dynamics compared withof rainfall water stimulated denitrification and increased periods of lower activity.resistance to gas transfer.
As for soil mineral N contents, lowest soil N2O con- Nitrous Oxide Emissionscentrations were found under timothy (�1 �mol mol�1),thus suggesting that the small rates of N2O production Seasonal variations in FN2O were similar to those in
soil N2O concentrations (Fig. 6 and 7). Fluxes were verywere limited by NO3–N availability (Beauchamp et al.,1996). There was, however, no clear relationship be- small (�0.1 mg N2O m�2 h�1) under timothy except on
the first 2001 sampling date in the clay soil at the Harlakatween soil mineral N content and soil N2O accumulationin our study. For example, the largest increase in soil site. Our values under timothy compare well with aver-
age fluxes from nonfertilized grasslands reported byN2O at the Harlaka-clay site was observed late in 2001under soybean (1.7 �mol mol�1) following the largest Christensen (1983) (0.044 mg N2O m�2 h�1), Velthof et
al. (1996) (0.044 mg N2O m�2 h�1), and Wagner-Riddlerainfall of the season (Fig. 6). This accumulation likely
ROCHETTE ET AL.: EMISSIONS OF N2O FROM ALFALFA AND SOYBEAN CROPS 501
Fig. 5. Water-extractable organic carbon (WEOC) (7.5-cm depth) under alfalfa (Medicago sativa L.), timothy (Phleum pratense L.), and soybean(Glycine max L.) at the Chapais and Harlaka sites. Arrows indicate alfalfa, timothy, and soybean harvests. Bars represent the LSD (P � 0.05)values for the comparison of crop types at each sampling date; LSD values are only presented when the analysis of variance indicated asignificant (P � 0.05) effect of the crop types.
et al. (1997) (0.013 mg N2O m�2 h�1). Low FN2O values eral N during the growing season (Fig. 3 and 4) and thelow timothy DM and N yield (Table 2).under timothy are in agreement with the tight N cycle
in this system as indicated by the constant low soil min- Nitrous oxide fluxes were also generally low under
502 SOIL SCI. SOC. AM. J., VOL. 68, MARCH–APRIL 2004
Fig. 6. Nitrous oxide concentration in the soil gas phase (7.5-cm depth) under alfalfa (Medicago sativa L.), timothy (Phleum pratense L.), andsoybean (Glycine max L.) at the Chapais and Harlaka sites. Arrows indicate alfalfa, timothy, and soybean harvests. Bars represent the LSD(P � 0.05) values for the comparison of crop types at each sampling date; LSD values are only presented when the analysis of varianceindicated a significant (P � 0.05) effect of the crop types.
the legume crops during the study with only six sampling Wagner-Riddle et al. (1997) in first- and second-yearalfalfa fields in southern Ontario but contrast with rela-dates when values under alfalfa and/or soybean were
higher than 0.2 mg N2O m�2 h�1 (Fig. 7). These results tively large emissions reported by Duxbury et al. (1982)in northeastern USA. Significantly greater values underare in agreement with the small FN2O measured by
ROCHETTE ET AL.: EMISSIONS OF N2O FROM ALFALFA AND SOYBEAN CROPS 503
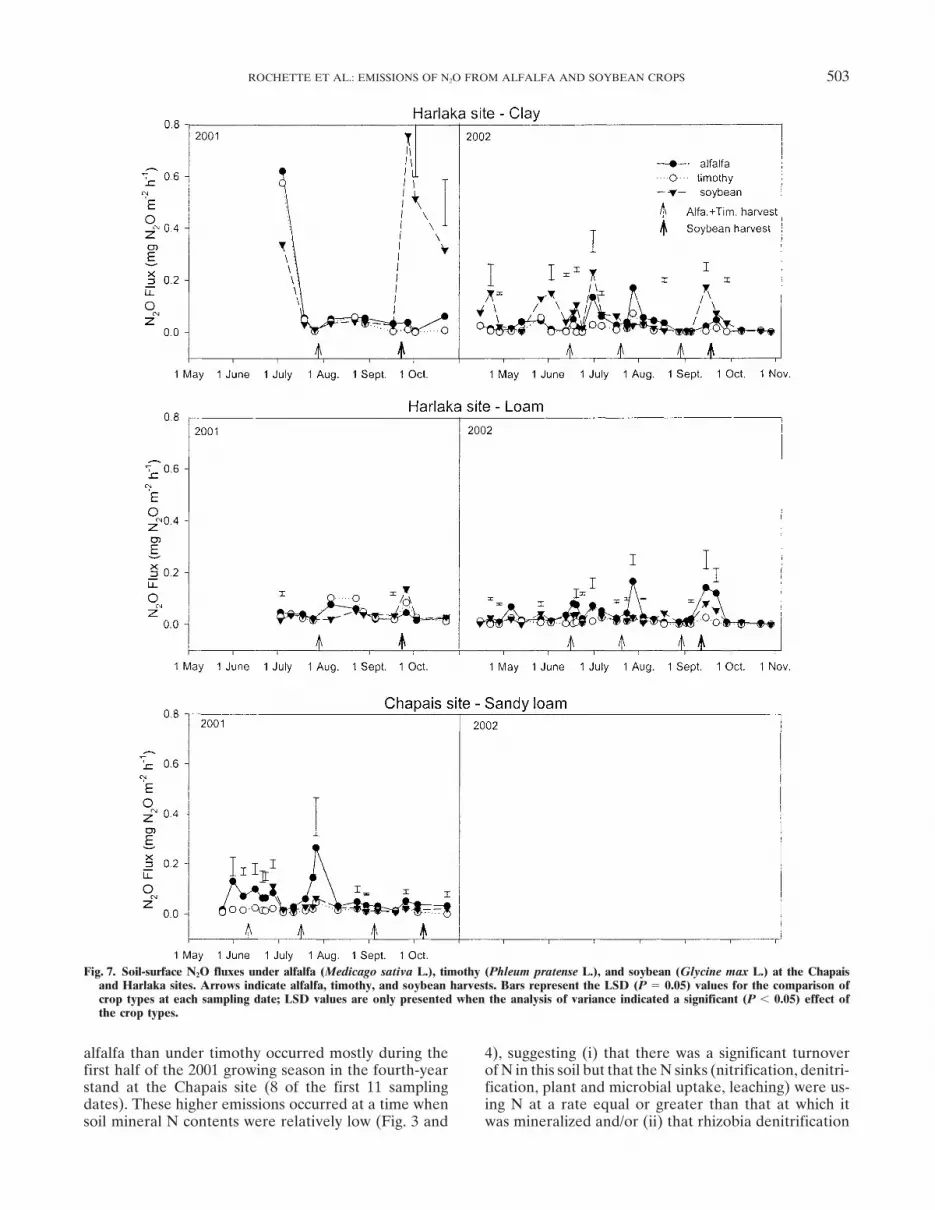
Fig. 7. Soil-surface N2O fluxes under alfalfa (Medicago sativa L.), timothy (Phleum pratense L.), and soybean (Glycine max L.) at the Chapaisand Harlaka sites. Arrows indicate alfalfa, timothy, and soybean harvests. Bars represent the LSD (P � 0.05) values for the comparison ofcrop types at each sampling date; LSD values are only presented when the analysis of variance indicated a significant (P � 0.05) effect ofthe crop types.
alfalfa than under timothy occurred mostly during the 4), suggesting (i) that there was a significant turnoverof N in this soil but that the N sinks (nitrification, denitri-first half of the 2001 growing season in the fourth-year
stand at the Chapais site (8 of the first 11 sampling fication, plant and microbial uptake, leaching) were us-ing N at a rate equal or greater than that at which itdates). These higher emissions occurred at a time when
soil mineral N contents were relatively low (Fig. 3 and was mineralized and/or (ii) that rhizobia denitrification
504 SOIL SCI. SOC. AM. J., VOL. 68, MARCH–APRIL 2004
(O’Hara and Daniel, 1985) was contributing to FN2O. In high (Fig. 2). Again, close coupling between sources andsinks of C and N may explain the absence of variations inthe sandy loam at the Harlaka site (2002), FN2O were
also increased on several sampling dates under the sec- WEOC and soil mineral N pools during that period(Fig. 3, 4, and 5). High postharvest emission episodesond-year alfalfa compared with timothy. Interestingly,
these differences occurred even if fluxes were very low, were not seen in the coarse-textured soils at Harlakaand Chapais, suggesting that soil type played a majorsuggesting that the soil–alfalfa system was a weak but
constantly greater source of N2O than the soil–timothy role in determining the N2O emissions during the trans-formation of soybean crop residue N.system. Robertson et al. (2000) also reported greater
FN2O in alfalfa than in adjacent successional plots butthe differences were greater than in our study. Cumulative N2O-N Emissions
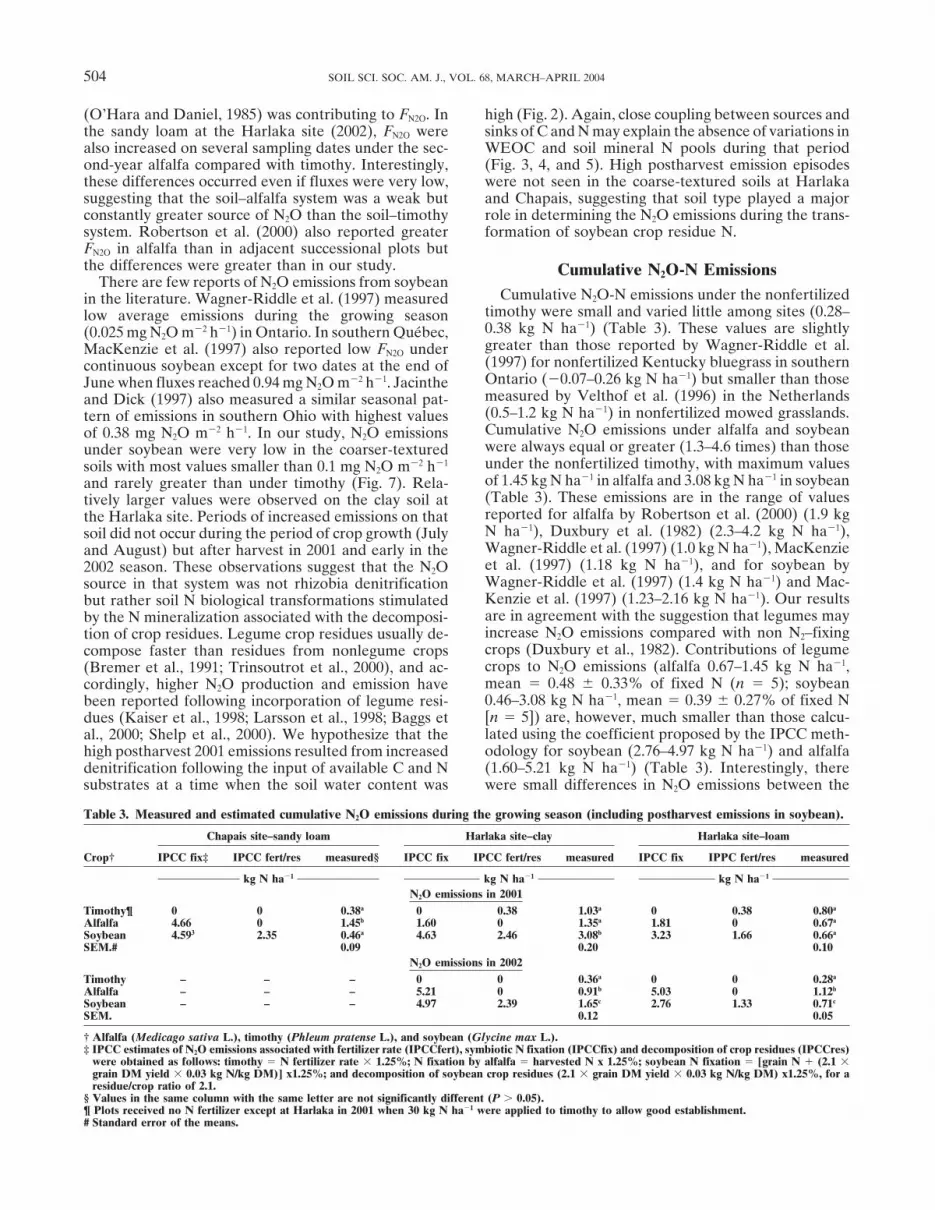
There are few reports of N2O emissions from soybeanCumulative N2O-N emissions under the nonfertilizedin the literature. Wagner-Riddle et al. (1997) measured
timothy were small and varied little among sites (0.28–low average emissions during the growing season0.38 kg N ha�1) (Table 3). These values are slightly(0.025 mg N2O m�2 h�1) in Ontario. In southern Quebec,greater than those reported by Wagner-Riddle et al.MacKenzie et al. (1997) also reported low FN2O under(1997) for nonfertilized Kentucky bluegrass in southerncontinuous soybean except for two dates at the end ofOntario (�0.07–0.26 kg N ha�1) but smaller than thoseJune when fluxes reached 0.94 mg N2O m�2 h�1. Jacinthemeasured by Velthof et al. (1996) in the Netherlandsand Dick (1997) also measured a similar seasonal pat-(0.5–1.2 kg N ha�1) in nonfertilized mowed grasslands.tern of emissions in southern Ohio with highest valuesCumulative N2O emissions under alfalfa and soybeanof 0.38 mg N2O m�2 h�1. In our study, N2O emissionswere always equal or greater (1.3–4.6 times) than thoseunder soybean were very low in the coarser-texturedunder the nonfertilized timothy, with maximum valuessoils with most values smaller than 0.1 mg N2O m�2 h�1
of 1.45 kg N ha�1 in alfalfa and 3.08 kg N ha�1 in soybeanand rarely greater than under timothy (Fig. 7). Rela-(Table 3). These emissions are in the range of valuestively larger values were observed on the clay soil atreported for alfalfa by Robertson et al. (2000) (1.9 kgthe Harlaka site. Periods of increased emissions on thatN ha�1), Duxbury et al. (1982) (2.3–4.2 kg N ha�1),soil did not occur during the period of crop growth (JulyWagner-Riddle et al. (1997) (1.0 kg N ha�1), MacKenzieand August) but after harvest in 2001 and early in theet al. (1997) (1.18 kg N ha�1), and for soybean by2002 season. These observations suggest that the N2OWagner-Riddle et al. (1997) (1.4 kg N ha�1) and Mac-source in that system was not rhizobia denitrificationKenzie et al. (1997) (1.23–2.16 kg N ha�1). Our resultsbut rather soil N biological transformations stimulatedare in agreement with the suggestion that legumes mayby the N mineralization associated with the decomposi-increase N2O emissions compared with non N2–fixingtion of crop residues. Legume crop residues usually de-crops (Duxbury et al., 1982). Contributions of legumecompose faster than residues from nonlegume cropscrops to N2O emissions (alfalfa 0.67–1.45 kg N ha�1,(Bremer et al., 1991; Trinsoutrot et al., 2000), and ac-mean � 0.48 0.33% of fixed N (n � 5); soybeancordingly, higher N2O production and emission have0.46–3.08 kg N ha�1, mean � 0.39 0.27% of fixed Nbeen reported following incorporation of legume resi-[n � 5]) are, however, much smaller than those calcu-dues (Kaiser et al., 1998; Larsson et al., 1998; Baggs etlated using the coefficient proposed by the IPCC meth-al., 2000; Shelp et al., 2000). We hypothesize that theodology for soybean (2.76–4.97 kg N ha�1) and alfalfahigh postharvest 2001 emissions resulted from increased(1.60–5.21 kg N ha�1) (Table 3). Interestingly, theredenitrification following the input of available C and N
substrates at a time when the soil water content was were small differences in N2O emissions between the
Table 3. Measured and estimated cumulative N2O emissions during the growing season (including postharvest emissions in soybean).
Chapais site–sandy loam Harlaka site–clay Harlaka site–loam
Crop† IPCC fix‡ IPCC fert/res measured§ IPCC fix IPCC fert/res measured IPCC fix IPPC fert/res measured
kg N ha�1 kg N ha�1 kg N ha�1
N2O emissions in 2001Timothy¶ 0 0 0.38a 0 0.38 1.03a 0 0.38 0.80a
Alfalfa 4.66 0 1.45b 1.60 0 1.35a 1.81 0 0.67a
Soybean 4.593 2.35 0.46a 4.63 2.46 3.08b 3.23 1.66 0.66a
SEM.# 0.09 0.20 0.10N2O emissions in 2002
Timothy – – – 0 0 0.36a 0 0 0.28a
Alfalfa – – – 5.21 0 0.91b 5.03 0 1.12b
Soybean – – – 4.97 2.39 1.65c 2.76 1.33 0.71c
SEM. 0.12 0.05
† Alfalfa (Medicago sativa L.), timothy (Phleum pratense L.), and soybean (Glycine max L.).‡ IPCC estimates of N2O emissions associated with fertilizer rate (IPCCfert), symbiotic N fixation (IPCCfix) and decomposition of crop residues (IPCCres)
were obtained as follows: timothy � N fertilizer rate � 1.25%; N fixation by alfalfa � harvested N x 1.25%; soybean N fixation � [grain N � (2.1 �grain DM yield � 0.03 kg N/kg DM)] x1.25%; and decomposition of soybean crop residues (2.1 � grain DM yield � 0.03 kg N/kg DM) x1.25%, for aresidue/crop ratio of 2.1.
§ Values in the same column with the same letter are not significantly different (P 0.05).¶ Plots received no N fertilizer except at Harlaka in 2001 when 30 kg N ha�1 were applied to timothy to allow good establishment.# Standard error of the means.
ROCHETTE ET AL.: EMISSIONS OF N2O FROM ALFALFA AND SOYBEAN CROPS 505
analysis, plot maintenance, and statistical analysis. This projectlightly fertilized timothy (30 kg N ha�1) and the legumewas partly funded by the Pollution Data Branch of Environ-plots in 2001 at the Harlaka site. Moreover, N2O emis-ment Canada.sions under the lightly fertilized timothy on the loam
soil (Harlaka in 2001) were even greater than underREFERENCESalfalfa and soybean where amounts up to 145 kg N ha�1
were uptaken by the crop. Baggs, E.M., R.M. Rees, K.A. Smith, and J.A. Vinten. 2000. NitrousOur results suggest that the assumption that legume oxide emission from soils after incorporating crop residues. Soil
Use Manage. 16:82–87.cropping produces N2O emissions as high as when N isBeauchamp, E.G., D.W. Bergstrom, and D.L. Burton. 1996. Denitrifi-added as mineral fertilizers (IPCC, 1997) may often not
cation and nitrous oxide production in soil fallowed or under alfalfabe valid in eastern Canada. However, we may have or grass. Commun. Soil Sci. Plant Anal. 27:87–99.underestimated the cumulative N2O losses because Belanger, G., T. Kunelius, D. McKenzie, Y.A. Papadopoulos, B.
Thomas, K. McRae, S. Fillmore, and B. Christie. 1999. Fall cuttingemissions may have occurred during spring thaw whenmanagement affects yield and persistence of alfalfa in Atlanticchambers could not be used (Christensen and Tiedje,Canada. Can. J. Plant Sci. 79:57–63.1990; Flessa et al., 1995). Wagner-Riddle et al. (1997) Belanger, G., and J.E. Richards. 1997. Growth analysis of timothy
reported high spring thaw N2O emissions in Southern grown with varying N nutrition. Can. J. Plant Sci. 77:373–380.Ontario in cropping systems where organic amendments Belanger, G., and J.E. Richards. 2000. Dynamics of biomass and N
accumulation of alfalfa under three N fertilization rates. Plantwere added during the previous fall. However, theySoil 219:177–185.observed no significant increase in N2O emissions during
Bolinder, M.A., D.A. Angers, G. Belanger, R. Michaud, and M.R.spring thaw under alfalfa. It is also unknown to what Laverdiere. 2002. Root biomass and shoot to root ratios of peren-extent the below-average rainfall in 2001 and 2002 may nial forage crops in eastern Canada. Can. J. Plant Sci. 82:731–737.
Bolinder, M.A., D.A. Angers, and J.-P. Dubuc. 1997. Estimating shoothave decreased soil denitrification activity and N2O pro-to root ratios and annual carbon inputs in soils for cereal crops.duction compared with a year with near or above aver-Agric. Ecosyst. Environ. 63:61–66.age rainfall. Breitenbeck, G.A., and J.M. Bremner. 1989. Ability of free-living
For greenhouse gas accounting purposes, the other Bradyrhizobium japonicum to denitrify nitrate in soils. Biol. Fertil.source of N2O emissions associated with soybean pro- Soils 7:219–224.
Bremer, E., W. van Houtum, and C. van Kessel. 1991. Carbon dioxideduction is through the decomposition of crop residuesevolution from wheat and lentil residues as affected by grinding,(IPCC, 1997). The large N2O emissions (approximatelyadded nitrogen, and the absence of soil. Biol. Fertil. Soils 11:221–3 kg N2O-N ha�1) measured after soybean harvest (Har- 227.
laka-clay 2001) and early in the following growing sea- Bremner, J.M. 1997. Sources of nitrous oxide in soils. Nutr. CyclingAgroecosyst. 49:7–16.son indicate that soybean crop residues are a source
Burton, D.L., D.W. Bergstrom, J.A. Convert, C. Wagner-Riddle, andof C and N substrates that can induce significant N2OE.G. Beauchamp. 1997. Three methods to estimate N2O fluxes asproduction in agricultural soils (Table 3). However, the impacted by agricultural management. Can. J. Soil Sci. 77:125–134.
contribution of soybean crop residues to N2O emissions Calderon, F.J., L.E. Jackson, K.M. Scow, and D.E. Rolston. 2001.could not be detected in the other four situations investi- Short-term dynamics of nitrogen, microbial activity, and phospho-
lipid fatty acids after tillage. Soil Sci. Soc. Am. J. 65:118–126.gated, thus suggesting a strong interaction between N2OCarpenter-Boggs, L., J.L. Pikul, Jr., M.F. Vigil, and W.E. Riedell.emissions, soil, and climatic conditions.
2000. Soil nitrogen mineralization influenced by crop rotation andnitrogen fertilization. Soil Sci. Soc. Am. J. 64:2038–2045.
Chantigny, M.H. 2003. Dissolved and water-extractable organic mat-CONCLUSIONSter in soils: A review on the influence of land use and managementpractices. Geoderma 113:357–380.Emissions of N2O were small under the unfertilized
Christensen, S. 1983. Nitrous oxide emission from a soil under perma-grass where very low soil mineral N contents probablynent grass: Seasonal and diurnal fluctuations as influenced by ma-limited denitrification and N2O production. Soil mineral nuring and fertilization. Soil Biol. Biochem. 15:531–536.
N contents under legumes were up to 10 times greater Christensen, S., and J.M. Tiedje. 1990. Brief and vigorous N2O produc-than under grasses. However, soil mineral N contents tion by soil at spring thaw. J. Soil Sci. 41:1–4.
Desjardins, R.L., and R. Riznek. 2000. Agricultural greenhouse gasand FN2O were not closely related, thus suggesting thatbudget. p. 133–140. In T. McRae (ed) Environmental sustainabilitythe soil mineral N pool was a poor indicator of theof Canadian agriculture: Report of the agri-environmental indica-intensity of N2O production processes. Higher N2O tor project. Agriculture and Agri-Food Canada, Ottawa, ON.
fluxes were measured under legumes than under grasses Duxbury, J.M., D.R. Bouldin, R.E. Terry, and R.L. Tate, III. 1982.Emissions of nitrous oxide from soils. Nature 298:462–464.in only 6 out of 10 field comparisons. Moreover, the
Elgersma, A., and J. Hassink. 1997. Effects of white clover (Trifoliumemissions associated with N2–fixing crops were consider-repens L.) on plant and soil nitrogen and soil organic matter inably smaller than those predicted using the emission mixtures with perennial ryegrass (Lolium perenne L.). Plant Soil
coefficient proposed for the national inventory of green- 197:177–186.house gases (1.25% of fixed N) (IPCC, 1997). We con- Flessa, H., P. Doersch, and F. Beese. 1995. Seasonal variation of N2O
and CH4 fluxes in differently managed arable soils in southernclude that the use of the IPCC coefficient may overesti-Germany. J. Geophys. Res. 100:23115–23124.mate the N2O emissions associated with soybean and
Gil, J.L., and W.H. Fick. 2001. Soil nitrogen mineralization in mixturesalfalfa production in eastern Canada. of eastern gamagrass with alfalfa and red clover. Agron. J. 93:902–910.
IPCC. 1997. Greenhouse gas reference manual: Revised 1996 IPCCACKNOWLEDGMENTSguidelines for national greenhouse gas inventories. Reference Vol. 3.
We thank D. Mongrain, I. Morasse, N. Bertrand, J.-P. J.T. Houghton et al. (ed.) available at: http://www.ipcc-nggip.iges.or.Soucy, A. Toussaint, N. Bissonnette, P. Jolicoeur, and B. Gag- jp/public/gl/invs6.htm (verified 1 Dec. 2003).
IPCC. 2001. Climate change 2001: The scientific basis. Contributionnon for assistance in soil–surface gas flux measurements, soil
506 SOIL SCI. SOC. AM. J., VOL. 68, MARCH–APRIL 2004
of working group I to the third assessment report of the Intergov- tions of soil nitrogen pools in response to alfalfa roots systems andshoot mulch. Agron. J. 91:471–477.ernmental Panel on Climate Change. J.T. Houghton et al. (ed).
Richards, E.J. 1993. Chemical characterization of plant tissue. p. 115–Cambridge University Press, Cambridge, UK.139. In M.R. Carter (ed.) Soil sampling and methods of analysis.Jacinthe, P.-A., and W.A. Dick. 1997. Soil management and nitrousLewis Publ., Boca Raton, FL.oxide emissions from cultivated fields in Southern Ohio. Soil Tillage
Robertson, F.A., R.J.K. Myers, and P.G. Saffigna. 1993. Carbon andRes. 41:221–235.nitrogen mineralization in cultivated and grasslands soils in sub-Janzen, H.H., R.L. Desjardins, J.M.R. Asselin, and B. Grace. 1999.tropical Queensland. Aust. J. Soil Res. 31:611–619.The health of our air: Towards sustainable agriculture in Canada.
Robertson, G.P., E.A. Paul, and R.R. Harwood. 2000. GreenhousePublication 1981/E. Agriculture and Agri-Food Canada Researchgases in intensive agriculture: Contributions of individual gases toBranch, Ottawa, ON.the radiative forcing of the atmosphere. Science 289:1922–1925.Jarvis, S.C., E.A. Stockdale, M.A. Shepherd, and D.S. Powlson. 1996.
Rochette, P., and G.L. Hutchinson. 2004. Measuring soil respirationNitrogen mineralization in temperate agricultural soils: Processin situ: Chamber techniques. In J. Hatfield, (ed.) Micromet studiesand measurement. Adv. Agron. 57:187–235.of the soil-plant-atmosphere continuum. ASA monograph. (in press).Kaiser, E.-A., K. Kohrs, M. Kucke, E. Schnug, O. Heinemeyer, and SAS Institute Inc. 1990. SAS/STAT user’s guide, Vol. 1 and 2. Ver.
J.C. Munch. 1998. Nitrous oxide release from arable soil: Impor- 6. 4th ed. SAS Institute Inc, Cary, NC.tance of N-fertilization, crops and temporal variation. Soil Biol. Shelp, M.L., E.G. Beauchamp, and G.W. Thurthell. 2000. NitrousBiochem. 30:1553–1563. oxide emissions from soil amended with glucose, alfalfa or maize
Kelner, D.J., J.K. Vessey, and M.H. Entz. 1997. The nitrogen dynamics residues. Commun. Soil Plant Anal. 31:877–892.of 1-, 2- and 3-year stands of alfalfa in a cropping system. Agric. Schertz, D.L., and D.A. Miller. 1972. Nitrate-N accumulation in theEcosyst. Environ. 64:1–10. soil under alfalfa. Agron. J. 64:660–664.
Kim, T.H., A. Ourry, J. Boucaud, and G. Lemaire. 1991. Changes in Staggenborg, S.A., D.A. Whitney, D.L. Fjell, and J.P. Shroyer. 2003.sources-sink relationship for nitrogen during regrowth of lucerne Seeding and nitrogen rates required to optimize winter wheat yields(Medicago sativa. L.) following removal of shoots. Aust. J. Plant following grain sorghum and soybean. Agron. J. 95:253–259.Physiol. 18:593–602. Ta, T.C., F.D.H. MacDowall, and M.A. Faris. 1986. Excretion of
nitrogen assimilated from N2 fixed by nodulated roots of alfalfaKunelius, H.T., G.H. Durr, K.B. McRae, S.A.E. Fillmore, G. Belanger,(Medicago sativa). Can. J. Bot. 64:2063–2067.and Y.A. Papadopoulos. 2003. Yield, herbage composition, and
Trinsoutrot, I., S. Recous, B. Bentz, M. Lineres, D. Cheneby, and B.tillering of timothy cultivars under grazing. Can. J. Plant Sci. 83:Nicolardot. 2000. Biochemical quality of crop residues and carbon57–63.and nitrogen mineralization kinetics under nonlimiting nitrogenLarsson, L., M. Ferm, A. Kasimir-Klemedtsson, and L. Klemedtsson.conditions. Soil Sci. Soc. Am. J. 64:918–926.1998. Ammonia and nitrous oxide emissions from grass and alfalfa
Tremblay, G.J., L. Gagnon, and M. Saulnier. 2002. Effet de la densitemulches. Nutr. Cycling Agroecosyst. 51:41–46.de peuplement sur trois cultivars. Can. J. Plant Sci. 82:675–680.Livingston, G.P., and G.L. Hutchinson. 1995. Enclosure-based mea-
Vance, C.P. 1997. Nitrogen fixation capacity. p. 375–407. In B.D.surement of trace gas exchange: Applications and sources of error.McKersie and D.C.W. Brown (ed.) Biotechnology and the improve-p. 14–51. In P.A. Matson and R.C. Harriss (ed.) Biogenic tracement of forage legumes. CAB International, Wallingford, UK.gases: Measuring emissions from soil and water. Blackwell Science
Vance, C.P., G.H. Heichel, D.K. Barnes, J.W. Bryan, and L.E. John-Ltd., Oxford, UK. son. 1979. Nitrogen fixation, nodule development, and vegetativeMacKenzie, A.F., M.X. Fan, and F. Cadrin. 1997. Nitrous oxide emis- regrowth of alfalfa (Medicago sativa) following harvest. Plant Phys-
sion as affected by tillage, maize-soybean-alfalfa rotations and ni- iol. 64:1–8.trogen fertilization. Can. J. Soil Sci. 77:145–152. Velthof, G.L., A.B. Brader, and O. Oenema. 1996. Seasonal variations
Mayer, J., F. Buegger, E.S. Jensen, M. Schloter, and J. Heb. 2003. in nitrous oxide losses from managed grasslands in The Nether-Estimating N rhizodeposition of grain legumes using a 15N in situ lands. Plant Soil 181:263–274.stem labelling method. Soil Biol. Biochem. 35:21–28. Wagner-Riddle, C., G.W. Thurtell, G.E. Kidd, E.G. Beauchamp, and
O’Hara, G.W., and R.M. Daniel. 1985. Rhizobial denitrification: A R. Sweetman. 1997. Estimates of nitrous oxide emissions fromreview. Soil Biol. Biochem. 17:1–9. agricultural fields over 28 months. Can. J. Soil Sci. 77:135–144.
Piper, J.K. 1993. Soil water and nutrient change in stands of three Walley, F.L., G.O. Tomm, A. Matus, A.E. Slinkard, and C. van Kessel.perennial crops. Soil Sci. Soc. Am. J. 57:497–505. 1996. Allocation and cycling of nitrogen in an alfalfa-bromegrass
sward. Agron. J. 88:834–843.Rasse, D.P., A.J.M. Smucker, and O. Schabenberger. 1999. Modifica-