4f crops: future crops for food, feed, fiber and fuel
TRANSCRIPT
44FF CCRROOPPSS:: FFuuttuurree CCrrooppss ffoorr FFoooodd,, FFeeeedd,, FFiibbeerr aanndd FFuueell
Life cycle analyses (LCA) Final report on Tasks 4.2 & 4.3
Deliverable №: 13 Lead beneficiary: IFEU Delivery date: November 2009 Dissemination level: Public
Grant agreement №: 212811 (FP7-KBBE-2007-1-3-01) Duration: 01/06/2008 – 30/11/2010
Heidelberg, April 2010
FIBER FUEL FOOD FEED
ifeu - Institute for Energy andEnvironmental Research Heidelberg GmbH

The research leading to these results has received funding from the European Union Seventh Framework Programme (FP7/2007-2013) under grant agreement № 212811.
4F CROPS: Future Crops for Food, Feed, Fiber and Fuel
Life cycle analyses (LCA) Final report on Tasks 4.2 & 4.3
Authors:
Dipl.-Geoökol. Nils Rettenmaier
Dipl.-Landschaftsökol. Susanne Köppen
Dipl.-Phys. Ing. Sven Gärtner
Dr. Guido Reinhardt
ifeu – Institute for Energy and Environmental Research Heidelberg GmbH Wilckensstraße 3 D-69120 Heidelberg Phone: +49 (0)6221 47 67-0; Fax: -19 http://www.ifeu.de
Heidelberg, April 2010
II 4F CROPS – D 13: Life cycle analyses (LCA) IFEU Heidelberg
Abbreviations
Abbreviation Explanation
1,3-PDO 1,3-propanediol
BtL Biomass-to-Liquid; thermochemical process yielding liquid biofuels from biomass
C2H4 Ethylene
CFC-11 Trichlorofluoromethane (freon-11 / R-11); ozone-depleting chlorofluorocarbon
CH4 Methane
CHP Combined heat and power (plant)
CO2 Carbon dioxide
DDGS Distillers’ Dried Grains with Solubles; co-product of distillation used as animal feed
eq. Equivalent
EtOH Ethanol; biofuel / biochemical made from sugar, starch or lignocellulosic crops
EU27 All countries that are currently part of the European Union
FAME Fatty Acid Methyl Ester; biodiesel
FT (diesel) Fischer-Tropsch (diesel); chemical process yielding liquid biofuel from syngas
GHG Greenhouse gas(es)
GJ Gigajoule (109 Joule)
ha Hectare (104 m2)
HC Hydrocarbons
HVO Hydrogenated Vegetable Oil; liquid biofuel made by hydrotreatment of vegetable oil
IE inhabitant equivalent, yearly environmental impact of an average European (EU27)
IPCC Intergovernmental Panel on Climate Change
LCA Life Cycle Analysis / Life Cycle Assessment
LUC Land-use change
N2O Nitrous oxide (Dinitrogen monoxide)
NOX Generic term for nitrogen oxides
PM10 Particulate matter; fine particles with a diameter of < 10 µm, linked to health hazards
PO4 Phosphate
POCP Photochemical Ozone Creation Potential
RE Renewable Energy
RME Rapeseed oil Methyl Ester; biodiesel made from rapeseed oil
SO2 Sulphur dioxide
SVO Straight Vegetable Oil; can be used as biofuel in technically modified diesel engines
t (Metric) tonne (106 g)
UCTE Union for the Co-ordination of Transmission of Electricity; association of electricity
distribution network operators in Continental Europe.
WP work package
yr year
IFEU Heidelberg 4F CROPS – D 13: Life cycle analyses (LCA) III
Table of Contents
1 Introduction 2
2 Methodology, specifications and data sources 4
2.1 Methodology 4
2.2 Specifications 5 2.2.1 General specifications in this study 5 2.2.2 Agricultural reference system 6 2.2.3 Environmental impact categories 9
2.3 Data sources 12
3 System description and scenarios 14
3.1 Selection of crops and environmental zones 14
3.2 Selection of conversion paths and products 16
3.3 Basic scenarios 18 3.3.1 Oil crops 18 3.3.2 Fiber crops 19 3.3.3 Woody and herbaceous lignocellulosic crops 20 3.3.4 Sugar crops 22
3.4 Reference scenarios: Variations and sensitivity analyses 24 3.4.1 Crop cultivation 24 3.4.2 Co-product use and allocation 28 3.4.3 Fossil reference system 31
4 Results 32
4.1 Exemplification of results 32
4.2 Basic scenarios 34 4.2.1 Oil crops 34 4.2.2 Fiber crops 40 4.2.3 Woody lignocellulosic crops 44 4.2.4 Herbaceous lignocellulosic crops 50 4.2.5 Sugar crops 60 4.2.6 Synopsis and conclusions 64
4.3 Reference scenarios: Variations and sensitivity analyses 66 4.3.1 Agricultural reference system 66 4.3.2 Yields 68 4.3.3 Co-product use and allocation 74 4.3.4 Fossil reference system 78
5 Summary and conclusions 82
6 References 84
7 Appendix 89
2 4F CROPS – D 13: Life cycle analyses (LCA) IFEU Heidelberg
1 Introduction
Background
The production and use of biomass for non-food purposes plays an increasing role in the European Union. The Renewable Energy Directive (2009/28/EC) fosters the use of biomass for energy in order to reduce greenhouse gas emissions, to increase the security of energy supply and to provide opportunities for employment and regional development /CEC 2009/. In addition, the use of biomass for bio-based materials or chemicals will gain in importance. In the absence of a European regulation, Germany has recently launched a national action plan on the increased use of biomass for non-food-non-energy purposes /BMELV 2009/.
However, the agricultural area within the European Union is limited. Therefore, an additional biomass production in order to meet the above mentioned goals puts more pressure on this limited area and increases the competition between the production of food, feed, fiber and fuel. In order to mitigate this competition and potential negative side-effects such as defores-tation, land use efficiency in the agricultural sector needs to be increased.
On this background the EU-funded project “4F CROPS – Future Crops for Food, Feed, Fiber and Fuel” has been initiated. The overall goal of this project is to analyse parameters that play an important role in establishing successful non-food cropping systems in the EU27. Within the project, work package 4 (WP 4) focuses on environmental parameters by investi-gating the environmental impacts associated with the production and use of future non-food crops which were selected in WP 2. Two assessment techniques were applied: environ-mental impact assessment (EIA) and life cycle assessment (LCA), the latter of which is in the focuses of this report.
In literature, hundreds of LCA studies on bioenergy and bio-based products can be found, covering a wide range of products (see e.g. review studies on biofuel LCAs by /Quirin et al. 2004/, /Larson 2006/, /von Blottnitz & Curran 2007/, /Menichetti & Otto 2009/). Usually, either different products originating from a certain crop or a certain product originating from different crops is investigated, but rarely a multitude of crops and products at the same time. More-over, the results of different LCA studies for the same product are known to vary quite sub-stantially, among others due to differences in accounting for co-products, in system bounda-ries or in basic data /Gnansounou et al. 2009/, /Cherubini et al. 2009/. Therefore, the as-sessment in WP 4 could not be based on a literature review but required own calculations in order to ensure unbiased comparisons. For this purpose, the crops selected in WP 2 were amended with conversion paths and products by IFEU taking into account important studies on the energy and / or material use of biomass such as /Patyk et al. 2000/, /Quirin et al. 2004/, /Werpy et al. 2004/, /Scheurlen et al. 2005/, /Patel et al. 2006/, /Bozell et al. 2007/, /Oertel 2007/, /Reinhardt et al. 2007/ and /van Beilen et al. 2007/.
This deliverable (D 13) covers the results of the screening life cycle analyses (LCA) per-formed under task 4.2 as well as the results of the modelling of dependencies and sensitivi-ties under task 4.3. These results serve the basis for task 4.4 and thereby contribute to the identification of best options which are presented in a separate deliverable (D 14).
IFEU Heidelberg 4F CROPS – D 13: Life cycle analyses (LCA) 3
Goal and scope
The overall goal of this report is to analyse by means of screening LCAs which environ-mental impacts are associated with the production and use of bioenergy and bio-based ma-terials from selected future crops and to compare them to the environmental impacts of their fossil or conventional equivalent products. Apart from that, dependencies and sensitivities are modelled and investigated using a multi-functional assessment tool.
In total, 15 future crops are assessed covering oil, fiber and sugar crops as well as woody and herbaceous lignocellulosic crops. The analysis covers seven different environmental zones within Europe and two non-food use options for the main products: their use either for bioenergy production (‘fuel’) or for producing bio-based materials (‘fiber’). The environmental impact categories to be assessed cover energy savings, greenhouse effect, acidification, eutrophication, summer smog, ozone depletion, and human toxicity.
The following main question and sub-questions are addressed in this report (D 13). Further environment-related questions will be answered in a separate report (D 14):
What are the environmental advantages and disadvantages of bioenergy and bio-based materials made from the selected crops in comparison to their fossil or conventional equivalents?
Which life cycle stages make the largest contribution to the overall results?
Are there opportunities to improve the environmental performance of bioenergy or bio-based materials?
What are the effects of the choices made regarding methods and data on the results?
Approach
Within WP 4, a multi-functional assessment tool was developed by IFEU to carry out all ana-lyses to be done under tasks 4.2, 4.3 and 4.4. First of all, this custom-made Microsoft® Excel based software tool was used to perform the life cycle assessments under task 4.2. It is able to simultaneously handle a large number of different bioenergy and biomaterial paths. The tool is linked to the continuously updated internal IFEU database /IFEU 2010/ as well as commercial databases such as /ecoinvent 2010/ and /GEMIS 2010/.
The tool was also used for the modelling of dependencies and sensitivities under task 4.3. For this purpose, the basic scenarios of task 4.2 were transferred into so-called reference scenarios by varying a number of parameters along the entire life cycle. Dozens of variations and sensitivity analyses were performed in order to identify multi-functional dependencies as well as opportunities to improve the environmental performance of products.
4 4F CROPS – D 13: Life cycle analyses (LCA) IFEU Heidelberg
2 Methodology, specifications and data sources
2.1 Methodology
The life cycle analyses (LCA) in this study are carried out largely following the guidelines of the ISO standards 14040 and 14044 on product life cycle assessment /ISO 2006/. Basically, the following aspects are covered by LCAs:
Inputs and outputs (biomass and other raw materials, energy and wastes, waste water, emissions etc.), which lead to
potential environmental impacts (e.g. use of resources and environmental conse-quences of releases such as greenhouse effect or acidification),
throughout the product’s entire life cycle from raw material acquisition through pro-duction (including co-products), use, end-of-life treatment, recycling and final disposal (“cradle-to-grave approach”).
The analyses in this study are so-called screening LCAs which follow the above mentioned ISO standards except for a) the level of detail of documentation, b) the quantity of sensitivity analyses and c) the mandatory critical review. Nevertheless, the results of these screening LCAs are quite reliable due to the close conformity with the standards. They describe basic interrelationships regarding selected environmental impact categories and give a conclusive overview. For more specific questions, they can be extended to a full LCA.
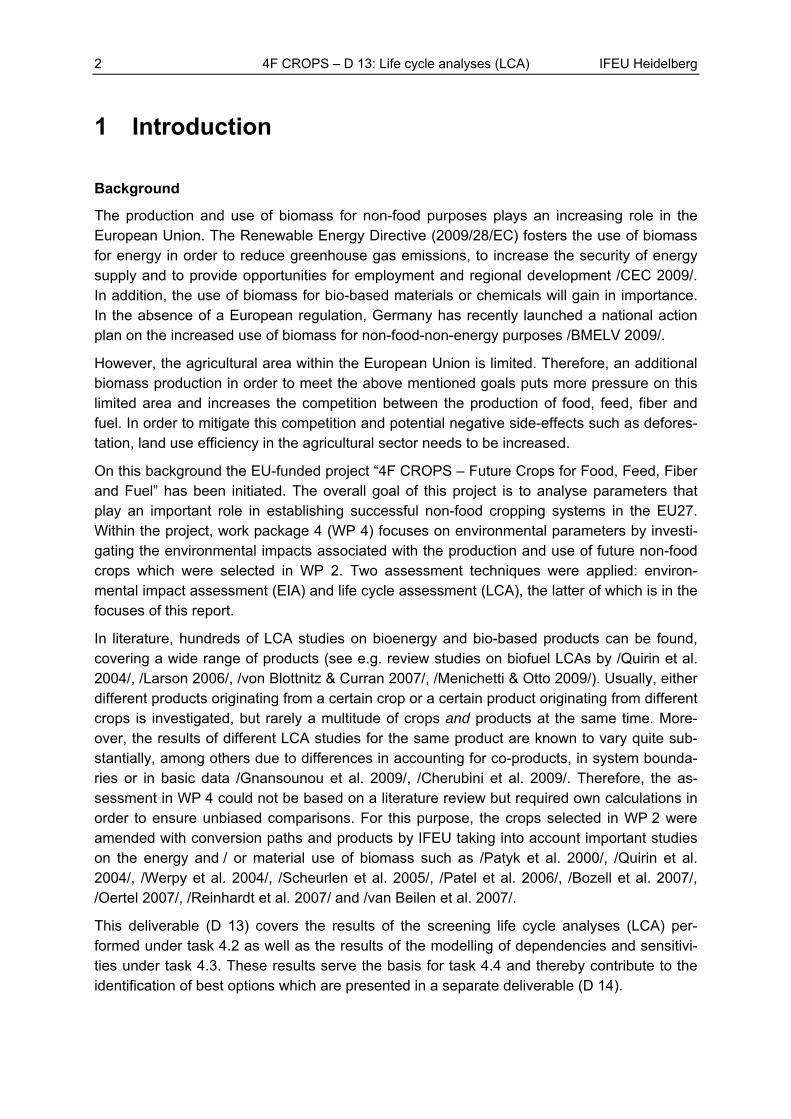
The basic feature of LCAs is the so-called life cycle comparison: for example, the entire life cycle of a bioenergy carrier is compared to the entire life cycle of non-renewable (fossil) en-ergy carrier (see example in Fig. 2-1).
Biomasscultivation
Conversion
Transport
Crude oilextraction
Refining
Transport
Bioenergy carrier
Foss. energycarrier
UseUse
Energy crop
Alternative land use
Co-productsEquivalentproducts
Product Reference systemProcess
Fig. 2-1 Exemplary schematic life cycle comparison between a bioenergy carrier and a non-renewable (fossil) energy carrier
IFEU Heidelberg 4F CROPS – D 13: Life cycle analyses (LCA) 5
With that, LCAs provide comprehensive information on environmental impacts, both for sin-gle production stages as well as for the life cycle as a whole. By means of variations and sensitivity analyses, multi-functional dependencies as well as opportunities to improve the environmental performance of products can be identified. Finally, interpretations and recom-mendations relevant for decision-makers in industry, government or non-government organi-sations can be derived from the results.
2.2 Specifications
2.2.1 General specifications in this study
System to be studied: This study covers the cultivation and use of 15 crops for non-food purposes in seven environmental zones within Europe covering five crop groups (oil, fi-ber, lignocellulose from woody and herbaceous biomass, sugar). It assesses the produc-tion and use of these crops for both bioenergy and biomaterial production replacing non-renewable (fossil) energy and conventional products, respectively. Fig. 2-1 shows such a schematic life cycle comparison, exemplified for bioenergy versus fossil energy.
Agricultural reference system: The agricultural reference system is an essential part of LCAs for agricultural products. It defines what the agricultural land would be used for if the investigated crop was not cultivated. In this study, fallow / set-aside land is taken as the default agricultural reference system. Further background information can be found in /Jungk et al. 2000/. More detailed descriptions on agricultural reference systems and variations thereof are given in chapter 2.2.2 and 3.4.1, respectively.
Functional unit: With agricultural land becoming increasingly scarce and land-use com-petitions between food / feed production and non-food applications aggravating, land-use efficiency is becoming a very relevant parameter /Reinhardt & Zemanek 2000/. There-fore, in this project the functional unit is defined as ‘useful output per hectare in an aver-age year’. The results will be referred to this unit.
Co-product allocation: In the standard scenarios, allocation is avoided by expanding the system boundaries as stipulated by the ISO standards 14040 and 14044 /ISO 2006/. Instead, the substitution method is applied where avoided environmental impacts due to the co-product use – which substitutes for a conventional product – are credited to the main product. For more details, see /Borken et al. 1999/ and chapter 3.4.2.
Environmental impact categories: The environmental impact categories covered in this study are energy savings, greenhouse effect, acidification, eutrophication, summer smog, ozone depletion as well as human toxicity. In order to increase the comparability between the categories, the results are normalised and displayed as ‘inhabitant equivalent’ (IE) per 100 hectares (ha). For further specification, see chapter 2.2.3.
Time-related coverage: In this study, the cropping systems are related to current condi-tions (2008). In order to cover future developments regarding yields the results are also calculated for 2020 and 2030 by means of a sensitivity analysis (see chapter 3.4.1).
6 4F CROPS – D 13: Life cycle analyses (LCA) IFEU Heidelberg
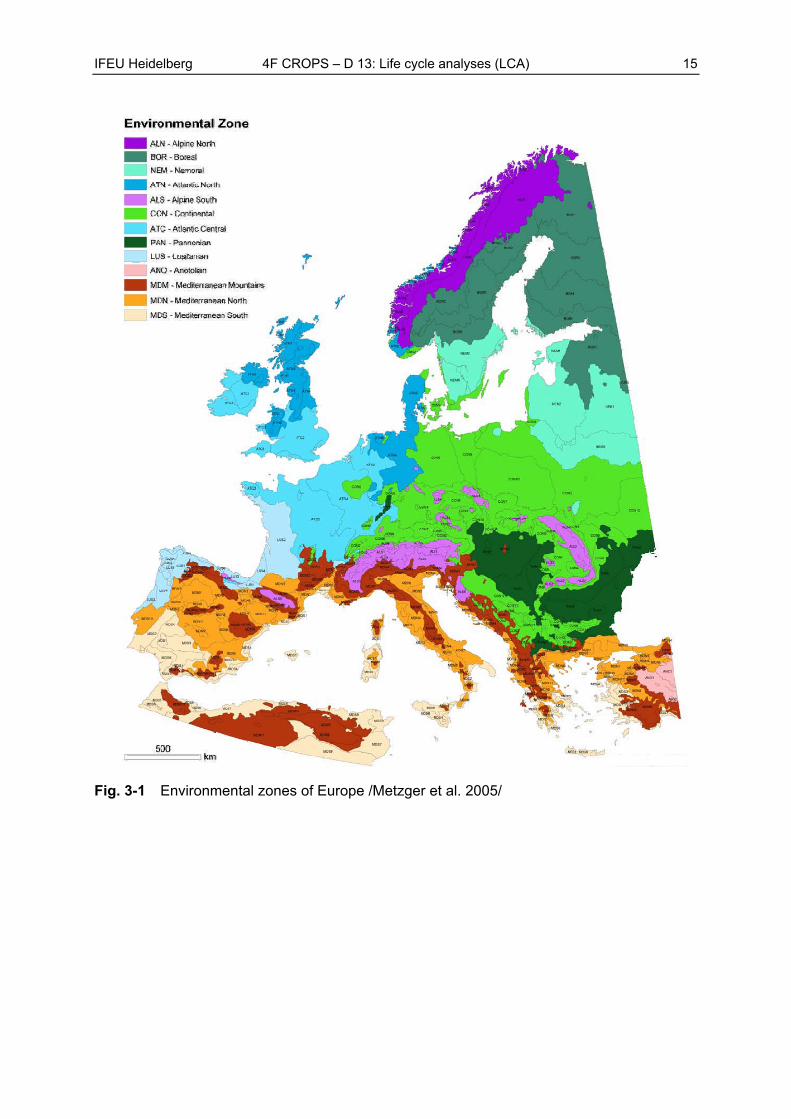
Geographical coverage: The geographical area covered in this study is the EU27. For an easier handling and in order to ensure the coverage of a wide range of environmental conditions (e.g. regarding climate and soil), the area is subdivided into representative re-gions. As in WP 2, the approach suggested by /Metzger et al. 2005/ is followed. Out of 13 environmental zones of Europe, seven zones were chosen: Atlantic Central (ATC), Atlan-tic North (ATN), Continental (CON), Lusitanian (LUS), Mediterranean North (MDN), Medi-terranean South (MDS) and Nemoral (NEM). For more details, see chapter 3.1.
Infrastructure: Infrastructure comprises all production and processing equipment, vehi-cles such as tractors, buildings and streets connected with the crop’s production and use. In many LCAs assessing bioenergy systems or conventional energy production systems it was shown that infrastructure accounts for less than 10 % of the overall results (see /Nitsch et al. 2004/, /Fritsche et al. 2004/ and /Gärtner 2008/). Therefore, in this project, infrastructure is not included.
2.2.2 Agricultural reference system
The agricultural reference system is an essential part of LCAs for agricultural products. It defines the alternative land use, i.e. what the cultivation area would be used for if the crop under investigation was not cultivated /Jungk et al. 2000/. By definition, the agricultural refer-ence system also comprises any change in land use or land cover induced by the cultivation of the investigated crop (energy crop or industrial crop). In literature, two different cases are distinguished, of which the first one is commonly referred to as land-use change (LUC), whereas the second one is called land-cover change (LCC):
1. LUC: The cultivation area is situated on existing cropland which either lay fallow / was set aside or was used for other crops, e.g. for food and / or feed crops
2. LCC: The cultivation area is situated on land which was transformed from grassland, for-est land or wetland to cropland
Most often, both processes are subsumed under the term land-use change (LUC). In LCAs, such changes in land use have to be accounted for in two respects: first, land-use changes lead to an alteration of existing processes and the environmental impacts caused by them. For example, if wheat production is replaced, the same amount of wheat has to be produced elsewhere leading to respective expenditures; second, changes in site quality are induced in terms of carbon stocks. For example, a decline in above-ground and below-ground carbon stock leads to greenhouse gas emissions which have to be included in the greenhouse gas balance. Land-use changes also have considerable effects on biodiversity; however, to date no method exists to include these effects in LCAs.
Land-use changes involve both direct and indirect effects. Direct land-use changes (dLUC) comprise any change in land use or land cover which is directly induced by the cultivation of the crop under investigation. This crop can either be cultivated on existing cropland (replac-ing fallow / set-aside land or grassland) or on land which was transformed from (semi-)natural ecosystems such as grassland, forest land or wetland into cropland. Espe-cially the transformation of the latter can lead to considerable emission of greenhouse gases.
IFEU Heidelberg 4F CROPS – D 13: Life cycle analyses (LCA) 7
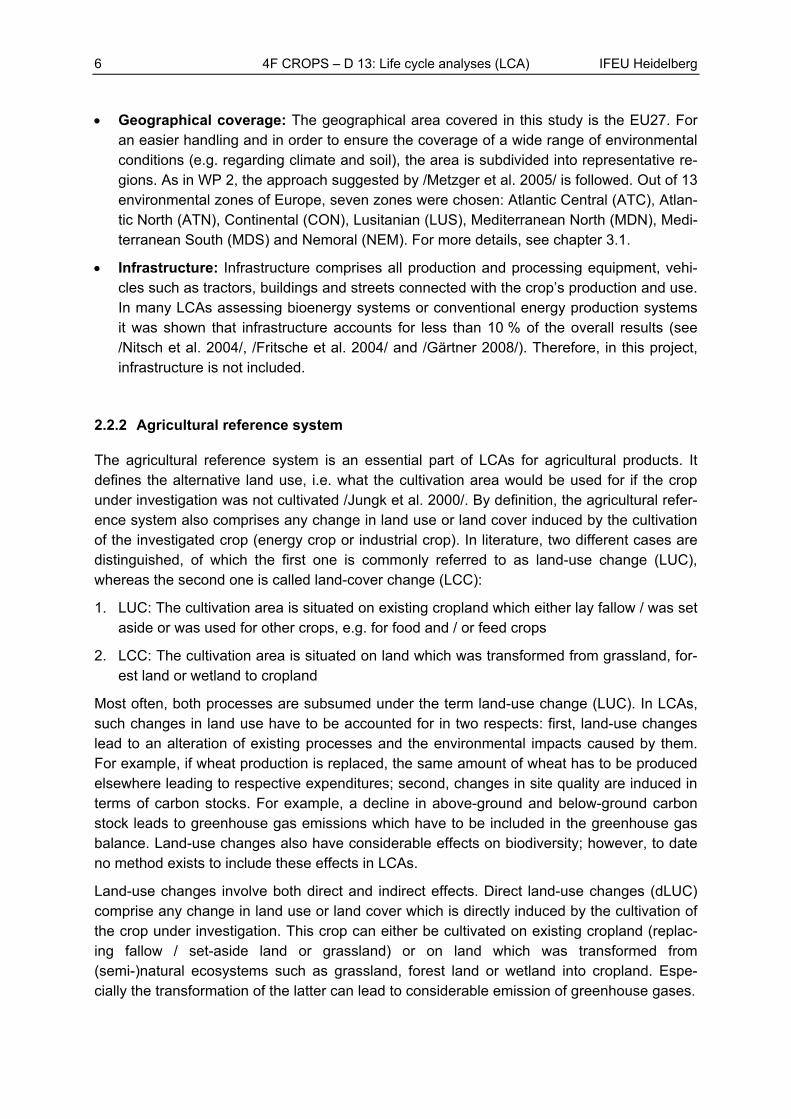
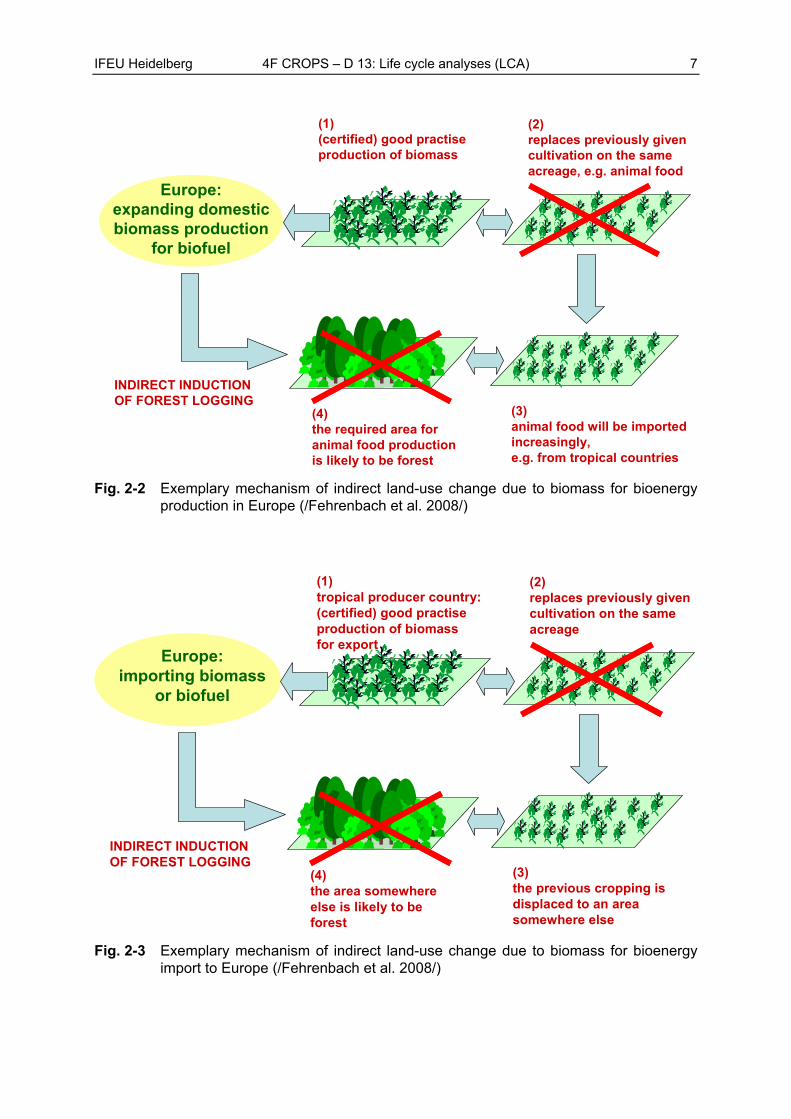
Europe: expanding domestic biomass production
for biofuel
(1) (certified) good practiseproduction of biomass
(2) replaces previously givencultivation on the same acreage, e.g. animal food
(3) animal food will be imported increasingly, e.g. from tropical countries
(4) the required area for animal food production is likely to be forest
INDIRECT INDUCTION OF FOREST LOGGING
Fig. 2-2 Exemplary mechanism of indirect land-use change due to biomass for bioenergy production in Europe (/Fehrenbach et al. 2008/)
Europe: importing biomass
or biofuel
(1) tropical producer country: (certified) good practiseproduction of biomass for export
(2) replaces previously givencultivation on the same acreage
(3) the previous cropping is displaced to an area somewhere else
(4) the area somewhere else is likely to be forest
INDIRECT INDUCTION OF FOREST LOGGING
Fig. 2-3 Exemplary mechanism of indirect land-use change due to biomass for bioenergy import to Europe (/Fehrenbach et al. 2008/)
8 4F CROPS – D 13: Life cycle analyses (LCA) IFEU Heidelberg
As long as fallow / set-aside land or any (semi-)natural ecosystem are transformed into crop-land, no further indirect effects are caused. However, if agricultural land currently used for food and feed production is used for non-food purposes, the demand for food and feed still needs to be satisfied. Consequently, food and feed production is displaced to another area where unfavourable land-use changes might occur. This phenomenon is called indirect land-use change (iLUC), leakage effect or displacement and is demonstrated in Fig. 2-2. Also here, high carbon emissions can be caused if ultimately natural forests, savannahs, grass-lands or peatlands are transformed into cropland.
Not only the production of energy crops in Europe leads to indirect land-use changes else-where in the world. Also the import of biomass or biofuel into Europe has such effects. This mechanism is shown in Fig. 2-3. In the producing country good practice and the absence of direct land-use change may be certified. However, the required area now being used by the new crop is no longer available for the previous food or feed production. As a result, food or feed production is displaced to other areas where in turn land-use changes may occur.
Indirect land-use change effects are difficult to verify empirically: they occur at global level and they are linked to the cultivation of energy crops (e.g. in Europe) via economic market mechanisms. In contrast to direct land-use changes, these indirect effects cannot be exactly allocated to the cultivation of a specific energy crop. This makes the positioning of affected areas and the quantification of these effects very challenging. Therefore, several studies use partial and / or general equilibrium models to quantify the iLUC effect of different non-food biomass expansion scenarios. These are sometimes linked to biophysical models covering different thematic focuses such as biodiversity, soil (erosion) and water (see e.g. /Fehrenbach et al. 2009/ for more details). Despite all efforts, up to date there is no com-monly accepted method on how to quantify iLUC effects, let alone integrate indirect land-use changes in life cycle assessments. Therefore, in this study these effects can only be exempli-fied using scenarios.
In order to evaluate the effects of different agricultural reference systems including direct and indirect land-use changes on the greenhouse gas balances, a sensitivity analysis is per-formed covering fallow and the displacement of food crops (cereals) and feed (grassland on organic soils). As has been noted, indirect effects are difficult to quantify. Since it is outside the scope of this study to apply models for analysing land-use dynamics, the scenarios re-garding land-use change are subjectively chosen. Therefore, the results obtained are only exemplary, indicating at most the order of magnitude of these effects. Further details of the scenarios are provided in chapter 3.4.1.
IFEU Heidelberg 4F CROPS – D 13: Life cycle analyses (LCA) 9
2.2.3 Environmental impact categories
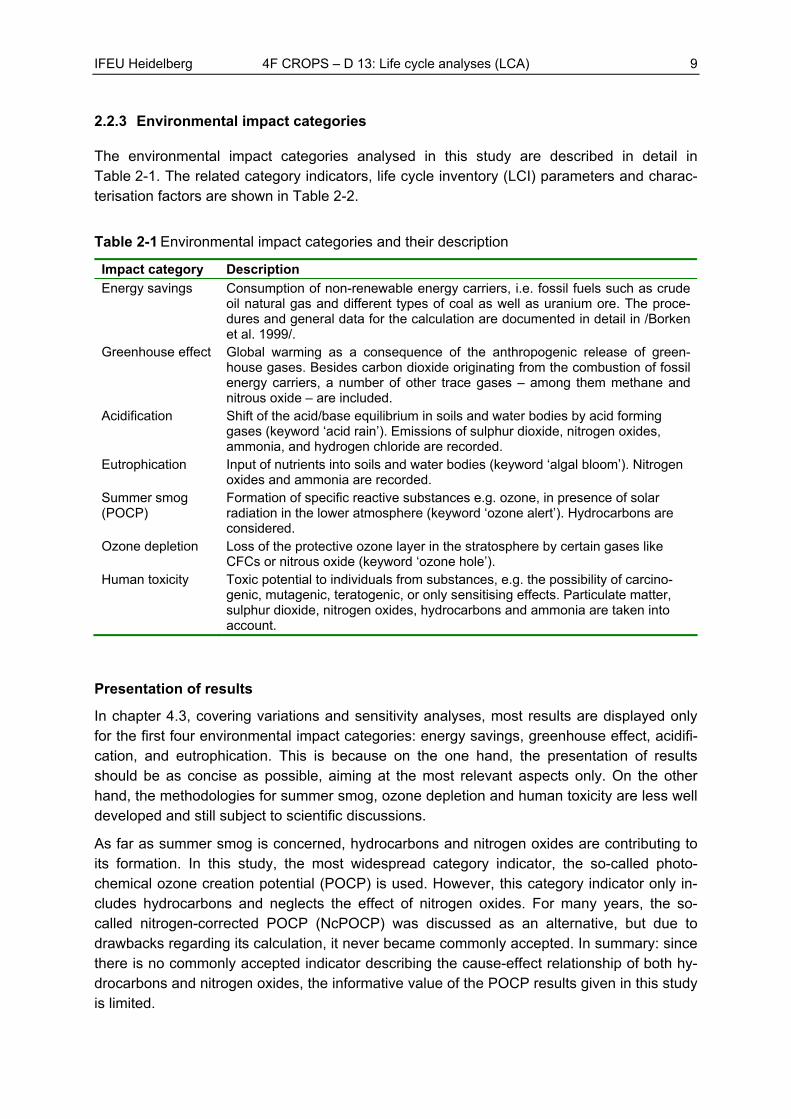
The environmental impact categories analysed in this study are described in detail in Table 2-1. The related category indicators, life cycle inventory (LCI) parameters and charac-terisation factors are shown in Table 2-2.
Table 2-1 Environmental impact categories and their description
Impact category Description
Energy savings
Consumption of non-renewable energy carriers, i.e. fossil fuels such as crude oil natural gas and different types of coal as well as uranium ore. The proce-dures and general data for the calculation are documented in detail in /Borken et al. 1999/.
Greenhouse effect Global warming as a consequence of the anthropogenic release of green-house gases. Besides carbon dioxide originating from the combustion of fossil energy carriers, a number of other trace gases – among them methane and nitrous oxide – are included.
Acidification Shift of the acid/base equilibrium in soils and water bodies by acid forming gases (keyword ‘acid rain’). Emissions of sulphur dioxide, nitrogen oxides, ammonia, and hydrogen chloride are recorded.
Eutrophication Input of nutrients into soils and water bodies (keyword ‘algal bloom’). Nitrogen oxides and ammonia are recorded.
Summer smog (POCP)
Formation of specific reactive substances e.g. ozone, in presence of solar radiation in the lower atmosphere (keyword ‘ozone alert’). Hydrocarbons are considered.
Ozone depletion Loss of the protective ozone layer in the stratosphere by certain gases like CFCs or nitrous oxide (keyword ‘ozone hole’).
Human toxicity Toxic potential to individuals from substances, e.g. the possibility of carcino-genic, mutagenic, teratogenic, or only sensitising effects. Particulate matter, sulphur dioxide, nitrogen oxides, hydrocarbons and ammonia are taken into account.
Presentation of results
In chapter 4.3, covering variations and sensitivity analyses, most results are displayed only for the first four environmental impact categories: energy savings, greenhouse effect, acidifi-cation, and eutrophication. This is because on the one hand, the presentation of results should be as concise as possible, aiming at the most relevant aspects only. On the other hand, the methodologies for summer smog, ozone depletion and human toxicity are less well developed and still subject to scientific discussions.
As far as summer smog is concerned, hydrocarbons and nitrogen oxides are contributing to its formation. In this study, the most widespread category indicator, the so-called photo-chemical ozone creation potential (POCP) is used. However, this category indicator only in-cludes hydrocarbons and neglects the effect of nitrogen oxides. For many years, the so-called nitrogen-corrected POCP (NcPOCP) was discussed as an alternative, but due to drawbacks regarding its calculation, it never became commonly accepted. In summary: since there is no commonly accepted indicator describing the cause-effect relationship of both hy-drocarbons and nitrogen oxides, the informative value of the POCP results given in this study is limited.
10 4F CROPS – D 13: Life cycle analyses (LCA) IFEU Heidelberg
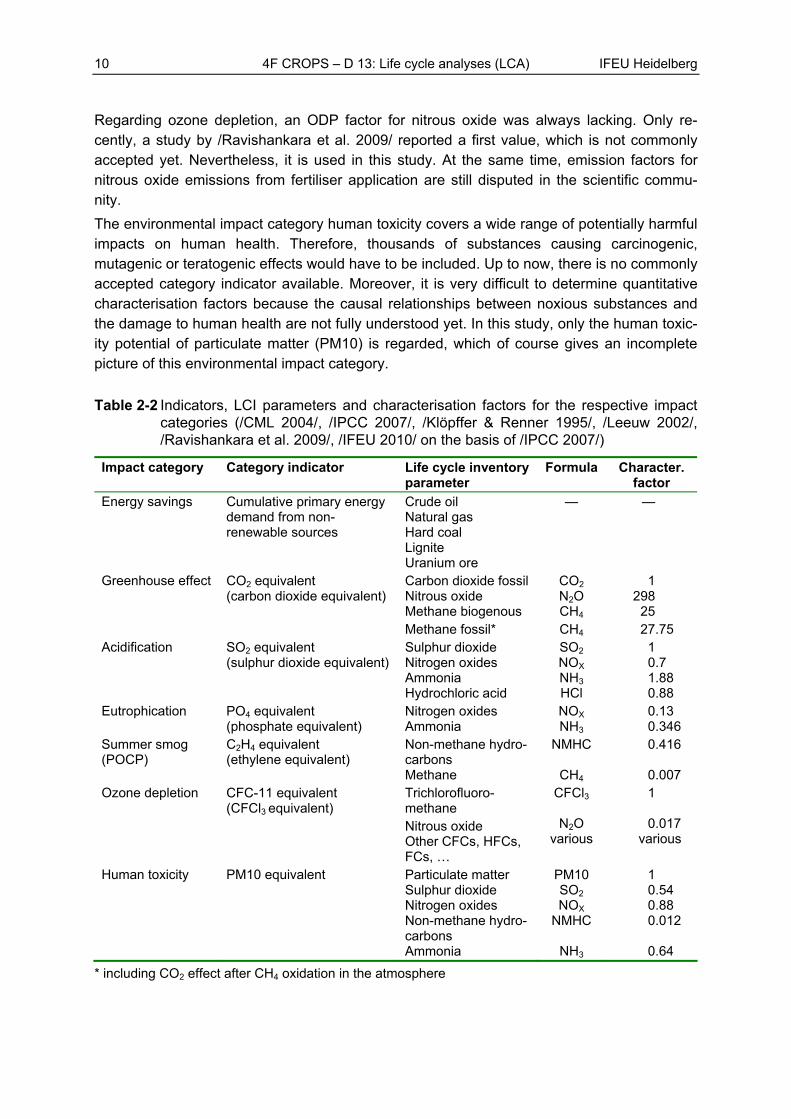
Regarding ozone depletion, an ODP factor for nitrous oxide was always lacking. Only re-cently, a study by /Ravishankara et al. 2009/ reported a first value, which is not commonly accepted yet. Nevertheless, it is used in this study. At the same time, emission factors for nitrous oxide emissions from fertiliser application are still disputed in the scientific commu-nity.
The environmental impact category human toxicity covers a wide range of potentially harmful impacts on human health. Therefore, thousands of substances causing carcinogenic, mutagenic or teratogenic effects would have to be included. Up to now, there is no commonly accepted category indicator available. Moreover, it is very difficult to determine quantitative characterisation factors because the causal relationships between noxious substances and the damage to human health are not fully understood yet. In this study, only the human toxic-ity potential of particulate matter (PM10) is regarded, which of course gives an incomplete picture of this environmental impact category.
Table 2-2 Indicators, LCI parameters and characterisation factors for the respective impact categories (/CML 2004/, /IPCC 2007/, /Klöpffer & Renner 1995/, /Leeuw 2002/, /Ravishankara et al. 2009/, /IFEU 2010/ on the basis of /IPCC 2007/)
Impact category Category indicator Life cycle inventory parameter
Formula Character. factor
Energy savings Cumulative primary energy demand from non-renewable sources
Crude oil Natural gas Hard coal Lignite Uranium ore
— —
Greenhouse effect CO2 equivalent (carbon dioxide equivalent)
Carbon dioxide fossilNitrous oxide Methane biogenous Methane fossil*
CO2 N2O CH4
CH4
1 298
25 27.75
Acidification SO2 equivalent (sulphur dioxide equivalent)
Sulphur dioxide Nitrogen oxides Ammonia Hydrochloric acid
SO2 NOX NH3 HCl
1 0.7 1.88 0.88
Eutrophication PO4 equivalent (phosphate equivalent)
Nitrogen oxides Ammonia
NOX NH3
0.13 0.346
Summer smog (POCP)
C2H4 equivalent (ethylene equivalent)
Non-methane hydro-carbons Methane
NMHC
CH4
0.416
0.007 Ozone depletion CFC-11 equivalent
(CFCl3 equivalent) Trichlorofluoro-methane Nitrous oxide Other CFCs, HFCs, FCs, …
CFCl3
N2O
various
1
0.017 various
Human toxicity PM10 equivalent Particulate matter Sulphur dioxide Nitrogen oxides Non-methane hydro-carbons Ammonia
PM10 SO2 NOX
NMHC
NH3
1 0.54 0.88 0.012
0.64
* including CO2 effect after CH4 oxidation in the atmosphere
IFEU Heidelberg 4F CROPS – D 13: Life cycle analyses (LCA) 11
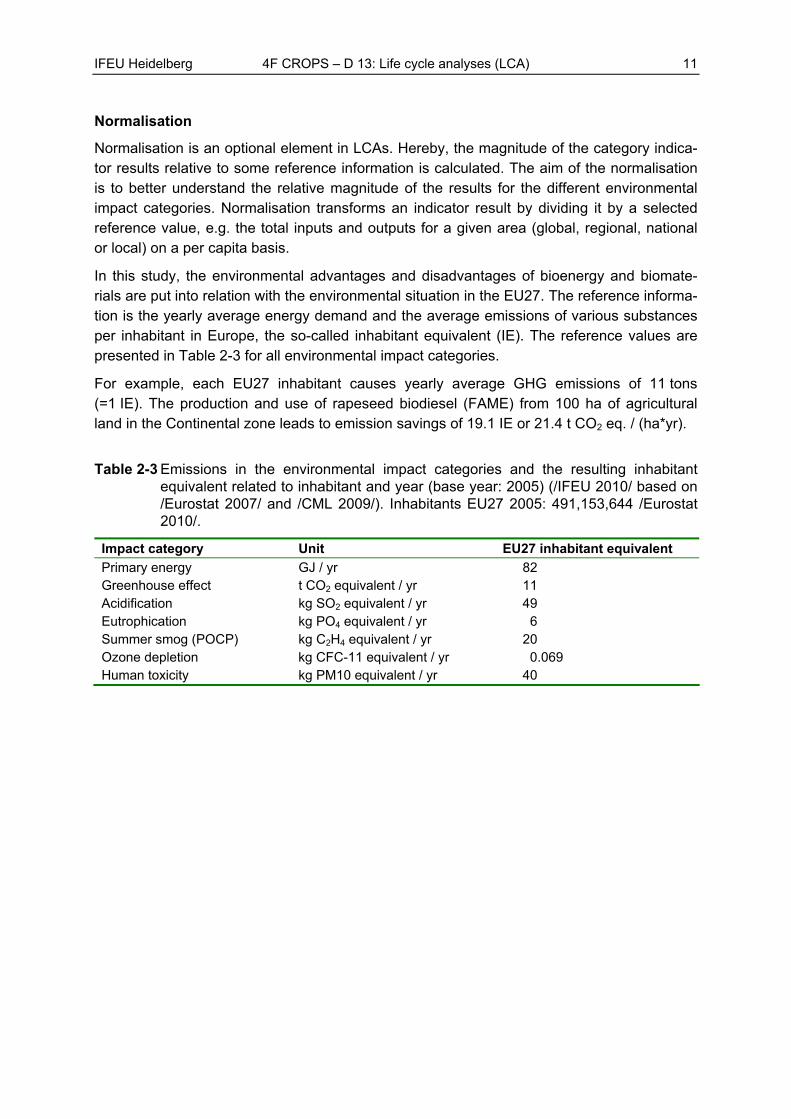
Normalisation
Normalisation is an optional element in LCAs. Hereby, the magnitude of the category indica-tor results relative to some reference information is calculated. The aim of the normalisation is to better understand the relative magnitude of the results for the different environmental impact categories. Normalisation transforms an indicator result by dividing it by a selected reference value, e.g. the total inputs and outputs for a given area (global, regional, national or local) on a per capita basis.
In this study, the environmental advantages and disadvantages of bioenergy and biomate-rials are put into relation with the environmental situation in the EU27. The reference informa-tion is the yearly average energy demand and the average emissions of various substances per inhabitant in Europe, the so-called inhabitant equivalent (IE). The reference values are presented in Table 2-3 for all environmental impact categories.
For example, each EU27 inhabitant causes yearly average GHG emissions of 11 tons (=1 IE). The production and use of rapeseed biodiesel (FAME) from 100 ha of agricultural land in the Continental zone leads to emission savings of 19.1 IE or 21.4 t CO2 eq. / (ha*yr).
Table 2-3 Emissions in the environmental impact categories and the resulting inhabitant equivalent related to inhabitant and year (base year: 2005) (/IFEU 2010/ based on /Eurostat 2007/ and /CML 2009/). Inhabitants EU27 2005: 491,153,644 /Eurostat 2010/.
Impact category Unit EU27 inhabitant equivalent
Primary energy GJ / yr 82 Greenhouse effect t CO2 equivalent / yr 11 Acidification kg SO2 equivalent / yr 49 Eutrophication kg PO4 equivalent / yr 6 Summer smog (POCP) kg C2H4 equivalent / yr 20 Ozone depletion kg CFC-11 equivalent / yr 0.069 Human toxicity kg PM10 equivalent / yr 40
12 4F CROPS – D 13: Life cycle analyses (LCA) IFEU Heidelberg
2.3 Data sources
The data used for the life cycle analyses can be divided into different categories:
Data on the cultivation of the crops
Data on the upstream process of ancillary products (e.g. fertilisers, tractor fuel, pesticides etc.), data on transport processes as well as data on provision and use of fossil energy carriers and conventional products
Data on the conversion of biomass into bioenergy or bio-based materials
Regarding crop cultivation, data on yields and irrigation related to the different environmental zones were provided by /UNICT 2009/ and cross-checked by IFEU. All other data on cultiva-tion, e.g. the amount of fertiliser input stem from IFEU’s internal database which is continu-ously updated /IFEU 2010/.
The data for the second category are mostly taken from IFEU’s internal database which is continuously updated /IFEU 2010/. Where necessary, these data are supplemented by data from external databases such as /ecoinvent 2010/.
Data on the conversion of biomass are also taken from IFEU’s internal database. They were obtained, validated and updated during the years in the course of different life cycle assess-ment studies (/Müller-Sämann et al. 2002/, /Gärtner & Reinhardt 2003/, /Gärtner & Reinhardt 2005/, /Gärtner et al. 2006/, /Reinhardt et al. 2006/, /Reinhardt et al. 2007/, /Rettenmaier et al. 2008/, /Köppen et al. 2009/). Where necessary, they are adjusted to the project-specific needs regarding system boundaries.
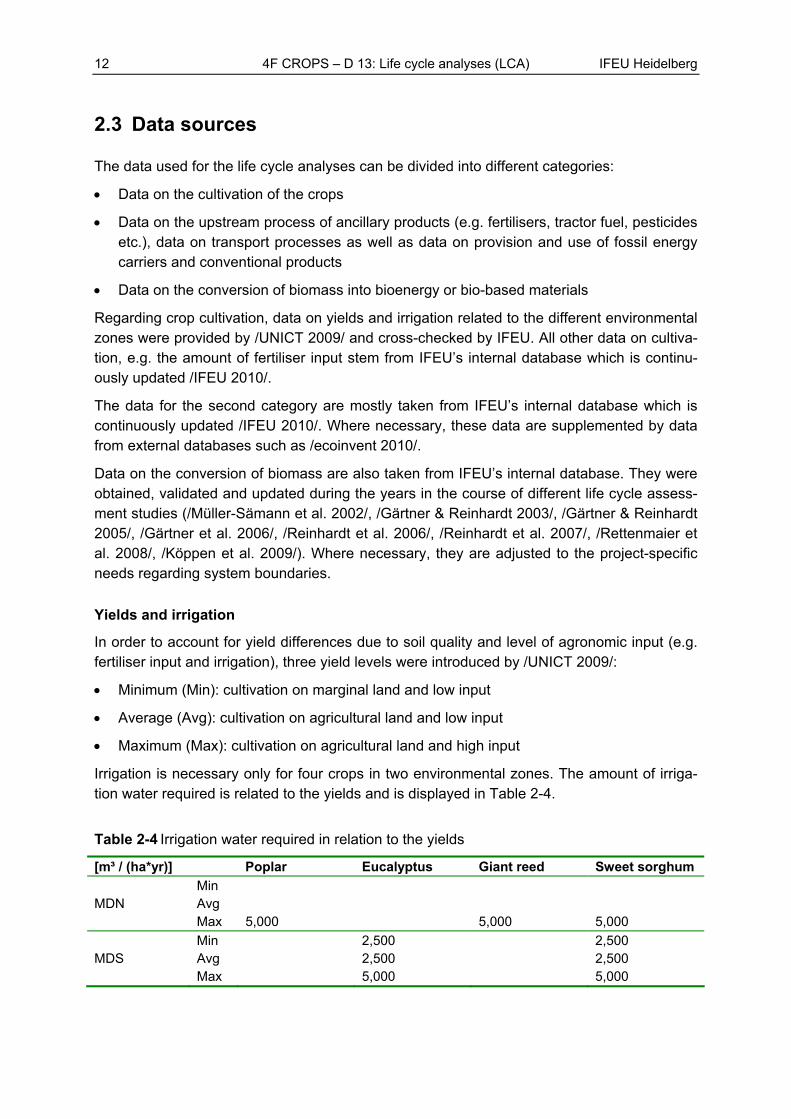
Yields and irrigation
In order to account for yield differences due to soil quality and level of agronomic input (e.g. fertiliser input and irrigation), three yield levels were introduced by /UNICT 2009/:
Minimum (Min): cultivation on marginal land and low input
Average (Avg): cultivation on agricultural land and low input
Maximum (Max): cultivation on agricultural land and high input
Irrigation is necessary only for four crops in two environmental zones. The amount of irriga-tion water required is related to the yields and is displayed in Table 2-4.
Table 2-4 Irrigation water required in relation to the yields
[m³ / (ha*yr)] Poplar Eucalyptus Giant reed Sweet sorghum
Min MDN Avg Max 5,000 5,000 5,000
Min 2,500 2,500 MDS Avg 2,500 2,500 Max 5,000 5,000
IFEU Heidelberg 4F CROPS – D 13: Life cycle analyses (LCA) 13
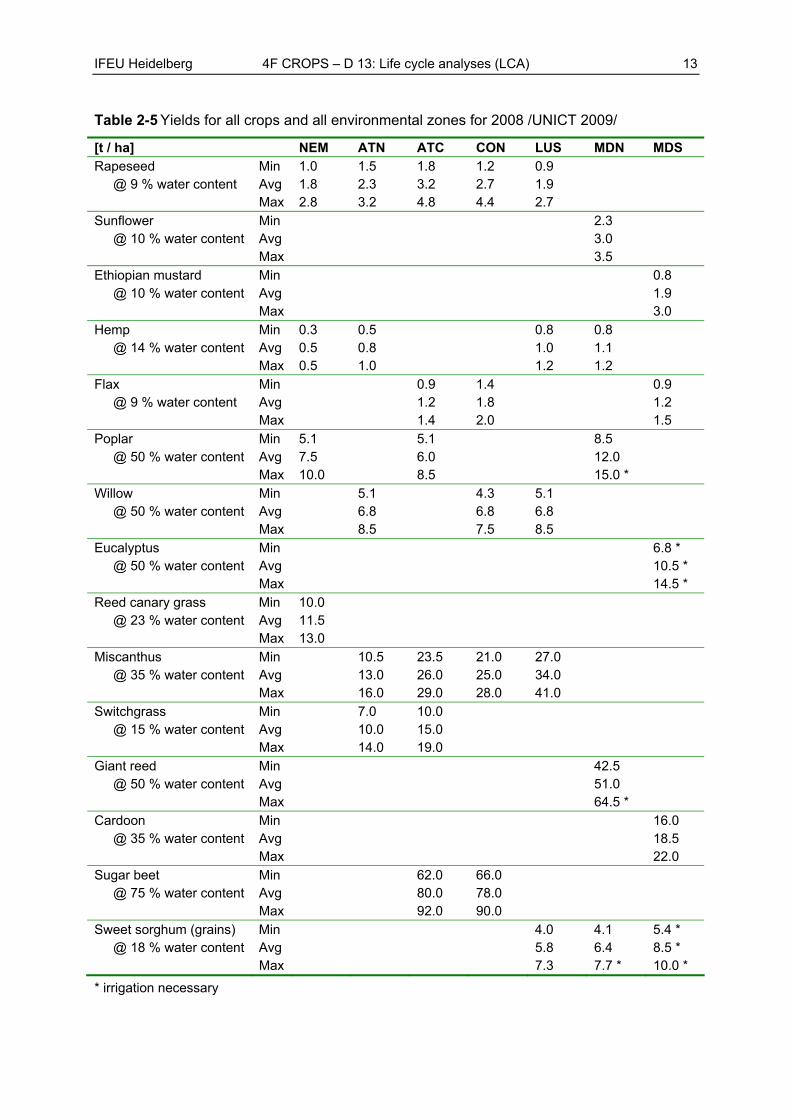
Table 2-5 Yields for all crops and all environmental zones for 2008 /UNICT 2009/
[t / ha] NEM ATN ATC CON LUS MDN MDS Rapeseed Min 1.0 1.5 1.8 1.2 0.9 @ 9 % water content Avg 1.8 2.3 3.2 2.7 1.9 Max 2.8 3.2 4.8 4.4 2.7 Sunflower Min 2.3 @ 10 % water content Avg 3.0 Max 3.5 Ethiopian mustard Min 0.8 @ 10 % water content Avg 1.9 Max 3.0 Hemp Min 0.3 0.5 0.8 0.8 @ 14 % water content Avg 0.5 0.8 1.0 1.1 Max 0.5 1.0 1.2 1.2 Flax Min 0.9 1.4 0.9 @ 9 % water content Avg 1.2 1.8 1.2 Max 1.4 2.0 1.5 Poplar Min 5.1 5.1 8.5 @ 50 % water content Avg 7.5 6.0 12.0 Max 10.0 8.5 15.0 * Willow Min 5.1 4.3 5.1 @ 50 % water content Avg 6.8 6.8 6.8 Max 8.5 7.5 8.5 Eucalyptus Min 6.8 * @ 50 % water content Avg 10.5 * Max 14.5 * Reed canary grass Min 10.0 @ 23 % water content Avg 11.5 Max 13.0 Miscanthus Min 10.5 23.5 21.0 27.0 @ 35 % water content Avg 13.0 26.0 25.0 34.0 Max 16.0 29.0 28.0 41.0 Switchgrass Min 7.0 10.0 @ 15 % water content Avg 10.0 15.0 Max 14.0 19.0 Giant reed Min 42.5 @ 50 % water content Avg 51.0 Max 64.5 * Cardoon Min 16.0 @ 35 % water content Avg 18.5 Max 22.0 Sugar beet Min 62.0 66.0 @ 75 % water content Avg 80.0 78.0 Max 92.0 90.0 Sweet sorghum (grains) Min 4.0 4.1 5.4 * @ 18 % water content Avg 5.8 6.4 8.5 * Max 7.3 7.7 * 10.0 *
* irrigation necessary
14 4F CROPS – D 13: Life cycle analyses (LCA) IFEU Heidelberg
3 System description and scenarios
Chapter 3.1 presents the selection of the crops assessed in this project as well as their allo-cation to seven environmental zones in Europe. In chapter 3.2 the use of the different crops is presented. For almost each crops both the use for bioenergy production as well as for biomaterials is assessed. In chapter 3.3, the life cycles for each of the crop uses and the re-spective equivalent systems are depicted. Based on these basic scenarios, different varia-tions are investigated by means of sensitivity analyses. They are presented in chapter 3.4.
3.1 Selection of crops and environmental zones
As stated in the previous chapters, the environmental advantages and disadvantages of the main products from energy crops and industrial crops are compared to their respective fossil and conventional equivalents by means of a life cycle analysis.
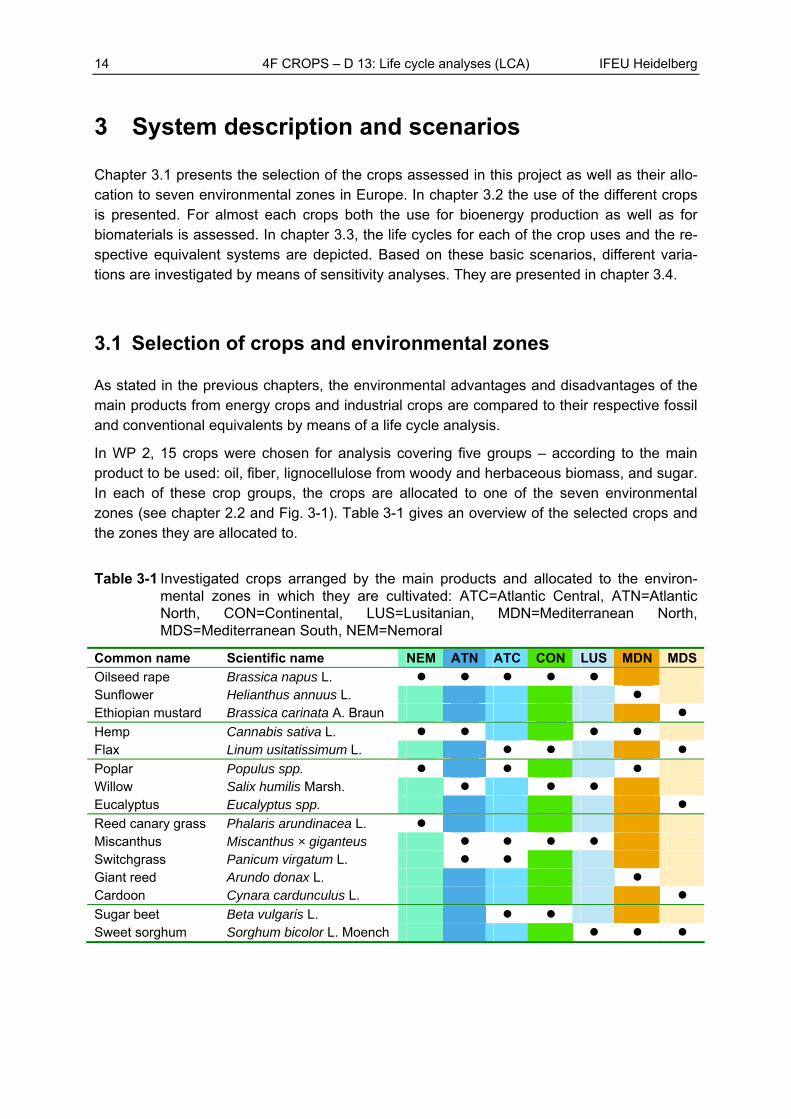
In WP 2, 15 crops were chosen for analysis covering five groups – according to the main product to be used: oil, fiber, lignocellulose from woody and herbaceous biomass, and sugar. In each of these crop groups, the crops are allocated to one of the seven environmental zones (see chapter 2.2 and Fig. 3-1). Table 3-1 gives an overview of the selected crops and the zones they are allocated to.
Table 3-1 Investigated crops arranged by the main products and allocated to the environ-mental zones in which they are cultivated: ATC=Atlantic Central, ATN=Atlantic North, CON=Continental, LUS=Lusitanian, MDN=Mediterranean North, MDS=Mediterranean South, NEM=Nemoral
Common name Scientific name NEM ATN ATC CON LUS MDN MDS
Oilseed rape Brassica napus L. Sunflower Helianthus annuus L. Ethiopian mustard Brassica carinata A. Braun
Hemp Cannabis sativa L. Flax Linum usitatissimum L.
Poplar Populus spp. Willow Salix humilis Marsh. Eucalyptus Eucalyptus spp.
Reed canary grass Phalaris arundinacea L. Miscanthus Miscanthus × giganteus Switchgrass Panicum virgatum L. Giant reed Arundo donax L. Cardoon Cynara cardunculus L.
Sugar beet Beta vulgaris L. Sweet sorghum Sorghum bicolor L. Moench
IFEU Heidelberg 4F CROPS – D 13: Life cycle analyses (LCA) 15
Fig. 3-1 Environmental zones of Europe /Metzger et al. 2005/
16 4F CROPS – D 13: Life cycle analyses (LCA) IFEU Heidelberg
3.2 Selection of conversion paths and products
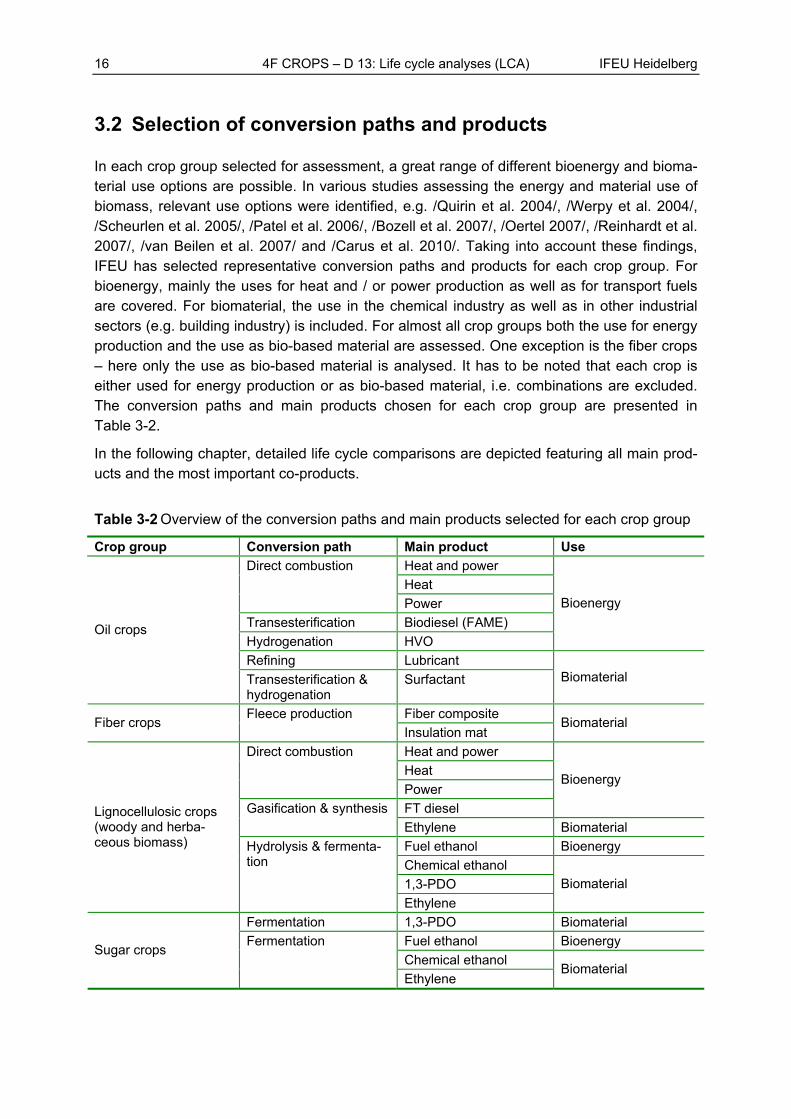
In each crop group selected for assessment, a great range of different bioenergy and bioma-terial use options are possible. In various studies assessing the energy and material use of biomass, relevant use options were identified, e.g. /Quirin et al. 2004/, /Werpy et al. 2004/, /Scheurlen et al. 2005/, /Patel et al. 2006/, /Bozell et al. 2007/, /Oertel 2007/, /Reinhardt et al. 2007/, /van Beilen et al. 2007/ and /Carus et al. 2010/. Taking into account these findings, IFEU has selected representative conversion paths and products for each crop group. For bioenergy, mainly the uses for heat and / or power production as well as for transport fuels are covered. For biomaterial, the use in the chemical industry as well as in other industrial sectors (e.g. building industry) is included. For almost all crop groups both the use for energy production and the use as bio-based material are assessed. One exception is the fiber crops – here only the use as bio-based material is analysed. It has to be noted that each crop is either used for energy production or as bio-based material, i.e. combinations are excluded. The conversion paths and main products chosen for each crop group are presented in Table 3-2.
In the following chapter, detailed life cycle comparisons are depicted featuring all main prod-ucts and the most important co-products.
Table 3-2 Overview of the conversion paths and main products selected for each crop group
Crop group Conversion path Main product Use
Heat and power
Heat
Direct combustion
Power
Transesterification Biodiesel (FAME)
Hydrogenation HVO
Bioenergy
Refining Lubricant
Oil crops
Transesterification & hydrogenation
Surfactant Biomaterial
Fiber composite Fiber crops
Fleece production
Insulation mat Biomaterial
Heat and power
Heat
Direct combustion
Power
FT diesel
Bioenergy
Gasification & synthesis
Ethylene Biomaterial
Fuel ethanol Bioenergy
Chemical ethanol
1,3-PDO
Lignocellulosic crops (woody and herba-ceous biomass) Hydrolysis & fermenta-
tion
Ethylene
Biomaterial
Fermentation 1,3-PDO Biomaterial
Fuel ethanol Bioenergy
Chemical ethanol Sugar crops
Fermentation
Ethylene Biomaterial
IFEU Heidelberg 4F CROPS – D 13: Life cycle analyses (LCA) 17
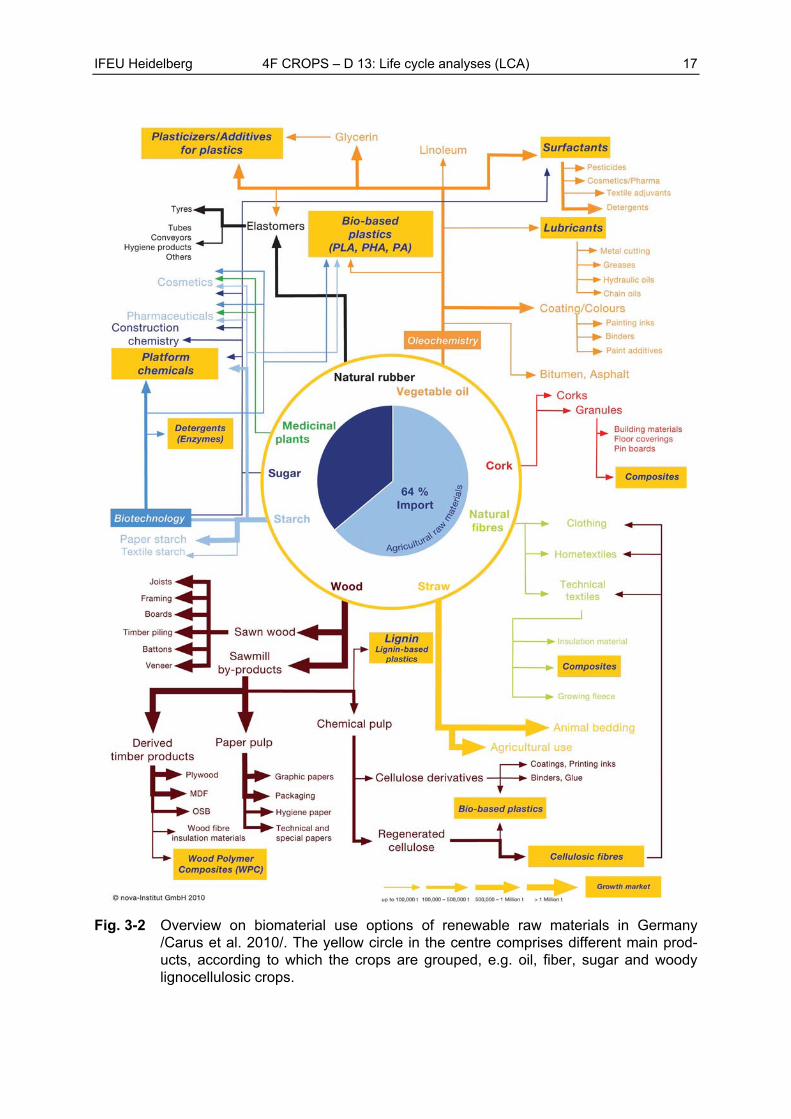
Fig. 3-2 Overview on biomaterial use options of renewable raw materials in Germany /Carus et al. 2010/. The yellow circle in the centre comprises different main prod-ucts, according to which the crops are grouped, e.g. oil, fiber, sugar and woody lignocellulosic crops.
18 4F CROPS – D 13: Life cycle analyses (LCA) IFEU Heidelberg
3.3 Basic scenarios
In the following subchapters, the life cycles for all crop groups to be assessed are depicted. Where applicable the life cycle scheme is the same for all crops in one group. The figures show all main and co-products and their respective conventional equivalents. For all basic scenarios, the default agricultural reference system (alternative land use) is fallow. Regard-ing electricity inputs and outputs, the European average power mix (UCTE mix) is taken into account.
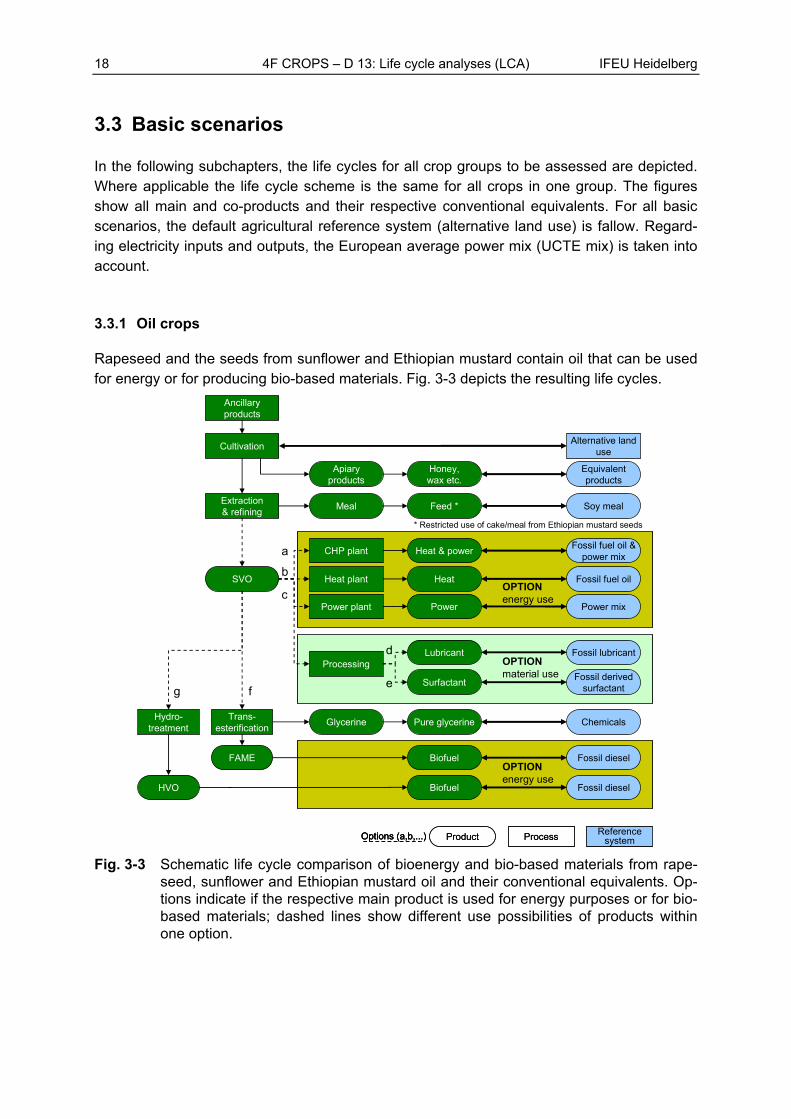
3.3.1 Oil crops
Rapeseed and the seeds from sunflower and Ethiopian mustard contain oil that can be used for energy or for producing bio-based materials. Fig. 3-3 depicts the resulting life cycles.
OPTION energy use
Cultivation
Extraction& refining
Ancillary products
Meal Feed * Soy meal
Glycerine Pure glycerine Chemicals
Apiary products
Honey,wax etc.
Equivalent products
Trans-esterification
SVO
Alternative land use
FAME
CHP plant
Heat plant
Power plant
Fossil fuel oil &power mix
Fossil fuel oil
Power mix
ProcessingLubricant Fossil lubricant
SurfactantFossil derived
surfactant
Fossil diesel
OPTION material use
OPTIONenergy use
Heat & power
Heat
Power
* Restricted use of cake/meal from Ethiopian mustard seeds
a
b
c
d
f
HVO
Hydro-treatment
Fossil diesel
g
Product ProcessReference
systemOptions (a,b,...) Product ProcessReference
systemOptions (a,b,...)Options (a,b,...)
Biofuel
Biofuel
e
Fig. 3-3 Schematic life cycle comparison of bioenergy and bio-based materials from rape-seed, sunflower and Ethiopian mustard oil and their conventional equivalents. Op-tions indicate if the respective main product is used for energy purposes or for bio-based materials; dashed lines show different use possibilities of products within one option.
IFEU Heidelberg 4F CROPS – D 13: Life cycle analyses (LCA) 19
As the seed cake of Ethiopian mustard contains high amounts of glucosinate it is not suitable as feed /Carlsson 2009/ and thus excluded from this use. Three energy use pathways are considered: the straight vegetable oil (SVO) can be directly combusted in order to produce heat and / or power (a - c). The second and third possibility would be its transesterification to biodiesel (FAME, f) or its hydrogenation to hydrogenated vegetable oil (HVO, g). The mate-rial use covers the application as bio-based lubricant (d) or surfactant (e).
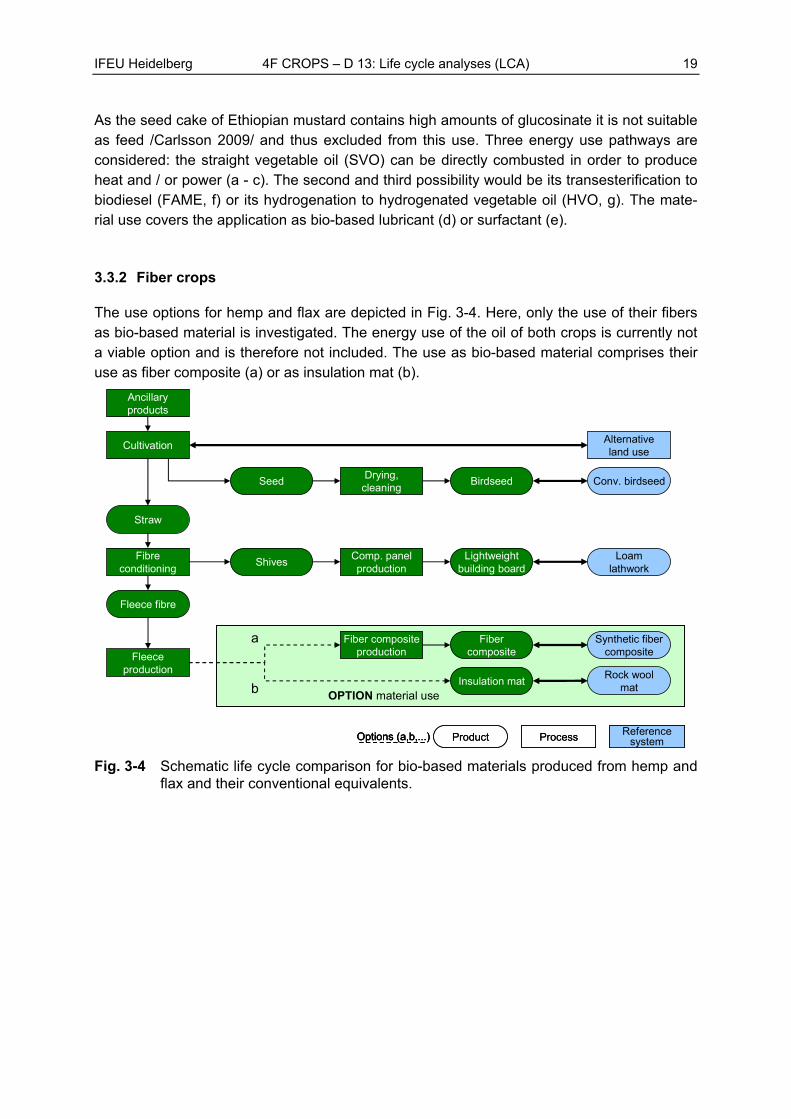
3.3.2 Fiber crops
The use options for hemp and flax are depicted in Fig. 3-4. Here, only the use of their fibers as bio-based material is investigated. The energy use of the oil of both crops is currently not a viable option and is therefore not included. The use as bio-based material comprises their use as fiber composite (a) or as insulation mat (b).
OPTION material use
Cultivation
Fibreconditioning
Drying,cleaning
Comp. panelproduction
Fleeceproduction
Straw
Seed
Alternativeland use
Fleece fibre
Insulation mat
ShivesLightweight
building boardLoam
lathwork
Rock woolmat
Conv. birdseed
Fiber compositeproduction
Fibercomposite
Synthetic fibercomposite
Ancillaryproducts
Birdseed
a
b
Product Process Reference systemOptions (a,b,...) Product Process Reference systemOptions (a,b,...)Options (a,b,...)
Fig. 3-4 Schematic life cycle comparison for bio-based materials produced from hemp and flax and their conventional equivalents.
20 4F CROPS – D 13: Life cycle analyses (LCA) IFEU Heidelberg
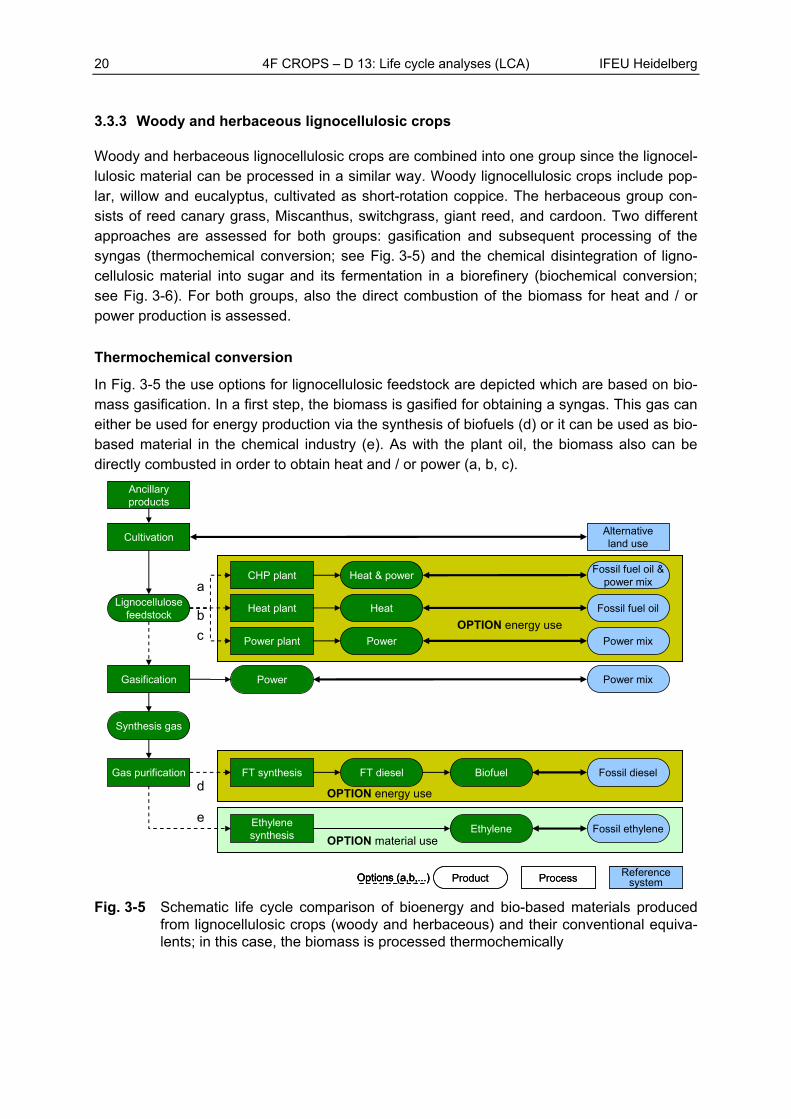
3.3.3 Woody and herbaceous lignocellulosic crops
Woody and herbaceous lignocellulosic crops are combined into one group since the lignocel-lulosic material can be processed in a similar way. Woody lignocellulosic crops include pop-lar, willow and eucalyptus, cultivated as short-rotation coppice. The herbaceous group con-sists of reed canary grass, Miscanthus, switchgrass, giant reed, and cardoon. Two different approaches are assessed for both groups: gasification and subsequent processing of the syngas (thermochemical conversion; see Fig. 3-5) and the chemical disintegration of ligno-cellulosic material into sugar and its fermentation in a biorefinery (biochemical conversion; see Fig. 3-6). For both groups, also the direct combustion of the biomass for heat and / or power production is assessed.
Thermochemical conversion
In Fig. 3-5 the use options for lignocellulosic feedstock are depicted which are based on bio-mass gasification. In a first step, the biomass is gasified for obtaining a syngas. This gas can either be used for energy production via the synthesis of biofuels (d) or it can be used as bio-based material in the chemical industry (e). As with the plant oil, the biomass also can be directly combusted in order to obtain heat and / or power (a, b, c).
CultivationAlternativeland use
Lignocellulose feedstock
CHP plant
Heat plant
Fossil fuel oil &power mix
Power plant
Fossil fuel oil
Power mix
Synthesis gas
Gasification
Gas purification
Power Power mix
FT synthesis Biofuel Fossil diesel
Ethylene Fossil ethyleneEthylene synthesis
Heat & power
Heat
Power
Ancillary products
b
d
a
e
cOPTION energy use
OPTION energy use
OPTION material use
Product Process Reference systemOptions (a,b,...) Product Process Reference systemOptions (a,b,...)Options (a,b,...)
FT diesel
Fig. 3-5 Schematic life cycle comparison of bioenergy and bio-based materials produced from lignocellulosic crops (woody and herbaceous) and their conventional equiva-lents; in this case, the biomass is processed thermochemically
IFEU Heidelberg 4F CROPS – D 13: Life cycle analyses (LCA) 21
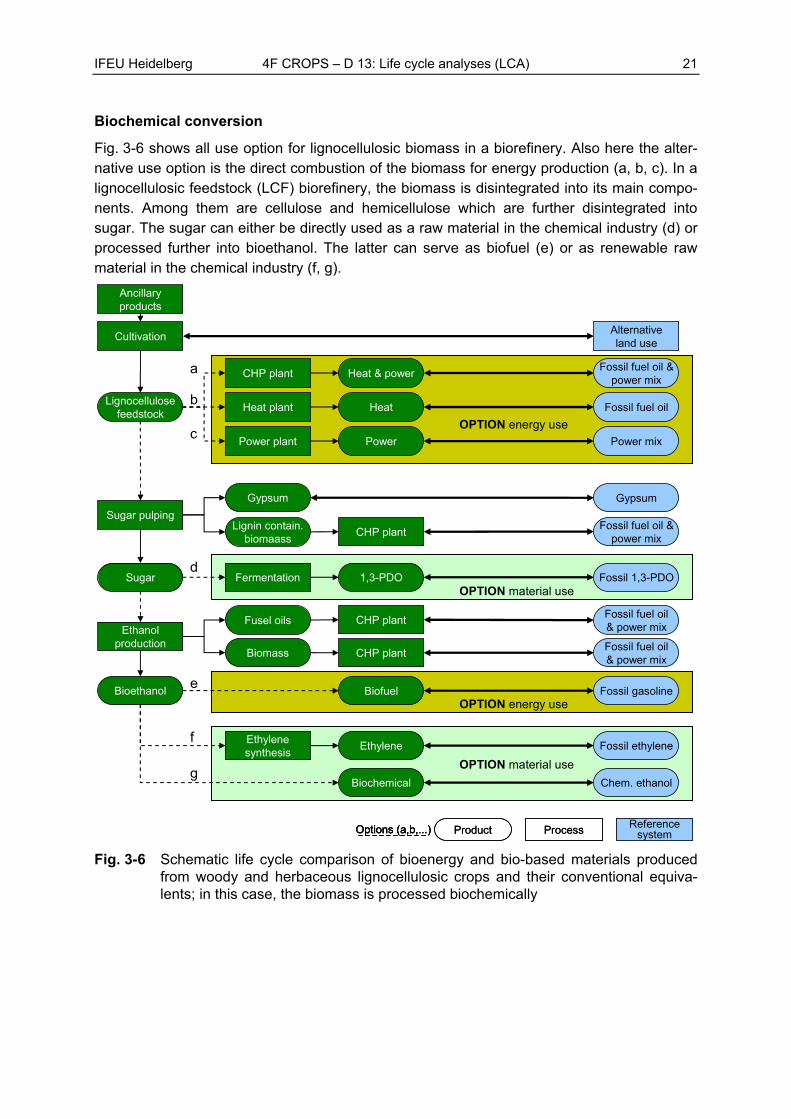
Biochemical conversion
Fig. 3-6 shows all use option for lignocellulosic biomass in a biorefinery. Also here the alter-native use option is the direct combustion of the biomass for energy production (a, b, c). In a lignocellulosic feedstock (LCF) biorefinery, the biomass is disintegrated into its main compo-nents. Among them are cellulose and hemicellulose which are further disintegrated into sugar. The sugar can either be directly used as a raw material in the chemical industry (d) or processed further into bioethanol. The latter can serve as biofuel (e) or as renewable raw material in the chemical industry (f, g).
Sugar pulping
Cultivation
Gypsum
Sugar
Alternativeland use
Ethanol production
Gypsum
Bioethanol
Fusel oilsFossil fuel oil & power mix
BiomassFossil fuel oil & power mix
Lignocellulose feedstock
Chem. ethanol
Fossil ethyleneEthylene synthesis
Ethylene
Lignin contain. biomaass
Fossil fuel oil &power mix
CHP plant
Heat plant
Fossil fuel oil &power mix
Power plant
Fossil fuel oil
Power mix
Heat & power
Heat
Power
Ancillary products
Fermentation 1,3-PDO Fossil 1,3-PDO
Biochemical
CHP plant
d
e
f
a
b
c
g
Fossil gasolineBiofuel
CHP plant
CHP plant
OPTION energy use
OPTION energy use
OPTION material use
Product Process Reference systemOptions (a,b,...) Product Process Reference systemOptions (a,b,...)Options (a,b,...)
OPTION material use
Fig. 3-6 Schematic life cycle comparison of bioenergy and bio-based materials produced from woody and herbaceous lignocellulosic crops and their conventional equiva-lents; in this case, the biomass is processed biochemically
22 4F CROPS – D 13: Life cycle analyses (LCA) IFEU Heidelberg
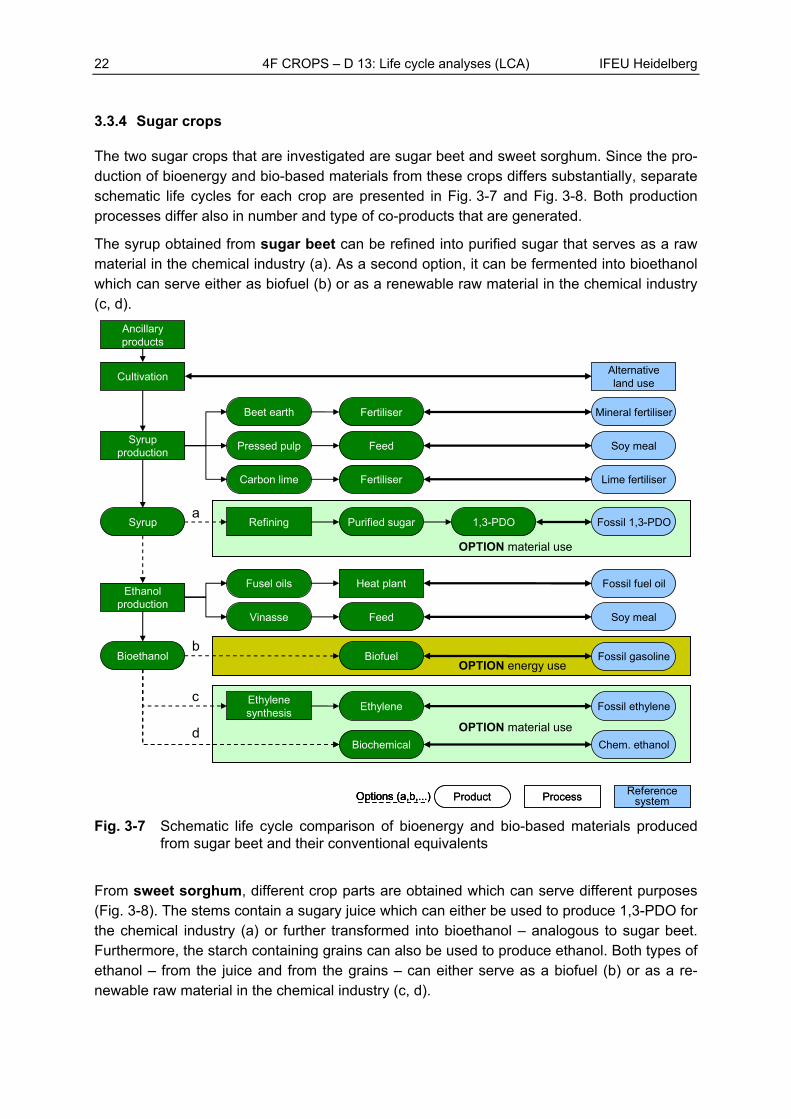
3.3.4 Sugar crops
The two sugar crops that are investigated are sugar beet and sweet sorghum. Since the pro-duction of bioenergy and bio-based materials from these crops differs substantially, separate schematic life cycles for each crop are presented in Fig. 3-7 and Fig. 3-8. Both production processes differ also in number and type of co-products that are generated.
The syrup obtained from sugar beet can be refined into purified sugar that serves as a raw material in the chemical industry (a). As a second option, it can be fermented into bioethanol which can serve either as biofuel (b) or as a renewable raw material in the chemical industry (c, d).
Cultivation
Syrup production
Ancillary products
Beet earth
Syrup
Alternativeland use
Ethanol production
Fertiliser Mineral fertiliser
Bioethanol
Pressed pulp Feed Soy meal
Carbon lime Fertiliser Lime fertiliser
Fusel oils
Feed
Fossil fuel oil
Vinasse Soy meal
Chem. ethanol
Fossil ethyleneEthylene synthesis
Ethylene
Refining Purified sugar 1,3-PDO Fossil 1,3-PDO
Biochemical
a
b
c
d
Fossil gasolineBiofuelOPTION energy use
OPTION material use
Heat plant
OPTION material use
Product Process Reference systemOptions (a,b,...) Product Process Reference systemOptions (a,b,...)Options (a,b,...)
Fig. 3-7 Schematic life cycle comparison of bioenergy and bio-based materials produced from sugar beet and their conventional equivalents
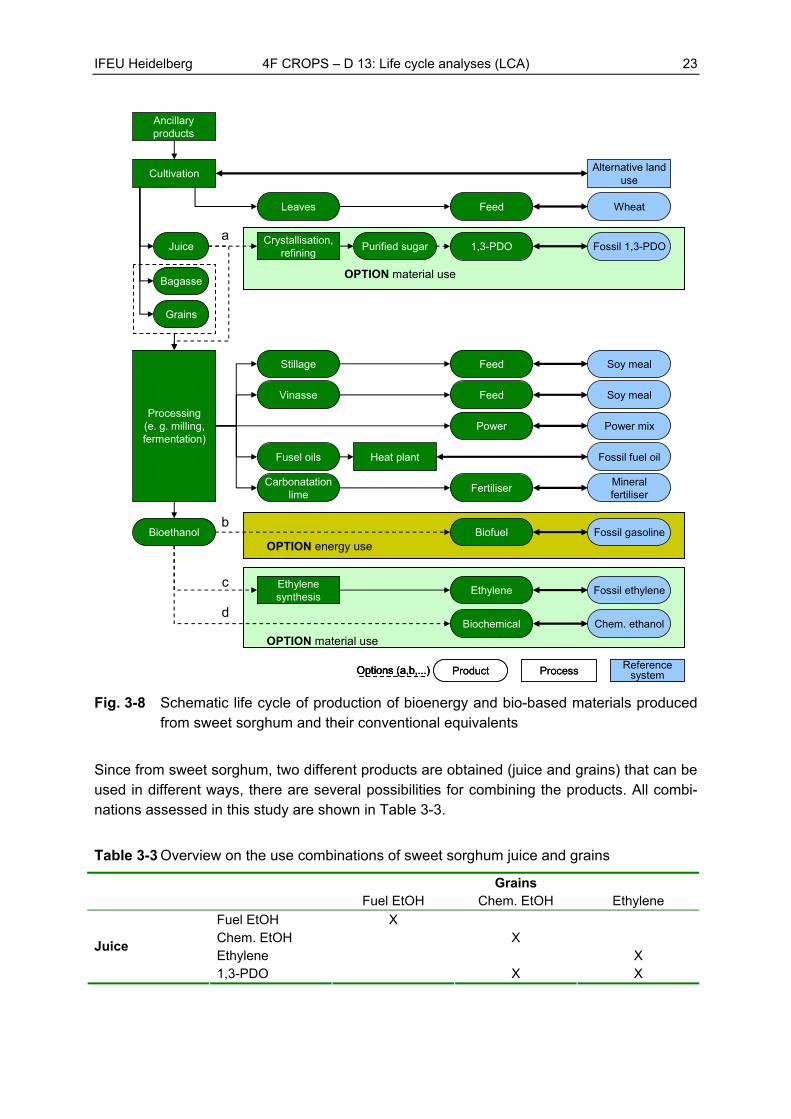
From sweet sorghum, different crop parts are obtained which can serve different purposes (Fig. 3-8). The stems contain a sugary juice which can either be used to produce 1,3-PDO for the chemical industry (a) or further transformed into bioethanol – analogous to sugar beet. Furthermore, the starch containing grains can also be used to produce ethanol. Both types of ethanol – from the juice and from the grains – can either serve as a biofuel (b) or as a re-newable raw material in the chemical industry (c, d).
IFEU Heidelberg 4F CROPS – D 13: Life cycle analyses (LCA) 23
Cultivation
Ancillary products
Bioethanol
Vinasse Feed
Grains
Stillage
Leaves
Fusel oils
Carbonatationlime
Feed
Fertiliser
Wheat
Soy meal
Soy meal
Power mix
Fossil fuel oil
Mineral fertiliser
Power
Feed
Crystallisation, refining
Purified sugar 1,3-PDO Fossil 1,3-PDO
Fossil ethyleneEthylene synthesis
Ethylene
Chem. ethanol
Processing (e. g. milling, fermentation)
Biochemical
Juice
Bagasse
Heat plant
a
bBiofuel Fossil gasoline
c
d
OPTION material use
OPTION energy use
Product Process Reference systemOptions (a,b,...) Product Process Reference systemOptions (a,b,...)Options (a,b,...)
OPTION material use
Alternative land use
Fig. 3-8 Schematic life cycle of production of bioenergy and bio-based materials produced from sweet sorghum and their conventional equivalents
Since from sweet sorghum, two different products are obtained (juice and grains) that can be used in different ways, there are several possibilities for combining the products. All combi-nations assessed in this study are shown in Table 3-3.
Table 3-3 Overview on the use combinations of sweet sorghum juice and grains
Grains Fuel EtOH Chem. EtOH Ethylene
Fuel EtOH X Chem. EtOH X Ethylene X
Juice
1,3-PDO X X
24 4F CROPS – D 13: Life cycle analyses (LCA) IFEU Heidelberg
3.4 Reference scenarios: Variations and sensitivity analyses
A multi-functional assessment tool is applied to scrutinise life cycle stages having a signifi-cant influence on the results as well as to identify dependencies on various parameters. This tool uses correlations based on functional dependencies, e.g. CO2 equivalent savings as a function of yields (spatial and temporal), co-product uses or substituted power mixes.
In the following, a number of variations and sensitivity analyses are shortly presented. Their results are displayed in chapter 4.3. If not indicated otherwise, all variations and sensitivity analyses are based on current (2008) average (avg) yields. The default agricultural reference system (alternative land use) is fallow and for electricity inputs and outputs, the European average power mix (UCTE mix) is taken into account.
3.4.1 Crop cultivation
Agricultural reference system
As described in chapter 2.2.2, the agricultural reference system (alternative land use) is an essential part of LCAs for agricultural products. By definition, the agricultural reference sys-tem also comprises any change in land use or land cover induced by the cultivation of the investigated crop. This sensitivity analysis aims at evaluating the effects of different alterna-tive land uses, including direct and indirect effects on the greenhouse gas balances. For fur-ther background information on land-use change dynamics, see chapter 2.2.2.
All scenarios assessed in this sensitivity analysis are displayed in Fig. 3-9. The scenarios are divided into scenarios which only consider direct effects (referred to as ‘a’) and others which also take into account indirect effects (referred to as ‘b’).
In the basic scenarios of this study, the default agricultural reference system is fallow (sce-nario Ia). This choice is substantiated by the results of an assessment of surplus land poten-tially available for non-food cropping systems within EU25, indicating that more agricultural land will be available than is needed to satisfy the demand for food and feed. This is in line with the assumptions of the land availability assessment in WP 1. Since only surplus land (i.e. land which is not needed for food and feed production) is used for energy and industrial crop cultivation, no crops are displaced, which does not lead to any indirect land-use changes. With carbon stock change set at zero, a land-use change from fallow (still remain-ing agricultural land, i.e. not subject to natural succession) to cropland does not involve any GHG emissions. The latter also applies to scenario Ib, but in this case, indirect land-use ef-fects due to co-product use are taken into account.
Scenario II and III refer to the replacement of food crops (wheat) as well as of feed (grass-land on organic soils). In contrast to the use of fallow, the displacement of food and feed pro-duction due to energy crop cultivation in Europe induces indirect land-use changes: wheat production is displaced to US prairie and feed production is substituted by soy production on former Brazilian forest land. The displacement of feed, i.e. the substitution of forage by soy is calculated based on the protein contents. Therefore, using one hectare of grassland for non-food purposes does not necessarily mean that exactly one hectare of new land will be used
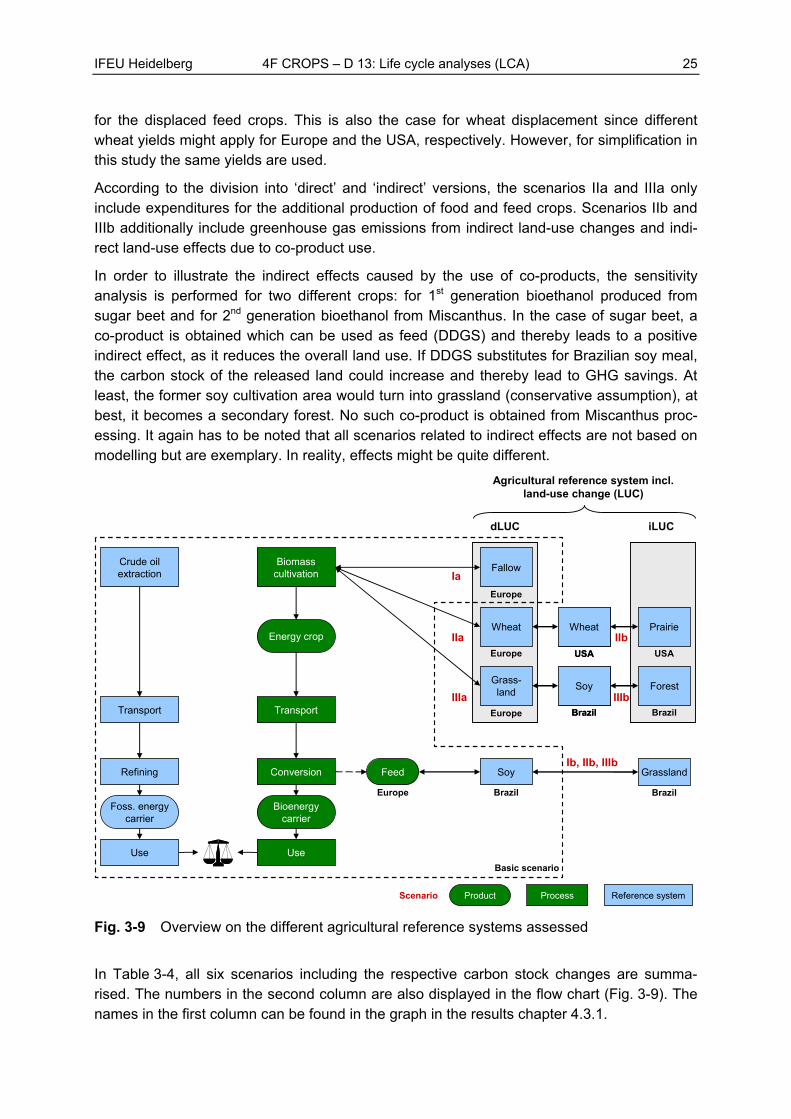
IFEU Heidelberg 4F CROPS – D 13: Life cycle analyses (LCA) 25
for the displaced feed crops. This is also the case for wheat displacement since different wheat yields might apply for Europe and the USA, respectively. However, for simplification in this study the same yields are used.
According to the division into ‘direct’ and ‘indirect’ versions, the scenarios IIa and IIIa only include expenditures for the additional production of food and feed crops. Scenarios IIb and IIIb additionally include greenhouse gas emissions from indirect land-use changes and indi-rect land-use effects due to co-product use.
In order to illustrate the indirect effects caused by the use of co-products, the sensitivity analysis is performed for two different crops: for 1st generation bioethanol produced from sugar beet and for 2nd generation bioethanol from Miscanthus. In the case of sugar beet, a co-product is obtained which can be used as feed (DDGS) and thereby leads to a positive indirect effect, as it reduces the overall land use. If DDGS substitutes for Brazilian soy meal, the carbon stock of the released land could increase and thereby lead to GHG savings. At least, the former soy cultivation area would turn into grassland (conservative assumption), at best, it becomes a secondary forest. No such co-product is obtained from Miscanthus proc-essing. It again has to be noted that all scenarios related to indirect effects are not based on modelling but are exemplary. In reality, effects might be quite different.
Ia
IIa
Biomasscultivation
Conversion
Transport
Crude oilextraction
Refining
Transport
Bioenergycarrier
Foss. energycarrier
UseUse
Energy cropWheat
Europe
Wheat
USA
Wheat
USA
Prairie
USA
Fallow
Europe
dLUC iLUC
IIIaBrazil
ForestGrass-land
Europe Brazil
Soy
Brazil
Soy
Feed Soy
Agricultural reference system incl.land-use change (LUC)
Brazil
Grassland
BrazilEurope
Product Reference systemProcess
IIb
IIIb
Ib, IIb, IIIb
Scenario
Basic scenario
Fig. 3-9 Overview on the different agricultural reference systems assessed
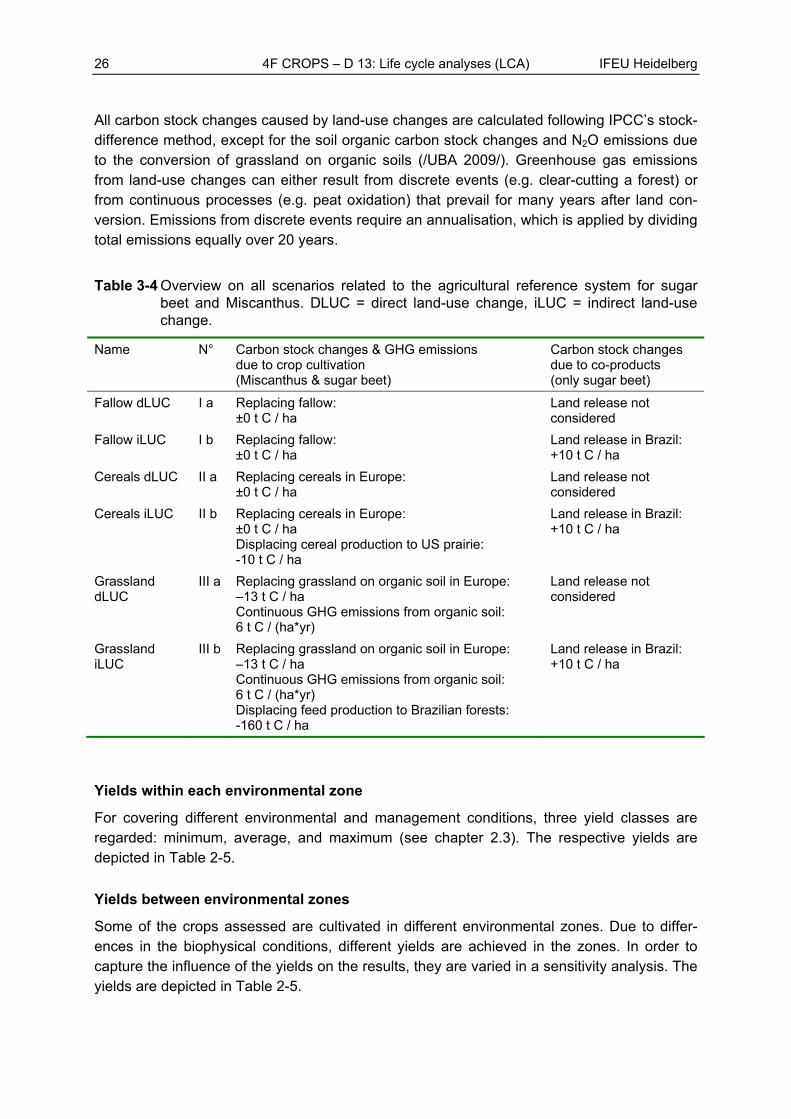
In Table 3-4, all six scenarios including the respective carbon stock changes are summa-rised. The numbers in the second column are also displayed in the flow chart (Fig. 3-9). The names in the first column can be found in the graph in the results chapter 4.3.1.
26 4F CROPS – D 13: Life cycle analyses (LCA) IFEU Heidelberg
All carbon stock changes caused by land-use changes are calculated following IPCC’s stock-difference method, except for the soil organic carbon stock changes and N2O emissions due to the conversion of grassland on organic soils (/UBA 2009/). Greenhouse gas emissions from land-use changes can either result from discrete events (e.g. clear-cutting a forest) or from continuous processes (e.g. peat oxidation) that prevail for many years after land con-version. Emissions from discrete events require an annualisation, which is applied by dividing total emissions equally over 20 years.
Table 3-4 Overview on all scenarios related to the agricultural reference system for sugar beet and Miscanthus. DLUC = direct land-use change, iLUC = indirect land-use change.
Name N° Carbon stock changes & GHG emissions due to crop cultivation (Miscanthus & sugar beet)
Carbon stock changes due to co-products (only sugar beet)
Fallow dLUC I a Replacing fallow: ±0 t C / ha
Land release not considered
Fallow iLUC I b Replacing fallow: ±0 t C / ha
Land release in Brazil: +10 t C / ha
Cereals dLUC II a Replacing cereals in Europe: ±0 t C / ha
Land release not considered
Cereals iLUC II b Replacing cereals in Europe: ±0 t C / ha Displacing cereal production to US prairie: -10 t C / ha
Land release in Brazil: +10 t C / ha
Grassland dLUC
III a Replacing grassland on organic soil in Europe: –13 t C / ha
Continuous GHG emissions from organic soil: 6 t C / (ha*yr)
Land release not considered
Grassland iLUC
III b Replacing grassland on organic soil in Europe: –13 t C / ha Continuous GHG emissions from organic soil: 6 t C / (ha*yr)
Displacing feed production to Brazilian forests: -160 t C / ha
Land release in Brazil: +10 t C / ha
Yields within each environmental zone
For covering different environmental and management conditions, three yield classes are regarded: minimum, average, and maximum (see chapter 2.3). The respective yields are depicted in Table 2-5.
Yields between environmental zones
Some of the crops assessed are cultivated in different environmental zones. Due to differ-ences in the biophysical conditions, different yields are achieved in the zones. In order to capture the influence of the yields on the results, they are varied in a sensitivity analysis. The yields are depicted in Table 2-5.
IFEU Heidelberg 4F CROPS – D 13: Life cycle analyses (LCA) 27
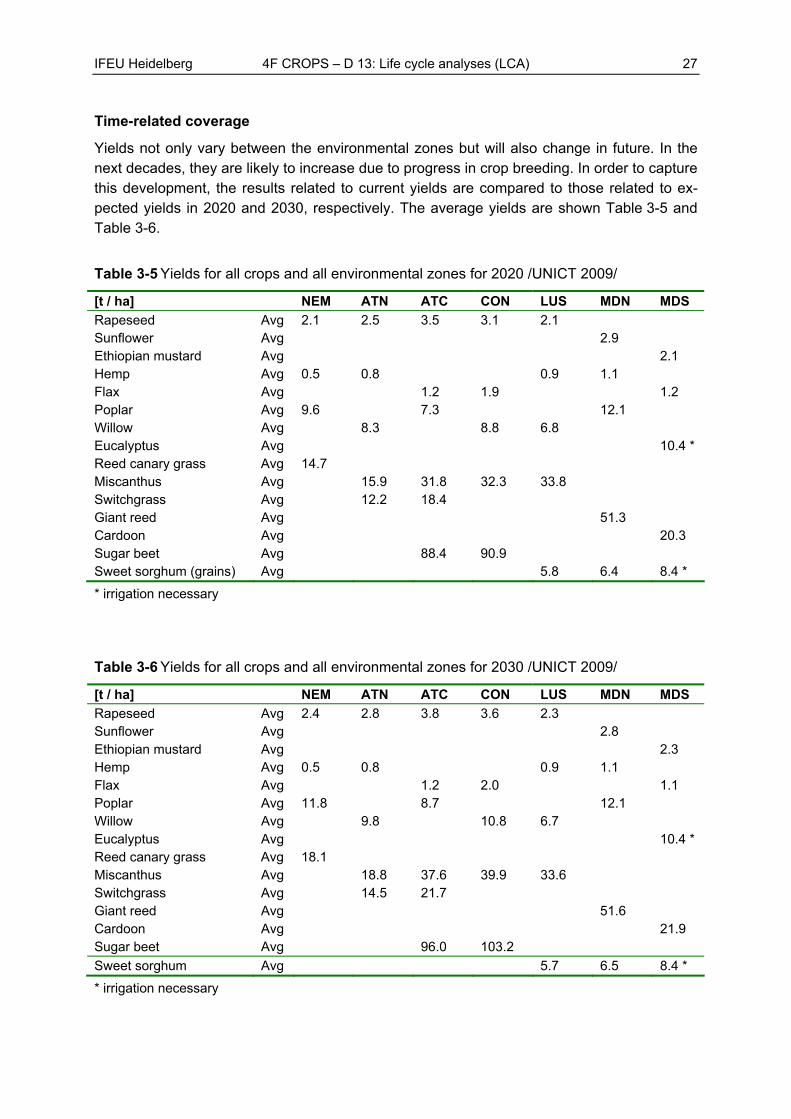
Time-related coverage
Yields not only vary between the environmental zones but will also change in future. In the next decades, they are likely to increase due to progress in crop breeding. In order to capture this development, the results related to current yields are compared to those related to ex-pected yields in 2020 and 2030, respectively. The average yields are shown Table 3-5 and Table 3-6.
Table 3-5 Yields for all crops and all environmental zones for 2020 /UNICT 2009/
[t / ha] NEM ATN ATC CON LUS MDN MDS
Rapeseed Avg 2.1 2.5 3.5 3.1 2.1 Sunflower Avg 2.9 Ethiopian mustard Avg 2.1 Hemp Avg 0.5 0.8 0.9 1.1 Flax Avg 1.2 1.9 1.2 Poplar Avg 9.6 7.3 12.1 Willow Avg 8.3 8.8 6.8 Eucalyptus Avg 10.4 * Reed canary grass Avg 14.7 Miscanthus Avg 15.9 31.8 32.3 33.8 Switchgrass Avg 12.2 18.4 Giant reed Avg 51.3 Cardoon Avg 20.3 Sugar beet Avg 88.4 90.9 Sweet sorghum (grains) Avg 5.8 6.4 8.4 *
* irrigation necessary
Table 3-6 Yields for all crops and all environmental zones for 2030 /UNICT 2009/
[t / ha] NEM ATN ATC CON LUS MDN MDS
Rapeseed Avg 2.4 2.8 3.8 3.6 2.3 Sunflower Avg 2.8 Ethiopian mustard Avg 2.3 Hemp Avg 0.5 0.8 0.9 1.1 Flax Avg 1.2 2.0 1.1 Poplar Avg 11.8 8.7 12.1 Willow Avg 9.8 10.8 6.7 Eucalyptus Avg 10.4 * Reed canary grass Avg 18.1 Miscanthus Avg 18.8 37.6 39.9 33.6 Switchgrass Avg 14.5 21.7 Giant reed Avg 51.6 Cardoon Avg 21.9 Sugar beet Avg 96.0 103.2
Sweet sorghum Avg 5.7 6.5 8.4 *
* irrigation necessary

28 4F CROPS – D 13: Life cycle analyses (LCA) IFEU Heidelberg
3.4.2 Co-product use and allocation
Variation of co-product use
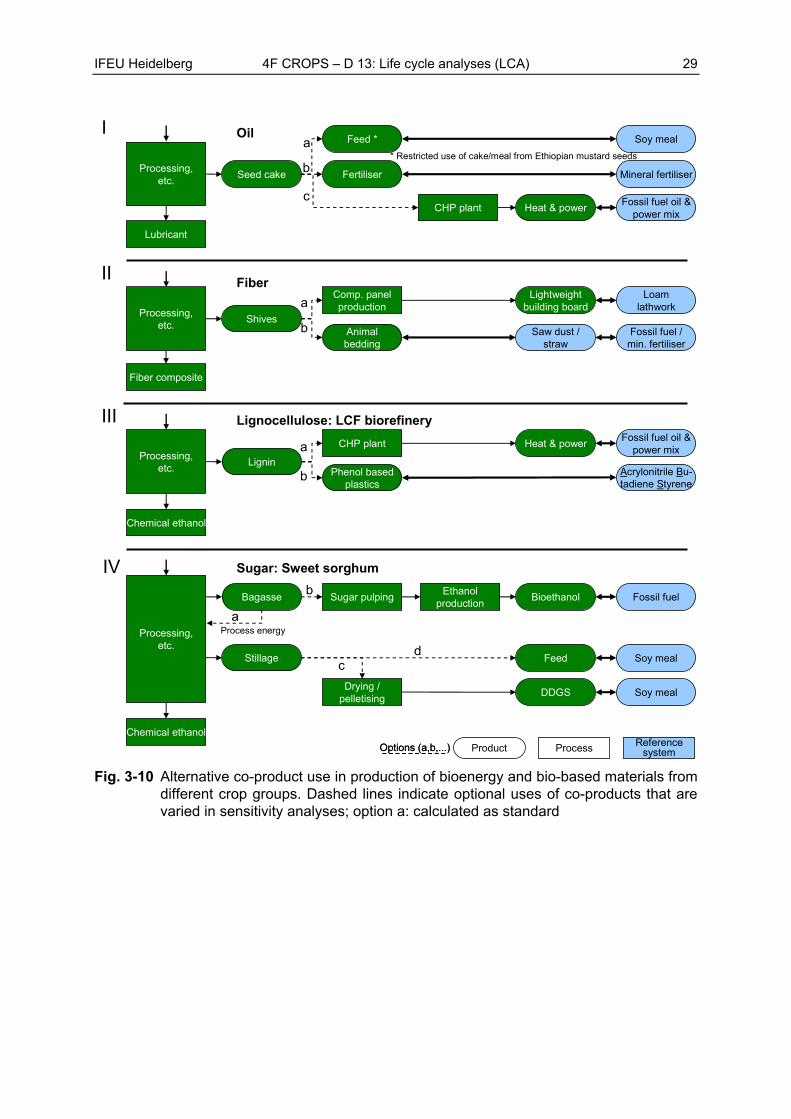
Along the life cycles of the crops under concern, different co-products are obtained. They can be used in different ways resulting in different conventional products to be replaced. Fig. 3-10 shows selected co-products obtained in different crop groups and their alternative use op-tions. For oil crops, the seed meal can either be used as animal feed, fertiliser or as solid biofuel producing heat and power (Variation I). Regarding hemp and flax, the shives that are obtained in fiber extraction can be used as material for lightweight building board production or as animal bedding (Variation II). In the lignocellulosic feedstock (LCF) biorefinery, the lig-nin containing biomass can either be directly combusted in a CHP to generate process en-ergy or used as raw material for plastics production (Variation III). When processing sweet sorghum into bioethanol, bagasse and stillage are obtained which can be used as follows (Variation IV): the bagasse can either be combusted internally and returned to the production process as process energy, or it can be processed to second generation bioethanol. One option to use stillage, a residue from fermentation, is its direct use as feed. It can also can be further dried and pelletised and used as feed in form of Distillers’ Dried Grains with Solubles (DDGS). The advantage of the latter product is that it can be stored and transported and thus may be sold on the feed market.
IFEU Heidelberg 4F CROPS – D 13: Life cycle analyses (LCA) 29
Comp. panelproduction
Shives
Lightweight building board
Loamlathwork
Animalbedding
Saw dust /straw
Fossil fuel /min. fertiliser
Seed cake
Feed * Soy meal
Fertiliser Mineral fertiliser
Fossil fuel oil &power mix
Fiber
Oil
Processing,etc.
Processing,etc.
DDGS
Stillage Soy meal
Soy mealDrying /
pelletising
Feed
Processing,etc.
Sugar: Sweet sorghum
Lignin
Fossil fuel oil &power mix
CHP plantProcessing,
etc.
Lignocellulose: LCF biorefinery
Phenol based plastics
Acrylonitrile Bu-tadiene Styrene
I
II
III
IV
Bagasse Fossil fuelSugar pulping BioethanolEthanol
production
Process energy
* Restricted use of cake/meal from Ethiopian mustard seeds
CHP plant Heat & power
Heat & power
a
b
c
a
b
a
b
b
c
a
d
Product Process Reference systemOptions (a,b,...)Options (a,b,...)
Lubricant
Fiber composite
Chemical ethanol
Chemical ethanol
Fig. 3-10 Alternative co-product use in production of bioenergy and bio-based materials from different crop groups. Dashed lines indicate optional uses of co-products that are varied in sensitivity analyses; option a: calculated as standard
30 4F CROPS – D 13: Life cycle analyses (LCA) IFEU Heidelberg
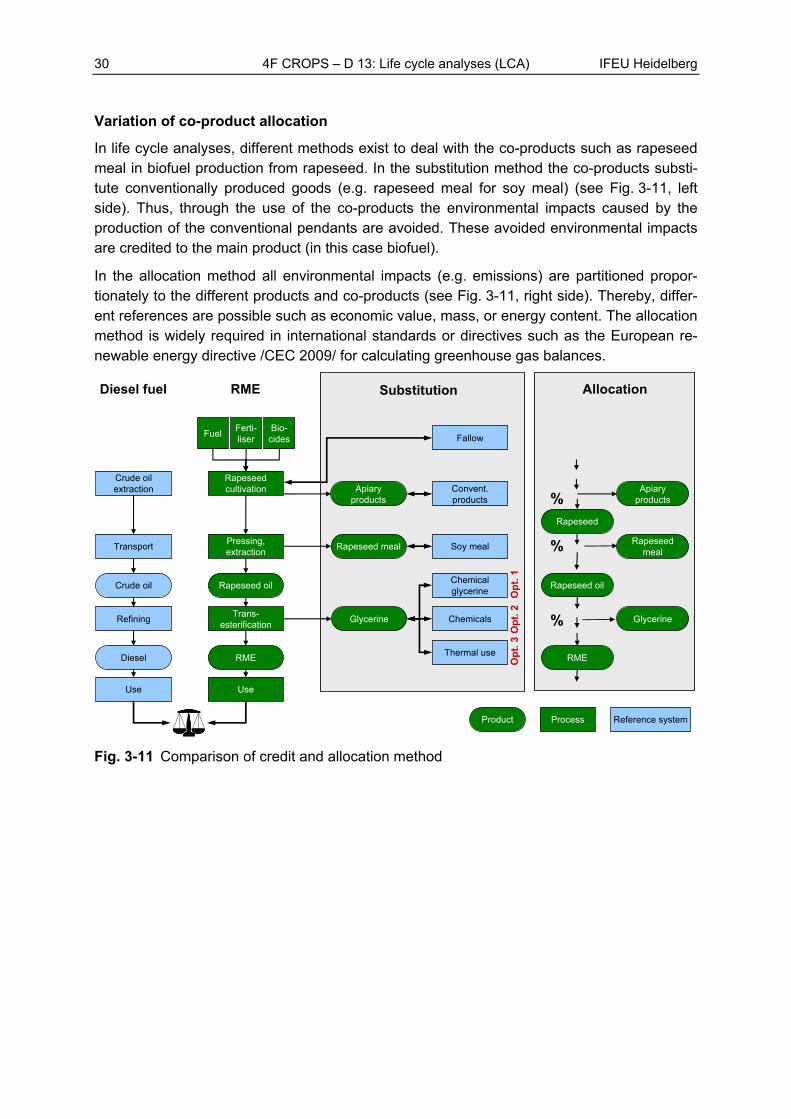
Variation of co-product allocation
In life cycle analyses, different methods exist to deal with the co-products such as rapeseed meal in biofuel production from rapeseed. In the substitution method the co-products substi-tute conventionally produced goods (e.g. rapeseed meal for soy meal) (see Fig. 3-11, left side). Thus, through the use of the co-products the environmental impacts caused by the production of the conventional pendants are avoided. These avoided environmental impacts are credited to the main product (in this case biofuel).
In the allocation method all environmental impacts (e.g. emissions) are partitioned propor-tionately to the different products and co-products (see Fig. 3-11, right side). Thereby, differ-ent references are possible such as economic value, mass, or energy content. The allocation method is widely required in international standards or directives such as the European re-newable energy directive /CEC 2009/ for calculating greenhouse gas balances.
Crude oil extraction
Use
RME
Use
Diesel fuel
Ferti-liser
FuelBio-cides
Rapeseed cultivation
Glycerine
Convent. products
Substitution
Chemicals
TransportPressing, extraction
RefiningTrans-
esterification
Rapeseed meal Soy meal
Fallow
Apiaryproducts
Chemical glycerine
Thermal use
Glycerine
Apiaryproducts
Allocation
Rapeseed
Rapeseed oil
RME
Rapeseed meal
%
%
%
Crude oil Rapeseed oil
Diesel RME
Product Reference systemProcess
Op
t. 1
Op
t. 2
Op
t. 3
Fig. 3-11 Comparison of credit and allocation method
IFEU Heidelberg 4F CROPS – D 13: Life cycle analyses (LCA) 31
3.4.3 Fossil reference system
Stationary energy use
The oil and lignocellulosic crops can be used for generating power and / or heat either in combined heat and power production facilities (CHP) or in separate heat and power plants. These options are displayed in Fig. 3-3 to Fig. 3-7. Depending on the scenario, different fos-sil energy carrier sources are replaced: if the biomass is used in a CHP, a fossil heat plant and power from the grid are replaced. If only power or heat are produced from the biomass, either power from the grid or fossil heating plants are replaced.
Substituted power mix
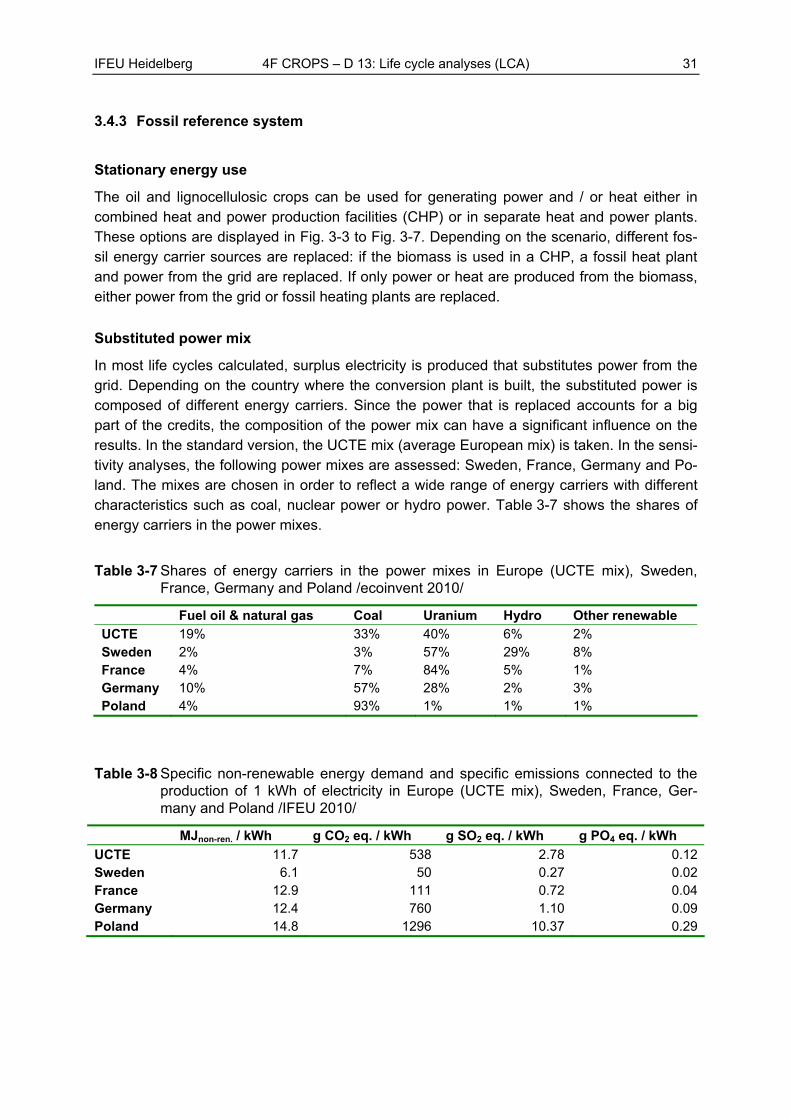
In most life cycles calculated, surplus electricity is produced that substitutes power from the grid. Depending on the country where the conversion plant is built, the substituted power is composed of different energy carriers. Since the power that is replaced accounts for a big part of the credits, the composition of the power mix can have a significant influence on the results. In the standard version, the UCTE mix (average European mix) is taken. In the sensi-tivity analyses, the following power mixes are assessed: Sweden, France, Germany and Po-land. The mixes are chosen in order to reflect a wide range of energy carriers with different characteristics such as coal, nuclear power or hydro power. Table 3-7 shows the shares of energy carriers in the power mixes.
Table 3-7 Shares of energy carriers in the power mixes in Europe (UCTE mix), Sweden, France, Germany and Poland /ecoinvent 2010/
Fuel oil & natural gas Coal Uranium Hydro Other renewable
UCTE 19% 33% 40% 6% 2% Sweden 2% 3% 57% 29% 8% France 4% 7% 84% 5% 1% Germany 10% 57% 28% 2% 3% Poland 4% 93% 1% 1% 1%
Table 3-8 Specific non-renewable energy demand and specific emissions connected to the production of 1 kWh of electricity in Europe (UCTE mix), Sweden, France, Ger-many and Poland /IFEU 2010/
MJnon-ren. / kWh g CO2 eq. / kWh g SO2 eq. / kWh g PO4 eq. / kWh
UCTE 11.7 538 2.78 0.12Sweden 6.1 50 0.27 0.02France 12.9 111 0.72 0.04Germany 12.4 760 1.10 0.09Poland 14.8 1296 10.37 0.29
32 4F CROPS – D 13: Life cycle analyses (LCA) IFEU Heidelberg
4 Results
In the following, the results for the life cycle comparisons between the products of the differ-ent crops and their fossil equivalents are presented. In chapter 4.1 some results are exempli-fied in order to explain how the graphs are generated. In chapter 4.2 the results are pre-sented for each crop featuring its use for energy production and as bio-based material as well as for all environmental impact categories. For each crop, one environmental zone is chosen as an example. The results for all other environmental zones can be found in the appendix (chapter 7). Chapter 4.3 presents the results of the sensitivity analyses where se-lected life cycle stages are varied.
4.1 Exemplification of results
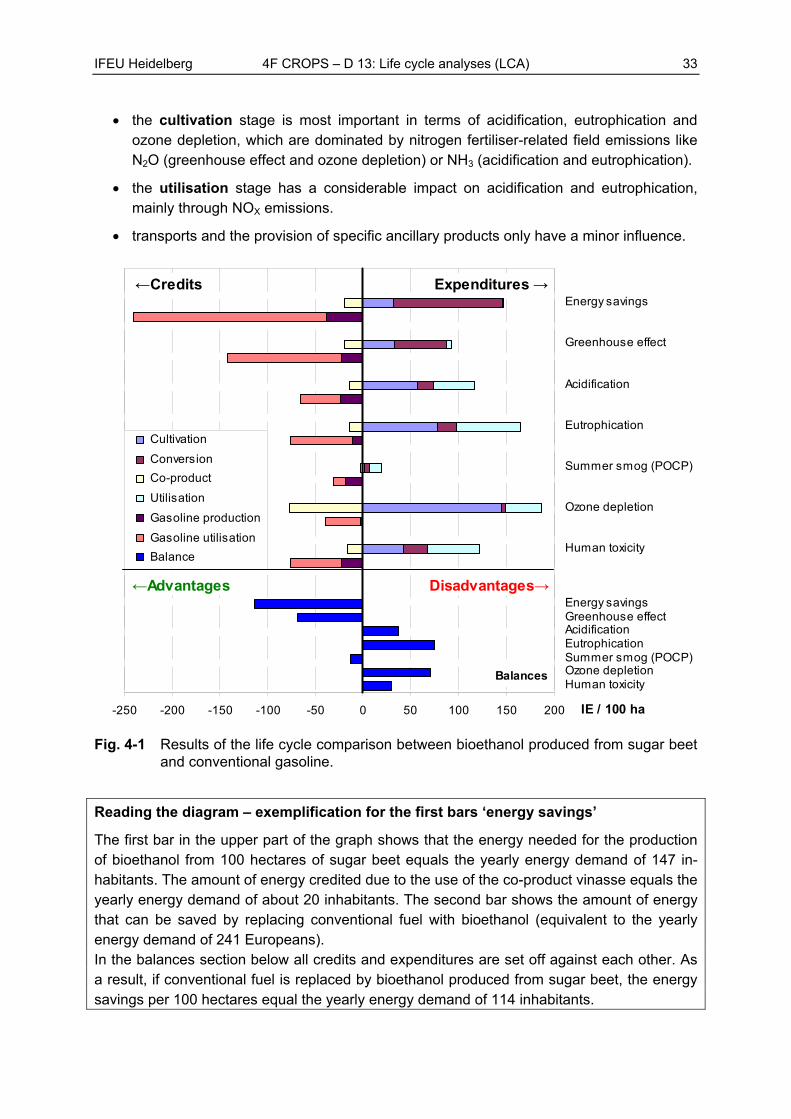
Fig. 4-1 shall serve as an example to explain how the graphs in the following chapters are generated. It shows the life cycle comparison between bioethanol produced from sugar beet and conventional gasoline. The first bars in the upper part of the chart show on the right side all expenditures necessary for the production of bioethanol (e.g. cultivation, conversion of the juice into bioethanol). To the left all credits are depicted which are obtained from the use of co-products (here: vinasse). The second bars in each category show the expenditures re-lated to the production and use of the conventional gasoline which is replaced by bioethanol. The lower part of the graph depicts the balances for each environmental impact category. They are calculated as follows: the credits for the bioethanol production and the expenditures for the fossil equivalent are summed up and subtracted from the expenditures for the bio-ethanol production. The balances thus quantify for instance the net primary energy or green-house gas savings due to the use of bioethanol instead of conventional gasoline. In the fol-lowing chapters, only these balances will be depicted.
Results
The energy and greenhouse gas balances for bioethanol produced from sugar beet show advantages, i.e. substituting conventional fuel by bioethanol helps saving fossil energy resources and greenhouse gas emissions. Regarding summer smog, the balances are advantageous, too.
In contrast, the balances show disadvantages regarding acidification, eutrophication, ozone depletion, and human toxicology. In these cases the expenditures that occur dur-ing the production of bioethanol cannot be compensated by the credits obtained due to the co-product use and due to the replacement of fossil fuel.
The extent to which each life cycle stage contributes to the overall balance varies be-tween the environmental impact categories:
the conversion stage, i.e. the use of fossil energy carriers for process energy genera-tion, has the largest influence on energy and greenhouse gas balances. In contrast, conversion is of only minor importance for other environmental impact categories.
IFEU Heidelberg 4F CROPS – D 13: Life cycle analyses (LCA) 33
the cultivation stage is most important in terms of acidification, eutrophication and ozone depletion, which are dominated by nitrogen fertiliser-related field emissions like N2O (greenhouse effect and ozone depletion) or NH3 (acidification and eutrophication).
the utilisation stage has a considerable impact on acidification and eutrophication, mainly through NOX emissions.
transports and the provision of specific ancillary products only have a minor influence.
-250 -200 -150 -100 -50 0 50 100 150 200
Human toxicityOzone depletionSummer smog (POCP)EutrophicationAcidificationGreenhouse effectEnergy savings
Human toxicity
Ozone depletion
Summer smog (POCP)
Eutrophication
Acidification
Greenhouse effect
Energy savings
IE / 100 ha
Cultivation
Conversion
Co-product
Utilisation
Gasoline production
Gasoline utilisation
Balance
←Advantages Disadvantages→
Expenditures →←Credits
Balances
Fig. 4-1 Results of the life cycle comparison between bioethanol produced from sugar beet and conventional gasoline.
Reading the diagram – exemplification for the first bars ‘energy savings’
The first bar in the upper part of the graph shows that the energy needed for the production of bioethanol from 100 hectares of sugar beet equals the yearly energy demand of 147 in-habitants. The amount of energy credited due to the use of the co-product vinasse equals the yearly energy demand of about 20 inhabitants. The second bar shows the amount of energy that can be saved by replacing conventional fuel with bioethanol (equivalent to the yearly energy demand of 241 Europeans). In the balances section below all credits and expenditures are set off against each other. As a result, if conventional fuel is replaced by bioethanol produced from sugar beet, the energy savings per 100 hectares equal the yearly energy demand of 114 inhabitants.
34 4F CROPS – D 13: Life cycle analyses (LCA) IFEU Heidelberg
4.2 Basic scenarios
This chapter presents the results of the life cycle comparisons for all 15 crops. The underly-ing life cycles are shown in chapter 3.3. The results are aggregated into oil crops, fiber crops, woody lignocellulosic crops, herbaceous lignocellulosic crops and sugar crops. For each crop, results are shown only for one exemplary environmental zone. The results for all other investigated environmental zones are depicted in the appendix (chapter 7). The bandwidths refer to the minimum and maximum yields, respectively (see chapter 2.3).
4.2.1 Oil crops
For the bioenergy pathway, only one of the three possibilities presented in chapter 3.3.1 is depicted: the direct combustion of the biomass in combined heat and power plants (CHP). The other two options (the production of either heat or power) are presented in chapter 4.3.4. For each crop, the abbreviation of the environmental zone is indicated in the chapter title.
4.2.1.1 Rapeseed (CON)
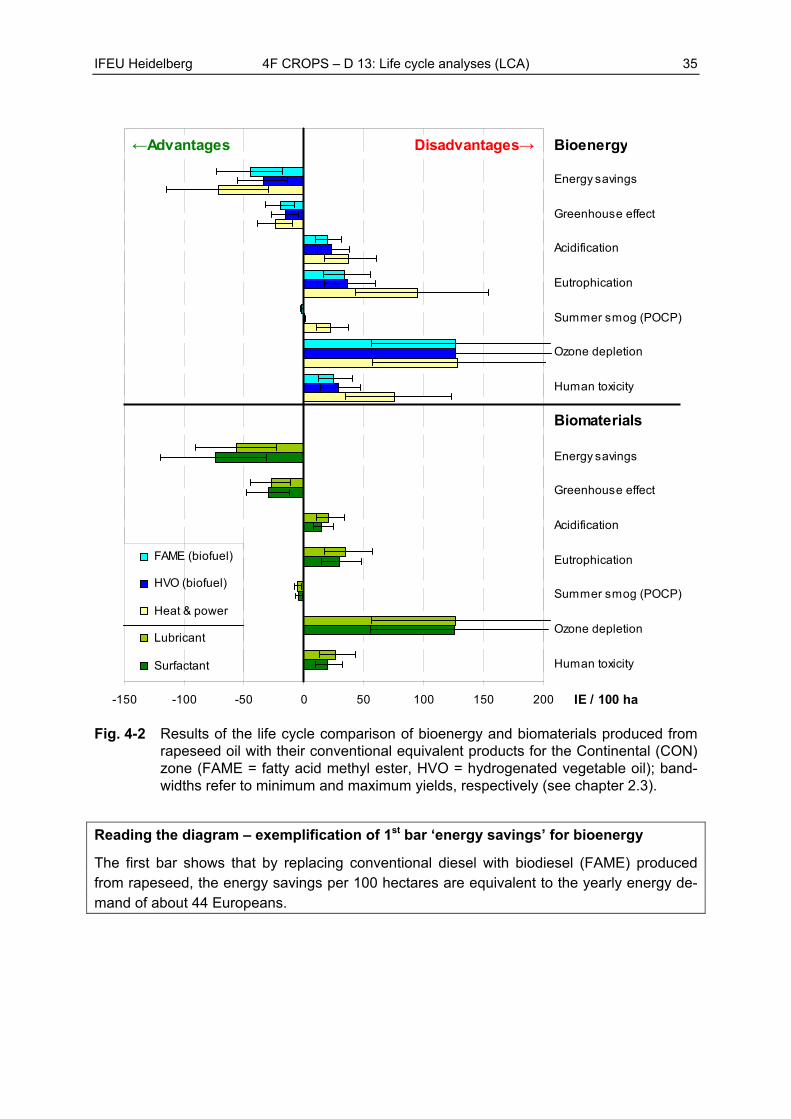
Results: bioenergy
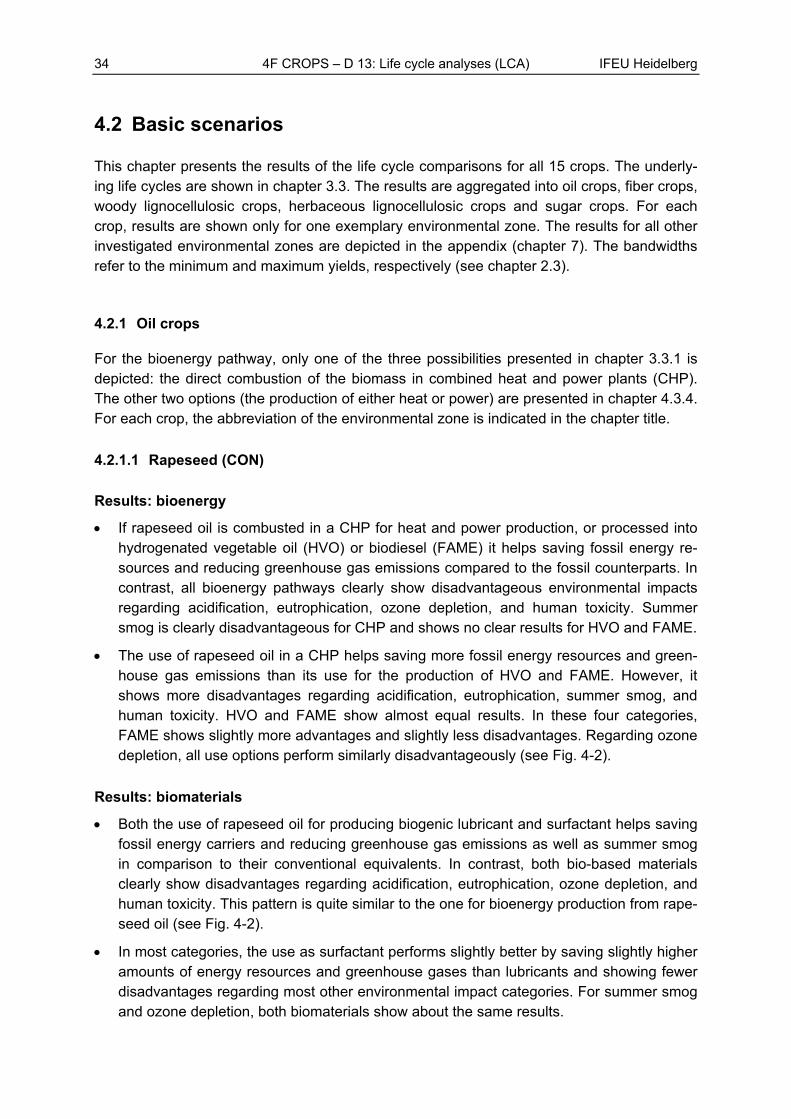
If rapeseed oil is combusted in a CHP for heat and power production, or processed into hydrogenated vegetable oil (HVO) or biodiesel (FAME) it helps saving fossil energy re-sources and reducing greenhouse gas emissions compared to the fossil counterparts. In contrast, all bioenergy pathways clearly show disadvantageous environmental impacts regarding acidification, eutrophication, ozone depletion, and human toxicity. Summer smog is clearly disadvantageous for CHP and shows no clear results for HVO and FAME.
The use of rapeseed oil in a CHP helps saving more fossil energy resources and green-house gas emissions than its use for the production of HVO and FAME. However, it shows more disadvantages regarding acidification, eutrophication, summer smog, and human toxicity. HVO and FAME show almost equal results. In these four categories, FAME shows slightly more advantages and slightly less disadvantages. Regarding ozone depletion, all use options perform similarly disadvantageously (see Fig. 4-2).
Results: biomaterials
Both the use of rapeseed oil for producing biogenic lubricant and surfactant helps saving fossil energy carriers and reducing greenhouse gas emissions as well as summer smog in comparison to their conventional equivalents. In contrast, both bio-based materials clearly show disadvantages regarding acidification, eutrophication, ozone depletion, and human toxicity. This pattern is quite similar to the one for bioenergy production from rape-seed oil (see Fig. 4-2).
In most categories, the use as surfactant performs slightly better by saving slightly higher amounts of energy resources and greenhouse gases than lubricants and showing fewer disadvantages regarding most other environmental impact categories. For summer smog and ozone depletion, both biomaterials show about the same results.
IFEU Heidelberg 4F CROPS – D 13: Life cycle analyses (LCA) 35
-150 -100 -50 0 50 100 150 200
Human toxicity
Ozone depletion
Summer smog (POCP)
Eutrophication
Acidification
Greenhouse effect
Energy savings
Human toxicity
Ozone depletion
Summer smog (POCP)
Eutrophication
Acidification
Greenhouse effect
Energy savings
IE / 100 ha
FAME (biofuel)
HVO (biofuel)
Heat & power
Lubricant
Surfactant
←Advantages Disadvantages→
Biomaterials
Bioenergy
Fig. 4-2 Results of the life cycle comparison of bioenergy and biomaterials produced from rapeseed oil with their conventional equivalent products for the Continental (CON) zone (FAME = fatty acid methyl ester, HVO = hydrogenated vegetable oil); band-widths refer to minimum and maximum yields, respectively (see chapter 2.3).
Reading the diagram – exemplification of 1st bar ‘energy savings’ for bioenergy
The first bar shows that by replacing conventional diesel with biodiesel (FAME) produced from rapeseed, the energy savings per 100 hectares are equivalent to the yearly energy de-mand of about 44 Europeans.
36 4F CROPS – D 13: Life cycle analyses (LCA) IFEU Heidelberg
4.2.1.2 Sunflower (MDN)
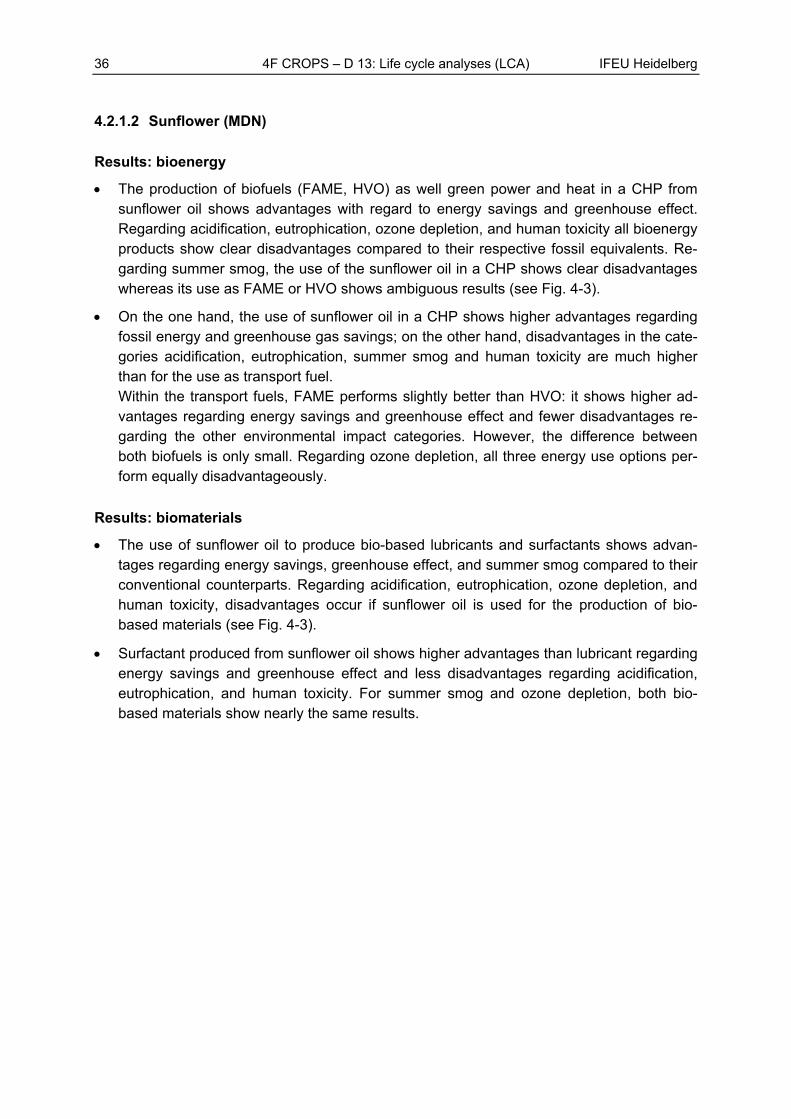
Results: bioenergy
The production of biofuels (FAME, HVO) as well green power and heat in a CHP from sunflower oil shows advantages with regard to energy savings and greenhouse effect. Regarding acidification, eutrophication, ozone depletion, and human toxicity all bioenergy products show clear disadvantages compared to their respective fossil equivalents. Re-garding summer smog, the use of the sunflower oil in a CHP shows clear disadvantages whereas its use as FAME or HVO shows ambiguous results (see Fig. 4-3).
On the one hand, the use of sunflower oil in a CHP shows higher advantages regarding fossil energy and greenhouse gas savings; on the other hand, disadvantages in the cate-gories acidification, eutrophication, summer smog and human toxicity are much higher than for the use as transport fuel. Within the transport fuels, FAME performs slightly better than HVO: it shows higher ad-vantages regarding energy savings and greenhouse effect and fewer disadvantages re-garding the other environmental impact categories. However, the difference between both biofuels is only small. Regarding ozone depletion, all three energy use options per-form equally disadvantageously.
Results: biomaterials
The use of sunflower oil to produce bio-based lubricants and surfactants shows advan-tages regarding energy savings, greenhouse effect, and summer smog compared to their conventional counterparts. Regarding acidification, eutrophication, ozone depletion, and human toxicity, disadvantages occur if sunflower oil is used for the production of bio-based materials (see Fig. 4-3).
Surfactant produced from sunflower oil shows higher advantages than lubricant regarding energy savings and greenhouse effect and less disadvantages regarding acidification, eutrophication, and human toxicity. For summer smog and ozone depletion, both bio-based materials show nearly the same results.
IFEU Heidelberg 4F CROPS – D 13: Life cycle analyses (LCA) 37
-150 -100 -50 0 50 100 150 200
Human toxicity
Ozone depletion
Summer smog (POCP)
Eutrophication
Acidification
Greenhouse effect
Energy savings
Human toxicity
Ozone depletion
Summer smog (POCP)
Eutrophication
Acidification
Greenhouse effect
Energy savings
IE / 100 ha
FAME (biofuel)
HVO (biofuel)
Heat & power
Lubricant
Surfactant
←Advantages Disadvantages→
Biomaterials
Bioenergy
Fig. 4-3 Results of the life cycle comparison of bioenergy and biomaterials produced from sunflower oil with their conventional equivalent products for the Mediterranean North (MDN) zone (FAME = fatty acid methyl ester, HVO = hydrogenated vegeta-ble oil); bandwidths refer to minimum and maximum yields, respectively (see chap-ter 2.3).
Reading the diagram – exemplification of 4th bar ‘greenhouse effect’ for bioenergy
If sunflower oil from 100 hectares is used to produce biodiesel (FAME) that replaces conven-tional diesel as transport fuel, the amount of greenhouse gases savings equals the amount which is emitted each year by 28 Europeans.
38 4F CROPS – D 13: Life cycle analyses (LCA) IFEU Heidelberg
4.2.1.3 Ethiopian mustard (MDS)
Results: bioenergy
Fossil energy can be saved and greenhouse gas emissions can be reduced if the biofu-els HVO or FAME are produced from Ethiopian mustard oil or if the oil is used in a CHP for heat and power production. All these bioenergy use options, however, show disadvan-tages regarding acidification, eutrophication, summer smog, ozone depletion, and human toxicity (see Fig. 4-4).
The use of Ethiopian mustard oil in a CHP shows far higher advantages regarding energy savings and greenhouse effect than if it was used to produce HVO or FAME. These ad-vantages, however, come along with higher disadvantages with regard to acidification, eutrophication, summer smog, and human toxicity. The difference between HVO and FAME are small. HVO performs slightly better than FAME: it shows slightly more savings of energy and greenhouse gases and slightly less disadvantages regarding most other environmental impact categories. Regarding sum-mer smog, there are no clear results for either of the biofuels. Regarding ozone depletion, there are no differences between the stationary use of the oil (in a CHP) and its mobile (HVO or FAME).
Results: biomaterials
Fossil energy as well as greenhouse gas emissions can be saved by using lubricants and surfactants produced from Ethiopian mustard oil instead of the respective conventional equivalents. However, they increase acidification, eutrophication, ozone depletion, and human toxicity in comparison to their conventional equivalent products. Regarding sum-mer smog, there are no clear results (see Fig. 4-4).
The use of Ethiopian mustard oil for producing surfactants helps saving more energy and greenhouse gas emissions than lubricants. At the same time, surfactants show less dis-advantages regarding acidification, eutrophication, and human toxicity. Regarding sum-mer smog and ozone depletion, the results do not show significant differences.
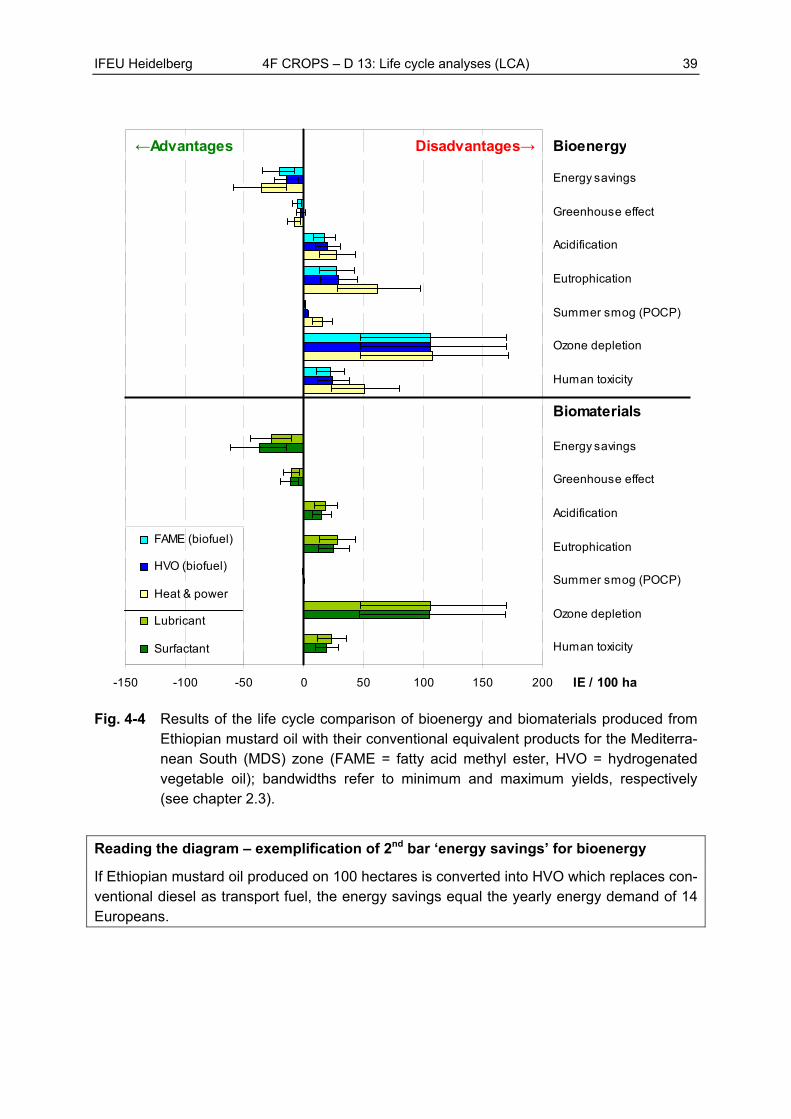
IFEU Heidelberg 4F CROPS – D 13: Life cycle analyses (LCA) 39
-150 -100 -50 0 50 100 150 200
Human toxicity
Ozone depletion
Summer smog (POCP)
Eutrophication
Acidification
Greenhouse effect
Energy savings
Human toxicity
Ozone depletion
Summer smog (POCP)
Eutrophication
Acidification
Greenhouse effect
Energy savings
IE / 100 ha
FAME (biofuel)
HVO (biofuel)
Heat & power
Lubricant
Surfactant
←Advantages Disadvantages→
Biomaterials
Bioenergy
Fig. 4-4 Results of the life cycle comparison of bioenergy and biomaterials produced from Ethiopian mustard oil with their conventional equivalent products for the Mediterra-nean South (MDS) zone (FAME = fatty acid methyl ester, HVO = hydrogenated vegetable oil); bandwidths refer to minimum and maximum yields, respectively (see chapter 2.3).
Reading the diagram – exemplification of 2nd bar ‘energy savings’ for bioenergy
If Ethiopian mustard oil produced on 100 hectares is converted into HVO which replaces con-ventional diesel as transport fuel, the energy savings equal the yearly energy demand of 14 Europeans.
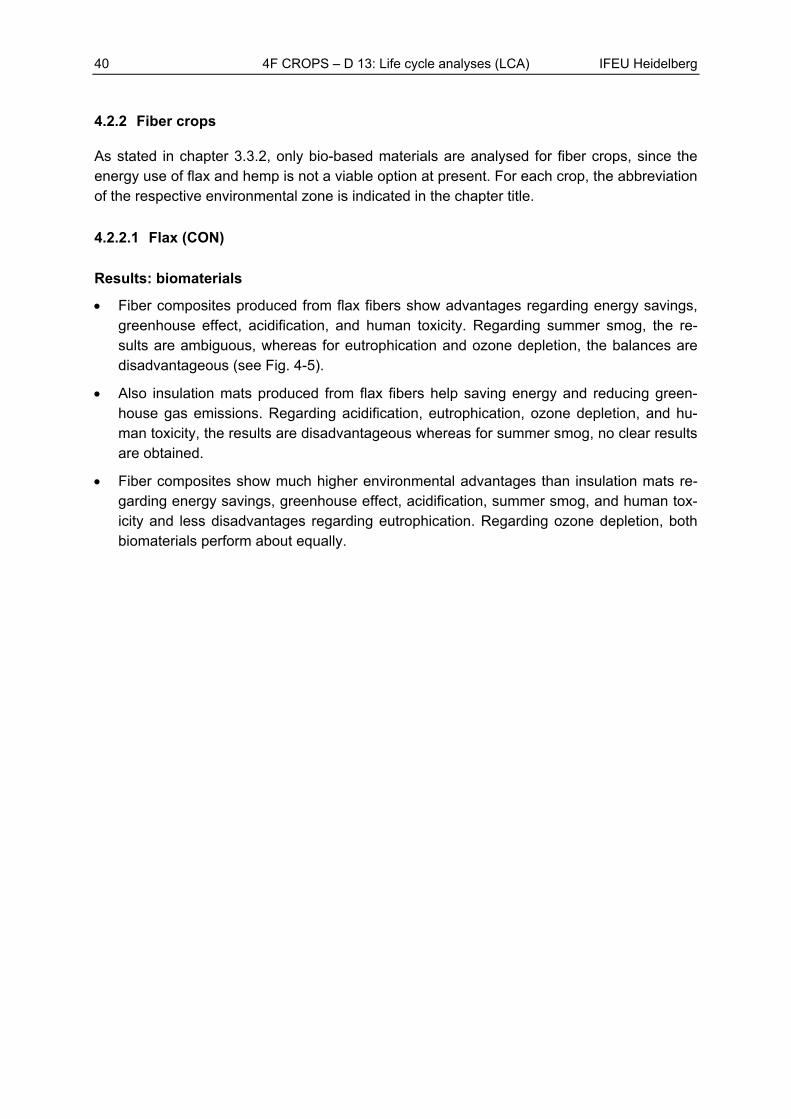
40 4F CROPS – D 13: Life cycle analyses (LCA) IFEU Heidelberg
4.2.2 Fiber crops
As stated in chapter 3.3.2, only bio-based materials are analysed for fiber crops, since the energy use of flax and hemp is not a viable option at present. For each crop, the abbreviation of the respective environmental zone is indicated in the chapter title.
4.2.2.1 Flax (CON)
Results: biomaterials
Fiber composites produced from flax fibers show advantages regarding energy savings, greenhouse effect, acidification, and human toxicity. Regarding summer smog, the re-sults are ambiguous, whereas for eutrophication and ozone depletion, the balances are disadvantageous (see Fig. 4-5).
Also insulation mats produced from flax fibers help saving energy and reducing green-house gas emissions. Regarding acidification, eutrophication, ozone depletion, and hu-man toxicity, the results are disadvantageous whereas for summer smog, no clear results are obtained.
Fiber composites show much higher environmental advantages than insulation mats re-garding energy savings, greenhouse effect, acidification, summer smog, and human tox-icity and less disadvantages regarding eutrophication. Regarding ozone depletion, both biomaterials perform about equally.
IFEU Heidelberg 4F CROPS – D 13: Life cycle analyses (LCA) 41
-350 -300 -250 -200 -150 -100 -50 0 50 100 150 200
Human toxicity
Ozone depletion
Summer smog (POCP)
Eutrophication
Acidification
Greenhouse effect
Energy savings
IE / 100 ha
Fiber composite
Insulation mat
←Advantages Disadvantages→ Biomaterials
Fig. 4-5 Results of the life cycle comparison of biomaterials produced from flax fibers grown in the Continental (CON) zone; bandwidths refer to minimum and maximum yields, respectively (see chapter 2.3).
Reading the diagram – exemplification of 1st bar ‘energy savings’
If flax fibers are used for the production of fiber composites that replace conventionally pro-duced synthetic fiber composites, the energy savings per 100 hectares equal the yearly en-ergy demand of 190 inhabitants.
42 4F CROPS – D 13: Life cycle analyses (LCA) IFEU Heidelberg
4.2.2.2 Hemp (ATN)
Results: biomaterials
By using fiber composites made from hemp fibers instead of conventionally produced synthetic fiber composites, fossil energy resources can be saved and greenhouse gas emissions can be reduced (see Fig. 4-6). On the contrary, the biomaterial option clearly show environmental disadvantages regarding acidification, eutrophication, ozone deple-tion, and human toxicity. Regarding summer smog, results are inconclusive.
Also insulation mats produced from hemp fibers show advantages regarding energy sav-ings and greenhouse effect whereas for acidification, eutrophication, ozone depletion, and human toxicity, they show disadvantages compared to conventionally produced rock wool mats. For summer smog ambiguous results are obtained.
Fiber composites perform better than insulation mats. They show far higher advantages regarding energy savings and greenhouse effect and perform much better regarding acidification, eutrophication, summer smog, and human toxicity. Regarding ozone deple-tion, both biomaterials show almost the same amount of disadvantages.
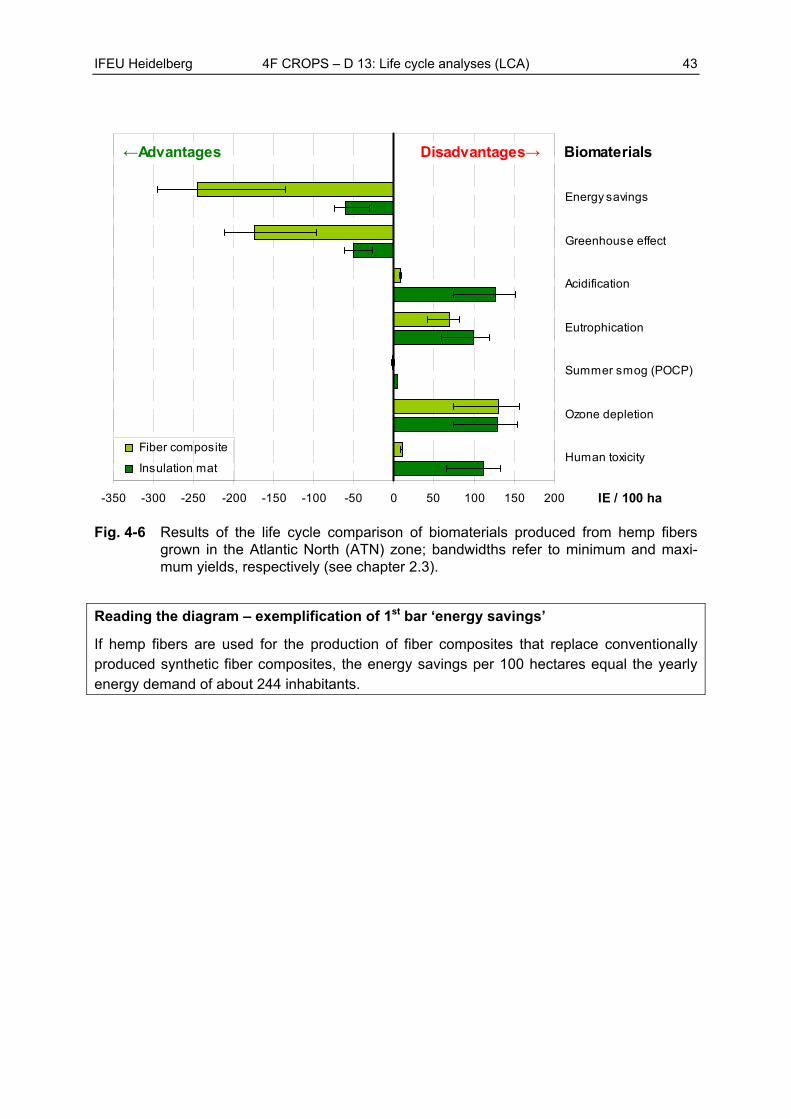
IFEU Heidelberg 4F CROPS – D 13: Life cycle analyses (LCA) 43
-350 -300 -250 -200 -150 -100 -50 0 50 100 150 200
Human toxicity
Ozone depletion
Summer smog (POCP)
Eutrophication
Acidification
Greenhouse effect
Energy savings
IE / 100 ha
Fiber composite
Insulation mat
←Advantages Disadvantages→ Biomaterials
Fig. 4-6 Results of the life cycle comparison of biomaterials produced from hemp fibers grown in the Atlantic North (ATN) zone; bandwidths refer to minimum and maxi-mum yields, respectively (see chapter 2.3).
Reading the diagram – exemplification of 1st bar ‘energy savings’
If hemp fibers are used for the production of fiber composites that replace conventionally produced synthetic fiber composites, the energy savings per 100 hectares equal the yearly energy demand of about 244 inhabitants.
44 4F CROPS – D 13: Life cycle analyses (LCA) IFEU Heidelberg
4.2.3 Woody lignocellulosic crops
This chapter presents the results of the life cycle comparisons for woody lignocellulosic crops. As described in chapter 3.3.3, three different pathways are assessed for each crop: 1) direct combustion in a CHP, 2) gasification, and 3) processing in a biorefinery. For bio-energy, only one of the three options presented in chapter 3.3.3 is depicted: the direct com-bustion in a CHP. The other options are presented in chapter 4.3.4. The pathways are indi-cated in the legends behind the respective main products and for each crop the abbreviation of the respective environmental zone is indicated in the chapter title.
4.2.3.1 Poplar (ATC)
Results: bioenergy
If poplar is used in a CHP for heat and power production or for producing FT diesel or fuel ethanol, it shows advantages regarding energy savings and greenhouse effect and disadvantages regarding eutrophication, ozone depletion, and human toxicity. For acidifi-cation, both biofuels are disadvantageous whereas for the use in a CHP the results are ambiguous. The same applies for summer smog: no clear results are obtained for the use of the wood in a CHP and for FT diesel whereas fuel ethanol production shows clear ad-vantages (see Fig. 4-7).
If poplar wood is used to produce heat and power in a CHP, most energy and green-house gases can be saved, followed by fuel ethanol and FT diesel. Regarding acidifica-tion, eutrophication, ozone depletion, and human toxicity, CHP and FT diesel perform quite similar and show less disadvantages than fuel ethanol. If summer smog is to be avoided, fuel ethanol is the best use option.
Results: biomaterials
Most of the bio-based materials assessed show the following pattern: advantages regard-ing energy savings and greenhouse effect and disadvantages regarding acidification, eu-trophication, ozone depletion, and human toxicity. As an exception, 1,3-PDO shows (very small) advantages regarding acidification and human toxicity. In these impact categories, the disadvantages for chemical ethanol are only small, too. For summer smog, chemical ethanol and 1,3-PDO show advantages whereas both ethylene pathways show inconclu-sive results (see Fig. 4-7).
Of all bio-based materials assessed, 1,3-PDO shows the best results regarding energy savings, greenhouse effect and summer smog, followed by chemical ethanol, ethylene produced in a biorefinery, and ethylene produced via biomass gasification. Regarding acidification, eutrophication, and human toxicity, 1,3-PDO and chemical ethanol show similar results – just as do both ethylene pathways. The latter show much more disadvan-tages than chemical ethanol and 1,3-PDO. Regarding ozone depletion, there are no sig-nificant differences between the biomaterials.
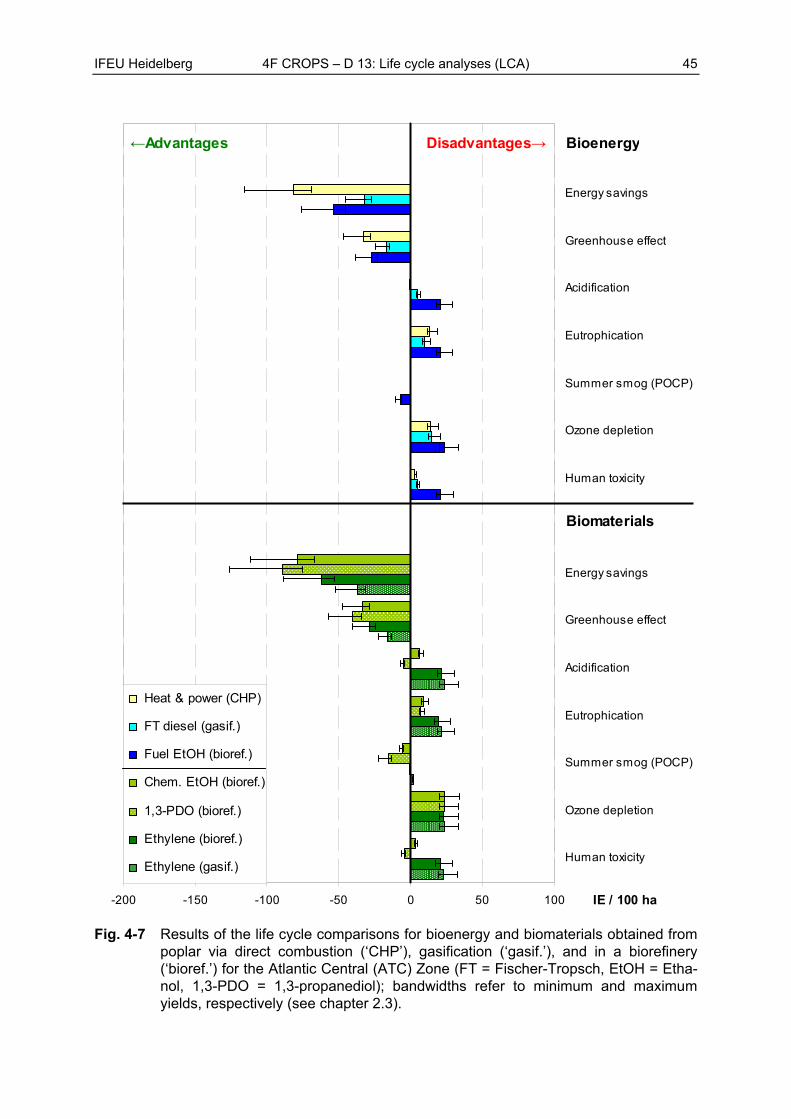
IFEU Heidelberg 4F CROPS – D 13: Life cycle analyses (LCA) 45
-200 -150 -100 -50 0 50 100
Human toxicity
Ozone depletion
Summer smog (POCP)
Eutrophication
Acidification
Greenhouse effect
Energy savings
Human toxicity
Ozone depletion
Summer smog (POCP)
Eutrophication
Acidification
Greenhouse effect
Energy savings
IE / 100 ha
Heat & power (CHP)
FT diesel (gasif.)
Fuel EtOH (bioref.)
Chem. EtOH (bioref.)
1,3-PDO (bioref.)
Ethylene (bioref.)
Ethylene (gasif.)
←Advantages Disadvantages→ Bioenergy
Biomaterials
Fig. 4-7 Results of the life cycle comparisons for bioenergy and biomaterials obtained from poplar via direct combustion (‘CHP’), gasification (‘gasif.’), and in a biorefinery (‘bioref.’) for the Atlantic Central (ATC) Zone (FT = Fischer-Tropsch, EtOH = Etha-nol, 1,3-PDO = 1,3-propanediol); bandwidths refer to minimum and maximum yields, respectively (see chapter 2.3).
46 4F CROPS – D 13: Life cycle analyses (LCA) IFEU Heidelberg
4.2.3.2 Willow (CON)
Results: bioenergy
The production of power and heat in a CHP from willow wood as well as of FT diesel and fuel ethanol helps saving energy and greenhouse gases. Fuel ethanol also shows advan-tages regarding summer smog. In contrast, many bioenergy use options show disadvan-tages regarding acidification, eutrophication, ozone depletion, and human toxicity. As an exception from this pattern, the use of wood in a CHP or as FT diesel does not lead to any clear results regarding acidification, summer smog and human toxicity (see Fig. 4-8).
The direct combustion of the wood in a CHP leads to more savings in energy and green-house gases than the use for fuel ethanol or FT diesel production. Regarding acidifica-tion, eutrophication, ozone depletion, and human toxicity, the use in a CHP and for fuel ethanol production performs almost equally and both use options show far less disadvan-tages than FT diesel. Regarding summer smog, by far the best option is to produce fuel ethanol.
Results: biomaterials
All biomaterial pathways assessed show advantages regarding energy savings and greenhouse effect. Both ethylene pathways show clear disadvantages regarding acidifi-cation, eutrophication, ozone depletion, and human toxicity. 1,3-PDO shows slight advan-tages regarding acidification and human toxicity and disadvantages regarding eutrophica-tion. In these three categories, also chemical ethanol performs disadvantageously. Re-garding summer smog, chemical ethanol and 1,3-PDO show advantages, whereas both ethylene pathways show ambiguous results (see Fig. 4-8).
If the four biomaterials are compared among each other, the following results can be de-rived: 1,3-PDO performs best since it saves most energy and greenhouse gases and shows the highest advantages regarding summer smog. Regarding acidification, eutro-phication, and human toxicity it performs similarly with chemical ethanol. Both show far less disadvantages than the two ethylene pathways. Regarding energy savings and greenhouse effect, chemical ethanol performs second best, followed by ethylene pro-duced in a biorefinery and ethylene produced via biomass gasification. Regarding ozone depletion, there is almost no difference between the four biomaterials assessed.
Reading the diagram – exemplification of 1st bar ‘energy savings’ for bioenergy
If willow wood is combusted in a CHP to produce heat and power that replace conventionally produced heat and power, energy savings that can be achieved per 100 hectares equal the yearly energy demand of about 93 inhabitants.
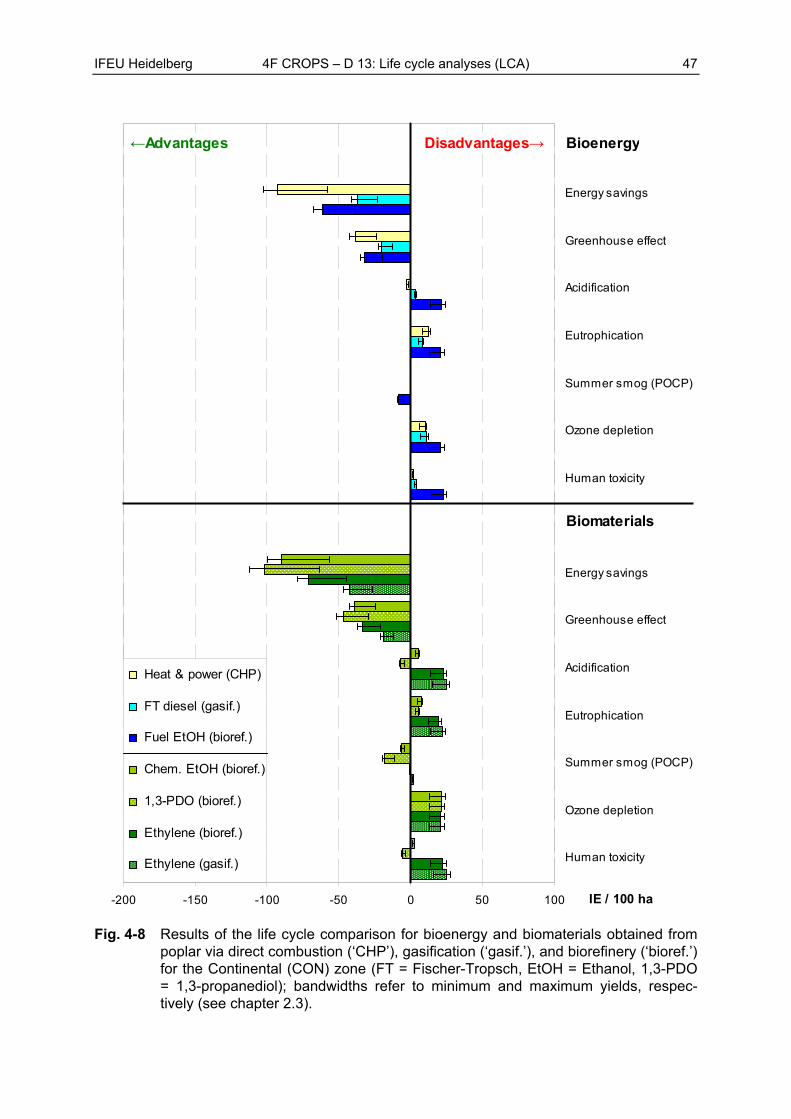
IFEU Heidelberg 4F CROPS – D 13: Life cycle analyses (LCA) 47
-200 -150 -100 -50 0 50 100
Human toxicity
Ozone depletion
Summer smog (POCP)
Eutrophication
Acidification
Greenhouse effect
Energy savings
Human toxicity
Ozone depletion
Summer smog (POCP)
Eutrophication
Acidification
Greenhouse effect
Energy savings
IE / 100 ha
Heat & power (CHP)
FT diesel (gasif.)
Fuel EtOH (bioref.)
Chem. EtOH (bioref.)
1,3-PDO (bioref.)
Ethylene (bioref.)
Ethylene (gasif.)
←Advantages Disadvantages→ Bioenergy
Biomaterials
Fig. 4-8 Results of the life cycle comparison for bioenergy and biomaterials obtained from poplar via direct combustion (‘CHP’), gasification (‘gasif.’), and biorefinery (‘bioref.’) for the Continental (CON) zone (FT = Fischer-Tropsch, EtOH = Ethanol, 1,3-PDO = 1,3-propanediol); bandwidths refer to minimum and maximum yields, respec-tively (see chapter 2.3).
48 4F CROPS – D 13: Life cycle analyses (LCA) IFEU Heidelberg
4.2.3.3 Eucalyptus (MDS)
Results: bioenergy
If eucalyptus wood is used for the production of heat and power in a CHP or for the pro-duction of the biofuels FT diesel and fuel ethanol, energy and greenhouse gas emissions can be saved compared to the fossil equivalent products. However, these advantages come along with disadvantages regarding acidification, eutrophication, ozone depletion, and human toxicity for all bioenergy pathways assessed. For summer smog, fuel ethanol shows advantages whereas for the two other bioenergy no clear results are obtained (see Fig. 4-9).
The combustion of the wood in a CHP clearly performs best in saving energy and green-house gases, followed by FT diesel and fuel ethanol. Regarding acidification, eutrophica-tion, ozone depletion, and human toxicity, CHP and FT diesel perform similarly and show less disadvantages than fuel ethanol. Regarding summer smog, fuel ethanol is by far the best choice.
Results: biomaterials
All biomaterials produced from eucalyptus wood show clear advantages regarding energy savings and greenhouse effect and clear disadvantages regarding eutrophication and ozone depletion. For acidification and human toxicity, both ethylene pathways show clear disadvantages and also chemical ethanol shows slight disadvantages whereas 1,3-PDO shows inconclusive results. For summer smog, chemical ethanol and 1,3-PDO show ad-vantages. In this environmental impact category, both ethylene pathways show ambigu-ous results (see Fig. 4-9).
By producing 1,3-PDO, most energy and greenhouse gases can be saved and most summer smog can be avoided, followed by chemical ethanol, ethylene from biomass gasification and ethylene from a biorefinery. For ozone depletion, there is no significant difference between the four biomaterial use options. For acidification, eutrophication, and human toxicity, both ethylene pathways perform similarly and show clearly higher disad-vantages than chemical ethanol and 1,3-PDO – which both also show very similar re-sults.
Reading the diagram – exemplification of 2nd bar ‘energy savings’ for bioenergy
If eucalyptus wood is used to produce Fischer-Tropsch diesel that replaces conventional die-sel as a transport fuel, the energy savings per 100 hectares equal the yearly energy demand of about 53 inhabitants.
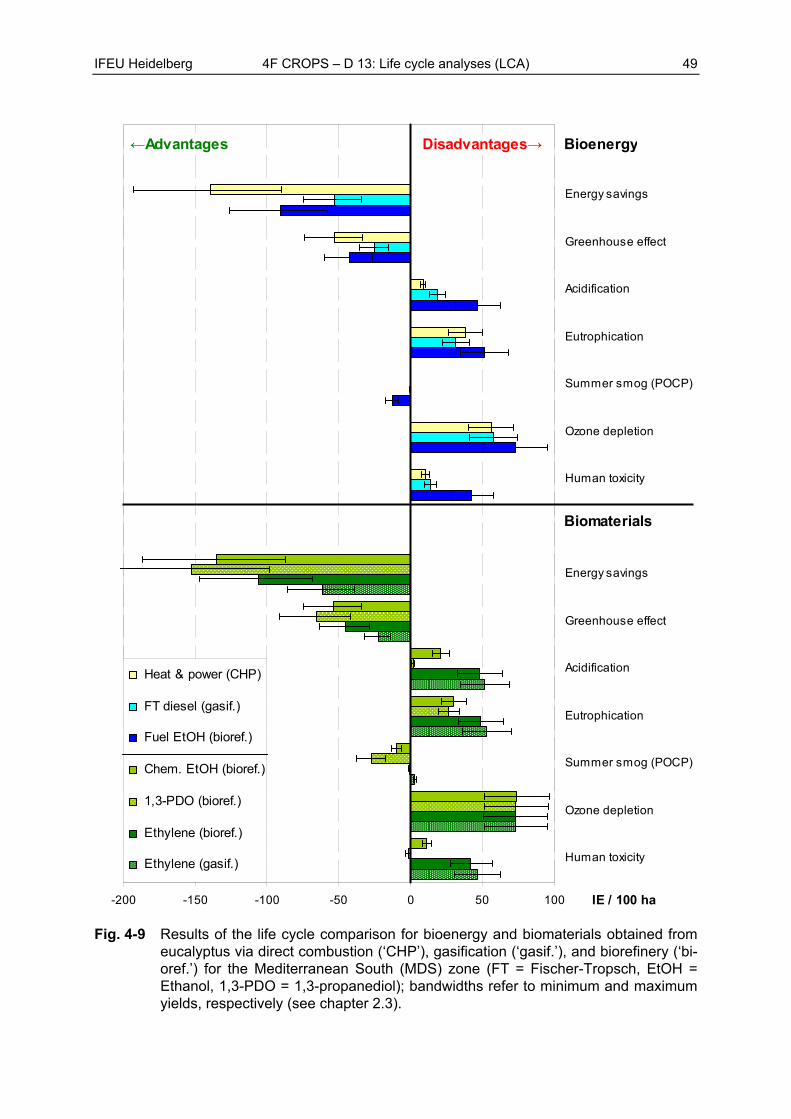
IFEU Heidelberg 4F CROPS – D 13: Life cycle analyses (LCA) 49
-200 -150 -100 -50 0 50 100
Human toxicity
Ozone depletion
Summer smog (POCP)
Eutrophication
Acidification
Greenhouse effect
Energy savings
Human toxicity
Ozone depletion
Summer smog (POCP)
Eutrophication
Acidification
Greenhouse effect
Energy savings
IE / 100 ha
Heat & power (CHP)
FT diesel (gasif.)
Fuel EtOH (bioref.)
Chem. EtOH (bioref.)
1,3-PDO (bioref.)
Ethylene (bioref.)
Ethylene (gasif.)
←Advantages Disadvantages→ Bioenergy
Biomaterials
Fig. 4-9 Results of the life cycle comparison for bioenergy and biomaterials obtained from eucalyptus via direct combustion (‘CHP’), gasification (‘gasif.’), and biorefinery (‘bi-oref.’) for the Mediterranean South (MDS) zone (FT = Fischer-Tropsch, EtOH = Ethanol, 1,3-PDO = 1,3-propanediol); bandwidths refer to minimum and maximum yields, respectively (see chapter 2.3).
50 4F CROPS – D 13: Life cycle analyses (LCA) IFEU Heidelberg
4.2.4 Herbaceous lignocellulosic crops
Also for herbaceous lignocellulosic crops three pathways are assessed: 1) direct combustion in a CHP, 2) gasification, and 3) processing in a biorefinery (see chapter 3.3.3). For bio-energy, only direct combustion in a CHP is depicted. The two other options named in chapter 3.3.3 are presented in chapter 4.3.4 as sensitivity analyses. The pathways are indicated in the legends and the abbreviation of the respective environmental zone is indicated in the chapter title.
4.2.4.1 Reed canary grass (NEM)
Results: bioenergy
The production of heat and power in a CHP or of biofuels from reed canary grass helps saving energy and greenhouse gases, but shows disadvantages regarding eutrophica-tion, ozone depletion, and human toxicity. In the latter impact category, however, disad-vantages for the use in a CHP and for the production of FT diesel are very small. For acidification, fuel ethanol shows disadvantages whereas the use as FT diesel or in a CHP performs neutrally. Regarding summer smog, fuel ethanol shows advantages whereas the use in a CHP and for FT diesel is ambiguous (see Fig. 4-10).
Of all bioenergy use options assessed, most energy and greenhouse gases can be saved if reed canary grass is combusted in a CHP for the production of heat and power. Fuel ethanol and FT diesel are second and third best, respectively. Regarding acidifica-tion, eutrophication, ozone depletion, and human toxicity, fuel ethanol shows far more disadvantages than the use in a CHP or for producing FT diesel. The latter two options perform similarly. Regarding summer smog, fuel ethanol saves most emissions.
Results: biomaterials
All bio-based materials assessed save energy resources and greenhouse gas emissions in comparison to their fossil equivalent products. However, at the same time additional emissions leading to eutrophication and ozone depletion are caused. Also regarding acidification and human toxicity, both ethylene pathways show clear disadvantages – just as does chemical ethanol. For the latter, however, they are very small. In contrast, 1,3-PDO shows slight advantages. Regarding summer smog, chemical ethanol and 1,3-PDO help saving emissions whereas both ethylene pathways show inconclusive results (see Fig. 4-10).
The production of 1,3-PDO from reed canary grass leads to the highest savings regard-ing energy, greenhouse gas emissions and the emission of photooxidants (causing sum-mer smog) – followed by chemical ethanol, ethylene produced in a biorefinery and ethyl-ene produced via biomass gasification. The latter performs disadvantageously regarding summer smog. Regarding acidification, eutrophication, and human toxicity, chemical ethanol and 1,3-PDO show similar results and perform better than the two ethylene pathways which also perform similarly. Regarding ozone depletion, all biomaterials show equally disadvantageous results.
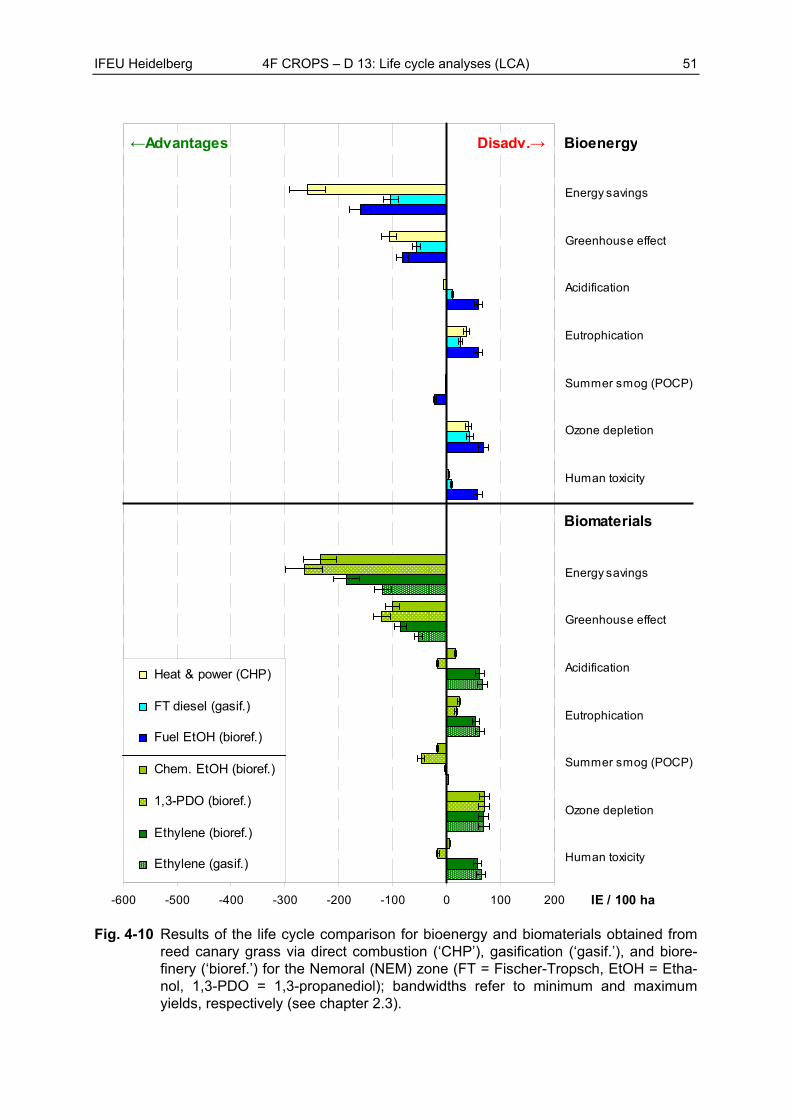
IFEU Heidelberg 4F CROPS – D 13: Life cycle analyses (LCA) 51
-600 -500 -400 -300 -200 -100 0 100 200
Human toxicity
Ozone depletion
Summer smog (POCP)
Eutrophication
Acidification
Greenhouse effect
Energy savings
Human toxicity
Ozone depletion
Summer smog (POCP)
Eutrophication
Acidification
Greenhouse effect
Energy savings
IE / 100 ha
Heat & power (CHP)
FT diesel (gasif.)
Fuel EtOH (bioref.)
Chem. EtOH (bioref.)
1,3-PDO (bioref.)
Ethylene (bioref.)
Ethylene (gasif.)
←Advantages Disadv.→ Bioenergy
Biomaterials
Fig. 4-10 Results of the life cycle comparison for bioenergy and biomaterials obtained from reed canary grass via direct combustion (‘CHP’), gasification (‘gasif.’), and biore-finery (‘bioref.’) for the Nemoral (NEM) zone (FT = Fischer-Tropsch, EtOH = Etha-nol, 1,3-PDO = 1,3-propanediol); bandwidths refer to minimum and maximum yields, respectively (see chapter 2.3).
52 4F CROPS – D 13: Life cycle analyses (LCA) IFEU Heidelberg
4.2.4.2 Miscanthus (ATN)
Results: bioenergy
The use of Miscanthus in a CHP or for the production of ethanol or FT diesel shows ad-vantages regarding energy savings and greenhouse effect. However, the advantages come along with disadvantages regarding eutrophication and ozone depletion. Regarding acidification, fuel ethanol shows clear disadvantages whereas the use in a CHP and as FT diesel do not show clear results: here, credits and expenditures that occur along the life cycle almost completely outweigh each other. For human toxicity, fuel ethanol again shows clear disadvantages whereas for the other two use options, no clear results can be given. The same is true for the use in a CHP and for FT diesel in the impact category summer smog. Here, fuel ethanol shows clear advantages (see Fig. 4-11).
The combustion of Miscanthus in a CHP is the bioenergy application that leads to the highest savings of energy and greenhouse gases as well as of photooxidants – followed by fuel ethanol and FT diesel. For all other environmental impact categories, fuel ethanol shows the most disadvantageous results. For acidification, eutrophication, ozone deple-tion and human toxicity, the use of Miscanthus in a CHP as well as for FT diesel show ambiguous results.
Results: biomaterials
The environmental impact categories for which all bio-based materials assessed show advantages are energy savings and greenhouse effect. In contrast, all materials contrib-ute to eutrophication and ozone depletion. Regarding acidification and human toxicity, the two ethylene pathways show disadvantageous results whereas 1,3-PDO shows advanta-geous results. Chemical ethanol performs neutrally regarding acidification and human toxicity. Regarding summer smog, chemical ethanol and 1,3-PDO help saving respective emissions. Here, both ethylene pathways show inconclusive results (see Fig. 4-11).
Of all bio-based materials assessed, 1,3-PDO helps saving the most energy and green-house gases as well as photooxidants. Chemical ethanol, ethylene produced in a biore-finery as well as ethylene produced via biomass gasification show the next best results. 1,3-PDO performs also best regarding acidification, eutrophication, and human toxicity – closely followed by chemical ethanol. Both ethylene production pathways perform equally disadvantageous in these categories. Regarding ozone depletion, there is no significant difference between the four bio-based materials.
Reading the diagram – exemplification of 6th bar ‘greenhouse effect’ for biomaterials
Greenhouse gas savings equivalent to the yearly emissions of 118 Europeans can be achieved per 100 hectares of Miscanthus, if 1,3-PDO is produced from Miscanthus that re-places conventionally produced 1,3-PDO.
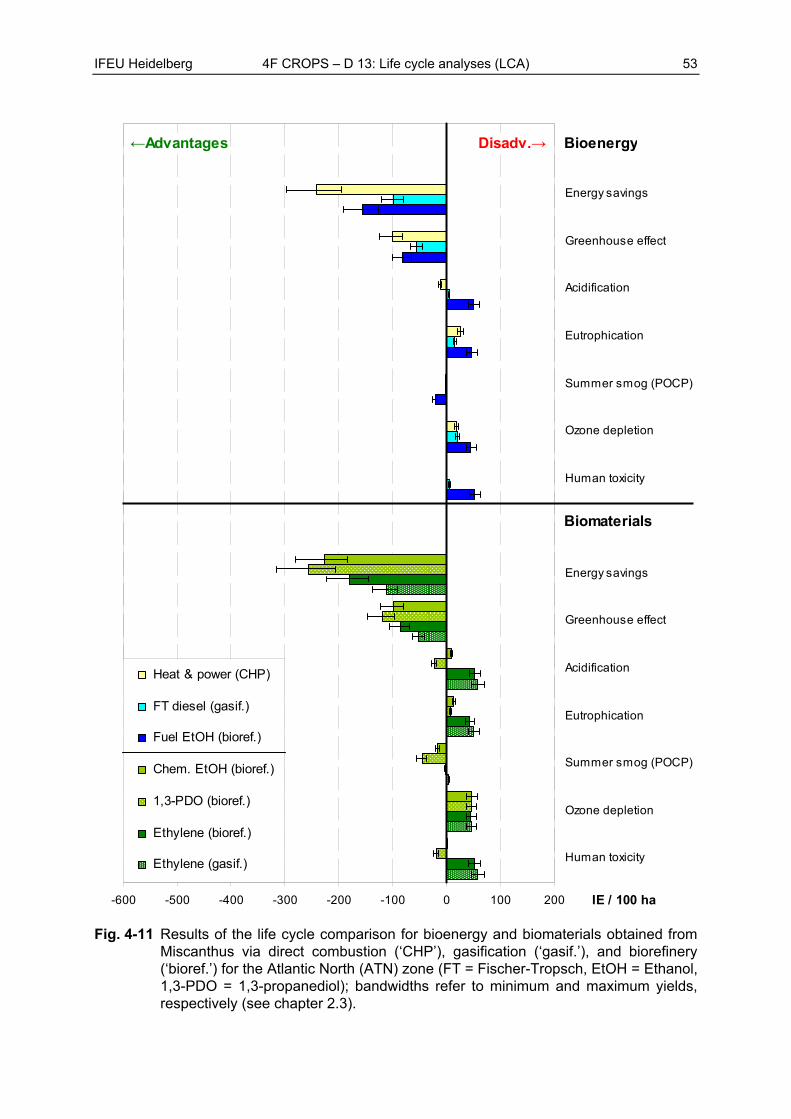
IFEU Heidelberg 4F CROPS – D 13: Life cycle analyses (LCA) 53
-600 -500 -400 -300 -200 -100 0 100 200
Human toxicity
Ozone depletion
Summer smog (POCP)
Eutrophication
Acidification
Greenhouse effect
Energy savings
Human toxicity
Ozone depletion
Summer smog (POCP)
Eutrophication
Acidification
Greenhouse effect
Energy savings
IE / 100 ha
Heat & power (CHP)
FT diesel (gasif.)
Fuel EtOH (bioref.)
Chem. EtOH (bioref.)
1,3-PDO (bioref.)
Ethylene (bioref.)
Ethylene (gasif.)
←Advantages Disadv.→ Bioenergy
Biomaterials
Fig. 4-11 Results of the life cycle comparison for bioenergy and biomaterials obtained from Miscanthus via direct combustion (‘CHP’), gasification (‘gasif.’), and biorefinery (‘bioref.’) for the Atlantic North (ATN) zone (FT = Fischer-Tropsch, EtOH = Ethanol, 1,3-PDO = 1,3-propanediol); bandwidths refer to minimum and maximum yields, respectively (see chapter 2.3).
54 4F CROPS – D 13: Life cycle analyses (LCA) IFEU Heidelberg
4.2.4.3 Switchgrass (ATN)
Results: bioenergy
All bioenergy pathways based on switchgrass help saving energy and greenhouse gas emissions compared to fossil energy carriers. On the contrary, most pathways are disad-vantageous regarding eutrophication, ozone depletion, and human toxicity. Regarding the latter impact category, the use in a CHP and for FT diesel show ambiguous results. For acidification, fuel ethanol shows disadvantages and for the use as FT diesel or in a CHP, results are inconclusive. The same holds true for the use in a CHP and the production of FT diesel regarding summers smog. Here, fuel ethanol shows clear advantages (see Fig. 4-12).
When comparing the bioenergy pathways among each other, the use of switchgrass in a CHP performs best in terms of saving energy and greenhouse gas emissions and also shows the best results regarding acidification. Regarding eutrophication and ozone de-pletion, the results of the use in a CHP and for FT diesel are very similar and both are less disadvantageous than fuel ethanol. For summer smog, fuel ethanol shows the high-est savings.
Results: biomaterials
By replacing conventionally produced materials by bio-based materials from switchgrass, energy demand and greenhouse gas emissions are reduced. In contrast, eutrophication and ozone depletion are increased. Regarding acidification and human toxicity, bio-based ethylene – regardless of the production pathway – increases the respective emissions. In these environmental categories, 1,3-PDO is advantageous whereas chemical ethanol shows inconclusive results. Chemical ethanol and 1,3-PDO help reducing summer smog whereas both ethylene pathways show ambiguous results (see Fig. 4-12).
Among the four bio-based material use options assessed, 1,3-PDO helps saving most energy and greenhouse gases as well as most summer smog causing emissions. It is fol-lowed by chemical ethanol, ethylene produced in a biorefinery and ethylene produced via biomass gasification. The best performance of 1,3-PDO also occurs in all other environ-mental impact categories – except for ozone depletion, where all four products perform equally. In these categories, both ethylene pathways have almost similar results and highest disadvantages.
Reading the diagram – exemplification of 2nd bar ‘energy savings’ for biomaterials
If 1,3-PDO is produced from switchgrass replacing conventionally produced 1,3-PDO, the energy savings per 100 hectares equal the yearly energy demand of 258 Europeans.
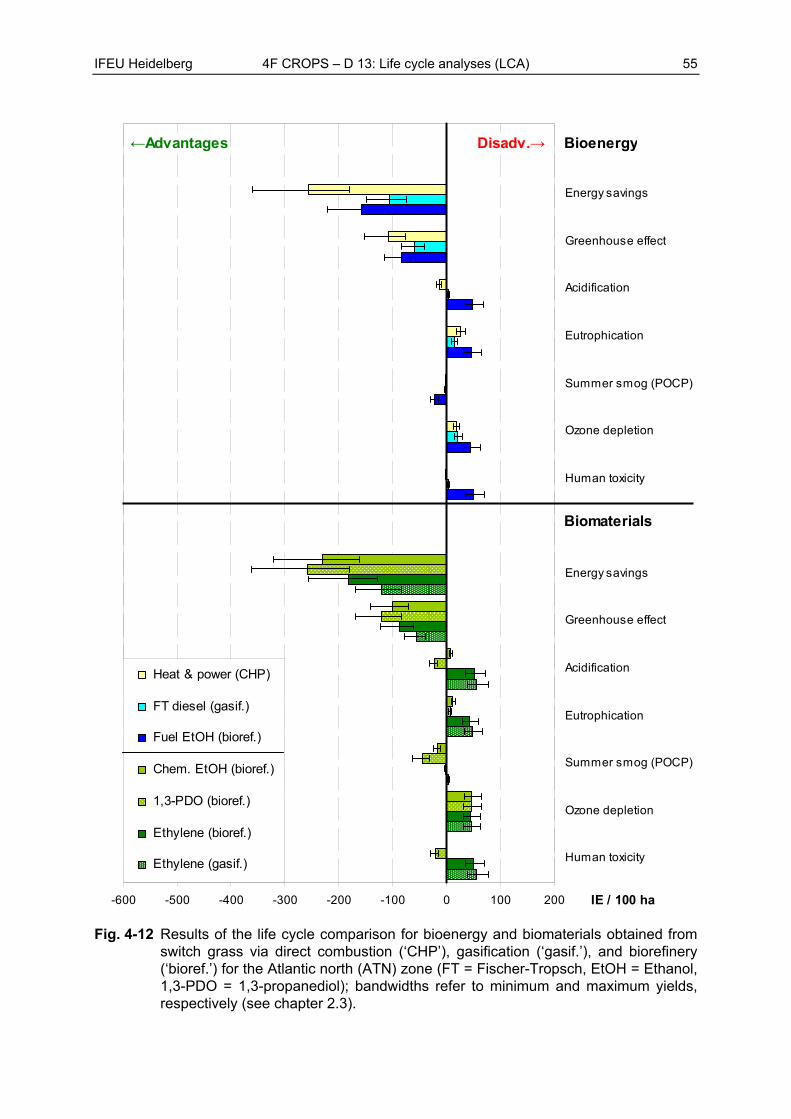
IFEU Heidelberg 4F CROPS – D 13: Life cycle analyses (LCA) 55
-600 -500 -400 -300 -200 -100 0 100 200
Human toxicity
Ozone depletion
Summer smog (POCP)
Eutrophication
Acidification
Greenhouse effect
Energy savings
Human toxicity
Ozone depletion
Summer smog (POCP)
Eutrophication
Acidification
Greenhouse effect
Energy savings
IE / 100 ha
Heat & power (CHP)
FT diesel (gasif.)
Fuel EtOH (bioref.)
Chem. EtOH (bioref.)
1,3-PDO (bioref.)
Ethylene (bioref.)
Ethylene (gasif.)
←Advantages Disadv.→ Bioenergy
Biomaterials
Fig. 4-12 Results of the life cycle comparison for bioenergy and biomaterials obtained from switch grass via direct combustion (‘CHP’), gasification (‘gasif.’), and biorefinery (‘bioref.’) for the Atlantic north (ATN) zone (FT = Fischer-Tropsch, EtOH = Ethanol, 1,3-PDO = 1,3-propanediol); bandwidths refer to minimum and maximum yields, respectively (see chapter 2.3).
56 4F CROPS – D 13: Life cycle analyses (LCA) IFEU Heidelberg
4.2.4.4 Giant reed (MDN)
Results: bioenergy
On the one hand, the use of giant reed for producing heat and power in a CHP or for the biofuels FT diesel or ethanol helps saving energy and greenhouse gas emissions. On the other hand, eutrophication, ozone depletion, and human toxicity are increased. Also re-garding acidification, the production of biofuels show disadvantages. For the use in a CHP, results are inconclusive. Here, the credits gained from the co-products and for re-placing fossil heat and power almost exactly compensate all expenditures that occur dur-ing the production process. Regarding summer smog, the use of giant reed for ethanol production shows clear advantages whereas for the other two bioenergy pathways, there are no clear results (see Fig. 4-13).
Most energy and greenhouse gases can be saved if giant reed is used in a CHP, fol-lowed by its use for producing ethanol or FT diesel as transport fuels. Also regarding acidification, ozone depletion, and human toxicity, the use in a CHP shows best results, directly followed by FT diesel. For eutrophication, FT diesel shows slightly better results. Regarding summer smog, however, fuel ethanol is the best use option.
Results: biomaterials
Most of the bio-based materials produced from giant reed show the following pattern: advantages regarding energy savings and greenhouse effect and disadvantages regard-ing acidification, eutrophication, ozone depletion, and human toxicity. As an exception, 1,3-PDO shows advantages regarding acidification and human toxicity. For summer smog, chemical ethanol and 1,3-PDO show advantages, whereas both ethylene path-ways show ambiguous results (see Fig. 4-13).
Of all bio-based materials assessed, 1,3-PDO shows the best results regarding energy savings and greenhouse effect, followed by chemical ethanol, ethylene produced in a bio-refinery and ethylene produced via biomass gasification. Also regarding acidification and human toxicity, 1,3-PDO performs best. For summer smog, 1,3-PDO shows by far the best results, followed by chemical ethanol. Regarding ozone depletion, there are no sig-nificant differences between the bio-based materials assessed.
Reading the diagram – exemplification of 4th bar ‘energy savings’ for biomaterials
If ethylene is produced from giant reed via biomass gasification and replaces conventionally produced ethylene, the energy savings per 100 hectares equal the yearly energy demand of about 296 inhabitants.
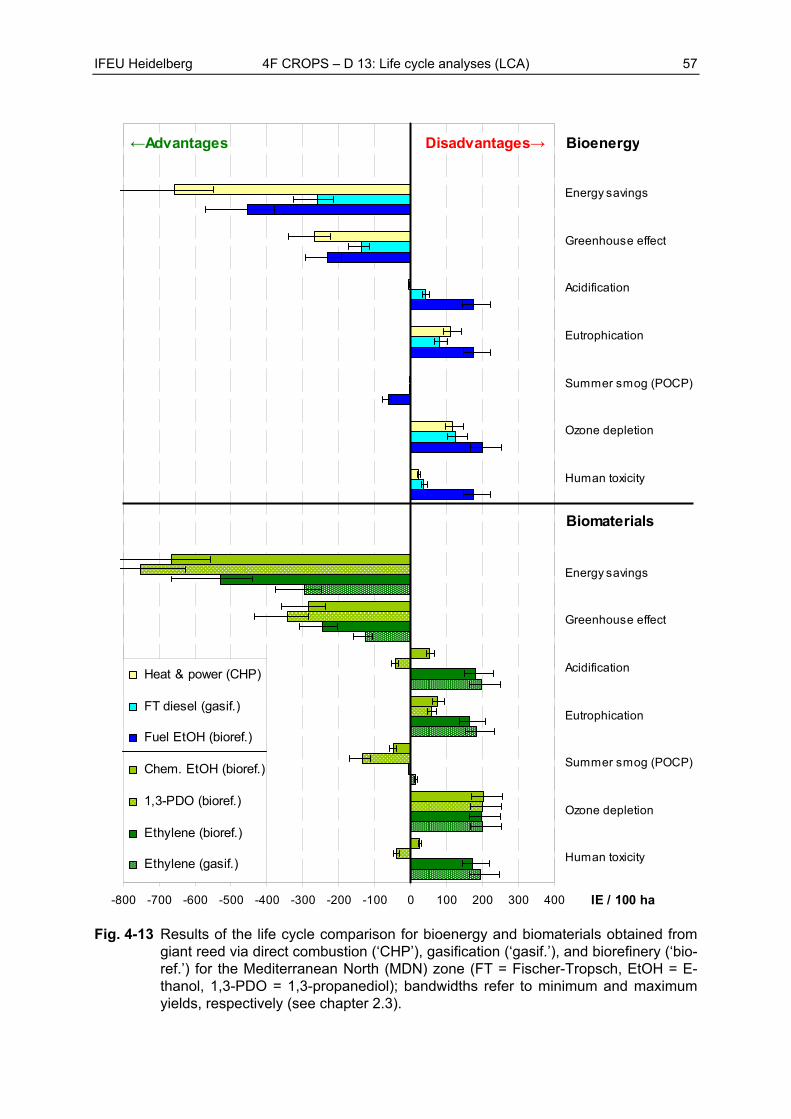
IFEU Heidelberg 4F CROPS – D 13: Life cycle analyses (LCA) 57
-800 -700 -600 -500 -400 -300 -200 -100 0 100 200 300 400
Human toxicity
Ozone depletion
Summer smog (POCP)
Eutrophication
Acidification
Greenhouse effect
Energy savings
Human toxicity
Ozone depletion
Summer smog (POCP)
Eutrophication
Acidification
Greenhouse effect
Energy savings
IE / 100 ha
Heat & power (CHP)
FT diesel (gasif.)
Fuel EtOH (bioref.)
Chem. EtOH (bioref.)
1,3-PDO (bioref.)
Ethylene (bioref.)
Ethylene (gasif.)
←Advantages Disadvantages→ Bioenergy
Biomaterials
Fig. 4-13 Results of the life cycle comparison for bioenergy and biomaterials obtained from giant reed via direct combustion (‘CHP’), gasification (‘gasif.’), and biorefinery (‘bio-ref.’) for the Mediterranean North (MDN) zone (FT = Fischer-Tropsch, EtOH = E-thanol, 1,3-PDO = 1,3-propanediol); bandwidths refer to minimum and maximum yields, respectively (see chapter 2.3).
58 4F CROPS – D 13: Life cycle analyses (LCA) IFEU Heidelberg
4.2.4.5 Cardoon (MDS)
Results: bioenergy
If cardoon is used for producing heat and power in a CHP or for producing the biofuels FT diesel and fuel ethanol, energy and greenhouse gas emissions can be saved com-pared to the fossil equivalent products. These advantages come along with disadvan-tages regarding eutrophication, ozone depletion, and human toxicity. However, the dis-advantages regarding human toxicity for the use in a CHP are only very small. Regarding acidification, the use in a CHP is neutral whereas both biofuels show disadvantageous results. For summer smog, only fuel ethanol shows advantages whereas the use in a CHP or as FT diesel shows inconclusive results (see Fig. 4-14).
If the three bioenergy use options are compared with each other, the combustion of car-doon in a CHP clearly performs best in terms of saving energy and greenhouse gases, followed by FT diesel and fuel ethanol. The use in a CHP also shows best results regard-ing acidification. For eutrophication, ozone depletion, and human toxicity the production and use of FT diesel performs equal with the use in a CHP and better than fuel ethanol. Only for summer smog, fuel ethanol is the best choice.
Results: biomaterials
Similar to bioenergy, the bio-based materials obtained from cardoon all help saving en-ergy and reducing greenhouse gas emissions. However, all biomaterials show disadvan-tages for eutrophication and ozone depletion. For acidification and human toxicity, both ethylene pathways are clearly disadvantageous. Also chemical ethanol is disadvanta-geous here, although the results are very small. 1,3-PDO, in contrast, shows slight ad-vantages. Regarding summer smog, ethanol and 1,3-PDO show clear advantages, whereas the results for both types of ethylene are ambiguous (see Fig. 4-14).
If the four bio-based materials assessed are compared with each other, the following re-sults can be derived: 1,3-PDO performs best in saving energy and greenhouse gases and shows the highest advantages regarding acidification, summer smog, and human toxicity. Both ethylene pathways show similar results, however, they show highest disad-vantages. Regarding ozone depletion, there is almost no difference between the four bio-based materials.
Reading the diagram – exemplification of 2nd bar ‘energy savings’ for bioenergy
If cardoon is used to produce FT diesel that replaces conventional diesel as a transport fuel, the energy savings per 100 hectares equal the yearly energy demand of 134 inhabitants.
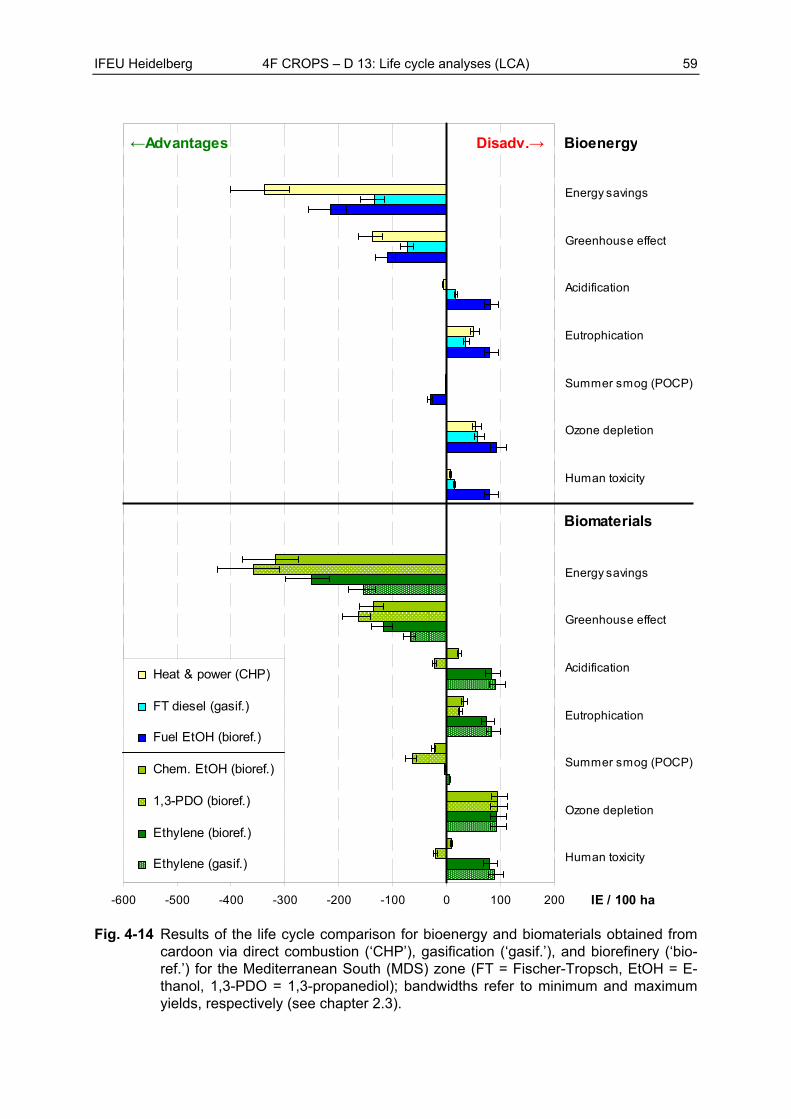
IFEU Heidelberg 4F CROPS – D 13: Life cycle analyses (LCA) 59
-600 -500 -400 -300 -200 -100 0 100 200
Human toxicity
Ozone depletion
Summer smog (POCP)
Eutrophication
Acidification
Greenhouse effect
Energy savings
Human toxicity
Ozone depletion
Summer smog (POCP)
Eutrophication
Acidification
Greenhouse effect
Energy savings
IE / 100 ha
Heat & power (CHP)
FT diesel (gasif.)
Fuel EtOH (bioref.)
Chem. EtOH (bioref.)
1,3-PDO (bioref.)
Ethylene (bioref.)
Ethylene (gasif.)
←Advantages Disadv.→ Bioenergy
Biomaterials
n
Fig. 4-14 Results of the life cycle comparison for bioenergy and biomaterials obtained from cardoon via direct combustion (‘CHP’), gasification (‘gasif.’), and biorefinery (‘bio-ref.’) for the Mediterranean South (MDS) zone (FT = Fischer-Tropsch, EtOH = E-thanol, 1,3-PDO = 1,3-propanediol); bandwidths refer to minimum and maximum yields, respectively (see chapter 2.3).
60 4F CROPS – D 13: Life cycle analyses (LCA) IFEU Heidelberg
4.2.5 Sugar crops
The production and use of biofuel and bio-based materials from the sugar crops sweet sor-ghum and sugar beet differ substantially in their life cycles. For sugar beet, only the produc-tion of biofuel is assessed as bioenergy option. For sweet sorghum, energy and biomaterial options are assessed based on two different crop parts that are obtained at the same time: grains and a sugary juice. For every crop the environmental zone that the results refer to is indicated in the chapter title.
4.2.5.1 Sugar beet (ATC)
Results: bioenergy
If fuel ethanol produced from sugar beet is used instead of conventional gasoline, fossil energy carriers can be saved and greenhouse gas as well as summer smog emissions can be reduced (see Fig. 4-15).
However, sugar beet ethanol shows disadvantages regarding the environmental impact categories acidification, eutrophication, ozone depletion, and human toxicity.
Results: biomaterials
All three bio-based materials produced from sugar beet show advantages regarding en-ergy savings, greenhouse effect and summer smog. In contrast, clear disadvantages oc-cur for eutrophication and ozone depletion. For acidification and human toxicity, chemical ethanol as well as 1,3-PDO show advantages whereas ethylene shows disadvantages. (see Fig. 4-15).
Comparing the biomaterial use options shows that 1,3-PDO performs best regarding en-ergy savings, greenhouse effect, acidification, summer smog, and human toxicity: in these impact categories, the highest savings can be obtained. However, regarding ozone depletion, it shows by far the highest disadvantages. Regarding energy savings and greenhouse effect, chemical ethanol has the second best results, followed by ethylene. Chemical ethanol also performs better than ethylene regarding acidification, eutrophica-tion, summer smog, and human toxicity. Regarding ozone depletion, both products show the same results.
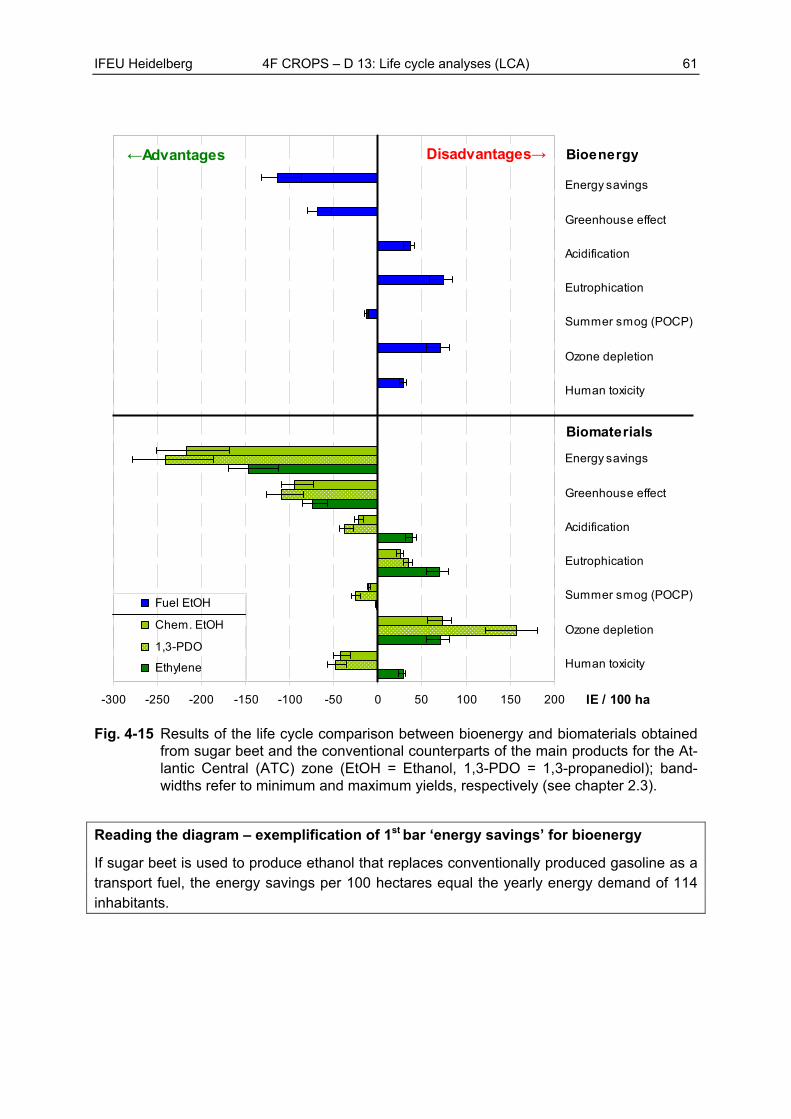
IFEU Heidelberg 4F CROPS – D 13: Life cycle analyses (LCA) 61
-300 -250 -200 -150 -100 -50 0 50 100 150 200
Human toxicity
Ozone depletion
Summer smog (POCP)
Eutrophication
Acidification
Greenhouse effect
Energy savings
Human toxicity
Ozone depletion
Summer smog (POCP)
Eutrophication
Acidification
Greenhouse effect
Energy savings
IE / 100 ha
Fuel EtOH
Chem. EtOH
1,3-PDO
Ethylene
←Advantages Disadvantages→ Bioenergy
Biomaterials
Fig. 4-15 Results of the life cycle comparison between bioenergy and biomaterials obtained from sugar beet and the conventional counterparts of the main products for the At-lantic Central (ATC) zone (EtOH = Ethanol, 1,3-PDO = 1,3-propanediol); band-widths refer to minimum and maximum yields, respectively (see chapter 2.3).
Reading the diagram – exemplification of 1st bar ‘energy savings’ for bioenergy
If sugar beet is used to produce ethanol that replaces conventionally produced gasoline as a transport fuel, the energy savings per 100 hectares equal the yearly energy demand of 114 inhabitants.
62 4F CROPS – D 13: Life cycle analyses (LCA) IFEU Heidelberg
4.2.5.2 Sweet sorghum (MDN)
For sweet sorghum, different crop parts (grains and juice) can be used in different ways. Both juice and grains can be used to produce biomaterials and bioenergy (for all combina-tions assessed, see Table 3-3). Theoretically, the production of bioenergy and biomaterials can be combined. This combination, however, is not assessed in this chapter in order not to mix both use paths. Only the combination of different biomaterial products is assessed. The respective combinations are indicated in the legend. The first product is produced from juice, the second one from the grains.
Results: bioenergy
The production of ethanol from sweet sorghum juice and grains shows advantages re-garding energy savings, greenhouse effect and summer smog (see Fig. 4-16).
However, results regarding acidification, eutrophication and ozone depletion are slightly disadvantageous. Regarding human toxicity, no clear results can be derived.
Results: biomaterials
All biomaterials assessed show advantages for energy savings and greenhouse effect as well as regarding summer smog and human toxicity. However, all materials perform dis-advantageous regarding eutrophication and ozone depletion. For acidification, chemical ethanol and both combinations show advantages. Ethylene shows slight disadvantages.
Chemical ethanol performs best in saving energy and greenhouse gases. Regarding acidification, summer smog and human toxicity, chemical ethanol (stand-alone or in com-bination with 1,3-PDO) show very similar results and perform better than ethylene (also both stand-alone and in combination with 1,3-PDO). Regarding eutrophication, both variations of ethylene also show very similar results and perform slightly better than 1,3-PDO. For ozone depletion, chemical ethanol and ethylene as well as both combinations of 1,3-PDO show similar results. The first group shows less disadvantages.
Results: bandwidths
In contrast to all graphs in the previous chapters, in Fig. 4-16 the energy and greenhouse gas balances for average yields (depicted in the balances) do not lie between the results for minimum and maximum yields (depicted in the bandwidths). In contrast, results for maximum yields even perform less advantageous than results for minimum yields. The reason is that for maximum yields, the crop needs to be irrigated leading to great expen-ditures in energy and greenhouse gases (see also chapter 2.3). No such expenditures occur for average or minimum yields.
Reading the diagram – exemplification of 2nd bar ‘greenhouse effect’ for bioenergy
If the juice and the grains from sweet sorghum are used to produce ethanol that replaces conventional gasoline as a transport fuel, the greenhouse gas savings per 100 hectares equal the yearly greenhouse gas emissions of 106 inhabitants.
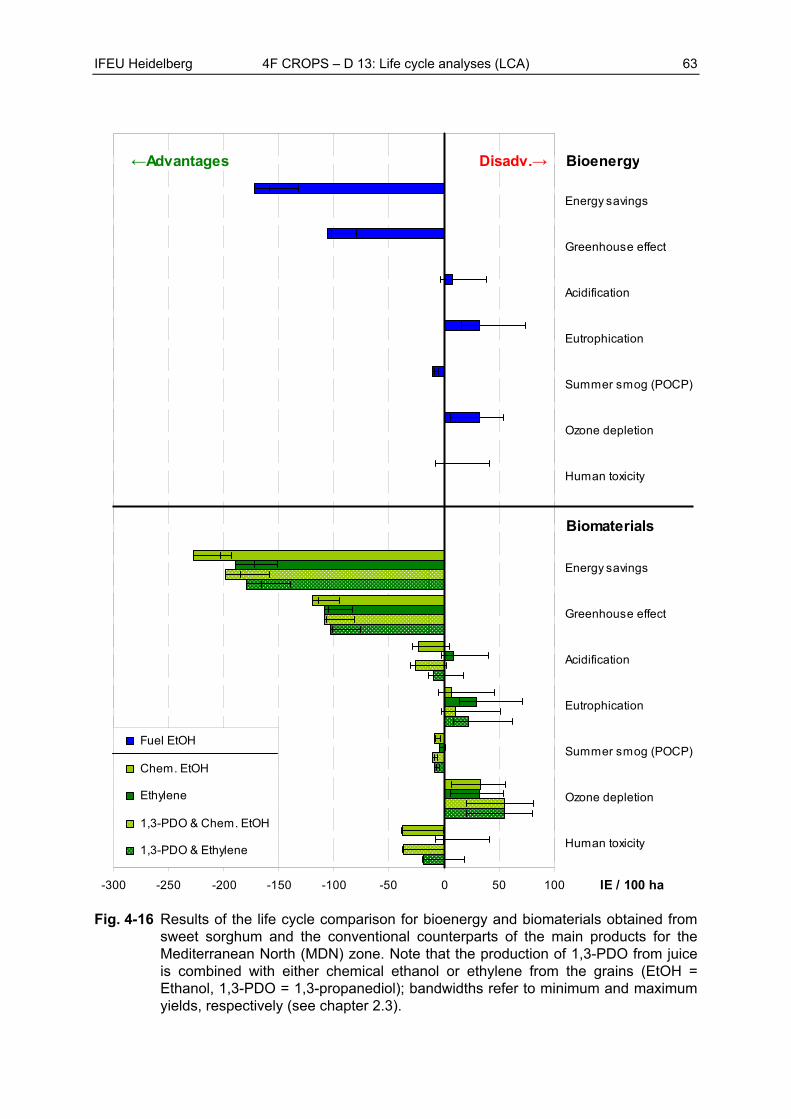
IFEU Heidelberg 4F CROPS – D 13: Life cycle analyses (LCA) 63
-300 -250 -200 -150 -100 -50 0 50 100
Human toxicity
Ozone depletion
Summer smog (POCP)
Eutrophication
Acidification
Greenhouse effect
Energy savings
Human toxicity
Ozone depletion
Summer smog (POCP)
Eutrophication
Acidification
Greenhouse effect
Energy savings
IE / 100 ha
Fuel EtOH
Chem. EtOH
Ethylene
1,3-PDO & Chem. EtOH
1,3-PDO & Ethylene
←Advantages Disadv.→ Bioenergy
Biomaterials
Fig. 4-16 Results of the life cycle comparison for bioenergy and biomaterials obtained from sweet sorghum and the conventional counterparts of the main products for the Mediterranean North (MDN) zone. Note that the production of 1,3-PDO from juice is combined with either chemical ethanol or ethylene from the grains (EtOH = Ethanol, 1,3-PDO = 1,3-propanediol); bandwidths refer to minimum and maximum yields, respectively (see chapter 2.3).
64 4F CROPS – D 13: Life cycle analyses (LCA) IFEU Heidelberg
4.2.6 Synopsis and conclusions
In the previous chapters, detailed results are presented for each of the 15 crops under inves-tigation covering their uses for bioenergy production and as biomaterials. The most important conclusions are pointed out in the following paragraphs.
As exemplified in chapter 4.1 for bioethanol from sugar beet, the single life cycle stages con-tribute to the overall results to different extents. For example, the conversion phase, i.e. the use of fossil energy carriers as process energy has the largest influence on energy and greenhouse gas balances. In contrast, this stage only is of minor importance for acidification and eutrophication. Here, cultivation and use phases are most relevant due to fertilizer appli-cation and use emissions. In total, it is not possible to determine one single life cycle stage with the largest contribution to the overall results across all environmental impact categories but the influences differ between the environmental impact categories.
All credits and expenditures along the life cycles sum up to advantages or disadvantages of the products from non-food crops compared to their fossil equivalents. For an easy overview on the environmental performance of all crops assessed here, the detailed results of the pre-vious chapters are simplified and aggregated in Table 4-1. All in all, the crops show both en-vironmental advantages and disadvantages. The following overall pattern can be identified: advantages in terms of energy and greenhouse gas savings and ambiguous or even disad-vantageous results regarding acidification, eutrophication, ozone depletion, summer smog, and human toxicity. With that, an objective conclusion regarding the overall environmental performance of bioenergy and biomaterials produced from the 15 crops is impossible from a scientific point of view. The overall rating rather has to be based on subjective criteria. For that purpose, LCAs offer optional elements such as grouping and weighting. Grouping for example involves a ranking of the impact categories in a given hierarchy (e.g. high, medium, and low priority). However, it has to be noted that any ranking is based on (subjective) value-choices. Different individuals, organisations and societies may have different preferences; therefore different rankings may be derived based on the same objectively obtained results.
The RE Directive (2009/28/EC) may serve as a guideline for ranking the results. As an over-all goal, it aims at a reduction of greenhouse gas emissions and promotes security of energy supply, among others by saving energy. If – based on this directive – energy saving and mitigation of GHG emissions are subjectively given the highest priority, all bioenergy carriers and biomaterials assessed in this study are superior to their fossil or conventional equiva-lents. Summing up, a conclusion regarding the overall environmental performance of bio-energy and biomaterials is possible based on subjective value-choices, but it is not scientifi-cally defendable.
Despite the impossibility to come to an objective conclusion on whether the biogenous or the fossil / conventional pathways are to be preferred, the biogenous pathways can still be com-pared among each others. Generally, herbaceous and sugar crops show the highest advan-tages in terms of energy and greenhouse gas savings. Woody crops perform best regarding acidification, eutrophication, summer smog, ozone depletion, and human toxicity. Oil crops show least advantages.
A thorough and more in-depth comparison of the crops and the respective use pathways will be provided in a separate report on the identification of best options (D 14).
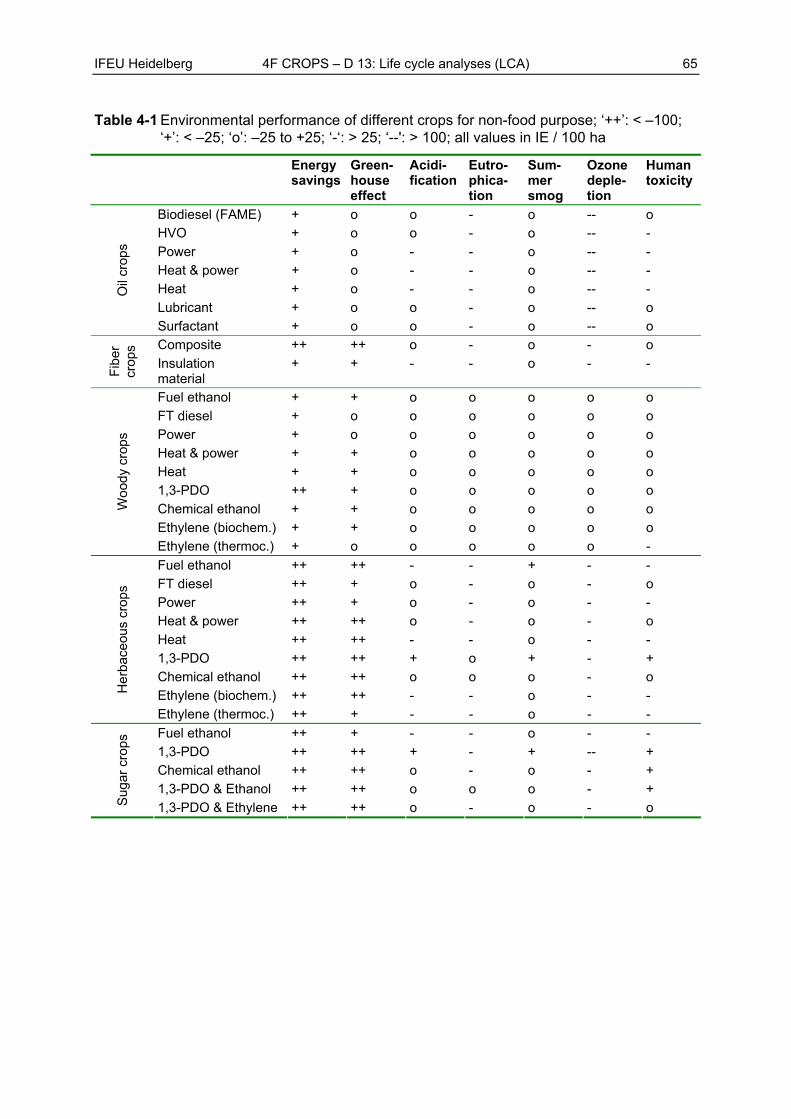
IFEU Heidelberg 4F CROPS – D 13: Life cycle analyses (LCA) 65
Table 4-1 Environmental performance of different crops for non-food purpose; ‘++’: < –100; ‘+’: < –25; ‘o’: –25 to +25; ‘-‘: > 25; ‘--': > 100; all values in IE / 100 ha
Energysavings
Green-house effect
Acidi- fication
Eutro- phica-tion
Sum-mer smog
Ozone deple-tion
Humantoxicity
Biodiesel (FAME) + o o - o -- o HVO + o o - o -- -
Power + o - - o -- - Heat & power + o - - o -- - Heat + o - - o -- -
Lubricant + o o - o -- o
Oil
crop
s
Surfactant + o o - o -- o Composite ++ ++ o - o - o
Fib
er
crop
s
Insulation material
+ + - - o - -
Fuel ethanol + + o o o o o
FT diesel + o o o o o o Power + o o o o o o Heat & power + + o o o o o
Heat + + o o o o o 1,3-PDO ++ + o o o o o Chemical ethanol + + o o o o o
Ethylene (biochem.) + + o o o o o
Wo
ody
crop
s
Ethylene (thermoc.) + o o o o o -
Fuel ethanol ++ ++ - - + - -
FT diesel ++ + o - o - o Power ++ + o - o - - Heat & power ++ ++ o - o - o
Heat ++ ++ - - o - - 1,3-PDO ++ ++ + o + - + Chemical ethanol ++ ++ o o o - o
Ethylene (biochem.) ++ ++ - - o - - Her
bace
ous
crop
s
Ethylene (thermoc.) ++ + - - o - -
Fuel ethanol ++ + - - o - -
1,3-PDO ++ ++ + - + -- + Chemical ethanol ++ ++ o - o - + 1,3-PDO & Ethanol ++ ++ o o o - +
Sug
ar c
rops
1,3-PDO & Ethylene ++ ++ o - o - o
66 4F CROPS – D 13: Life cycle analyses (LCA) IFEU Heidelberg
4.3 Reference scenarios: Variations and sensitivity analyses
In the following chapters, the outcomes of the modelling of multi-functional dependencies described in chapter 3.4 are presented. For the variations and sensitivity analyses, numerous parameters are varied, followed by a quantification of the respective influence on the results.
4.3.1 Agricultural reference system
The choice of agricultural reference system (including direct and indirect land-use changes) affects the greenhouse gas balances, as presented in Fig. 4-17. The results are exemplified for first and second generation bioethanol from sugar beet and Miscanthus, respectively. Both crops are cultivated in the Continental (CON) zone. The basic scenario (fallow) is marked with an asterisk. For details on the scenarios, refer to chapter 3.4.1, for background information on direct and indirect land-use changes, see chapter 2.2.2.
Results
Land-use changes and associated changes in carbon stocks can have significant influ-ences on the greenhouse gas balances of energy crops. In certain cases, previously ad-vantageous results even become disadvantageous.
For sugar beet, there is almost no difference between fallow or cereal replacement if only direct land-use changes are regarded (Fallow – dLUC / Cereals – dLUC). Carbon stocks do not change and there are just small expenditures for the production of addi-tional cereals. In contrast, grassland conversion on organic soils (Grassland – dLUC) causes great CO2 emissions and disadvantageous results. The integration of indirect effects has a strong impact on all scenarios. These effects may be advantageous due to land release related to the feed use of pulp and vinasse which supersede soy production in Brazil. If grassland is re-established on this released land, the credits for carbon sequestration equal the carbon loss related to US prairie conver-sion for additional food production (Fallow – iLUC / Cereals – iLUC). In contrast, indirect effects related to the displacement of feed production (Grassland – iLUC) lead to disad-vantageous results: carbon emissions from forest conversion in Brazil for soy production are added to carbon losses from grassland conversion. These losses cannot be compen-sated by the land release due to co-products.
For Miscanthus, the same results are derived if only direct effects are included: there is no difference between the cultivation on fallow and the displacement of food production (both showing advantages) whereas great disadvantages occur for grassland conversion. If indirect effects are included, however, results differ from sugar beet. Since in Miscan-thus processing, no co-product occurs that could be used as feed, no carbon credits can be given that would compensate for part of the carbon losses associated with the dis-placed food or feed production. Whereas these losses are only small for US prairie con-version compensating the displaced wheat production, they are large for the displace-ment of feed production. Here, carbon emissions from grassland conversion and emis-sions from forest conversion for soy production sum up to very disadvantageous results.
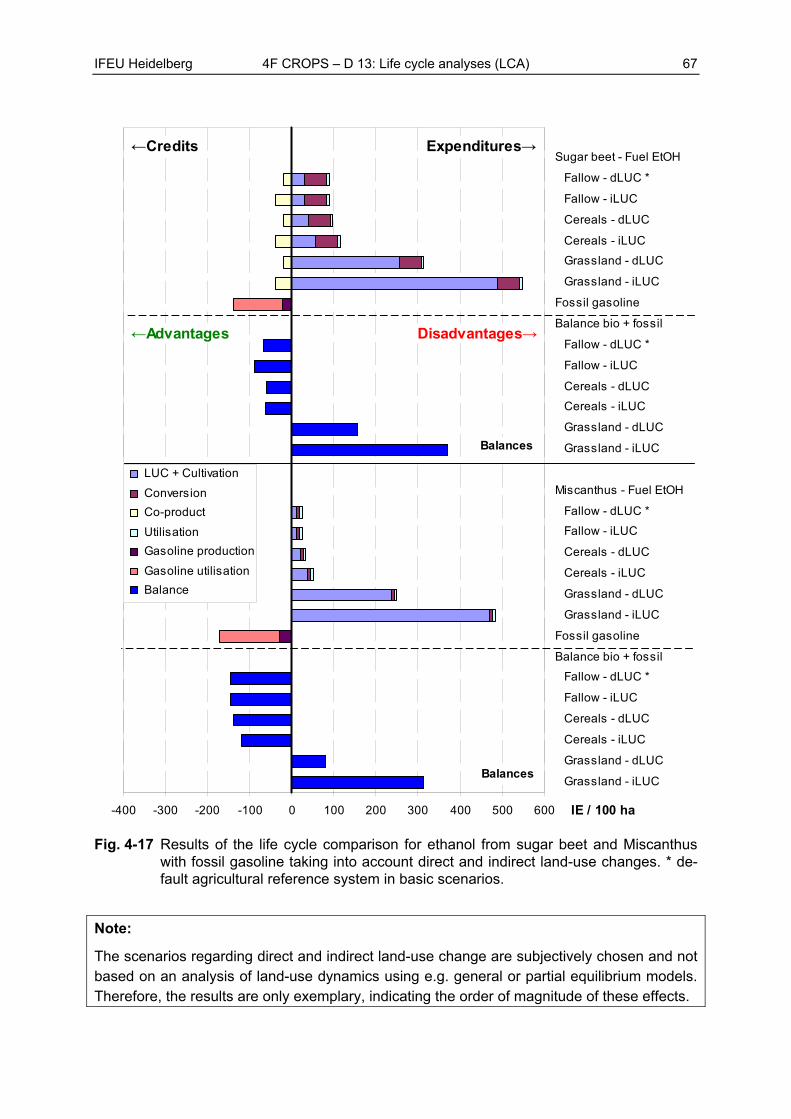
IFEU Heidelberg 4F CROPS – D 13: Life cycle analyses (LCA) 67
-400 -300 -200 -100 0 100 200 300 400 500 600
Grassland - iLUC
Grassland - dLUC
Cereals - iLUC
Cereals - dLUC
Fallow - iLUC
Fallow - dLUC *
Balance bio + fossil
Fossil gasoline
Grassland - iLUC
Grassland - dLUC
Cereals - iLUC
Cereals - dLUC
Fallow - iLUC
Fallow - dLUC *
Miscanthus - Fuel EtOH
Grassland - iLUC
Grassland - dLUC
Cereals - iLUC
Cereals - dLUC
Fallow - iLUC
Fallow - dLUC *
Balance bio + fossil
Fossil gasoline
Grassland - iLUC
Grassland - dLUC
Cereals - iLUC
Cereals - dLUC
Fallow - iLUC
Fallow - dLUC *
Sugar beet - Fuel EtOH
IE / 100 ha
LUC + Cultivation
Conversion
Co-product
Utilisation
Gasoline production
Gasoline utilisation
Balance
←Credits Expenditures→
←Advantages Disadvantages→
Balances
Balances
Fig. 4-17 Results of the life cycle comparison for ethanol from sugar beet and Miscanthus with fossil gasoline taking into account direct and indirect land-use changes. * de-fault agricultural reference system in basic scenarios.
Note:
The scenarios regarding direct and indirect land-use change are subjectively chosen and not based on an analysis of land-use dynamics using e.g. general or partial equilibrium models. Therefore, the results are only exemplary, indicating the order of magnitude of these effects.
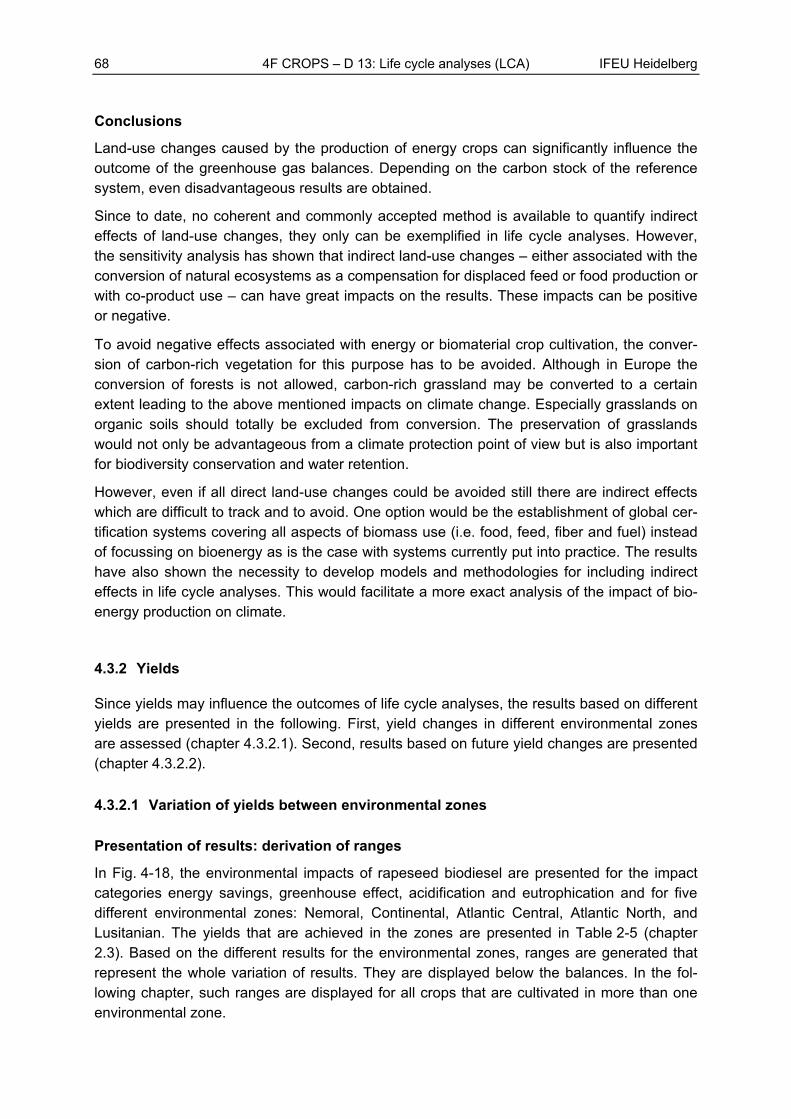
68 4F CROPS – D 13: Life cycle analyses (LCA) IFEU Heidelberg
Conclusions
Land-use changes caused by the production of energy crops can significantly influence the outcome of the greenhouse gas balances. Depending on the carbon stock of the reference system, even disadvantageous results are obtained.
Since to date, no coherent and commonly accepted method is available to quantify indirect effects of land-use changes, they only can be exemplified in life cycle analyses. However, the sensitivity analysis has shown that indirect land-use changes – either associated with the conversion of natural ecosystems as a compensation for displaced feed or food production or with co-product use – can have great impacts on the results. These impacts can be positive or negative.
To avoid negative effects associated with energy or biomaterial crop cultivation, the conver-sion of carbon-rich vegetation for this purpose has to be avoided. Although in Europe the conversion of forests is not allowed, carbon-rich grassland may be converted to a certain extent leading to the above mentioned impacts on climate change. Especially grasslands on organic soils should totally be excluded from conversion. The preservation of grasslands would not only be advantageous from a climate protection point of view but is also important for biodiversity conservation and water retention.
However, even if all direct land-use changes could be avoided still there are indirect effects which are difficult to track and to avoid. One option would be the establishment of global cer-tification systems covering all aspects of biomass use (i.e. food, feed, fiber and fuel) instead of focussing on bioenergy as is the case with systems currently put into practice. The results have also shown the necessity to develop models and methodologies for including indirect effects in life cycle analyses. This would facilitate a more exact analysis of the impact of bio-energy production on climate.
4.3.2 Yields
Since yields may influence the outcomes of life cycle analyses, the results based on different yields are presented in the following. First, yield changes in different environmental zones are assessed (chapter 4.3.2.1). Second, results based on future yield changes are presented (chapter 4.3.2.2).
4.3.2.1 Variation of yields between environmental zones
Presentation of results: derivation of ranges
In Fig. 4-18, the environmental impacts of rapeseed biodiesel are presented for the impact categories energy savings, greenhouse effect, acidification and eutrophication and for five different environmental zones: Nemoral, Continental, Atlantic Central, Atlantic North, and Lusitanian. The yields that are achieved in the zones are presented in Table 2-5 (chapter 2.3). Based on the different results for the environmental zones, ranges are generated that represent the whole variation of results. They are displayed below the balances. In the fol-lowing chapter, such ranges are displayed for all crops that are cultivated in more than one environmental zone.
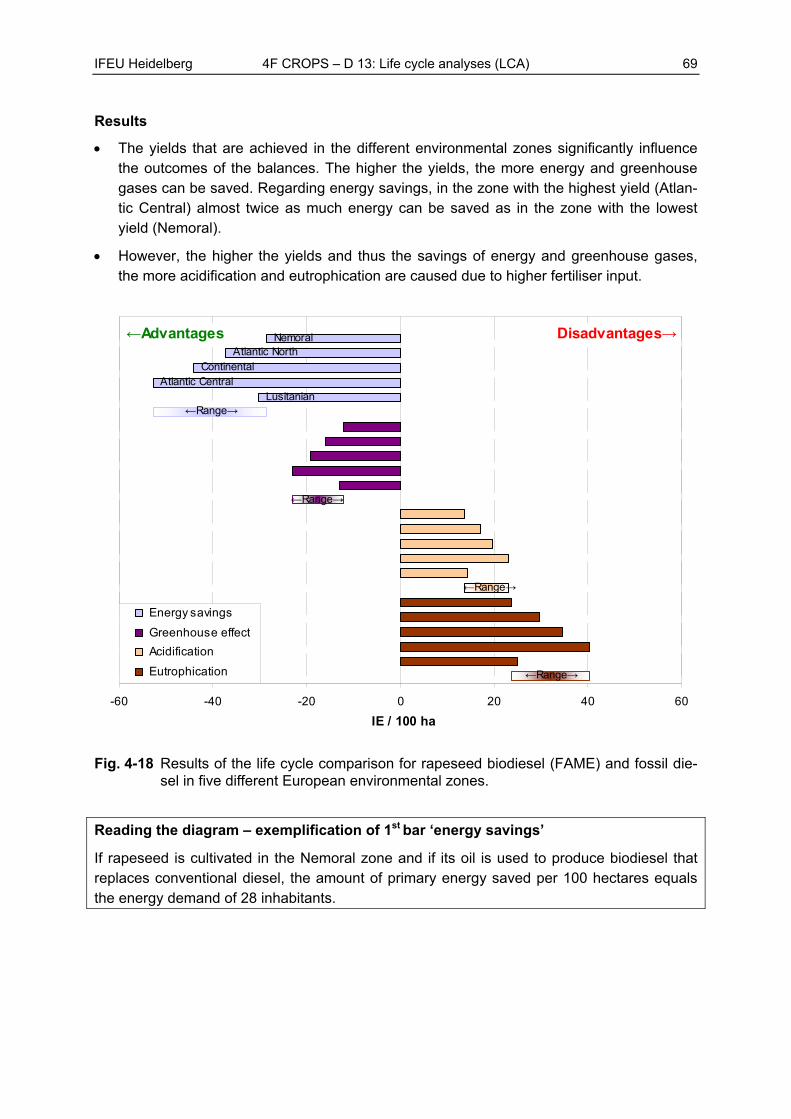
IFEU Heidelberg 4F CROPS – D 13: Life cycle analyses (LCA) 69
Results
The yields that are achieved in the different environmental zones significantly influence the outcomes of the balances. The higher the yields, the more energy and greenhouse gases can be saved. Regarding energy savings, in the zone with the highest yield (Atlan-tic Central) almost twice as much energy can be saved as in the zone with the lowest yield (Nemoral).
However, the higher the yields and thus the savings of energy and greenhouse gases, the more acidification and eutrophication are caused due to higher fertiliser input.
IE / 100 ha
Nemoral Atlantic North
Continental Atlantic Central
Lusitanian ←Range→
←Range→
←Range→
←Range→
-60 -40 -20 0 20 40 60
Energy savings
Greenhouse effect
Acidification
Eutrophication
←Advantages Disadvantages→
Fig. 4-18 Results of the life cycle comparison for rapeseed biodiesel (FAME) and fossil die-sel in five different European environmental zones.
Reading the diagram – exemplification of 1st bar ‘energy savings’
If rapeseed is cultivated in the Nemoral zone and if its oil is used to produce biodiesel that replaces conventional diesel, the amount of primary energy saved per 100 hectares equals the energy demand of 28 inhabitants.
70 4F CROPS – D 13: Life cycle analyses (LCA) IFEU Heidelberg
Ranges for multiregional crops
In Fig. 4-19, the greenhouse gas balances are shown for all crops that are cultivated in more than one environmental zone and for the respective main products. The ranges are derived in analogy to the method presented in the previous paragraph: they cover all environmental zones the crops are cultivated in and thus the related yields. These yields are presented in Table 2-5 (chapter 2.3).
The results are depicted taking greenhouse gas savings as an example. They can be trans-ferred to the other environmental impact categories according to the findings from the previ-ous chapter: energy and greenhouse gases as well as acidification and eutrophication, re-spectively, run parallel. However, the results of these two groups are directly opposed: the more energy and greenhouse gases are saved, the higher are acidification and eutrophica-tion.
Results
Yield differences related to different environmental zones considerably influence the out-come of the GHG balances of each pathway. A higher yield per hectare leads to higher GHG savings.
When comparing different pathways among each other in terms of absolute GHG sav-ings, it becomes obvious that differences are not just determined by the sheer biomass yield, but also by the specific GHG savings potential (CO2 eq. / tbiomass) of each pathway: the higher the specific GHG savings potential is, the more the absolute GHG savings in-crease with yield. For example, the result range for Miscanthus is quite large both be-cause the yields range from 13.0 t / ha (ATN) to 34.0 t / ha (LUS) and because high spe-cific savings can be achieved with most of the Miscanthus pathways.
Conclusions
For each pathway, there is a linear relationship between biomass yield per hectare and the greenhouse gas savings achieved. The absolute GHG savings, however, are also deter-mined by the specific GHG savings potential of each pathway.
Therefore, in order to maximise GHG savings, it is not sufficient to choose the environmental zone with the highest yield, but also to make sure that the biomass is converted and used in the most efficient way. In other words: the entire life cycle has to be taken into account.
Moreover, it has to be kept in mind that higher yields also require a higher fertiliser input. Therefore, higher energy and greenhouse gas savings are in many cases connected with increases of acidification and eutrophication.
Reading the diagram – exemplification of 2nd bar ‘rapeseed HVO’
If rapeseed oil from 100 hectares is used to produce HVO that replaces conventional diesel as transport fuel, the greenhouse gas savings equal the annual greenhouse gas emissions of 12 to 23 inhabitants – depending on the environmental zone rapeseed is cultivated in.
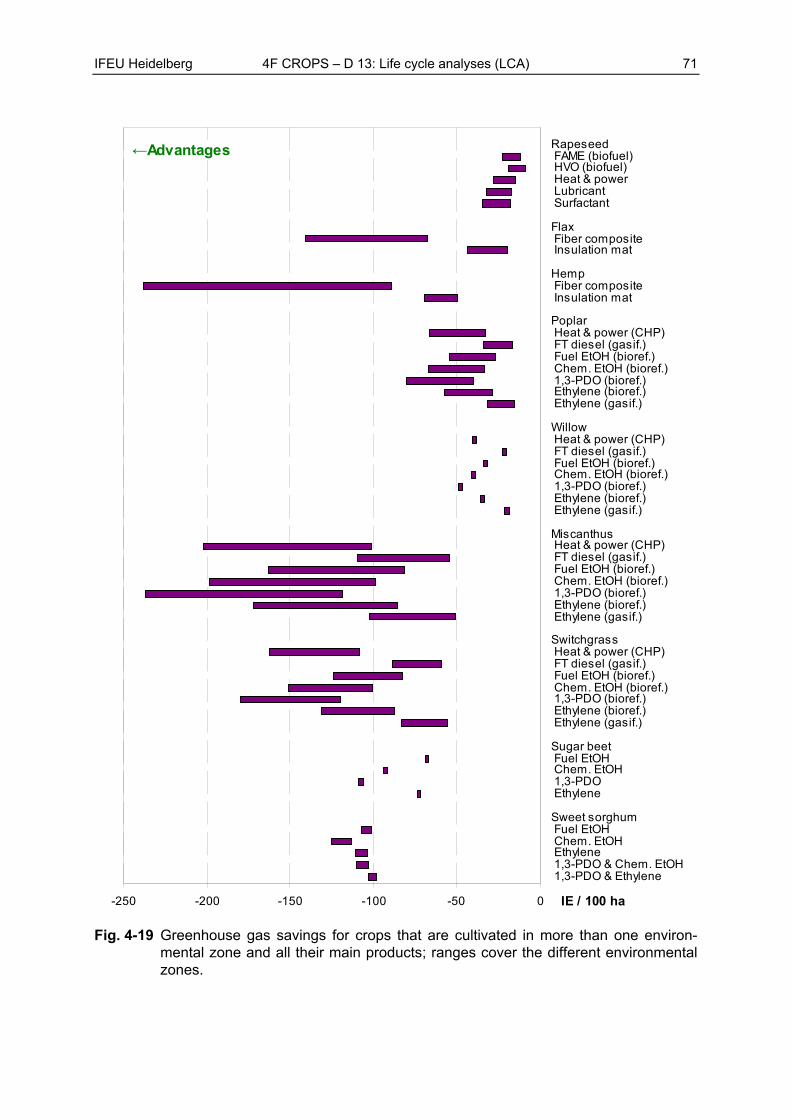
IFEU Heidelberg 4F CROPS – D 13: Life cycle analyses (LCA) 71
-250 -200 -150 -100 -50 0
Rapeseed FAME (biofuel) HVO (biofuel) Heat & power Lubricant Surfactant
Flax Fiber composite Insulation mat
Hemp Fiber composite Insulation mat
Poplar Heat & power (CHP) FT diesel (gasif.) Fuel EtOH (bioref.) Chem. EtOH (bioref.) 1,3-PDO (bioref.) Ethylene (bioref.) Ethylene (gasif.)
Willow Heat & power (CHP) FT diesel (gasif.) Fuel EtOH (bioref.) Chem. EtOH (bioref.) 1,3-PDO (bioref.) Ethylene (bioref.) Ethylene (gasif.)
Miscanthus Heat & power (CHP) FT diesel (gasif.) Fuel EtOH (bioref.) Chem. EtOH (bioref.) 1,3-PDO (bioref.) Ethylene (bioref.) Ethylene (gasif.)
Switchgrass Heat & power (CHP) FT diesel (gasif.) Fuel EtOH (bioref.) Chem. EtOH (bioref.) 1,3-PDO (bioref.) Ethylene (bioref.) Ethylene (gasif.)
Sugar beet Fuel EtOH Chem. EtOH 1,3-PDO Ethylene
Sweet sorghum Fuel EtOH Chem. EtOH Ethylene 1,3-PDO & Chem. EtOH 1,3-PDO & Ethylene
IE / 100 ha
←Advantages
Fig. 4-19 Greenhouse gas savings for crops that are cultivated in more than one environ-mental zone and all their main products; ranges cover the different environmental zones.
72 4F CROPS – D 13: Life cycle analyses (LCA) IFEU Heidelberg
4.3.2.2 Variation of yields in time: future yields
Yields do not only vary in different environmental zones due to climatic and biophysical con-ditions but they will also change in future due to progress in crop breeding. In Fig. 4-20 the results related to the yield increases extrapolated into the future (2020 & 2030) are pre-sented. For this analysis, all crops that are grown in the Atlantic Central (ATC) zone are as-sessed in order to exclude differences related to different biophysical conditions. The ranges cover the main products that are obtained. The results are presented for energy savings and greenhouse effect. They can be transferred to acidification and eutrophication (though in the opposite direction) as explained in chapter 4.3.2.1.
Results
The results show again that yields have a considerable influence on the outcomes of the balances: the higher the yields will be in future, the more energy and greenhouse gases can be saved. However, it has to be kept in mind that higher savings of energy and greenhouse gases are related to increased acidification and eutrophication.
The absolute energy and greenhouse gas savings increase in a linear way, i.e. the higher the specific savings (GJ / tbiomass and CO2 eq. / tbiomass) are for a certain pathway, the more they increase with yield (tbiomass / (ha*yr)). The absolute savings (GJ / (ha*yr) and CO2 eq. / (ha*yr)) are thus dependent on two factors.
Conclusions
Yields are among the main factors to influence the outcomes of the energy and greenhouse gas balances – at least if results are displayed on a hectare-basis.
Therefore, from an energy savings and climate protection point of view, all efforts should be put into striving for yield increases. However, since higher yields require a higher fertiliser input, acidification, eutrophication and stratospheric ozone depletion (the latter is not dis-played) will increase at the same time.
However, in order to maximise energy and GHG savings, it is not sufficient to breed for high yields, but also to ensure that the biomass is converted and used in an optimal way, i.e. the entire life cycle has to be taken into account.
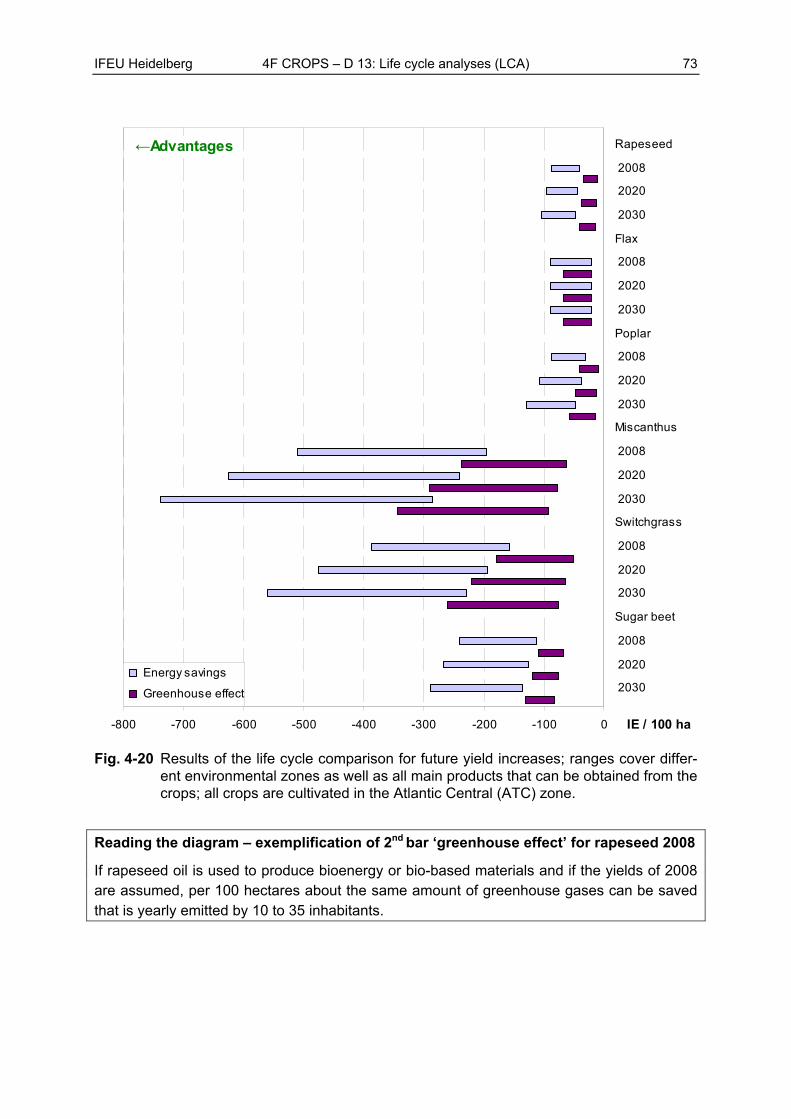
IFEU Heidelberg 4F CROPS – D 13: Life cycle analyses (LCA) 73
-800 -700 -600 -500 -400 -300 -200 -100 0
Rapeseed
2008
2020
2030
Flax
2008
2020
2030
Poplar
2008
2020
2030
Miscanthus
2008
2020
2030
Switchgrass
2008
2020
2030
Sugar beet
2008
2020
2030
IE / 100 ha
Energy savings
Greenhouse effect
←Advantages
Fig. 4-20 Results of the life cycle comparison for future yield increases; ranges cover differ-ent environmental zones as well as all main products that can be obtained from the crops; all crops are cultivated in the Atlantic Central (ATC) zone.
Reading the diagram – exemplification of 2nd bar ‘greenhouse effect’ for rapeseed 2008
If rapeseed oil is used to produce bioenergy or bio-based materials and if the yields of 2008 are assumed, per 100 hectares about the same amount of greenhouse gases can be saved that is yearly emitted by 10 to 35 inhabitants.
74 4F CROPS – D 13: Life cycle analyses (LCA) IFEU Heidelberg
4.3.3 Co-product use and allocation
4.3.3.1 Variation of co-product use
Along the life cycles of the crops, various co-products are obtained that can be used in dif-ferent ways (see chapter 3.4.2). Fig. 4-21 shows the environmental impacts of different co-product use options. One crop is taken as an example for each crop group (oil, fiber, ligno-cellulosic, sugar). All results are related to the Lusitanian (LUS) zone. The standard use op-tions are marked with an asterisk.
Results
The purposes which the co-products are used for in most cases have a significant impact on the results. Exceptions are the sweet sorghum combinations EtOH / feed and energy / DDGS that do not show any significant difference.
Regarding the relation between energy savings / greenhouse effect as well as acidifica-tion / eutrophication, the results do not follow the same pattern. For rapeseed, acidifica-tion and eutrophication increase if more energy and greenhouse gases are saved. For hemp, willow and sweet sorghum, in contrast, the more energy and greenhouse gases can be saved, the better are the performances regarding acidification and eutrophication.
For rapeseed, most energy and greenhouse gases can be saved if the meal is used for bioenergy production in a CHP instead of as feed. However, this use option increases acidification. For willow, results are opposite: the biomaterial use leads to better results than the use for bioenergy production. For sweet sorghum, results for all energy and greenhouse gas savings are best if the bagasse is used for process energy production and stillage is used as feed. Best results regarding acidification and eutrophication can be achieved if the stillage is further processed into Distillers’ Dried Grains with Solubles (DDGS). However, in this case there is only a small difference to the use of bagasse for second generation ethanol production and the direct use of the stillage as feed.
Conclusions
The choice of the co-product use has a clear influence on the outcomes of the life cycle analyses. Therefore, optimising co-product use is very essential. However, this choice is sub-jective, a fact which is often used as an argument against system expansion (substitution method). On the other hand, it shows that an optimised co-product use clearly has a positive impact on LCA results (which is not the case when using the allocation method).
A general statement is not possible on whether the co-products should rather be used as biomaterials or for bioenergy production – this depends on the crop. Also regarding the rela-tion between acidification / eutrophication and energy savings / greenhouse effect, no gen-eral result can be derived – sometimes, they run parallel, however, in some cases acidifica-tion and eutrophication increase if more energy and greenhouse gases are saved.
Therefore, no general advice can be given on the ‘best’ use of the co-products. Decisions have to be taken considering case-specific conditions. Moreover, there might be other rea-sons than the environmental performance of a certain co-product use. For example, the
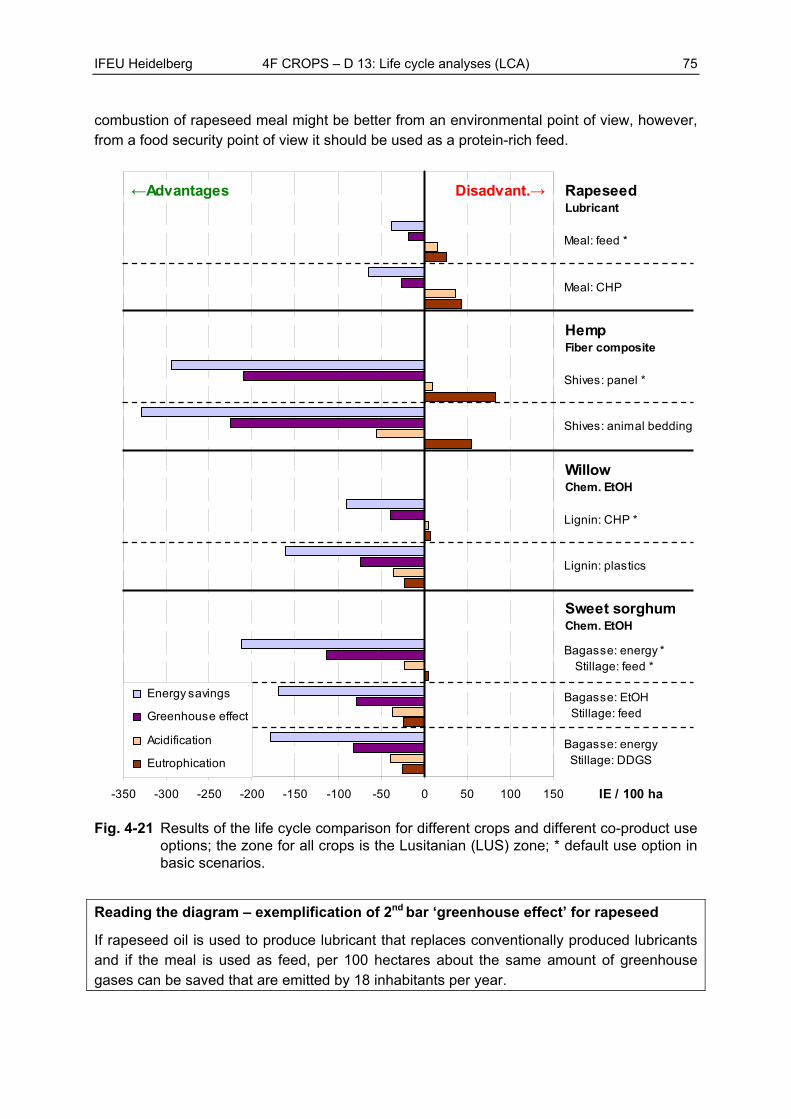
IFEU Heidelberg 4F CROPS – D 13: Life cycle analyses (LCA) 75
combustion of rapeseed meal might be better from an environmental point of view, however, from a food security point of view it should be used as a protein-rich feed.
-350 -300 -250 -200 -150 -100 -50 0 50 100 150
Bagasse: energyStillage: DDGS
Bagasse: EtOHStillage: feed
Bagasse: energy *Stillage: feed *
Lignin: plastics
Lignin: CHP *
Shives: animal bedding
Shives: panel *
Meal: CHP
Meal: feed *
IE / 100 ha
Energy savings
Greenhouse effect
Acidification
Eutrophication
Disadvant.→←Advantages
Sweet sorghumChem. EtOH
WillowChem. EtOH
HempFiber composite
RapeseedLubricant
Fig. 4-21 Results of the life cycle comparison for different crops and different co-product use options; the zone for all crops is the Lusitanian (LUS) zone; * default use option in basic scenarios.
Reading the diagram – exemplification of 2nd bar ‘greenhouse effect’ for rapeseed
If rapeseed oil is used to produce lubricant that replaces conventionally produced lubricants and if the meal is used as feed, per 100 hectares about the same amount of greenhouse gases can be saved that are emitted by 18 inhabitants per year.
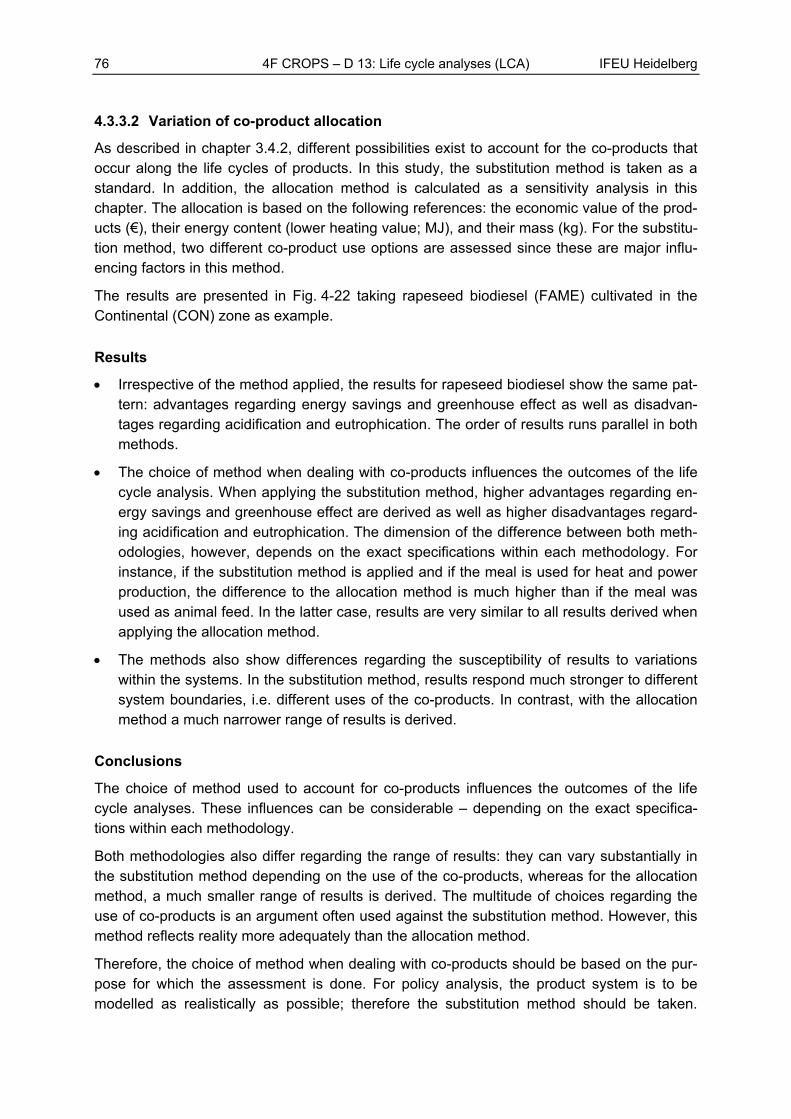
76 4F CROPS – D 13: Life cycle analyses (LCA) IFEU Heidelberg
4.3.3.2 Variation of co-product allocation
As described in chapter 3.4.2, different possibilities exist to account for the co-products that occur along the life cycles of products. In this study, the substitution method is taken as a standard. In addition, the allocation method is calculated as a sensitivity analysis in this chapter. The allocation is based on the following references: the economic value of the prod-ucts (€), their energy content (lower heating value; MJ), and their mass (kg). For the substitu-tion method, two different co-product use options are assessed since these are major influ-encing factors in this method.
The results are presented in Fig. 4-22 taking rapeseed biodiesel (FAME) cultivated in the Continental (CON) zone as example.
Results
Irrespective of the method applied, the results for rapeseed biodiesel show the same pat-tern: advantages regarding energy savings and greenhouse effect as well as disadvan-tages regarding acidification and eutrophication. The order of results runs parallel in both methods.
The choice of method when dealing with co-products influences the outcomes of the life cycle analysis. When applying the substitution method, higher advantages regarding en-ergy savings and greenhouse effect are derived as well as higher disadvantages regard-ing acidification and eutrophication. The dimension of the difference between both meth-odologies, however, depends on the exact specifications within each methodology. For instance, if the substitution method is applied and if the meal is used for heat and power production, the difference to the allocation method is much higher than if the meal was used as animal feed. In the latter case, results are very similar to all results derived when applying the allocation method.
The methods also show differences regarding the susceptibility of results to variations within the systems. In the substitution method, results respond much stronger to different system boundaries, i.e. different uses of the co-products. In contrast, with the allocation method a much narrower range of results is derived.
Conclusions
The choice of method used to account for co-products influences the outcomes of the life cycle analyses. These influences can be considerable – depending on the exact specifica-tions within each methodology.
Both methodologies also differ regarding the range of results: they can vary substantially in the substitution method depending on the use of the co-products, whereas for the allocation method, a much smaller range of results is derived. The multitude of choices regarding the use of co-products is an argument often used against the substitution method. However, this method reflects reality more adequately than the allocation method.
Therefore, the choice of method when dealing with co-products should be based on the pur-pose for which the assessment is done. For policy analysis, the product system is to be modelled as realistically as possible; therefore the substitution method should be taken.
IFEU Heidelberg 4F CROPS – D 13: Life cycle analyses (LCA) 77
However, if results need to be clear and transparent for the purpose of regulation, e.g. for the verification of compliance with the sustainability criteria, allocation would be the more ade-quate choice since it is easier to define in standards and directives.
-100 -75 -50 -25 0 25 50 75
Energy savings
Greenhouse effect
Acidification
Eutrophication
IE / 100 ha
Substitution: Meal→feed
Substit.: Meal→heat & power
Allocation: Economic value
Allocation: Energy cont. (LHV)
Allocation: Mass
←Advantages Disadvantages→ Rapeseed FAME
Fig. 4-22 Results of the life cycle comparisons for rapeseed biodiesel if the substitution and the allocation method are taken as a basis; rapeseed is cultivated in the Continen-tal (CON) zone.
Reading the diagram – exemplification of 1st bar ‘energy savings’
If rapeseed oil is used to produce biodiesel that replaces conventional diesel as transport fuel, and if the meal is used as feed, the energy savings per 100 hectares equal the yearly energy demand of 44 inhabitants if the substitution method is applied.
78 4F CROPS – D 13: Life cycle analyses (LCA) IFEU Heidelberg
4.3.4 Fossil reference system
4.3.4.1 Variation of stationary energy use
All oil and lignocellulosic crops assessed in this study can be used for the production of heat and / or power either via the combustion in a combined heat and power plant (CHP) or via the use in separate heat or power plants (see chapter 3.3). Accordingly, either fossil-fired combined heat and power plants or separate fossil-fired heat plants or power from the grid are substituted. For this sensitivity analysis, one crop of each of the crop groups is chosen: straight vegetable oil from rapeseed and biomass from poplar as well as from Miscanthus. The environmental zone for each crop is the Atlantic Central zone (ATC). Fig. 4-23 shows the results of the life cycle comparisons for the environmental impact categories energy sav-ings, greenhouse effect, acidification, and eutrophication.
Results
Almost all use options and crops show the following pattern: advantages regarding en-ergy savings and greenhouse effect and disadvantages regarding acidification and eutro-phication. One exception is the use of poplar for a combined heat and power production: regarding acidification, results are ambiguous. For Miscanthus, the use in a CHP per-forms slightly advantageous regarding acidification.
For all crops assessed, best results regarding energy savings and greenhouse effect can be achieved if power and heat are produced in combined heat and power plants (CHP) due to the high conversion efficiency. The second best option is the production of heat. However, for rapeseed there is almost no difference between heat and power production regarding energy savings.
Also regarding acidification and eutrophication, CHP is the best use option. Power pro-duction performs slightly better than does heat production regarding acidification whereas regarding eutrophication, there is no significant difference between both options. In the latter impact category there is not much difference between all three use options if rape-seed or poplar are used.
Conclusions
If vegetable oil or crop biomass is used to produce heat and / or power, environmental ad-vantages and disadvantages occur. From an environmental point of view, the use in a CHP in order to produce heat and power is the best choice in most cases: it helps saving most energy and greenhouse gases and shows the least disadvantageous results regarding eu-trophication and acidification. Regarding energy and greenhouse gas savings, heat produc-tion is the second best option.
Therefore, from an energy saving and climate protection point of view, the biomass should best be used for a combined heat and power production in order to achieve a maximum use efficiency.
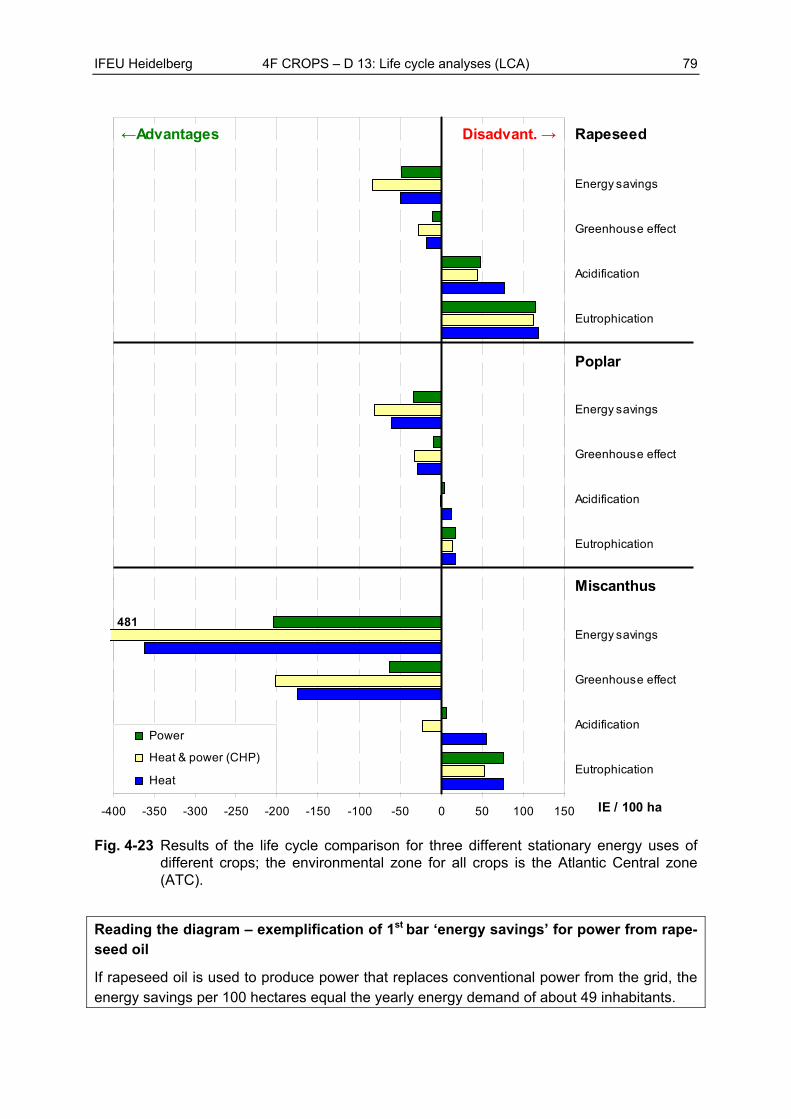
IFEU Heidelberg 4F CROPS – D 13: Life cycle analyses (LCA) 79
-400 -350 -300 -250 -200 -150 -100 -50 0 50 100 150
Eutrophication
Acidification
Greenhouse effect
Energy savings
Eutrophication
Acidification
Greenhouse effect
Energy savings
Eutrophication
Acidification
Greenhouse effect
Energy savings
IE / 100 ha
Power
Heat & power (CHP)
Heat
←Advantages Disadvant. → Rapeseed
Poplar
Miscanthus
481
Fig. 4-23 Results of the life cycle comparison for three different stationary energy uses of different crops; the environmental zone for all crops is the Atlantic Central zone (ATC).
Reading the diagram – exemplification of 1st bar ‘energy savings’ for power from rape-seed oil
If rapeseed oil is used to produce power that replaces conventional power from the grid, the energy savings per 100 hectares equal the yearly energy demand of about 49 inhabitants.
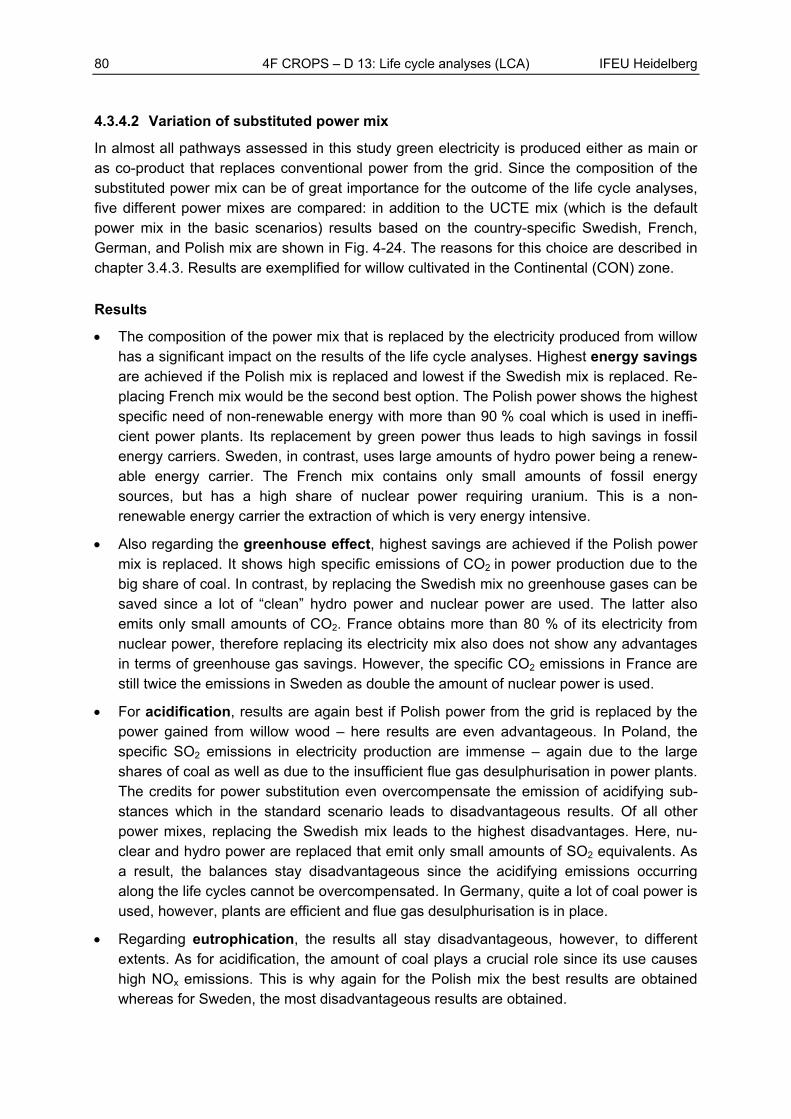
80 4F CROPS – D 13: Life cycle analyses (LCA) IFEU Heidelberg
4.3.4.2 Variation of substituted power mix
In almost all pathways assessed in this study green electricity is produced either as main or as co-product that replaces conventional power from the grid. Since the composition of the substituted power mix can be of great importance for the outcome of the life cycle analyses, five different power mixes are compared: in addition to the UCTE mix (which is the default power mix in the basic scenarios) results based on the country-specific Swedish, French, German, and Polish mix are shown in Fig. 4-24. The reasons for this choice are described in chapter 3.4.3. Results are exemplified for willow cultivated in the Continental (CON) zone.
Results
The composition of the power mix that is replaced by the electricity produced from willow has a significant impact on the results of the life cycle analyses. Highest energy savings are achieved if the Polish mix is replaced and lowest if the Swedish mix is replaced. Re-placing French mix would be the second best option. The Polish power shows the highest specific need of non-renewable energy with more than 90 % coal which is used in ineffi-cient power plants. Its replacement by green power thus leads to high savings in fossil energy carriers. Sweden, in contrast, uses large amounts of hydro power being a renew-able energy carrier. The French mix contains only small amounts of fossil energy sources, but has a high share of nuclear power requiring uranium. This is a non-renewable energy carrier the extraction of which is very energy intensive.
Also regarding the greenhouse effect, highest savings are achieved if the Polish power mix is replaced. It shows high specific emissions of CO2 in power production due to the big share of coal. In contrast, by replacing the Swedish mix no greenhouse gases can be saved since a lot of “clean” hydro power and nuclear power are used. The latter also emits only small amounts of CO2. France obtains more than 80 % of its electricity from nuclear power, therefore replacing its electricity mix also does not show any advantages in terms of greenhouse gas savings. However, the specific CO2 emissions in France are still twice the emissions in Sweden as double the amount of nuclear power is used.
For acidification, results are again best if Polish power from the grid is replaced by the power gained from willow wood – here results are even advantageous. In Poland, the specific SO2 emissions in electricity production are immense – again due to the large shares of coal as well as due to the insufficient flue gas desulphurisation in power plants. The credits for power substitution even overcompensate the emission of acidifying sub-stances which in the standard scenario leads to disadvantageous results. Of all other power mixes, replacing the Swedish mix leads to the highest disadvantages. Here, nu-clear and hydro power are replaced that emit only small amounts of SO2 equivalents. As a result, the balances stay disadvantageous since the acidifying emissions occurring along the life cycles cannot be overcompensated. In Germany, quite a lot of coal power is used, however, plants are efficient and flue gas desulphurisation is in place.
Regarding eutrophication, the results all stay disadvantageous, however, to different extents. As for acidification, the amount of coal plays a crucial role since its use causes high NOx emissions. This is why again for the Polish mix the best results are obtained whereas for Sweden, the most disadvantageous results are obtained.
IFEU Heidelberg 4F CROPS – D 13: Life cycle analyses (LCA) 81
Conclusions
The composition of the power mix that is replaced by the green power has a significant influ-ence on the results. The specific non-renewable energy demand for producing a kWh of electricity depends on both the share and the type of non-renewable energy carriers in a power mix. The higher the specific non-renewable energy demand is in the existing power mix, the more energy savings can be achieved by replacing it. The same applies for the other environmental impact categories: the more specific emissions of greenhouse gases as well as acidifying or eutrophying substances are caused in existing electricity production, the bet-ter results can be obtained by replacing it. In contrast, if a lot of renewable energy is used, its replacement has less advantages from an environmental point of view. Thus, best results regarding all impact categories can be obtained if the Polish power mix is replaced. In con-trast, replacing power from the grid in Sweden makes much less sense from an environ-mental point of view. Here, it should be assessed more closely whether an alternative use of the biomass would result in higher environmental advantages.
-75 -50 -25 0 25
Eutrophication
Acidification
Greenhouse effect
Energy savings
IE / 100 ha
UCTE
Sweden
France
Germany
Poland
←Advantages Disadvant. → WillowPower
Fig. 4-24 Results of the life cycle comparison for power production from willow in the Conti-nental (CON) zone taking into account different substituted power mixes: UCTE (European), Swedish, French, German, and Polish mix.
Reading the diagram – exemplification of 2nd bar ‘energy savings’ in Sweden
If willow is combusted for producing green electricity that replaces power from the grid in Sweden, per 100 hectares the same amount of energy can be saved that is demanded by 17 inhabitants per year.
82 4F CROPS – D 13: Life cycle analyses (LCA) IFEU Heidelberg
5 Summary and conclusions
Environmental advantages and disadvantages
The main goal of this study was to identify environmental advantages and disadvantages of bioenergy and bio-based materials made from 15 future crops in comparison to their fossil or conventional counterparts. The crops under investigation cover different crops groups (oil, fiber, woody and herbaceous lignocellulosic, sugar) and are cultivated in seven environ-mental zones within Europe.
All crops show a certain potential for saving energy and greenhouse gases – regardless of the environmental zone they are cultivated in and the purpose they are used for. However, in most cases these benefits are associated with ambiguous or even disadvantageous impacts regarding acidification, eutrophication, summer smog, ozone depletion as well as human toxicity. Therefore, from a scientific point of view an objective conclusion regarding the over-all environmental performance of bioenergy and biomaterials cannot be drawn. An overall conclusion rather has to be based on (subjective) value-choices, e g. by ranking the impact categories in a given hierarchy (e.g. high, medium, and low priority). For instance, if – in line with the goals of the RE Directive (2009/28/EC) – energy saving and mitigation of GHG emis-sions are subjectively given the highest priority, all bioenergy carriers and biomaterials as-sessed in this study are superior to their fossil or conventional equivalents.
Contribution of life cycle stages
Subgoal 1 was to identify the life cycle stages which make the largest contribution to the overall results. In general, the cultivation, conversion and utilisation stage are most impor-tant, whereas transports and the provision of specific ancillary products only have a minor influence. However, the extent to which each stage contributes to the overall balance differs both between pathways and between environmental impact categories within one pathway:
Regarding transport biofuel and biomaterial pathways, for example, the conversion stage makes a large contribution. On the contrary, it is less important for bioenergy pathways (e.g. direct combustion).
The cultivation stage is most important in terms of acidification, eutrophication and ozone depletion, which are dominated by nitrogen fertiliser-related field emissions (NH3 & N2O).
The conversion stage has the largest influence on energy and greenhouse gas balances due to the use of fossil energy carriers causing CO2 emissions.
The utilisation stage has a considerable impact on acidification and eutrophication, mainly through NOX emissions.
As a consequence, it is essential to assess the entire life cycle of bioenergy and bio-based materials. It is not sufficient to focus on single life cycle stages (e.g. crop cultivation) as the overall impact largely depends on what the biomass is used for, how efficiently it is converted and which fossil or conventional product it substitutes. Regarding transport biofuels and bio-energy for example, the stationary use of biomass, e.g. in a combined heat and power plant (CHP), usually outperforms the biofuel use of the biomass. However, the quantitative results
IFEU Heidelberg 4F CROPS – D 13: Life cycle analyses (LCA) 83
of the stationary use of biomass for energy depend on the case-specific conditions, e.g. on the composition of the substituted conventional power mix. The higher its specific non-renewable energy demand and specific emissions are, the better the results if it is substi-tuted. With respect to the most efficient biomass use, biomaterials should not be neglected since in certain cases they match up to or even surpass the stationary energy use!
Optimisation potentials
Regardless of the pathway chosen, there are a number of opportunities to improve the envi-ronmental performance of bioenergy or bio-based materials. Subgoal 2 aimed at the identifi-cation of such optimisation potentials. The following ones could be identified:
Yields: Higher yields clearly lead to higher energy and greenhouse gas savings. There-fore, from an energy saving and climate protection point of view, high yields should be strived for. However, at the same time more acidification and eutrophication are caused. In this respect it also has to be noted that the irrigation of the crops (in order to increase yield) may even show less advantage per unit area than non-irrigated crops.
Use of co-products: The use of the co-products that occur during crop processing can have a great impact on the results and considerably increase environmental advantages. However, no general advice can be given on the ‘best’ use of the co-products. Decisions have to be taken considering case-specific conditions.
Dependencies and sensitivities
Subgoal 3 of this study was to identify multi-functional dependencies and to quantify the im-pacts of methodological and data choices on the results. The key parameters are:
Agricultural reference system: In this study, fallow / set-aside land has been chosen as the default alternative land use, in line with the WP 1 assumption that only surplus land is used for the cultivation of energy or industrial crops. However, if food or feed crops were displaced causing direct and indirect land-use changes, the greenhouse gas balances could become disadvantageous, i.e. more greenhouse gas emissions would be caused than by using fossil or conventional products. It has to be noted that research concerning indirect land-use changes is still in its infancy and that a harmonised approach to account for indirect effects in life cycle assessments urgently needs to be developed.
Accounting for co-products: The choice of method used to account for co-products influences the outcomes of the life cycle analyses. In this study, system expansion – also called substitution method – has been applied. Despite multiple options regarding the use of co-products and potentially larger variations in results, this method reflects reality more adequately and should therefore be preferred for the purpose of policy analysis.
In this study, no overall and objective conclusion could be drawn on whether bioenergy or biomaterials are to be preferred over their fossil / conventional equivalents. Nevertheless, the results still allow for a comparison of the crops as well as conversion and use pathways among each other. Thereby, they serve the basis for the identification of options with a high energy and greenhouse gas savings potential. This is done in a separate report (D 14).
84 4F CROPS – D 13: Life cycle analyses (LCA) IFEU Heidelberg
6 References
/BMELV 2009/ Federal Ministry of Food, Agriculture and Consumer Protection: Aktionsplan der Bundesregierung zur stofflichen Nutzung nachwachsender Rohstoffe (Action plan of the Federal Government for a material use of biomass). Berlin, 2009.
/Borken et al. 1999/ Borken, J., Patyk, A., Reinhardt, G. A.: Basisdaten für ökologische Bi-lanzierungen (Basic data for ecological balances). Verlag Vieweg, Braunschweig / Wiesbaden, 1999.
/Bozell et al. 2007/ Bozell, J. J., Holladay, J. E., Johnson, D., White, J. F.: Top value added chemicals from biomass - Volume II: Results of Screening for Potential Candi-dates from Biorefinery Lignin. Prepared for the U.S. Department of Energy, 2007.
/Carlsson 2009/ Carlsson, A. S.: Plant oils as feedstock alternatives to petroleum – a short survey of potential oil crop platforms. Biochemie 91, 665-670.
/Carus et al. 2010/ Carus, M., Raschka, A., Piotrowski, S.: The development of instruments to support the material use of renewable raw materials in Germany (Summary). Nova-Institut, Hürth, 2010.
/CEC 2009/ Directive 2009/28/EC of the European Parliament and of the Council of 23 April 2009 on the promotion of the use of energy from renewable sources and amending and subsequently repealing Directives 2001/77/EC and 2003/30/EC. Official Journal of the European Union L 140/16, Brussels, 07.06.2009.
/Cherubini et al. 2009/ Cherubini, F., Bird, N.D., Cowie, A., Jungmeier, G., Schlamadinger, B., Woess-Gallasch, S.: Energy- and greenhouse gas-based LCA of biofuel and bio-energy systems: Key issues, ranges and recommendations. Resources, Conservation and Recycling 53(8): 434–447.
/CML 2004/ Institute of Environmental Sciences (CML). CML's impact assessment methods and characterisation factors. Department of Industrial Ecology, Leiden, 2004.
/CML 2009/ Institute of Environmental Sciences (CML): CML Impact assessment version 3.6 (CML-IA). Department of Industrial Ecology, Leiden, 2009.
/ecoinvent 2010/ Frischknecht, R. et al.: ecoinvent Data v2.2 – Ökoinventare für Energiesys-teme. ESU-services, Uster, 2007
/Eurostat 2007/ Eurostat: Energy, transport and environment indicators. European Commu-nities, Luxembourg, 2007.
/Eurostat 2010/ http://epp.eurostat.ec.europa.eu/tgm/table.do?tab=table&init=1&language= en&pcode=tps00001&plugin=1; download February 2010.
/Fehrenbach et al. 2008/ Fehrenbach, H.; Giegrich, J.; Reinhardt, G.; Schmitz, J.; Sayer, U.; Gretz, M.; Seizinger, E.; Lanje, K.: Criteria for a sustainable use of bioenergy on a glo-bal scale. UBA Texte 30/08, Federal Environment Agency, Dessau, 2008.
/Fehrenbach et al. 2009/ Fehrenbach, H., Giegrich, J., Reinhardt, G., Rettenmaier, N. : Syn-opsis of current models and methods applicable to indirect land use change (iLUC). Commissioned by the German Bioethanol Industry Association (BDBe), Berlin, 2009.
IFEU Heidelberg 4F CROPS – D 13: Life cycle analyses (LCA) 85
/Fritsche et al. 2004/ Fritsche, U. and 25 co-authors: Stoffstromanalyse zur nachhaltigen energetischen Nutzung von Biomasse (Material Flow Analysis of Sustainable Biomass Use for Energy). Öko-Institut (co-ordinator), Fraunhofer UMSICHT, Institut für Energe-tik und Umwelt, IFEU, Institut für ZukunftsEnergieSysteme, TU Braunschweig & TU München. Supported by the Federal Ministry for the Environment, Nature Conservation and Nuclear Safety in the framework of the ZIP programme. Darmstadt, 2004.
/Gärtner 2008/ Gärtner, S. O. (ed.): Final report on technical data, costs and life cycle inven-tories of biomass CHP plants. Prepared for the NEEDS project (“New Energy External-ities Developments for Sustainability”), supported by EC’s FP 6 programme. IFEU, Heidelberg, 2008.
/Gärtner et al. 2006/ Gärtner, S. O., Helms, H., Reinhardt, G. A., Rettenmaier, N.: An As-sessment of Energy and Greenhouse Gases of NExBTL. Commissioned by Neste Oil Corporation, Porvoo, 2006.
/Gärtner & Reinhardt 2003/ Gärtner, S. O., Reinhardt, G. A.: Life Cycle Assessment of Bio-diesel: Update and new Aspects. Commissioned by the Union for the Promotion of Oil and Protein Plants e. V. (UFOP), Berlin, 2003.
/Gärtner & Reinhardt 2005/ Gärtner, S. O., Reinhardt, G. A.: Übersichtsökobilanz von Bio-diesel aus Altspeisefetten (Screening Life Cycle Assessment of Biodiesel from Used Cooking Oils). Commissioned by Petrotec GmbH, Borken, 2005.
/GEMIS 2010/ Fritsche, U. et al.: Global Emission Model for Integrated Systems (GEMIS), Version 4.6. Öko-Institut e.V., Darmstadt, 2010
/Gnansounou et al. 2009/ Gnansounou, E., Dauriat, A., Villegas, J., Panichelli, L.: Life cycle assessment of biofuels: Energy and greenhouse gas balances. Bioresource Technolo-gy 100(21): 4919–4930.
/IFEU 2010/ Continuously updated internal IFEU Database. Heidelberg, 2010.
/IPCC 2006/ Intergovernmental Panel on Climate Change: 2006 IPCC Guidelines for Natio-nal Greenhouse Gas Inventories. Institute for Global Environmental Strategies (IGES), Hayama, 2006.
/IPCC 2007/ Intergovernmental Panel on Climate Change: Climate change 2007: The physi-cal science basis. Contribution of Working Group I to the Fourth Assessment Report of the Intergovernmental Panel on Climate Change. Cambridge University Press, Cam-bridge, 2007, pp 129-134.
/ISO 2006/ International Organization for Standardization: ISO 14040:2006 / 14044:2006. Environmental management – Life cycle assessment – Principles and framework / Re-quirements and guidelines. Beuth Verlag, Berlin, 2006.
/Jungk et al. 2000/ Jungk, N. C., Reinhardt G. A., Gärtner S. O.: Agricultural reference sys-tems in life cycle assessments. In: van Ierland EV, Lansink AO (eds.). Economics of sustainable energy in agriculture. Kluwer Academic Publishers, 2002.
/Klöpffer & Renner 1995/ Klöpffer, W., Renner, I: Methodik der Wirkungsbilanz im Rahmen von Produkt-Ökobilanzen unter Berücksichtigung nicht oder nur schwer quantifizierba-rer Umwelt-Kategorien. In Umweltbundesamt (1995): Methodik der produktbezogenen
86 4F CROPS – D 13: Life cycle analyses (LCA) IFEU Heidelberg
Ökobilanzen – Wirkungsbilanz und Bewertung. UBA Texte 23/95, Federal Environment Agency, Berlin, 1995.
/Köppen et al. 2009/ Köppen, S., Reinhardt, G. A., Gärtner, S. O.: Assessment of energy and greenhouse gas inventories of Sweet Sorghum for first and second generation bio-ethanol. Commissioned by the Food and Agriculture Organization of the United Nations (FAO), Rome, 2009.
/Larson 2006/ Larson, E.D.: A review of life-cycle analysis studies on liquid biofuel systems for the transport sector. Energy for Sustainable Development X(2): 109–126.
/Leeuw 2002/ Leeuw, F. D.: A set of emission indicators for long-range transboundary air pollution. Bilthoven, 2002.
/Menichetti & Otto 2009/ Menichetti, A., Otto, M.: Energy balances & greenhouse gas emis-sions of biofuels from a life cycle perspective. In: Howarth, R.W., Bringezu, S. (eds.): Biofuels: environmental consequences & implications of changing land use. Procee-dings of the Scientific Committee on Problems of the Environment (SCOPE) Internatio-nal biofuels project rapid assessment, 22–25 September 2008, Gummersbach, 81–109.
/Metzger et al. 2005/ Metzger, M. J., Bunce, R. G. H., Jongman, R. H. G., Mücher, C. A., Watkins, J. W.: A climatic stratification of the environment of Europe. Global Ecology and Biogeography 14 (6), 549 – 563
/Müller-Sämann et al. 2002/ Müller-Sämann, K. M., Reinhardt, G. A., Vetter, R., Gärtner, S. O.: Nachwachsende Rohstoffe in Baden-Württemberg: Identifizierung vorteilhafter Produktlinien zur stofflichen Nutzung unter besonderer Berücksichtigung umwelt-gerechter Anbauverfahren (Bio-based materials in Baden-Württemberg: Identification of advantageous product lines for material use under special consideration of environ-mentally friendly cultivation methods). Supported by the State of Baden-Württemberg in the framework of the BW-PLUS programme. Institut für umweltgerechte Landbe-wirtschaftung Müllheim & IFEU, Müllheim / Heidelberg, 2002
/Nitsch et al. 2004/ Nitsch, J. and 12 co-authors: Ökologisch optimierter Ausbau der Nutzung erneuerbarer Energien in Deutschland (Ecologically Optimized Extension of Renew-able Energy Utilization in Germany ). German Aerospace Center (co-ordinator), IFEU, IUS Weisser & Ness GmbH & Wuppertal Institute. Commissioned by the Federal Minis-try for the Environment, Nature Conservation and Nuclear Safety, Berlin, 2004.
/Oertel 2007/ Oertel, D.: Industrielle stoffliche Nutzung nachwachsender Rohstoffe (Industri-al conversion of biomass). Prepared by the Büro für Technikfolgen-Abschätzung beim Deutschen Bundestag (Office of Technology Assessment at the German Bundestag), Berlin, 2007.
/Patel et al. 2006/ Patel, M., Crank, M., Dornburg, V., Hermann, B., Roes, L. Hüsing, B., Overbeek, L., Terragni, F., Recchia, E.: Medium and long-term opportunities and risks of the biotechnological production of bulk chemicals from renewable resources – The potential of white biotechnology (The BREW Project). Supported by EC’s GROWTH programme, Utrecht, 2006.
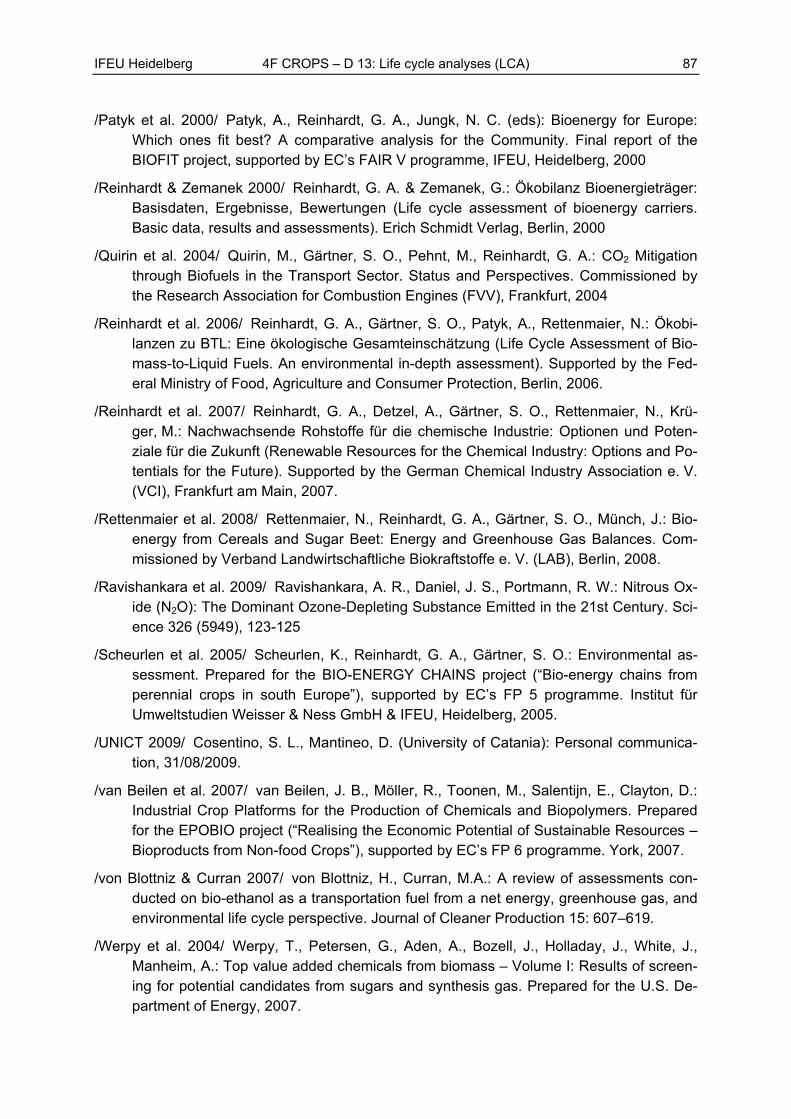
IFEU Heidelberg 4F CROPS – D 13: Life cycle analyses (LCA) 87
/Patyk et al. 2000/ Patyk, A., Reinhardt, G. A., Jungk, N. C. (eds): Bioenergy for Europe: Which ones fit best? A comparative analysis for the Community. Final report of the BIOFIT project, supported by EC’s FAIR V programme, IFEU, Heidelberg, 2000
/Reinhardt & Zemanek 2000/ Reinhardt, G. A. & Zemanek, G.: Ökobilanz Bioenergieträger: Basisdaten, Ergebnisse, Bewertungen (Life cycle assessment of bioenergy carriers. Basic data, results and assessments). Erich Schmidt Verlag, Berlin, 2000
/Quirin et al. 2004/ Quirin, M., Gärtner, S. O., Pehnt, M., Reinhardt, G. A.: CO2 Mitigation through Biofuels in the Transport Sector. Status and Perspectives. Commissioned by the Research Association for Combustion Engines (FVV), Frankfurt, 2004
/Reinhardt et al. 2006/ Reinhardt, G. A., Gärtner, S. O., Patyk, A., Rettenmaier, N.: Ökobi-lanzen zu BTL: Eine ökologische Gesamteinschätzung (Life Cycle Assessment of Bio-mass-to-Liquid Fuels. An environmental in-depth assessment). Supported by the Fed-eral Ministry of Food, Agriculture and Consumer Protection, Berlin, 2006.
/Reinhardt et al. 2007/ Reinhardt, G. A., Detzel, A., Gärtner, S. O., Rettenmaier, N., Krü-ger, M.: Nachwachsende Rohstoffe für die chemische Industrie: Optionen und Poten-ziale für die Zukunft (Renewable Resources for the Chemical Industry: Options and Po-tentials for the Future). Supported by the German Chemical Industry Association e. V. (VCI), Frankfurt am Main, 2007.
/Rettenmaier et al. 2008/ Rettenmaier, N., Reinhardt, G. A., Gärtner, S. O., Münch, J.: Bio-energy from Cereals and Sugar Beet: Energy and Greenhouse Gas Balances. Com-missioned by Verband Landwirtschaftliche Biokraftstoffe e. V. (LAB), Berlin, 2008.
/Ravishankara et al. 2009/ Ravishankara, A. R., Daniel, J. S., Portmann, R. W.: Nitrous Ox-ide (N2O): The Dominant Ozone-Depleting Substance Emitted in the 21st Century. Sci-ence 326 (5949), 123-125
/Scheurlen et al. 2005/ Scheurlen, K., Reinhardt, G. A., Gärtner, S. O.: Environmental as-sessment. Prepared for the BIO-ENERGY CHAINS project (“Bio-energy chains from perennial crops in south Europe”), supported by EC’s FP 5 programme. Institut für Umweltstudien Weisser & Ness GmbH & IFEU, Heidelberg, 2005.
/UNICT 2009/ Cosentino, S. L., Mantineo, D. (University of Catania): Personal communica-tion, 31/08/2009.
/van Beilen et al. 2007/ van Beilen, J. B., Möller, R., Toonen, M., Salentijn, E., Clayton, D.: Industrial Crop Platforms for the Production of Chemicals and Biopolymers. Prepared for the EPOBIO project (“Realising the Economic Potential of Sustainable Resources – Bioproducts from Non-food Crops”), supported by EC’s FP 6 programme. York, 2007.
/von Blottniz & Curran 2007/ von Blottniz, H., Curran, M.A.: A review of assessments con-ducted on bio-ethanol as a transportation fuel from a net energy, greenhouse gas, and environmental life cycle perspective. Journal of Cleaner Production 15: 607–619.
/Werpy et al. 2004/ Werpy, T., Petersen, G., Aden, A., Bozell, J., Holladay, J., White, J., Manheim, A.: Top value added chemicals from biomass – Volume I: Results of screen-ing for potential candidates from sugars and synthesis gas. Prepared for the U.S. De-partment of Energy, 2007.

88 4F CROPS – D 13: Life cycle analyses (LCA) IFEU Heidelberg
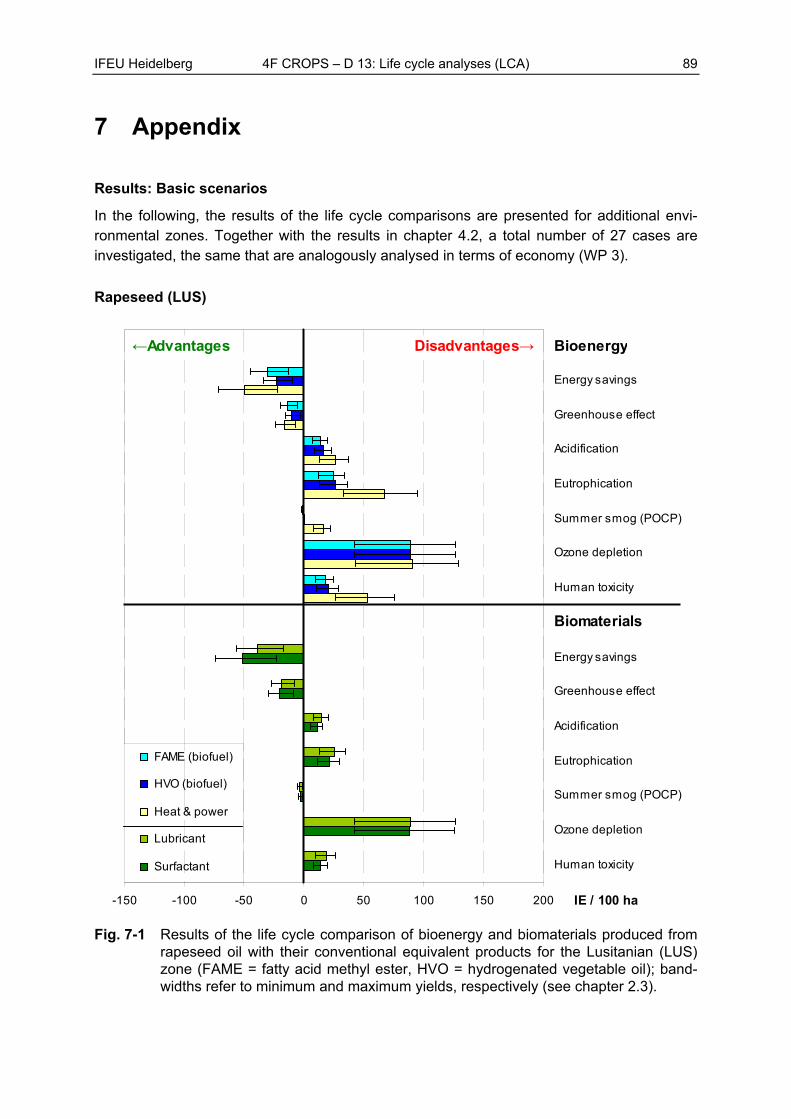
IFEU Heidelberg 4F CROPS – D 13: Life cycle analyses (LCA) 89
7 Appendix
Results: Basic scenarios
In the following, the results of the life cycle comparisons are presented for additional envi-ronmental zones. Together with the results in chapter 4.2, a total number of 27 cases are investigated, the same that are analogously analysed in terms of economy (WP 3).
Rapeseed (LUS)
-150 -100 -50 0 50 100 150 200
Human toxicity
Ozone depletion
Summer smog (POCP)
Eutrophication
Acidification
Greenhouse effect
Energy savings
Human toxicity
Ozone depletion
Summer smog (POCP)
Eutrophication
Acidification
Greenhouse effect
Energy savings
IE / 100 ha
FAME (biofuel)
HVO (biofuel)
Heat & power
Lubricant
Surfactant
←Advantages Disadvantages→
Biomaterials
Bioenergy
Fig. 7-1 Results of the life cycle comparison of bioenergy and biomaterials produced from rapeseed oil with their conventional equivalent products for the Lusitanian (LUS) zone (FAME = fatty acid methyl ester, HVO = hydrogenated vegetable oil); band-widths refer to minimum and maximum yields, respectively (see chapter 2.3).
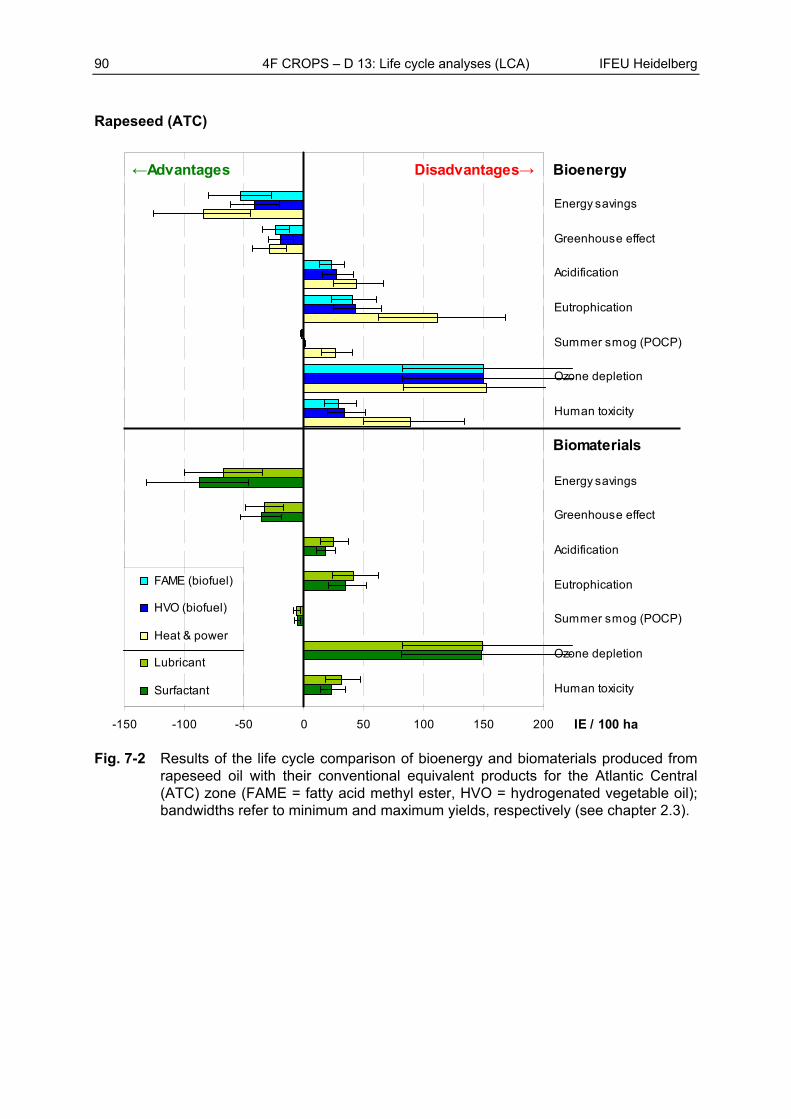
90 4F CROPS – D 13: Life cycle analyses (LCA) IFEU Heidelberg
Rapeseed (ATC)
-150 -100 -50 0 50 100 150 200
Human toxicity
Ozone depletion
Summer smog (POCP)
Eutrophication
Acidification
Greenhouse effect
Energy savings
Human toxicity
Ozone depletion
Summer smog (POCP)
Eutrophication
Acidification
Greenhouse effect
Energy savings
IE / 100 ha
FAME (biofuel)
HVO (biofuel)
Heat & power
Lubricant
Surfactant
←Advantages Disadvantages→
Biomaterials
Bioenergy
Fig. 7-2 Results of the life cycle comparison of bioenergy and biomaterials produced from rapeseed oil with their conventional equivalent products for the Atlantic Central (ATC) zone (FAME = fatty acid methyl ester, HVO = hydrogenated vegetable oil); bandwidths refer to minimum and maximum yields, respectively (see chapter 2.3).
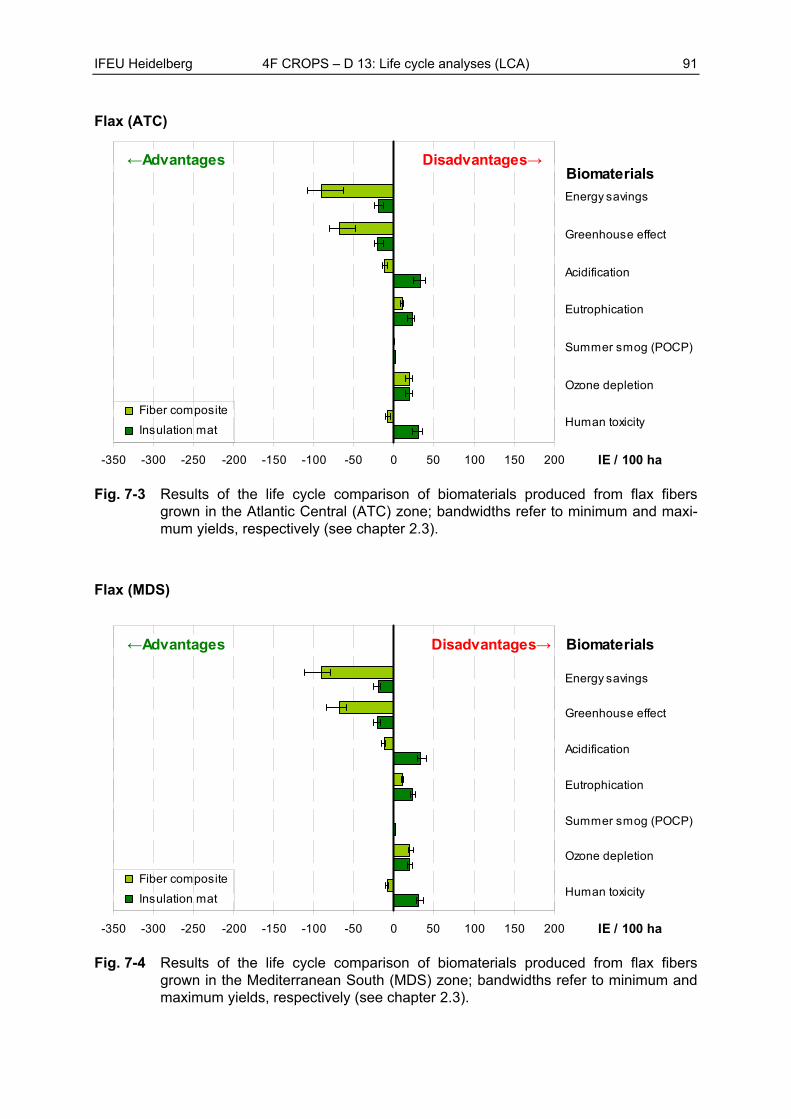
IFEU Heidelberg 4F CROPS – D 13: Life cycle analyses (LCA) 91
Flax (ATC)
-350 -300 -250 -200 -150 -100 -50 0 50 100 150 200
Human toxicity
Ozone depletion
Summer smog (POCP)
Eutrophication
Acidification
Greenhouse effect
Energy savings
IE / 100 ha
Fiber composite
Insulation mat
←Advantages Disadvantages→Biomaterials
Fig. 7-3 Results of the life cycle comparison of biomaterials produced from flax fibers grown in the Atlantic Central (ATC) zone; bandwidths refer to minimum and maxi-mum yields, respectively (see chapter 2.3).
Flax (MDS)
-350 -300 -250 -200 -150 -100 -50 0 50 100 150 200
Human toxicity
Ozone depletion
Summer smog (POCP)
Eutrophication
Acidification
Greenhouse effect
Energy savings
IE / 100 ha
Fiber composite
Insulation mat
←Advantages Disadvantages→ Biomaterials
Fig. 7-4 Results of the life cycle comparison of biomaterials produced from flax fibers grown in the Mediterranean South (MDS) zone; bandwidths refer to minimum and maximum yields, respectively (see chapter 2.3).
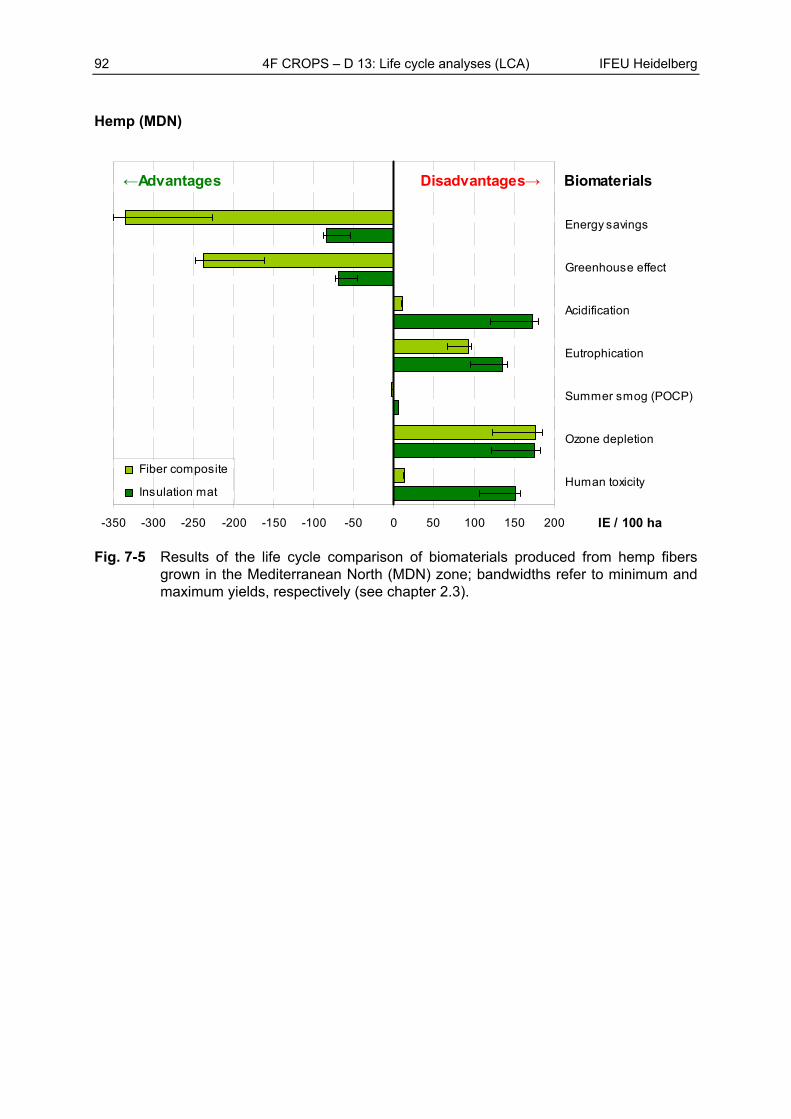
92 4F CROPS – D 13: Life cycle analyses (LCA) IFEU Heidelberg
Hemp (MDN)
-350 -300 -250 -200 -150 -100 -50 0 50 100 150 200
Human toxicity
Ozone depletion
Summer smog (POCP)
Eutrophication
Acidification
Greenhouse effect
Energy savings
IE / 100 ha
Fiber composite
Insulation mat
←Advantages Disadvantages→ Biomaterials
Fig. 7-5 Results of the life cycle comparison of biomaterials produced from hemp fibers grown in the Mediterranean North (MDN) zone; bandwidths refer to minimum and maximum yields, respectively (see chapter 2.3).
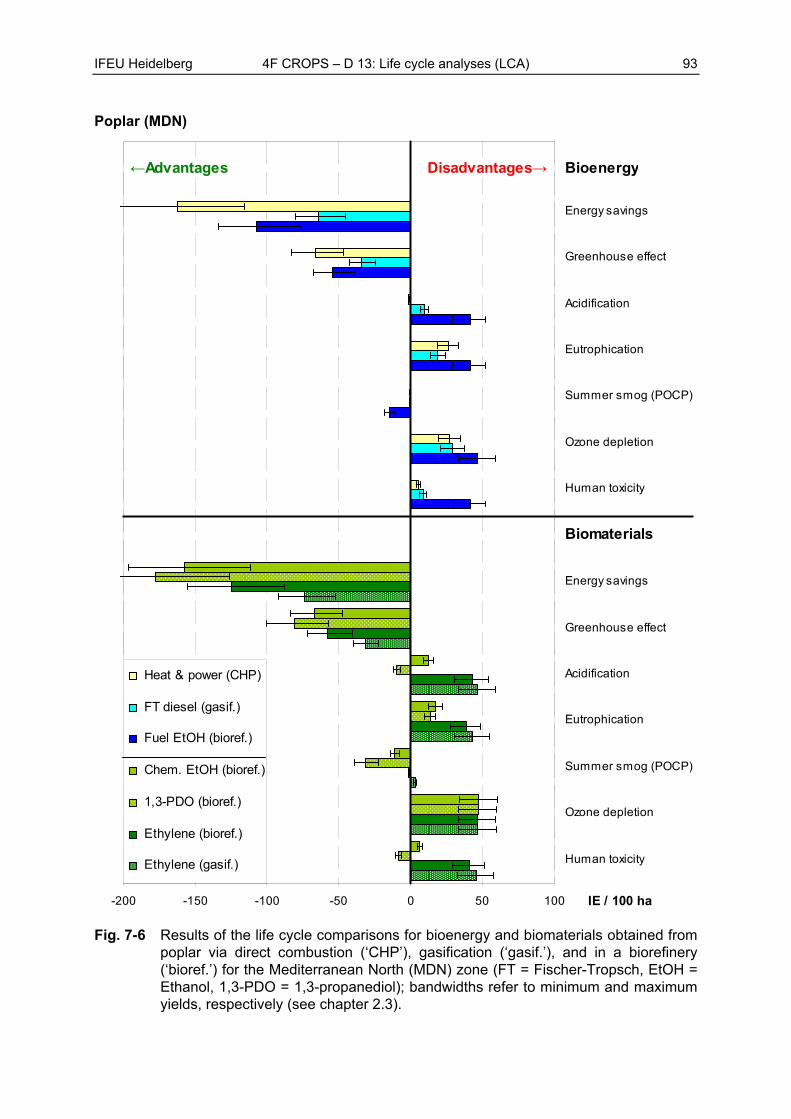
IFEU Heidelberg 4F CROPS – D 13: Life cycle analyses (LCA) 93
Poplar (MDN)
-200 -150 -100 -50 0 50 100
Human toxicity
Ozone depletion
Summer smog (POCP)
Eutrophication
Acidification
Greenhouse effect
Energy savings
Human toxicity
Ozone depletion
Summer smog (POCP)
Eutrophication
Acidification
Greenhouse effect
Energy savings
IE / 100 ha
Heat & power (CHP)
FT diesel (gasif.)
Fuel EtOH (bioref.)
Chem. EtOH (bioref.)
1,3-PDO (bioref.)
Ethylene (bioref.)
Ethylene (gasif.)
←Advantages Disadvantages→ Bioenergy
Biomaterials
Fig. 7-6 Results of the life cycle comparisons for bioenergy and biomaterials obtained from poplar via direct combustion (‘CHP’), gasification (‘gasif.’), and in a biorefinery (‘bioref.’) for the Mediterranean North (MDN) zone (FT = Fischer-Tropsch, EtOH = Ethanol, 1,3-PDO = 1,3-propanediol); bandwidths refer to minimum and maximum yields, respectively (see chapter 2.3).
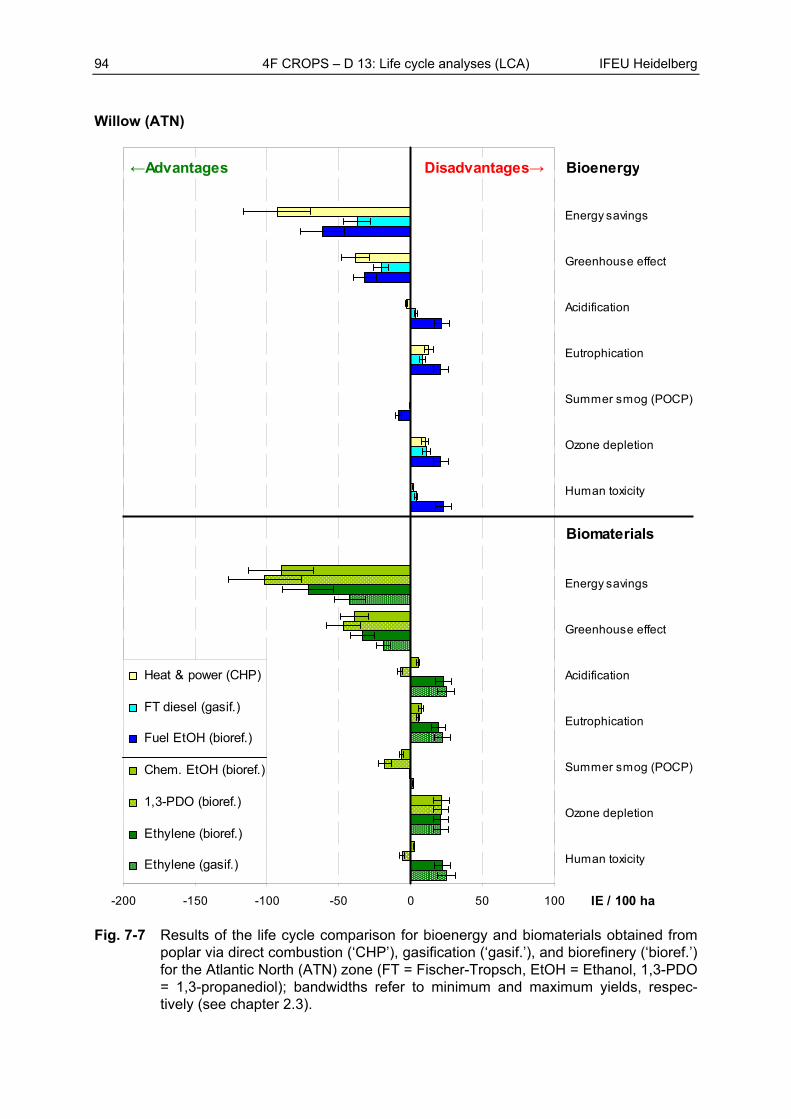
94 4F CROPS – D 13: Life cycle analyses (LCA) IFEU Heidelberg
Willow (ATN)
-200 -150 -100 -50 0 50 100
Human toxicity
Ozone depletion
Summer smog (POCP)
Eutrophication
Acidification
Greenhouse effect
Energy savings
Human toxicity
Ozone depletion
Summer smog (POCP)
Eutrophication
Acidification
Greenhouse effect
Energy savings
IE / 100 ha
Heat & power (CHP)
FT diesel (gasif.)
Fuel EtOH (bioref.)
Chem. EtOH (bioref.)
1,3-PDO (bioref.)
Ethylene (bioref.)
Ethylene (gasif.)
←Advantages Disadvantages→ Bioenergy
Biomaterials
Fig. 7-7 Results of the life cycle comparison for bioenergy and biomaterials obtained from poplar via direct combustion (‘CHP’), gasification (‘gasif.’), and biorefinery (‘bioref.’) for the Atlantic North (ATN) zone (FT = Fischer-Tropsch, EtOH = Ethanol, 1,3-PDO = 1,3-propanediol); bandwidths refer to minimum and maximum yields, respec-tively (see chapter 2.3).
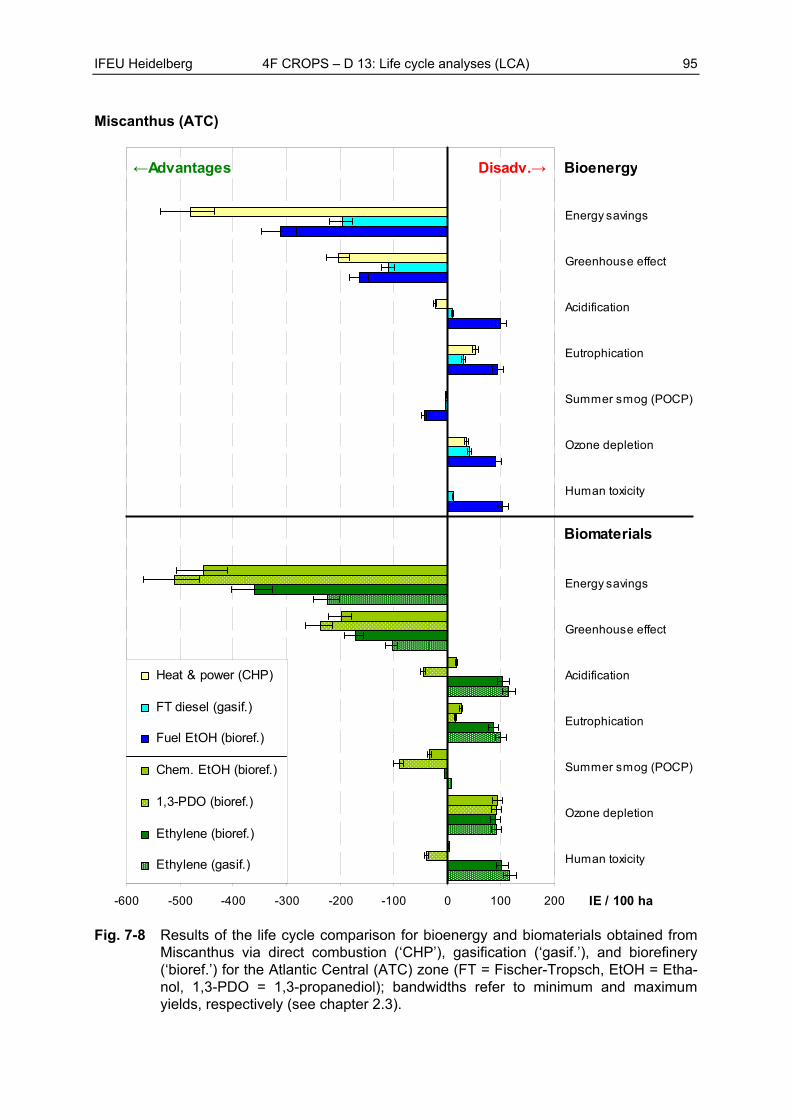
IFEU Heidelberg 4F CROPS – D 13: Life cycle analyses (LCA) 95
Miscanthus (ATC)
-600 -500 -400 -300 -200 -100 0 100 200
Human toxicity
Ozone depletion
Summer smog (POCP)
Eutrophication
Acidification
Greenhouse effect
Energy savings
Human toxicity
Ozone depletion
Summer smog (POCP)
Eutrophication
Acidification
Greenhouse effect
Energy savings
IE / 100 ha
Heat & power (CHP)
FT diesel (gasif.)
Fuel EtOH (bioref.)
Chem. EtOH (bioref.)
1,3-PDO (bioref.)
Ethylene (bioref.)
Ethylene (gasif.)
←Advantages Disadv.→ Bioenergy
Biomaterials
Fig. 7-8 Results of the life cycle comparison for bioenergy and biomaterials obtained from Miscanthus via direct combustion (‘CHP’), gasification (‘gasif.’), and biorefinery (‘bioref.’) for the Atlantic Central (ATC) zone (FT = Fischer-Tropsch, EtOH = Etha-nol, 1,3-PDO = 1,3-propanediol); bandwidths refer to minimum and maximum yields, respectively (see chapter 2.3).
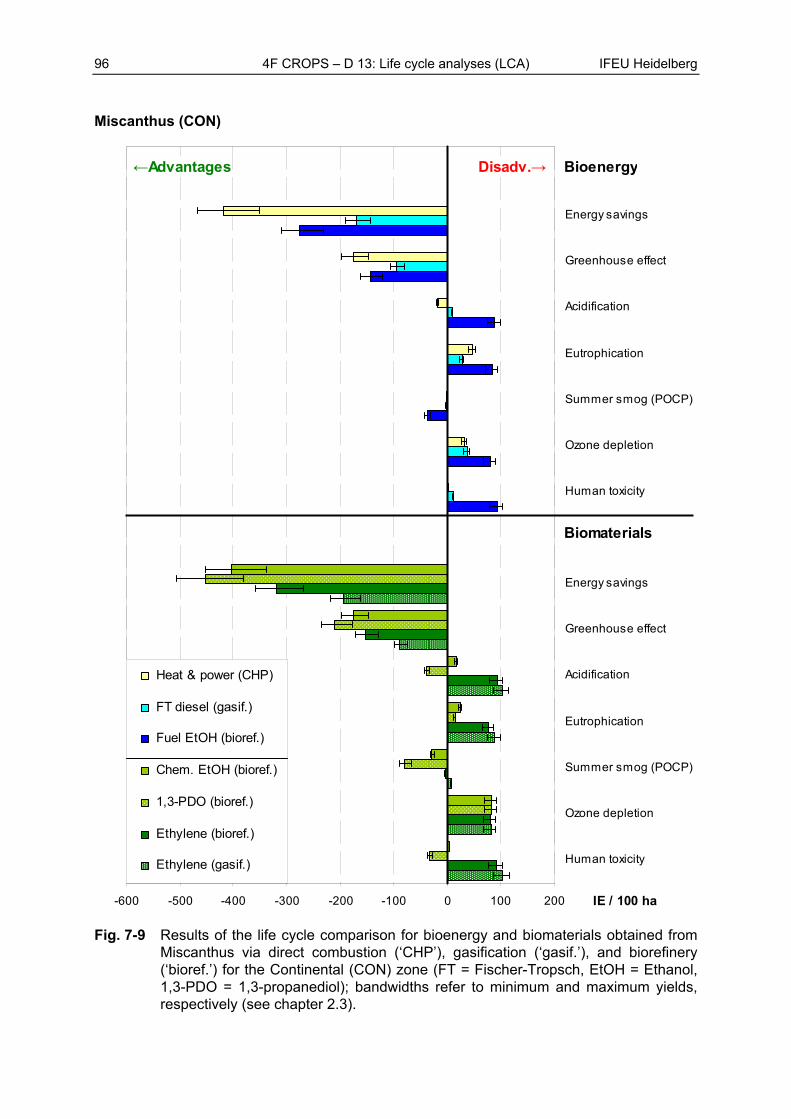
96 4F CROPS – D 13: Life cycle analyses (LCA) IFEU Heidelberg
Miscanthus (CON)
-600 -500 -400 -300 -200 -100 0 100 200
Human toxicity
Ozone depletion
Summer smog (POCP)
Eutrophication
Acidification
Greenhouse effect
Energy savings
Human toxicity
Ozone depletion
Summer smog (POCP)
Eutrophication
Acidification
Greenhouse effect
Energy savings
IE / 100 ha
Heat & power (CHP)
FT diesel (gasif.)
Fuel EtOH (bioref.)
Chem. EtOH (bioref.)
1,3-PDO (bioref.)
Ethylene (bioref.)
Ethylene (gasif.)
←Advantages Disadv.→ Bioenergy
Biomaterials
Fig. 7-9 Results of the life cycle comparison for bioenergy and biomaterials obtained from Miscanthus via direct combustion (‘CHP’), gasification (‘gasif.’), and biorefinery (‘bioref.’) for the Continental (CON) zone (FT = Fischer-Tropsch, EtOH = Ethanol, 1,3-PDO = 1,3-propanediol); bandwidths refer to minimum and maximum yields, respectively (see chapter 2.3).
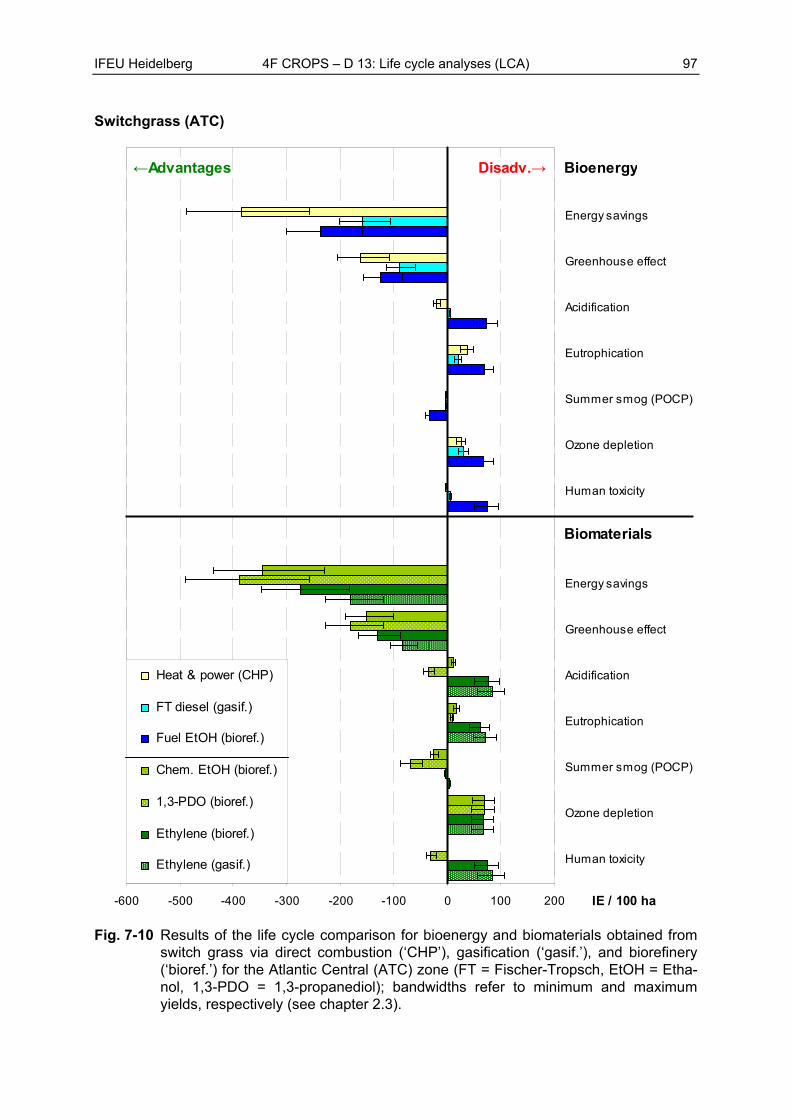
IFEU Heidelberg 4F CROPS – D 13: Life cycle analyses (LCA) 97
Switchgrass (ATC)
-600 -500 -400 -300 -200 -100 0 100 200
Human toxicity
Ozone depletion
Summer smog (POCP)
Eutrophication
Acidification
Greenhouse effect
Energy savings
Human toxicity
Ozone depletion
Summer smog (POCP)
Eutrophication
Acidification
Greenhouse effect
Energy savings
IE / 100 ha
Heat & power (CHP)
FT diesel (gasif.)
Fuel EtOH (bioref.)
Chem. EtOH (bioref.)
1,3-PDO (bioref.)
Ethylene (bioref.)
Ethylene (gasif.)
←Advantages Disadv.→ Bioenergy
Biomaterials
Fig. 7-10 Results of the life cycle comparison for bioenergy and biomaterials obtained from switch grass via direct combustion (‘CHP’), gasification (‘gasif.’), and biorefinery (‘bioref.’) for the Atlantic Central (ATC) zone (FT = Fischer-Tropsch, EtOH = Etha-nol, 1,3-PDO = 1,3-propanediol); bandwidths refer to minimum and maximum yields, respectively (see chapter 2.3).
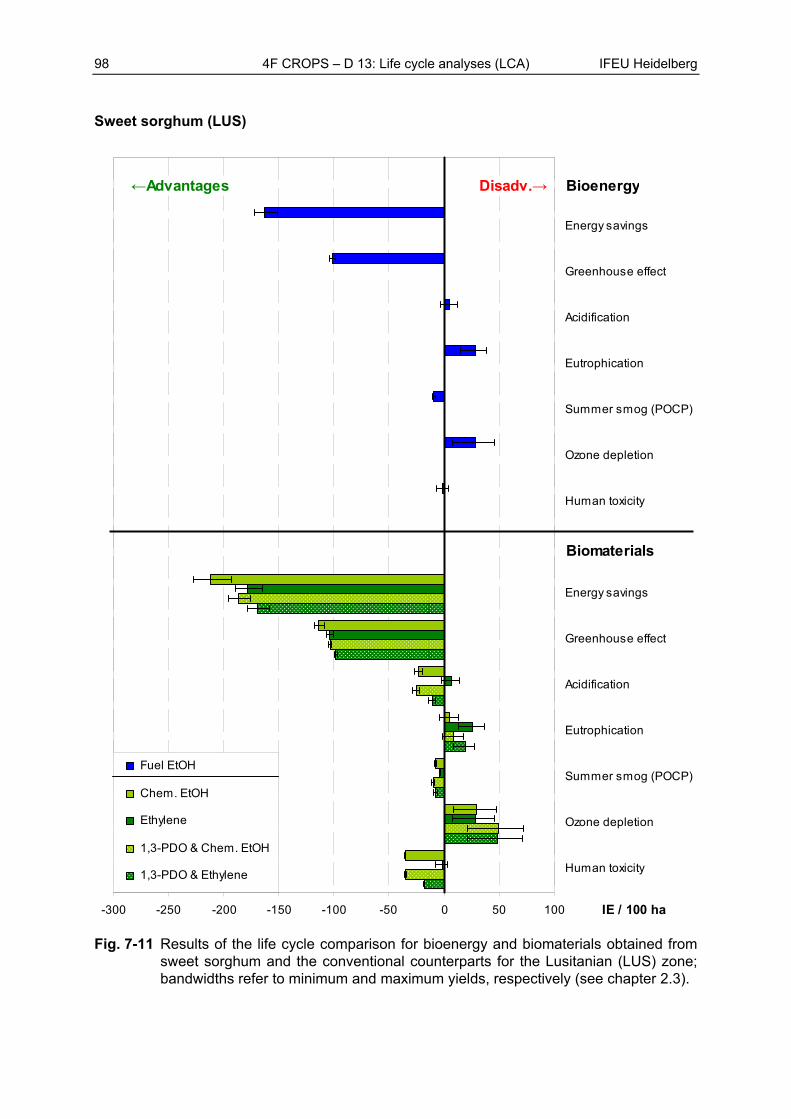
98 4F CROPS – D 13: Life cycle analyses (LCA) IFEU Heidelberg
Sweet sorghum (LUS)
-300 -250 -200 -150 -100 -50 0 50 100
Human toxicity
Ozone depletion
Summer smog (POCP)
Eutrophication
Acidification
Greenhouse effect
Energy savings
Human toxicity
Ozone depletion
Summer smog (POCP)
Eutrophication
Acidification
Greenhouse effect
Energy savings
IE / 100 ha
Fuel EtOH
Chem. EtOH
Ethylene
1,3-PDO & Chem. EtOH
1,3-PDO & Ethylene
←Advantages Disadv.→ Bioenergy
Biomaterials
Fig. 7-11 Results of the life cycle comparison for bioenergy and biomaterials obtained from sweet sorghum and the conventional counterparts for the Lusitanian (LUS) zone; bandwidths refer to minimum and maximum yields, respectively (see chapter 2.3).
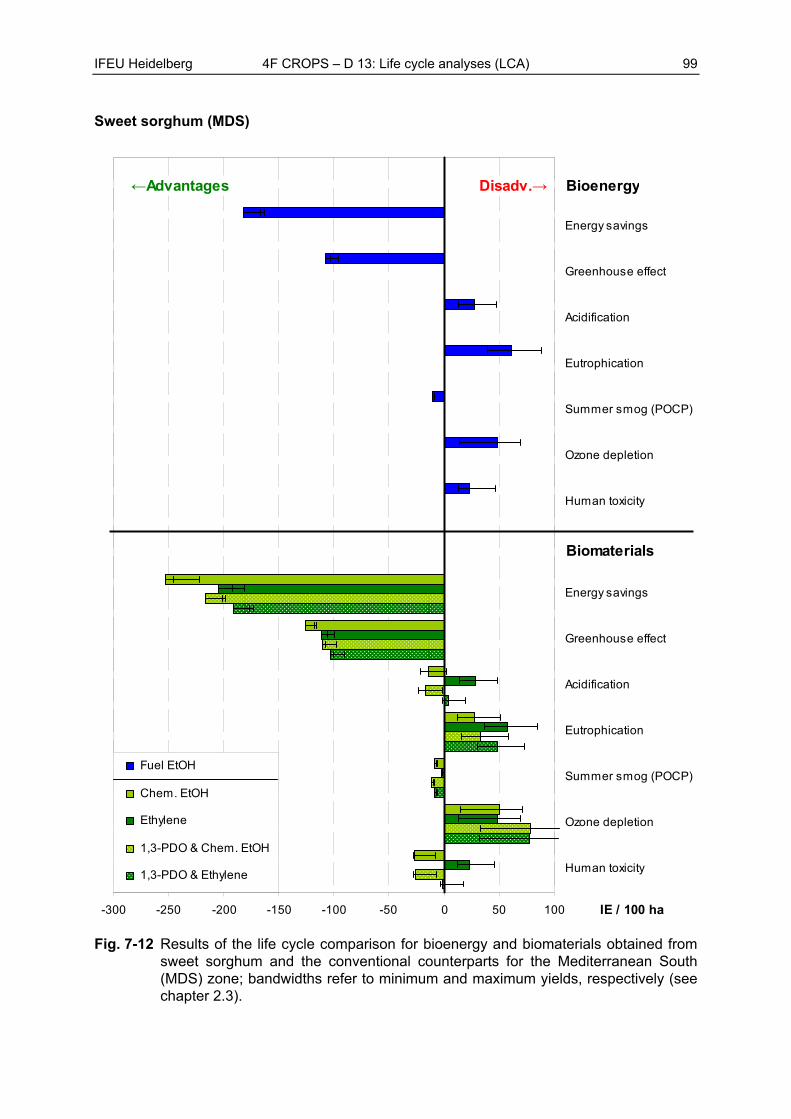
IFEU Heidelberg 4F CROPS – D 13: Life cycle analyses (LCA) 99
Sweet sorghum (MDS)
-300 -250 -200 -150 -100 -50 0 50 100
Human toxicity
Ozone depletion
Summer smog (POCP)
Eutrophication
Acidification
Greenhouse effect
Energy savings
Human toxicity
Ozone depletion
Summer smog (POCP)
Eutrophication
Acidification
Greenhouse effect
Energy savings
IE / 100 ha
Fuel EtOH
Chem. EtOH
Ethylene
1,3-PDO & Chem. EtOH
1,3-PDO & Ethylene
←Advantages Disadv.→ Bioenergy
Biomaterials
Fig. 7-12 Results of the life cycle comparison for bioenergy and biomaterials obtained from sweet sorghum and the conventional counterparts for the Mediterranean South (MDS) zone; bandwidths refer to minimum and maximum yields, respectively (see chapter 2.3).
