improving acid and aluminum tolerance in alfalfa using breeding
TRANSCRIPT
IMPROVING ACID AND ALUMINUM TOLERANCE IN ALFALFA USING BREEDING
AND GENOMICS
by
RAFAEL ALEJANDRO REYNO PODESTA
(Under the Direction of H. Roger Boerma)
ABSTRACT
Alfalfa, Medicago sativa L., is an important forage crop in the U.S. and worldwide.
However, in acid soil, its productivity and persistence dramatically decrease. Acid-soil syndrome
causes a severe toxicity that inhibits root growth and development exacerbated by Al+3
.
Breeding and genomic approaches to improve acid/Al tolerance provide new opportunities to
grow alfalfa in lands considered marginal for alfalfa growth. In this study, three different
approaches were used to identify and to evaluate acid/Al tolerance in alfalfa: (1) identification
and mapping of quantitative trait loci (QTL) associated with acid/Al tolerance, (2) evaluation of
transgenic plants over-expressing Pseudomonas aeruginosa citrate synthase (CS) and/or a gene
coding for a plasma membrane H+-ATPase from Daucus carota (DcPA1), and (3) comparison of
genetic gain for acid/Al tolerance as assessed by seedling biomass production in acidic soil
under greenhouse conditions. Single-factor analysis and interval mapping identified QTL for Al
tolerance on Altet-4 and on NECS-141 linkage groups. The phenotypic variation explained by
individual QTL ranged from 9.5 to 35.3%. Some of these QTL were detected in multiple
environments and for multiple traits while others were environment-specific. Four isogenic T2
populations, containing neither, one, or both transgenes (CS+DcPA1) were evaluated for acid/Al
tolerance. The transgenic populations containing either CS or DcPA1 or both genes showed
higher acid/Al tolerance than the non-transgenic population. No advantage of combining both
transgenes in the same genetic background was observed. Lower levels of Al in shoot tissue were
observed for the transgenic populations over the non-transgenic population. The comparison of
selection methods showed that the phenotypic recurrent selection with gridding in unlimed soil
was most effective at improving the Bulldog 805 population for shoot dry weight. This method
of selection was the most effective in terms of the resources used and the responses achieved.
Direct selection in unlimed soil resulted in increased alfalfa growth in acid and Al-rich soils
compared to selection in limed soil. The information generated in these three experiments can be
useful in improving our understanding of acid/Al tolerance in alfalfa and in developing cost-
effective and efficient methods to obtain enhanced alfalfa germplasm in the future.
INDEX WORDS: alfalfa, greenhouse soil-based assay, unlimed and limed soils, quantitative
trait loci, transgenic, citrate synthase, plasma membrane H+-ATPase,
recurrent selection, grid selection, among-within family selection
IMPROVING ACID AND ALUMINUM TOLERANCE IN ALFALFA USING BREEDING
AND GENOMICS
by
RAFAEL ALEJANDRO REYNO PODESTA
BS, Agronomy Engineer, University of the Republic, Montevideo, Uruguay, 2003
A Dissertation Submitted to the Graduate Faculty of The University of Georgia in Partial
Fulfillment of the Requirements for the Degree
DOCTOR OF PHILOSOPHY
ATHENS, GEORGIA
2012
© 2012
Rafael Alejandro Reyno Podesta
All Rights Reserved
IMPROVING ACID AND ALUMINUM TOLERANCE IN ALFALFA USING BREEDING
AND GENOMICS
by
RAFAEL ALEJANDRO REYNO PODESTA
Major Professor: H. Roger Boerma
Committee: E. Charles Brummer
Maria J. Monteros
Wayne Parrott
Brian Schwartz
Electronic Version Approved:
Maureen Grasso
Dean of the Graduate School
The University of Georgia
May 2012

iv
DEDICATION
This dissertation is dedicated to my wife Barbara, my son Emiliano, and my daughter
Julieta. Without their support, nothing would have been possible. I also want to dedicate this
work to my family members and friends in Uruguay.
v
ACKNOWLEDGEMENTS
These acknowledgements are in no particular order. I would like to acknowledge my
committee members, Drs. Charlie Brummer, Roger Boerma, Maria Monteros, Wayne Parrott,
and Brian Schwartz for their support during this process. Special thanks to Charlie Brummer for
admitting me as his student, and also for his time dedicated to guide me and advise me. I would
like to thank Dr. Dong-Man Khu my lab-mates, Xuehui Li, Yanling Wei, Muhammet Sakiroglu,
and Ananta Acharya, and the seed-lab staff who helped me to perform the experiments and the
greenhouse labor, Jonathan Markham, Donald Wood, Wesley Dean, Kurk Lance, and all the
student workers. I also want to acknowledge the UGA and Athens communities where I have
made many friends. Finally, I like to thank The Samuel Roberts Noble Foundation, The
University of Georgia, and The National Institute of Agricultural Research (Uruguay) for their
financial support.
vi
TABLE OF CONTENTS
Page
ACKNOWLEDGEMENTS .............................................................................................................v
LIST OF TABLES ....................................................................................................................... viii
LIST OF FIGURES ....................................................................................................................... xi
CHAPTER
1 INTRODUCTION AND LITERATURE REVIEW .....................................................1
Importance of alfalfa ................................................................................................1
Acid soils, aluminum toxicity, and tolerance mechanisms ......................................1
Methods to evaluate acid soil and aluminum tolerance ...........................................2
Genetic mapping for acid soil/aluminum tolerance .................................................7
Transgenesis to improve acid soil/aluminum tolerance ...........................................8
Breeding to improve acid soil/aluminum tolerance .................................................8
Overall objectives if this research ..........................................................................11
References ..............................................................................................................12
2 GENETIC MAPPING OF TOLERANCE TO ACID-SOIL SYNDROME IN
TETRAPLOID ALFALFA USING A WHOLE-PLANT ASSAY IN SOIL ..............18
Abstract ..................................................................................................................19
Introduction ............................................................................................................20
Materials and Methods ...........................................................................................22
Results ....................................................................................................................28
vii
Discussion ..............................................................................................................31
Conclusions ............................................................................................................35
References ..............................................................................................................37
3 EVALUATION OF TWO TRANSGENIC EVENTS FOR ALUMINUM
TOLERANCE IN ALFALFA................................................................................57
Abstract ..................................................................................................................58
Introduction ............................................................................................................59
Materials and Methods ...........................................................................................61
Results ....................................................................................................................68
Discussion ..............................................................................................................70
Conclusions ............................................................................................................72
References ..............................................................................................................74
4 SELECTION FOR TOLERANCE TO ACIDIC, ALUMINUM-RICH SOIL IN
ALFALFA....................................................................................................................87
Abstract ..................................................................................................................88
Introduction ............................................................................................................89
Materials and Methods ...........................................................................................92
Results……………………………………………………………………………98
Discussion ..............................................................................................................99
Conclusions and future implications ....................................................................102
References ............................................................................................................103
5 CONCLUSIONS........................................................................................................113
viii
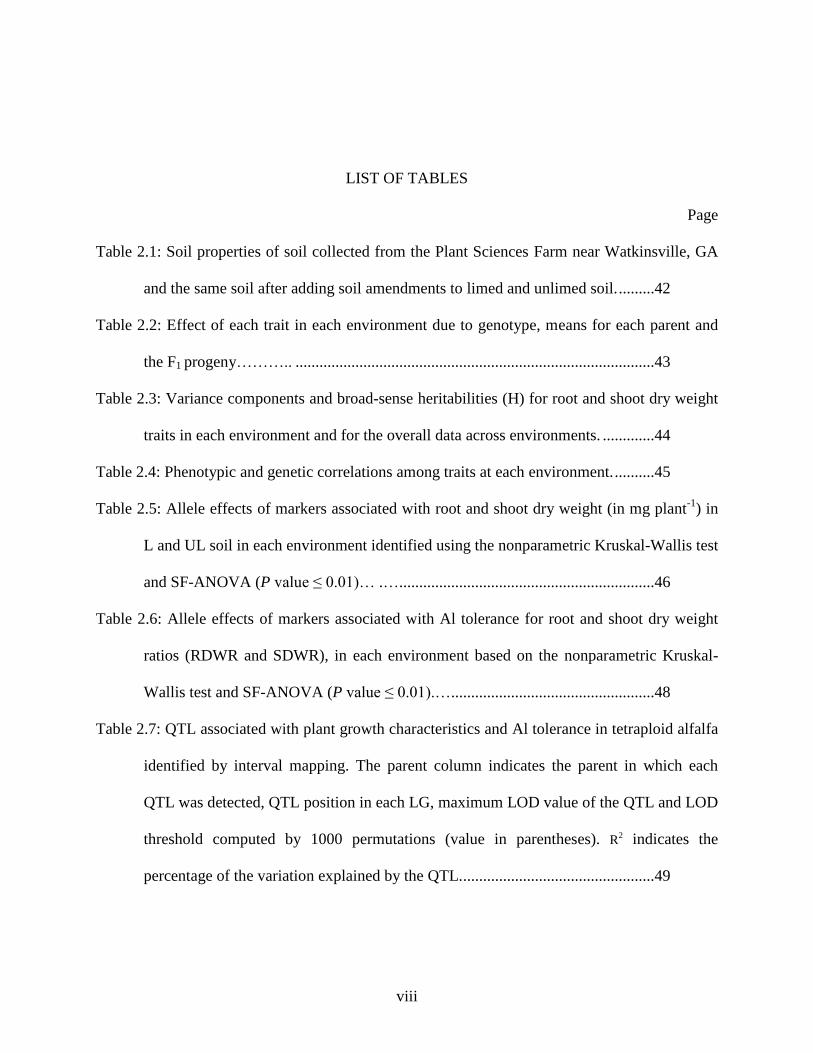
LIST OF TABLES
Page
Table 2.1: Soil properties of soil collected from the Plant Sciences Farm near Watkinsville, GA
and the same soil after adding soil amendments to limed and unlimed soil. .........42
Table 2.2: Effect of each trait in each environment due to genotype, means for each parent and
the F1 progeny……….. ..........................................................................................43
Table 2.3: Variance components and broad-sense heritabilities (H) for root and shoot dry weight
traits in each environment and for the overall data across environments. .............44
Table 2.4: Phenotypic and genetic correlations among traits at each environment. ..........45
Table 2.5: Allele effects of markers associated with root and shoot dry weight (in mg plant-1
) in
L and UL soil in each environment identified using the nonparametric Kruskal-Wallis test
and SF-ANOVA (P value ≤ 0.01)… .…................................................................46
Table 2.6: Allele effects of markers associated with Al tolerance for root and shoot dry weight
ratios (RDWR and SDWR), in each environment based on the nonparametric Kruskal-
Wallis test and SF-ANOVA (P value ≤ 0.01).…...................................................48
Table 2.7: QTL associated with plant growth characteristics and Al tolerance in tetraploid alfalfa
identified by interval mapping. The parent column indicates the parent in which each
QTL was detected, QTL position in each LG, maximum LOD value of the QTL and LOD
threshold computed by 1000 permutations (value in parentheses). R2 indicates the
percentage of the variation explained by the QTL. ................................................49
ix
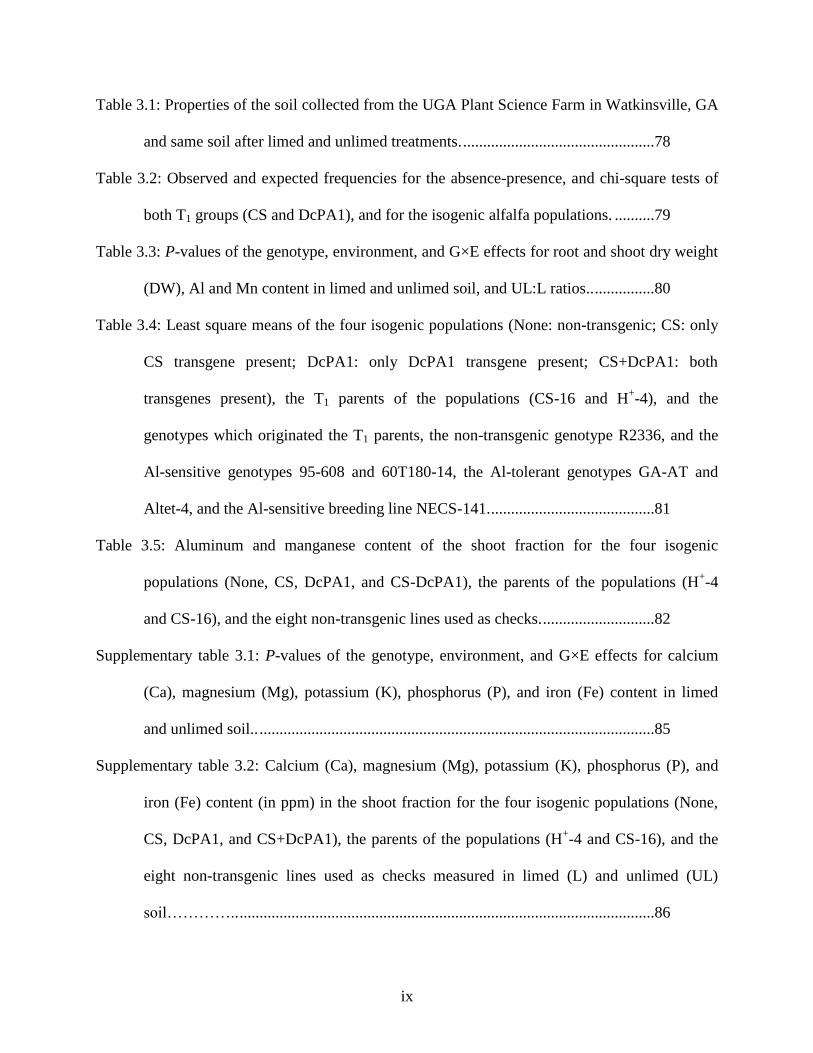
Table 3.1: Properties of the soil collected from the UGA Plant Science Farm in Watkinsville, GA
and same soil after limed and unlimed treatments. ................................................78
Table 3.2: Observed and expected frequencies for the absence-presence, and chi-square tests of
both T1 groups (CS and DcPA1), and for the isogenic alfalfa populations. ..........79
Table 3.3: P-values of the genotype, environment, and G×E effects for root and shoot dry weight
(DW), Al and Mn content in limed and unlimed soil, and UL:L ratios.. ...............80
Table 3.4: Least square means of the four isogenic populations (None: non-transgenic; CS: only
CS transgene present; DcPA1: only DcPA1 transgene present; CS+DcPA1: both
transgenes present), the T1 parents of the populations (CS-16 and H+-4), and the
genotypes which originated the T1 parents, the non-transgenic genotype R2336, and the
Al-sensitive genotypes 95-608 and 60T180-14, the Al-tolerant genotypes GA-AT and
Altet-4, and the Al-sensitive breeding line NECS-141. .........................................81
Table 3.5: Aluminum and manganese content of the shoot fraction for the four isogenic
populations (None, CS, DcPA1, and CS-DcPA1), the parents of the populations (H+-4
and CS-16), and the eight non-transgenic lines used as checks. ............................82
Supplementary table 3.1: P-values of the genotype, environment, and G×E effects for calcium
(Ca), magnesium (Mg), potassium (K), phosphorus (P), and iron (Fe) content in limed
and unlimed soil.. ...................................................................................................85
Supplementary table 3.2: Calcium (Ca), magnesium (Mg), potassium (K), phosphorus (P), and
iron (Fe) content (in ppm) in the shoot fraction for the four isogenic populations (None,
CS, DcPA1, and CS+DcPA1), the parents of the populations (H+-4 and CS-16), and the
eight non-transgenic lines used as checks measured in limed (L) and unlimed (UL)
soil………….. ........................................................................................................86
x
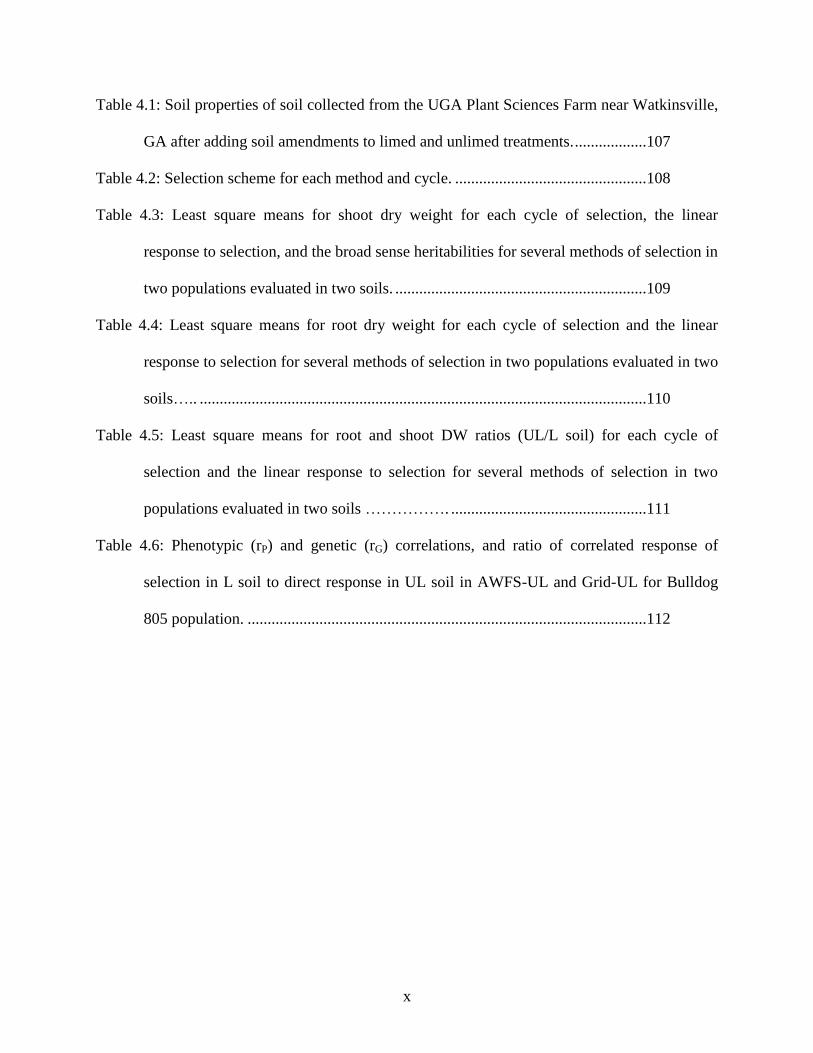
Table 4.1: Soil properties of soil collected from the UGA Plant Sciences Farm near Watkinsville,
GA after adding soil amendments to limed and unlimed treatments. ..................107
Table 4.2: Selection scheme for each method and cycle. ................................................108
Table 4.3: Least square means for shoot dry weight for each cycle of selection, the linear
response to selection, and the broad sense heritabilities for several methods of selection in
two populations evaluated in two soils. ...............................................................109
Table 4.4: Least square means for root dry weight for each cycle of selection and the linear
response to selection for several methods of selection in two populations evaluated in two
soils….. ................................................................................................................110
Table 4.5: Least square means for root and shoot DW ratios (UL/L soil) for each cycle of
selection and the linear response to selection for several methods of selection in two
populations evaluated in two soils ……………. .................................................111
Table 4.6: Phenotypic (rP) and genetic (rG) correlations, and ratio of correlated response of
selection in L soil to direct response in UL soil in AWFS-UL and Grid-UL for Bulldog
805 population. ....................................................................................................112
xi
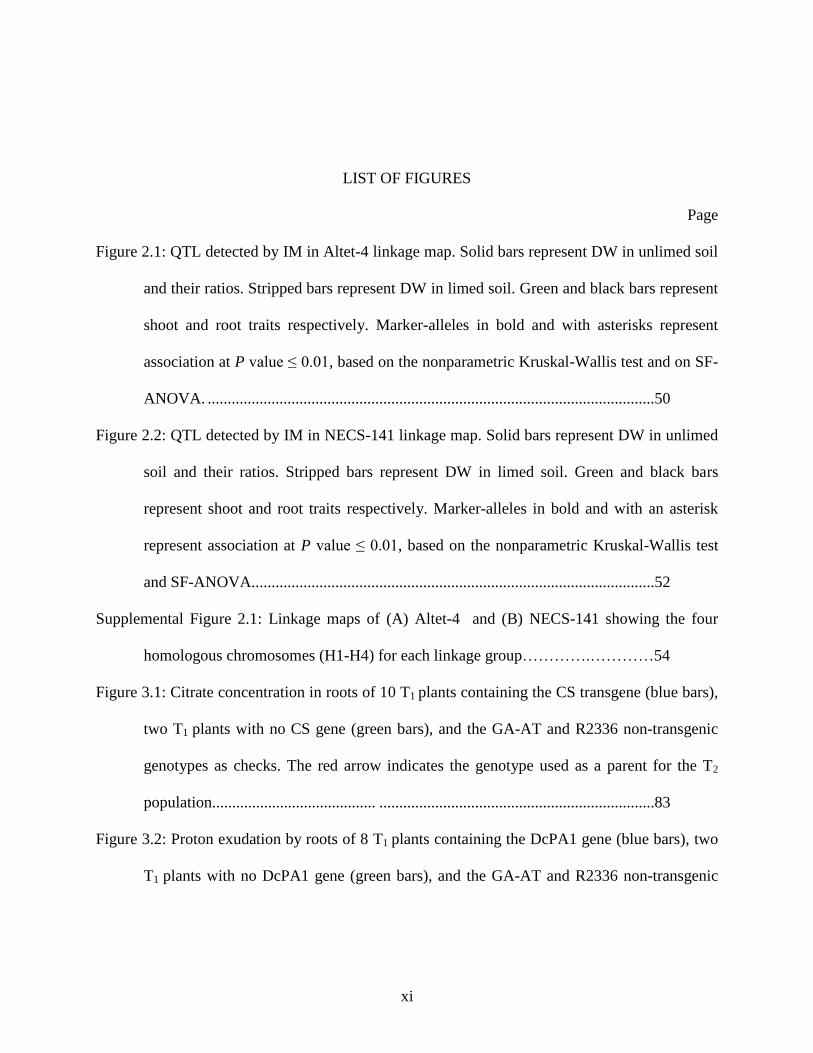
LIST OF FIGURES
Page
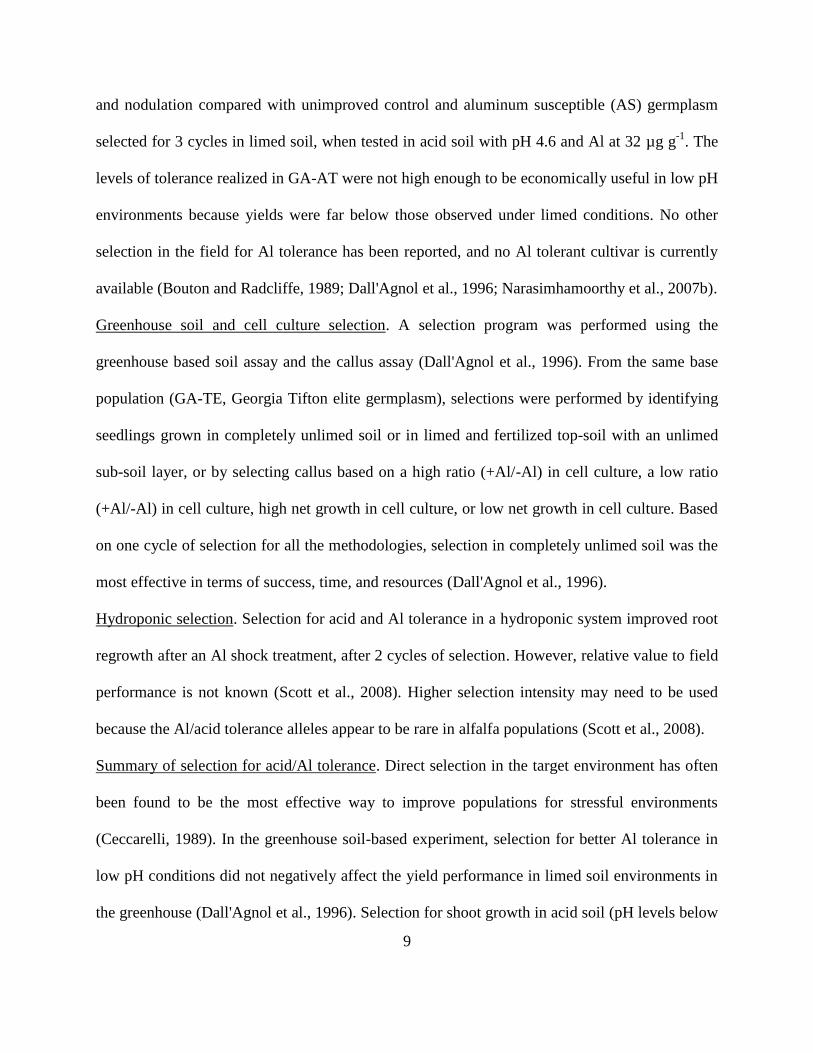
Figure 2.1: QTL detected by IM in Altet-4 linkage map. Solid bars represent DW in unlimed soil
and their ratios. Stripped bars represent DW in limed soil. Green and black bars represent
shoot and root traits respectively. Marker-alleles in bold and with asterisks represent
association at P value ≤ 0.01, based on the nonparametric Kruskal-Wallis test and on SF-
ANOVA. ................................................................................................................50
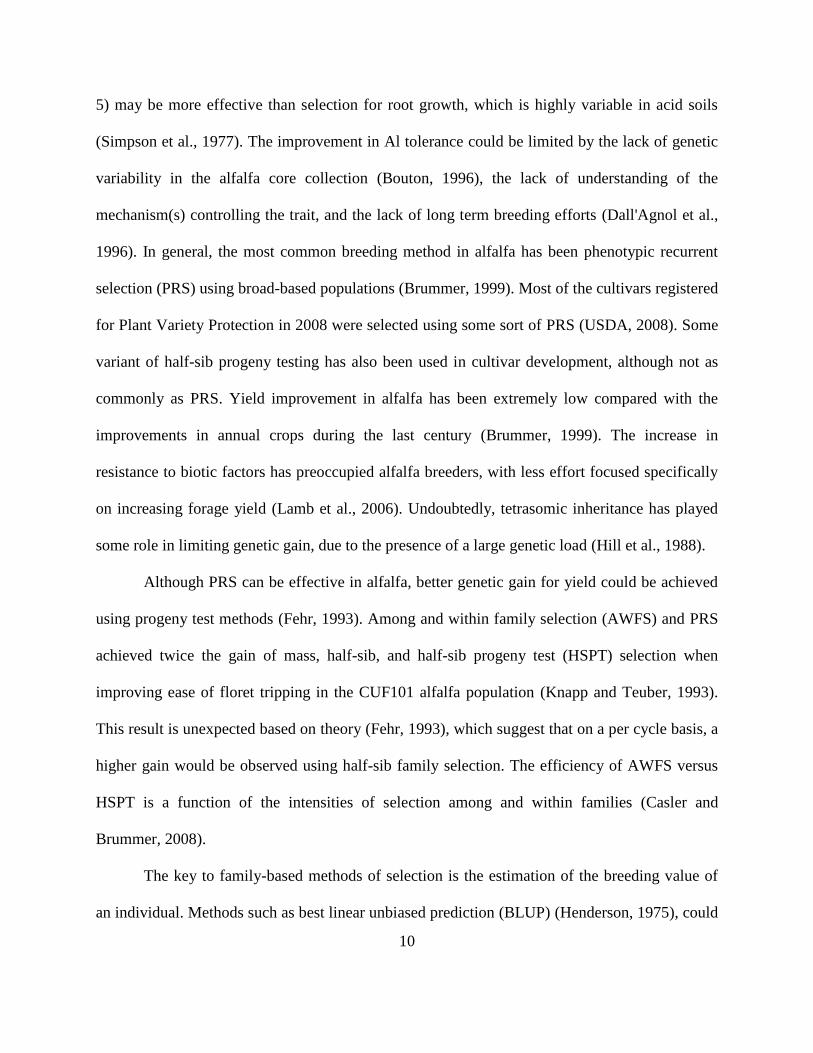
Figure 2.2: QTL detected by IM in NECS-141 linkage map. Solid bars represent DW in unlimed
soil and their ratios. Stripped bars represent DW in limed soil. Green and black bars
represent shoot and root traits respectively. Marker-alleles in bold and with an asterisk
represent association at P value ≤ 0.01, based on the nonparametric Kruskal-Wallis test
and SF-ANOVA.....................................................................................................52
Supplemental Figure 2.1: Linkage maps of (A) Altet-4 and (B) NECS-141 showing the four
homologous chromosomes (H1-H4) for each linkage group………….…………54
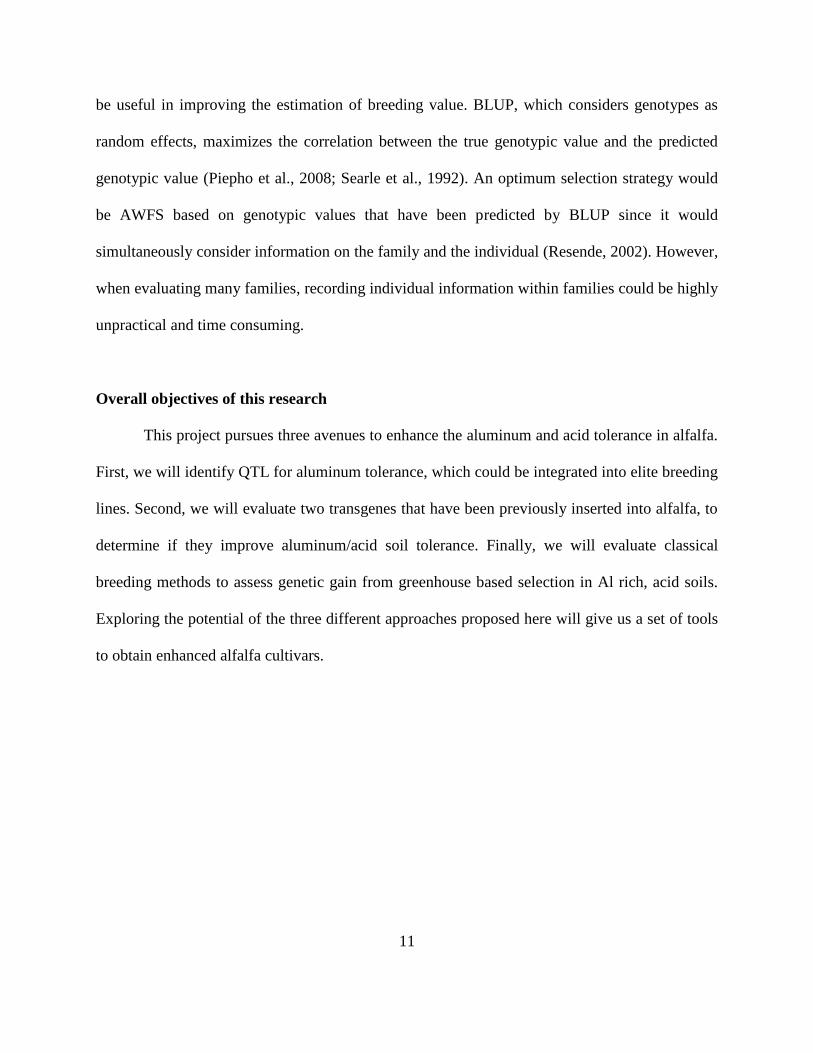
Figure 3.1: Citrate concentration in roots of 10 T1 plants containing the CS transgene (blue bars),
two T1 plants with no CS gene (green bars), and the GA-AT and R2336 non-transgenic
genotypes as checks. The red arrow indicates the genotype used as a parent for the T2
population......................................... .....................................................................83
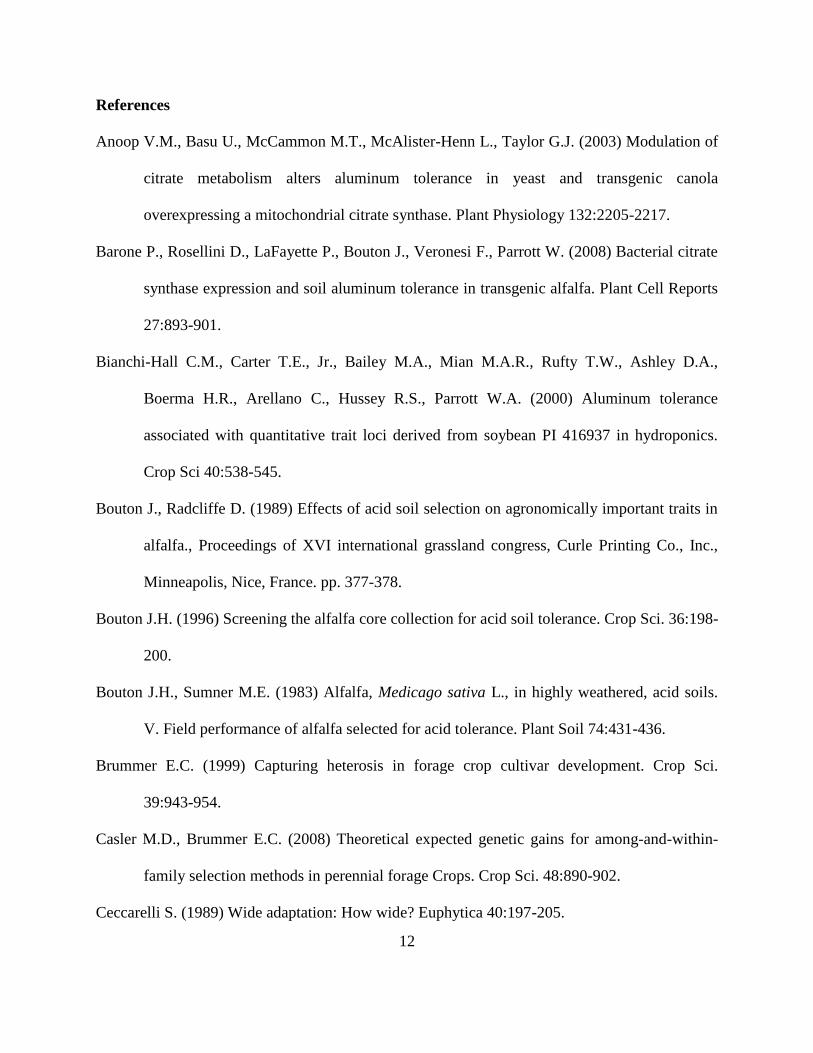
Figure 3.2: Proton exudation by roots of 8 T1 plants containing the DcPA1 gene (blue bars), two
T1 plants with no DcPA1 gene (green bars), and the GA-AT and R2336 non-transgenic

xii
genotypes as checks. The red arrow indicates the genotype used as a parent for the T2
population ..............................................................................................................84
1
CHAPTER 1
INTRODUCTION AND LITERATURE REVIEW
Importance of alfalfa
Alfalfa, Medicago sativa L., is one of the most important forage legumes worldwide and
is the fourth most important crop in U.S. agriculture in terms of both farm gate value and
hectares under cultivation (USDA, 2009). Alfalfa is successfully cultivated throughout most of
the country, under very different management and environmental conditions, ranging from
intensively irrigated alfalfa in the Southwest, to dryland cultivation in the northern Great Plains.
Commercial cultivars have been developed to accommodate specific growing conditions
throughout the country.
Acid soils, aluminum toxicity, and tolerance mechanisms
Acid soils are a limitation for alfalfa cultivation in many parts of the world, including the
southeastern USA (Bouton and Sumner, 1983b). Under low pH soil conditions, aluminum (Al)
and manganese (Mn) become soluble causing a severe toxicity that inhibits root growth and
development (Kochian et al., 2004a). Two different types of Al tolerance mechanisms exist;
those that exclude Al from the root apex through organic acid exudation and those that allow the
plant to tolerate Al accumulation in roots and shoots (Kochian et al., 2004a). The predominant
mechanism varies among and within species (Kochian et al., 2005). Studies in barley, wheat,
sorghum, rye, soybean, rice, and Arabidopsis indicate that aluminum tolerance is controlled by
2
few genes of large effect, but other studies, sometimes in the same species, have reported that Al
tolerance is a more complex trait (Kochian et al., 2005).
Soil acidity can be ameliorated by liming, effectively eliminating Al toxicity in the plow
layer (Foy, 1992) but not in the subsoil (Bouton and Sumner, 1983b). The increased costs of lime
and fertilizer have increased interest in identifying genetic tolerance to acidic conditions (Bouton
and Sumner, 1983b). Genetic selection for acid soil tolerance can increase alfalfa productivity
and reduce production costs, with previous experiments showing moderate success (Bouton and
Radcliffe, 1989; Bouton, 1996).
Methods to evaluate acid soil and aluminum tolerance
In Medicago, various methods have been used to measure Al tolerance some of which are
discussed individually below.
Callus culture. Parrott and Bouton (1990) developed a tissue culture bioassay in which callus
growth on an aluminum toxic cell culture medium relative to growth on media without Al was
used as a measure of Al tolerance. The method consists of inducing callus from seedling
hypocotyls on modified Blaydes medium, and splitting the resulting callus 30 d after induction
into equal pieces that are transferred to separate plates with and without aluminum. The calli are
transferred onto fresh media every 15 d for 8 wk and weighed at each transfer. The technique
proved useful to distinguish between an acid-tolerant (AT) and an acid-sensitive (AS) M. sativa
germplasm (Parrott and Bouton, 1990). The limitation of the method is that the number of
genotypes that can be evaluated is limited because of the time and resources needed. Al tolerance
was also observed at the callus level in tomato (Meredith, 1978) and sorghum (Smith et al.,
1983).
3
Soil “cup test”. This assay was initially developed to assess acid tolerance of the alfalfa core
collection (Bouton, 1996). The method evaluates seedlings grown in 720-ml Styrofoam cups
filled with 930 g of Cecil sandy clay loam soil. The method consists of the following treatments:
(1) an unlimed treatment with 730 g of unlimed and unfertilized soil overlaid with an upper layer
of 200 g of the same soil limed to a near neutral pH, and (2) a limed treatment in which the entire
cup is filled with soil amended with lime to increase the pH to near 7.0. The cups are watered by
weight until 90% of their field capacity with deionized water to prevent leaching and soil
saturation, which causes increased acidic conditions and Mn toxicity (Foy and Brown, 1964a;
Sumner et al., 1986). The seedlings are allowed to grow for 8 wk at which time the plants are
destructively harvested. Shoots are separated from roots at the soil surface. The intact cup is then
cut at the point between soil types in the unlimed treatment and the same level is used for the
limed treatment. Roots from both portions (i.e., the top is limed in both treatments; the bottom is
either limed or unlimed) are then washed free of soil, dried, and weighed. This procedure was
also used as a screening method to develop alfalfa germplasm tolerant of acid and aluminum
toxic soils (Dall'Agnol et al., 1996). Aluminum tolerance is assessed as the total root growth,
total shoot growth, and the ratio between growths in unlimed vs. limed soil (Bouton, 1996;
Dall'Agnol et al., 1996; Narasimhamoorthy et al., 2007b; Sledge et al., 2002). In the soil assay,
relative growth was found to be a poor indicator of Al tolerance, as genotypes with poor vigor
and limited growth in limed, fertilized soil, could have high relative root and shoot growth
(Dall'Agnol et al., 1996). In addition, the ratios show very low narrow sense heritability.
Therefore, root growth in unlimed soil is considered a more effective estimate of Al tolerance.
The soil assay was also used with rooted stems and could successfully discriminate among
genotypes differing in Al tolerance (Sledge et al., 2002). The soil based assay showed greater
4
discriminating power among genotypes than either hydroponic or root staining methods
(Narasimhamoorthy et al., 2007b). The soil assay requires close monitoring of water content by
weight or by electronic sensors, which is highly time consuming, and the cups themselves are
rather large. As a consequence, the soil assay is low throughput and thus limited in the number of
entries that are able to be evaluated simultaneously. For example, evaluating mapping
populations of 200 individuals is almost impossible with this method.
Hydroponic systems. Hydroponic screening techniques have been extensively used to evaluate
Al tolerance in many species, including soybean, rice, wheat, and maize (Bianchi-Hall et al.,
2000; Nguyen et al., 2002; Ninamango-Cárdenas et al., 2003; Xue et al., 2008; Zhou et al.,
2007). These evaluation systems have also been used to assess Al responses in alfalfa and
Medicago truncatula (Barone et al., 2008; Narasimhamoorthy et al., 2007b; Scott et al., 2008;
Sledge et al., 2005; Zhang et al., 2007). The method evaluates seedlings grown on floating
devices for short periods of time, from 5 to 7 d. The general method consists of growing the
seedlings initially in an Al-free solution and then either transferring them to new solutions
containing Al or placing them in a shock solution with high Al content for 1 d before growing in
Al solutions with a more moderate concentration. The pH and Al concentration in the solution
are monitored and adjusted every day to maintain constant levels. The length of roots at the end
time point serves as the measure of Al tolerance. In some cases, the Al concentration in the root
may be estimated by root staining (Narasimhamoorthy et al., 2007b; Scott et al., 2008).
This methodology is rapid, in terms of time, and hence able to screen large numbers of
accessions or genotypes (Narasimhamoorthy et al., 2007b; Scott et al., 2008), and it has some
advantages compared to soil assays for measuring the effect of added Al (Sledge et al., 2005).
However, this methodology has not shown high correlations with soil assays (Narasimhamoorthy
5
et al., 2007b). General combining ability was observed for root length growth, suggesting that
recurrent selection would be successful in improving root length in Al solution (Zhang et al.,
2007), but whether this is related to enhanced Al tolerance in the field remains unclear. Root
length in Al solution has been increased in populations selected using the hydroponic system
(Scott et al., 2008).
Root staining. This method estimates the amount of Al present in root tips based on stains which
react with the Al absorbed and accumulated by the plants. Many stains can be used, but the most
commonly used have been lumogallion and hematoxylin (Barone et al., 2008). Plants are
exposed to Al for short a period, root tips are sampled and sectioned longitudinally, and root
sections are washed with buffer solutions, and stained. Al forms a complex with the stain
solution reflecting a fluorescence color. Digital images are taken and the quantification of the
stain in the roots is achieved by measuring the intensity of the fluorescence. The more intense the
fluorescence, the more Al is accumulated in the root tips, and hence, the more Al sensitive the
plant. The absence of color indicates that organic acids (citrate or malate) has chelated the Al and
prevented its accumulation in the root apices. This technique has been used in wheat, barley, M.
truncatula, and alfalfa to identify superior genotypes related to their Al tolerance (Barone et al.,
2008; Delhaize et al., 2004; Narasimhamoorthy et al., 2007b; Ryan et al., 1995).
Genetic engineered barley genotypes were successfully discriminated based on this
technique (Delhaize et al., 2004). A modified technique, staining root tips with 0.1% solution of
Eriochome cyanine R, was used to detect Al accumulation in transformed wheat genotypes
(Ryan et al., 1995). Root staining was capable of identifying genotypes with higher tolerance to
Al, when analyzing 15 transgenic alfalfa plants transformed for citrate synthase (Barone et al.,
2008). A wide range in fluorescence between the most sensitive and the most tolerant accessions
6
was found using seedlings of M. truncatula (Narasimhamoorthy et al., 2007b). Since this
technique correlated well with hydroponics, it could be an alternative to screen for Al tolerance,
but it is time-consuming and labor intensive (Narasimhamoorthy et al., 2007b). No consistency
was found between root staining methodologies and the soil based assay (Barone et al., 2008).
The value of root staining to assess Al tolerance is thus not clear due to its highly variable results
and inconsistency with soil evaluations.
Whole plant culture. Screening methods which can discriminate between the effects of acidity
and Al on root growth and development would provide a better understanding of the process
involved in Al/acid tolerance. A new methodology has been described to differentiate between
these two factors using rooted stems grown in a CaCl2 culture media containing 1% Gelrite (Khu
et al., 2012). Plants can be grown under neutral pH, acidic pH without Al, or acidic pH with Al.
The genotypes are grown for 18 d, at which time the plants are harvested and the root length,
lateral root number, and root branching are quantified using the winRHIZO software (Regent
Instruments, Québec, Canada). In addition, absolute root growth and ratio of roots growing in
Al-containing media and Al-free media are determined to quantify the Al tolerance.
Summary of methods. All these methods are capable of identifying variation between and within
populations. However, their utility for use in selection programs needs further analysis, since
they have shown contradictory results when evaluated on the same genotypes. In general, the
correlations between the culture (tissue or hydroponics) or root staining assays and soil assays
are low. Although we assume that the soil assay may be most relevant for field conditions, we do
not know how selection using any of these methods relates to progress for Al tolerance in the
field.
7
Genetic mapping for acid soil/aluminum tolerance
The identification and evaluation of quantitative trait loci (QTL) associated with traits of
interest enables the effective introgression of favorable alleles from any source into elite
breeding germplasm (Bernardo, 2002). Aluminum tolerance QTL have been identified in rice
(Nguyen et al., 2002; Xue et al., 2008), wheat (Zhou et al., 2007), maize (Ninamango-Cárdenas
et al., 2003), soybean (Bianchi-Hall et al., 2000), and Arabidopsis thaliana (Ikka et al., 2008a)
by phenotyping in nutrient solutions with different concentrations of Al+3
. These studies have
identified three (Bianchi-Hall et al., 2000) to nine (Nguyen et al., 2002) QTL associated with Al
tolerance. One QTL in a wheat doubled haploid mapping population explained 49% of the
phenotypic variation in the population (Navakode et al., 2009).
Aluminum tolerance QTLs based on the callus assay were indentified in diploid alfalfa F2
populations and confirmed in a backcross population using both callus and soil assays (Sledge et
al., 2002). The effects of marker alleles were consistent in both F2 and backcross callus studies.
In addition, two alleles that had not been confirmed in the callus assay of the backcross
population were identified in the soil study. More information is needed about the regions
surrounding the QTL to precisely locate them on the linkage group and estimate their effects. A
further mapping study using the backcross population first evaluated by Sledge et al. (2002)
added 162 EST-SSR marker loci to the population and identified QTL for Al tolerance based on
the callus assay on linkage groups LG 1, LG 2, LG 3, LG 4, and LG 5 (Narasimhamoorthy et al.,
2007a). A major QTL explained 37.9% of the variation for Al tolerance in this population.
8
Transgenesis to improve acid soil/aluminum tolerance
The exudation of organic acids by root tips plays an important role in conferring Al
tolerance to plants, and Al tolerant plants can secrete these acids in response to Al in the
rhizosphere (Barone et al., 2008; Delhaize et al., 1993a). The Al+3
present in acid soil forms a
chelate in the presence of organic acids such as citrate, malate, and oxalate (Barone et al., 2008;
Kochian et al., 2004a). Transgenic plants over-expressing organic acids have shown improved Al
tolerance in several crops, including tobacco and papaya (de la Fuente et al., 1997) and canola
(Anoop et al., 2003). The over-expression of citrate synthase was also introduced into alfalfa
(Barone et al., 2008).
A second transgenic approach to improving Al tolerance is to introgress organic acid
transporters (Kochian et al., 2004a). This approach has been effective in barley (Hordeum
vulgare), a very Al-sensitive cereal crop (Delhaize et al., 2004). The DcPA1 gene coding for a
plasma membrane H+ATPase from Daucus carota was shown to play a role in the proton
exudation (Ohno et al., 2004). The optimum Al tolerance may result from a strategy that
integrates the organic acid over-expression with a gene encoding the corresponding organic acid
transporter (Barone et al., 2008).
Breeding to improve acid soil/aluminum tolerance
Field based selection. In the field, aluminum or acid soil tolerance is manifested as higher
biomass yield in tolerant relative to sensitive germplasm when grown in acidic and Al-rich soils.
Recurrent selection based on field performance was used to develop a tolerant germplasm,
Georgia - Acid Tolerant (GA-AT), derived from U.S. cultivars (Bouton and Radcliffe, 1989).
GA-AT was the result of 3 cycles of selection in acid soil and showed enhanced top-root growth
9
and nodulation compared with unimproved control and aluminum susceptible (AS) germplasm
selected for 3 cycles in limed soil, when tested in acid soil with pH 4.6 and Al at 32 µg g-1
. The
levels of tolerance realized in GA-AT were not high enough to be economically useful in low pH
environments because yields were far below those observed under limed conditions. No other
selection in the field for Al tolerance has been reported, and no Al tolerant cultivar is currently
available (Bouton and Radcliffe, 1989; Dall'Agnol et al., 1996; Narasimhamoorthy et al., 2007b).
Greenhouse soil and cell culture selection. A selection program was performed using the
greenhouse based soil assay and the callus assay (Dall'Agnol et al., 1996). From the same base
population (GA-TE, Georgia Tifton elite germplasm), selections were performed by identifying
seedlings grown in completely unlimed soil or in limed and fertilized top-soil with an unlimed
sub-soil layer, or by selecting callus based on a high ratio (+Al/-Al) in cell culture, a low ratio
(+Al/-Al) in cell culture, high net growth in cell culture, or low net growth in cell culture. Based
on one cycle of selection for all the methodologies, selection in completely unlimed soil was the
most effective in terms of success, time, and resources (Dall'Agnol et al., 1996).
Hydroponic selection. Selection for acid and Al tolerance in a hydroponic system improved root
regrowth after an Al shock treatment, after 2 cycles of selection. However, relative value to field
performance is not known (Scott et al., 2008). Higher selection intensity may need to be used
because the Al/acid tolerance alleles appear to be rare in alfalfa populations (Scott et al., 2008).
Summary of selection for acid/Al tolerance. Direct selection in the target environment has often
been found to be the most effective way to improve populations for stressful environments
(Ceccarelli, 1989). In the greenhouse soil-based experiment, selection for better Al tolerance in
low pH conditions did not negatively affect the yield performance in limed soil environments in
the greenhouse (Dall'Agnol et al., 1996). Selection for shoot growth in acid soil (pH levels below
10
5) may be more effective than selection for root growth, which is highly variable in acid soils
(Simpson et al., 1977). The improvement in Al tolerance could be limited by the lack of genetic
variability in the alfalfa core collection (Bouton, 1996), the lack of understanding of the
mechanism(s) controlling the trait, and the lack of long term breeding efforts (Dall'Agnol et al.,
1996). In general, the most common breeding method in alfalfa has been phenotypic recurrent
selection (PRS) using broad-based populations (Brummer, 1999). Most of the cultivars registered
for Plant Variety Protection in 2008 were selected using some sort of PRS (USDA, 2008). Some
variant of half-sib progeny testing has also been used in cultivar development, although not as
commonly as PRS. Yield improvement in alfalfa has been extremely low compared with the
improvements in annual crops during the last century (Brummer, 1999). The increase in
resistance to biotic factors has preoccupied alfalfa breeders, with less effort focused specifically
on increasing forage yield (Lamb et al., 2006). Undoubtedly, tetrasomic inheritance has played
some role in limiting genetic gain, due to the presence of a large genetic load (Hill et al., 1988).
Although PRS can be effective in alfalfa, better genetic gain for yield could be achieved
using progeny test methods (Fehr, 1993). Among and within family selection (AWFS) and PRS
achieved twice the gain of mass, half-sib, and half-sib progeny test (HSPT) selection when
improving ease of floret tripping in the CUF101 alfalfa population (Knapp and Teuber, 1993).
This result is unexpected based on theory (Fehr, 1993), which suggest that on a per cycle basis, a
higher gain would be observed using half-sib family selection. The efficiency of AWFS versus
HSPT is a function of the intensities of selection among and within families (Casler and
Brummer, 2008).
The key to family-based methods of selection is the estimation of the breeding value of
an individual. Methods such as best linear unbiased prediction (BLUP) (Henderson, 1975), could
11
be useful in improving the estimation of breeding value. BLUP, which considers genotypes as
random effects, maximizes the correlation between the true genotypic value and the predicted
genotypic value (Piepho et al., 2008; Searle et al., 1992). An optimum selection strategy would
be AWFS based on genotypic values that have been predicted by BLUP since it would
simultaneously consider information on the family and the individual (Resende, 2002). However,
when evaluating many families, recording individual information within families could be highly
unpractical and time consuming.
Overall objectives of this research
This project pursues three avenues to enhance the aluminum and acid tolerance in alfalfa.
First, we will identify QTL for aluminum tolerance, which could be integrated into elite breeding
lines. Second, we will evaluate two transgenes that have been previously inserted into alfalfa, to
determine if they improve aluminum/acid soil tolerance. Finally, we will evaluate classical
breeding methods to assess genetic gain from greenhouse based selection in Al rich, acid soils.
Exploring the potential of the three different approaches proposed here will give us a set of tools
to obtain enhanced alfalfa cultivars.
12
References
Anoop V.M., Basu U., McCammon M.T., McAlister-Henn L., Taylor G.J. (2003) Modulation of
citrate metabolism alters aluminum tolerance in yeast and transgenic canola
overexpressing a mitochondrial citrate synthase. Plant Physiology 132:2205-2217.
Barone P., Rosellini D., LaFayette P., Bouton J., Veronesi F., Parrott W. (2008) Bacterial citrate
synthase expression and soil aluminum tolerance in transgenic alfalfa. Plant Cell Reports
27:893-901.
Bianchi-Hall C.M., Carter T.E., Jr., Bailey M.A., Mian M.A.R., Rufty T.W., Ashley D.A.,
Boerma H.R., Arellano C., Hussey R.S., Parrott W.A. (2000) Aluminum tolerance
associated with quantitative trait loci derived from soybean PI 416937 in hydroponics.
Crop Sci 40:538-545.
Bouton J., Radcliffe D. (1989) Effects of acid soil selection on agronomically important traits in
alfalfa., Proceedings of XVI international grassland congress, Curle Printing Co., Inc.,
Minneapolis, Nice, France. pp. 377-378.
Bouton J.H. (1996) Screening the alfalfa core collection for acid soil tolerance. Crop Sci. 36:198-
200.
Bouton J.H., Sumner M.E. (1983) Alfalfa, Medicago sativa L., in highly weathered, acid soils.
V. Field performance of alfalfa selected for acid tolerance. Plant Soil 74:431-436.
Brummer E.C. (1999) Capturing heterosis in forage crop cultivar development. Crop Sci.
39:943-954.
Casler M.D., Brummer E.C. (2008) Theoretical expected genetic gains for among-and-within-
family selection methods in perennial forage Crops. Crop Sci. 48:890-902.
Ceccarelli S. (1989) Wide adaptation: How wide? Euphytica 40:197-205.
13
Dall'Agnol M., Bouton J.H., Parrott W.A. (1996) Screening methods to develop alfalfa
germplasms tolerant of acid, aluminum toxic soils. Crop Science 36:64-70.
de la Fuente J.M., Ramirez-Rodriguez V., Cabrera-Ponce J.L., Herrera-Estrella L. (1997)
Aluminum tolerance in transgenic plants by alteration of citrate synthesis. Science
276:1566-1568.
Delhaize E., Ryan P.R., Randall P.J. (1993) Aluminum tolerance in wheat (Triticum aestivum
L.). 2. Aluminum-stimulated excretion of malic acid from root apices. Plant Physiol
103:695-702.
Delhaize E., Ryan P.R., Hebb D.M., Yamamoto Y., Sasaki T., Matsumoto H. (2004) Engineering
high-level aluminum tolerance in barley with the ALMT1 gene. Proc Natl Acad Sci USA
101:15249-15254.
Fehr W. (1993) Principles of cultivar development. I. Theory and technique Macmillian Publ,
New York.
Foy C.D. (1992) Soil chemical factors limiting plants root. Adv. Soil Sci. 19:97-149.
Foy C.D., Brown J.C. (1964) Toxic factors in acid soils: II. Differential aluminum tolerance of
plant species. Soil Sci Soc Am Proc 28:27-32.
Henderson C.R. (1975) Best linear unbiased estimation and prediction under a selection model.
Biometrics 31:423-447.
Hill R.J., Shenk J., Barnes R. (1988) Breeding for yield and quality, in: A. Hanson, et al. (Eds.),
Alfalfa and alfalfa improvement, Agronomy Monograph. pp. 809-825.
Ikka T., Kobayashi Y., Tazib T., Koyama H. (2008) Aluminum-tolerance QTL in
Columbia/Kashmir inbred population of Arabidopsis thaliana is not associated with
aluminum-responsive malate excretion. Plant Science 175:533-538.
14
Khu D.-M., Reyno R., Brummer E.C., Monteros M.J. (2012) Screening methods for aluminum
tolerance in alfalfa. Crop Sci. 52:161-167.
Knapp E.E., Teuber L.R. (1993) Outcrossing rates of alfalfa populations differing in ease of
floret tripping. Crop Sci. 33:1181-1185.
Kochian L.V., Hoekenga O.A., Pineros M.A. (2004) How do crop plants tolerate acid soils? -
Mechanisms of aluminum tolerance and phosphorous efficiency. Annu Rev Plant Biol
55:459-493.
Kochian L.V., Pineros M.A., Hoekenga O.A. (2005) The physiology, genetics and molecular
biology of plant aluminum resistance and toxicity. Plant and Soil 274:175-195.
Lamb J.F.S., Sheaffer C.C., Rhodes L.H., Sulc R.M., Undersander D.J., Brummer E.C. (2006)
Five decades of alfalfa cultivar improvement. Crop Sci. 46:902-909.
Meredith C.P. (1978) Selection and characterization of aluminum-resistant variants from tomato
cell cultures. Plant Science Letters 12:25-34.
Narasimhamoorthy B., Bouton J.H., Olsen K.M., Sledge M.K. (2007a) Quantitative trait loci and
candidate gene mapping of aluminum tolerance in diploid alfalfa. Theor Appl Genet
114:901-913.
Narasimhamoorthy B., Blancaflor E.B., Bouton J.H., Payton M.E., Sledge M.K. (2007b) A
comparison of hydroponics, soil, and root staining methods for evaluation of aluminum
tolerance in Medicago truncatula (barrel medic) germplasm. Crop Sci 47:321-328.
Navakode S., Weidner A., Lohwasser U., Röder M., Börner A. (2009) Molecular mapping of
quantitative trait loci (QTLs) controlling aluminium tolerance in bread wheat. Euphytica
166:283-290.
15
Nguyen V.N., Nguyen B.N., Sarkarung S.S., Martinez C.M., Paterson A.P., Nguyen H.N. (2002)
Mapping of genes controlling aluminum tolerance in rice: comparison of different genetic
backgrounds. Molecular Genetics and Genomics 267:772-780.
Ninamango-Cárdenas F., Teixeira Guimarães C., Martins P., Netto Parentoni S., Portilho
Carneiro N., Lopes M., Moro J., Paiva E. (2003) Mapping QTLs for aluminum tolerance
in maize. Euphytica 130:223-232.
Ohno T., Nakahira S., Suzuki Y., Kani T., Hara T., Koyama H. (2004) Molecular
characterization of plasma membrane H+-ATPase in a carrot mutant cell line with
enhanced citrate excretion. Physiologia Plantarum 122:265-274.
Parrott W.A., Bouton J.H. (1990) Aluminum tolerance in alfalfa as expressed in tissue culture.
Crop Sci 30:387-389.
Piepho H., Möhring J., Melchinger A., Büchse A. (2008) BLUP for phenotypic selection in plant
breeding and variety testing. Euphytica 161:209-228.
Resende M. (2002) Genética biométrica e estatística no melhoramento de plantas perenes
Embrapa Informação Tecnológica, Brasilia, Brasil.
Ryan P.R., Delhaize E., Randall P.J. (1995) Characterisation of Al-stimulated efflux of malate
from the apices of Al-tolerant wheat roots. Planta 196:103-110.
Scott B.J., Ewing M.A., Williams R., Humphries A.W., Coombes N.E. (2008) Tolerance of
aluminium toxicity in annual Medicago species and lucerne. Australian Journal of
Experimental Agriculture 48:499-511.
Searle S.R., Casella G., McCulloch C.E. (1992) Variance Components, John Wiley & Sons, Inc.,
New York.
16
Simpson J., Pinkerton A., Lazdovskis J. (1977) Effects of subsoil calcium on the root growth of
some lucerne genotypes (Medicago sativa L.) in acidic soil profiles. Australian Journal of
Agricultural Research 28:629-638.
Sledge M., Ray I., Jiang G. (2005) An expressed sequence tag SSR map of tetraploid alfalfa
(Medicago sativa L.). Theor Appl Genet 111:980-992.
Sledge M.K., Bouton J.H., Dall'Agnoll M., Parrott W.A., Kochert G. (2002) Identification and
confirmation of aluminum tolerance QTL in diploid Medicago sativa subsp. coerulea.
Crop Sci 42:1121-1128.
Smith R.H., Bhaskaran S., Schertz K. (1983) Sorghum plant regeneration from aluminum
selection media. Plant Cell Reports 2:129-132.
Sumner M.E., Shahandeh H., Bouton J., Hammel J. (1986) Amelioration of an acid soil-profile
through deep liming and surface application of gypsum. Soil Sci Soc Am J 50:1254-
1258.
USDA A., National Genetic Resources Program. (2008) Germplasm Resources Information
Network - (GRIN) [Online Database], National Germplasm Resources Laboratory.
Beltsville, MD. (Verified 30 March 2008).
USDA N., National Agricultural Statistics Service. (2009) Crop production.
Xue Y., Jiang L., Su N., Wang J.K., Deng P., Ma J.F., Zhai H.Q., Wan J.M. (2008) The genetic
basic and fine-mapping of a stable quantitative-trait loci for aluminium tolerance in rice.
Planta 27:255-262
Zhang X., Humphries A., Auricht G. (2007) Genetic variability and inheritance of aluminium
tolerance as indicated by long root regrowth in lucerne ( Medicago sativa L.). Euphytica
157:177-184.

17
Zhou L.-L., Bai G.-H., Ma H.-X., Carver B. (2007) Quantitative trait loci for aluminum
resistance in wheat. Molecular Breeding 19:153-161.
18
CHAPTER 2
GENETIC MAPPING OF TOLERANCE TO ACID-SOIL SYNDROME IN TETRAPLOID
ALFALFA USING A WHOLE-PLANT ASSAY IN SOIL1
1 Rafael Reyno, Dong-Man Khu, Joseph H. Bouton, Maria J. Monteros, and E. Charles Brummer. To be submitted
to Crop Science
19
Abstract
Alfalfa, Medicago sativa L., is one of the most important forage legumes worldwide. However,
acid soils and aluminum toxicity dramatically decrease its productivity and persistence. Limited
variability for Al tolerance exists within tetraploid germplasm, and no aluminum tolerant cultivar
is commercially available. The tetraploid aluminum tolerant genotype Altet-4, derived from a
source of tolerance identified in diploid M. sativa subsp. caerulea, was crossed to NECS-141, a
semi-dormant breeding line, to produce a mapping population segregating for Al tolerance. The
population was evaluated using a modified soil-based greenhouse assay to assess individual
genotype performance in unlimed, aluminum rich, acid soil compared with performance in limed
soil without Al toxicity. Rooted stem cuttings were grown for 6 wk in both types of soil and
harvested. Root and shoot dry weight in both soil treatments were measured and the ratio of
unlimed:limed of these traits was determined. Linkage maps were constructed using molecular
markers, generating a composite map length of 840 cM and 749 cM for Altet4 and NECS-141,
respectively. Single-factor analysis and interval mapping identified quantitative trait loci (QTL)
on Altet-4 linkage groups 1, 2, 5, 6, and 7, and on NECS-141 linkage group 5. The phenotypic
variation explained by individual QTL ranged from 9.5 to 35.3%. Some of these QTL were
detected in multiple environments and for multiple traits while others were environment-specific,
suggesting that multiple mechanisms of Al tolerance exist. Introgression of these Al-tolerance
QTL into elite breeding lines can result in cultivars with enhanced Al tolerance.
20
Introduction
Alfalfa, Medicago sativa L., is one of the most important forage legumes worldwide and
is the fourth most important crop in U.S. agriculture in terms of hectares under cultivation
(USDA-NASS, 2009). Acid soils limit alfalfa cultivation in many parts of the world, including
the southeastern USA (Bouton and Sumner, 1983a). At low pH, aluminum (Al) and manganese
(Mn) become soluble, causing severe toxicity that inhibits root growth and development
(Kochian et al., 2004a). The most common form of aluminum released from soil minerals is
Al(H2O)3+, which is commonly referred to as Al
3+ (Kinraide, 1991). Two different types of Al
tolerance mechanisms exist; those that exclude Al from the root apex through organic acid
exudation, and those that allow the plant to tolerate Al accumulation in roots and shoots
(Kochian et al., 2004a). Studies in barley, wheat, sorghum, rye, soybean, rice, and arabidopsis
indicate that aluminum tolerance is controlled by a few genes with large effects (Delhaize et al.,
2004; Hoekenga et al., 2003; Magalhaes et al., 2004; Pineros et al., 2002), while others,
sometimes in the same species, suggests the complexity of the Al trait (Bianchi-Hall et al., 2000;
Ikka et al., 2008b; Liu et al., 2009; Narasimhamoorthy et al., 2007a; Xue et al., 2008).
Acid soil syndrome (Al+3
and H+
toxicity) can be ameliorated by applying lime and P
fertilizer, effectively eliminating Al toxicity in the plow layer, but not changing the subsoil
(Bouton and Sumner, 1983a). The rising costs of lime application and fertilizer have made these
practices less affordable (Bennett et al., 2008), thus increasing the interest in genetic tolerance to
acidic conditions. Genetic selection for acid soil tolerance can increase alfalfa productivity and
reduce production costs, but only limited variation has been detected in alfalfa germplasm
(Bouton, 1996; Campbell et al., 1988).
21
The success for developing Al tolerance alfalfa cultivars depends on reliable phenotypic
assays. Phenotypic assays traditionally used to evaluated Al tolerance in alfalfa have included a
callus bioassay (Parrott and Bouton, 1990), hydroponic systems (Barone et al., 2008;
Narasimhamoorthy et al., 2007b; Scott et al., 2008; Sledge et al., 2005), root-staining (Barone et
al., 2008; Narasimhamoorthy et al., 2007b), and soil-based assays (Bouton, 1996; Dall' Agnol et
al., 1996; Sledge et al., 2002). Results among the various assays are not highly correlated,
suggesting that they may be capturing different mechanisms of Al tolerance (Barone et al., 2008;
Narasimhamoorthy et al., 2007b). We recently described two new screening assays to assess Al
tolerance in alfalfa more efficiently, one using a whole-plant assay in media, and one that is a
modification of the Bouton (1996) soil assay that enables high-throughput analysis (Khu et al.,
2012). Although we anticipate the soil assay to be most relevant for field conditions, we do not
know how selection using any of these methods relates to progress for Al tolerance in the field.
Understanding the genetic basis of Al tolerance can further improve selection strategies.
Al tolerance QTL were identified in several genomic regions in diploid alfalfa based on callus
assays (Narasimhamoorthy et al., 2007a; Sledge et al., 2002). However, since cultivated alfalfa is
tetraploid, those QTL need to be integrated and evaluated at the tetraploid level. Genetic maps in
tetraploid alfalfa (Julier et al., 2003; Robins et al., 2007b; Sledge et al., 2005) were constructed
and used for mapping traits of interest, including yield, persistence, and others (Brower et al.,
2000; Robins and Brummer, 2010; Robins et al., 2007a; Robins et al., 2008; Robins et al.,
2007b).
Our hypothesis is that QTL associated with Al/acid soil tolerance can be identified in a
tetraploid alfalfa breeding population using a modified soil-based assay, and the QTL identified
previously at the diploid level will also be identified at the tetraploid level. The objective of this
22
study was to evaluate Al/acid soil tolerance in a tetraploid alfalfa mapping population using a
soil-based assay.
Materials and Methods
Plant Materials
The autotetraploid genotypes NECS-141 and Altet-4 were reciprocally crossed,
emasculating the female parent in each case, generating a full-sib F1 population of 185
individuals. Altet-4 is a tetraploid genotype derived from an interploidy cross between Al-4, a
diploid plant of M. sativa subsp. caerulea used to identify QTL alleles for Al tolerance
(Narasimhamoorthy et al., 2007a; Sledge et al., 2002), and an Al-sensitive tetraploid genotype
derived from the non-dormant synthetic cultivar CUF101 (Lehman et al., 1983). The Al-sensitive
parental genotype NECS-141 (Khu et al., 2012) is a semi-dormant (3-4 dormancy group)
genotype with high yield, derived from a breeding population previously evaluated for yield at
three locations (Li et al., 2011).
Genotyping and Map Construction
Genomic DNA extractions from all individuals and the parental genotypes were
performed using the DNeasy Plant Kit® (QIAGEN, Valencia, CA, USA). The NECS-141×Altet-
4 population was initially screened using 20 SSR primer pairs to confirm the hybrid origin of the
individuals in the population. Amplicons from 266 loci, including SSR markers (Sledge et al.,
2005) and candidate genes involved in organic acid secretion (Narasimhamoorthy et al., 2007a),
were detected using ABI3730 DNA analyzer, and then scored using GeneMapper 3.7TM
and
GeneMarker V1.5 software. The software TetraploidMap (Hackett and Luo, 2003), previously
used for map construction and QTL analysis in alfalfa (Julier et al., 2003; Robins and Brummer,
23
2010; Robins et al., 2007a; Robins et al., 2008), was used to infer allele dosage in each parent
and the most likely parental genotype, and to estimate recombination frequencies and to cluster
markers into linkage groups. Marker order and distances were estimated using the simulated
annealing algorithm from the TetraploidMap suite (Hackett and Luo, 2003). MapChart
(Voorrips, 2002) was used to draw the resulting linkage groups, and to draw the QTL identified
using the TetraploidMap software.
Eight linkage groups, corresponding to the basic chromosome number in alfalfa, were
obtained from each parent. Each linkage group contains four co-segregating groups
corresponding to the four homologous chromosomes, and they were randomly numbered from 1
to 4 within each linkage group (Supplemental Fig. 2.1). Different allelic dosages and multi-
allelic markers are expected in autotetraploid alfalfa. The markers were placed into co-
segregating groups based on their linkage with simplex markers (only one copy of a given allele
present in only one parent) (Hackett and Luo, 2003). Most of the alleles were allocated into co-
segregating groups based on their coupling or repulsion phases using a LOD score ≥ 3.0,
previously utilized in alfalfa (Robins et al., 2007b).
Phenotyping
Experimental design and data collection
Phenotyping was performed in the Crop and Soil Sciences Department greenhouses at
the University of Georgia, Athens, GA. The entire experiment was performed in the following
three environments: Nov-Dec 2009, Mar-Apr 2010, and Apr-May 2011. The use of cups as
described by (Bouton, 1996) for soil-based Al tolerance evaluations is time-consuming and
space-intensive, and thus cups were replaced with conetainers (Stuewe and Sons, Inc., Tangent,
OR) using the whole-plant assay in soil as previously described (Khu et al., 2012). Briefly, each
24
conetainer (3.8 cm diameter × 21 cm long, with a volume of 164 ml) was filled with 140 g of soil
leaving approximately 5 cm space at the top of each cone. Individual conetainers were placed in
30 cm wide × 61 cm long × 18 cm high racks, each of which held 98 (7 × 14) conetainers. Half
of each rack (49 cones in a 7 × 7 square) was filled with unlimed (UL) soil and the other half
with limed (L) soil. The outer cones in each half were utilized for border rows thus leaving 25
cones (5 × 5) per rack evaluated for each soil type. Each soil type per rack included two clones of
each parental genotype along with 21 genotypes from the mapping population. The same 21
genotypes were evaluated in both soil treatments within the same rack. To prevent waterlogging,
the racks with the conetainers were placed into plastic trays that were filled with 15 cm of sterile
sand, and with drain holes at the bottom. The conetainers used had drain holes at the bottom and
were placed 5 cm into the sand to ensure contact between cone soil and sand. The sand was used
to prevent soil saturation after watering (Dr. M.E. Sumner, pers. comm.), thereby preventing Mn
toxicity. One replication of the entire mapping population consisted of nine incomplete blocks
(racks) of 21 genotypes from the population and two clones of each parent (NECS-141 and
Altet-4) per rack for a total of 25 individuals evaluated in each soil treatment per rack. Four
replications of the entire population were evaluated in each environment.
The soil used for these experiments and the macro and micro nutrients used for
amendments were previously described (Khu et al., 2012). Although the same soil, obtained
from the UGA Plant Sciences Farm near Watkinsville, GA, was used for each environment,
nutrients and lime were mixed into the soil prior to each experiment, resulting in minor
variations in the soil analysis (Table 2.1). After the addition of soil amendments, the soil was air-
dried and sieved using a 3-mm screen (Dall' Agnol et al., 1996) prior to filling the conetainers.
25
Rooted stem cuttings were used for all evaluations. Stem cuttings were vegetatively
propagated in 96-cell plastic flats growing in Fafard Super-fine Germinating Mix® (Conrad
Fafard Inc., Agawam, MA). Each cutting was grown in a cell with top dimensions of 2.5 cm ×
2.5 cm and 5 cm deep, tapering to a point and grown for 6 wk. Uniform 5-wk old stem cuttings
from each genotype in the population were identified, and the clonal plugs were transferred
directly to the conetainers without washing off the germination mix in which the cuttings were
grown. The treated soil, L or UL, depending on the treatment was used to fill the area around the
plug at the top of the conetainer. The experiment was watered every 1 to 2 d using distilled
water, and the trays were rotated inside the greenhouse benches at weekly intervals to diminish
micro-environmental variation inside the greenhouse. Day and night temperatures were 25°C and
20°C, respectively, with a day length of 16 hr. During the course of the experiment one or two
applications of chlorpenapyr (0.41 g/l) and avermectin (49.3 g/l) for thrips (Caliothrips fasciatus
and Frankliniella occidentalis) control were required.
After growing for 6 to 8 wk, plants and soil were removed from the conetainers and the
roots of each plant were gently washed to remove the excess soil. Plants were separated into root
and stem fractions at the soil line. The top 5 cm of the root fraction, corresponding to the roots
growing in the germination mix, was discarded and not considered for further analysis. The
remaining roots below 5 cm represented the roots growing in the UL or L soil, were retained as
the root fraction for analysis. The dry weight (DW) of roots and shoots was determined after
drying at 65ºC for 72 hr. Relative root weight was determined as the ratio of root dry weight in
UL soil compared to the root dry weight in L soil for each genotype at the block level. Relative
shoot dry weight was computed analogously. Therefore, the traits analyzed were root dry weight
in L and UL soil, hereafter referred to as RDW-L and RDW-UL, shoot dry weight in L and UL
26
soil, hereafter referred to as SDW-L and SDW-UL, and root and shoot dry weight ratios
representing the relative growth in UL vs L soil, referred to as RDWR and SDWR, respectively.
Data analysis
The UNIVARIATE procedure of SAS v. 9.1 (SAS Institute, 2007) was used to determine
general statistics for each trait and to test for normality using the QQPlot statement and the
normal option. The MIXED procedure also in SAS was used to calculate the least-square means
for each genotype for each trait. The full model considered genotypes, environments, and
genotypes × environments (G×E) interaction as fixed effects, while incomplete blocks (nested in
replications) and replications (nested in environments) were designated as random effects. The
environment effect represents the greenhouse conditions under which this experiment was
conducted and thus, was considered as a fixed effect. Based on the overall analysis, a significant
G×E effect for all traits suggested we analyze environments separately, using an analogous
model. Progeny data were analyzed using the VARCOMP procedure of SAS in an all-random
model to estimate the genetic, G×E interaction, and the residual error variance components. The
broad sense heritability (H) for traits evaluated was calculated using the following equation:
where σ2 genotypes is the variance due to genotypes, σ
2g×e is the variance due to the two-way G×E
interaction, σ2 residual is variance due to the error, e refers to the number of environments, and r is
the number of replications within environments. Heritabilities were also estimated for each
environment modifying the previous equation by removing the σ2
g×e and e variables.
re e
residual gxe genotypes
genotypes 2 2
2
2 H
27
Phenotypic and genetic correlations among traits were estimated for each environment.
The CORR procedure of SAS was used to estimate phenotypic correlations based on mean
values within environments. The MANOVA option from the GLM procedure was used to obtain
the variance-covariance matrix and the genetic correlations were calculated using the equation:
where rg x-y represents the genetic correlation between traits x and y, Covx-y is the covariance of
traits x and y, Varx is the variance associated with trait x, and Vary is the variance associated with
trait y. For all statistical analyses, we assessed significance at the 5% probability level unless
otherwise indicated.
QTL analyses
Single-factor analysis of variance and the nonparametric Kruskal-Wallis test (Siegel,
1956) were performed using the ANOVA module of the TetraploidMap software (Hackett and
Luo, 2003). This analysis was performed for each trait in each of the three environments. Single-
factor analysis compares the least-square mean of the genotypes with the presence of a particular
allele against the least-square mean of the genotypes without that allele. Marker alleles were
declared significantly associated with a trait at P ≤ 0.01. Single-factor analysis was used for a
preliminary identification of markers associated with traits, highlighting relevant linkage groups
for further analysis. Interval QTL mapping was performed using TetraploidMap (Hackett et al.,
2001; Hackett et al., 2007). Linkage groups from both parents were analyzed to identify QTL for
each trait. Experiment-wise thresholds were set by running 1000 permutations, where putative
QTL showing a LOD score over the 5% experiment-wise threshold were declared as significant
QTL.
21
2112
*VarVar
CovrG
28
Results
Trait variation and correlations among traits
The overall analysis of variance across all three environments showed that most traits
exhibited significant G×E interaction (data not shown). Therefore, we evaluated each
environment independently. Although the experiments were conducted in the greenhouse, the
external environment, particularly day length and ambient temperature, were quite variable
throughout the different environments, which likely affected plant growth. In addition, soil
properties for the L and UL treatments were slightly different across environments (Table 2.1).
All the traits in each environment were normally distributed (data not shown). Genotypes
differed for all traits in all environments, except for SDWR in Environment 1 and RDWR 2 in
Environment 2 (Table 2.2). For the primary Al trait phenotype – the ratio of root dry weight in
UL vs. L soil (UL:L) – the two parental genotypes differed as expected in Environments 2 and 3,
with Altet-4 showing a higher ratio, suggesting more Al tolerance, than NECS-141; the parents
performed similarly in Environment 1. The mapping population means for all traits were close to
the mid-parent value, but the range largely exceeded the parent values (Table 2.2).
Broad-sense heritablities were moderate to low for all the traits (Table 2.3). In the overall
analysis, the G×E and error variances were large. In L soil, the genotype variance component
was larger than G×E variance component, but these were reversed in UL soil (Table 2.3).
Heritability for root dry weight was higher in L than UL conditions, but the heritability of shoot
dry weight was similar for the two soils. Heritabilities for all traits were very low for
Environment 1. Environment 2 had higher heritabilities for root and shoot dry weights in UL
soils than in L soil. The heritability of the ratios was lower in all cases than the corresponding
dry weight heritability.
29
Phenotypic correlations among the traits were positive and moderate in each environment
(Table 2.4). Root and shoot dry weights had similar correlations between L and UL conditions.
Correlations of RDW with SDW in L or UL soil were higher than the correlations of individual
traits across soil conditions. RDWR and SDWR were moderately correlated in all environments.
Genetic correlations were generally similar than phenotypic correlations. In all the cases, genetic
correlations were positive and moderate to high depending on the trait.
Linkage Map and QTL Analyses
The genetic map of each parent consists of eight linkage groups corresponding to the
eight alfalfa chromosomes, each containing four homologous chromosomes. The composite map
lengths were 840 cM and 749 cM for the Altet-4 and NECS-141, respectively (Supplementary
Fig. 2.1).
Single-factor ANOVA identified 36 marker alleles, 24 from Altet-4 and 12 from NECS-
141 that showed an association with RDW or SDW in one or both soil treatments (Table 2.5).
Marker alleles from all linkage groups (LG) except LG 2 and LG 3 were associated with RDW
or SDW. Most of the associations are environment and soil specific, but a few marker alleles are
associated with multiple traits and/or with the same trait in multiple environments or soils (e.g.,
marker allele BF119-159 on LG 1 is associated with SDW and RDW in UL soil in Environments
1 and 2, and with SDW in L soil in Environment 1). In general, few marker associations with
RDW in L soil were identified.
Both parents contributed marker alleles associated with RDW and SDW (Table 2.5).
While most of the associations identified for RDW and SDW in L and UL conditions showed
negative allele effects, each parent contributed alleles with both positive and negative effects,
30
and alleles from one parent with the same effect within a linkage group appeared to be clustered
(Table 2.5).
The ratio of dry weight in UL vs. L soil was used to estimate the Al tolerance. Thirty-
three marker alleles associated with RDWR and SDWR were identified from both parents and on
all linkage groups and with both positive and negative effects (Table 2.6). The marker allele
effects range from -0.15 to +0.13, and in general, alleles with same effect tend to be clustered
within a LG. All of the associations were trait and environment specific, but in the case of
NECS-141 LG 4, a cluster of marker alleles with a positive effect were located in the interval
between positions 4.1 to 21.9 cM across all environments evaluated (Table 2.6).
Interval mapping identified 16 QTL associated with dry weight or dry weight ratios in
Altet-4 and nine QTL for those traits in NECS-141 (Table 2.7; Fig. 2.1; Fig. 2.2). QTL for dry
weight and Al tolerance were located on Altet-4 LGs 1, 2, 5, 6, 7, and 8, and on NECS-141 LGs
1, 4, 5, and 7. Individual QTL explained between 7 and 41% of the phenotypic variation (Table
2.7). As suggested by the single factor analysis, limited correspondence across environments was
seen (Fig. 2.1; Fig. 2.2). However, the genomic region located in the middle of LG 1 of Altet-4 is
associated with traits in several soil types, traits, and environments (Table 2.7; Fig. 2.1). Most of
the QTL detected by interval mapping correspond to alleles identified by single factor analysis
(Fig. 2.1a and 2.1b).
The gene action of these QTL is quite complex. For instance, the RDWR QTL on Altet-4
LG 2 explained 30% of the phenotypic variation (Table 2.7) and had a positive effect when
homologues 2 and 3 from Altet-4 were inherited by the F1 individuals (data not shown). This
QTL is flanked by the duplex markers RCS4209-157A and AC155884-162A which showed
positive effects in the single-factor analysis (Fig. 2.1 and Table 2.6). Even though this QTL was
31
detected only in Environment 3 using interval mapping, AC155884-162A was associated with
RDWR in Environment 1 as well (Table 2.6). A QTL for RDWR in Environment 1 was located
on LG 5 of Altet-4 at 48 cM, and explains 35% of the phenotypic variation. For this QTL, the F1
individuals that inherited homologues 1 and 3 showed higher Al tolerance than those with other
homologous chromosome combinations (data not shown). The simplex marker-allele BF106-
214B, located at 54.9 cM position on homologue 4 (Supp. Fig. 2.1), was negatively associated
with Al tolerance for RDWR, while no marker from homologues 1 and 3 was associated with
this trait.
Putative QTL for Al tolerance were also identified in the Al-sensitive parent NECS-141.
On LG 5, QTL for Al tolerance (RDWR and SDWR) were identified at 75 and 77 cM in
Environment 3. For both QTL, F1 individuals that inherited NECS-141 homologue 2 had lower
Al tolerance (data not shown). This result is in agreement with the presence of simplex marker
Mstri10686-126N on that homologue (Supp. Fig. 2.1), which was highly negatively associated
with these traits in Environment 3 (Table 2.6).
Discussion
Aluminum tolerance was evaluated in a tetraploid alfalfa mapping population grown in
soil using conetainers. This new methodology (Khu et al., 2012) allowed us to screen a mapping
population using a soil assay, something precluded using previous methods. Substantial G×E
was observed in this experiment for root and shoot dry weights and for the ratios of dry weights
from UL vs. L soils. Significant G×E interactions for dry weight were also found in tetraploid
alfalfa in a QTL mapping analysis of yield (Robins et al., 2007b), where location and year
combinations were analyzed independently. Broad-sense heritabilities within environments were
32
moderate to low (Table 2.3). In this experiment, the causes of G×E include slight variations in
the soil analysis (Table 2.1) and also differences in photoperiod responses. Although we
supplemented plants with lights, the ambient day-length varied considerably between
environments, and probably affected the rate of plant growth. The parents differ in autumn
dormancy, and therefore, may be expected to respond to photoperiod differently during the
duration of the experiment.
The traits measured in this population in each of the three environments showed normal
and continuous distribution in agreement with polygenic inheritance cited in alfalfa and other
species for Al tolerance and for biomass (Narasimhamoorthy et al., 2007a; Robins et al., 2007b;
Sledge et al., 2002). The density of the genetic maps used in this study were 4.0 cM/marker in
Altet-4 and 3.2 cM/marker in the NECS-141 parental map. These genetic maps were sufficiently
dense to detect marker-trait associations though single-factor analysis and interval mapping.
Transgressive segregation was observed in all evaluated traits in this population (Table
2.2), thus supporting our findings of marker-alleles and QTL with positive and negative effects
being contributed from both parents. Even though NECS-141 has lower Al tolerance compared
with Altet-4, it contributed positive alleles for Al tolerance. Similar findings of transgressive
segregation and beneficial alleles from the agronomically inferior parent were reported studying
Al tolerance in alfalfa at the diploid level (Narasimhamoorthy et al., 2007a), persistence and
other agronomic traits at the tetraploid level (Robins et al., 2007a; Robins et al., 2008; Robins et
al., 2007b), and in other species (Bianchi-Hall et al., 2000; Hoekenga et al., 2003).
Phenotypic and genetic correlations among shoot and root dry weights and their ratios
were moderate to high in all the cases in each of the three environments (Table 2.4). Linkage or
pleiotropic effects drive genetic correlations. Thus, these positive and moderate to high
33
correlations suggest that in this study these traits are being controlled to some extent by the same
genomic regions. We have observed marker-alleles and QTL associated with different traits
located in the same LG and in similar genomic regions likely representing the same QTL.
In this study, we identified QTL associated with RDW and SDW in limed conditions.
Under limed conditions the soil pH was almost neutral and the exchangeable Al was absent
(Table 2.1). Therefore, these QTL likely represent growth traits (biomass yield) that are not
necessarily related to Al tolerance. Thus, QTL identified in the same locations in UL soil are also
probably related to yield per se, rather than to Al tolerance. For instance, the cluster of QTL on
LG 1 of the Altet-4 parent (Fig. 2.1) includes dry weight QTL in both L and UL soils, and these
may represent growth QTL, not Al tolerance QTL.
In the Environment 1, parents did not perform as anticipated in terms of the Al tolerance
type (Table 2.2). As stated above, parents differ in autumn dormancy, and thus because the
experiment was performed during the fall-winter season we likely observed confounding effects
due to dormancy responses. In alfalfa, QTL associated to winter hardiness, fall growth, and
freezing injury were identified on LGs 1, 3, 5, and 8 (Brouwer et al., 2000). QTL identified only
in Environment 1 may be affected by dormancy effects. However, the lack of common markers
between this study and the Brouwer map makes confirmation difficult.
A previous study to evaluate Al tolerance based on a callus bioassay, identified QTL on
LGs 1, 2, and 3 in diploid alfalfa (Narasimhamoorthy et al., 2007a). The parental genotype Al-4
had tolerance alleles at these QTL, and as it is a parent of Altet-4 thus, we anticipate that QTL in
these regions would also be identified in the tetraploid population provided that markers
segregate in this region. Al tolerance QTL per se are those assuming associated with RDWR and
SDWR. However, QTL for root or shoot growth characteristics could also indirectly affect Al
34
tolerance through improved growth per se. A major QTL for Al tolerance was identified at the
diploid level in the region near marker AW11 (Narasimhamoorthy et al., 2007a); we also
identified a QTL for SDWR in the region of AW11 (Table 2.7 and Fig. 2.1). The second QTL
found on LG 1 in the diploid population may correspond to the large cluster of QTL we
identified on LG 1 in this study. However, different markers were used in both studies limiting
our ability to determine whether these QTL co-locate to the same position on the same LG. An
Al-tolerance QTL at the diploid level on LG 2 of Al-4 was localized at the marker locus AL99
(Narasimhamoorthy et al., 2007a); we identified a QTL on Altet-4 LG 2 close to this marker
(Fig. 2.1).
The position of a QTL on a LG identified in different environments may be affected by
the G×E interaction, thus slightly shifting its specific map position. This phenomenon was
reported for persistence QTL in tetraploid alfalfa (Robins et al., 2008). Similar results were
found on Altet-4 LG 1, were two QTL detected in two different environments range in map
position between 77 to 91 cM (Fig. 2.1), suggesting that these may be under the same genetic
control.
In addition to the presence of two of the three Al tolerance QTL previously reported at
the diploid level, we identified three additional LGs (5, 6, and 7) associated with Al tolerance in
Altet-4 not previously reported at the diploid level. Different Al tolerance mechanisms have been
described acting at different levels of the plant structure, and these can be cell-based and whole-
plant based. Those mechanisms include Al-induced exudation of organic acids from the root
apex and/or internal detoxification of Al via complexation with organic ligands, which allows the
plant to accumulate Al in roots and shoots (Kochian et al., 2004a). Evidence for the later
mechanism includes some plant species which are able to accumulate high levels of Al in roots
35
and shoots (Ma et al., 1998; Ma et al., 2001; Ma et al., 1997). Therefore, the QTL identified can
be a result of different mechanism of Al tolerance captured by the different assays and genetic
maps used. Alternatively, these represent Al tolerance mechanism relevant at the tetraploid level
based on the higher order allelic interaction present in tetraploid alfalfa (Bingham et al., 1994).
Single factor ANOVA was used to identify several alleles with positive and negative
effects being closely linked (Table 2.5 and 2.6). In most of the cases, the alleles with the positive
and negative effects are localized in different co-segregating homologous on a linkage group
(Supp. Fig. 2.1). The same condition was observed in the homologous combination inherited by
the F1 individuals, where some homologues contain alleles with a positive effect and others with
negative effects in the same genomic region.
This study has identified several genomic regions associated with Al/acid soil tolerance
using a recently described whole-plant assay in soil that allowed screening at a mapping
population (Khu et al., 2012). Sources of Al/acid soil tolerance were identified, but their value in
a range of alfalfa germplasm with different background remains unknown.
Conclusion
Multiple QTL for Al/acid soil tolerance were identified in a tetraploid alfalfa mapping
population. Our results suggest that two QTL identified for Al tolerance at the diploid levels
were also present in tetraploid alfalfa, with the addition of QTL identified from the Al-tolerant
parent, not previously reported, and from the Al-sensitive parent. Individual QTL explained
between 8 and 35% of the phenotypic variation, but their modes of action together with the
QTL×E interaction suggest the complexity behind Al tolerance in alfalfa. Further research is
needed to refine the genomic regions associated with Al tolerance and to understand Al tolerance
36
mechanisms in alfalfa, including identification of and identify candidate genes from which to
develop new molecular markers. The introgression of some of these QTL in elite breeding alfalfa
germplasm and the development of a marker-assisted selection program can be used to increase
their frequency in elite alfalfa populations thus enhancing Al tolerance.
Acknowledgements
The authors would like to thank Donald Wood, Jonathan Markham, and Wesley Dean for
their support with the greenhouse screening, Dr. Xuehui Li for making the population cross and
Yanling Wei for laboratory assistance, and Dr. Malcolm Sumner for assistance with the
phenotypic assay methodology. This study was funded by The University of Georgia and The
Samuel Roberts Noble Foundation.
37
References
Barone P., Rosellini D., LaFayette P., Bouton J., Veronesi F., Parrott W. (2008) Bacterial citrate
synthase expression and soil aluminum tolerance in transgenic alfalfa. Plant Cell Reports
27:893-901.
Bennett E.M., Carpenter S.R., Cardille J.A. (2008) Estimating the risk of exceeding thresholds in
environmental systems. Water, Air & Soil Pollut 191:131-138.
Bianchi-Hall C.M., Carter T.E., Jr., Bailey M.A., Mian M.A.R., Rufty T.W., Ashley D.A.,
Boerma H.R., Arellano C., Hussey R.S., Parrott W.A. (2000) Aluminum tolerance
associated with quantitative trait loci derived from soybean PI 416937 in hydroponics.
Crop Sci 40:538-545.
Bingham E.T., Groose R.W., Woodfield D.R., Kidwell K.K. (1994) Complementary gene
interactions in alfalfa are greater in autotetraploids than diploids. Crop Sci. 34:823-829.
Bouton J., Sumner M. (1983) Alfalfa Medicago sativa L., in highly weathered, acid soils. Plant
and Soil 74:431-436.
Bouton J.H. (1996) Screening the alfalfa core collection for acid soil tolerance. Crop Sci. 36:198-
200.
Brouwer D.J., Duke S.H., Osborn T.C. (2000) Mapping genetic factors associated with winter
hardiness, fall growth, and freezing injury in autotetraploid alfalfa. Crop Sci. 40:1387-
1396.
Brower D.J., Duke S.H., Osborn T.C. (2000) Mapping genetic factors associated with winter
hardiness, fall growth, and freezing injury in autotetraploid alfalfa. Crop Sci. 40:1387-
1396.
38
Campbell T.A., Elgin J.H.J., Foy C.D., McMurtrey M.E., III. (1988) Selection in alfalfa for
tolerance to toxic levels of aluminum. Canadian J Plant Sci 68:743-754.
Dall' Agnol M., Bouton J.H., Parrott W.A. (1996) Screening methods to develop alfalfa
germplasms tolerant of acid, aluminum toxic soils. Crop Sci 36:64-70.
Delhaize E., Ryan P.R., Hebb D.M., Yamamoto Y., Sasaki T., Matsumoto H. (2004) Engineering
high-level aluminum tolerance in barley with the ALMT1 gene. Proc Natl Acad Sci USA
101:15249-15254.
Hackett C.A., Luo Z.W. (2003) TetraploidMap: construction of linkage map in autotetraploid
species. J Hered 94:358-359.
Hackett C.A., Bradshaw J.E., McNicol J.W. (2001) Interval mapping of quantitative trait loci in
autotetraploid species. Genetics 159:1819-1832.
Hackett C.A., Milne I., Bradshaw J.E., Luo Z. (2007) TetraploidMap for Windows: Linkage map
construction and QTL mapping in autotetraploid species. J Hered 98:727-729.
Hoekenga O.A., Vision T.J., Shaff J.E., Monforte A.J., Lee G.P., Howell S.H., Kochian L.V.
(2003) Identification and characterization of aluminum tolerance loci in Arabidopsis
(Landsberg erecta x Columbia) by quantitative trait locus mapping. A physiologically
simple but genetically complex trait. Plant Physiol 132:936-948.
Ikka T., Kobayashi Y., Tazib T., Koyama H. (2008) Aluminum-tolerance QTL in
Columbia/Kashmir inbred population of Arabidopsis thaliana is not associated with
aluminum-responsive malate excretion. Plant Sci 175:533-538.
Julier B., Flajoulot S., Barre P., Cardinet G., Santoni S., Huguet T., Huyghe C. (2003)
Construction of two genetic linkage maps in cultivated tetraploid alfalfa (Medicago
sativa) using microsatellite and AFLP markers. BMC Plant Biol 3:9.
39
Khu D.-M., Reyno R., Brummer E.C., Monteros M.J. (2012) Screening methods for aluminum
tolerance in alfalfa. Crop Sci. 52:161-167.
Kinraide T. (1991) Identity of the rhizotoxic aluminium species. Plant and Soil 134:167-178.
Kochian L.V., Hoekenga O.A., Pineros M.A. (2004) How do crop plants tolerate acid soils?
Mechanisms of aluminum tolerance and phosphorous efficiency. Annu Rev Plant Biol
55:459-493.
Lehman W.F., Nielson F.M., Marble V.L., Stanford E.H. (1983) Registration of CUF 101 alfalfa.
Crop Sci 23 398-399.
Li X., Wei Y., Moore K.J., Michaud R.A., Viands D.R., Hansen J.L., Acharya A., Brummer E.C.
(2011) Association mapping of biomass yield and stem composition in a tetraploid alfalfa
breeding population. Plant Gen. 4:24-35.
Liu J.P., Magalhaes J.V., Shaff J., Kochian L.V. (2009) Aluminum-activated citrate and malate
transporters from the MATE and ALMT families function independently to confer
Arabidopsis aluminum tolerance. Plant J 57:389-399.
Ma J.F., Hiradate S., Matsumoto H. (1998) High Aluminum resistance in buckwheat. Plant
Physiology 117:753-759.
Ma J.F., Ryan P.R., Delhaize E. (2001) Aluminum tolerance in plants and the complexing role of
organic acids. Trends Plant Sci 6:273-278.
Ma J.F., Hiradate S., Nomoto K., Iwashita T., Matsumoto H. (1997) Internal detoxification
mechanism of aluminum in Hydrangea: Identification of aluminum form in the leaves.
Plant Physiology 113:1033-1039.
40
Magalhaes J.V., Garvin D.F., Wang Y.H., Sorrells M.E., Klein P.E., Schaffert R.E., Li L.,
Kochian L.V. (2004) Comparative mapping of a major aluminum tolerance gene in
sorghum and other species in the Poaceae. Genetics 167:1905-1914.
Narasimhamoorthy B., Bouton J.H., Olsen K.M., Sledge M.K. (2007a) Quantitative trait loci and
candidate gene mapping of aluminum tolerance in diploid alfalfa. Theor Appl Genet
114:901-913.
Narasimhamoorthy B., Blancaflor E.B., Bouton J.H., Payton M.E., Sledge M.K. (2007b) A
comparison of hydroponics, soil, and root staining methods for evaluation of aluminum
tolerance in Medicago truncatula (barrel medic) germplasm. Crop Sci 47:321-328.
Parrot W.A., Bouton J.H. (1990) Aluminum tolerance in alfalfa as expressed in tissue culture.
Crop Sci 30:387-389.
Pineros M.A., Magalhaes J., Alves V.M.C., Kochian L.V. (2002) The physiology and
biophysics of an aluminum tolerance mechanism based on root citrate exudation in
maize. Plant Physiol 129:1194-1206.
Robins J.G., Brummer E.C. (2010) QTL underlying self-fertility in tetraploid alfalfa. Crop Sci.
50:143-149.
Robins J.G., Bauchan G.R., Brummer E.C. (2007a) Genetic mapping forage yield, plant height,
and regrowth at multiple harvests in tetraploid alfalfa ( L.). Crop Sci. 47:11-18.
Robins J.G., Viands D.R., Brummer E.C. (2008) Genetic mapping of persistence in tetraploid
alfalfa. Crop Sci 48:1780-1786.
Robins J.G., Luth D., Campbell I.A., Bauchan G.R., He C.L., Viands D.R., Hansen J.L.,
Brummer E.C. (2007b) Genetic mapping of biomass production in tetraploid alfalfa. Crop
Sci 47: 1-10.
41
Scott B.J., Ewing M.A., Williams R., Humphries A.W., Coombes N.E. (2008) Tolerance of
aluminium toxicity in annual Medicago species and lucerne. Australian Journal of
Experimental Agriculture 48:499-511.
Siegel S. (1956) Nonparametric statistics for the behavioural sciences, McGraw-Hill, London,
UK.
Sledge M., Ray I., Jiang G. (2005) An expressed sequence tag SSR map of tetraploid alfalfa
(Medicago sativa L.). Theor Appl Genet 111:980-992.
Sledge M.K., Bouton J.H., Dall'Agnoll M., Parrott W.A., Kochert G. (2002) Identification and
confirmation of aluminum tolerance QTL in diploid Medicago sativa subsp. coerulea.
Crop Sci 42:1121-1128.
Voorrips R.E. (2002) MapChart: Software for the graphical presentation of linkage maps and
QTLs. J Hered 93:77-78.
Xue Y., Jiang L., Su N., Wang J.K., Deng P., Ma J.F., Zhai H.Q., Wan J.M. (2008) The genetic
basic and fine-mapping of a stable quantitative-trait loci for aluminium tolerance in rice.
Planta 27:255-262
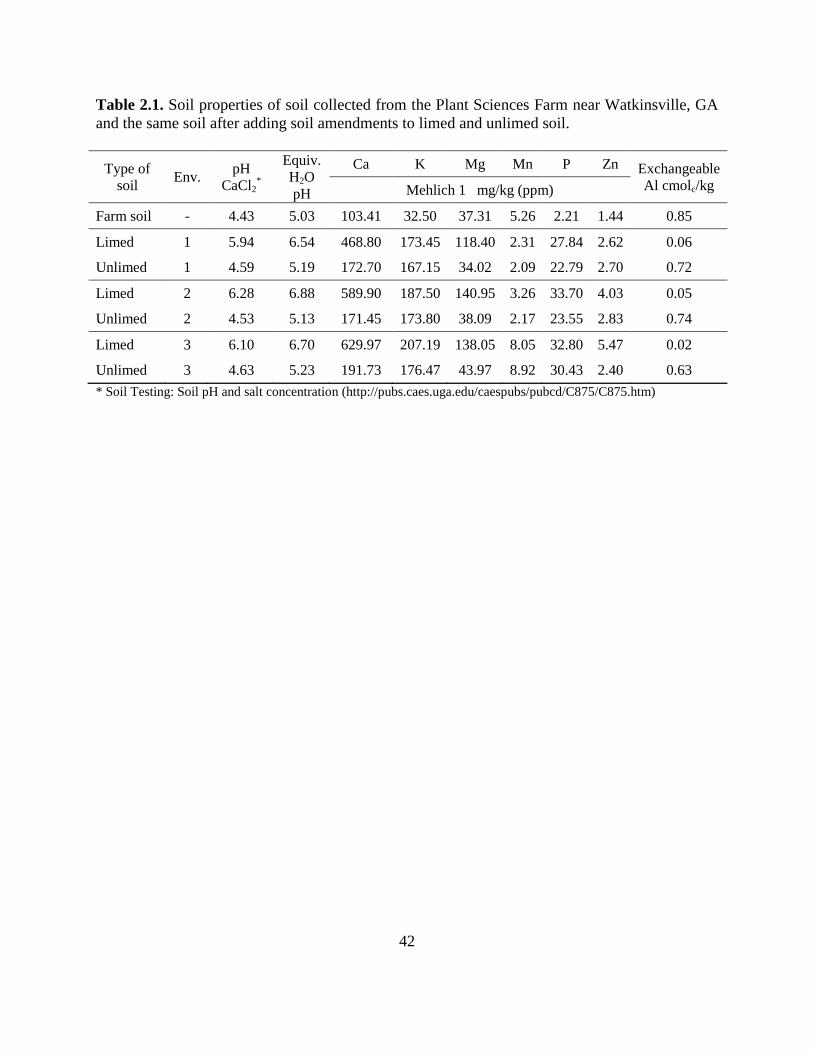
42
Table 2.1. Soil properties of soil collected from the Plant Sciences Farm near Watkinsville, GA
and the same soil after adding soil amendments to limed and unlimed soil.
Type of
soil Env.
pH
CaCl2*
Equiv.
H2O
pH
Ca K Mg Mn P Zn Exchangeable
Al cmolc/kg Mehlich 1 mg/kg (ppm)
Farm soil - 4.43 5.03 103.41 32.50 37.31 5.26 2.21 1.44 0.85
Limed 1 5.94 6.54 468.80 173.45 118.40 2.31 27.84 2.62 0.06
Unlimed 1 4.59 5.19 172.70 167.15 34.02 2.09 22.79 2.70 0.72
Limed 2 6.28 6.88 589.90 187.50 140.95 3.26 33.70 4.03 0.05
Unlimed 2 4.53 5.13 171.45 173.80 38.09 2.17 23.55 2.83 0.74
Limed 3 6.10 6.70 629.97 207.19 138.05 8.05 32.80 5.47 0.02
Unlimed 3 4.63 5.23 191.73 176.47 43.97 8.92 30.43 2.40 0.63
* Soil Testing: Soil pH and salt concentration (http://pubs.caes.uga.edu/caespubs/pubcd/C875/C875.htm)
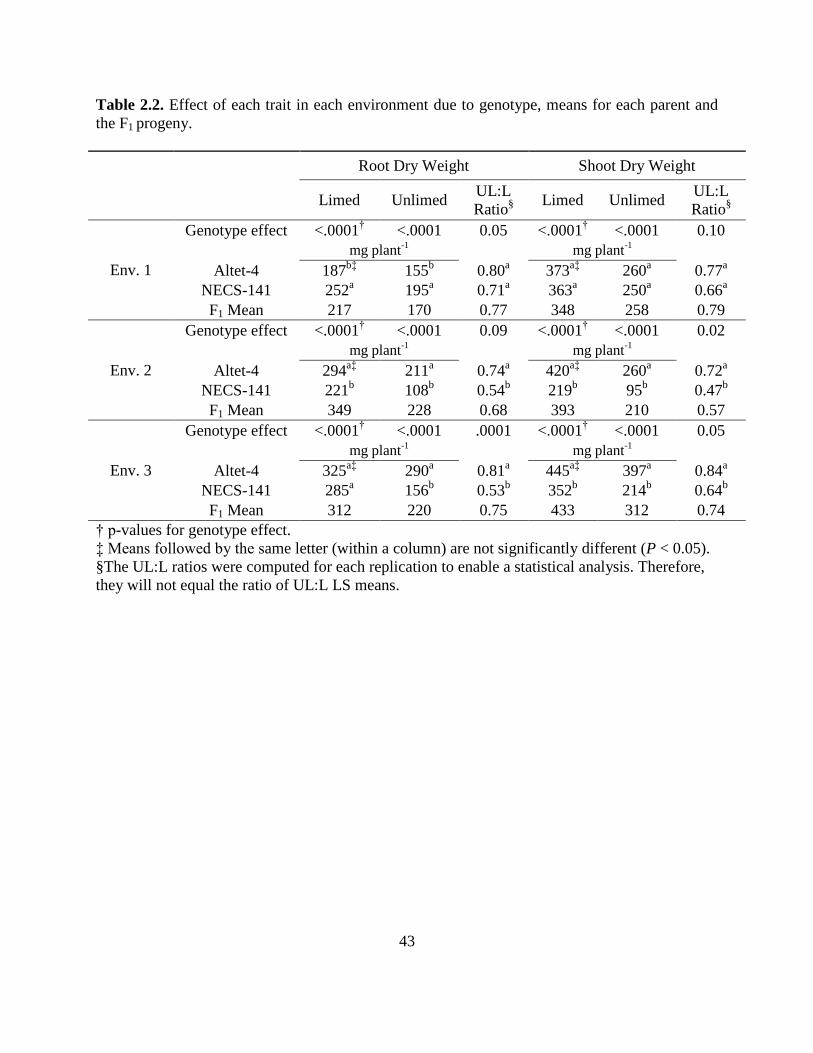
43
Table 2.2. Effect of each trait in each environment due to genotype, means for each parent and
the F1 progeny.
Root Dry Weight Shoot Dry Weight
Limed Unlimed
UL:L
Ratio§
Limed Unlimed UL:L
Ratio§
Env. 1
Genotype effect <.0001† <.0001 0.05 <.0001
† <.0001 0.10
mg plant
-1
mg plant
-1
Altet-4 187
b‡ 155
b 0.80
a 373
a‡ 260
a 0.77
a
NECS-141 252a 195
a 0.71
a 363
a 250
a 0.66
a
F1 Mean 217 170 0.77 348 258 0.79
Env. 2
Genotype effect <.0001† <.0001 0.09 <.0001
† <.0001 0.02
mg plant
-1
mg plant
-1
Altet-4 294
a‡ 211
a 0.74
a 420
a‡ 260
a 0.72
a
NECS-141 221b 108
b 0.54
b 219
b 95
b 0.47
b
F1 Mean 349 228 0.68 393 210 0.57
Env. 3
Genotype effect <.0001† <.0001 .0001 <.0001
† <.0001 0.05
mg plant
-1
mg plant
-1
Altet-4 325
a‡ 290
a 0.81
a 445
a‡ 397
a 0.84
a
NECS-141 285a 156
b 0.53
b 352
b 214
b 0.64
b
F1 Mean 312 220 0.75 433 312 0.74
† p-values for genotype effect.
‡ Means followed by the same letter (within a column) are not significantly different (P < 0.05).
§The UL:L ratios were computed for each replication to enable a statistical analysis. Therefore,
they will not equal the ratio of UL:L LS means.
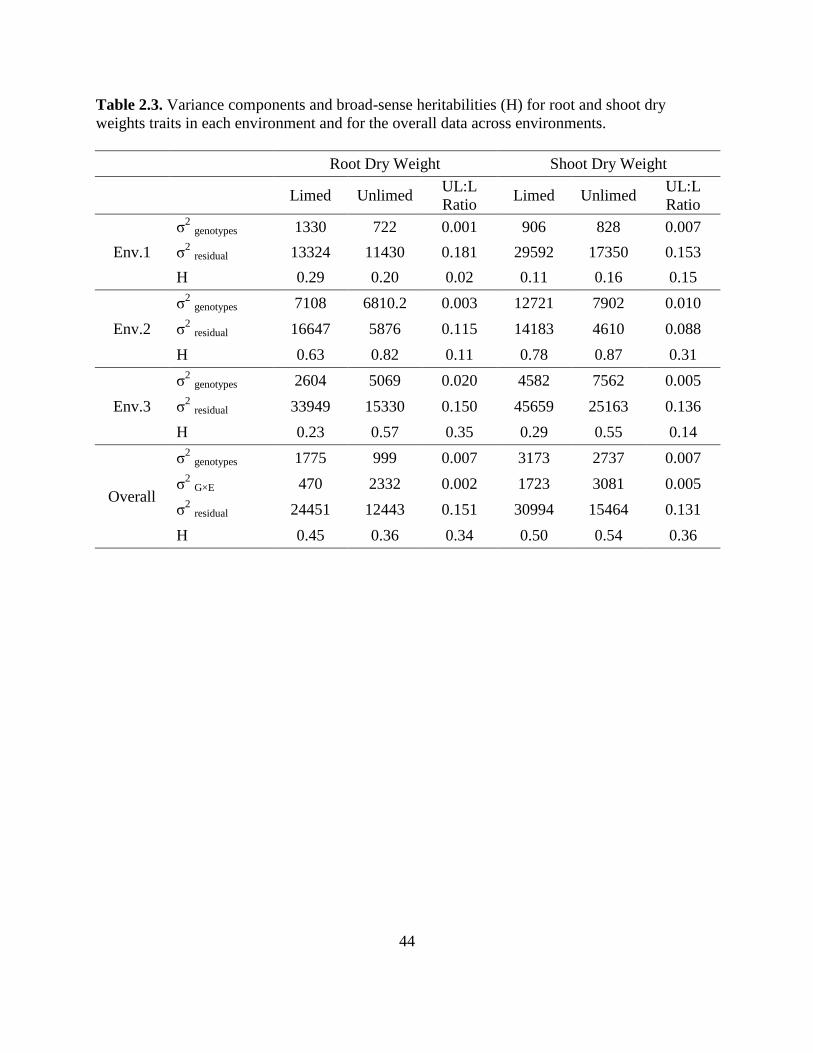
44
Table 2.3. Variance components and broad-sense heritabilities (H) for root and shoot dry
weights traits in each environment and for the overall data across environments.
Root Dry Weight Shoot Dry Weight
Limed Unlimed UL:L
Ratio Limed Unlimed
UL:L
Ratio
Env.1
σ2 genotypes 1330 722 0.001 906 828 0.007
σ2 residual 13324 11430 0.181 29592 17350 0.153
H 0.29 0.20 0.02 0.11 0.16 0.15
Env.2
σ2 genotypes 7108 6810.2 0.003 12721 7902 0.010
σ2 residual 16647 5876 0.115 14183 4610 0.088
H 0.63 0.82 0.11 0.78 0.87 0.31
Env.3
σ2 genotypes 2604 5069 0.020 4582 7562 0.005
σ2 residual 33949 15330 0.150 45659 25163 0.136
H 0.23 0.57 0.35 0.29 0.55 0.14
Overall
σ2 genotypes 1775 999 0.007 3173 2737 0.007
σ2 G×E 470 2332 0.002 1723 3081 0.005
σ2 residual 24451 12443 0.151 30994 15464 0.131
H 0.45 0.36 0.34 0.50 0.54 0.36
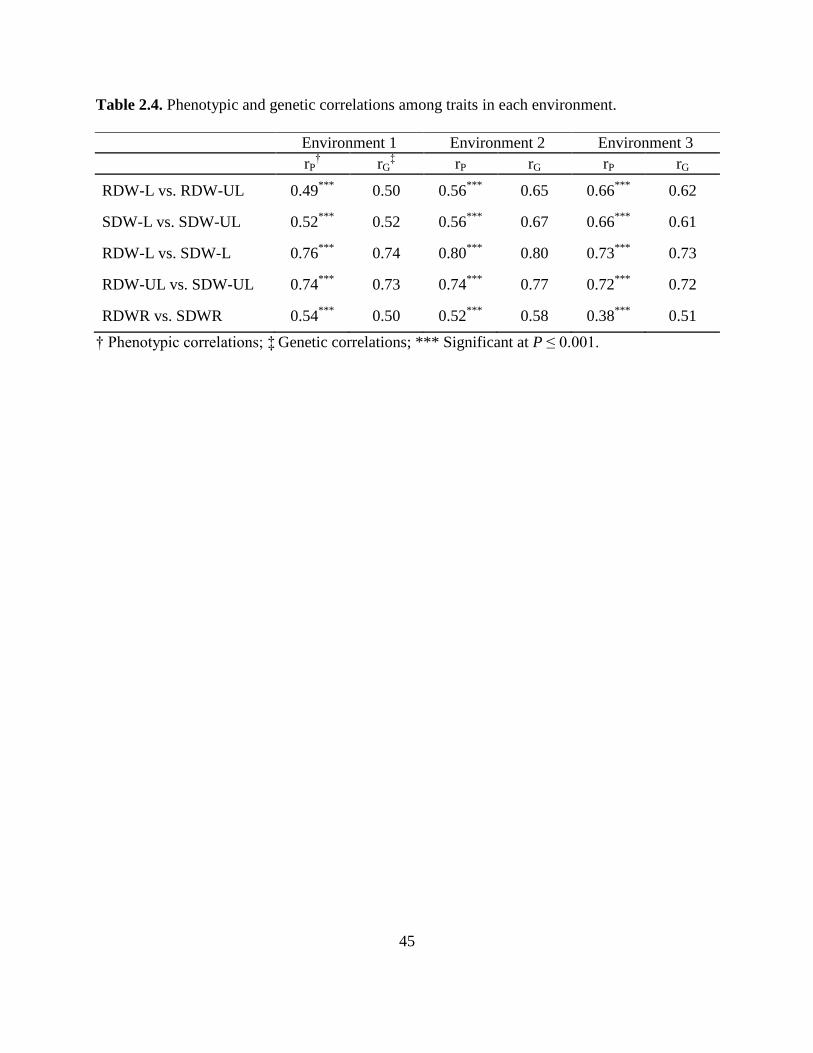
45
Table 2.4. Phenotypic and genetic correlations among traits in each environment.
Environment 1 Environment 2 Environment 3
rP† rG
‡ rP rG rP rG
RDW-L vs. RDW-UL 0.49***
0.50 0.56***
0.65 0.66***
0.62
SDW-L vs. SDW-UL 0.52***
0.52 0.56***
0.67 0.66***
0.61
RDW-L vs. SDW-L 0.76***
0.74 0.80***
0.80 0.73***
0.73
RDW-UL vs. SDW-UL 0.74***
0.73 0.74***
0.77 0.72***
0.72
RDWR vs. SDWR 0.54***
0.50 0.52***
0.58 0.38***
0.51
† Phenotypic correlations; ‡ Genetic correlations; *** Significant at P ≤ 0.001.
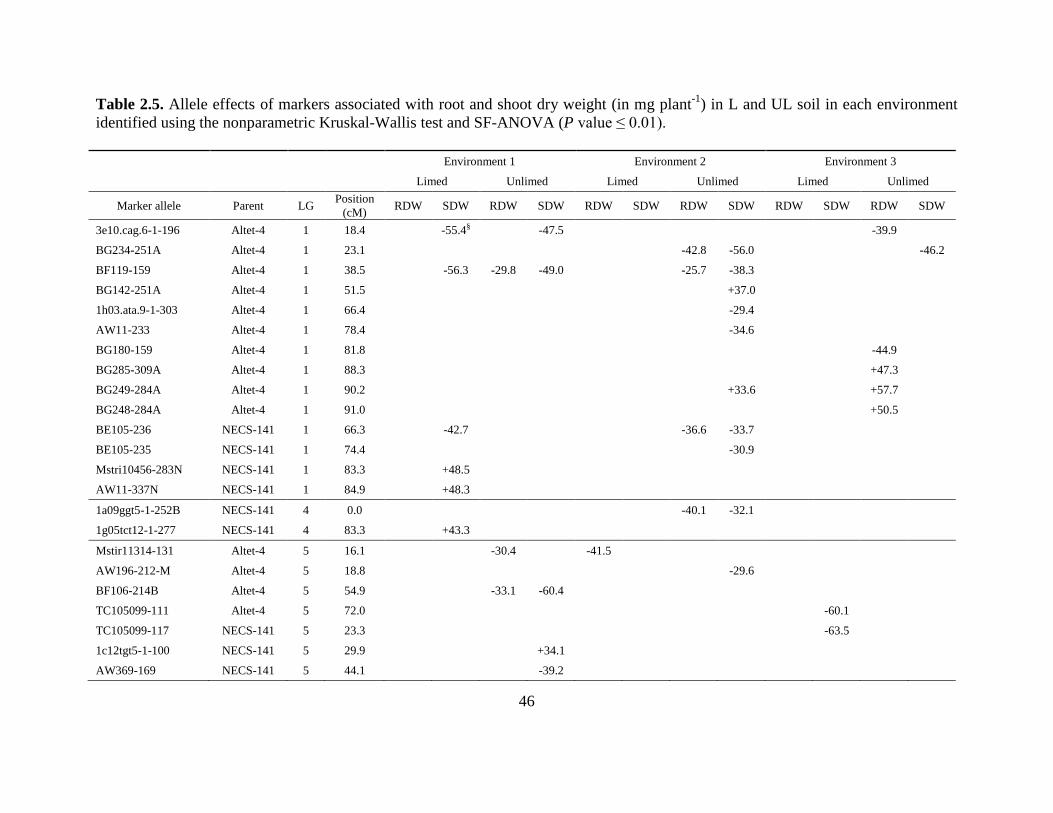
46
Table 2.5. Allele effects of markers associated with root and shoot dry weight (in mg plant-1
) in L and UL soil in each environment
identified using the nonparametric Kruskal-Wallis test and SF-ANOVA (P value ≤ 0.01).
Environment 1 Environment 2 Environment 3
Limed Unlimed Limed Unlimed Limed Unlimed
Marker allele Parent LG Position
(cM) RDW SDW RDW SDW RDW SDW RDW SDW RDW SDW RDW SDW
3e10.cag.6-1-196 Altet-4 1 18.4
-55.4§
-47.5
-39.9
BG234-251A Altet-4 1 23.1
-42.8 -56.0
-46.2
BF119-159 Altet-4 1 38.5
-56.3 -29.8 -49.0
-25.7 -38.3
BG142-251A Altet-4 1 51.5
+37.0
1h03.ata.9-1-303 Altet-4 1 66.4
-29.4
AW11-233 Altet-4 1 78.4
-34.6
BG180-159 Altet-4 1 81.8
-44.9
BG285-309A Altet-4 1 88.3
+47.3
BG249-284A Altet-4 1 90.2
+33.6
+57.7
BG248-284A Altet-4 1 91.0
+50.5
BE105-236 NECS-141 1 66.3
-42.7
-36.6 -33.7
BE105-235 NECS-141 1 74.4
-30.9
Mstri10456-283N NECS-141 1 83.3
+48.5
AW11-337N NECS-141 1 84.9
+48.3
1a09ggt5-1-252B NECS-141 4 0.0
-40.1 -32.1
1g05tct12-1-277 NECS-141 4 83.3
+43.3
Mstir11314-131 Altet-4 5 16.1
-30.4
-41.5
AW196-212-M Altet-4 5 18.8
-29.6
BF106-214B Altet-4 5 54.9
-33.1 -60.4
TC105099-111 Altet-4 5 72.0
-60.1
TC105099-117 NECS-141 5 23.3
-63.5
1c12tgt5-1-100 NECS-141 5 29.9
+34.1
AW369-169 NECS-141 5 44.1
-39.2
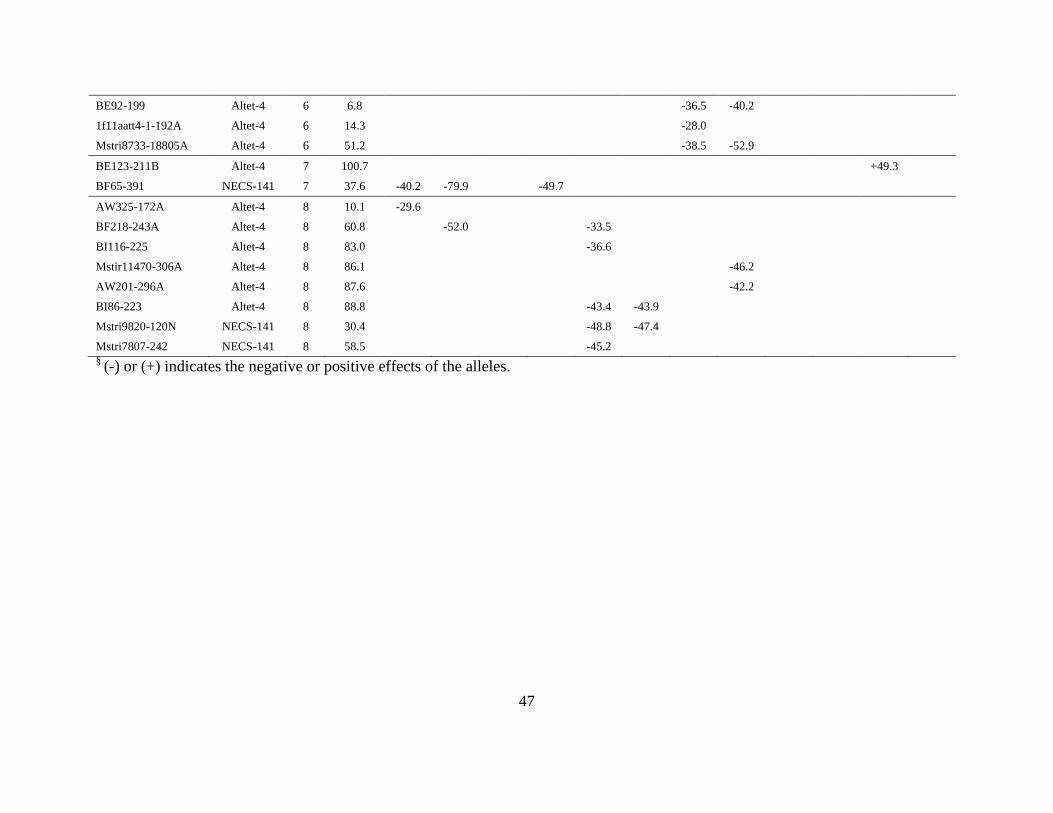
47
BE92-199 Altet-4 6 6.8
-36.5 -40.2
1f11aatt4-1-192A Altet-4 6 14.3
-28.0
Mstri8733-18805A Altet-4 6 51.2
-38.5 -52.9
BE123-211B Altet-4 7 100.7
+49.3
BF65-391 NECS-141 7 37.6 -40.2 -79.9
-49.7
AW325-172A Altet-4 8 10.1 -29.6
BF218-243A Altet-4 8 60.8
-52.0
-33.5
BI116-225 Altet-4 8 83.0
-36.6
Mstir11470-306A Altet-4 8 86.1
-46.2
AW201-296A Altet-4 8 87.6
-42.2
BI86-223 Altet-4 8 88.8
-43.4 -43.9
Mstri9820-120N NECS-141 8 30.4
-48.8 -47.4
Mstri7807-242 NECS-141 8 58.5
-45.2
§ (-) or (+) indicates the negative or positive effects of the alleles.
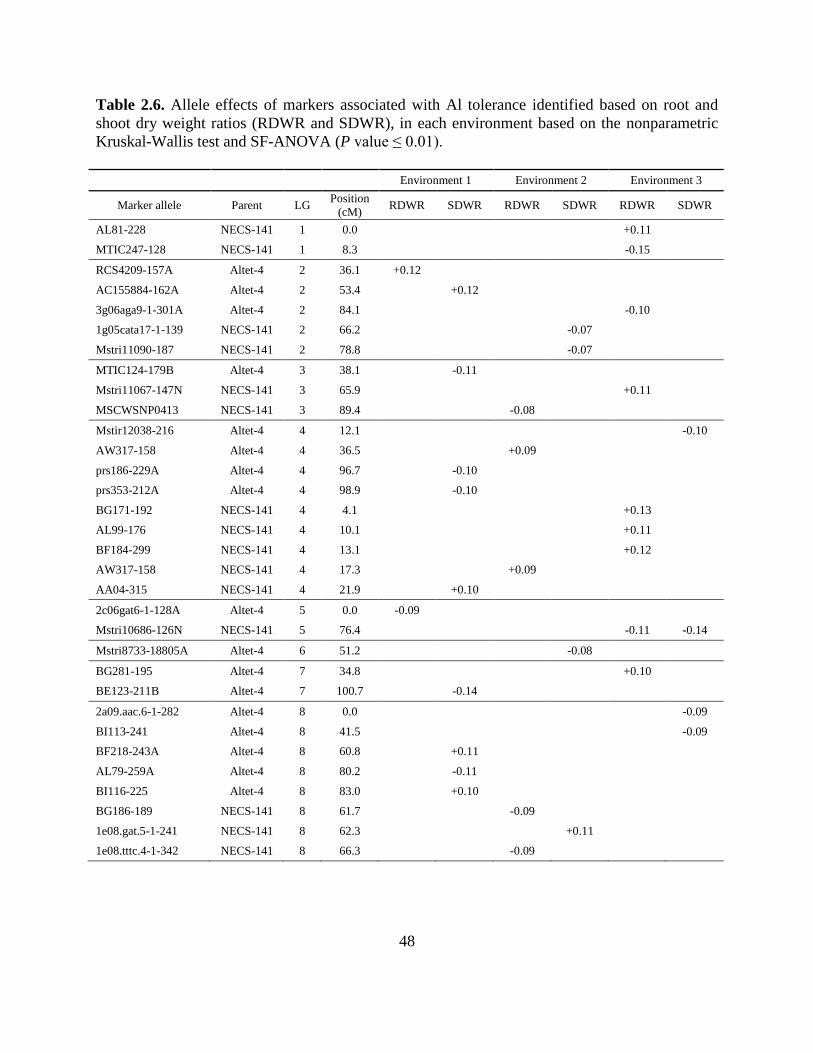
48
Table 2.6. Allele effects of markers associated with Al tolerance identified based on root and
shoot dry weight ratios (RDWR and SDWR), in each environment based on the nonparametric
Kruskal-Wallis test and SF-ANOVA (P value ≤ 0.01).
Environment 1 Environment 2 Environment 3
Marker allele Parent LG Position
(cM) RDWR SDWR RDWR SDWR RDWR SDWR
AL81-228 NECS-141 1 0.0
+0.11
MTIC247-128 NECS-141 1 8.3
-0.15
RCS4209-157A Altet-4 2 36.1 +0.12
AC155884-162A Altet-4 2 53.4
+0.12
3g06aga9-1-301A Altet-4 2 84.1
-0.10
1g05cata17-1-139 NECS-141 2 66.2
-0.07
Mstri11090-187 NECS-141 2 78.8
-0.07
MTIC124-179B Altet-4 3 38.1
-0.11
Mstri11067-147N NECS-141 3 65.9
+0.11
MSCWSNP0413 NECS-141 3 89.4
-0.08
Mstir12038-216 Altet-4 4 12.1
-0.10
AW317-158 Altet-4 4 36.5
+0.09
prs186-229A Altet-4 4 96.7
-0.10
prs353-212A Altet-4 4 98.9
-0.10
BG171-192 NECS-141 4 4.1
+0.13
AL99-176 NECS-141 4 10.1
+0.11
BF184-299 NECS-141 4 13.1
+0.12
AW317-158 NECS-141 4 17.3
+0.09
AA04-315 NECS-141 4 21.9
+0.10
2c06gat6-1-128A Altet-4 5 0.0 -0.09
Mstri10686-126N NECS-141 5 76.4
-0.11 -0.14
Mstri8733-18805A Altet-4 6 51.2
-0.08
BG281-195 Altet-4 7 34.8
+0.10
BE123-211B Altet-4 7 100.7
-0.14
2a09.aac.6-1-282 Altet-4 8 0.0
-0.09
BI113-241 Altet-4 8 41.5
-0.09
BF218-243A Altet-4 8 60.8
+0.11
AL79-259A Altet-4 8 80.2
-0.11
BI116-225 Altet-4 8 83.0
+0.10
BG186-189 NECS-141 8 61.7
-0.09
1e08.gat.5-1-241 NECS-141 8 62.3
+0.11
1e08.tttc.4-1-342 NECS-141 8 66.3
-0.09
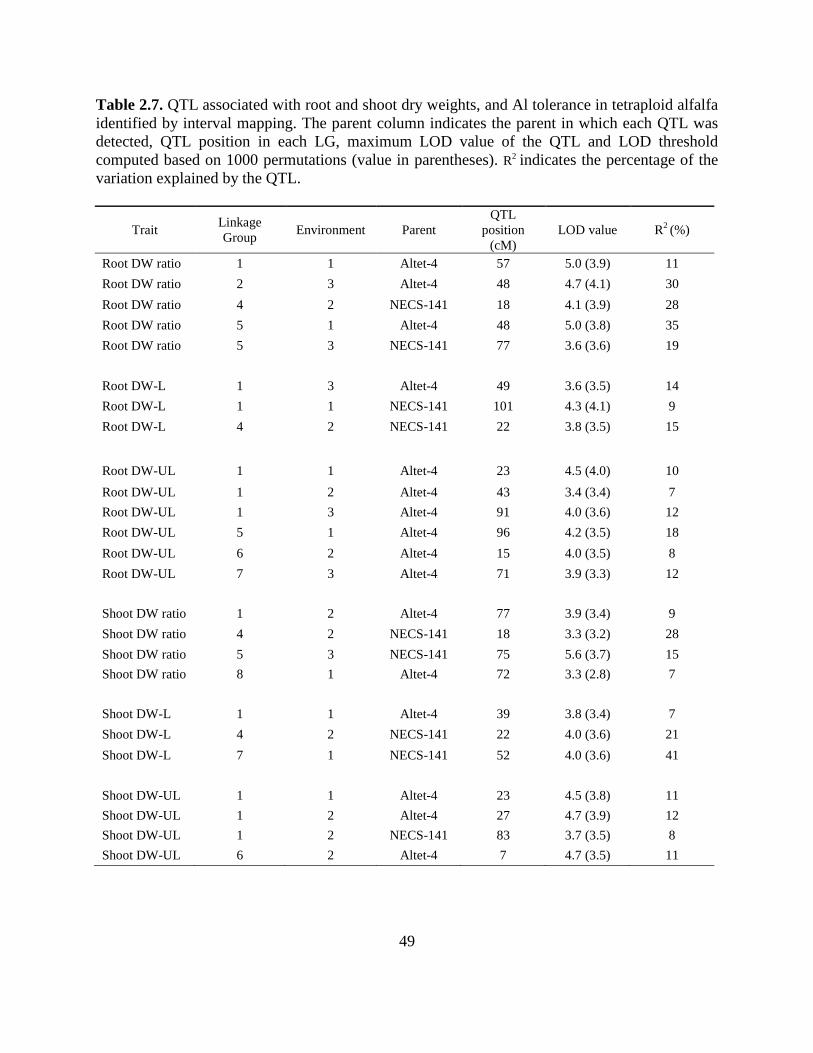
49
Table 2.7. QTL associated with root and shoot dry weights, and Al tolerance in tetraploid alfalfa
identified by interval mapping. The parent column indicates the parent in which each QTL was
detected, QTL position in each LG, maximum LOD value of the QTL and LOD threshold
computed based on 1000 permutations (value in parentheses). R2 indicates the percentage of the
variation explained by the QTL.
Trait Linkage
Group Environment Parent
QTL
position
(cM)
LOD value R2 (%)
Root DW ratio 1 1 Altet-4 57 5.0 (3.9) 11
Root DW ratio 2 3 Altet-4 48 4.7 (4.1) 30
Root DW ratio 4 2 NECS-141 18 4.1 (3.9) 28
Root DW ratio 5 1 Altet-4 48 5.0 (3.8) 35
Root DW ratio 5 3 NECS-141 77 3.6 (3.6) 19
Root DW-L 1 3 Altet-4 49 3.6 (3.5) 14
Root DW-L 1 1 NECS-141 101 4.3 (4.1) 9
Root DW-L 4 2 NECS-141 22 3.8 (3.5) 15
Root DW-UL 1 1 Altet-4 23 4.5 (4.0) 10
Root DW-UL 1 2 Altet-4 43 3.4 (3.4) 7
Root DW-UL 1 3 Altet-4 91 4.0 (3.6) 12
Root DW-UL 5 1 Altet-4 96 4.2 (3.5) 18
Root DW-UL 6 2 Altet-4 15 4.0 (3.5) 8
Root DW-UL 7 3 Altet-4 71 3.9 (3.3) 12
Shoot DW ratio 1 2 Altet-4 77 3.9 (3.4) 9
Shoot DW ratio 4 2 NECS-141 18 3.3 (3.2) 28
Shoot DW ratio 5 3 NECS-141 75 5.6 (3.7) 15
Shoot DW ratio 8 1 Altet-4 72 3.3 (2.8) 7
Shoot DW-L 1 1 Altet-4 39 3.8 (3.4) 7
Shoot DW-L 4 2 NECS-141 22 4.0 (3.6) 21
Shoot DW-L 7 1 NECS-141 52 4.0 (3.6) 41
Shoot DW-UL 1 1 Altet-4 23 4.5 (3.8) 11
Shoot DW-UL 1 2 Altet-4 27 4.7 (3.9) 12
Shoot DW-UL 1 2 NECS-141 83 3.7 (3.5) 8
Shoot DW-UL 6 2 Altet-4 7 4.7 (3.5) 11
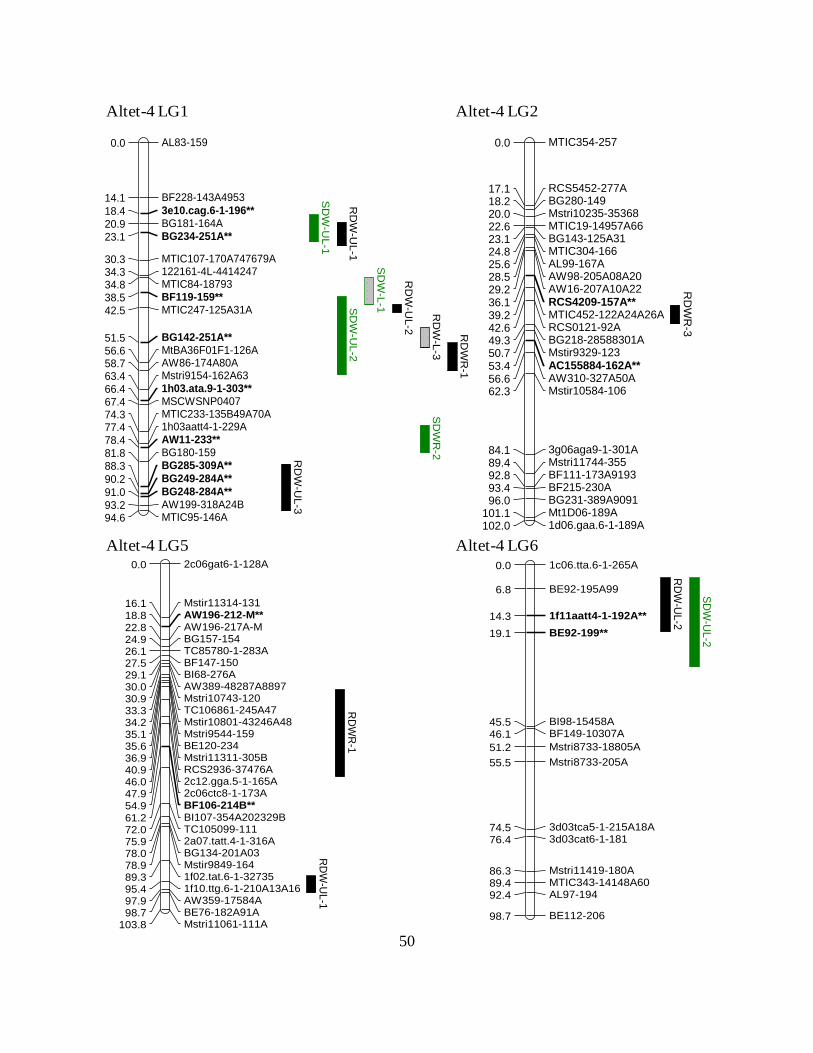
50
2c06gat6-1-128A0.0
Mstir11314-13116.1AW196-212-M**18.8AW196-217A-M22.8BG157-15424.9TC85780-1-283A26.1BF147-15027.5BI68-276A29.1AW389-48287A889730.0Mstri10743-12030.9TC106861-245A4733.3Mstir10801-43246A4834.2Mstri9544-15935.1BE120-23435.6Mstri11311-305B36.9RCS2936-37476A40.92c12.gga.5-1-165A46.02c06ctc8-1-173A47.9BF106-214B**54.9BI107-354A202329B61.2TC105099-11172.02a07.tatt.4-1-316A75.9BG134-201A0378.0Mstir9849-16478.91f02.tat.6-1-3273589.31f10.ttg.6-1-210A13A1695.4AW359-17584A97.9BE76-182A91A98.7Mstri11061-111A103.8
RD
W-U
L-1
RD
WR
-1
LG5 Altet-4
1c06.tta.6-1-265A0.0
BE92-195A996.8
1f11aatt4-1-192A**14.3
BE92-199**19.1
BI98-15458A45.5BF149-10307A46.1
Mstri8733-18805A51.2
Mstri8733-205A55.5
3d03tca5-1-215A18A74.53d03cat6-1-18176.4
Mstri11419-180A86.3MTIC343-14148A6089.4AL97-19492.4
BE112-20698.7
RD
W-U
L-2
SD
W-U
L-2
LG6 Altet-4
BE92-1990.0
BI98-15458A26.4BF149-10307A27.0
Mstri8733-18805A32.1
MTIC343-14148A6070.3
BE112-20679.6
H1
1f11aatt4-1-192A6.3
BI98-15458A37.5BF149-10307A38.1
Mstri8733-205A47.5
3d03tca5-1-215A18A66.53d03cat6-1-18168.4
MTIC343-14148A6081.4AL97-19484.4
H2
BI98-15458A9.3BF149-10307A9.9
3d03tca5-1-215A18A38.3
Mstri11419-180A50.1MTIC343-14148A6053.2
H3
AL83-1590.0
BF228-143A495314.13e10.cag.6-1-196**18.4BG181-164A20.9BG234-251A**23.1
MTIC107-170A747679A30.3122161-4L-441424734.3MTIC84-1879334.8BF119-159**38.5MTIC247-125A31A42.5
BG142-251A**51.5MtBA36F01F1-126A56.6AW86-174A80A58.7Mstri9154-162A6363.41h03.ata.9-1-303**66.4MSCWSNP040767.4MTIC233-135B49A70A74.31h03aatt4-1-229A77.4AW11-233**78.4BG180-15981.8BG285-309A**88.3BG249-284A**90.2BG248-284A**91.0AW199-318A24B93.2MTIC95-146A94.6
RD
W-U
L-3
SD
W-U
L-1
RD
W-U
L-1
SD
W-U
L-2
SD
W-L
-1
RD
W-U
L-2
RD
W-L
-3S
DW
R-2
RD
WR
-1
LG1 Altet-4
BF228-143A49531.4
3e10.cag.6-1-1965.7
BG234-251A10.4
MTIC107-170A747679A17.6122161-4L-441424721.6MTIC84-1879322.1BF119-15925.8MTIC247-125A31A29.8
AW86-174A80A46.0
Mstri9154-162A6350.71h03.ata.9-1-30353.7
MTIC233-135B49A70A61.6
AW11-23365.7BG180-15969.1
AW199-318A24B80.5
H1
BF228-143A49530.0
BG234-251A9.0
MTIC107-170A747679A16.2
122161-4L-441424720.2
MTIC247-125A31A28.4
BG142-251A37.4
AW86-174A80A44.6
Mstri9154-162A6349.3
MTIC233-135B49A70A60.21h03aatt4-1-229A63.3
BG285-309A74.2BG249-284A76.1BG248-284A76.9AW199-318A24B79.1MTIC95-146A80.5
H2
MTIC354-2570.0
RCS5452-277A17.1BG280-14918.2Mstri10235-3536820.0MTIC19-14957A6622.6BG143-125A3123.1MTIC304-16624.8AL99-167A25.6AW98-205A08A2028.5AW16-207A10A2229.2RCS4209-157A**36.1MTIC452-122A24A26A39.2RCS0121-92A42.6BG218-28588301A49.3Mstir9329-12350.7AC155884-162A**53.4AW310-327A50A56.6Mstir10584-10662.3
3g06aga9-1-301A84.1Mstri11744-35589.4BF111-173A919392.8BF215-230A93.4BG231-389A909196.0Mt1D06-189A101.11d06.gaa.6-1-189A102.0
RD
WR
-3
LG2 Altet-4
MTIC354-2570.0
RCS5452-277A17.1BG280-14918.2Mstri10235-3536820.0MTIC19-14957A6622.6MTIC304-16624.8AL99-167A25.6AW98-205A08A2028.5AW16-207A10A2229.2
MTIC452-122A24A26A39.2
BG218-28588301A49.3Mstir9329-12350.7
AW310-327A50A56.6
Mstir10584-10662.3
3g06aga9-1-301A84.1Mstri11744-35589.4BF111-173A919392.8BF215-230A93.4BG231-389A909196.0Mt1D06-189A101.11d06.gaa.6-1-189A102.0
H1
MTIC19-14957A666.0BG143-125A316.5AW98-205A08A2011.9AW16-207A10A2212.6
RCS4209-157A19.5MTIC452-122A24A26A22.6RCS0121-92A26.0
BG218-28588301A32.7
AC155884-162A36.8AW310-327A50A40.0
BF111-173A919376.2BG231-389A909179.4
H2
Altet-4 LG1 Altet-4 LG2
Altet-4 LG5 Altet-4 LG6
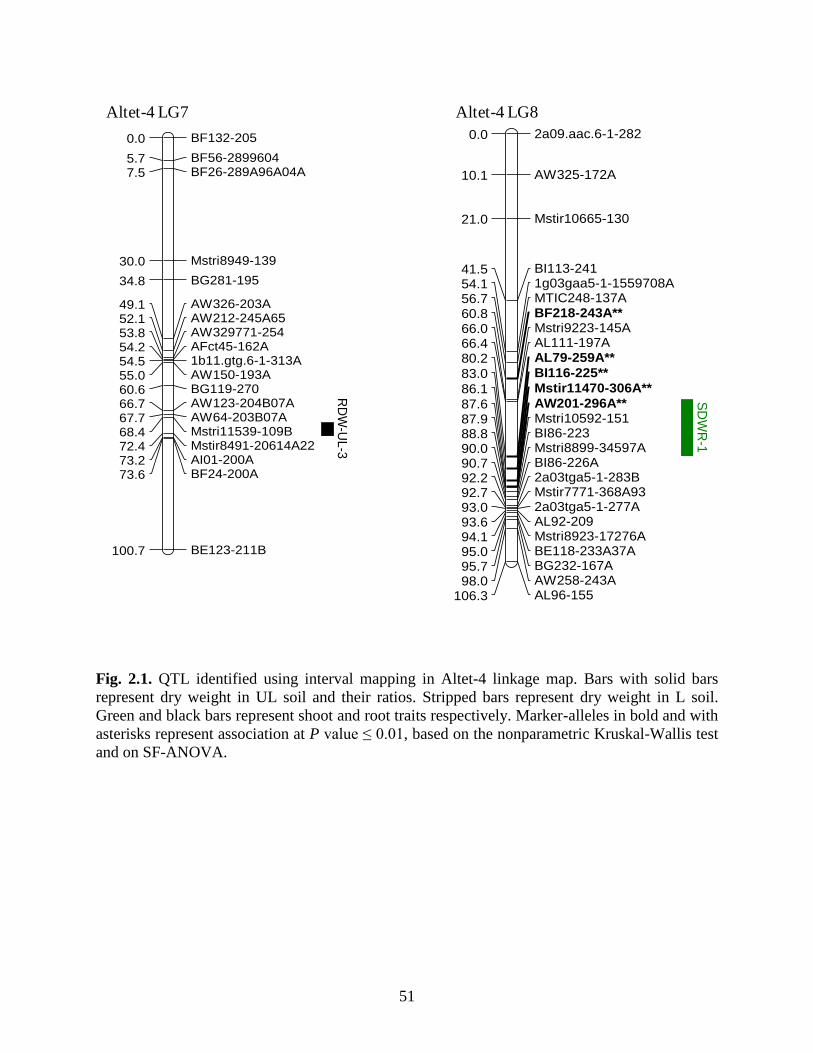
51
Fig. 2.1. QTL identified using interval mapping in Altet-4 linkage map. Bars with solid bars
represent dry weight in UL soil and their ratios. Stripped bars represent dry weight in L soil.
Green and black bars represent shoot and root traits respectively. Marker-alleles in bold and with
asterisks represent association at P value ≤ 0.01, based on the nonparametric Kruskal-Wallis test
and on SF-ANOVA.
Altet-4 LG7 Altet-4 LG8
BF132-2050.0
BF56-28996045.7BF26-289A96A04A7.5
Mstri8949-13930.0
BG281-19534.8
AW326-203A49.1AW212-245A6552.1AW329771-25453.8AFct45-162A54.21b11.gtg.6-1-313A54.5AW150-193A55.0BG119-27060.6AW123-204B07A66.7AW64-203B07A67.7Mstri11539-109B68.4Mstir8491-20614A2272.4AI01-200A73.2BF24-200A73.6
BE123-211B100.7
RD
W-U
L-3
LG7 Altet-4
BF24-200A27.1AI01-200A27.5Mstir8491-20614A2228.3AW64-203B07A33.0AW123-204B07A34.0
AW150-193A45.7AFct45-162A46.5AW329771-25446.9AW212-245A6548.6AW326-203A51.6
BG281-19565.9
BF132-205100.7
H1
BE123-211B0.0
Mstir8491-20614A2228.3Mstri11539-109B32.3AW64-203B07A33.0AW123-204B07A34.0BG119-27040.1
1b11.gtg.6-1-313A46.2AW212-245A6548.6
BF26-289A96A04A93.2BF56-289960495.0
H2
Mstir8491-20614A2228.3
BF26-289A96A04A93.2BF56-289960495.0
H3
2a09.aac.6-1-2820.0
AW325-172A10.1
Mstir10665-13021.0
BI113-24141.51g03gaa5-1-1559708A54.1MTIC248-137A56.7BF218-243A**60.8Mstri9223-145A66.0AL111-197A66.4AL79-259A**80.2BI116-225**83.0Mstir11470-306A**86.1AW201-296A**87.6Mstri10592-15187.9BI86-22388.8Mstri8899-34597A90.0BI86-226A90.72a03tga5-1-283B92.2Mstir7771-368A9392.72a03tga5-1-277A93.0AL92-20993.6Mstri8923-17276A94.1BE118-233A37A95.0BG232-167A95.7AW258-243A98.0AL96-155106.3
SD
WR
-1
LG8 Altet-4
2a09.aac.6-1-2820.0
BI113-24141.5
1g03gaa5-1-1559708A54.1MTIC248-137A56.7
Mstir11470-306A86.1AW201-296A87.6Mstri10592-15187.92a03tga5-1-283B92.2AL92-20993.6Mstri8923-17276A94.1BE118-233A37A95.0BG232-167A95.7AL96-155106.3
H1
AW325-172A10.1
1g03gaa5-1-1559708A54.1
BF218-243A60.8
BI116-22583.0Mstir11470-306A86.1AW201-296A87.6BI86-22388.8Mstri8899-34597A90.0Mstir7771-368A9392.7Mstri8923-17276A94.1
H2
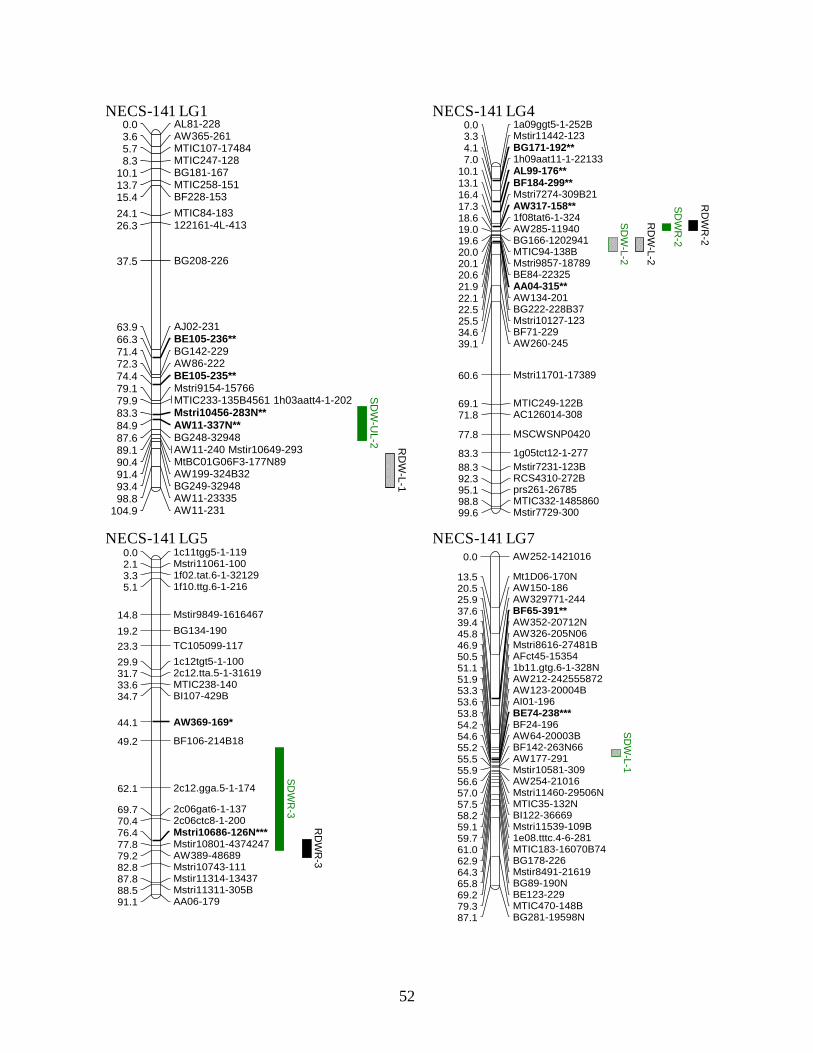
52
1a09ggt5-1-252B0.0Mstir11442-1233.3BG171-192**4.11h09aat11-1-221337.0AL99-176**10.1BF184-299**13.1Mstri7274-309B2116.4AW317-158**17.31f08tat6-1-32418.6AW285-1194019.0BG166-120294119.6MTIC94-138B20.0Mstri9857-1878920.1BE84-2232520.6AA04-315**21.9AW134-20122.1BG222-228B3722.5Mstri10127-12325.5BF71-22934.6AW260-24539.1
Mstri11701-1738960.6
MTIC249-122B69.1AC126014-30871.8
MSCWSNP042077.8
1g05tct12-1-27783.3
Mstir7231-123B88.3RCS4310-272B92.3prs261-2678595.1MTIC332-148586098.8Mstir7729-30099.6
SD
W-L
-2
RD
W-L
-2
SD
WR
-2
RD
WR
-2LG4 Necs-141
BG166-12029410.0Mstri9857-187890.5BE84-223251.0
Mstri11701-1738941.0
MTIC332-148586079.2Mstir7729-30080.0
H1
BG171-1920.81h09aat11-1-221333.7AL99-1766.8BF184-2999.8Mstri7274-309B2113.1AW317-15814.0AW285-1194015.7MTIC94-138B16.7BE84-2232517.3
Mstri11701-1738957.3
MTIC249-122B65.8
prs261-2678591.8
MTIC332-148586095.5
H2
1a09ggt5-1-252B0.8Mstir11442-1234.1
Mstri7274-309B2117.2BG166-120294120.4Mstri9857-1878920.9AA04-31522.7BG222-228B3723.3Mstri10127-12326.3
AW260-24539.9
1g05tct12-1-27784.1
Mstir7231-123B89.1
RCS4310-272B93.1prs261-2678595.9MTIC332-148586099.6
H3NECS-141 LG1 NECS-141 LG4
NECS-141 LG5 NECS-141 LG71c11tgg5-1-1190.0Mstri11061-1002.11f02.tat.6-1-321293.31f10.ttg.6-1-2165.1
Mstir9849-161646714.8
BG134-19019.2
TC105099-11723.3
1c12tgt5-1-10029.92c12.tta.5-1-3161931.7MTIC238-14033.6BI107-429B34.7
AW369-169*44.1
BF106-214B1849.2
2c12.gga.5-1-17462.1
2c06gat6-1-13769.72c06ctc8-1-20070.4Mstri10686-126N***76.4Mstir10801-437424777.8AW389-4868979.2Mstri10743-11182.8Mstir11314-1343787.8Mstri11311-305B88.5AA06-17991.1
SD
WR
-3
RD
WR
-3LG5 Necs-141
Mstir9849-16164670.0
1c12tgt5-1-10015.12c12.tta.5-1-3161916.9
2c12.gga.5-1-17447.3
2c06gat6-1-13754.9
Mstir10801-437424763.0
Mstri10743-11168.0
Mstir11314-1343773.0AA06-17976.3
H1
Mstri11061-1003.31f02.tat.6-1-321294.5
Mstir9849-161646716.0
TC105099-11724.5
1c12tgt5-1-10031.1
MTIC238-14034.8
2c06ctc8-1-20071.6
Mstri10686-126N77.6Mstir10801-437424779.0AW389-4868980.4
Mstir11314-1343789.0
H2
1f02.tat.6-1-321292.6
Mstir9849-161646714.1
MTIC238-14032.9BI107-429B34.0
AW369-16943.4
BF106-214B1848.5
Mstir10801-437424777.1AW389-4868978.5Mstri10743-11182.1Mstir11314-1343787.1Mstri11311-305B87.8
H3
AW252-14210160.0
Mt1D06-170N13.5AW150-18620.5AW329771-24425.9BF65-391**37.6AW352-20712N39.4AW326-205N0645.8Mstri8616-27481B46.9AFct45-1535450.51b11.gtg.6-1-328N51.1AW212-24255587251.9AW123-20004B53.3AI01-19653.6BE74-238***53.8BF24-19654.2AW64-20003B54.6BF142-263N6655.2AW177-29155.5Mstir10581-30955.9AW254-2101656.6Mstri11460-29506N57.0MTIC35-132N57.5BI122-3666958.2Mstri11539-109B59.11e08.tttc.4-6-28159.7MTIC183-16070B7461.0BG178-22662.9Mstir8491-2161964.3BG89-190N65.8BE123-22969.2MTIC470-148B79.3BG281-19598N87.1
SD
W-L
-1
LG7 Necs-141
AW252-14210160.0
Mt1D06-170N13.5
AW150-18620.5
AW329771-24425.9
AW326-205N0645.8Mstri8616-27481B46.9AFct45-1535450.51b11.gtg.6-1-328N51.1AW212-24255587251.9AW123-20004B53.3AW64-20003B54.6BF142-263N6655.2AW177-29155.5MTIC35-132N57.5Mstri11539-109B59.11e08.tttc.4-6-28159.7MTIC183-16070B7461.0Mstir8491-2161964.3BG89-190N65.8
H1
AW150-18620.5
AW329771-24425.9
BF65-39137.6AW352-20712N39.4AFct45-1535450.5AW212-24255587251.9AI01-19653.6BE74-23853.8BF24-19654.2AW64-20003B54.6BF142-263N6655.2AW254-2101656.6Mstri11460-29506N57.0BI122-3666958.21e08.tttc.4-6-28159.7MTIC183-16070B7461.0Mstir8491-2161964.3
MTIC470-148B79.3
BG281-19598N87.1
H2
AW352-20712N39.4
Mstri8616-27481B46.9AFct45-1535450.5AW212-24255587251.9BE74-23853.8AW254-2101656.6Mstri11460-29506N57.0BI122-3666958.2MTIC183-16070B7461.0BG178-22662.9BG89-190N65.8BE123-22969.2
H3
AL81-2280.0AW365-2613.6MTIC107-174845.7MTIC247-1288.3BG181-16710.1MTIC258-15113.7BF228-15315.4
MTIC84-18324.1122161-4L-41326.3
BG208-22637.5
AJ02-23163.9BE105-236**66.3BG142-22971.4AW86-22272.3BE105-235**74.4Mstri9154-1576679.1MTIC233-135B4561 1h03aatt4-1-20279.9Mstri10456-283N**83.3AW11-337N**84.9BG248-3294887.6AW11-240 Mstir10649-29389.1MtBC01G06F3-177N8990.4AW199-324B3291.4BG249-3294893.4AW11-2333598.8AW11-231104.9
SD
W-U
L-2
RD
W-L
-1
LG1 Necs-141
AL81-2280.0AW365-2613.6MTIC107-174845.7BG181-16710.1
MTIC84-18324.1
BG208-22637.5
AJ02-23163.9
AW86-22272.3Mstri9154-1576679.1MTIC233-135B456179.9Mstri10456-283N83.3BG248-3294887.6AW11-240 Mstir10649-29389.1MtBC01G06F3-177N8990.4AW199-324B3291.4BG249-3294893.4AW11-2333598.8AW11-231104.9
H1
MTIC107-174846.1
MTIC258-15114.1BF228-15315.8
MTIC233-135B456180.3
MtBC01G06F3-177N8990.8
AW11-2333599.2
H2

53
Fig. 2.2. QTL identified with interval mapping in NECS-141 linkage map. Solid bars represent
dry weight in UL soil and their ratios. Stripped bars represent dry weight in L soil. Green and
black bars represent shoot and root traits respectively. Marker-alleles in bold and with an asterisk
represent association at P value ≤ 0.01, based on the nonparametric Kruskal-Wallis test and SF-
ANOVA.
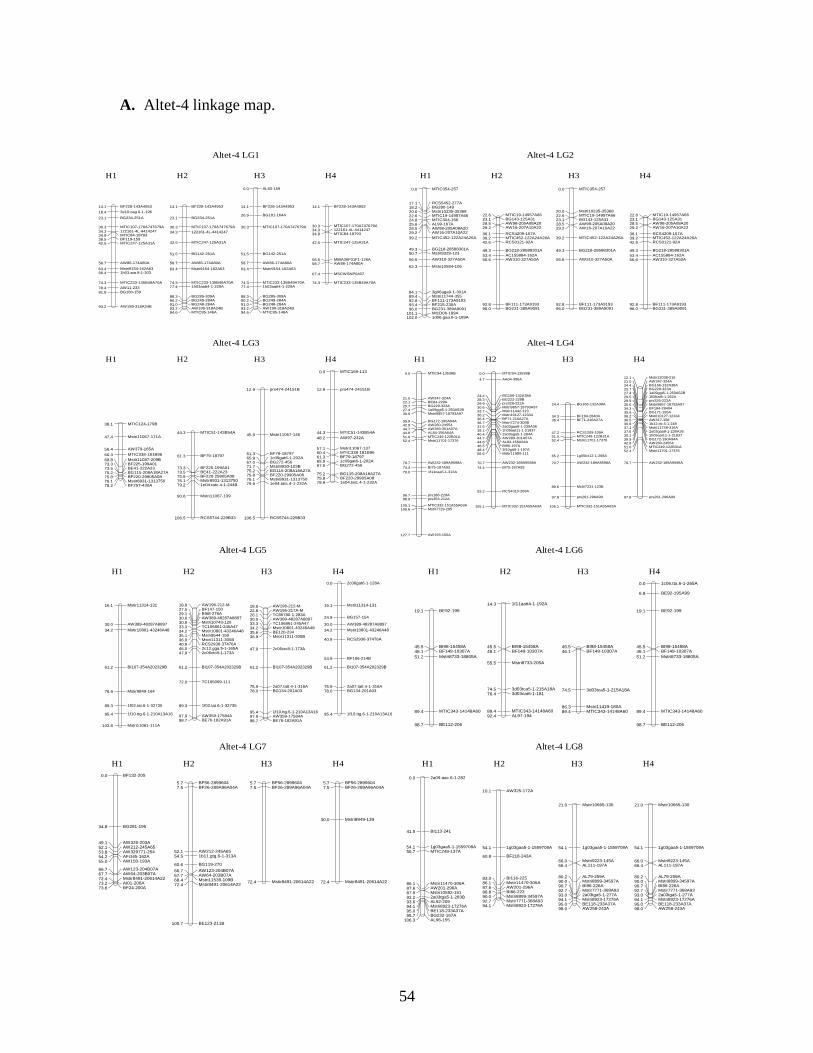
54
A. Altet-4 linkage map.
H1 H2 H3 H4 H1 H2 H3 H4
H1 H2 H3 H4 H1 H2 H3 H4
Altet-4 LG1 Altet-4 LG2
Altet-4 LG3 Altet-4 LG4
BF228-143A495314.1
3e10.cag.6-1-19618.4
BG234-251A23.1
MTIC107-170A747679A30.3122161-4L-441424734.3MTIC84-1879334.8BF119-15938.5MTIC247-125A31A42.5
AW86-174A80A58.7
Mstri9154-162A6363.41h03.ata.9-1-30366.4
MTIC233-135B49A70A74.3
AW11-23378.4BG180-15981.8
AW199-318A24B93.2
H1
BF228-143A495314.1
BG234-251A23.1
MTIC107-170A747679A30.3
122161-4L-441424734.3
MTIC247-125A31A42.5
BG142-251A51.5
AW86-174A80A58.7
Mstri9154-162A6363.4
MTIC233-135B49A70A74.31h03aatt4-1-229A77.4
BG285-309A88.3BG249-284A90.2BG248-284A91.0AW199-318A24B93.2MTIC95-146A94.6
H2
AL83-1590.0
BF228-143A495314.1
BG181-164A20.9
MTIC107-170A747679A30.3
BG142-251A51.5
AW86-174A80A58.7
Mstri9154-162A6363.4
MTIC233-135B49A70A74.31h03aatt4-1-229A77.4
BG285-309A88.3BG249-284A90.2BG248-284A91.0AW199-318A24B93.2MTIC95-146A94.6
H3
BF228-143A495314.1
MTIC107-170A747679A30.3122161-4L-441424734.3MTIC84-1879334.8
MTIC247-125A31A42.5
MtBA36F01F1-126A56.6AW86-174A80A58.7
MSCWSNP040767.4
MTIC233-135B49A70A74.3
H4
MTIC354-2570.0
RCS5452-277A17.1BG280-14918.2Mstri10235-3536820.0MTIC19-14957A6622.6MTIC304-16624.8AL99-167A25.6AW98-205A08A2028.5AW16-207A10A2229.2
MTIC452-122A24A26A39.2
BG218-28588301A49.3Mstir9329-12350.7
AW310-327A50A56.6
Mstir10584-10662.3
3g06aga9-1-301A84.1Mstri11744-35589.4BF111-173A919392.8BF215-230A93.4BG231-389A909196.0Mt1D06-189A101.11d06.gaa.6-1-189A102.0
H1
MTIC19-14957A6622.6BG143-125A3123.1AW98-205A08A2028.5AW16-207A10A2229.2
RCS4209-157A36.1MTIC452-122A24A26A39.2RCS0121-92A42.6
BG218-28588301A49.3
AC155884-162A53.4AW310-327A50A56.6
BF111-173A919392.8BG231-389A909196.0
H2
MTIC354-2570.0
Mstri10235-3536820.0MTIC19-14957A6622.6BG143-125A3123.1AW98-205A08A2028.5AW16-207A10A2229.2
MTIC452-122A24A26A39.2
BG218-28588301A49.3
AW310-327A50A56.6
BF111-173A919392.8BG231-389A909196.0
H3
MTIC19-14957A6622.6BG143-125A3123.1AW98-205A08A2028.5AW16-207A10A2229.2
RCS4209-157A36.1MTIC452-122A24A26A39.2RCS0121-92A42.6
BG218-28588301A49.3
AC155884-162A53.4AW310-327A50A56.6
BF111-173A919392.8BG231-389A909196.0
H4
MTIC124-179B38.1
Mstri11067-171A47.4
AW379-165A56.4
MTIC338-181B9660.4
Mstir11087-209B68.8BF225-199A0173.3BE41-222A2373.5BG115-208A18A27A75.2BF220-29905A0875.8Mstir8931-131375076.1BF257-430A78.2
H1
MTIC51-143B54A44.3
BF79-1879761.3
BF225-199A0173.3BE41-222A2373.5BF220-29905A0875.8Mstir8931-131375076.11e04.tatc.4-1-244B79.2
Mstri11067-13990.6
RCS5744-229B33106.5
H2
prs474-24151B12.9
Mstri11067-14545.9
BF79-1879761.31c09gat6-1-202A65.9BG272-45667.0Mstri8930-103B71.7BG115-208A18A27A75.2BF220-29905A0875.8Mstir8931-131375076.11e04.tatc.4-1-232A79.9
RCS5744-229B33106.5
H3
MTIC169-1130.0
prs474-24151B12.9
MTIC51-143B54A44.3
AW97-232A48.2
Mstri11067-13757.1MTIC338-181B9660.4BF79-1879761.31c09gat6-1-202A65.9BG272-45667.0
BG115-208A18A27A75.2BF220-29905A0875.81e04.tatc.4-1-232A79.9
H4
MTIC94-13538B0.0
AW347-324A21.0BE84-229A22.1BG229-323A25.71a09ggt5-1-250A52B27.4Mstri9857-18793A9730.6
BG172-190A94A39.9AW260-2455442.9AW289-301A07A44.7AL84-156A64A44.8MTIC249-122B31A51.0Mstri11701-1737652.4
AW232-189A9598A70.7
BI75-187A9374.4
1f11caa5-1-313A78.0
prs186-229A96.7prs353-212A98.9
MTIC332-151A55A63A105.1Mstir7729-295106.6
AW193-150A127.7
H1
MTIC94-13538B0.0
AA04-306A4.7
BG166-132A38A24.4BG222-228B28.3prs326-222A29.9Mstri9857-18793A9730.6Mstir11442-12333.7Mstri10127-1233436.2BF71-216A27A36.4Mstri7274-309B36.72a03gaa8-1-230A3637.61h09aat11-1-2183739.12a03aga5-1-284A40.4AW289-301A07A44.7AL84-156A64A44.8BI96-197A46.53f10gtt8-1-197A48.4Mstir11989-11156.6
AW232-189A9598A70.7
BI75-187A9374.4
RCS4310-269A93.2
MTIC332-151A55A63A105.1
H2
BG166-132A38A24.4
BF184-2840434.3BF71-216A27A36.4
RCS1209-109A47.2MTIC249-122B31A51.0Mstri11701-1737652.4
1g05tct12-1-268A65.2
AW232-189A9598A70.7
Mstir7231-123B89.6
prs261-296A9997.8
MTIC332-151A55A63A105.1
H3
Mstir12038-21612.1AW347-324A21.0BG166-132A38A24.4BG229-323A25.71a09ggt5-1-250A52B27.41f08tat6-1-262A29.5prs326-222A29.9Mstri9857-18793A9730.6BF184-2840434.3BG171-195A35.6Mstri10127-1233436.2AW317-15836.51b12.ttc.5-1-24836.8Mstri11748-316A37.12a03gaa8-1-230A3637.61h09aat11-1-2183739.1BG172-190A94A39.9AW260-2455442.9MTIC249-122B31A51.0Mstri11701-1737652.4
AW232-189A9598A70.7
prs261-296A9997.8
H4
H1 H2 H3 H4 H1 H2 H3 H4
H1 H2 H3 H4 H1 H2 H3 H4
Altet-4 LG5 Altet-4 LG6
Altet-4 LG7 Altet-4 LG8
Mstir11314-13116.1
AW389-48287A889730.0
Mstir10801-43246A4834.2
BI107-354A202329B61.2
Mstir9849-16478.9
1f02.tat.6-1-3273589.3
1f10.ttg.6-1-210A13A1695.4
Mstri11061-111A103.8
H1
AW196-212-M18.8BF147-15027.5BI68-276A29.1AW389-48287A889730.0Mstri10743-12030.9TC106861-245A4733.3Mstir10801-43246A4834.2Mstri9544-15935.1Mstri11311-305B36.9RCS2936-37476A40.92c12.gga.5-1-165A46.02c06ctc8-1-173A47.9
BI107-354A202329B61.2
TC105099-11172.0
1f02.tat.6-1-3273589.3
AW359-17584A97.9BE76-182A91A98.7
H2
AW196-212-M18.8AW196-217A-M22.8TC85780-1-283A26.1AW389-48287A889730.0TC106861-245A4733.3Mstir10801-43246A4834.2BE120-23435.6Mstri11311-305B36.9
2c06ctc8-1-173A47.9
BI107-354A202329B61.2
2a07.tatt.4-1-316A75.9BG134-201A0378.0
1f10.ttg.6-1-210A13A1695.4AW359-17584A97.9BE76-182A91A98.7
H3
2c06gat6-1-128A0.0
Mstir11314-13116.1
BG157-15424.9
AW389-48287A889730.0
Mstir10801-43246A4834.2
RCS2936-37476A40.9
BF106-214B54.9
BI107-354A202329B61.2
2a07.tatt.4-1-316A75.9BG134-201A0378.0
1f10.ttg.6-1-210A13A1695.4
H4
BE92-19919.1
BI98-15458A45.5BF149-10307A46.1
Mstri8733-18805A51.2
MTIC343-14148A6089.4
BE112-20698.7
H1
1f11aatt4-1-192A14.3
BI98-15458A45.5BF149-10307A46.1
Mstri8733-205A55.5
3d03tca5-1-215A18A74.53d03cat6-1-18176.4
MTIC343-14148A6089.4AL97-19492.4
H2
BI98-15458A45.5BF149-10307A46.1
3d03tca5-1-215A18A74.5
Mstri11419-180A86.3MTIC343-14148A6089.4
H3
1c06.tta.6-1-265A0.0
BE92-195A996.8
BE92-19919.1
BI98-15458A45.5BF149-10307A46.1
Mstri8733-18805A51.2
MTIC343-14148A6089.4
BE112-20698.7
H4
BF132-2050.0
BG281-19534.8
AW326-203A49.1AW212-245A6552.1AW329771-25453.8AFct45-162A54.2AW150-193A55.0
AW123-204B07A66.7AW64-203B07A67.7Mstir8491-20614A2272.4AI01-200A73.2BF24-200A73.6
H1
BF56-28996045.7BF26-289A96A04A7.5
AW212-245A6552.11b11.gtg.6-1-313A54.5
BG119-27060.6
AW123-204B07A66.7AW64-203B07A67.7Mstri11539-109B68.4Mstir8491-20614A2272.4
BE123-211B100.7
H2
BF56-28996045.7BF26-289A96A04A7.5
Mstir8491-20614A2272.4
H3
BF56-28996045.7BF26-289A96A04A7.5
Mstri8949-13930.0
Mstir8491-20614A2272.4
H4
2a09.aac.6-1-2820.0
BI113-24141.5
1g03gaa5-1-1559708A54.1MTIC248-137A56.7
Mstir11470-306A86.1AW201-296A87.6Mstri10592-15187.92a03tga5-1-283B92.2AL92-20993.6Mstri8923-17276A94.1BE118-233A37A95.0BG232-167A95.7AL96-155106.3
H1
AW325-172A10.1
1g03gaa5-1-1559708A54.1
BF218-243A60.8
BI116-22583.0Mstir11470-306A86.1AW201-296A87.6BI86-22388.8Mstri8899-34597A90.0Mstir7771-368A9392.7Mstri8923-17276A94.1
H2
Mstir10665-13021.0
1g03gaa5-1-1559708A54.1
Mstri9223-145A66.0AL111-197A66.4
AL79-259A80.2Mstri8899-34597A90.0BI86-226A90.7Mstir7771-368A9392.72a03tga5-1-277A93.0Mstri8923-17276A94.1BE118-233A37A95.0AW258-243A98.0
H3
Mstir10665-13021.0
1g03gaa5-1-1559708A54.1
Mstri9223-145A66.0AL111-197A66.4
AL79-259A80.2Mstri8899-34597A90.0BI86-226A90.7Mstir7771-368A9392.72a03tga5-1-277A93.0Mstri8923-17276A94.1BE118-233A37A95.0AW258-243A98.0
H4
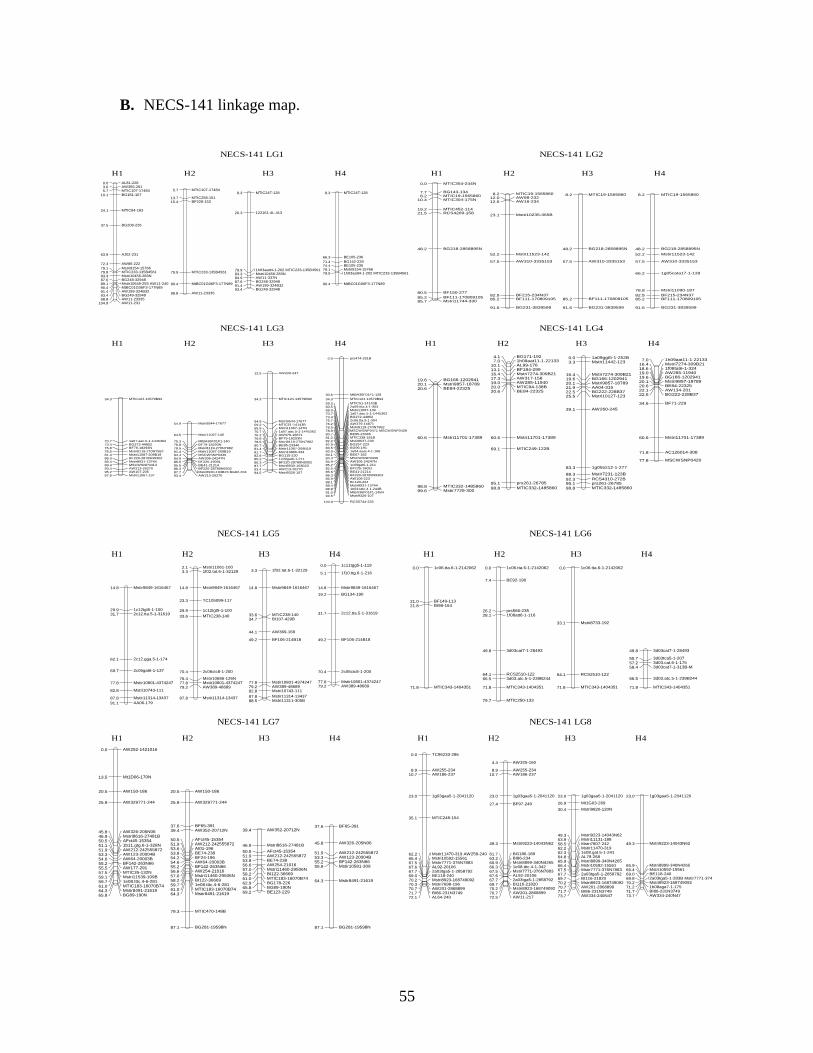
55
B. NECS-141 linkage map.
H1 H2 H3 H4 H1 H2 H3 H4
H1 H2 H3 H4 H1 H2 H3 H4
NECS-141 LG1 NECS-141 LG2
NECS-141 LG3 NECS-141 LG4
AL81-2280.0AW365-2613.6MTIC107-174845.7BG181-16710.1
MTIC84-18324.1
BG208-22637.5
AJ02-23163.9
AW86-22272.3
Mstri9154-1576679.1MTIC233-135B456179.9Mstri10456-283N83.3BG248-3294887.6Mstir10649-293 AW11-24089.1MtBC01G06F3-177N8990.4AW199-324B3291.4BG249-3294893.4AW11-2333598.8AW11-231104.9
H1
MTIC107-174845.7
MTIC258-15113.7BF228-15315.4
MTIC233-135B456179.9
MtBC01G06F3-177N8990.4
AW11-2333598.8
H2
MTIC247-1288.3
122161-4L-41326.3
1h03aatt4-1-202 MTIC233-135B456179.9Mstri10456-283N83.3AW11-337N84.9BG248-3294887.6AW199-324B3291.4BG249-3294893.4
H3
MTIC247-1288.3
BE105-23666.3
BG142-22971.4BE105-23574.4Mstri9154-1576679.11h03aatt4-1-202 MTIC233-135B456179.9
MtBC01G06F3-177N8990.4
H4
MTIC354-244N0.0
BG143-1347.7MTIC19-15658608.2MTIC304-175N10.4
MTIC452-11419.2RCS4209-15821.5
BG218-2858895N48.2
BF150-27780.5
BF111-17080910585.2Mstri11744-33085.7
H1
MTIC19-15658608.2AW98-23212.0AW16-23412.6
Mstri10235-365B23.1
Mstir11523-14252.2
AW310-333515357.5
BF215-234N3782.5BF111-17080910585.2
BG231-383959991.6
H2
MTIC19-15658608.2
BG218-2858895N48.2
AW310-333515357.5
BF111-17080910585.2
BG231-383959991.6
H3
MTIC19-15658608.2
BG218-2858895N48.2
Mstir11523-14252.2
AW310-333515357.5
1g05cata17-1-13966.2
Mstri11090-18778.8
BF215-234N3782.5BF111-17080910585.2
BG231-383959991.6
H4
MTIC124-13579B9234.3
1a07.aac.5-1-144536270.7BG272-4485273.4BF79-18293N76.8Mstri8119-270N798278.5Mstir11087-209B1981.4BF220-28789N930286.3Mstir8931-1374488.4MSCWSNP041389.4AW213-2627093.4AW107-20595.2Mstri11067-13797.6
H1
Mstri9544-1767754.9
Mstri11067-14564.5
MtBA36F01F1-14075.3BF79-18293N76.8Mstri8119-270N798278.5Mstir11087-209B1981.4MSCWSNP043984.4AW306-24247N84.9BF225-1909185.5BE41-2121485.6BF220-28789N930286.3Mstri8930-103B23 BG82-20487.7AW213-2627093.4
H2
AW220-24712.5
MTIC124-13579B9234.3
Mstri9544-1767754.9MTIC51-14143B59.2Mstri11067-147N65.91a07.aac.5-1-144536270.7AW379-1687176.2BF79-18293N76.8Mstri8119-270N798278.5BE85-2334680.7Mstir11087-209B1981.4Mstri10866-33481.7BG115-23082.81c09gat6-1-21185.2BF220-28789N930286.3Mstri8930-103B2387.7AW213-2627093.4Mstri9326-10794.5
H3
prs474-251B0.0
MtBA36F01F1-12830.6
MTIC124-13579B9234.3
MTIC51-14143B59.22a09.ttta.4-1-30360.5Mstri11067-13968.01a07.aac.5-1-144536270.7BG272-4485273.42c06.tta.9-1-30475.7AW379-1687176.2Mstri8119-270N798278.5MSCWSNP0471 MSCWSNP042878.9BE85-2334680.7MTIC338-181B81.2Mstir8637-23882.2BG257-22382.9BG96-19183.51e04.aaat.4-1-16683.9BE67-18284.1MSCWSNP043984.4AW306-24247N84.91c09gat6-1-21185.2BF225-1909185.5BE41-2121485.6BF220-28789N930286.3AW108-22386.9BF120-22488.1Mstir8931-1374488.41e04.tatc.4-1-244B88.8MtBA36F01F1-145N91.0Mstri9326-10794.5
RCS5744-233120.9
H4
BG166-120294119.6Mstri9857-1878920.1BE84-2232520.6
Mstri11701-1738960.6
MTIC332-148586098.8Mstir7729-30099.6
H1
BG171-1924.11h09aat11-1-221337.0AL99-17610.1BF184-29913.1Mstri7274-309B2116.4AW317-15817.3AW285-1194019.0MTIC94-138B20.0BE84-2232520.6
Mstri11701-1738960.6
MTIC249-122B69.1
prs261-2678595.1
MTIC332-148586098.8
H2
1a09ggt5-1-252B0.0Mstir11442-1233.3
Mstri7274-309B2116.4BG166-120294119.6Mstri9857-1878920.1AA04-31521.9BG222-228B3722.5Mstri10127-12325.5
AW260-24539.1
1g05tct12-1-27783.3
Mstir7231-123B88.3
RCS4310-272B92.3prs261-2678595.1MTIC332-148586098.8
H3
1h09aat11-1-221337.0Mstri7274-309B2116.41f08tat6-1-32418.6AW285-1194019.0BG166-120294119.6Mstri9857-1878920.1BE84-2232520.6AW134-20122.1BG222-228B3722.5
BF71-22934.6
Mstri11701-1738960.6
AC126014-30871.8
MSCWSNP042077.8
H4
H1 H2 H3 H4 H1 H2 H3 H4
H1 H2 H3 H4 H1 H2 H3 H4
NECS-141 LG5 NECS-141 LG6
NECS-141 LG7 NECS-141 LG8
Mstir9849-161646714.8
1c12tgt5-1-10029.92c12.tta.5-1-3161931.7
2c12.gga.5-1-17462.1
2c06gat6-1-13769.7
Mstir10801-437424777.8
Mstri10743-11182.8
Mstir11314-1343787.8
AA06-17991.1
H1
Mstri11061-1002.11f02.tat.6-1-321293.3
Mstir9849-161646714.8
TC105099-11723.3
1c12tgt5-1-10029.9
MTIC238-14033.6
2c06ctc8-1-20070.4
Mstri10686-126N76.4Mstir10801-437424777.8AW389-4868979.2
Mstir11314-1343787.8
H2
1f02.tat.6-1-321293.3
Mstir9849-161646714.8
MTIC238-14033.6BI107-429B34.7
AW369-16944.1
BF106-214B1849.2
Mstir10801-437424777.8AW389-4868979.2Mstri10743-11182.8
Mstir11314-1343787.8Mstri11311-305B88.5
H3
1c11tgg5-1-1190.0
1f10.ttg.6-1-2165.1
Mstir9849-161646714.8
BG134-19019.2
2c12.tta.5-1-3161931.7
BF106-214B1849.2
2c06ctc8-1-20070.4
Mstir10801-437424777.8AW389-4868979.2
H4
1c06.tta.6-1-21420620.0
BF149-11321.0BI98-16421.8
MTIC343-140435171.8
H1
1c06.tta.6-1-21420620.0
BE92-1907.4
prs566-23526.21f08att6-1-11628.1
3d03cat7-1-2849349.8
RCS2510-12264.13d03.atc.5-1-239B24466.5
MTIC343-140435171.8
MTIC250-13379.7
H2
1c06.tta.6-1-21420620.0
Mstri8733-19233.1
RCS2510-12264.1
MTIC343-140435171.8
H3
3d03cat7-1-2849349.8
3d03tca5-1-20755.73d03.cat.6-1-17557.23d03cat7-1-313B-M58.4
3d03.atc.5-1-239B24466.5
MTIC343-140435171.8
H4
AW252-14210160.0
Mt1D06-170N13.5
AW150-18620.5
AW329771-24425.9
AW326-205N0645.8Mstri8616-27481B46.9AFct45-1535450.51b11.gtg.6-1-328N51.1AW212-24255587251.9AW123-20004B53.3AW64-20003B54.6BF142-263N6655.2AW177-29155.5MTIC35-132N57.5Mstri11539-109B59.11e08.tttc.4-6-28159.7MTIC183-16070B7461.0Mstir8491-2161964.3BG89-190N65.8
H1
AW150-18620.5
AW329771-24425.9
BF65-39137.6AW352-20712N39.4
AFct45-1535450.5AW212-24255587251.9AI01-19653.6BE74-23853.8BF24-19654.2AW64-20003B54.6BF142-263N6655.2AW254-2101656.6Mstri11460-29506N57.0BI122-3666958.21e08.tttc.4-6-28159.7MTIC183-16070B7461.0Mstir8491-2161964.3
MTIC470-148B79.3
BG281-19598N87.1
H2
AW352-20712N39.4
Mstri8616-27481B46.9
AFct45-1535450.5AW212-24255587251.9BE74-23853.8AW254-2101656.6Mstri11460-29506N57.0BI122-3666958.2MTIC183-16070B7461.0BG178-22662.9BG89-190N65.8BE123-22969.2
H3
BF65-39137.6
AW326-205N0645.8
AW212-24255587251.9AW123-20004B53.3BF142-263N6655.2Mstir10581-30955.9
Mstir8491-2161964.3
BG281-19598N87.1
H4
TC96233-2860.0
AW255-2348.9AW186-23710.7
1g03gaa5-1-204112023.0
MTIC248-15435.1
Mstir11470-319 AW258-24062.2Mstri10592-1556166.4Mstir7771-376N788367.5AL92-2010667.62a03tga5-1-285879267.7BE118-24069.0Mstri8923-16874909270.2Mstri7698-19670.3AW201-286889970.7BI86-231N374971.7AL64-24072.1
H1
AW325-1604.4
AW255-2348.9AW186-23710.7
1g03gaa5-1-204112023.0
BF97-24927.4
Mstri9223-14043N6249.3
BG186-18961.7BI86-23463.2Mstri8899-340N426565.91e08.tttc.4-1-34266.3Mstir7771-376N788367.5AL92-2010667.62a03tga5-1-285879267.7BI116-2182069.7Mstri8923-16874909270.2AW201-286889970.7AW11-21772.5
H2
1g03gaa5-1-204112023.0
Mt1G03-26926.9
Mstri9820-120N30.4
Mstri9223-14043N6249.3Mstri11131-18853.9Mstri7807-24258.5Mstir11470-31962.21e08.gat.5-1-24162.3AL79-26864.8Mstri8899-340N426565.9Mstri10592-1556166.4Mstir7771-376N788367.52a03tga5-1-285879267.7BI116-2182069.7Mstri8923-16874909270.2AW201-286889970.7BI86-231N374971.7AW334-240N4773.7
H3
1g03gaa5-1-204112023.0
Mstri9223-14043N6249.3
Mstri8899-340N426565.9Mstri10592-1556166.4BE118-24069.02a03tga5-1-283B Mstir7771-37469.8Mstri8923-16874909270.21b08aga7-1-17571.2BI86-231N374971.7AW334-240N4773.7
H4
56
Supplementary Fig. 2.1. Linkage maps of (A) Altet-4 and (B) NECS-141 showing the four
homologous chromosomes (H1-H4) for each linkage group.
57
CHAPTER 3
EVALUATION OF TWO TRANSGENIC EVENTS FOR ALUMINUM TOLERANCE IN
ALFALFA2
2 Rafael Reyno, Dong-Man Khu, Maria J. Monteros, Joseph H. Bouton, Wayne Parrott, and E. Charles Brummer. To
be submitted to Crop Science
58
Abstract
Acid-soil syndrome inhibits root growth and development of many plant species due to Al+3
and
H+
toxicity and essential nutrients deficiencies. Alfalfa, Medicago sativa L., production is
dramatically reduced in acidic, Al-rich soil. Transgenic plants of several species over-expressing
organic acid synthesis and/or organic acid transporter genes have shown enhanced tolerance to
Al. The objective of this research was to evaluate the effect of the citrate synthase (CS) and the
plasma membrane H+-ATPase (DcPA1) transgenes on Al tolerance in alfalfa when evaluated in a
greenhouse soil assay. Transgenic alfalfa plants containing a single insertion of either CS or
DcPA1 were crossed to the Al-sensitive genotypes 95-608 and 60T180-14, respectively, and a
highly expressing transgenic progeny genotype from each cross was used to generate a full-sib
T2 population including four isogenic groups. Stem cuttings from 48 T2 genotypes, consisting of
13 with neither transgene, 11 with CS only, 14 with DcPA1 only, and 10 with both transgenes,
together with 8 non-transformed check genotypes were evaluated for Al/acid soil tolerance in a
greenhouse assay in limed (L) and unlimed (UL) soil. Al/acid soil tolerance was assessed by
measuring the ratios of root and shoot dry weight in UL soil compared to L soil. The three
transgenic populations, CS, DcPA1, and CS+DcPA1, all showed higher Al/acid soil tolerance
than the nontransgenic isogenic population or the nontransgenic parental genotypes. We
observed no advantage of combining both transgenes in the same genetic background. Levels of
tolerance achieved by the transgenic populations were high, with ratios of 0.91 to 0.98. Lower
levels of Al in shoot tissue were observed for the transgenic populations compared to the non-
transgenic population, suggesting that the Al-exclusion mechanism could be driving Al/acid soil
tolerance in this study. These transgenes offer an efficient method to achieve enhanced Al/acid
59
soil tolerant alfalfa cultivars, with more information needed on the stability of these transgenes
and their performance under field conditions.
Introduction
Alfalfa, Medicago sativa L., is widely cultivated worldwide and is the fourth most
important crop in U.S. agriculture (USDA-NASS, 2009). Acid soils are a severe problem for
alfalfa production in many parts of the world, including the southeastern U.S. (Bouton and
Sumner, 1983b). Acid-soil syndrome, which mainly compromises Al+3
and H+
toxicity and a
deficiency of essential nutrients such as phosphorus (P), causes severe inhibition of root growth
and development (Kochian et al., 2004b). Two mechanisms of Al tolerance have been described
in higher plants – those that prevent Al uptake by the roots, through the exudation of organic
acids from the roots or by raising the pH of the rhizosphere, and those that internally detoxify Al,
allowing the plant to tolerate Al accumulation in roots and shoots (Kochian et al., 2004b). Both
mechanisms are complex and hard to dissect experimentally (Kochian et al., 2005). Based on
research in many species, aluminum tolerance appears to be controlled by few genes with large
effects, and organic acid exudation plays an important role (Delhaize et al., 2004; Hoekenga et
al., 2003; Magalhaes et al., 2004; Pineros et al., 2002). However, other studies, sometimes in the
same species, have reported that Al tolerance is more complex, with potentially multiple
mechanisms interacting (Bianchi-Hall et al., 2000; Liu et al., 2009; Narasimhamoorthy et al.,
2007a; Xue et al., 2008).
Traditionally, soil acidity can be ameliorated by liming, effectively eliminating Al
toxicity in the plow layer, but not in the subsoil (Bouton and Sumner, 1983b). Genetic tolerance
to acidic conditions would be a more durable and less expensive method to increase alfalfa
productivity and reduce production costs in acid soils (Bouton, 1996; Bouton et al., 1986), but
60
limited variability has been observed in alfalfa germplasm for Al tolerance (Bouton, 1996;
Campbell et al., 1988). An alternative, or additional, method of modifying Al tolerance of alfalfa
is through the insertion of transgenes, introduces genes or modulates expression of existing genes
to a level not available in existing germplasm.
The Al-chelating ability of some organic acids, including citrate, malate, and oxalate
appears to confer Al tolerance through the formation of stable complexes with Al+3
in the soil,
making it insoluble and preventing its uptake by the roots (Barone et al., 2008; Delhaize et al.,
1993b). Transgenic plants over-expressing genes coding for organic acid synthesis, such as
citrate synthase (CS), have shown improved Al tolerance in several crops, including tobacco,
papaya (de la Fuente et al., 1997), canola (Anoop et al., 2003), and alfalfa (Barone et al., 2008).
A complementary transgenic approach to improve Al tolerance is to use organic acid transporters
(Kochian et al., 2004b). This approach has been effective in barley (Hordeum vulgare), a very
Al-sensitive cereal crop (Delhaize et al., 2004; Delhaize et al., 2009). The DcPA1 gene coding
for a plasma membrane H+ATPase from Daucus carota may play a role in the proton exudation
(Ohno et al., 2004).
The practical value of the transgenes may not be manifested in plants only containing a
single gene. The optimum Al tolerance may arise from a strategy that combines the organic acid
over-expression with a gene encoding a compatible transporter (Barone et al., 2008). The
transporter gene is hypothesized to be necessary to export citrate out of the plant cells, and
consequently, both transgenes could perform better than either one alone.
Engineered alfalfa plants with CS and DcPA1 under the control of three different
promoters were developed (Shen, 2009). The MtHP promoter, a constitutive promoter from M.
truncatula (Xiao et al., 2005), showed higher expression levels for both genes, CS and DcPA1,
61
compared to the untransformed control, R2336 alfalfa line (Federal Register /Vol. 70, No. 122
/Monday, June 27, 2005 /Notices 36917-9) and the GA-AT breeding line (Shen, 2009).
However, transgene-containing plants were not evaluated for aluminum tolerance.
We hypothesized that both the CS and DcPA1 gene individually would confer Al
tolerance on alfalfa, and that the combination of both genes would further improve Al tolerance.
Therefore, the objective of this experiment was to evaluate isogenic alfalfa populations
containing neither transgene, each transgene individually, or both transgenes for their Al
tolerance using a soil-based assay in the greenhouse.
Materials and Methods
Plant material and population development
The citrate synthase (CS) and the plasma membrane H+ATPase (DcPA1) genes were
previously transformed into the Forage Genetics Intl. proprietary alfalfa genotype R2336 under
the control of three promoters (Shen, 2009). R2336, like many alfalfa genotypes, is non-inbred.
The transgenic (T0) genotypes, CS-14 and DcPA1-85, with genes driven by the constitutive
promoter MtHP, showed higher expression levels of their respective transgene than other
genotypes when compared to the untransformed R2336 control (Shen, 2009), and thus were
selected for further evaluation.
Our goal was to evaluate the performance of these genes singly and in combination in
isogenic backgrounds. Because both genes were transformed into the same alfalfa line (R2336),
they cannot be crossed due to self-incompatibility, and if the hybridization would have been
successful, the progeny would have resulted with significant inbreeding depression, potentially
obscuring the phenotypes caused by the transgenes. Therefore, avoid low vigor and other
62
problems due to inbreeding depression; we hybridized each transgenic genotype to an unrelated
genotype in the following combination: CS-14×95-608 and DcPA1-85×60T180-14. Previous
evaluations have identified the 95-608 (Khu et al., 2012) and the 60T180-14 (data not shown)
genotypes as Al-sensitive. The 95-608 genotype was derived from the non-dormant synthetic
cultivar CUF101 (Lehman et al., 1983), while 60T180-14 was selected under grazing and
drought conditions in Tifton GA (Dr. J.H. Bouton, pers. comm.) from an Italian germplasm
(Forage Genetics Intl.).
Twenty-five T1 progeny from each cross were evaluated by PCR (see below) for the
presence or absence of the appropriate transgene. The genotype CS-16 derived from CS-14×95-
608 was hybridized to the genotype H+-4 from DcPA1-85×60T180-14 to generate progeny that
fell into one of four isogenic T2 populations: (1) no transgene, (2) CS only, (3) DcPA1 only, or
(4) both transgenes. Because every plant in the population is genetically unique, the comparison
among the transgene groups has to be done at the population level to minimize background
variation. The resulting populations are expected to be isogenic except for the transgene. The
genotypes CS-16 and H+-4 were reciprocally hybridized, emasculating the female parent, to
generate a full-sib F1 population of 76 individuals.
PCR screening of putative transgenic plants
Genomic DNA extractions from T0, T1, and T2 genotypes were done using a modified
CTAB protocol (Murray and Thompson, 1980). About 50 ng of DNA from each alfalfa plant
was used for PCR. Amplification reactions used primers CS-463F (5’-
CCGAAGCATCGCGAAGTCTC-3’) and CS-1012R (5’-CCAGTTGCGGGTCGTTGATG-3’)
or DcPA1-1342F (5’-ATTGATAAGTTTGCAGAGCGTGGGTTGAG-3’) and DcPA1-1977R
(5’-AAACACAATACGGATCGTGATGGATACTGC-3’) as described by Shen (2009). The
63
positive controls were plasmid DNA (about 1 ng) containing the corresponding expression
cassettes, and the negative control was genomic DNA isolated from the wild type R2336 alfalfa
genotype. Amplicons from the PCR were analyzed on a 1% agarose gel containing ethidium
bromide and visualized under UV light. The segregation ratios for the T1 and T2 individuals were
tested for deviation from expectations using the FREQ procedure of SAS v. 9.2 (SAS, 2008)
with the chi-square test option.
Expression levels
To quantify citrate production and proton exudation, we evaluated 5-wk-old rooted stem
cuttings grown in a Fafard Super-fine Germinating Mix® (Conrad Fafard Inc., Agawam, MA) in
the UGA Crop and Soil Sciences greenhouses, Athens GA. For citrate production, three replicate
stem cuttings of 10 transgenic individuals originating from CS-14×95-608 containing the CS
transgene together with two non-transgenic siblings, the non-transformed alfalfa genotype
R2336, and a single genotype from the GA-AT alfalfa population (Bouton and Radcliffe, 1989)
(labeled as GA-AT) were evaluated as described by Shen (2009). Briefly, 0.2 g of fresh active
growing roots were harvested, ground in liquid nitrogen with a mortar and pestle, and transferred
to a 1.5 ml Eppendorf tube with 1 ml of ice-cold 0.6 N perchloric acid neutralized with 170-200
μl of 5 N K2CO3. The citrate acid quantification kit (RBiopharm Inc., Marshall, Michigan) was
used for the spectrographic assay of citrate, and the absorbance was measured using the
Synergy™ HT Multi-Mode Microplate Reader (BioTek Instruments, Inc., Winooski, VT).
For proton exudation, three replicate stem cuttings of eight transgenic and two non-
transgenic individuals from the DcPA1-85×60T180-14 progeny, the non-transformed R2336
alfalfa genotype, and the GA-AT genotype were evaluated as described by Shen (2009). Briefly,
a uniform set of stem cuttings with 5 cm long roots were placed in 30 ml COREX® (Krackeler
64
Scientific Inc., Albany, NY) centrifuge tubes containing 20 ml of 0.5 mM CaCI2 (pH 5.8) for 24
hours in a growth chamber (14h/26°C day and a 10 h/22°C night regimen). Subsequently,
changes in the pH of the solution were measured using a Corning pH meter 240 (Corning
Incorporated, Corning, NY). The H+ concentration in the solution was calculated based on the
following equation, [H+] (mol
-1) = 10
-pH.
For both assays, a completely randomized design with three biological and three
technical replications was used. The UNIVARIATE procedure of SAS was used to evaluate the
general statistics in each trait and for testing for normal distribution using the QQPlot statement
and the normal option. The GLM procedure of SAS v. 9.1 (SAS Institute, 2007) was used
calculate the means for each genotype and to compute a mean comparison based on the least
significant difference (LSD) at the 5% probability level.
Southern blot analysis
The CS-16 and the H+-4 genotypes were evaluated to confirm the number of insertion
sites. The Southern blot analysis protocol used was previously described by Shen (2009).
Negative controls for each transgene and positive controls of plasmid DNA containing the
corresponding expression cassettes were included in the analysis. Briefly, about 10 μg of purified
genomic DNA were digested overnight at 37oC with 12 units of EcoRI (Promega, Madison, WI),
and fractions separated in a 0.8% agarose gel with 1×TAE buffer at 30V, 35 mAmps. After
soaking the agarose gel in denaturation and neutralization buffers, DNA was transferred to a
Hybond™-N+ membrane (Amersham, Piscataway, NJ). The probes used in each case amplified
a fragment of the CS and DcPA1 genes, and were amplified using the primers pairs CS-463F (5’-
CCGAAGCATCGCGAAGTCTC-3’) and CS-1012R (5’-CCAGTTGCGGGTCGTTGATG-3’),
and hph-117F (5’-CGATGTAGGAGGGCGTGGATA-3’) and hph-938R (5’-
65
CTTCTGCGGGCGATTTGTG- 3’). Finally, after prehybridization and hybridization steps, the
hybridized membrane was exposed to a Kodak BioMax Film at -80oC for 7 d.
Phenotypic analysis of Al tolerance
Evaluation of soil-based Al tolerance of the T2 isogenic populations was performed in
the UGA Crop and Soil Sciences greenhouses, Athens, GA during Nov. and Dec. 2011, using
two greenhouses as separate environments. We used the whole-plant assay in soil system (Khu et
al., 2012) modified to prevent waterlogging. The modification consisted of placing racks with
conetainers into a plastic tray with drain holes at the bottom and filled with 15 cm of sterile sand.
The conetainers were placed 5 cm into the sand to ensure contact between cone soil and sand.
The sand was used to prevent soil saturation after watering (Dr. M.E. Sumner, pers. comm.),
thereby preventing Mn toxicity. The soil we used was identical to that in Khu et al. (2012),
except that nutrients and lime were mixed prior to these experiments (Table 3.1).
Rooted stem cuttings were used as previously described (Khu et al., 2012). Briefly,
conetainers were filled with either limed (L) or unlimed (UL) soil leaving a space at the top for a
6-wk-old clonal plug of a given genotype, which was transferred directly without washing off the
germination mix in which the cuttings were grown. The appropriate soil was added around the
plug to fill the space at the top of the conetainer. Greenhouse temperatures were 25°C day and
20°C night with a 16 hr photoperiod supplemented by high-intensity lights. The experiments
were watered daily using distilled water, and the trays were rotated on the greenhouse benches
weekly to diminish micro-environmental variation inside the greenhouse. Chlorpenapyr (0.41
g/l) and avermectin (49.3 g/l) were applied to control thrips (Caliothrips fasciatus and
Frankliniella occidentalis). After growing for 6 wk, plants and soil were removed from cones,
and the soil was gently washed off from the roots. Plants were then separated into root and stem
66
fractions at the soil line. The roots growing in the germination mix, corresponding to the top 5
cm of the root fraction, were discarded and not considered for further analysis. Therefore, the
root fraction that we analyzed and discussed here corresponds to the roots below 5 cm, growing
in the UL or L soil. After drying at 65ºC for 72 hr, the dry weight (DW) of roots and shoots was
determined. Relative root weight was computed as the ratio of root dry weight in UL soil to the
root dry weight in L soil for each genotype in each replication. Relative shoot dry weight was
computed analogously.
Therefore, the traits analyzed were root dry weight in L and UL soil, hereafter referred to
RDW-L and RDW-UL, shoot dry weight in L and UL soil, hereafter named as SDW-L and
SDW-UL, and root and shoot dry weight ratios, the relative growth in UL vs L soil, hereafter
named as RDWR and SDWR, respectively.
Forty-eight genotypes from the CS-16×H+-4 progeny were used in this experiment,
consisting of 13 with neither transgene, 11 with the CS transgene, 14 with the DcPA1 transgene,
and 10 with both transgenes. Eight non-transformed genotypes were used as checks. Some of the
genotypes were present in more than one copy per replication, for completing a total of 60 plugs
evaluated in each conetainer rack. These 60 genotypes were placed in a 98 (7 × 14) conetainer
rack, where the outer cones were planted as borders. The four isogenic populations and the check
genotypes were evaluated in four replications per environment. Two racks, one with UL soil and
the other with L soil represented one replication. Conetainers used in this experiment were the
same as those used in Khu et al. (2012).
Besides the traits previously described, we also measured the concentration of
macronutrients (Ca, K, Mg, N, P, and S) and Al, Fe, and Mn accumulated by the plants using a
tissue analysis on the entire shoot fraction of plants from the four isogenic populations and the
67
eight checks in both types of soil. In each environment, shoot fractions from replications 1 and 2,
and 3 and 4 from were consolidated, therefore two samples per environment and type of soil
were analyzed. The analyses were performed at the Soil, Plant, and Water Laboratory of The
University of Georgia, Athens, GA, following the inductively coupled plasma method by using
the ICP Emission Spectrograph (Thermo Jarrel Ash Corp., Franklin, MA).
Reverse transcriptase PCR
Total RNA was extracted from young leaves from the four isogenic populations (CS-
DcPA1, CS, DcPA1, and non-transgenic), and the eight genotypes used as checks growing in L
and UL soil in the fifth week of the soil assay using the TRI Reagent® protocol (Ambion,
Austin, TX). Tissue samples from the isogenic populations were collected from two replications
per environment in each type of soil, while for the check genotypes samples from both
environments and replications were pooled. The concentration of extracted total RNA was
measured using the Synergy™ HT Multi-Mode Microplate Reader (BioTek Instruments, Inc.,
Winooski, VT). About 1 μg of total RNA was used to synthesize cDNAs with GoScript™
Reverse Transcription System (Promega Corporation, Madison, WI). The cDNA product was
used as the template in a PCR reaction using the same primers and PCR conditions described for
the DNA screening section. PCR amplicons were analyzed on a 1% agarose gel containing
ethidium bromide and visualized under UV light.
Data analysis
Data for each trait was tested for normality, and all traits were normally distributed. We
used a mixed model containing effects for replications (nested in environments), genotypes,
environments, and genotype × environment (G×E) interaction; all effects were considered fixed
except replications. Environment effect was considered as fixed effect since they represent
68
highly controlled greenhouse conditions. For each trait, least square means were obtained for
genotypes and compared using the least significant difference. Mixed models were evaluated
using the MIXED procedure of SAS v. 9.1 (SAS, 2008). For all statistical analyses, significance
was determined at the 5% probability level unless otherwise indicated.
Results
Twenty-three hybrid T1 plants were obtained from each cross, CS-14×95-608 and
DcPA1-85×60T180-14, and were screened for the presence or absence of the appropriate
transgene (Table 3.2). In both cases the observed frequencies of the presence/absence of the
transgenes fit the expected segregation ratio of 1:1 (Table 3.2). Citrate concentration or proton
exudation varied among the T1 individuals (Figures 3.1 and 3.2). The transgenic genotype CS-16
showed a three-fold increase over the non-transgenic genotypes (Figure 3.1). Two genotypes,
H+-2 and H
+-4, showed 4.5-fold higher proton exudation levels than the R2336 non-transgenic
genotype (Figure 3.2). Based on the expression levels showed by CS-16 and H+-4, they were
used as parents to develop the isogenic populations.
Southern-blot analysis indicated that CS-16 contained a single insertion of the CS
transgene and that H+-4 likely contained a single DcPA1 insertion (data not shown). The
segregation ratios observed for the T1 plants were congruent with this result (Table 3.2). We
expected four classes of progeny from the CS-16 × H+-4 cross in equal frequencies, assuming
that each transgene was present as a single insertion and in a single dose (i.e., Tttt) and the
observed progeny frequencies fit the expected 1:1:1:1 ratio (Table 3.2).
The isogenic population evaluation in soil showed significant genotype effects for most
of the traits, except for RDW-L and SDW-UL (Table 3.3). No significant genotype×environment
69
(G×E) effect was observed for RDW and SDW. The isogenic T2 population without transgenes
had similar root weight in L soil, but lower root weight in UL soil when compared to the
populations with transgenes (Table 3.4). The Al-tolerance phenotype of the UL:L ratio was
lower for the isogenic T2 population without transgenes than for the other three populations,
which had similar ratios. Parental genotypes did not differ for root weight in either soil but those
containing a transgene (CS-16 and/or H+-4) had higher ratios than those without transgenes.
Shoot dry weight results similarly showed that the populations or parental genotypes containing
at least one transgene had superior Al-tolerance than those without a transgene. The Al-tolerant
genotype Altet-4, a parent in our Al-tolerance mapping population (see Chapter 2), showed the
same Al tolerance (UL:L ratio) as the transgenic lines and populations (Table 3.4). The genotype
NECS-141, the Al-sensitive parent of our mapping population, was Al-sensitive in this
experiment, as expected.
Aluminum (Al) and manganese (Mn) content in the shoots did not differ among the
isogenic population when grown in L soil (Table 3.5). However, in UL soil, the transgenic
populations had lower Al in the tissue than the non-transgenic population. The transgenic
parental genotypes were similar to the transgenic populations and generally lower than the non-
transgenic genotypes. The Al-tolerant, non-transgenic genotype Altet-4 had high levels of Al in
its shoot tissue. Trends for Mn were less clear than those for Al (Table 3.5). The non-transgenic
population had higher Mn than the CS population, but did not differ from the other two transgene
containing populations. The parents showed no consistent relationship between Mn content and
transgene content. The Al-tolerant genotype Altet-4, showed the highest levels of Mn in
root/shoot tissue from all entries evaluated.
70
The concentration of Ca and Mg were generally higher in L versus UL soil. The
CS+DcPA1 population had higher concentrations of Mg than the CS, DcPA1, and non-
transgenic populations in L and UL soils. Concentrations of K and P in shoot tissue did not differ
between L and UL soil or among the genotypes within type of soils. Iron (Fe) had a similar
pattern to that of the Al, showing two-fold higher concentration in UL than L conditions, and
also a similar ranking of the isogenic populations for the Al concentration in UL soil. In UL soil,
the non-transgenic population showed higher concentration of Fe in shoots than the other three
transgenic populations. No differences were observed in L soil (Supplementary Tables 3.1 and
3.2).
Discussion
Organic acids play a key role in aluminum tolerance (Kochian et al., 2004), and the role
of organic acids in alfalfa was shown by expressing a gene for citrate synthase (Barone et al.,
2008). In this experiment, we wanted to confirm the value of citrate synthase for improving Al
tolerance in a different, more agronomically desirable genetic background and to determine if
tolerance could be improved further by also expressing a citrate transporter gene, as suggested by
Barone et al. (2008). Therefore, we developed isogenic T2 populations in order to compare Al
tolerance of the genes singly or in combination with a non-transgenic control. Our hypothesis
was that combining the CS gene with a transporter would enable more organic acid to be
secreted from the roots, thereby imparting a greater level of Al tolerance than either gene alone
could provide.
We confirmed that the CS gene improves Al tolerance as had previously been
demonstrated in a different genetic background (Barone et al., 2008). The range of Al tolerance,
71
measured as RDWR and SDWR, observed in the population having only the CS transgene was
higher in this study than that previously reported (Barone et al., 2008). The difference in the
magnitude of Al tolerance reported may be because we used a different transgenic construct with
a different promoter driving the CS gene and/or because we evaluated completely unrelated
germplasm in the two experiments. We also used soil with slightly different characteristics and a
modified methodology to evaluate Al tolerance, both of which could also have caused variations
between the experiments. Regardless, in both cases, expression of the CS gene imparts Al
tolerance in alfalfa.
The DcPA1 transgene had been previously introduced into alfalfa (Shen, 2009), but the
effect of the gene on Al tolerance had not been evaluated in alfalfa. In this study, the DcPA1
isogenic T2 population showed similar Al tolerance as the CS isogenic population and higher
RDWR and SDWR than the non-transgenic population (Table 3.4). When we compared the
isogenic populations with individual genes to that containing both genes, we found that all three
isogenic populations gave the same level of Al tolerance, but no additional tolerance was
achieved by expressing both genes in the same plants.
The Al tolerance, measured as the ratio of growth in unlimed vs limed soil, of our
transgenic populations was similar to that of the nontransgenic, Al tolerant genotype Altet-4,
which we are using as a parent for a genetic mapping population. We evaluated the
concentrations of Al in the shoot tissue to get an indication of the mechanism of Al tolerance –
either exclusion of Al from the plant or detoxification inside the plant (Kochian et al., 2004). The
Al concentration in the transgenic isogenic populations was lower than the nontransgenic
isogenic population. Interestingly, the concentration of shoot Al in Altet-4 was similar to the
nontransgenic population. This suggests that the transgenic populations are achieving Al
72
tolerance through the exclusion of Al from the plant, or at least from the shoot. In contrast, Altet-
4 appears to be able to accumulate Al and still maintain Al tolerance. This result suggests that
detoxification of Al within Altet-4 is a likely mechanism of Al tolerance, as previously described
in other plant species (Ma et al., 1998; Ma et al., 2001; Ma et al., 1997).
The Mn concentrations observed in UL soil were similar to those in L soil, where no
toxicity effects were observed. Thus, even though some differences among populations and
genotypes were observed in UL soil, the magnitude of Mn concentrations suggests that Mn was
not a major factor affecting the results.
Conclusion
We have confirmed that two transgenes, Pseudomonas aeruginosa citrate synthase (CS)
and Daucus carota plasma membrane H+ATPase (DcPA1) improved alfalfa Al/acid soil
tolerance either singly or in combination. The Al tolerance conferred by the transgenes was
similar to that observed in a non-transgenic Al tolerant genotype, but based on different levels of
Al accumulation in shoot tissue, the tolerances may result from different mechanisms. We are
now attempting to pyramid the transgenes with quantitative trait loci (QTL) identified in a
segregating population derived from Altet-4 to determine if additional Al tolerance can be
obtained. Additional research is also needed to determine the stability of these transgenes and
their performance under field and commercial conditions.
Acknowledgments
The authors would like to thank Donald Wood, Jonathan Markham, and Wesley Dean for their
support with the greenhouse screening, Dr. Nathan Hancock for helping with the Southern blot

73
analysis, Yanling Wei for laboratory assistance with gene expressions, and Maria Ortega for
helping with the RT-PCR. This study was funded by The University of Georgia and The Samuel
Roberts Noble Foundation.
74
References
Anoop V.M., Basu U., McCammon M.T., McAlister-Henn L., Taylor G.J. (2003) Modulation of
citrate metabolism alters aluminum tolerance in yeast and transgenic canola
overexpressing a mitochondrial citrate synthase. Plant Physiology 132:2205-2217.
Barone P., Rosellini D., LaFayette P., Bouton J., Veronesi F., Parrott W. (2008) Bacterial citrate
synthase expression and soil aluminum tolerance in transgenic alfalfa. Plant Cell Reports
27:893-901.
Bianchi-Hall C.M., Carter T.E., Jr., Bailey M.A., Mian M.A.R., Rufty T.W., Ashley D.A.,
Boerma H.R., Arellano C., Hussey R.S., Parrott W.A. (2000) Aluminum tolerance
associated with quantitative trait loci derived from soybean PI 416937 in hydroponics.
Crop Sci 40:538-545.
Bouton J., Radcliffe D. (1989) Effects of acid soil selection on agronomically important traits in
alfalfa., Proceedings of XVI international grassland congress, Curle Printing Co., Inc.,
Minneapolis, Nice, France. pp. 377-378.
Bouton J.H. (1996) Screening the alfalfa core collection for acid soil tolerance. Crop Sci. 36:198-
200.
Bouton J.H., Sumner M.E. (1983) Alfalfa, Medicago sativa L., in highly weathered, acid soils.
V. Field performance of alfalfa selected for acid tolerance. Plant Soil 74:431-436.
Bouton J.H., Sumner M.E., Hammel J.E., Shahandeh H. (1986) Yield of an alfalfa germplasm
selected for acid soil tolerance when grown in soil with modified subsoils. Crop Sci
26:334-336.
Campbell T.A., Elgin J.H.J., Foy C.D., McMurtrey M.E., III. (1988) Selection in alfalfa for
tolerance to toxic levels of aluminum. Canadian J Plant Sci 68:743-754.
75
de la Fuente J.M., Ramirez-Rodriguez V., Cabrera-Ponce J.L., Herrera-Estrella L. (1997)
Aluminum tolerance in transgenic plants by alteration of citrate synthesis. Science
276:1566-1568.
Delhaize E., Ryan P.R., Randall P.J. (1993) Aluminum tolerance in wheat (Triticum aestivum
L.). 2. Aluminum-stimulated excretion of malic acid from root apices. Plant Phyisiology
103:695-702.
Delhaize E., Ryan P.R., Hebb D.M., Yamamoto Y., Sasaki T., Matsumoto H. (2004) Engineering
high-level aluminum tolerance in barley with the ALMT1 gene. Proc Natl Acad Sci USA
101:15249-15254.
Delhaize E., Taylor P., Hocking P.J., Simpson R.J., Ryan P.R., Richardson A.E. (2009)
Transgenic barley (Hordeum vulgare L.) expressing the wheat aluminium resistance gene
(TaALMT1) shows enhanced phosphorus nutrition and grain production when grown on
an acid soil. Plant Biotechnology Journal 7:391-400.
Hoekenga O.A., Vision T.J., Shaff J.E., Monforte A.J., Lee G.P., Howell S.H., Kochian L.V.
(2003) Identification and characterization of aluminum tolerance loci in Arabidopsis
(Landsberg erecta x Columbia) by quantitative trait locus mapping. A physiologically
simple but genetically complex trait. Plant Physiol 132:936-948.
Ikka T., Kobayashi Y., Tazib T., Koyama H. (2008) Aluminum-tolerance QTL in
Columbia/Kashmir inbred population of Arabidopsis thaliana is not associated with
aluminum-responsive malate excretion. Plant Sci 175:533-538.
Khu D.-M., Reyno R., Brummer E.C., Monteros M.J. (2012) Screening methods for aluminum
tolerance in alfalfa. Crop Sci. 52:161-167.
76
Kochian L.V., Hoekenga O.A., Pineros M.A. (2004) How do crop plants tolerate acid soils?
mechanisms of aluminum tolerance and phosphorous efficiency. Annu Rev. Plant Biol.
55:459-493.
Kochian L.V., Pineros M.A., Hoekenga O.A. (2005) The physiology, genetics and molecular
biology of plant aluminum resistance and toxicity. Plant and Soil 274:175-195.
Lehman W.F., Nielson F.M., Marble V.L., Stanford E.H. (1983) Registration of CUF 101 alfalfa.
Crop Sci 23 398-399.
Liu J.P., Magalhaes J.V., Shaff J., Kochian L.V. (2009) Aluminum-activated citrate and malate
transporters from the MATE and ALMT families function independently to confer
Arabidopsis aluminum tolerance. Plant J 57:389-399.
Ma J.F., Hiradate S., Matsumoto H. (1998) High aluminum resistance in buckwheat. Plant
Physiology 117:753-759.
Ma J.F., Ryan P.R., Delhaize E. (2001) Aluminum tolerance in plants and the complexing role of
organic acids. Trends Plant Sci 6:273-278.
Ma J.F., Hiradate S., Nomoto K., Iwashita T., Matsumoto H. (1997) Internal detoxification
mechanism of aluminum in Hydrangea: Identification of aluminum form in the leaves.
Plant Physiology 113:1033-1039.
Magalhaes J.V., Garvin D.F., Wang Y.H., Sorrells M.E., Klein P.E., Schaffert R.E., Li L.,
Kochian L.V. (2004) Comparative mapping of a major aluminum tolerance gene in
sorghum and other species in the Poaceae. Genetics 167:1905-1914.
Murray M.G., Thompson W.F. (1980) Rapid isolation of high molecular weight plant DNA.
Nucleic Acids Research 8:4321-4326.
77
Narasimhamoorthy B., Bouton J.H., Olsen K.M., Sledge M.K. (2007) Quantitative trait loci and
candidate gene mapping of aluminum tolerance in diploid alfalfa. Theor Appl Genet
114:901-913.
Ohno T., Nakahira S., Suzuki Y., Kani T., Hara T., Koyama H. (2004) Molecular
characterization of plasma membrane H+-ATPase in a carrot mutant cell line with
enhanced citrate excretion. Physiologia Plantarum 122:265-274.
Pineros M.A., Magalhaes J., Alves V.M.C., Kochian L.V. (2002) The physiology and
biophysics of an aluminum tolerance mechanism based on root citrate exudation in
maize. Plant Physiol 129:1194-1206.
SAS. (2008) SAS/STAT®9.2, User’s Guide, SAS Institute Inc., Cary, NC.
Shen L. (2009) A comparison of promoters for expression of transgenes in alfalfa roots, Crop
and Soil Sciences, MS Thesis, University of Georgia, Athens.
Xiao K., Zhang C., Harrison M., Wang Z.-Y. (2005) Isolation and characterization of a novel
plant promoter that directs strong constitutive expression of transgenes in plants.
Molecular Breeding 15:221-231.
Xue Y., Jiang L., Su N., Wang J.K., Deng P., Ma J.F., Zhai H.Q., Wan J.M. (2008) The genetic
basic and fine-mapping of a stable quantitative-trait loci for aluminium tolerance in rice.
Planta 27:255-262.
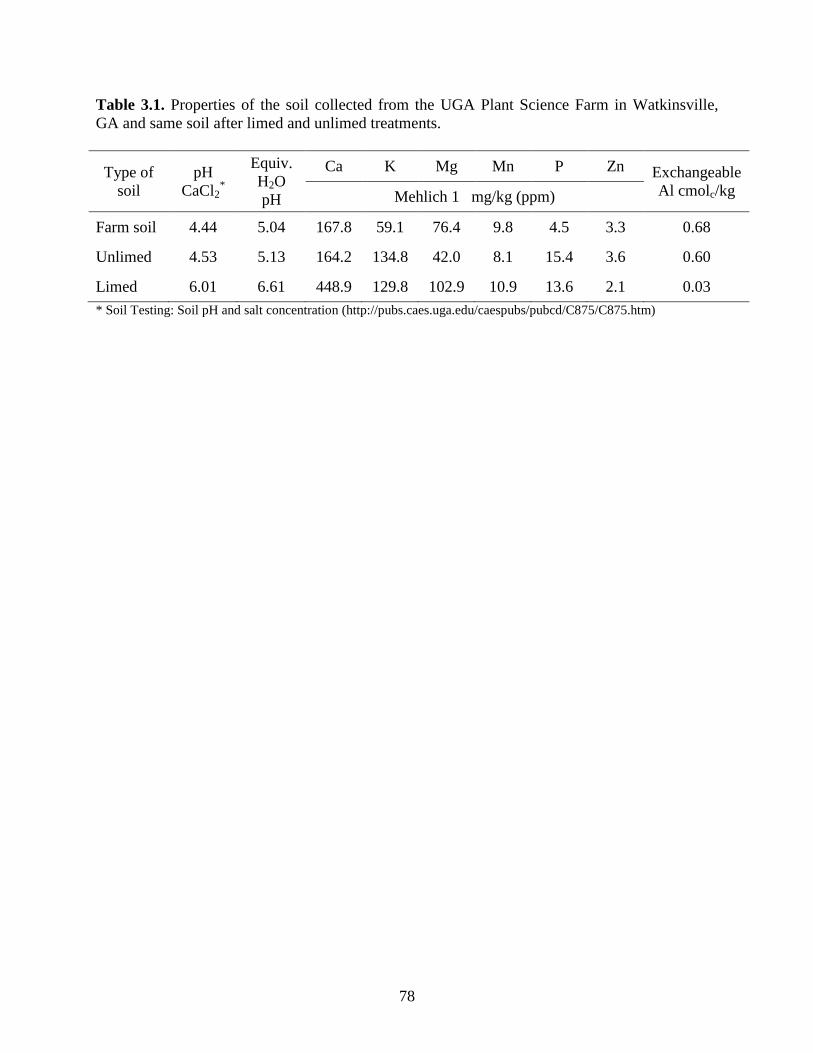
78
Table 3.1. Properties of the soil collected from the UGA Plant Science Farm in Watkinsville,
GA and same soil after limed and unlimed treatments.
Type of
soil
pH
CaCl2*
Equiv.
H2O
pH
Ca K Mg Mn P Zn Exchangeable
Al cmolc/kg Mehlich 1 mg/kg (ppm)
Farm soil 4.44 5.04 167.8 59.1 76.4 9.8 4.5 3.3 0.68
Unlimed 4.53 5.13 164.2 134.8 42.0 8.1 15.4 3.6 0.60
Limed 6.01 6.61 448.9 129.8 102.9 10.9 13.6 2.1 0.03
* Soil Testing: Soil pH and salt concentration (http://pubs.caes.uga.edu/caespubs/pubcd/C875/C875.htm)
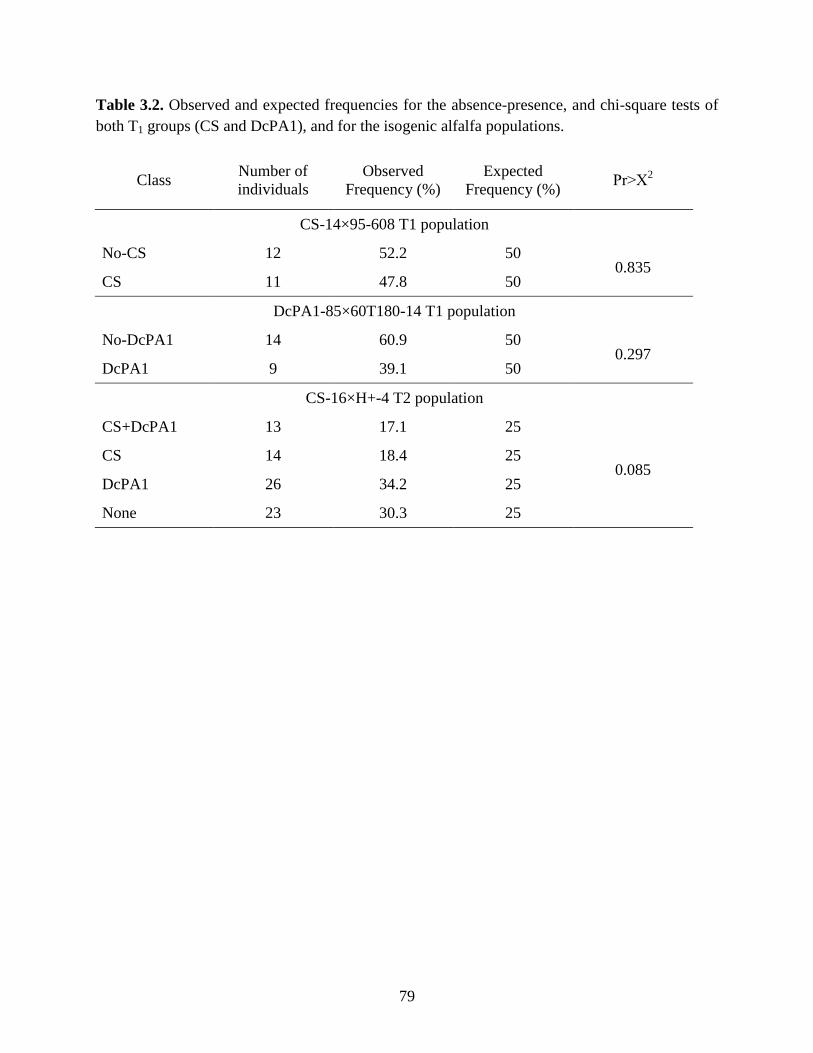
79
Table 3.2. Observed and expected frequencies for the absence-presence, and chi-square tests of
both T1 groups (CS and DcPA1), and for the isogenic alfalfa populations.
Class Number of
individuals
Observed
Frequency (%)
Expected
Frequency (%) Pr>Χ
2
CS-14×95-608 T1 population
No-CS 12 52.2 50 0.835
CS 11 47.8 50
DcPA1-85×60T180-14 T1 population
No-DcPA1 14 60.9 50 0.297
DcPA1 9 39.1 50
CS-16×H+-4 T2 population
CS+DcPA1 13 17.1 25
0.085 CS 14 18.4 25
DcPA1 26 34.2 25
None 23 30.3 25
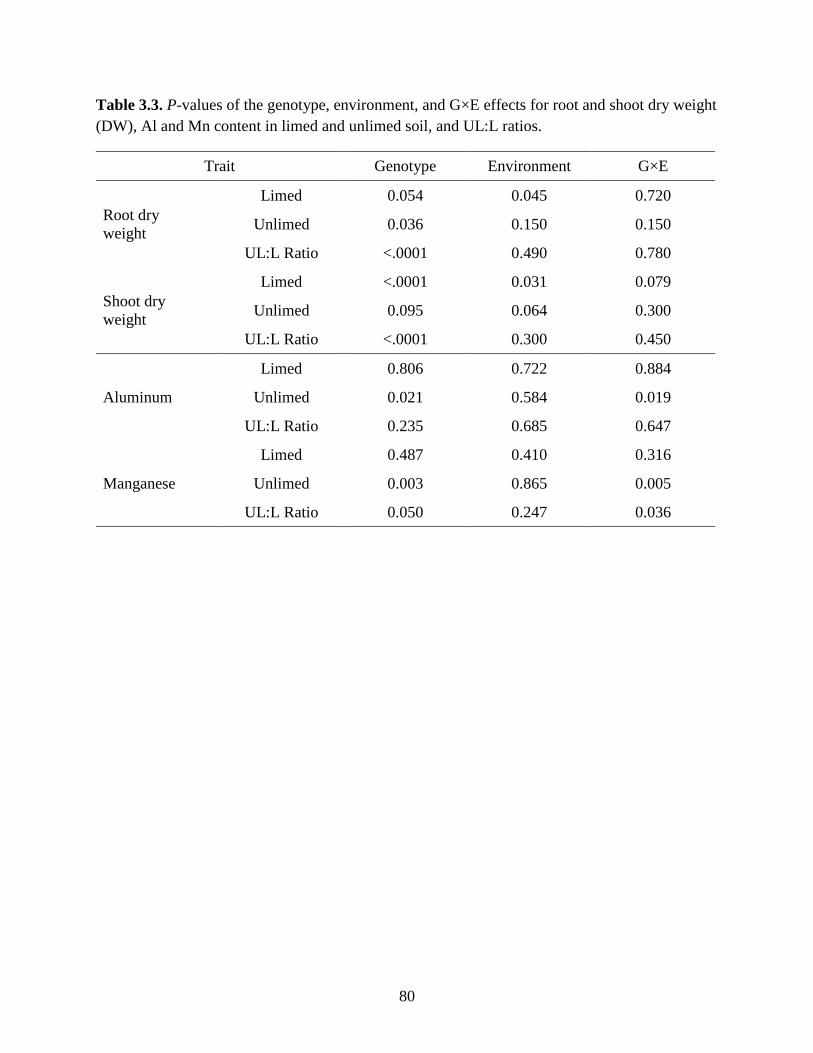
80
Table 3.3. P-values of the genotype, environment, and G×E effects for root and shoot dry weight
(DW), Al and Mn content in limed and unlimed soil, and UL:L ratios.
Trait Genotype Environment G×E
Root dry
weight
Limed 0.054 0.045 0.720
Unlimed 0.036 0.150 0.150
UL:L Ratio <.0001 0.490 0.780
Shoot dry
weight
Limed <.0001 0.031 0.079
Unlimed 0.095 0.064 0.300
UL:L Ratio <.0001 0.300 0.450
Aluminum
Limed 0.806 0.722 0.884
Unlimed 0.021 0.584 0.019
UL:L Ratio 0.235 0.685 0.647
Manganese
Limed 0.487 0.410 0.316
Unlimed 0.003 0.865 0.005
UL:L Ratio 0.050 0.247 0.036
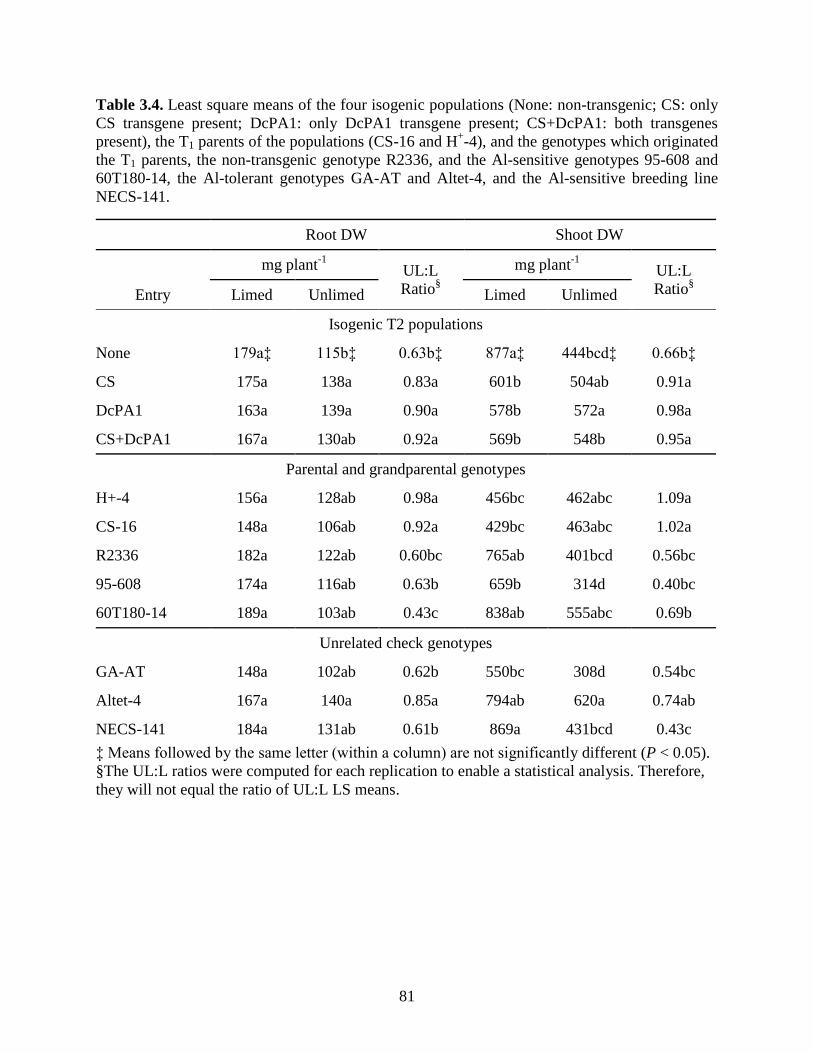
81
Table 3.4. Least square means of the four isogenic populations (None: non-transgenic; CS: only
CS transgene present; DcPA1: only DcPA1 transgene present; CS+DcPA1: both transgenes
present), the T1 parents of the populations (CS-16 and H+-4), and the genotypes which originated
the T1 parents, the non-transgenic genotype R2336, and the Al-sensitive genotypes 95-608 and
60T180-14, the Al-tolerant genotypes GA-AT and Altet-4, and the Al-sensitive breeding line
NECS-141.
Root DW Shoot DW
mg plant-1
UL:L
Ratio§
mg plant-1
UL:L
Ratio§ Entry Limed Unlimed Limed Unlimed
Isogenic T2 populations
None 179a‡ 115b‡ 0.63b‡ 877a‡ 444bcd‡ 0.66b‡
CS 175a 138a 0.83a 601b 504ab 0.91a
DcPA1 163a 139a 0.90a 578b 572a 0.98a
CS+DcPA1 167a 130ab 0.92a 569b 548b 0.95a
Parental and grandparental genotypes
H+-4 156a 128ab 0.98a 456bc 462abc 1.09a
CS-16 148a 106ab 0.92a 429bc 463abc 1.02a
R2336 182a 122ab 0.60bc 765ab 401bcd 0.56bc
95-608 174a 116ab 0.63b 659b 314d 0.40bc
60T180-14 189a 103ab 0.43c 838ab 555abc 0.69b
Unrelated check genotypes
GA-AT 148a 102ab 0.62b 550bc 308d 0.54bc
Altet-4 167a 140a 0.85a 794ab 620a 0.74ab
NECS-141 184a 131ab 0.61b 869a 431bcd 0.43c
‡ Means followed by the same letter (within a column) are not significantly different (P < 0.05).
§The UL:L ratios were computed for each replication to enable a statistical analysis. Therefore,
they will not equal the ratio of UL:L LS means.
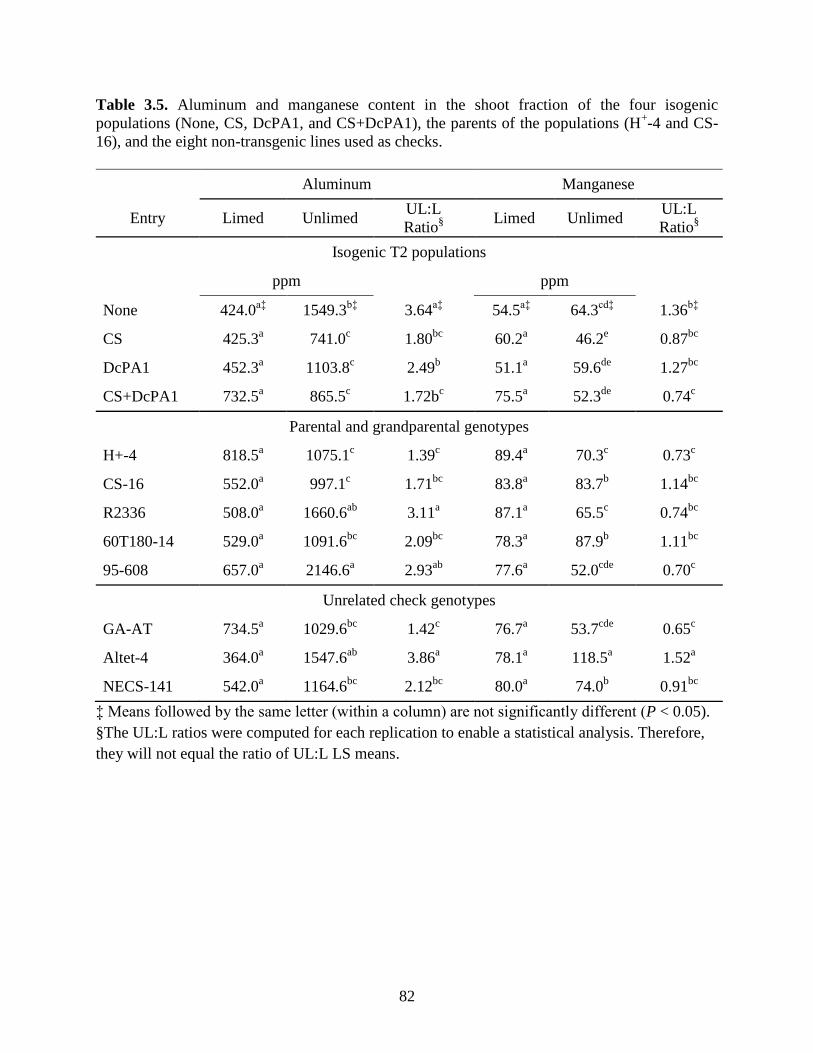
82
Table 3.5. Aluminum and manganese content in the shoot fraction of the four isogenic
populations (None, CS, DcPA1, and CS+DcPA1), the parents of the populations (H+-4 and CS-
16), and the eight non-transgenic lines used as checks.
Aluminum Manganese
Entry Limed Unlimed UL:L
Ratio§
Limed Unlimed UL:L
Ratio§
Isogenic T2 populations
ppm ppm
None 424.0a‡
1549.3b‡
3.64a‡
54.5a‡
64.3cd‡
1.36b‡
CS 425.3a 741.0
c 1.80
bc 60.2
a 46.2
e 0.87
bc
DcPA1 452.3a 1103.8
c 2.49
b 51.1
a 59.6
de 1.27
bc
CS+DcPA1 732.5a 865.5
c 1.72b
c 75.5
a 52.3
de 0.74
c
Parental and grandparental genotypes
H+-4 818.5a 1075.1
c 1.39
c 89.4
a 70.3
c 0.73
c
CS-16 552.0a 997.1
c 1.71
bc 83.8
a 83.7
b 1.14
bc
R2336 508.0a 1660.6
ab 3.11
a 87.1
a 65.5
c 0.74
bc
60T180-14 529.0a 1091.6
bc 2.09
bc 78.3
a 87.9
b 1.11
bc
95-608 657.0a 2146.6
a 2.93
ab 77.6
a 52.0
cde 0.70
c
Unrelated check genotypes
GA-AT 734.5a 1029.6
bc 1.42
c 76.7
a 53.7
cde 0.65
c
Altet-4 364.0a 1547.6
ab 3.86
a 78.1
a 118.5
a 1.52
a
NECS-141 542.0a 1164.6
bc 2.12
bc 80.0
a 74.0
b 0.91
bc
‡ Means followed by the same letter (within a column) are not significantly different (P < 0.05).
§The UL:L ratios were computed for each replication to enable a statistical analysis. Therefore,
they will not equal the ratio of UL:L LS means.
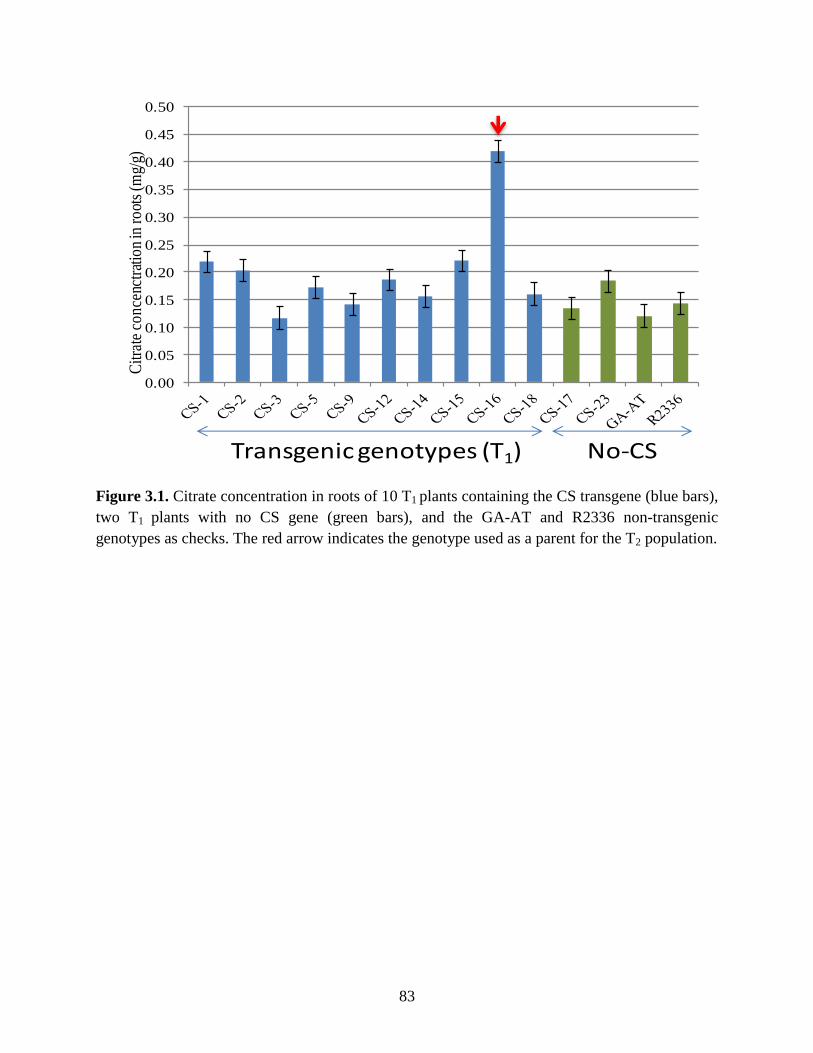
83
Figure 3.1. Citrate concentration in roots of 10 T1 plants containing the CS transgene (blue bars),
two T1 plants with no CS gene (green bars), and the GA-AT and R2336 non-transgenic
genotypes as checks. The red arrow indicates the genotype used as a parent for the T2 population.
0.00
0.05
0.10
0.15
0.20
0.25
0.30
0.35
0.40
0.45
0.50
Citr
ate
conc
enct
ratio
n in
root
s (m
g/g)
Transgenic genotypes (T1) No-CS
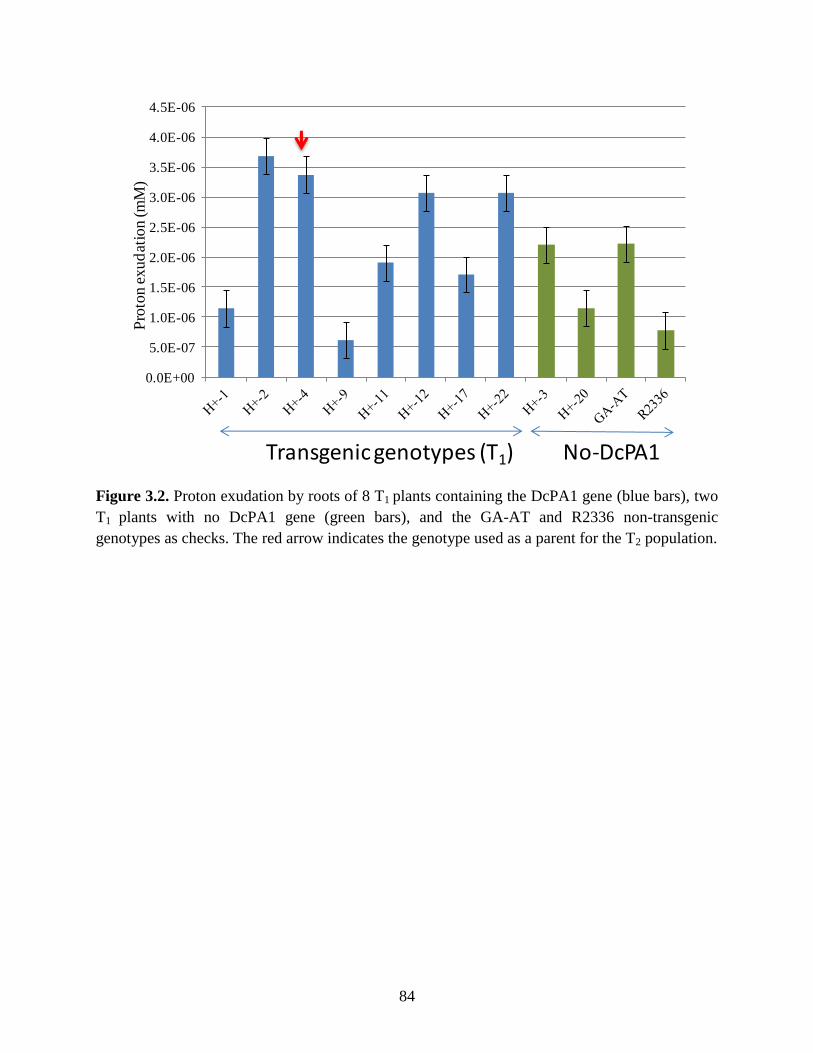
84
Figure 3.2. Proton exudation by roots of 8 T1 plants containing the DcPA1 gene (blue bars), two
T1 plants with no DcPA1 gene (green bars), and the GA-AT and R2336 non-transgenic
genotypes as checks. The red arrow indicates the genotype used as a parent for the T2 population.
0.0E+00
5.0E-07
1.0E-06
1.5E-06
2.0E-06
2.5E-06
3.0E-06
3.5E-06
4.0E-06
4.5E-06
Pro
ton
ex
ud
atio
n (m
M)
Transgenic genotypes (T1) No-DcPA1
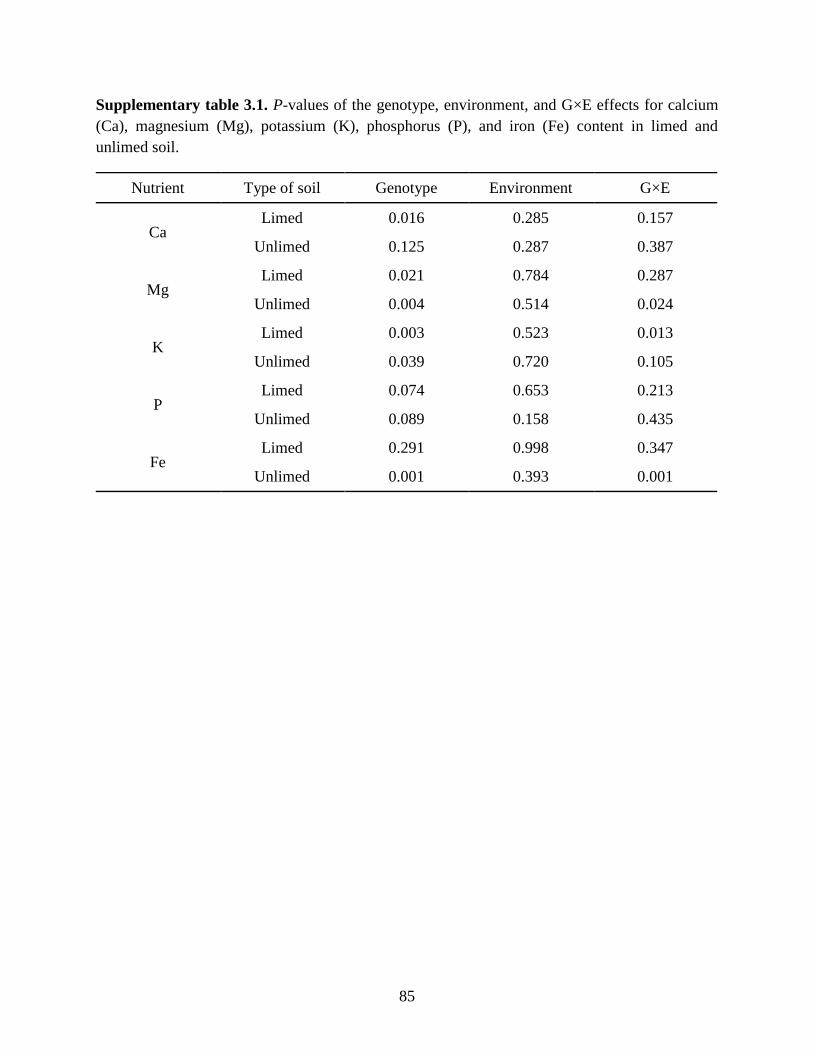
85
Supplementary table 3.1. P-values of the genotype, environment, and G×E effects for calcium
(Ca), magnesium (Mg), potassium (K), phosphorus (P), and iron (Fe) content in limed and
unlimed soil.
Nutrient Type of soil Genotype Environment G×E
Ca Limed 0.016 0.285 0.157
Unlimed 0.125 0.287 0.387
Mg Limed 0.021 0.784 0.287
Unlimed 0.004 0.514 0.024
K Limed 0.003 0.523 0.013
Unlimed 0.039 0.720 0.105
P Limed 0.074 0.653 0.213
Unlimed 0.089 0.158 0.435
Fe Limed 0.291 0.998 0.347
Unlimed 0.001 0.393 0.001
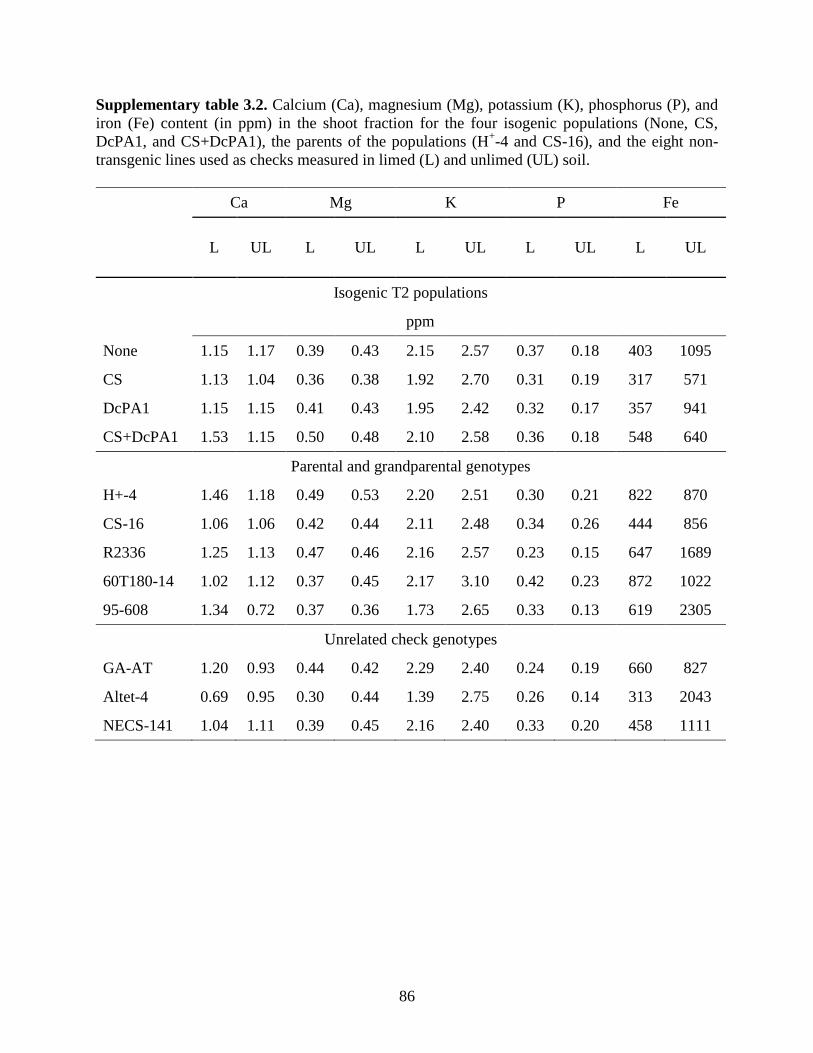
86
Supplementary table 3.2. Calcium (Ca), magnesium (Mg), potassium (K), phosphorus (P), and
iron (Fe) content (in ppm) in the shoot fraction for the four isogenic populations (None, CS,
DcPA1, and CS+DcPA1), the parents of the populations (H+-4 and CS-16), and the eight non-
transgenic lines used as checks measured in limed (L) and unlimed (UL) soil.
Ca Mg K P Fe
L UL L UL L UL L UL L UL
Isogenic T2 populations
ppm
None 1.15 1.17 0.39 0.43 2.15 2.57 0.37 0.18 403 1095
CS 1.13 1.04 0.36 0.38 1.92 2.70 0.31 0.19 317 571
DcPA1 1.15 1.15 0.41 0.43 1.95 2.42 0.32 0.17 357 941
CS+DcPA1 1.53 1.15 0.50 0.48 2.10 2.58 0.36 0.18 548 640
Parental and grandparental genotypes
H+-4 1.46 1.18 0.49 0.53 2.20 2.51 0.30 0.21 822 870
CS-16 1.06 1.06 0.42 0.44 2.11 2.48 0.34 0.26 444 856
R2336 1.25 1.13 0.47 0.46 2.16 2.57 0.23 0.15 647 1689
60T180-14 1.02 1.12 0.37 0.45 2.17 3.10 0.42 0.23 872 1022
95-608 1.34 0.72 0.37 0.36 1.73 2.65 0.33 0.13 619 2305
Unrelated check genotypes
GA-AT 1.20 0.93 0.44 0.42 2.29 2.40 0.24 0.19 660 827
Altet-4 0.69 0.95 0.30 0.44 1.39 2.75 0.26 0.14 313 2043
NECS-141 1.04 1.11 0.39 0.45 2.16 2.40 0.33 0.20 458 1111
87
CHAPTER 4
SELECTION FOR TOLERANCE TO ACIDIC, ALUMINUM-RICH SOIL IN ALFALFA3
3 Rafael Reyno, Daniel Real, and E. Charles Brummer. To be submitted to Crop Science
88
Abstract
Alfalfa (Medicago sativa L.) is an important forage crop in U.S. and worldwide but its
productivity is greatly affected in acid soils. In acid soils (pH below 5), aluminum (Al) and
manganese (Mn) become toxic, which affects plant growth and development. In the southeastern
U.S., Al and Mn toxicity, together with calcium (Ca) and phosphorus (P) deficiencies are the
most significant soil factors limiting alfalfa production. Selection in the field is difficult due to
heterogeneity of pH, Al concentration, and other microenvironmental variables. The aim of this
study was to compare genetic gain for acid/Al tolerance as assessed by seedling biomass
production in acidic soil under greenhouse conditions using phenotypic recurrent selection (PRS)
and among and within family selection (AWFS) in the cultivar Bulldog 805, and PRS in the
germplasm Cultivated Alfalfa at the Diploid Level (CADL) for two cycles. Selection was
performed based on aerial biomass production or visual score 60 d after germination in an Al-
rich acidic (unlimed or UL) and a limed (L) soil. Cycles 0, 1, and 2 (C0, C1, and C2) from each
method and population were evaluated for their root and shoot dry weight (RDW and SDW)
after 60 days of growth in UL and L soils using a greenhouse soil-based assay. Relative root and
shoot ratios, DW in UL relative to L soil were computed. The diploid CADL cultivar did not
respond to selection likely due to the lack of initial variability for Al tolerance. Bulldog 805
selected in L soil did not result in improvement in L or UL conditions, but selection conducted in
UL soil successfully improved performance in acid Al-rich soil after two cycles of selection, and
did not negatively affect its growth when evaluated in L soil. The PRS method in Bulldog 805
resulted in the largest response per cycle, over 20% per cycle over C0. Direct selection in UL
soil was the best way to improve alfalfa growth in acid Al-rich soils.
89
Introduction
Alfalfa (Medicago sativa L.) is the most important forage crop in U.S. and worldwide.
Under acidic conditions at a soil pH below 5, aluminum (Al) and manganese (Mn) become toxic
affecting plants growth and development; alfalfa is particularly sensitive to low pH and Al
toxicity. Aluminum toxicity decreases root elongation and branching, thus reducing water and
nutrient uptake (Kochian et al., 2004a). In the southeastern U.S., Al and Mn toxicity, together
with calcium (Ca) and phosphorus (P) deficiencies are significant factors limiting alfalfa
production (Foy and Brown, 1964b). Usually, soil acidity is addressed by using lime and
fertilizers to correct acidity and nutrient deficiencies at the plow layer, but this does not solve the
problem at the subsoil layer which remains unamended and thus acid and highly Al-toxic
(Bouton and Sumner, 1983b; Foy and Brown, 1964b). Therefore, genetic improvement of alfalfa
cultivars with tolerance to acid Al-rich soils offers an alternative to overcome this problem
(Bouton, 1996; Bouton et al., 1986).
In the field, aluminum or acid soil tolerance is manifested as higher biomass yield in
tolerant relative to sensitive germplasm when grown in acidic and Al-rich soils. Recurrent
selection based on field performance has been used to develop a tolerant germplasm, Georgia -
Acid Tolerant (GA-AT), derived from U.S. cultivars (Bouton and Radcliffe, 1989). GA-AT was
the result of three cycles of selection in acid soil and showed enhanced tap-root growth and
nodulation over an unimproved control and aluminum sensitive (AS) germplasm selected for 3
cycles in limed soil, when tested in acid soil with pH 4.6 and 32 µg g-1
Al (Bouton and Radcliffe,
1989). The levels of tolerance realized in GA-AT were not high enough to be economically
useful at low pH environments, because yields are far below those observed under limed
90
conditions. No other selection in the field for Al tolerance has been reported, and no Al tolerant
cultivar is currently commercialized (Bouton and Radcliffe, 1989; Dall' Agnol et al., 1996).
A number of screening methodologies has been developed for detecting Al tolerance in
alfalfa. Selection of seedlings using two greenhouse soil-based assays and on four callus
bioassay characteristics for one cycle indicated that selection in completely UL soil was the most
effective in terms of success, time, and resources (Dall' Agnol et al., 1996). Selection for acid
and Al tolerance in a hydroponic system improved root regrowth after 2 cycles of selection, but
the relation to field performance was not evaluated (Scott et al., 2008). Because the Al/acid
tolerance alleles appear to be rare in alfalfa populations, a higher selection intensity may be
necessary to concentrate useful alleles (Scott et al., 2008). The hydroponic-based selection was
validated in alfalfa using populations derived from selection in high Al-solution culture which
showed improved root and shoot growth in acid soil (Hayes et al., 2011). However, a lack of
correlation among hydroponic systems, root staining evaluations, and acid-soil screenings,
suggest the use of soil methods, since they may be the most relevant for field performance,
although even that has to be rigorously evaluated (Barone et al., 2008; Narasimhamoorthy et al.,
2007b).
Direct selection in the target environment has often been found to be the most effective
way to improve populations for stressful environments (Atlin and Frey, 1989; Ceccarelli, 1989).
In the greenhouse soil-based experiment, selection for better Al tolerance at low pH conditions
did not negatively affect the yield performance in L soil environments in the greenhouse (Bouton
and Sumner, 1983b; Dall' Agnol et al., 1996). Selection for shoot growth in acid soil (pH levels
below 5) may be more effective than selection for root growth, which is highly variable in acid
soils (Simpson et al., 1977). The improvement in Al tolerance is probably limited by the lack of
91
genetic variability in the alfalfa germplasm (Bouton, 1996), the lack of understanding of the
mechanism(s) controlling the trait, and the lack of long term breeding efforts (Dall' Agnol et al.,
1996).
Theoretical responses to selection for quantitatively inherited traits like yield show that
phenotypic recurrent selection (PRS) can be effective. However, in general, better genetic gain
could be achieved using progeny test methods (Fehr, 1993; Hill and Haag, 1974). Phenotypic
recurrent selection can be improved by gridding to control environmental variability when doing
selection based on single plant performance (Burton, 1982; Missaoui et al., 2005). The amount of
improvement realized from each method of evaluation depends on the population, trait of
interest, and intensity of selection applied (Celami, 1996; Haag and Hill, 1974; Knapp and
Teuber, 1993). Among and within family selection (AWFS) and PRS achieved twice the gain of
mass, half-sib, and half-sib progeny test (HSPT) selection when improving ease of floret tripping
in the CUF101 alfalfa population (Knapp and Teuber, 1993). The similar performance of AWFS
and PRS is not expected (Fehr, 1993). The efficiency of AWFS versus HSPT is a function of the
intensities of selection among and within families (Casler, 2008; Casler and Brummer, 2008). An
optimum selection strategy would be AWFS based on genotypic values predicted by best linear
unbiased predictor (BLUP), since it would simultaneously use information on family and
individuals (Resende, 2002). However, when evaluating many families, recording individual
information within families could be highly unpractical and time consuming.
In this experiment we attempted to use a simple soil-based assay in the greenhouse to
control soil variation to a much greater extent than is possible in the field, but still evaluate large
populations while selecting for Al tolerance. Our hypotheses were that using a family based
selection method like AWFS would improve our genetic gain for shoot biomass in acid, Al-rich
92
soil compared to an individual-based method like PRS, and that selecting directly in unlimed soil
would be lead to greater improvement in shoot biomass than selecting in limed soil. Therefore,
the objective of this experiment was to test these two hypotheses by selecting for shoot dry
weight with PRS and AWFS in the tetraploid alfalfa cultivar, Bulldog 805, which is adapted to
the acidic subsoils of the southeastern USA. In addition, we also evaluated PRS in unlimed soil
in the diploid population, CADL.
Materials and Methods
Base populations
The tetraploid cultivar Bulldog 805 (Bouton et al., 1997), a non-dormant cultivar
developed in southern Georgia, and the diploid germplasm CADL, Cultivated Alfalfa at the
Diploid Level (Bingham and McCoy, 1979), were used for the selection experiments. About 120
plants per population (Bulldog 805 and CADL) were grown in 750-ml plastic pots filled with
Fafard Super-fine Germinating Mix® (Conrad Fafard Inc., Agawam, MA) and were intercrossed
to develop half-sib families. For each population, the 80 families producing the most seed were
retained.
Soil for selection and evaluation
Selection was performed in the Crop and Soil Sciences Department greenhouses at the
University of Georgia, Athens, GA using a Cecil sandy clay loam soil (clayey, kaolinitic,
thermic, Typic Kanhapludul) collected from the UGA Plant Sciences Farm near Watkinsville,
GA, which is naturally acidic and high in exchangeable Al. Prior to the experiment, this soil was
amended with macro and micro nutrients as previously described (Khu et al., 2012) to generate
unlimed (UL) and limed (L) soils. After the addition of soil amendments, the soil was air dried
93
and sieved using a 3-mm screen according to Dall’Agnol et al. (1996). Amendments were mixed
into the soil prior to each cycle of selection and prior to the evaluation of selection response,
resulting in minor variations in the soil analysis (Table 4.1).
Selection Methodologies and Experimental Design
Two cycles of selection for shoot biomass were performed in Bulldog 805 and CADL
using among-and-within family (AWFS) recurrent selection (Casler and Brummer, 2008; Vogel
and Pedersen, 1993) and phenotypic recurrent selection with gridding (Bos and Caligari, 1995;
Gardner, 1961) (Table 4.2). Cycle 1 was performed during summer 2010 and Cycle 2 during
spring 2011.
Phenotypic recurrent selection (PRS): An equal amount of seed from each of the 80 families of
Bulldog 805 and of CADL was pooled to form the Cycle 0 populations used for selection. In
each cycle of selection, seeds were planted in 128-cell (8 × 16) plastic flats, in which each
seedling was grown in a 2.5 cm × 2.5 cm × 5 cm cell tapering to a point. Seedlings were watered
every 1 to 2 d using distilled water, and the flats were rotated inside the greenhouse benches at
weekly intervals to diminish micro-environmental greenhouse variation. Day and night
temperatures were on average 25°C and 20°C, respectively, but during Cycle 1 selection,
maximum temperatures during the day went up to 33 to 35°C. Supplemental lights were added to
provide 16 hr of light. During the course of the selections one or two applications of
chlorpenapyr (0.41 g/l) and avermectin (49.3 g/l) for thrips (Caliothrips fasciatus and
Frankliniella occidentalis) control were required.
In each flat, the outer rows were considered as borders, and thus not included in the
evaluation, keeping a core of 84 plants per flat for the evaluation. Six flats containing a total of
1008 plants from Bulldog 805 and from CADL Cycle 0 were placed in each of two greenhouses
94
(environments) and evaluated after growing for 60 d in UL soil. Shoots for each plant were
visually scored from 1 (low vigor) to 5 (highly vigorous). Each flat was then divided into seven
grids consisted of 12 plants (6 × 2), and the visual scores of plants within each grid were
standardized as follows:
Pi
iij
s
pp
where pij is the phenotypic value of plant j in grid i, is the mean phenotypic value of all plants
in grid i, and spi is the standard deviation of the plants in grid i. Based on standardized values,
truncation selection was imposed to select the most vigorous 80 plants across all flats in both
environments. Each environment and flat within environment contributed roughly equal numbers
of plants for the next cycle. The selected 80 plants in each cycle were intercrossed using bumble
bees (Bombus impatiens) to form the seed for the next cycle. Each plant contributed the same
amount of seed for the new population, but no control of the paternal contribution to the next
generation was made.
Among and within family selection: The AWFS method was performed in Bulldog 805 in both
L and UL soil (Table 4.2). General seedling growth methods were the same as described for grid
selection above. Border plants were again grown on all sides of flats. Two greenhouse
environments were used. Fourteen families were grown per flat, considered as a block in the
statistical model. Each half-sib family consisted of six plants growing in a row per replication
with four replications per environment. At 60 d after planting, for the families grown in UL soil,
individual plants within families were visually scored, and the two most vigorous individuals
across replications in each environment (8.3%) within the 20 (25%) superior families were
selected for the next cycle. Each environment contributed equal number of plants. For the
pi.
95
families grown in L soil, plants were larger than in UL soil, so shoot biomass was harvested by
row at 2.5cm above the soil level, dried at 65ºC for 72 hr, and weighed. The 20 (25%) highest
yielding families were selected based on biomass and then the two (8.3%) individuals within
these families across replications in each environment with the most visually vigorous regrowth
were selected for intercrossing. Thus, eighty plants were selected each cycle and intercrossed in
bee cages to produce seed for the next cycle. A linear statistical model was developed including
effects of families, environments, genotypes × environments (G×E) interaction, incomplete
blocks (nested in replications), and replications (nested in environments). All effects were
considered random except families, which were fixed. The visual score or the SDW least square
mean for each family was estimated using the MIXED procedure of SAS v. 9.1 (SAS, 2008).
Evaluation and genetic gain estimation
In order to evaluate gain from selection, we first manually recombined about 60 plants
from each of the eight populations generated by selection (Table 4.2) and the two base
populations (Cycle 0) of Bulldog 805 and CADL to increase seed quantity, to produce seeds
under similar environmental conditions and of the same age, and to avoid any heterotic effects
present in the Syn-1 generation. From the 60 plants planted per population, between 40 and 50
contributed most of the seeds in each population, and those seed were used for evaluating the
cycles and for genetic gain estimations.
Response to selection in each method was evaluated by growing Cycles 0, 1, and 2 from
both germplasms in L and UL soil for 65 d during the winter of 2011-2012 in the Crop and Soil
Sciences Department greenhouses at the University of Georgia, Athens, GA. Evaluations were
performed using conetainers (Stuewe and Sons, Inc., Tangent, OR) as previously described for
Al tolerance evaluation in soil (Khu et al., 2012). Each conetainer (3.8 cm diameter × 21 cm
96
long, with a volume of 164 ml) was filled with 140 g of soil. Individual racks (30 cm wide × 61
cm long × 18 cm high) held 98 (7 × 14) conetainers. The outer cones in each rack were used for
border rows, leaving 60 cones (12 × 5) per rack. Half of each rack was filled with L and the other
half with UL soil (Table 4.1). In the case of the UL treatment, a top-layer of 2.5 cm of limed soil
was added to allow proper germination and initial growth of the seedlings. To prevent
waterlogging and manganese toxicity, racks with the conetainers were placed into a plastic tray
with drain holes at the bottom that were filled with 15 cm of sterile sand (Khu et al., 2012). In a
single rack in each type of soil, two rows (named as replications) of five plants each for Cycle 0,
1, and 2 for a given selection method and a given germplasm were randomized. Seeds were
scarified by lightly rubbing with sandpaper prior to planting. Each method of selection was
evaluated in three blocks in each of two greenhouses, denoted as environments.
After growing for 65 d, plants were removed from the conetainers and roots gently
washed to remove excess soil. Plants were separated into root and stem fractions at the soil line,
and both fractions placed in a forced-air dryer at 65ºC for 72 hr to determine the root and shoot
dry weight (RDW and SDW) for each method in each type of soil for each individual plant. Plant
dry weights were summed for each row, and the root and shoot weight ratio (RDWR and
SDWR) on an entry basis was determined as the ratio of root or shoot dry weight in UL soil
compared to the dry weight in L soil. Therefore, the traits analyzed include SDW, which was
basically the trait used for selection, and RDW in both UL and L soil, and RDWR and SDWR,
representing the relative growth in UL vs. L soil.
Data analysis
The data for each trait in each method and cycle were tested for normality using the
UNIVARIATE procedure of SAS v. 9.2 (SAS, 2008) with the QQPlot statement and the Normal
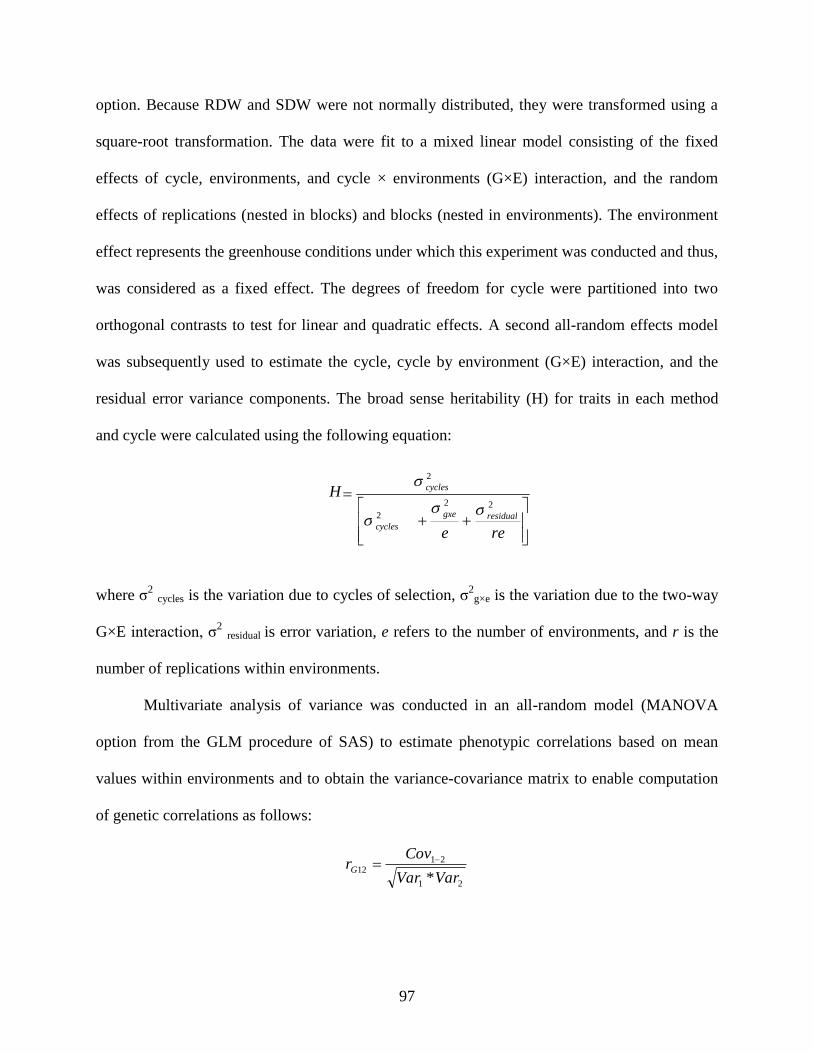
97
option. Because RDW and SDW were not normally distributed, they were transformed using a
square-root transformation. The data were fit to a mixed linear model consisting of the fixed
effects of cycle, environments, and cycle × environments (G×E) interaction, and the random
effects of replications (nested in blocks) and blocks (nested in environments). The environment
effect represents the greenhouse conditions under which this experiment was conducted and thus,
was considered as a fixed effect. The degrees of freedom for cycle were partitioned into two
orthogonal contrasts to test for linear and quadratic effects. A second all-random effects model
was subsequently used to estimate the cycle, cycle by environment (G×E) interaction, and the
residual error variance components. The broad sense heritability (H) for traits in each method
and cycle were calculated using the following equation:
where σ2 cycles is the variation due to cycles of selection, σ
2g×e is the variation due to the two-way
G×E interaction, σ2 residual is error variation, e refers to the number of environments, and r is the
number of replications within environments.
Multivariate analysis of variance was conducted in an all-random model (MANOVA
option from the GLM procedure of SAS) to estimate phenotypic correlations based on mean
values within environments and to obtain the variance-covariance matrix to enable computation
of genetic correlations as follows:
21
2112
*VarVar
CovrG
re e
residual gxe cycles
cycles 2 2
2
2 H
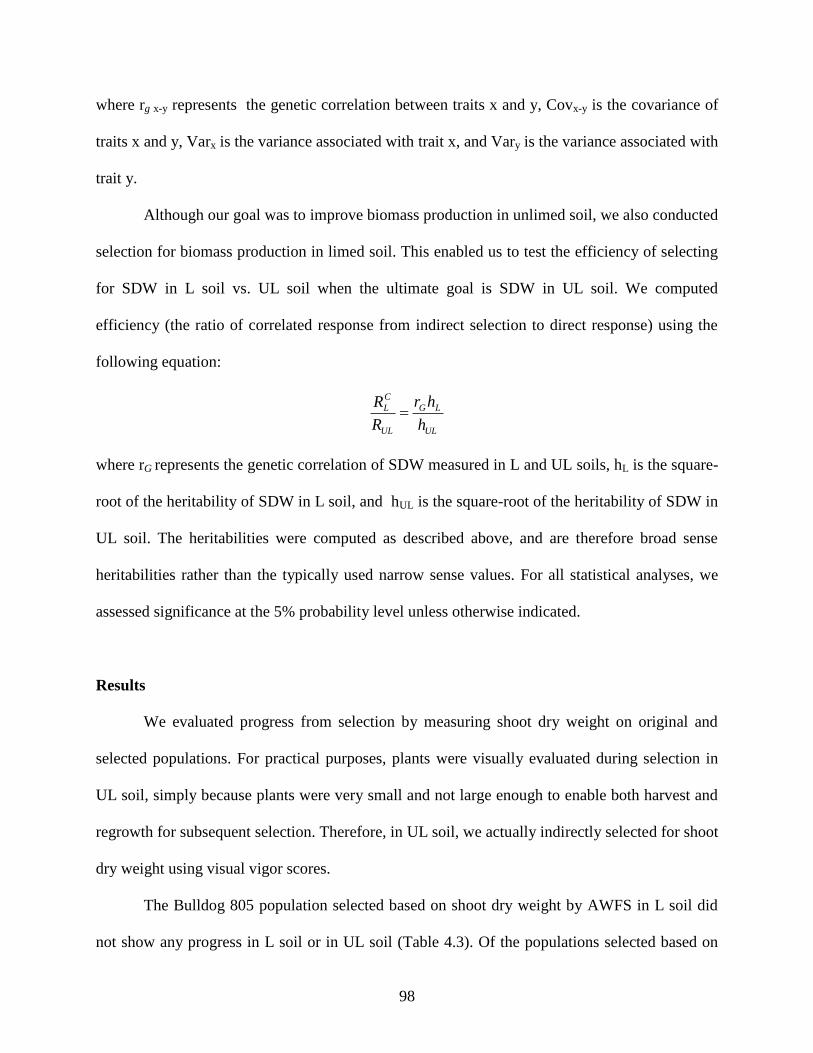
98
where rg x-y represents the genetic correlation between traits x and y, Covx-y is the covariance of
traits x and y, Varx is the variance associated with trait x, and Vary is the variance associated with
trait y.
Although our goal was to improve biomass production in unlimed soil, we also conducted
selection for biomass production in limed soil. This enabled us to test the efficiency of selecting
for SDW in L soil vs. UL soil when the ultimate goal is SDW in UL soil. We computed
efficiency (the ratio of correlated response from indirect selection to direct response) using the
following equation:
where rG represents the genetic correlation of SDW measured in L and UL soils, hL is the square-
root of the heritability of SDW in L soil, and hUL is the square-root of the heritability of SDW in
UL soil. The heritabilities were computed as described above, and are therefore broad sense
heritabilities rather than the typically used narrow sense values. For all statistical analyses, we
assessed significance at the 5% probability level unless otherwise indicated.
Results
We evaluated progress from selection by measuring shoot dry weight on original and
selected populations. For practical purposes, plants were visually evaluated during selection in
UL soil, simply because plants were very small and not large enough to enable both harvest and
regrowth for subsequent selection. Therefore, in UL soil, we actually indirectly selected for shoot
dry weight using visual vigor scores.
The Bulldog 805 population selected based on shoot dry weight by AWFS in L soil did
not show any progress in L soil or in UL soil (Table 4.3). Of the populations selected based on
UL
LG
UL
C
L
h
hr
R
R
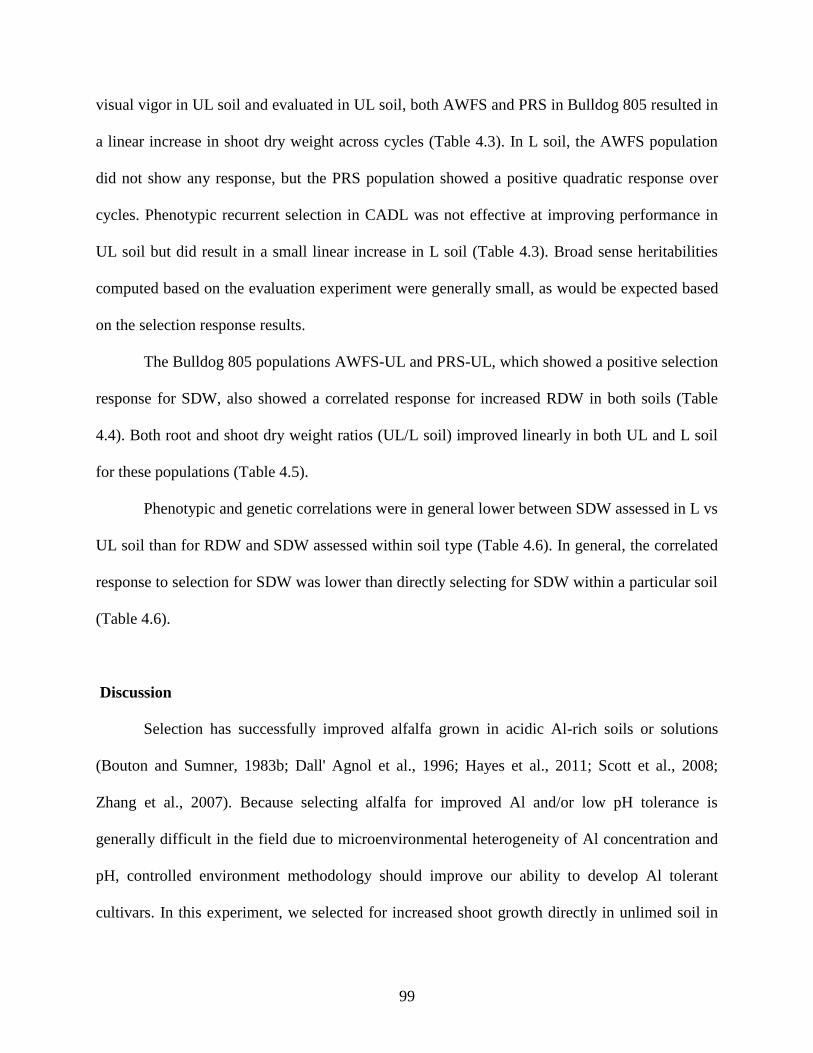
99
visual vigor in UL soil and evaluated in UL soil, both AWFS and PRS in Bulldog 805 resulted in
a linear increase in shoot dry weight across cycles (Table 4.3). In L soil, the AWFS population
did not show any response, but the PRS population showed a positive quadratic response over
cycles. Phenotypic recurrent selection in CADL was not effective at improving performance in
UL soil but did result in a small linear increase in L soil (Table 4.3). Broad sense heritabilities
computed based on the evaluation experiment were generally small, as would be expected based
on the selection response results.
The Bulldog 805 populations AWFS-UL and PRS-UL, which showed a positive selection
response for SDW, also showed a correlated response for increased RDW in both soils (Table
4.4). Both root and shoot dry weight ratios (UL/L soil) improved linearly in both UL and L soil
for these populations (Table 4.5).
Phenotypic and genetic correlations were in general lower between SDW assessed in L vs
UL soil than for RDW and SDW assessed within soil type (Table 4.6). In general, the correlated
response to selection for SDW was lower than directly selecting for SDW within a particular soil
(Table 4.6).
Discussion
Selection has successfully improved alfalfa grown in acidic Al-rich soils or solutions
(Bouton and Sumner, 1983b; Dall' Agnol et al., 1996; Hayes et al., 2011; Scott et al., 2008;
Zhang et al., 2007). Because selecting alfalfa for improved Al and/or low pH tolerance is
generally difficult in the field due to microenvironmental heterogeneity of Al concentration and
pH, controlled environment methodology should improve our ability to develop Al tolerant
cultivars. In this experiment, we selected for increased shoot growth directly in unlimed soil in
100
the greenhouse, using AWFS and PRS. Selection in Bulldog 805, selected in south Georgia in
soils which naturally have acidic subsoils with high Al, was effective at improving shoot
biomass by 8 to 20% per cycle (Table 4.3). A 22% gain in shoot dry weight was reported in a
previous study, in which one cycle of selection was done in unlimed, unfertilized soil using a
different germplasm than we used in this experiment (Dall' Agnol et al., 1996). In our
experiment, phenotypic recurrent selection with gridding was more effective than AWFS. The
diploid germplasm, CADL, did not respond to PRS, perhaps because of limited variability for Al
tolerance, a problem noted previously in most alfalfa germplasm (Bouton, 1996).
In Bulldog 805, we also attempted to select indirectly for shoot growth in UL soil by
conducting selection in L soil. Our hypothesis was that selection for general plant vigor and
growth may translate into more vigorous plants in either soil. This was not the case. Our results
conclusively show that in order to improve growth in UL soil, selection needs to be made in UL
soil, at least in Bulldog 805.
In a previous study, it was observed that selection for root and shoot growth in UL,
unfertilized soil was the most effective way to achieve acid soil stress tolerance, and that
selection for acid soil did not negatively affect root and shoot yields in L and fertilized soil (Dall'
Agnol et al., 1996). In our experiment, selection for shoot growth actually improved root growth
as well, and also improved the ratio of root and shoot growth in UL soil relative to L soil. Thus,
our results suggest that selecting for shoot growth in UL soil will improve overall plant
performance in UL soil, and in some cases in L soil as well. Selection for shoot growth in acid
soil may be more effective than selection for root growth, which is highly variable in acid soils
(Simpson et al., 1977), and our experiment supports that contention.
101
The lack of improvement observed in AWFS-L when evaluated in L soil, may be due to
the fact that under L conditions, most plants performed well, making identification of superior
families or individuals within family at the seedling stage difficult. When the plants were grown
in UL soil, most plants were greatly affected by the stressful conditions, making identification of
superior individuals easier.
Based on theoretical expectations, a higher genetic gain for yield, typically a low
heritability quantitative trait, would be expected using family test methods (Fehr, 1993; Hill and
Haag, 1974). The use of gridding in a phenotypic recurrent selection program (Bos and Caligari,
1995; Gardner, 1961) can effectively control environmental variability when selection is done on
single plant performance, thus resulting in improved populations (Burton, 1982; Missaoui et al.,
2005). Selection performed in the CUF101 alfalfa population to improve ease of floret tripping,
showed that AWFS and phenotypic recurrent selection achieved twice the gain of mass, half-sib,
and half-sib progeny test selection (Knapp and Teuber, 1993). Our results showed that PRS in
UL soil showed higher responses on cycle basis than the AWFS-UL. Apparently, under the
conditions of this experiment, gridding was efficiently able to reduce environmental variance to a
point where PRS was more effective than AWFS for acid Al-rich soil.
Some studies have concluded that direct selection in the target environment was the most
effective way to improve populations for stressful environments (Atlin and Frey, 1989;
Ceccarelli, 1989). In our study, selection directly in the unlimed soil resulted in better
performance for UL conditions than selection in limed soil (Table 4.6). This result agrees with a
previous study using a greenhouse soil-based experiment, which concluded that selection in UL
soil was the most effective way for achieving acid/Al tolerance in alfalfa (Dall' Agnol et al.,
1996). Therefore, selection to improve alfalfa yields in acid Al-rich soils should be conducted
102
directly in the target soil and using refined selection techniques in order to reduce the
environmental variance as much as possible.
Conclusions and Future Implications
The results we found in this experiment need to be validated in the field. If selection in
UL soil in the greenhouse can improve field tolerance to Al, then additional cycles of selection
should be undertaken. The progress we noted was quite good, but whether greenhouse selection
of seedling biomass translates into adult plant biomass and Al tolerance also needs to be tested.
We did not study physiological aspects of acid/Al tolerance in this investigation. However, other
experiments we have conducted have identified molecular markers associated with acid/Al
tolerance and have documented Al tolerance from different transgenes (Chapters 2 and 3). Thus,
combining the breeding methods with marker-assisted recurrent selection could accelerate
genetic gain for this trait. Breeding programs could be developed to select families based on their
yield and individuals within families based on molecular markers (Casler, 2012). Further
research on all these avenues is needed.
Acknowledgments
The authors would like to thank Donald Wood, Jonathan Markham, and Wesley Dean for their
support with the greenhouse screening. This study was funded by The University of Georgia and
The Samuel Roberts Noble Foundation.
103
References
Atlin G.N., Frey K.J. (1989) Predicting the relative effectiveness of direct versus indirect
selection for oat yield in three types of stress environments. Euphytica 44:137-142.
Barone P., Rosellini D., LaFayette P., Bouton J., Veronesi F., Parrott W. (2008) Bacterial citrate
synthase expression and soil aluminum tolerance in transgenic alfalfa. Plant Cell Reports
27:893-901.
Bingham E.T., McCoy T.J. (1979) Cultivated Alfalfa at the Diploid Level: origin, reproductive
stability, and yield of seed and forage. Crop Sci 19:97-100.
Bos I., Caligari P. (1995) Selection methods in plant breeding. Chapman & Hall, London.
Bouton J., Radcliffe D. (1989) Effects of acid soil selection on agronomically important traits in
alfalfa., Proceedings of XVI international grassland congress, Curle Printing Co., Inc.,
Minneapolis, Nice, France. pp. 377-378.
Bouton J.H. (1996) Screening the alfalfa core collection for acid soil tolerance. Crop Sci. 36:198-
200.
Bouton J.H., Sumner M.E. (1983) Alfalfa, Medicago sativa L., in highly weathered, acid soils.
V. Field performance of alfalfa selected for acid tolerance. Plant Soil 74:431-436.
Bouton J.H., Sumner M.E., Hammel J.E., Shahandeh H. (1986) Yield of an alfalfa germplasm
selected for acid soil tolerance when grown in soil with modified subsoils. Crop Sci
26:334-336.
Bouton J.H., Gates R.N., Wood D.T., Utley P.R. (1997) Registration of 'ABT 805' Alfalfa. Crop
Sci. 37:293-293.
Burton G.W. (1982) Improved recurrent restricted phenotypic selection increases bahiagrass
forage yields. Crop Sci. 22:1058-1061.
104
Casler M. (2012) Genomics to feed a switchgrass breeding program. Plant and Animal Genomes
XX Conference, San Diego, CA.
Casler M.D. (2008) Among-and-within-family selection in eight forage grass populations. Crop
Sci. 48:434-442.
Casler M.D., Brummer E.C. (2008) Theoretical expected genetic gains for among-and-within-
family selection methods in perennial forage crops. Crop Sci. 48:890-902.
Ceccarelli S. (1989) Wide adaptation: How wide? Euphytica 40:197-205.
Celami A. (1996) The methodology of honeycomb mass selection in yield improvement of
alfalfa, in: P. J. M. e. Genier G. (ed.) (Ed.), The Genus Medicago in the Mediterranean
region: Current situation and prospects in research, CIHEAM-IAMZ, Zaragoza. pp. 127-
132.
Dall' Agnol M., Bouton J.H., Parrott W.A. (1996) Screening methods to develop alfalfa
germplasms tolerant of acid, aluminum toxic soils. Crop Sci 36:64-70.
Fehr W. (1993) Principles of cultivar development. I. Theory and technique Macmillian Publ,
New York.
Foy C.D., Brown J.C. (1964) Toxic Factors in Acid Soils: II. Differential aluminum tolerance of
plant species. Soil Sci Soc Am J 28:27-32.
Gardner C.O. (1961) An evaluation of effects of mass selection and seed irradiation with thermal
neutrons on yield of corn. Crop Sci 1:241-245.
Haag W.L., Hill R.R. (1974) Comparison of selection methods for autotetraploids. II. Selection
for disease resistance in alfalfa. Crop Sci. 14:591-593.
105
Hayes R.C., Scott B.J., Dear B.S., Li G.D., Auricht G.C. (2011) Seedling validation of acid soil
tolerance of lucerne populations selected in solution culture high in aluminium. Crop and
Pasture Science 62:803-811.
Hill R.R., Haag W.L. (1974) Comparison of selection methods for autotetraploids. I. Theoretical.
Crop Sci. 14:587-590.
Khu D.-M., Reyno R., Brummer E.C., Monteros M.J. (2012) Screening methods for aluminum
tolerance in alfalfa. Crop Sci. 52:161-167.
Knapp E.E., Teuber L.R. (1993) Outcrossing rates of alfalfa populations differing in ease of
floret tripping. Crop Sci. 33:1181-1185.
Kochian L.V., Hoekenga O.A., Pineros M.A. (2004) How do crop plants tolerate acid soils? -
Mechanisms of aluminum tolerance and phosphorous efficiency. Annu Rev Plant Biol
55:459-493.
Missaoui A., Fasoula V., Bouton J. (2005) The effect of low plant density on response to
selection for biomass production in switchgrass. Euphytica 142:1-12.
Narasimhamoorthy B., Blancaflor E.B., Bouton J.H., Payton M.E., Sledge M.K. (2007) A
comparison of hydroponics, soil, and root staining methods for evaluation of aluminum
tolerance in Medicago truncatula (barrel medic) germplasm. Crop Sci 47:321-328.
Resende M. (2002) Genética biométrica e estatística no melhoramento de plantas perenes
Embrapa Informação Tecnológica, Brasilia, Brasil.
SAS. (2008) SAS/STAT®9.2, User’s Guide, SAS Institute Inc., Cary, NC.
Scott B.J., Ewing M.A., Williams R., Humphries A.W., Coombes N.E. (2008) Tolerance of
aluminium toxicity in annual Medicago species and lucerne. Australian Journal of
Experimental Agriculture 48:499-511.
106
Simpson J., Pinkerton A., Lazdovskis J. (1977) Effects of subsoil calcium on the root growth of
some lucerne genotypes (Medicago sativa L.) in acidic soil profiles. Australian Journal of
Agricultural Research 28:629-638.
Vogel K.P., Pedersen J.F. (1993) Breeding systems for cross-pollinated perennial grasses. Plant
Breeding Reviews, John Wiley & Sons, Inc. pp. 251-274.
Zhang X., Humphries A., Auricht G. (2007) Genetic variability and inheritance of aluminium
tolerance as indicated by long root regrowth in lucerne ( Medicago sativa L.). Euphytica
157:177-184.
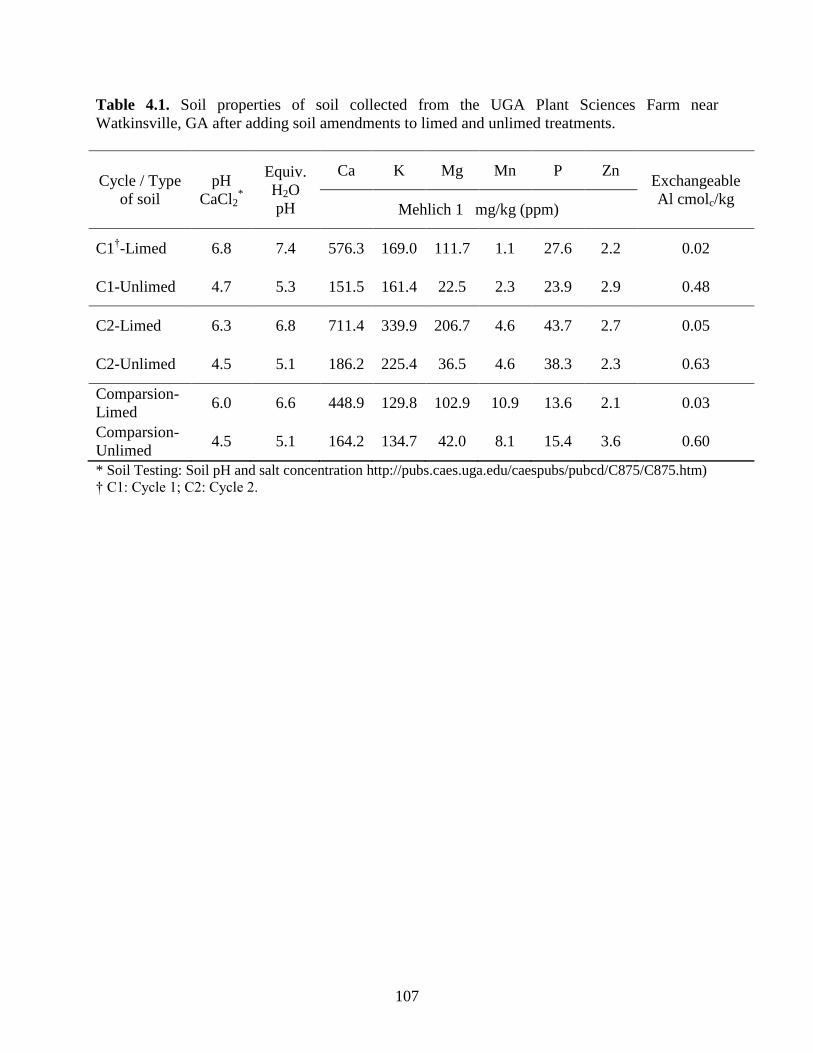
107
Table 4.1. Soil properties of soil collected from the UGA Plant Sciences Farm near
Watkinsville, GA after adding soil amendments to limed and unlimed treatments.
Cycle / Type
of soil
pH
CaCl2*
Equiv.
H2O
pH
Ca K Mg Mn P Zn Exchangeable
Al cmolc/kg Mehlich 1 mg/kg (ppm)
C1†-Limed 6.8 7.4 576.3 169.0 111.7 1.1 27.6 2.2 0.02
C1-Unlimed 4.7 5.3 151.5 161.4 22.5 2.3 23.9 2.9 0.48
C2-Limed 6.3 6.8 711.4 339.9 206.7 4.6 43.7 2.7 0.05
C2-Unlimed 4.5 5.1 186.2 225.4 36.5 4.6 38.3 2.3 0.63
Comparsion-
Limed 6.0 6.6 448.9 129.8 102.9 10.9 13.6 2.1 0.03
Comparsion-
Unlimed 4.5 5.1 164.2 134.7 42.0 8.1 15.4 3.6 0.60
* Soil Testing: Soil pH and salt concentration http://pubs.caes.uga.edu/caespubs/pubcd/C875/C875.htm)
† C1: Cycle 1; C2: Cycle 2.
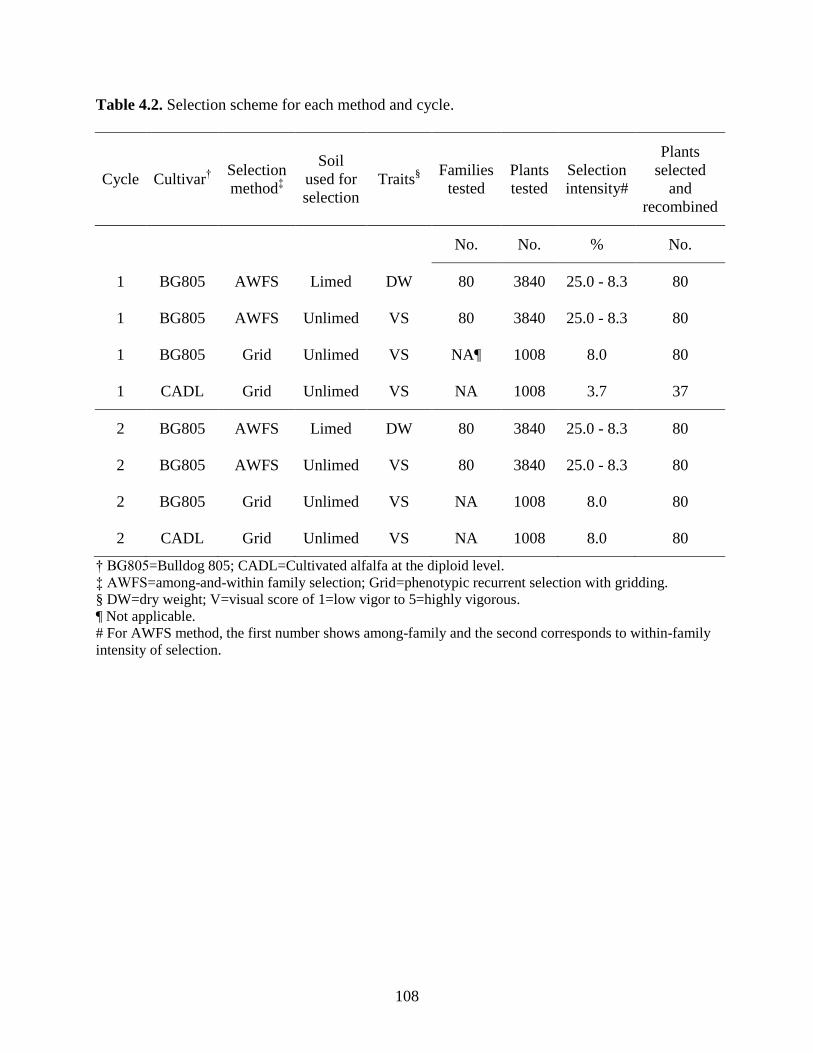
108
Table 4.2. Selection scheme for each method and cycle.
Cycle Cultivar†
Selection
method‡
Soil
used for
selection
Traits§
Families
tested
Plants
tested
Selection
intensity#
Plants
selected
and
recombined
No. No. % No.
1 BG805 AWFS Limed DW 80 3840 25.0 - 8.3 80
1 BG805 AWFS Unlimed VS 80 3840 25.0 - 8.3 80
1 BG805 Grid Unlimed VS NA¶ 1008 8.0 80
1 CADL Grid Unlimed VS NA 1008 3.7 37
2 BG805 AWFS Limed DW 80 3840 25.0 - 8.3 80
2 BG805 AWFS Unlimed VS 80 3840 25.0 - 8.3 80
2 BG805 Grid Unlimed VS NA 1008 8.0 80
2 CADL Grid Unlimed VS NA 1008 8.0 80
† BG805=Bulldog 805; CADL=Cultivated alfalfa at the diploid level.
‡ AWFS=among-and-within family selection; Grid=phenotypic recurrent selection with gridding.
§ DW=dry weight; V=visual score of 1=low vigor to 5=highly vigorous.
¶ Not applicable.
# For AWFS method, the first number shows among-family and the second corresponds to within-family
intensity of selection.
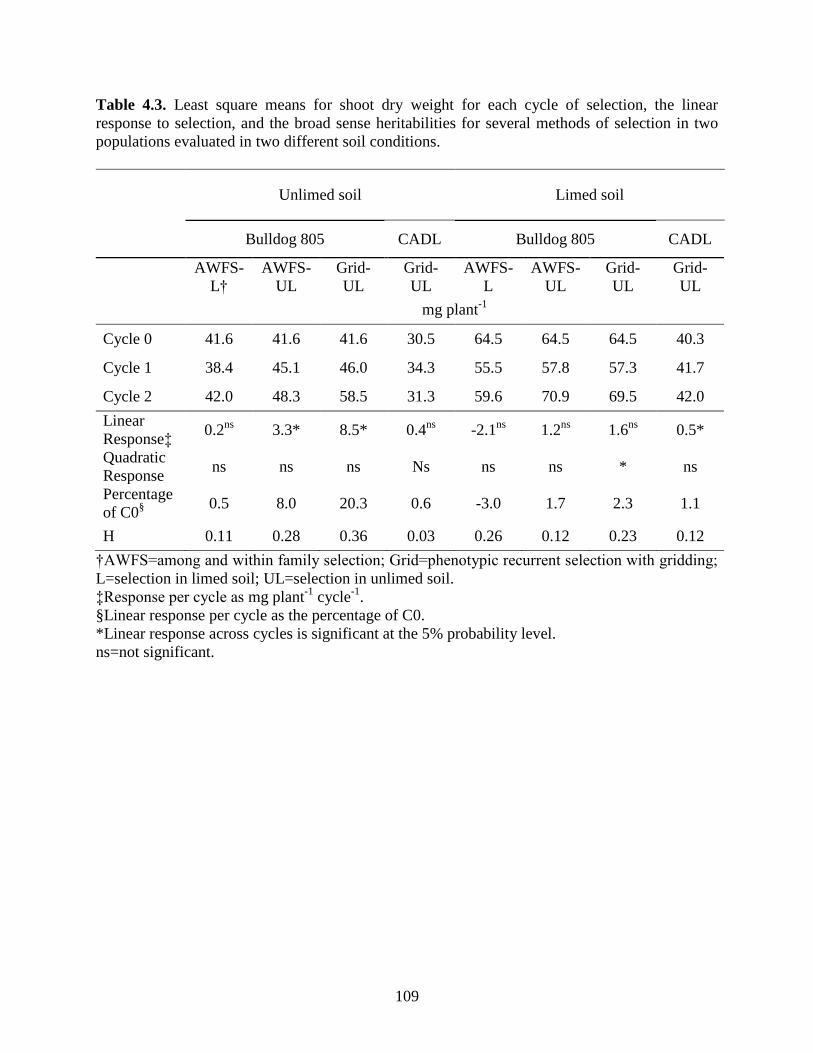
109
Table 4.3. Least square means for shoot dry weight for each cycle of selection, the linear
response to selection, and the broad sense heritabilities for several methods of selection in two
populations evaluated in two different soil conditions.
Unlimed soil Limed soil
Bulldog 805 CADL Bulldog 805 CADL
AWFS-
L†
AWFS-
UL
Grid-
UL
Grid-
UL
AWFS-
L
AWFS-
UL
Grid-
UL
Grid-
UL
mg plant-1
Cycle 0 41.6 41.6 41.6 30.5 64.5 64.5 64.5 40.3
Cycle 1 38.4 45.1 46.0 34.3 55.5 57.8 57.3 41.7
Cycle 2 42.0 48.3 58.5 31.3 59.6 70.9 69.5 42.0
Linear
Response‡ 0.2
ns 3.3* 8.5* 0.4
ns -2.1
ns 1.2
ns 1.6
ns 0.5*
Quadratic
Response ns ns ns Ns ns ns * ns
Percentage
of C0§
0.5 8.0 20.3 0.6 -3.0 1.7 2.3 1.1
H 0.11 0.28 0.36 0.03 0.26 0.12 0.23 0.12
†AWFS=among and within family selection; Grid=phenotypic recurrent selection with gridding;
L=selection in limed soil; UL=selection in unlimed soil.
‡Response per cycle as mg plant-1
cycle-1
.
§Linear response per cycle as the percentage of C0.
*Linear response across cycles is significant at the 5% probability level.
ns=not significant.
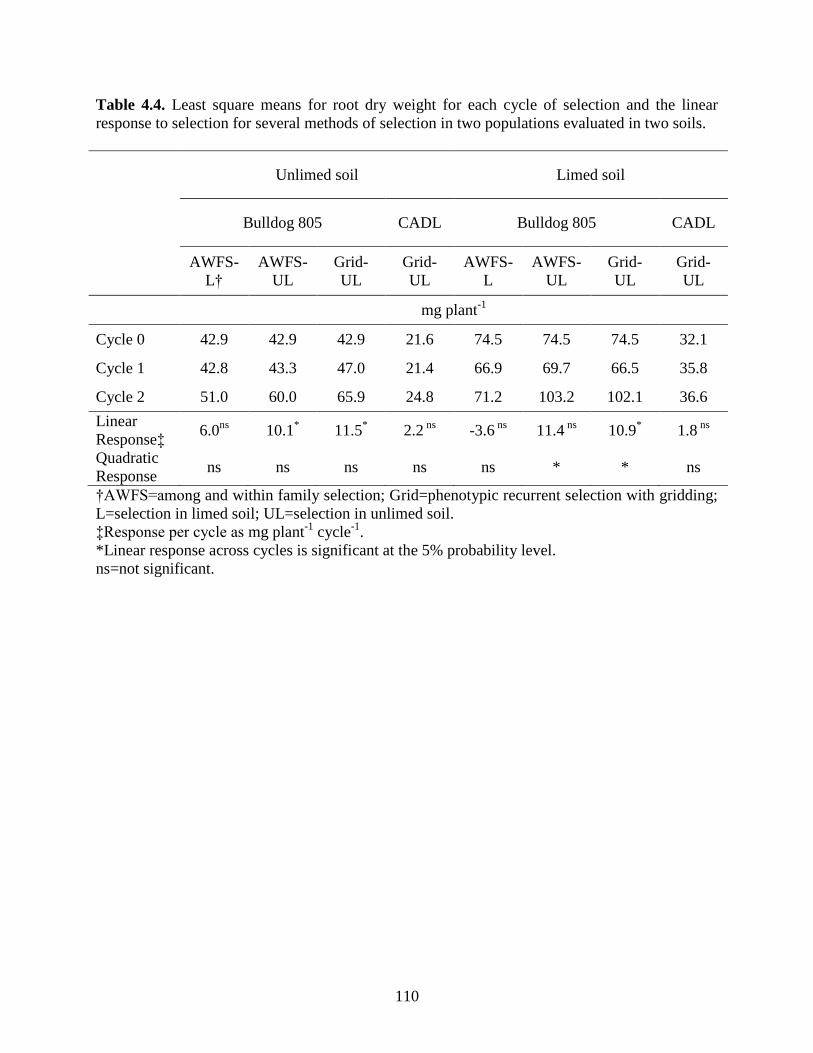
110
Table 4.4. Least square means for root dry weight for each cycle of selection and the linear
response to selection for several methods of selection in two populations evaluated in two soils.
Unlimed soil Limed soil
Bulldog 805 CADL Bulldog 805 CADL
AWFS-
L†
AWFS-
UL
Grid-
UL
Grid-
UL
AWFS-
L
AWFS-
UL
Grid-
UL
Grid-
UL
mg plant-1
Cycle 0 42.9 42.9 42.9 21.6 74.5 74.5 74.5 32.1
Cycle 1 42.8 43.3 47.0 21.4 66.9 69.7 66.5 35.8
Cycle 2 51.0 60.0 65.9 24.8 71.2 103.2 102.1 36.6
Linear
Response‡ 6.0
ns 10.1
* 11.5
* 2.2
ns -3.6
ns 11.4
ns 10.9
* 1.8
ns
Quadratic
Response ns ns ns ns ns * * ns
†AWFS=among and within family selection; Grid=phenotypic recurrent selection with gridding;
L=selection in limed soil; UL=selection in unlimed soil.
‡Response per cycle as mg plant-1
cycle-1
.
*Linear response across cycles is significant at the 5% probability level.
ns=not significant.
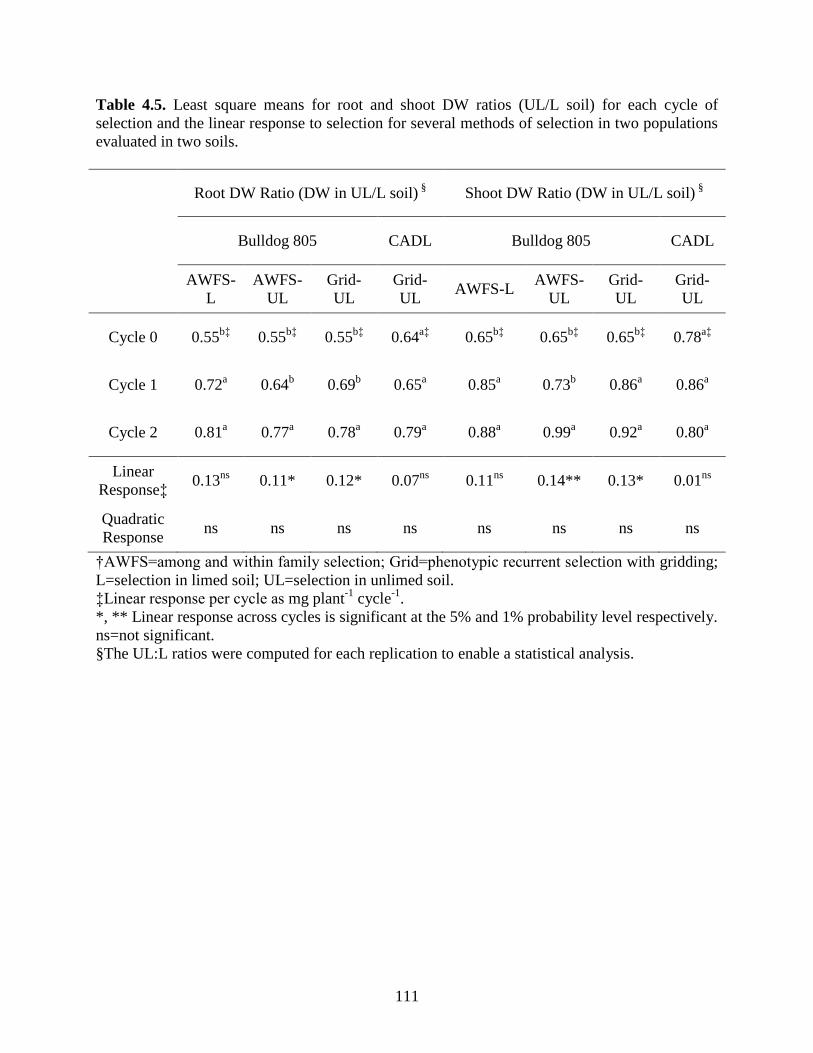
111
Table 4.5. Least square means for root and shoot DW ratios (UL/L soil) for each cycle of
selection and the linear response to selection for several methods of selection in two populations
evaluated in two soils.
Root DW Ratio (DW in UL/L soil) §
Shoot DW Ratio (DW in UL/L soil) §
Bulldog 805 CADL Bulldog 805 CADL
AWFS-
L
AWFS-
UL
Grid-
UL
Grid-
UL AWFS-L
AWFS-
UL
Grid-
UL
Grid-
UL
Cycle 0 0.55b‡
0.55b‡
0.55b‡
0.64a‡
0.65b‡
0.65b‡
0.65b‡
0.78a‡
Cycle 1 0.72a 0.64
b 0.69
b 0.65
a 0.85
a 0.73
b 0.86
a 0.86
a
Cycle 2 0.81a 0.77
a 0.78
a 0.79
a 0.88
a 0.99
a 0.92
a 0.80
a
Linear
Response‡ 0.13
ns 0.11* 0.12* 0.07
ns 0.11
ns 0.14** 0.13* 0.01
ns
Quadratic
Response ns ns ns ns ns ns ns ns
†AWFS=among and within family selection; Grid=phenotypic recurrent selection with gridding;
L=selection in limed soil; UL=selection in unlimed soil.
‡Linear response per cycle as mg plant-1
cycle-1
.
*, ** Linear response across cycles is significant at the 5% and 1% probability level respectively.
ns=not significant.
§The UL:L ratios were computed for each replication to enable a statistical analysis.
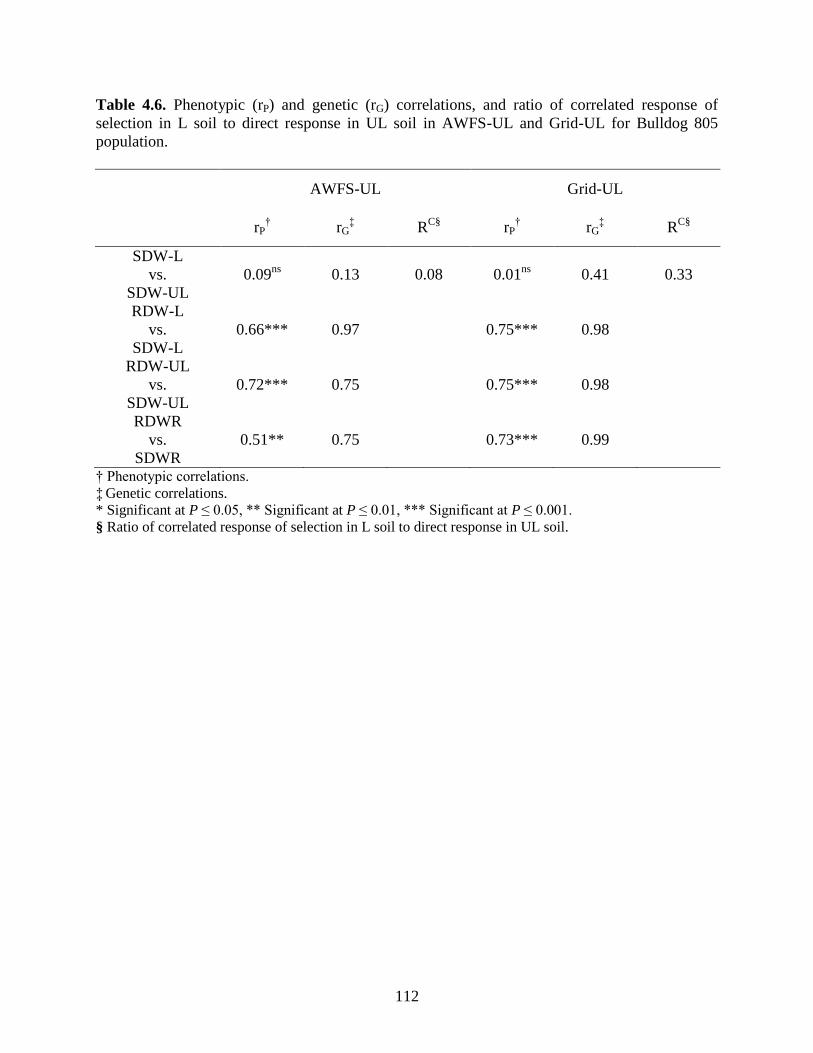
112
Table 4.6. Phenotypic (rP) and genetic (rG) correlations, and ratio of correlated response of
selection in L soil to direct response in UL soil in AWFS-UL and Grid-UL for Bulldog 805
population.
AWFS-UL Grid-UL
rP
† rG
‡ R
C§ rP
† rG
‡ R
C§
SDW-L
vs.
SDW-UL
0.09ns
0.13 0.08 0.01ns
0.41 0.33
RDW-L
vs.
SDW-L
0.66*** 0.97
0.75*** 0.98
RDW-UL
vs.
SDW-UL
0.72*** 0.75
0.75*** 0.98
RDWR
vs.
SDWR
0.51** 0.75
0.73*** 0.99
† Phenotypic correlations.
‡ Genetic correlations.
* Significant at P ≤ 0.05, ** Significant at P ≤ 0.01, *** Significant at P ≤ 0.001.
§ Ratio of correlated response of selection in L soil to direct response in UL soil.
113
CHAPTER 5
CONCLUSIONS
Alfalfa, Medicago sativa L., is one of the most important forage legumes worldwide.
However, in acidic soils the productivity and persistence of alfalfa decreases markedly due to
Al+3
and H+
toxicity and essential nutrients deficiencies that inhibit root growth and
development. Low pH and Al toxicity can be ameliorated by liming the soil, but acidic subsoil
layers will persist. Therefore, plant breeding to develop cultivars tolerant of low pH and Al
would be valuable. Genomics technologies can help dissect the genetic basis of acid/Al
tolerance, and can augment plant breeding programs to achieve tolerance in an efficient and
durable manner.
The first objective of this research was to identify sources of acid/Al tolerance in
tetraploid alfalfa through genetic mapping of quantitative trait loci (QTL). The tetraploid
aluminum tolerant genotype Altet-4, derived from a source of tolerance identified in diploid M.
sativa subsp. caerulea, was crossed to NECS-141, a semi-dormant breeding genotype, to
produce a mapping population segregating for Al tolerance. Linkage maps were constructed
using single-sequence repeat (SSR) molecular markers, generating a composite map length of
840 cM for Altet4 and 749 cM for NECS-141. Single-factor analysis and interval mapping
identified QTL for root and shoot weight or root and shoot weight ratio between unlimed and
limed soil on Altet-4 LGs 1, 2, 5, 6, and 7, and on NECS-141 LG 5. Our results suggest that two
of the three QTL previously detected for Al tolerance at the diploid level were also present in
this mapping population, together with new QTL identified from the Al-tolerant and from the Al-
114
sensitive parent. Individual QTL explained between 8.0 and 35.3% of the phenotypic variation.
Some of these QTL were detected in multiple greenhouse environments and for multiple traits
while others were environment-specific, suggesting that multiple mechanisms of Al tolerance
exist in alfalfa.
The second goal was to assess the acid/Al tolerance of transgenic alfalfa plants over-
expressing Pseudomonas aeruginosa citrate synthase (CS) and a plasma membrane H+-ATPase
from Daucus carota (DcPA1). Because membrane transporters are thought to enhance organic
acid transportation and exudation, we hypothesized that combining both genes into a common
background would increase Al tolerance over either gene individually. We generated a full-sib
population with individual genotypes being allocated to one of four isogenic T2 populations: (1)
no transgene, (2) CS only, (3) DcPA1 only, or (4) both transgenes. Based on the segregation
ratios of T1 and T2 generations and Southern blot analysis, both transgenes are likely present as a
single copy.
The evaluation of these populations was done using rooted stem cuttings growing in
unlimed and limed soil in the greenhouse. All three transgenic populations (CS, DcPA1, and
CS+DcPA1) showed higher Al/acid soil tolerance measured as the ratios of root and shoot dry
weight in UL vs. L soil than the isogenic non-transgenic population. However, we did not
observe an advantage of combining both transgenes compared to the single transgenes. Levels of
tolerance achieved by the transgenic populations were high, with UL:L ratios near unity (0.91 to
0.98), showing the potential of a transgenic approach. Lower levels of Al in shoot tissue were
observed for the transgenic populations over the non-transgenic one, suggesting that the Al-
exclusion mechanism could be driving Al/acid soil tolerance in this study. Interestingly, the level
of tolerance we observed by transgenesis was equal to that observed in the non-transgenic
115
genotype Altet-4, but Altet-4 had high levels of Al in its shoot tissue. This suggests that
combining both transgenes and QTL into a common background may lead to superior Al
tolerance.
Finally, the third objective of this study was to compare genetic gain for acid/Al tolerance
as measured by seedling biomass production in acidic soil under greenhouse conditions from
phenotypic recurrent selection with gridding (PRS) and among and within family selection
(AWFS) in the tetraploid cultivar Bulldog 805 and the diploid germplasm CADL (Cultivated
Alfalfa at the Diploid Level). Two cycles of selection were performed either based on shoot dry
weight or a visual score of shoot vigor 60 d after germination. Cycles 0, 1, and 2 (C0, C1, and
C2) from each method and population were evaluated for their root and shoot dry weight (RDW
and SDW) after 60 d of growth in UL and L soils using a greenhouse soil-based assay. The
diploid CADL cultivar did not respond to selection likely due to a lack of variability. Bulldog
805 selected for aerial biomass by either method in UL soil had higher shoot biomass when
grown UL soil after two cycles of selection. Interestingly, its performance in L soil was not
negatively affected. The results also suggest that direct selection in UL soil was the most
efficient method to improve alfalfa’s performance in acid Al-rich soils. Under the conditions of
this experiment, the PRS method in UL soil was the most effective in terms of the resources used
and the responses achieved.
The transgenic approach offers a fast, efficient way to achieve enhanced acid/Al tolerant
alfalfa cultivars, but more information is needed especially related to their performance under
field and commercial conditions. However, the difficulty and costly regulatory process make this
approach less affordable for small seed companies or public breeding programs, and may
preclude commercialization altogether. The identification of molecular markers associated with

116
acid/Al tolerance in this study will provide the opportunity to introduce marker-assisted recurrent
selection to the breeding programs. This genomic information together with the development of
quick and easy selection methodology to assess the current existing variability in tetraploid
germplasm will allow us to speed up the progress to integrate acid/Al tolerance in alfalfa.