feeding recommendations regarding reduced lignin alfalfa
TRANSCRIPT
11/8/2018
4
Feeding recommendations regarding reduced lignin alfalfa
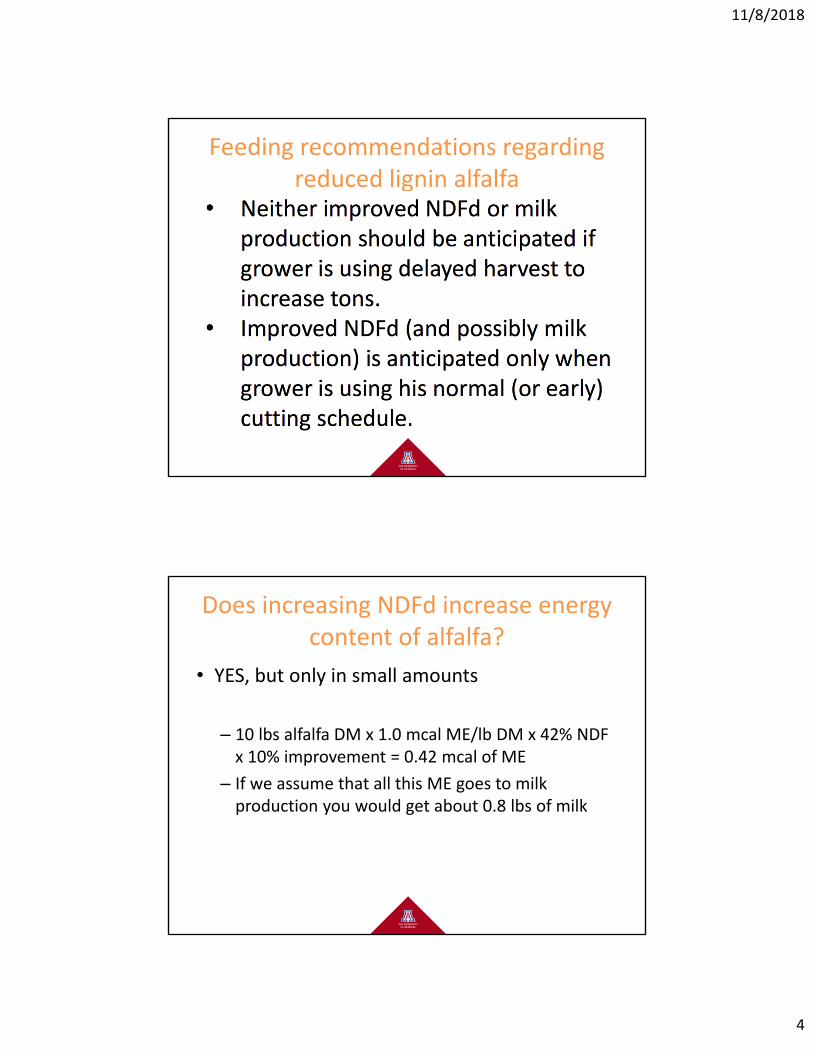
Does increasing NDFd increase energy content of alfalfa?
• YES, but only in small amounts
– 10 lbs alfalfa DM x 1.0 mcal ME/lb DM x 42% NDF x 10% improvement = 0.42 mcal of ME
– If we assume that all this ME goes to milk production you would get about 0.8 lbs of milk
11/8/2018
5
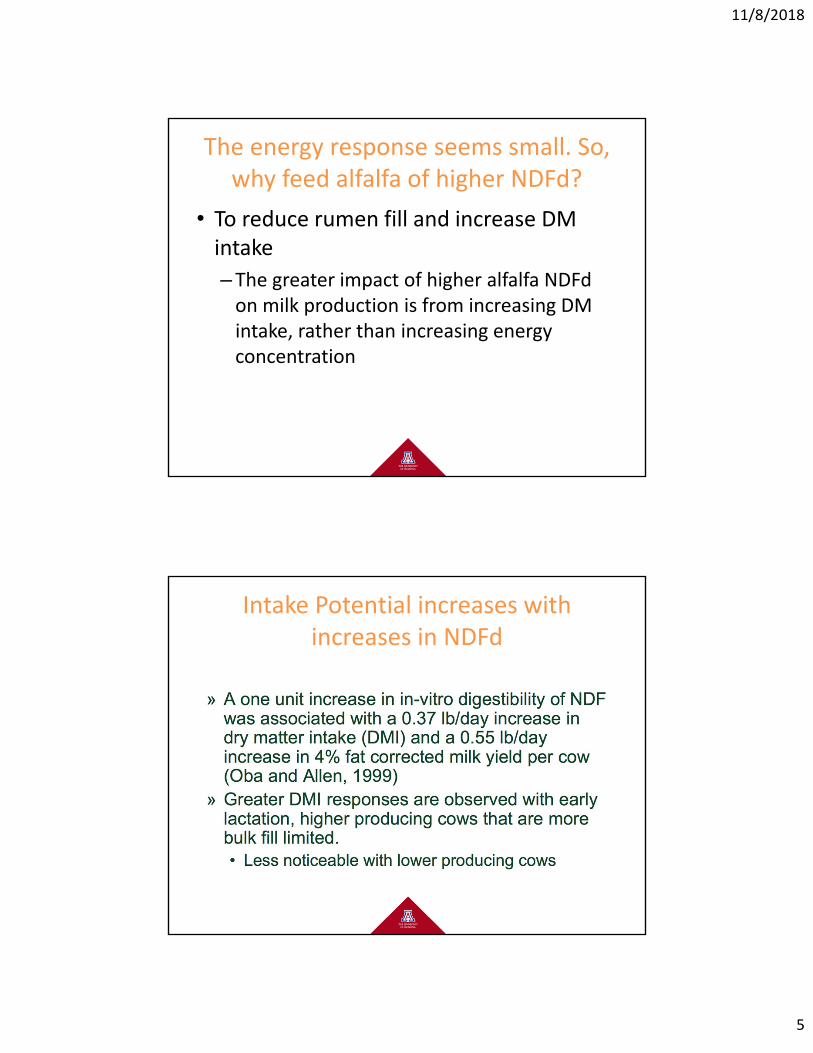
The energy response seems small. So, why feed alfalfa of higher NDFd?
• To reduce rumen fill and increase DM intake
– The greater impact of higher alfalfa NDFdon milk production is from increasing DM intake, rather than increasing energy concentration
Intake Potential increases with increases in NDFd
11/8/2018
6
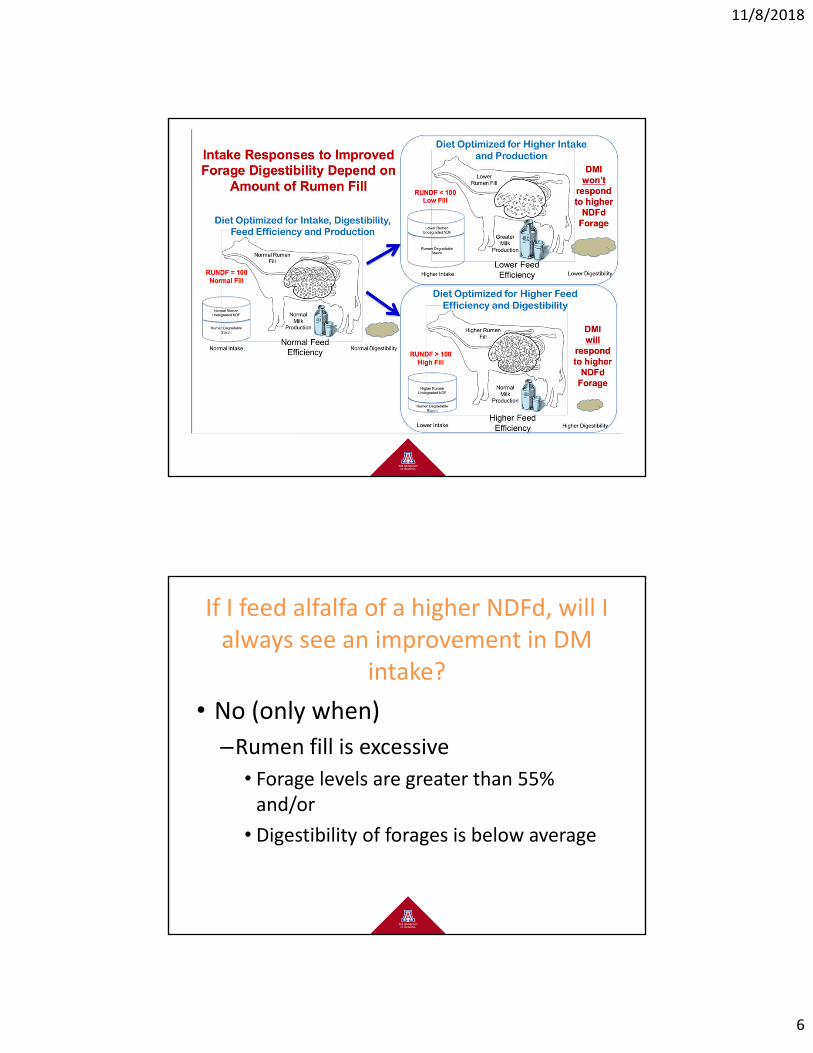
If I feed alfalfa of a higher NDFd, will I always see an improvement in DM
intake?
• No (only when)–Rumen fill is excessive
• Forage levels are greater than 55% and/or
• Digestibility of forages is below average
11/8/2018
7
When rumen fill is not excessive, will I see a response in DM intake?
• NO–When forage levels in the diet are low (less than about 45%) and/or
–Digestibility of forages is above average, rumen fill is not limiting intake
Does a improvement in DM intake always lead to higher milk production?
• Not always. If cows are in poor body condition or in later lactation, the increased energy intake will be used for tissue growth and not milk production.
11/8/2018
8
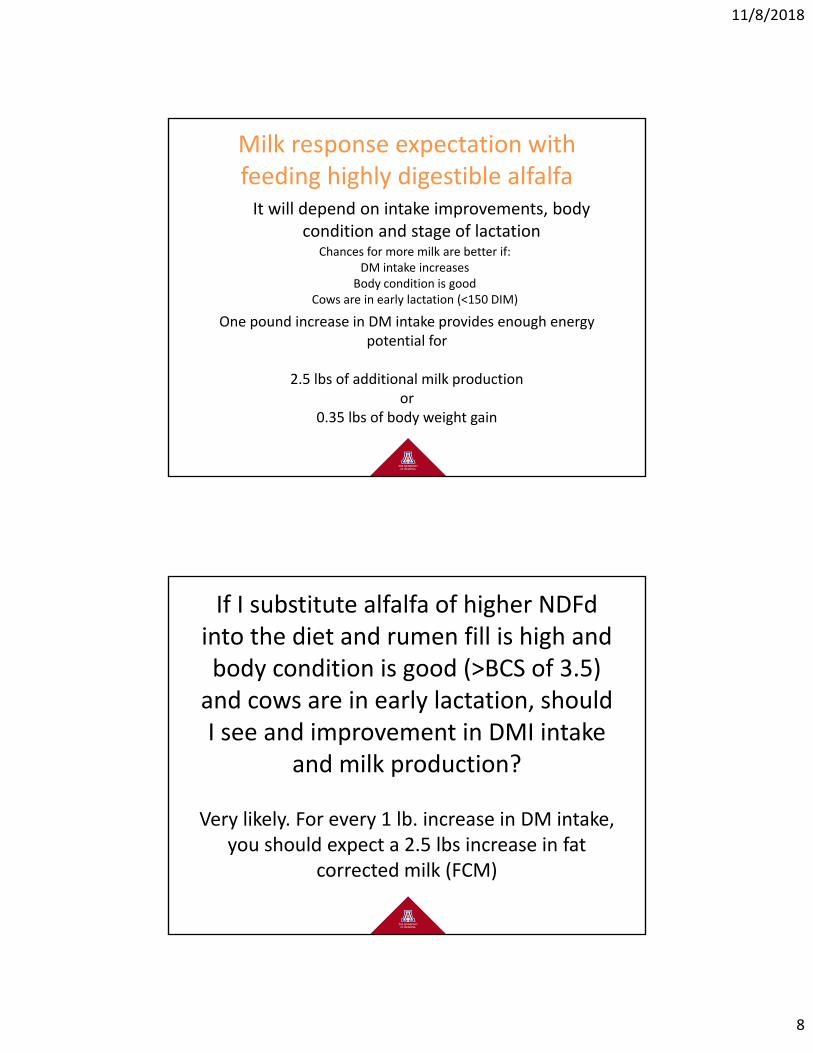
Milk response expectation with feeding highly digestible alfalfaIt will depend on intake improvements, body
condition and stage of lactationChances for more milk are better if:
DM intake increasesBody condition is good
Cows are in early lactation (<150 DIM)
One pound increase in DM intake provides enough energy potential for
2.5 lbs of additional milk productionor
0.35 lbs of body weight gain
If I substitute alfalfa of higher NDFdinto the diet and rumen fill is high and body condition is good (>BCS of 3.5) and cows are in early lactation, should I see and improvement in DMI intake
and milk production?
Very likely. For every 1 lb. increase in DM intake, you should expect a 2.5 lbs increase in fat
corrected milk (FCM)
11/8/2018
9
11/8/2018
10
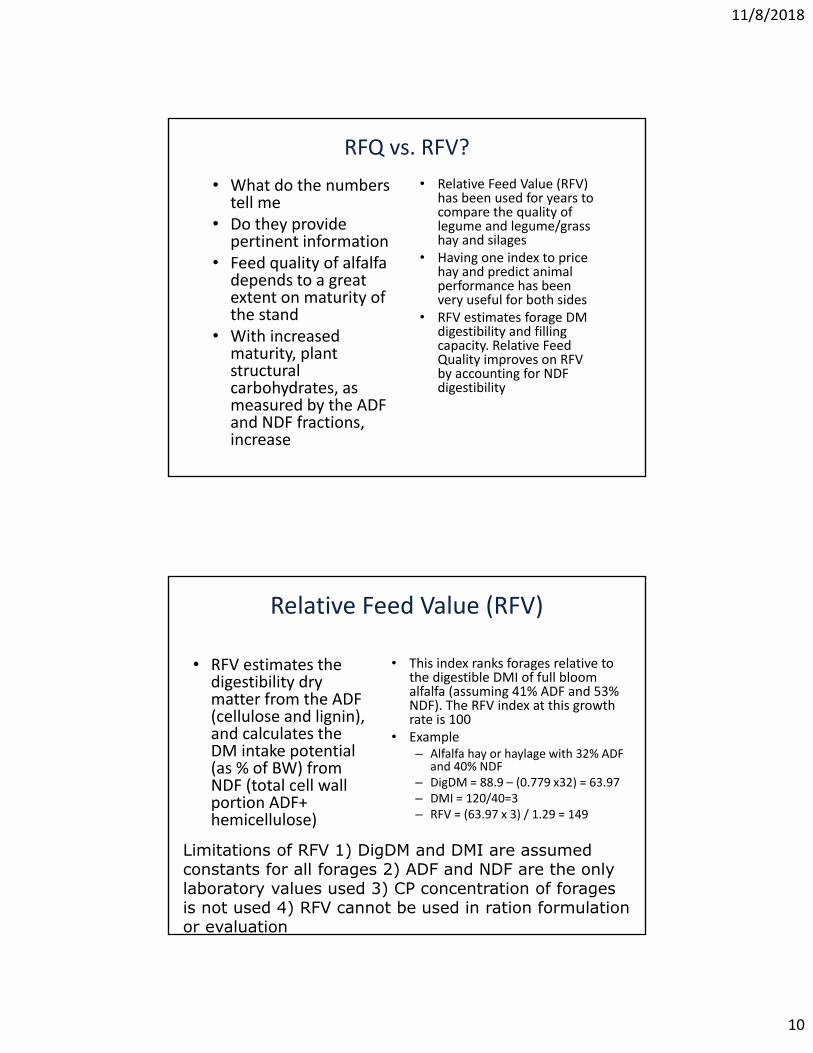
RFQ vs. RFV?
• What do the numbers tell me
• Do they provide pertinent information
• Feed quality of alfalfa depends to a great extent on maturity of the stand
• With increased maturity, plant structural carbohydrates, as measured by the ADF and NDF fractions, increase
• Relative Feed Value (RFV) has been used for years to compare the quality of legume and legume/grass hay and silages
• Having one index to price hay and predict animal performance has been very useful for both sides
• RFV estimates forage DM digestibility and filling capacity. Relative Feed Quality improves on RFV by accounting for NDF digestibility
Relative Feed Value (RFV)
• RFV estimates the digestibility dry matter from the ADF (cellulose and lignin), and calculates the DM intake potential (as % of BW) from NDF (total cell wall portion ADF+ hemicellulose)
• This index ranks forages relative to the digestible DMI of full bloom alfalfa (assuming 41% ADF and 53% NDF). The RFV index at this growth rate is 100
• Example– Alfalfa hay or haylage with 32% ADF
and 40% NDF– DigDM = 88.9 – (0.779 x32) = 63.97– DMI = 120/40=3– RFV = (63.97 x 3) / 1.29 = 149
Limitations of RFV 1) DigDM and DMI are assumed constants for all forages 2) ADF and NDF are the only laboratory values used 3) CP concentration of forages is not used 4) RFV cannot be used in ration formulation or evaluation
11/8/2018
11
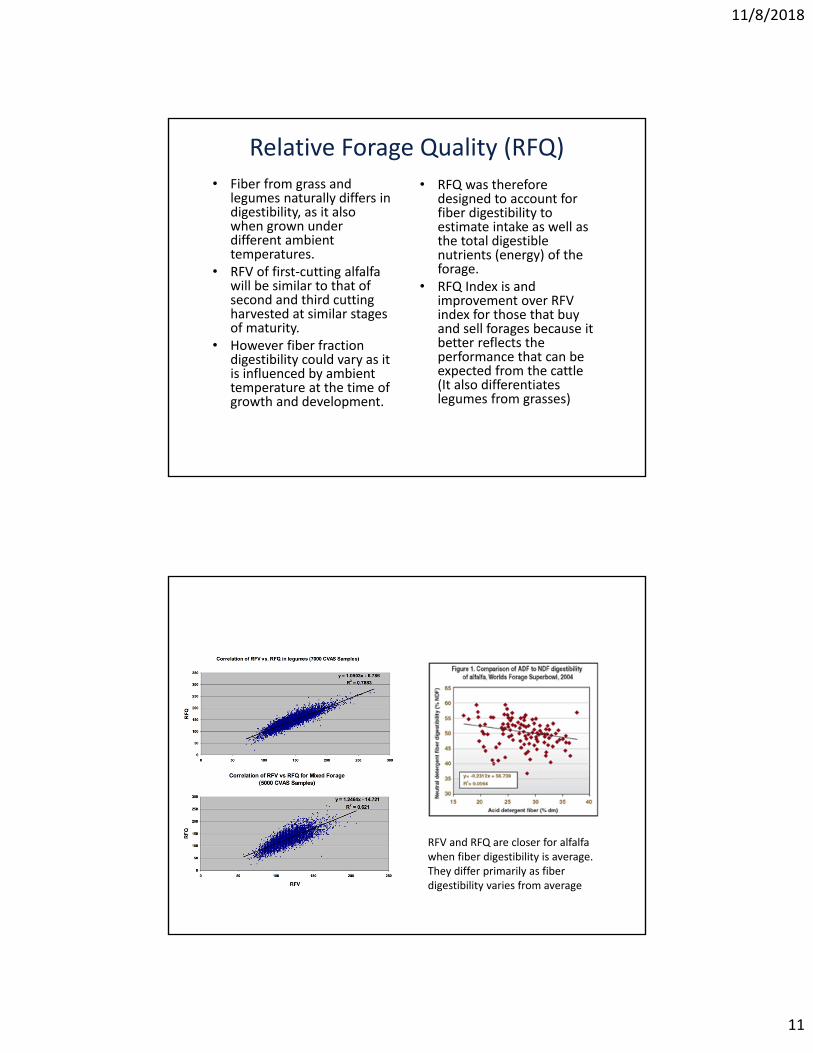
Relative Forage Quality (RFQ)• Fiber from grass and
legumes naturally differs in digestibility, as it also when grown under different ambient temperatures.
• RFV of first‐cutting alfalfa will be similar to that of second and third cutting harvested at similar stages of maturity.
• However fiber fraction digestibility could vary as it is influenced by ambient temperature at the time of growth and development.
• RFQ was therefore designed to account for fiber digestibility to estimate intake as well as the total digestible nutrients (energy) of the forage.
• RFQ Index is and improvement over RFV index for those that buy and sell forages because it better reflects the performance that can be expected from the cattle (It also differentiates legumes from grasses)
RFV and RFQ are closer for alfalfa when fiber digestibility is average. They differ primarily as fiber digestibility varies from average
11/8/2018
12
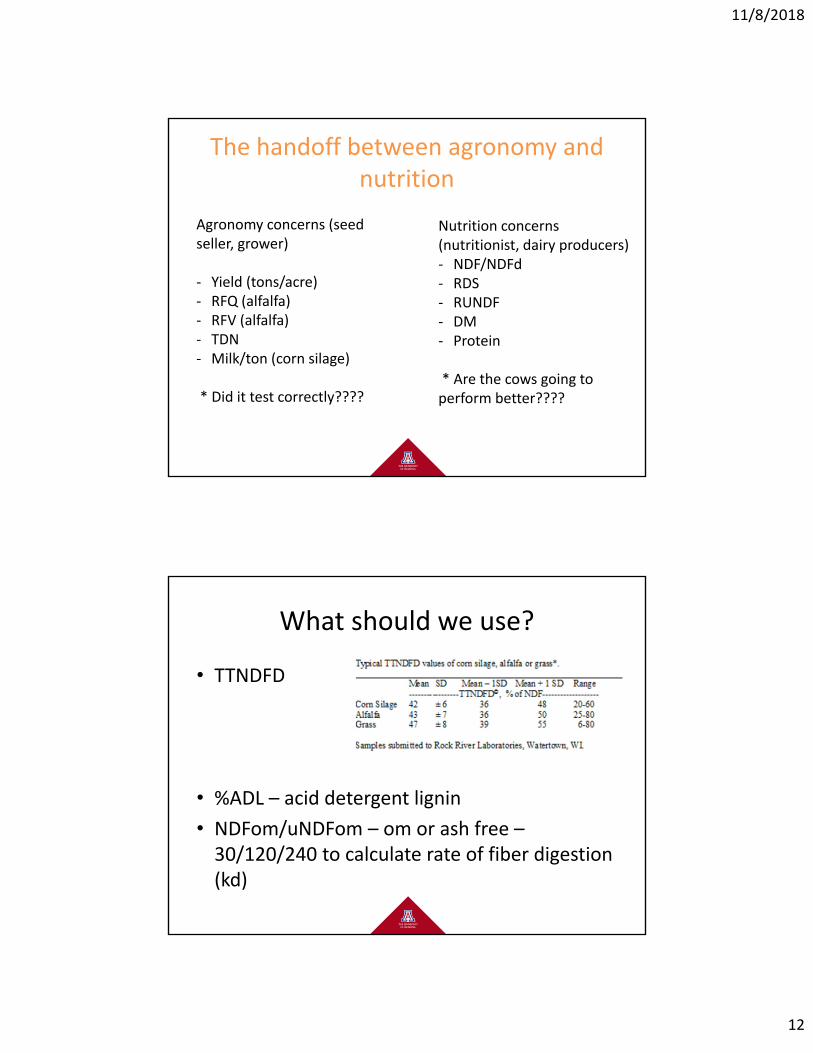
The handoff between agronomy and nutrition
Agronomy concerns (seed seller, grower)
‐ Yield (tons/acre)‐ RFQ (alfalfa)‐ RFV (alfalfa)‐ TDN‐ Milk/ton (corn silage)
* Did it test correctly????
Nutrition concerns (nutritionist, dairy producers)‐ NDF/NDFd‐ RDS‐ RUNDF‐ DM‐ Protein
* Are the cows going to perform better????
What should we use?
• TTNDFD
• %ADL – acid detergent lignin
• NDFom/uNDFom – om or ash free –30/120/240 to calculate rate of fiber digestion (kd)
11/8/2018
13
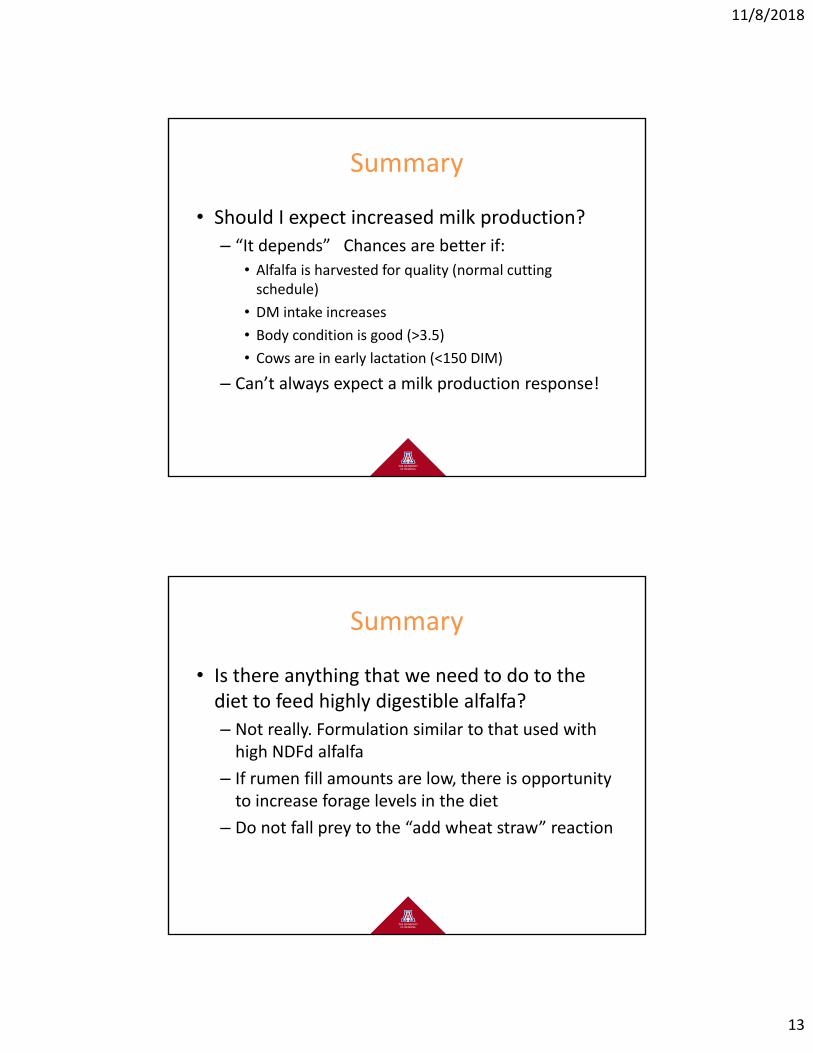
Summary
• Should I expect increased milk production?
– “It depends” Chances are better if:
• Alfalfa is harvested for quality (normal cutting schedule)
• DM intake increases
• Body condition is good (>3.5)
• Cows are in early lactation (<150 DIM)
– Can’t always expect a milk production response!
Summary
• Is there anything that we need to do to the diet to feed highly digestible alfalfa?
– Not really. Formulation similar to that used with high NDFd alfalfa
– If rumen fill amounts are low, there is opportunity to increase forage levels in the diet
– Do not fall prey to the “add wheat straw” reaction
11/8/2018
14
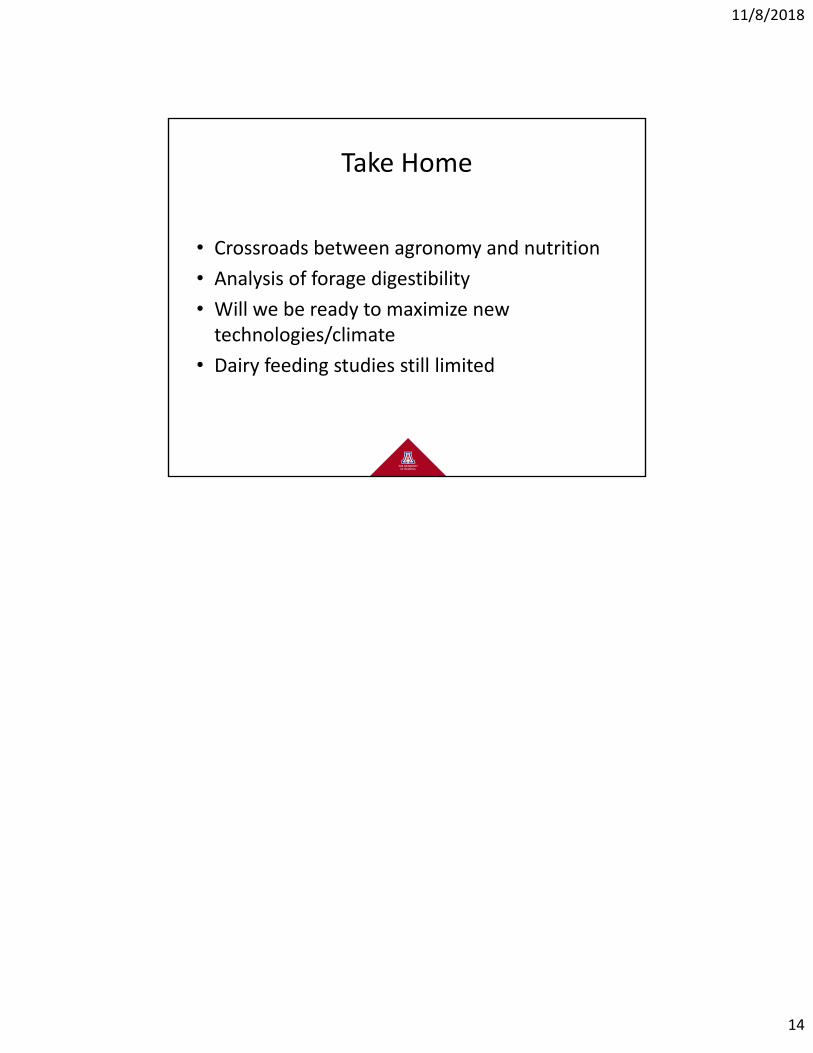
Take Home
• Crossroads between agronomy and nutrition
• Analysis of forage digestibility
• Will we be ready to maximize new technologies/climate
• Dairy feeding studies still limited
10/18/2018
1
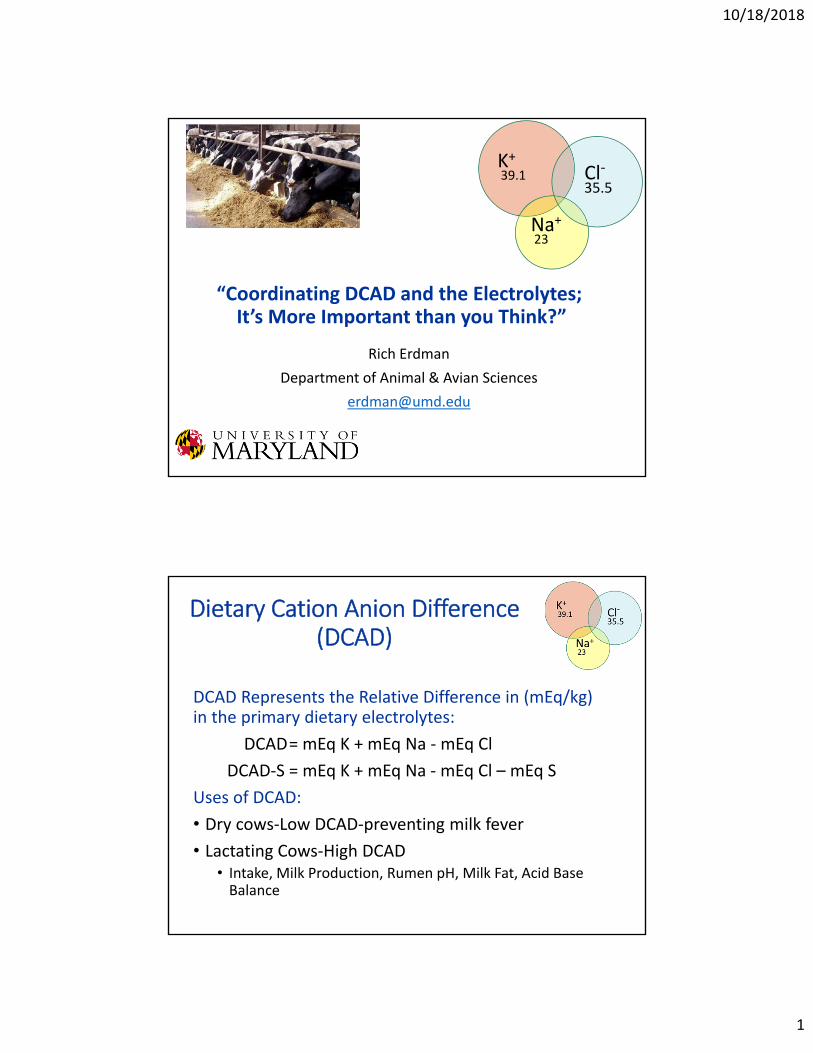
“Coordinating DCAD and the Electrolytes;It’s More Important than you Think?”
Rich Erdman
Department of Animal & Avian Sciences
K+39.1
Na+23
Cl‐35.5
Dietary Cation Anion Difference (DCAD)
DCAD Represents the Relative Difference in (mEq/kg) in the primary dietary electrolytes:
DCAD= mEq K + mEq Na ‐ mEq Cl
DCAD‐S = mEq K + mEq Na ‐ mEq Cl – mEq S
Uses of DCAD:
• Dry cows‐Low DCAD‐preventing milk fever
• Lactating Cows‐High DCAD• Intake, Milk Production, Rumen pH, Milk Fat, Acid Base Balance
10/18/2018
2
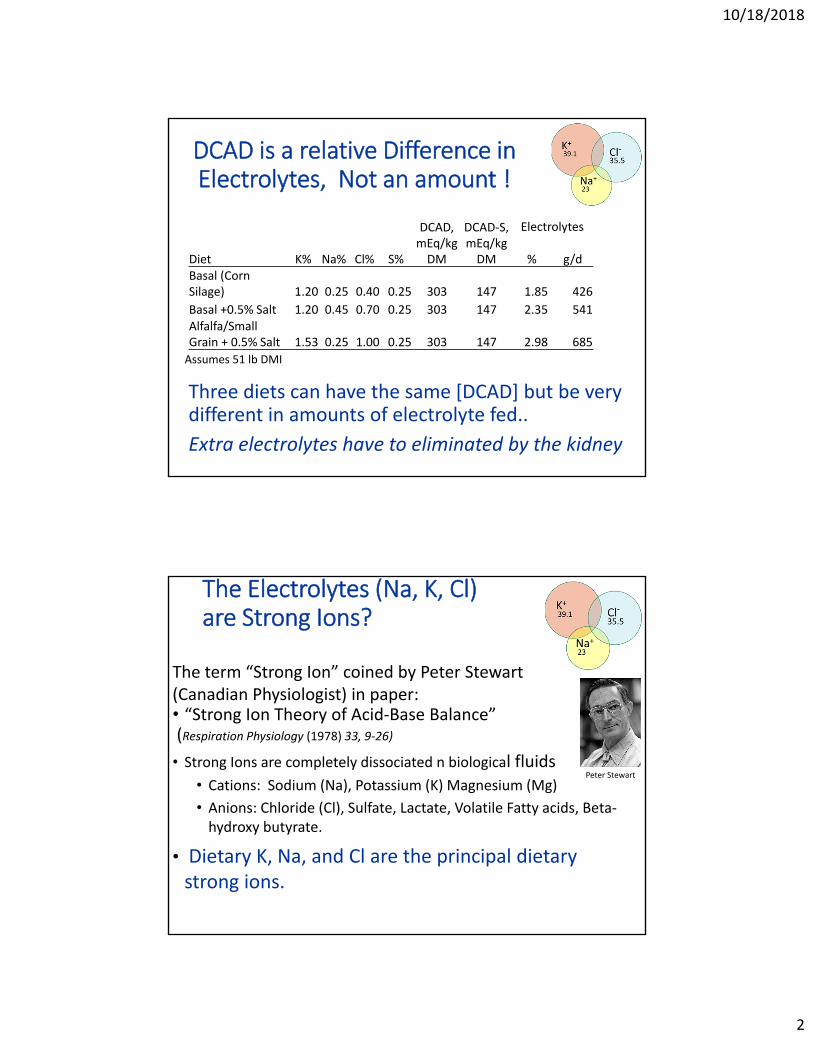
DCAD is a relative Difference in Electrolytes, Not an amount !
Three diets can have the same [DCAD] but be very different in amounts of electrolyte fed..
Extra electrolytes have to eliminated by the kidney
Assumes 51 lb DMI
Diet K% Na% Cl% S%
DCAD, mEq/kg DM
DCAD‐S, mEq/kg DM
Electrolytes
% g/dBasal (CornSilage) 1.20 0.25 0.40 0.25 303 147 1.85 426
Basal +0.5% Salt 1.20 0.45 0.70 0.25 303 147 2.35 541Alfalfa/Small Grain + 0.5% Salt 1.53 0.25 1.00 0.25 303 147 2.98 685
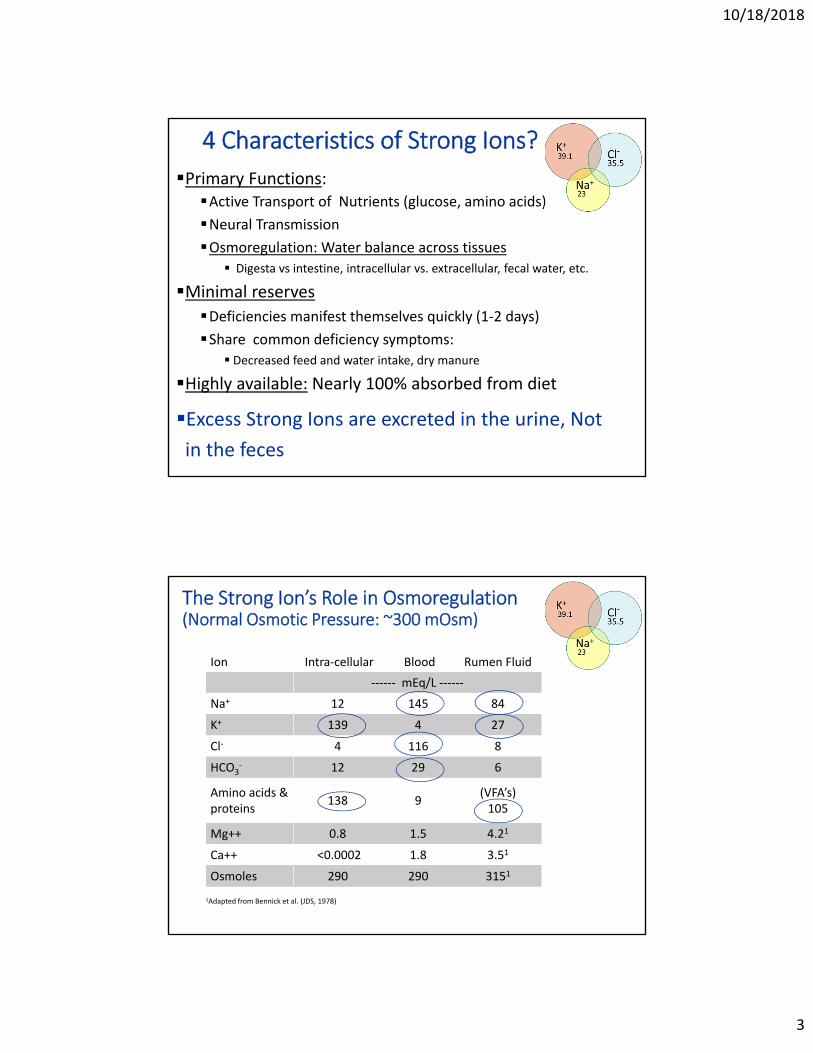
The Electrolytes (Na, K, Cl)are Strong Ions?
The term “Strong Ion” coined by Peter Stewart(Canadian Physiologist) in paper:• “Strong Ion Theory of Acid‐Base Balance”(Respiration Physiology (1978) 33, 9‐26)
• Strong Ions are completely dissociated n biological fluids • Cations: Sodium (Na), Potassium (K) Magnesium (Mg)
• Anions: Chloride (Cl), Sulfate, Lactate, Volatile Fatty acids, Beta‐hydroxy butyrate.
• Dietary K, Na, and Cl are the principal dietary strong ions.
Peter Stewart
10/18/2018
3
4 Characteristics of Strong Ions?
Primary Functions:Active Transport of Nutrients (glucose, amino acids)
Neural Transmission
Osmoregulation: Water balance across tissues
Digesta vs intestine, intracellular vs. extracellular, fecal water, etc.
Minimal reserves
Deficiencies manifest themselves quickly (1‐2 days)
Share common deficiency symptoms:
Decreased feed and water intake, dry manure
Highly available: Nearly 100% absorbed from diet
Excess Strong Ions are excreted in the urine, Not
in the feces
Ion Intra‐cellular Blood Rumen Fluid
‐‐‐‐‐‐ mEq/L ‐‐‐‐‐‐
Na+ 12 145 84
K+ 139 4 27
Cl‐ 4 116 8
HCO3‐ 12 29 6
Amino acids & proteins
138 9(VFA’s)105
Mg++ 0.8 1.5 4.21
Ca++ <0.0002 1.8 3.51
Osmoles 290 290 3151
1Adapted from Bennick et al. (JDS, 1978)
The Strong Ion’s Role in Osmoregulation(Normal Osmotic Pressure: ~300 mOsm)
10/18/2018
4
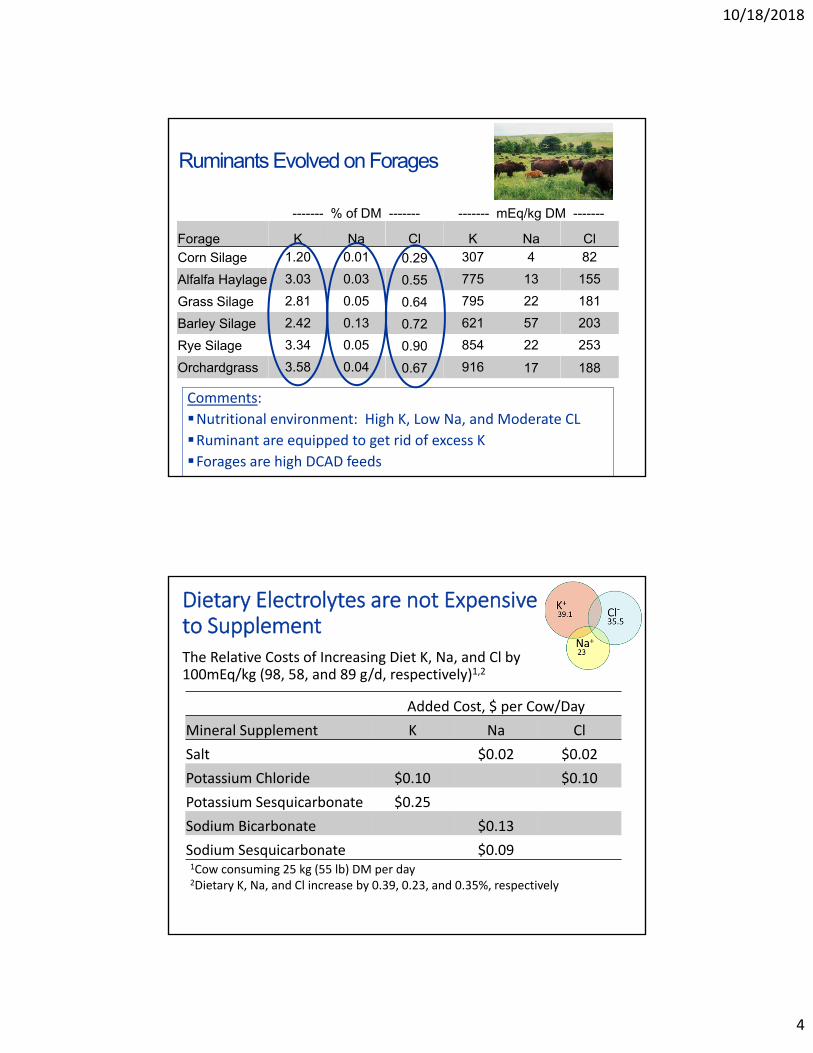
------- % of DM ------- ------- mEq/kg DM -------
Forage K Na Cl K Na Cl
Corn Silage 1.20 0.01 0.29 307 4 82
Alfalfa Haylage 3.03 0.03 0.55 775 13 155
Grass Silage 2.81 0.05 0.64 795 22 181
Barley Silage 2.42 0.13 0.72 621 57 203
Rye Silage 3.34 0.05 0.90 854 22 253
Orchardgrass 3.58 0.04 0.67 916 17 188
Ruminants Evolved on Forages
Comments:
Nutritional environment: High K, Low Na, and Moderate CL
Ruminant are equipped to get rid of excess K
Forages are high DCAD feeds
Dietary Electrolytes are not Expensive to SupplementThe Relative Costs of Increasing Diet K, Na, and Cl by 100mEq/kg (98, 58, and 89 g/d, respectively)1,2
Added Cost, $ per Cow/Day
Mineral Supplement K Na Cl
Salt $0.02 $0.02
Potassium Chloride $0.10 $0.10
Potassium Sesquicarbonate $0.25
Sodium Bicarbonate $0.13
Sodium Sesquicarbonate $0.091Cow consuming 25 kg (55 lb) DM per day2Dietary K, Na, and Cl increase by 0.39, 0.23, and 0.35%, respectively
10/18/2018
5
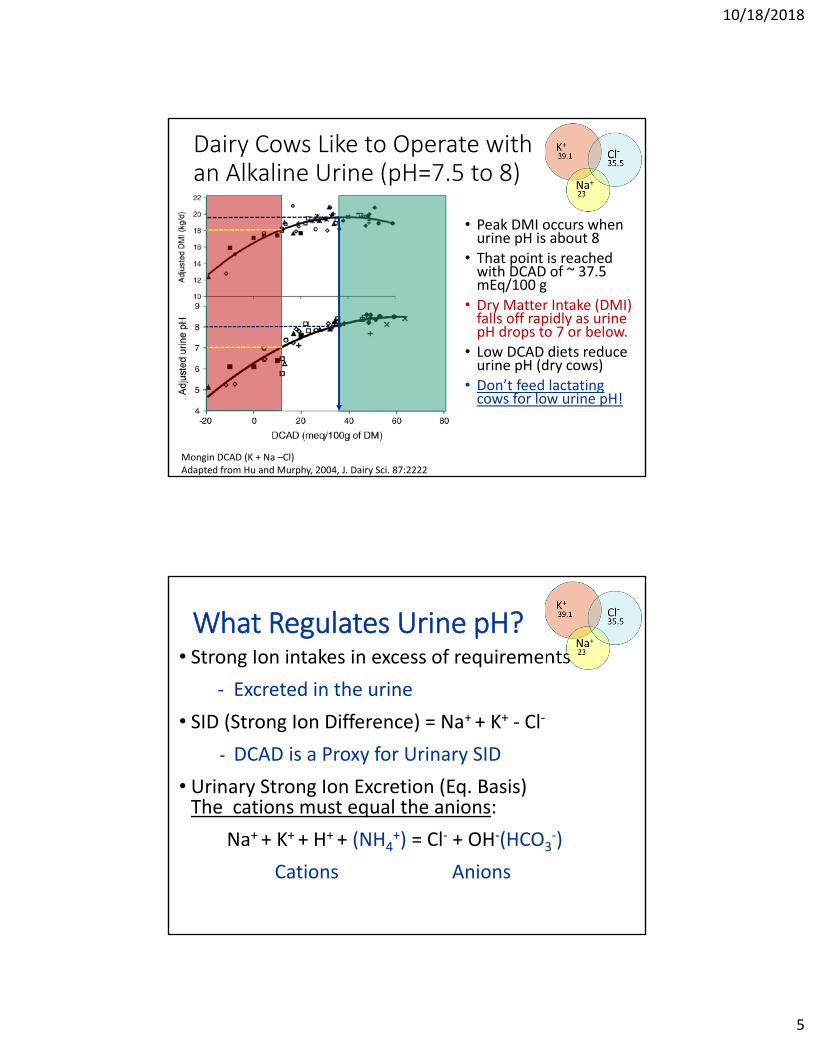
Dairy Cows Like to Operate with an Alkaline Urine (pH=7.5 to 8)
• Peak DMI occurs when urine pH is about 8
• That point is reached with DCAD of ~ 37.5 mEq/100 g
• Dry Matter Intake (DMI)falls off rapidly as urine pH drops to 7 or below.
• Low DCAD diets reduce urine pH (dry cows)
• Don’t feed lactating cows for low urine pH!
Mongin DCAD (K + Na –Cl)Adapted from Hu and Murphy, 2004, J. Dairy Sci. 87:2222
What Regulates Urine pH?• Strong Ion intakes in excess of requirements
‐ Excreted in the urine
• SID (Strong Ion Difference) = Na+ + K+ ‐ Cl‐
‐ DCAD is a Proxy for Urinary SID
• Urinary Strong Ion Excretion (Eq. Basis) The cations must equal the anions:
Na+ + K+ + H+ + (NH4+) = Cl‐ + OH‐(HCO3
‐)
Cations Anions
10/18/2018
6
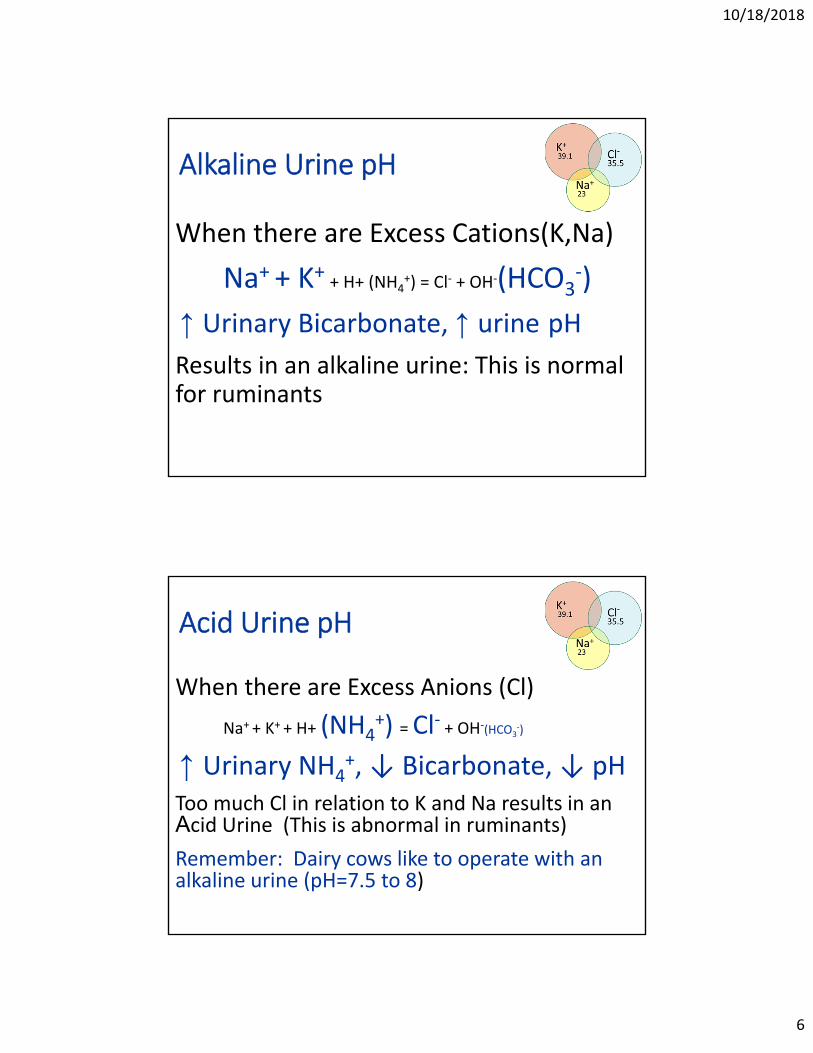
Alkaline Urine pH
When there are Excess Cations(K,Na)
Na+ + K+ + H+ (NH4+) = Cl‐ + OH‐(HCO3
‐)
↑ Urinary Bicarbonate, ↑ urine pH
Results in an alkaline urine: This is normal for ruminants
Acid Urine pH
When there are Excess Anions (Cl)
Na+ + K+ + H+ (NH4+) = Cl‐ + OH‐(HCO3
‐)
↑ Urinary NH4+, ↓ Bicarbonate, ↓ pH
Too much Cl in relation to K and Na results in an Acid Urine (This is abnormal in ruminants)
Remember: Dairy cows like to operate with an alkaline urine (pH=7.5 to 8)
10/18/2018
7
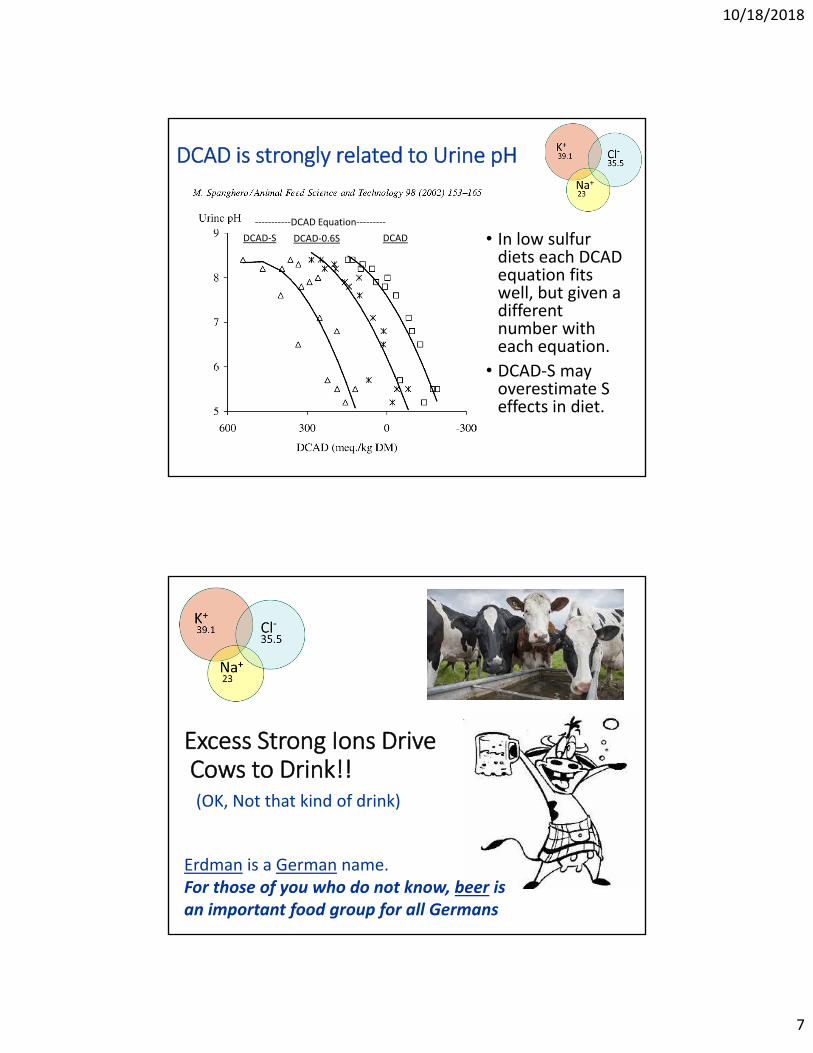
DCAD is strongly related to Urine pH
DCAD‐0.6S DCADDCAD‐S • In low sulfur diets each DCAD equation fits well, but given a different number with each equation.
• DCAD‐S may overestimate S effects in diet.
‐‐‐‐‐‐‐‐‐‐‐DCAD Equation‐‐‐‐‐‐‐‐‐
Excess Strong Ions DriveCows to Drink!!(OK, Not that kind of drink)
Erdman is a German name. For those of you who do not know, beer is an important food group for all Germans
10/18/2018
8
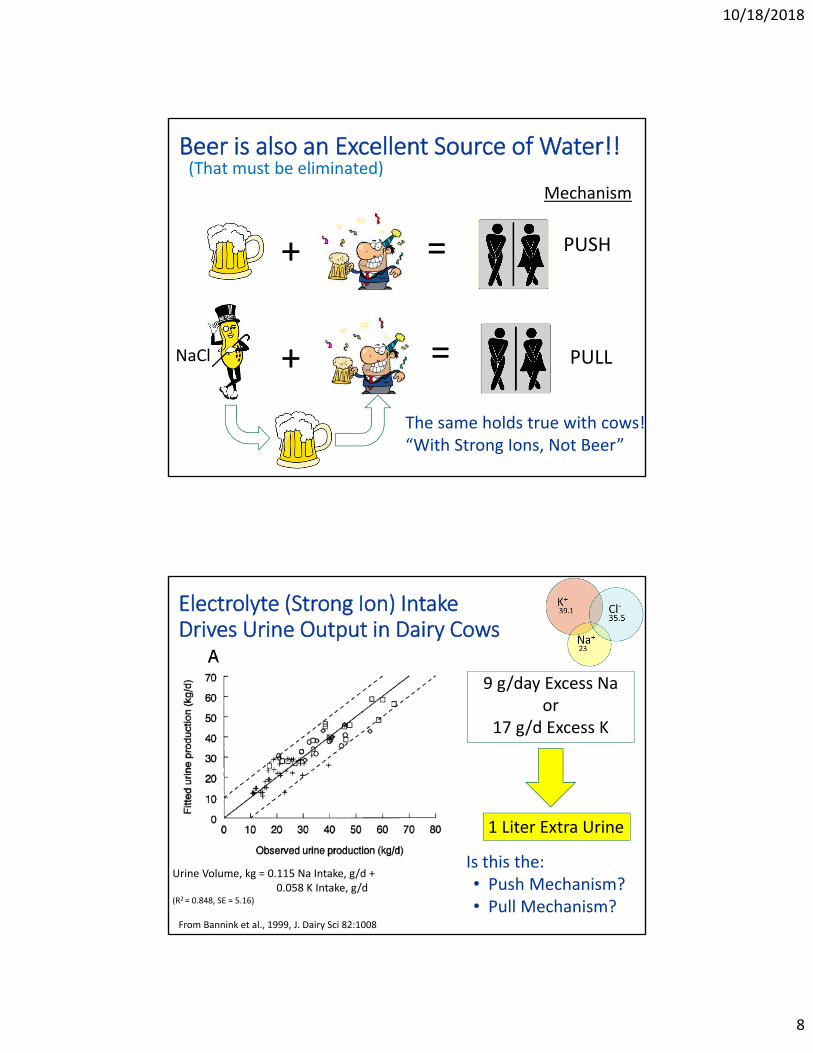
Beer is also an Excellent Source of Water!!
+ = PUSH
Mechanism
PULL+ =
The same holds true with cows!“With Strong Ions, Not Beer”
(That must be eliminated)
NaCl
Electrolyte (Strong Ion) Intake Drives Urine Output in Dairy Cows
9 g/day Excess Naor
17 g/d Excess K
From Bannink et al., 1999, J. Dairy Sci 82:1008
Urine Volume, kg = 0.115 Na Intake, g/d +0.058 K Intake, g/d
(R2 = 0.848, SE = 5.16)
1 Liter Extra Urine
Is this the: • Push Mechanism?• Pull Mechanism?
10/18/2018
9
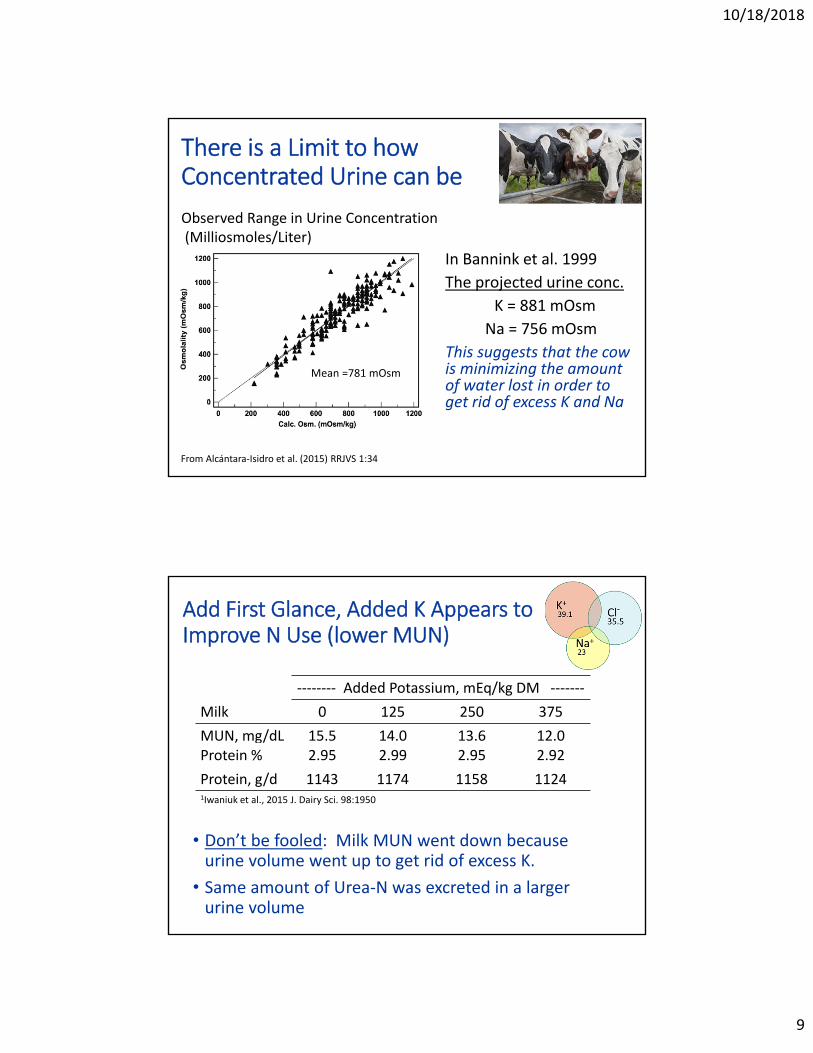
In Bannink et al. 1999
The projected urine conc.
K = 881 mOsm
Na = 756 mOsm
This suggests that the cow is minimizing the amount of water lost in order to get rid of excess K and Na
There is a Limit to how Concentrated Urine can be
From Alcántara‐Isidro et al. (2015) RRJVS 1:34
Mean =781 mOsm
Observed Range in Urine Concentration(Milliosmoles/Liter)
Add First Glance, Added K Appears to Improve N Use (lower MUN)
• Don’t be fooled: Milk MUN went down because urine volume went up to get rid of excess K.
• Same amount of Urea‐N was excreted in a larger urine volume
‐‐‐‐‐‐‐‐ Added Potassium, mEq/kg DM ‐‐‐‐‐‐‐
Milk 0 125 250 375
MUN, mg/dL 15.5 14.0 13.6 12.0Protein % 2.95 2.99 2.95 2.92
Protein, g/d 1143 1174 1158 11241Iwaniuk et al., 2015 J. Dairy Sci. 98:1950
10/18/2018
10
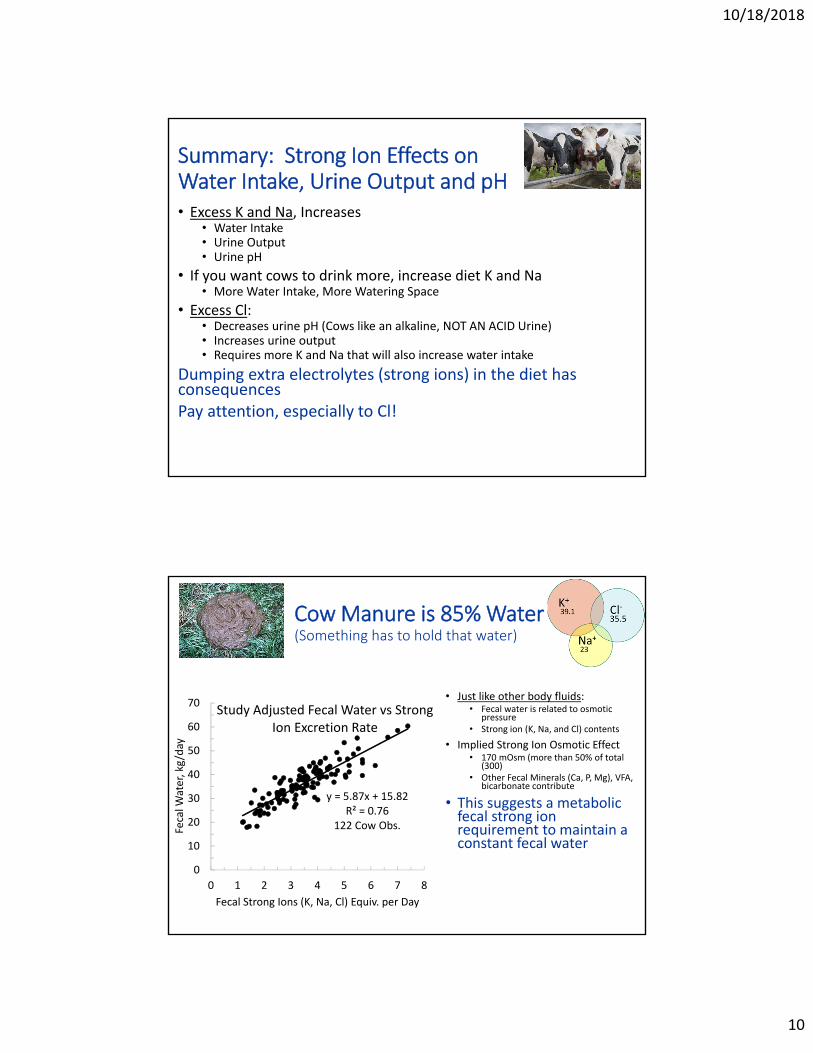
Summary: Strong Ion Effects onWater Intake, Urine Output and pH• Excess K and Na, Increases
• Water Intake• Urine Output• Urine pH
• If you want cows to drink more, increase diet K and Na• More Water Intake, More Watering Space
• Excess Cl:• Decreases urine pH (Cows like an alkaline, NOT AN ACID Urine)• Increases urine output• Requires more K and Na that will also increase water intake
Dumping extra electrolytes (strong ions) in the diet has consequences Pay attention, especially to Cl!
Cow Manure is 85% Water(Something has to hold that water)
• Just like other body fluids:• Fecal water is related to osmotic
pressure• Strong ion (K, Na, and Cl) contents
• Implied Strong Ion Osmotic Effect • 170 mOsm (more than 50% of total
(300)• Other Fecal Minerals (Ca, P, Mg), VFA,
bicarbonate contribute
• This suggests a metabolic fecal strong ion requirement to maintain a constant fecal water
y = 5.87x + 15.82R² = 0.76
122 Cow Obs.
0
10
20
30
40
50
60
70
0 1 2 3 4 5 6 7 8
Fecal W
ater, kg/day
Fecal Strong Ions (K, Na, Cl) Equiv. per Day
Study Adjusted Fecal Water vs Strong Ion Excretion Rate
10/18/2018
11
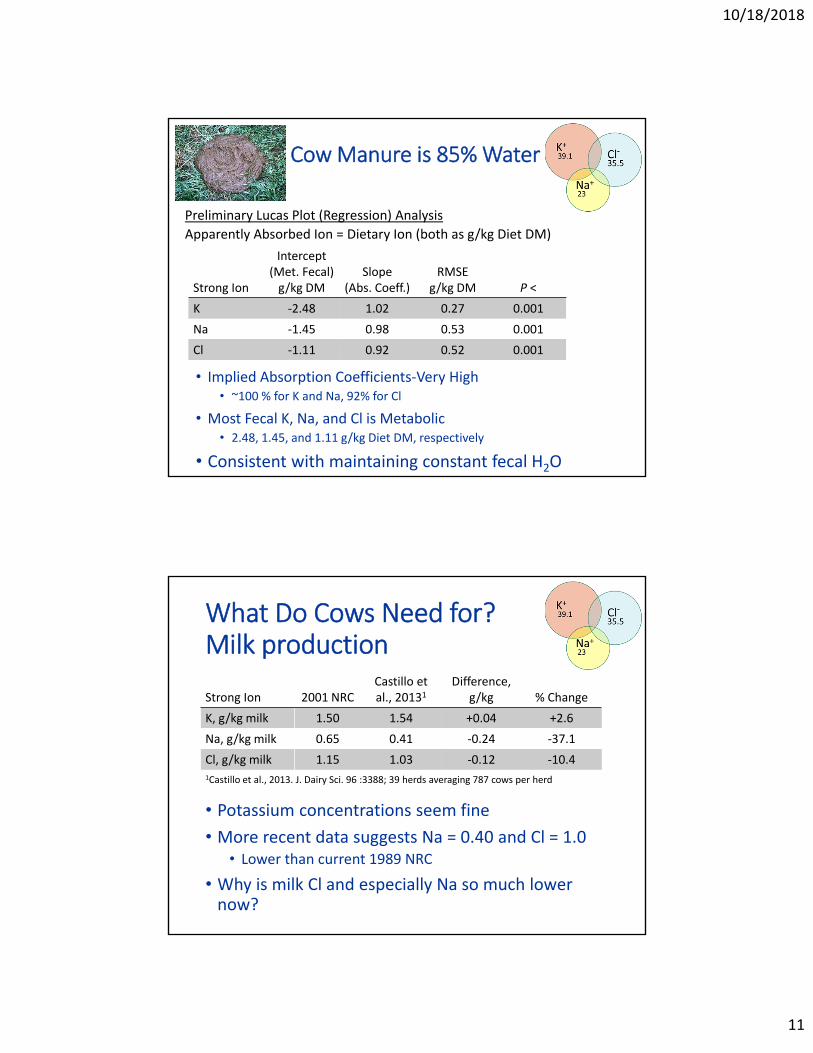
Cow Manure is 85% Water
Preliminary Lucas Plot (Regression) Analysis
Apparently Absorbed Ion = Dietary Ion (both as g/kg Diet DM)
Strong Ion
Intercept(Met. Fecal)g/kg DM
Slope(Abs. Coeff.)
RMSEg/kg DM P <
K ‐2.48 1.02 0.27 0.001
Na ‐1.45 0.98 0.53 0.001
Cl ‐1.11 0.92 0.52 0.001
• Implied Absorption Coefficients‐Very High• ~100 % for K and Na, 92% for Cl
• Most Fecal K, Na, and Cl is Metabolic• 2.48, 1.45, and 1.11 g/kg Diet DM, respectively
• Consistent with maintaining constant fecal H2O
What Do Cows Need for?Milk production
• Potassium concentrations seem fine
• More recent data suggests Na = 0.40 and Cl = 1.0• Lower than current 1989 NRC
• Why is milk Cl and especially Na so much lower now?
Strong Ion 2001 NRCCastillo et al., 20131
Difference, g/kg % Change
K, g/kg milk 1.50 1.54 +0.04 +2.6
Na, g/kg milk 0.65 0.41 ‐0.24 ‐37.1
Cl, g/kg milk 1.15 1.03 ‐0.12 ‐10.41Castillo et al., 2013. J. Dairy Sci. 96 :3388; 39 herds averaging 787 cows per herd
10/18/2018
12
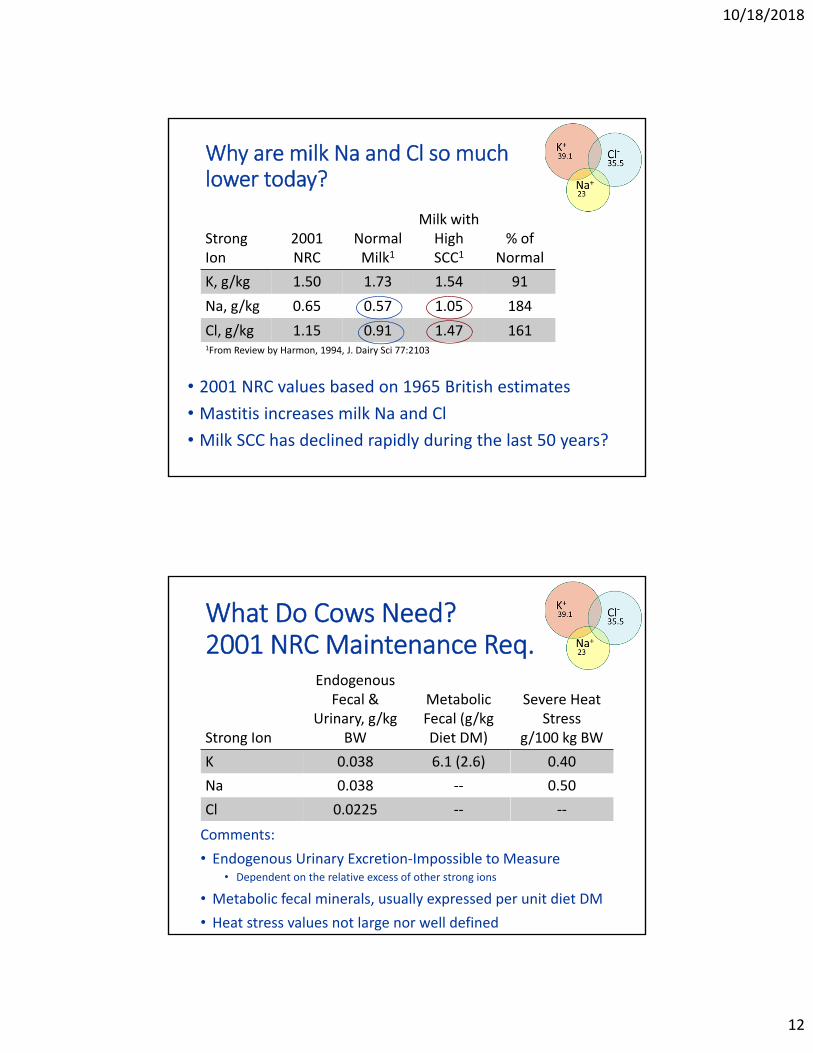
Why are milk Na and Cl so much lower today?
• 2001 NRC values based on 1965 British estimates
• Mastitis increases milk Na and Cl
• Milk SCC has declined rapidly during the last 50 years?
StrongIon
2001 NRC
Normal Milk1
Milk with High SCC1
% of Normal
K, g/kg 1.50 1.73 1.54 91
Na, g/kg 0.65 0.57 1.05 184
Cl, g/kg 1.15 0.91 1.47 1611From Review by Harmon, 1994, J. Dairy Sci 77:2103
What Do Cows Need?2001 NRC Maintenance Req.
Strong Ion
Endogenous Fecal &
Urinary, g/kg BW
Metabolic Fecal (g/kg Diet DM)
Severe HeatStress
g/100 kg BW
K 0.038 6.1 (2.6) 0.40
Na 0.038 ‐‐ 0.50
Cl 0.0225 ‐‐ ‐‐
Comments:
• Endogenous Urinary Excretion‐Impossible to Measure• Dependent on the relative excess of other strong ions
• Metabolic fecal minerals, usually expressed per unit diet DM
• Heat stress values not large nor well defined
10/18/2018
13
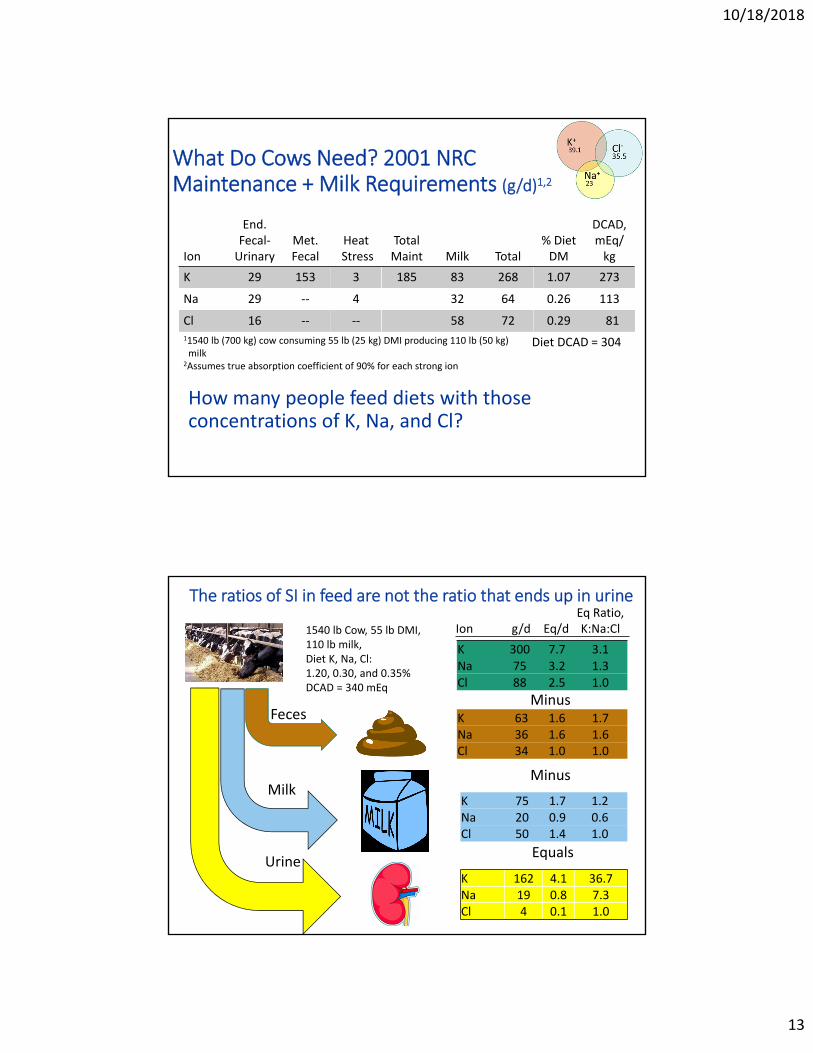
What Do Cows Need? 2001 NRC Maintenance + Milk Requirements (g/d)1,2
How many people feed diets with those concentrations of K, Na, and Cl?
11540 lb (700 kg) cow consuming 55 lb (25 kg) DMI producing 110 lb (50 kg)milk
2Assumes true absorption coefficient of 90% for each strong ion
Ion
End. Fecal‐Urinary
Met. Fecal
HeatStress
Total Maint Milk Total
% Diet DM
DCAD, mEq/ kg
K 29 153 3 185 83 268 1.07 273
Na 29 ‐‐ 4 32 64 0.26 113
Cl 16 ‐‐ ‐‐ 58 72 0.29 81
Diet DCAD = 304
Ion g/d Eq/dEq Ratio, K:Na:Cl
K 63 1.6 1.7Na 36 1.6 1.6Cl 34 1.0 1.0
Feces
K 75 1.7 1.2Na 20 0.9 0.6Cl 50 1.4 1.0
K 162 4.1 36.7Na 19 0.8 7.3Cl 4 0.1 1.0
The ratios of SI in feed are not the ratio that ends up in urine
K 300 7.7 3.1
Na 75 3.2 1.3Cl 88 2.5 1.0
Milk
Urine
Minus
Minus
Equals
1540 lb Cow, 55 lb DMI,110 lb milk,Diet K, Na, Cl:1.20, 0.30, and 0.35%DCAD = 340 mEq
10/18/2018
14
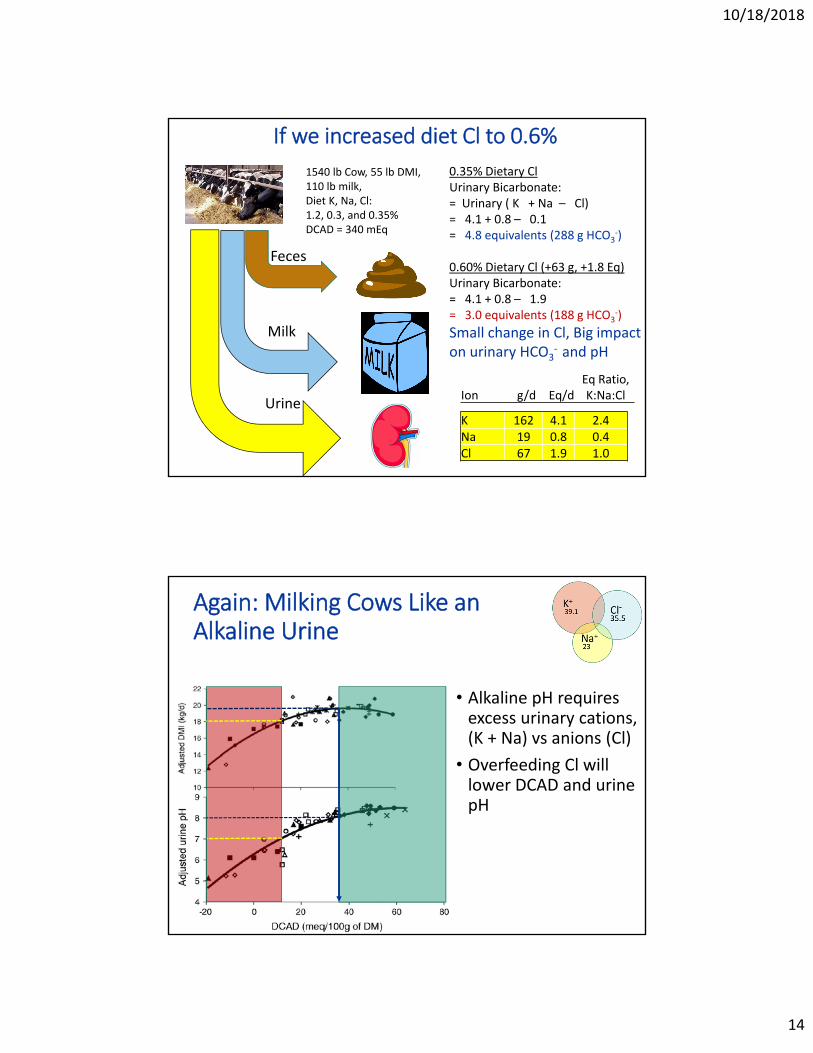
Ion g/d Eq/dEq Ratio, K:Na:Cl
Feces
K 162 4.1 2.4Na 19 0.8 0.4Cl 67 1.9 1.0
If we increased diet Cl to 0.6%
Milk
Urine
1540 lb Cow, 55 lb DMI,110 lb milk,Diet K, Na, Cl:1.2, 0.3, and 0.35%DCAD = 340 mEq
0.35% Dietary ClUrinary Bicarbonate:= Urinary ( K + Na – Cl)= 4.1 + 0.8 – 0.1= 4.8 equivalents (288 g HCO3
‐)
0.60% Dietary Cl (+63 g, +1.8 Eq)Urinary Bicarbonate:= 4.1 + 0.8 – 1.9= 3.0 equivalents (188 g HCO3
‐)
Small change in Cl, Big impact on urinary HCO3
‐ and pH
Again: Milking Cows Like an Alkaline Urine
• Alkaline pH requires excess urinary cations, (K + Na) vs anions (Cl)
• Overfeeding Cl will lower DCAD and urine pH
10/18/2018
15
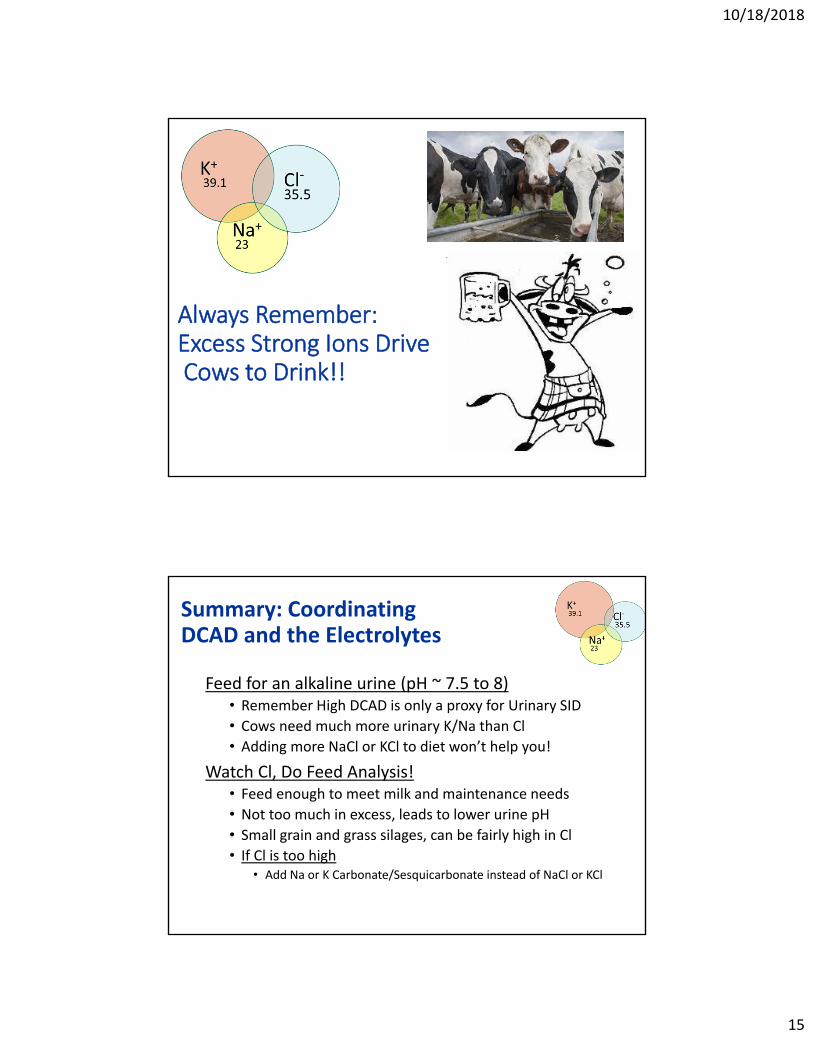
Always Remember:Excess Strong Ions DriveCows to Drink!!
Summary: CoordinatingDCAD and the Electrolytes
Feed for an alkaline urine (pH ~ 7.5 to 8)• Remember High DCAD is only a proxy for Urinary SID
• Cows need much more urinary K/Na than Cl
• Adding more NaCl or KCl to diet won’t help you!
Watch Cl, Do Feed Analysis!• Feed enough to meet milk and maintenance needs
• Not too much in excess, leads to lower urine pH
• Small grain and grass silages, can be fairly high in Cl
• If Cl is too high• Add Na or K Carbonate/Sesquicarbonate instead of NaCl or KCl
10/18/2018
16
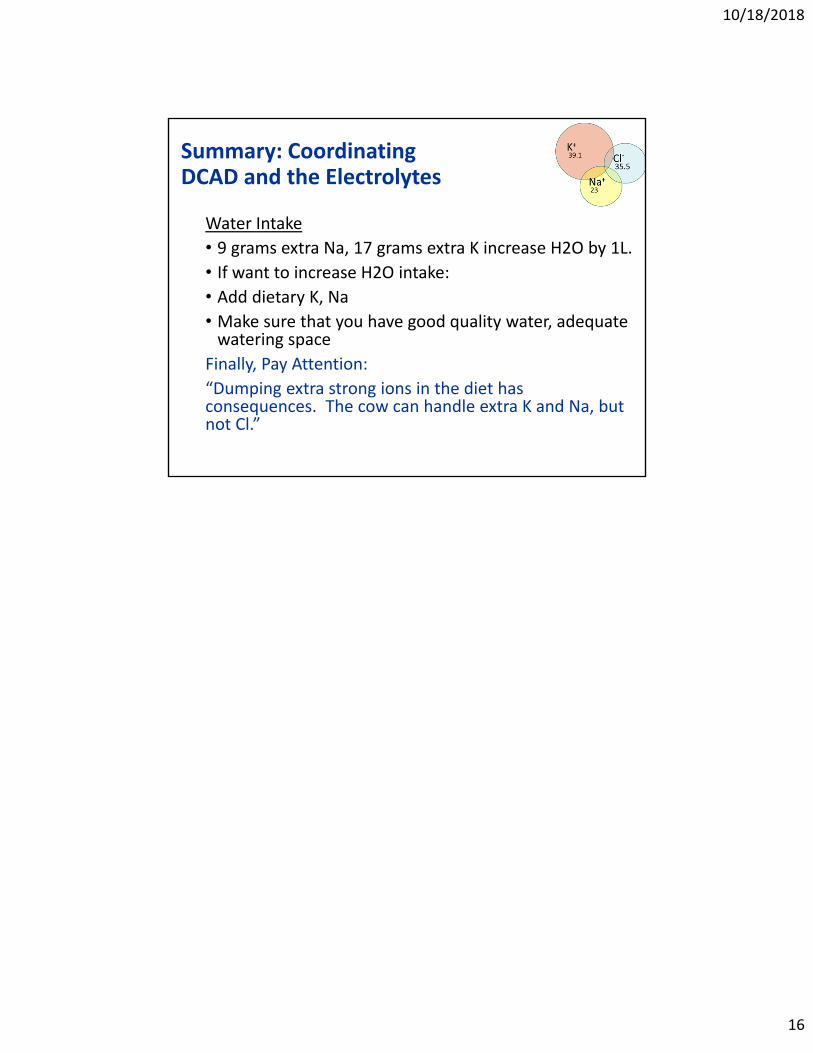
Water Intake
• 9 grams extra Na, 17 grams extra K increase H2O by 1L.
• If want to increase H2O intake:• Add dietary K, Na• Make sure that you have good quality water, adequate watering space
Finally, Pay Attention:
“Dumping extra strong ions in the diet has consequences. The cow can handle extra K and Na, but not Cl.”
Summary: CoordinatingDCAD and the Electrolytes
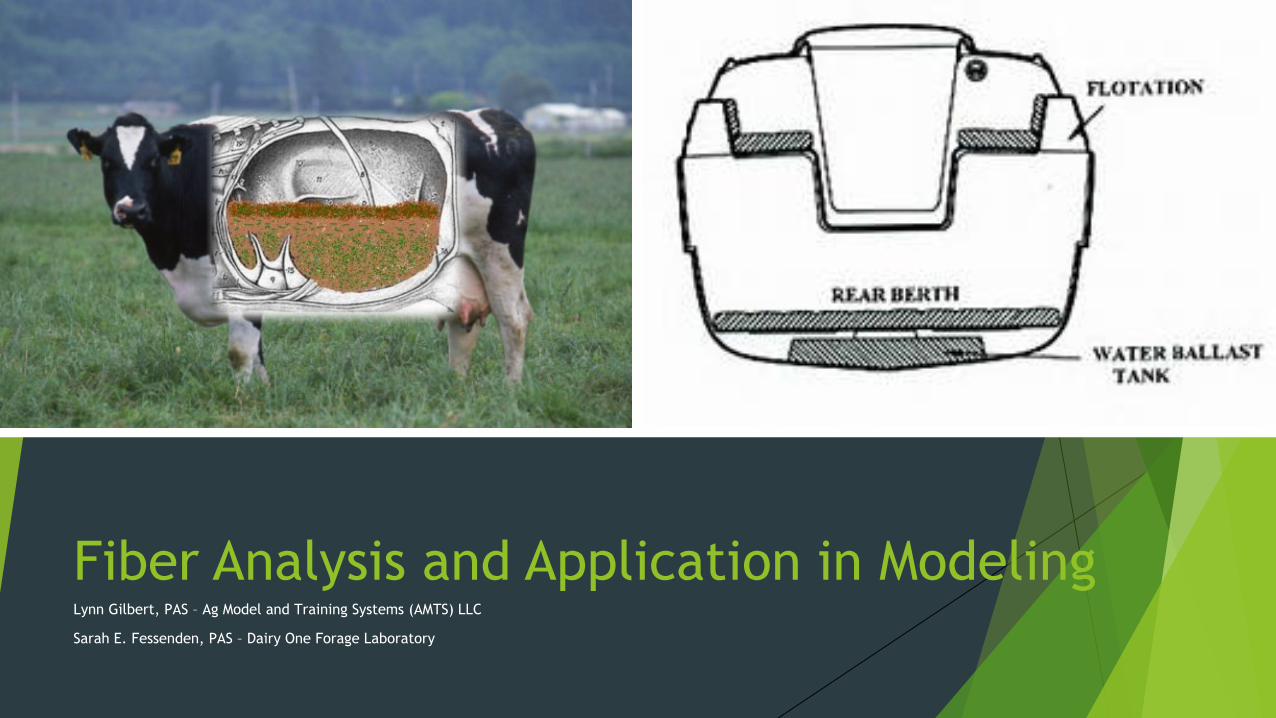
Fiber Analysis and Application in ModelingLynn Gilbert, PAS – Ag Model and Training Systems (AMTS) LLC
Sarah E. Fessenden, PAS – Dairy One Forage Laboratory

Let’s start with the basics
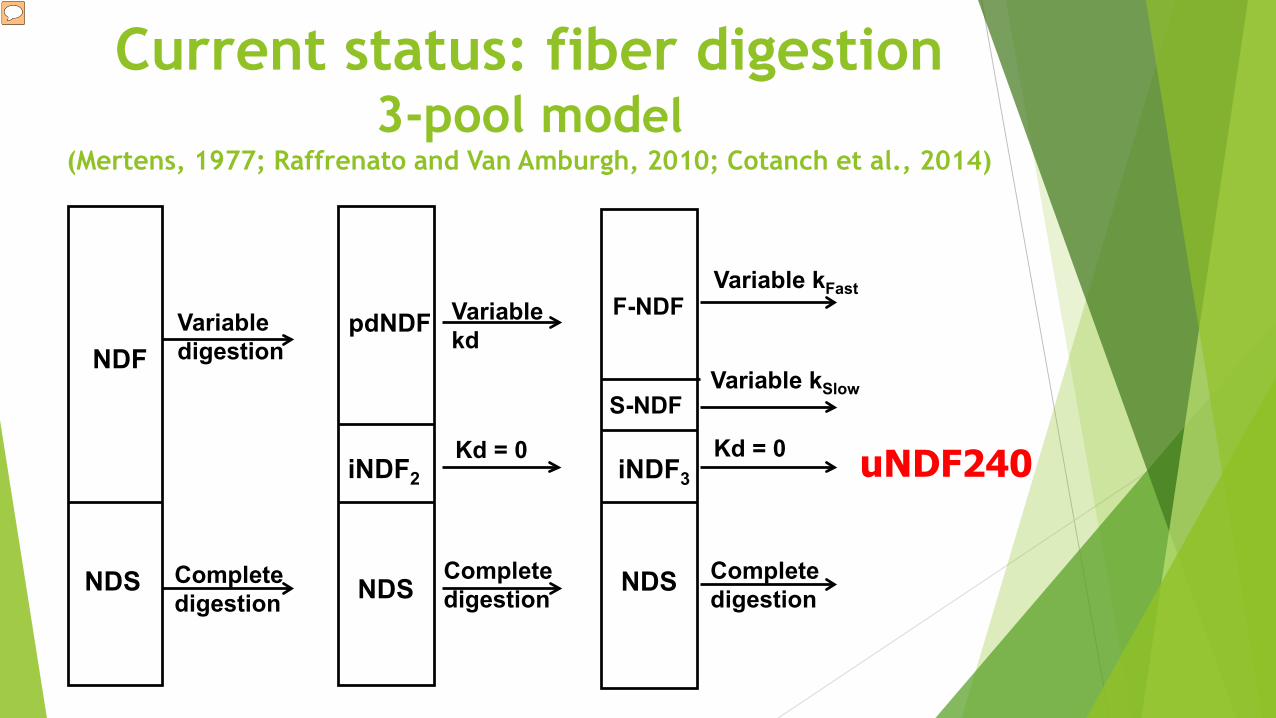
Current status: fiber digestion3-pool model
(Mertens, 1977; Raffrenato and Van Amburgh, 2010; Cotanch et al., 2014)
pdNDF
iNDF2
NDF
NDS
Variable digestion
Complete digestion NDS
Variable kd
Kd = 0
Complete digestion NDS Complete
digestion
iNDF3Kd = 0
F-NDFVariable kFast
S-NDFVariable kSlow
uNDF240
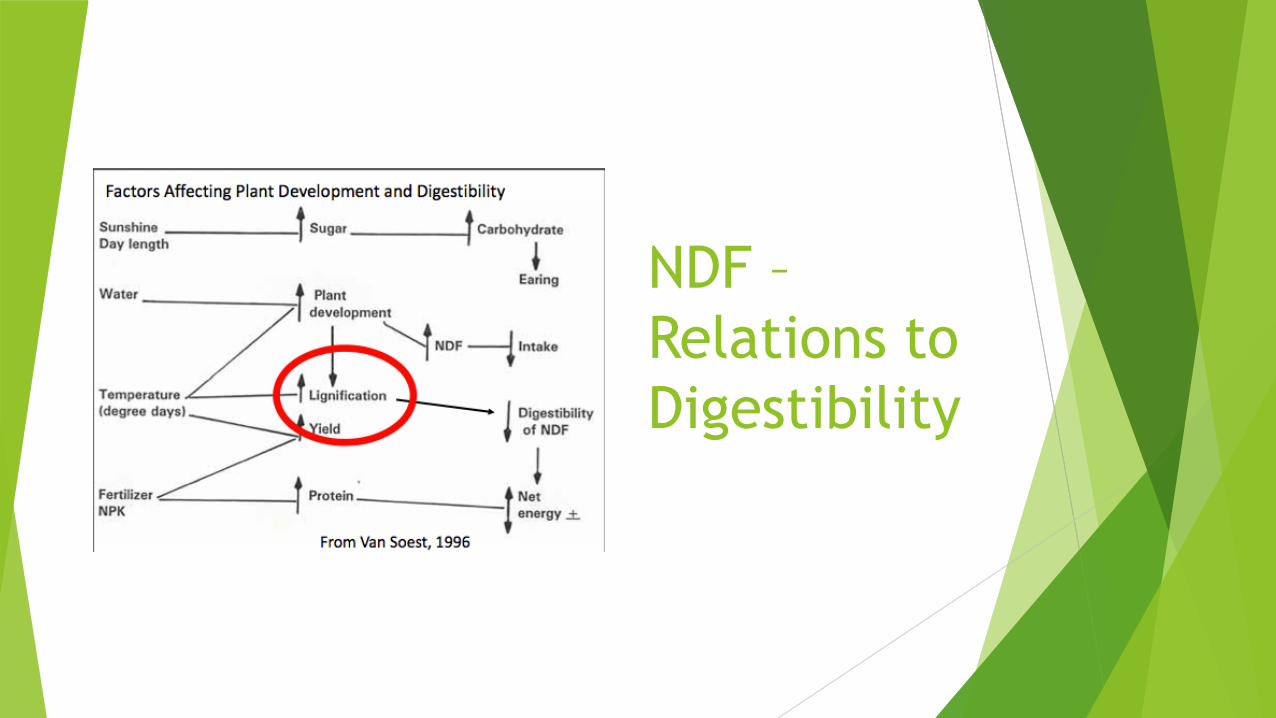
NDF –Relations to Digestibility
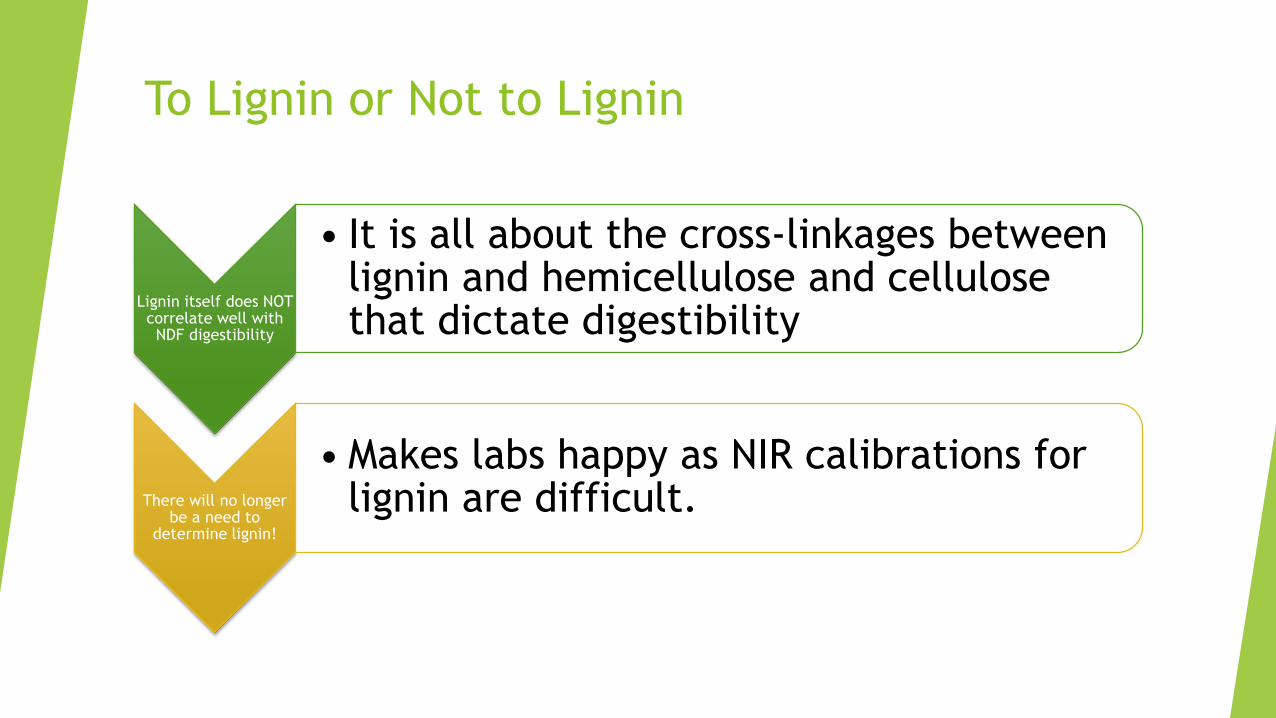
To Lignin or Not to Lignin
Lignin itself does NOT correlate well with NDF digestibility
• It is all about the cross-linkages between lignin and hemicellulose and cellulose that dictate digestibility
There will no longer be a need to
determine lignin!
• Makes labs happy as NIR calibrations for lignin are difficult.
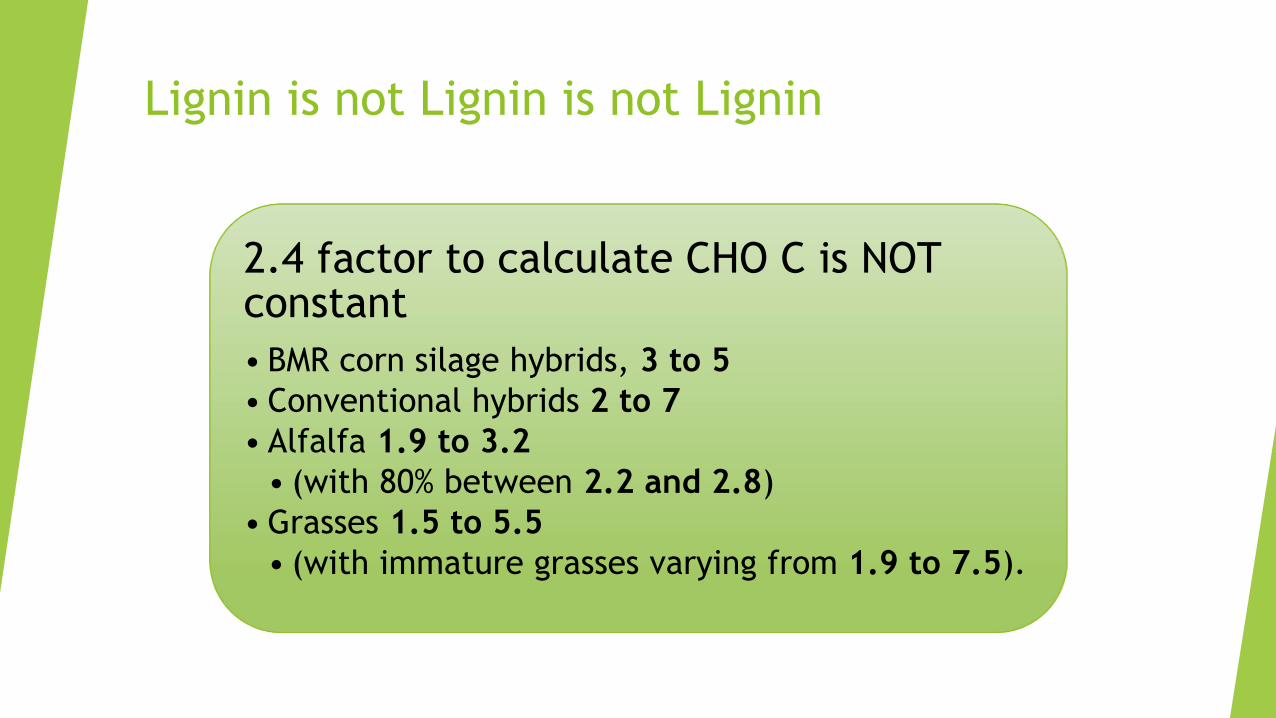
Lignin is not Lignin is not Lignin
2.4 factor to calculate CHO C is NOT constant• BMR corn silage hybrids, 3 to 5• Conventional hybrids 2 to 7• Alfalfa 1.9 to 3.2
• (with 80% between 2.2 and 2.8)• Grasses 1.5 to 5.5
• (with immature grasses varying from 1.9 to 7.5).
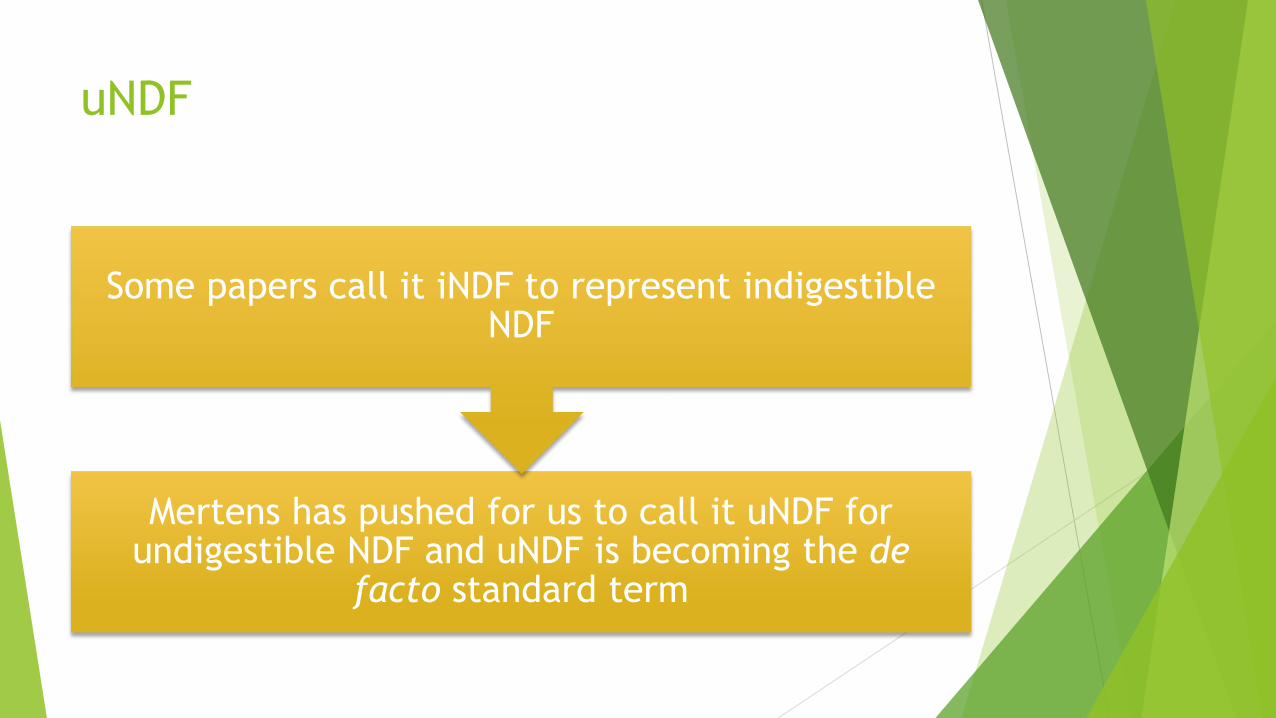
uNDF
Mertens has pushed for us to call it uNDF for undigestible NDF and uNDF is becoming the de
facto standard term
Some papers call it iNDF to represent indigestible NDF
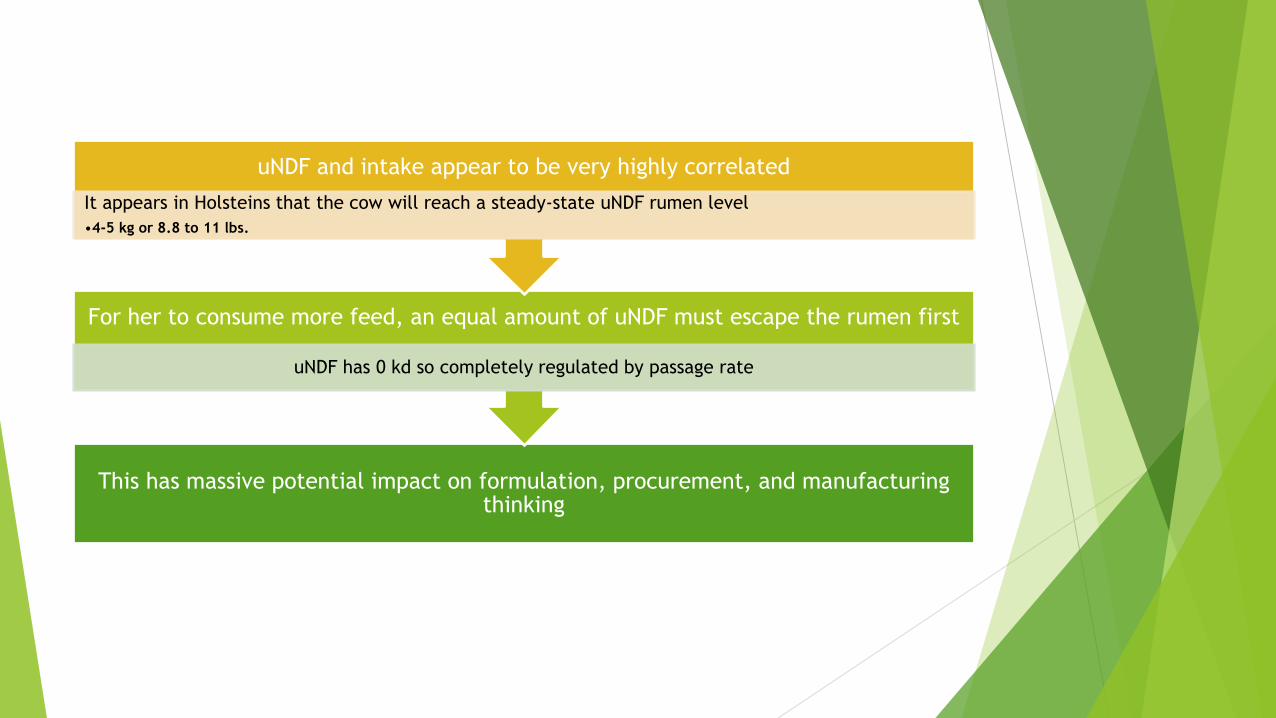
This has massive potential impact on formulation, procurement, and manufacturing thinking
For her to consume more feed, an equal amount of uNDF must escape the rumen first
uNDF has 0 kd so completely regulated by passage rate
uNDF and intake appear to be very highly correlatedIt appears in Holsteins that the cow will reach a steady-state uNDF rumen level•4-5 kg or 8.8 to 11 lbs.
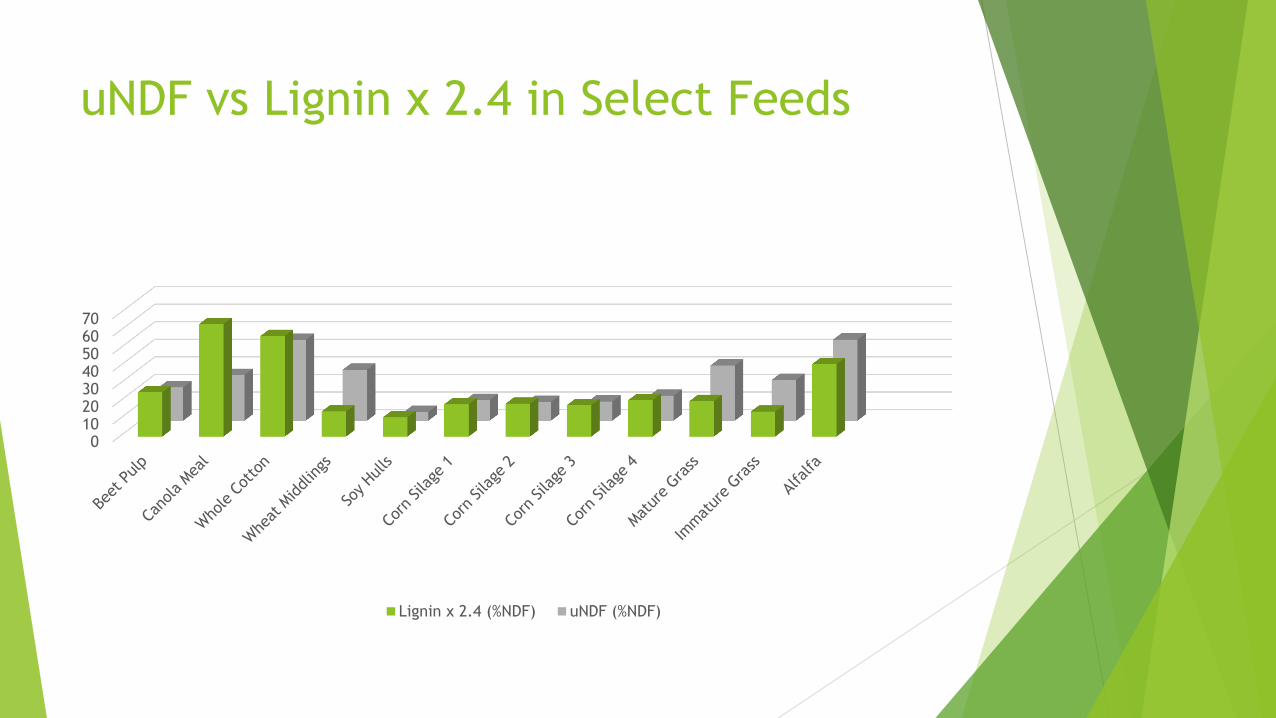
uNDF vs Lignin x 2.4 in Select Feeds
010203040506070
Lignin x 2.4 (%NDF) uNDF (%NDF)

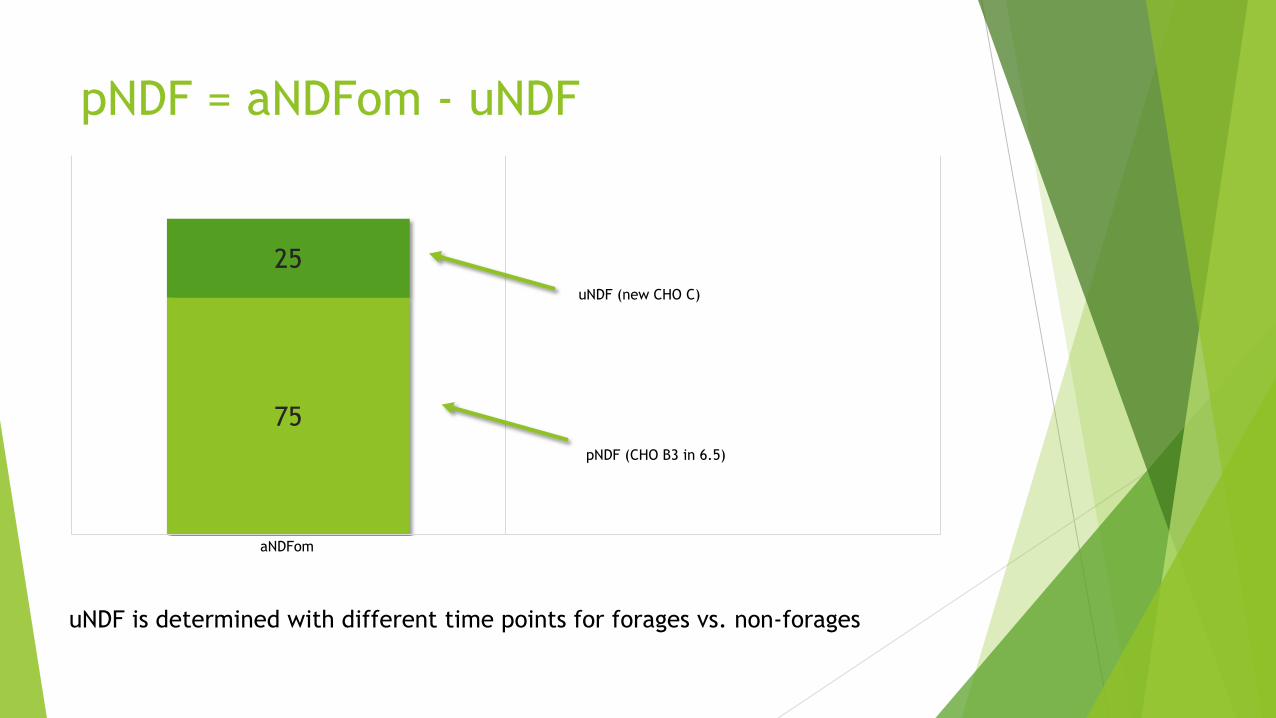
pNDF = aNDFom - uNDF
75
25uNDF (new CHO C)
pNDF (CHO B3 in 6.5)
aNDFom
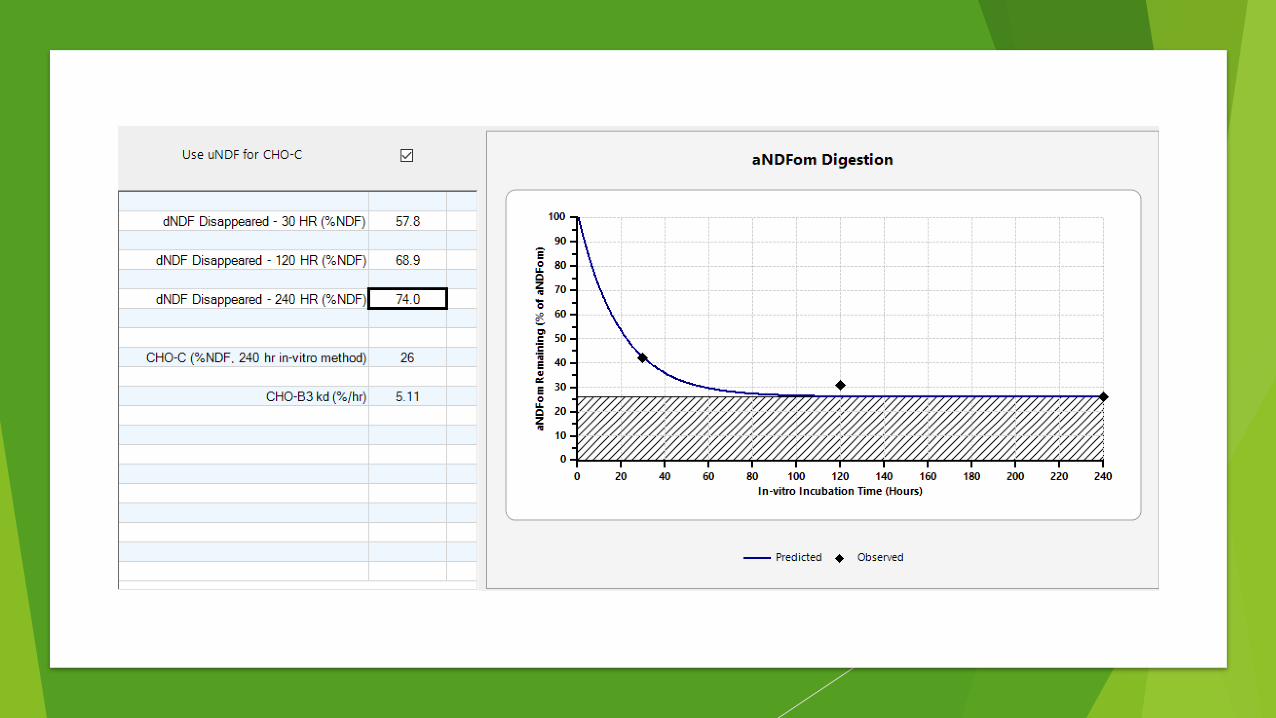
uNDF is determined with different time points for forages vs. non-forages
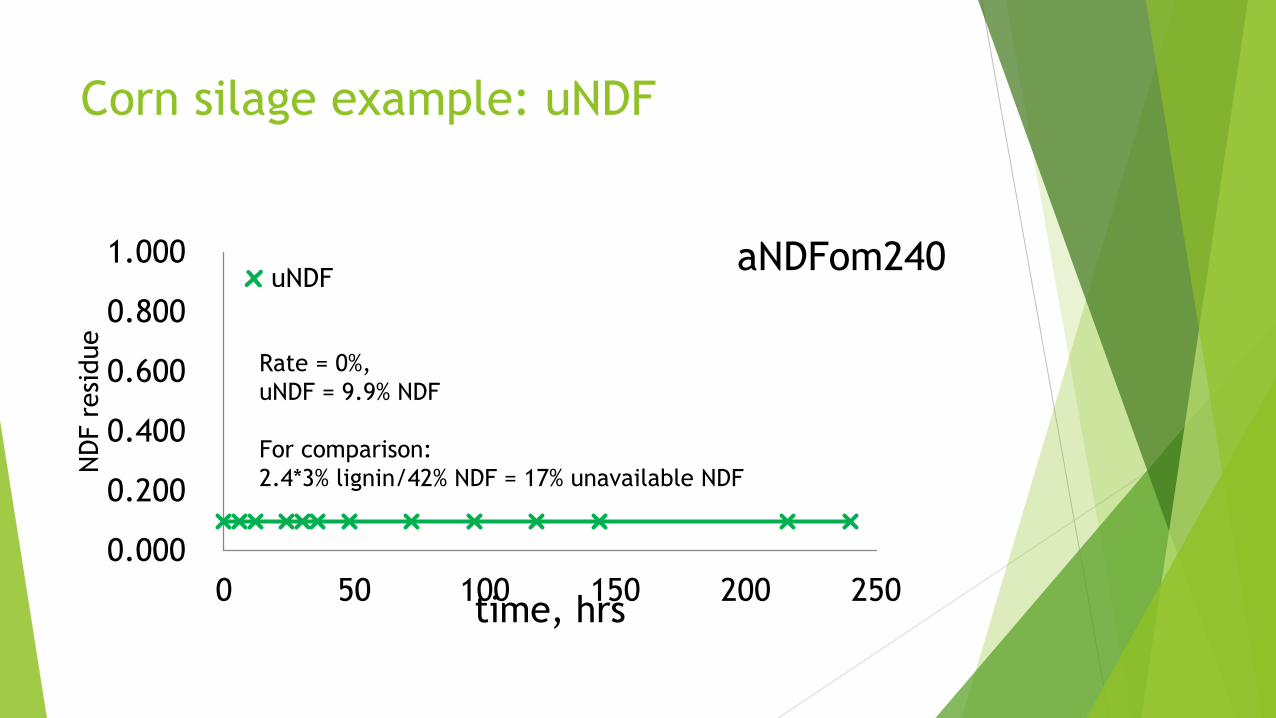
Corn silage example: uNDF
0.000
0.200
0.400
0.600
0.800
1.000
0 50 100 150 200 250
NDF
res
idue
time, hrs
x uNDFaNDFom240
Rate = 0%, uNDF = 9.9% NDF
For comparison:2.4*3% lignin/42% NDF = 17% unavailable NDF
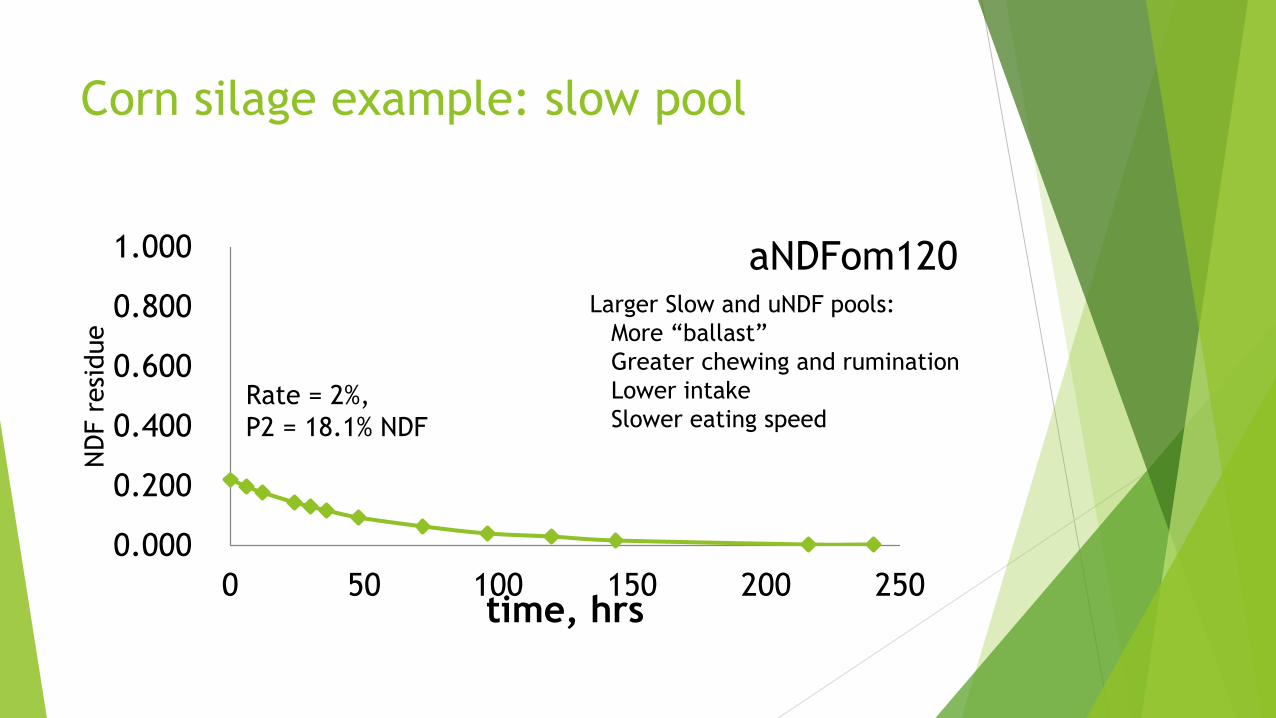
Corn silage example: slow pool
0.000
0.200
0.400
0.600
0.800
1.000
0 50 100 150 200 250
NDF
res
idue
time, hrs
Larger Slow and uNDF pools:More “ballast”Greater chewing and ruminationLower intakeSlower eating speed
Rate = 2%, P2 = 18.1% NDF
aNDFom120
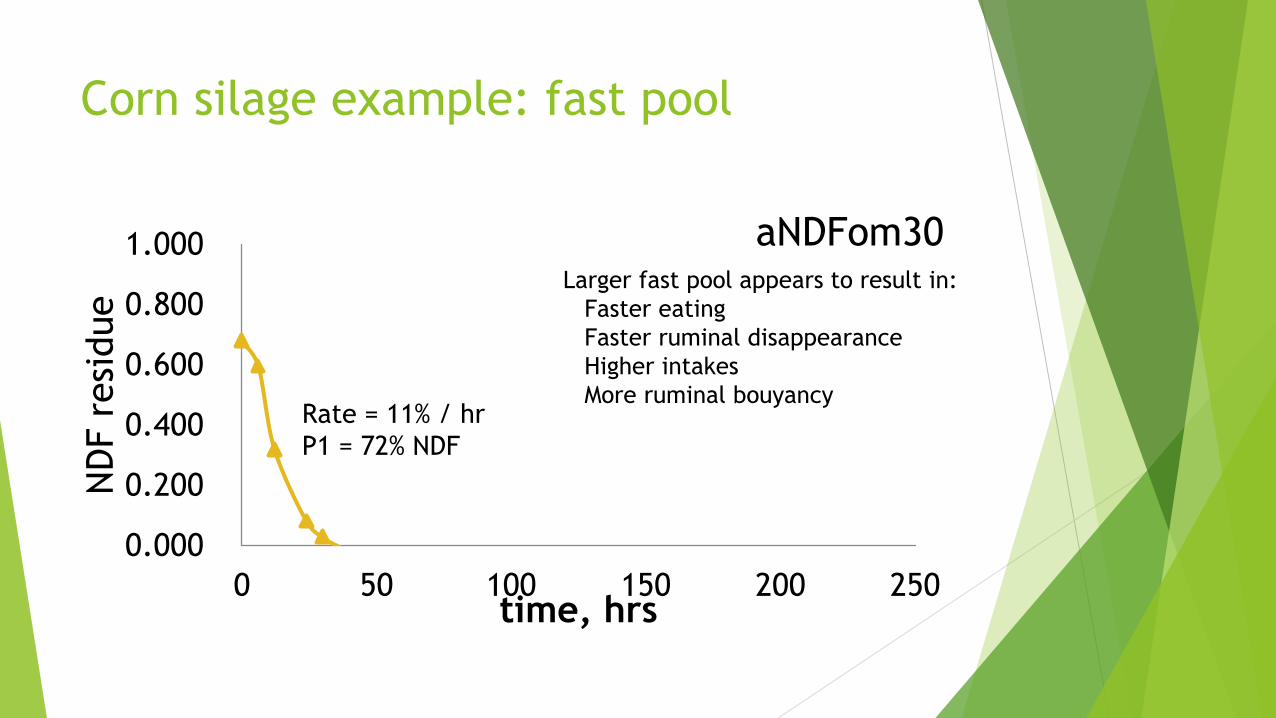
Corn silage example: fast pool
0.000
0.200
0.400
0.600
0.800
1.000
0 50 100 150 200 250
NDF
res
idue
time, hrs
Rate = 11% / hrP1 = 72% NDF
Larger fast pool appears to result in:Faster eatingFaster ruminal disappearanceHigher intakesMore ruminal bouyancy
aNDFom30
Neutral Detergent Fiber (NDF)
u Procedure used to describe the total fiber content of feed
u Collectively cellulose, hemicellulose, and lignin
u Sample is boiled in ND solution for 1 hour to dissolve the unwanted nutrients leaving the fibrous residue behind
u Various chemicals are employed to dissolve the unwanted nutrients
u Sodium dodecyl sulfate – protein and fats
u EDTA (ethylene diamine tetra acetic acid) –Ca, Mg, Zn, and pectins
u Triethylene glycol – starch
u Sodium borate – buffer
u Sodium phosphate dibasic - buffer
Neutral Detergent Fiber (aNDF)
u Procedure modified in the 90s to clear more of the noise
u Amylase – enzyme to breakdown starch
u Sodium sulfite - protein
Neutral Detergent Fiber (aNDFom)
u Now encouraged to use “organic matter” or “ash free” basis for NDF
u Contamination of ash comes from large harvesting equipment, flood irrigation, and other sources
u Elevated total ash content of some feeds can sometimes contribute to elevated NDF values
u Can lead to an underestimation and underfeeding of fiber and the problems associated with low fiber diets.
Neutral Detergent Fiber (aNDFom)
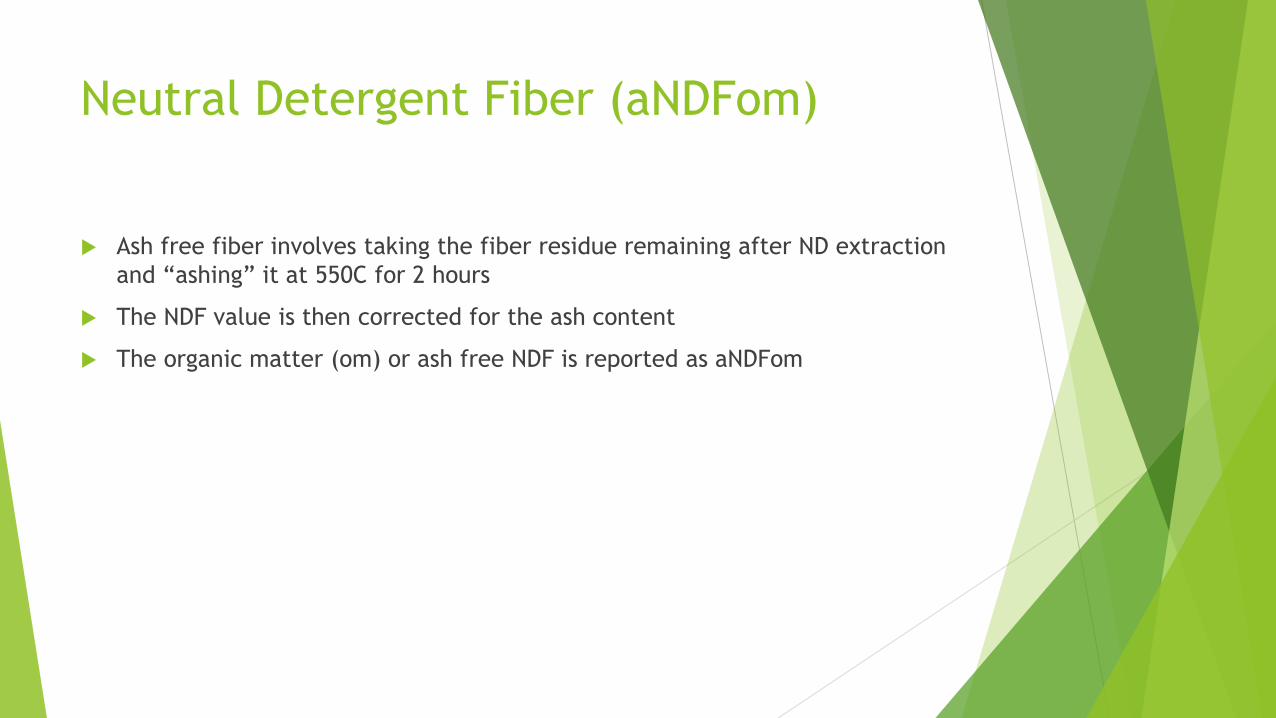
u Ash free fiber involves taking the fiber residue remaining after ND extraction and “ashing” it at 550C for 2 hours
u The NDF value is then corrected for the ash content
u The organic matter (om) or ash free NDF is reported as aNDFom
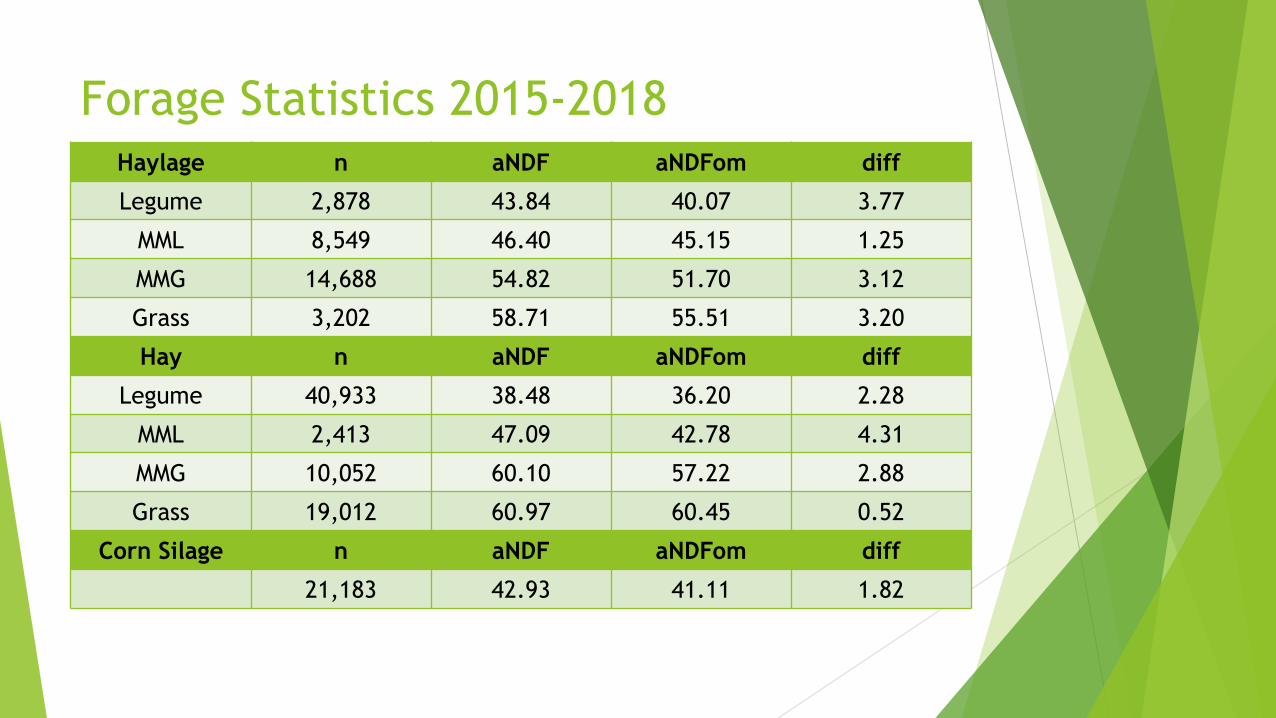
Forage Statistics 2015-2018Haylage n aNDF aNDFom diff
Legume 2,878 43.84 40.07 3.77
MML 8,549 46.40 45.15 1.25
MMG 14,688 54.82 51.70 3.12
Grass 3,202 58.71 55.51 3.20
Hay n aNDF aNDFom diff
Legume 40,933 38.48 36.20 2.28
MML 2,413 47.09 42.78 4.31
MMG 10,052 60.10 57.22 2.88
Grass 19,012 60.97 60.45 0.52
Corn Silage n aNDF aNDFom diff
21,183 42.93 41.11 1.82
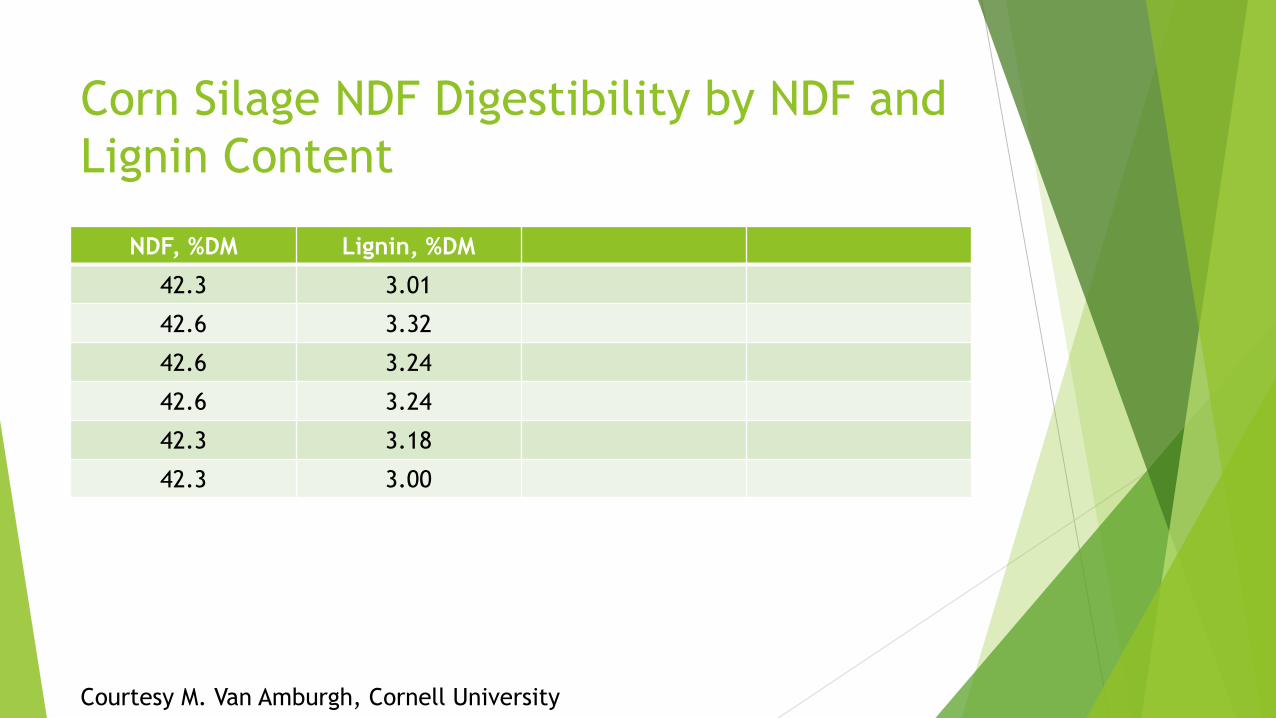
Corn Silage NDF Digestibility by NDF and Lignin Content
NDF, %DM Lignin, %DM
42.3 3.01
42.6 3.32
42.6 3.24
42.6 3.24
42.3 3.18
42.3 3.00
Courtesy M. Van Amburgh, Cornell University
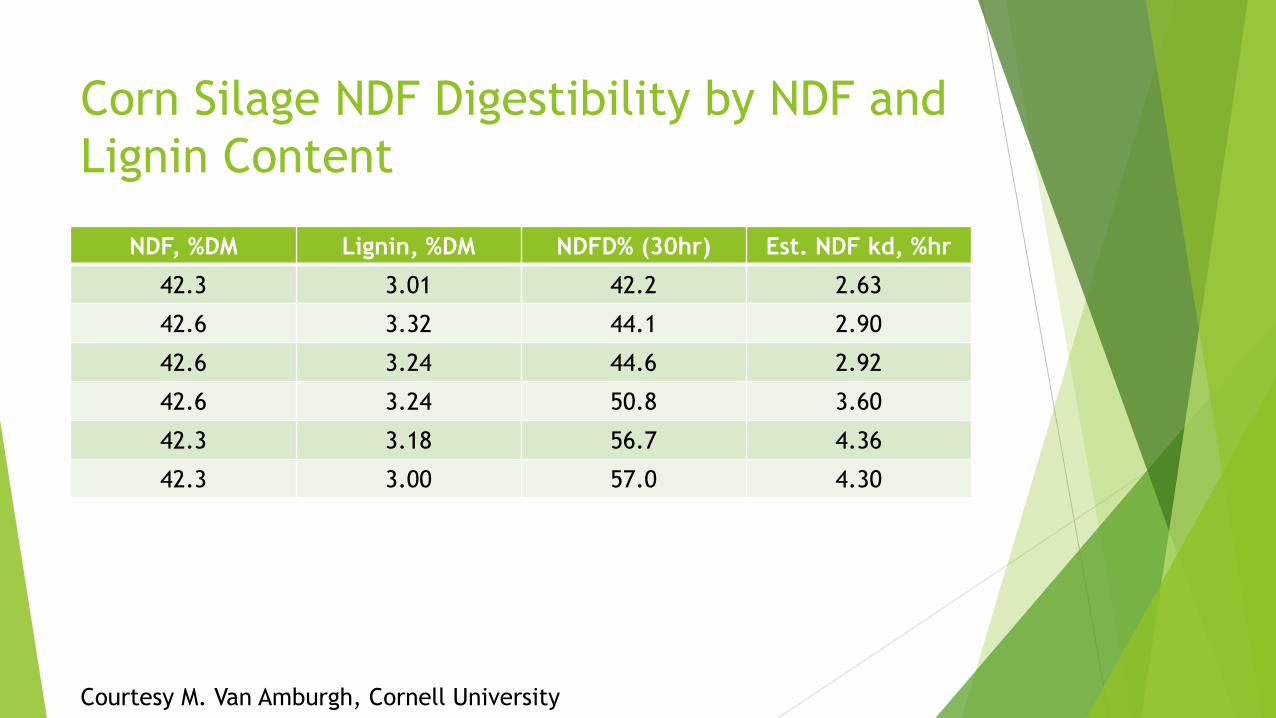
Corn Silage NDF Digestibility by NDF and Lignin Content
NDF, %DM Lignin, %DM NDFD% (30hr) Est. NDF kd, %hr
42.3 3.01 42.2 2.63
42.6 3.32 44.1 2.90
42.6 3.24 44.6 2.92
42.6 3.24 50.8 3.60
42.3 3.18 56.7 4.36
42.3 3.00 57.0 4.30
Courtesy M. Van Amburgh, Cornell University
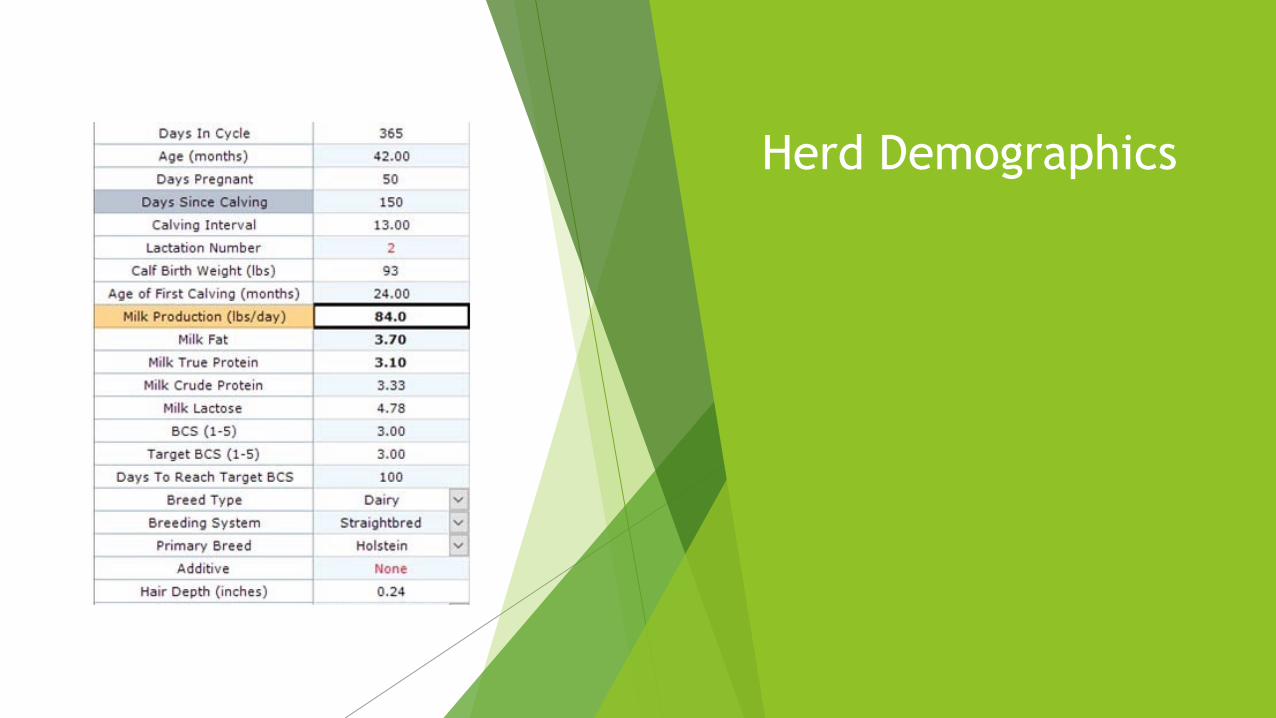
Herd Demographics
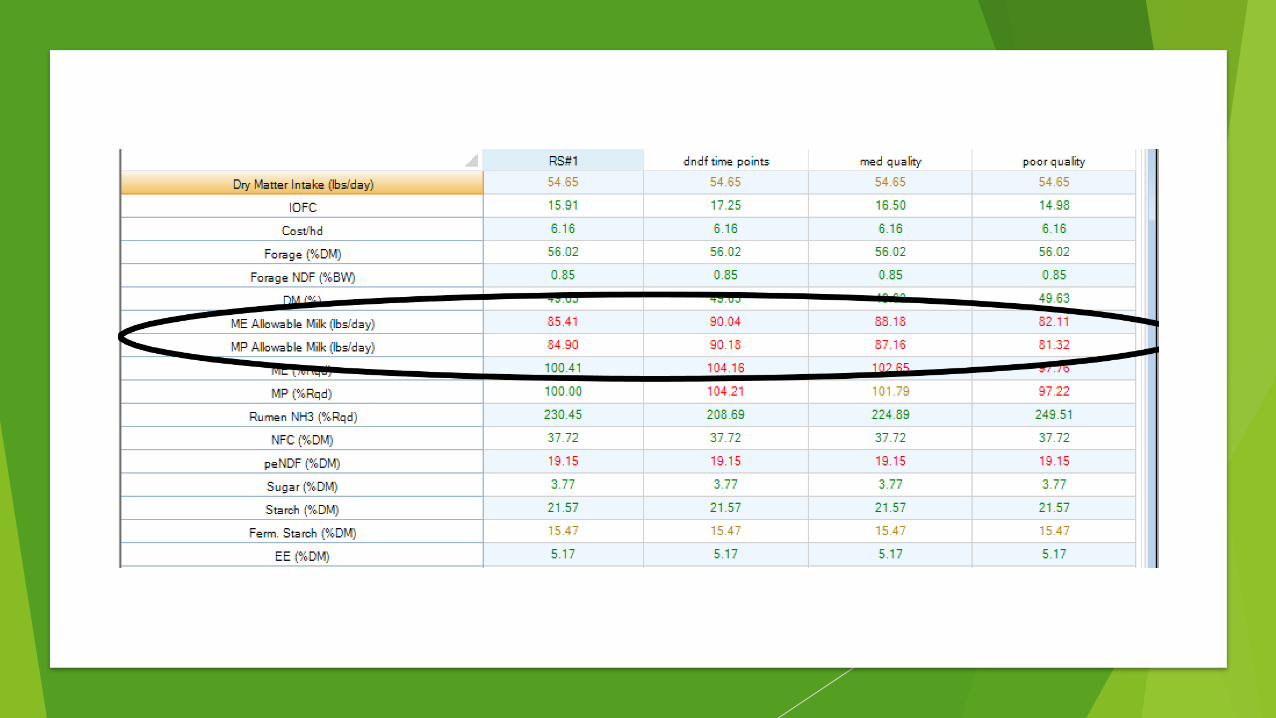
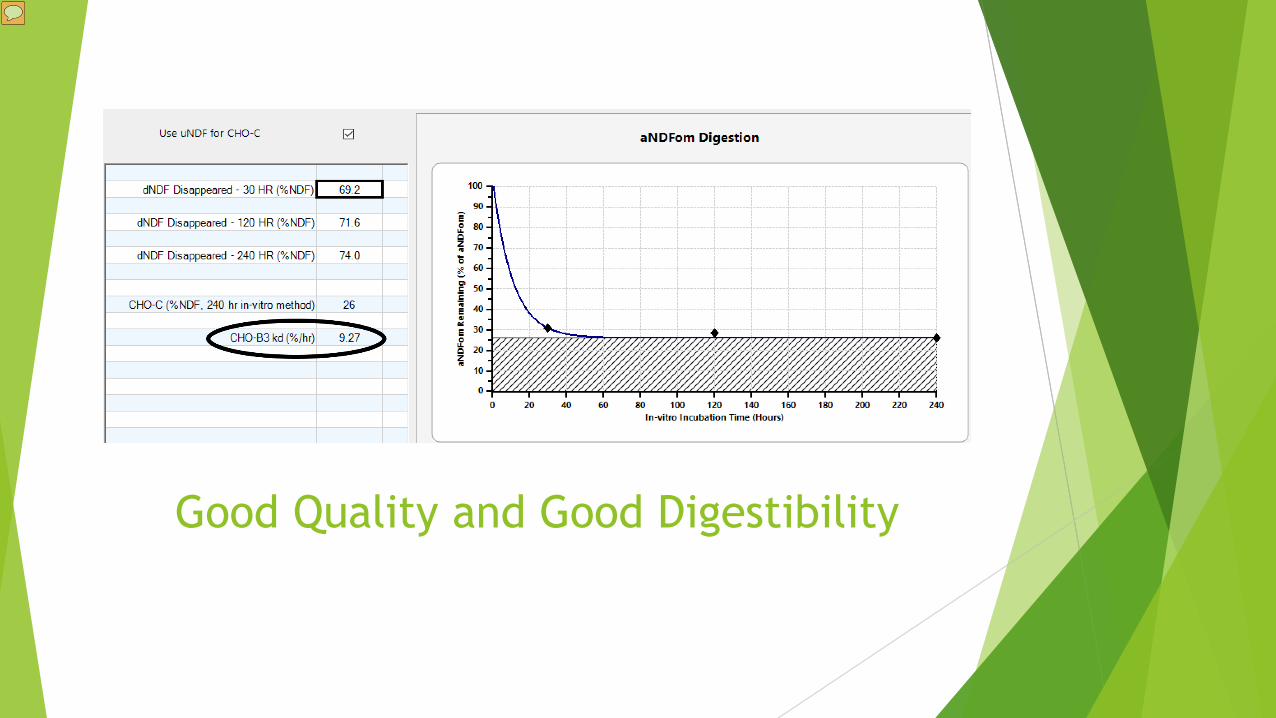
Good Quality and Good Digestibility
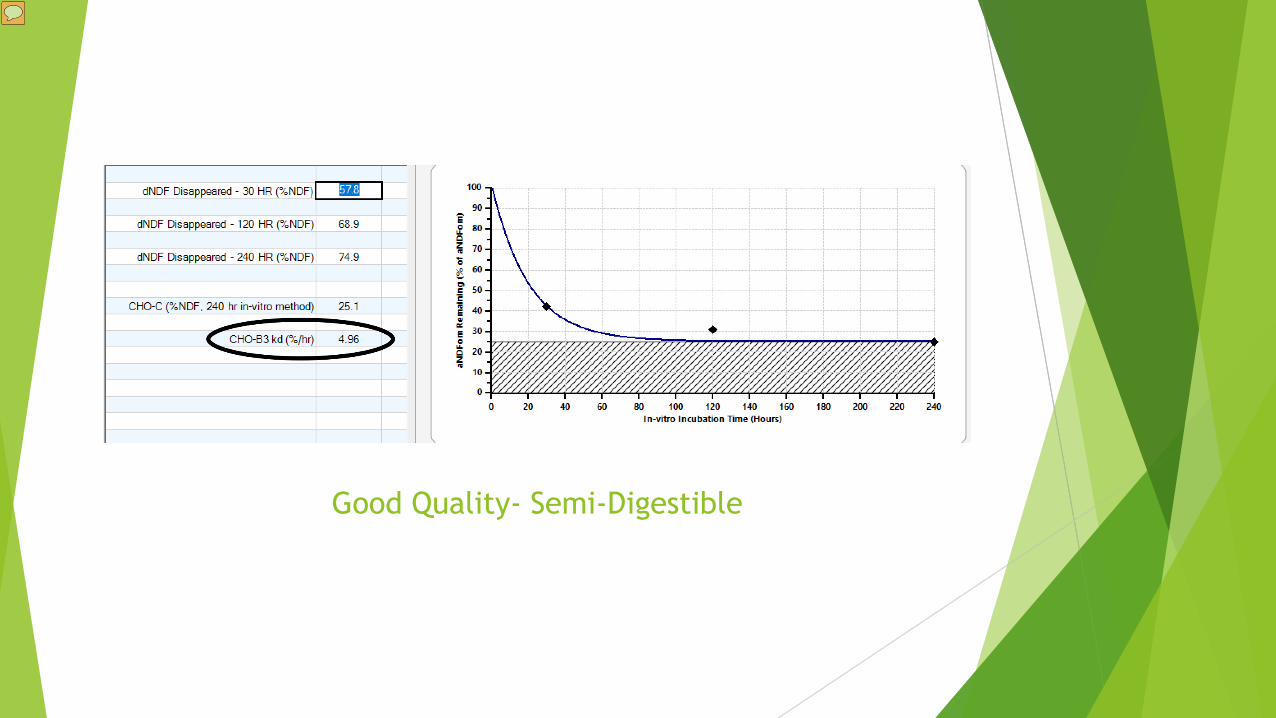
Good Quality- Semi-Digestible
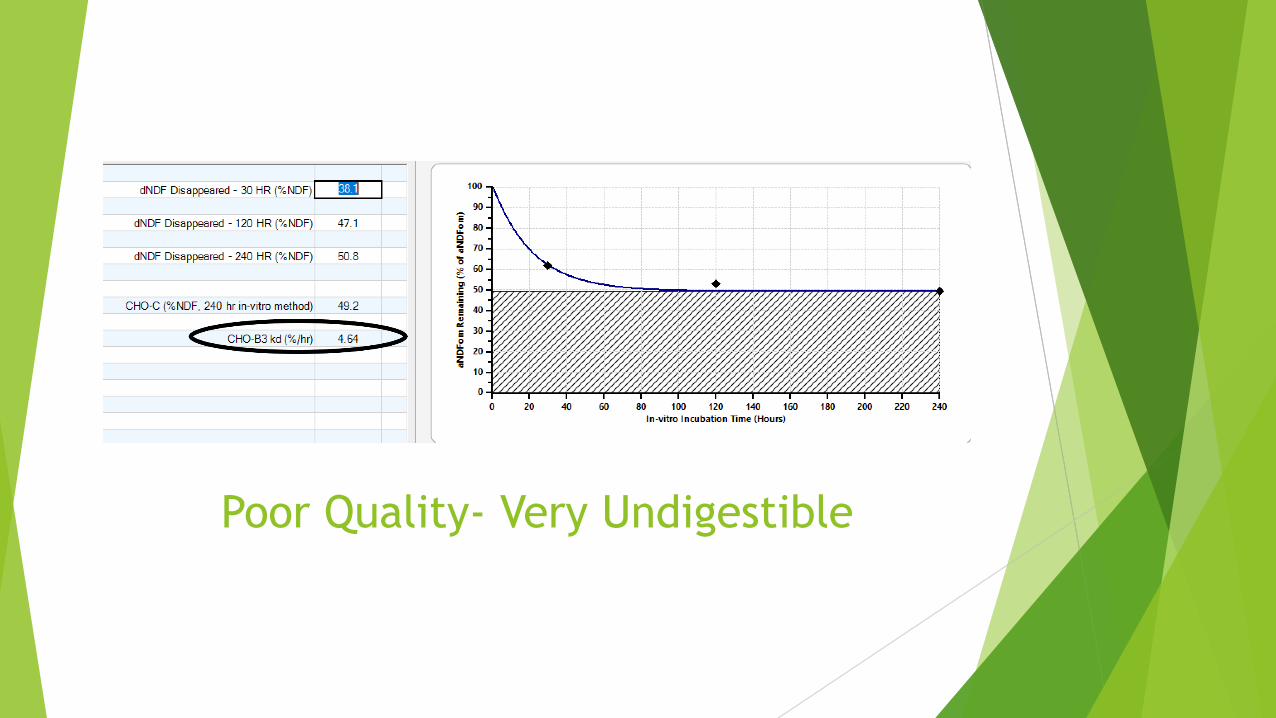
Poor Quality- Very Undigestible
The size of the uNDF pool doesn’t correlate with the rate AND the non forages don’t have values in the
model
NOW WHAT?!?

End of the Storyu It’s very important to test all your feeds with
the time points
u Tests have come a long way and we’re still learning things from this

Open Discussion: What are you seeing in the field?

Thank you
The heifer paradigm:know your future generation
Dr. Jud Heinrichs & Rob Goodling
Dept. of Animal Science, Penn State University
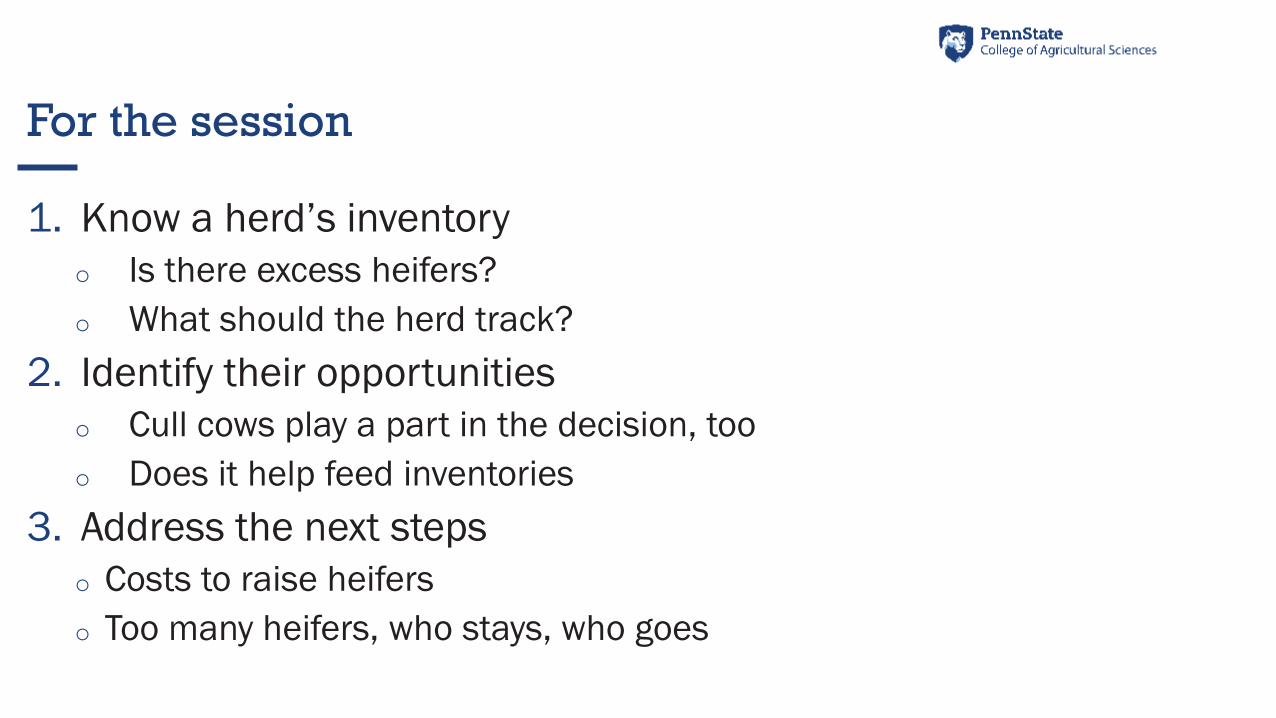
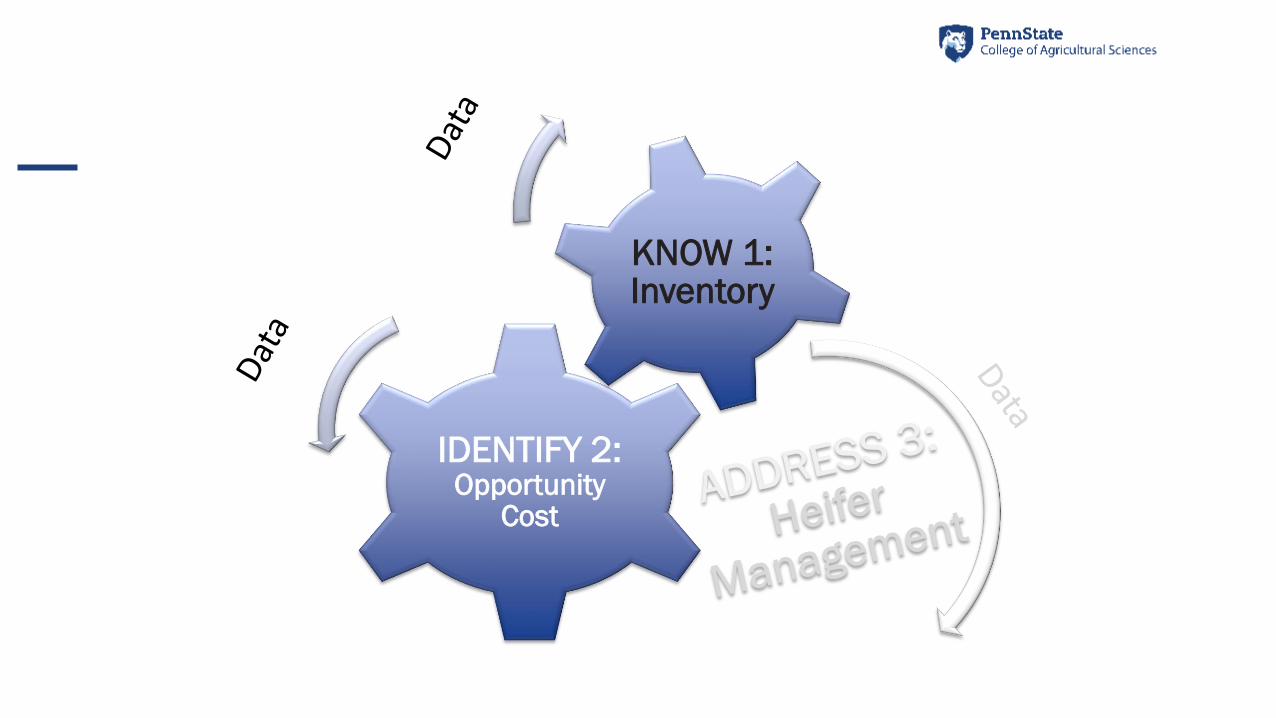
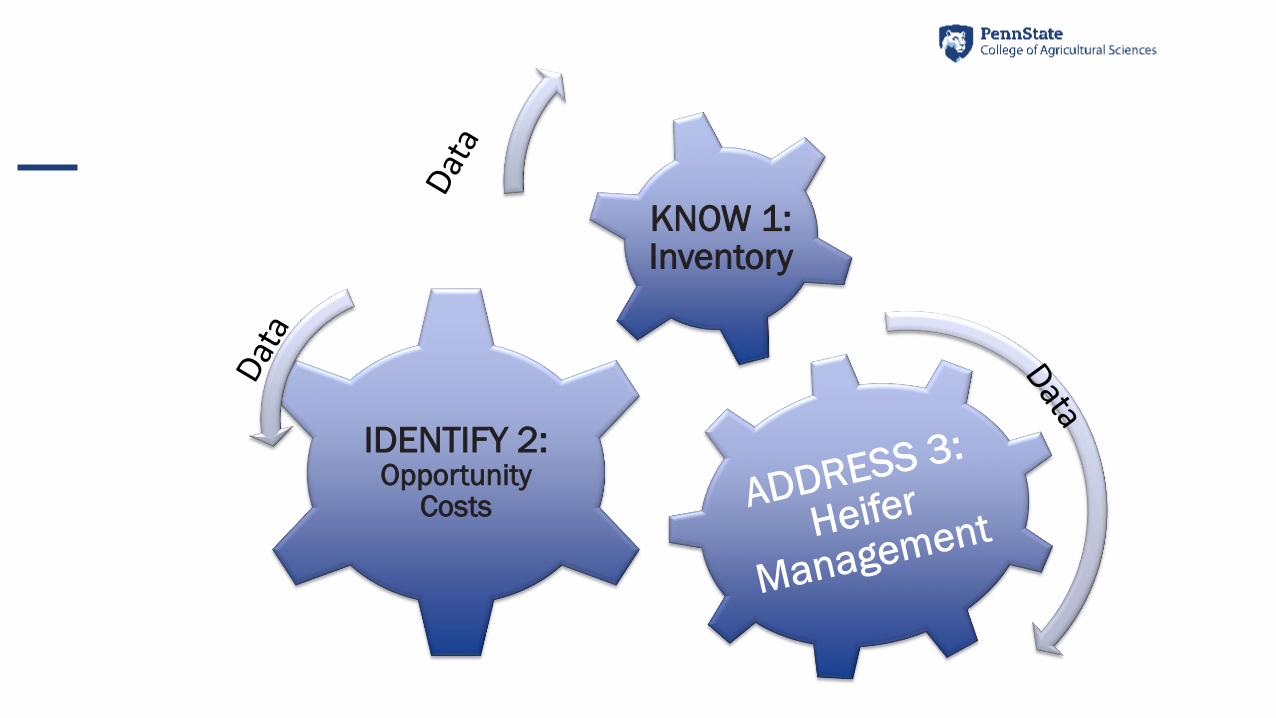
1. Know a herd’s inventory
o Is there excess heifers?
o What should the herd track?
2. Identify their opportunities
o Cull cows play a part in the decision, too
o Does it help feed inventories
3. Address the next steps
o Costs to raise heifers
o Too many heifers, who stays, who goes
For the session
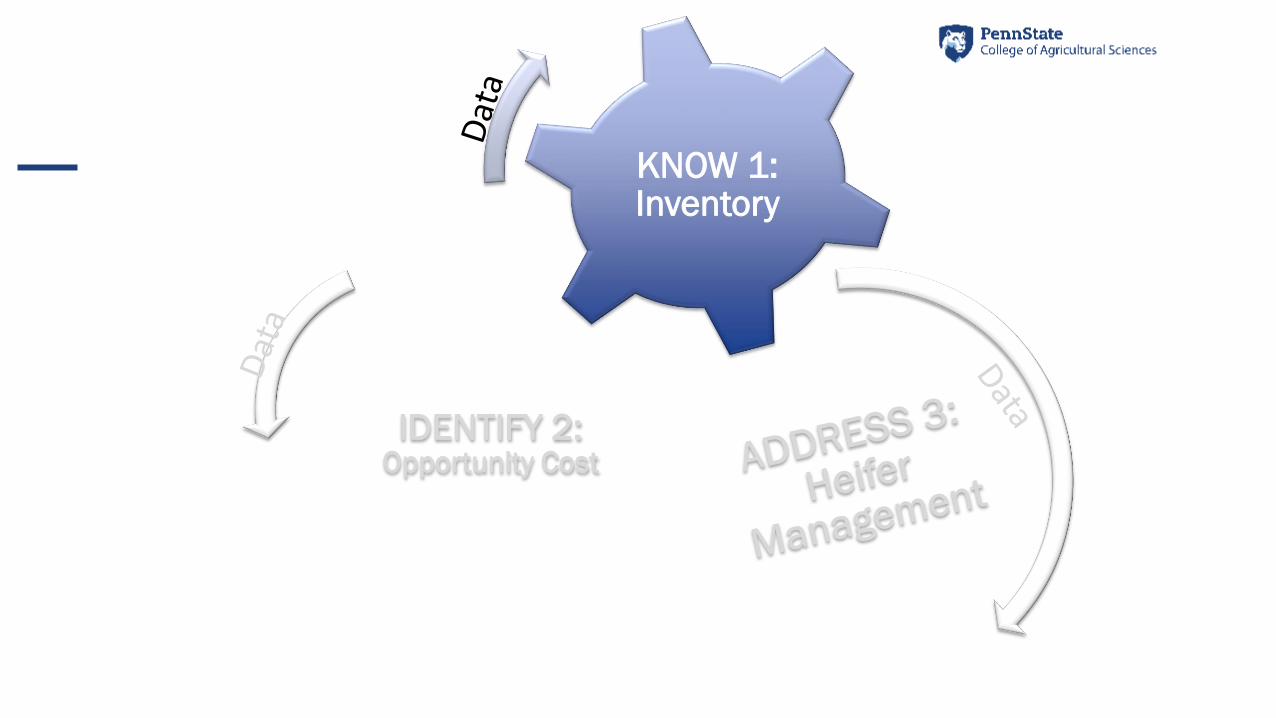
IDENTIFY 2: Opportunity Cost
KNOW 1: Inventory
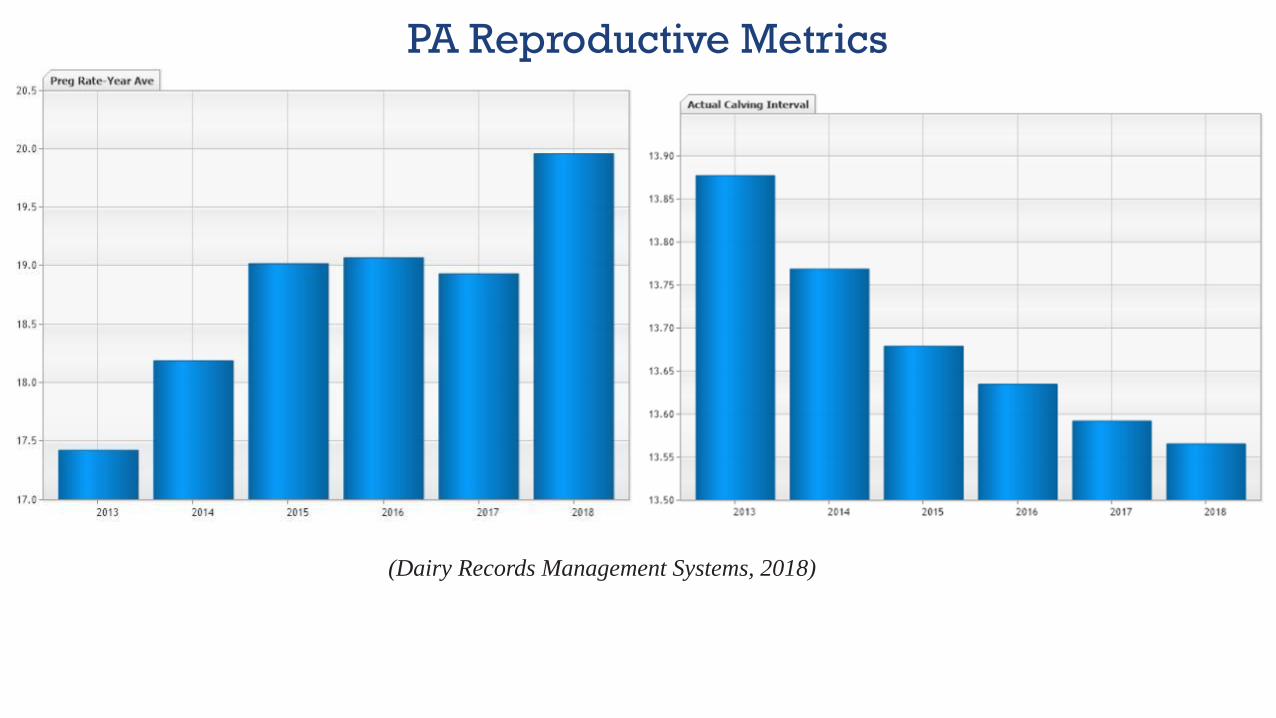
PA Reproductive Metrics
(Dairy Records Management Systems, 2018)
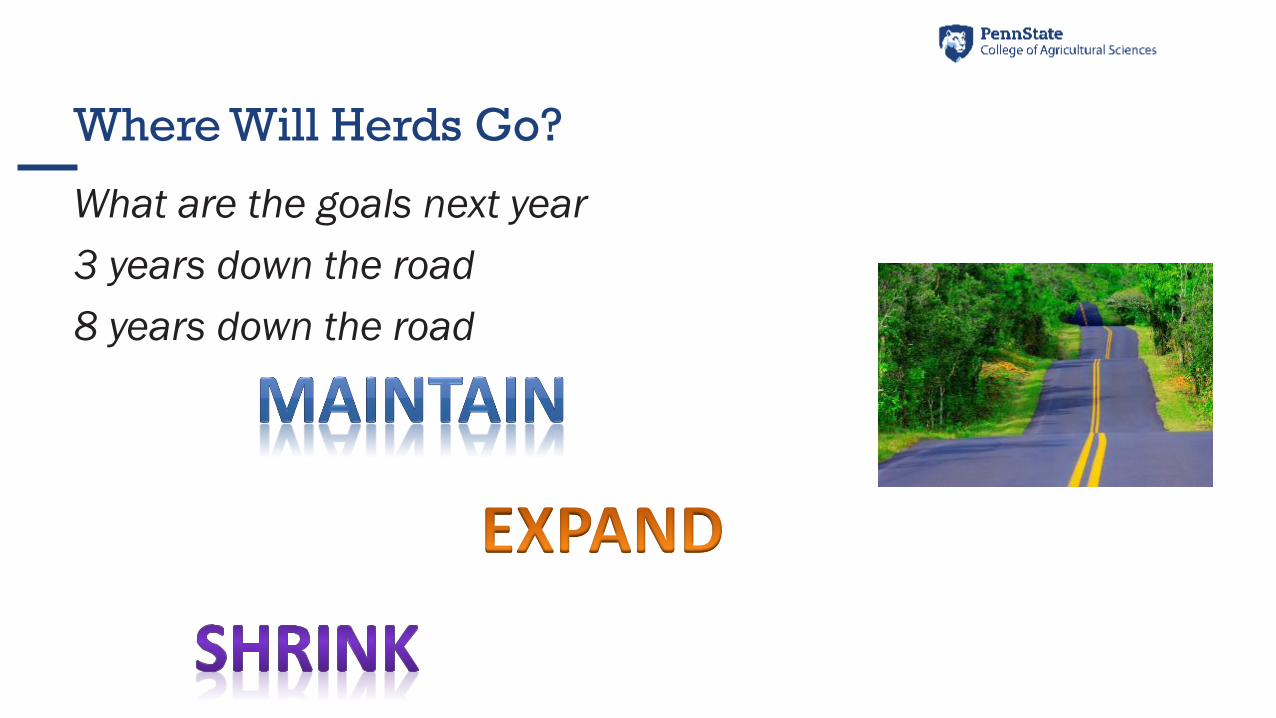
Where Will Herds Go?
What are the goals next year
3 years down the road
8 years down the road
Is it measured?
(really) (wrong)
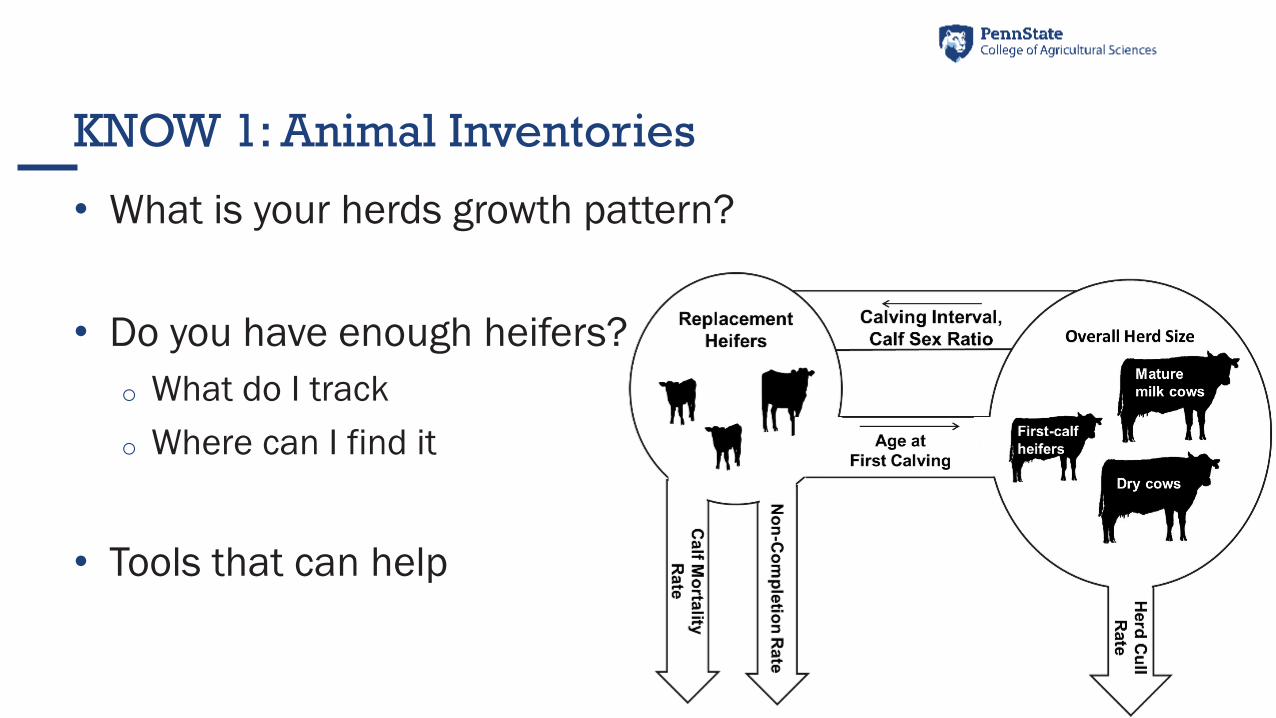
KNOW 1: Animal Inventories
• What is your herds growth pattern?
• Do you have enough heifers?
o What do I track
o Where can I find it
• Tools that can help
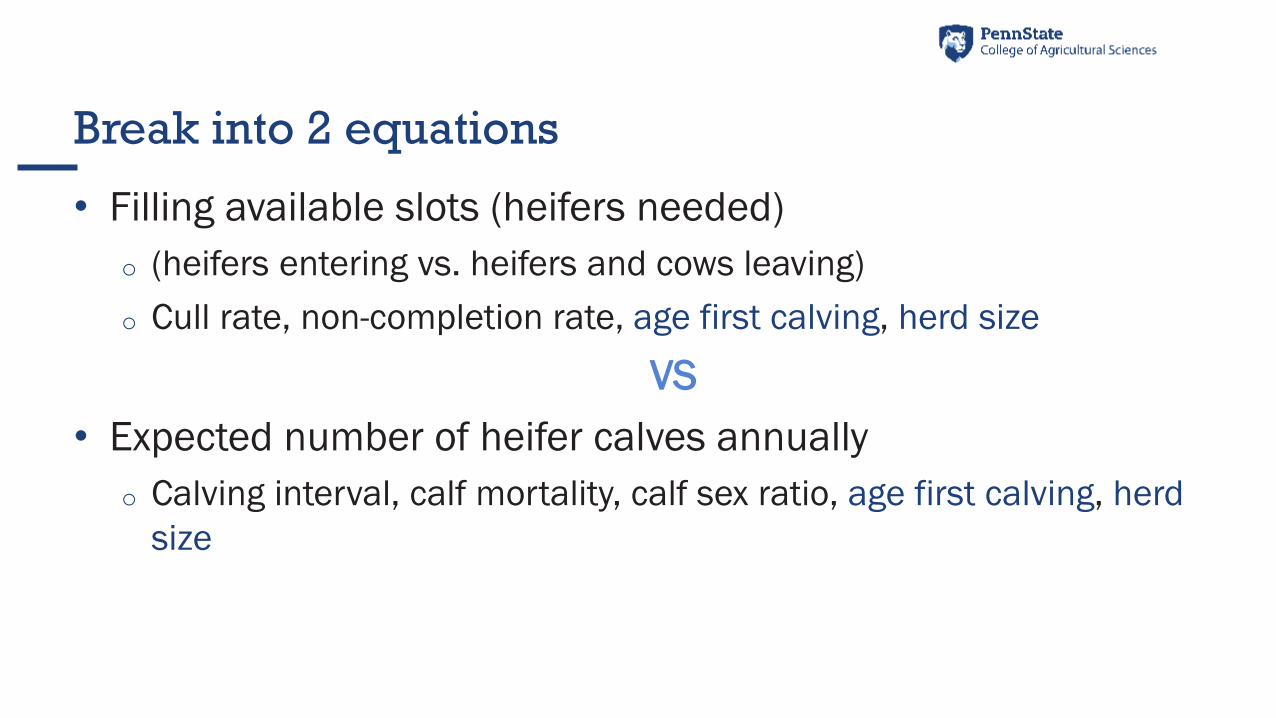
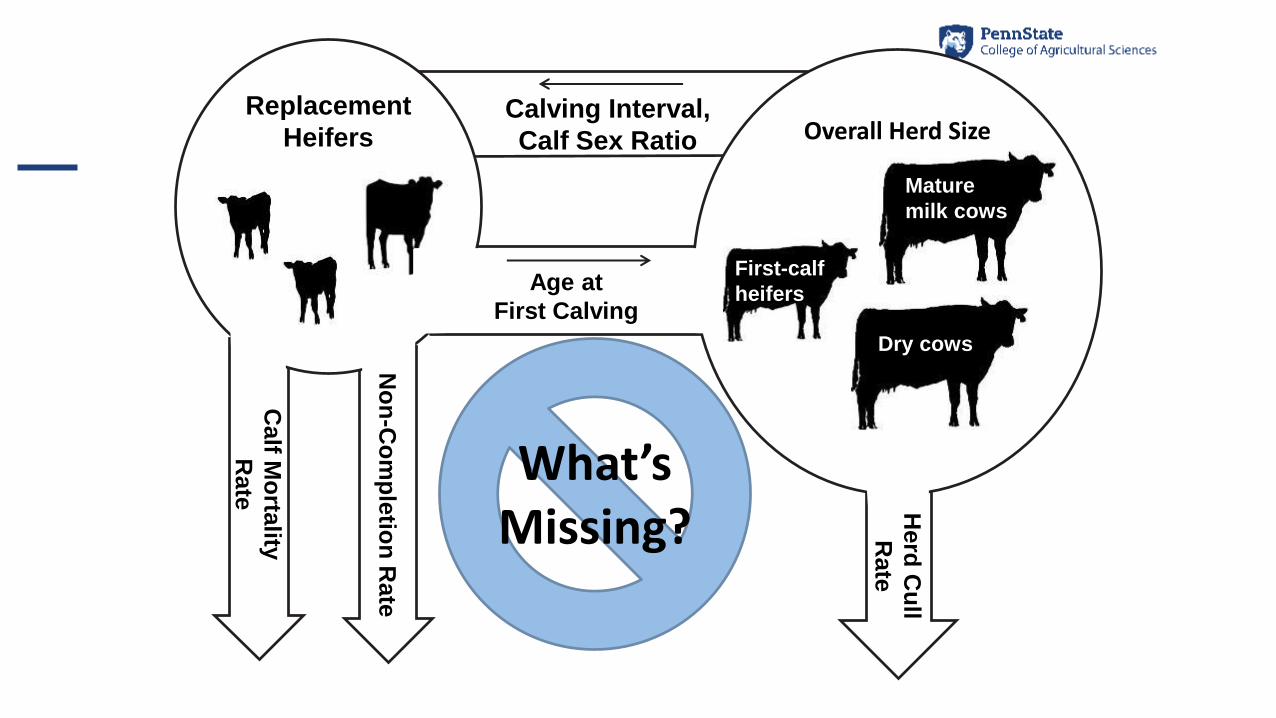
Break into 2 equations
• Filling available slots (heifers needed)
o (heifers entering vs. heifers and cows leaving)
o Cull rate, non-completion rate, age first calving, herd size
VS
• Expected number of heifer calves annually
o Calving interval, calf mortality, calf sex ratio, age first calving, herd
size
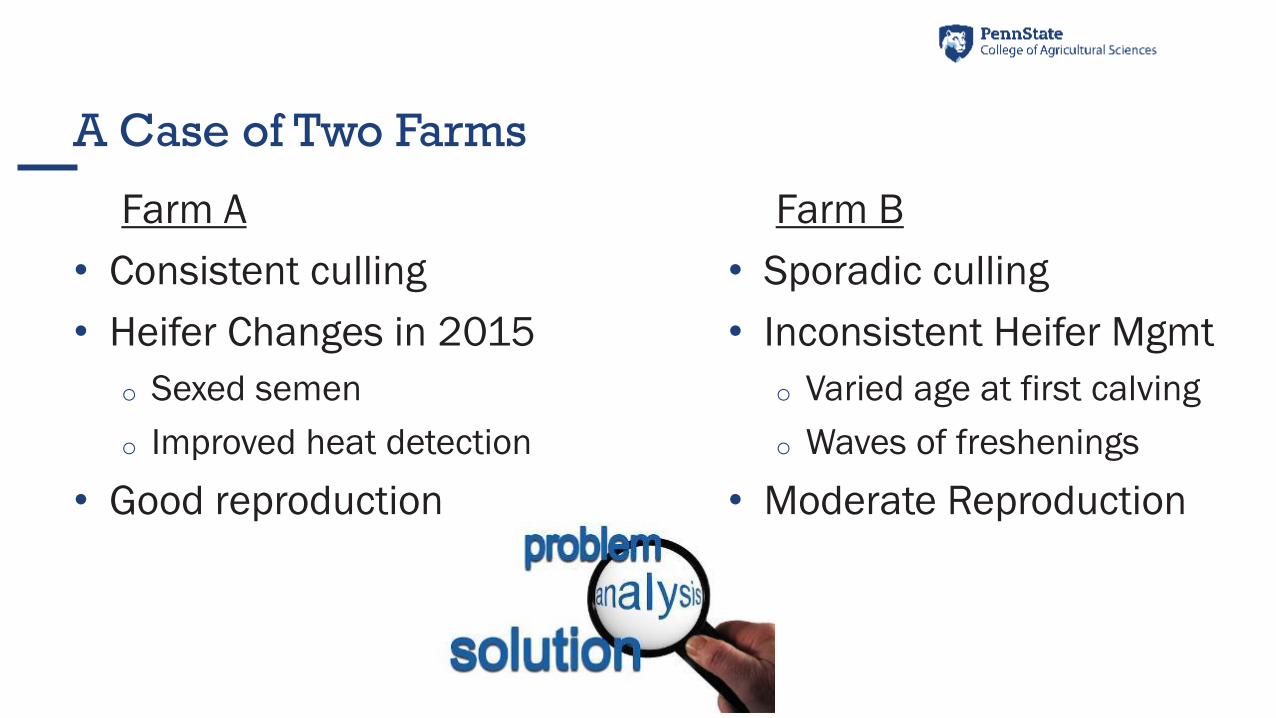
A Case of Two Farms
Farm A
• Consistent culling
• Heifer Changes in 2015
o Sexed semen
o Improved heat detection
• Good reproduction
Farm B
• Sporadic culling
• Inconsistent Heifer Mgmt
o Varied age at first calving
o Waves of freshenings
• Moderate Reproduction
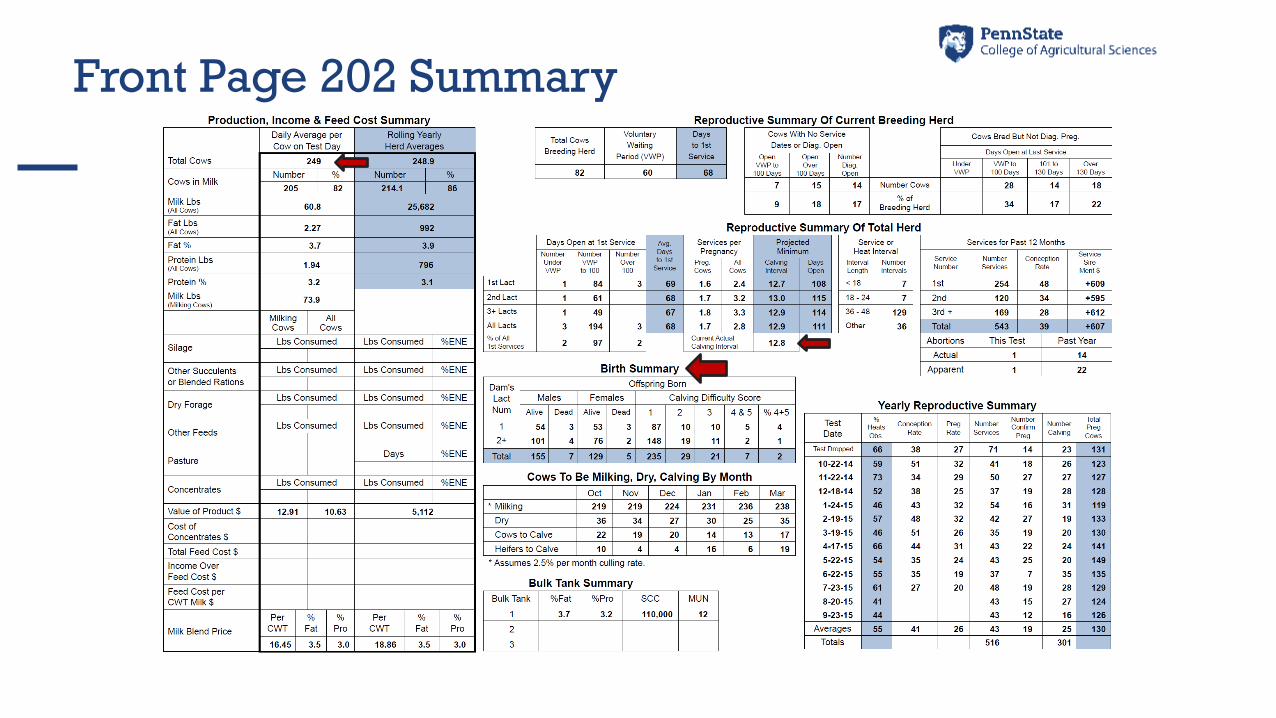
Front Page 202 Summary
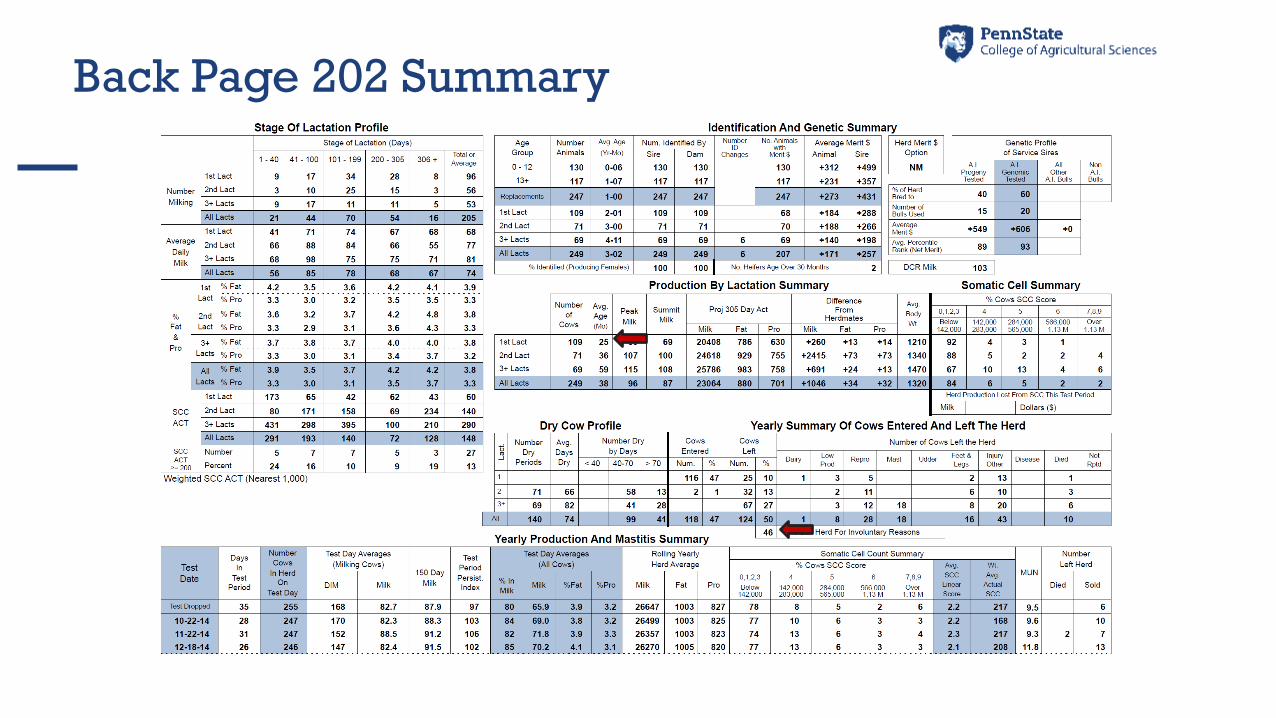
Back Page 202 Summary
Calving Interval,
Calf Sex Ratio
Herd
Cu
ll
Rate
Age at
First Calving
Overall Herd Size
Calf M
orta
lity
Rate
No
n-C
om
ple
tion
Rate
Replacement
Heifers
First-calf
heifers
Mature
milk cows
Dry cows
What’s Missing?
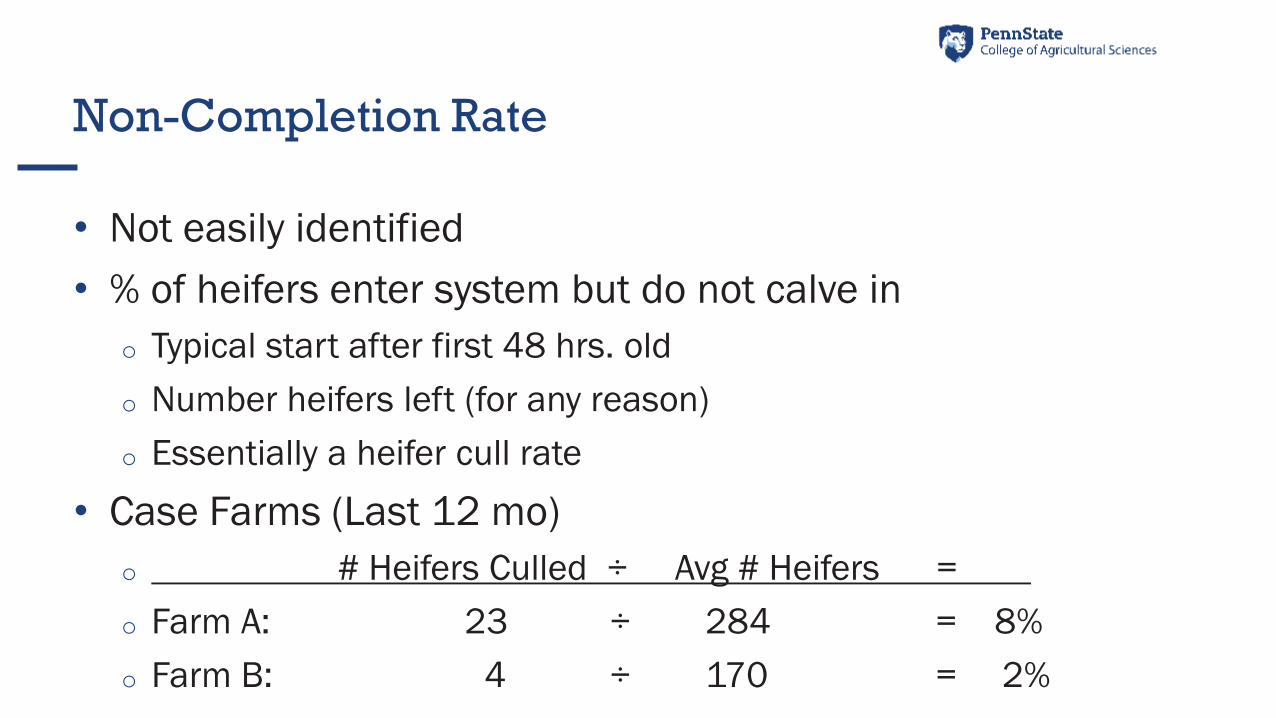
Non-Completion Rate
• Not easily identified
• % of heifers enter system but do not calve in
o Typical start after first 48 hrs. old
o Number heifers left (for any reason)
o Essentially a heifer cull rate
• Case Farms (Last 12 mo)
o # Heifers Culled ÷ Avg # Heifers =
o Farm A: 23 ÷ 284 = 8%
o Farm B: 4 ÷ 170 = 2%
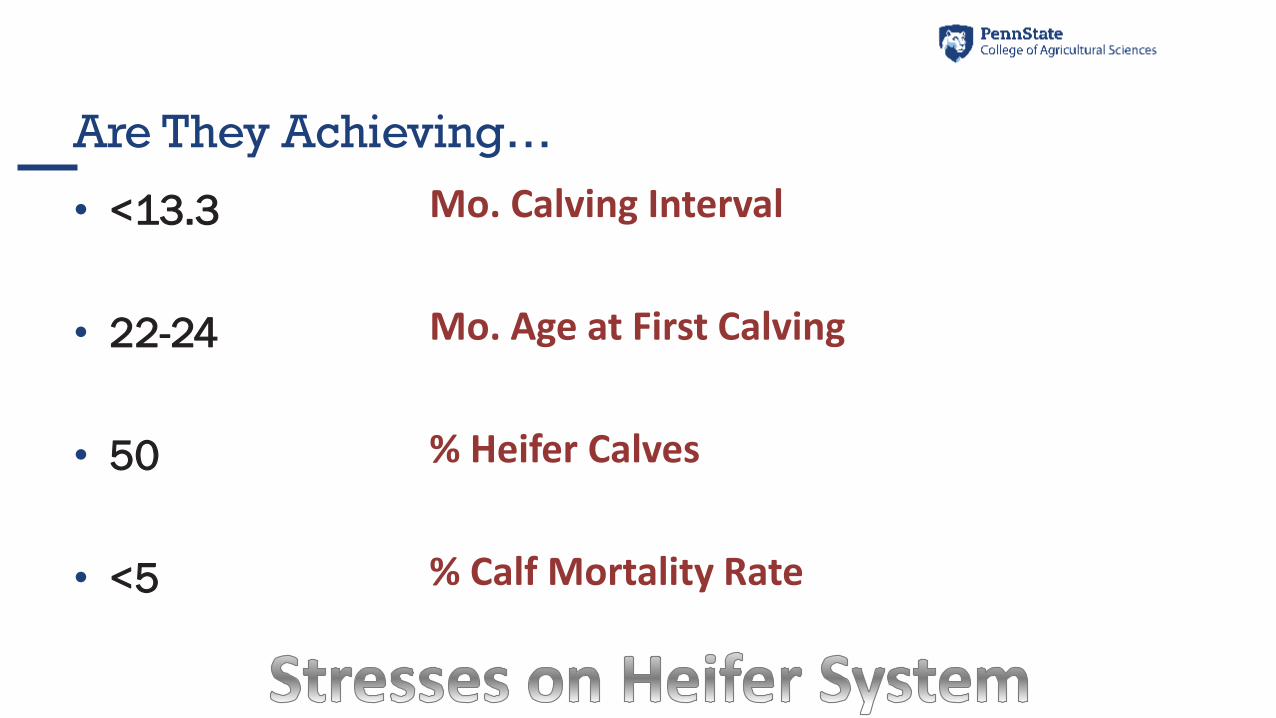
Are They Achieving…
• <13.3
• 22-24
• 50
• <5
Mo. Calving Interval
Mo. Age at First Calving
% Heifer Calves
% Calf Mortality Rate
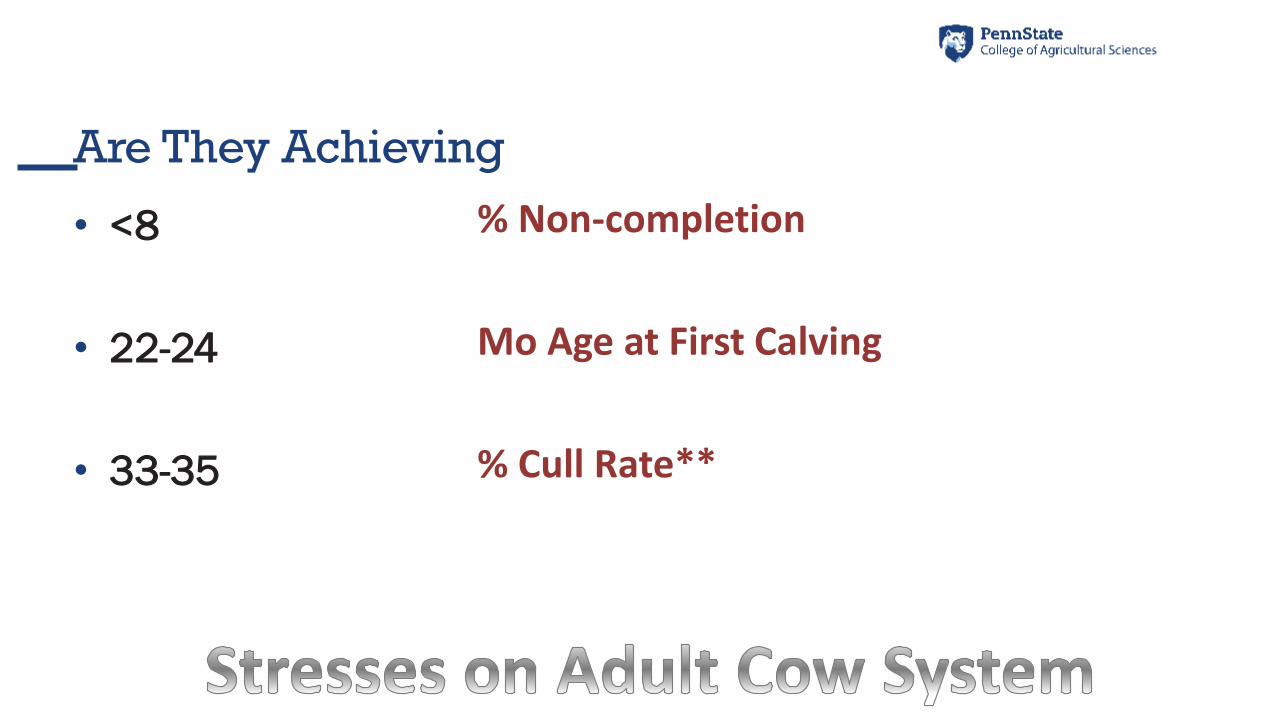
Are They Achieving
• <8
• 22-24
• 33-35
% Non-completion
Mo Age at First Calving
% Cull Rate**
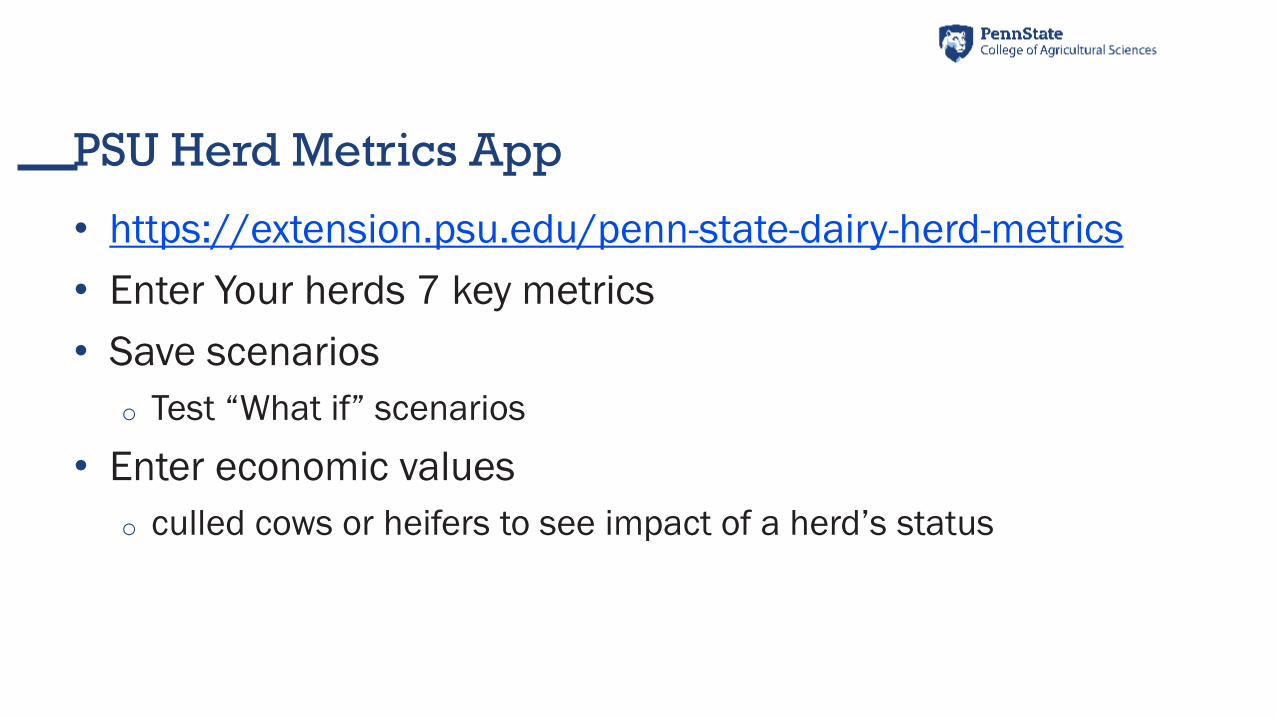
PSU Herd Metrics App
• https://extension.psu.edu/penn-state-dairy-herd-metrics
• Enter Your herds 7 key metrics
• Save scenarios
o Test “What if” scenarios
• Enter economic values
o culled cows or heifers to see impact of a herd’s status
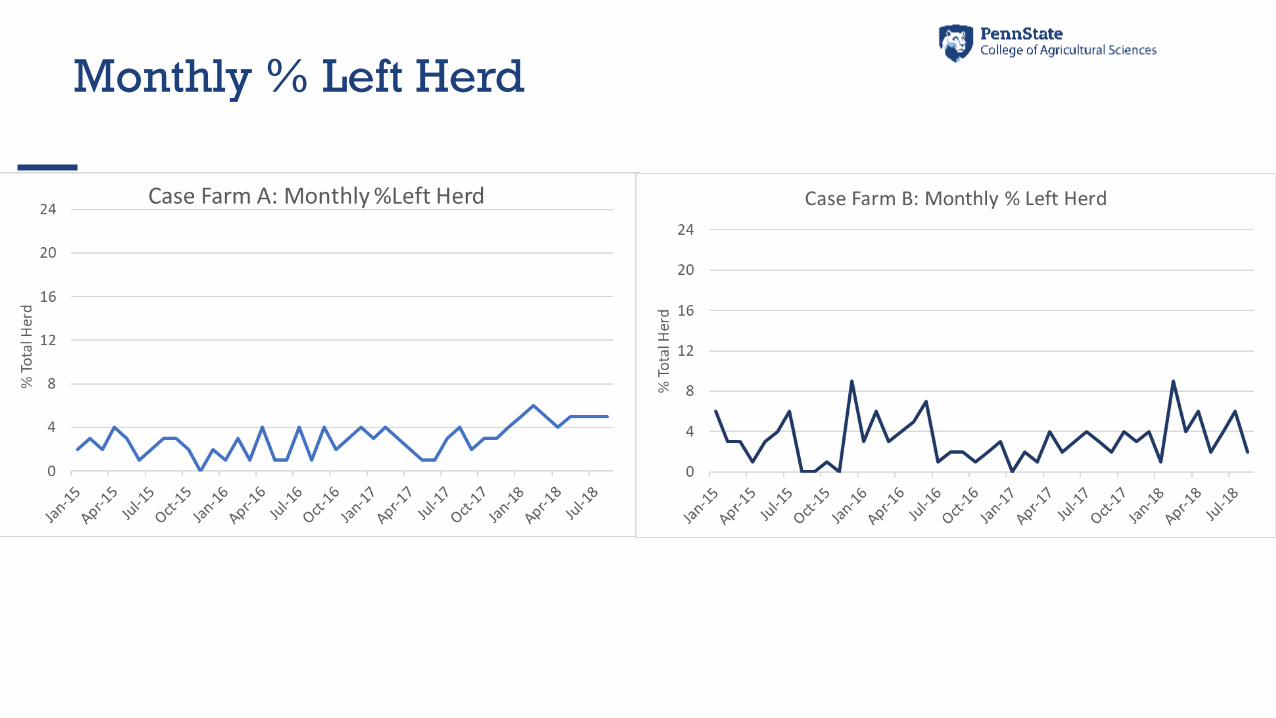
Monthly % Left Herd
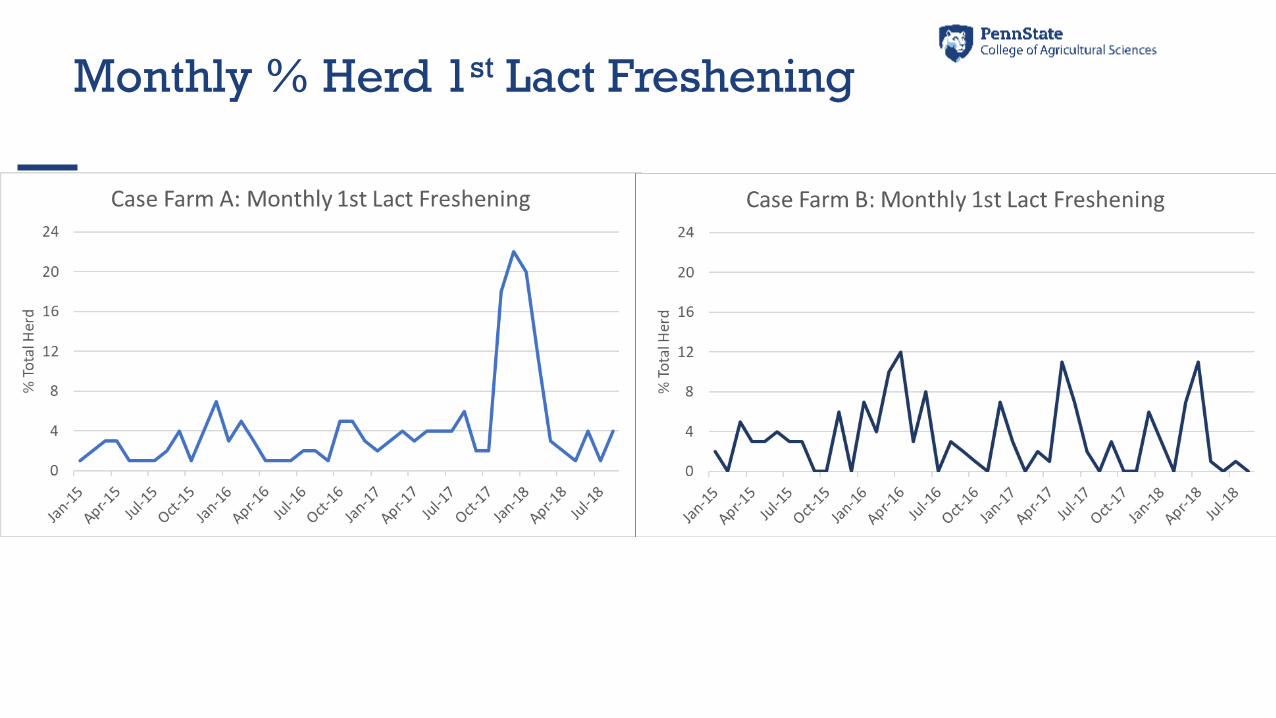
Monthly % Herd 1st Lact Freshening
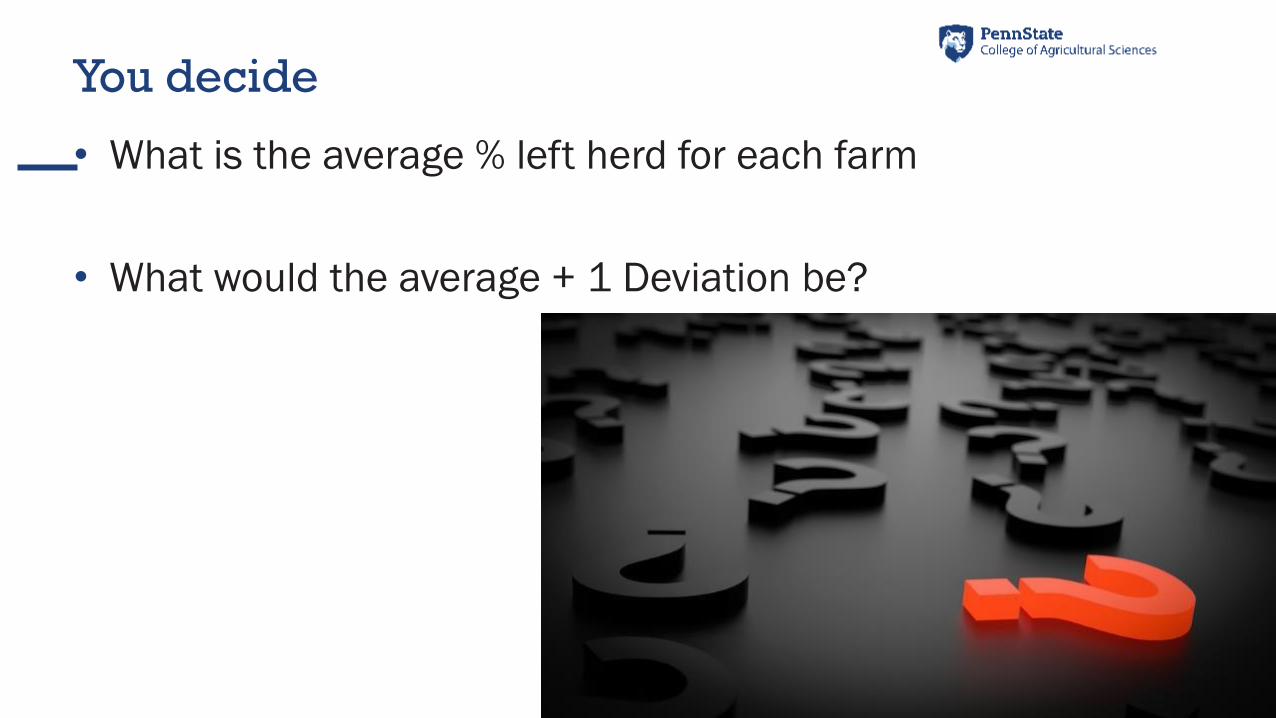
You decide
• What is the average % left herd for each farm
• What would the average + 1 Deviation be?
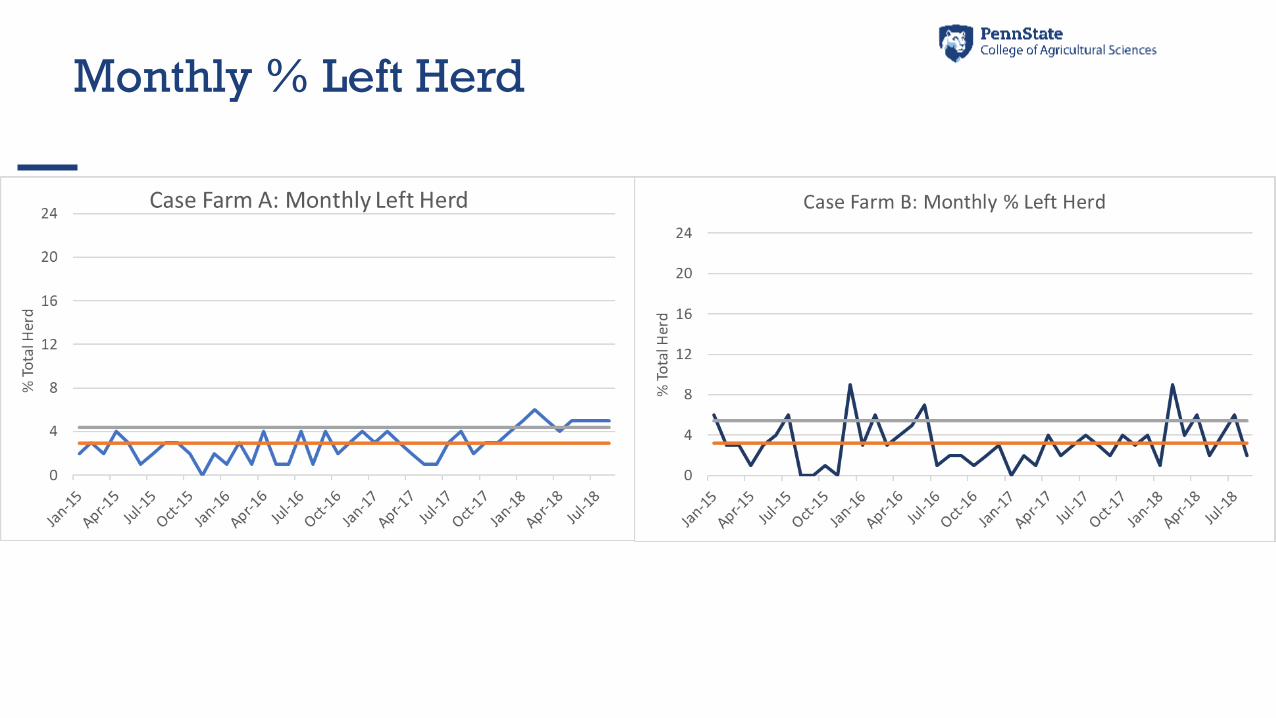
Monthly % Left Herd
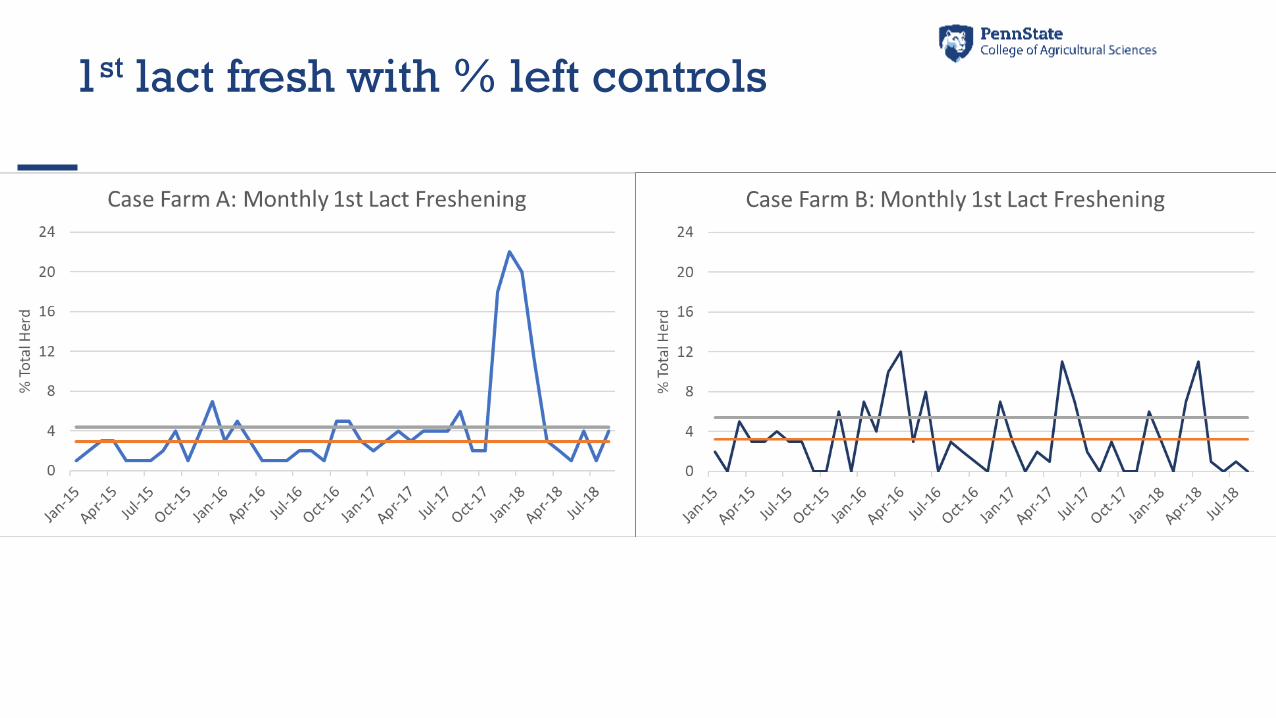
1st lact fresh with % left controls
IDENTIFY 2: Opportunity
Cost
KNOW 1: Inventory
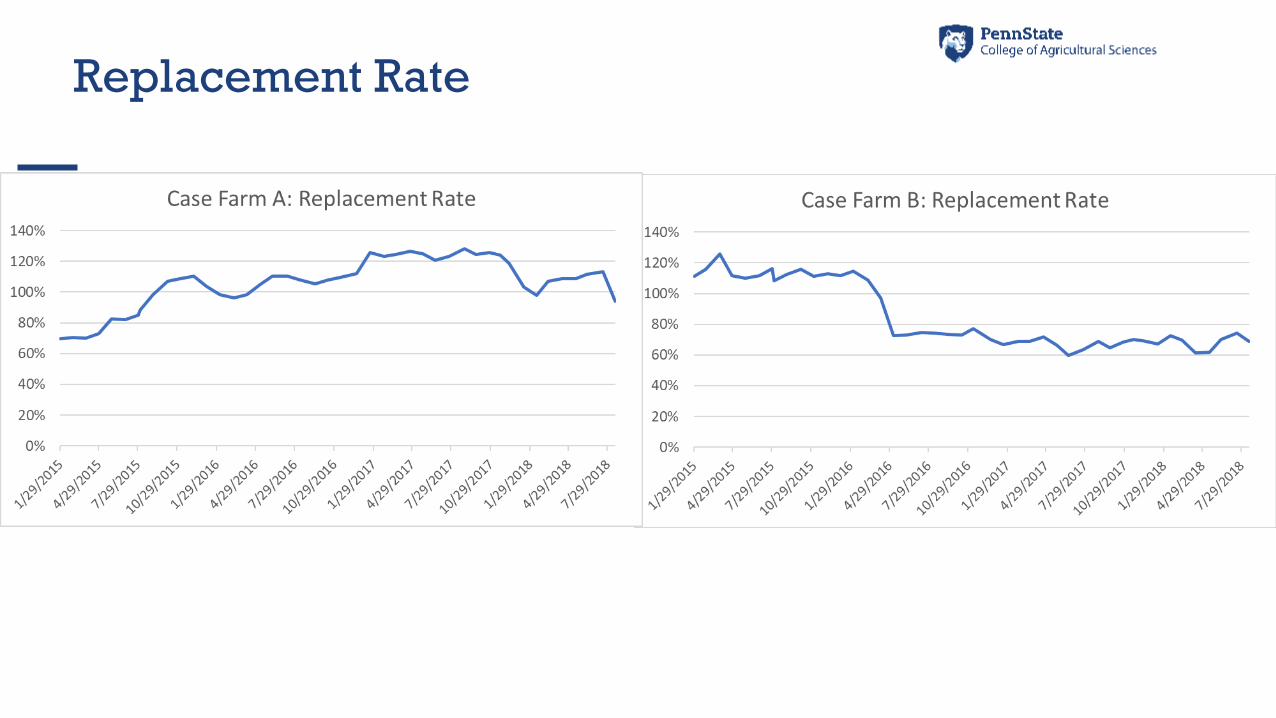
Replacement Rate
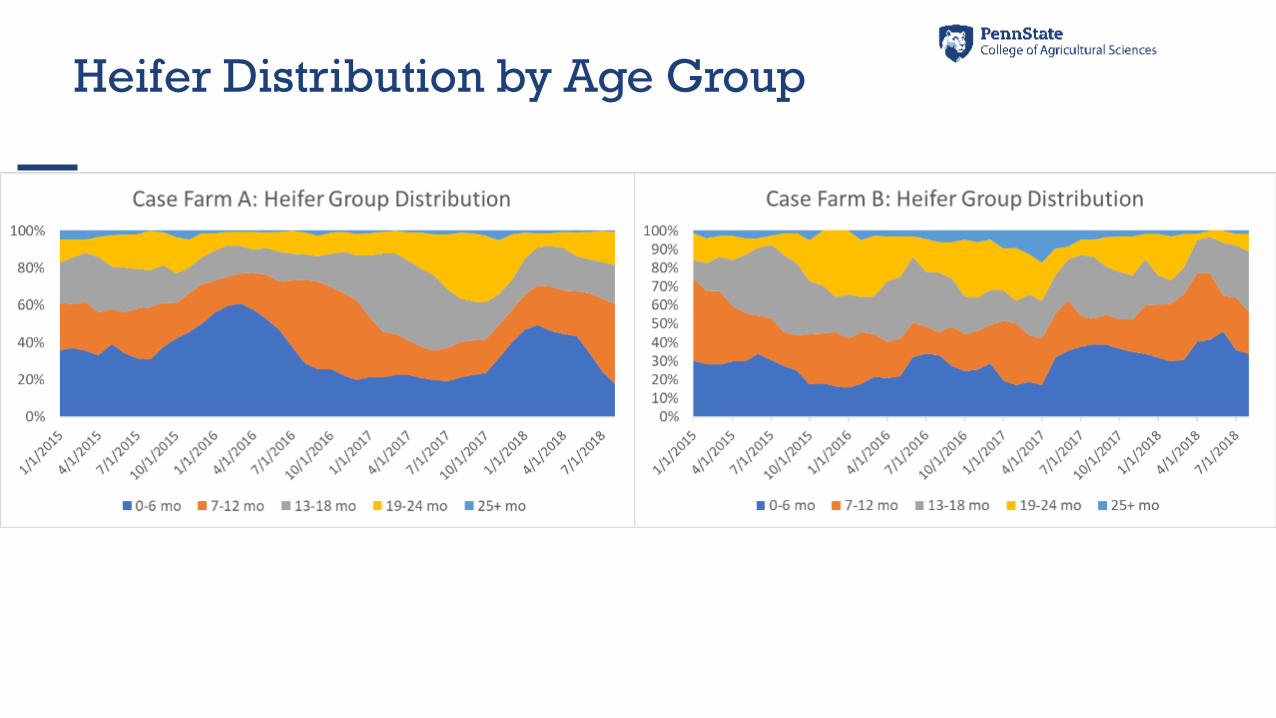
Heifer Distribution by Age Group
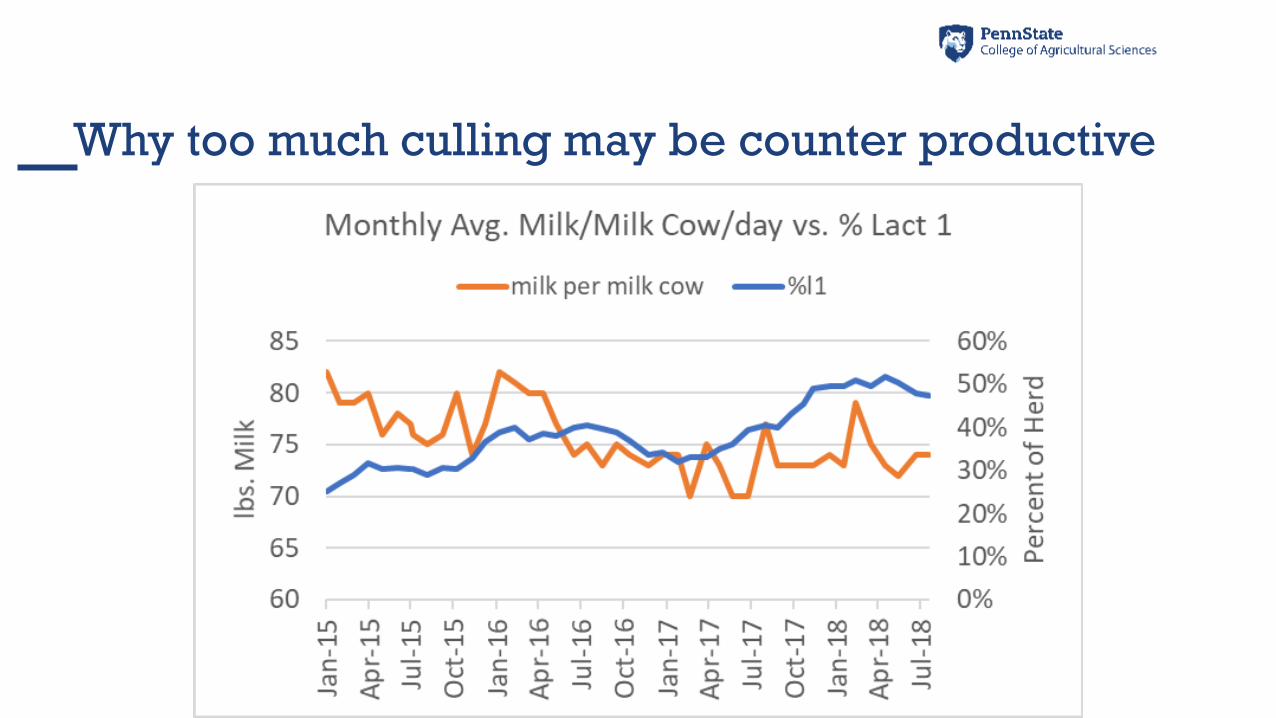
Why too much culling may be counter productive
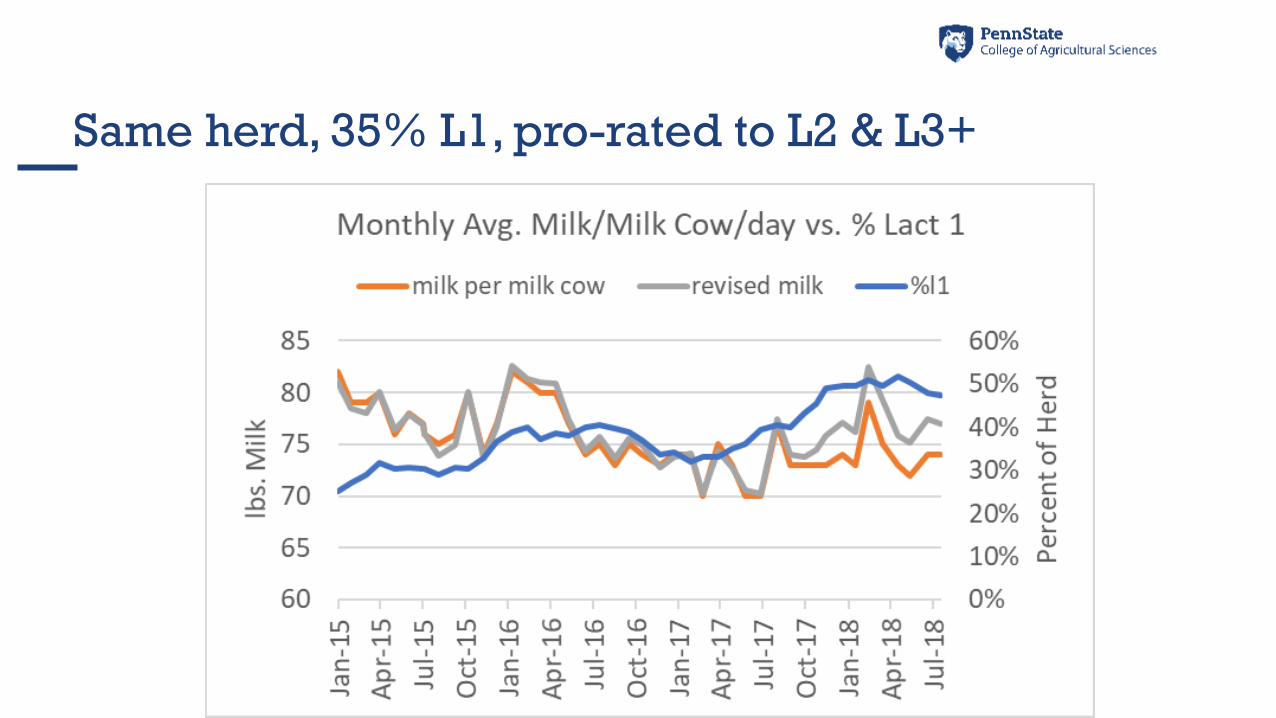
Same herd, 35% L1, pro-rated to L2 & L3+
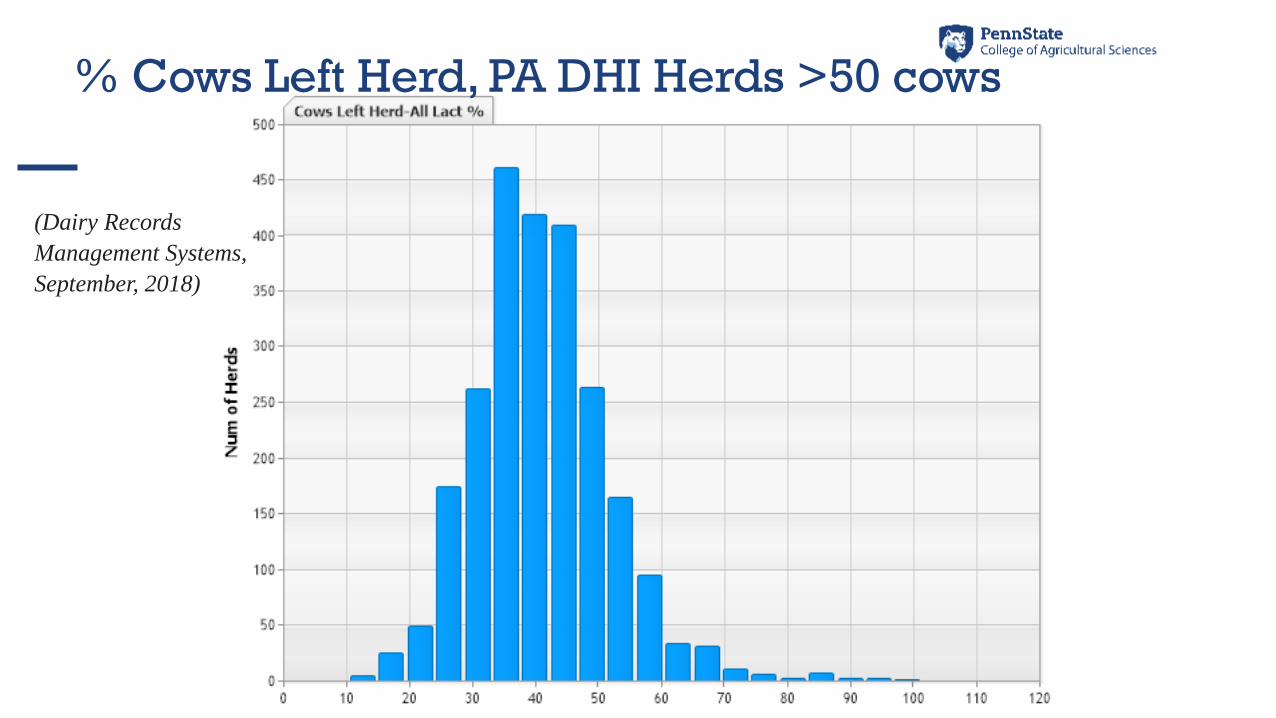
% Cows Left Herd, PA DHI Herds >50 cows
(Dairy Records
Management Systems,
September, 2018)
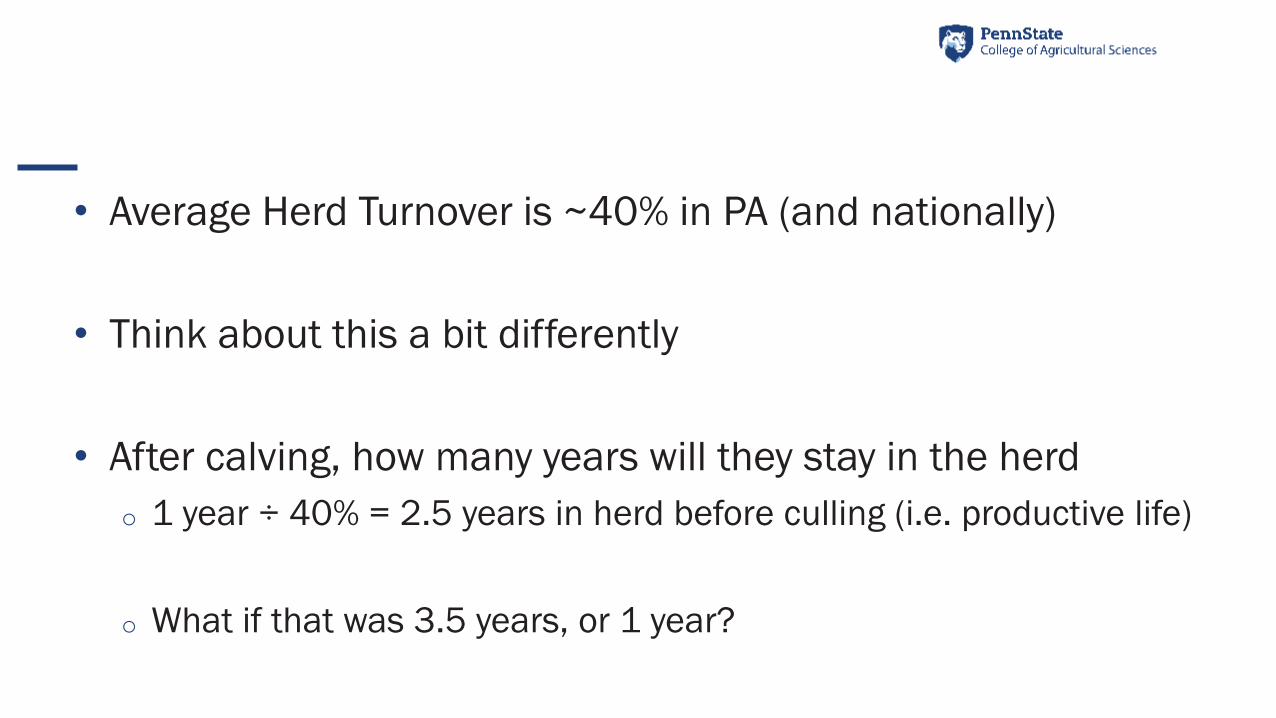
• Average Herd Turnover is ~40% in PA (and nationally)
• Think about this a bit differently
• After calving, how many years will they stay in the herd
o 1 year ÷ 40% = 2.5 years in herd before culling (i.e. productive life)
o What if that was 3.5 years, or 1 year?
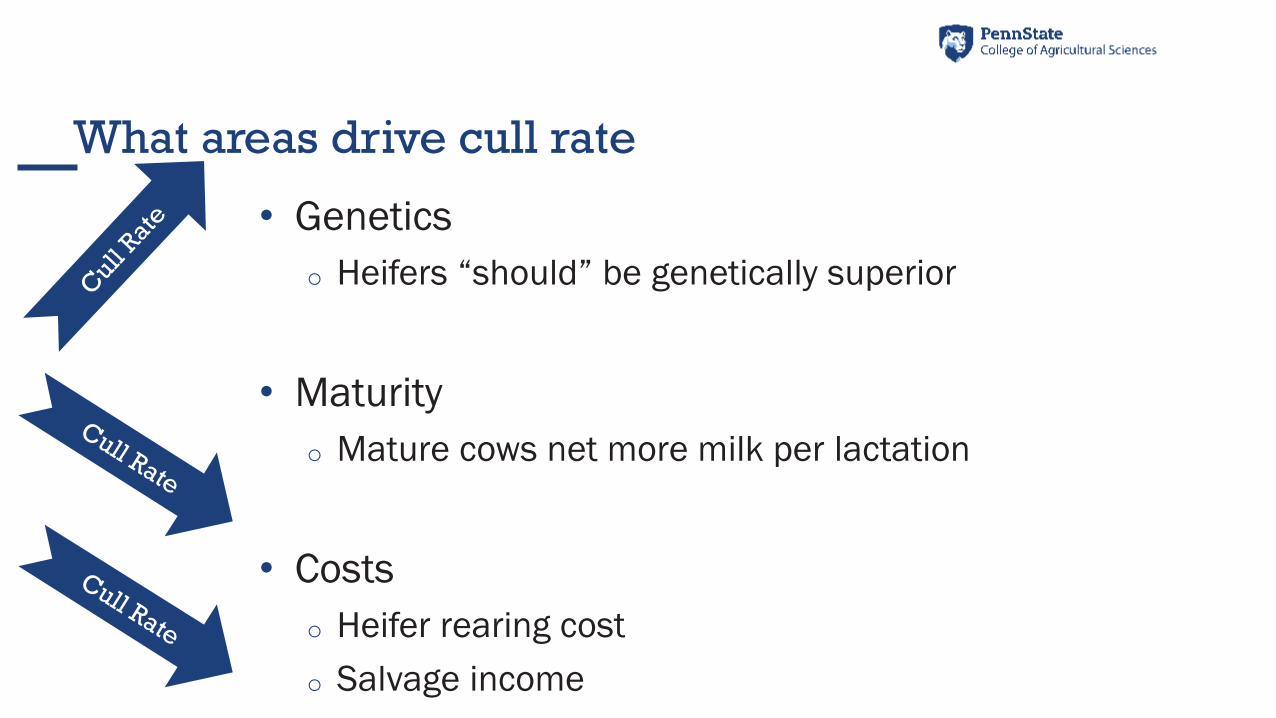
What areas drive cull rate
• Genetics
o Heifers “should” be genetically superior
• Maturity
o Mature cows net more milk per lactation
• Costs
o Heifer rearing cost
o Salvage income
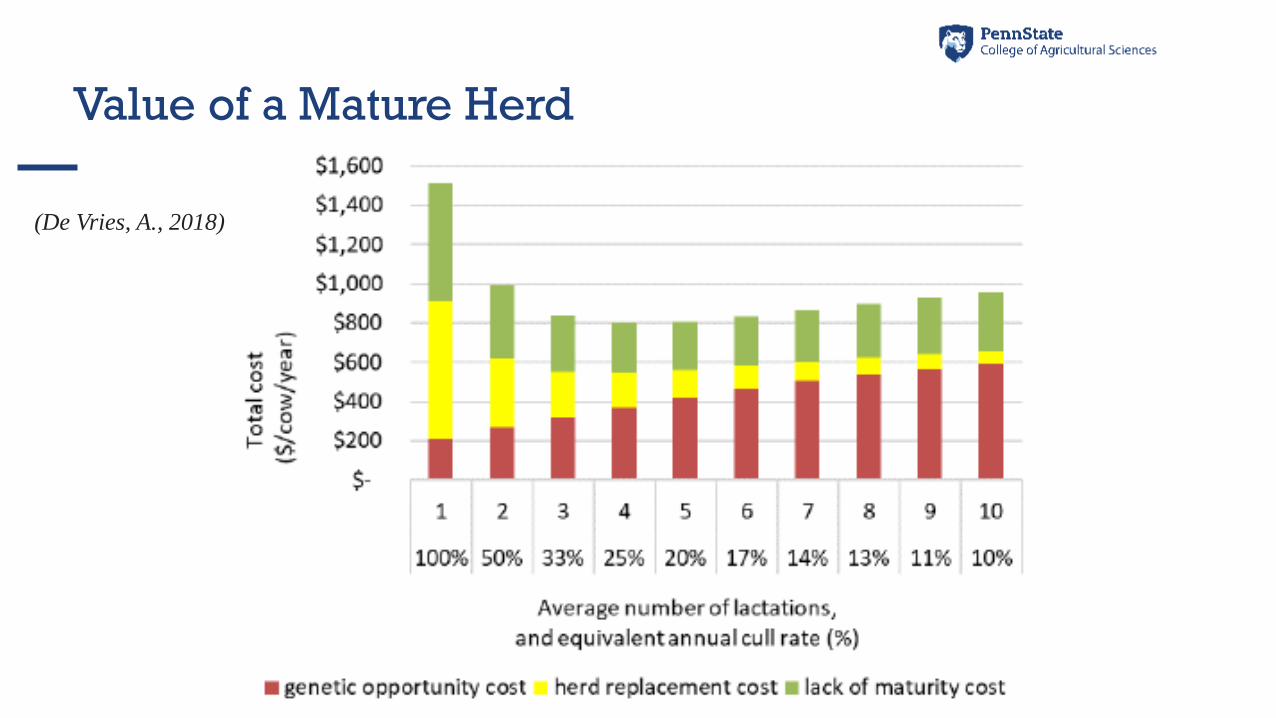
Value of a Mature Herd
(De Vries, A., 2018)
IDENTIFY 2: Opportunity
Costs
KNOW 1: Inventory
Costs to Raising Heifers
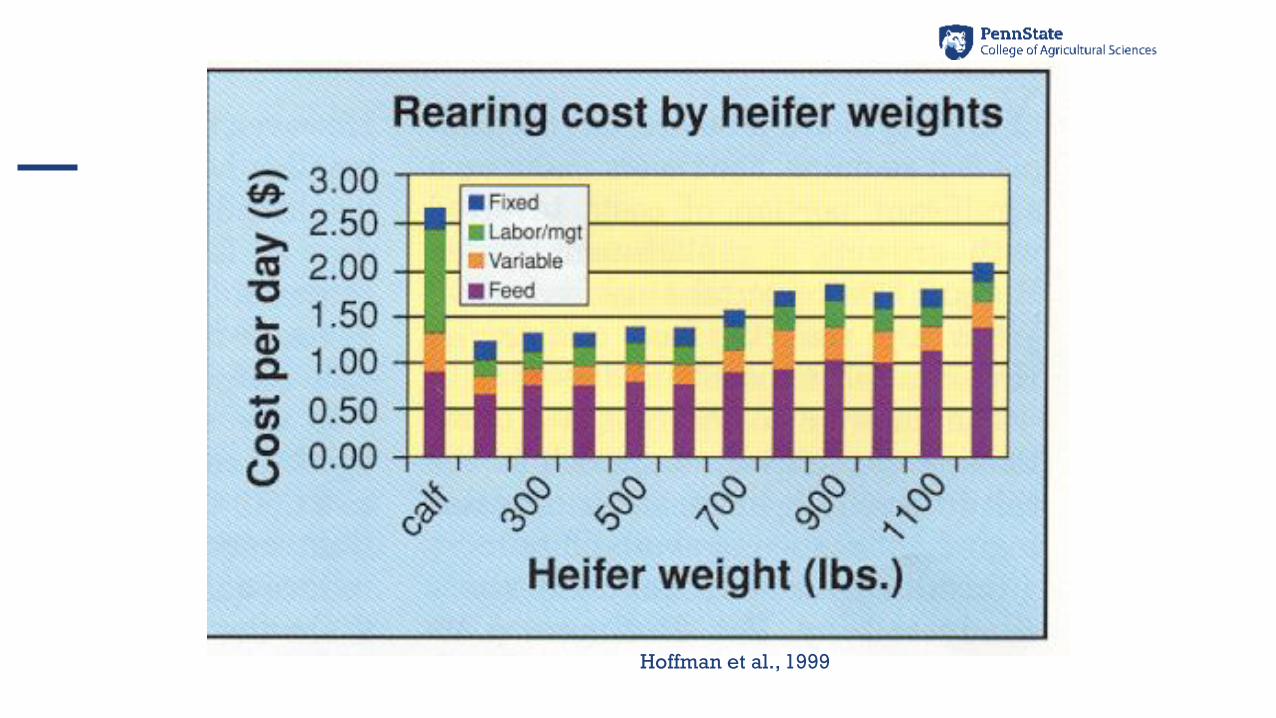
Hoffman et al., 1999
0
100
200
300
400
500
600A
vera
ge
To
tal C
ost
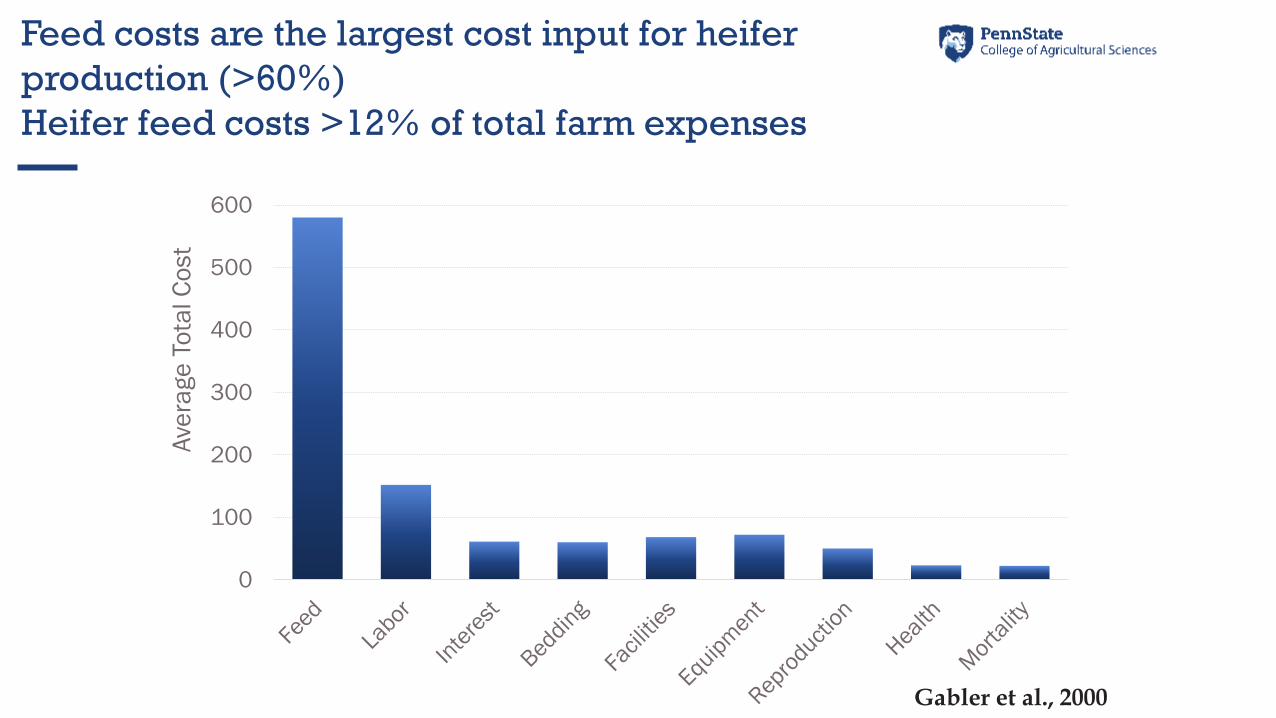
Gabler et al., 2000
Feed costs are the largest cost input for heifer
production (>60%)
Heifer feed costs >12% of total farm expenses
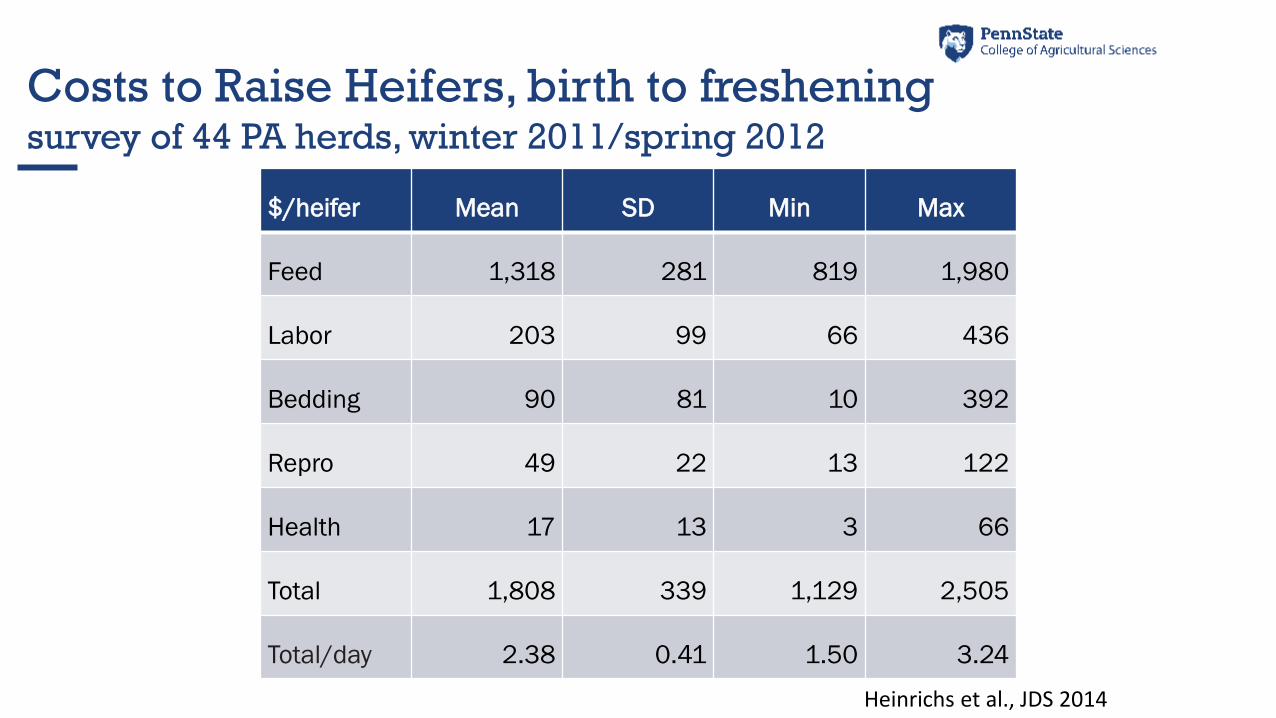
Costs to Raise Heifers, birth to fresheningsurvey of 44 PA herds, winter 2011/spring 2012
$/heifer Mean SD Min Max
Feed 1,318 281 819 1,980
Labor 203 99 66 436
Bedding 90 81 10 392
Repro 49 22 13 122
Health 17 13 3 66
Total 1,808 339 1,129 2,505
Total/day 2.38 0.41 1.50 3.24
Heinrichs et al., JDS 2014
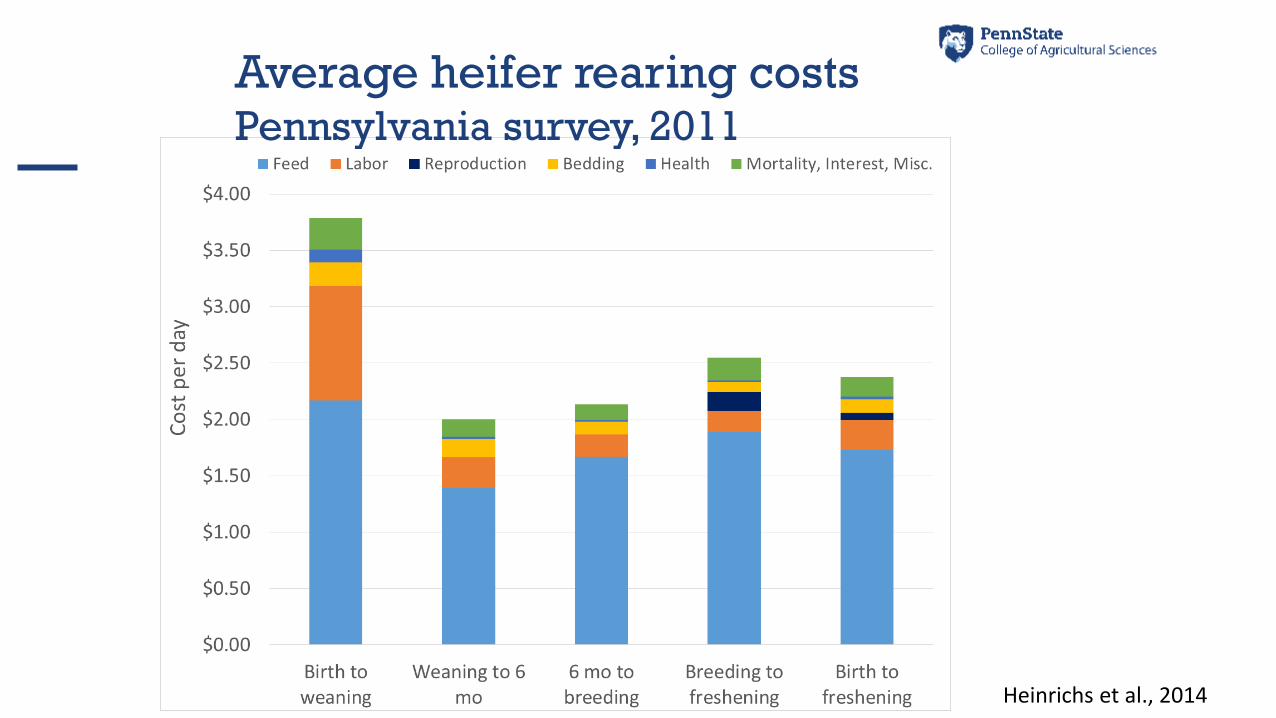
Average heifer rearing costs Pennsylvania survey, 2011
Heinrichs et al., 2014
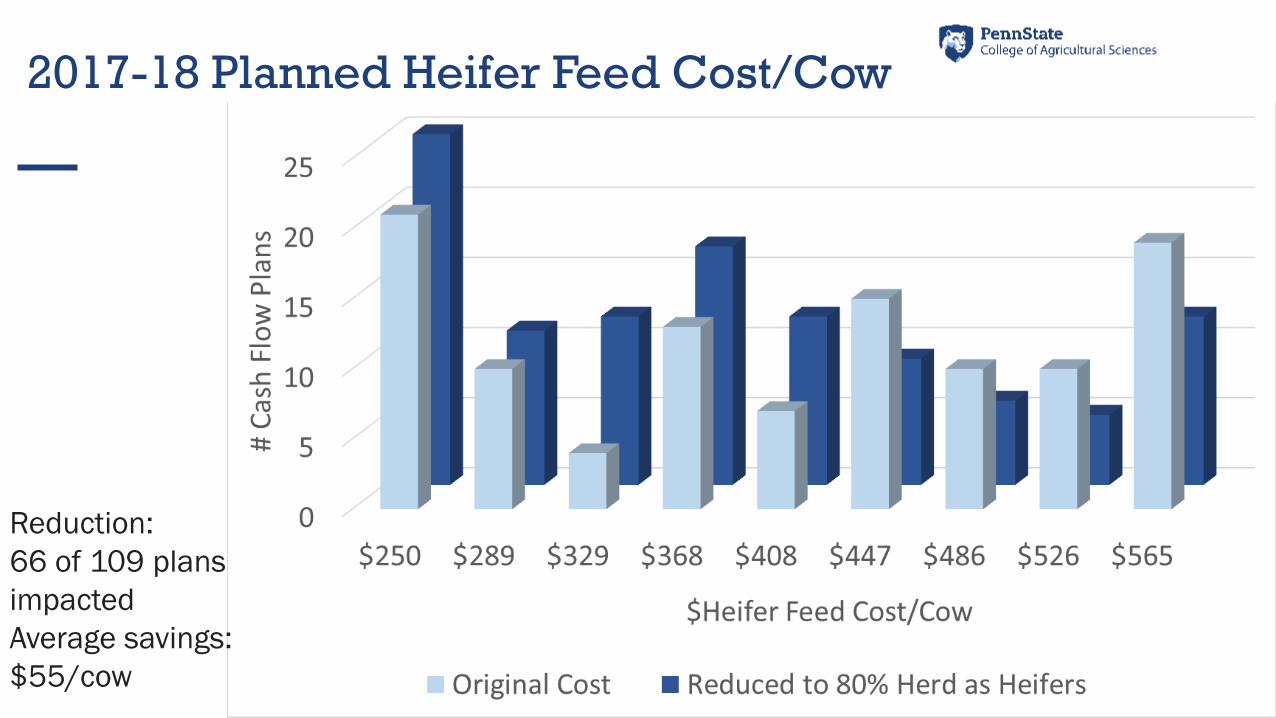
2017-18 Planned Heifer Feed Cost/Cow
Reduction:
66 of 109 plans
impacted
Average savings:
$55/cow
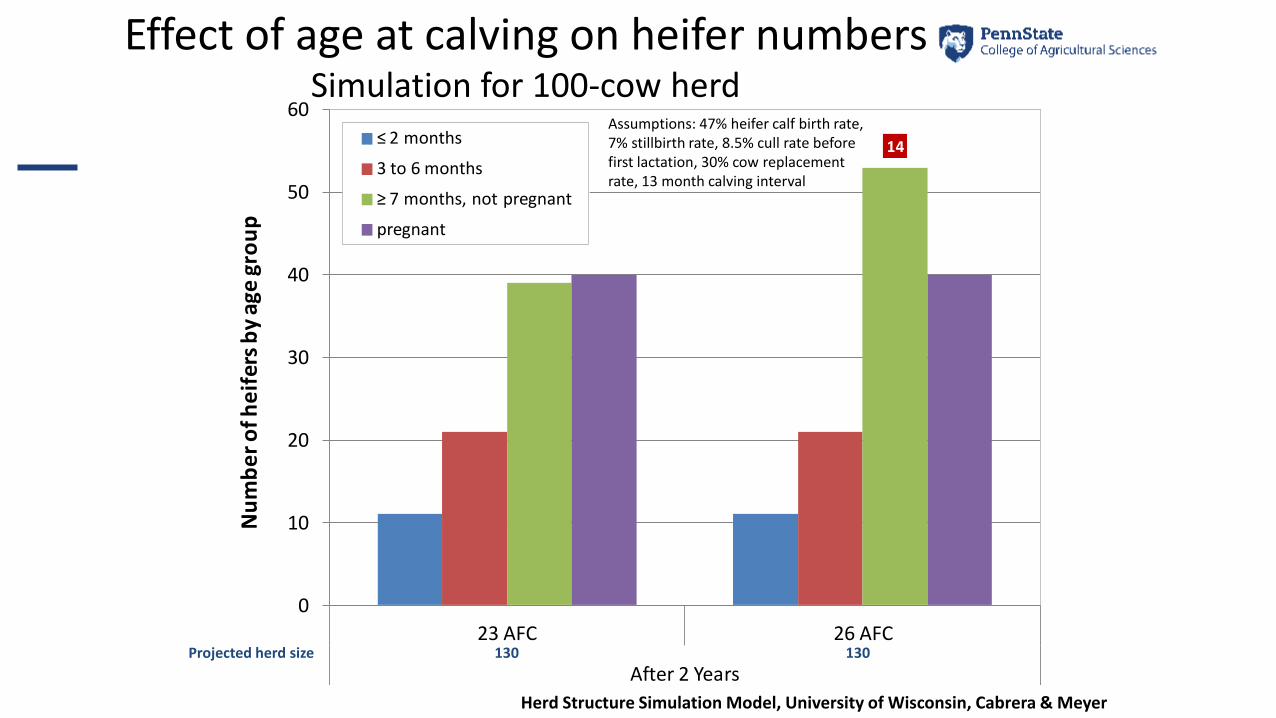
14
0
10
20
30
40
50
60
23 AFC 26 AFC
After 2 Years
Nu
mb
er
of h
eif
ers
by
age
gro
up
≤ 2 months
3 to 6 months
≥ 7 months, not pregnant
pregnant
Effect of age at calving on heifer numbersSimulation for 100-cow herd
Herd Structure Simulation Model, University of Wisconsin, Cabrera & Meyer
Assumptions: 47% heifer calf birth rate, 7% stillbirth rate, 8.5% cull rate before first lactation, 30% cow replacement rate, 13 month calving interval
Projected herd size 130 130
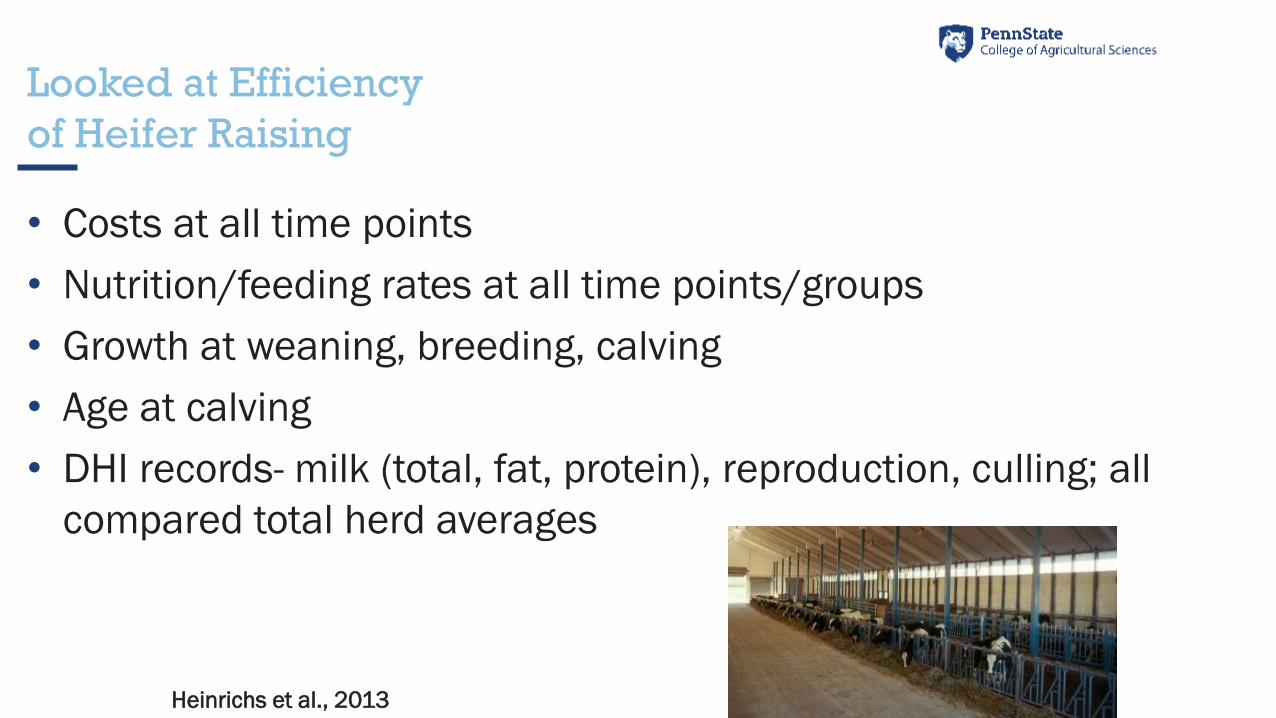
Looked at Efficiency
of Heifer Raising
• Costs at all time points
• Nutrition/feeding rates at all time points/groups
• Growth at weaning, breeding, calving
• Age at calving
• DHI records- milk (total, fat, protein), reproduction, culling; all
compared total herd averages
Heinrichs et al., 2013
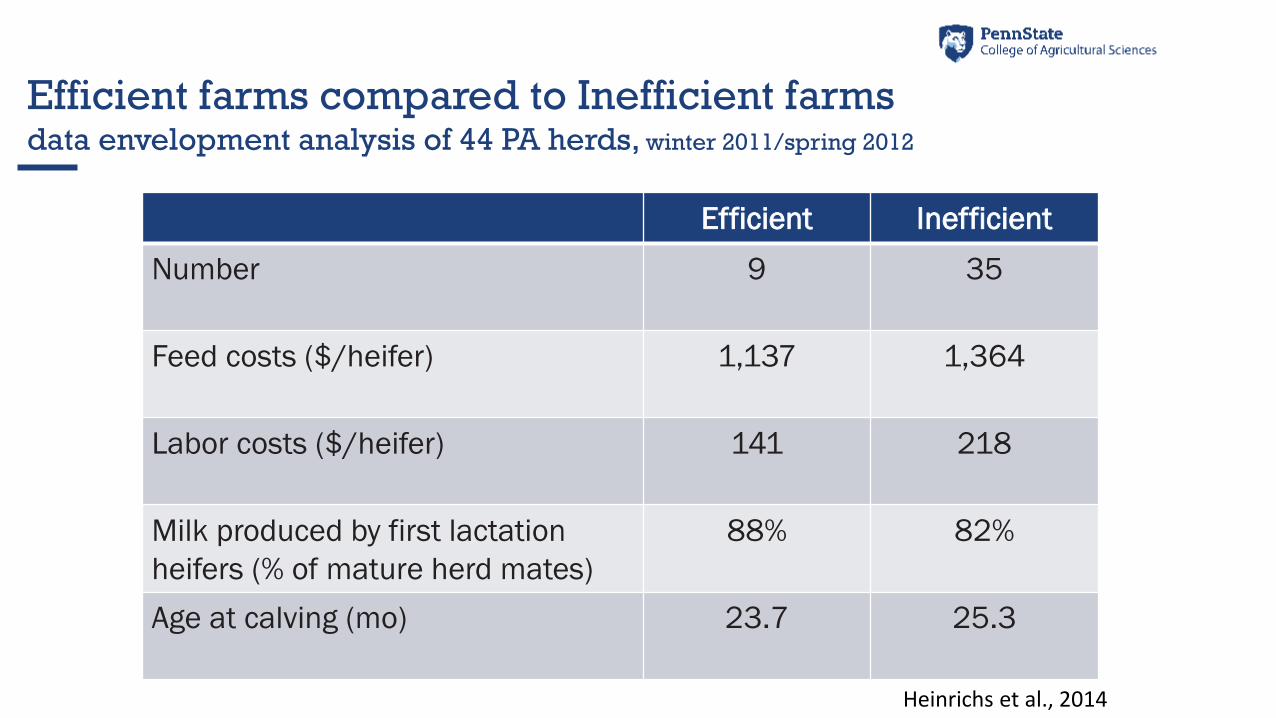
Efficient farms compared to Inefficient farmsdata envelopment analysis of 44 PA herds, winter 2011/spring 2012
Efficient Inefficient
Number 9 35
Feed costs ($/heifer) 1,137 1,364
Labor costs ($/heifer) 141 218
Milk produced by first lactation
heifers (% of mature herd mates)
88% 82%
Age at calving (mo) 23.7 25.3
Heinrichs et al., 2014
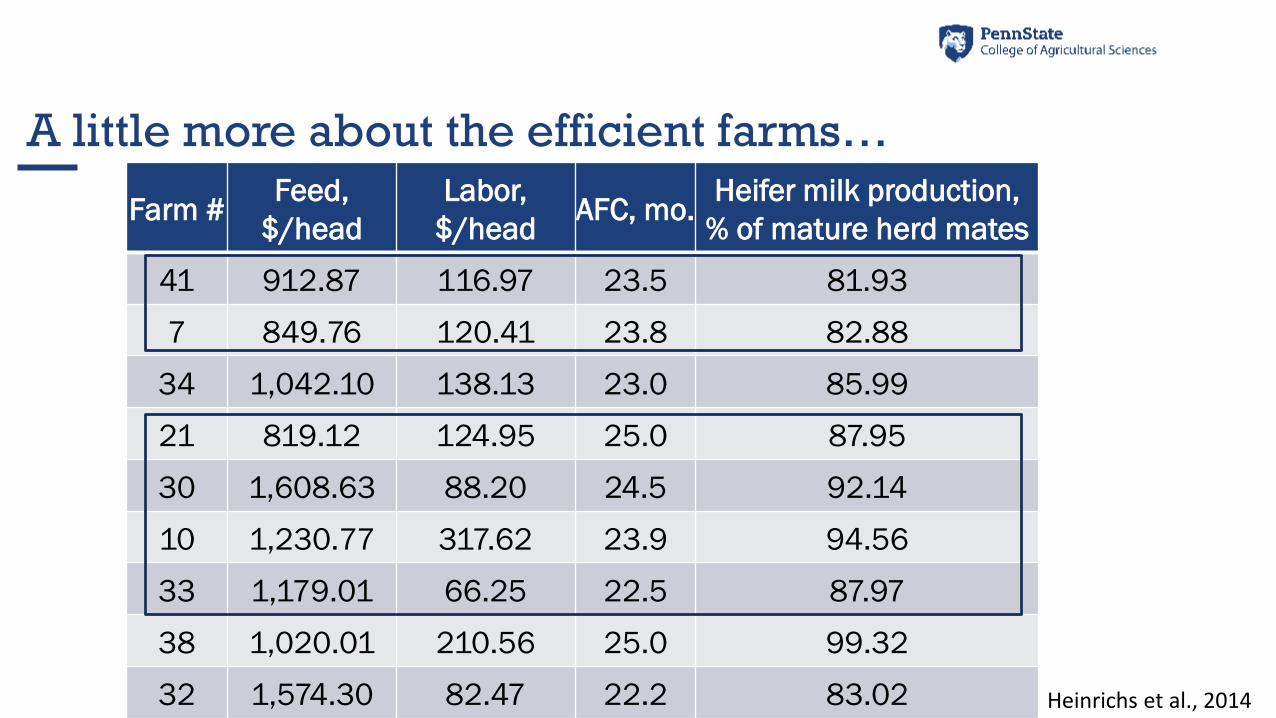
A little more about the efficient farms…
Farm #Feed,
$/head
Labor,
$/headAFC, mo.
Heifer milk production,
% of mature herd mates
41 912.87 116.97 23.5 81.93
7 849.76 120.41 23.8 82.88
34 1,042.10 138.13 23.0 85.99
21 819.12 124.95 25.0 87.95
30 1,608.63 88.20 24.5 92.14
10 1,230.77 317.62 23.9 94.56
33 1,179.01 66.25 22.5 87.97
38 1,020.01 210.56 25.0 99.32
32 1,574.30 82.47 22.2 83.02 Heinrichs et al., 2014
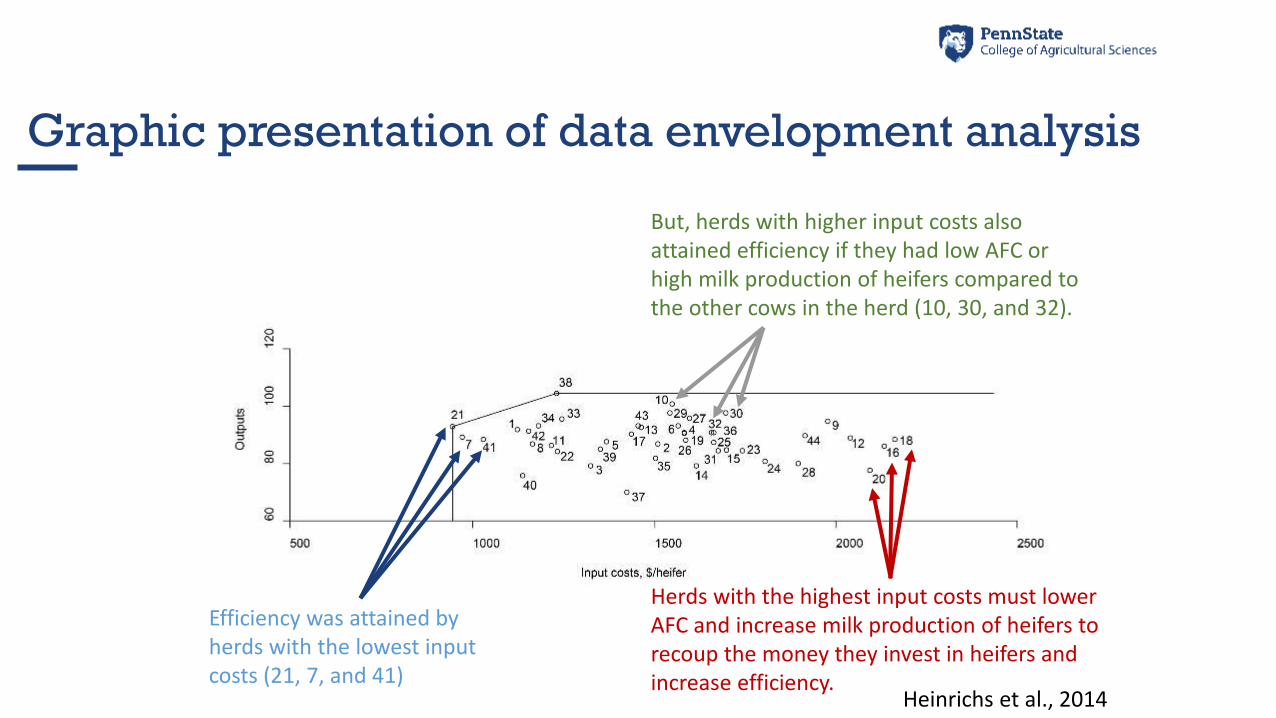
Graphic presentation of data envelopment analysis
Efficiency was attained by herds with the lowest input costs (21, 7, and 41)
But, herds with higher input costs also attained efficiency if they had low AFC or high milk production of heifers compared to the other cows in the herd (10, 30, and 32).
Heinrichs et al., 2014
Herds with the highest input costs must lower AFC and increase milk production of heifers to recoup the money they invest in heifers and increase efficiency.
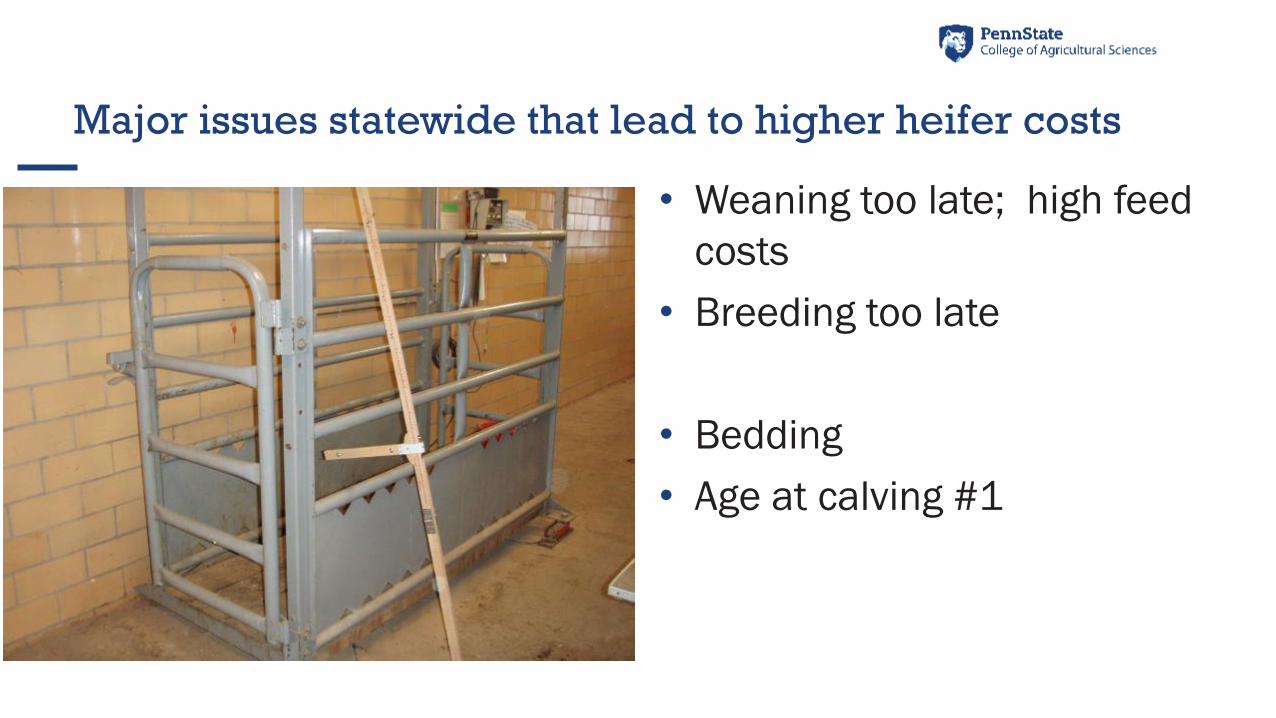
Major issues statewide that lead to higher heifer costs
• Weaning too late; high feed
costs
• Breeding too late
• Bedding
• Age at calving #1
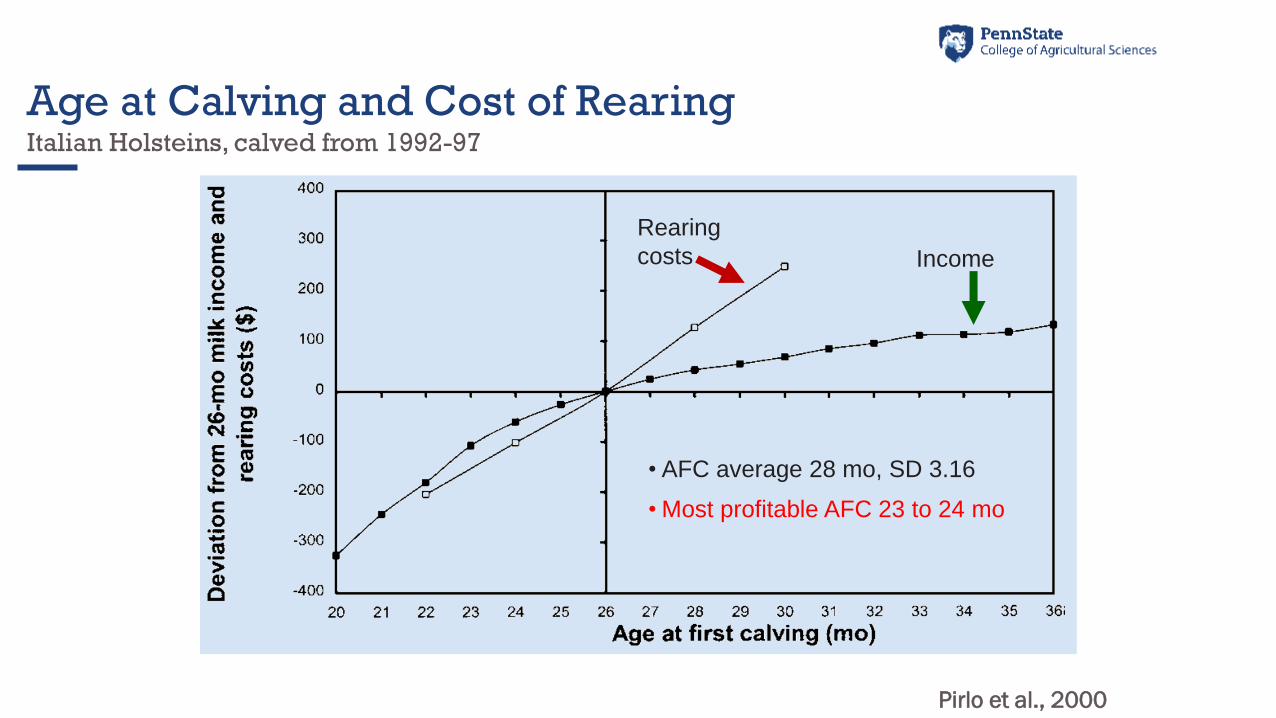
Age at Calving and Cost of RearingItalian Holsteins, calved from 1992-97
• AFC average 28 mo, SD 3.16
• Most profitable AFC 23 to 24 mo
Rearing
costs Income
Pirlo et al., 2000
• Herd culling rate
o 20% costs 24.6%
o 25% insufficient heifers
• Age at first calving
o 1 mo AFC costs 4.3%
What affects the costs of raising
replacement dairy heifers: A multiple component analysis (Tozer and Heinrichs, 2001)
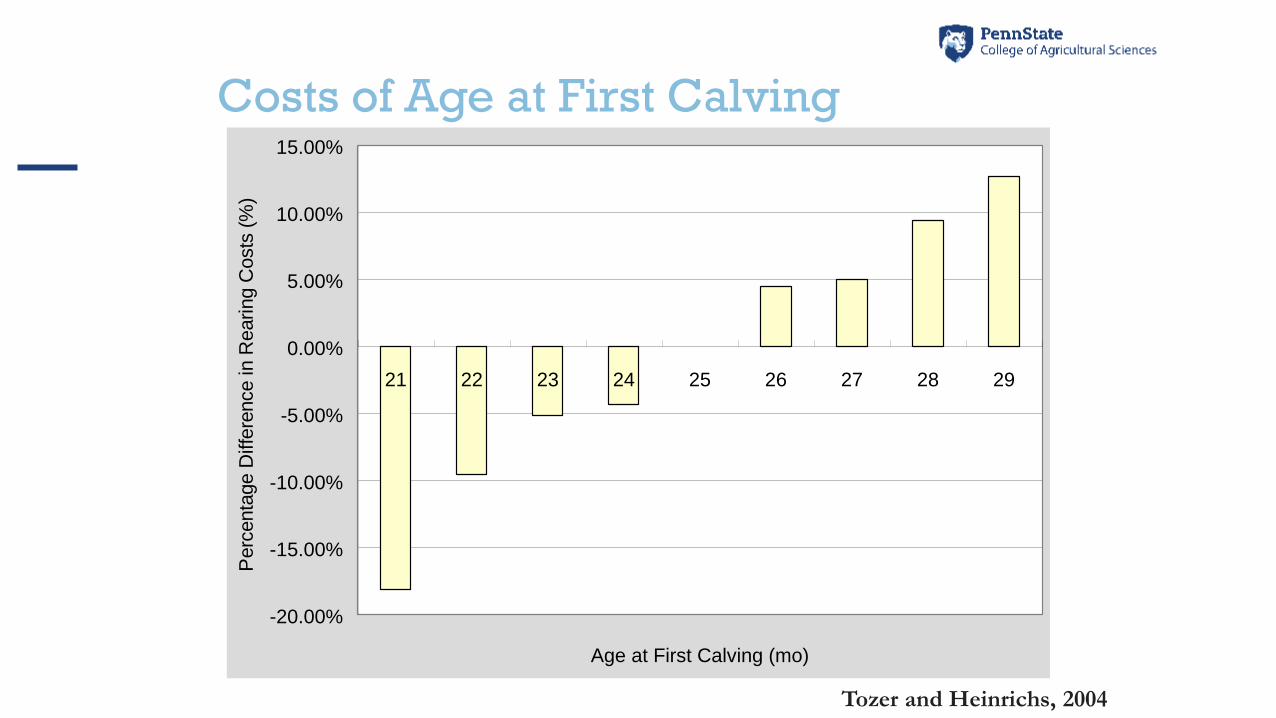
Tozer and Heinrichs, 2004
Costs of Age at First Calving
-20.00%
-15.00%
-10.00%
-5.00%
0.00%
5.00%
10.00%
15.00%
21 22 23 24 25 26 27 28 29
Age at First Calving (mo)
Perc
enta
ge D
iffe
rence in R
earing C
osts
(%
)
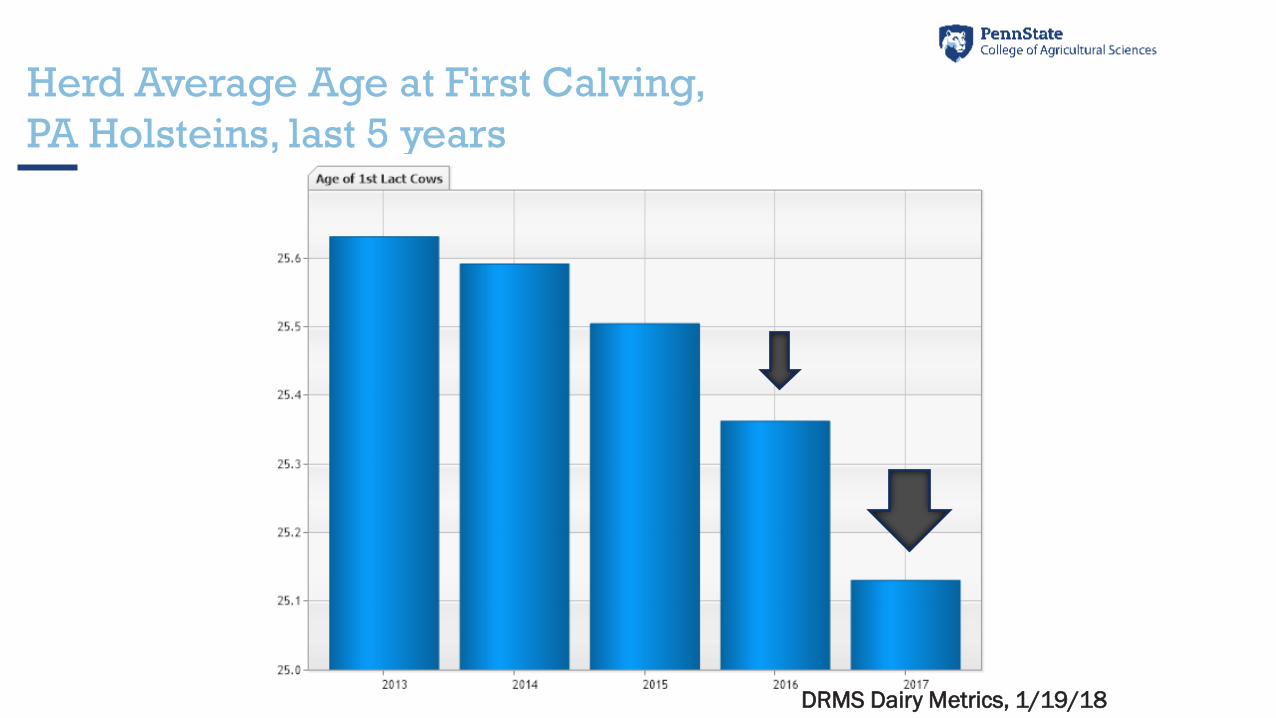
Herd Average Age at First Calving,
PA Holsteins, last 5 years
DRMS Dairy Metrics, 1/19/18

Distribution of age at first calving in PA
Holsteins, 2002 v. 2017
0.0%
5.0%
10.0%
15.0%
20.0%
25.0%
30.0%
18 19 20 21 22 23 24 25 26 27 28 29 30He
ife
rs a
t e
ach
age
, %
of
tota
l
Age at first calving, months
2017 2002
DRMS data
Heifers with AFC of 21 – 24 mo2002 – 31.1% 2017 – 63.4%
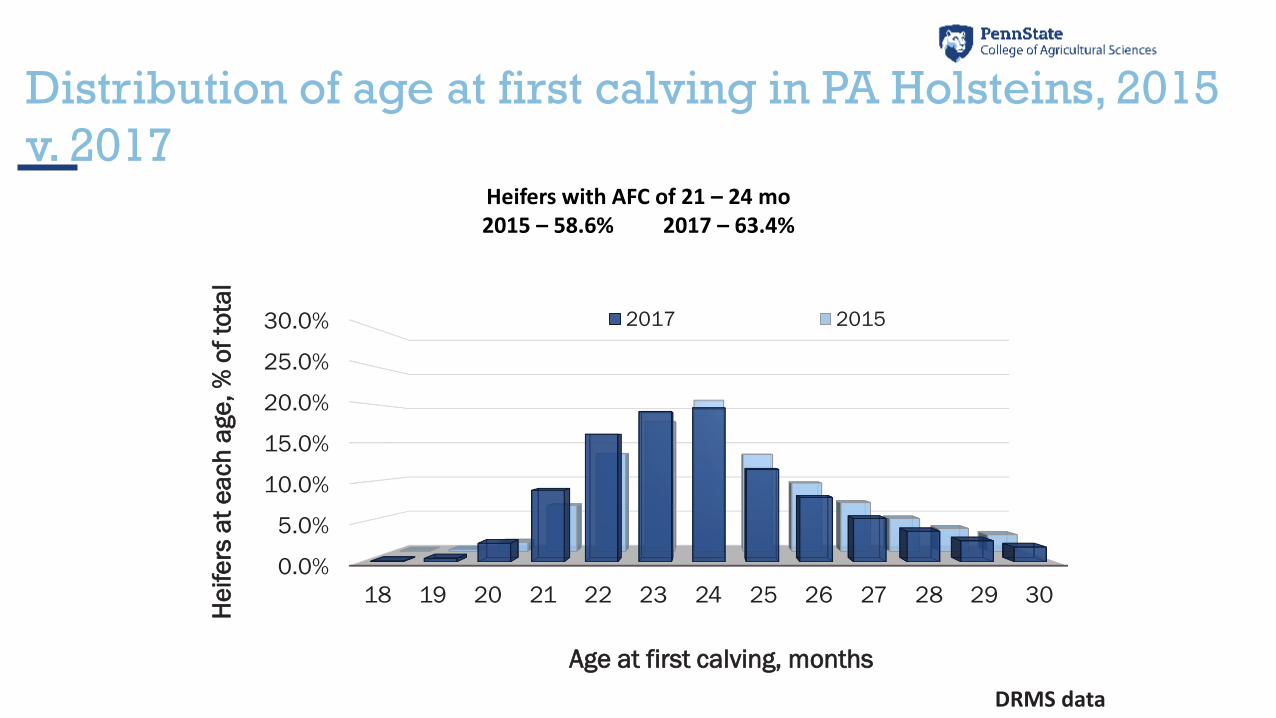
Distribution of age at first calving in PA Holsteins, 2015
v. 2017
0.0%
5.0%
10.0%
15.0%
20.0%
25.0%
30.0%
18 19 20 21 22 23 24 25 26 27 28 29 30
He
ife
rs a
t e
ach
age
, %
of
tota
l
Age at first calving, months
2017 2015
DRMS data
Heifers with AFC of 21 – 24 mo2015 – 58.6% 2017 – 63.4%
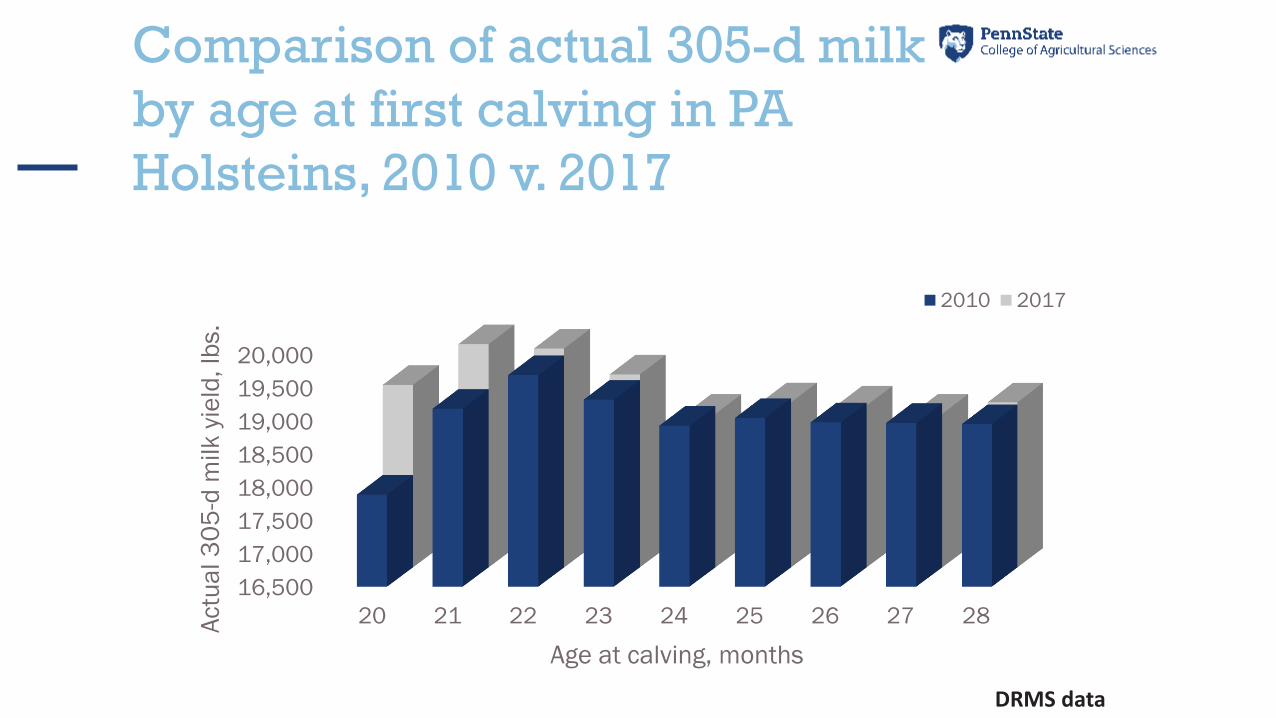
Comparison of actual 305-d milk
by age at first calving in PA
Holsteins, 2010 v. 2017
16,500
17,000
17,500
18,000
18,500
19,000
19,500
20,000
20 21 22 23 24 25 26 27 28Actu
al 3
05
-d m
ilk
yie
ld, lb
s.
Age at calving, months
2010 2017
DRMS data
Heifer Health Events are Critical
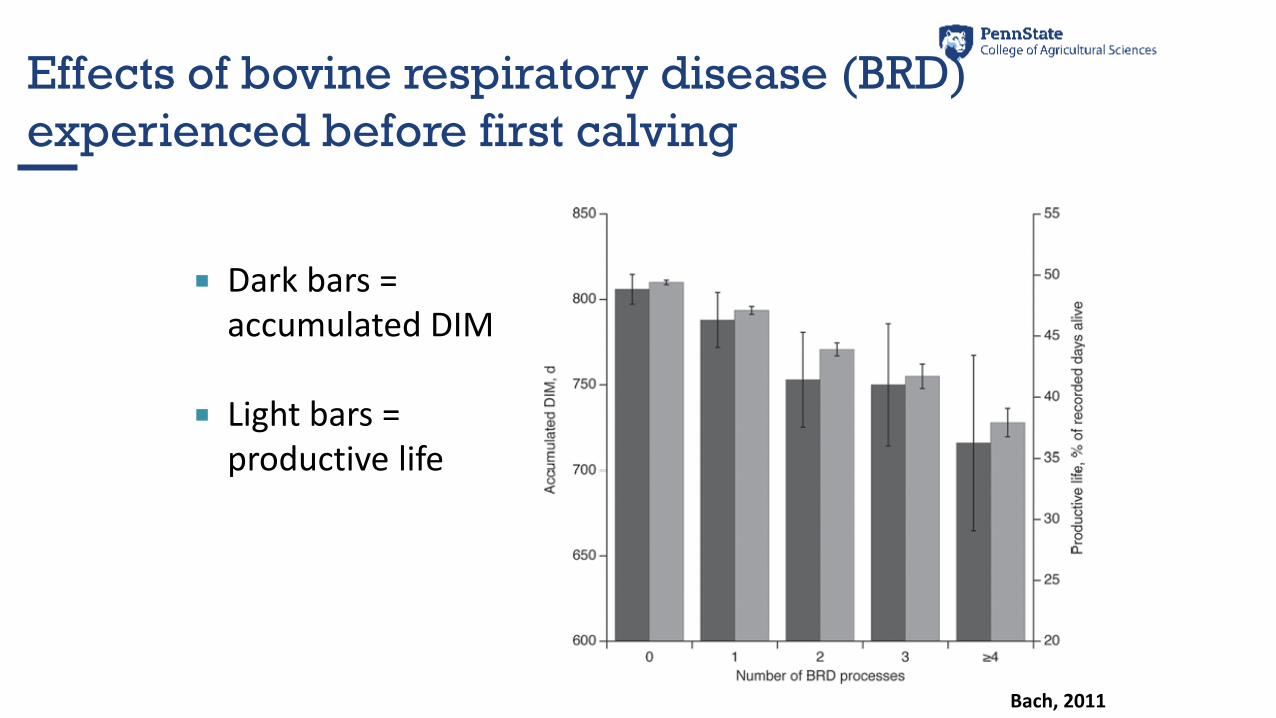
Effects of bovine respiratory disease (BRD)
experienced before first calving
Bach, 2011
Dark bars = accumulated DIM
Light bars = productive life
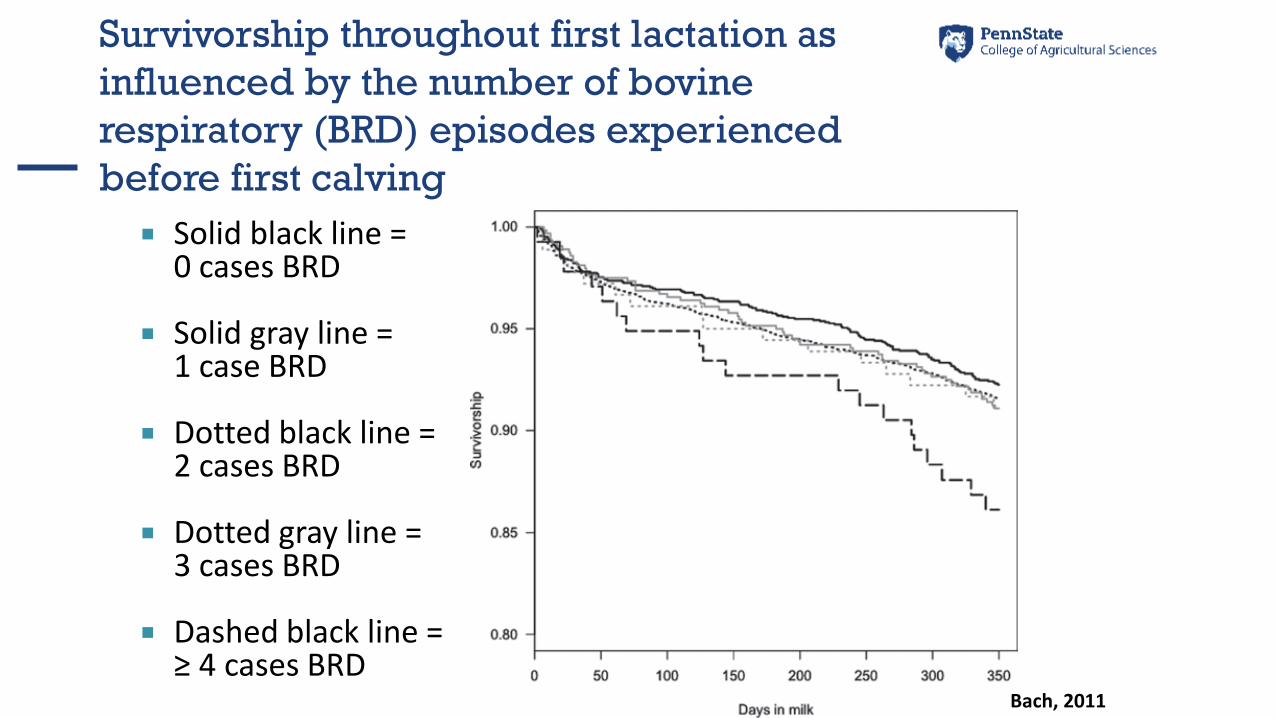
Survivorship throughout first lactation as
influenced by the number of bovine
respiratory (BRD) episodes experienced
before first calving
Solid black line = 0 cases BRD
Solid gray line = 1 case BRD
Dotted black line = 2 cases BRD
Dotted gray line = 3 cases BRD
Dashed black line = ≥ 4 cases BRD
Bach, 2011
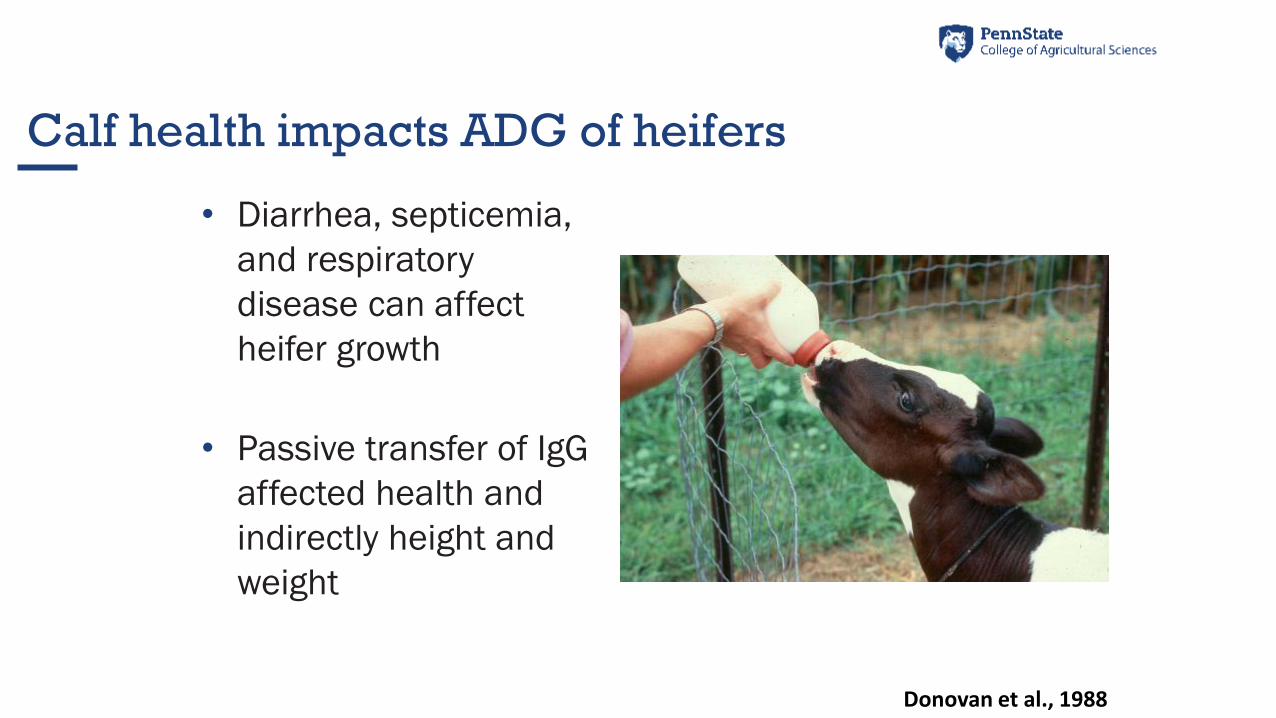
Calf health impacts ADG of heifers
• Diarrhea, septicemia,
and respiratory
disease can affect
heifer growth
• Passive transfer of IgG
affected health and
indirectly height and
weight
Donovan et al., 1988
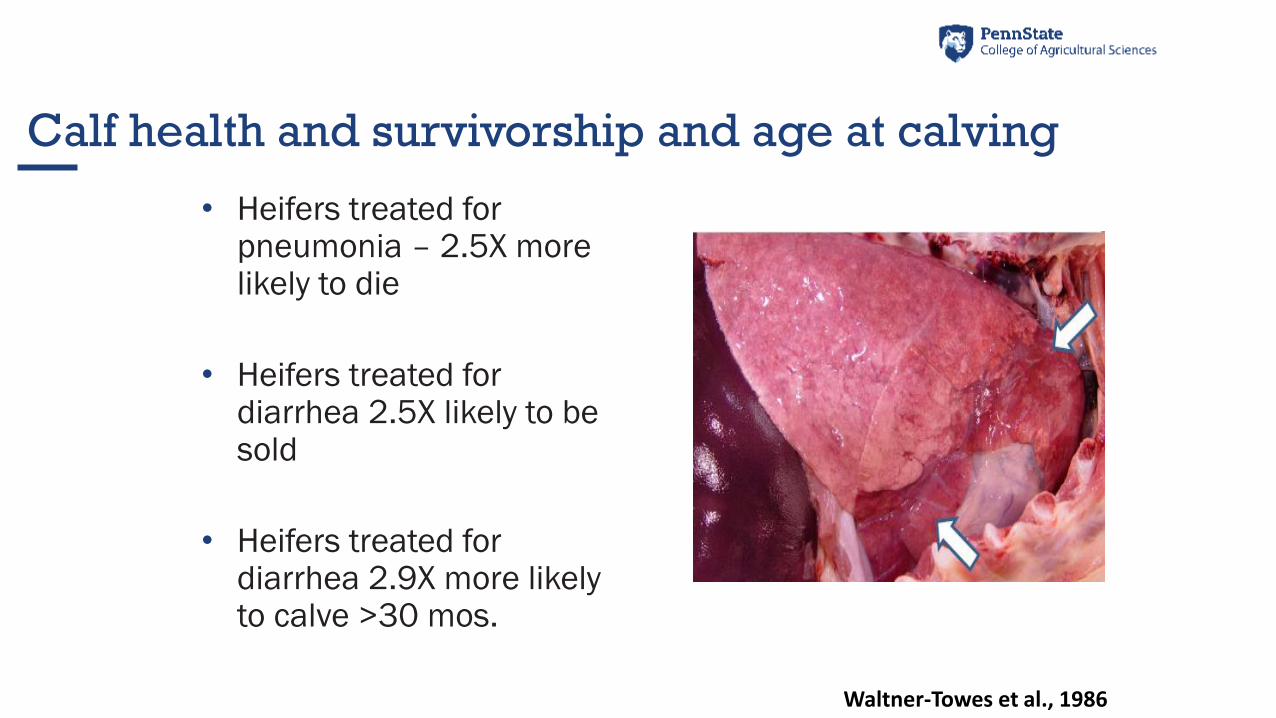
Calf health and survivorship and age at calving
• Heifers treated for pneumonia – 2.5X more likely to die
• Heifers treated for diarrhea 2.5X likely to be sold
• Heifers treated for diarrhea 2.9X more likely to calve >30 mos.
Waltner-Towes et al., 1986
Summary
• Goal of raising dairy heifers is to minimize costs without
sacrificing future productive potential
o Age at first calving 22-24 mo
• Several management systems can work well
o Choice depends on individual farm facilities, resources, and
management preferences
What is needed
• Beef crosses (which ones, market value)
• “don’t put eggs in 1 basket”
• Back calculate needs in age groups
In Summary
• Need to know the numbers
o Cost to raise heifers at various stages
o Current metrics impacting cow flow
o Current metrics impacting available heifers
• Current and future goals
o Plan for possible bumps in the road
• No single answer fits every farm
Credits
“cows-calves-calf-farm-ag-1235910” by CLM-bv. Pixabay.com. cc0.
“cow-calf-mama-farm-animal-beef-2125856” by maryconnealy Pixabay.com cc0.
“problem-analysis-solution-hand-67054” by geralt. Pixabay.com cc0.
“question-mark-important-sign-1872634” by qimono. Pixabay.com cc0.
“brown-eggs-breakfast-nutrition-food-3217675” by jill111. Pixabay.com cc0.
Penn State College of Agricultural Sciences research and extension programs are funded in part by Pennsylvania counties, the Commonwealth of Pennsylvania, and the U.S. Department of Agriculture.
Where trade names appear, no discrimination is intended, and no endorsement by Penn State Extension is implied.
The Pennsylvania State University encourages qualified persons with disabilities to participate in its programs and activities. If you anticipate needing any type of accommodation or have questions about the physical access provided, please contact Rob Goodling in advance of your participation or visit.
This publication is available in alternative media on request.
The University is committed to equal access to programs, facilities, admission, and employment for all persons. It is the policy of the University to maintain an environment free of harassment and free of discrimination against any person because of age, race, color, ancestry, national origin, religion, creed, service in the uniformed services (as defined in state and federal law), veteran status, sex, sexual orientation, marital or family status, pregnancy, pregnancy-related conditions, physical or mental disability, gender, perceived gender, gender identity, genetic information, or political ideas. Discriminatory conduct and harassment, as well as sexual misconduct and relationship violence, violates the dignity of individuals, impedes the realization of the University’s educational mission, and will not be tolerated. Direct all inquiries regarding the nondiscrimination policy to Dr. Kenneth Lehrman III, Vice Provost for Affirmative Action, Affirmative Action Office, The Pennsylvania State University, 328 Boucke Building, University Park, PA 16802-5901; Email: [email protected]; Tel 814-863-0471.
Dietary Protein: How Low Can We Go?AFRI Grant: 2012-67015-19464
M. D. HaniganDept. of Dairy Science
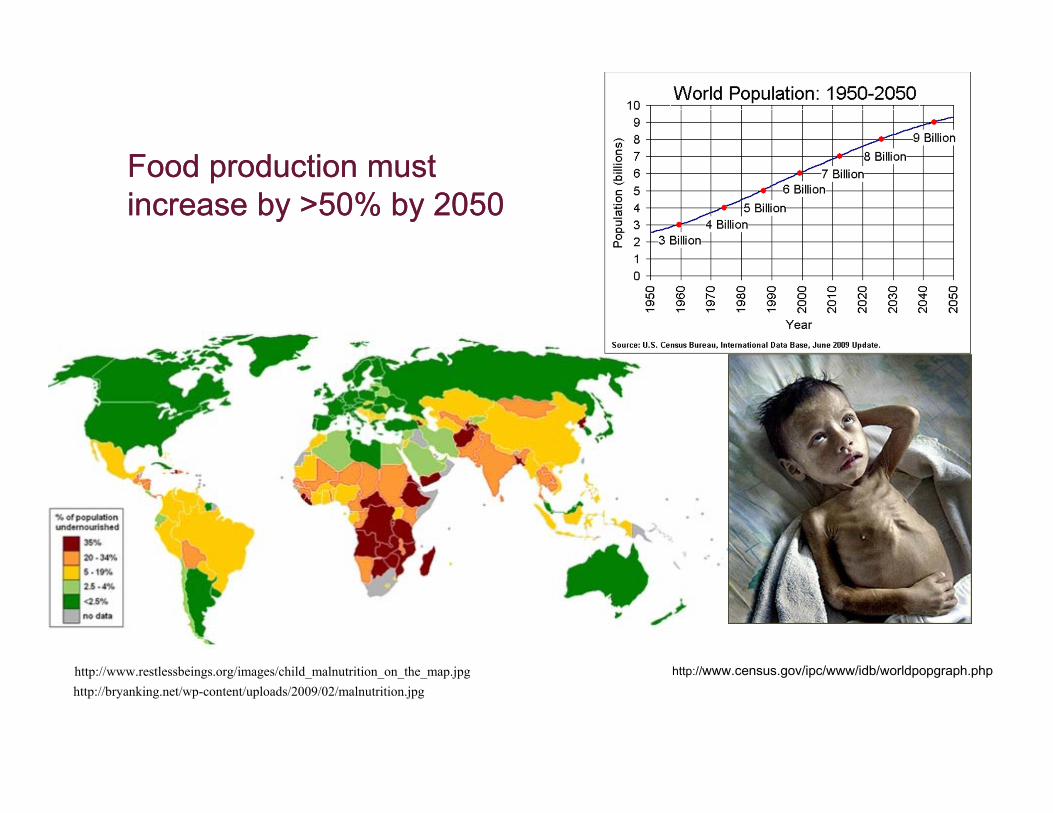
Food production must increase by >50% by 2050Food production must increase by >50% by 2050
http://www.restlessbeings.org/images/child_malnutrition_on_the_map.jpghttp://bryanking.net/wp-content/uploads/2009/02/malnutrition.jpg
http://www.census.gov/ipc/www/idb/worldpopgraph.php
2
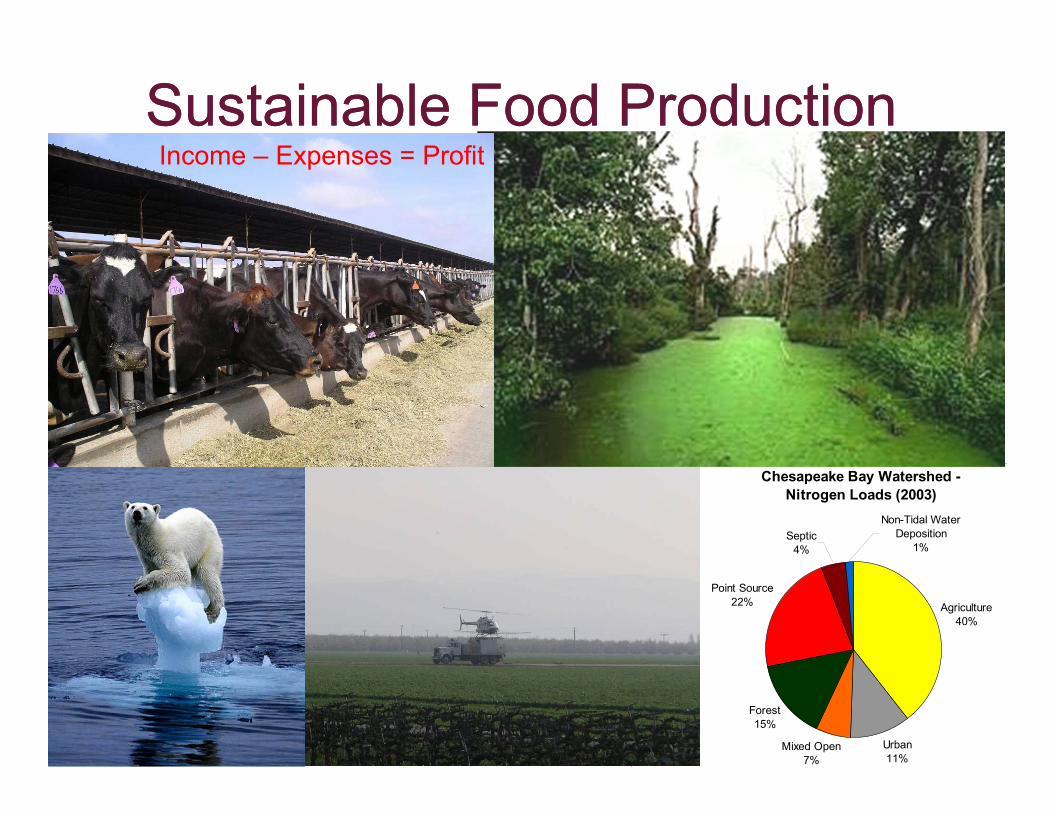
Sustainable Food ProductionSustainable Food Production
Chesapeake Bay Watershed - Nitrogen Loads (2003)
Agriculture40%
Urban11%
Mixed Open7%
Forest15%
Point Source22%
Septic4%
Non-Tidal Water Deposition
1%
Income – Expenses = Profit
4
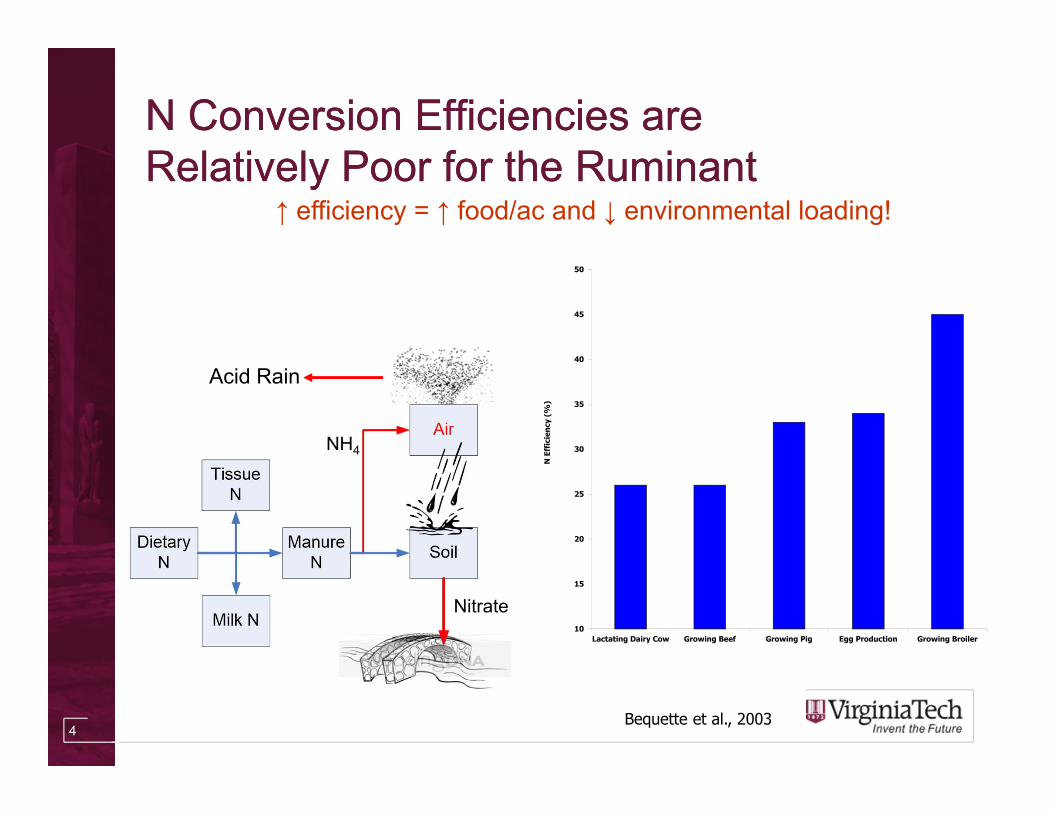
N Conversion Efficiencies are Relatively Poor for the RuminantN Conversion Efficiencies are Relatively Poor for the Ruminant
10
15
20
25
30
35
40
45
50
Lactating Dairy Cow Growing Beef Growing Pig Egg Production Growing Broiler
N E
ffic
ienc
y (%
)
Bequette et al., 2003
Acid Rain
Nitrate
NH4
↑ efficiency = ↑ food/ac and ↓ environmental loading!
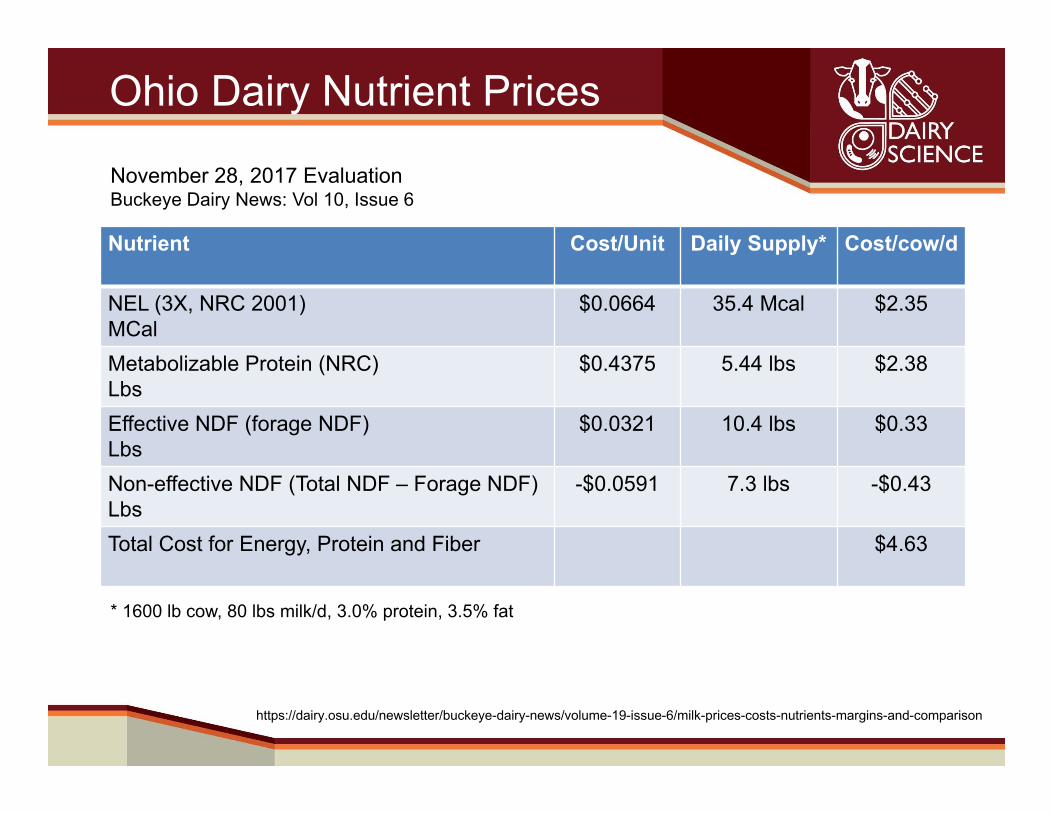
Ohio Dairy Nutrient Prices
Nutrient Cost/Unit Daily Supply* Cost/cow/d
NEL (3X, NRC 2001)MCal
$0.0664 35.4 Mcal $2.35
Metabolizable Protein (NRC)Lbs
$0.4375 5.44 lbs $2.38
Effective NDF (forage NDF)Lbs
$0.0321 10.4 lbs $0.33
Non-effective NDF (Total NDF – Forage NDF)Lbs
-$0.0591 7.3 lbs -$0.43
Total Cost for Energy, Protein and Fiber $4.63
* 1600 lb cow, 80 lbs milk/d, 3.0% protein, 3.5% fat
https://dairy.osu.edu/newsletter/buckeye-dairy-news/volume-19-issue-6/milk-prices-costs-nutrients-margins-and-comparison
November 28, 2017 EvaluationBuckeye Dairy News: Vol 10, Issue 6
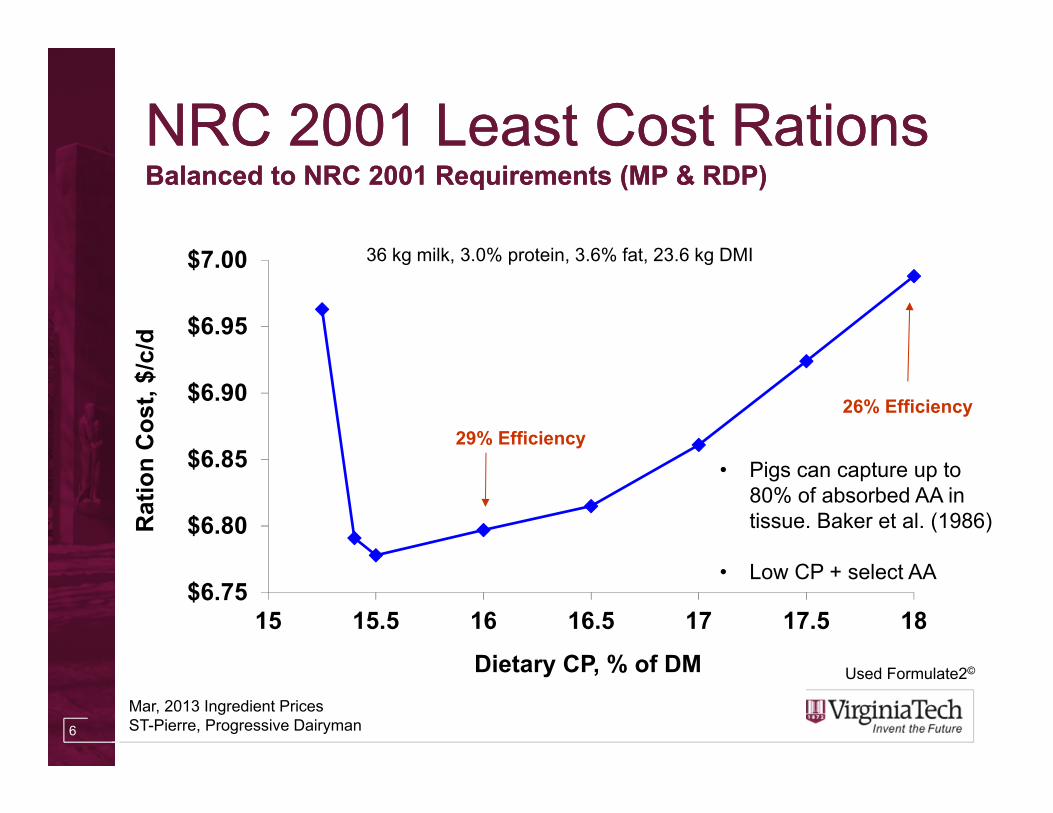
NRC 2001 Least Cost RationsBalanced to NRC 2001 Requirements (MP & RDP)NRC 2001 Least Cost RationsBalanced to NRC 2001 Requirements (MP & RDP)
6
$6.75
$6.80
$6.85
$6.90
$6.95
$7.00
15 15.5 16 16.5 17 17.5 18
Rat
ion
Cos
t, $/
c/d
Dietary CP, % of DM
29% Efficiency26% Efficiency
Mar, 2013 Ingredient Prices ST-Pierre, Progressive Dairyman
36 kg milk, 3.0% protein, 3.6% fat, 23.6 kg DMI
Used Formulate2©
• Pigs can capture up to 80% of absorbed AA in tissue. Baker et al. (1986)
• Low CP + select AA
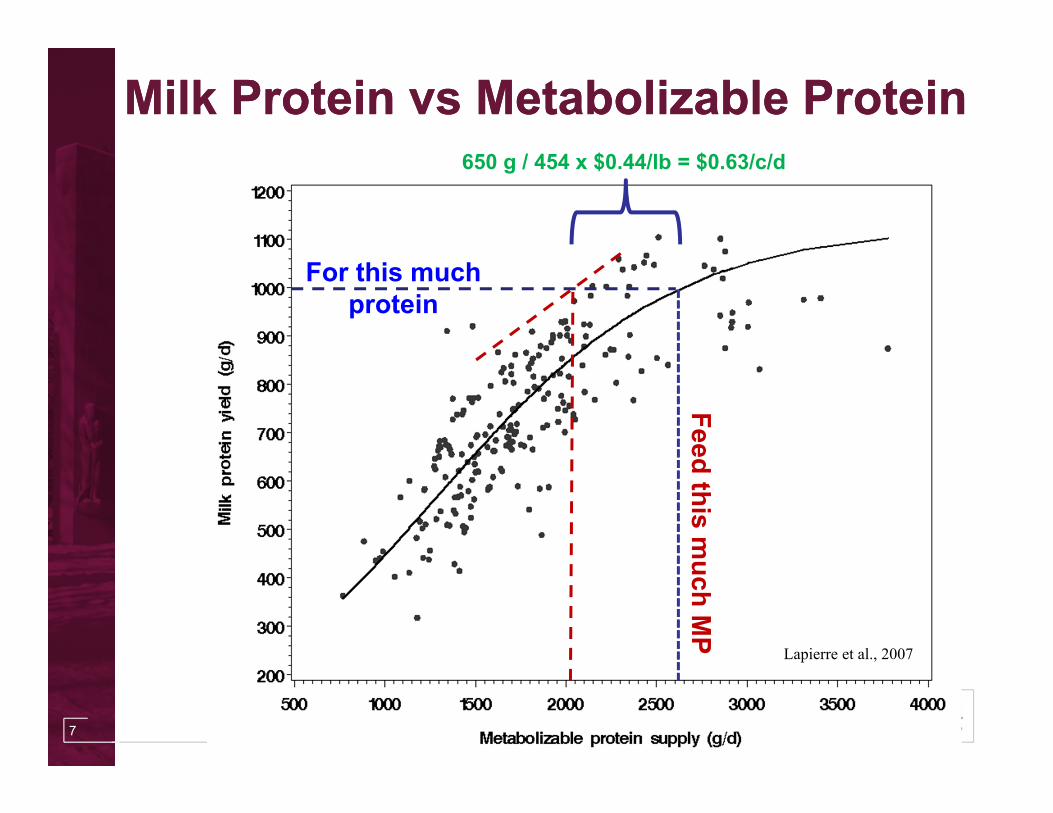
Lapierre et al., 2007
Milk Protein vs Metabolizable ProteinMilk Protein vs Metabolizable Protein
For this much protein
Feed this much M
P
7
650 g / 454 x $0.44/lb = $0.63/c/d
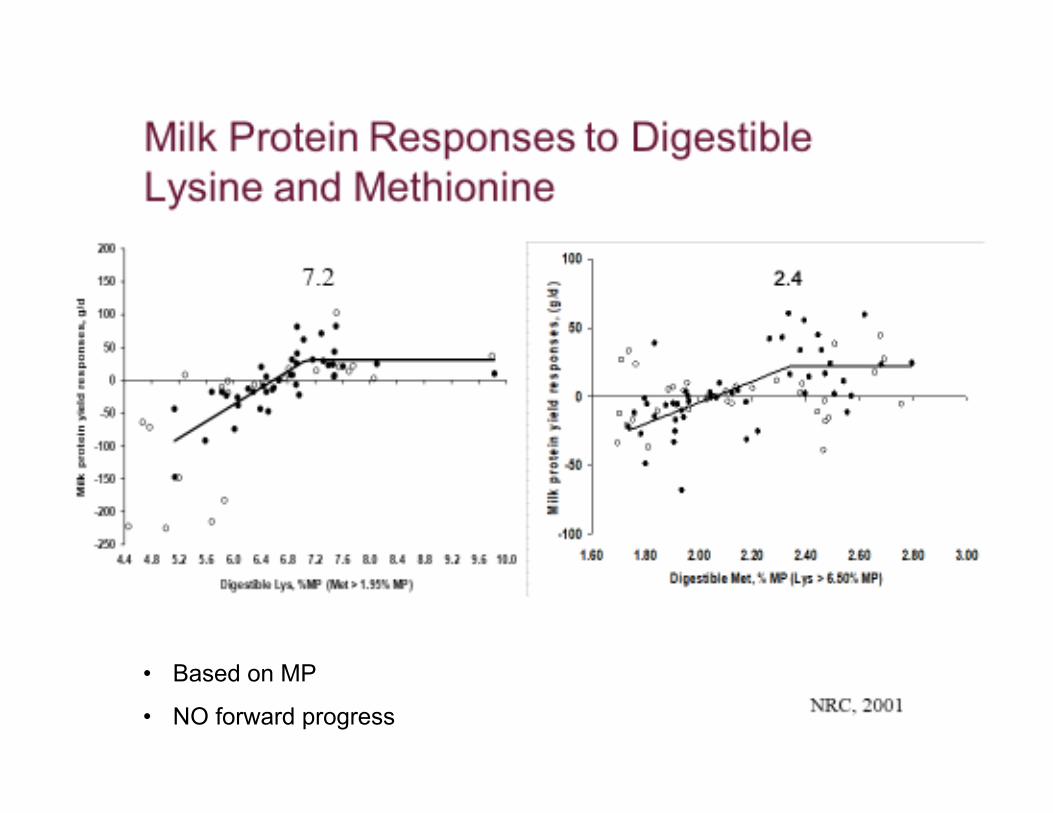
• Based on MP
• NO forward progress
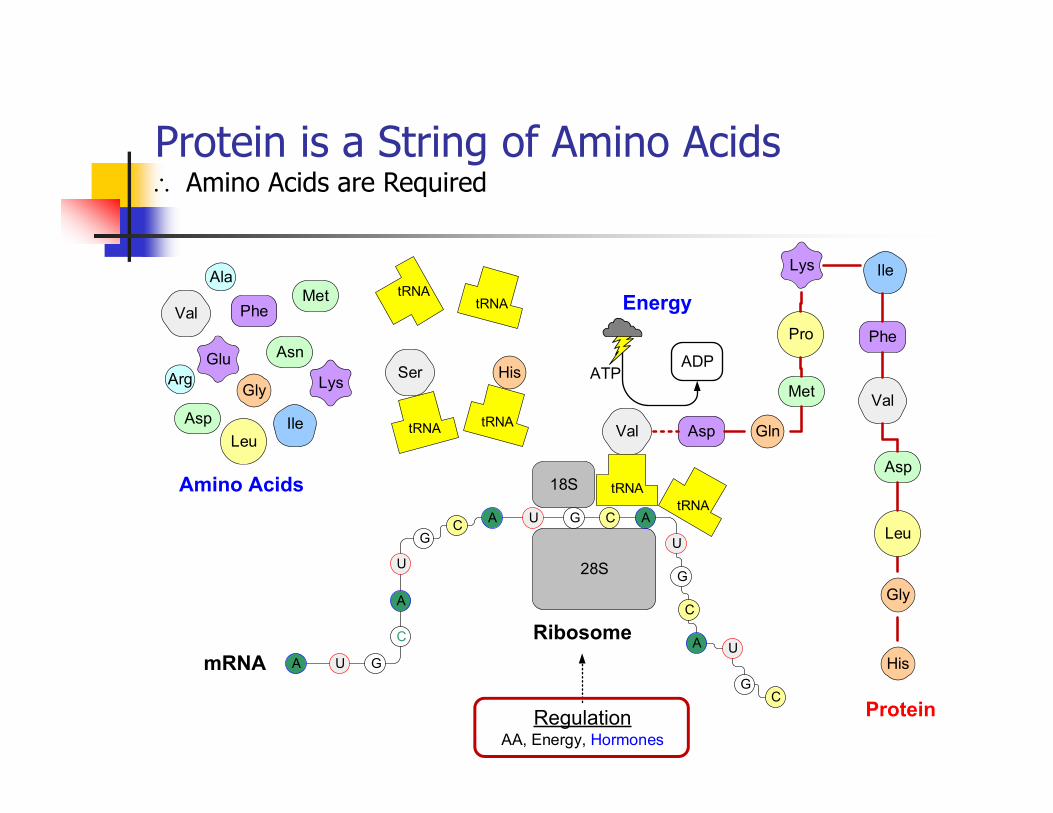
Protein is a String of Amino Acids Amino Acids are Required
Met
Gln
Pro
Ala
Val
Glu
Asp
18S
28S
A U
GC
A U G
C
A
U
GC A U G C A
U
G
C
AsnHis
Leu
SerLysArg
IleAsp
Gly
Val Phe
ADP
Amino Acids
Energy
mRNA
Protein
Ribosome
ATP
RegulationAA, Energy, Hormones
tRNA
Lys Ile
Phe
Val
Asp
Gly
His
Leu
Met
10
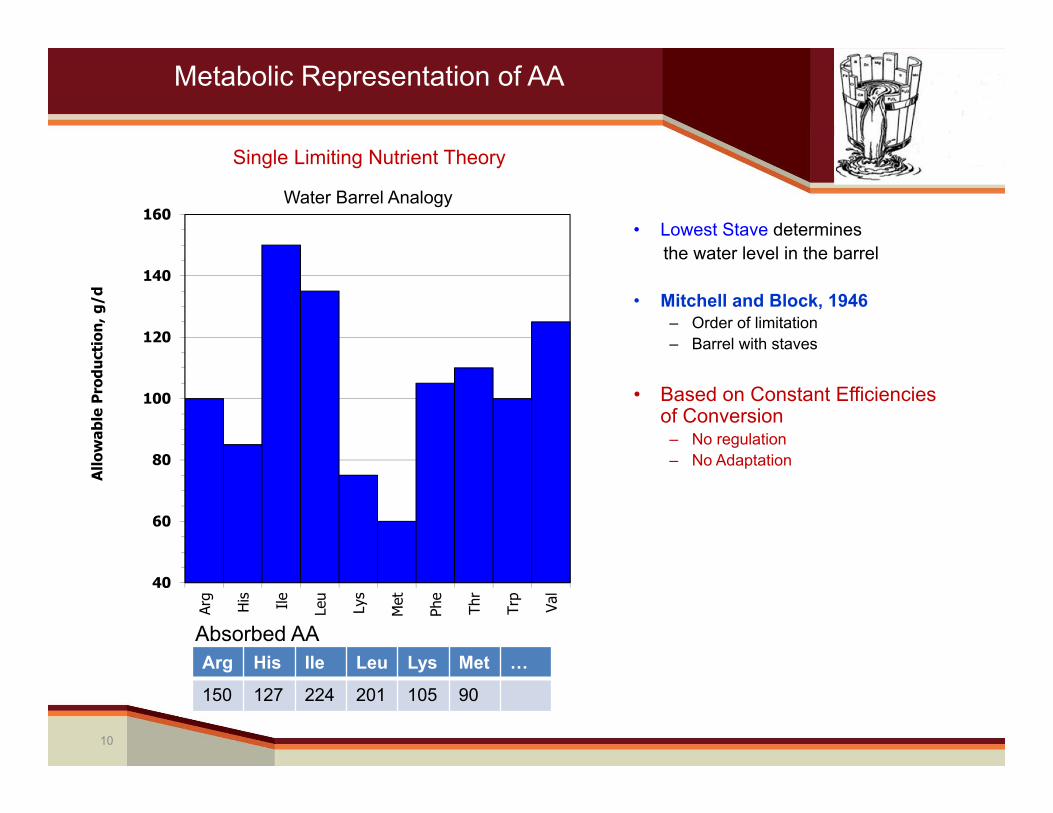
Metabolic Representation of AA
Single Limiting Nutrient Theory
40
60
80
100
120
140
160Ar
g
His Ile Leu
Lys
Met
Phe
Thr
Trp
Val
Allo
wab
le P
rodu
ctio
n, g
/d
• Lowest Stave determinesthe water level in the barrel
• Mitchell and Block, 1946– Order of limitation– Barrel with staves
• Based on Constant Efficiencies of Conversion
– No regulation– No Adaptation
Water Barrel Analogy
Arg His Ile Leu Lys Met …
150 127 224 201 105 90
Absorbed AA
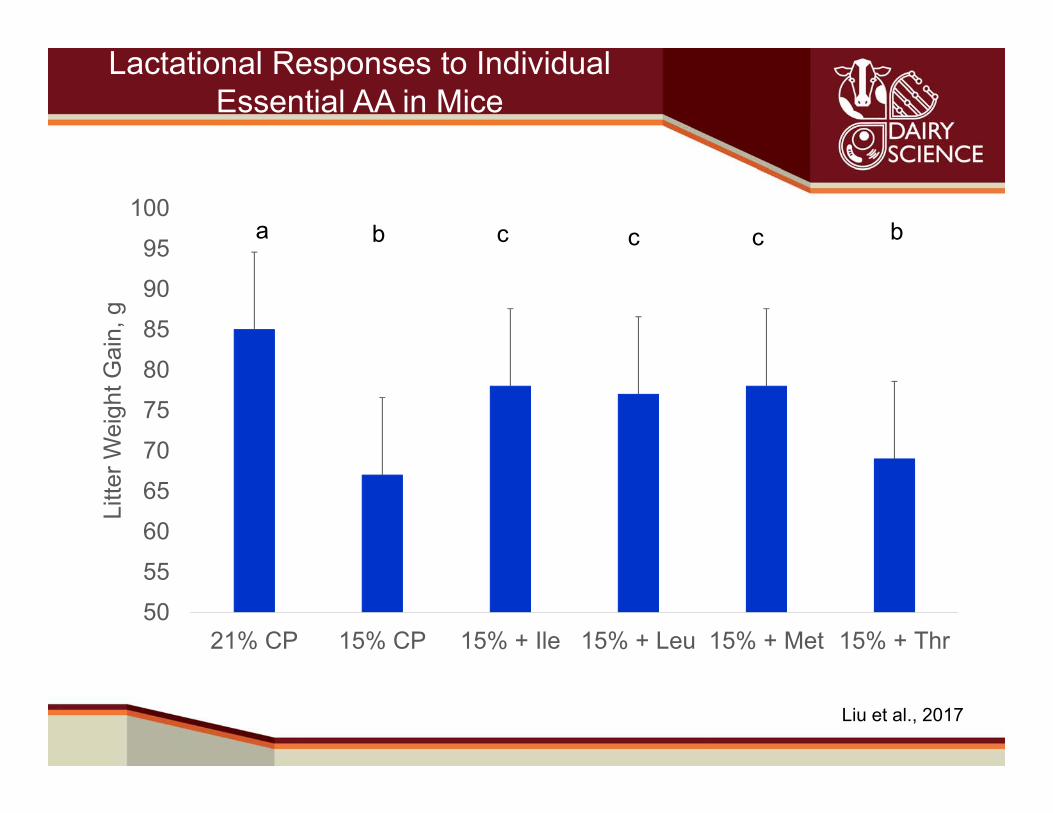
Lactational Responses to Individual Essential AA in Mice
50556065707580859095
100
21% CP 15% CP 15% + Ile 15% + Leu 15% + Met 15% + Thr
Litte
r Wei
ght G
ain,
g
a b c c c b
Liu et al., 2017
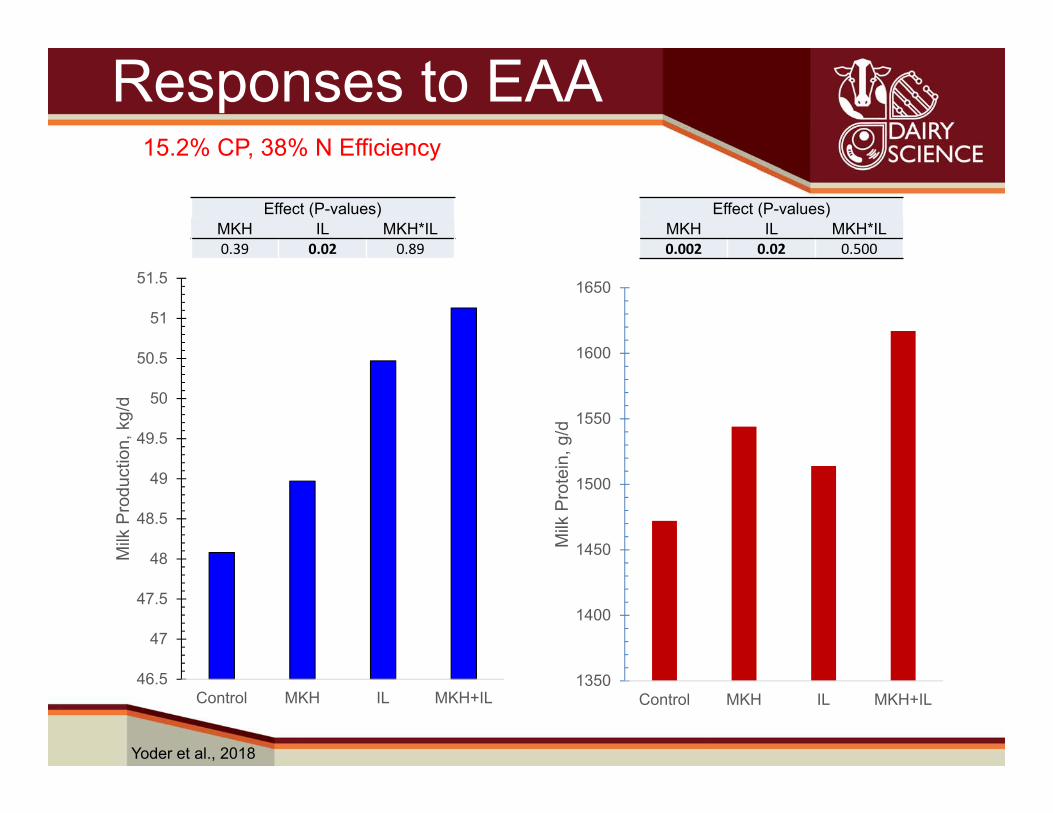
Responses to EAA
46.5
47
47.5
48
48.5
49
49.5
50
50.5
51
51.5
Control MKH IL MKH+IL
Milk
Pro
duct
ion,
kg/
d
1350
1400
1450
1500
1550
1600
1650
Control MKH IL MKH+IL
Milk
Pro
tein
, g/d
Effect (P-values)MKH IL MKH*IL0.39 0.02 0.89
Effect (P-values)MKH IL MKH*IL0.002 0.02 0.500
15.2% CP, 38% N Efficiency
Yoder et al., 2018
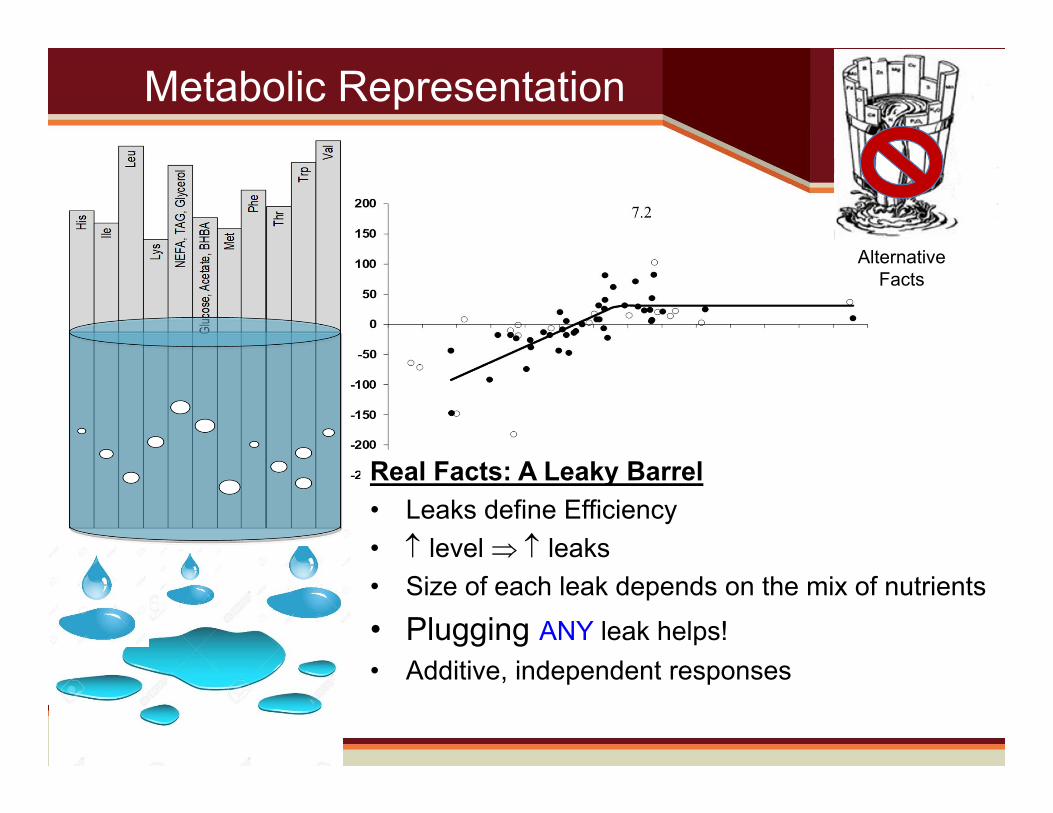
Metabolic Representation
Real Facts: A Leaky Barrel• Leaks define Efficiency• level leaks• Size of each leak depends on the mix of nutrients• Plugging ANY leak helps!• Additive, independent responses
Alternative Facts
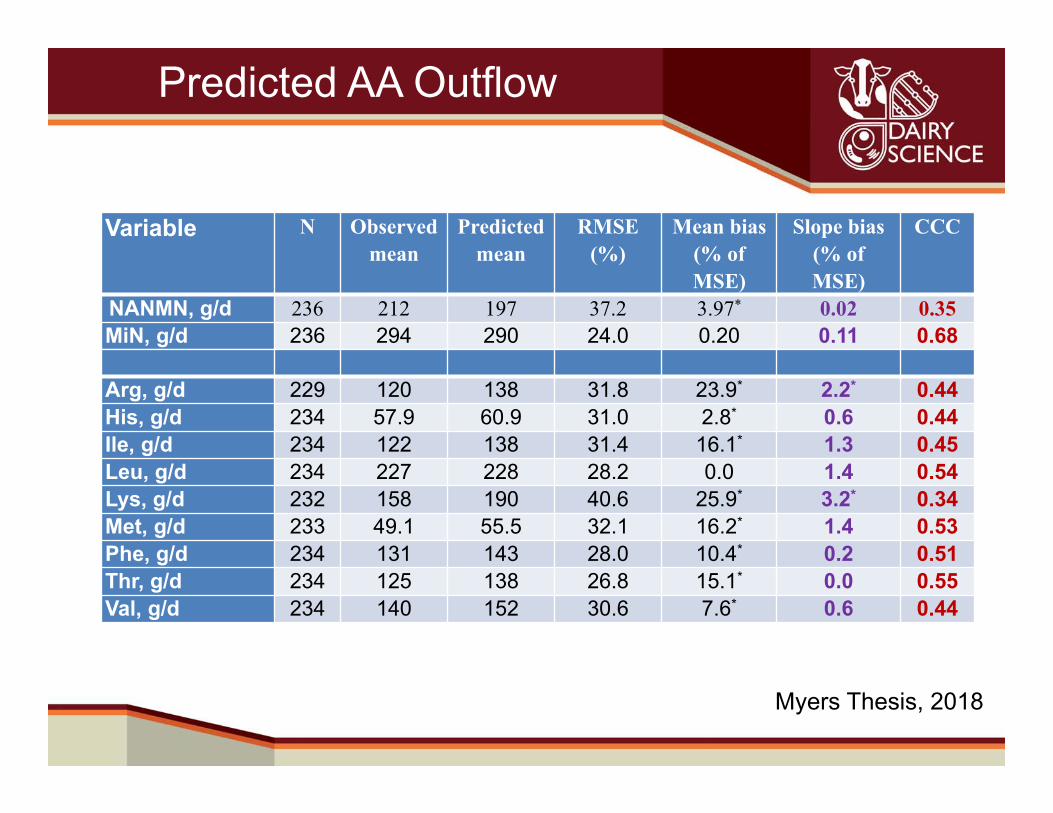
Predicted AA Outflow
Variable N Observed mean
Predicted mean
RMSE(%)
Mean bias (% of MSE)
Slope bias (% of MSE)
CCC
NANMN, g/d 236 212 197 37.2 3.97* 0.02 0.35MiN, g/d 236 294 290 24.0 0.20 0.11 0.68
Myers Thesis, 2018
Arg, g/d 229 120 138 31.8 23.9* 2.2* 0.44His, g/d 234 57.9 60.9 31.0 2.8* 0.6 0.44Ile, g/d 234 122 138 31.4 16.1* 1.3 0.45Leu, g/d 234 227 228 28.2 0.0 1.4 0.54Lys, g/d 232 158 190 40.6 25.9* 3.2* 0.34Met, g/d 233 49.1 55.5 32.1 16.2* 1.4 0.53Phe, g/d 234 131 143 28.0 10.4* 0.2 0.51Thr, g/d 234 125 138 26.8 15.1* 0.0 0.55Val, g/d 234 140 152 30.6 7.6* 0.6 0.44
Other
ArterialAA
LiverPDV
Absorbed AA
Marmmary
Milk Protein
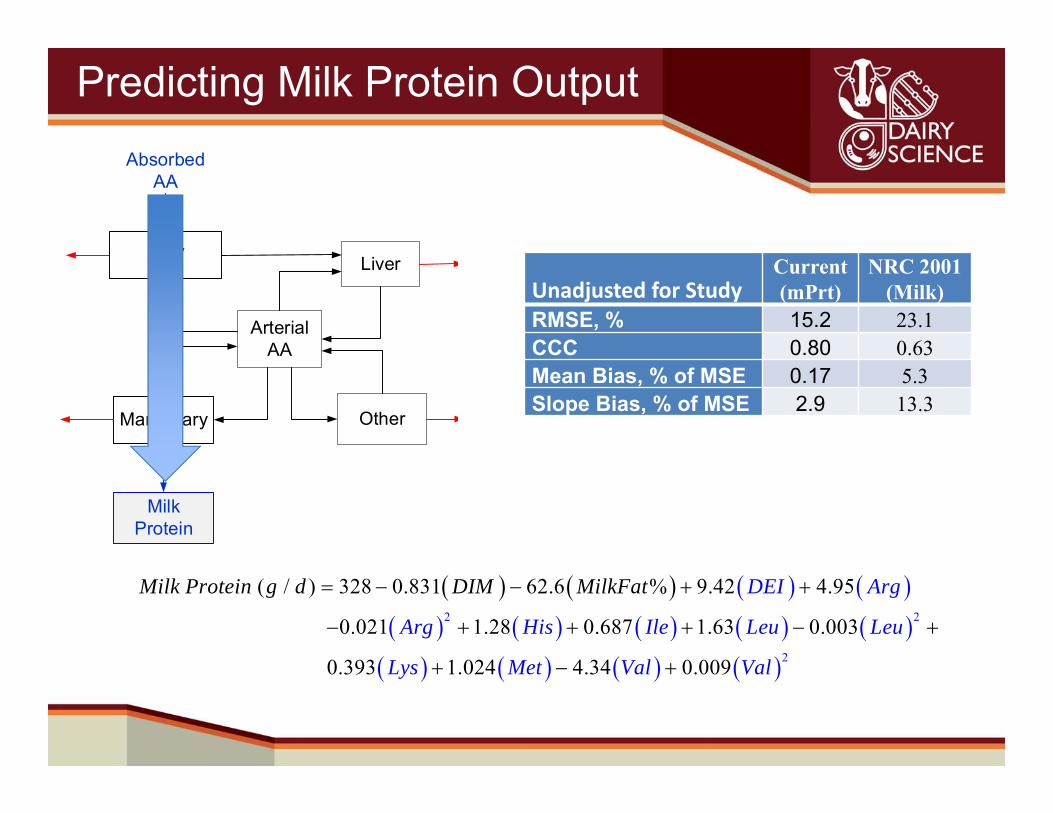
Predicting Milk Protein Output
2 2
2
9.42 4.95
0.021 1 .
( / ) 3
8
28 0.
.28 0 6 7 1.63 0.003
0.393 1.024 4.34
831 62
0.0
%
09
.6 DEI Arg
Arg His I
M
l
I
e
ilk Protein g
as
d D M M
Leu Leu
Ly Met V l Val
ilkFat
Unadjusted for Study Current(mPrt)
NRC 2001 (Milk)
RMSE, % 15.2 23.1CCC 0.80 0.63Mean Bias, % of MSE 0.17 5.3Slope Bias, % of MSE 2.9 13.3
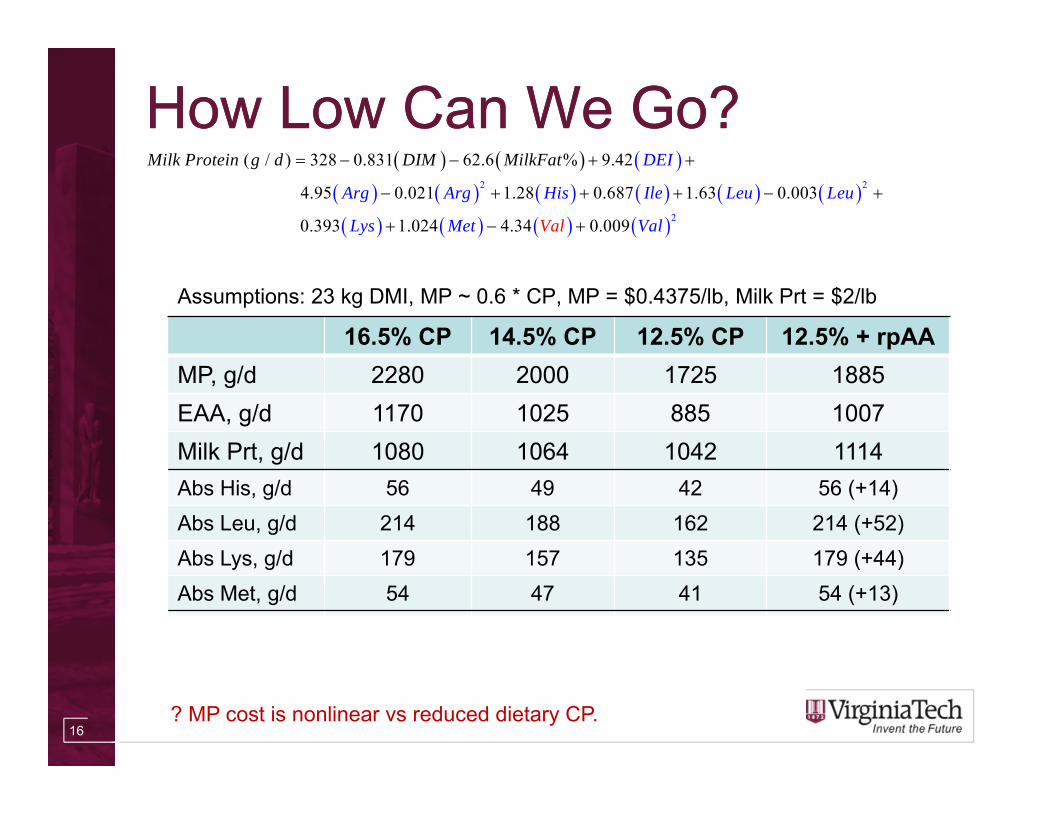
How Low Can We Go?How Low Can We Go?
16
2 2
2
9.42
4.95 0.021 1 .
( / ) 3
8
28 0.
.28 0 6 7 1.63 0.003
0.393 1.024 4.34
831 62
0.0
%
09
.6 DEI
Arg Arg His I
M
l
I
e
ilk Protein g
as
d D M M
Leu Leu
Ly Met Val
ilkFat
V l
16.5% CP 14.5% CP 12.5% CP 12.5% + rpAAMP, g/d 2280 2000 1725 1885EAA, g/d 1170 1025 885 1007Milk Prt, g/d 1080 1064 1042 1114Abs His, g/d 56 49 42 56 (+14)Abs Leu, g/d 214 188 162 214 (+52)Abs Lys, g/d 179 157 135 179 (+44)Abs Met, g/d 54 47 41 54 (+13)
MP, $/d $2.20 $1.93 $1.66? $1.66?Milk Prt, $/d $4.76 $4.69 $4.59 $4.91
? MP cost is nonlinear vs reduced dietary CP.
Assumptions: 23 kg DMI, MP ~ 0.6 * CP, MP = $0.4375/lb, Milk Prt = $2/lb
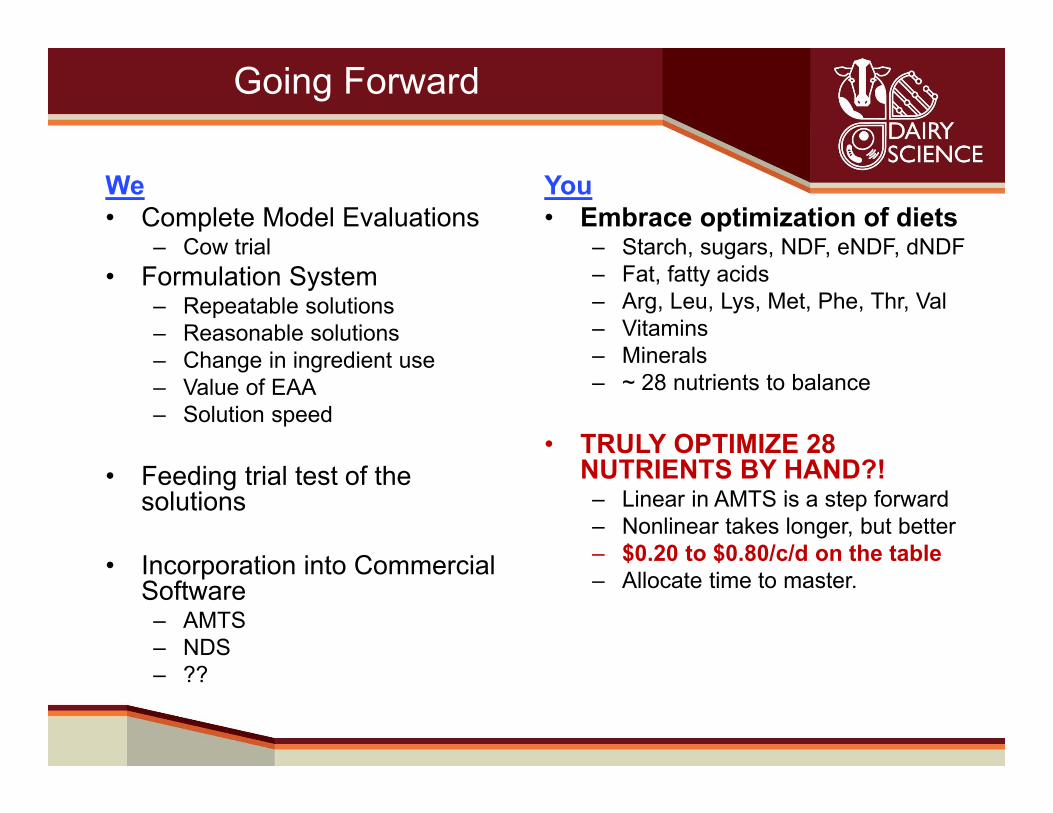
Going Forward
We• Complete Model Evaluations
– Cow trial• Formulation System
– Repeatable solutions– Reasonable solutions– Change in ingredient use– Value of EAA– Solution speed
• Feeding trial test of the solutions
• Incorporation into Commercial Software– AMTS– NDS– ??
You• Embrace optimization of diets
– Starch, sugars, NDF, eNDF, dNDF– Fat, fatty acids– Arg, Leu, Lys, Met, Phe, Thr, Val– Vitamins– Minerals– ~ 28 nutrients to balance
• TRULY OPTIMIZE 28 NUTRIENTS BY HAND?!– Linear in AMTS is a step forward– Nonlinear takes longer, but better– $0.20 to $0.80/c/d on the table– Allocate time to master.
18
Acknowledgements and QuestionsAcknowledgements and QuestionsFunding has been provided by:• UK Government• Purina Animal Nutrition• England and Wales Milk Marketing
Board• Nutreco• AFRI Grant: 2012-67015-19464• Balchem• Evonik• Perdue Ag Solutions• Papillon• Adisseo• Virginia State Dairymen’s
Association• Virginia Agricultural Council• The VT Pratt Endowment• VT College of Agriculture and Life
Sciences• USDA under Regional Research
Project NC-1040/NC-2040
Collaborators• Jim France, U. of Guelph• Brian Bequette, UMD• Les Crompton, U. Reading• John Mecalf , U. Reading• Gerald Lobley, Rowett• John MacRae, Rowett• John Sutton , U. Reading• Diane Wray-Cahen , U. Reading• Nate Smith, Purina• Larry Reutzel, Purina• Helene Lapierre, Ag Canada• Alex Hristov, Penn State Univ.• Jeffery Escobar, VT/Novus• Mike Akers, VT• Mike McGilliard, VT• Ondrej Becvar, VT• Hollie Schramm, VT• Danijela Kirovski, Univ. of Belgrade• Lin Xueyan, Shandong Ag Univ.• Zhonghua Wang, Shandong Ag Univ.• Niels Kristensen, Aarhus Univ.• Adam Storm, Aarhus Univ.• Mogens Larsen, Aarhus Univ.• Tatiana Ruiz-Cortes, Univ. Antioquia• Chong Wang, Zhejiang Ag. & Forestry• Ning Jiang, Heilongjiang Bayi Ag. Univ
Students/Technicians• Tara Piloner• Agustin Rius• Ranga Appuhamy• Ashley Bell• Sebastian Arriola• Michelle Aguilar• Juan Castro• Kari Estes• Adelyn Myers• Robin White• Xinbei Huang• Ashley Felock• Rebecca Garnett• Guimei Liu• Xin Feng• Veridiana Daley• Meng Li• Peter Yoder• A herd of undergraduate
students
Understanding and Using MUNMark D. HaniganProfessorDepartment of Dairy ScienceVirginia Tech
Department of Dairy Science at Virginia Tech ꞏ dasc.vt.edu
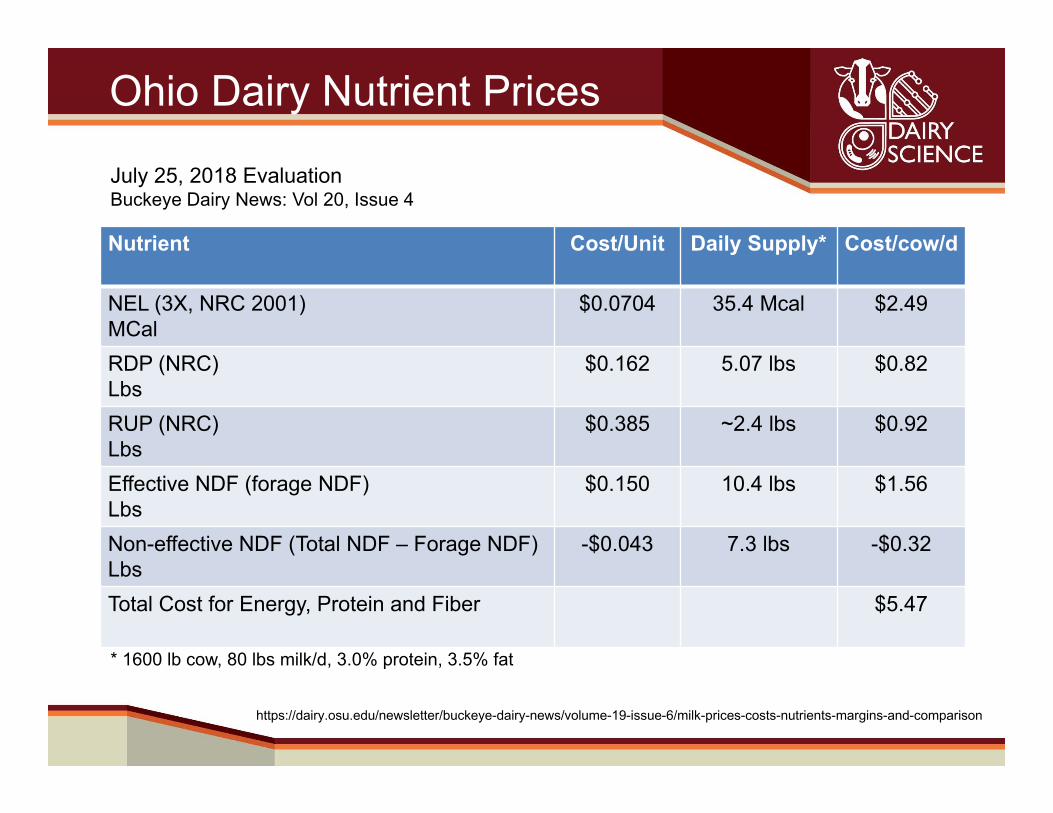
Ohio Dairy Nutrient Prices
Nutrient Cost/Unit Daily Supply* Cost/cow/d
NEL (3X, NRC 2001)MCal
$0.0704 35.4 Mcal $2.49
RDP (NRC)Lbs
$0.162 5.07 lbs $0.82
RUP (NRC)Lbs
$0.385 ~2.4 lbs $0.92
Effective NDF (forage NDF)Lbs
$0.150 10.4 lbs $1.56
Non-effective NDF (Total NDF – Forage NDF)Lbs
-$0.043 7.3 lbs -$0.32
Total Cost for Energy, Protein and Fiber $5.47
* 1600 lb cow, 80 lbs milk/d, 3.0% protein, 3.5% fat
https://dairy.osu.edu/newsletter/buckeye-dairy-news/volume-19-issue-6/milk-prices-costs-nutrients-margins-and-comparison
July 25, 2018 EvaluationBuckeye Dairy News: Vol 20, Issue 4

3
N Conversion Efficiencies are Relatively Poor for the RuminantN Conversion Efficiencies are Relatively Poor for the Ruminant
10
15
20
25
30
35
40
45
50
Lactating Dairy Cow Growing Beef Growing Pig Egg Production Growing Broiler
N E
ffic
ienc
y (%
)
Bequette et al., 2003
Acid Rain
Nitrate
NH4
↑ efficiency = ↑ food/ac and ↓ environmental loading!
4
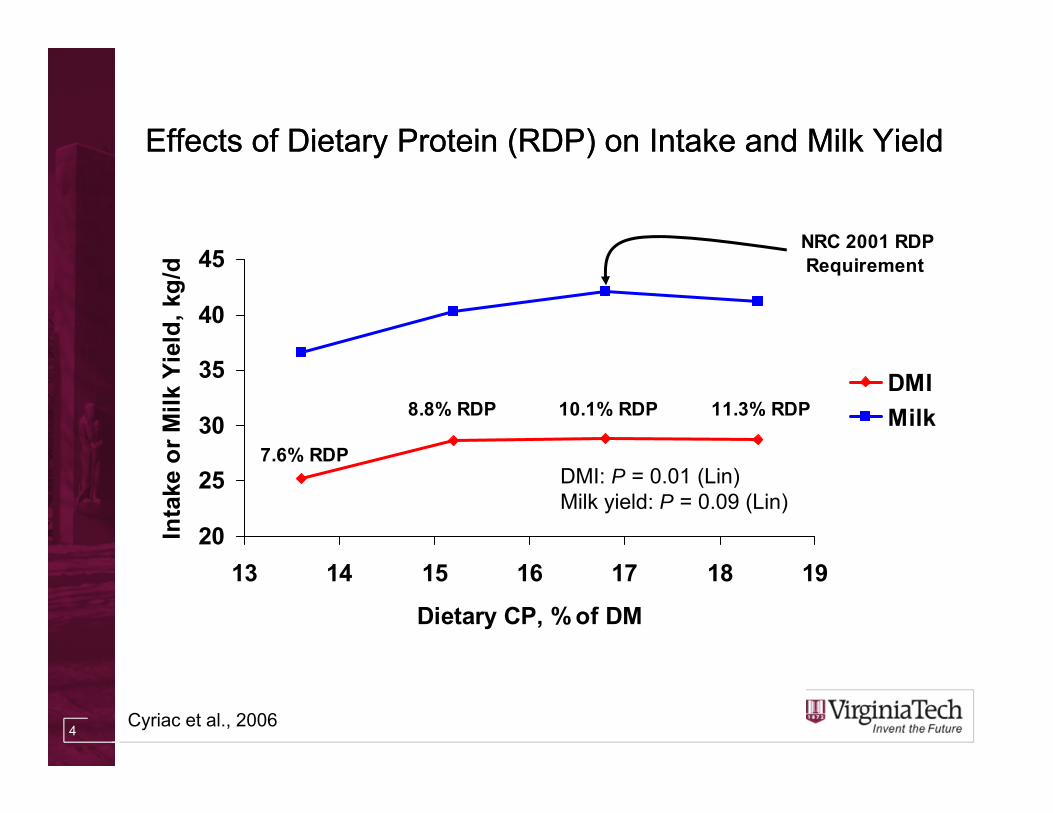
20
25
30
35
40
45
13 14 15 16 17 18 19
Dietary CP, % of DM
Inta
ke o
r Milk
Yie
ld, k
g/d
DMIMilk11.3% RDP10.1% RDP8.8% RDP
7.6% RDP
NRC 2001 RDP Requirement
DMI: P = 0.01 (Lin)Milk yield: P = 0.09 (Lin)
Effects of Dietary Protein (RDP) on Intake and Milk YieldEffects of Dietary Protein (RDP) on Intake and Milk Yield
Cyriac et al., 2006
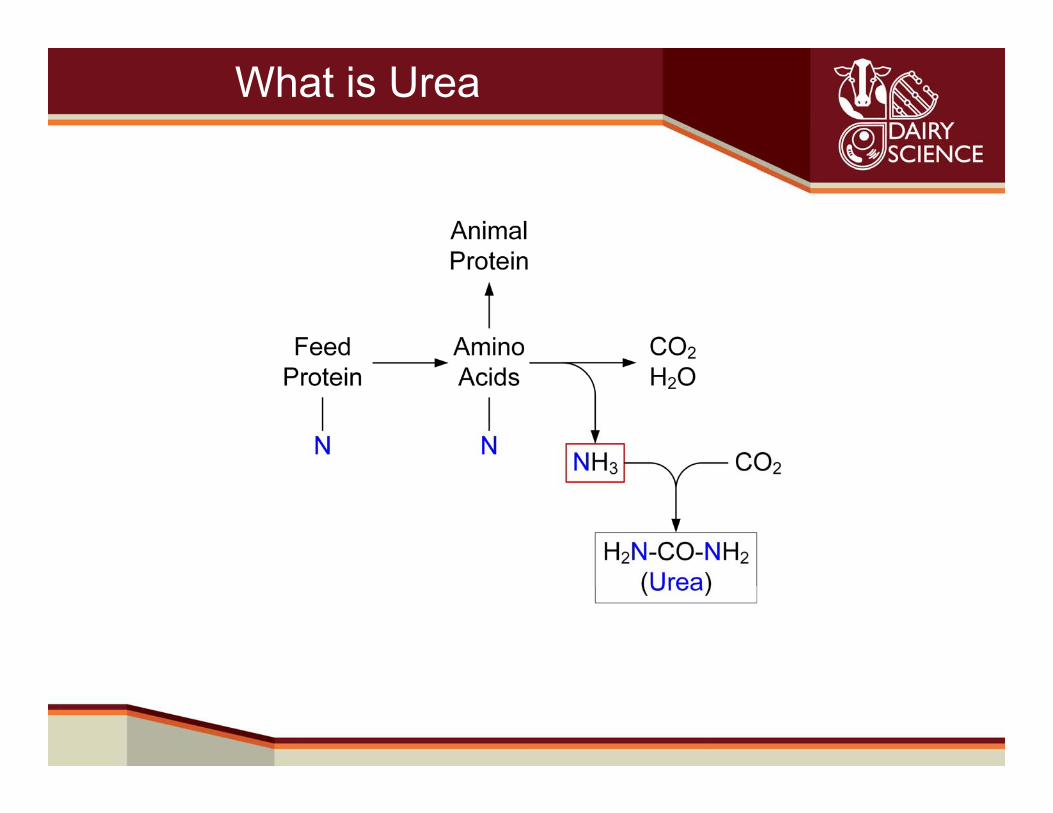
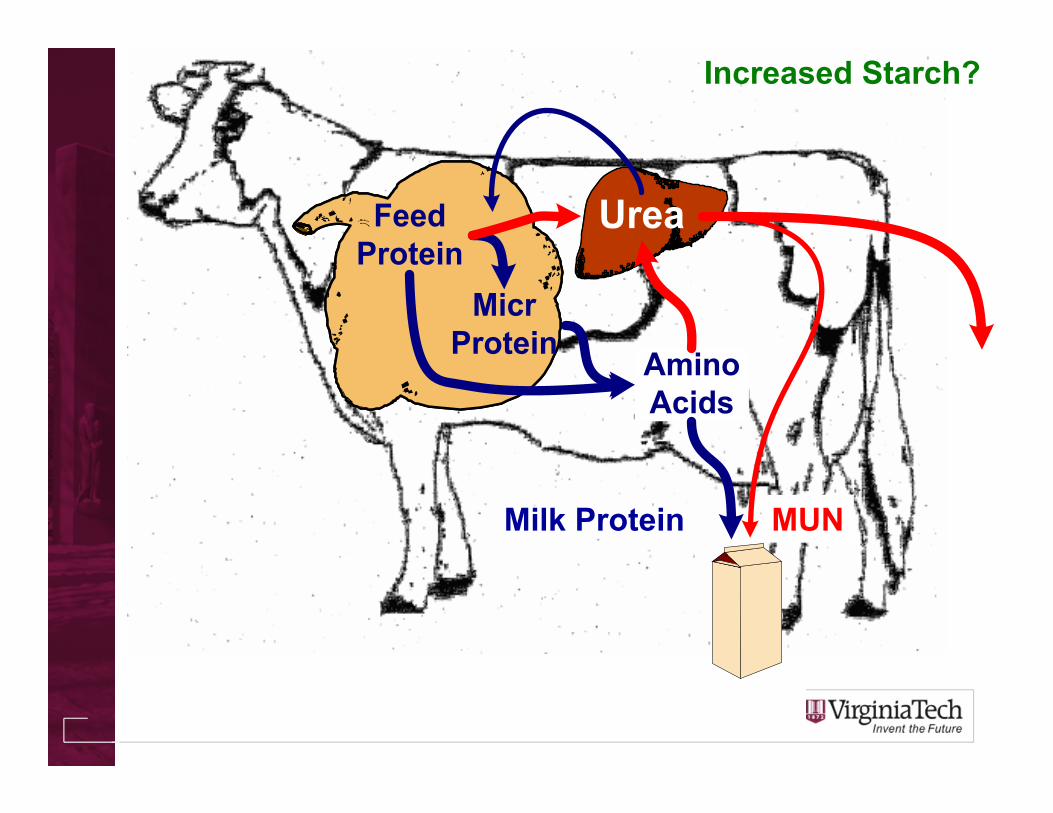
What is Urea
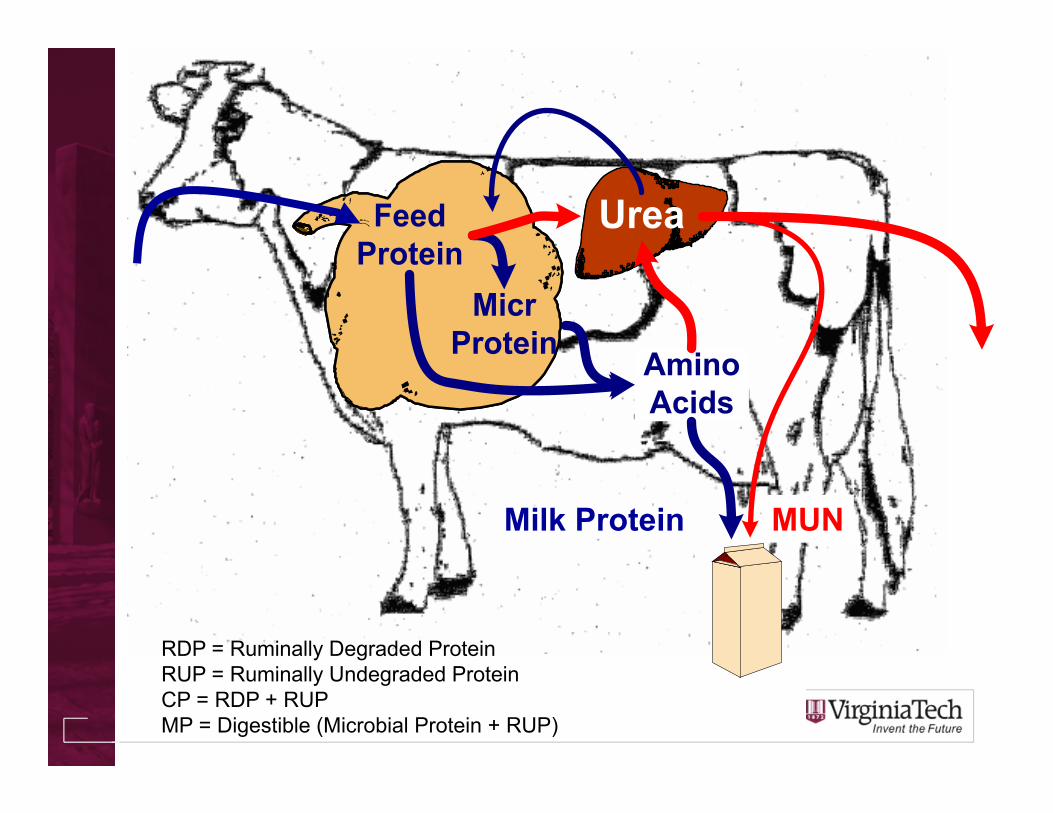
Milk Protein MUN
RDP = Ruminally Degraded ProteinRUP = Ruminally Undegraded ProteinCP = RDP + RUPMP = Digestible (Microbial Protein + RUP)

What Goes In MUST Come Out!
8
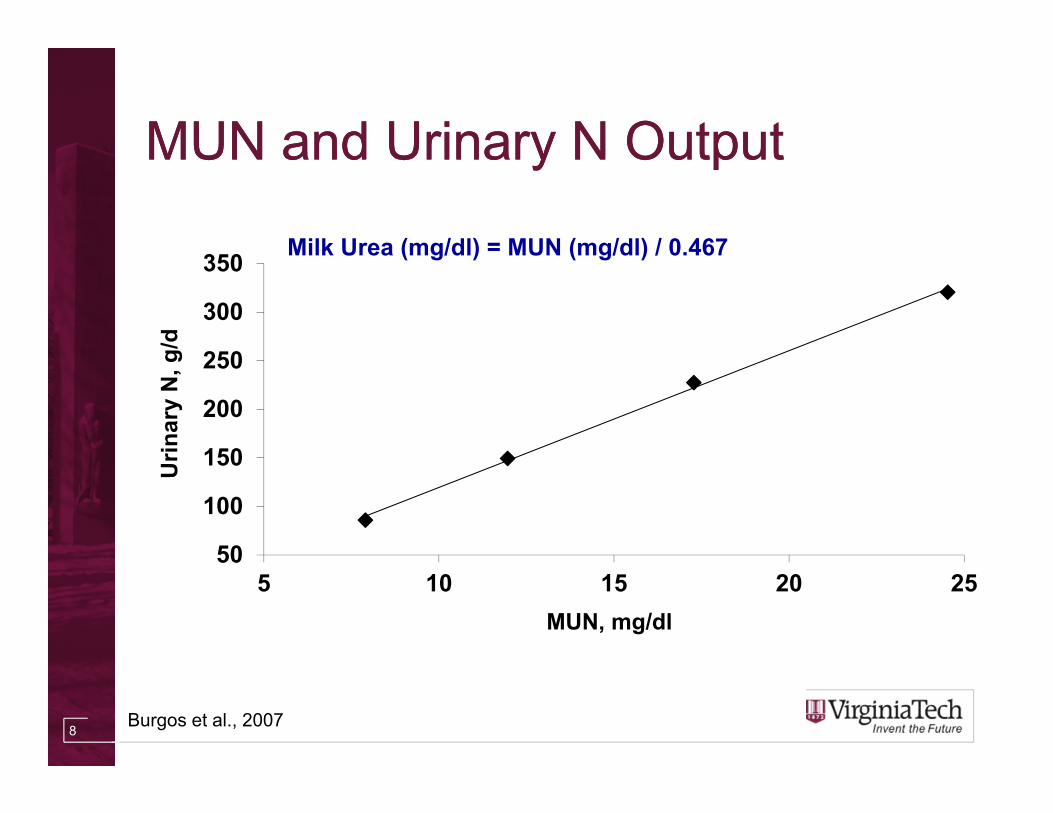
MUN and Urinary N OutputMUN and Urinary N Output
50
100
150
200
250
300
350
5 10 15 20 25
Urin
ary
N, g
/d
MUN, mg/dl
Burgos et al., 2007
Milk Urea (mg/dl) = MUN (mg/dl) / 0.467
9
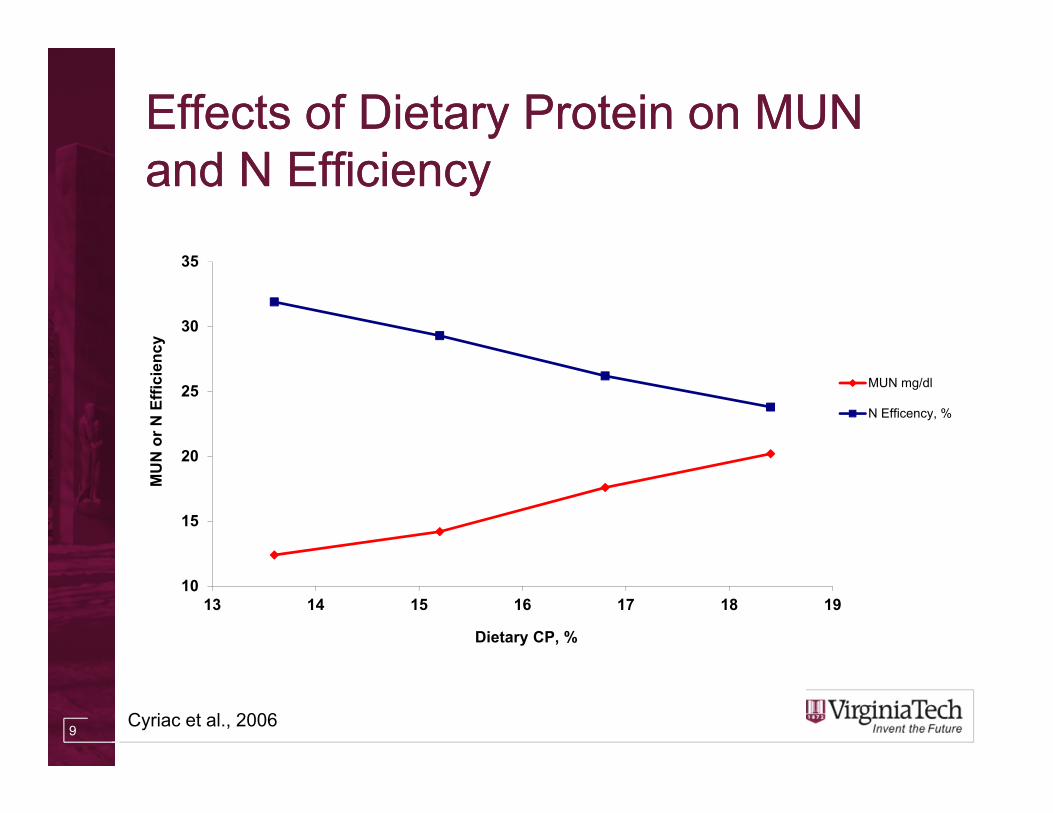
Effects of Dietary Protein on MUN and N EfficiencyEffects of Dietary Protein on MUN and N Efficiency
10
15
20
25
30
35
13 14 15 16 17 18 19
MU
N o
r N E
ffici
ency
Dietary CP, %
MUN mg/dl
N Efficency, %
Cyriac et al., 2006
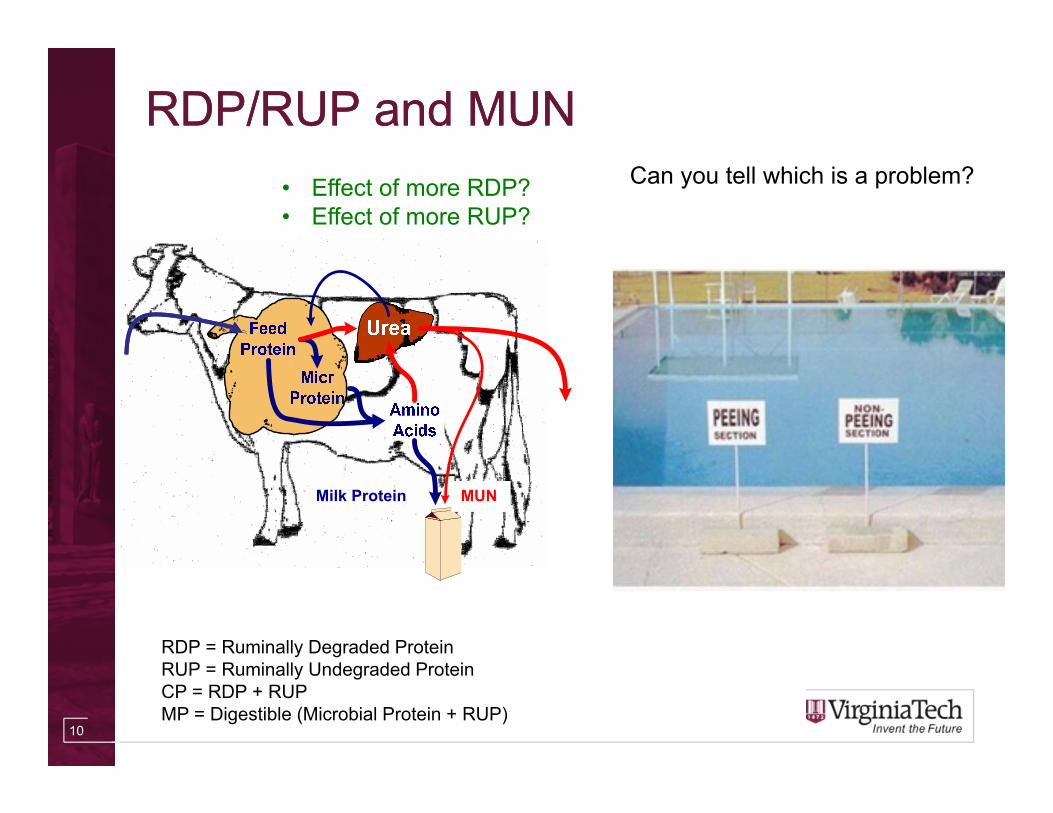
RDP/RUP and MUNRDP/RUP and MUN
10
Milk Protein MUN
RDP = Ruminally Degraded ProteinRUP = Ruminally Undegraded ProteinCP = RDP + RUPMP = Digestible (Microbial Protein + RUP)
• Effect of more RDP?• Effect of more RUP?
Can you tell which is a problem?
11
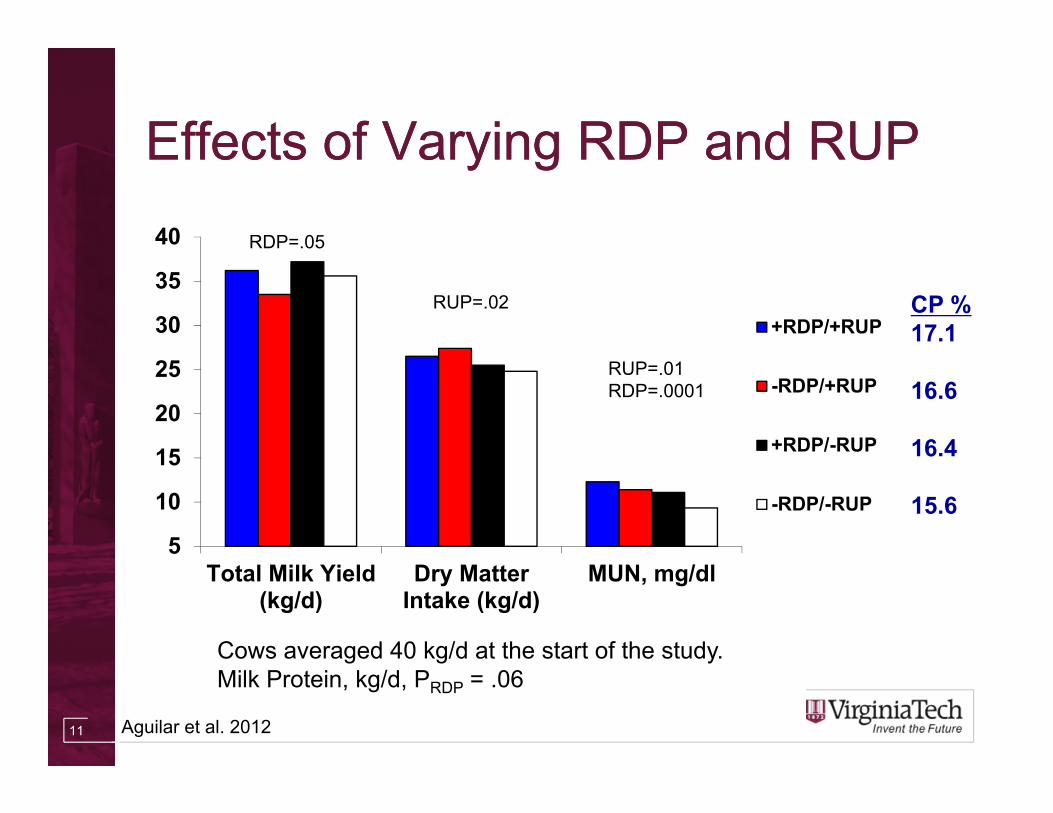
Effects of Varying RDP and RUPEffects of Varying RDP and RUP
5
10
15
20
25
30
35
40
Total Milk Yield(kg/d)
Dry MatterIntake (kg/d)
MUN, mg/dl
+RDP/+RUP
-RDP/+RUP
+RDP/-RUP
-RDP/-RUP
RDP=.05
RUP=.02
RUP=.01RDP=.0001
CP %17.1
16.6
16.4
15.6
Cows averaged 40 kg/d at the start of the study.Milk Protein, kg/d, PRDP = .06
Aguilar et al. 2012
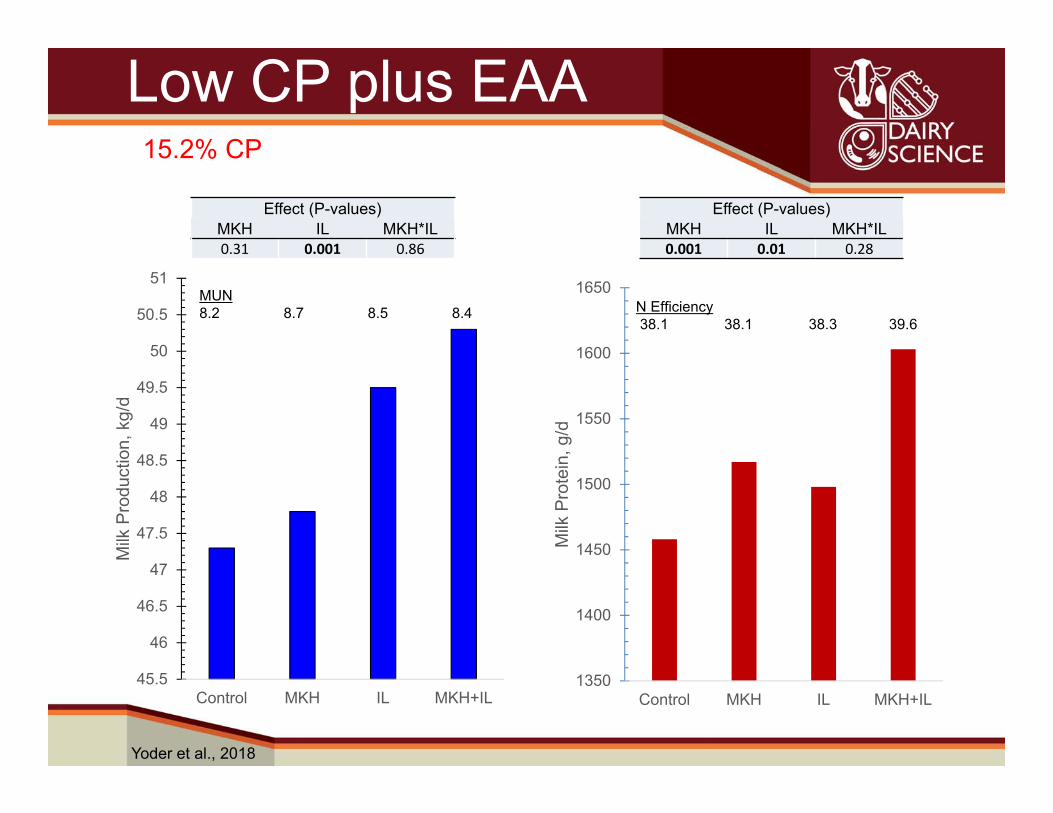
Low CP plus EAA
45.5
46
46.5
47
47.5
48
48.5
49
49.5
50
50.5
51
Control MKH IL MKH+IL
Milk
Pro
duct
ion,
kg/
d
MUN8.2 8.7 8.5 8.4
1350
1400
1450
1500
1550
1600
1650
Control MKH IL MKH+IL
Milk
Pro
tein
, g/d
Effect (P-values)MKH IL MKH*IL0.31 0.001 0.86
Effect (P-values)MKH IL MKH*IL0.001 0.01 0.28
15.2% CP
Yoder et al., 2018
N Efficiency38.1 38.1 38.3 39.6
Milk Protein MUN
Increased Starch?
14
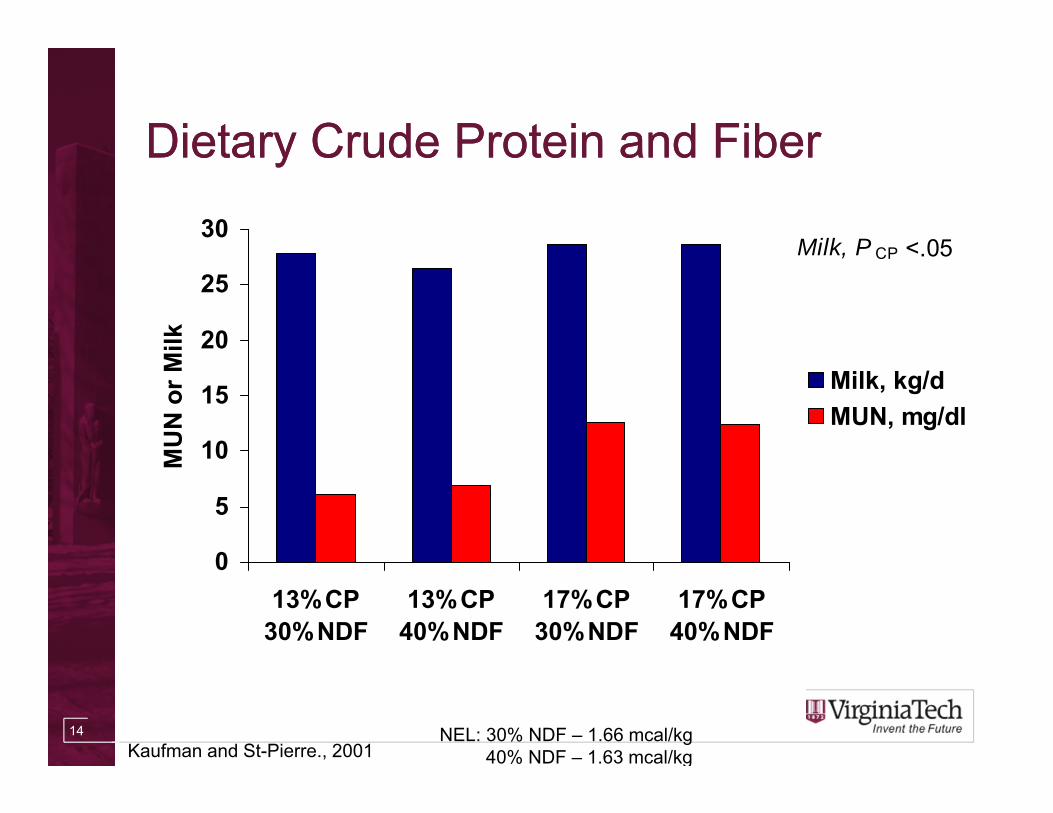
Dietary Crude Protein and FiberDietary Crude Protein and Fiber
0
5
10
15
20
25
30
13% CP30% NDF
13% CP40% NDF
17% CP30% NDF
17% CP40% NDF
MU
N o
r Milk
Milk, kg/dMUN, mg/dl
Milk, P CP <.05
Kaufman and St-Pierre., 2001NEL: 30% NDF – 1.66 mcal/kg
40% NDF – 1.63 mcal/kg
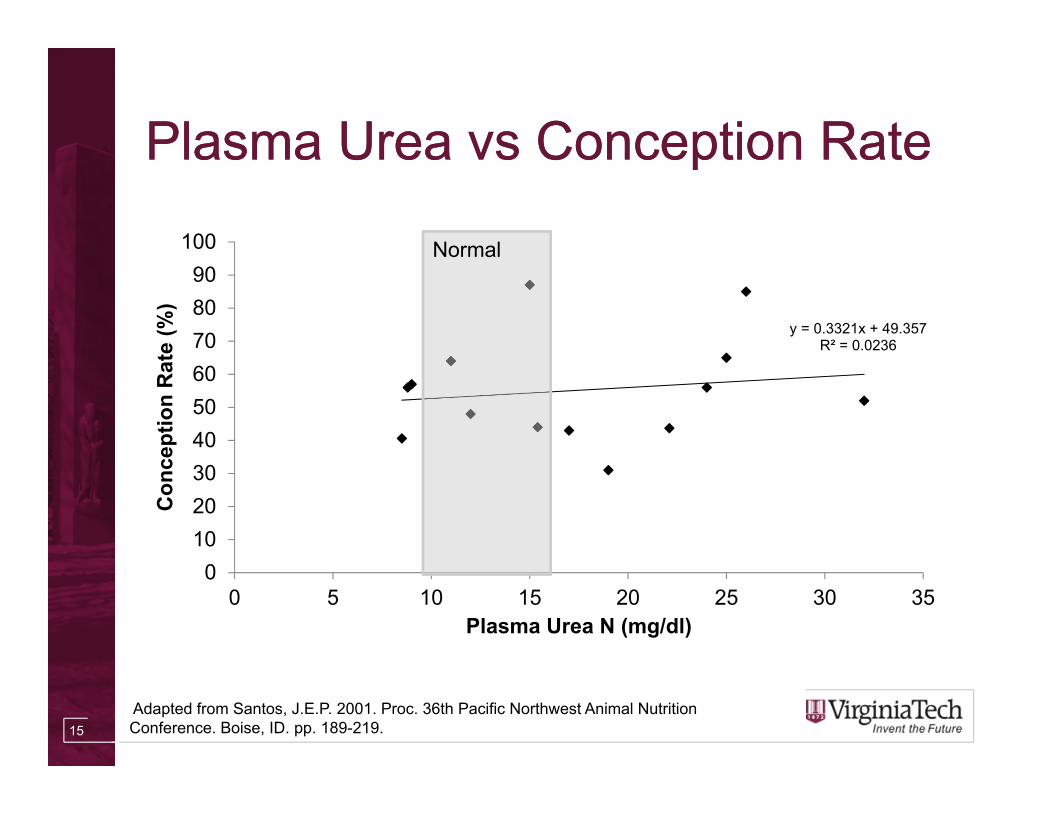
Plasma Urea vs Conception RatePlasma Urea vs Conception Rate
15
y = 0.3321x + 49.357R² = 0.0236
0102030405060708090
100
0 5 10 15 20 25 30 35
Con
cept
ion
Rat
e (%
)
Plasma Urea N (mg/dl)
Normal
Adapted from Santos, J.E.P. 2001. Proc. 36th Pacific Northwest Animal Nutrition Conference. Boise, ID. pp. 189-219.
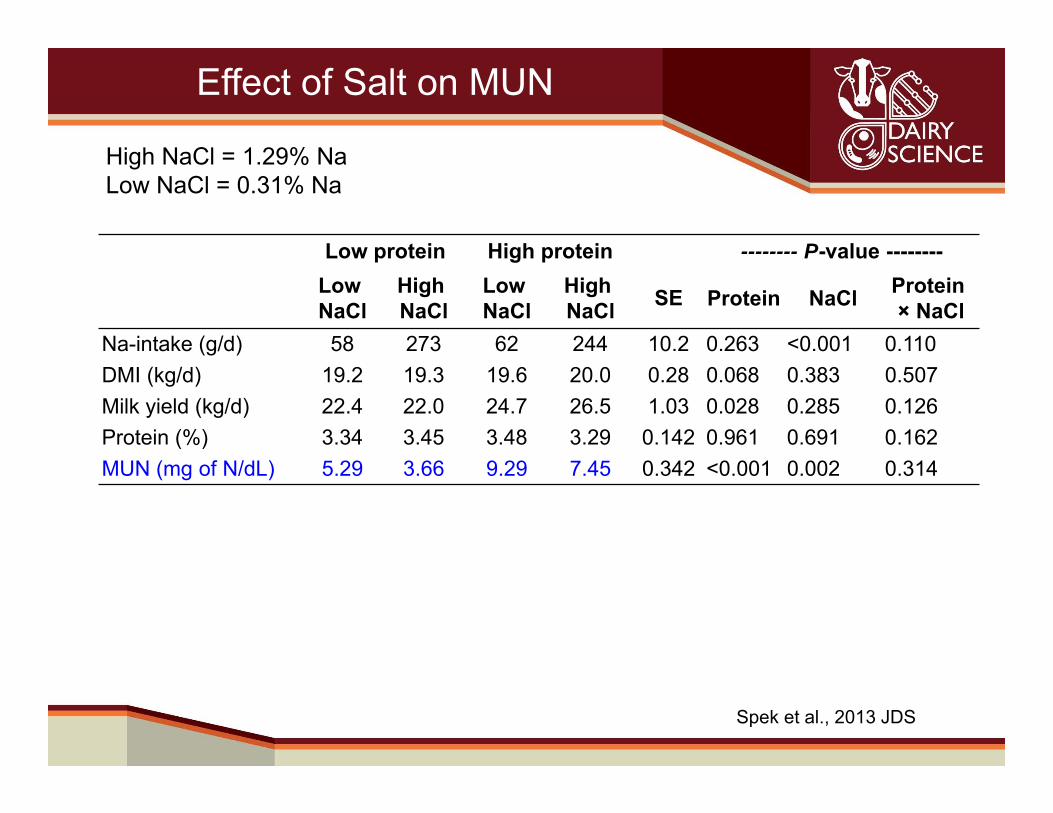
Effect of Salt on MUN
Low protein High protein -------- P-value --------LowNaCl
HighNaCl
LowNaCl
HighNaCl SE Protein NaCl Protein
× NaClNa-intake (g/d) 58 273 62 244 10.2 0.263 <0.001 0.110DMI (kg/d) 19.2 19.3 19.6 20.0 0.28 0.068 0.383 0.507Milk yield (kg/d) 22.4 22.0 24.7 26.5 1.03 0.028 0.285 0.126Protein (%) 3.34 3.45 3.48 3.29 0.142 0.961 0.691 0.162MUN (mg of N/dL) 5.29 3.66 9.29 7.45 0.342 <0.001 0.002 0.314
Spek et al., 2013 JDS
High NaCl = 1.29% NaLow NaCl = 0.31% Na
17
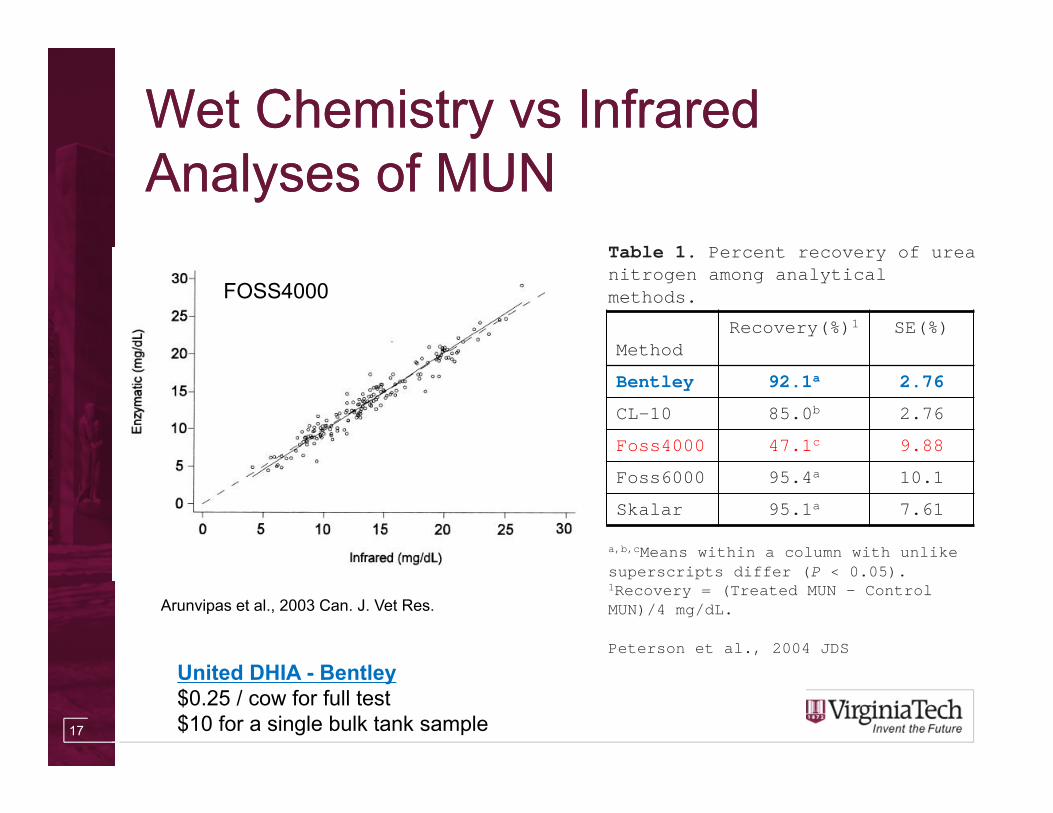
Wet Chemistry vs Infrared Analyses of MUNWet Chemistry vs Infrared Analyses of MUN
Table 1. Percent recovery of urea nitrogen among analytical methods.
MethodRecovery(%)1 SE(%)
Bentley 92.1a 2.76
CL-10 85.0b 2.76
Foss4000 47.1c 9.88
Foss6000 95.4a 10.1
Skalar 95.1a 7.61
a,b,cMeans within a column with unlike superscripts differ (P < 0.05).1Recovery = (Treated MUN - Control MUN)/4 mg/dL.
Peterson et al., 2004 JDS
FOSS4000
Arunvipas et al., 2003 Can. J. Vet Res.
United DHIA - Bentley$0.25 / cow for full test$10 for a single bulk tank sample
18
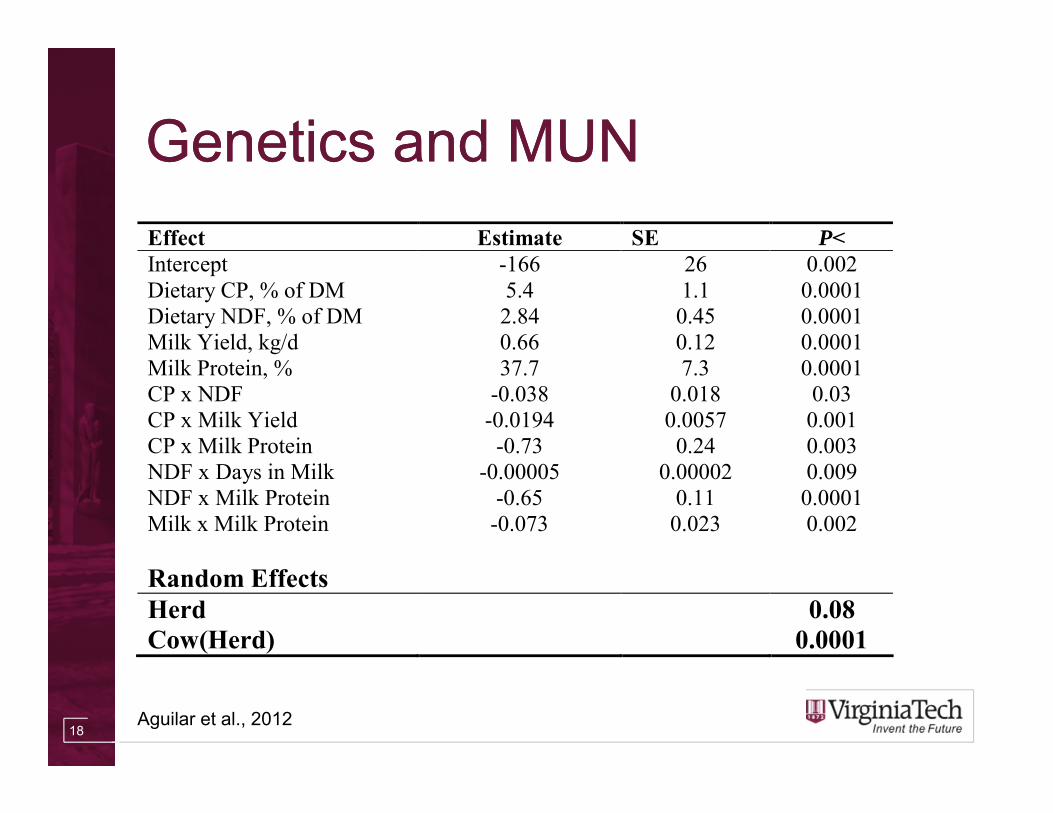
Genetics and MUNGenetics and MUNEffect Estimate SE P< Intercept -166 26 0.002 Dietary CP, % of DM 5.4 1.1 0.0001 Dietary NDF, % of DM 2.84 0.45 0.0001 Milk Yield, kg/d 0.66 0.12 0.0001 Milk Protein, % 37.7 7.3 0.0001 CP x NDF -0.038 0.018 0.03 CP x Milk Yield -0.0194 0.0057 0.001 CP x Milk Protein -0.73 0.24 0.003 NDF x Days in Milk -0.00005 0.00002 0.009 NDF x Milk Protein -0.65 0.11 0.0001 Milk x Milk Protein -0.073 0.023 0.002 Random Effects Herd 0.08 Cow(Herd) 0.0001
Aguilar et al., 2012
19
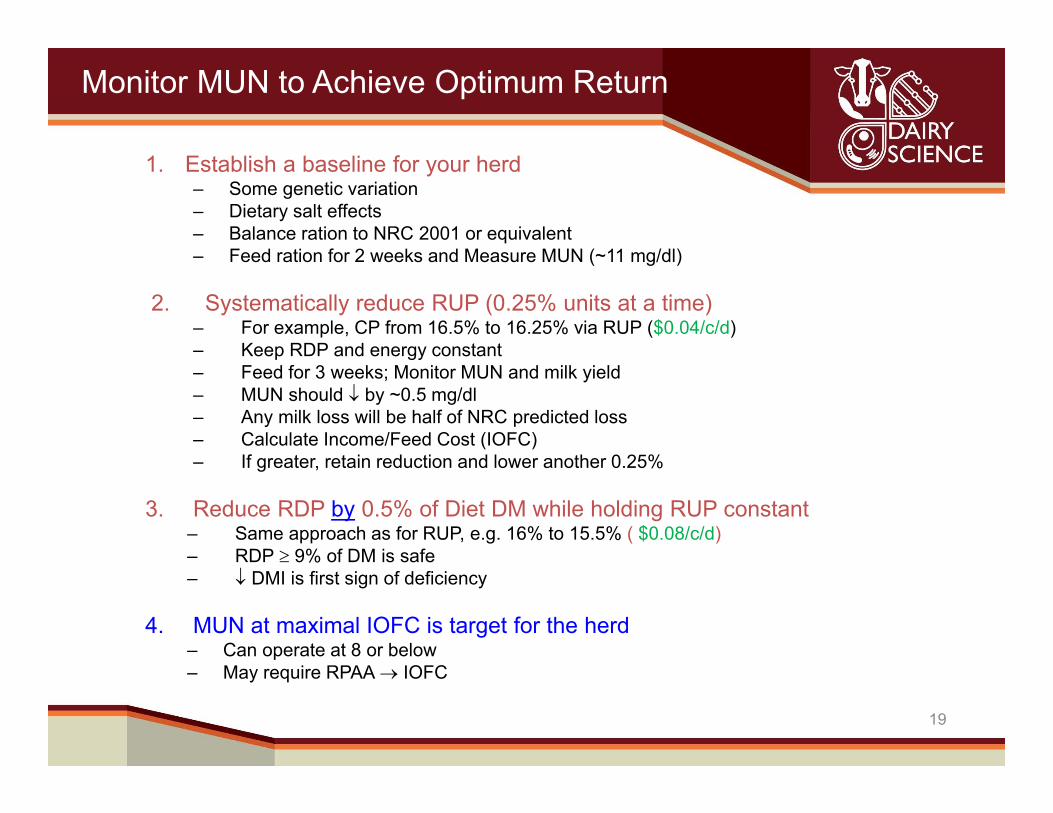
Monitor MUN to Achieve Optimum Return
1. Establish a baseline for your herd– Some genetic variation– Dietary salt effects– Balance ration to NRC 2001 or equivalent– Feed ration for 2 weeks and Measure MUN (~11 mg/dl)
2. Systematically reduce RUP (0.25% units at a time)– For example, CP from 16.5% to 16.25% via RUP ($0.04/c/d)– Keep RDP and energy constant– Feed for 3 weeks; Monitor MUN and milk yield – MUN should by ~0.5 mg/dl– Any milk loss will be half of NRC predicted loss– Calculate Income/Feed Cost (IOFC)– If greater, retain reduction and lower another 0.25%
3. Reduce RDP by 0.5% of Diet DM while holding RUP constant– Same approach as for RUP, e.g. 16% to 15.5% ( $0.08/c/d)– RDP 9% of DM is safe– DMI is first sign of deficiency
4. MUN at maximal IOFC is target for the herd– Can operate at 8 or below– May require RPAA IOFC
20
Bay Restoration = $
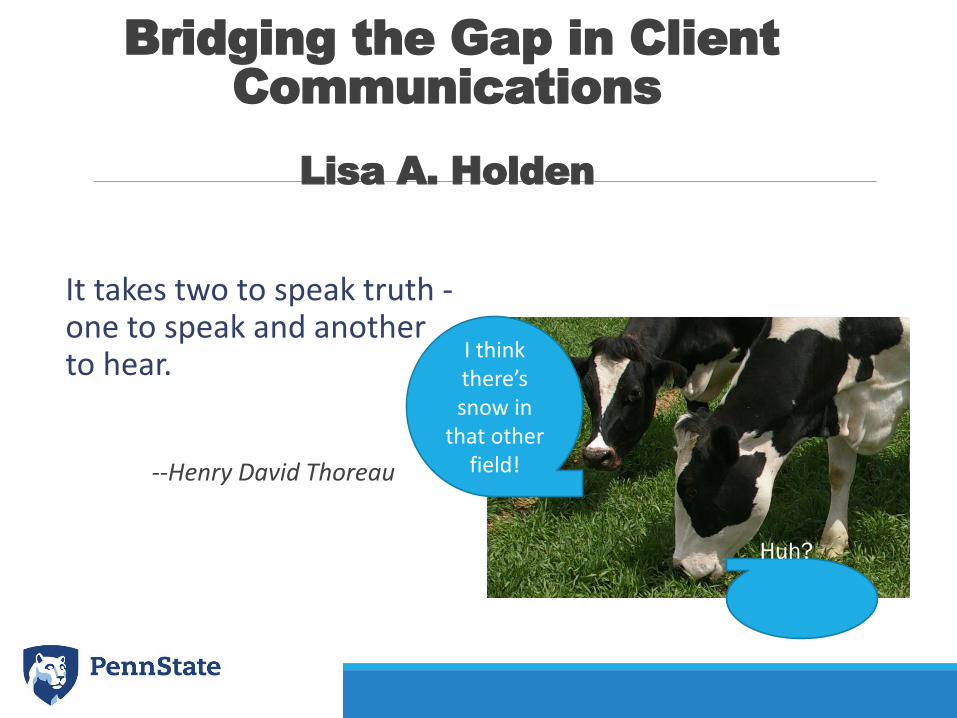
Bridging the Gap in Client Communications
Lisa A. Holden
It takes two to speak truth -one to speak and another to hear.
--Henry David Thoreau
I think there’s snow in
that other field!
Huh?
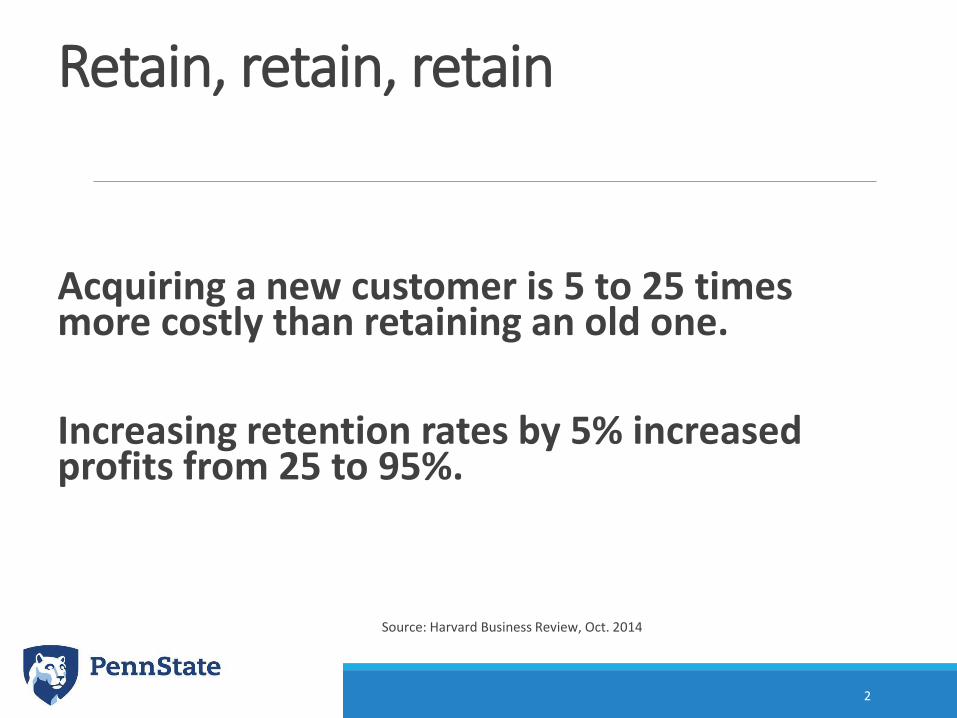
Retain, retain, retain
Acquiring a new customer is 5 to 25 times more costly than retaining an old one.
Increasing retention rates by 5% increased profits from 25 to 95%.
Source: Harvard Business Review, Oct. 2014
2

Today’s Session
A little communication
A little personality/generations
A few examples
Action steps – to BRIDGE the GAPS!
3

Activity
For the next 40 seconds . . .
Communicate with the person beside you.
4

WHAT DOES THIS MEAN???
A.S.A.P.
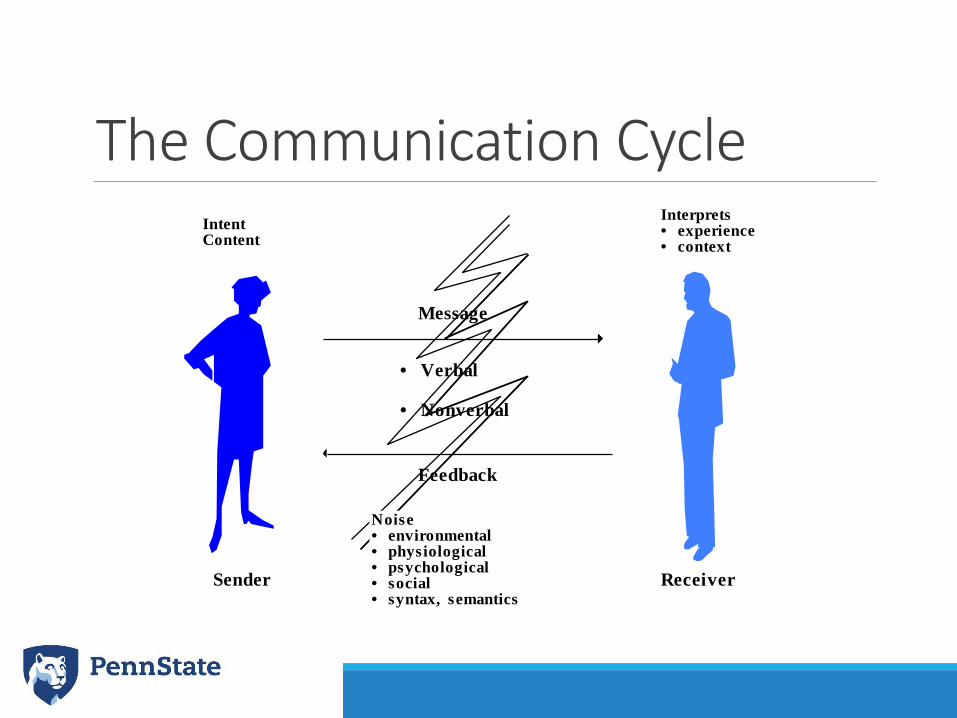
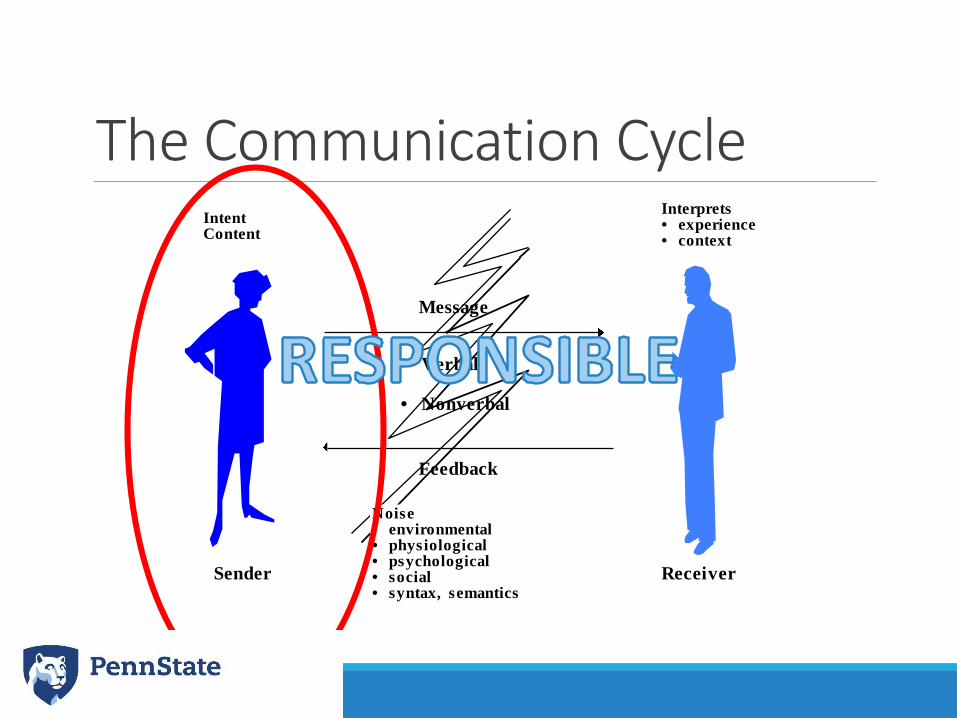
The Communication Cycle
Message
• Verbal
• Nonverbal
Feedback
Sender Receiver
Noise• environmental• physiological• psychological• social• syntax, semantics
IntentContent
Interprets• experience• context

Communication
Sender – The one with the ball◦ Pitcher◦ Quarterback
Receiver – The one who wants the ball◦ Catcher◦ Wide Receiver◦ Dog
7

Don’t drop the message!
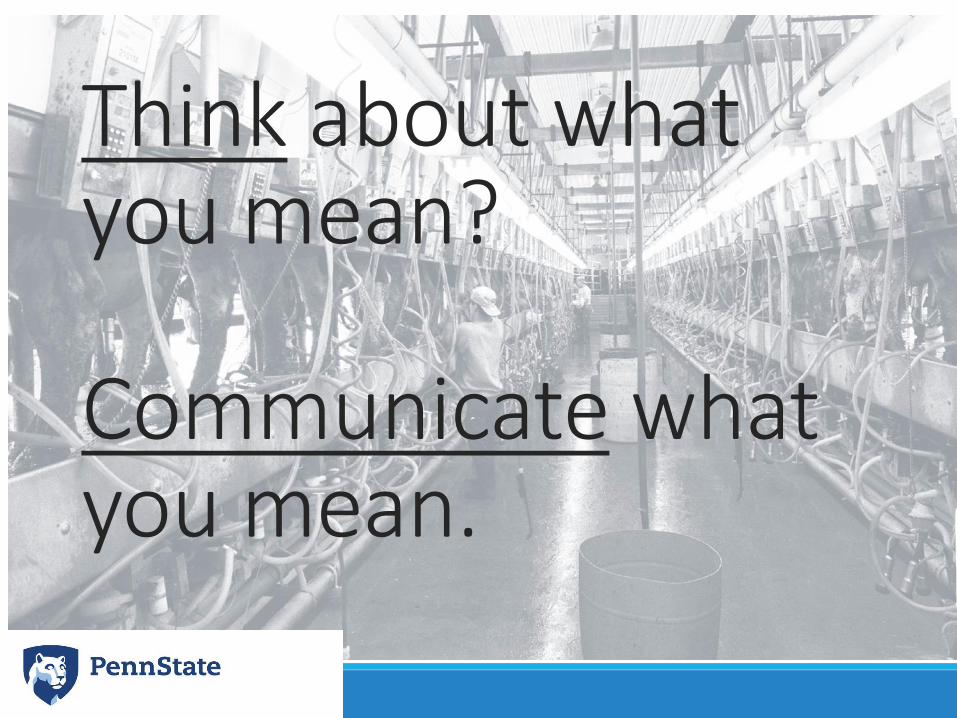
Think about what you mean?
Communicate what you mean.

Consider this . . .Manager: Tom I need you to move that heifer to Pen 6.
Tom: Sure thing, Boss.
Possible outcomes:◦ Correct heifer moved to correct pen in timely fashion.
◦ Wrong heifer moved.
◦ Correct heifer moved . . . Eventually.
◦ Other??

What about. . .Manager: Tom I need you to move heifer #355 to Pen 6 in the next hour.
Tom: OK, Boss.
Manager: Will you be able to do that? Do you need any help?
Tom: I’ll get Bill to help me right after he is done pushing up feed.
Possible outcomes:◦ Correct heifer moved to correct pen in timely fashion.
◦ Wrong heifer moved.
◦ Correct heifer moved . . . Eventually.
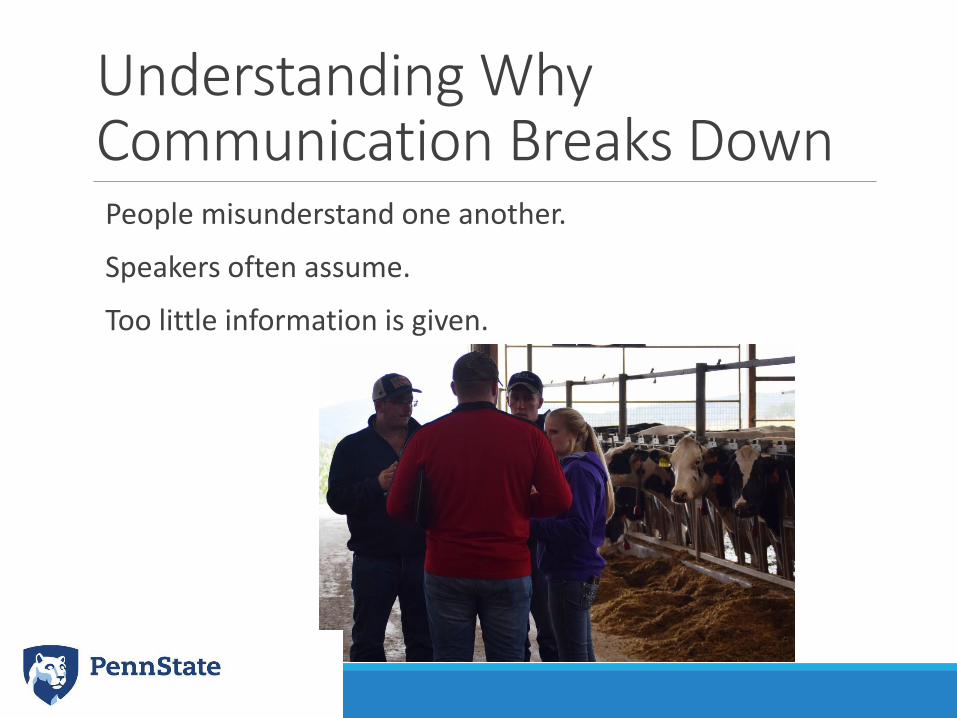
Understanding Why Communication Breaks DownPeople misunderstand one another.
Speakers often assume.
Too little information is given.
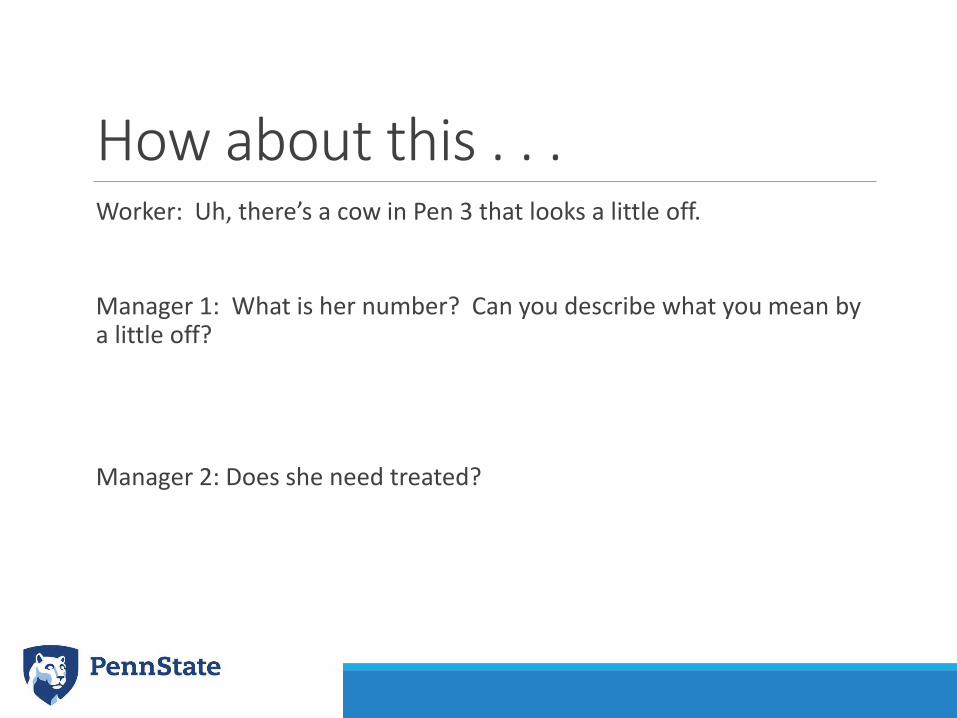
How about this . . .Worker: Uh, there’s a cow in Pen 3 that looks a little off.
Manager 1: What is her number? Can you describe what you mean by a little off?
Manager 2: Does she need treated?

Understanding Why Communication Breaks DownInformation is given too fast.
Listeners are unwilling to ask questions.
Background noise, distractions.
The Communication Cycle
Message
• Verbal
• Nonverbal
Feedback
Sender Receiver
Noise• environmental• physiological• psychological• social• syntax, semantics
IntentContent
Interprets• experience• context

Action Steps Think about what you want to communicate.
◦ Ask questions.
◦ NOT: Do you understand?
◦ BUT: I’m not sure I am being clear. Can you confirm for me . . .
Coach your clients to be better at COMMUNICATING!

What is Nonverbal Communication?
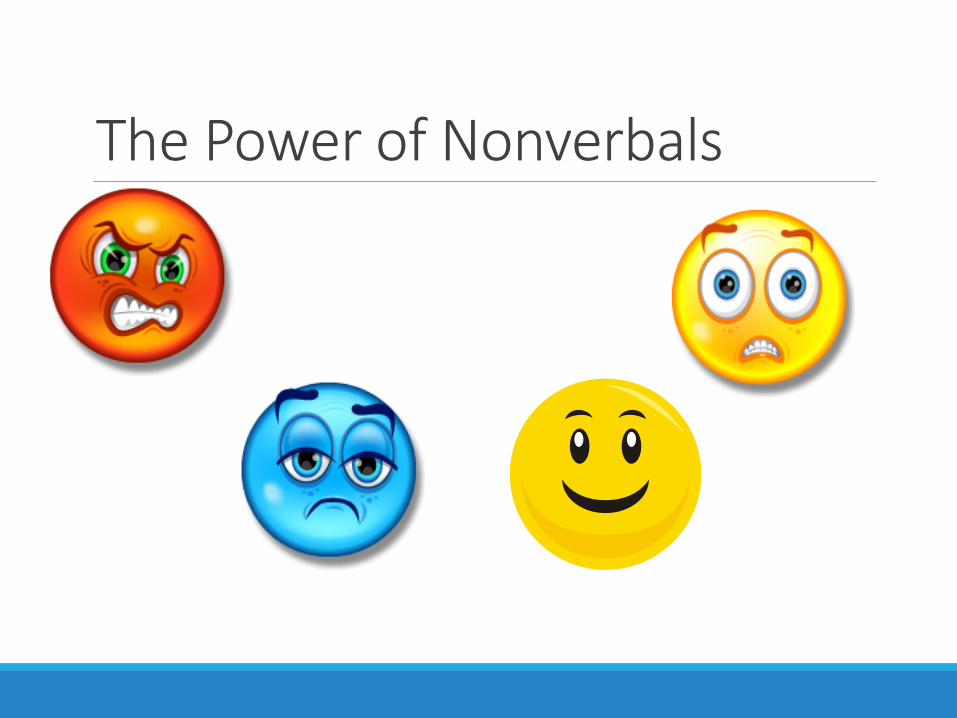
The Power of Nonverbals
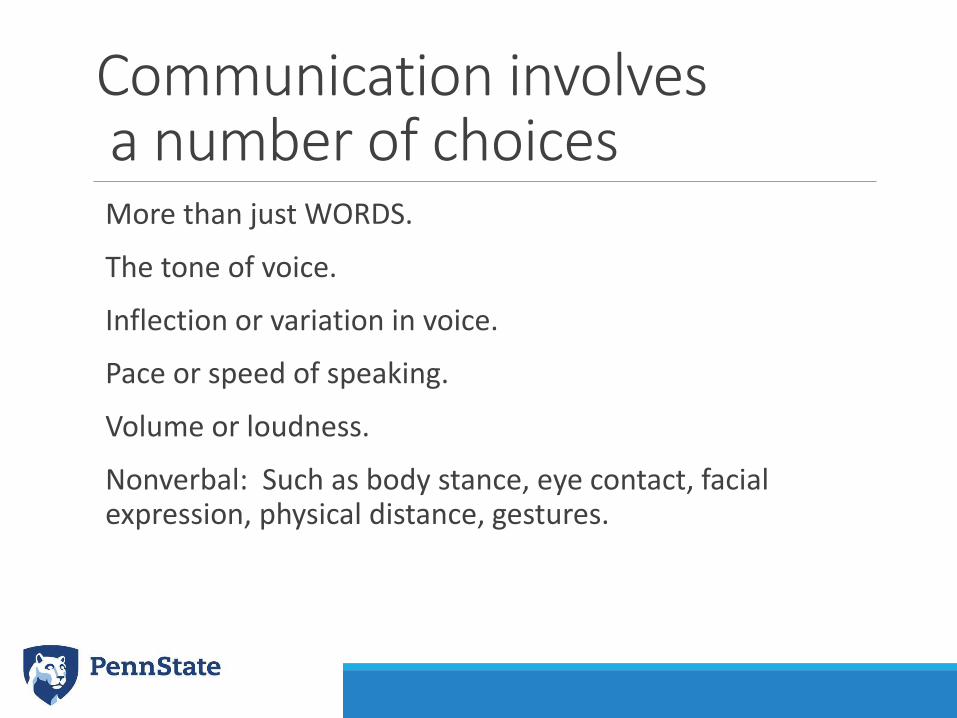
Communication involvesa number of choicesMore than just WORDS.
The tone of voice.
Inflection or variation in voice.
Pace or speed of speaking.
Volume or loudness.
Nonverbal: Such as body stance, eye contact, facial expression, physical distance, gestures.

Action Steps
Pay attention to YOUR nonverbals
WATCH the nonverbal of others

Improving Your Communication
1. Simplify the content.
2. Speak at a reasonable rate.
3. Give details in order.
4. EXAMPLE: Milker meetings.
Change from quarterly with lots of information
to weekly 20 minute “updates”.
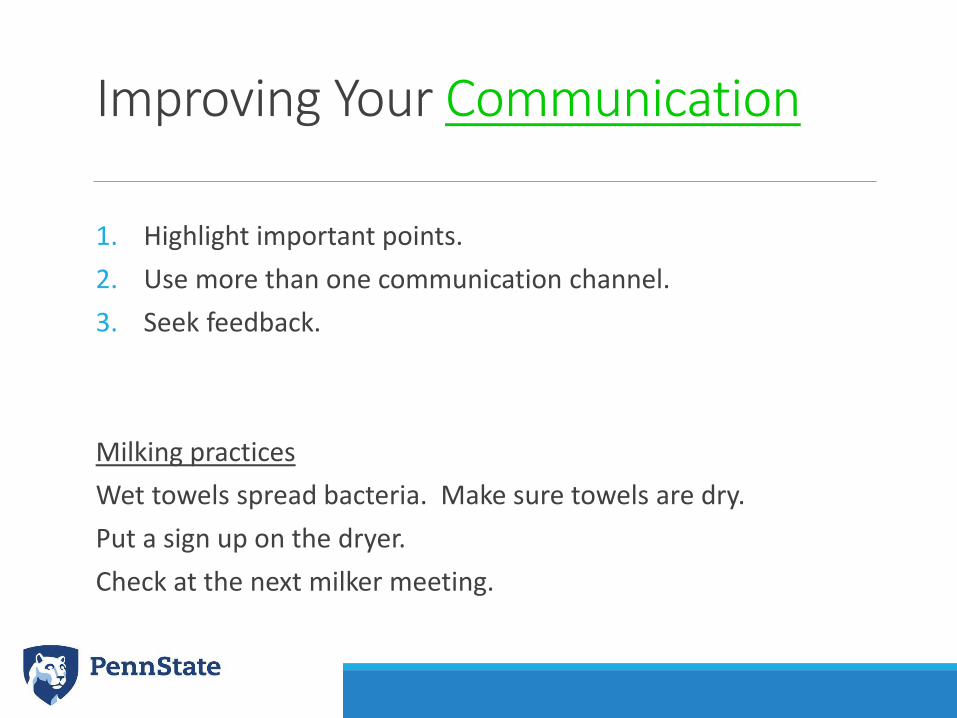
Improving Your Communication
1. Highlight important points.
2. Use more than one communication channel.
3. Seek feedback.
Milking practices
Wet towels spread bacteria. Make sure towels are dry.
Put a sign up on the dryer.
Check at the next milker meeting.

Action Steps Think about what you want to communicate.
◦ Ask questions.
◦ NOT: Do you understand?
◦ BUT: I’m not sure I am being clear. Can you confirm for me . . .
Pay attention to “power gradient”.

Questions?

People
25
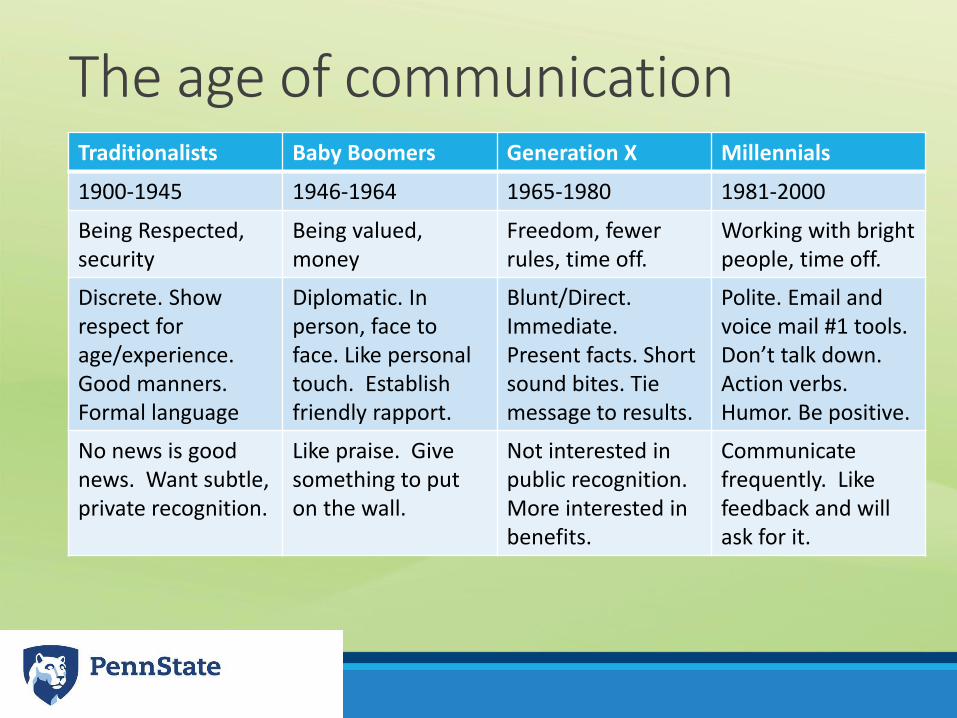
Traditionalists Baby Boomers Generation X Millennials
1900-1945 1946-1964 1965-1980 1981-2000
Being Respected, security
Being valued,money
Freedom, fewer rules, time off.
Working with brightpeople, time off.
Discrete. Show respect for age/experience. Good manners. Formal language
Diplomatic. In person, face to face. Like personal touch. Establish friendly rapport.
Blunt/Direct. Immediate. Present facts. Short sound bites. Tie message to results.
Polite. Email and voice mail #1 tools. Don’t talk down. Action verbs. Humor. Be positive.
No news is good news. Want subtle,private recognition.
Like praise. Give something to put on the wall.
Not interested in public recognition. More interested in benefits.
Communicate frequently. Like feedback and will ask for it.
The age of communication

Personality “TESTS” ???Myers-Briggs
Kiersey
DISC
Others?
27
Four “types”1. Driver
2. Analytical
3. Amiable
4. Expressive
28

So what . . .
29

Conversations: Texts, emails, phone calls, -- communication is constant.
30
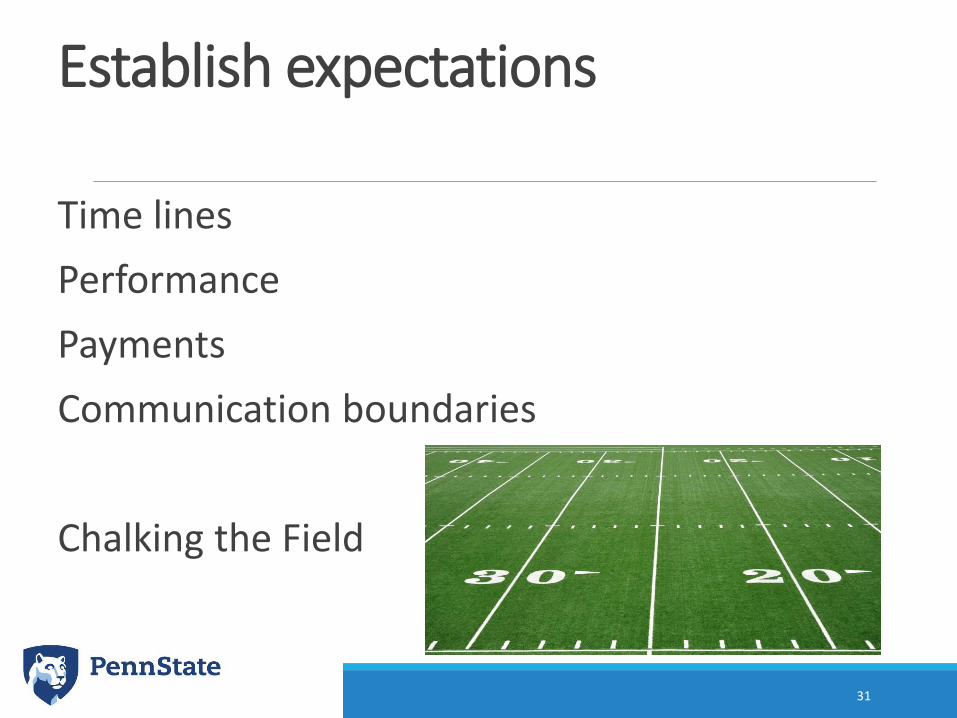
Establish expectations
Time lines
Performance
Payments
Communication boundaries
Chalking the Field
31
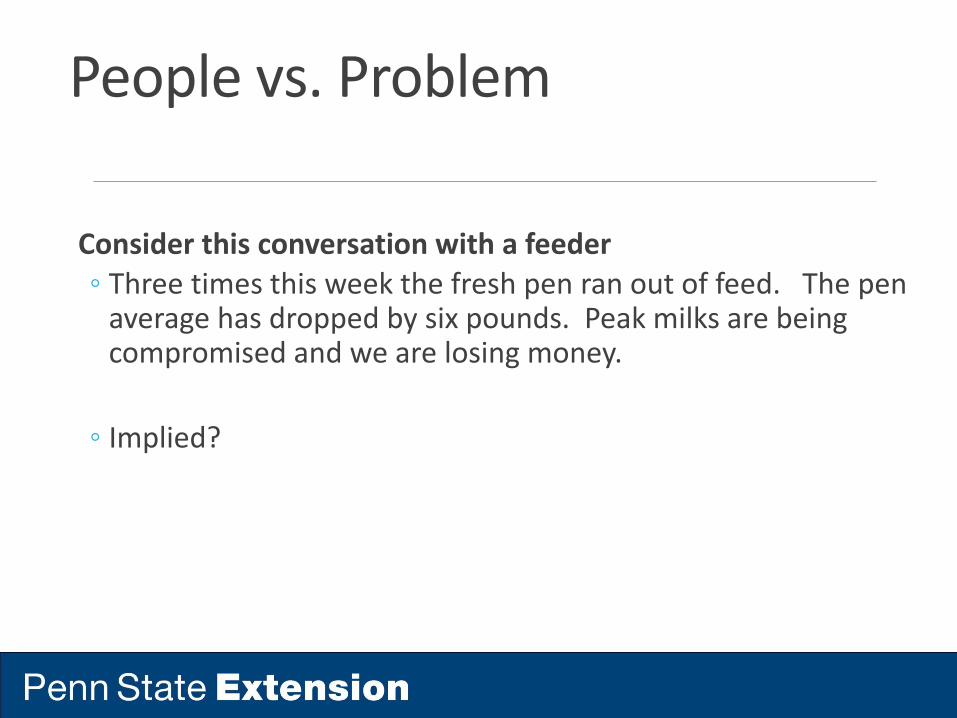
People vs. Problem
Consider this conversation with a feeder◦ Three times this week the fresh pen ran out of feed. The pen
average has dropped by six pounds. Peak milks are being compromised and we are losing money.
◦ Implied?

People vs Problem
•The implied YOU
•Covey – Seek first to
understand.
•Solve PROBLEMS together
People vs. ProblemConsider another conversation with a feeder◦ I wanted to talk with you about a problem that I noticed
this week. You know its important to have the fresh pen feed delivered on time since intakes will greatly impact peaks. In looking at the data , I noticed that feed was late three times on the datasheet. Do you know what has changed and why this is happening?
◦ Implied?
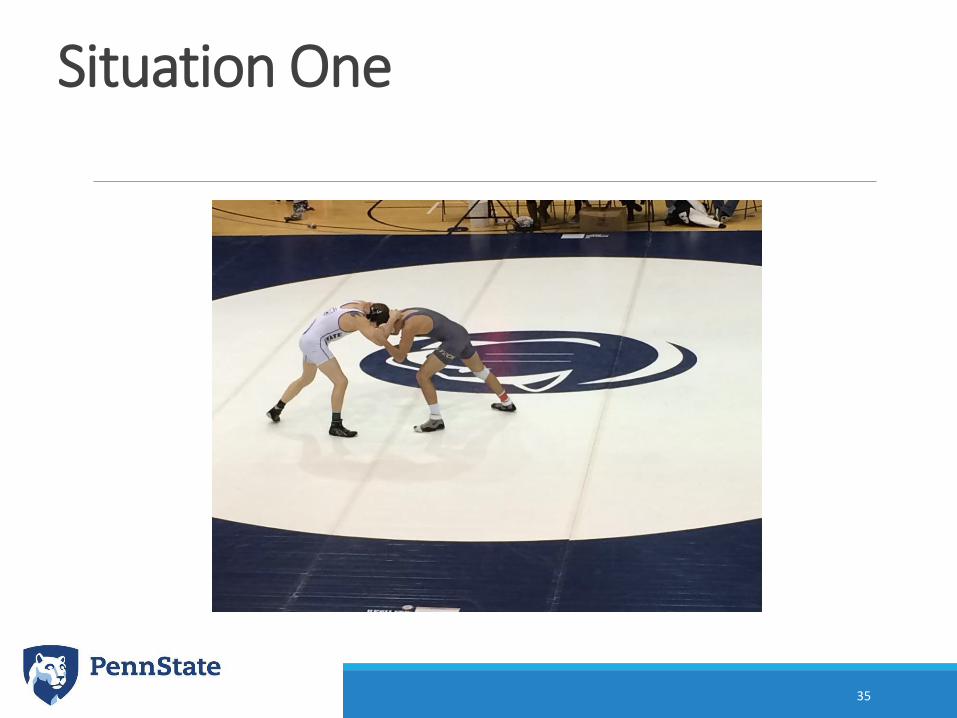
Situation One
35
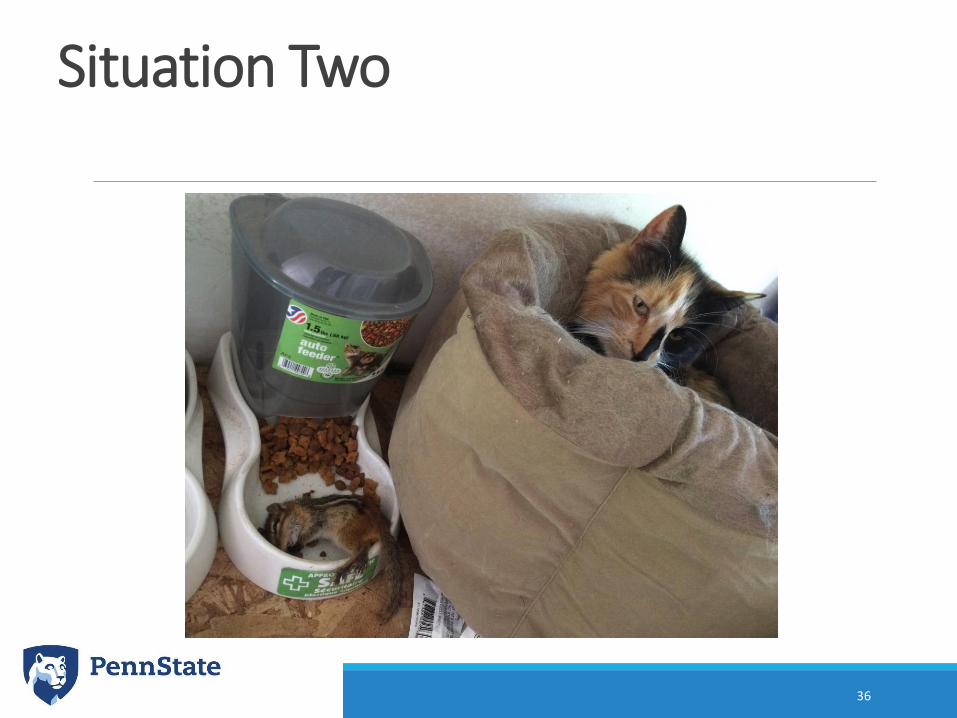
Situation Two
36
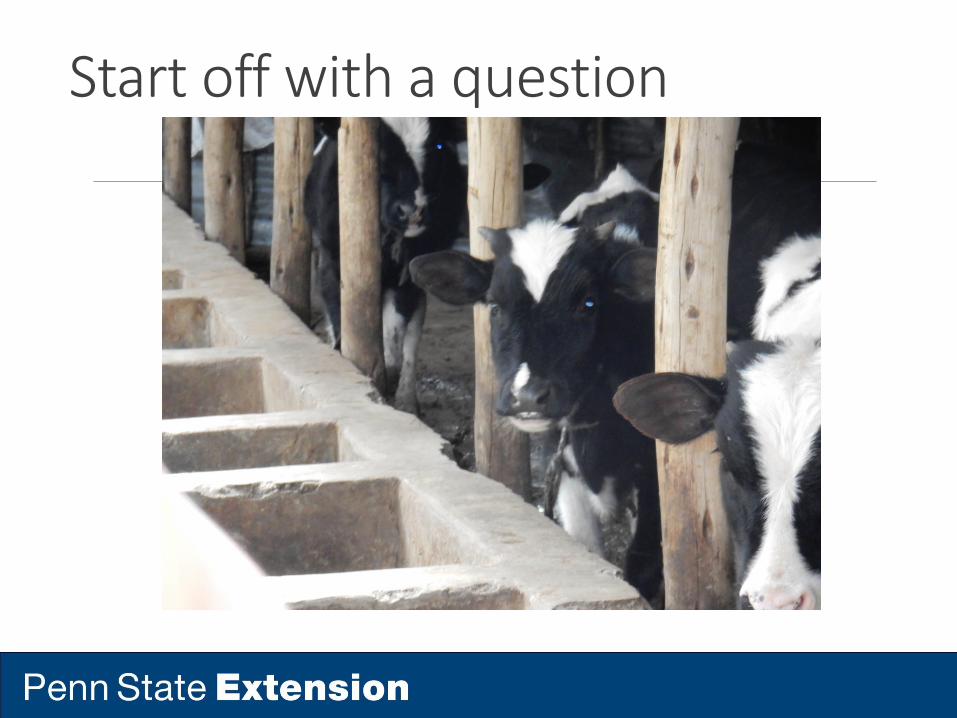
Start off with a question

How do you ask great questions?SENTENCE STARTERS
WHO?
WHAT?
WHEN?
WHERE?
HOW?
Tell me more about that.
TIPS TO REMEMBER
Don’t be afraid of a delay or a break in the conversation!
Silence creates magic!
Focus only on what the person is saying, formulate next question after they’ve finished responding.
Try not to be invested in the outcome, or ask questions that lead.

Action Steps Be aware of differences◦ Adjust when needed.
◦ Clarify expectations◦ Time and money
◦ Start the conversation◦ Ask good questions
11/8/2018
1
Realizing the Potential from your Small Grain forages in the Northeast
Ron HooverCoordinator of on‐farm research
Department of Plant Science
November 1, 2018
Subtitle: Increasing production from each acre… beyond what is possible from corn silage and alfalfa
• Why consider small grain forages?
• Key considerations: opportunities and challenges
• Opportunities to increase output/reduce risk of forage systems
• Paying attention to the agronomics
• Performance of recent small grain/cover crop trials
• Other possible crops/systems
NOT advocating abandonment of corn silage OR alfalfa
11/8/2018
2
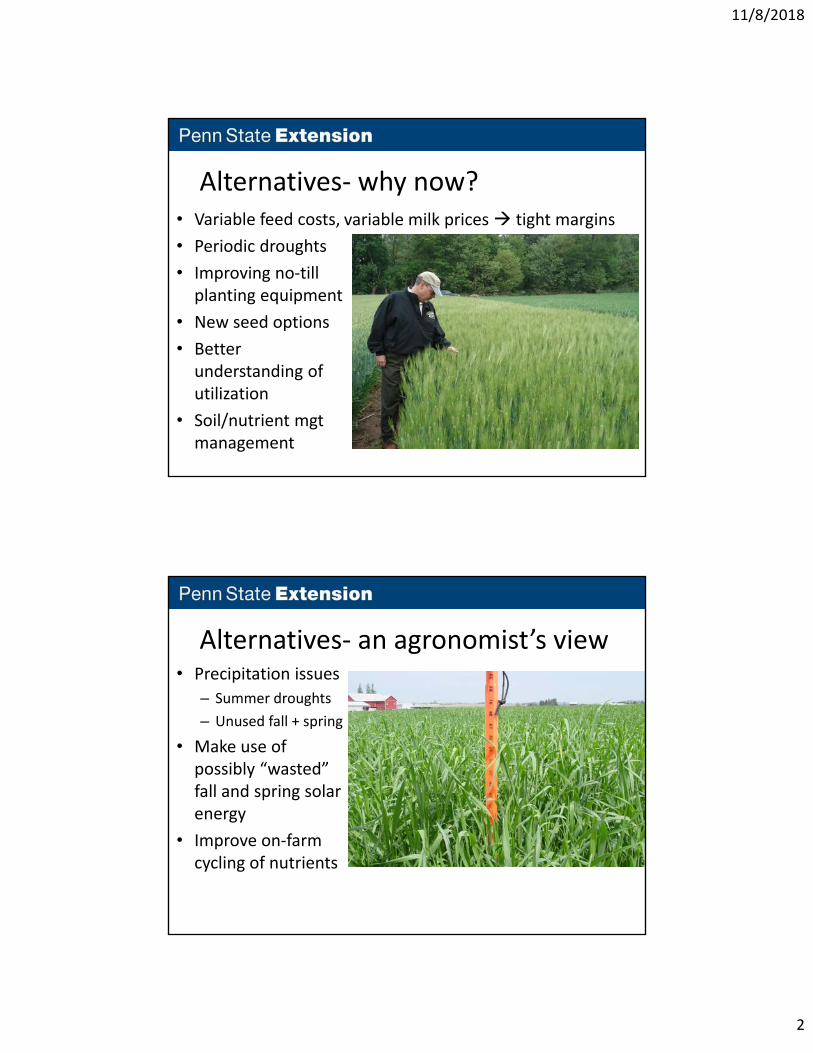
Alternatives‐ why now?• Variable feed costs,
• Periodic droughts
• Improving no‐till planting equipment
• New seed options
• Better understanding of utilization
• Soil/nutrient mgtmanagement
variable milk prices tight margins
Alternatives‐ an agronomist’s view• Precipitation issues
– Summer droughts
– Unused fall + spring
• Make use of possibly “wasted” fall and spring solar energy
• Improve on‐farm cycling of nutrients
11/8/2018
3
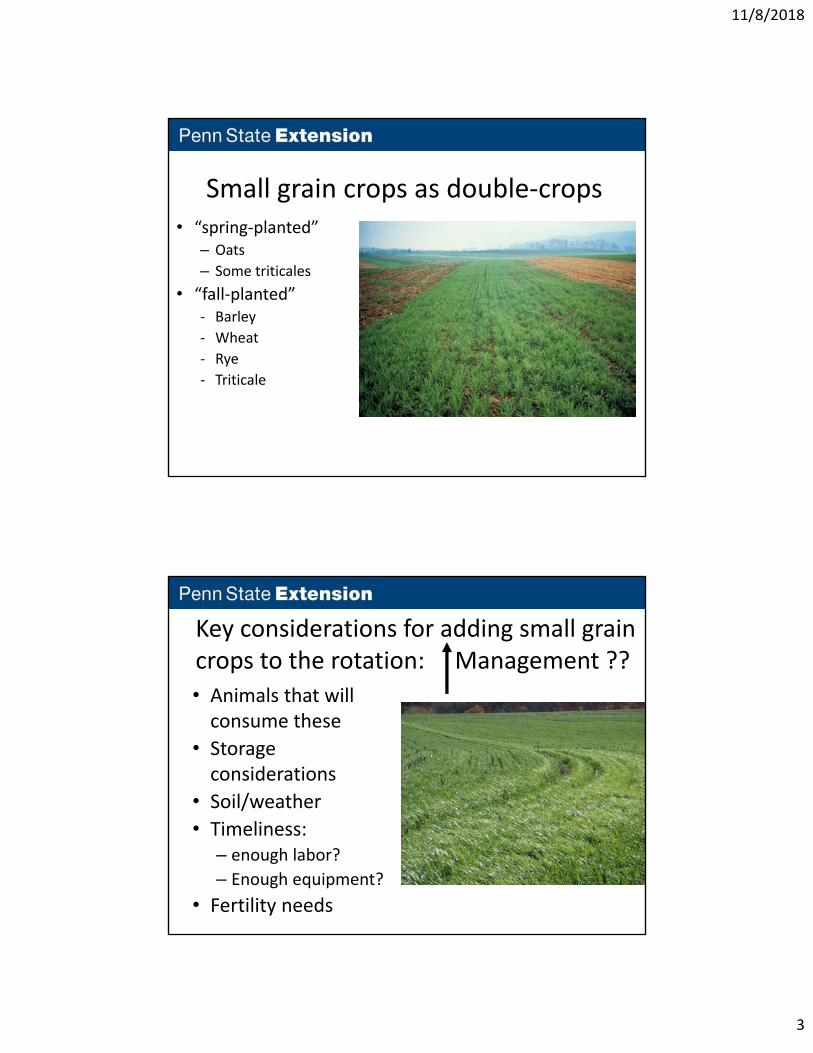
Small grain crops as double‐crops• “spring‐planted”
– Oats
– Some triticales
• “fall‐planted”‐ Barley
‐ Wheat
‐ Rye
‐ Triticale
Key considerations for adding small grain crops to the rotation: Management ??
• Animals that will consume these
• Storage considerations
• Soil/weather
• Timeliness:– enough labor?
– Enough equipment?
• Fertility needs
11/8/2018
4
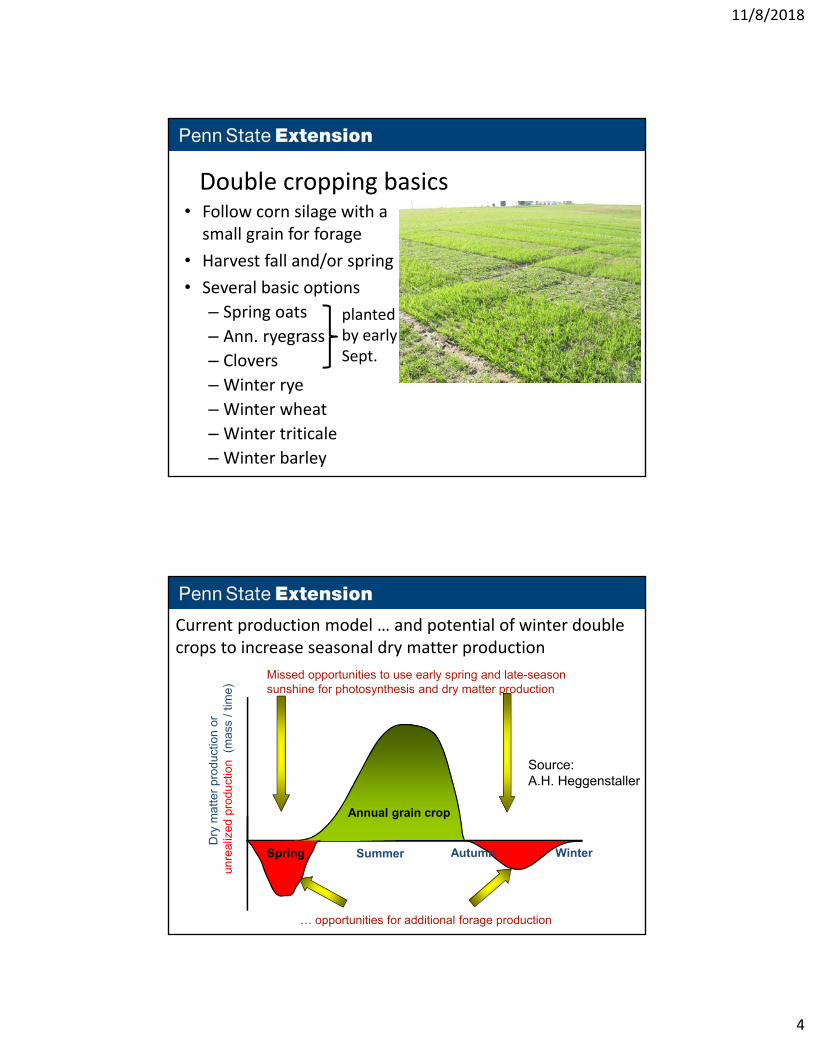
Double cropping basics• Follow corn silage with a small grain for forage
• Harvest fall and/or spring
• Several basic options
– Spring oats
– Ann. ryegrass
– Clovers
– Winter rye
– Winter wheat
– Winter triticale
– Winter barley
planted by early Sept.
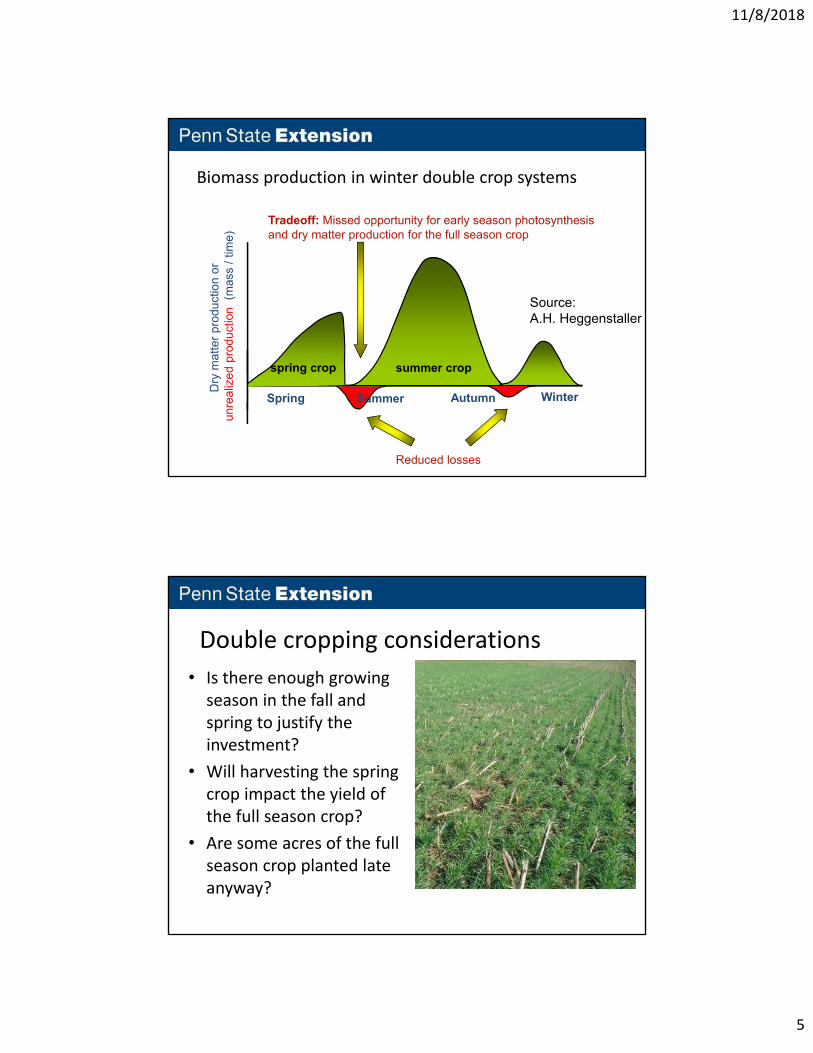
Current production model … and potential of winter double crops to increase seasonal dry matter production
Summer
Dry
mat
ter
prod
uctio
n (m
ass
/ tim
e)
Annual grain crop
Winter
Missed opportunities to use early spring and late-seasonsunshine for photosynthesis and dry matter production
… opportunities for additional forage production
Dry
mat
ter
prod
uctio
n or
un
real
ized
pro
duct
ion
(mas
s / t
ime)
Source:A.H. Heggenstaller
Spring Autumn
11/8/2018
5
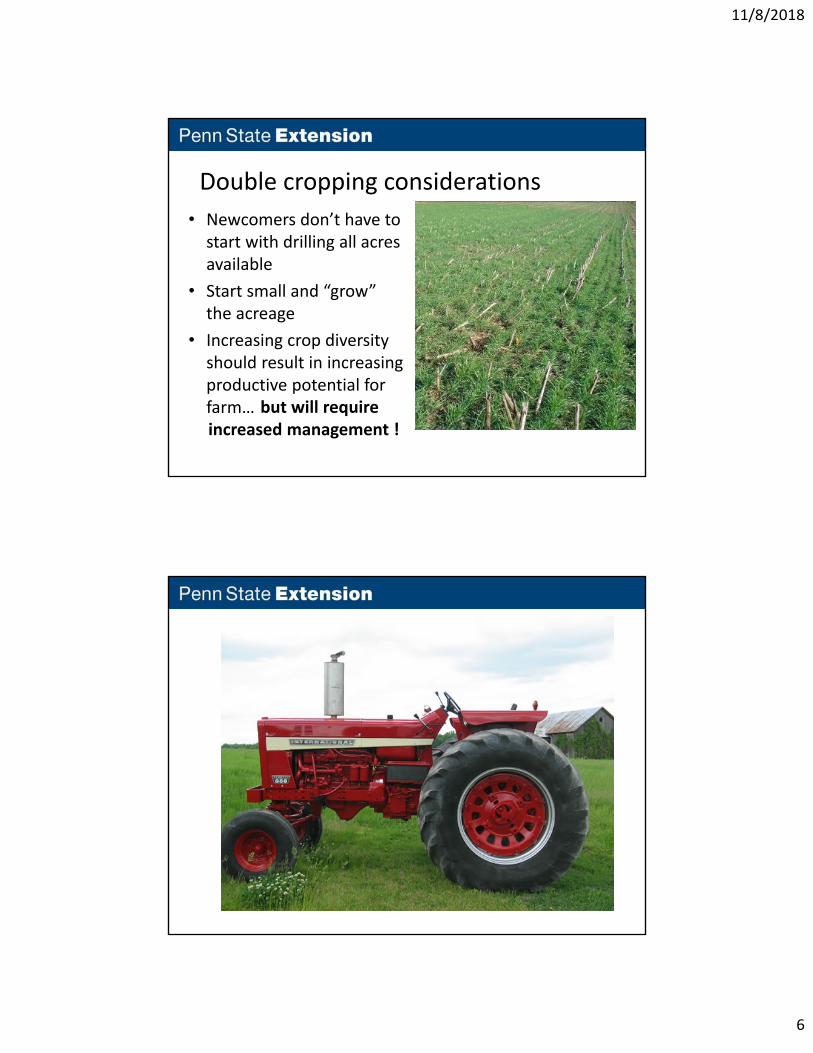
Biomass production in winter double crop systems
AutumnDry
mat
ter
prod
uctio
n (m
ass
/ tim
e)
spring crop
Spring Winter
summer crop
Tradeoff: Missed opportunity for early season photosynthesisand dry matter production for the full season crop
Reduced losses
Dry
mat
ter
prod
uctio
n or
un
real
ized
pro
duct
ion
(m
ass
/ tim
e)
Source:A.H. Heggenstaller
Summer
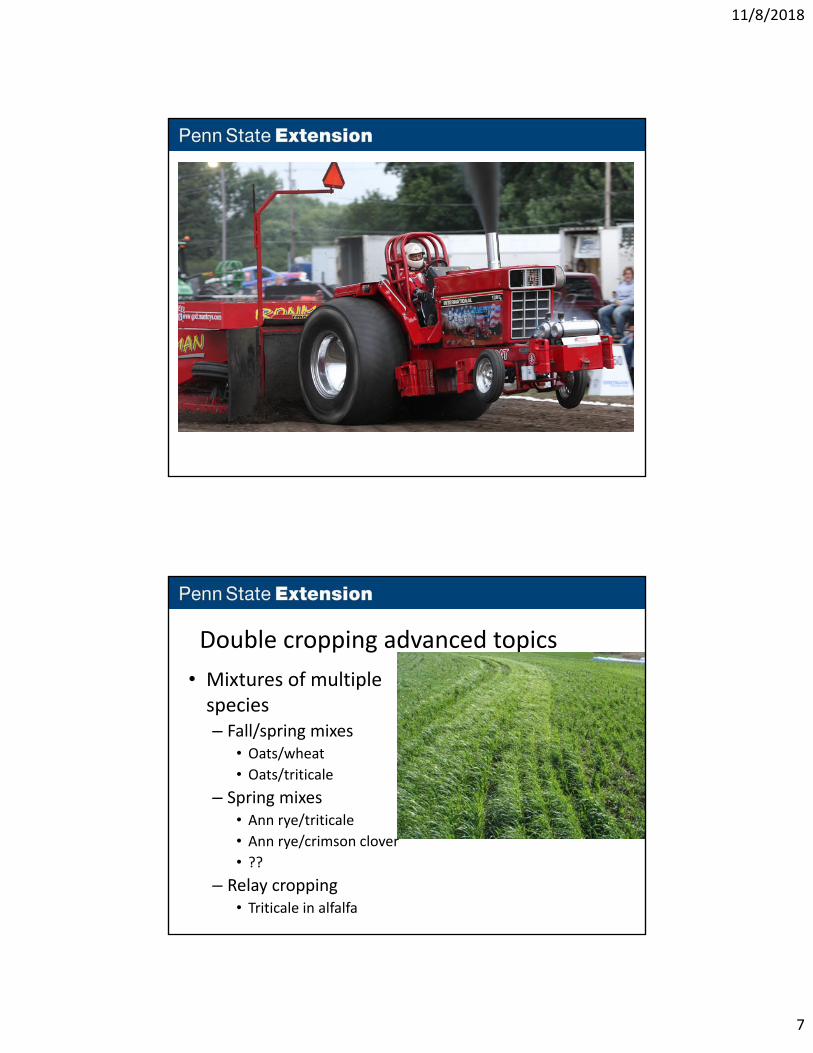
Double cropping considerations
• Is there enough growing season in the fall and spring to justify the investment?
• Will harvesting the spring crop impact the yield of the full season crop?
• Are some acres of the full season crop planted late anyway?
11/8/2018
6
Double cropping considerations
• Newcomers don’t have to start with drilling all acres available
• Start small and “grow” the acreage
• Increasing crop diversity should result in increasing productive potential for farm… but will require increased management !
11/8/2018
7
Double cropping advanced topics
• Mixtures of multiple species– Fall/spring mixes
• Oats/wheat
• Oats/triticale
– Spring mixes• Ann rye/triticale
• Ann rye/crimson clover
• ??
– Relay cropping• Triticale in alfalfa
11/8/2018
8
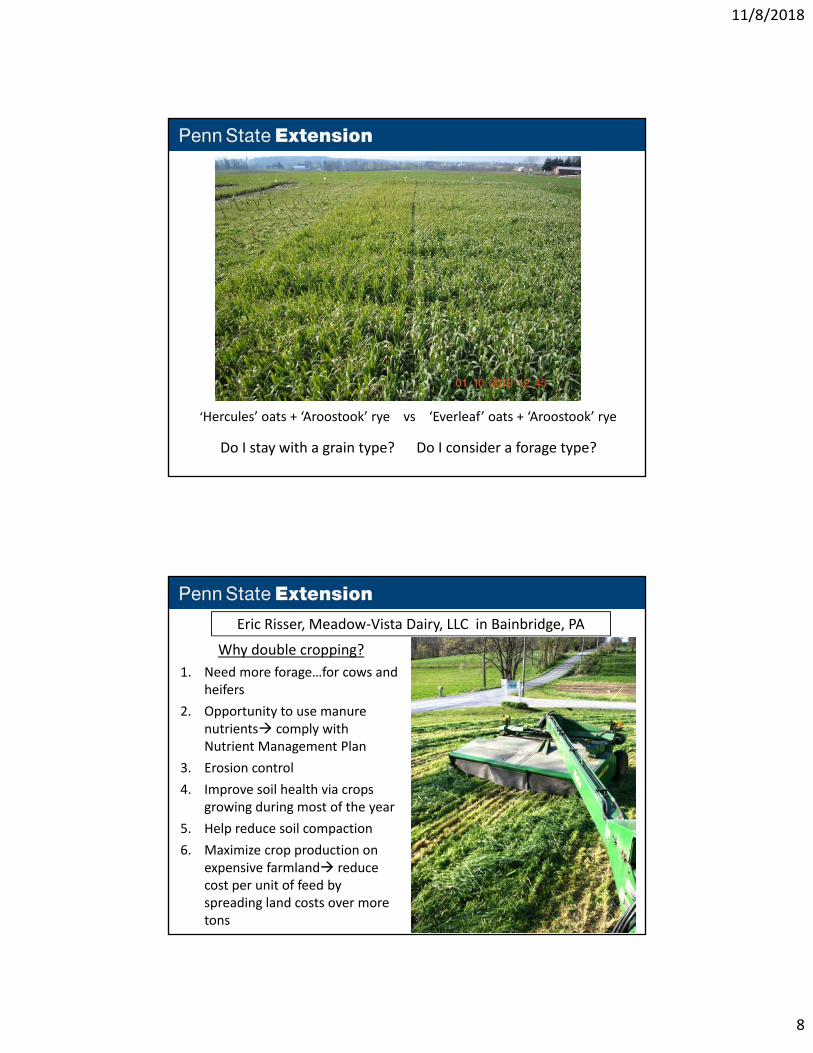
‘Hercules’ oats + ‘Aroostook’ rye vs ‘Everleaf’ oats + ‘Aroostook’ rye
Do I stay with a grain type? Do I consider a forage type?
Eric Risser, Meadow‐Vista Dairy, LLC in Bainbridge, PA
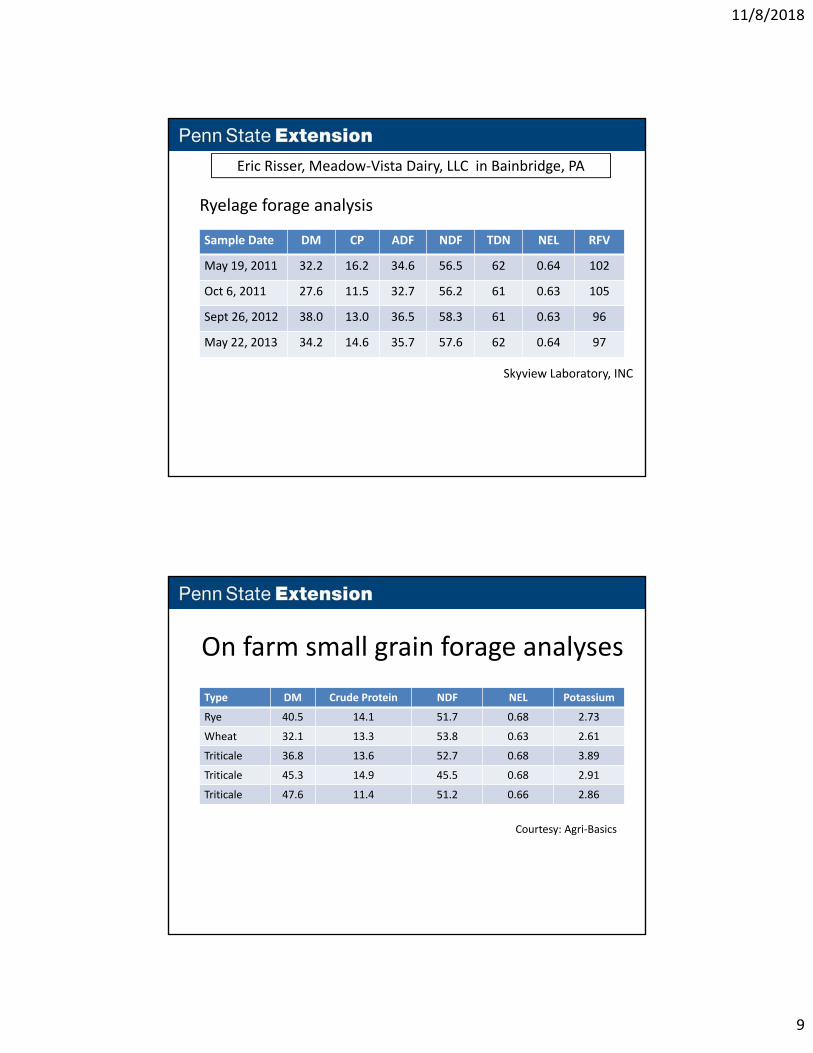
Why double cropping?
1. Need more forage…for cows and heifers
2. Opportunity to use manure nutrients comply with Nutrient Management Plan
3. Erosion control
4. Improve soil health via crops growing during most of the year
5. Help reduce soil compaction
6. Maximize crop production on expensive farmland reduce cost per unit of feed by spreading land costs over more tons
11/8/2018
9
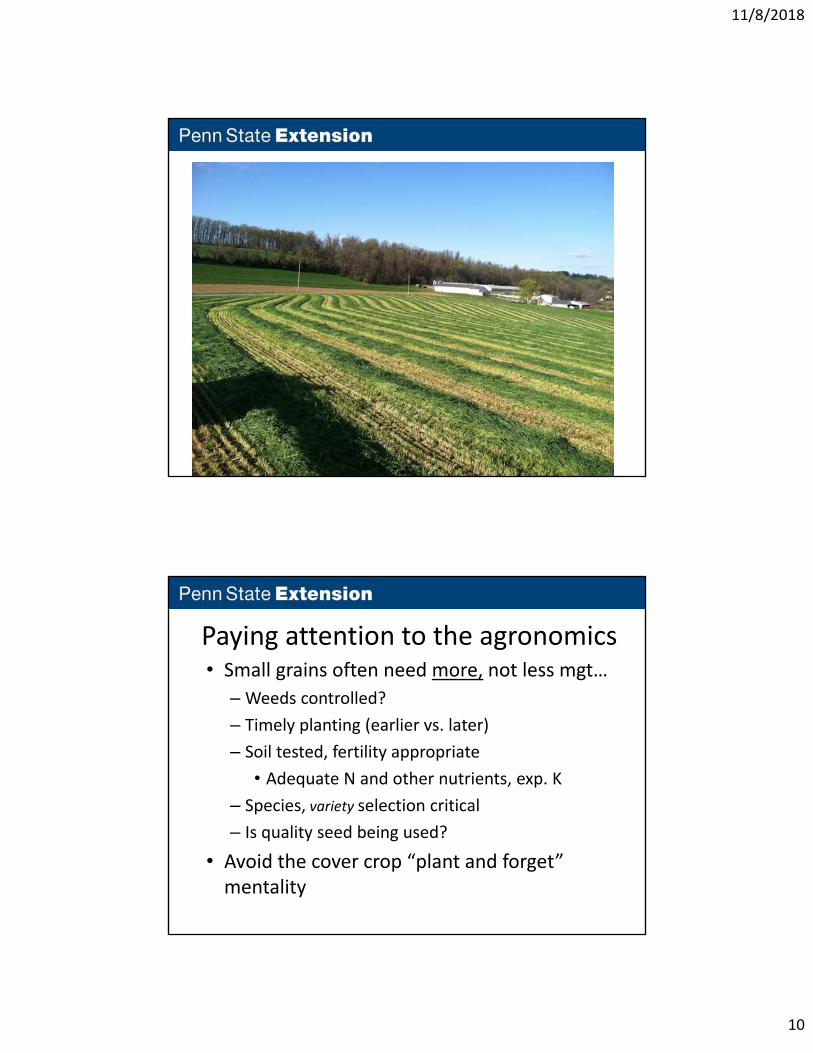
Ryelage forage analysis
Sample Date DM CP ADF NDF TDN NEL RFV
May 19, 2011 32.2 16.2 34.6 56.5 62 0.64 102
Oct 6, 2011 27.6 11.5 32.7 56.2 61 0.63 105
Sept 26, 2012 38.0 13.0 36.5 58.3 61 0.63 96
May 22, 2013 34.2 14.6 35.7 57.6 62 0.64 97
Skyview Laboratory, INC
Eric Risser, Meadow‐Vista Dairy, LLC in Bainbridge, PA
On farm small grain forage analyses
Type DM Crude Protein NDF NEL Potassium
Rye 40.5 14.1 51.7 0.68 2.73
Wheat 32.1 13.3 53.8 0.63 2.61
Triticale 36.8 13.6 52.7 0.68 3.89
Triticale 45.3 14.9 45.5 0.68 2.91
Triticale 47.6 11.4 51.2 0.66 2.86
Courtesy: Agri‐Basics
11/8/2018
10
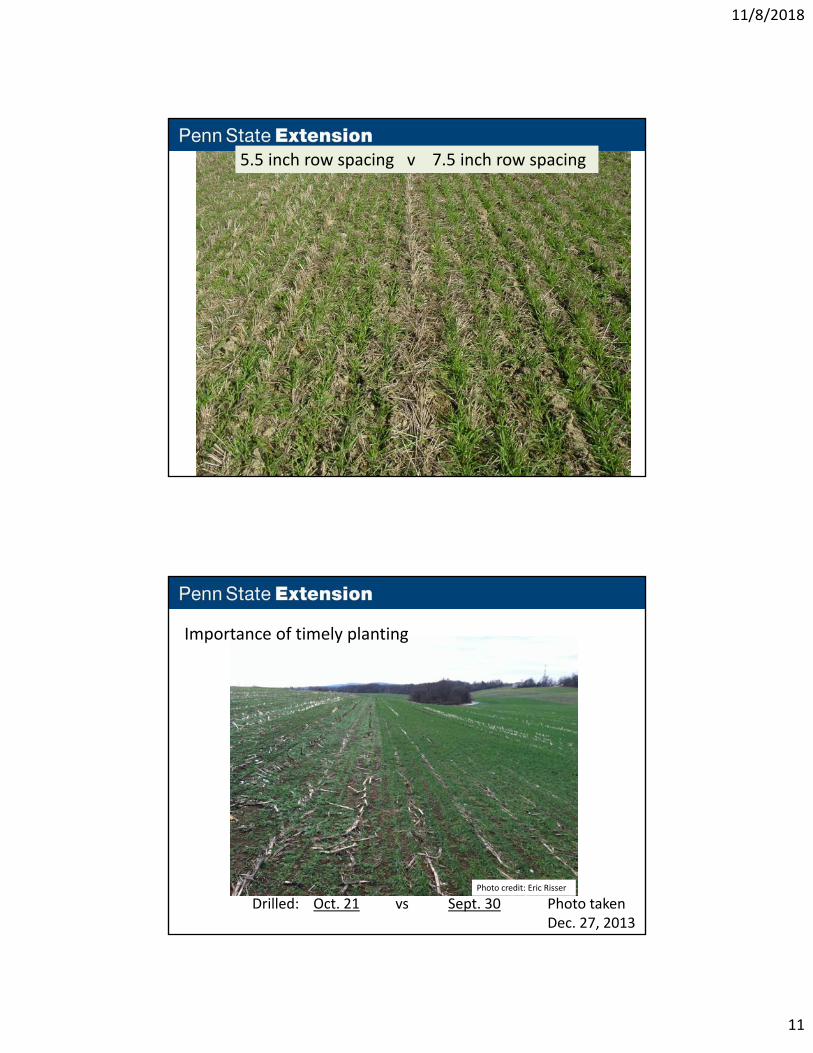
Paying attention to the agronomics• Small grains often need more, not less mgt…
– Weeds controlled?
– Timely planting (earlier vs. later)
– Soil tested, fertility appropriate
• Adequate N and other nutrients, exp. K
– Species, variety selection critical
– Is quality seed being used?
• Avoid the cover crop “plant and forget” mentality
11/8/2018
11
5.5 inch row spacing v 7.5 inch row spacing
Photo taken Dec. 27, 2013
Drilled: Oct. 21 vs Sept. 30
Importance of timely planting
Photo credit: Eric Risser
11/8/2018
12
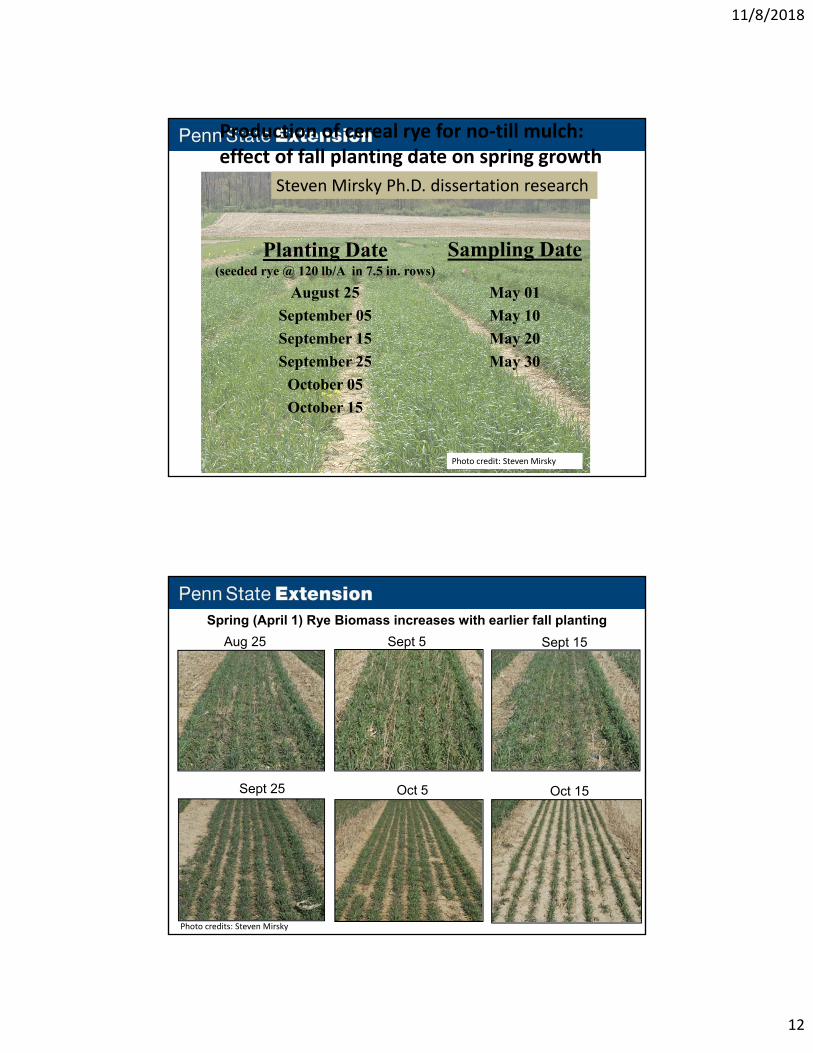
Planting Date(seeded rye @ 120 lb/A in 7.5 in. rows)
August 25
September 05
September 15
September 25
October 05
October 15
Sampling Date
May 01
May 10
May 20
May 30
Production of cereal rye for no‐till mulch: effect of fall planting date on spring growth
Photo credit: Steven Mirsky
Steven Mirsky Ph.D. dissertation research
Spring (April 1) Rye Biomass increases with earlier fall planting
Aug 25
Oct 15
Sept 15
Oct 5Sept 25
Sept 5
Photo credits: Steven Mirsky
11/8/2018
13
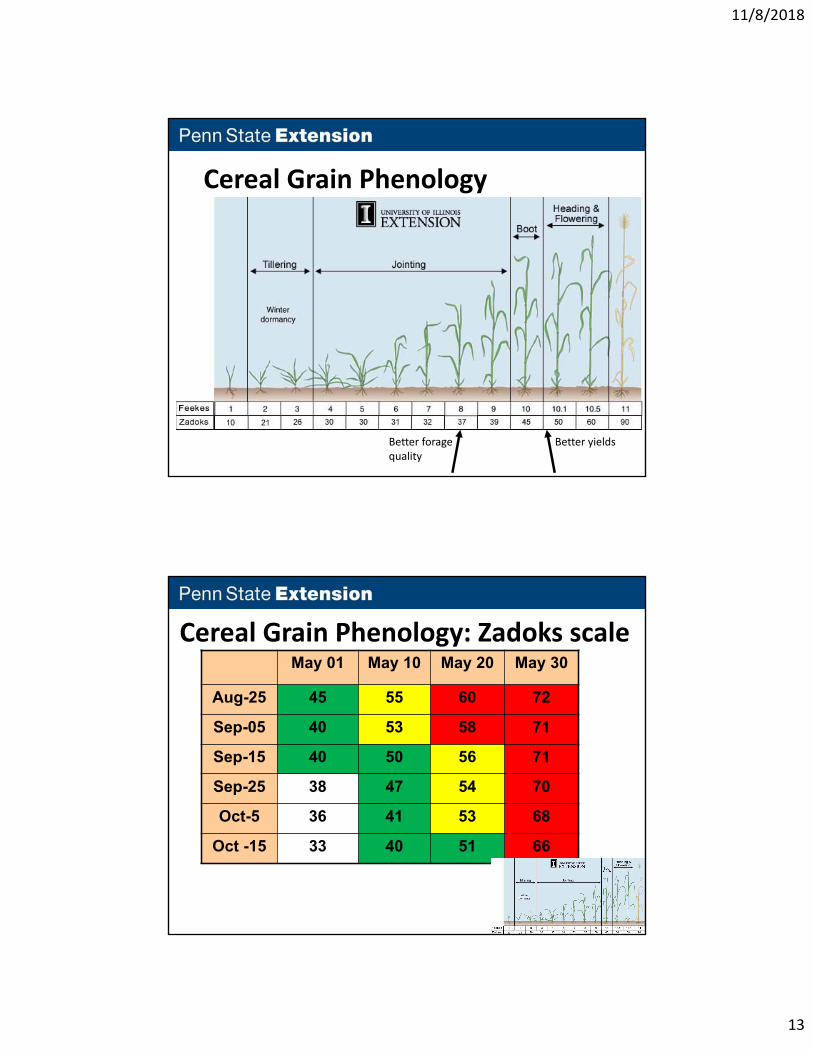
Cereal Grain Phenology
Better yieldsBetter foragequality
Cereal Grain Phenology: Zadoks scale May 01 May 10 May 20 May 30
Aug-25 45 55 60 72
Sep-05 40 53 58 71
Sep-15 40 50 56 71
Sep-25 38 47 54 70
Oct-5 36 41 53 68
Oct -15 33 40 51 66
11/8/2018
14
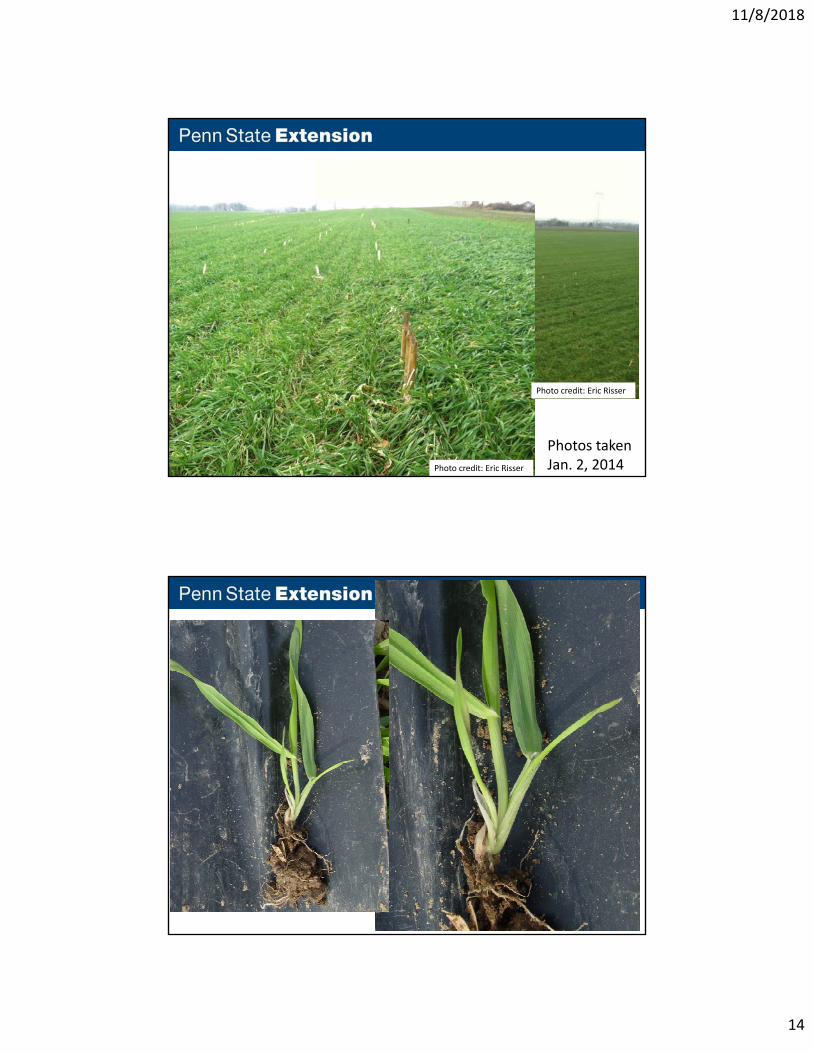
Photos taken Jan. 2, 2014Photo credit: Eric Risser
Photo credit: Eric Risser
11/8/2018
15
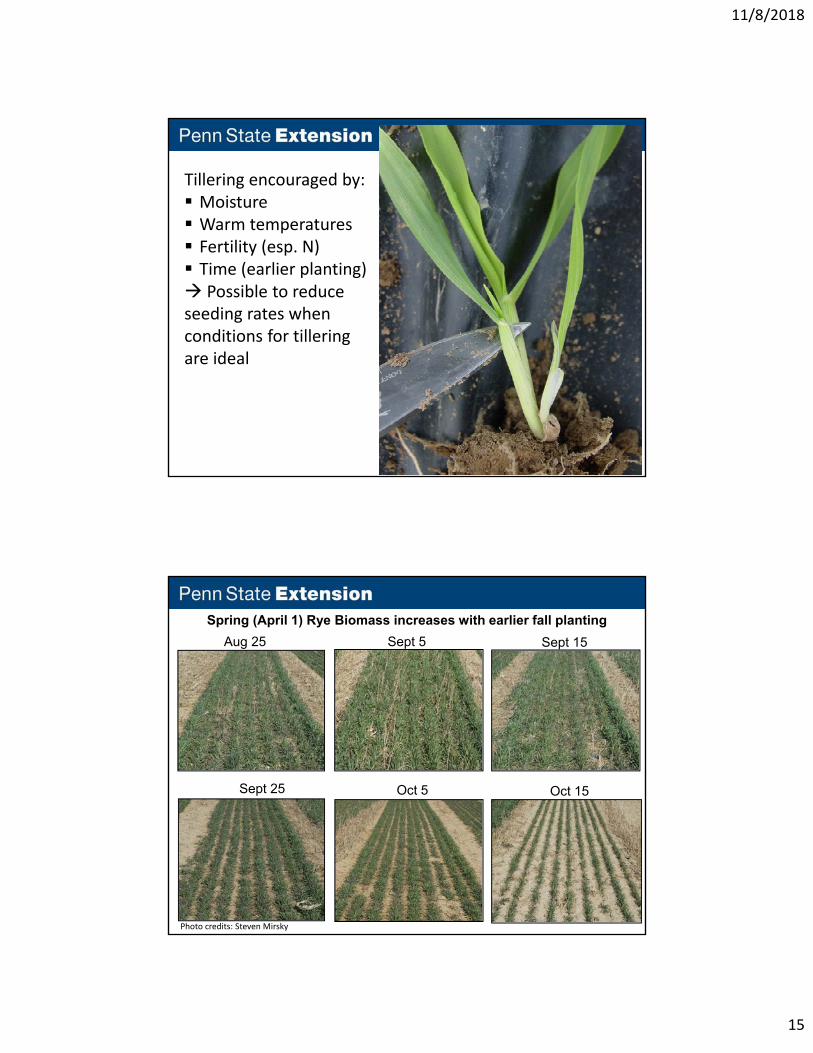
Tillering encouraged by: Moisture Warm temperatures Fertility (esp. N) Time (earlier planting) Possible to reduce seeding rates when conditions for tilleringare ideal
Spring (April 1) Rye Biomass increases with earlier fall planting
Aug 25
Oct 15
Sept 15
Oct 5Sept 25
Sept 5
Photo credits: Steven Mirsky
11/8/2018
16
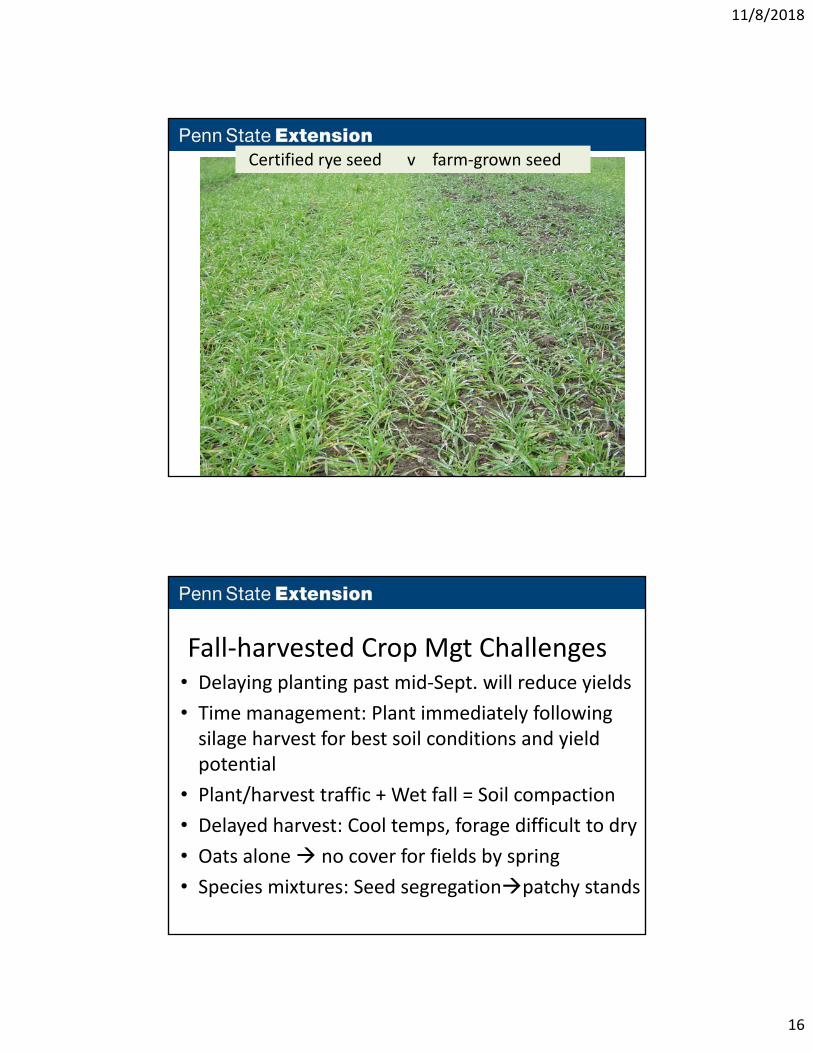
Certified rye seed v farm‐grown seed
Fall‐harvested Crop Mgt Challenges• Delaying planting past mid‐Sept. will reduce yields
• Time management: Plant immediately following silage harvest for best soil conditions and yield potential
• Plant/harvest traffic + Wet fall = Soil compaction
• Delayed harvest: Cool temps, forage difficult to dry
• Oats alone no cover for fields by spring
• Species mixtures: Seed segregationpatchy stands
11/8/2018
17
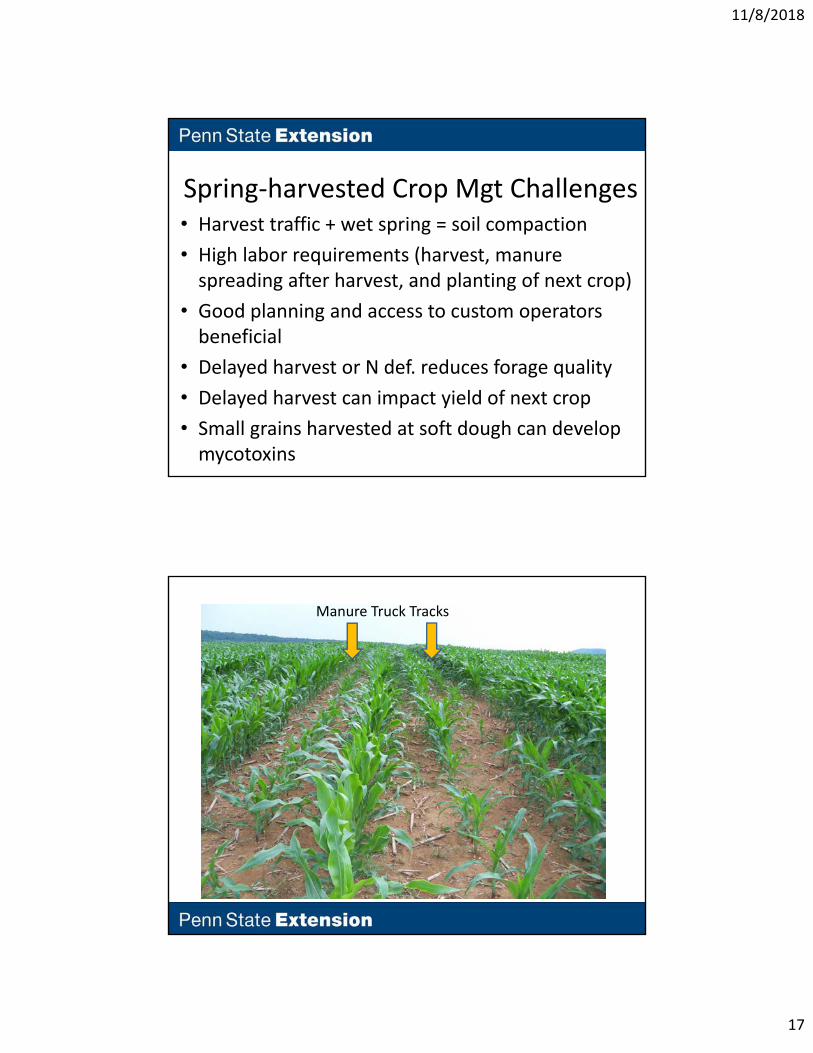
Spring‐harvested Crop Mgt Challenges• Harvest traffic + wet spring = soil compaction
• High labor requirements (harvest, manure spreading after harvest, and planting of next crop)
• Good planning and access to custom operators beneficial
• Delayed harvest or N def. reduces forage quality
• Delayed harvest can impact yield of next crop
• Small grains harvested at soft dough can develop mycotoxins
Manure Truck Tracks
11/8/2018
18
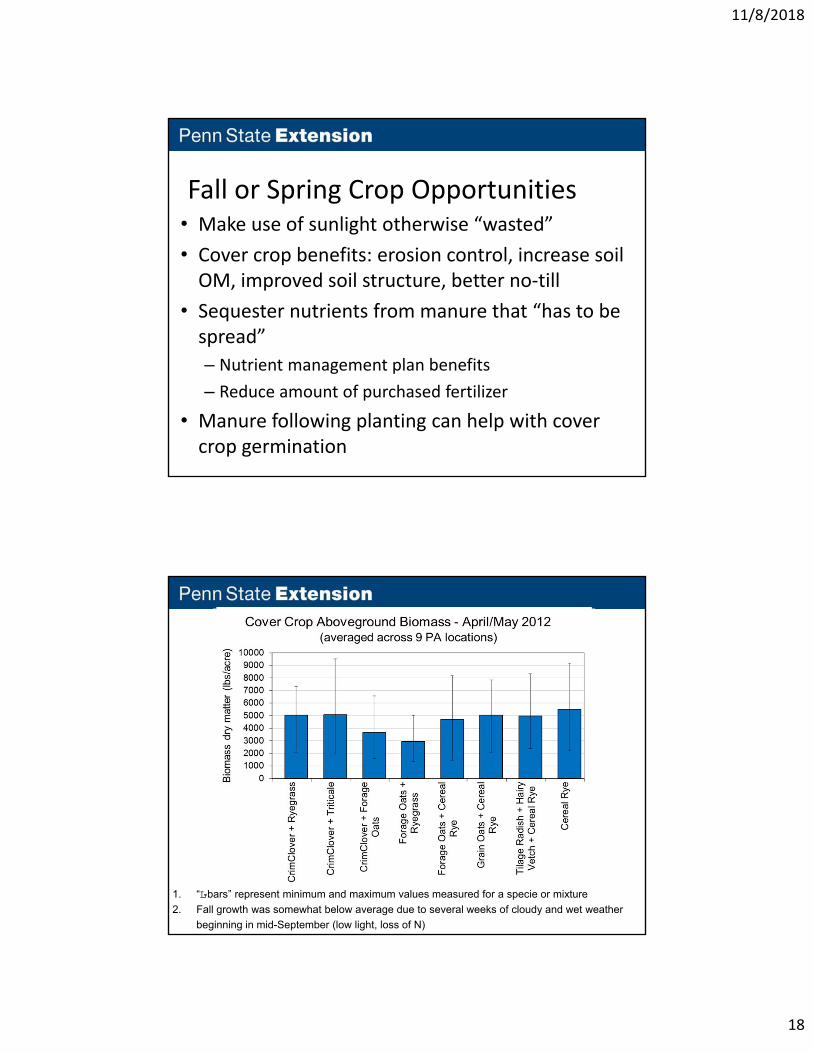
Fall or Spring Crop Opportunities• Make use of sunlight otherwise “wasted”
• Cover crop benefits: erosion control, increase soil OM, improved soil structure, better no‐till
• Sequester nutrients from manure that “has to be spread”
– Nutrient management plan benefits
– Reduce amount of purchased fertilizer
• Manure following planting can help with cover crop germination
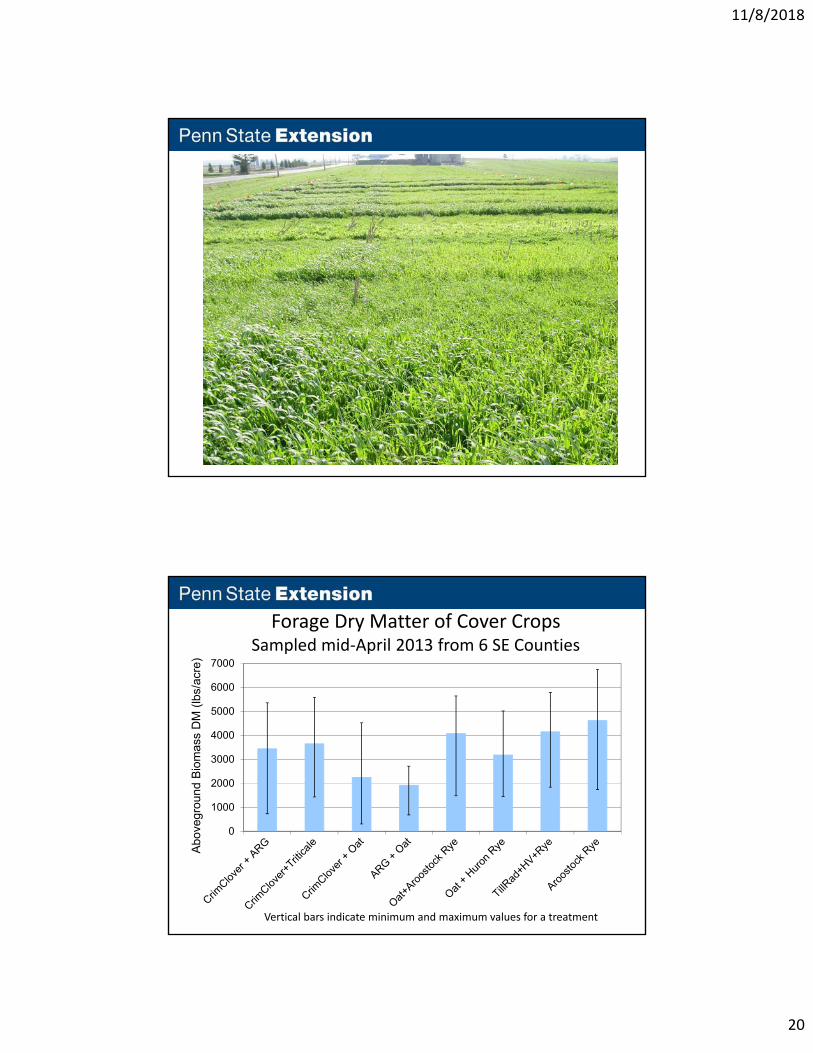
1. “�-bars” represent minimum and maximum values measured for a specie or mixture
2. Fall growth was somewhat below average due to several weeks of cloudy and wet weather
beginning in mid-September (low light, loss of N)
11/8/2018
19
0
50
100
150
200
250
300
Crim
Clo
ver+
Rye
gra
ss
Tri
tical
e+
Rye
gra
ss
Oa
ts+
Rye
Ra
pe+
HV
etc
h+
Rye
Till
Rad
+H
Vet
ch+
Rye
Till
Rad
+R
ye
Rye
Cap
ture
d N
(lb
s/ac
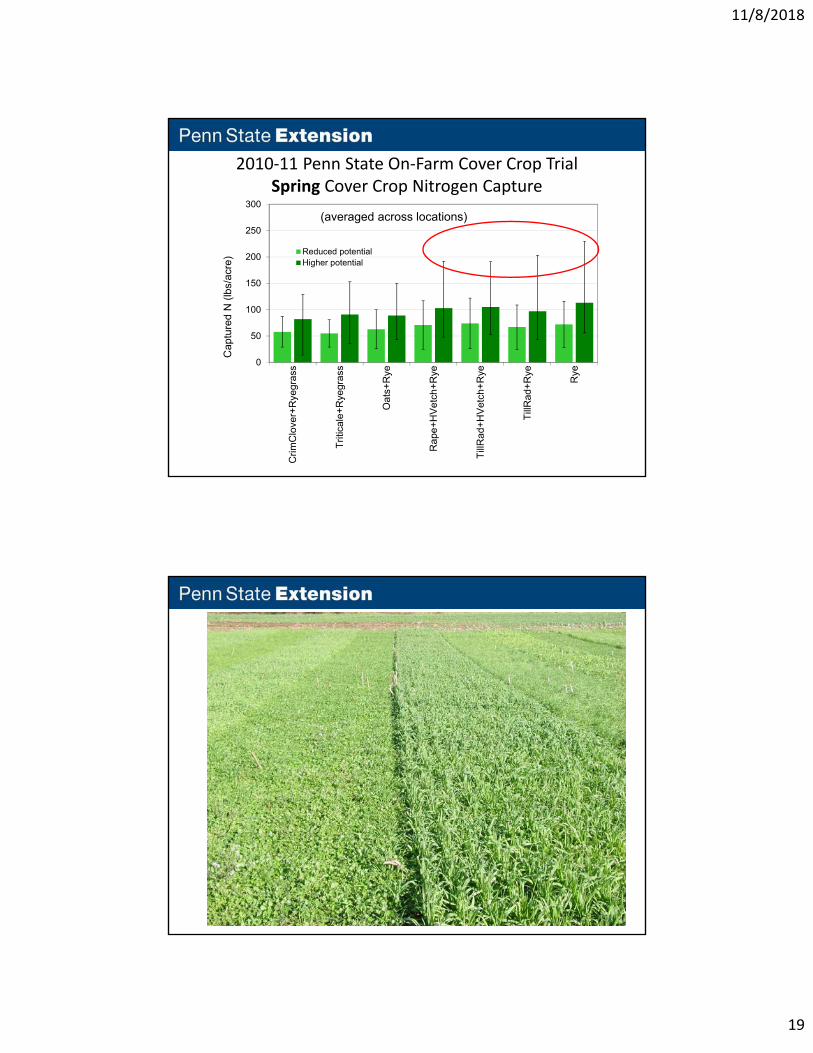
re) Reduced potential
Higher potential
(averaged across locations)
2010‐11 Penn State On‐Farm Cover Crop TrialSpring Cover Crop Nitrogen Capture
11/8/2018
20
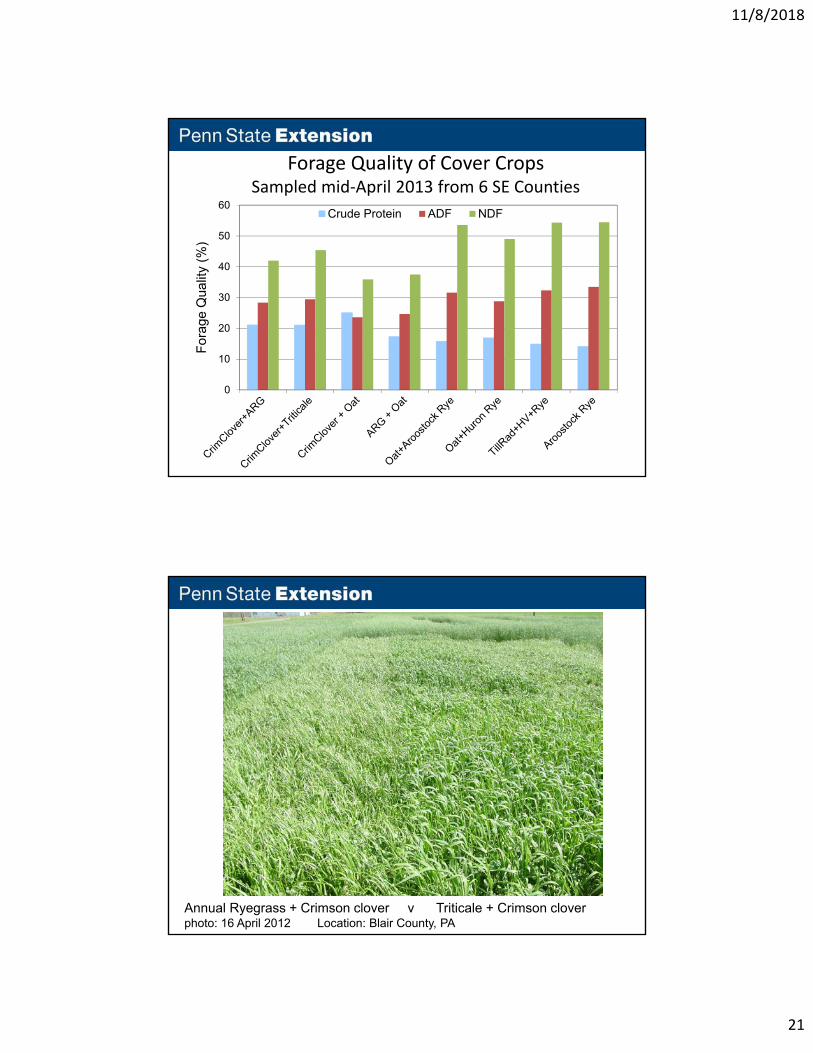
Forage Dry Matter of Cover CropsSampled mid‐April 2013 from 6 SE Counties
0
1000
2000
3000
4000
5000
6000
7000
Abo
vegr
ound
Bio
mas
s D
M (
lbs/
acre
)
Vertical bars indicate minimum and maximum values for a treatment
11/8/2018
21
Forage Quality of Cover CropsSampled mid‐April 2013 from 6 SE Counties
0
10
20
30
40
50
60F
orag
e Q
ualit
y (%
)Crude Protein ADF NDF
Annual Ryegrass + Crimson clover v Triticale + Crimson cloverphoto: 16 April 2012 Location: Blair County, PA
11/8/2018
22
Aroostock Rye @ late boot/early head Photo: 16 April 2012 Location: Blair County, PA
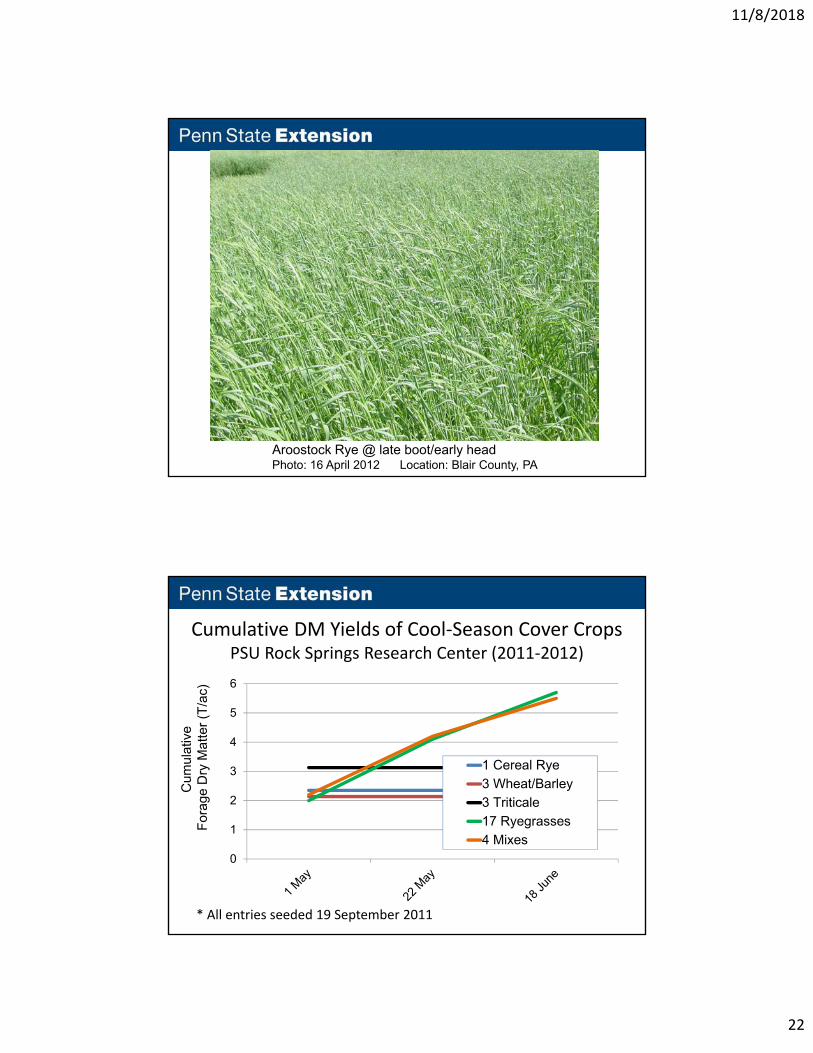
Cumulative DM Yields of Cool‐Season Cover CropsPSU Rock Springs Research Center (2011‐2012)
0
1
2
3
4
5
6
1 Cereal Rye
3 Wheat/Barley
3 Triticale
17 Ryegrasses
4 Mixes
Cum
ulat
ive
For
age
Dry
Mat
ter
(T/a
c)
* All entries seeded 19 September 2011
11/8/2018
23
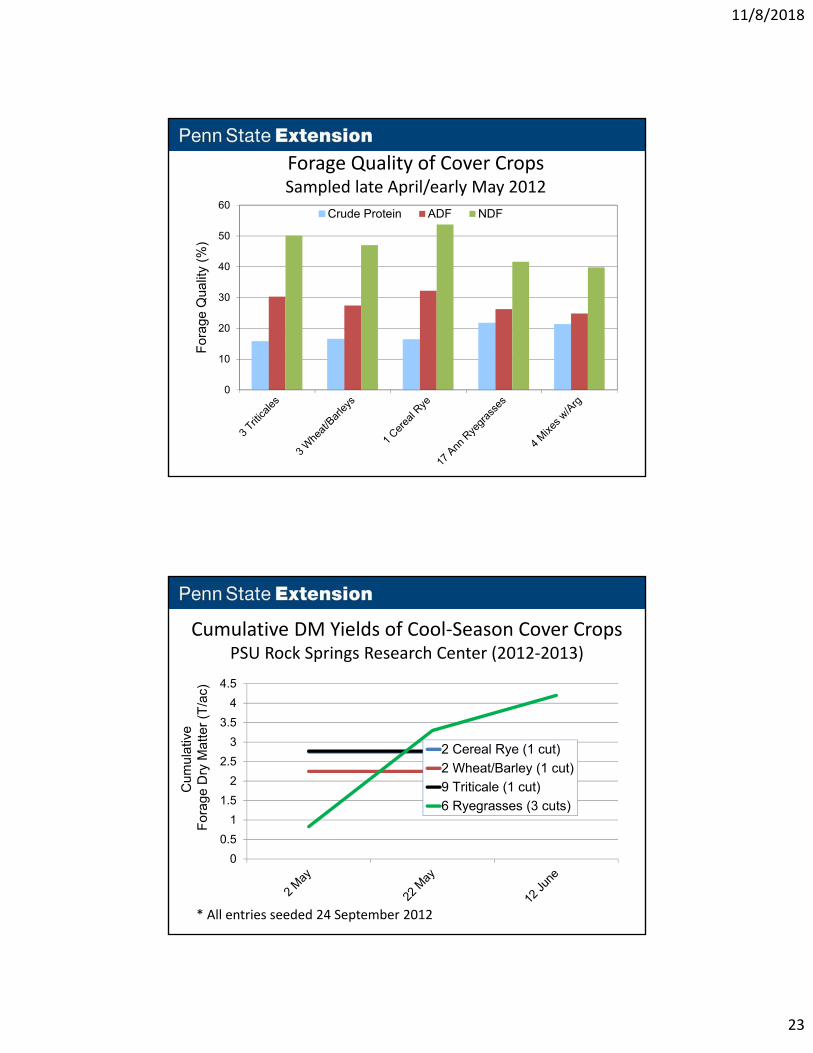
Forage Quality of Cover CropsSampled late April/early May 2012
0
10
20
30
40
50
60F
orag
e Q
ualit
y (%
)Crude Protein ADF NDF
Cumulative DM Yields of Cool‐Season Cover CropsPSU Rock Springs Research Center (2012‐2013)
0
0.5
1
1.5
2
2.5
3
3.5
4
4.5
2 Cereal Rye (1 cut)
2 Wheat/Barley (1 cut)
9 Triticale (1 cut)
6 Ryegrasses (3 cuts)
Cum
ulat
ive
For
age
Dry
Mat
ter
(T/a
c)
* All entries seeded 24 September 2012
11/8/2018
24
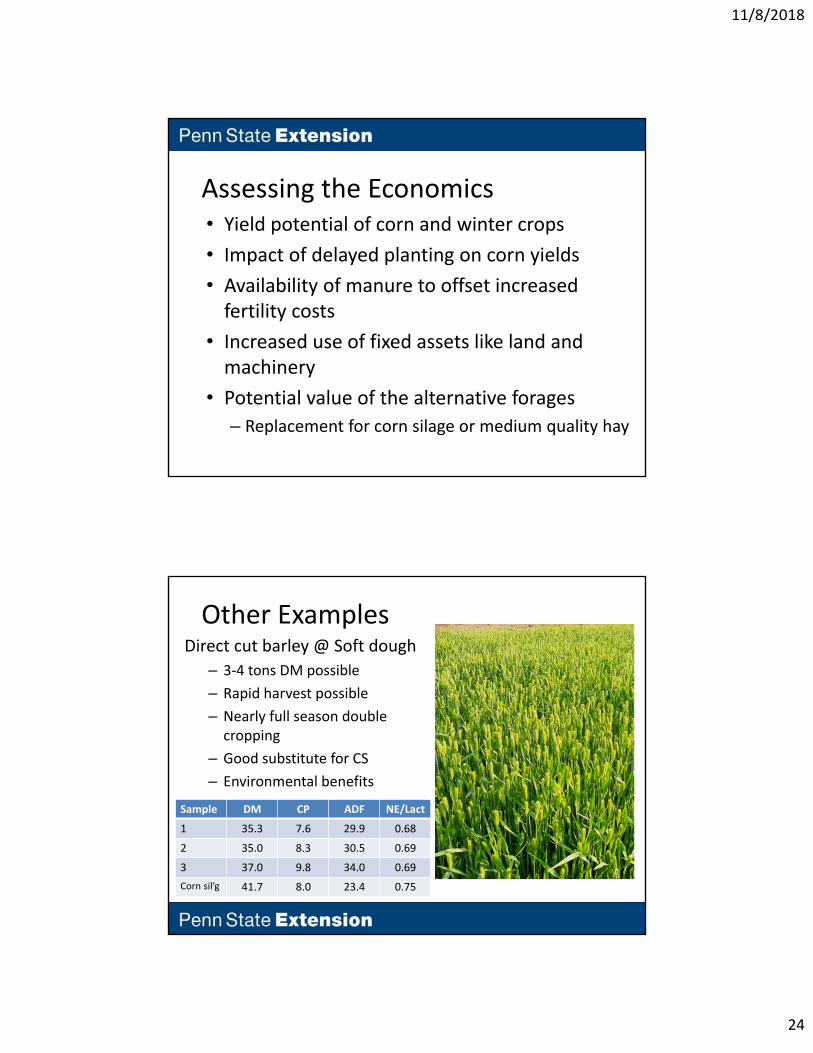
Assessing the Economics• Yield potential of corn and winter crops
• Impact of delayed planting on corn yields
• Availability of manure to offset increased fertility costs
• Increased use of fixed assets like land and machinery
• Potential value of the alternative forages
– Replacement for corn silage or medium quality hay
Direct cut barley @ Soft dough
– 3‐4 tons DM possible
– Rapid harvest possible
– Nearly full season double cropping
– Good substitute for CS
– Environmental benefits
Other Examples
Sample DM CP ADF NE/Lact
1 35.3 7.6 29.9 0.68
2 35.0 8.3 30.5 0.69
3 37.0 9.8 34.0 0.69
Corn sil’g 41.7 8.0 23.4 0.75
11/8/2018
25
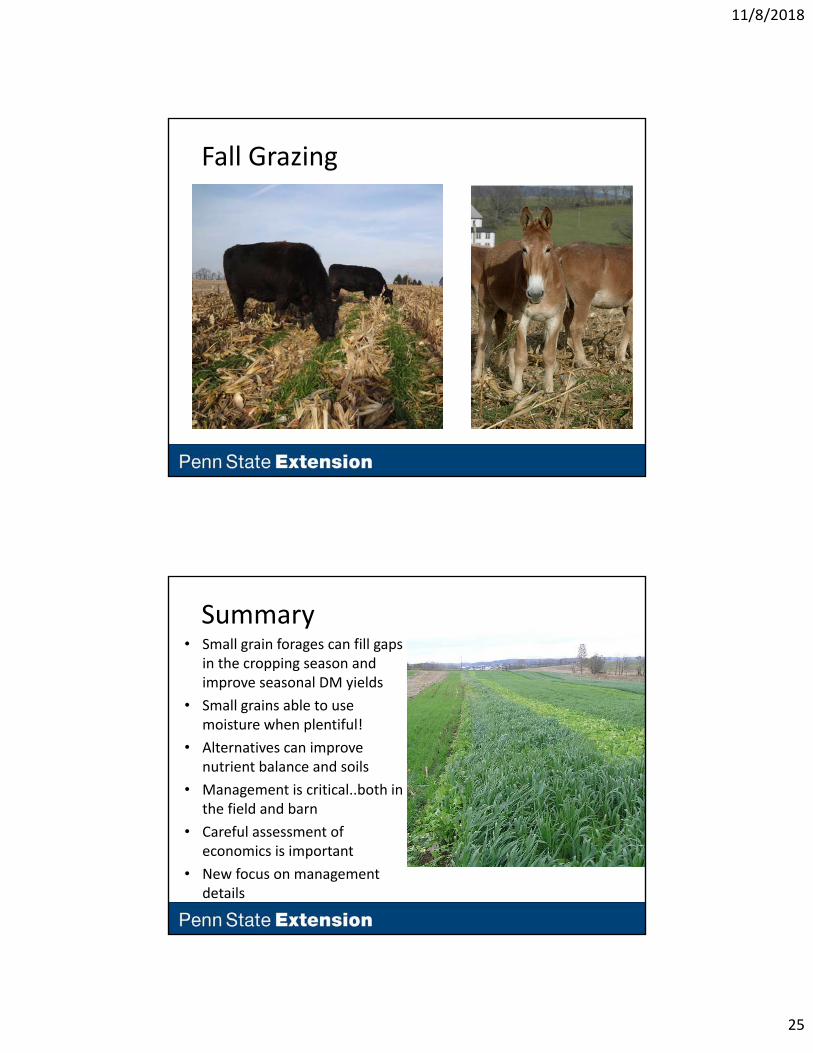
Fall Grazing
Summary• Small grain forages can fill gaps
in the cropping season and improve seasonal DM yields
• Small grains able to use moisture when plentiful!
• Alternatives can improve nutrient balance and soils
• Management is critical..both in the field and barn
• Careful assessment of economics is important
• New focus on management details
11/8/2018
26
Discussion/Questions?
11/9/2018
1
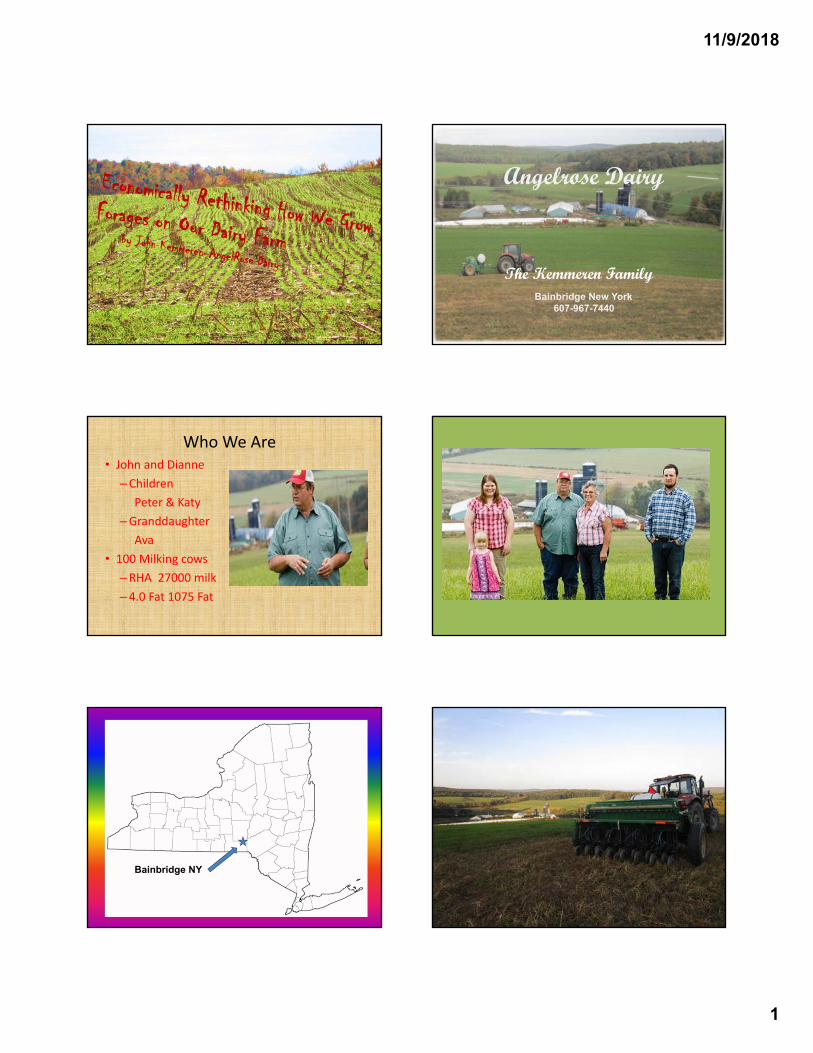
Angelrose Dairy
The Kemmeren FamilyBainbridge New York
607-967-7440
Angelrose Dairy
The Kemmeren FamilyBainbridge New York
607-967-7440
Who We Are• John and Dianne
– ChildrenPeter & Katy
– GranddaughterAva
• 100 Milking cows– RHA 27000 milk– 4.0 Fat 1075 Fat
Bainbridge NY
11/9/2018
2
• Why Am I Farming?• Is It Fun?• What is The Future?• Am I Scared?
• Have a Plan- At Least an Idea.• The Highest Yield is My Goal #1• Cutting Costs is Second #2• Learn From Others. Successes and Failures.• Attend Many Meetings. Great Advice and Free
Food.• Every Failure is a test Plot Learning Experience.• Can I Seed Two things at Once.• Take Many Photos for Your Records.• Write it Down. Paper and Pen or Tablet.• Grow Cow Quality Feedstuff.
TechnologyMachinery and Equipment Developed from the Application of Scientific Knowledge.
11/9/2018
3
One Size Doesn’t fit all..
New Tools For Greater Efficiency
Goals
Results
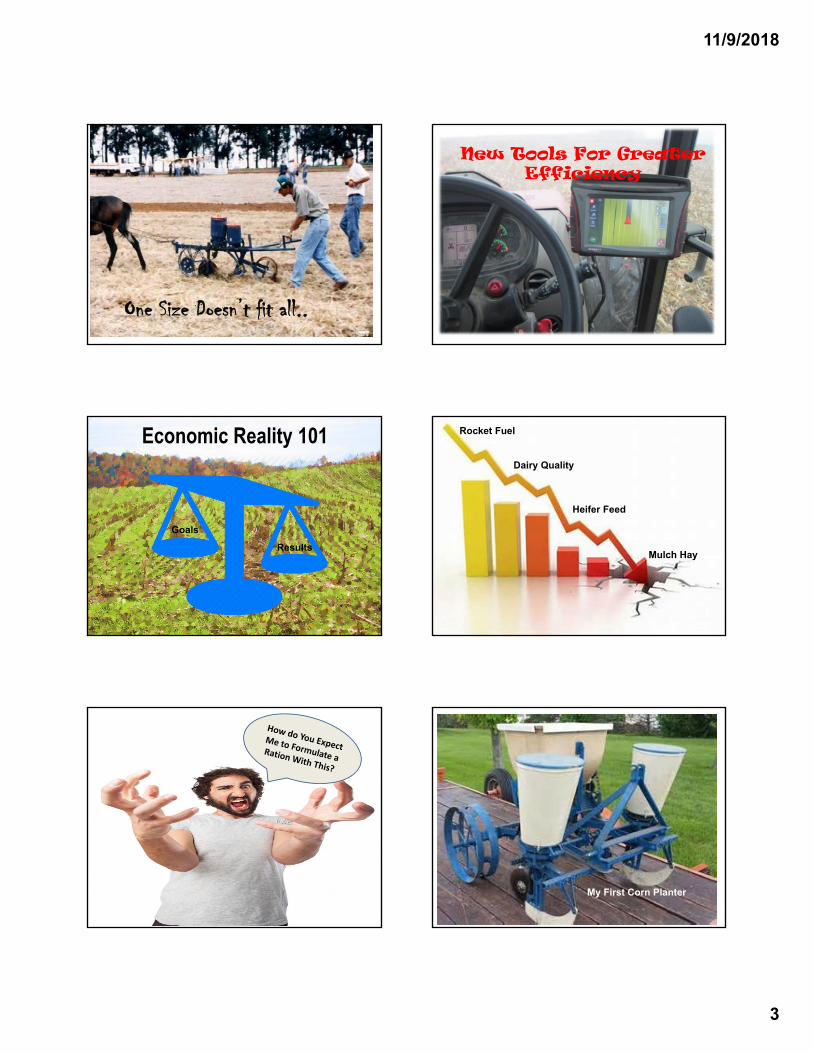
Economic Reality 101 Rocket Fuel
Mulch Hay
Dairy Quality
Heifer Feed
My First Corn Planter
11/9/2018
4
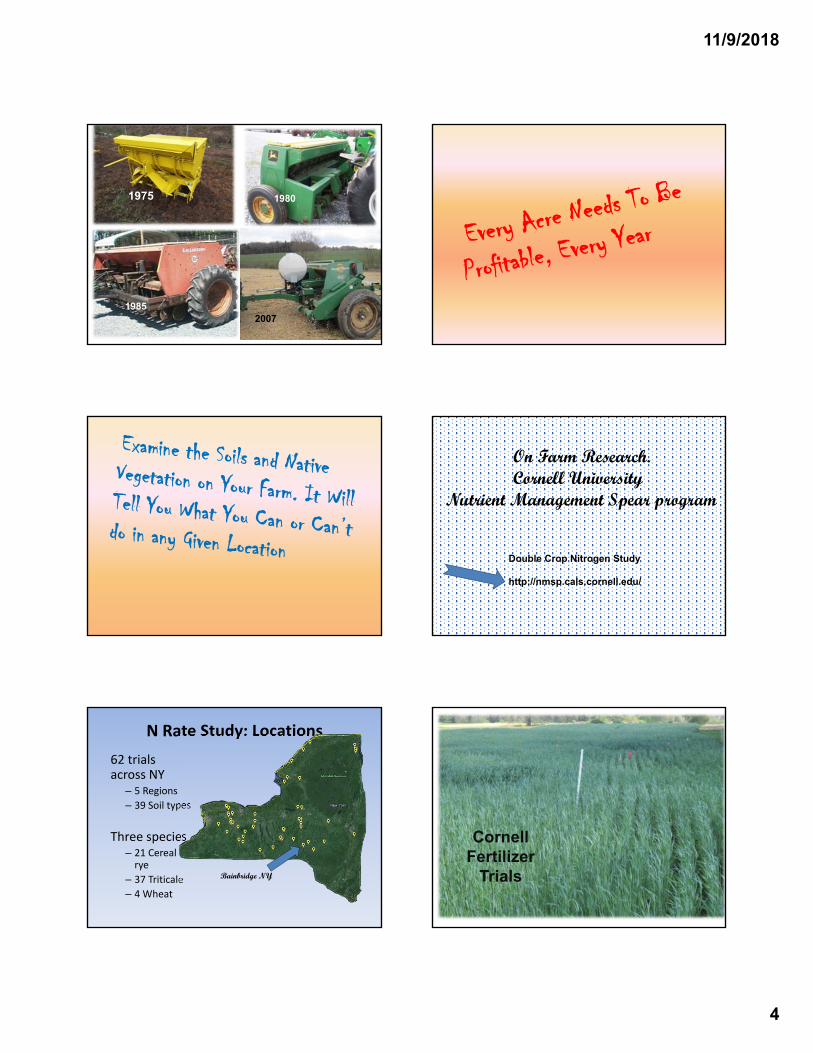
1975
1985
2007
1980
2007
On Farm Research. Cornell University
Nutrient Management Spear program
Double Crop Nitrogen Study
http://nmsp.cals.cornell.edu/
N Rate Study: Locations62 trials across NY
– 5 Regions– 39 Soil types
Three species– 21 Cereal
rye– 37 Triticale – 4 Wheat
Bainbridge NY
Cornell Fertilizer
Trials
11/9/2018
5
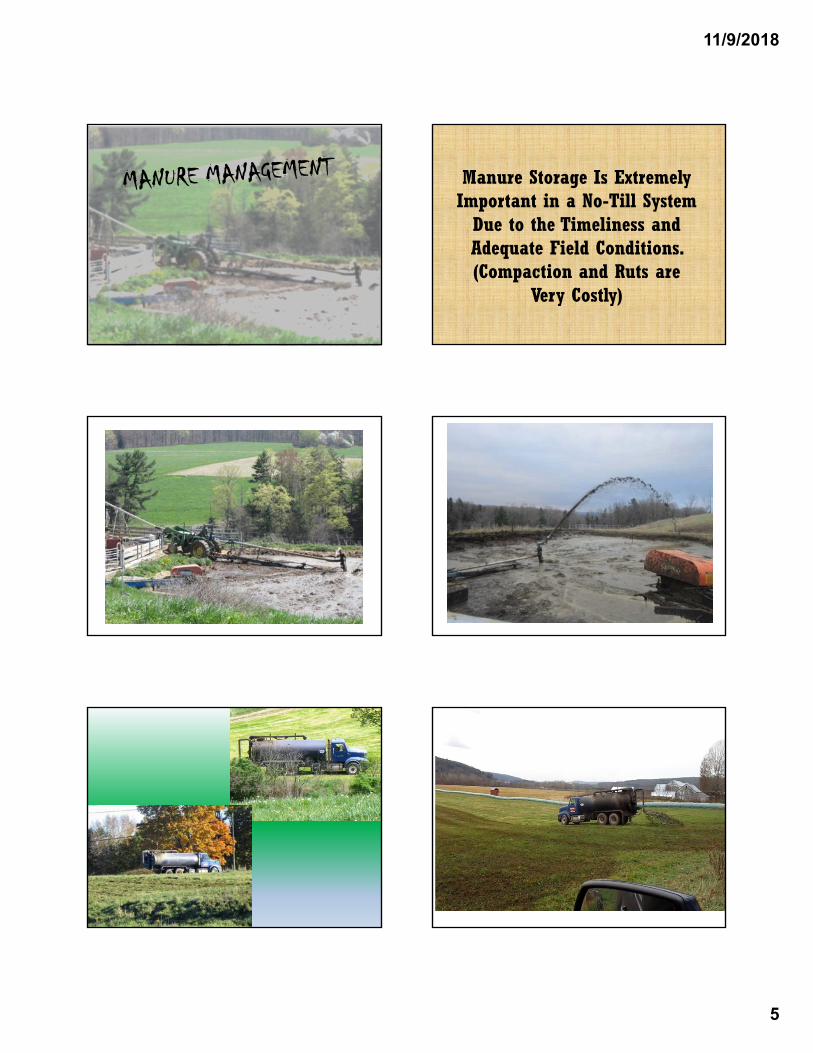
Manure Storage Is Extremely Important in a No-Till System
Due to the Timeliness and Adequate Field Conditions. (Compaction and Ruts are
Very Costly)
11/9/2018
6
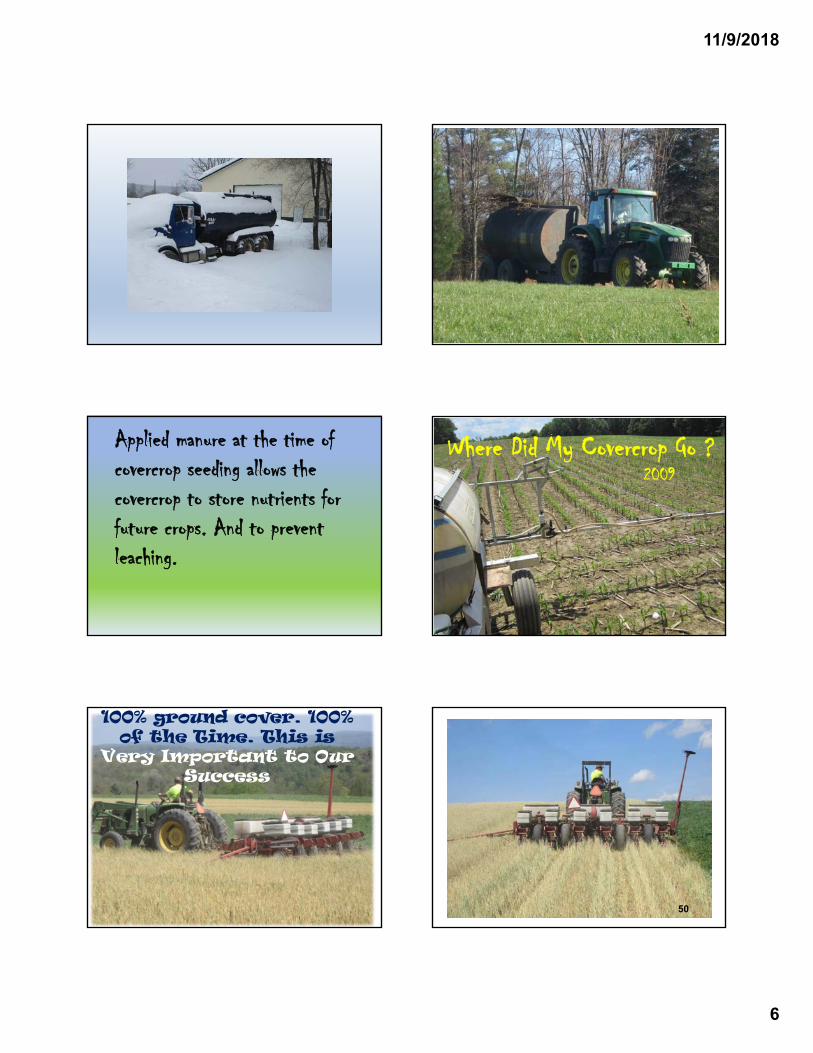
Applied manure at the time of covercrop seeding allows the covercrop to store nutrients for future crops. And to prevent leaching.
Where Did My Covercrop Go ?2009
100% ground cover. 100% of the Time. This is
Very Important to Our Success
50
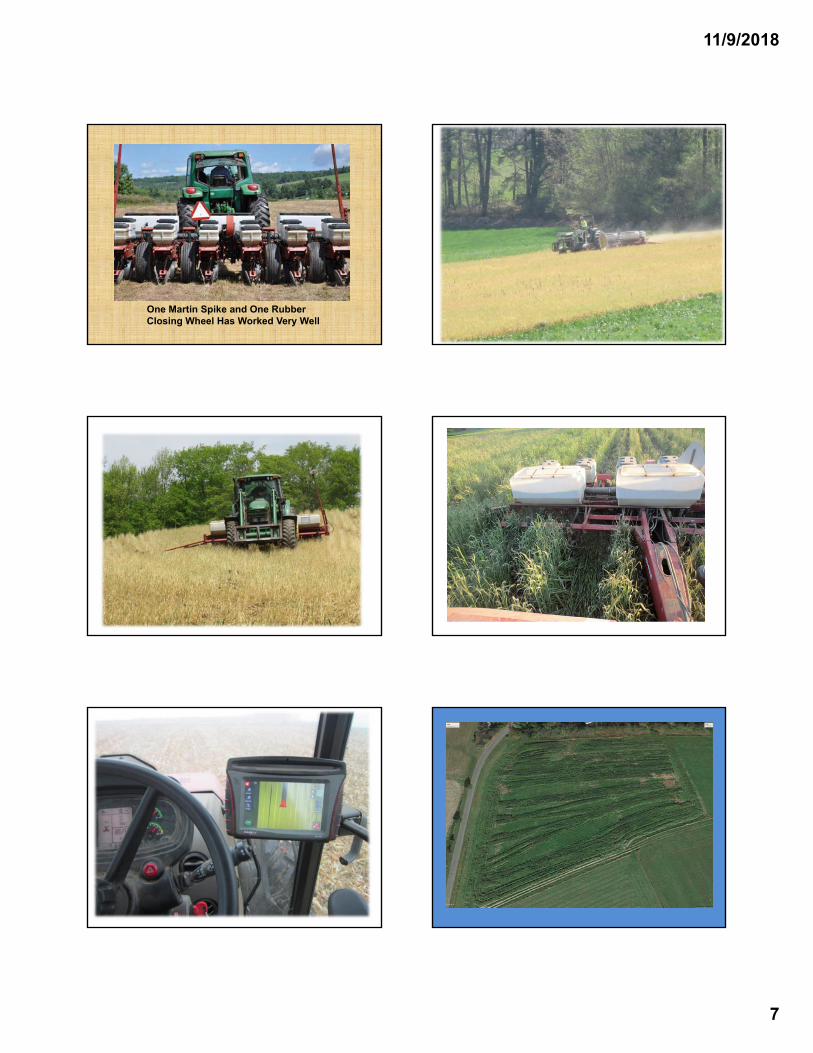
11/9/2018
7
One Martin Spike and One Rubber Closing Wheel Has Worked Very Well
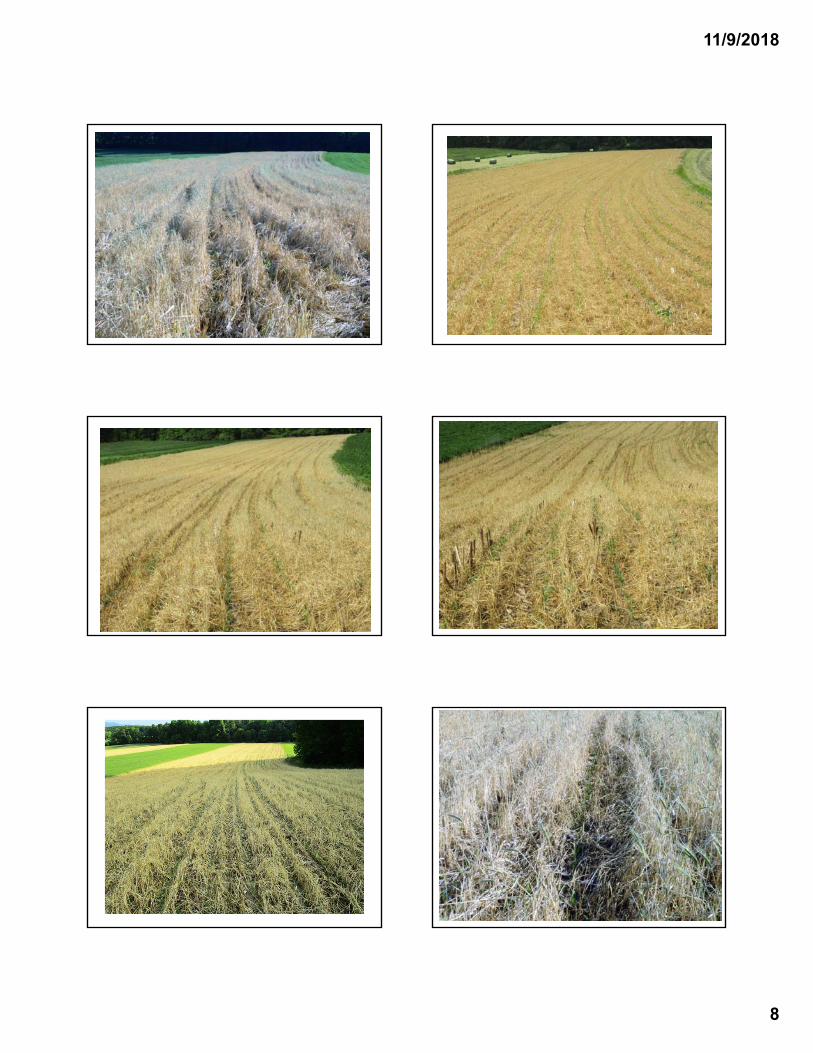
11/9/2018
8
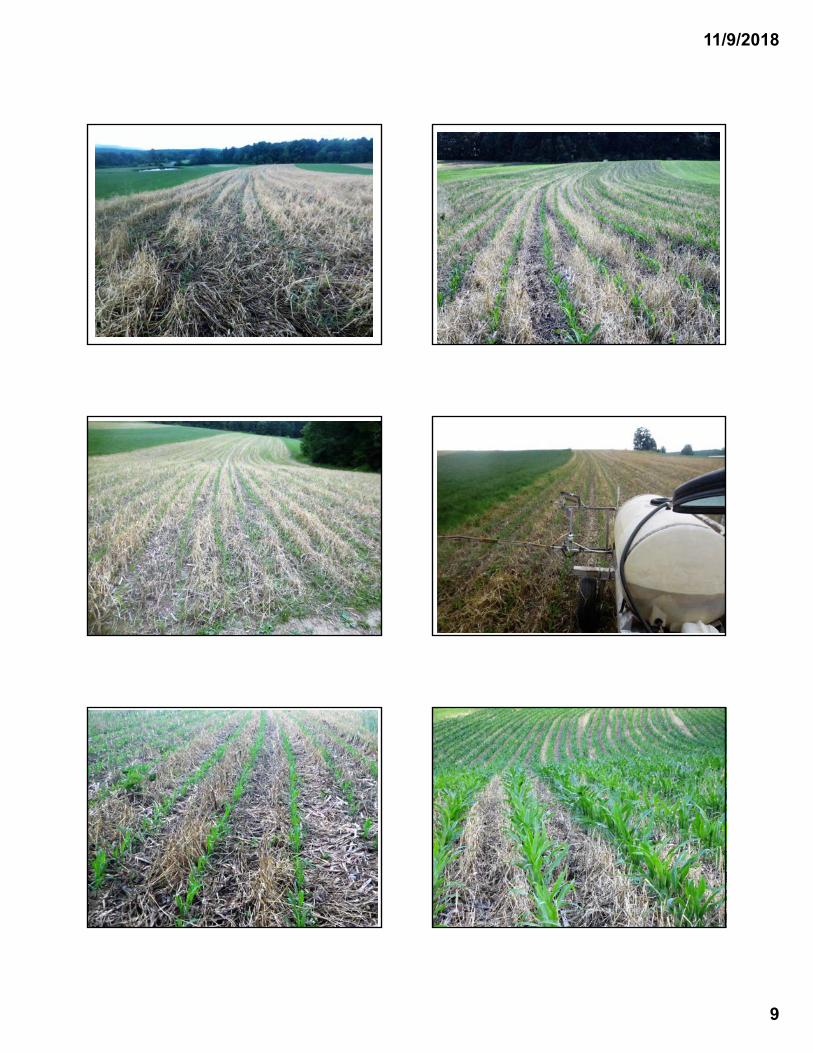
11/9/2018
9
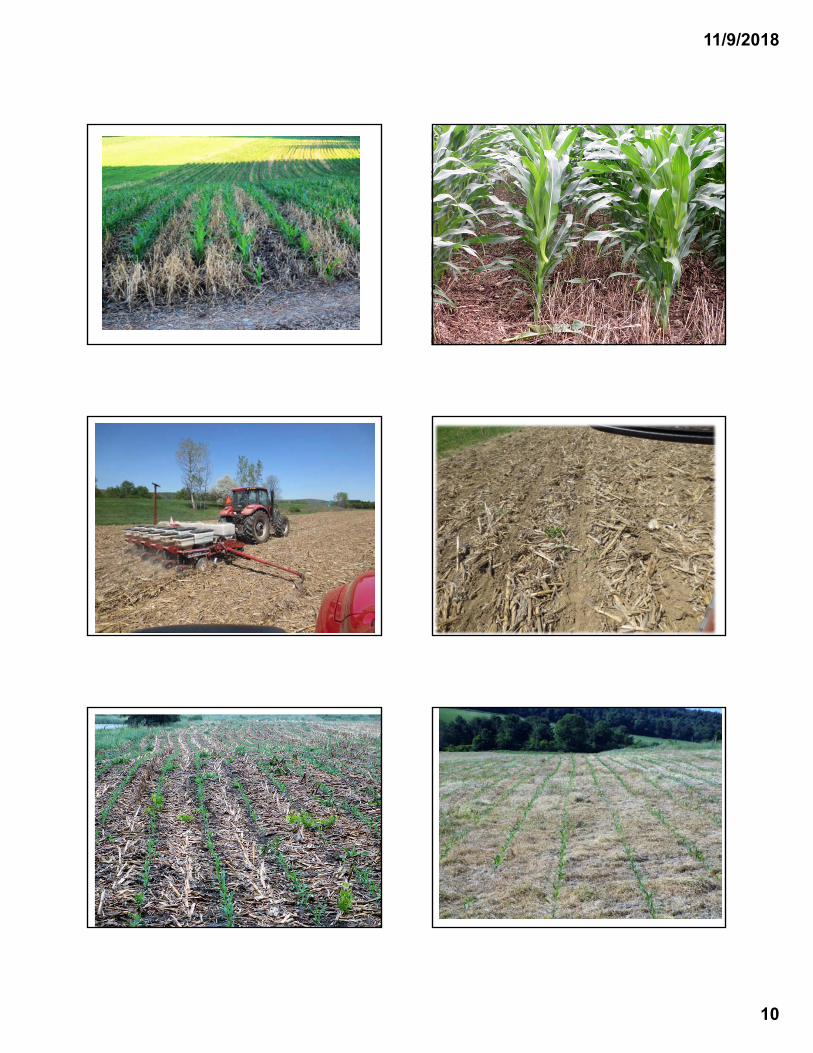
11/9/2018
10
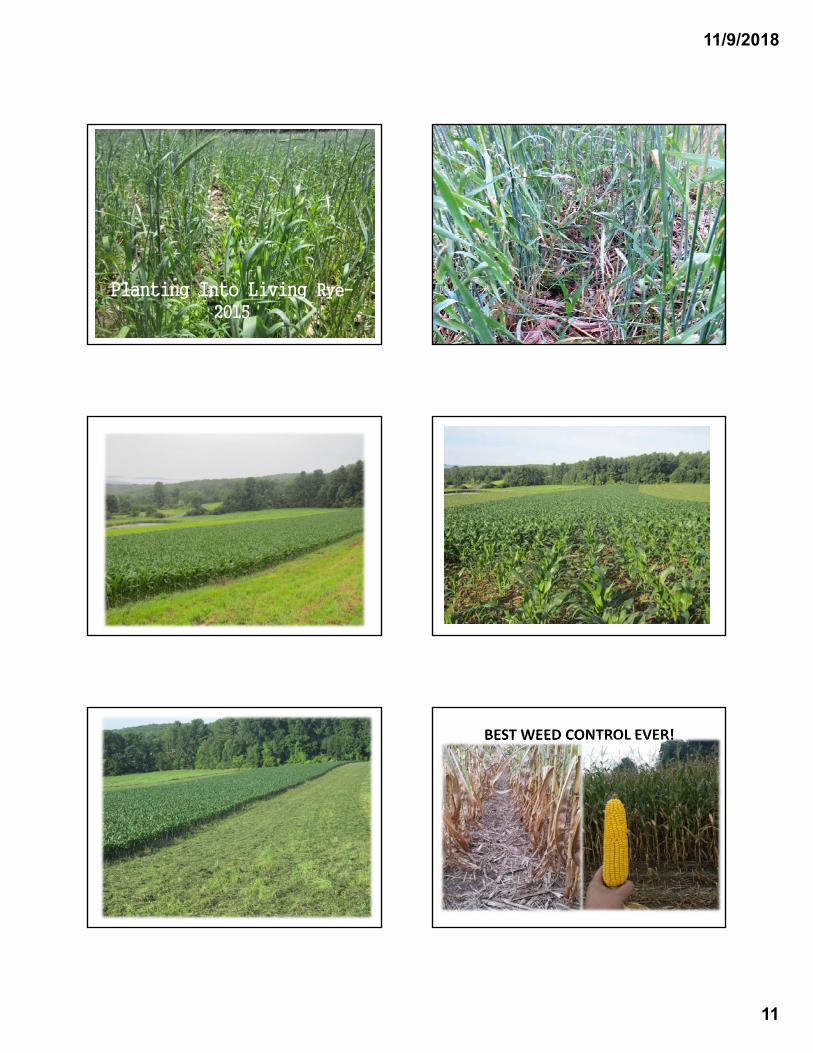
11/9/2018
11
Planting Into Living Rye-2015
BEST WEED CONTROL EVER!
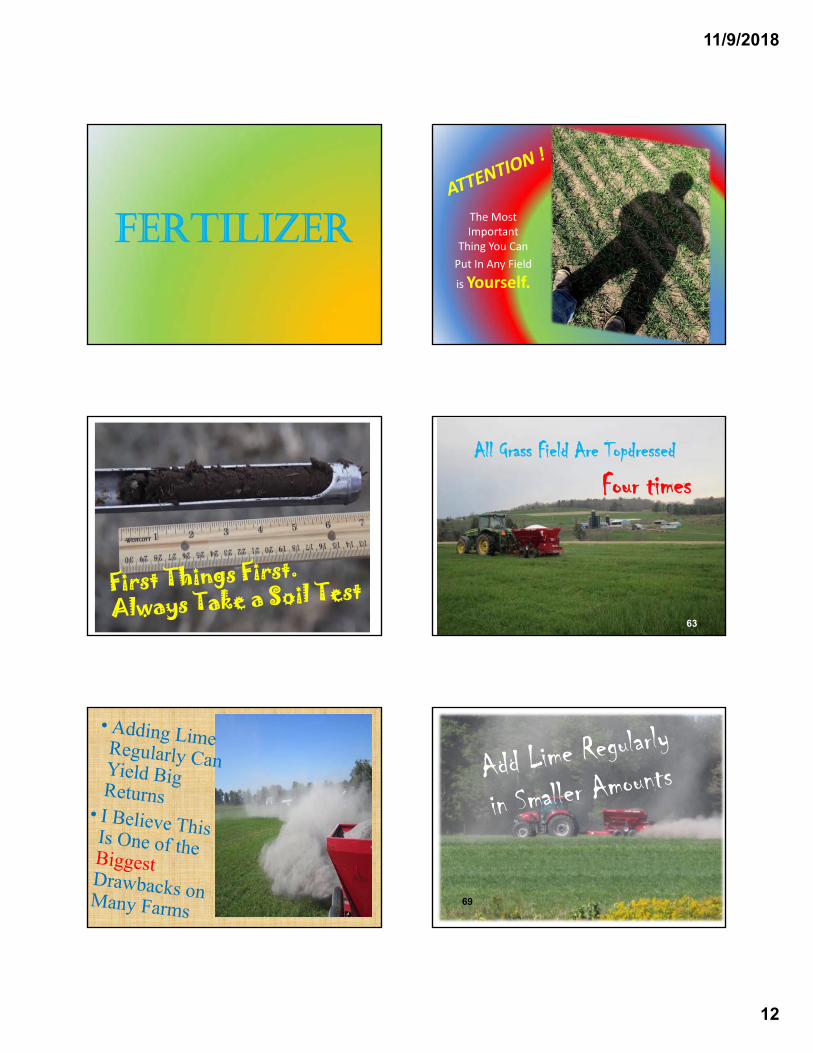
11/9/2018
12
FERTILIZER The Most Important
Thing You CanPut In Any Field is Yourself.
All Grass Field Are Topdressed
Four times
63
69
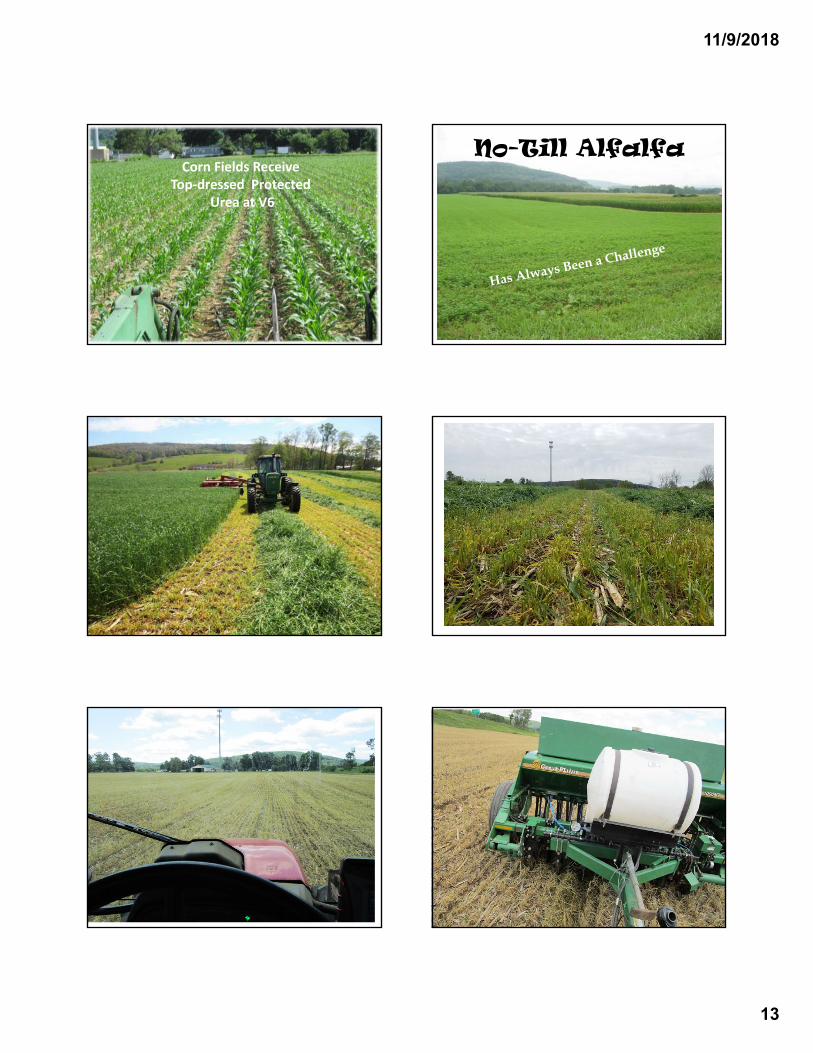
11/9/2018
13
Corn Fields Receive Top-dressed Protected
Urea at V6
No-Till Alfalfa
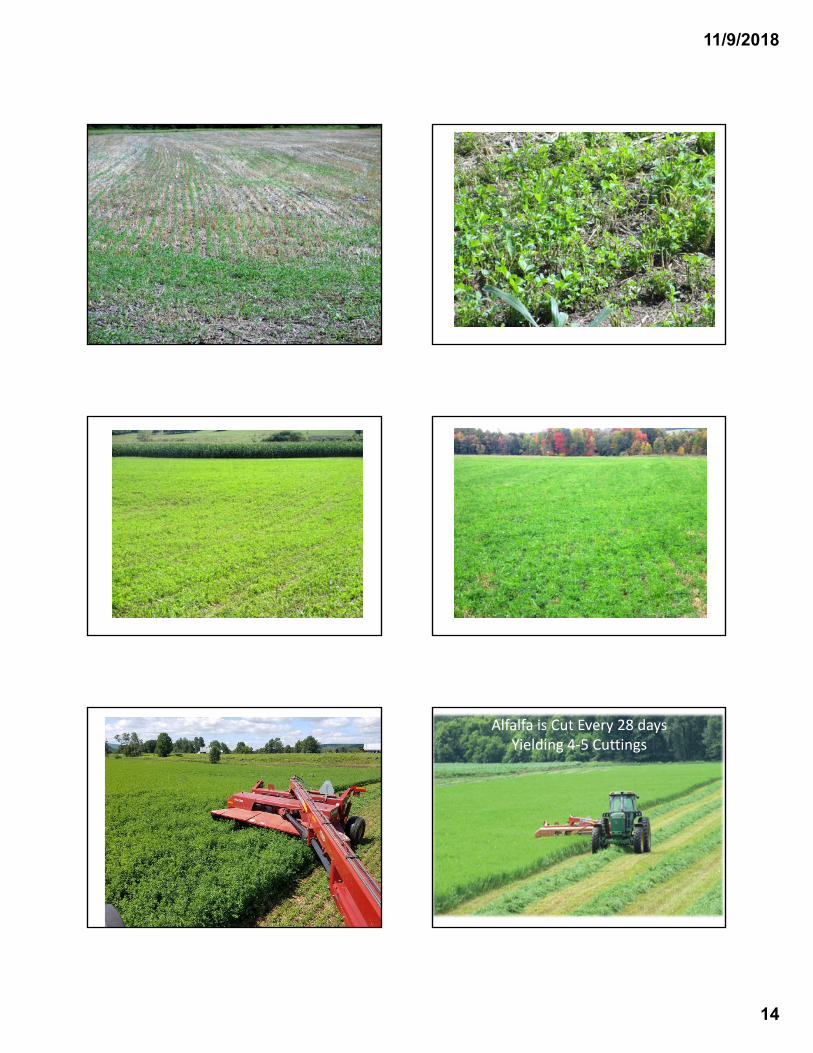
11/9/2018
14
Alfalfa is Cut Every 28 daysYielding 4-5 Cuttings
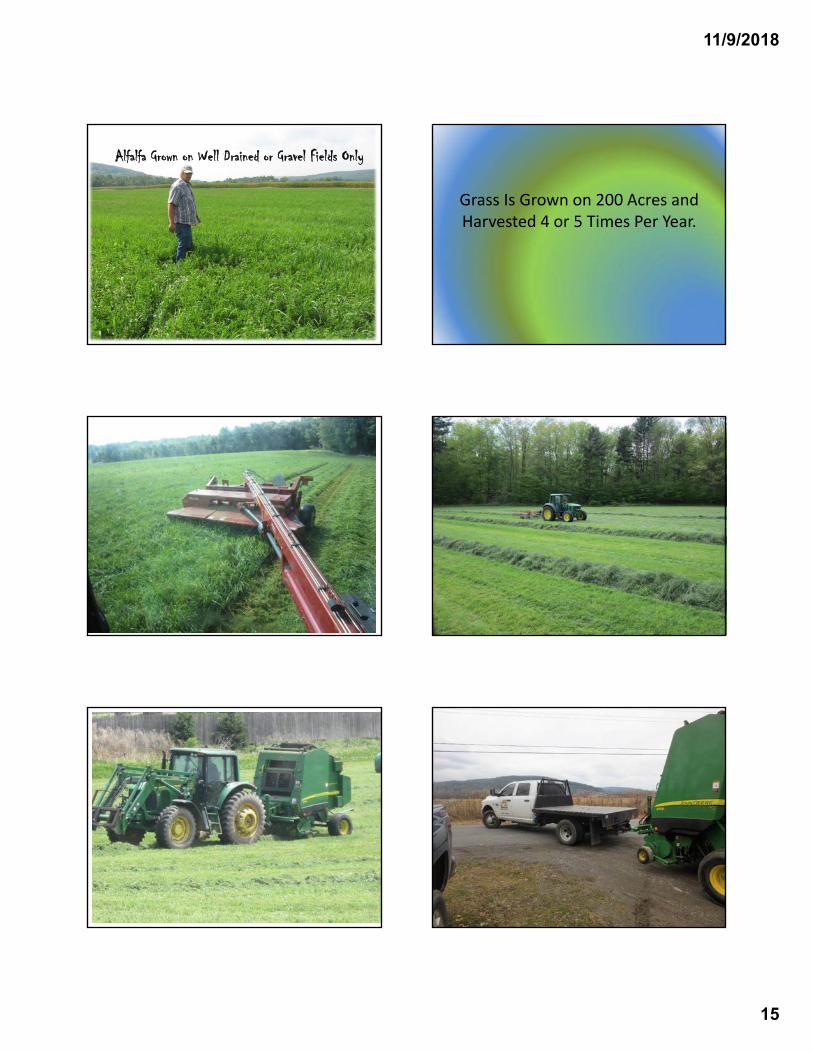
11/9/2018
15
Alfalfa Grown on Well Drained or Gravel Fields Only
Grass Is Grown on 200 Acres and Harvested 4 or 5 Times Per Year.
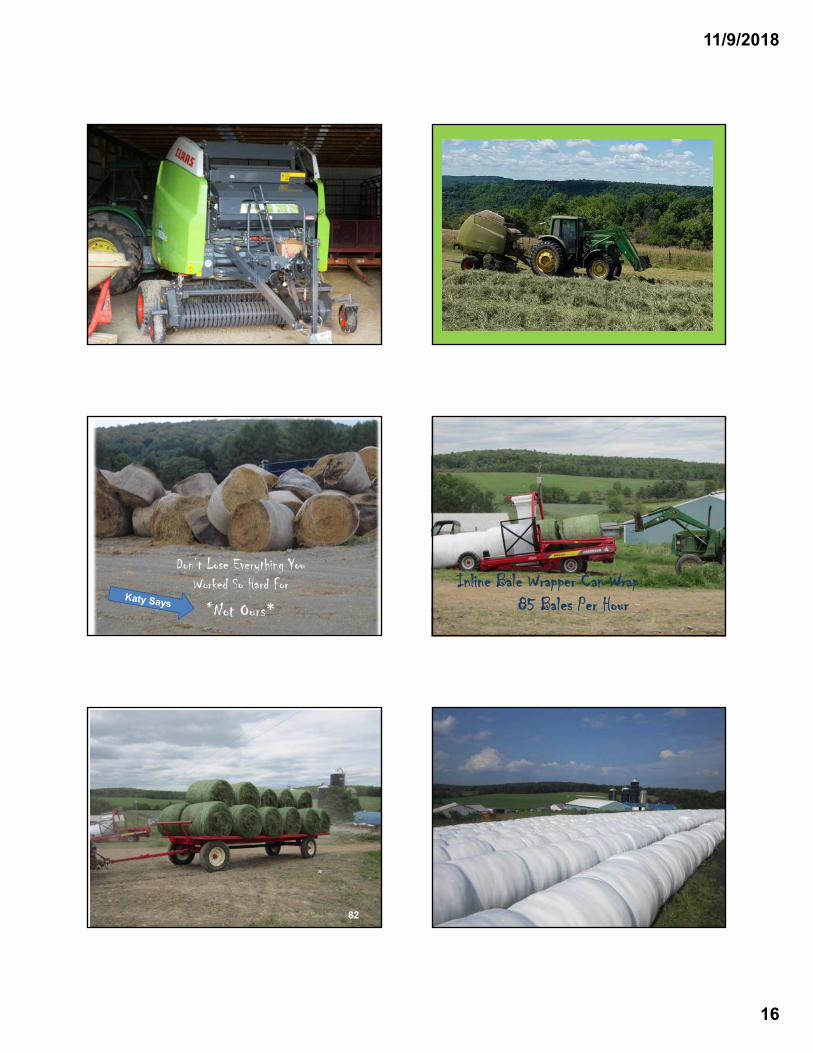
11/9/2018
16
Don’t Lose Everything You Worked So Hard For
*Not Ours*Inline Bale Wrapper Can Wrap
85 Bales Per Hour
82
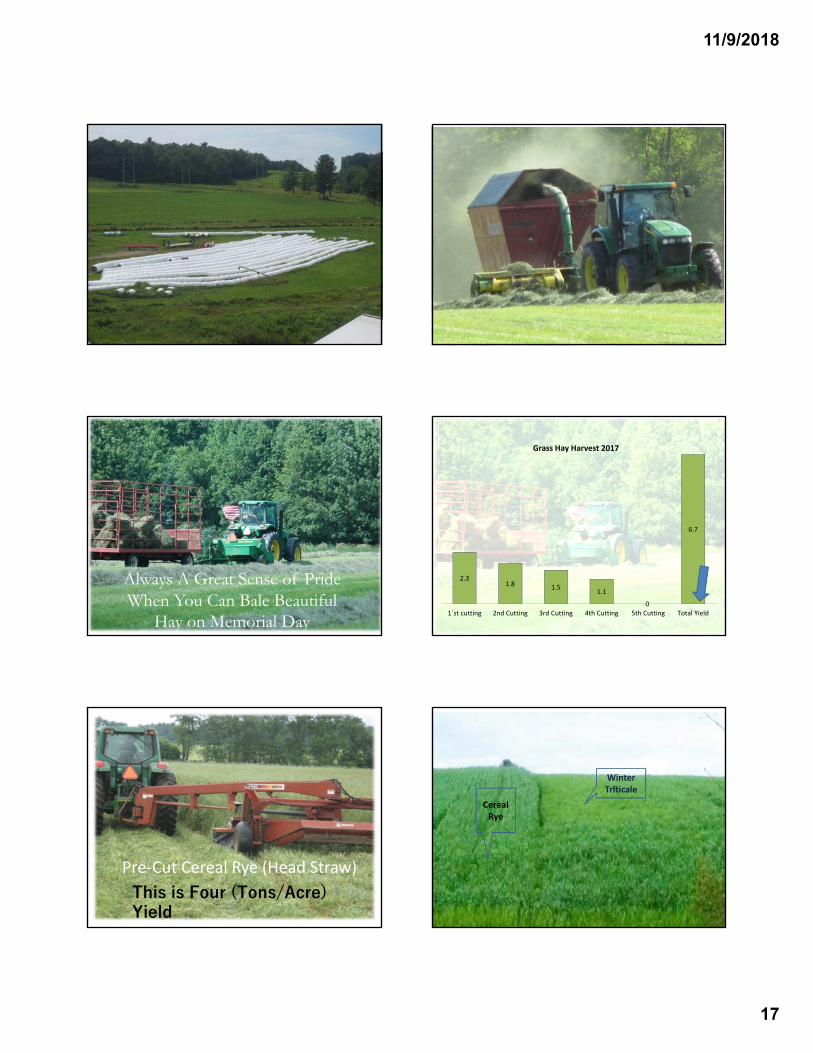
11/9/2018
17
Baleage Storage 1500 +
Always A Great Sense of Pride When You Can Bale Beautiful
Hay on Memorial Day
2.31.8 1.5 1.1
0
6.7
1`st cutting 2nd Cutting 3rd Cutting 4th Cutting 5th Cutting Total Yield
Grass Hay Harvest 2017
Pre-Cut Cereal Rye (Head Straw)This is Four (Tons/Acre) Yield
Cereal Rye
Winter Triticale
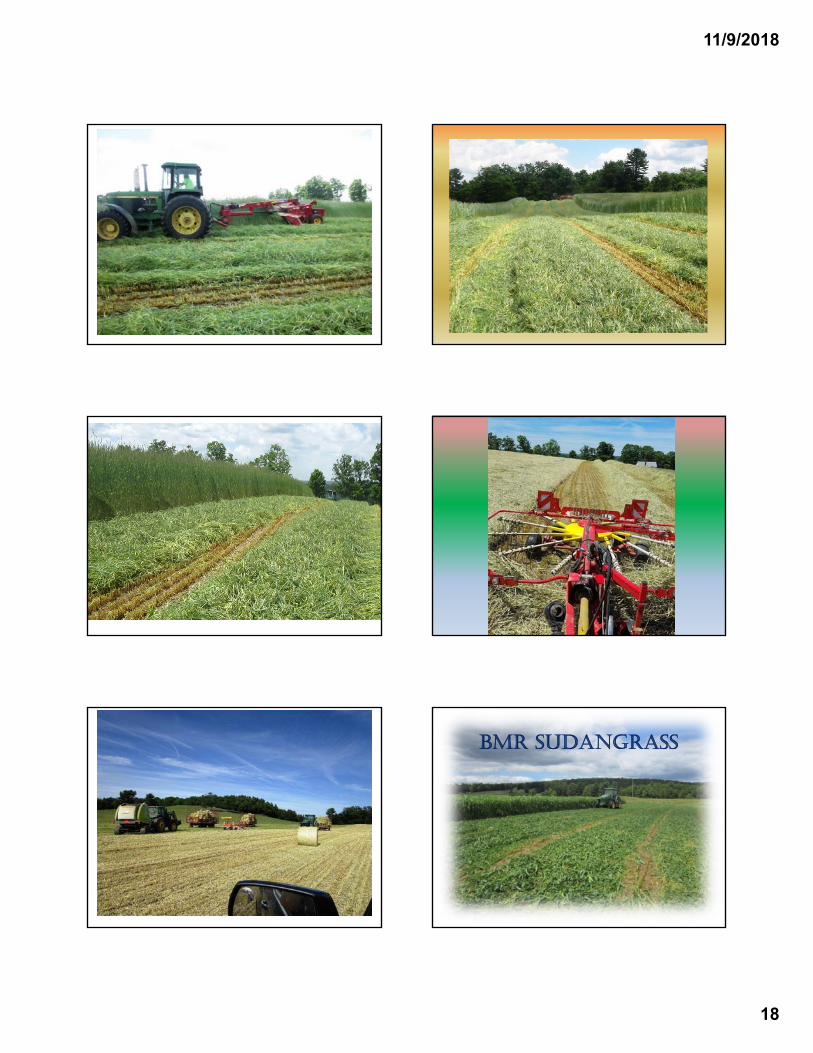
11/9/2018
18
BMR SUDANGRASS
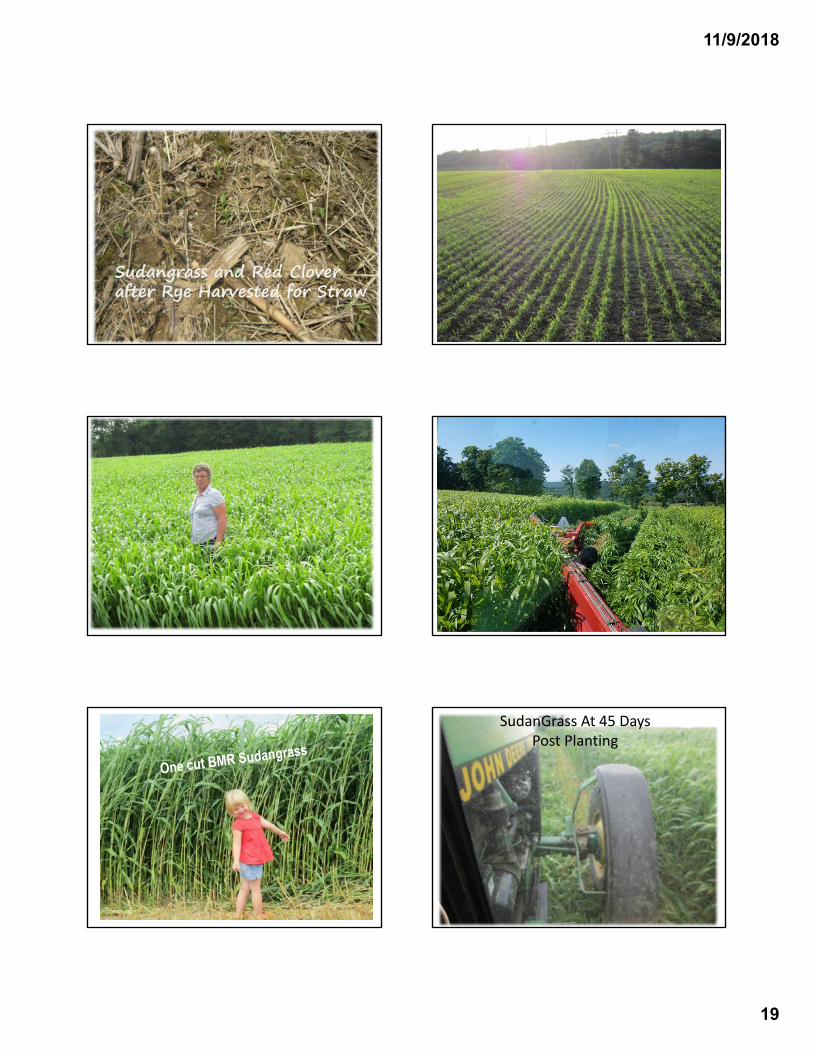
11/9/2018
19
Sudangrass and Red Clover after Rye Harvested for Straw
SudanGrass At 45 DaysPost Planting
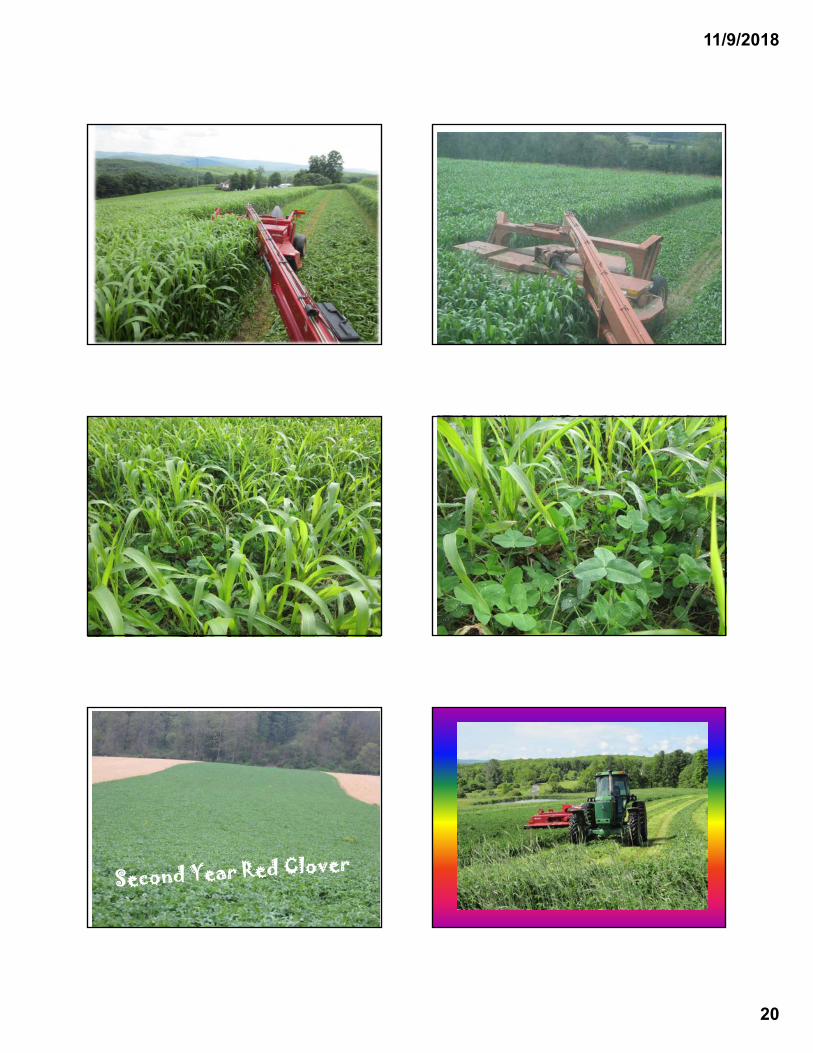
11/9/2018
20
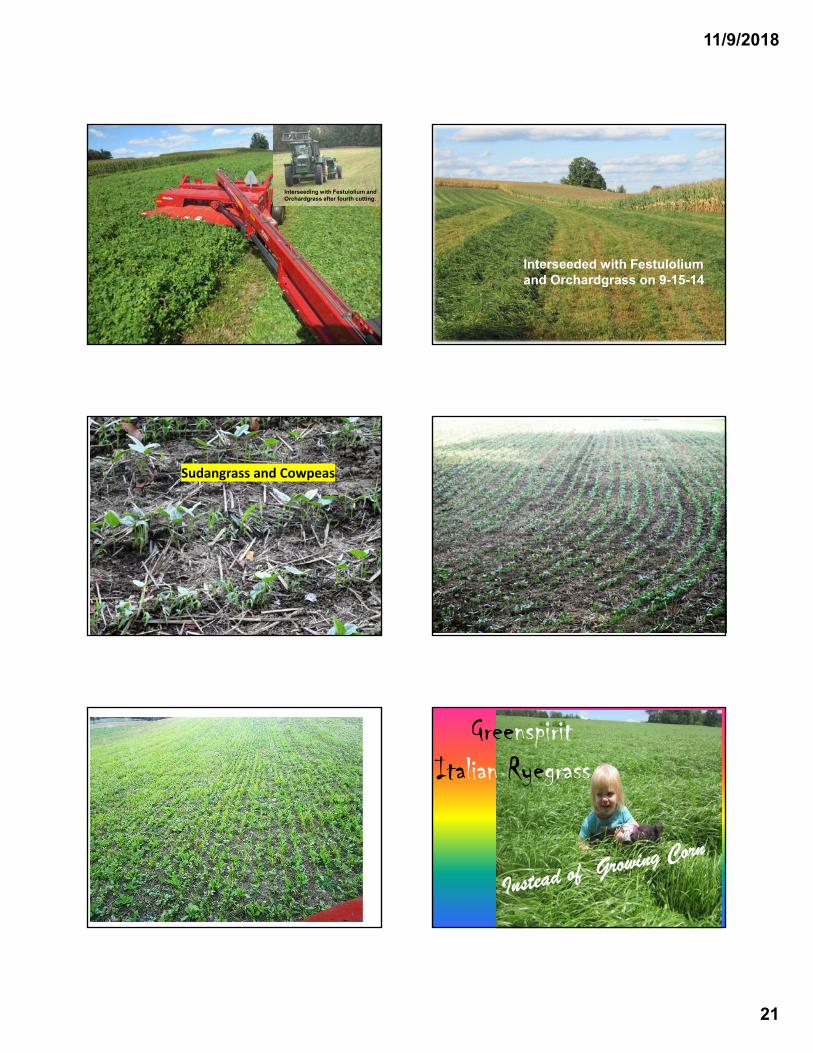
11/9/2018
21
Interseeding with Festulolium and Orchardgrass after fourth cutting.
Interseeded with Festuloliumand Orchardgrass on 9-15-14
Sudangrass and Cowpeas
GreenspiritItalian Ryegrass
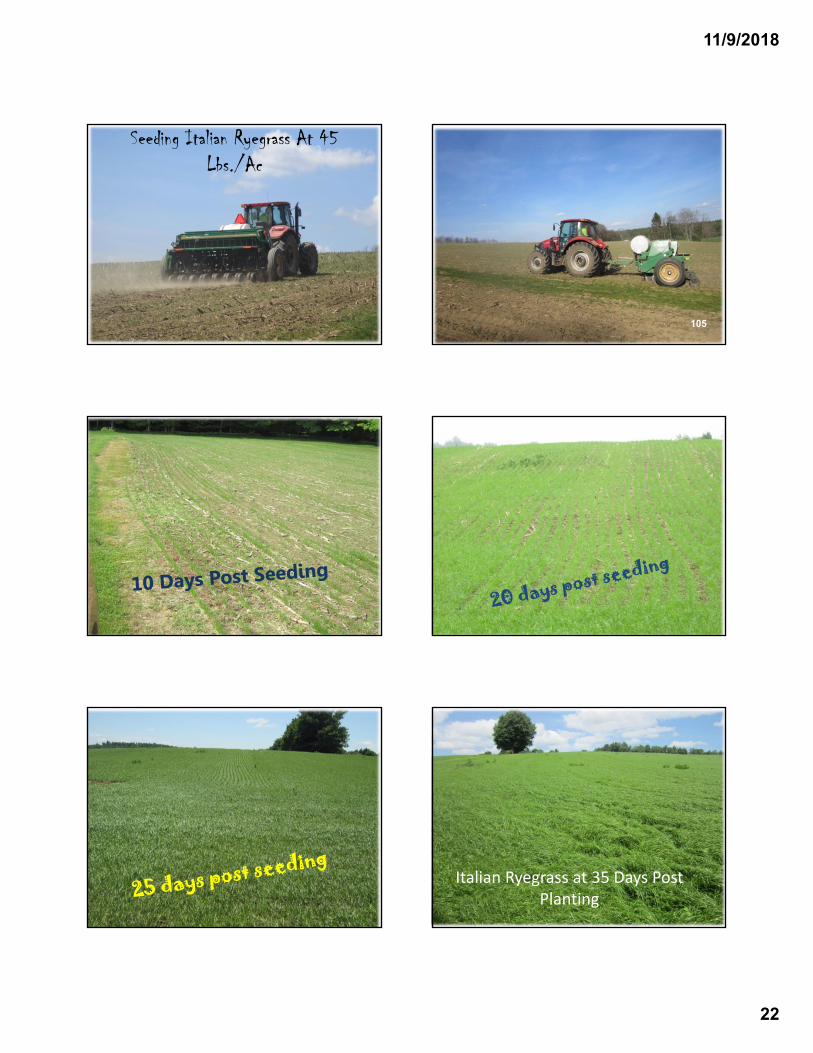
11/9/2018
22
Seeding Italian Ryegrass At 45 Lbs./Ac
105
“Rise” up
Italian Ryegrass at 35 Days Post Planting
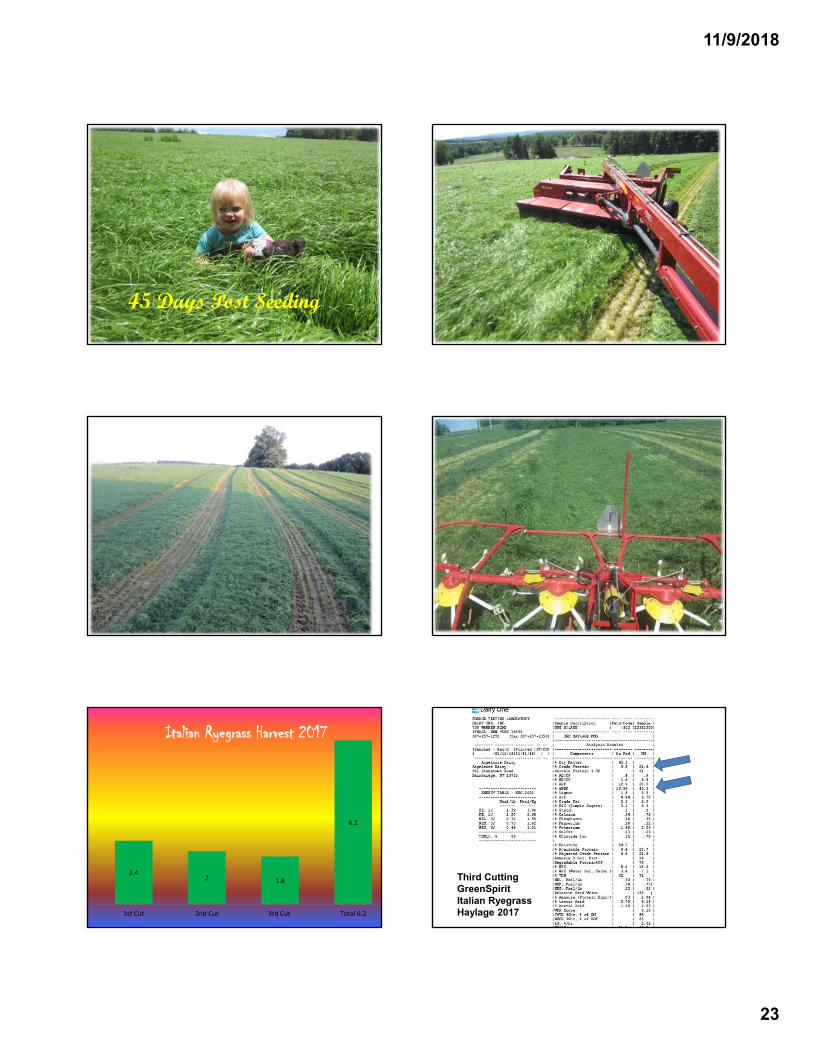
11/9/2018
23
It ryegrass
45 Days Post Seeding
2.42 1.8
6.2
1st Cut 2nd Cut 3rd Cut Total 6.2
Italian Ryegrass Harvest 2017
Third Cutting GreenSpiritItalian Ryegrass Haylage 2017
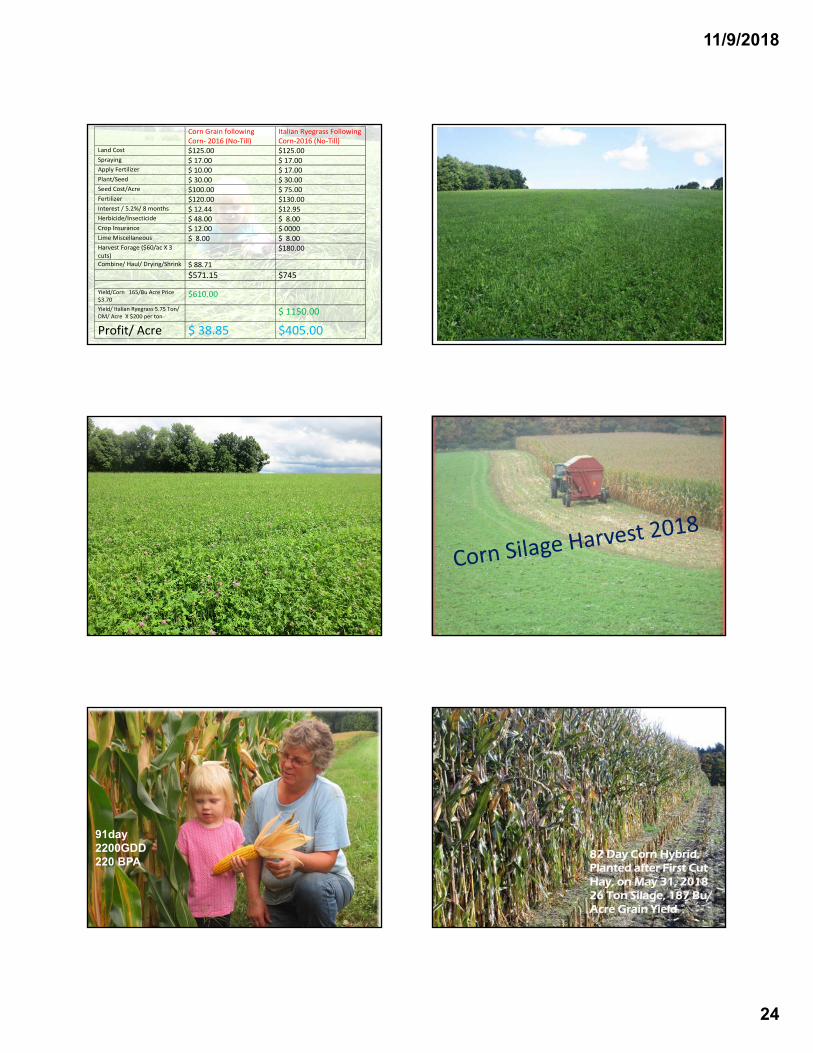
11/9/2018
24
Corn Grain following Corn- 2016 (No-Till)
Italian Ryegrass Following Corn-2016 (No-Till)
Land Cost $125.00 $125.00 Spraying $ 17.00 $ 17.00 Apply Fertilizer $ 10.00 $ 17.00 Plant/Seed $ 30.00 $ 30.00 Seed Cost/Acre $100.00 $ 75.00 Fertilizer $120.00 $130.00 Interest / 5.2%/ 8 months $ 12.44 $12.95 Herbicide/Insecticide $ 48.00 $ 8.00 Crop Insurance $ 12.00 $ 0000 Lime Miscellaneous $ 8.00 $ 8.00 Harvest Forage ($60/ac X 3 cuts)
$180.00
Combine/ Haul/ Drying/Shrink $ 88.71 $571.15 $745 Yield/Corn 165/Bu Acre Price $3.70
$610.00
Yield/ Italian Ryegrass 5.75 Ton/ DM/ Acre X $200 per ton
$ 1150.00
Profit/ Acre $ 38.85 $405.00 .
91day 2200GDD 220 BPA 82 Day Corn Hybrid.
Planted after First Cut Hay, on May 31, 201826 Ton Silage, 187 Bu/ Acre Grain Yield
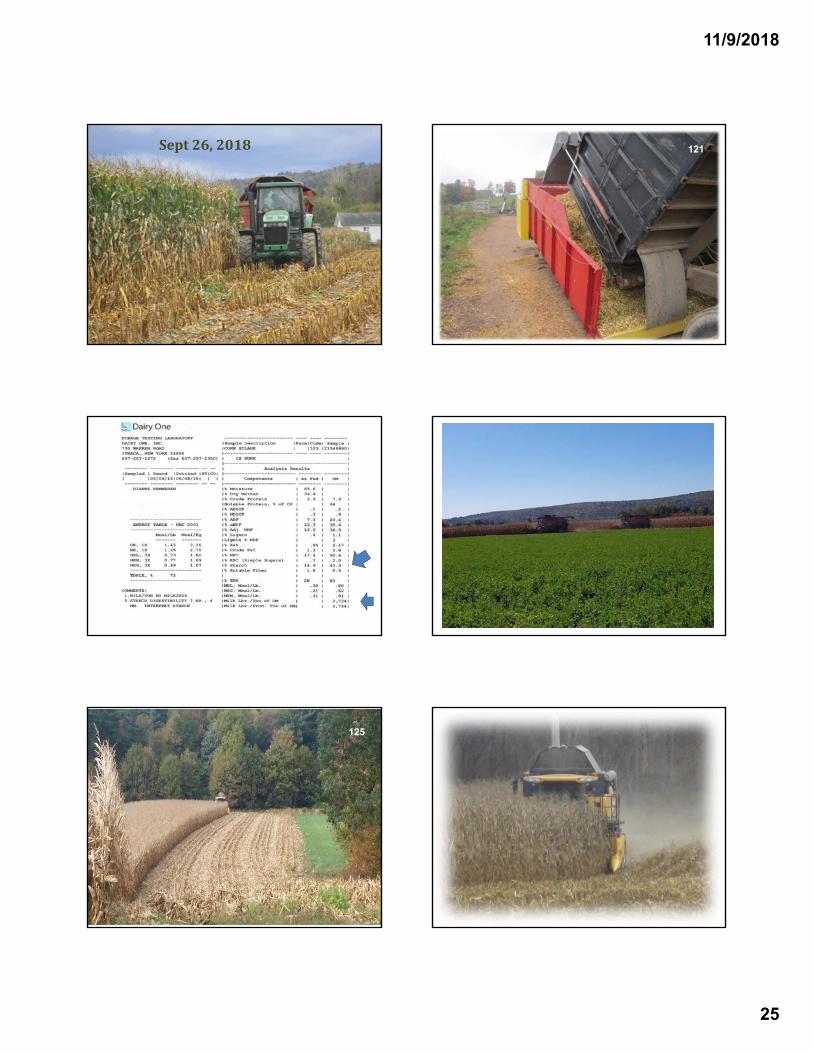
11/9/2018
25
Sept 26, 2018 121
125
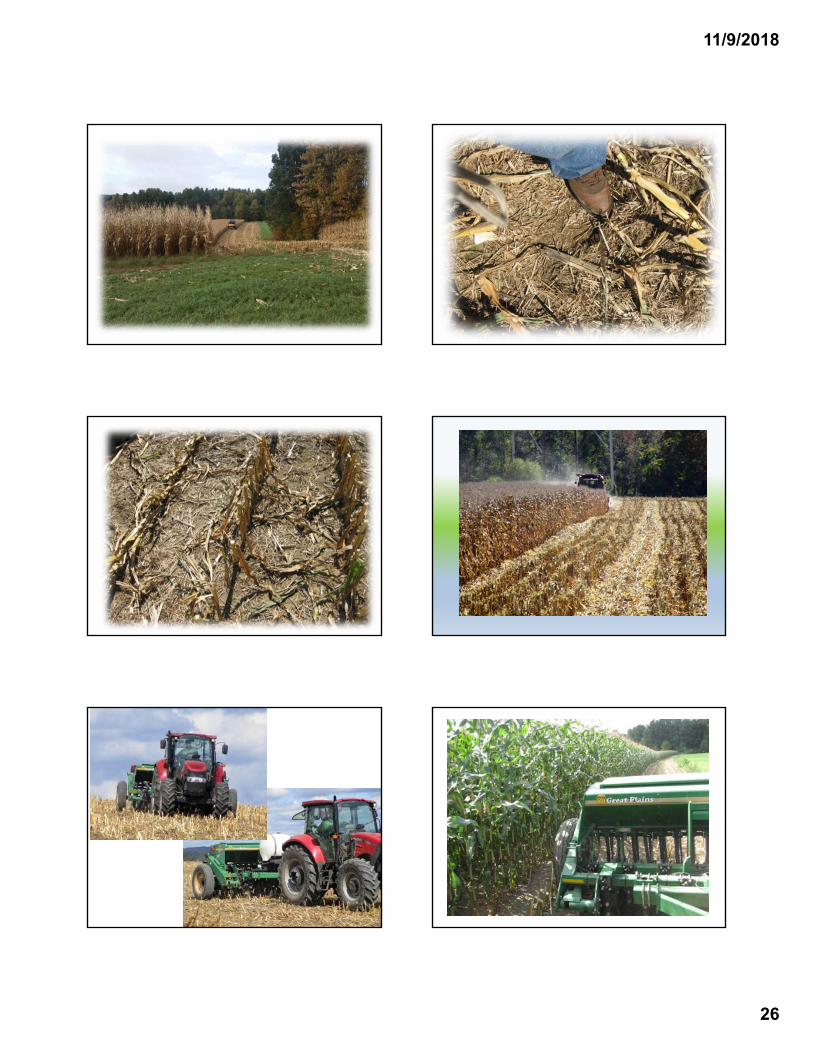
11/9/2018
26
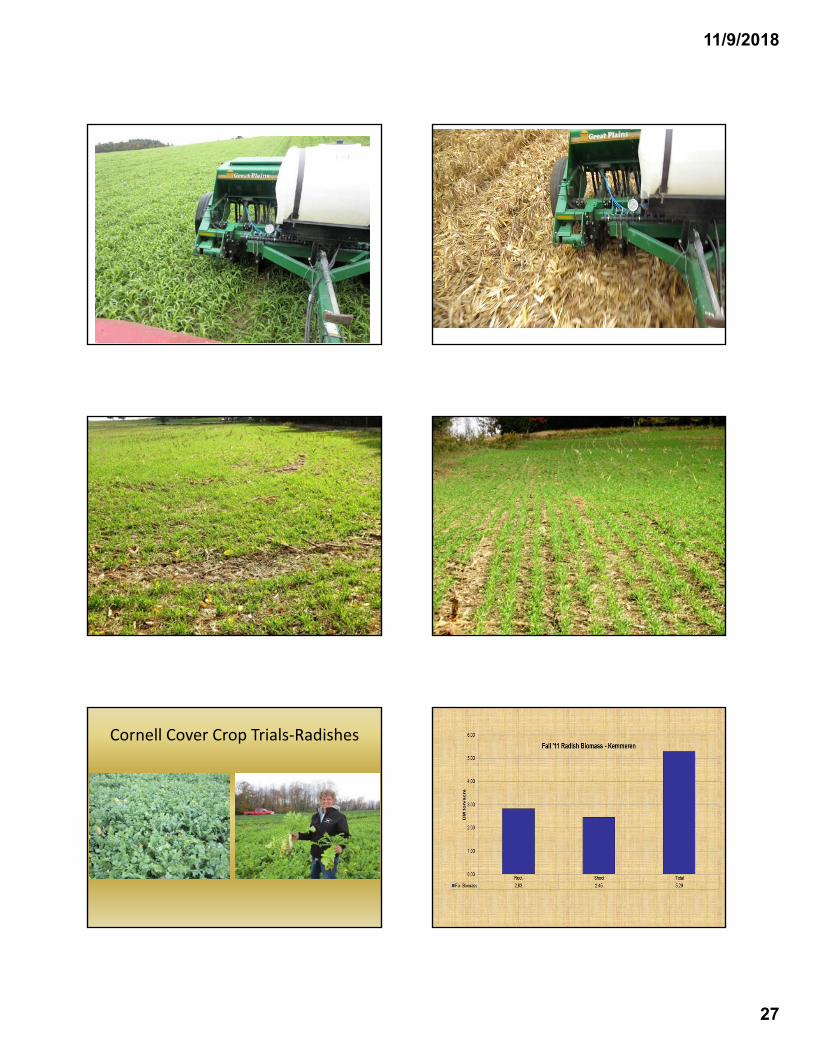
11/9/2018
27
Cornell Cover Crop Trials-Radishes
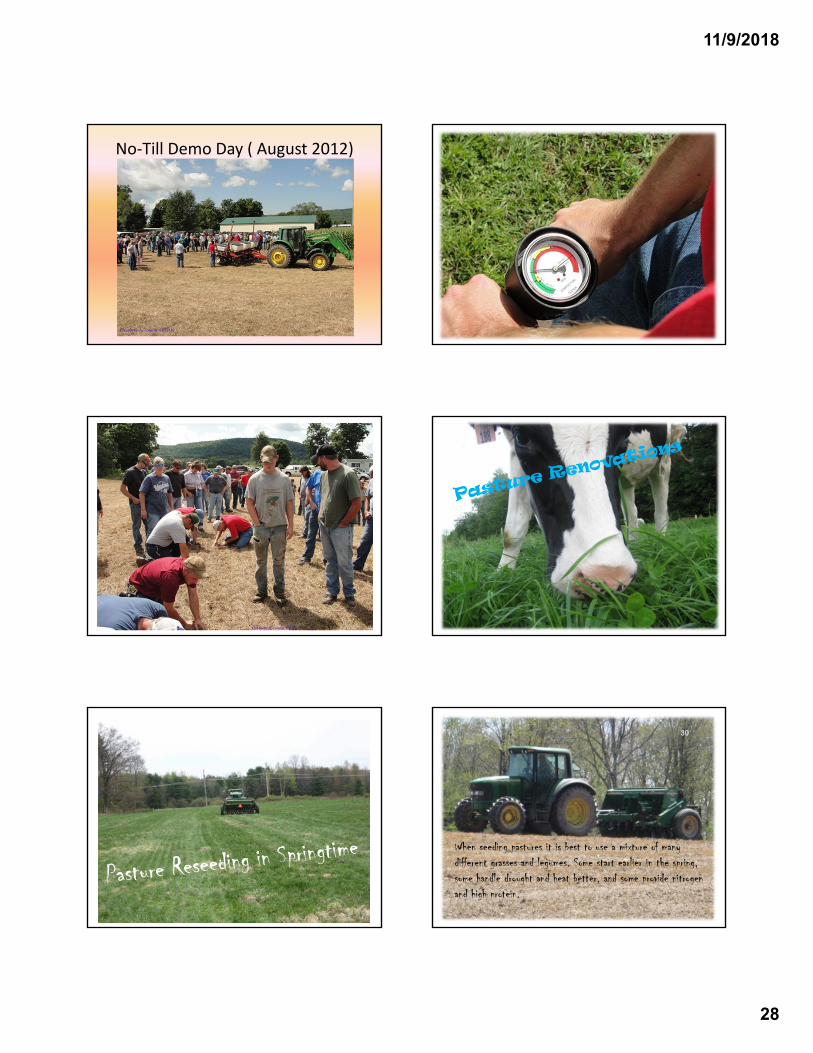
11/9/2018
28
No-Till Demo Day ( August 2012)
When seeding pastures it is best to use a mixture of many different grasses and legumes. Some start earlier in the spring, some handle drought and heat better, and some provide nitrogen and high protein.
30
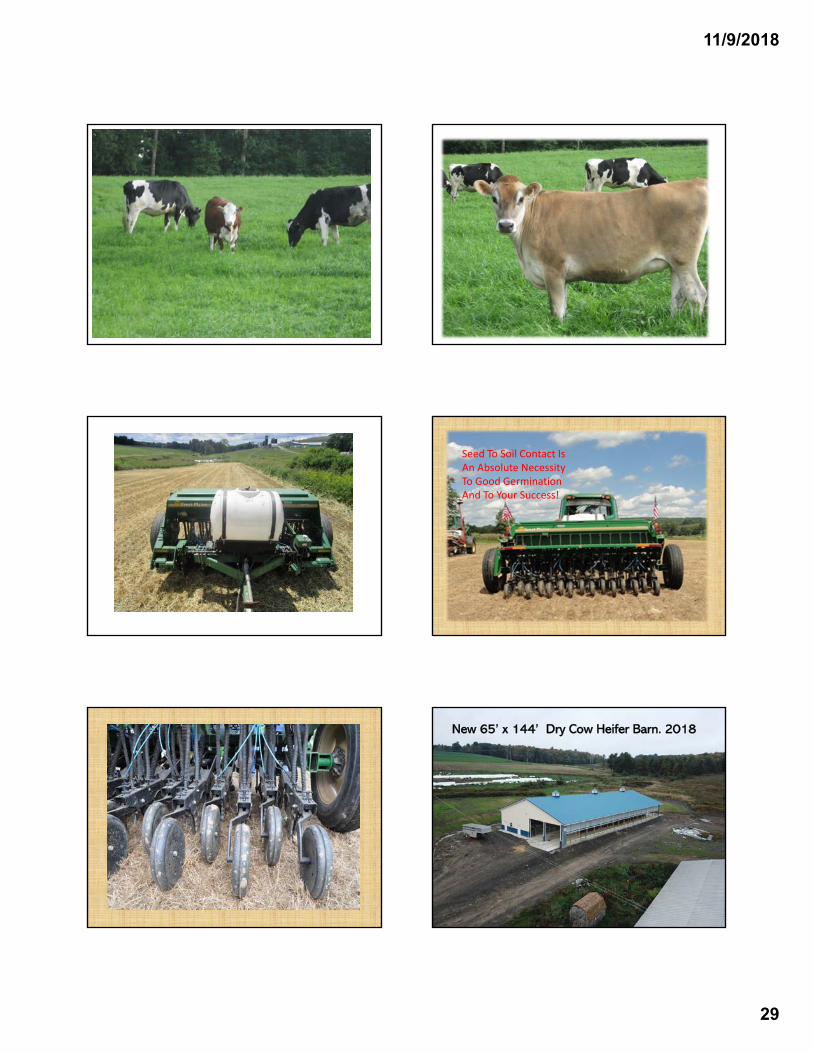
11/9/2018
29
Seed To Soil Contact Is An Absolute Necessity To Good Germination And To Your Success!
New 65’ x 144’ Dry Cow Heifer Barn. 2018
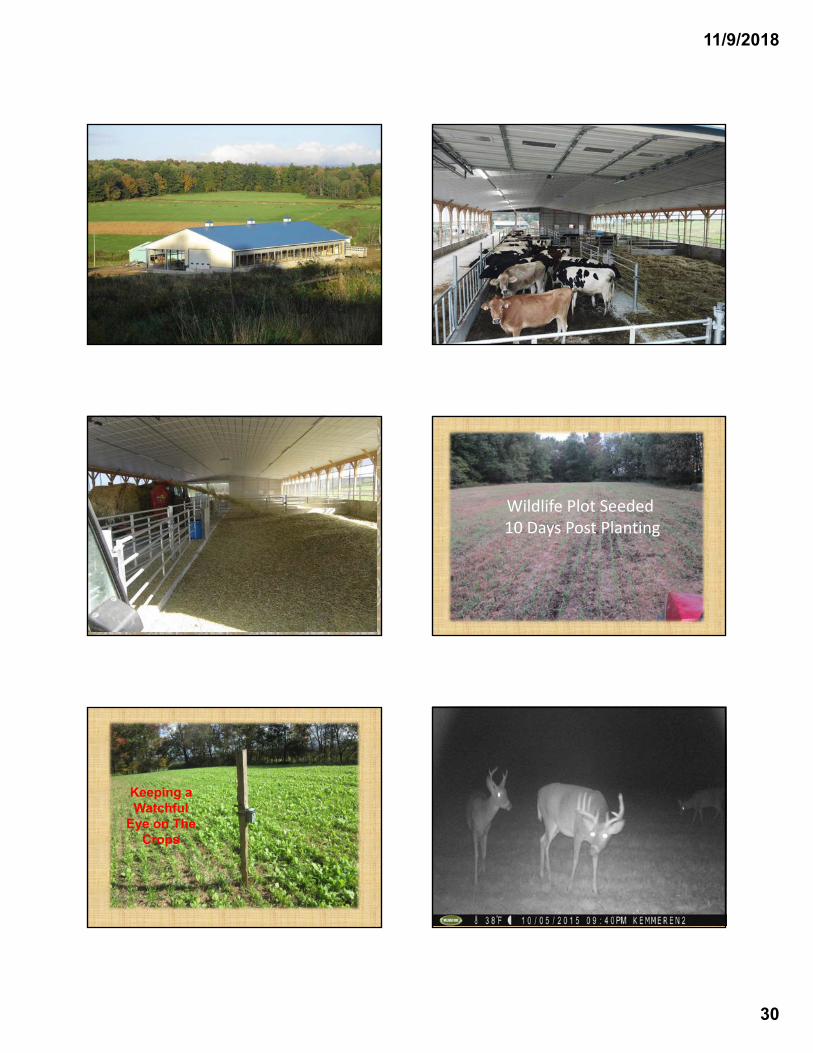
11/9/2018
30
Wildlife Plot Seeded10 Days Post Planting
Keeping a Watchful
Eye on The Crops
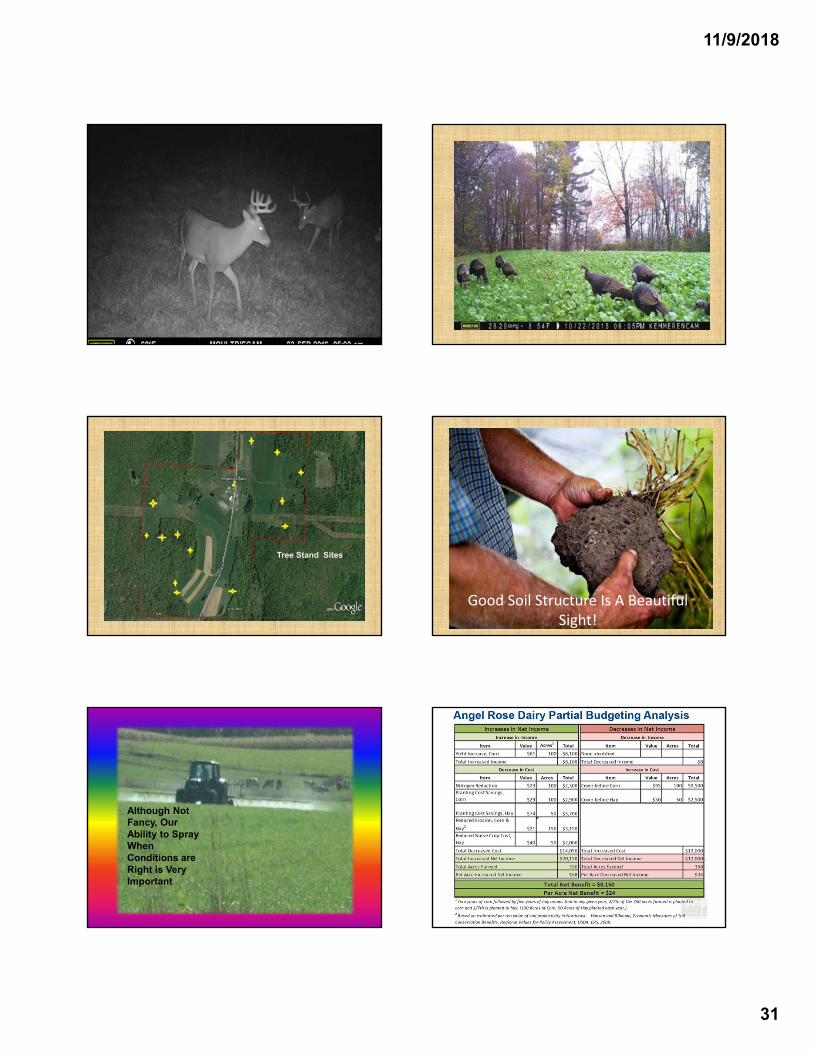
11/9/2018
31
Tree Stand Sites
Good Soil Structure Is A Beautiful Sight!
Although Not Fancy, Our Ability to Spray When Conditions are Right is Very Important
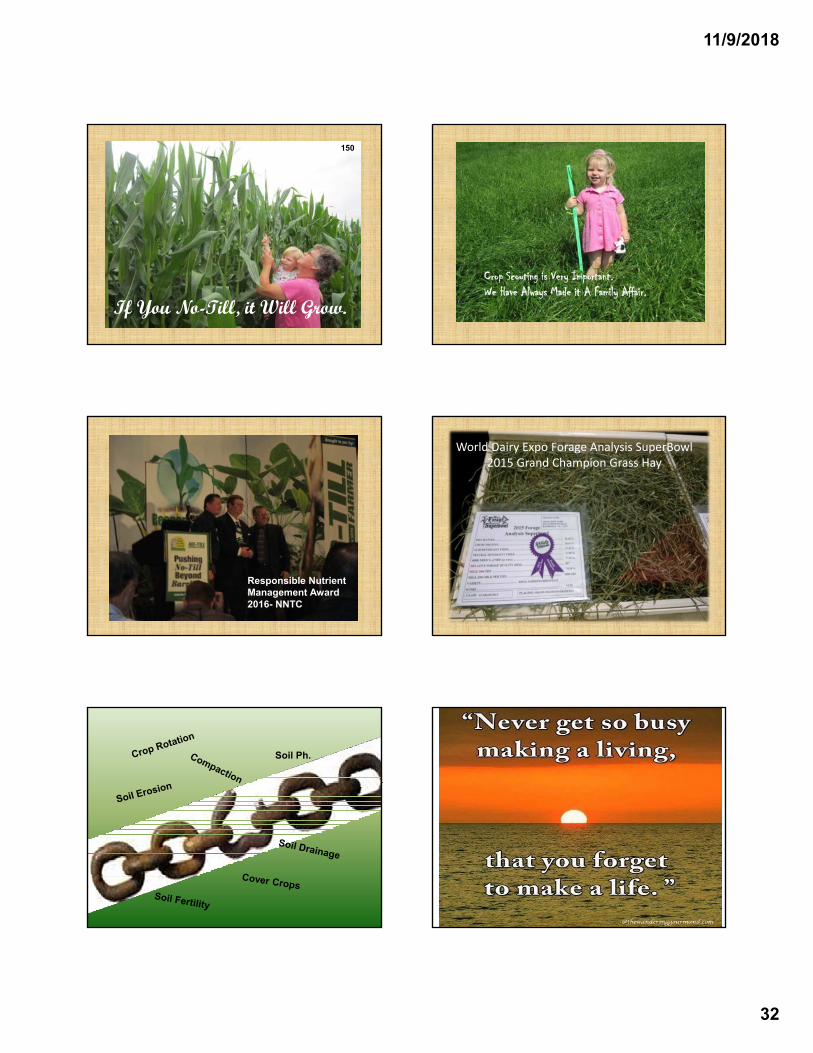
11/9/2018
32
If You No-Till, it Will Grow.
150
Crop Scouting is Very Important. We Have Always Made it A Family Affair.
Responsible Nutrient Management Award 2016- NNTC
World Dairy Expo Forage Analysis SuperBowl2015 Grand Champion Grass Hay
Soil Ph.
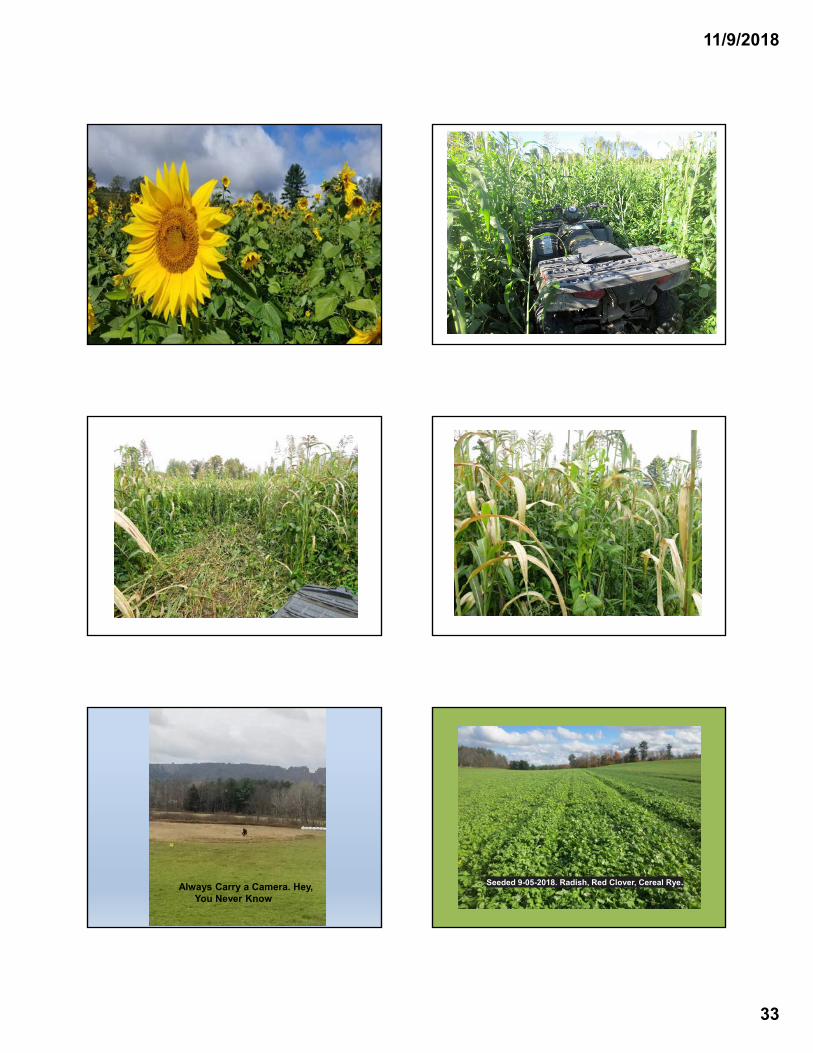
11/9/2018
33
Always Carry a Camera. Hey, You Never Know
Seeded 9-05-2018. Radish, Red Clover, Cereal Rye.
11/9/2018
34
Some Of My Neighbors in
Disbelief(Dog, Tick, and
Woim)
This really Happens more often than you would think
I would like to thank Penn State, It’s employees and the Nearby Farm Support Community for Inviting Me, and the Opportunity to Speak at This Nutrition Conference about our Farm. It is Always a Pleasure. John K
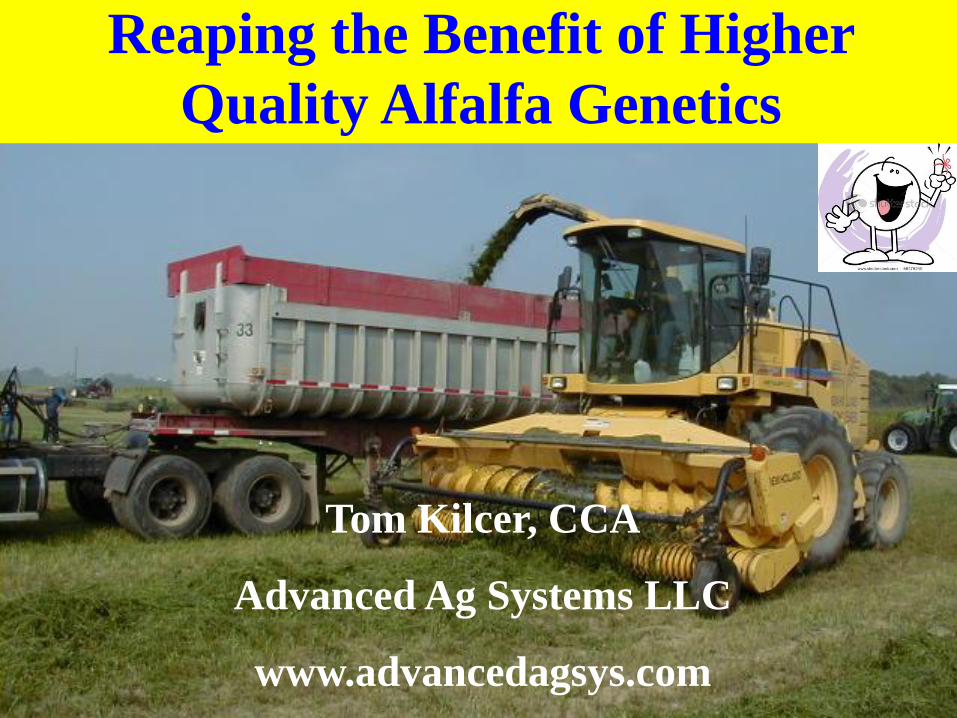
Reaping the Benefit of Higher
Quality Alfalfa Genetics
Tom Kilcer, CCA
Advanced Ag Systems LLC
www.advancedagsys.com
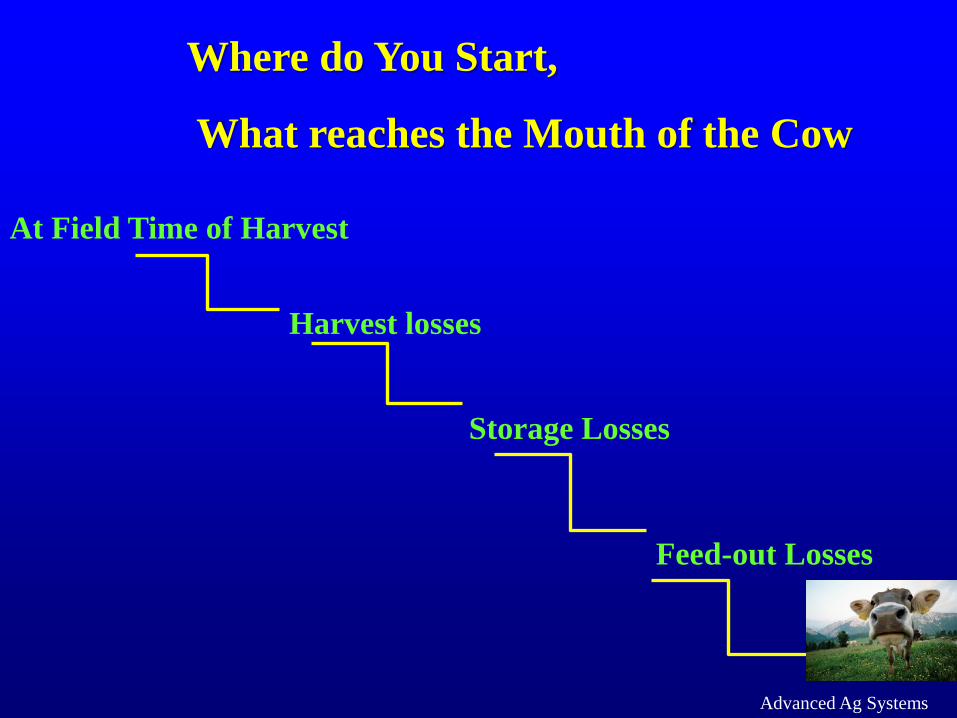
Advanced Ag Systems
LLC
At Field Time of Harvest
Harvest losses
Storage Losses
Feed-out Losses
Where do You Start,
What reaches the Mouth of the Cow
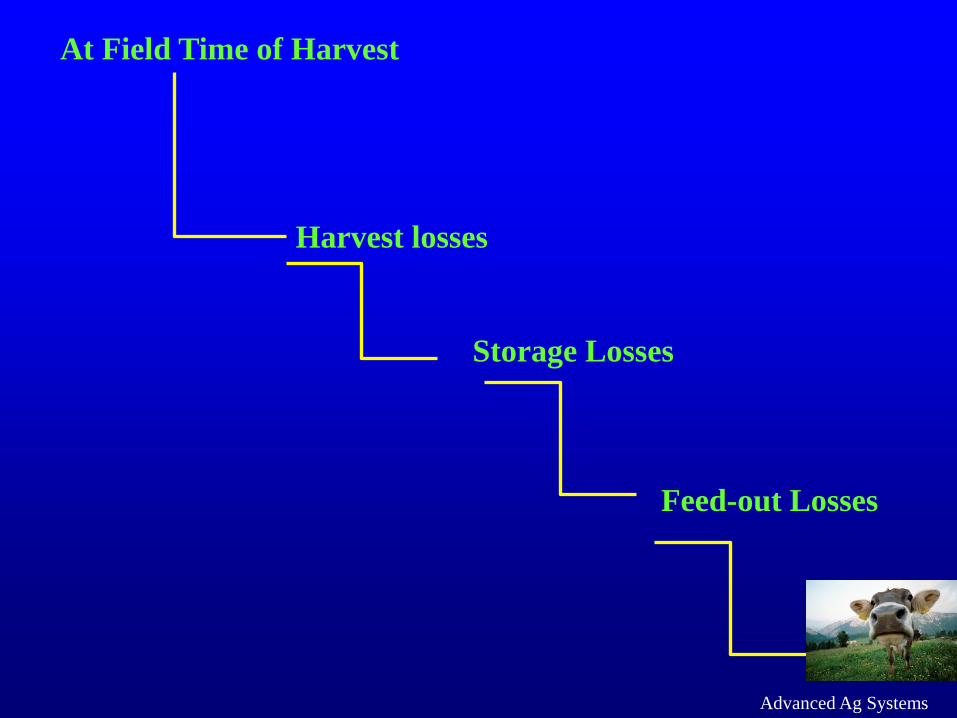
Advanced Ag Systems
LLC
At Field Time of Harvest
Harvest losses
Storage Losses
Feed-out Losses
Advanced Ag Systems LLC
Highly Digestible Alfalfa Genetics
Not a Magic Bullet
But a critical tool to increase
or get profitability
Field at the Time of Harvest
When was Last Soil Samples?
pH : This is not magic alfalfa
Advanced Ag Systems LLC
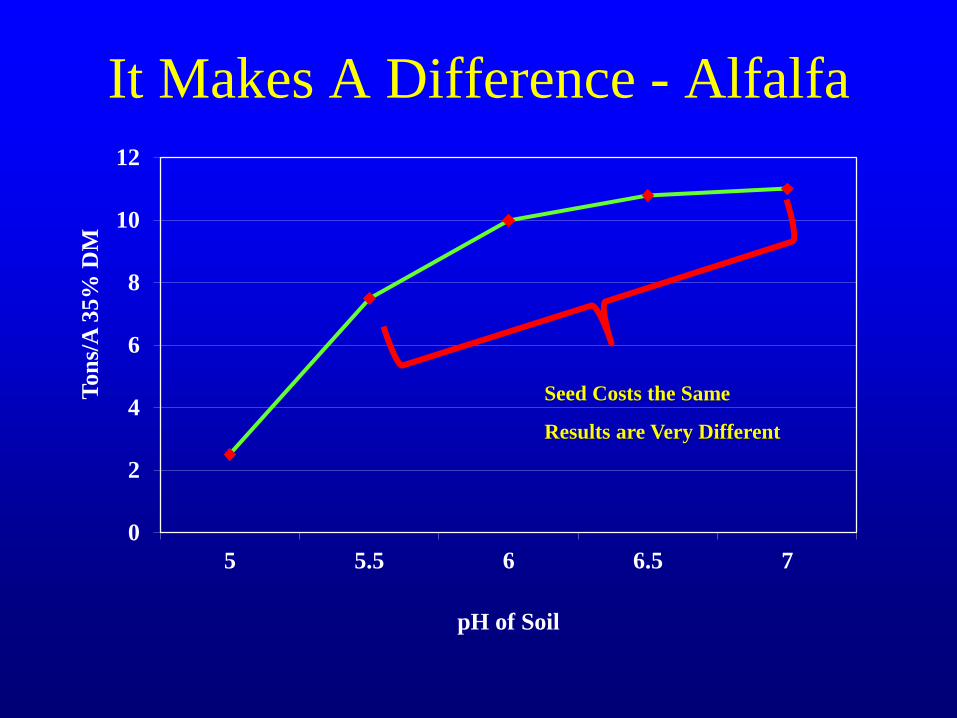
It Makes A Difference - Alfalfa
0
2
4
6
8
10
12
5 5.5 6 6.5 7
Ton
s/A
35%
DM
pH of Soil
Seed Costs the Same
Results are Very Different
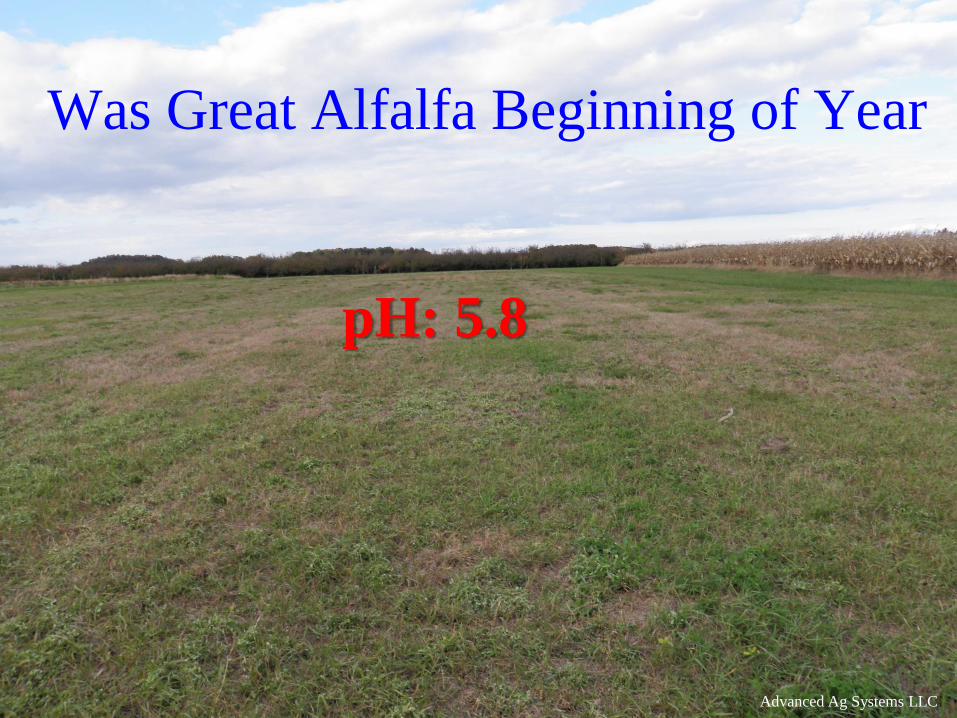
Was Great Alfalfa Beginning of Year
Advanced Ag Systems LLC
pH: 5.8
Field at the Time of Harvest
When was Last Soil Samples?
pH : This is not magic alfalfa
Sulfur: Critical for protein
Advanced Ag Systems LLC
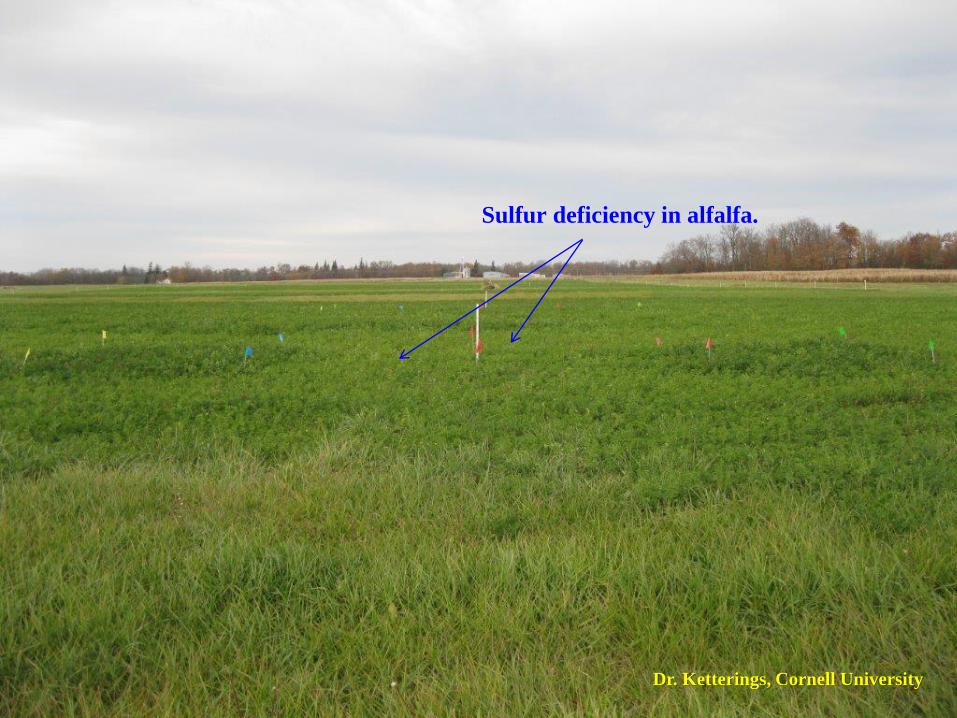
Sulfur deficiency in alfalfa.
Dr. Ketterings, Cornell University

Quality Forage
Advanced Ag Systems LLC
When You Harvest
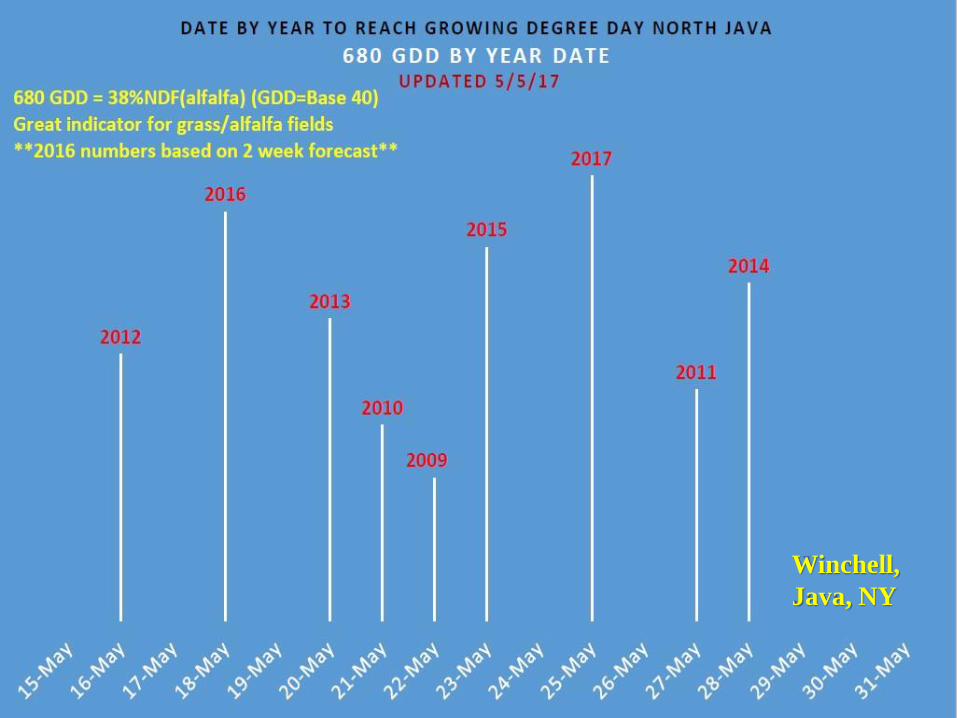
Winchell,
Java, NY
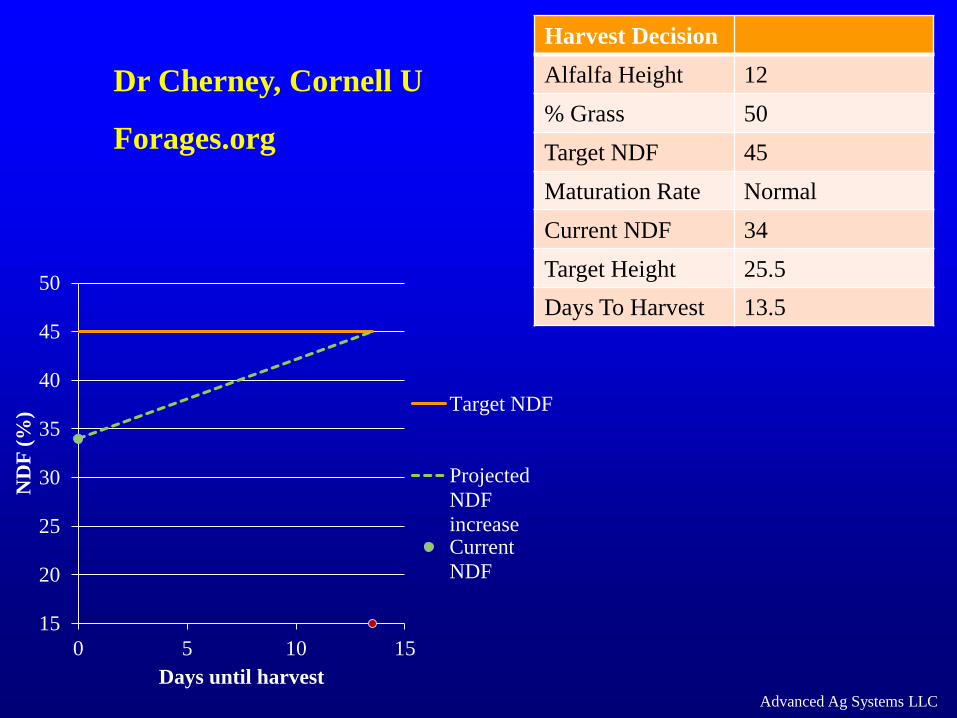
Harvest Decision
Alfalfa Height 12
% Grass 50
Target NDF 45
Maturation Rate Normal
Current NDF 34
Target Height 25.5
Days To Harvest 13.5
Advanced Ag Systems LLC
15
20
25
30
35
40
45
50
0 5 10 15
ND
F (
%)
Days until harvest
Target NDF
Projected
NDF
increaseCurrent
NDF
Dr Cherney, Cornell U
Forages.org

Quality Forage
Advanced Ag Systems LLC
How You Harvest
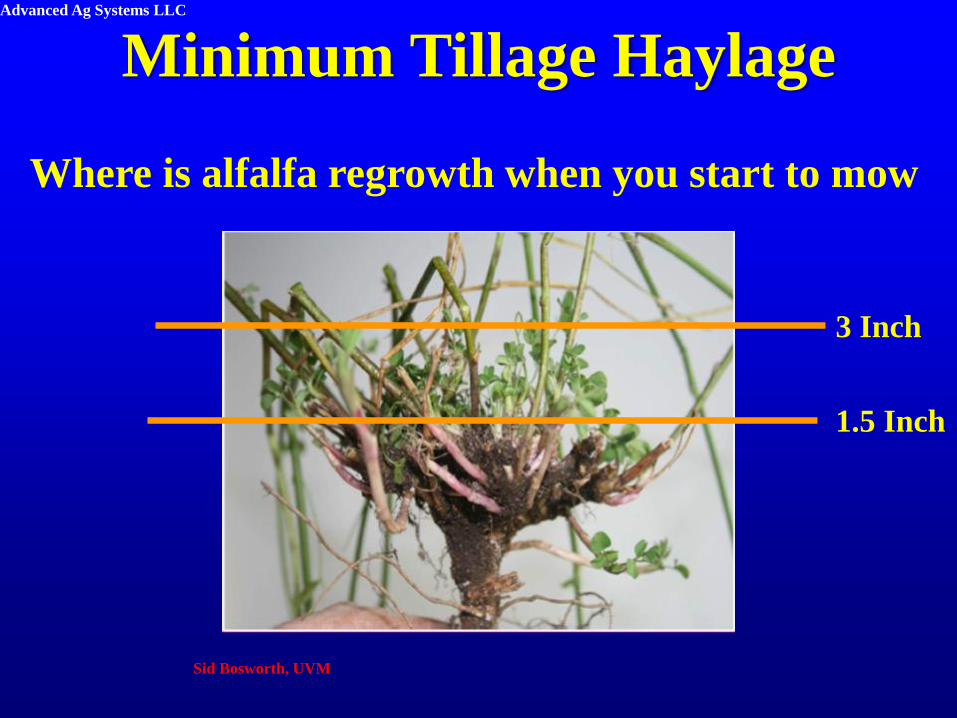
Advanced Ag Systems LLC
Sid Bosworth, UVM
Where is alfalfa regrowth when you start to mow
3 Inch
1.5 Inch
Minimum Tillage Haylage
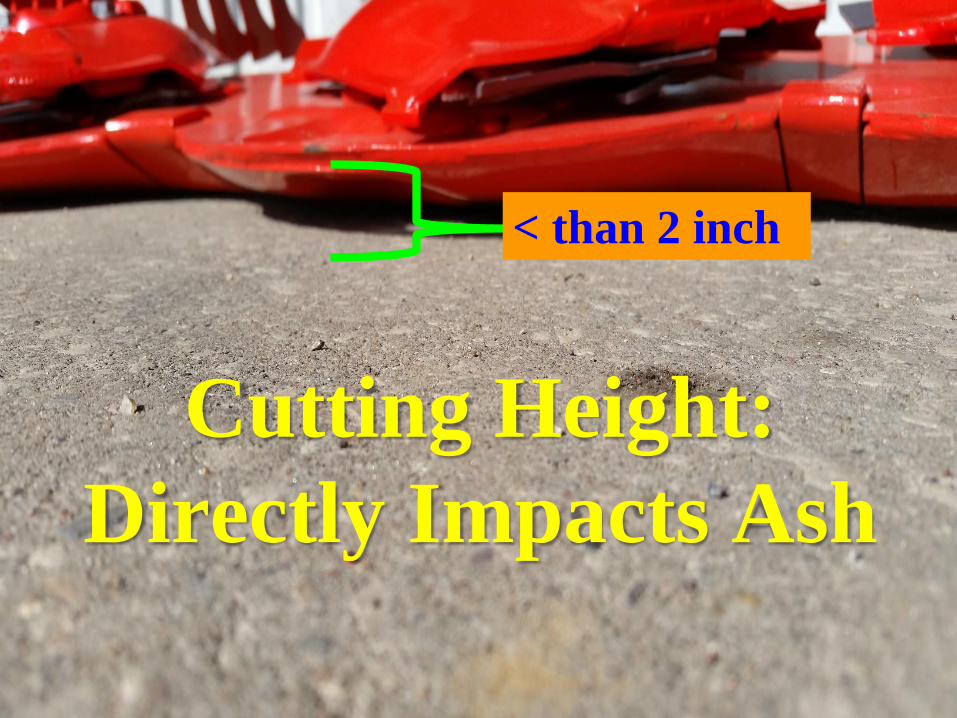
Advanced Ag Systems LLC
< than 2 inch
Cutting Height:
Directly Impacts Ash
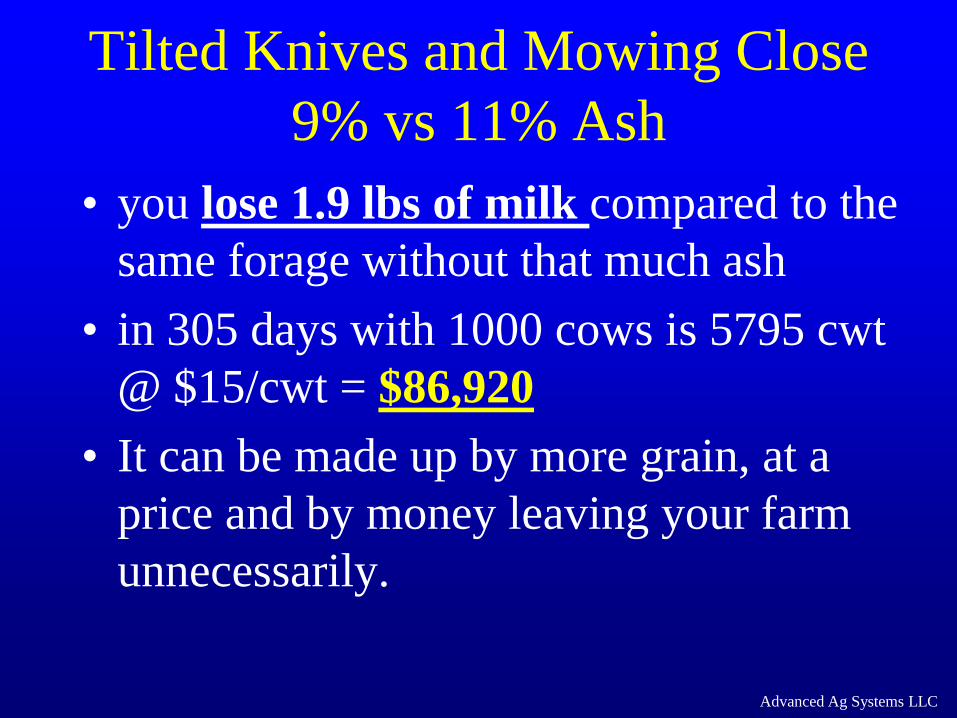
Tilted Knives and Mowing Close
9% vs 11% Ash
• you lose 1.9 lbs of milk compared to the
same forage without that much ash
• in 305 days with 1000 cows is 5795 cwt
@ $15/cwt = $86,920
• It can be made up by more grain, at a
price and by money leaving your farm
unnecessarily.
Advanced Ag Systems LLC
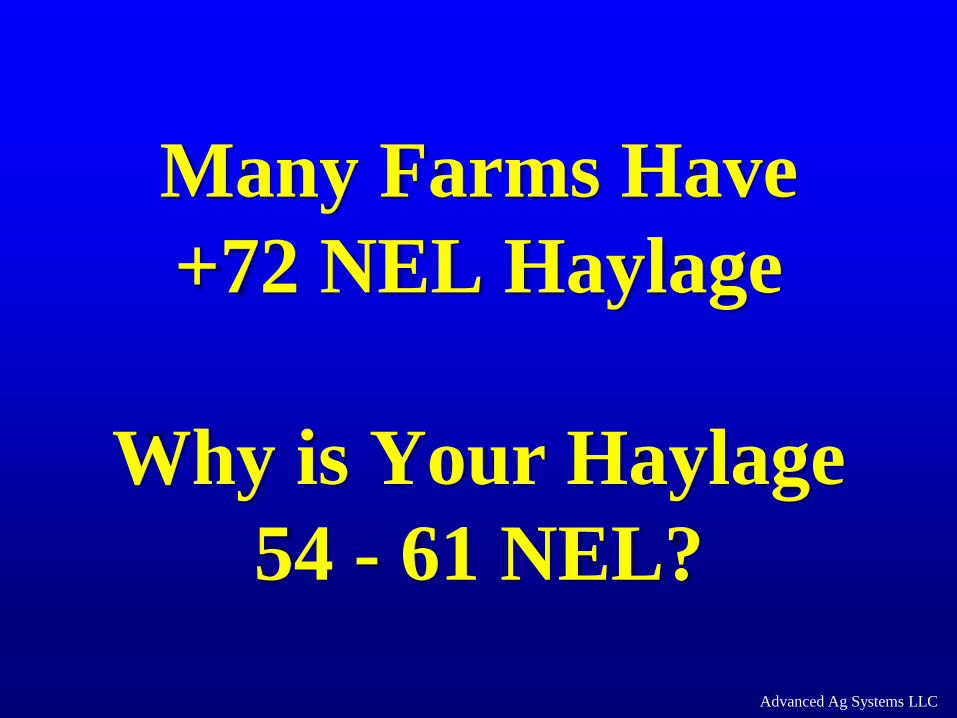
Advanced Ag Systems LLC
Many Farms Have
+72 NEL Haylage
Why is Your Haylage
54 - 61 NEL?
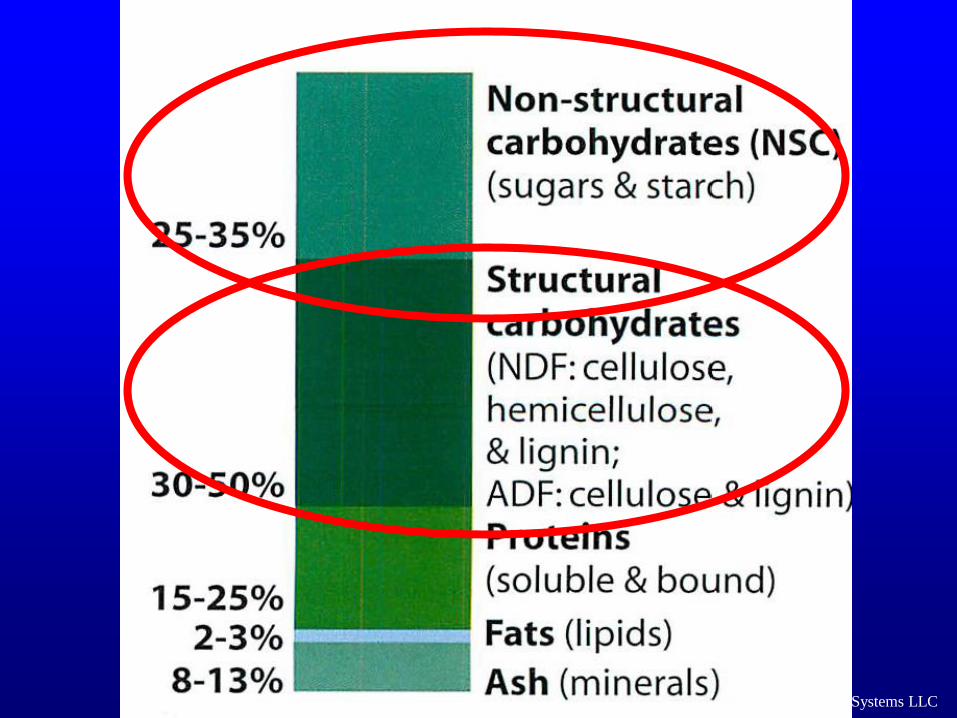
Advanced Ag Systems LLC
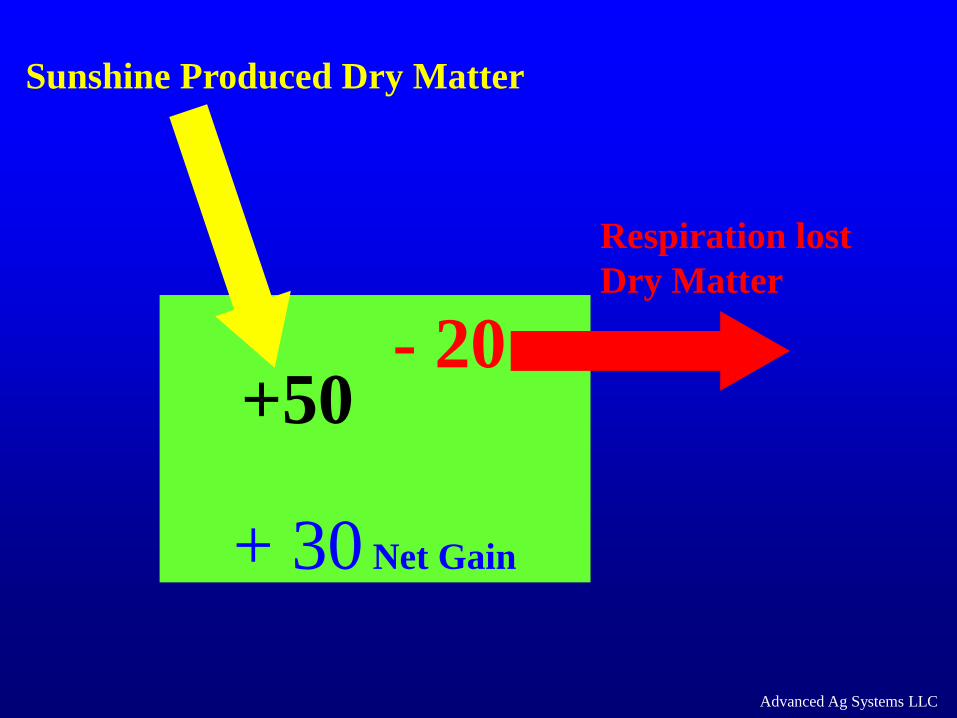
Advanced Ag Systems LLC
Sunshine Produced Dry Matter
+50
Respiration lost
Dry Matter
- 20
+ 30 Net Gain
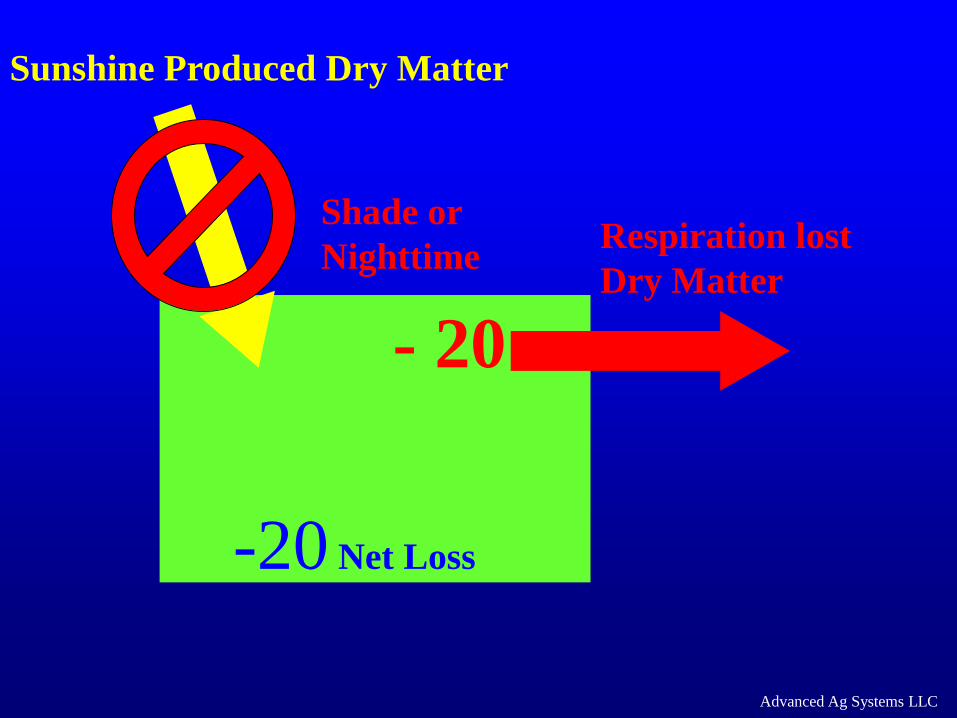
Advanced Ag Systems LLC
Sunshine Produced Dry Matter
Respiration lost
Dry Matter
- 20
-20 Net Loss
Shade or
Nighttime
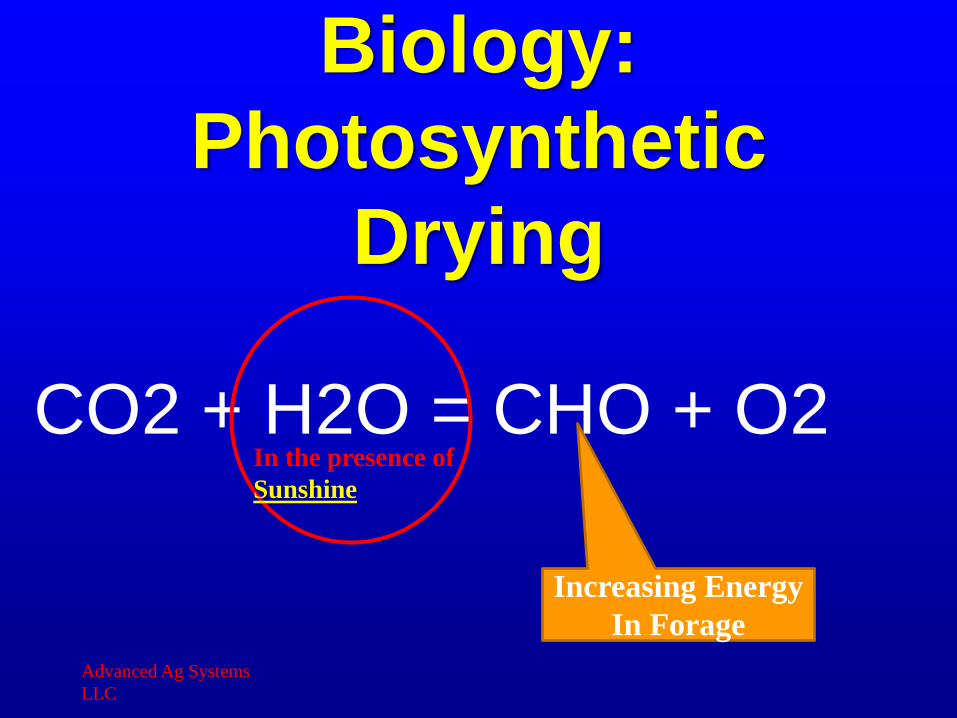
Biology:
Photosynthetic
Drying
CO2 + H2O = CHO + O2
Advanced Ag Systems
LLC
Increasing Energy
In Forage
In the presence of
Sunshine
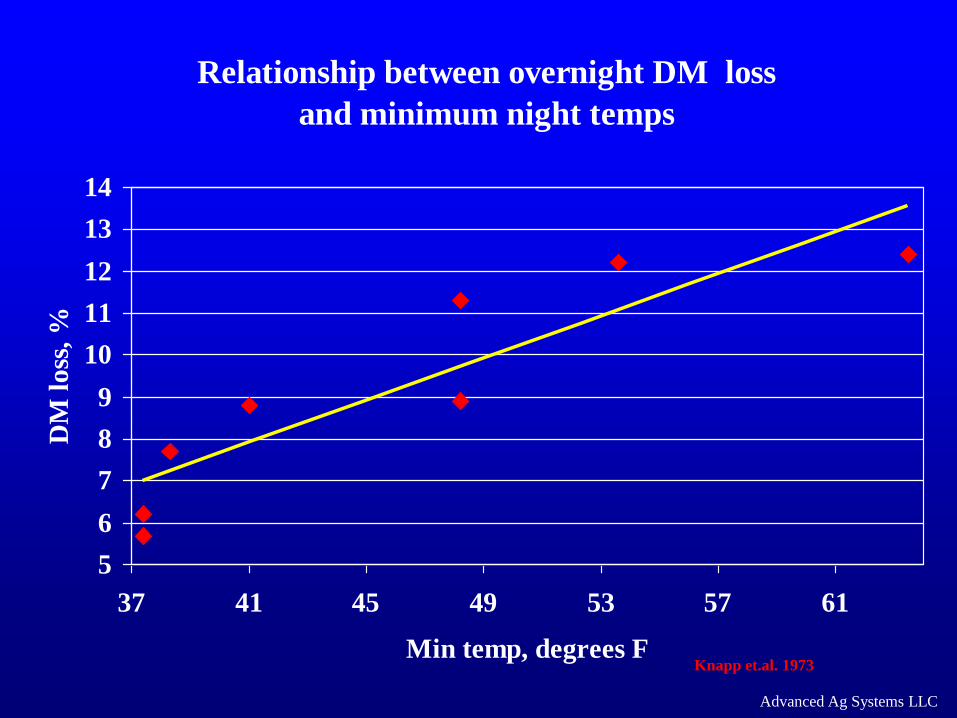
Advanced Ag Systems LLC
Relationship between overnight DM loss
and minimum night temps
5
6
7
8
9
10
11
12
13
14
37 41 45 49 53 57 61
Min temp, degrees F
DM
lo
ss,
%
Knapp et.al. 1973
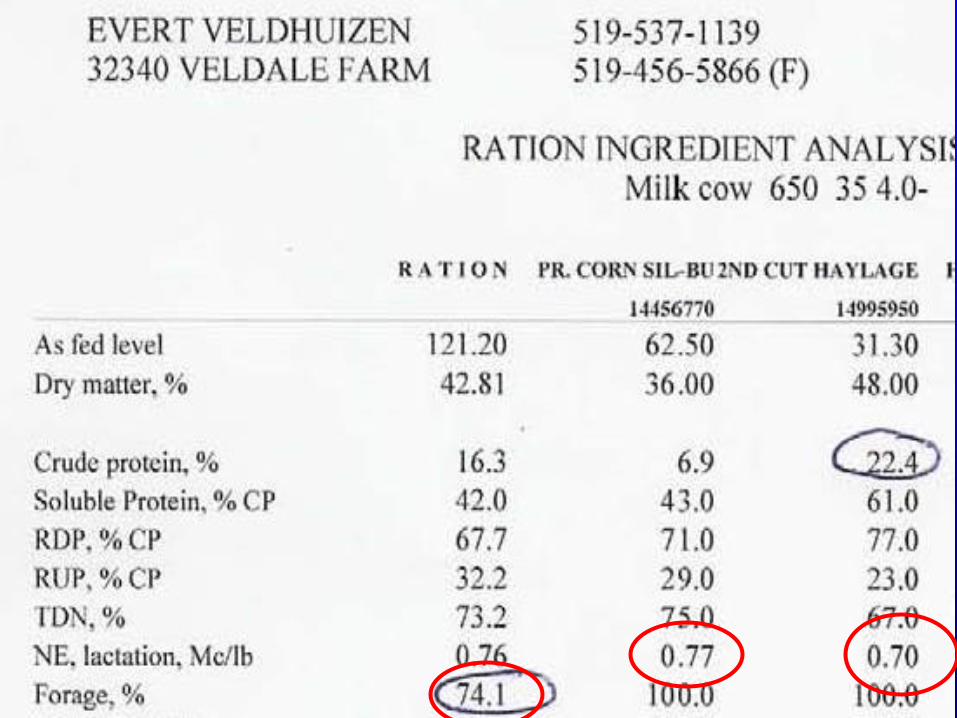
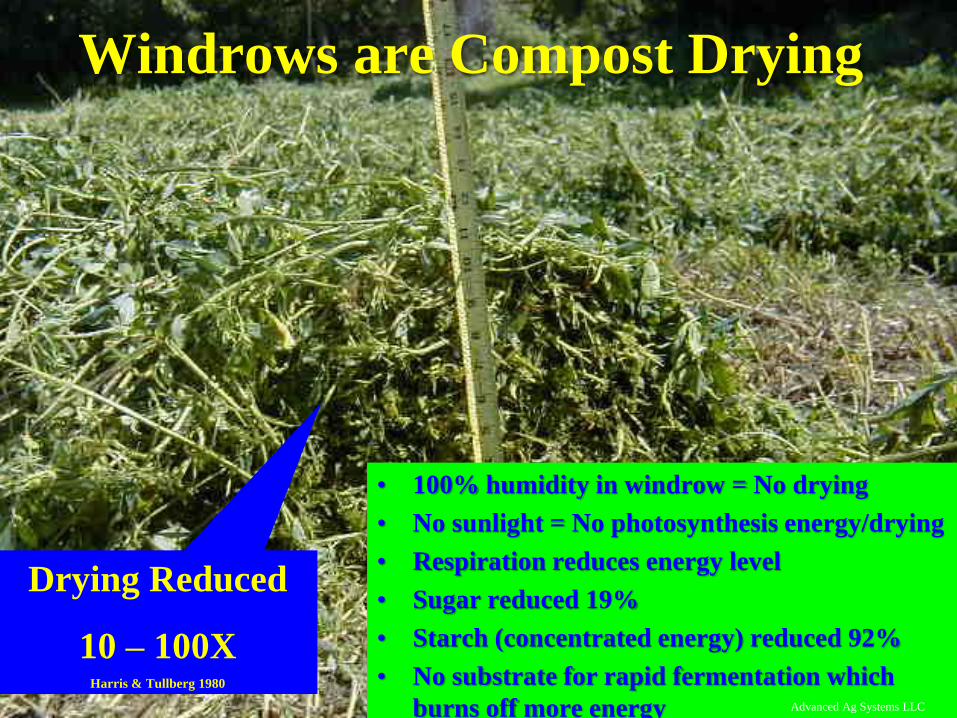
Windrows are Compost Drying
• 100% humidity in windrow = No drying
• No sunlight = No photosynthesis energy/drying
• Respiration reduces energy level
• Sugar reduced 19%
• Starch (concentrated energy) reduced 92%
• No substrate for rapid fermentation which
burns off more energy Advanced Ag Systems LLC
Drying Reduced
10 – 100XHarris & Tullberg 1980
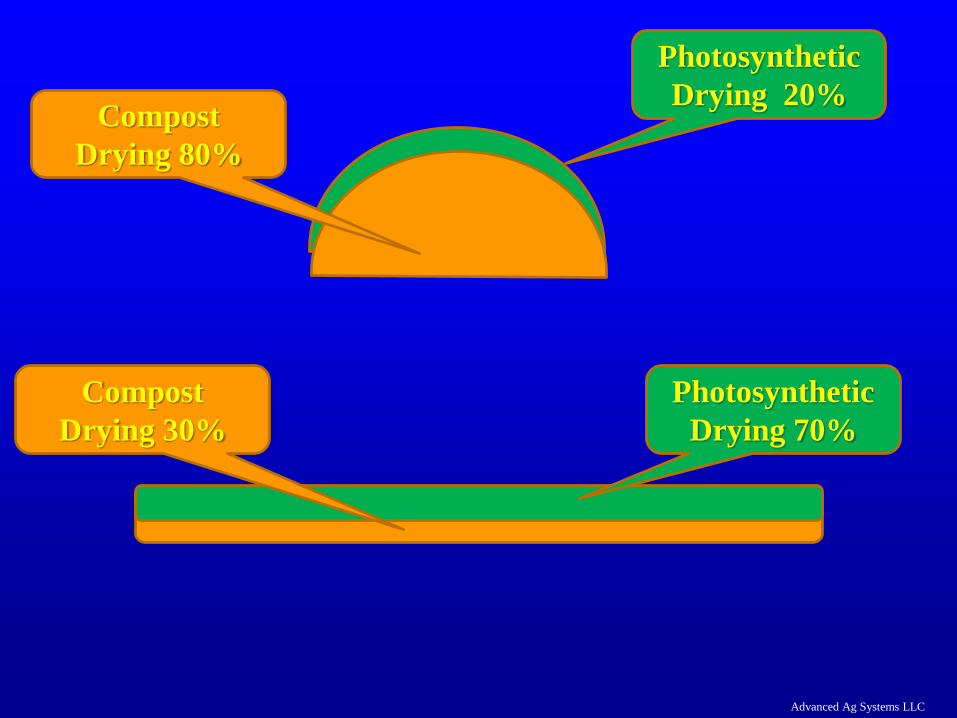
Advanced Ag Systems LLC
Photosynthetic
Drying 20%
Photosynthetic
Drying 70%
Compost
Drying 80%
Compost
Drying 30%
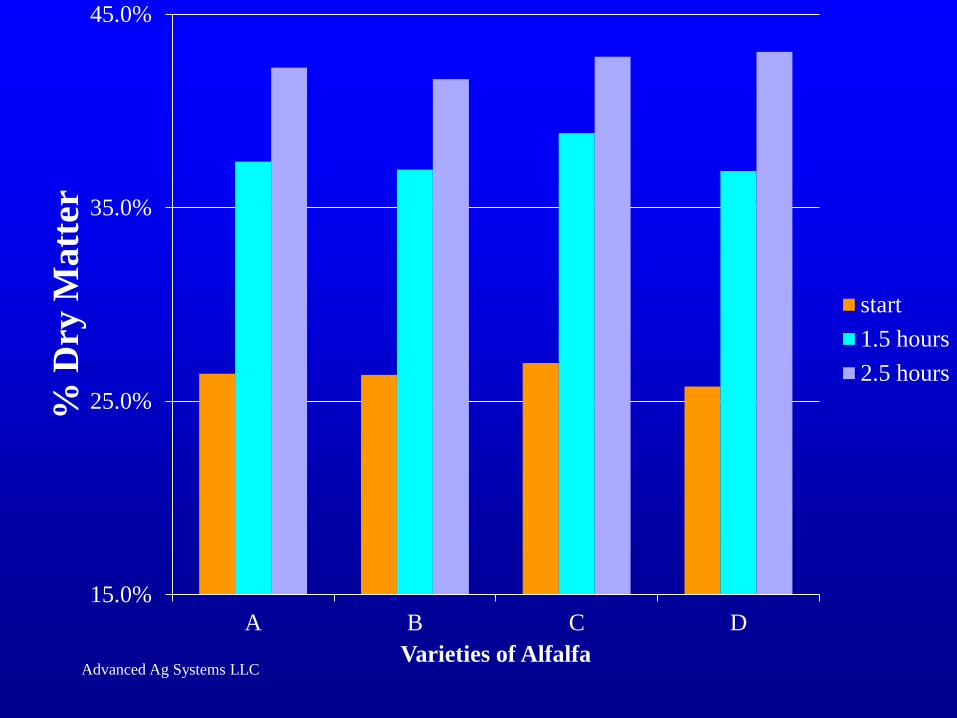
Advanced Ag Systems LLC
15.0%
25.0%
35.0%
45.0%
A B C D
% D
ry M
att
er
Varieties of Alfalfa
start
1.5 hours
2.5 hours
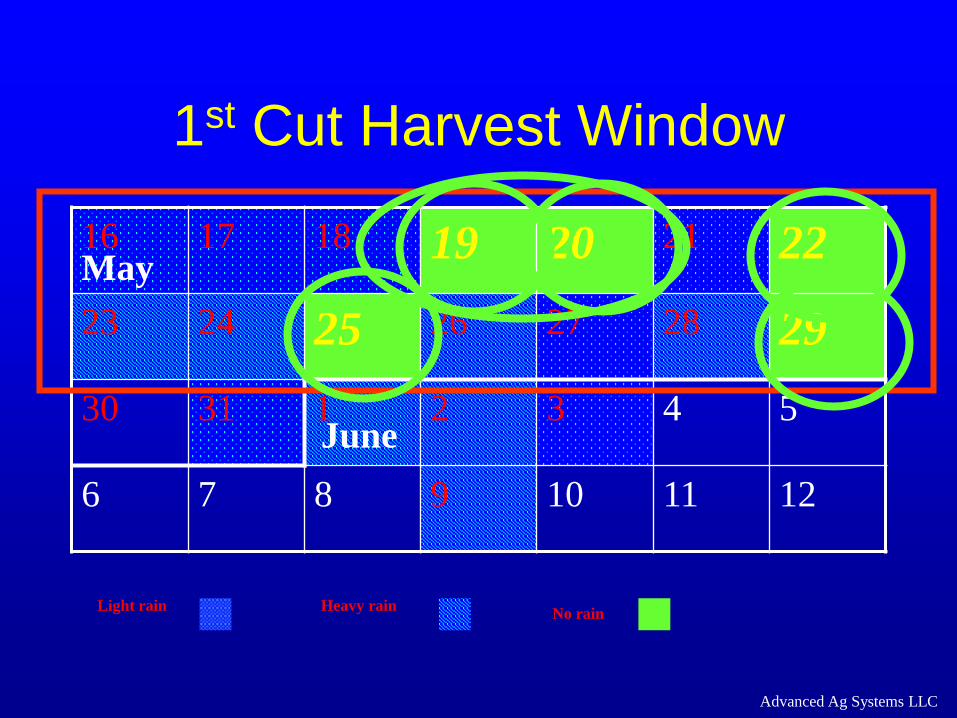
Advanced Ag Systems LLC
1st Cut Harvest Window
16 17 18 19 20 21 22
23 24 25 26 27 28 29
30 31 1 2 3 4 5
6 7 8 9 10 11 12
May
June
Light rain Heavy rainNo rain
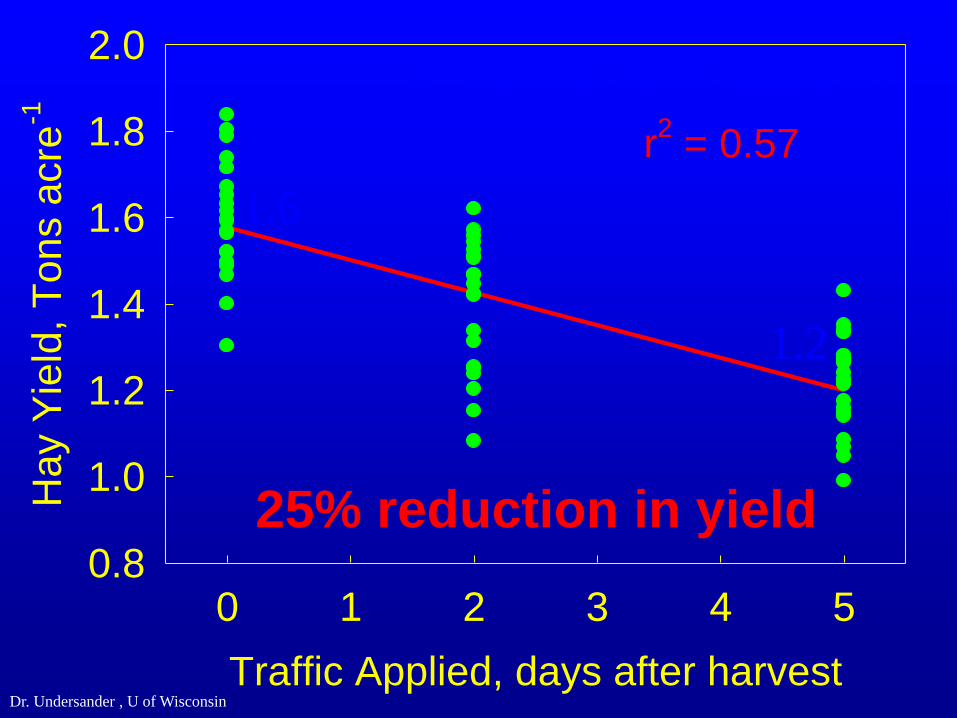
Dr. Undersander , U of Wisconsin
Traffic Applied, days after harvest
0 1 2 3 4 5
Hay Y
ield
, T
ons a
cre
-1
0.8
1.0
1.2
1.4
1.6
1.8
2.0
r2 = 0.57
2nd Harvest, 2001, Ithaca, NY
1.6
1.2
25% reduction in yield
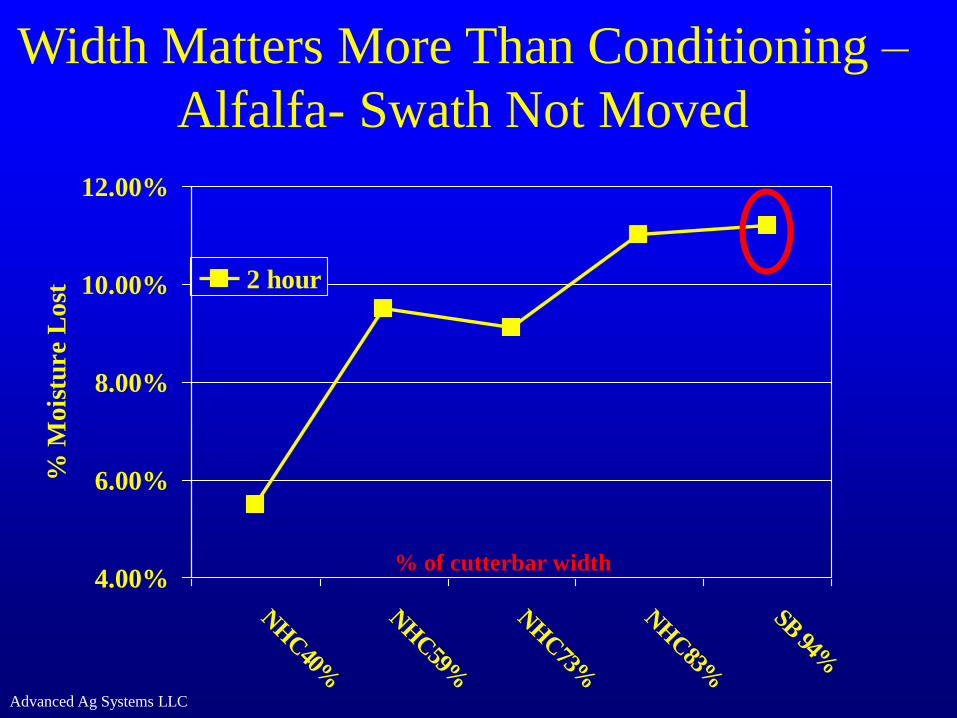
Advanced Ag Systems LLC
Width Matters More Than Conditioning –
Alfalfa- Swath Not Moved
4.00%
6.00%
8.00%
10.00%
12.00%
NH
C40%
NH
C59%
NH
C73%
NH
C83%
SB 94%
% M
ois
ture L
ost
2 hour
% of cutterbar width
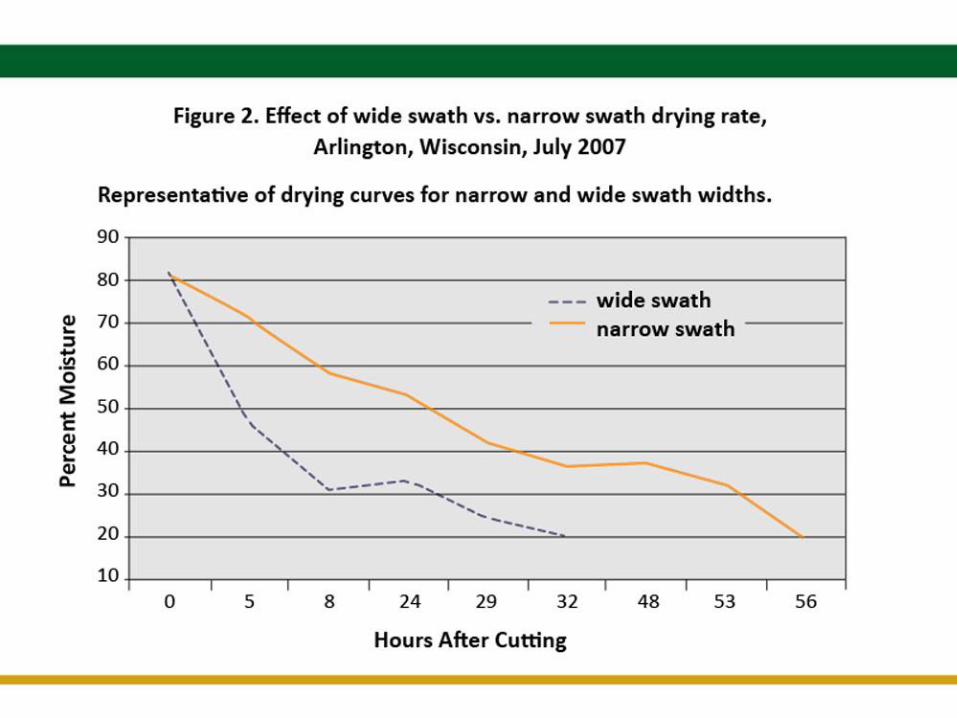
Advanced Ag Systems LLC
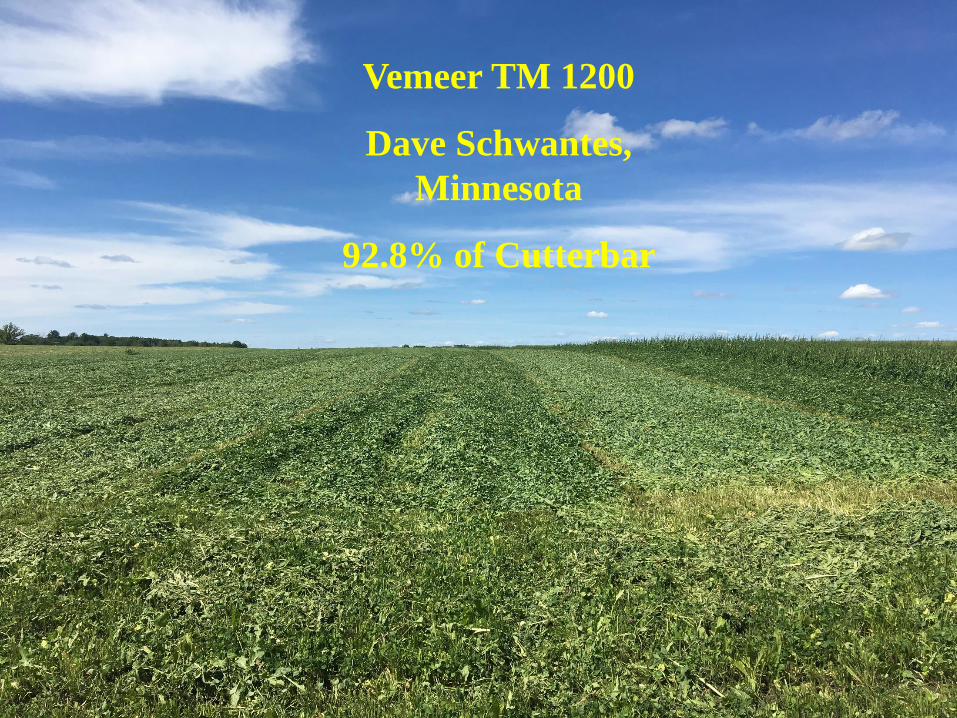
Advanced Ag Systems LLC
Vemeer TM 1200
Dave Schwantes,
Minnesota
92.8% of Cutterbar
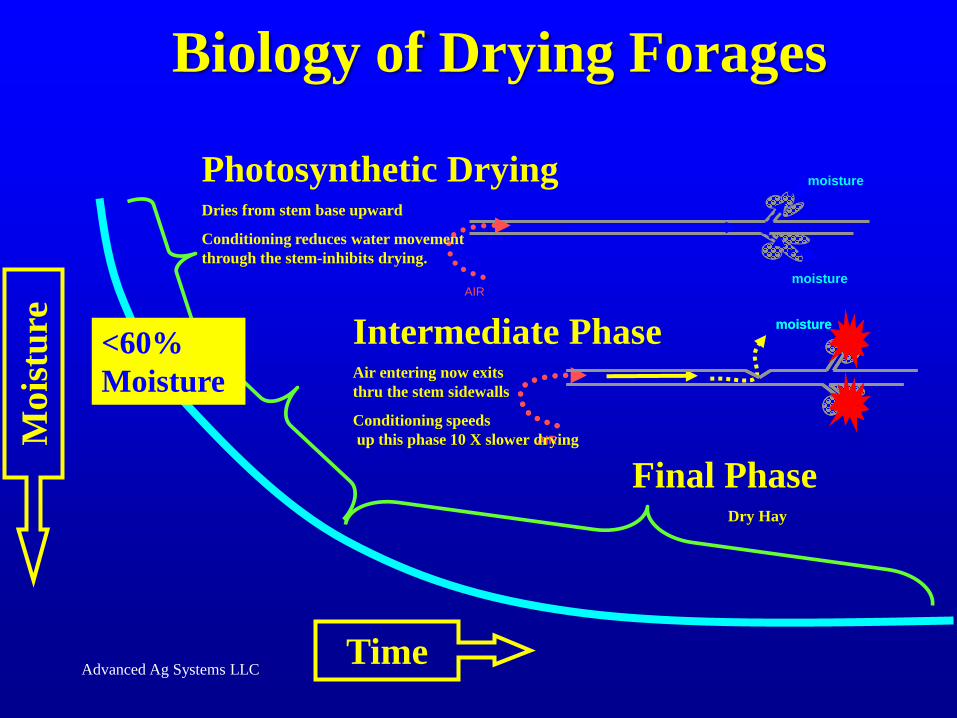
Advanced Ag Systems LLC
Biology of Drying Forages M
ois
ture
Time
<60%
Moisture
Final PhaseDry Hay
AIR
moisture
moisture
AIR
moisture
AIR
moistureIntermediate PhaseAir entering now exits
thru the stem sidewalls
Conditioning speeds
up this phase 10 X slower drying
Photosynthetic DryingDries from stem base upward
Conditioning reduces water movement
through the stem-inhibits drying.
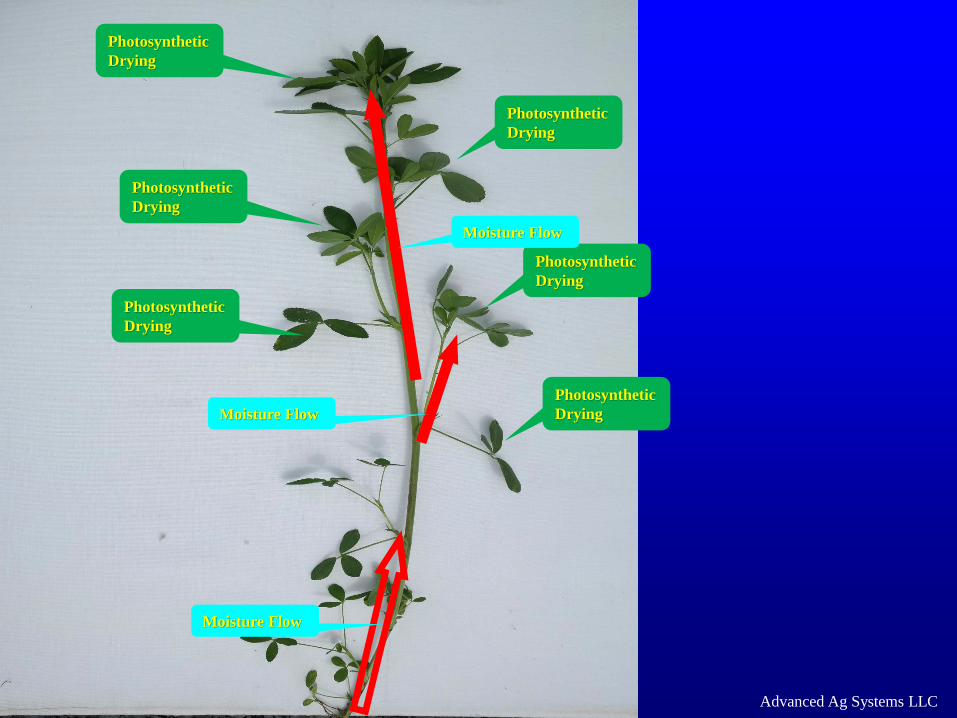
Advanced Ag Systems LLC
Photosynthetic
Drying
Photosynthetic
Drying
Photosynthetic
Drying
Photosynthetic
Drying
Photosynthetic
Drying
Photosynthetic
Drying
Moisture Flow
Moisture Flow
Moisture Flow
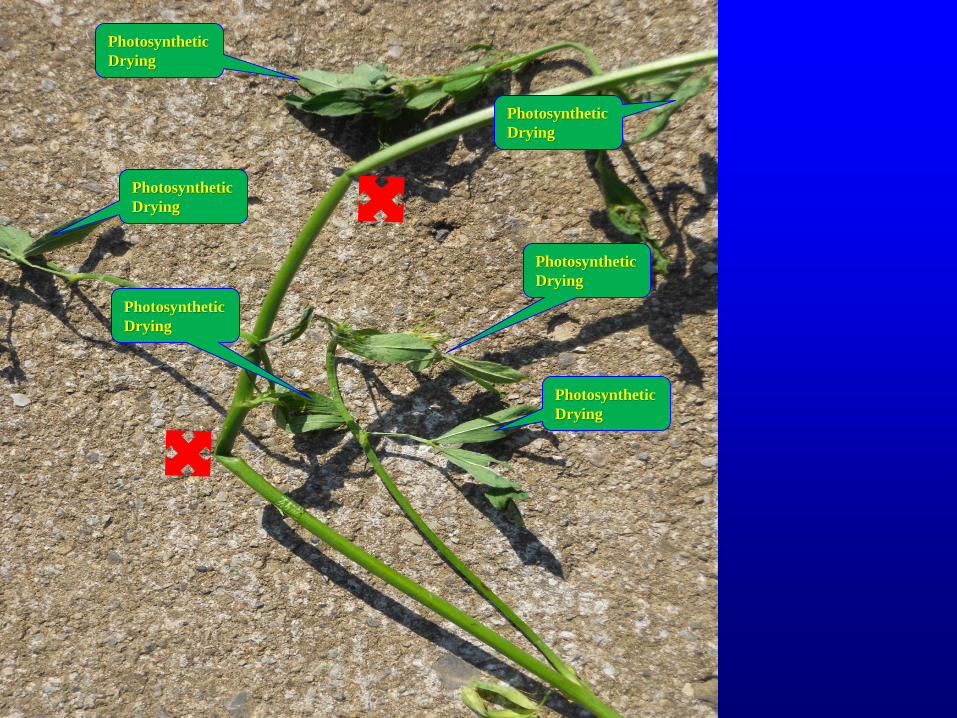
Photosynthetic
Drying
Photosynthetic
Drying
Photosynthetic
Drying
Photosynthetic
Drying
Photosynthetic
Drying
Photosynthetic
Drying
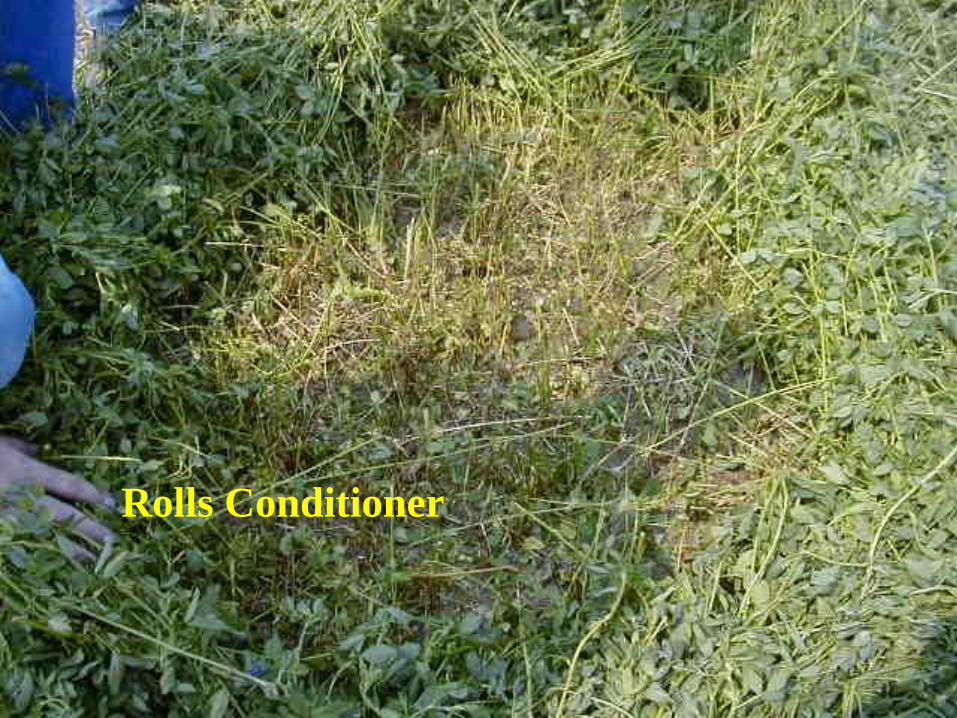
Advanced Ag Systems LLC
Rolls Conditioner
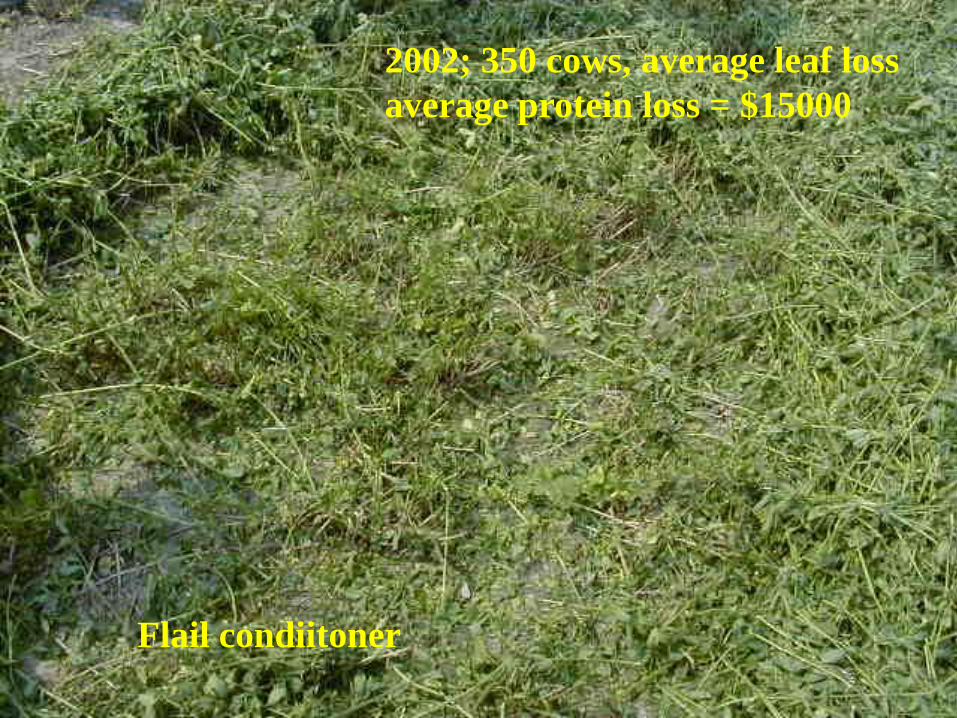
Advanced Ag Systems LLC
Flail condiitoner
2002; 350 cows, average leaf loss
average protein loss = $15000
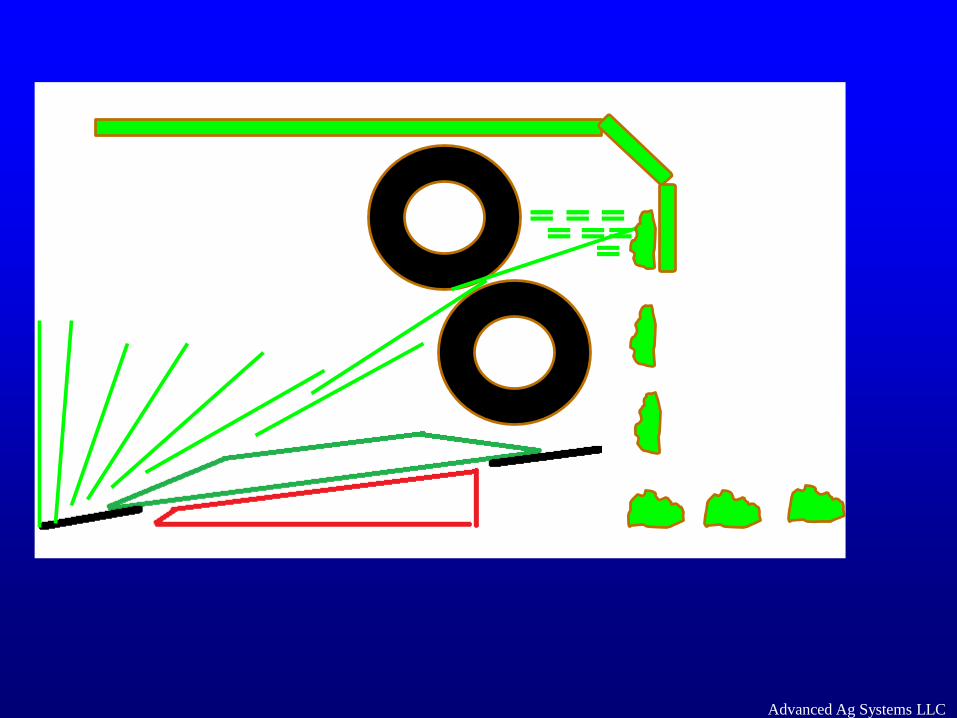
Advanced Ag Systems LLC
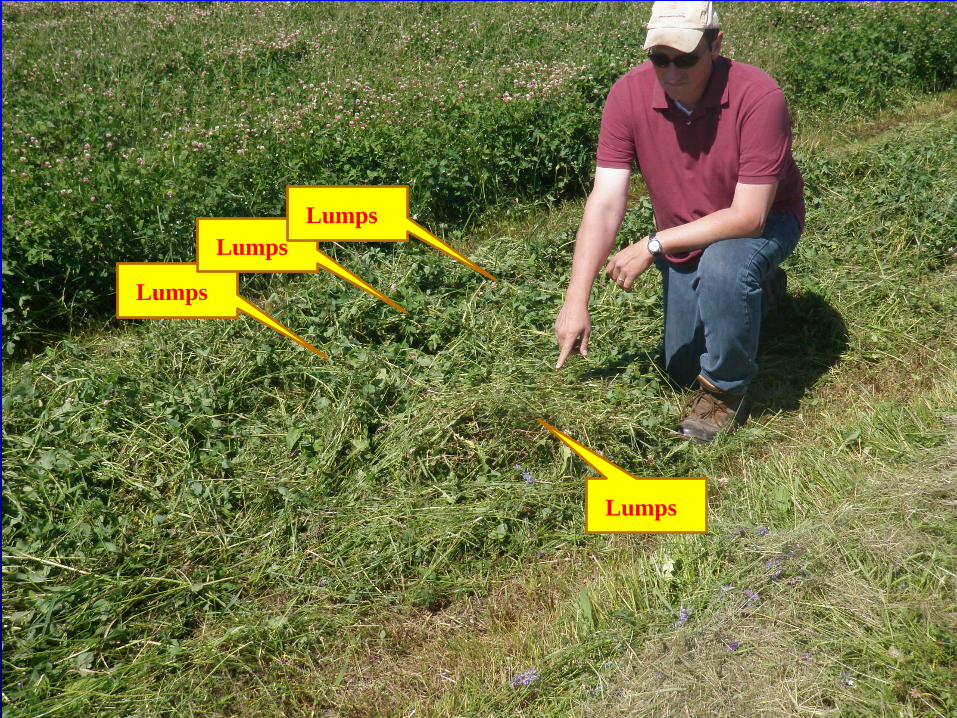
Advanced Ag
Systems LLC
Lumps
Lumps
Lumps
Lumps
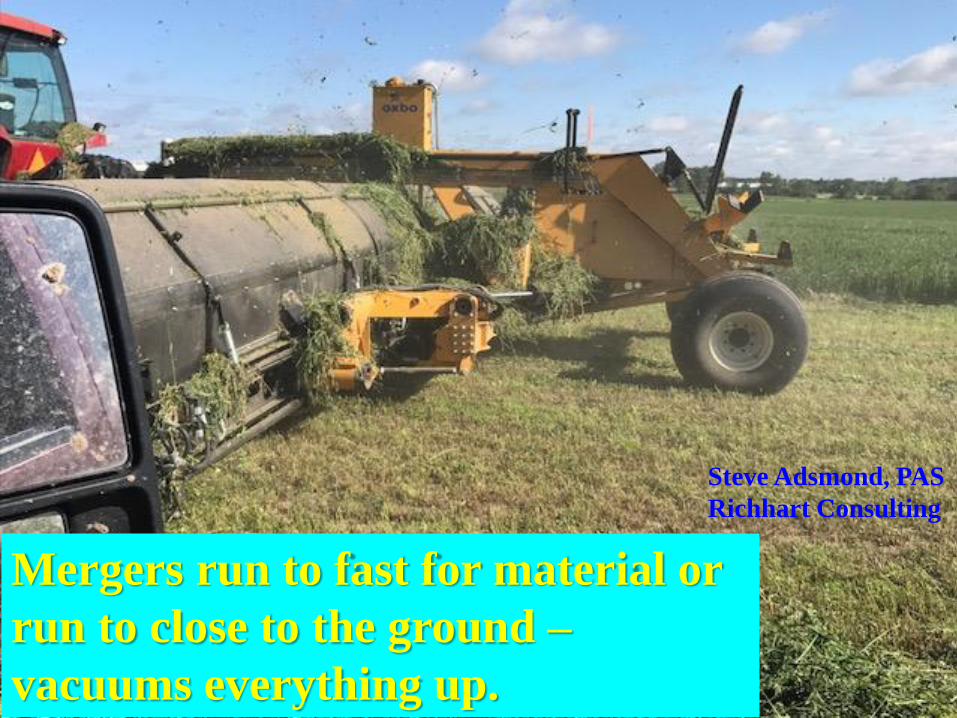
Advanced Ag Systems LLC
Steve Adsmond, PAS
Richhart Consulting
Mergers run to fast for material or
run to close to the ground –
vacuums everything up.
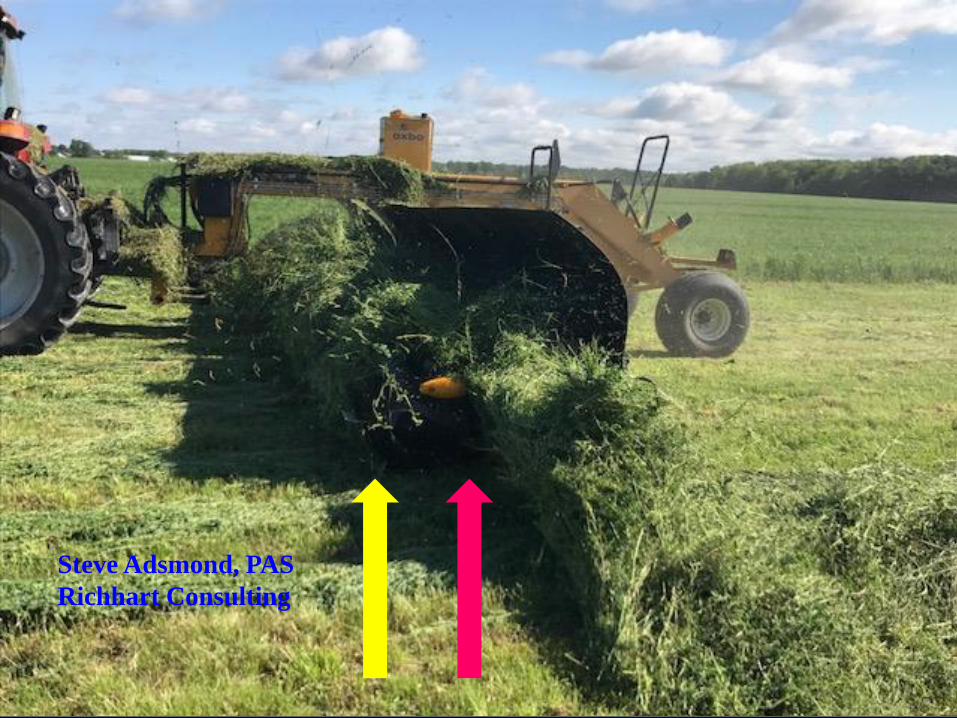
Advanced Ag Systems LLC
Steve Adsmond, PAS
Richhart Consulting
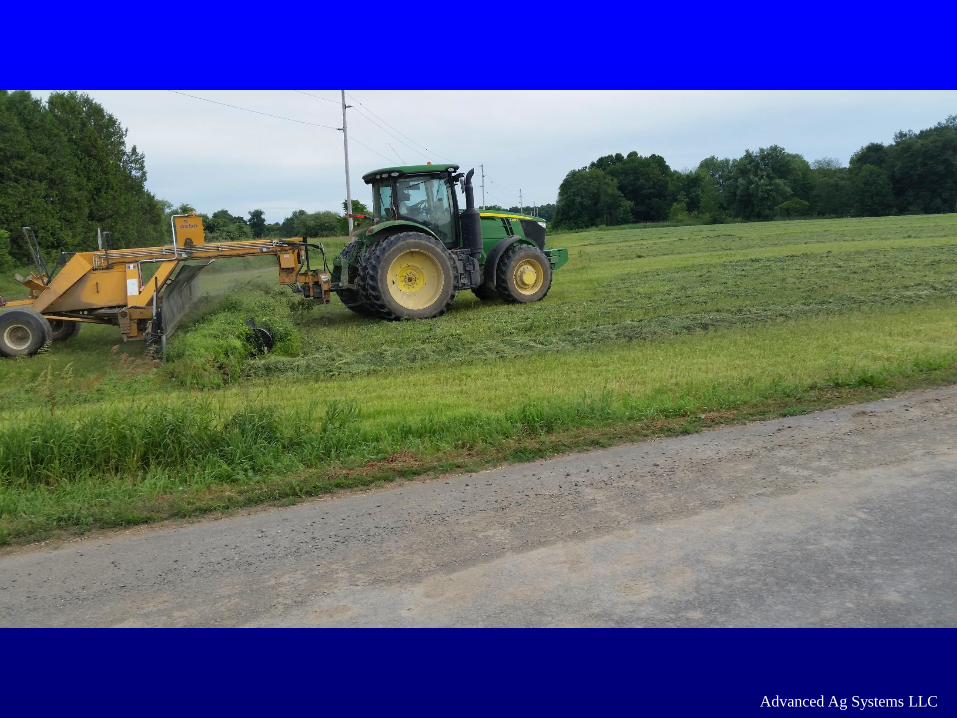
Advanced Ag Systems LLC
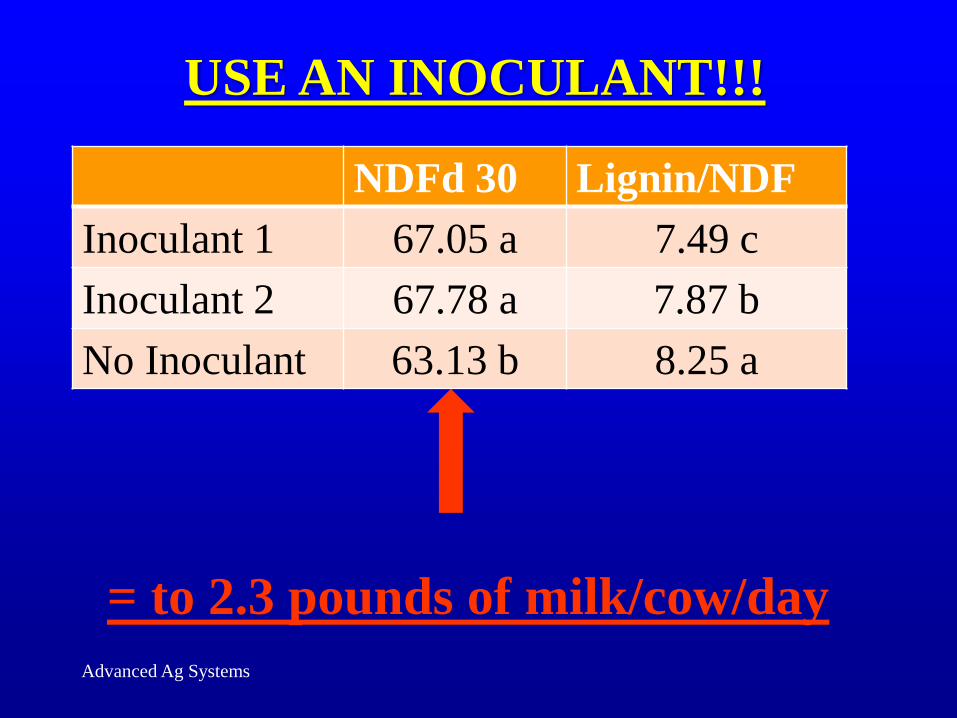
Advanced Ag Systems
= to 2.3 pounds of milk/cow/day
USE AN INOCULANT!!!
NDFd 30 Lignin/NDF
Inoculant 1 67.05 a 7.49 c
Inoculant 2 67.78 a 7.87 b
No Inoculant 63.13 b 8.25 a

Advanced Ag Systems LLC
Hooray!, I think
he is finally going
to be quiet
Photo by Ketterings
Thank God for
that, I was ready
to throw myself off
this rock
Advanced Ag Systems LLC.
http://www.advancedagsys.com
Questions??