electronic tongue as a screening tool for rapid analysis of beer
TRANSCRIPT
G
T
E
EFa
b
c
d
a
ARR2AA
KEPBBIP
1
tiitrqtpii
i
u4
0d
ARTICLE IN PRESSModel
AL-10929; No. of Pages 7
Talanta xxx (2009) xxx–xxx
Contents lists available at ScienceDirect
Talanta
journa l homepage: www.e lsev ier .com/ locate / ta lanta
lectronic tongue as a screening tool for rapid analysis of beer
vgeny Polshina,∗, Alisa Rudnitskayab,c, Dmitriy Kirsanovc, Andrey Leginc, Daan Saisond,ilip Delvauxd, Freddy R. Delvauxd, Bart M. Nicolaï a, Jeroen Lammertyna
BIOSYST-MeBioS, Catholic University of Leuven, W. De Croylaan 42, B-3001 Leuven, BelgiumCESAM/Chemistry Department, University of Aveiro, Aveiro, PortugalLaboratory of Chemical Sensors, Chemistry Department, St. Petersburg University, RussiaCentre for Malting and Brewing Science, Catholic University of Leuven, Kasteelpark Arenberg 22, Box 2463, B-3001 Leuven, Belgium
r t i c l e i n f o
rticle history:eceived 31 August 2009eceived in revised form2 September 2009ccepted 12 November 2009vailable online xxx
eywords:lectronic tongueotentiometric sensors
a b s t r a c t
An electronic tongue (ET) comprising 18 potentiometric chemical sensors was applied to the quantitativeanalysis of beer. Fifty Belgian and Dutch beers of different types were measured using the ET. The samesamples were analyzed using conventional analytical techniques with respect to the main physicochem-ical parameters. Only non-correlated physicochemical parameters were retained for further analysis,which were real extract, real fermentation degree, alcohol content, pH, bitterness, color, polyphenol andCO2 content. Relationship between the ET and physicochemical datasets was studied using CanonicalCorrelation Analysis (CCA). Four significant canonical variates were extracted using CCA. Correlation wasobserved between 6 physicochemical variables (real extract and fermentation degree, bitterness, pH,alcohol and polyphenols’ content) and 14 sensors of the ET. The feasibility of the ET for the quantificationof bitterness in beer was evaluated in the aqueous solutions of isomerised hop extract and in the set of
eeritternessso-�-acidsartial least square regression
11 beers with bitterness varying between 14 and 38 EBU (European Bitterness Units). Sensors displayedgood sensitivity to isomerised hop extract and good prediction of the bitterness in beer was obtained.Calibration models with respect to the physicochemical parameters using ET measurements in 50 Bel-gian and Dutch beer samples were calculated by Partial Least Square regression. The ET was capable ofpredicting such parameters as real extract, alcohol and polyphenol content and bitterness, the latter withRoot Mean Square Error of Prediction (RMSEP) of 2.5.
. Introduction
Beer is one of the oldest known alcoholic beverages produced byhe yeast fermentation of the cereal extract that were germinatedn water beforehand [1]. Brewing is a complex process demand-ng the control of many parameters to ensure reproducibility ofhe quality of the finished product. Determination of some of theoutine parameters such as extract and fermentation degree isuite simple as it is based on the measurements of density. Onhe other hand, measurement of some chemical parameters, i.e.,olyphenol content or bitterness requires the use of the analytical
Please cite this article in press as: E. Polshin, et al., Talanta (2009), doi:10.1
nstruments and therefore is more difficult and time consum-ng.
Bitterness in particular is a very important quality parametern beer production. Bitter taste in beer originates mainly from
∗ Corresponding author at: Division Mechatronics, Biostatistics and Sensors, Fac-lty of Bioscience Engineering, Katholieke Universiteit Leuven, Willem de Croylaan2, B-3001, Leuven, Belgium. Tel.: +32 16 320592; fax: +32 16 322955.
E-mail address: [email protected] (E. Polshin).
039-9140/$ – see front matter © 2009 Elsevier B.V. All rights reserved.oi:10.1016/j.talanta.2009.11.041
© 2009 Elsevier B.V. All rights reserved.
the hops added to the wort during brewing [1]. Hop contains�-acids, which undergo an isomerisation reaction during boilingresulting in the formations of more soluble and more bitter iso-�-acids [2,3]. Besides imparting bitter taste to beer, iso-�-acidsalso possess bacteriostatic properties and play substantial role inthe enhancing the foam stability of beer due to the tensioactiveproperties [4–7]. Instrumental measurements of bitterness consistin the determination of the total content of iso-�-acids, which isexpressed in the European Bitter Units (EBU). Analysis is carriedout by a spectrophotometric measurement at 275 nm of an acidicsolvent extract of beer [8]. The EBU method is quite slow due tothe cumbersome sample preparation step—extraction, which intro-duces high uncertainty and involves the use of undesirable organicsolvents.
Several efforts have been done in the last three decades aim-ing at the development of the fast and automated technique for
016/j.talanta.2009.11.041
routine bitterness measurements [9–11]. High performance liquidchromatography (HPLC) and liquid chromatography with ultravi-olet absorbance detection or with mass spectrometry (LC-UV andLC–MS) can also be used to measure the amount of iso-�-acids inbeer [12,13]. However, the EBU method continues to be widely used
ING
T
2 lanta x
apc
sdEotmiErpwe(aosaamqfnPsdbhb
oypopatutiditwate
2
2
bps
tieawr
ARTICLEModel
AL-10929; No. of Pages 7
E. Polshin et al. / Ta
s relatively high cost and long time of analysis, and experiencedersonnel required prohibit routine use of HPLC in the industrialonditions.
One of the alternatives for traditional techniques may be multi-ensor systems or electronic tongues (ET), which were developeduring last two decades by several research groups [14–16]. TheT typically comprises an array of sensors with partial selectivityr cross-sensitivity to the components of interest, data acquisi-ion device and data processing tools. Sensors based on different
easuring principles can be employed in the ET systems includ-ng potentiometric, amperometric, piezoelectric and optical. TheTs have been extensively applied in food research to the tasks ofecognition and classification, quantification of components andrediction of the sensory properties. Analyzed foodstuffs variedidely and included milk and dairy products, fruit juices, veg-
table oils, alcoholic and non-alcoholic beverages, coffee, and tea[14–16] and references therein). Applications of the ETs to thenalysis of beer, which were reported up to date, focused mainlyn the discrimination of the samples and prediction of the sen-ory attributes [17–20]. Recognition of beer according to the brandnd main organoleptic characteristics was carried using arrays ofll solid-state potentiometric sensors with plasticized polymericembranes [17–19] and optical sensors [20]. Application of a single
uartz crystal microbalance (QCM) sensor with polymeric coatingor the prediction of such the sensory attributes as body, smooth-ess, bitterness and astringency has been reported in [21–23].rediction of 20 sensory attributes of beer including bitterness,weet, sour, fruity, caramel, artificial, burnt, intensity and body wasone using an array of potentiometric sensors [24]. As such, feasi-ility of the ET systems for the analysis of beer was demonstrated,owever no applications to the quantitative analysis of beer haveeen reported in the literature up to date.
Therefore, the objective of the present study was the applicationf the ET based on potentiometric sensors to the quantitative anal-sis of beer. This research is a continuation of the previous workublished in [24], where the ET system was used for the predictionf beer sensory attributes as scored by the sensory panel. In theresent research the same set of 50 Belgian and Dutch beers wasnalyzed using conventional laboratory methods with respect tohe main physicochemical parameters, which were subsequentlysed for the calibration of the ET. Special attention has been paido the prediction of the instrumental bitterness—one of the mostmportant beer’s parameter. Therefore, a preliminary study wasone, which included the evaluation of the sensors sensitivity to
somerised hop extract and testing of a method of bitterness predic-ion in a small set of beer samples. Next, the prediction of bitternessas done on extended set of beer samples. This research was aimed
t the evaluation of the potential of the potentiometric electronicongue as a tool for fast analysis of several physicochemical param-ters including bitterness of beer.
. Materials and methods
.1. Samples
Measurements with the ET were carried out on commercialeers and model solutions of the isomerised hop extract. Beer sam-les were divided into two sets according to the purpose of thetudy.
The first sample set was used for calibrating the ET with respecto the physicochemical parameters that are routinely measured
Please cite this article in press as: E. Polshin, et al., Talanta (2009), doi:10.1
n beer. This set comprised 50 Belgian and Dutch beers of differ-nt types: dark and lager beers, ales, white (wheat), lambic fruitnd trappist beers. The description of the first sample set togetherith ranges of the physicochemical parameters measured by the
eference techniques are shown in Table 1.
PRESSxx (2009) xxx–xxx
The second set of samples was used for developing the method-ology of measuring beer bitterness using a sensor system. This setcomprised 11 beers produced in Denmark and UK, which were cho-sen to cover a large range of bitterness intensity (14–37.9 EBU). Thelist of the second set of samples and their corresponding bitternessvalues and SD are shown in Table 2.
Aqueous solutions of the 30% ethanolic isomerised hop extractwere measured using the ET. Concentration range was 0.1–100 ofthe recommended dose for the lager beer that is 0.005–5% (v/v)or ca. 1–1000 mg/L of the iso-�-acids. Solutions of isomerised hopextract were prepared on the background of a 0.01 M HEPES bufferat pH 6.2 to avoid pH changes during measurements.
2.2. Reference procedures
In total 13 physicochemical parameters were measured: orig-inal, apparent and real extracts, apparent and real fermentationdegrees, density, energetic value, color, pH, bitterness, alcohol,polyphenols and CO2 content. All standard beer analyses were per-formed according to [25]. The color of beer was measured accordingto method 9.6, at 430 nm in a 10 mm cell after filtration of the beer.The bitterness was determined by the extraction of the bitter sub-stances with iso-octane from acidified beer. After centrifugation,the absorbance of the iso-octane layer was measured at 275 nm,against a reference of pure iso-octane according to method 9.8. Theresults were expressed as European Bitter Units (EBU). The anal-ysis of the total polyphenol content of the beer was performedspectrophotometrically at 600 nm after treatment with a solutionfrom carboxymethyl cellulose and EDTA, followed by reaction withferric ions in alkaline solution as described by method 9.11. Theextracts, fermentation degrees, energetic value, density and thealcohol content were measured with a DMA 4500 density meterand an Alcolyzer plus (Anton Paar, Graz, Austria) [26]. The pH ofbeer was measured with a multichannel analyzer (Consort C831)after filtration of the beer. The dissolved CO2 content in beer wascalculated from the pressure and the temperature in the bottle asdescribed by method Beer-13 [27]. Average values of two determi-nations were used for data analysis.
2.3. ET measurements
The ET comprised 29 potentiometric chemical sensors with plas-ticized PVC and chalcogenide glass membranes and a pH glasselectrode. The potentials of the sensors were measured vs. a con-ventional Ag/AgCl reference electrode with a precision of 0.1 V. Themeasurements were carried out using a custom-made high inputimpedance multichannel voltmeter connected to a PC.
The beer samples were degassed by filtration through a Kiesel-guhr filter, diluted by distilled water with a ratio of 30–70 ml andthermostated at 27 ± 1 ◦C prior to the measurements. Sensors weredipped in the sample and potential values were recorded after3 min. Between the measurements the sensors were washed withdistilled water until stable sensor readings were reached.
Seven replicate measurements were run on each sample of thefirst sample set and three replicate measurements were run on eachsample of the second sample set—resulting into 383 measurementsin total. Samples and their replicates were run in random order.At least three replicate calibration measurements were run on theindividual solutions of isomerised hop extract.
2.4. Data analysis
016/j.talanta.2009.11.041
Variable selection was performed on both physicochemical andET datasets prior to the calculations. Three groups of highly corre-lated (correlation coefficients of 0.9–1) parameters were identifiedin the physicochemical dataset: original extract, alcohol content
Pleasecite
this
articlein
press
as:E.Polsh
in,et
al.,Talanta
(2009),doi:10.1016/j.talan
ta.2009.11.041
AR
TIC
LE
IN P
RE
SS
GM
odel
TAL-10929;
No.of
Pages7
E.Polshinet
al./Talantaxxx (2009) xxx–xxx
3
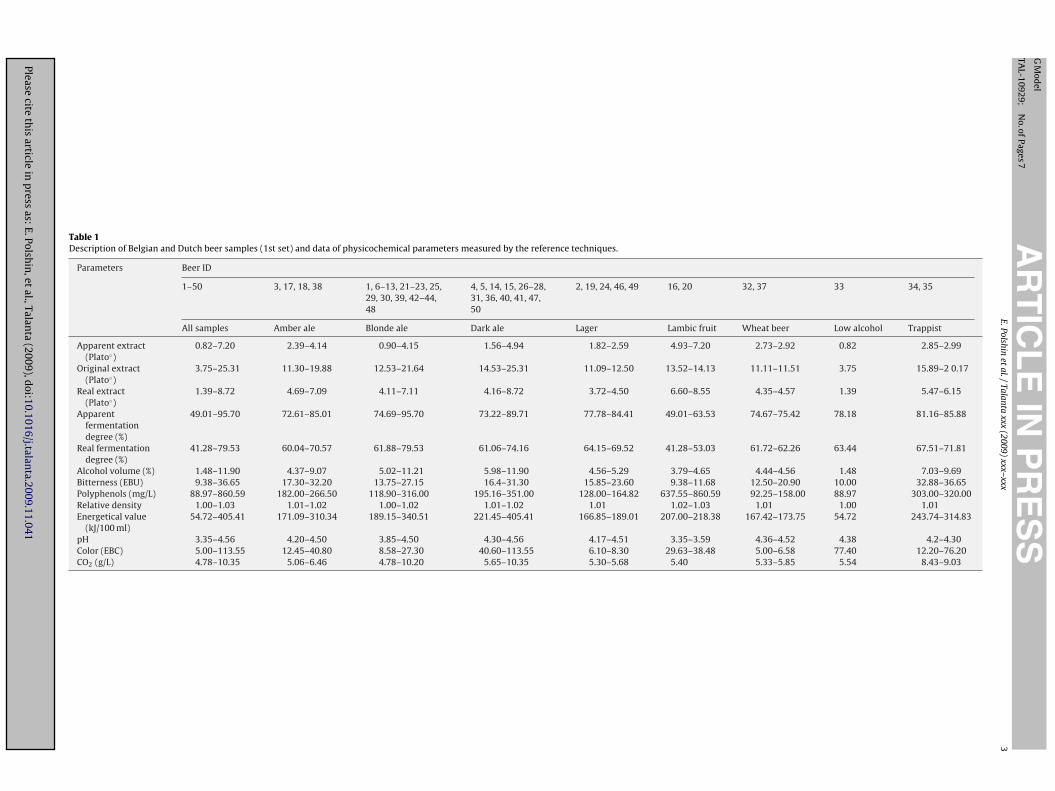
Table 1Description of Belgian and Dutch beer samples (1st set) and data of physicochemical parameters measured by the reference techniques.
Parameters Beer ID
1–50 3, 17, 18, 38 1, 6–13, 21–23, 25,29, 30, 39, 42–44,48
4, 5, 14, 15, 26–28,31, 36, 40, 41, 47,50
2, 19, 24, 46, 49 16, 20 32, 37 33 34, 35
All samples Amber ale Blonde ale Dark ale Lager Lambic fruit Wheat beer Low alcohol Trappist
Apparent extract(Plato◦)
0.82–7.20 2.39–4.14 0.90–4.15 1.56–4.94 1.82–2.59 4.93–7.20 2.73–2.92 0.82 2.85–2.99
Original extract(Plato◦)
3.75–25.31 11.30–19.88 12.53–21.64 14.53–25.31 11.09–12.50 13.52–14.13 11.11–11.51 3.75 15.89–2 0.17
Real extract(Plato◦)
1.39–8.72 4.69–7.09 4.11–7.11 4.16–8.72 3.72–4.50 6.60–8.55 4.35–4.57 1.39 5.47–6.15
Apparentfermentationdegree (%)
49.01–95.70 72.61–85.01 74.69–95.70 73.22–89.71 77.78–84.41 49.01–63.53 74.67–75.42 78.18 81.16–85.88
Real fermentationdegree (%)
41.28–79.53 60.04–70.57 61.88–79.53 61.06–74.16 64.15–69.52 41.28–53.03 61.72–62.26 63.44 67.51–71.81
Alcohol volume (%) 1.48–11.90 4.37–9.07 5.02–11.21 5.98–11.90 4.56–5.29 3.79–4.65 4.44–4.56 1.48 7.03–9.69Bitterness (EBU) 9.38–36.65 17.30–32.20 13.75–27.15 16.4–31.30 15.85–23.60 9.38–11.68 12.50–20.90 10.00 32.88–36.65Polyphenols (mg/L) 88.97–860.59 182.00–266.50 118.90–316.00 195.16–351.00 128.00–164.82 637.55–860.59 92.25–158.00 88.97 303.00–320.00Relative density 1.00–1.03 1.01–1.02 1.00–1.02 1.01–1.02 1.01 1.02–1.03 1.01 1.00 1.01Energetical value
(kJ/100 ml)54.72–405.41 171.09–310.34 189.15–340.51 221.45–405.41 166.85–189.01 207.00–218.38 167.42–173.75 54.72 243.74–314.83
pH 3.35–4.56 4.20–4.50 3.85–4.50 4.30–4.56 4.17–4.51 3.35–3.59 4.36–4.52 4.38 4.2–4.30Color (EBC) 5.00–113.55 12.45–40.80 8.58–27.30 40.60–113.55 6.10–8.30 29.63–38.48 5.00–6.58 77.40 12.20–76.20CO2 (g/L) 4.78–10.35 5.06–6.46 4.78–10.20 5.65–10.35 5.30–5.68 5.40 5.33–5.85 5.54 8.43–9.03
ARTICLE IN PRESSG Model
TAL-10929; No. of Pages 7
4 E. Polshin et al. / Talanta xxx (2009) xxx–xxx
Table 2The list of the British and Danish beer samples (2nd set) and their correspondingbitterness values.
Beer type Bitterness (EBU) SD
1 Brown ale 21.5 0.12 Pilsner 14 13 Pale ale 21.4 0.14 Pale ale 29.5 0.85 Pilsner 14 16 Brown ale 15.9 0.67 Pale ale 32 1
aaeawmpp
dcca
srct
nd
svbacttt
eCvtmcd
wbt
a
3
3
t
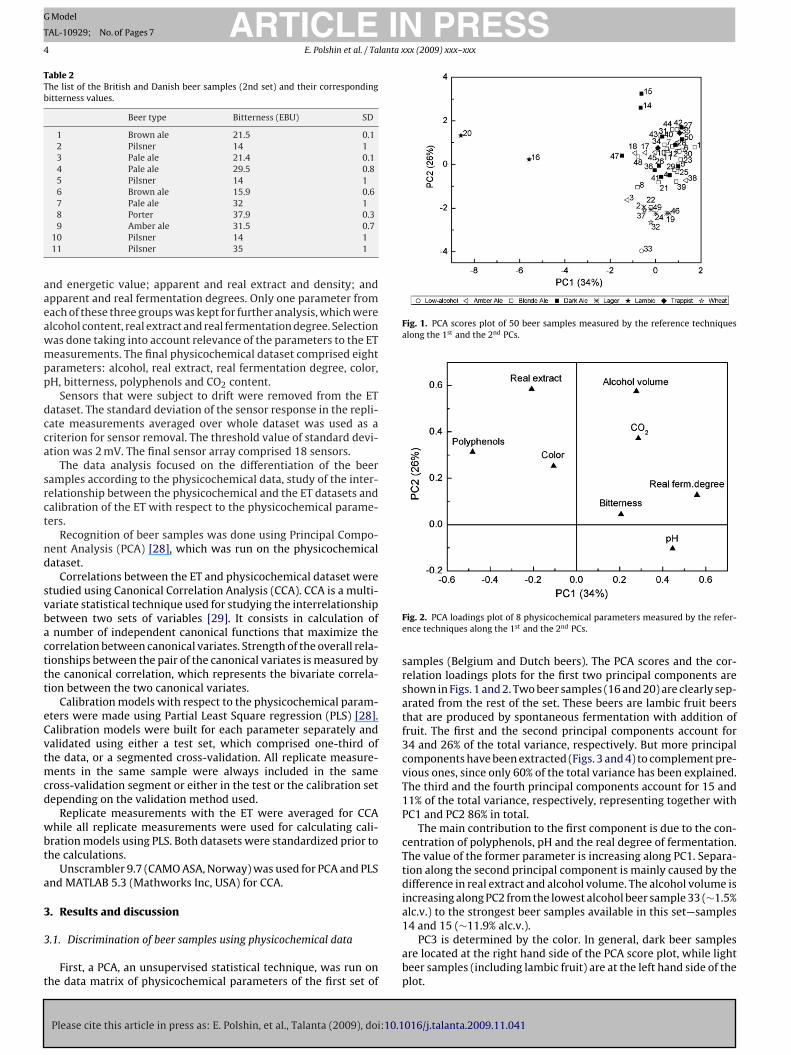
Fig. 1. PCA scores plot of 50 beer samples measured by the reference techniquesalong the 1st and the 2nd PCs.
8 Porter 37.9 0.39 Amber ale 31.5 0.7
10 Pilsner 14 111 Pilsner 35 1
nd energetic value; apparent and real extract and density; andpparent and real fermentation degrees. Only one parameter fromach of these three groups was kept for further analysis, which werelcohol content, real extract and real fermentation degree. Selectionas done taking into account relevance of the parameters to the ETeasurements. The final physicochemical dataset comprised eight
arameters: alcohol, real extract, real fermentation degree, color,H, bitterness, polyphenols and CO2 content.
Sensors that were subject to drift were removed from the ETataset. The standard deviation of the sensor response in the repli-ate measurements averaged over whole dataset was used as ariterion for sensor removal. The threshold value of standard devi-tion was 2 mV. The final sensor array comprised 18 sensors.
The data analysis focused on the differentiation of the beeramples according to the physicochemical data, study of the inter-elationship between the physicochemical and the ET datasets andalibration of the ET with respect to the physicochemical parame-ers.
Recognition of beer samples was done using Principal Compo-ent Analysis (PCA) [28], which was run on the physicochemicalataset.
Correlations between the ET and physicochemical dataset weretudied using Canonical Correlation Analysis (CCA). CCA is a multi-ariate statistical technique used for studying the interrelationshipetween two sets of variables [29]. It consists in calculation ofnumber of independent canonical functions that maximize the
orrelation between canonical variates. Strength of the overall rela-ionships between the pair of the canonical variates is measured byhe canonical correlation, which represents the bivariate correla-ion between the two canonical variates.
Calibration models with respect to the physicochemical param-ters were made using Partial Least Square regression (PLS) [28].alibration models were built for each parameter separately andalidated using either a test set, which comprised one-third ofhe data, or a segmented cross-validation. All replicate measure-
ents in the same sample were always included in the sameross-validation segment or either in the test or the calibration setepending on the validation method used.
Replicate measurements with the ET were averaged for CCAhile all replicate measurements were used for calculating cali-
ration models using PLS. Both datasets were standardized prior tohe calculations.
Unscrambler 9.7 (CAMO ASA, Norway) was used for PCA and PLSnd MATLAB 5.3 (Mathworks Inc, USA) for CCA.
. Results and discussion
Please cite this article in press as: E. Polshin, et al., Talanta (2009), doi:10.1
.1. Discrimination of beer samples using physicochemical data
First, a PCA, an unsupervised statistical technique, was run onhe data matrix of physicochemical parameters of the first set of
Fig. 2. PCA loadings plot of 8 physicochemical parameters measured by the refer-ence techniques along the 1st and the 2nd PCs.
samples (Belgium and Dutch beers). The PCA scores and the cor-relation loadings plots for the first two principal components areshown in Figs. 1 and 2. Two beer samples (16 and 20) are clearly sep-arated from the rest of the set. These beers are lambic fruit beersthat are produced by spontaneous fermentation with addition offruit. The first and the second principal components account for34 and 26% of the total variance, respectively. But more principalcomponents have been extracted (Figs. 3 and 4) to complement pre-vious ones, since only 60% of the total variance has been explained.The third and the fourth principal components account for 15 and11% of the total variance, respectively, representing together withPC1 and PC2 86% in total.
The main contribution to the first component is due to the con-centration of polyphenols, pH and the real degree of fermentation.The value of the former parameter is increasing along PC1. Separa-tion along the second principal component is mainly caused by thedifference in real extract and alcohol volume. The alcohol volume isincreasing along PC2 from the lowest alcohol beer sample 33 (∼1.5%alc.v.) to the strongest beer samples available in this set—samples
016/j.talanta.2009.11.041
14 and 15 (∼11.9% alc.v.).PC3 is determined by the color. In general, dark beer samples
are located at the right hand side of the PCA score plot, while lightbeer samples (including lambic fruit) are at the left hand side of theplot.
ARTICLE IN PRESSG Model
TAL-10929; No. of Pages 7
E. Polshin et al. / Talanta xxx (2009) xxx–xxx 5
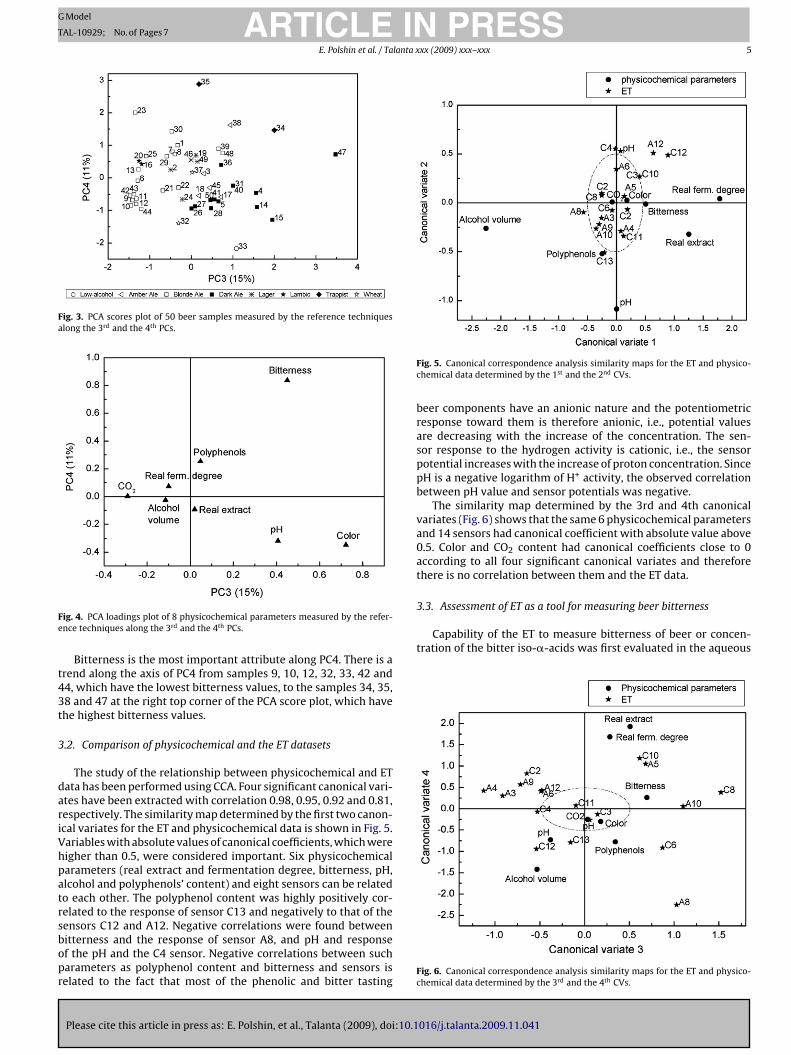
Fig. 3. PCA scores plot of 50 beer samples measured by the reference techniquesalong the 3rd and the 4th PCs.
Fe
t43t
3
dariVhpatrsbopr
3.3. Assessment of ET as a tool for measuring beer bitterness
Capability of the ET to measure bitterness of beer or concen-tration of the bitter iso-�-acids was first evaluated in the aqueous
ig. 4. PCA loadings plot of 8 physicochemical parameters measured by the refer-nce techniques along the 3rd and the 4th PCs.
Bitterness is the most important attribute along PC4. There is arend along the axis of PC4 from samples 9, 10, 12, 32, 33, 42 and4, which have the lowest bitterness values, to the samples 34, 35,8 and 47 at the right top corner of the PCA score plot, which havehe highest bitterness values.
.2. Comparison of physicochemical and the ET datasets
The study of the relationship between physicochemical and ETata has been performed using CCA. Four significant canonical vari-tes have been extracted with correlation 0.98, 0.95, 0.92 and 0.81,espectively. The similarity map determined by the first two canon-cal variates for the ET and physicochemical data is shown in Fig. 5.ariables with absolute values of canonical coefficients, which wereigher than 0.5, were considered important. Six physicochemicalarameters (real extract and fermentation degree, bitterness, pH,lcohol and polyphenols’ content) and eight sensors can be relatedo each other. The polyphenol content was highly positively cor-elated to the response of sensor C13 and negatively to that of the
Please cite this article in press as: E. Polshin, et al., Talanta (2009), doi:10.1
ensors C12 and A12. Negative correlations were found betweenitterness and the response of sensor A8, and pH and responsef the pH and the C4 sensor. Negative correlations between sucharameters as polyphenol content and bitterness and sensors iselated to the fact that most of the phenolic and bitter tasting
Fig. 5. Canonical correspondence analysis similarity maps for the ET and physico-chemical data determined by the 1st and the 2nd CVs.
beer components have an anionic nature and the potentiometricresponse toward them is therefore anionic, i.e., potential valuesare decreasing with the increase of the concentration. The sen-sor response to the hydrogen activity is cationic, i.e., the sensorpotential increases with the increase of proton concentration. SincepH is a negative logarithm of H+ activity, the observed correlationbetween pH value and sensor potentials was negative.
The similarity map determined by the 3rd and 4th canonicalvariates (Fig. 6) shows that the same 6 physicochemical parametersand 14 sensors had canonical coefficient with absolute value above0.5. Color and CO2 content had canonical coefficients close to 0according to all four significant canonical variates and thereforethere is no correlation between them and the ET data.
016/j.talanta.2009.11.041
Fig. 6. Canonical correspondence analysis similarity maps for the ET and physico-chemical data determined by the 3rd and the 4th CVs.
ARTICLE IN PRESSG Model
TAL-10929; No. of Pages 7
6 E. Polshin et al. / Talanta xxx (2009) xxx–xxx
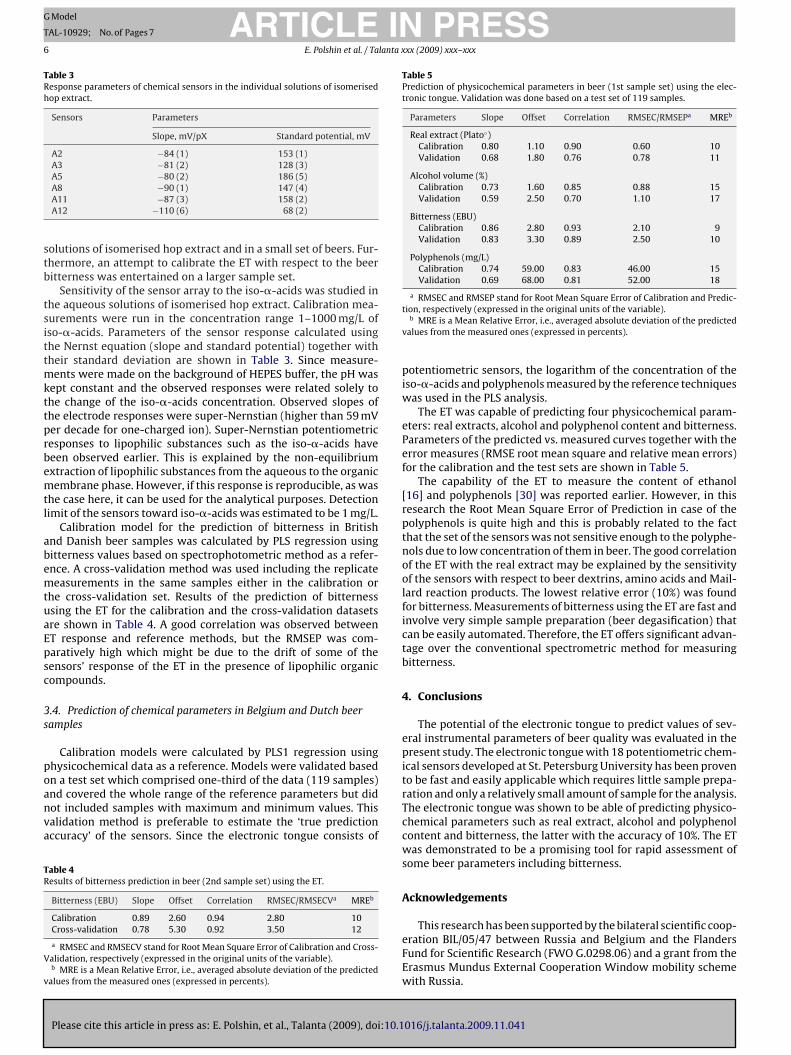
Table 3Response parameters of chemical sensors in the individual solutions of isomerisedhop extract.
Sensors Parameters
Slope, mV/pX Standard potential, mV
A2 −84 (1) 153 (1)A3 −81 (2) 128 (3)A5 −80 (2) 186 (5)
stb
tsittmkttprbemtl
abemtuaEpsc
3s
poanva
TR
V
v
Table 5Prediction of physicochemical parameters in beer (1st sample set) using the elec-tronic tongue. Validation was done based on a test set of 119 samples.
Parameters Slope Offset Correlation RMSEC/RMSEPa MREb
Real extract (Plato◦)Calibration 0.80 1.10 0.90 0.60 10Validation 0.68 1.80 0.76 0.78 11
Alcohol volume (%)Calibration 0.73 1.60 0.85 0.88 15Validation 0.59 2.50 0.70 1.10 17
Bitterness (EBU)Calibration 0.86 2.80 0.93 2.10 9Validation 0.83 3.30 0.89 2.50 10
Polyphenols (mg/L)Calibration 0.74 59.00 0.83 46.00 15Validation 0.69 68.00 0.81 52.00 18
a RMSEC and RMSEP stand for Root Mean Square Error of Calibration and Predic-
A8 −90 (1) 147 (4)A11 −87 (3) 158 (2)A12 −110 (6) 68 (2)
olutions of isomerised hop extract and in a small set of beers. Fur-hermore, an attempt to calibrate the ET with respect to the beeritterness was entertained on a larger sample set.
Sensitivity of the sensor array to the iso-�-acids was studied inhe aqueous solutions of isomerised hop extract. Calibration mea-urements were run in the concentration range 1–1000 mg/L ofso-�-acids. Parameters of the sensor response calculated usinghe Nernst equation (slope and standard potential) together withheir standard deviation are shown in Table 3. Since measure-
ents were made on the background of HEPES buffer, the pH wasept constant and the observed responses were related solely tohe change of the iso-�-acids concentration. Observed slopes ofhe electrode responses were super-Nernstian (higher than 59 mVer decade for one-charged ion). Super-Nernstian potentiometricesponses to lipophilic substances such as the iso-�-acids haveeen observed earlier. This is explained by the non-equilibriumxtraction of lipophilic substances from the aqueous to the organicembrane phase. However, if this response is reproducible, as was
he case here, it can be used for the analytical purposes. Detectionimit of the sensors toward iso-�-acids was estimated to be 1 mg/L.
Calibration model for the prediction of bitterness in Britishnd Danish beer samples was calculated by PLS regression usingitterness values based on spectrophotometric method as a refer-nce. A cross-validation method was used including the replicateeasurements in the same samples either in the calibration or
he cross-validation set. Results of the prediction of bitternesssing the ET for the calibration and the cross-validation datasetsre shown in Table 4. A good correlation was observed betweenT response and reference methods, but the RMSEP was com-aratively high which might be due to the drift of some of theensors’ response of the ET in the presence of lipophilic organicompounds.
.4. Prediction of chemical parameters in Belgium and Dutch beeramples
Calibration models were calculated by PLS1 regression usinghysicochemical data as a reference. Models were validated basedn a test set which comprised one-third of the data (119 samples)
Please cite this article in press as: E. Polshin, et al., Talanta (2009), doi:10.1
nd covered the whole range of the reference parameters but didot included samples with maximum and minimum values. Thisalidation method is preferable to estimate the ‘true predictionccuracy’ of the sensors. Since the electronic tongue consists of
able 4esults of bitterness prediction in beer (2nd sample set) using the ET.
Bitterness (EBU) Slope Offset Correlation RMSEC/RMSECVa MREb
Calibration 0.89 2.60 0.94 2.80 10Cross-validation 0.78 5.30 0.92 3.50 12
a RMSEC and RMSECV stand for Root Mean Square Error of Calibration and Cross-alidation, respectively (expressed in the original units of the variable).b MRE is a Mean Relative Error, i.e., averaged absolute deviation of the predicted
alues from the measured ones (expressed in percents).
tion, respectively (expressed in the original units of the variable).b MRE is a Mean Relative Error, i.e., averaged absolute deviation of the predicted
values from the measured ones (expressed in percents).
potentiometric sensors, the logarithm of the concentration of theiso-�-acids and polyphenols measured by the reference techniqueswas used in the PLS analysis.
The ET was capable of predicting four physicochemical param-eters: real extracts, alcohol and polyphenol content and bitterness.Parameters of the predicted vs. measured curves together with theerror measures (RMSE root mean square and relative mean errors)for the calibration and the test sets are shown in Table 5.
The capability of the ET to measure the content of ethanol[16] and polyphenols [30] was reported earlier. However, in thisresearch the Root Mean Square Error of Prediction in case of thepolyphenols is quite high and this is probably related to the factthat the set of the sensors was not sensitive enough to the polyphe-nols due to low concentration of them in beer. The good correlationof the ET with the real extract may be explained by the sensitivityof the sensors with respect to beer dextrins, amino acids and Mail-lard reaction products. The lowest relative error (10%) was foundfor bitterness. Measurements of bitterness using the ET are fast andinvolve very simple sample preparation (beer degasification) thatcan be easily automated. Therefore, the ET offers significant advan-tage over the conventional spectrometric method for measuringbitterness.
4. Conclusions
The potential of the electronic tongue to predict values of sev-eral instrumental parameters of beer quality was evaluated in thepresent study. The electronic tongue with 18 potentiometric chem-ical sensors developed at St. Petersburg University has been provento be fast and easily applicable which requires little sample prepa-ration and only a relatively small amount of sample for the analysis.The electronic tongue was shown to be able of predicting physico-chemical parameters such as real extract, alcohol and polyphenolcontent and bitterness, the latter with the accuracy of 10%. The ETwas demonstrated to be a promising tool for rapid assessment ofsome beer parameters including bitterness.
Acknowledgements
This research has been supported by the bilateral scientific coop-
016/j.talanta.2009.11.041
eration BIL/05/47 between Russia and Belgium and the FlandersFund for Scientific Research (FWO G.0298.06) and a grant from theErasmus Mundus External Cooperation Window mobility schemewith Russia.
ING
T
lanta x
R
[[[[
[[
[[
[
[[
[
[[
[
[[[
ARTICLEModel
AL-10929; No. of Pages 7
E. Polshin et al. / Ta
eferences
[1] A.H. Varnam, J.P. Sutherland, Bebidas: Tecnología, Química y Microbiología,Editorial Acribia, S.A., Zaragoza, 1996.
[2] M. Verzele, D. De Keukeleire, Chemistry and Analysis of Hop and Beer BitterAcids, Elsevier, Amsterdam, The Netherlands, 1991.
[3] L.R. Bishop, A.L. Whitear, W.R. Inman, J. Inst. Brew. 80 (1974) 68.[4] D. De Keukeleire, J. Vindevogle, R. Szucs, P. Sandra, Trends Anal. Chem. 11 (1992)
275.[5] R.J. Smith, D. Davidson, R.J.H. Wilson, J. Am. Soc. Brew. Chem. 56 (1998) 52–57.[6] Y. Kuroiwa, N. Hashimoto, H. Hashimoto, E. Kokubo, K. Nakgawa, Proc. Am. Soc.
Brew. Chem. 28 (1963) 181.[7] S. Cortacero-Ramirez, M. Hernainz-Bermudez de Castro, A. Segura-Carretero, C.
Cruces-Blanco, A. Fernandez-Gutierrez, Trends Anal. Chem. 22 (2003) 440–455.[8] Anonymous, Institute of Brewing Analysis Committee—recommended meth-
ods of analysis, J. Inst. Brew. 77 (2) (1971) 181–226.[9] J. Christensen, A.M. Ladefoged, L. Nørgaard, J. Inst. Brew. 111 (1) (2005) 3–10.10] A. Fisher, J. Inst. Brew. 78 (5) (1972) 407–408.
Please cite this article in press as: E. Polshin, et al., Talanta (2009), doi:10.1
11] J.C. Seaton, J.M. Hutcheson, M. Moir, J. Inst. Brew. 91 (3) (1985) 126.12] G.K. Buckee, J. Inst. Brew. 96 (3) (1990) 143–148.13] G. Vanhoenacker, D. De Keukeleire, P. Sandra, J. Chromatogr. A 1035 (2004)
53–61.14] Yu. Vlasov, A. Legin, A. Rudnitskaya, Anal. Bioanal. Chem. 373 (2002) 136–146.15] P. Ciosek, W. Wroblewski, The Analyst 132 (2007) 963.
[[
[
PRESSxx (2009) xxx–xxx 7
16] F. Winquist, Microchim. Acta 163 (2008) 3–10.17] K. Toko, T. Matsuno, K. Yamafuji, K. Hayashi, H. Ikezaki, K. Sato, R. Toukubo, S.
Kawarai, Biosens. Bioelectron. 9 (1994) 359–364.18] L. Lvova, S.S. Kim, A. Legin, Yu. Vlasov, J.S. Yang, G.S. Cha, H. Nam, Anal. Chim.
Acta 468 (2002) 303.19] P. Ciosek, W. Wroblewski, Talanta 69 (2006) 1156–1161.20] C. Zhang, D.P. Bailey, K.S. Suslick, J. Agric. Food Chem. 54 (2006) 4925–
4931.21] H. Kaneda, M. Takashio, K. Shinotsuka, Y. Okahata, J. Biosci. Bioeng. 92 (2001)
221–226.22] H. Kaneda, J. Watari, M. Takashio, Y. Okahata, J. Inst. Brew. 109 (2003) 27–33.23] H. Kaneda, M. Takashio, Y. Okahata, J. Am. Soc. Brew. Chem. 63 (2005)
89–94.24] A. Rudnitskaya, E. Polshin, D. Kirsanov, J. Lammertyn, B. Nicolaï, D. Saison, F.R.
Delvaux, F. Delvaux, A. Legin, Anal. Chim. Acta 646 (2009) 111–118.25] Analytica-EBC, Methods of Analysis, EBC Analysis Committee, Nurnberg, 1998.26] http://www.anton-paar.com/.27] ASBC Methods of Analysis, 8th ed., American Society of Brewing Chemists, St.
016/j.talanta.2009.11.041
Paul, Minnesota, 1992.28] K. Esbensen, Multivariate Analysis in Practice, 5th ed., Camo ASA, Norway, 2002.29] J.F. Hair, R.E. Anderson, R.L. Tatham, W.C. Black, Multivariate Data Analysis, 5th
ed., Prentice Hall, Inc, New Jersey, USA, 1998.30] A. Rudnitskaya, I. Delgadillo, S.M. Rocha, A.-M. Costa, A. Legin, Anal. Chim. Acta
563 (2006) 315–318.