experiment c-28, beer-lambert law - neulog
TRANSCRIPT
Experiment C-28 Beer-Lambert law Ver 3.0.5
1
Experiment C-28
Beer-Lambert law
Objectives To study the relationship between the concentration of a solution
and its absorbance according to the Beer-Lambert law. To plot a calibration curve in order to determine the concentration
of an unknown sample.
Modules and Sensors PC + NeuLog application
USB-200 module
NUL-219 Colorimeter logger sensor
Equipment and Accessories
50 ml beaker 4
100 ml conical flask 1
50 ml syringe 1
Pasteur pipette 2
Plastic cuvette (included with the sensor)
1
Plastic container 1
The items above (except for the cuvette) are included in the
NeuLog Utility accessories, UTL-KIT.
Materials 100 ml of tap water
80 ml of a diluted food coloring solution
Experiment C-28 Beer-Lambert law Ver 3.0.5
2
Introduction The Beer-Lambert law also known as Beer's law was proposed by August Beer and Johann Heinrich Lambert. This law is commonly used in chemistry, physics, and biology. It states that there is a linear relationship between the absorbance and the concentration of a solution. The general Beer-Lambert law is usually written as follows:
A=ԑlc
Where A is the measured absorbance (absorbance has no units), ԑ (M-1cm-1) is the molar extinction coefficient which is a measurement of how much a chemical substance absorbs light at a given wavelength, l (cm) is the path length and c is the concentration of the solution (M).
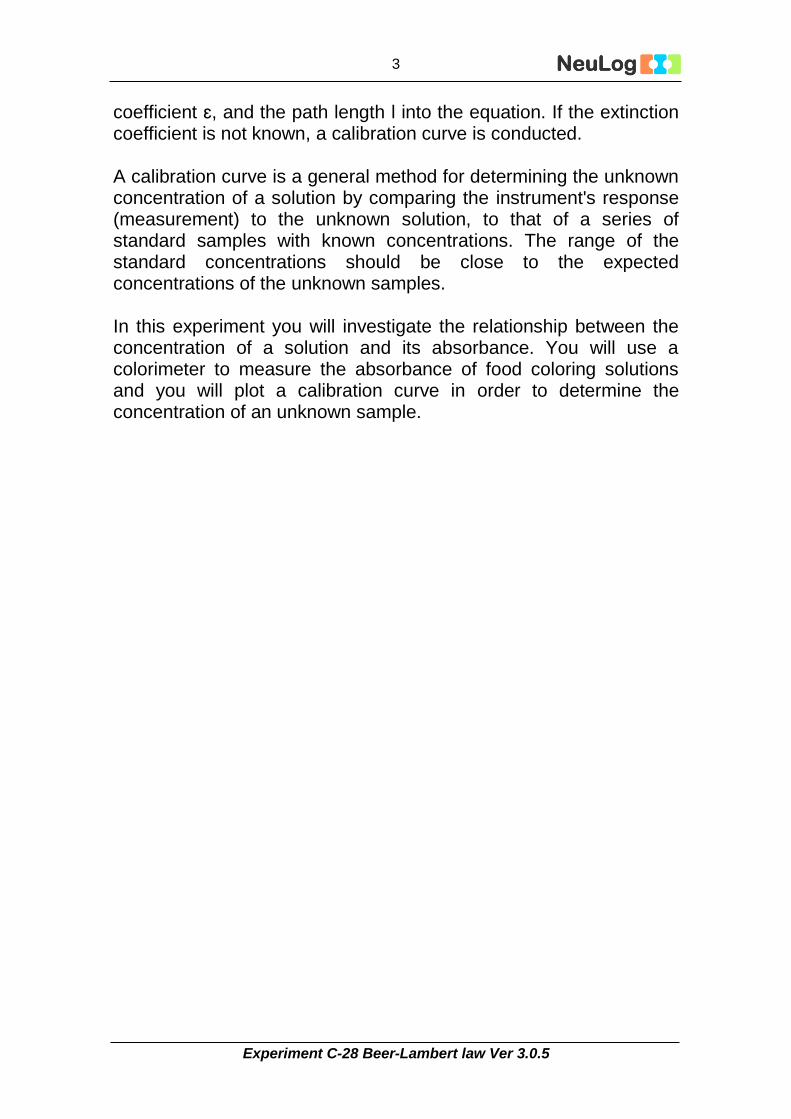
The absorbance is calculated using the light transmittance, T.
T=I/I0
Where I0 is the initial light intensity projected on the sample and I is
the light intensity after it passes through the sample.
A=-logT=-log(I/I 0)
Absorption instruments can usually display the data as either transmittance or absorbance (including the NeuLog colorimeter logger sensor). The Beer-Lambert law is often used to determine the unknown concentration of a solute in a solution. The concentration could be calculated by placing the absorption value A, the extinction
Experiment C-28 Beer-Lambert law Ver 3.0.5
3
coefficient ԑ, and the path length l into the equation. If the extinction coefficient is not known, a calibration curve is conducted. A calibration curve is a general method for determining the unknown concentration of a solution by comparing the instrument's response (measurement) to the unknown solution, to that of a series of standard samples with known concentrations. The range of the standard concentrations should be close to the expected concentrations of the unknown samples. In this experiment you will investigate the relationship between the concentration of a solution and its absorbance. You will use a colorimeter to measure the absorbance of food coloring solutions and you will plot a calibration curve in order to determine the concentration of an unknown sample.
Experiment C-28 Beer-Lambert law Ver 3.0.5
4
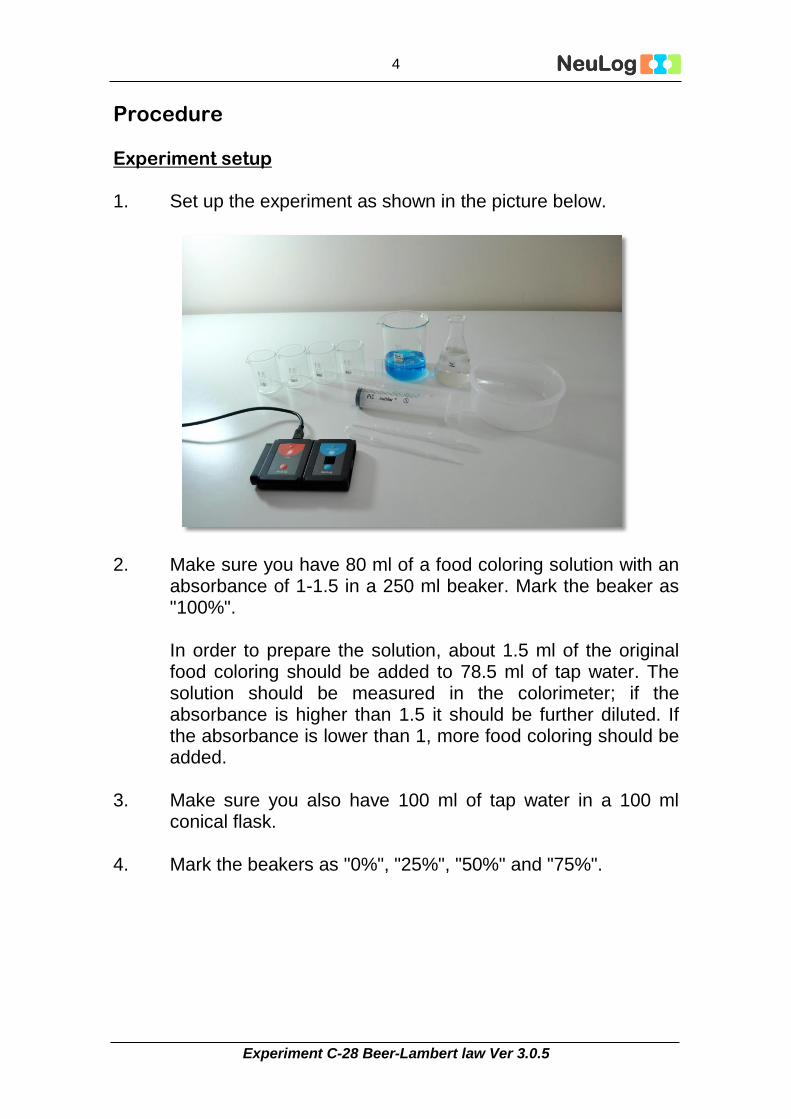
Procedure Experiment setup 1. Set up the experiment as shown in the picture below.
2. Make sure you have 80 ml of a food coloring solution with an
absorbance of 1-1.5 in a 250 ml beaker. Mark the beaker as "100%". In order to prepare the solution, about 1.5 ml of the original food coloring should be added to 78.5 ml of tap water. The solution should be measured in the colorimeter; if the absorbance is higher than 1.5 it should be further diluted. If the absorbance is lower than 1, more food coloring should be added.
3. Make sure you also have 100 ml of tap water in a 100 ml conical flask.
4. Mark the beakers as "0%", "25%", "50%" and "75%".
Experiment C-28 Beer-Lambert law Ver 3.0.5
5
Sensor setup
5. Connect the USB-200 module to the PC.
6. Check that the colorimeter sensor is connected to the USB-200 module.
Note:
The following application functions are explained in short. It is recommended to practice the NeuLog application functions (as described in the user manual) beforehand.
7. Run the NeuLog application and check that the colorimeter
sensor is identified.
Experiment C-28 Beer-Lambert law Ver 3.0.5
6
Settings
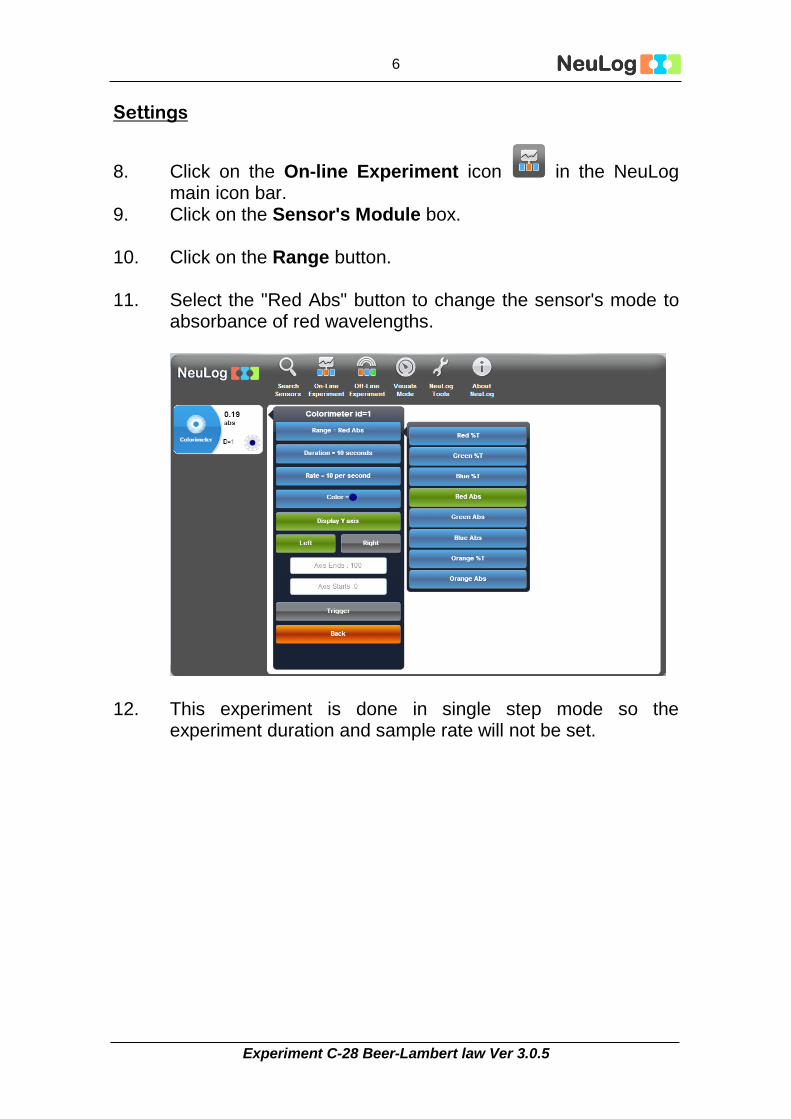
8. Click on the On-line Experiment icon in the NeuLog
main icon bar. 9. Click on the Sensor's Module box.
10. Click on the Range button.
11. Select the "Red Abs" button to change the sensor's mode to
absorbance of red wavelengths.
12. This experiment is done in single step mode so the experiment duration and sample rate will not be set.
Experiment C-28 Beer-Lambert law Ver 3.0.5
7
Testing and measurements 13. We will be using volume percentages of the initial food
coloring solution (instead of M).
14. Fill the "0%" beaker with 50 ml of tap water.
15. Use the syringe (and a Pasteur pipette if needed) to fill the 50 ml beakers with the food coloring solution and the tap water according to the following table. The 100% solution is your initial food coloring solution.
Sample Food coloring solution [ml]
Tap water [ml]
Volume percent Absorbance
0% 0 20 0%
25% 5 15 5/20*100%=25%
50% 10 10 10/20*100%=50%
75% 15 5 15/20*100%=75%
100% 20 0 20/20*100%=100%
Unknown ? ? ?
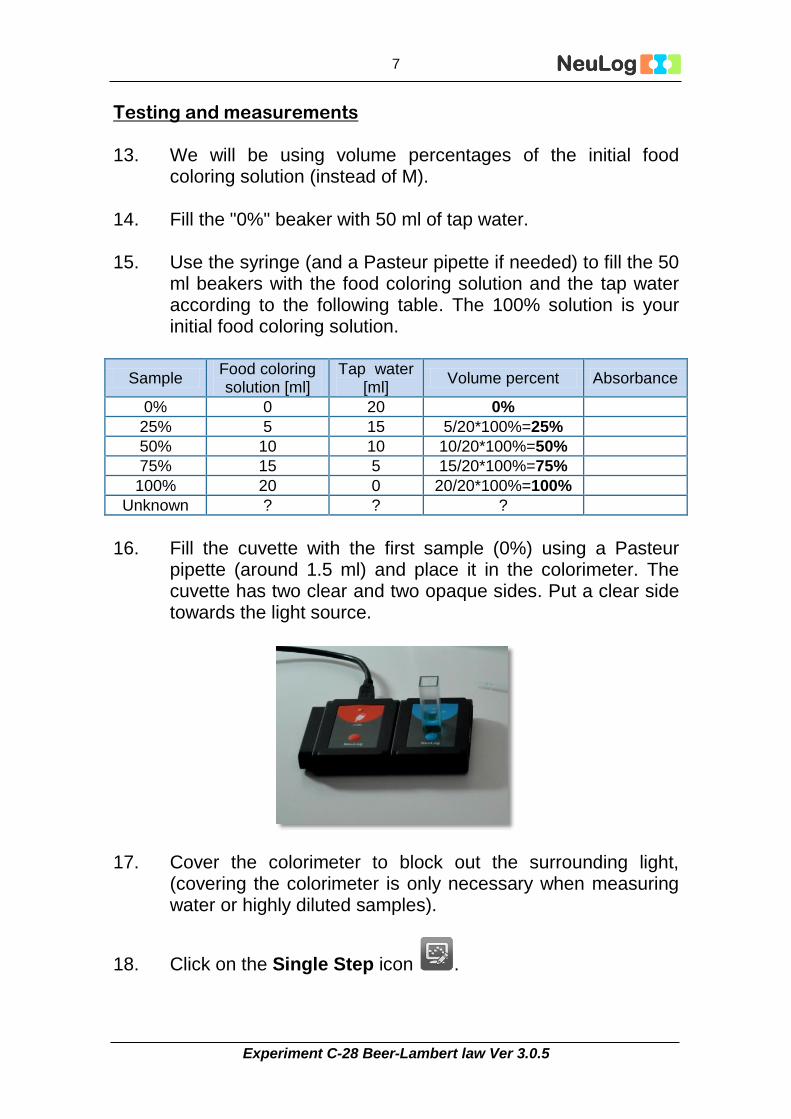
16. Fill the cuvette with the first sample (0%) using a Pasteur
pipette (around 1.5 ml) and place it in the colorimeter. The cuvette has two clear and two opaque sides. Put a clear side towards the light source.
17. Cover the colorimeter to block out the surrounding light,
(covering the colorimeter is only necessary when measuring water or highly diluted samples).
18. Click on the Single Step icon .
Experiment C-28 Beer-Lambert law Ver 3.0.5
8
19. Click on the Table icon on the bottom part of the screen. A table will be displayed for data record.
20. Change the "Manual values" column name to "Volume
percent [%]" (clicking on the title of the column will allow you to do so).
21. Insert the volume percent (0) into the "Volume percent [%]" column.
22. Repeat the measurement in single step mode for the 25%,
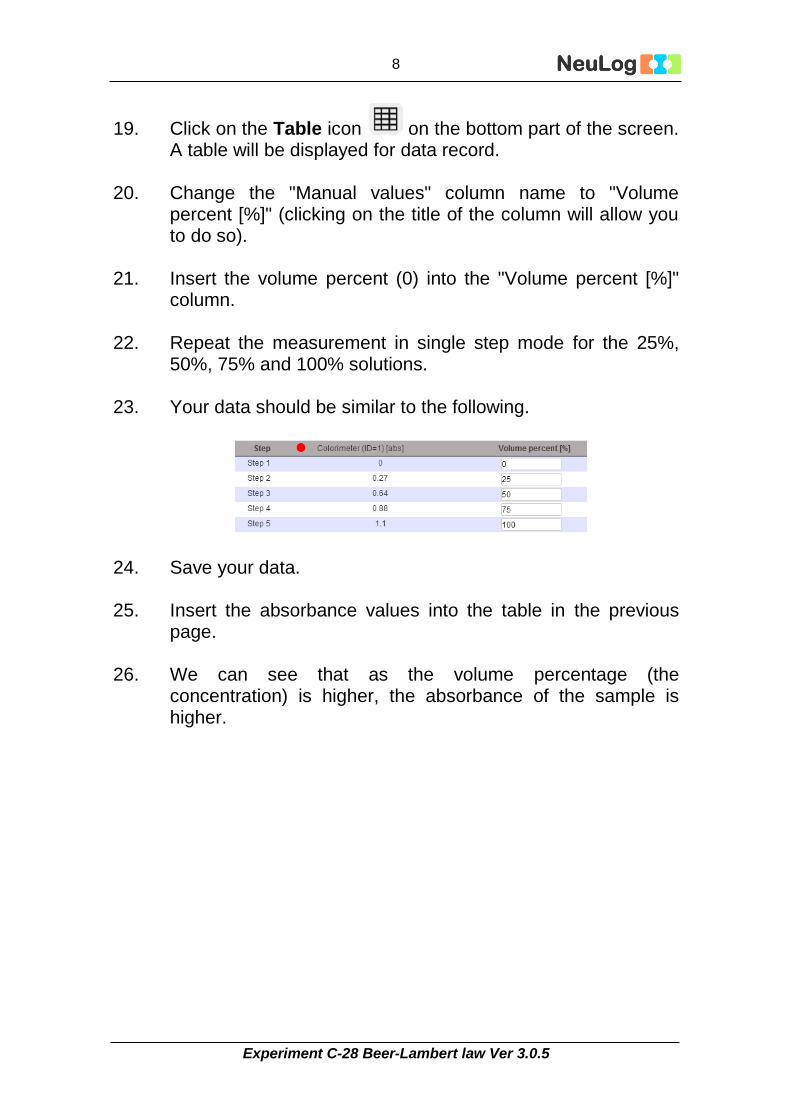
50%, 75% and 100% solutions. 23. Your data should be similar to the following.
24. Save your data.
25. Insert the absorbance values into the table in the previous
page. 26. We can see that as the volume percentage (the
concentration) is higher, the absorbance of the sample is higher.
Experiment C-28 Beer-Lambert law Ver 3.0.5
9
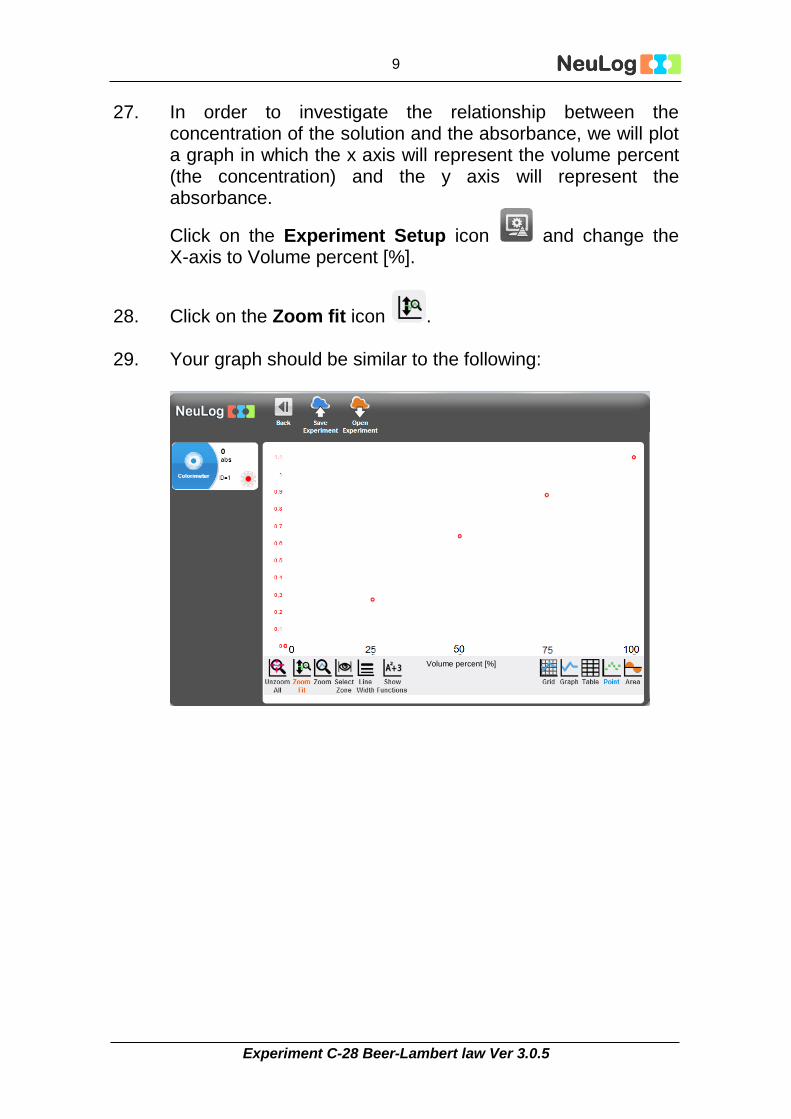
27. In order to investigate the relationship between the concentration of the solution and the absorbance, we will plot a graph in which the x axis will represent the volume percent (the concentration) and the y axis will represent the absorbance.
Click on the Experiment Setup icon and change the X-axis to Volume percent [%].
28. Click on the Zoom fit icon . 29. Your graph should be similar to the following:
Volume percent [%]
Experiment C-28 Beer-Lambert law Ver 3.0.5
10
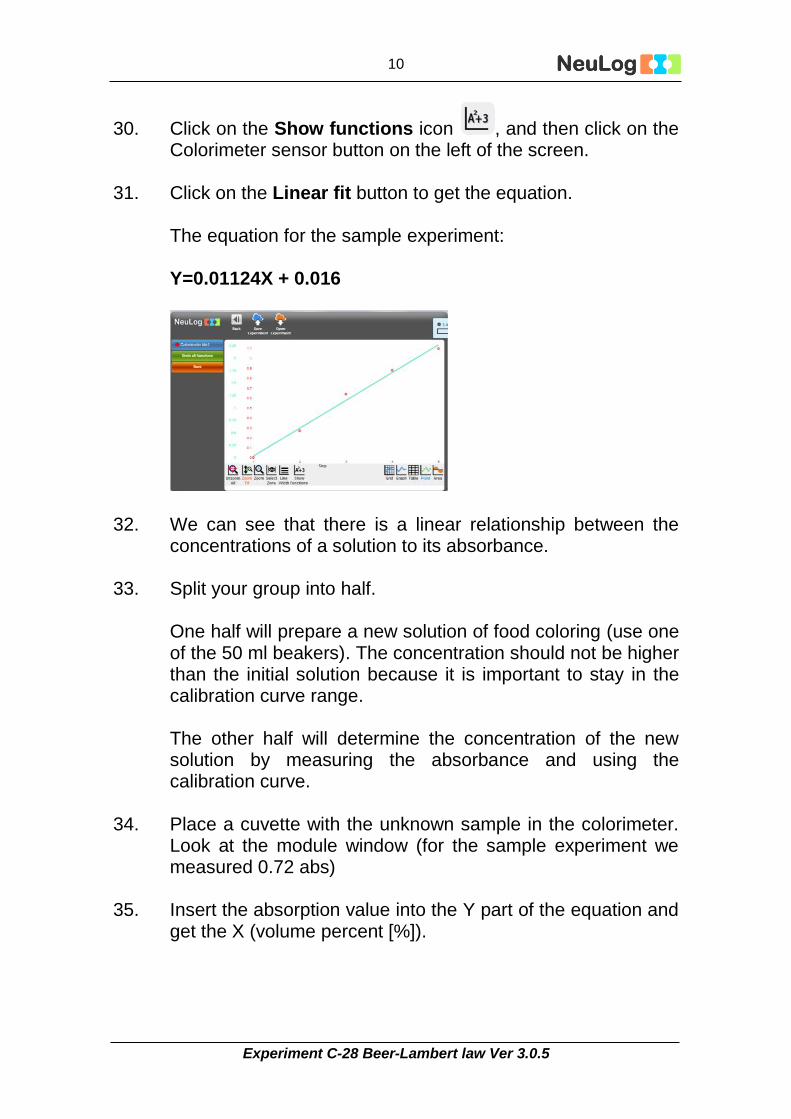
30. Click on the Show functions icon , and then click on the Colorimeter sensor button on the left of the screen.
31. Click on the Linear fit button to get the equation. The equation for the sample experiment: Y=0.01124X + 0.016
32. We can see that there is a linear relationship between the concentrations of a solution to its absorbance.
33. Split your group into half. One half will prepare a new solution of food coloring (use one of the 50 ml beakers). The concentration should not be higher than the initial solution because it is important to stay in the calibration curve range. The other half will determine the concentration of the new solution by measuring the absorbance and using the calibration curve.
34. Place a cuvette with the unknown sample in the colorimeter.
Look at the module window (for the sample experiment we measured 0.72 abs)
35. Insert the absorption value into the Y part of the equation and get the X (volume percent [%]).
Experiment C-28 Beer-Lambert law Ver 3.0.5
11
For example, the absorbance of a solution with an unknown concentration is 0.72. According to the calibration curve, the volume percent of the solution is 62.6%. The concentration of the sample was 60% which is very close to 62.6%.
Summary questions
1. Where you able to determine the concentration of the unknown sample by the calibration curve? Write your results and explain.
2. Why is it important that the solution with the unknown concentration will give an absorbance value in the range of the calibration curve?
3. Would this experiment work if we chose to project blue light on the sample instead of red?
4. Give an example of an application for the Beer-Lambert law.