effect of spatial architecture on cellular colonization
TRANSCRIPT
Effect of Spatial Architecture onCellular Colonization
Yan Huang, Mbonda Siewe, Sundararajan V. Madihally
School of Chemical Engineering, Oklahoma State University, Stillwater, Oklahoma74078; telephone: (405) 744 9115; fax: (405) 744 6338;e-mail: [email protected]
Received 10 September 2004; accepted 8 July 2005
Published online 2 September 2005 in Wiley InterScience (www.interscience.wiley.com). DOI: 10.1002/bit.20703
Abstract: The spatial cell-material interaction remainsvital issue in forming biodegradable scaffolds in TissueEngineering. In this study, to understand the influence ofspatial architecture on cellular behavior, 2D and 3Dchitosan scaffolds of 50–190 kD and >310 kD MW weresynthesized throughairdryingandcontrolled rate freezing/lypohilization technique, respectively. In addition, chitosanwas emulsified with 19, 76, and 160 kD 50:50 poly lactide-co-glycolide (PLGA) using 1,2-Dimyristoyl-sn-Glycero-3-Phosphocholine (DMPC) as stabilizer. 2D and 3D scaffoldswere formed by air drying and lyophilization as before.Tensile and compressive properties of films and scaffoldswere analyzed in wet conditions at 378C. Alterations in thecell spreading, proliferation, and cytoskeletal organizationof human umbilical vein endothelial cells (HUVECs) andmouse embryonic fibroblasts (MEFs) were studied. Theseresults showed that the formed 3D chitosan scaffolds hadinterconnected open pore architecture (50–200 mm size).HUVECs and MEFs had reduced spreading areas andcircular morphology on 2D chitosan membranes com-pared with 3D chitosan scaffolds. The fluorescence photo-micrographs for actin (using Alexa Fluor 488 phalloidin)and cytoplasm staining (using carboxyfluorescein diace-tate-succinimidyl ester) demonstrated that the cells spreadwithin 3D chitosan matrix. 2D and 3D emulsified chitosanand chitosan/PLGA scaffolds reduced the spreading ofHUVECs and MEFs even further. Proliferation results,analyzed viaMTT-Formazan assay andBrdUuptake assay,correlated with the spreading characteristics. The reduc-tions in cell spreadingareaonemulsifiedsurfaceswerenotdetrimental to the viability and endocytic activity but toproliferation. The observed alterations in cellular coloniza-tion are in part due to the substrate stiffness and surfacetopography. In summary, these results suggest a signifi-cant influence of spatial architecture on cellular coloniza-tion. � 2005 Wiley Periodicals, Inc.
Keywords: scaffold architecture; colonization; endothelialcells; fibroblasts; chitosan;PLGA;cytoskeletal organization
INTRODUCTION
Tissue engineering has given promise for generating func-
tionally replaceable tissue parts. Bioactive and bioresorbable
scaffolds are used to support and guide the in-growth of cells.
While supporting biological activity, scaffold transiently
degrades allowing regeneration of tissue without any
reminiscent foreign material in the long term (Persidis,
1999; Langer and Vacanti, 1993; Schoen and Levy, 1999).
Scaffolds generated from natural (Chvapil, 1977) and
synthetic polymers or after removing the cellular compo-
nents from xenogeneic tissues (Oberpenning et al., 1999)
have been used with and without prior cell-seeding.
A number of studies have shown that chemical and
mechanical properties of matrices such as edges, grooves,
hydrophilicity, pore sizes, presence of adhesion domains,
roughness/nanotopographies, stiffness, and void fractions
influence cellular processes in two-dimensional (2D) or
three-dimensional (3D)matrices (Balgude et al., 2001;Curtis
and Wilkinson, 1999; Rajnicek et al., 1997; Ranucci and
Moghe, 2001; Salem et al., 2002; Zeltinger et al., 2001). The
general dogma is that stimuli signaled through Arginine-
Glycine-Aspartic acid (RGD) binding domain, integrins and
focal adhesion (FA) points change the polymerization state of
cytoskeletal actin, which subsequently results in changed
cellular morphology and cellular activity (Giancotti
and Ruoslahti, 1999; Korff and Augustin, 1999; Sastry and
Burridge, 2000). Restraining cell spreading characteristics
usingmicropatterned substrates, has also shown the influence
of cell size on life or death (Chen et al., 1997).Majority of the
in vitro studies are performed in two-dimension and/or
substrates that have specific adhesion domains. Although
many in vivo studies have shown that the microarchitecture
of the biomaterials is the primary determinant in the foreign
body response rather than chemical composition (Sieminski
and Gooch, 2000), it is not clear how the microarchitecture
influences cell colonization.
The goal of this study was to understand the influence of
architecture via presenting a substrate in multiple forms, that
is, 2D membranes, 3D porous scaffolds, and in presence of
other materials without affecting its inherent chemical
characteristics. Chitosan, a derivative of naturally occurring
chitin, was selected because (a) it can be easily processed into
beads, fibers, films, or scaffolds with regulated porous
structure (Madihally and Matthew, 1999) and (b) it is a
�2005 Wiley Periodicals, Inc.
Correspondence to: Sundararajan V. Madihally, PhD
Contract grant sponsor: Oklahoma State University and Oklahoma
Center for Advancement of Science and Technology
Contract grant number: HR02-087R.
positively charged polysaccharide resembling glycosamino-
glycans, present in the extracellular matrix. Although chito-
san has no specific binding domain for integrin-mediated
adhesion, it supports biological activity of diverse cell types
and it has been a subject of many investigations in tissue
engineering (Cai et al., 2002; Chung et al., 2002; Chupa et al.,
2000; Lahiji et al., 2000; Mizuno et al., 2003; Zhu et al.,
2002). In addition, chitosan is an anti-infective and bio-
compatible polymer metabolized into non-toxic D-glucosa-
mines by lysozymes (Tomihata and Ikada, 1997).
To alter the structural features of chitosan, blending with
synthetic biodegradable poly-lactic-co-glycolic acid (50:50
PLGA) was considered. 50:50 PLGA is widely investigated
in various tissue engineering applications although it has no
integrin binding domain for adhesion. Unlike chitosan, 50:50
PLGA is amorphous, degradates by hydrolysis, electroneu-
tral, and hydrophobic. An emulsion systemwas used to blend
the two polymers without altering the chemical nature of
either polymer. Further, cells from two different origins were
tested: (i) human umbilical vein endothelial cells (HUVECs)
which make-up the luminal lining and (ii) mouse embryonic
fibroblasts (MEFs) which are found in the connective tissue,
synthesize collagen type I and III and tend to develop fibrous
network (Shigemasa et al., 1994). Cell spreading, prolifera-
tion, viability, endocytic activity, and cytoskeletal organiza-
tion were analyzed on 2D chitosan, 3D chitosan and PLGA-
chitosan scaffolds. These results show significant influence
of spatial architecture on cell adhesion and cytoskeletal
organization.
MATERIALS AND METHODS
Chitosan with 50–190 kD MW and >310 kD MW,
unconjugated 1,2-Dimyristoyl-sn-Glycero-3-Phosphocho-
line (DMPC, 678Da) and Dulbecco’s modified Eagle
medium (DMEM) were obtained from Sigma Aldrich
Chemical Co (St. Louis, MO). The degree of deacetylation
of both chitosans were&85%. 19 kD 50:50 PLGAwas from
Alkermes, Inc. (Cambridge, MA). Seventy-five and 160 kD
50:50 PLGA were from Birmingham Polymers, Inc.
(Birmingham, AL). FITC-conjugated DMPC was obtained
from Avanti Polar-Lipids (Alabaster, AL). Bromodeoxyur-
idine (BrdU) cell proliferation assay kit was obtained from
EMD Biosciences, Inc. (San Diego, CA). Carboxyfluores-
cein diacetate-succinimidyl ester (CFDA-SE), LIVE/DEAD
Assay Kit, and Alexa Fluor 488 phalloidin were obtained
from Molecular Probes (Eugene, OR). HUVECs and
endothelial growth medium-2 (EGM-2) Bulletkit were from
Cambrex Biosciences (Walkersville, MD). MEFs were from
American Tissue Culture Collection (Walkersville, MD).
Formation of 2D and 3D Chitosan Scaffoldsfor Cell Culture
Sterile 0.5% (w/v) chitosan solutions were prepared by
autoclaving (at 1218C in a wet cycle for 20 min) chitosan
suspension in water and then adding acetic acid equivalent to
0.5 M in a laminar flow hood. To form 2D membranes, 24-
well and 6-well tissue culture plates were layered with
chitosan solution and dried in a biological laminar flow hood
at room temperature; uncoated tissue culture-treated plastic
surfaces were used as controls (henceforth referred to as
control). To form 3D matrices, 300 mL of chitosan solutions
was poured into tissue culture plates which were frozen at
�208C (in a freezer) or at �868C (inside a freeze dryer).
Samples were lyophilized for 24 h using a Benchtop 6K
lyophilizer (VirTis, Gardiner, NY). Dried samples were
neutralized with 0.1N NaOH for 30 min, washed four times
with sterile phosphate buffered saline (PBS), and stored in
PBS till subsequent cell seeding.
Formation of PLGA-Chitosan Scaffolds
Three percent (w/v) 19, 75, and 160 kDPLGA solutionswere
prepared by dissolving in chloroform. Chitosan solution of
>310 kD MW was emulsified with chloroform or PLGA
solution in the volume ratio of 3:1 with 0.2% (w/v) DMPC.
To obtain 2D membranes, the emulsion was layered onto
glass slides, air-dried overnight at room temperature. To form
3D scaffolds, glass slides were converted into wells using
silicon glue to form the wall and then emulsions were freeze
dried similar to the procedure described above for 3D
chitosan scaffolds. All scaffoldswere neutralized prior to cell
seeding, similar to themethod described above for 2D and 3D
chitosan scaffolds.
Cell Culture and Seeding
HUVECs were cultured in EGM-2 BulletKit medium
(containing 2% fetal bovine serum (FBS), hydrocortisone,
fibroblast growth factor-B, heparin, vascular endothelial
growth factor, insulin-like growth factor-1, ascorbic acid,
human epidermal growth factor, gentamicin) following
vendors protocol. Cells between 2 and 8 passages were used
in all the experiments.
MEFs were maintained in DMEM supplemented with
4 mM L-glutamine, 4.5 g/L glucose, 1.5 g/L sodium bicar-
bonate, 100 U/mL penicillin-streptomycin, 2.5 mg/mL
amphotericin B, and 10% FBS (Invitrogen Corp., Carlsbad,
CA).
Both cultures were maintained at 378C, 5% CO2/95% air
and fed with fresh medium every 48 h. Prior to cell seeding,
cells were detached with 0.01% trypsin/10 mM EDTA
(Invitrogen Corp., Carlsbad, CA), centrifuged and resus-
pended in medium. 10,000 and 25,000 cells per well were
seeded onto 2D and 3D scaffolds respectively and incubated
with 0.5 mL of growth medium. To achieve uniform distri-
bution of cells in 3D scaffolds, a concentrated (500,000 cells/
mL) cell suspension was placed at different locations on each
sample. Then cells were distributed in the vertical direction
by lateral shaking with the addition of growth medium
summing up to 0.5 mL. To confirm uniform distribution of
cells in the scaffold, few experiments were performed by
staining the cells with a non-toxic metabolic stain CFDA-SE
HUANG ET AL.: CELLULAR COLONIZATION 65
prior to seeding onto the scaffold. To stain cells, they were
incubated in growth medium containing 2 mM CFDA-SE at
378C for 20 min followed by washing the excess stain with
growth medium. In addition, histological analysis was
performed to confirm the cell distribution in the porous
structure of 3D scaffolds. For this purpose, samples were
fixed in a 10% buffered formalin solution, embedded in
paraffin, 6 mm thick sections were cut, and stained with
hematoxylin and eosin (H and E) (Madihally et al., 2003).
Morphology Characterization
Morphologies were evaluated using an inverted microscope
(Nikon TE2000,Melville, NY) outfitted with a CCD camera.
Digital micrographs were captured from different locations.
Cell spreading area, pore sizes, and shape factors (defined as
4p� area/perimeter2; when the number is closer to 1, the cell
shape is closer to a circle) were quantified using an image
analysis software (Sigma Scan Pro, Chicago, IL). For each
condition, more than 50 pores or cells were analyzed. Few
samples were also analyzed using scanning electron micro-
scope (SEM, Joel scanning microscope) to confirm the open
pore architecture. For this purpose, samples were dried using
a series of increasing concentrations of ethanol followed by a
brief vacuum drying. Samples were sputter coated with gold
at 40 mA prior to observing under SEM.
Evaluation of Cytoskeletal Organizationand Viability
Cell-containing scaffolds were fixed in 3.7% formaldehyde
for 15min at room temperature. Cells werewashed with PBS
and permeabilized with �208C ethanol for 30 min at �48C,and then incubated with Alexa Fluor 488 phalloidin for 1 h at
room temperature in the dark. Cell viability on emulsified
samples was tested using LIVE/DEADAssay Kit. After two
days of culture, growth medium was replaced with the
combined solution of calcein AM and ethidium homodimer
(EthD-1) and incubated for 40 min. All the fluorescently-
labeled cells were examined under a fluorescence micro-
scope and digital images were captured.
Cell Proliferation Analysis
Cell growth was determined by MTT-Formazan assay by
sacrificing culture plates at regular intervals. MTT-formazan
assay was performed using a previously reported procedure
for 2D membranes (Chupa et al., 2000) and a modified
procedure for 3D scaffolds (Mosmann, 1983). Modifications
were made in order to minimize the background absorbance
from 3D scaffolds. For 2D membranes, the growth medium
was replaced with 0.5 mL of MTT (Sigma Chemical Co.)
solution (2 mg/mL in PBS) followed by incubation for two
hours at 378C. Then MTT solution was discarded and
dimethyl sulfoxide (DMSO) was added to dissolve formazan
and the solution absorbancewas measured at 540 nm. For 3D
scaffolds, cells were detached from the scaffolds using
trypsin-EDTA and transferred to 96 well plates. MTT
solution was added and incubated for 4 h at 378C. Isopro-panolwas added and the absorbancewasmeasured at 490 nm.
Obtained values were plotted assuming an exponential
growth rate, that is, ln(A/A0)¼ m(t�t0) where A0 is the
absorbance at initial time t0, A is the absorbance at certain
time t (day) andm is the specificgrowth rate (/dayunits).mwasdetermined in conditions where the regression coefficients
were >0.95. Calibration curves were developed by seeding
cells onto 3D matrices formed at �208C at four different
densities (10,000, 25,000, 100,000, and 300,000 cell) and
cultured for 2 days prior to analyses.
BrdU assay was also performed to confirm the growth
behavior on differentmatrices using vendor’s protocol for 2D
cultures. However, for 3D cultures, modifications were made
similar to MTT-assay. Briefly, BrdU was added to the wells
and incubated for 24 h in 2D cultures. 3D cultures were
incubated for 4 h and cells were then detached using trypsin-
EDTA and centrifuged. Cells were fixed and denatured, anti-
BrdU antibody was added and incubated for 1 h at room
temperature followed by incubation with horseradish
peroxidase-conjugated goat anti-mouse IgG for 30 min.
Tetra-methylbenzidine was added and incubated for 15 min
before stopping the reaction with sulfuric acid. The solution
absorbance was measured at 450 nm.
Evaluation of DMPC Internalization
DMPC was used as a stabilizer while forming PLGA-
chitosan emulsions. To understand the fate of DMPC during
cell culture, FITC-conjugated DMPC was used in preparing
the emulsions. 2D and 3D PLGA-chitosan scaffolds were
formed and HUVECs were seeded using the procedure
described above. After 2 days of incubation, cells were
harvested using trypsin-EDTA and the suspension was split
into two parts. One part was incubated in a trypan blue
solution for 5 min to quench the extracellular fluorescence.
Both portions were resuspended in PBS supplemented with
1% FBS and washed twice. Cells incubated on unconjugated
DMPC-containing scaffolds served as negative control. All
samples were analyzed using a FACSCalibur (Becton-
Dickinson, San Jose, CA) flow cytometer.
Material Stiffness Evaluation
Tensile properties of 2D membranes were measured by the
method described previously (Raghavan et al., 2005;
Sarasam and Madihally, 2005). In brief, large samples were
neutralized in 1N NaOH for 15 min and rinsed thoroughly
under tap water and immersed in PBS for 30 min prior
to testing. Rectangular strips of approximately 60 mm�7.5mm sizewere cut from each sample and pulled to break at
a constant cross head speed of 5 mm/min using INSTRON
5842 (INSTRON, Inc., Canton, MA) outfitted with a 100 N
load cell.
For measuring the material stiffness in 3D cylindrical
scaffolds, compression tests were performed at a rate of
66 BIOTECHNOLOGY AND BIOENGINEERING, VOL. 93, NO. 1, JANUARY 5, 2006

5 mm/min, similar to tensile tests were neutralized with
alcohol and washed with PBS. All samples were tested in the
wet state at 378C using a custom-built environmental
chamber. The stiffness (or elastic modulus) was calculated
from the slope of the linear portion of the stress-strain curve.
Statistical Analysis
All experiments were repeated three or more times with
triplicate samples. The pore size and cell spreading
characteristics were plotted as box plots to show the
distribution in the data and significant differences between
measured groups. At least 50 pores or cells were analyzed for
each condition. Each box encompasses 25th to 75th centiles,
extending lines cover 90th and 10th centiles, thin line is the
median (50th centile), and the thick line is the mean of the
values. Values outside 95th and 5th centiles were treated as
outliers and are represented by dots. Significant differences
between two groups were also evaluated using a one way
analysis of variance (ANOVA)with 99% confidence interval.
When P< 0.01, the differences were considered to be
statistically significant.
RESULTS
Characterization of 3D Chitosan Scaffolds
First, thin scaffolds were formed directly inside 24-well
plates (Fig. 1A) by freeze-drying a 300 mL volume of
chitosan solution. This volume was selected on the basis of
initial experiments, which showed non-uniform coverage of
the 24-well plate at lower volumes. Formed scaffolds were
�1 mm thick when dry. Although the thickness reduced to
less than 0.3 mm after hydration, scaffolds maintained their
porous structure with no significant changes during 15 days
of incubation. When the hydrated scaffolds were examined
under an inverted light microscope, porous structures were
clearly noticeable (Fig. 1B) in different layers. Evaluation of
micrographs showed that pore sizes between 50 and 200 mm(Fig. 1C) could be obtained by regulating the rate of cooling,
similar to thick cylindrical scaffolds (Madihally and
Matthew, 1999); pore sizes were larger in scaffolds frozen
at �208C (figure not shown) relative to samples frozen at
�868C. However, MW of chitosan did not significantly
influence the size or the shape of the pores. To understand
whether these pores are open to cell seeding and inter-
connected, scaffolds were analyzed via SEM and histology.
These results showed that the pores are open to cell seeding
(Fig. 1D) and interconnected (Fig. 1E).
Influence of 3D Architecture on theMorphology of HUVECs
To understand the influence of 3Dmatrix on cellular activity,
HUVECs were seeded onto 2D and 3D chitosan matrices.
First, cell seeding technique on 3D matrices was confirmed
using CFDA-SE staining. These results showed the uniform
distribution of cells in the 3D scaffold (Fig. 1F). Next,
comparison of cell spreading area showed significant
reduction on 2D chitosan surfaces (Fig. 2A–C) relative to
control surfaces. Reduction in cell spreading was similar in
both MWs of chitosan (Fig. 2F). In addition, cells showed
Figure 1. In situ scaffold formation.Panel A. Themacroscopic view of 3D chitosan scaffold before and after hydration.Panel B. Phase contrast micrograph
of a hydrated chitosan scaffold formed at �868C. Panel C. Box plot showing the pore size distribution in chitosan scaffolds. Panel D. Scanning electron
micrograph of 3D chitosan scaffold.Panel E.Micrograph ofH/E stained cross section of 3D chitosan scaffold formed at�208C.Panel F. Distribution of CFDESE-stained HUVECs after 1 h of seeding onto n a 3D chitosan scaffold. [Color figure can be seen in the online version of this article, available at
www.interscience.wiley.com.]
HUANG ET AL.: CELLULAR COLONIZATION 67
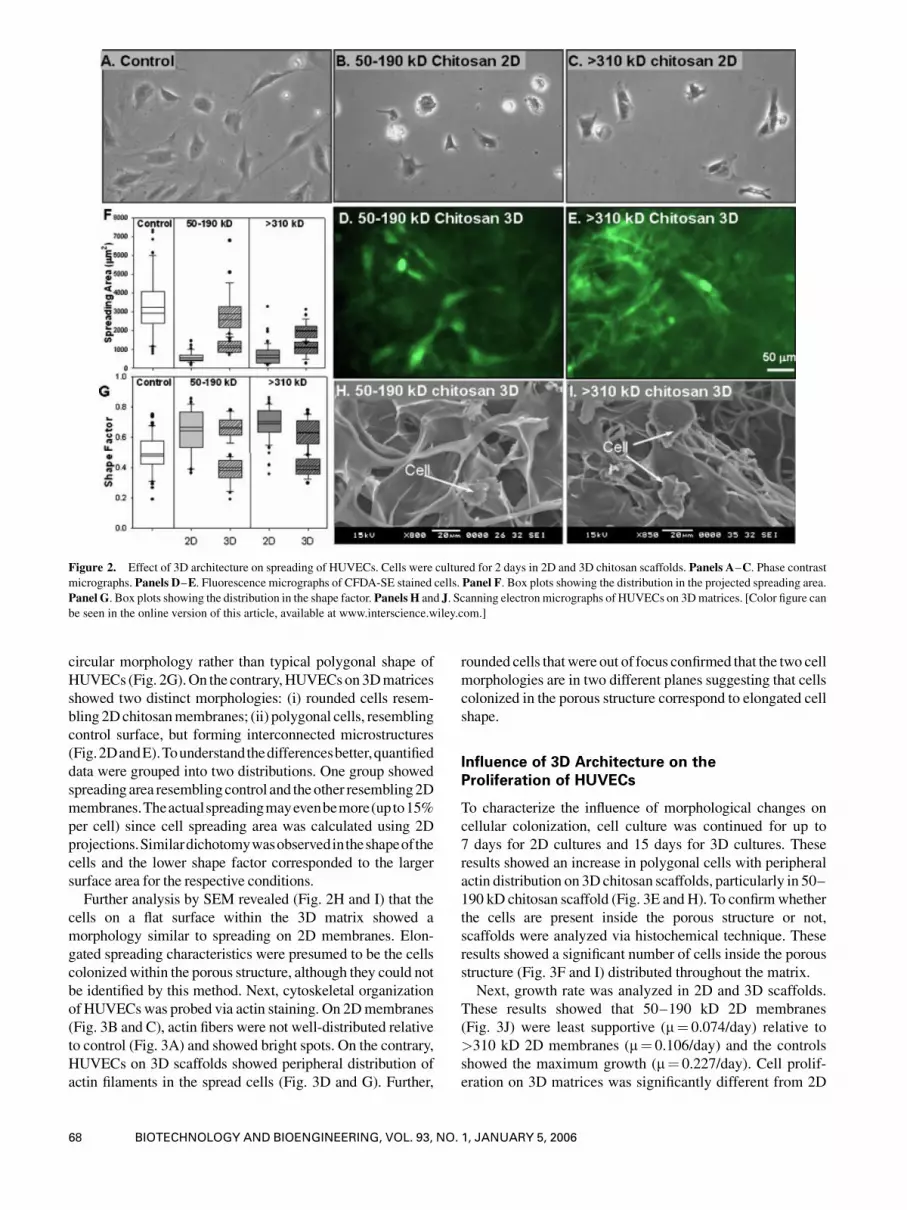
circular morphology rather than typical polygonal shape of
HUVECs (Fig. 2G).On the contrary,HUVECson3Dmatrices
showed two distinct morphologies: (i) rounded cells resem-
bling 2Dchitosanmembranes; (ii) polygonal cells, resembling
control surface, but forming interconnected microstructures
(Fig.2DandE).Tounderstandthedifferencesbetter,quantified
data were grouped into two distributions. One group showed
spreadingarea resemblingcontrol and theother resembling2D
membranes.Theactualspreadingmayevenbemore(upto15%
per cell) since cell spreading area was calculated using 2D
projections.Similardichotomywasobservedintheshapeofthe
cells and the lower shape factor corresponded to the larger
surface area for the respective conditions.
Further analysis by SEM revealed (Fig. 2H and I) that the
cells on a flat surface within the 3D matrix showed a
morphology similar to spreading on 2D membranes. Elon-
gated spreading characteristics were presumed to be the cells
colonizedwithin the porous structure, although they could not
be identified by this method. Next, cytoskeletal organization
of HUVECswas probed via actin staining. On 2Dmembranes
(Fig. 3B and C), actin fibers were not well-distributed relative
to control (Fig. 3A) and showed bright spots. On the contrary,
HUVECs on 3D scaffolds showed peripheral distribution of
actin filaments in the spread cells (Fig. 3D and G). Further,
rounded cells thatwere out of focus confirmed that the two cell
morphologies are in two different planes suggesting that cells
colonized in the porous structure correspond to elongated cell
shape.
Influence of 3D Architecture on theProliferation of HUVECs
To characterize the influence of morphological changes on
cellular colonization, cell culture was continued for up to
7 days for 2D cultures and 15 days for 3D cultures. These
results showed an increase in polygonal cells with peripheral
actin distribution on 3D chitosan scaffolds, particularly in 50–
190 kD chitosan scaffold (Fig. 3E and H). To confirmwhether
the cells are present inside the porous structure or not,
scaffolds were analyzed via histochemical technique. These
results showed a significant number of cells inside the porous
structure (Fig. 3F and I) distributed throughout the matrix.
Next, growth rate was analyzed in 2D and 3D scaffolds.
These results showed that 50–190 kD 2D membranes
(Fig. 3J) were least supportive (m¼ 0.074/day) relative to
>310 kD 2D membranes (m¼ 0.106/day) and the controls
showed the maximum growth (m¼ 0.227/day). Cell prolif-
eration on 3D matrices was significantly different from 2D
Figure 2. Effect of 3D architecture on spreading of HUVECs. Cells were cultured for 2 days in 2D and 3D chitosan scaffolds. Panels A–C. Phase contrastmicrographs. Panels D–E. Fluorescence micrographs of CFDA-SE stained cells. Panel F. Box plots showing the distribution in the projected spreading area.Panel G. Box plots showing the distribution in the shape factor. Panels H and J. Scanning electronmicrographs of HUVECs on 3Dmatrices. [Color figure can
be seen in the online version of this article, available at www.interscience.wiley.com.]
68 BIOTECHNOLOGY AND BIOENGINEERING, VOL. 93, NO. 1, JANUARY 5, 2006
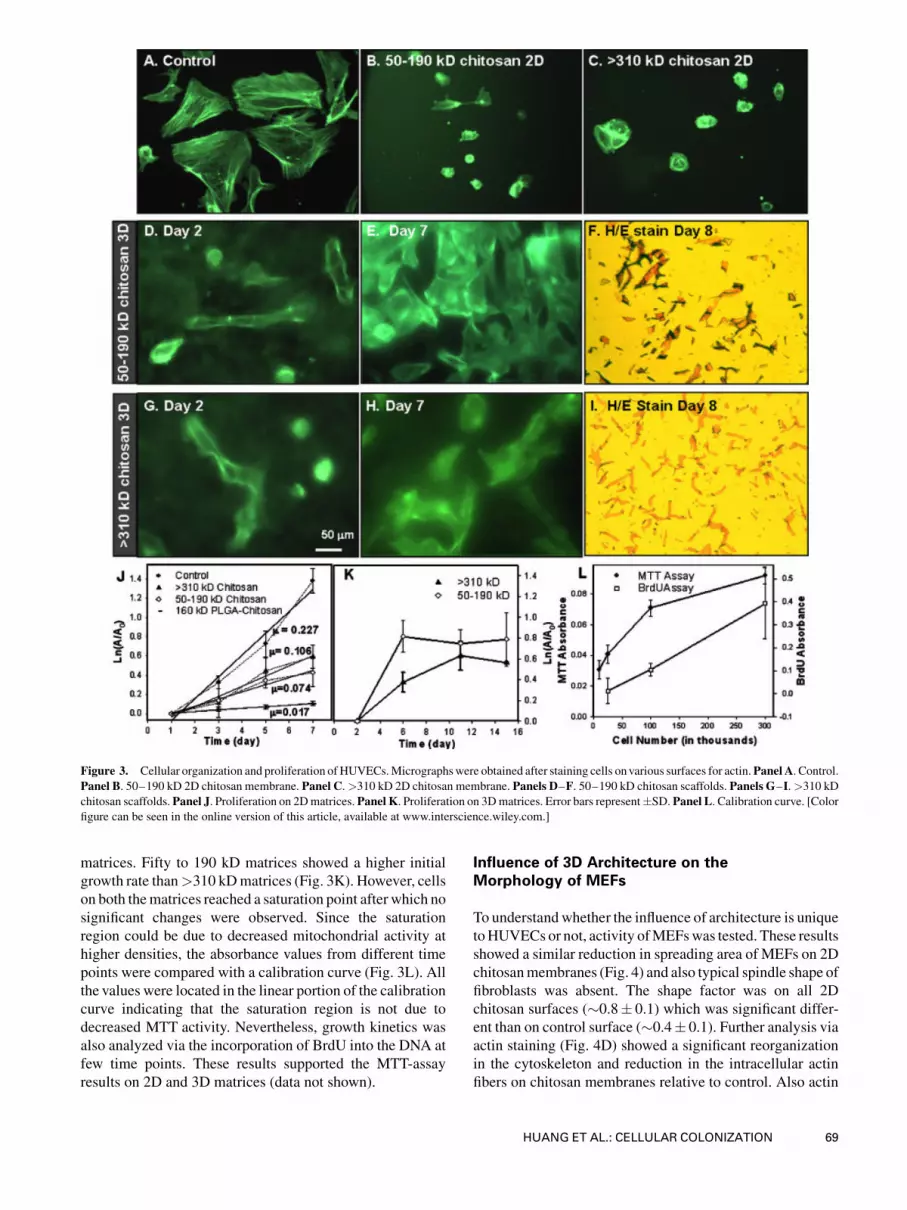
matrices. Fifty to 190 kD matrices showed a higher initial
growth rate than>310 kDmatrices (Fig. 3K). However, cells
on both thematrices reached a saturation point after which no
significant changes were observed. Since the saturation
region could be due to decreased mitochondrial activity at
higher densities, the absorbance values from different time
points were compared with a calibration curve (Fig. 3L). All
the values were located in the linear portion of the calibration
curve indicating that the saturation region is not due to
decreased MTT activity. Nevertheless, growth kinetics was
also analyzed via the incorporation of BrdU into the DNA at
few time points. These results supported the MTT-assay
results on 2D and 3D matrices (data not shown).
Influence of 3D Architecture on theMorphology of MEFs
To understandwhether the influence of architecture is unique
toHUVECs or not, activity ofMEFswas tested. These results
showed a similar reduction in spreading area of MEFs on 2D
chitosanmembranes (Fig. 4) and also typical spindle shape of
fibroblasts was absent. The shape factor was on all 2D
chitosan surfaces (�0.8� 0.1) which was significant differ-
ent than on control surface (�0.4� 0.1). Further analysis via
actin staining (Fig. 4D) showed a significant reorganization
in the cytoskeleton and reduction in the intracellular actin
fibers on chitosan membranes relative to control. Also actin
Figure 3. Cellular organization and proliferation of HUVECs.Micrographswere obtained after staining cells onvarious surfaces for actin.Panel A. Control.Panel B. 50–190 kD 2D chitosan membrane. Panel C.>310 kD 2D chitosan membrane. Panels D–F. 50–190 kD chitosan scaffolds. Panels G–I.>310 kD
chitosan scaffolds.Panel J. Proliferation on 2Dmatrices.Panel K. Proliferation on 3Dmatrices. Error bars represent�SD. Panel L. Calibration curve. [Colorfigure can be seen in the online version of this article, available at www.interscience.wiley.com.]
HUANG ET AL.: CELLULAR COLONIZATION 69
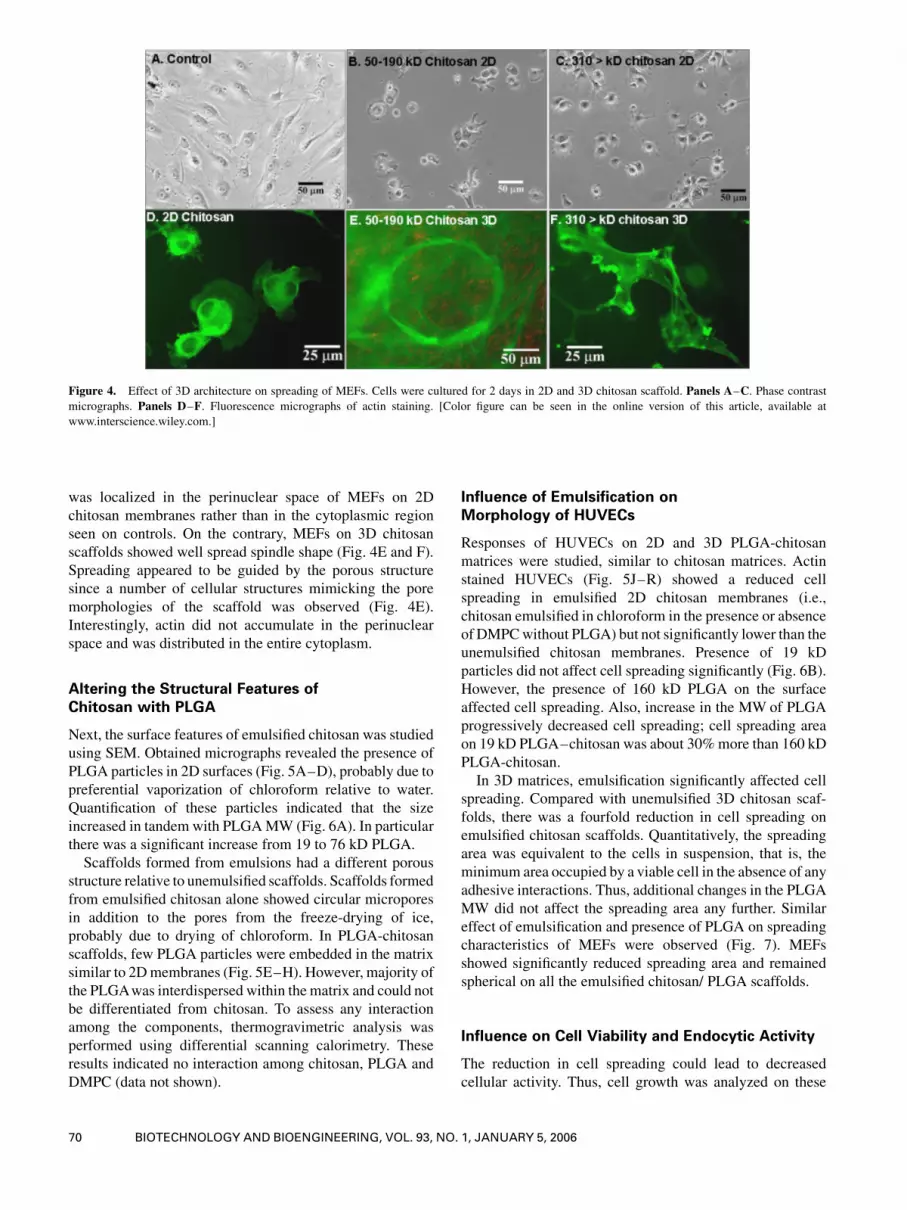
was localized in the perinuclear space of MEFs on 2D
chitosan membranes rather than in the cytoplasmic region
seen on controls. On the contrary, MEFs on 3D chitosan
scaffolds showed well spread spindle shape (Fig. 4E and F).
Spreading appeared to be guided by the porous structure
since a number of cellular structures mimicking the pore
morphologies of the scaffold was observed (Fig. 4E).
Interestingly, actin did not accumulate in the perinuclear
space and was distributed in the entire cytoplasm.
Altering the Structural Features ofChitosan with PLGA
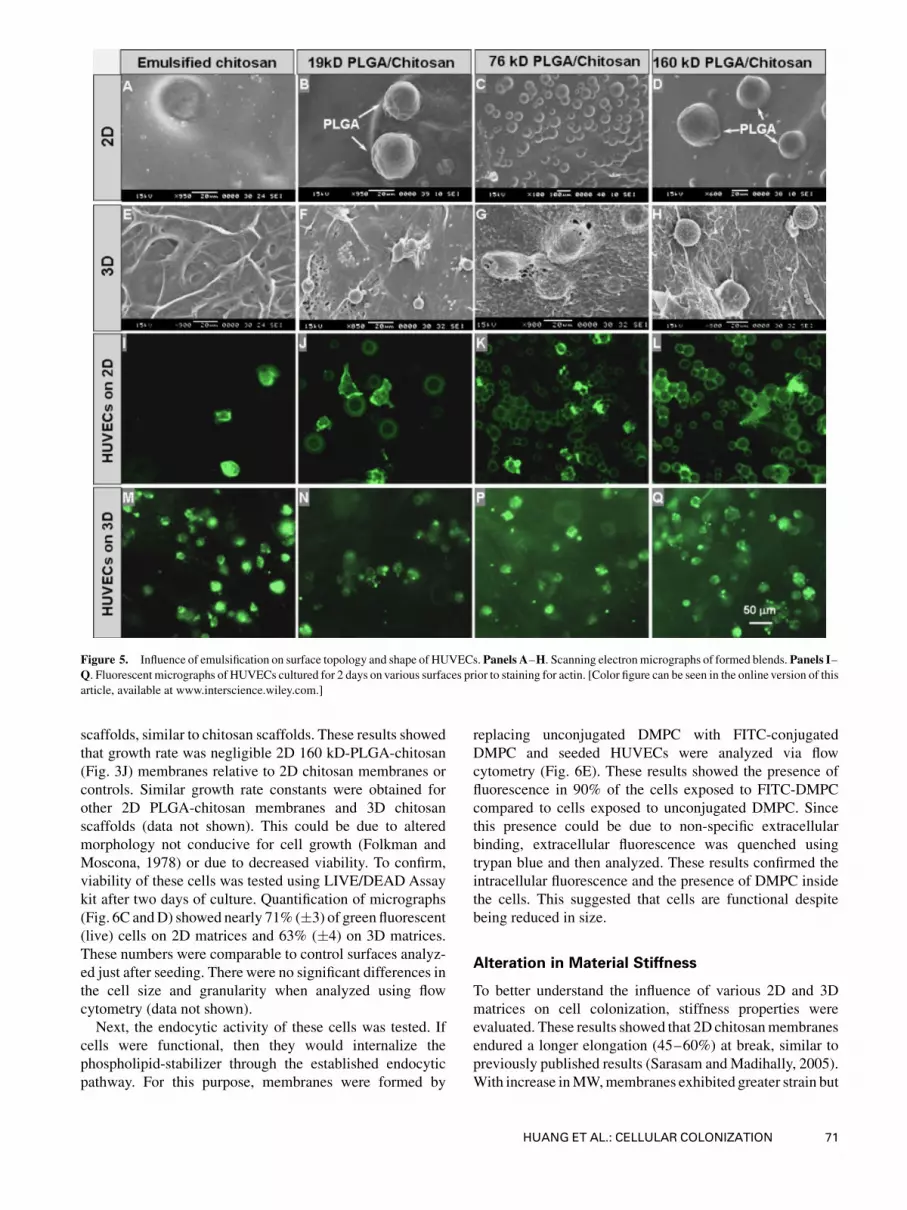
Next, the surface features of emulsified chitosan was studied
using SEM. Obtained micrographs revealed the presence of
PLGA particles in 2D surfaces (Fig. 5A–D), probably due to
preferential vaporization of chloroform relative to water.
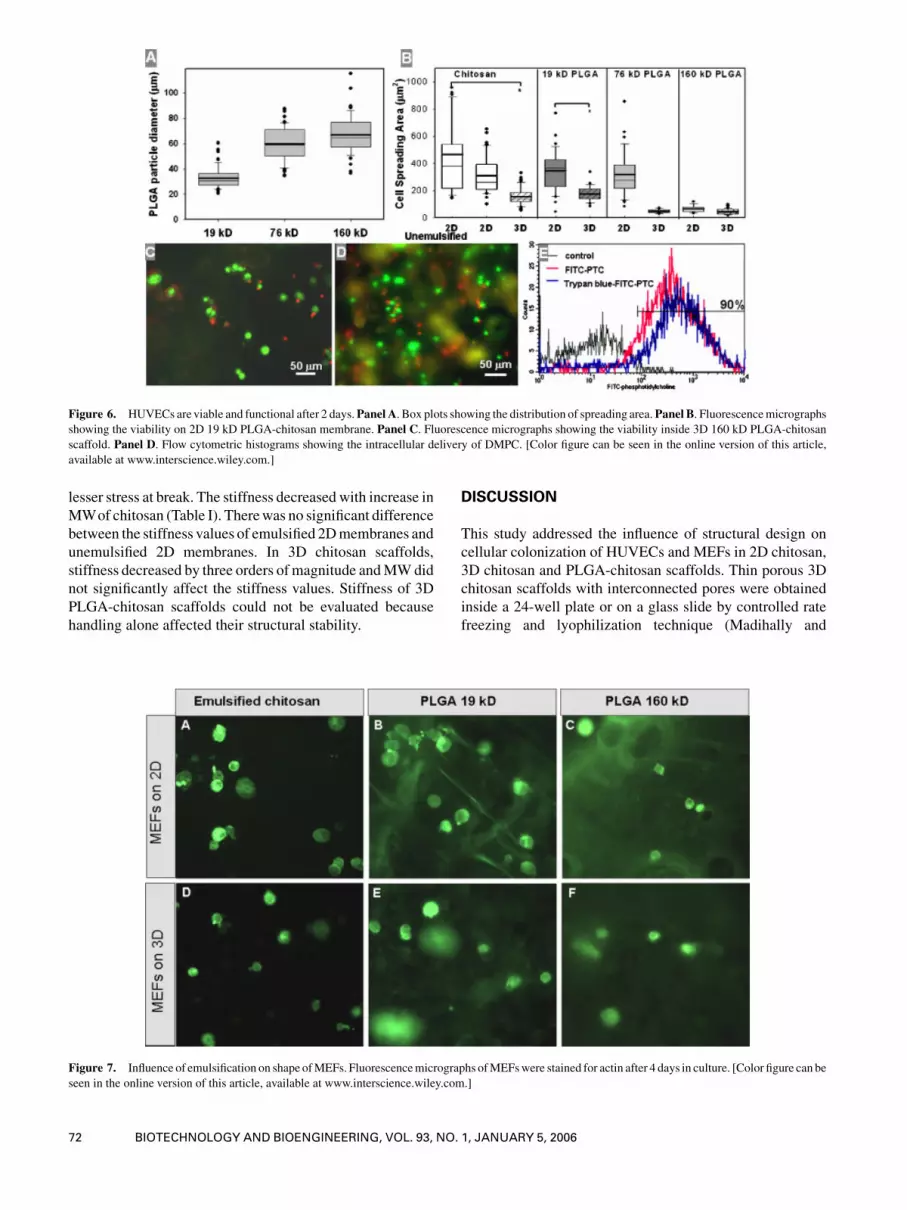
Quantification of these particles indicated that the size
increased in tandem with PLGAMW (Fig. 6A). In particular
there was a significant increase from 19 to 76 kD PLGA.
Scaffolds formed from emulsions had a different porous
structure relative to unemulsified scaffolds. Scaffolds formed
from emulsified chitosan alone showed circular micropores
in addition to the pores from the freeze-drying of ice,
probably due to drying of chloroform. In PLGA-chitosan
scaffolds, few PLGA particles were embedded in the matrix
similar to 2Dmembranes (Fig. 5E–H). However, majority of
the PLGAwas interdispersed within the matrix and could not
be differentiated from chitosan. To assess any interaction
among the components, thermogravimetric analysis was
performed using differential scanning calorimetry. These
results indicated no interaction among chitosan, PLGA and
DMPC (data not shown).
Influence of Emulsification onMorphology of HUVECs
Responses of HUVECs on 2D and 3D PLGA-chitosan
matrices were studied, similar to chitosan matrices. Actin
stained HUVECs (Fig. 5J–R) showed a reduced cell
spreading in emulsified 2D chitosan membranes (i.e.,
chitosan emulsified in chloroform in the presence or absence
of DMPCwithout PLGA) but not significantly lower than the
unemulsified chitosan membranes. Presence of 19 kD
particles did not affect cell spreading significantly (Fig. 6B).
However, the presence of 160 kD PLGA on the surface
affected cell spreading. Also, increase in the MW of PLGA
progressively decreased cell spreading; cell spreading area
on 19 kD PLGA–chitosan was about 30%more than 160 kD
PLGA-chitosan.
In 3D matrices, emulsification significantly affected cell
spreading. Compared with unemulsified 3D chitosan scaf-
folds, there was a fourfold reduction in cell spreading on
emulsified chitosan scaffolds. Quantitatively, the spreading
area was equivalent to the cells in suspension, that is, the
minimum area occupied by a viable cell in the absence of any
adhesive interactions. Thus, additional changes in the PLGA
MW did not affect the spreading area any further. Similar
effect of emulsification and presence of PLGA on spreading
characteristics of MEFs were observed (Fig. 7). MEFs
showed significantly reduced spreading area and remained
spherical on all the emulsified chitosan/ PLGA scaffolds.
Influence on Cell Viability and Endocytic Activity
The reduction in cell spreading could lead to decreased
cellular activity. Thus, cell growth was analyzed on these
Figure 4. Effect of 3D architecture on spreading of MEFs. Cells were cultured for 2 days in 2D and 3D chitosan scaffold. Panels A–C. Phase contrastmicrographs. Panels D–F. Fluorescence micrographs of actin staining. [Color figure can be seen in the online version of this article, available at
www.interscience.wiley.com.]
70 BIOTECHNOLOGY AND BIOENGINEERING, VOL. 93, NO. 1, JANUARY 5, 2006
scaffolds, similar to chitosan scaffolds. These results showed
that growth rate was negligible 2D 160 kD-PLGA-chitosan
(Fig. 3J) membranes relative to 2D chitosan membranes or
controls. Similar growth rate constants were obtained for
other 2D PLGA-chitosan membranes and 3D chitosan
scaffolds (data not shown). This could be due to altered
morphology not conducive for cell growth (Folkman and
Moscona, 1978) or due to decreased viability. To confirm,
viability of these cells was tested using LIVE/DEAD Assay
kit after two days of culture. Quantification of micrographs
(Fig. 6C andD) showed nearly 71% (�3) of green fluorescent
(live) cells on 2D matrices and 63% (�4) on 3D matrices.
These numbers were comparable to control surfaces analyz-
ed just after seeding. There were no significant differences in
the cell size and granularity when analyzed using flow
cytometry (data not shown).
Next, the endocytic activity of these cells was tested. If
cells were functional, then they would internalize the
phospholipid-stabilizer through the established endocytic
pathway. For this purpose, membranes were formed by
replacing unconjugated DMPC with FITC-conjugated
DMPC and seeded HUVECs were analyzed via flow
cytometry (Fig. 6E). These results showed the presence of
fluorescence in 90% of the cells exposed to FITC-DMPC
compared to cells exposed to unconjugated DMPC. Since
this presence could be due to non-specific extracellular
binding, extracellular fluorescence was quenched using
trypan blue and then analyzed. These results confirmed the
intracellular fluorescence and the presence of DMPC inside
the cells. This suggested that cells are functional despite
being reduced in size.
Alteration in Material Stiffness
To better understand the influence of various 2D and 3D
matrices on cell colonization, stiffness properties were
evaluated. These results showed that 2D chitosanmembranes
endured a longer elongation (45–60%) at break, similar to
previously published results (Sarasam andMadihally, 2005).
With increase inMW,membranes exhibited greater strain but
Figure 5. Influence of emulsification on surface topology and shape of HUVECs. Panels A–H. Scanning electronmicrographs of formed blends. Panels I–Q. Fluorescent micrographs of HUVECs cultured for 2 days on various surfaces prior to staining for actin. [Color figure can be seen in the online version of this
article, available at www.interscience.wiley.com.]
HUANG ET AL.: CELLULAR COLONIZATION 71
lesser stress at break. The stiffness decreased with increase in
MWof chitosan (Table I). Therewas no significant difference
between the stiffness values of emulsified 2Dmembranes and
unemulsified 2D membranes. In 3D chitosan scaffolds,
stiffness decreased by three orders ofmagnitude andMWdid
not significantly affect the stiffness values. Stiffness of 3D
PLGA-chitosan scaffolds could not be evaluated because
handling alone affected their structural stability.
DISCUSSION
This study addressed the influence of structural design on
cellular colonization of HUVECs and MEFs in 2D chitosan,
3D chitosan and PLGA-chitosan scaffolds. Thin porous 3D
chitosan scaffolds with interconnected pores were obtained
inside a 24-well plate or on a glass slide by controlled rate
freezing and lyophilization technique (Madihally and
Figure 6. HUVECs are viable and functional after 2 days.Panel A. Box plots showing the distribution of spreading area.Panel B. Fluorescencemicrographs
showing the viability on 2D 19 kD PLGA-chitosan membrane. Panel C. Fluorescence micrographs showing the viability inside 3D 160 kD PLGA-chitosan
scaffold. Panel D. Flow cytometric histograms showing the intracellular delivery of DMPC. [Color figure can be seen in the online version of this article,
available at www.interscience.wiley.com.]
Figure 7. Influence of emulsification on shape ofMEFs. Fluorescencemicrographs ofMEFswere stained for actin after 4 days in culture. [Color figure can be
seen in the online version of this article, available at www.interscience.wiley.com.]
72 BIOTECHNOLOGY AND BIOENGINEERING, VOL. 93, NO. 1, JANUARY 5, 2006
Matthew, 1999). Since 2D and 3D matrices were generated
from same solutions, sterilized, neutralized, and washed
similarly prior to cell seeding, the complexities associated
with the influence of altered solvent composition while
preparing the samples was minimized. The primary differ-
ences in generating 2D and 3D matrices was the method of
drying.
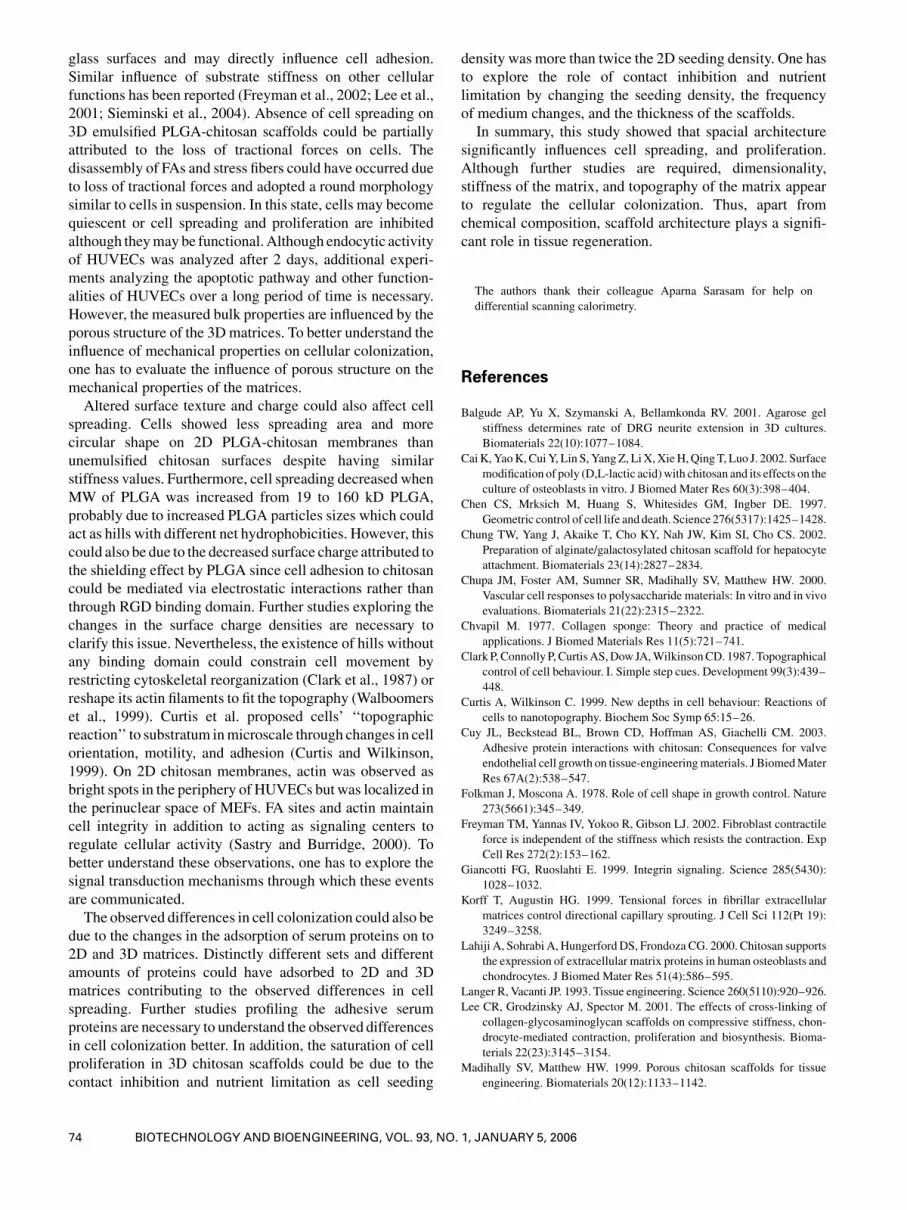
Different structural designs tested in this study are
summarized in Figure 8 along with the observed differences
on cell colonization. Both HUVECs and MEFs showed a
reduction in cell spreading on chitosanmembranes relative to
control. Similar reduction in cell spreading has also been
observed on chitosan membranes (Cuy et al., 2003) despite
comparable adsorption of serum proteins relative to controls.
The authors eluded this observation to a strong adhesive
interaction of cells and chitosan. Nevertheless, when cells
were seeded onto 3D chitosan scaffolds, cell spreading
significantly increased and cells grew in to the pores of
chitosan matrix. Significant alterations in cell spreading were
observed in 2D and 3D chitosan scaffolds although the
chemical composition is the same. Therefore, the spatial
architecture of scaffolds has the dominant role in directing
cellular colonization even at the absence of cell-binding
domain in thematerials. These observations are comparable to
in vivo implant studies condition, where scaffold microarch-
itecture, rather than chemical composition, is known to affect
vascularization (Sieminski and Gooch, 2000).
A number of factors could be contributing to the observed
differences in 2D and 3D matrices. In 2D membranes,
cultured cells are restricted to spread on a flat plane unlike 3D
matrices, which provide spatial advantages for cell adhesion.
A number of studies have shown that pore size of 3D
scaffolds significantly influence cellular responses and
colonization (Ng et al., 2004; Salem et al., 2002; Wang and
Ho, 2004; Yannas et al., 1989; Zeltinger et al., 2001). Many
cell types including HUVECs and fibroblasts are unable to
completely colonize scaffolds with the pore sizes >300 mm(Naughton and Applegate, 2002; Ng et al., 2004) due to the
difficulty in crossing large bridging distances. In this
study, chitosan scaffolds used for cell colonization studies
were prepared by freezing at �208C which had a pore size
distribution from 100 to 200 mm, closer to the optimum range
(50–150 mm) (Yannas et al., 1989). Thus the contribution
from altered pore sizes to cell colonization was not an issue.
Furthermore, HUVECs showed a faster colonization on 50–
190 kD chitosan scaffolds than >310 kD chitosan scaffolds
despite having similar pore size distributions. MEFs also
colonized 3D chitosan scaffolds although they may prefer
different pore sizes (Zeltinger et al., 2001). Nevertheless,
further studieswith pore sizes are necessary to understand the
influence of microarchitecture on cell colonization.
Measured bulk mechanical properties suggested that the
difference in the material stiffness could partially contribute
to the observed differences in cell spreading characteristics
between 2D membranes and 3D scaffolds. In 2D culture,
cells are cultured on rigid glass surfaces coated with thin
layer of matrices and stiffness that matrices posses may be
primary contributed by the glass surface. However, in 3D
cultures, the stiffness of the scaffolds will be different than
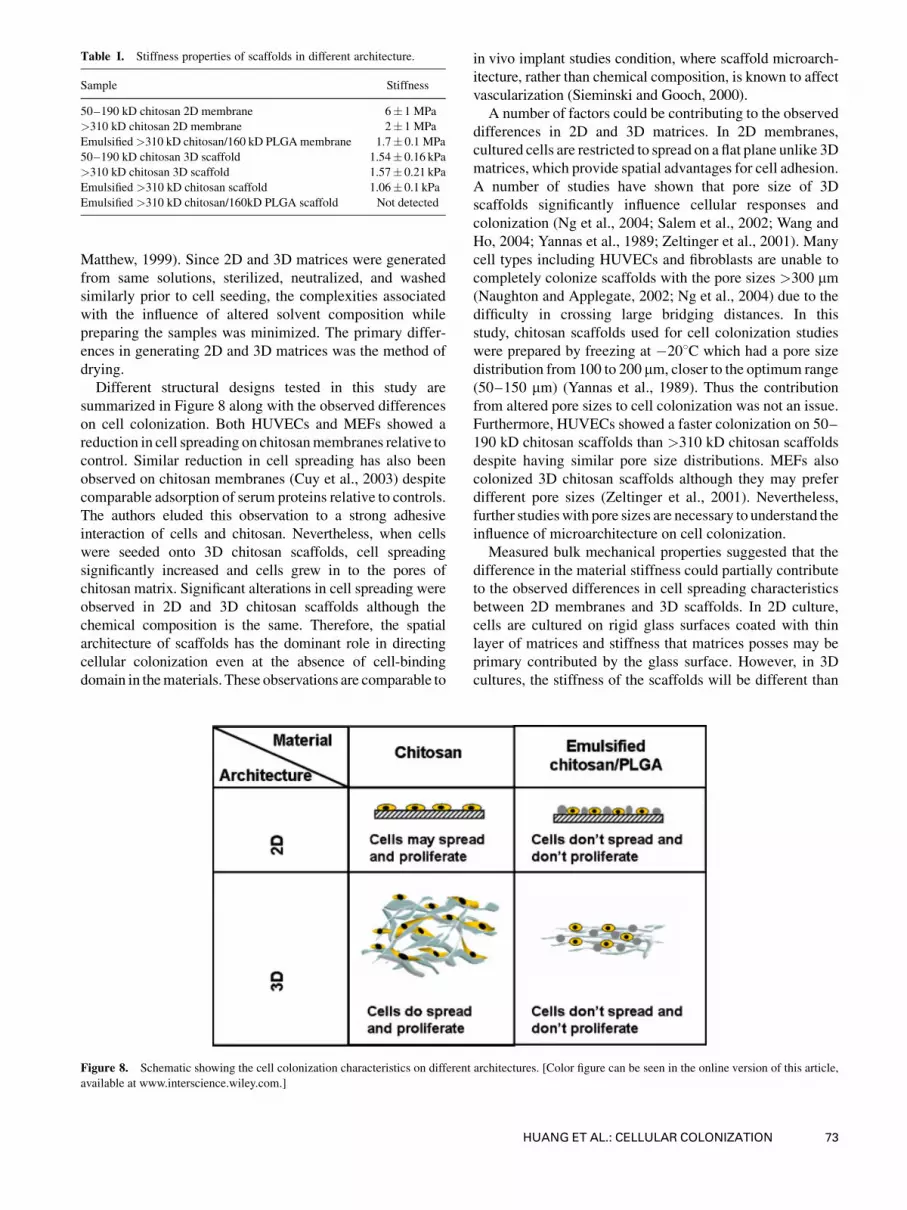
Table I. Stiffness properties of scaffolds in different architecture.
Sample Stiffness
50–190 kD chitosan 2D membrane 6� 1 MPa
>310 kD chitosan 2D membrane 2� 1 MPa
Emulsified>310 kD chitosan/160 kD PLGAmembrane 1.7� 0.1 MPa
50–190 kD chitosan 3D scaffold 1.54� 0.16 kPa
>310 kD chitosan 3D scaffold 1.57� 0.21 kPa
Emulsified >310 kD chitosan scaffold 1.06� 0.1 kPa
Emulsified >310 kD chitosan/160kD PLGA scaffold Not detected
Figure 8. Schematic showing the cell colonization characteristics on different architectures. [Color figure can be seen in the online version of this article,
available at www.interscience.wiley.com.]
HUANG ET AL.: CELLULAR COLONIZATION 73
glass surfaces and may directly influence cell adhesion.
Similar influence of substrate stiffness on other cellular
functions has been reported (Freyman et al., 2002; Lee et al.,
2001; Sieminski et al., 2004). Absence of cell spreading on
3D emulsified PLGA-chitosan scaffolds could be partially
attributed to the loss of tractional forces on cells. The
disassembly of FAs and stress fibers could have occurred due
to loss of tractional forces and adopted a round morphology
similar to cells in suspension. In this state, cells may become
quiescent or cell spreading and proliferation are inhibited
although theymay be functional.Although endocytic activity
of HUVECs was analyzed after 2 days, additional experi-
ments analyzing the apoptotic pathway and other function-
alities of HUVECs over a long period of time is necessary.
However, the measured bulk properties are influenced by the
porous structure of the 3Dmatrices. To better understand the
influence of mechanical properties on cellular colonization,
one has to evaluate the influence of porous structure on the
mechanical properties of the matrices.
Altered surface texture and charge could also affect cell
spreading. Cells showed less spreading area and more
circular shape on 2D PLGA-chitosan membranes than
unemulsified chitosan surfaces despite having similar
stiffness values. Furthermore, cell spreading decreased when
MW of PLGA was increased from 19 to 160 kD PLGA,
probably due to increased PLGA particles sizes which could
act as hills with different net hydrophobicities. However, this
could also be due to the decreased surface charge attributed to
the shielding effect by PLGA since cell adhesion to chitosan
could be mediated via electrostatic interactions rather than
through RGD binding domain. Further studies exploring the
changes in the surface charge densities are necessary to
clarify this issue. Nevertheless, the existence of hills without
any binding domain could constrain cell movement by
restricting cytoskeletal reorganization (Clark et al., 1987) or
reshape its actin filaments to fit the topography (Walboomers
et al., 1999). Curtis et al. proposed cells’ ‘‘topographic
reaction’’ to substratum inmicroscale through changes in cell
orientation, motility, and adhesion (Curtis and Wilkinson,
1999). On 2D chitosan membranes, actin was observed as
bright spots in the periphery of HUVECs but was localized in
the perinuclear space of MEFs. FA sites and actin maintain
cell integrity in addition to acting as signaling centers to
regulate cellular activity (Sastry and Burridge, 2000). To
better understand these observations, one has to explore the
signal transduction mechanisms through which these events
are communicated.
The observed differences in cell colonization could also be
due to the changes in the adsorption of serum proteins on to
2D and 3D matrices. Distinctly different sets and different
amounts of proteins could have adsorbed to 2D and 3D
matrices contributing to the observed differences in cell
spreading. Further studies profiling the adhesive serum
proteins are necessary to understand the observed differences
in cell colonization better. In addition, the saturation of cell
proliferation in 3D chitosan scaffolds could be due to the
contact inhibition and nutrient limitation as cell seeding
density was more than twice the 2D seeding density. One has
to explore the role of contact inhibition and nutrient
limitation by changing the seeding density, the frequency
of medium changes, and the thickness of the scaffolds.
In summary, this study showed that spacial architecture
significantly influences cell spreading, and proliferation.
Although further studies are required, dimensionality,
stiffness of the matrix, and topography of the matrix appear
to regulate the cellular colonization. Thus, apart from
chemical composition, scaffold architecture plays a signifi-
cant role in tissue regeneration.
The authors thank their colleague Aparna Sarasam for help on
differential scanning calorimetry.
References
Balgude AP, Yu X, Szymanski A, Bellamkonda RV. 2001. Agarose gel
stiffness determines rate of DRG neurite extension in 3D cultures.
Biomaterials 22(10):1077–1084.
CaiK,YaoK,CuiY, Lin S, YangZ, LiX,XieH,QingT, Luo J. 2002. Surface
modification of poly (D,L-lactic acid)with chitosan and its effects on the
culture of osteoblasts in vitro. J Biomed Mater Res 60(3):398–404.
Chen CS, Mrksich M, Huang S, Whitesides GM, Ingber DE. 1997.
Geometric control of cell life and death. Science 276(5317):1425–1428.
Chung TW, Yang J, Akaike T, Cho KY, Nah JW, Kim SI, Cho CS. 2002.
Preparation of alginate/galactosylated chitosan scaffold for hepatocyte
attachment. Biomaterials 23(14):2827–2834.
Chupa JM, Foster AM, Sumner SR, Madihally SV, Matthew HW. 2000.
Vascular cell responses to polysaccharide materials: In vitro and in vivo
evaluations. Biomaterials 21(22):2315–2322.
Chvapil M. 1977. Collagen sponge: Theory and practice of medical
applications. J Biomed Materials Res 11(5):721–741.
Clark P,Connolly P, CurtisAS,Dow JA,WilkinsonCD. 1987. Topographical
control of cell behaviour. I. Simple step cues. Development 99(3):439–
448.
Curtis A, Wilkinson C. 1999. New depths in cell behaviour: Reactions of
cells to nanotopography. Biochem Soc Symp 65:15–26.
Cuy JL, Beckstead BL, Brown CD, Hoffman AS, Giachelli CM. 2003.
Adhesive protein interactions with chitosan: Consequences for valve
endothelial cell growth on tissue-engineeringmaterials. J BiomedMater
Res 67A(2):538–547.
Folkman J, Moscona A. 1978. Role of cell shape in growth control. Nature
273(5661):345–349.
Freyman TM, Yannas IV, Yokoo R, Gibson LJ. 2002. Fibroblast contractile
force is independent of the stiffness which resists the contraction. Exp
Cell Res 272(2):153–162.
Giancotti FG, Ruoslahti E. 1999. Integrin signaling. Science 285(5430):
1028–1032.
Korff T, Augustin HG. 1999. Tensional forces in fibrillar extracellular
matrices control directional capillary sprouting. J Cell Sci 112(Pt 19):
3249–3258.
Lahiji A, Sohrabi A, HungerfordDS, Frondoza CG. 2000. Chitosan supports
the expression of extracellular matrix proteins in human osteoblasts and
chondrocytes. J Biomed Mater Res 51(4):586–595.
Langer R, Vacanti JP. 1993. Tissue engineering. Science 260(5110):920–926.
Lee CR, Grodzinsky AJ, Spector M. 2001. The effects of cross-linking of
collagen-glycosaminoglycan scaffolds on compressive stiffness, chon-
drocyte-mediated contraction, proliferation and biosynthesis. Bioma-
terials 22(23):3145–3154.
Madihally SV, Matthew HW. 1999. Porous chitosan scaffolds for tissue
engineering. Biomaterials 20(12):1133–1142.
74 BIOTECHNOLOGY AND BIOENGINEERING, VOL. 93, NO. 1, JANUARY 5, 2006
Madihally SV, Solomon V, Mitchell RN, Van De Water L, Yarmush ML,
Toner M. 2003. Influence of insulin therapy on burn wound healing in
rats. J Surg Res 109(2):92–100.
Mizuno K, Yamamura K, Yano K, Osada T, Saeki S, Takimoto N, Sakurai T,
Nimura Y. 2003. Effect of chitosan film containing basic fibroblast
growth factor on wound healing in genetically diabetic mice. J Biomed
Mater Res 64(1):177–181.
MosmannT. 1983. Rapid colorimetric assay for cellular growth and survival:
Application to proliferation and cytotoxicity assays. J Immunol
Methods 65(1-2):55–63.
Naughton GK, Applegate DR. 2002. Cryopreserved dermal implants. In:
Atala A, Langer RP, editors. Methods of tissue engineering. New York:
Academic Press, 2001.
Ng KW, Khor HL, Hutmacher DW. 2004. In vitro characterization of natural
and synthetic dermal matrices cultured with human dermal fibroblasts.
Biomaterials 25(14):2807–2818.
Oberpenning F, Meng J, Yoo JJ, Atala A. 1999. De novo reconstitution of a
functional mammalian urinary bladder by tissue engineering. Natl
Biotechnol 17(2):149–155.
Persidis A. 1999. Tissue engineering. Natl Biotechnol 17:508–510.
Raghavan D, Kropp BP, Lin HK, Zhang Y, Cowan R, Madihally SV.
2005. Physical characteristics of small intestinal submucosa
scaffolds are location-dependent. J Biomed Mater Res A 73A(1):
90–96.
Rajnicek A, Britland S, McCaig C. 1997. Contact guidance of CNS neurites
on grooved quartz: Influence of groove dimensions, neuronal age and
cell type. J Cell Sci 110(Pt 23):2905–2913.
Ranucci CS, Moghe PV. 2001. Substrate microtopography can enhance cell
adhesive and migratory responsiveness to matrix ligand density. J
Biomed Mater Res 54(2):149–161.
Salem AK, Stevens R, Pearson RG, Davies MC, Tendler SJ, Roberts CJ,
Williams PM, Shakesheff KM. 2002. Interactions of 3T3 fibroblasts and
endothelial cells with defined pore features. J Biomed Mater Res
61(2):212–217.
Sarasam A, Madihally SV. 2005. Characterization of chitosan-polycaprolac-
tone blends for tissue engineering applications. Biomaterials 26:5500–
5508.
Sastry SK, Burridge K. 2000. Focal adhesions: A nexus for intracellular
signaling and cytoskeletal dynamics. Exp Cell Res 261(1):25–36.
Schoen FJ, Levy RJ. 1999. Founder’s Award, 25th Annual Meeting of the
Society for Biomaterials, perspectives. Providence, RI, April 28-May 2,
1999. Tissue heart valves: Current challenges and future research
perspectives. J Biomed Mater Res 47(4):439–465.
Shigemasa Y SK, Sashiwa H, Saimoto H. 1994. Enzymatic degradation of
chitins and partially deacetylated chitins. Int J Biol Macromol 16(1):
43–49.
Sieminski AL, Gooch KJ. 2000. Biomaterial-microvasculature interactions.
Biomaterials 21(22):2232–2241.
Sieminski AL, Hebbel RP, Gooch KJ. 2004. The relative magnitudes of
endothelial force generation and matrix stiffness modulate capillary
morphogenesis in vitro. Exp Cell Res 297(2):574–584.
Tomihata K, Ikada Y. 1997. In vitro and in vivo degradation of films of chitin
and its deacetylated derivatives. Biomaterials 18(7):567–575.
Walboomers XF, Croes HJ, Ginsel LA, Jansen JA. 1999. Contact guidance
of rat fibroblasts on various implant materials. J Biomed Mater Res
47(2):204–212.
Wang YC, Ho CC. 2004. Micropatterning of proteins and mammalian cells
on biomaterials. Faseb J 18(3):525–527. Epub 2004 Jan 8.
Yannas IV, Lee E, Orgill DP, Skrabut EM, Murphy GF. 1989. Synthesis and
characterization of a model extracellular matrix that induces partial
regeneration of adult mammalian skin. Proc Natl Acad Sci USA
86(3):933–937.
Zeltinger J, Sherwood JK, GrahamDA,Mueller R, Griffith LG. 2001. Effect
of pore size and void fraction on cellular adhesion, proliferation, and
matrix deposition. Tissue Eng 7(5):557–572.
Zhu H, Ji J, Lin R, Gao C, Feng L, Shen J. 2002. Surface engineering of
poly(D,L-lactic acid) by entrapment of chitosan-based derivatives for
the promotion of chondrogenesis. J Biomed Mater Res 62(4):532–539.
HUANG ET AL.: CELLULAR COLONIZATION 75