dna barcoding reveals seasonal shifts in diet and ... - plos
TRANSCRIPT
RESEARCH ARTICLE
DNA barcoding reveals seasonal shifts in diet
and consumption of deep-sea fishes in
wedge-tailed shearwaters
Taketo Komura1*, Haruko Ando2, Kazuo Horikoshi3, Hajime Suzuki3, Yuji Isagi1
1 Graduate School of Agriculture, Kyoto University, Sakyo-ku, Kyoto, Japan, 2 Center for Environmental
Biology and Ecosystem Studies, National Institute for Environmental Studies, Onogawa, Tsukuba, Ibaraki,
Japan, 3 Institute of Boninology, Nishi-machi, Chichijima, Ogasawara, Tokyo, Japan
Abstract
The foraging ecology of pelagic seabirds is difficult to characterize because of their large for-
aging areas. In the face of this difficulty, DNA metabarcoding may be a useful approach to
analyze diet compositions and foraging behaviors. Using this approach, we investigated the
diet composition and its seasonal variation of a common seabird species on the Ogasawara
Islands, Japan: the wedge-tailed shearwater Ardenna pacifica. We collected fecal samples
during the prebreeding (N = 73) and rearing (N = 96) periods. The diet composition of
wedge-tailed shearwater was analyzed by Ion Torrent sequencing using two universal poly-
merase chain reaction primers for the 12S and 16S mitochondrial DNA regions that targeted
vertebrates and mollusks, respectively. The results of a BLAST search of obtained
sequences detected 31 and 1 vertebrate and mollusk taxa, respectively. The results of the
diet composition analysis showed that wedge-tailed shearwaters frequently consumed
deep-sea fishes throughout the sampling season, indicating the importance of these fishes
as a stable food resource. However, there was a marked seasonal shift in diet, which may
reflect seasonal changes in food resource availability and wedge-tailed shearwater foraging
behavior. The collected data regarding the shearwater diet may be useful for in situ conser-
vation efforts. Future research that combines DNA metabarcoding with other tools, such as
data logging, may provide further insight into the foraging ecology of pelagic seabirds.
Introduction
Seabirds are critical organisms within marine ecosystems as they are top-order predators in
hierarchical food webs. Thus, seabird populations have often been used as marine ecosystem
indicators [1–4]. The diets of pelagic seabirds, which may reflect fluctuations in available
marine food resources over their broad foraging ranges, are also useful indicators of marine
biological productivity [5,6]. Most studies of seabird diets have been conducted during only
the rearing period, as conventional methods are unsuitable for assessing their diets during
other periods, such as the prebreeding season [7]; information on seabird diets during the
PLOS ONE | https://doi.org/10.1371/journal.pone.0195385 April 9, 2018 1 / 18
a1111111111
a1111111111
a1111111111
a1111111111
a1111111111
OPENACCESS
Citation: Komura T, Ando H, Horikoshi K, Suzuki H,
Isagi Y (2018) DNA barcoding reveals seasonal
shifts in diet and consumption of deep-sea fishes
in wedge-tailed shearwaters. PLoS ONE 13(4):
e0195385. https://doi.org/10.1371/journal.
pone.0195385
Editor: Hideyuki Doi, University of Hyogo, JAPAN
Received: September 27, 2017
Accepted: March 21, 2018
Published: April 9, 2018
Copyright: © 2018 Komura et al. This is an open
access article distributed under the terms of the
Creative Commons Attribution License, which
permits unrestricted use, distribution, and
reproduction in any medium, provided the original
author and source are credited.
Data Availability Statement: All nucleotide
sequence data files are available from the DDBJ
database (accession number DRA006191).
Funding: This study was supported by the
Environment Research and Technology
Development Fund (4-1402) of the Ministry of the
Environment, Japan (http://www.env.go.jp/policy/
kenkyu/suishin/gaiyou/). The funders had no role in
study design, data collection and analysis, decision
to publish, or preparation of the manuscript.
Competing interests: The authors have declared
that no competing interests exist.
prebreeding season remains insufficient because conventional methods are unsuitable under
these conditions. To use seabird diets as an indicator to monitor seasonal shifts in marine bio-
logical productivity, it is necessary to conduct diet analyses of seabirds on a wider temporal
scale, including the prebreeding and breeding seasons. DNA metabarcoding of fecal samples is
a noninvasive and sensitive method for identifying prey taxa [8,9]. This method does not place
stress on the animals to determine their stomach contents; the metabarcoding method also
requires less effort than conventional morphological analyses [7]. With the development of
high-throughput sequencing techniques, it is now possible to recover DNA sequences from
fecal samples relatively easily [10,11]. In recent years, this method has been mainly used in die-
tary studies of large terrestrial mammals [12]. Continuous dietary research that applies nonin-
vasive and sensitive DNA metabarcoding to seabirds is likely to be useful for monitoring
marine ecosystems with very little impact on birds. However, only a few such studies have tar-
geted marine animals, such as penguins and seals [13,14], and only a limited number of Procel-
lariidae species have been examined using DNA metabarcoding [15–18].
The wedge-tailed shearwater Ardenna pacifica is a potential indicator of Pacific marine eco-
systems due to its wide distribution in the subtropical Pacific and Indian Oceans and its large
population size [19]. In this study, we focused on the population on the Ogasawara Islands,
which constitute a subtropical oceanic island chain located 1,000 km south of the main island
of Japan, and these islands are the only wedge-tailed shearwater breeding colony site in Japan
[20]. The productivity of the subtropical ocean surface is lower than that of northern oceans
[21], and it would be valuable to determine if shearwaters consume only surface nekton or if
they also consume deep-sea animals and how they change their diet as the food resources
change. Nekton communities generally exhibit seasonal migration and fluctuation [22–24],
which may affect the feeding behavior of seabirds. Indeed, other Procellariidae species exhibit
seasonal shifts in foraging behavior [25,26], and provision behaviors of seabirds have been
shown to change during the rearing period [27]. Therefore, it is important to compare the
diets of wedge-tailed shearwaters between two breeding phases to investigate such shifts.
Using a DNA metabarcoding approach, we investigated the dietary composition of the
wedge-tailed shearwater during the prebreeding and rearing periods to compensate for the
deficiency of the current knowledge of shearwater diet during the prebreeding period and its
seasonal dietary shifts. In addition, we surveyed the diets of wedge-tailed shearwaters to esti-
mate the foraging behavior of this species in relation to food resource availability and the pos-
sible contribution of the metabarcoding approach to marine ecosystem monitoring.
Materials & methods
Ethics statement
Fecal samples were collected on the ground at a wedge-tailed shearwater breeding site in a
national forest on Minamijima Island, Japan under an entry license from the Forest Agency of
Japan. During sample collection, we did not capture any birds and avoided damaging their
nests.
Study site
Our study site was located on the Ogasawara Islands, which were listed as a World National
Heritage Site in 2011. This island chain is a breeding site for 16 species of seabirds, including
five Procellariidae species [28,29]. Of these species, 10 are included on the Red List of the Inter-
national Union for Conservation of Nature and/or the Ministry of the Environment of Japan
[30,31]. This study was conducted on Minamijima Island (27˚02’N, 142˚10’E), which contains
one of the largest colonies of wedge-tailed shearwaters on the Ogasawara Islands.
Diet analysis of wedge-tailed shearwaters by DNA metabarcoding
PLOS ONE | https://doi.org/10.1371/journal.pone.0195385 April 9, 2018 2 / 18
Target species
The wedge-tailed shearwater Ardenna pacifica is a medium-sized species of the Procellariidae
family that breeds on oceanic islands in the tropical Pacific and Indian Oceans as well as on
the east and west coasts of Australia. The global wedge-tailed shearwater population is esti-
mated to be more than 5,200,000 individuals [19], and the number of breeding pairs in Japan
is estimated to be 10,000–100,000 [32]. Although the population of this species is large, there
are concerns that its numbers are declining owing to unsustainable levels of exploitation, per-
secution, predation by invasive species, and overfishing [19].
Although the wedge-tailed shearwater is a medium-sized species, it is the largest species of
Procellariidae on the Ogasawara Islands. In these islands, wedge-tailed shearwaters lay eggs in
June or July, incubate the eggs for approximately 50 days, and then rear the chicks for approxi-
mately 50 days (Kazuo Horikoshi and Hajime Suzuki, personal observation).
Fecal sampling and DNA extraction
We collected 73 and 96 fecal samples in the early mornings when the adults were absent in
May 2015 (prebreeding period) and September 2015 (rearing period), respectively, on rocky
limestone and grass in an exclusive wedge-tailed shearwater colony. We took care not to mix
uric acid into fecal samples during collection. These sampling criteria have been deemed valid
for the efficient recovery of prey DNA [18,33]. Most of the fecal samples were dried naturally
in the field. The collected feces were stored at –30˚C until DNA extraction. DNA from samples
>5 mg and<20 mg in fecal dry weight was extracted using the QIAamp DNA Stool Mini Kit
(QIAGEN, Venlo, the Netherlands).
DNA barcoding
Following previous studies based on stomach analysis conducted in Hawaii [34], we assumed
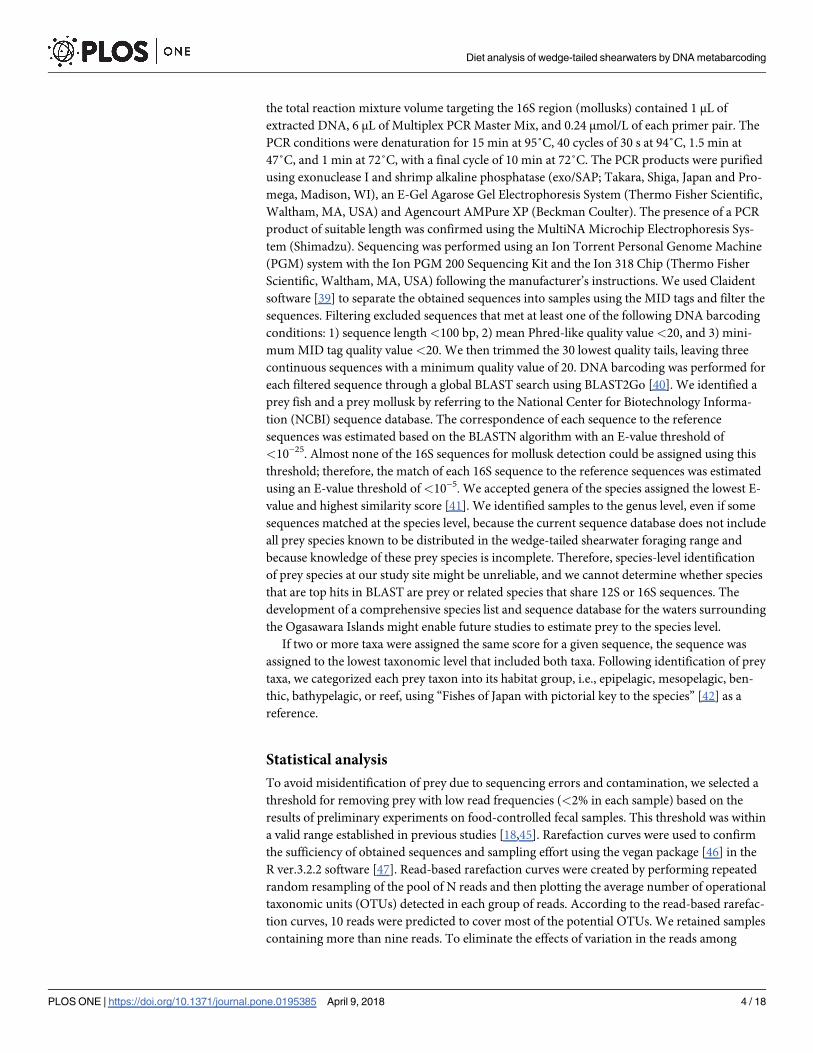
that the main prey of wedge-tailed shearwaters were fishes and mollusks. Universal primer
pairs were used to amplify the mtDNA of the 12S and 16S regions of fishes and mollusks,
respectively (Table 1). These regions have frequently been used for the amplification and iden-
tification of DNA of vertebrates and cephalopods in diet studies [8,35,36]. The forward prim-
ers were tagged with a multiplex identifier (MID) [37] to track the sequences resulting from
each sample. We designed a blocking primer specific to Procellariidae sequences by modifying
the primers used in a previous study [38]. Polymerase chain reaction (PCR) amplification was
conducted using a Qiagen Multiplex PCR kit (Qiagen), and each 10 μL sample of the total reac-
tion mixture volume targeting the 12S region (fishes) contained 1 μL of extracted DNA, 6 μL
of Multiplex PCR Master Mix, 0.24 μmol/L of each primer pair, and 1.2 μmol/L of blocking
primer. The PCR conditions were denaturation for 15 min at 95˚C, 35 cycles of 30 s at 94˚C,
1.5 min at 57˚C, and 1 min at 72˚C, with a final cycle of 10 min at 72˚C. Each 10 μL sample of
Table 1. Sequences of the primer pairs used in this study. The lengths of the amplified fragments (excluding primers) with 12SV5 and Mol-16S were 105–121 and 102–
143 bp, respectively.
Primer name Region Sequence (5’-3’) No. of prey taxa identified Reference
F_12SV5 mtDNA 12S TAGAACAGGCTCCTCTAG 31 [43]
R_12SV5 mtDNA 12S TTAGATACCCCACTATGC [43]
Mol-16S-F1 mtDNA 16S MCTTWTAAWTKRAGGCTAGA 9 [44]
Mol-16S-R2 mtDNA 16S MYYAGGGTCTTSTTGTC [44]
blocking primer for shearwaters mtDNA 12S CTATGCTTAGCCCTAAATCTTGATACTTACC-C3
https://doi.org/10.1371/journal.pone.0195385.t001
Diet analysis of wedge-tailed shearwaters by DNA metabarcoding
PLOS ONE | https://doi.org/10.1371/journal.pone.0195385 April 9, 2018 3 / 18
the total reaction mixture volume targeting the 16S region (mollusks) contained 1 μL of
extracted DNA, 6 μL of Multiplex PCR Master Mix, and 0.24 μmol/L of each primer pair. The
PCR conditions were denaturation for 15 min at 95˚C, 40 cycles of 30 s at 94˚C, 1.5 min at
47˚C, and 1 min at 72˚C, with a final cycle of 10 min at 72˚C. The PCR products were purified
using exonuclease I and shrimp alkaline phosphatase (exo/SAP; Takara, Shiga, Japan and Pro-
mega, Madison, WI), an E-Gel Agarose Gel Electrophoresis System (Thermo Fisher Scientific,
Waltham, MA, USA) and Agencourt AMPure XP (Beckman Coulter). The presence of a PCR
product of suitable length was confirmed using the MultiNA Microchip Electrophoresis Sys-
tem (Shimadzu). Sequencing was performed using an Ion Torrent Personal Genome Machine
(PGM) system with the Ion PGM 200 Sequencing Kit and the Ion 318 Chip (Thermo Fisher
Scientific, Waltham, MA, USA) following the manufacturer’s instructions. We used Claident
software [39] to separate the obtained sequences into samples using the MID tags and filter the
sequences. Filtering excluded sequences that met at least one of the following DNA barcoding
conditions: 1) sequence length <100 bp, 2) mean Phred-like quality value <20, and 3) mini-
mum MID tag quality value <20. We then trimmed the 30 lowest quality tails, leaving three
continuous sequences with a minimum quality value of 20. DNA barcoding was performed for
each filtered sequence through a global BLAST search using BLAST2Go [40]. We identified a
prey fish and a prey mollusk by referring to the National Center for Biotechnology Informa-
tion (NCBI) sequence database. The correspondence of each sequence to the reference
sequences was estimated based on the BLASTN algorithm with an E-value threshold of
<10−25. Almost none of the 16S sequences for mollusk detection could be assigned using this
threshold; therefore, the match of each 16S sequence to the reference sequences was estimated
using an E-value threshold of<10−5. We accepted genera of the species assigned the lowest E-
value and highest similarity score [41]. We identified samples to the genus level, even if some
sequences matched at the species level, because the current sequence database does not include
all prey species known to be distributed in the wedge-tailed shearwater foraging range and
because knowledge of these prey species is incomplete. Therefore, species-level identification
of prey species at our study site might be unreliable, and we cannot determine whether species
that are top hits in BLAST are prey or related species that share 12S or 16S sequences. The
development of a comprehensive species list and sequence database for the waters surrounding
the Ogasawara Islands might enable future studies to estimate prey to the species level.
If two or more taxa were assigned the same score for a given sequence, the sequence was
assigned to the lowest taxonomic level that included both taxa. Following identification of prey
taxa, we categorized each prey taxon into its habitat group, i.e., epipelagic, mesopelagic, ben-
thic, bathypelagic, or reef, using “Fishes of Japan with pictorial key to the species” [42] as a
reference.
Statistical analysis
To avoid misidentification of prey due to sequencing errors and contamination, we selected a
threshold for removing prey with low read frequencies (<2% in each sample) based on the
results of preliminary experiments on food-controlled fecal samples. This threshold was within
a valid range established in previous studies [18,45]. Rarefaction curves were used to confirm
the sufficiency of obtained sequences and sampling effort using the vegan package [46] in the
R ver.3.2.2 software [47]. Read-based rarefaction curves were created by performing repeated
random resampling of the pool of N reads and then plotting the average number of operational
taxonomic units (OTUs) detected in each group of reads. According to the read-based rarefac-
tion curves, 10 reads were predicted to cover most of the potential OTUs. We retained samples
containing more than nine reads. To eliminate the effects of variation in the reads among
Diet analysis of wedge-tailed shearwaters by DNA metabarcoding
PLOS ONE | https://doi.org/10.1371/journal.pone.0195385 April 9, 2018 4 / 18
samples, we equalized the number of reads per sample to 10. Next, we created sample-based
rarefaction curves for each period. After that, we calculated the relative read abundance of the
sequences (RRA) and the frequency of occurrence (FOO). Although the proportion of
sequence reads may not have correctly reflected the mass of consumed prey due to differences
in prey DNA density and survival of DNA during digestion [48], it was reported in previous
diet studies that the sequences of prey taxa that were fed in a large amounts were frequently
detected [49–51]. In addition, some studies have suggested that the proportion of sequences
provides semi-quantitative data [52,53]. The frequency of sequence reads is also used to reduce
the probability of misidentification by recognizing secondary ingestion, i.e., food items con-
sumed by prey species [54]. We calculated the sequence rates of each food taxon in each sam-
ple, and then performed a hierarchical cluster analysis of the sequence rates of fishes and
mollusks using Ward’s method. To visualize diet composition distances among fecal samples,
we used nonmetric multidimensional scaling (NMDS) in the vegan package.
Results
Identification of fishes and mollusks in feces using the 12S and 16S regions
We obtained 125,040 reads (105–121 bp) from the 12S region targeting fishes and 28,235 reads
(102–143 bp) from the 16S region targeting mollusks. After excluding sequence errors and
sequences identified as non-prey items (birds, non-oceanic species, and human beings),
86,666 reads of the 12S region (fish) and 28,218 reads of the 16S region (mollusks) remained.
There were 26 samples from the prebreeding period with more than nine reads of 12S se-
quences, 18 samples from the prebreeding period with more than nine reads of 16S sequences,
89 samples from the rearing period with more than nine reads of 12S sequences, and 44 sam-
ples from the rearing period with more than nine reads of 16S sequences. According to the rar-
efaction curves, most samples converged (S1 Fig), and the number of samples may have been
sufficient (S2 Fig). In the 12S region, the assigned OTUs were taxonomically separated into 25
genera, four families, one order, and one superorder of prey fishes (Table 2). In the 16S region,
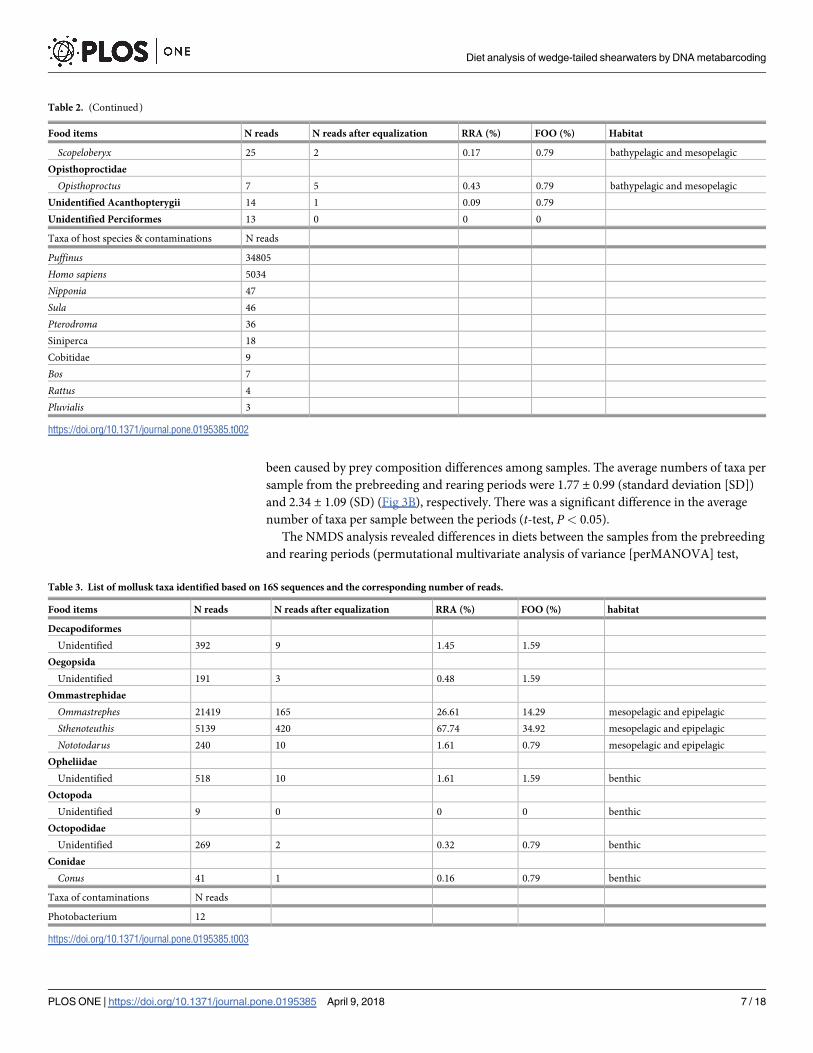
the assigned OTUs were taxonomically separated into three genera, three families, two orders,
and one superorder of prey mollusks (Table 3).
Diet comparisons between the prebreeding and rearing periods
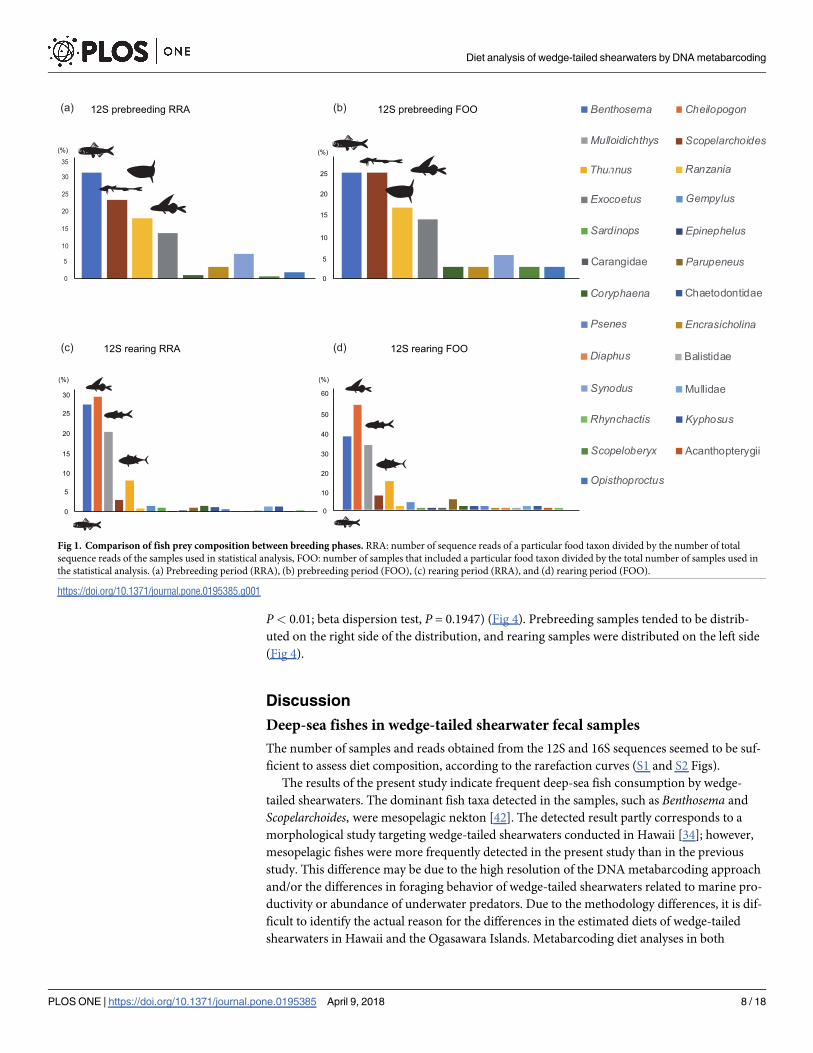
During the prebreeding period, Benthosema (RRA = 31.15%, FOO = 25.71%), Scopelarchoides(RRA = 23.08%, FOO = 25.71%), Ranzania (RRA = 17.69%, FOO = 17.14%), and Exocoetus(RRA = 13.49%, FOO = 14.29%) were the major fish prey items, accounting for approximately
85% of all sequences (Fig 1A and 1B). Scopelarchoides and Benthosema are deep-sea fishes [42],
and these results therefore indicate frequent consumption of deep-sea fishes by wedge-tailed
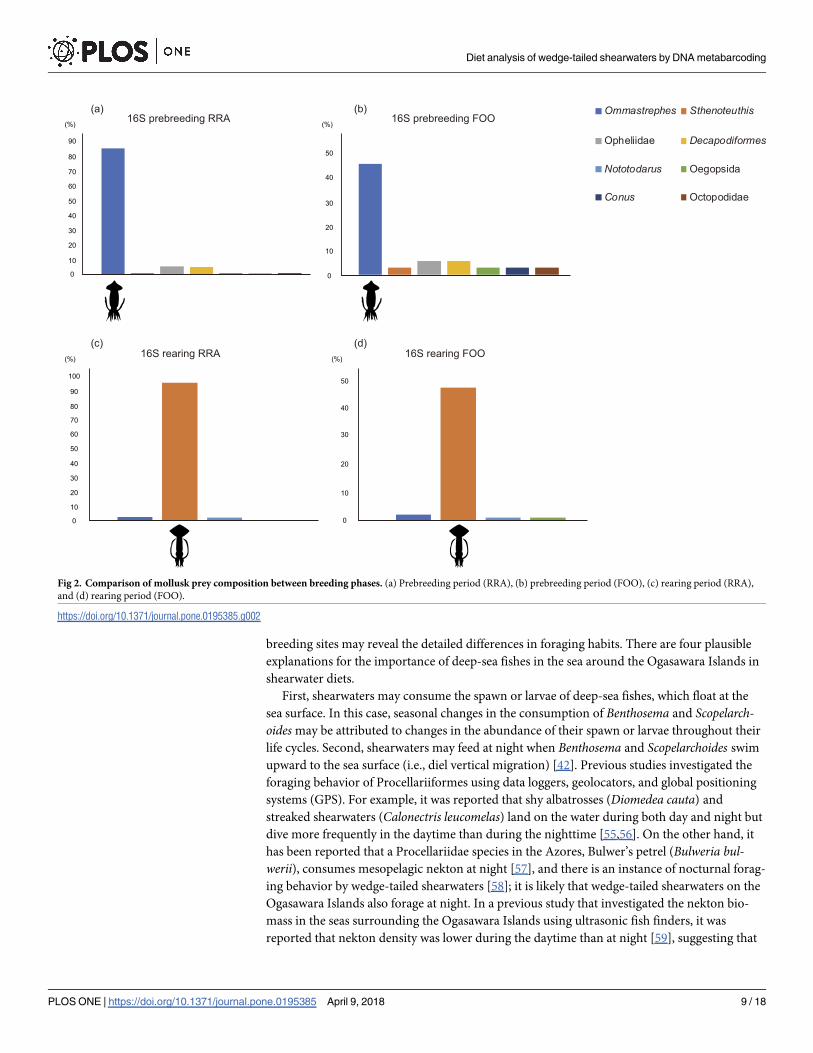
shearwaters. Ommastrephes accounted for nearly all mollusk prey (RRA = 85.56%, FOO =
45.71%) (Fig 2A and 2B). During the rearing period, diet composition was distinct from that
during the prebreeding period. Cheilopogon (RRA = 29.66%, FOO = 54.95%), Benthosema(RRA = 27.64%, FOO = 38.46%),Mulloidichthys (RRA = 20.56%, FOO = 34. 07%), and Thun-nus (RRA = 8.09%, FOO = 15.38%) comprised the main fish prey items, accounting for
approximately 86% of all sequences (Fig 1C and 1D). Sthenoteuthis accounted for the most
mollusk prey species (RRA = 95.00%, FOO = 47.25%) (Fig 2C and 2D).
Variation in prey composition among fecal samples
Inter-feces variability of the prey composition was assessed using cluster analysis, and all fecal
samples were roughly divided into two clusters (Fig 3A). The observed variability may have
Diet analysis of wedge-tailed shearwaters by DNA metabarcoding
PLOS ONE | https://doi.org/10.1371/journal.pone.0195385 April 9, 2018 5 / 18
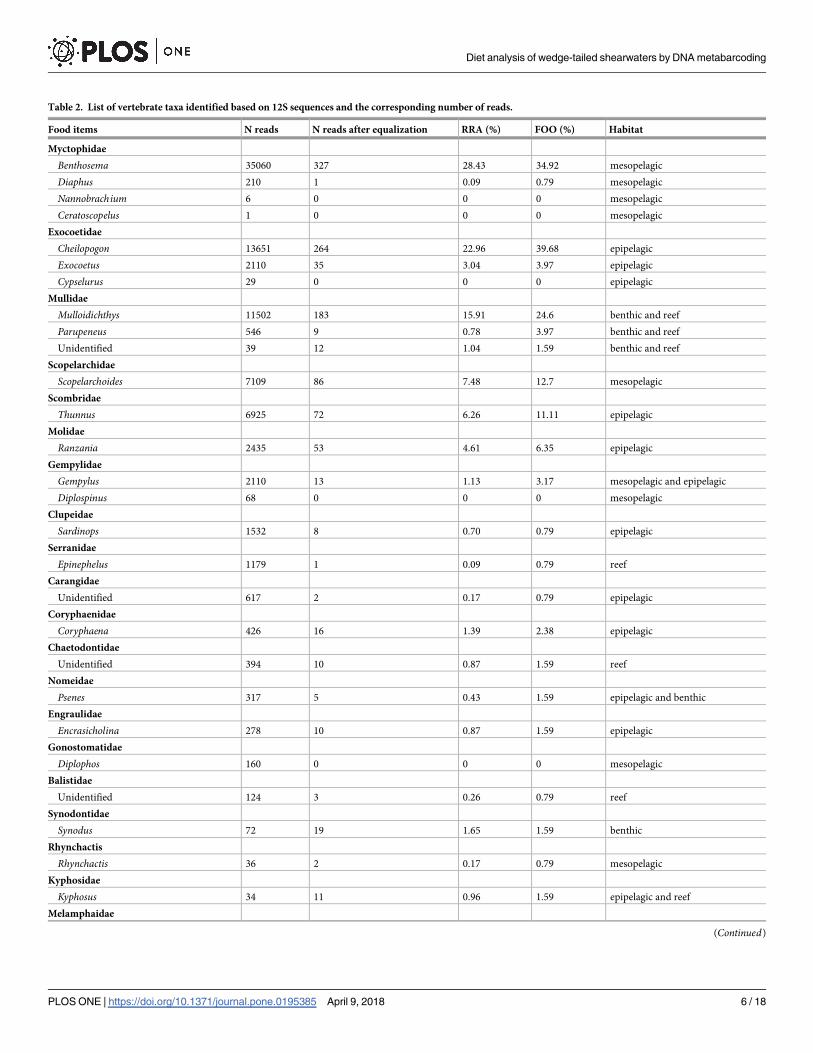
Table 2. List of vertebrate taxa identified based on 12S sequences and the corresponding number of reads.
Food items N reads N reads after equalization RRA (%) FOO (%) Habitat
Myctophidae
Benthosema 35060 327 28.43 34.92 mesopelagic
Diaphus 210 1 0.09 0.79 mesopelagic
Nannobrachium 6 0 0 0 mesopelagic
Ceratoscopelus 1 0 0 0 mesopelagic
Exocoetidae
Cheilopogon 13651 264 22.96 39.68 epipelagic
Exocoetus 2110 35 3.04 3.97 epipelagic
Cypselurus 29 0 0 0 epipelagic
Mullidae
Mulloidichthys 11502 183 15.91 24.6 benthic and reef
Parupeneus 546 9 0.78 3.97 benthic and reef
Unidentified 39 12 1.04 1.59 benthic and reef
Scopelarchidae
Scopelarchoides 7109 86 7.48 12.7 mesopelagic
Scombridae
Thunnus 6925 72 6.26 11.11 epipelagic
Molidae
Ranzania 2435 53 4.61 6.35 epipelagic
Gempylidae
Gempylus 2110 13 1.13 3.17 mesopelagic and epipelagic
Diplospinus 68 0 0 0 mesopelagic
Clupeidae
Sardinops 1532 8 0.70 0.79 epipelagic
Serranidae
Epinephelus 1179 1 0.09 0.79 reef
Carangidae
Unidentified 617 2 0.17 0.79 epipelagic
Coryphaenidae
Coryphaena 426 16 1.39 2.38 epipelagic
Chaetodontidae
Unidentified 394 10 0.87 1.59 reef
Nomeidae
Psenes 317 5 0.43 1.59 epipelagic and benthic
Engraulidae
Encrasicholina 278 10 0.87 1.59 epipelagic
Gonostomatidae
Diplophos 160 0 0 0 mesopelagic
Balistidae
Unidentified 124 3 0.26 0.79 reef
Synodontidae
Synodus 72 19 1.65 1.59 benthic
Rhynchactis
Rhynchactis 36 2 0.17 0.79 mesopelagic
Kyphosidae
Kyphosus 34 11 0.96 1.59 epipelagic and reef
Melamphaidae
(Continued)
Diet analysis of wedge-tailed shearwaters by DNA metabarcoding
PLOS ONE | https://doi.org/10.1371/journal.pone.0195385 April 9, 2018 6 / 18
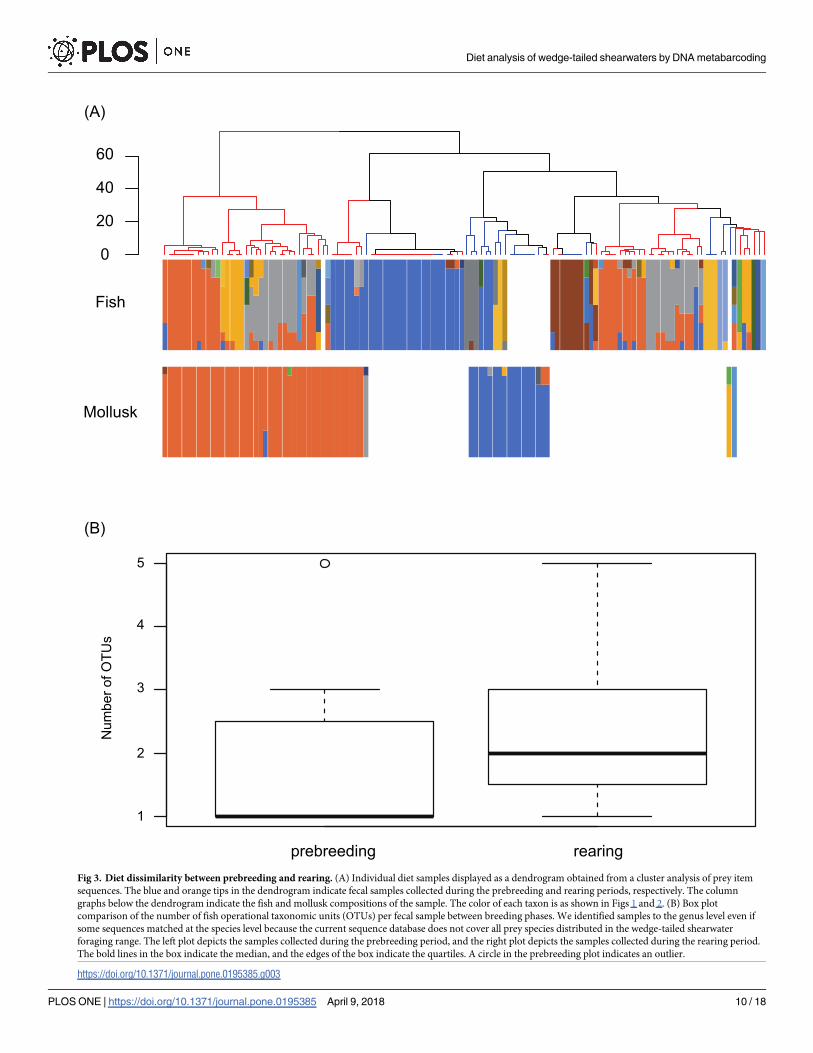
been caused by prey composition differences among samples. The average numbers of taxa per
sample from the prebreeding and rearing periods were 1.77 ± 0.99 (standard deviation [SD])
and 2.34 ± 1.09 (SD) (Fig 3B), respectively. There was a significant difference in the average
number of taxa per sample between the periods (t-test, P< 0.05).
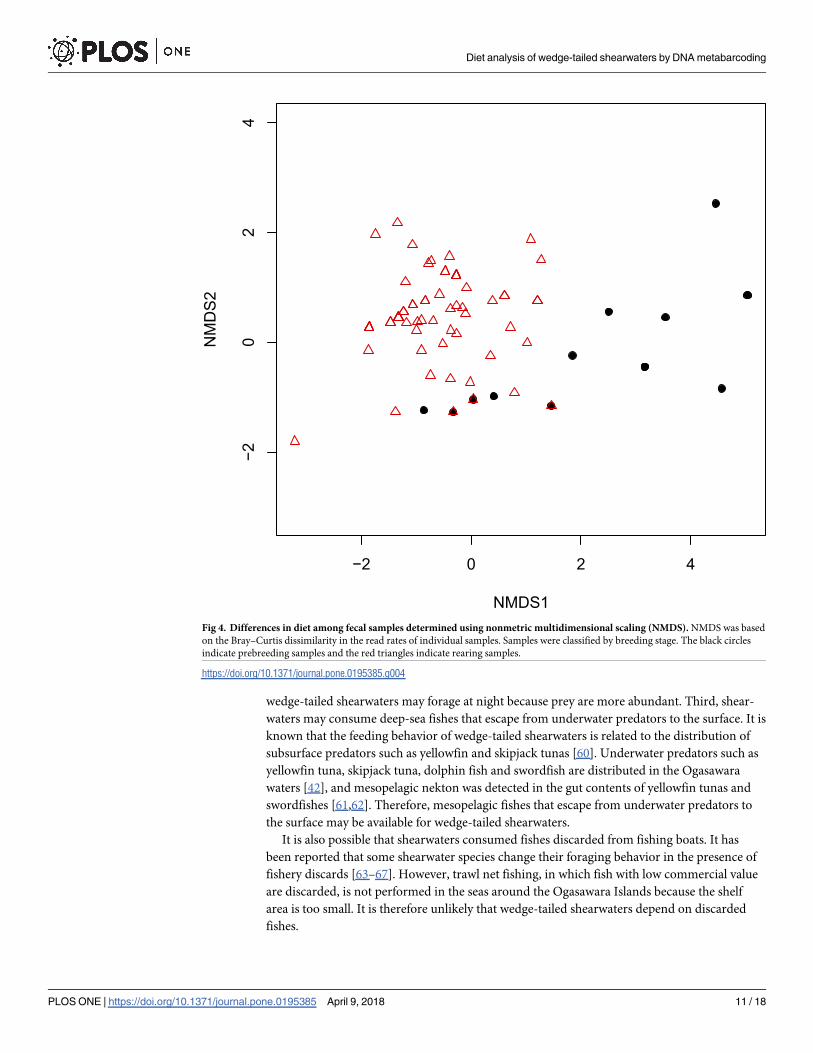
The NMDS analysis revealed differences in diets between the samples from the prebreeding
and rearing periods (permutational multivariate analysis of variance [perMANOVA] test,
Table 2. (Continued)
Food items N reads N reads after equalization RRA (%) FOO (%) Habitat
Scopeloberyx 25 2 0.17 0.79 bathypelagic and mesopelagic
Opisthoproctidae
Opisthoproctus 7 5 0.43 0.79 bathypelagic and mesopelagic
Unidentified Acanthopterygii 14 1 0.09 0.79
Unidentified Perciformes 13 0 0 0
Taxa of host species & contaminations N reads
Puffinus 34805
Homo sapiens 5034
Nipponia 47
Sula 46
Pterodroma 36
Siniperca 18
Cobitidae 9
Bos 7
Rattus 4
Pluvialis 3
https://doi.org/10.1371/journal.pone.0195385.t002
Table 3. List of mollusk taxa identified based on 16S sequences and the corresponding number of reads.
Food items N reads N reads after equalization RRA (%) FOO (%) habitat
Decapodiformes
Unidentified 392 9 1.45 1.59
Oegopsida
Unidentified 191 3 0.48 1.59
Ommastrephidae
Ommastrephes 21419 165 26.61 14.29 mesopelagic and epipelagic
Sthenoteuthis 5139 420 67.74 34.92 mesopelagic and epipelagic
Nototodarus 240 10 1.61 0.79 mesopelagic and epipelagic
Opheliidae
Unidentified 518 10 1.61 1.59 benthic
Octopoda
Unidentified 9 0 0 0 benthic
Octopodidae
Unidentified 269 2 0.32 0.79 benthic
Conidae
Conus 41 1 0.16 0.79 benthic
Taxa of contaminations N reads
Photobacterium 12
https://doi.org/10.1371/journal.pone.0195385.t003
Diet analysis of wedge-tailed shearwaters by DNA metabarcoding
PLOS ONE | https://doi.org/10.1371/journal.pone.0195385 April 9, 2018 7 / 18
P< 0.01; beta dispersion test, P = 0.1947) (Fig 4). Prebreeding samples tended to be distrib-
uted on the right side of the distribution, and rearing samples were distributed on the left side
(Fig 4).
Discussion
Deep-sea fishes in wedge-tailed shearwater fecal samples
The number of samples and reads obtained from the 12S and 16S sequences seemed to be suf-
ficient to assess diet composition, according to the rarefaction curves (S1 and S2 Figs).
The results of the present study indicate frequent deep-sea fish consumption by wedge-
tailed shearwaters. The dominant fish taxa detected in the samples, such as Benthosema and
Scopelarchoides, were mesopelagic nekton [42]. The detected result partly corresponds to a
morphological study targeting wedge-tailed shearwaters conducted in Hawaii [34]; however,
mesopelagic fishes were more frequently detected in the present study than in the previous
study. This difference may be due to the high resolution of the DNA metabarcoding approach
and/or the differences in foraging behavior of wedge-tailed shearwaters related to marine pro-
ductivity or abundance of underwater predators. Due to the methodology differences, it is dif-
ficult to identify the actual reason for the differences in the estimated diets of wedge-tailed
shearwaters in Hawaii and the Ogasawara Islands. Metabarcoding diet analyses in both
OOF gnideerberp S21ARR gnideerberp S21
OOF gniraer S21ARR gniraer S21
0
10
20
15
5
25
30 25
(%)
0
10
5
15
20
(%)
35
(%)(%)
30
0
20
10
25
15
5
50
0
40
20
30
10
60
Fig 1. Comparison of fish prey composition between breeding phases. RRA: number of sequence reads of a particular food taxon divided by the number of total
sequence reads of the samples used in statistical analysis, FOO: number of samples that included a particular food taxon divided by the total number of samples used in
the statistical analysis. (a) Prebreeding period (RRA), (b) prebreeding period (FOO), (c) rearing period (RRA), and (d) rearing period (FOO).
https://doi.org/10.1371/journal.pone.0195385.g001
Diet analysis of wedge-tailed shearwaters by DNA metabarcoding
PLOS ONE | https://doi.org/10.1371/journal.pone.0195385 April 9, 2018 8 / 18
breeding sites may reveal the detailed differences in foraging habits. There are four plausible
explanations for the importance of deep-sea fishes in the sea around the Ogasawara Islands in
shearwater diets.
First, shearwaters may consume the spawn or larvae of deep-sea fishes, which float at the
sea surface. In this case, seasonal changes in the consumption of Benthosema and Scopelarch-oidesmay be attributed to changes in the abundance of their spawn or larvae throughout their
life cycles. Second, shearwaters may feed at night when Benthosema and Scopelarchoides swim
upward to the sea surface (i.e., diel vertical migration) [42]. Previous studies investigated the
foraging behavior of Procellariiformes using data loggers, geolocators, and global positioning
systems (GPS). For example, it was reported that shy albatrosses (Diomedea cauta) and
streaked shearwaters (Calonectris leucomelas) land on the water during both day and night but
dive more frequently in the daytime than during the nighttime [55,56]. On the other hand, it
has been reported that a Procellariidae species in the Azores, Bulwer’s petrel (Bulweria bul-werii), consumes mesopelagic nekton at night [57], and there is an instance of nocturnal forag-
ing behavior by wedge-tailed shearwaters [58]; it is likely that wedge-tailed shearwaters on the
Ogasawara Islands also forage at night. In a previous study that investigated the nekton bio-
mass in the seas surrounding the Ogasawara Islands using ultrasonic fish finders, it was
reported that nekton density was lower during the daytime than at night [59], suggesting that
OOF gnideerberp S61ARR gnideerberp S61
OOF gniraer S61ARR gniraer S61
)b()a(
)d()c(
90
80
70
60
50
40
30
20
10
0
(%)
40
30
20
10
0
50
80
70
60
50
40
30
20
10
0
90
100
(%)
(%) (%)
40
30
20
10
0
50
Ommastrephes Sthenoteuthis
Opheliidae Decapodiformes
Nototodarus Oegopsida
Conus Octopodidae
Fig 2. Comparison of mollusk prey composition between breeding phases. (a) Prebreeding period (RRA), (b) prebreeding period (FOO), (c) rearing period (RRA),
and (d) rearing period (FOO).
https://doi.org/10.1371/journal.pone.0195385.g002
Diet analysis of wedge-tailed shearwaters by DNA metabarcoding
PLOS ONE | https://doi.org/10.1371/journal.pone.0195385 April 9, 2018 9 / 18
60
40
20
0
Fish
Mollusk
(A)
gniraergnideerberp
Num
ber o
f OTU
s
5
4
3
2
1
(B)
Fig 3. Diet dissimilarity between prebreeding and rearing. (A) Individual diet samples displayed as a dendrogram obtained from a cluster analysis of prey item
sequences. The blue and orange tips in the dendrogram indicate fecal samples collected during the prebreeding and rearing periods, respectively. The column
graphs below the dendrogram indicate the fish and mollusk compositions of the sample. The color of each taxon is as shown in Figs 1 and 2. (B) Box plot
comparison of the number of fish operational taxonomic units (OTUs) per fecal sample between breeding phases. We identified samples to the genus level even if
some sequences matched at the species level because the current sequence database does not cover all prey species distributed in the wedge-tailed shearwater
foraging range. The left plot depicts the samples collected during the prebreeding period, and the right plot depicts the samples collected during the rearing period.
The bold lines in the box indicate the median, and the edges of the box indicate the quartiles. A circle in the prebreeding plot indicates an outlier.
https://doi.org/10.1371/journal.pone.0195385.g003
Diet analysis of wedge-tailed shearwaters by DNA metabarcoding
PLOS ONE | https://doi.org/10.1371/journal.pone.0195385 April 9, 2018 10 / 18
wedge-tailed shearwaters may forage at night because prey are more abundant. Third, shear-
waters may consume deep-sea fishes that escape from underwater predators to the surface. It is
known that the feeding behavior of wedge-tailed shearwaters is related to the distribution of
subsurface predators such as yellowfin and skipjack tunas [60]. Underwater predators such as
yellowfin tuna, skipjack tuna, dolphin fish and swordfish are distributed in the Ogasawara
waters [42], and mesopelagic nekton was detected in the gut contents of yellowfin tunas and
swordfishes [61,62]. Therefore, mesopelagic fishes that escape from underwater predators to
the surface may be available for wedge-tailed shearwaters.
It is also possible that shearwaters consumed fishes discarded from fishing boats. It has
been reported that some shearwater species change their foraging behavior in the presence of
fishery discards [63–67]. However, trawl net fishing, in which fish with low commercial value
are discarded, is not performed in the seas around the Ogasawara Islands because the shelf
area is too small. It is therefore unlikely that wedge-tailed shearwaters depend on discarded
fishes.
−2 0 2 4
−20
24
NMDS1
NMDS2
Fig 4. Differences in diet among fecal samples determined using nonmetric multidimensional scaling (NMDS). NMDS was based
on the Bray–Curtis dissimilarity in the read rates of individual samples. Samples were classified by breeding stage. The black circles
indicate prebreeding samples and the red triangles indicate rearing samples.
https://doi.org/10.1371/journal.pone.0195385.g004
Diet analysis of wedge-tailed shearwaters by DNA metabarcoding
PLOS ONE | https://doi.org/10.1371/journal.pone.0195385 April 9, 2018 11 / 18
Benthosema and Scopelarchoides were detected in high frequencies throughout the sampling
season, and the prey items held the first and second highest ranks during the prebreeding
period, and the second and fifth ranks during the rearing period according to both RRA and
FOO indicators (Fig 1). This result indicates that deep-sea fishes are stable and important food
resources for wedge-tailed shearwaters.
Squids found in wedge-tailed shearwater feces
The taxa that accounted for the largest proportion of mollusk prey, Ommastrephes and Stheno-teuthis, both belong to the family Ommastrephidae. A previous study collected large numbers
of families such as Enoploteuthidae and Cranchiidae by trawl nets in seas adjacent to the Ogasa-
wara Islands [59]. However, these families were not detected in the present study. To confirm
whether these families can be amplified by the universal primer used in this study, we analyzed
the 16S sequence data of 10 species each of Enoploteuthidae and Cranchiidae selected from the
NCBI database. In all species, except for one from each family, all sequences included the uni-
versal primer sequence. This result suggests that wedge-tailed shearwaters selectively consumed
Ommastrephidae. In actuality, this result corresponds to a previous study that targeted wedge-
tailed shearwaters in Hawaii [34]. However, no comprehensive sequence database includes all
local mollusk species from the Ogasawara Islands. Thus, we could not determine whether some
Enoploteuthidae and Cranchiidae species went undetected due to primer mismatches. Further
development of the nucleotide database may improve the accuracy of these results.
Diet comparisons between the prebreeding and rearing periods
Several studies using geo-locators or GPS have revealed seasonal shifts in foraging behavior in
marine birds [68–71]. For example, the durations of foraging excursions of Manx shearwaters
(Puffinus puffinus) varied greatly with breeding stage [69], and the foraging trip distance of
short-tailed shearwaters (Puffinus tenuirostris) was shorter during the rearing period [68].
However, few studies have targeted the diet of shearwaters during the prebreeding period.
This study detected detailed diet information during the prebreeding period and observed dif-
ferences between the prebreeding period and the rearing period. In the present study, the
number of taxa detected per fecal sample during the rearing period was significantly higher
than that during the prebreeding period (Fig 3B). The results of the NMDS analysis also indi-
cated dietary dissimilarities between the prebreeding and rearing periods (Fig 4). Furthermore,
all fecal samples were roughly divided into two main clusters, and fecal samples collected dur-
ing the rearing period were lightly dispersed in the cluster analysis (Fig 3A). We deduced three
plausible reasons for the cluster separation and the dispersion of rearing period samples: (a)
seasonal fluctuations in the available prey resources, (b) variations in the foraging range of the
wedge-tailed shearwater, and (c) a seasonal change in prey selection. The plausible reasons for
the differences in the cluster dispersion between the prebreeding period and rearing period are
described in the following paragraphs.
Although more information about the distribution and biomass of fishes and mollusks
around the Ogasawara Islands is required, we can speculate that there are relationships
between shearwater diet composition and the seasonal availability of prey. Exocoetidae genera,
such as Exocoetus and Cheilopogon, were among the dominant fish prey taxa, which were also
detected in some morphological studies [34,72]. Exocoetuswas mainly detected during the pre-
breeding period, and Cheilopogon was detected during the rearing period. The Exocoetidae
genera that were detected in the present study inhabit seas adjacent to the Ogasawara Islands
[73]; however, the ecology of each Exocoetidae species is not well known. Seasonal differences
among the detected Exocoetidae genera may reflect different patterns of migration and/or
Diet analysis of wedge-tailed shearwaters by DNA metabarcoding
PLOS ONE | https://doi.org/10.1371/journal.pone.0195385 April 9, 2018 12 / 18
spawning. Large fishes were also detected, such as Ranzania during the prebreeding period
and Thunnus during the rearing period. It appears that shearwaters may have fed upon the
spawn, larvae, or carcasses of these large fishes, and their spawning periods may, therefore,
have affected shearwater diet composition. The composition of staple mollusk prey also clearly
differed between the prebreeding and rearing periods. According to Ando et al. (2004),
Ommastrephes bartrami in the North Pacific Ocean is separated into spring and autumn popu-
lations [74]. The spring population spawns and hatches from winter to spring and migrates to
the seas surrounding the Ogasawara Islands from January to June. The autumn population
spawns and hatches from summer to autumn and migrates to the Ogasawara Islands from
October to December [74]. Wedge-tailed shearwaters could have consumed mainly the spring
population of Ommastrephes, and samples detected in feces collected during the rearing period
may have belonged to early-arriving members of the autumn population. In a previous fishery
report, Sthenoteuthis oualaniensis was caught from September to December [74], and this spe-
cies is assumed to be an important resource for seabirds in the Ogasawara area. Indeed, Sthe-noteuthis sequences dominated during the rearing period.
Changes in foraging range may be another important factor that contributes to the seasonal
shift in diet composition. Streaked shearwaters (Calonectris leucomelas), which are widely dis-
tributed around Japanese islands, change their foraging areas in response to seasonal changes
in the marine environment [70]. There are also some studies targeting wedge-tailed shearwa-
ters at other breeding sites [60,75–77]. It is known that wedge-tailed shearwaters change forag-
ing areas and strategies depending on the purpose of foraging, whether it is provision for
themselves or their chicks [60,76]. In the case of this study, cluster analysis suggested that prey
items detected from fecal samples from the rearing period were more diverse than those from
the prebreeding period (Fig 3A and 3B). This result may indicate that wedge-tailed shearwaters
needed to forage for a variety of prey items or expand their foraging area, perhaps because
prey biomass decreased during the rearing period [78] or the nutrient requirements of chicks
changed [79]. It is known that wedge-tailed shearwaters perform dual foraging excursion,
which is a combination of long and short trips [75,77]. Increases in prey diversity during the
rearing period may be caused by dual foraging excursions.
Variation in prey selection may also affect the seasonal differences in prey composition.
Plasticity of prey selection in relation to prey availability and provision for themselves or their
chicks has been identified in some species of seabirds [80,81], and this plasticity is possible for
wedge-tailed shearwaters. Differences in major prey items between the two seasons may also
reflect changes in shearwater foraging range and/or prey selection. Further analysis of available
food resources and tracking foraging behavior may improve our understanding of wedge-
tailed shearwater foraging strategies.
Conclusion
In the present study, we estimated the composition of the wedge-tailed shearwater diet using a
DNA metabarcoding approach. Based on this method, we filled gaps in the current knowledge
of the shearwater diet during the prebreeding period. Our results indicate the importance of
deep-sea fishes as stable food resources for shearwaters throughout the sampling seasons,
although diet composition significantly differed between the prebreeding and rearing periods.
Further investigations by tracking individual foraging behavior may improve our knowledge
of wedge-tailed shearwater diet composition as it relates to foraging strategies.
The DNA metabarcoding approach is sensitive, and its application to fecal samples does
not disturb seabirds because it is noninvasive, which facilitates diet monitoring. Long-term
and wide-ranging studies of seabird diets using DNA metabarcoding may be useful for
Diet analysis of wedge-tailed shearwaters by DNA metabarcoding
PLOS ONE | https://doi.org/10.1371/journal.pone.0195385 April 9, 2018 13 / 18

detecting changes in marine ecosystems and/or investigating the potential impacts of fisheries
and climate changes.
Supporting information
S1 Fig. Rarefaction curves for each region and breeding phase. The effect of the sequencing
effort on the estimated number of operational taxonomic units (OTUs). Each curve indicates a
fecal sample, and numbers near the curves indicate the number of overlapping samples. (a)
The 12S region targeting fishes during the prebreeding period, (b) the 12S region targeting
fishes during the rearing period, (c) the 16S region targeting mollusks during the prebreeding
period, and (d) the 16S region targeting mollusks during the rearing period.
(EPS)
S2 Fig. Sample-based rarefaction curves for each breeding phase. The effect of fecal sam-
pling effort on the estimated number of OTUs in the 12S and 16S regions. The shaded areas
represent confidence intervals, and the curves within the shaded areas represent the average
number of OTUs determined by random sampling. (a) Prebreeding period; (b) rearing period.
(EPS)
Acknowledgments
We are deeply grateful to A. Izuno and N. Nakahama for advice on laboratory techniques and
analyses. We also thank T. Furuta for assistance with DNA extraction, K. Kawakami for advice
on sample collection, and N. Suzuki for sample collection assistance. We also thank H. Alonso
and an anonymous reviewer for their valuable advice on a previous version of the manuscript.
This study was conducted as part of the monitoring program of the natural environment on
Minamijima Island in Ogasawara National Park by the Tokyo Metropolitan Government.
Author Contributions
Conceptualization: Taketo Komura, Kazuo Horikoshi.
Data curation: Taketo Komura.
Formal analysis: Taketo Komura.
Funding acquisition: Kazuo Horikoshi.
Investigation: Taketo Komura, Kazuo Horikoshi, Hajime Suzuki.
Methodology: Taketo Komura, Haruko Ando.
Project administration: Taketo Komura, Kazuo Horikoshi.
Resources: Taketo Komura.
Supervision: Yuji Isagi.
Visualization: Taketo Komura.
Writing – original draft: Taketo Komura.
Writing – review & editing: Haruko Ando, Yuji Isagi.
References1. Boyd IL, Murray AWA. Monitoring a marine ecosystem using responses of upper trophic level predators.
J Anim Ecol. Wiley Online Library; 2001; 70: 747–760.
Diet analysis of wedge-tailed shearwaters by DNA metabarcoding
PLOS ONE | https://doi.org/10.1371/journal.pone.0195385 April 9, 2018 14 / 18
2. Bost CA, Le Maho Y. Seabirds as bio-indicators of changing marine ecosystems: new perspectives.
Acta. 1993; 14: 463–470.
3. Diamond AW, Devlin CM. Seabirds as indicators of changes in marine ecosystems: ecological monitor-
ing on Machias Seal Island. Environ Monit Assess. Springer; 2003; 88: 153–181. PMID: 14570414
4. Einoder LD. A review of the use of seabirds as indicators in fisheries and ecosystem management. Fish
Res. Elsevier; 2009; 95: 6–13.
5. Hobson KA, Piatt JF, Pitocchelli J. Using stable isotopes to determine seabird trophic relationships. J
Anim Ecol. JSTOR; 1994; 786–798.
6. Raymond B, Shaffer SA, Sokolov S, Woehler EJ, Costa DP, Einoder L, et al. Shearwater foraging in the
Southern Ocean: the roles of prey availability and winds. PLoS One. Public Library of Science; 2010; 5:
e10960. https://doi.org/10.1371/journal.pone.0010960 PMID: 20532034
7. Barrett RT, Camphuysen KCJ, Anker-Nilssen T, Chardine JW, Furness RW, Garthe S, et al. Diet stud-
ies of seabirds: a review and recommendations. ICES J Mar Sci J du Cons. Oxford University Press;
2007; 64: 1675–1691.
8. De Barba M, Miquel C, Boyer F, Mercier C, Rioux D, Coissac E, et al. DNA metabarcoding multiplexing
and validation of data accuracy for diet assessment: application to omnivorous diet. Mol Ecol Resour.
Wiley Online Library; 2014; 14: 306–323. https://doi.org/10.1111/1755-0998.12188 PMID: 24128180
9. Buglione M, Maselli V, Rippa D, de Filippo G, Trapanese M, Fulgione D. A pilot study on the application
of DNA metabarcoding for non-invasive diet analysis in the Italian hare. Mamm Biol. Elsevier; 2018; 88:
31–42.
10. Valentini A, Miquel C, Nawaz MA, Bellemain EVA, Coissac E, Pompanon F, et al. New perspectives in
diet analysis based on DNA barcoding and parallel pyrosequencing: the trnL approach. Mol Ecol
Resour. Wiley Online Library; 2009; 9: 51–60.
11. Shokralla S, Spall JL, Gibson JF, Hajibabaei M. Next-generation sequencing technologies for environ-
mental DNA research. Mol Ecol. Wiley Online Library; 2012; 21: 1794–1805. https://doi.org/10.1111/j.
1365-294X.2012.05538.x PMID: 22486820
12. Kress WJ, Garcıa-Robledo C, Uriarte M, Erickson DL. DNA barcodes for ecology, evolution, and con-
servation. Trends Ecol Evol. Elsevier Current Trends; 2015; 30: 25–35. https://doi.org/10.1016/j.tree.
2014.10.008 PMID: 25468359
13. Jarman SN, McInnes JC, Faux C, Polanowski AM, Marthick J, Deagle BE, et al. Adelie penguin popula-
tion diet monitoring by analysis of food DNA in scats. PLoS One. Public Library of Science; 2013; 8:
e82227. https://doi.org/10.1371/journal.pone.0082227 PMID: 24358158
14. Peters KJ, Ophelkeller K, Bott NJ, Deagle BE, Jarman SN, Goldsworthy SD. Fine-scale diet of the Aus-
tralian sea lion (Neophoca cinerea) using DNA-based analysis of faeces. Mar Ecol. Wiley Online
Library; 2015; 36: 347–367.
15. Waap S. Trophic relationships among pelagic predators of the deep seas of the Madeira Islands. Car-
diff University; 2015.
16. Alonso H, Granadeiro JP, Waap S, Xavier J, Symondson WOC, Ramos JA, et al. An holistic ecological
analysis of the diet of Cory’s shearwaters using prey morphological characters and DNA barcoding. Mol
Ecol. Wiley Online Library; 2014; 23: 3719–3733. https://doi.org/10.1111/mec.12785 PMID: 24806079
17. Waap S, Symondson WOC, Granadeiro JP, Alonso H, Serra-Goncalves C, Dias MP, et al. The diet of a
nocturnal pelagic predator, the Bulwer’s petrel, across the lunar cycle. Sci Rep. Nature Publishing
Group; 2017; 7: 1384. https://doi.org/10.1038/s41598-017-01312-3 PMID: 28469170
18. McInnes JC, Alderman R, Deagle BE, Lea M, Raymond B, Jarman SN. Optimised scat collection proto-
cols for dietary DNA metabarcoding in vertebrates. Methods Ecol Evol. Wiley Online Library; 2017; 8:
192–202.
19. Brooke M de L. Albatrosses and Petrels Across the World. Oxford: Oxford University Press; 2004.
20. Ornithological Society of Japan. Check-list of Japanese birds. 7th ed. Gakken; 2012.
21. Polovina JJ, Howell EA, Abecassis M. Ocean’s least productive waters are expanding. Geophys Res
Lett. Wiley Online Library; 2008; 35. https://doi.org/10.1029/2008gl035090 PMID: 24347740
22. Blackburn M, Laurs RM, Owen RW, Zeitzschel B. Seasonal and areal changes in standing stocks of
phytoplankton, zooplankton and micronekton in the eastern tropical Pacific. Mar Biol. Springer; 1970; 7:
14–31.
23. Dolganova NT, Zuenko YI. Seasonal and inter-annual dynamics of mesoplankton in the northwestern
Japan Sea. Prog Oceanogr. Elsevier; 2004; 61: 227–243.
24. Brodeur RD, Ralston S, Emmett RL, Trudel M, Auth TD, Phillips AJ. Anomalous pelagic nekton abun-
dance, distribution, and apparent recruitment in the northern California Current in 2004 and 2005. Geo-
phys Res Lett. Wiley Online Library; 2006; 33. https://doi.org/10.1029/2006GL027800 PMID: 19122778
Diet analysis of wedge-tailed shearwaters by DNA metabarcoding
PLOS ONE | https://doi.org/10.1371/journal.pone.0195385 April 9, 2018 15 / 18
25. Granadeiro J. P., Monteiro L. R., & Furness RW. Diet and feeding ecology of Cory’s shearwater Calo-
nectris diomedea in the Azores, north-east Atlantic. Mar Ecol Prog Ser. 1998; 166: 267–276.
26. Hunt GL, Baduini C, Jahncke J. Diets of short-tailed shearwaters in the southeastern Bering Sea. Deep
Sea Res Part II Top Stud Oceanogr. Elsevier; 2002; 49: 6147–6156.
27. Jansen JK, Russell RW, Meyer WR. Seasonal shifts in the provisioning behavior of chinstrap penguins,
Pygoscelis antarctica. Oecologia. Springer; 2002; 131: 306–318. https://doi.org/10.1007/s00442-002-
0880-1 PMID: 28547699
28. Chiba H, Kawakami K, Suzuki H, Horikoshi K. The Distribution of Seabirds in the Bonin Islands, South-
ern Japan. J Yamashina Inst Ornithol. 2007; 39: 1–17. https://doi.org/10.3312/jyio.39.1
29. Kawakami K, Eda M, Horikoshi K, Suzuki H, Chiba H, Hiraoka T. Bryan’s shearwaters have survived on
the Bonin Islands, northwestern Pacific. Condor. 2012; 114: 507–512.
30. BirdLife International. Phoebastria nigripes. (amended version published in 2016). In: The IUCN Red
List of Threatened Species 2017 [Internet]. 2017 [cited 26 Nov 2017]. doi:e.T22698350A111620625
31. Ministry of the Environment. The Japanese Bird Red List. In: Ministry of the Environment [Internet].
2015. Available: http://www.env.go.jp/press/files/jp/28057.pdf
32. Brazil M. Birds of East Asia: eastern China, Taiwan, Korea, Japan, eastern Russia. London: Christo-
pher Helm; 2009.
33. Oehm J, Thalinger B, Eisenkolbl S, Traugott M. Diet analysis in piscivorous birds: What can the addition
of molecular tools offer? Ecol Evol. Wiley Online Library; 2017; 7: 1984–1995. https://doi.org/10.1002/
ece3.2790 PMID: 28331605
34. Harrison CS, Hida TS, Seki MP. Hawaiian seabird feeding ecology. Wildl Monogr. JSTOR; 1983; 3–71.
35. Berry TE, Osterrieder SK, Murray DC, Coghlan ML, Richardson AJ, Grealy AK, et al. DNA metabarcod-
ing for diet analysis and biodiversity: A case study using the endangered AustBerry, Osterrieder T. E.,
Murray S. K., Coghlan D. C., Richardson M. L., Grealy A. J., A. K., . . . Bunce M. (2017). DNA metabar-
coding for diet analysis and biod. Ecol Evol. Wiley Online Library; 2017;
36. Giusti A, Tinacci L, Sotelo CG, Marchetti M, Guidi A, Zheng W, et al. Seafood Identification in Multispe-
cies Products: Assessment of 16SrRNA, cytb, and COI Universal Primers’ Efficiency as a Preliminary
Analytical Step for Setting up Metabarcoding Next-Generation Sequencing Techniques. J Agric Food
Chem. ACS Publications; 2017; 65: 2902–2912. https://doi.org/10.1021/acs.jafc.6b05802 PMID:
28290697
37. Hamady M, Walker JJ, Harris JK, Gold NJ, Knight R. Error-correcting barcoded primers allow hundreds
of samples to be pyrosequenced in multiplex. Nat Methods. NIH Public Access; 2008; 5: 235. https://
doi.org/10.1038/nmeth.1184 PMID: 18264105
38. Shehzad W, Riaz T, Nawaz MA, Miquel C, Poillot C, Shah SA, et al. Carnivore diet analysis based on
next-generation sequencing: application to the leopard cat (Prionailurus bengalensis) in Pakistan. Mol
Ecol. Wiley Online Library; 2012; 21: 1951–1965. https://doi.org/10.1111/j.1365-294X.2011.05424.x
PMID: 22250784
39. Tanabe AS, Toju H. Two new computational methods for universal DNA barcoding: A benchmark using
barcode sequences of bacteria, archaea, animals, fungi, and land plants. PLoS One. Public Library of
Science; 2013; 8: e76910. https://doi.org/10.1371/journal.pone.0076910 PMID: 24204702
40. Conesa A, Gotz S, Garcıa-Gomez JM, Terol J, Talon M, Robles M. Blast2GO: a universal tool for anno-
tation, visualization and analysis in functional genomics research. Bioinformatics. Oxford Univ Press;
2005; 21: 3674–3676. https://doi.org/10.1093/bioinformatics/bti610 PMID: 16081474
41. Craine JM, Angerer JP, Elmore A, Fierer N. Continental-Scale Patterns Reveal Potential for Warming-
Induced Shifts in Cattle Diet. PLoS One. Public Library of Science; 2016; 11: e0161511. https://doi.org/
10.1371/journal.pone.0161511 PMID: 27552104
42. Nakabou T. Fishes of Japan with pictorial key to the species. third edition. Hadano city, Kanagawa:
Tokai University Press: Japan; 2013.
43. Riaz T, Shehzad W, Viari A, Pompanon F, Taberlet P, Coissac E. ecoPrimers: inference of new DNA
barcode markers from whole genome sequence analysis. Nucleic Acids Res. Oxford University Press;
2011; 39: e145–e145. https://doi.org/10.1093/nar/gkr732 PMID: 21930509
44. Connell SC, O’Rorke R, Jeffs AG, Lavery SD. DNA identification of the phyllosoma diet of Jasus
edwardsii and Scyllarus sp. Z. New Zeal J Mar Freshw Res. Taylor & Francis; 2014; 48: 416–429.
45. Stamoulis KA, Friedlander AM, Meyer CG, Fernandez-Silva I, Toonen RJ. Coral reef grazer-benthos
dynamics complicated by invasive algae in a small marine reserve. Sci Rep. Nature Publishing Group;
2017; 7: 43819. https://doi.org/10.1038/srep43819 PMID: 28276458
46. Oksanen J, Blanchet FG, Kindt R, Legendre P, Minchin PR, O’hara RB, et al. Package “vegan.” Com-
munity Ecol Packag version. 2013; 2.
Diet analysis of wedge-tailed shearwaters by DNA metabarcoding
PLOS ONE | https://doi.org/10.1371/journal.pone.0195385 April 9, 2018 16 / 18
47. R Core Team. R: A language and environment for statistical computing. In: R Foundation for Statistical
Computing, Vienna, Austria [Internet]. 2015 [cited 17 May 2017]. Available: https://www.r-project.org/
48. Deagle BE, Tollit DJ. Quantitative analysis of prey DNA in pinniped faeces: potential to estimate diet
composition? Conserv Genet. Springer; 2007; 8: 743–747.
49. Deagle BE, Chiaradia A, McInnes J, Jarman SN. Pyrosequencing faecal DNA to determine diet of little
penguins: is what goes in what comes out? Conserv Genet. Springer; 2010; 11: 2039–2048.
50. Willerslev E, Davison J, Moora M, Zobel M, Coissac E, Edwards ME, et al. Fifty thousand years of Arctic
vegetation and megafaunal diet. Nature. Nature Research; 2014; 506: 47–51. https://doi.org/10.1038/
nature12921 PMID: 24499916
51. Nakahara F, Ando H, Ito H, Murakami A, Morimoto N, Yamasaki M, et al. The applicability of DNA bar-
coding for dietary analysis of sika deer. DNA Barcodes. 2015; 3: 200–206.
52. Bowles E, Schulte PM, Tollit DJ, Deagle BE, Trites AW. Proportion of prey consumed can be deter-
mined from faecal DNA using real-time PCR. Mol Ecol Resour. Wiley Online Library; 2011; 11: 530–
540. https://doi.org/10.1111/j.1755-0998.2010.02974.x PMID: 21481211
53. Pompanon F, Deagle BE, Symondson WOC, Brown DS, Jarman SN, Taberlet P. Who is eating what:
diet assessment using next generation sequencing. Mol Ecol. Wiley Online Library; 2012; 21: 1931–
1950. https://doi.org/10.1111/j.1365-294X.2011.05403.x PMID: 22171763
54. McInnes JC, Alderman R, Lea M, Raymond B, Deagle BE, Phillips RA, et al. High occurrence of jellyfish
predation by black-browed and Campbell albatross identified by DNA metabarcoding. Mol Ecol. Wiley
Online Library; 2017;
55. Hedd A, Gales R, Brothers N, Robertson G. Diving behaviour of the Shy Albatross Diomedea cauta in
Tasmania: initial findings and dive recorder assessment. Ibis (Lond 1859). Wiley Online Library; 1997;
139: 452–460.
56. Matsumoto K, Oka N, Ochi D, Muto F, Satoh TP, Watanuki Y. Foraging behavior and diet of Streaked
Shearwaters Calonectris leucomelas rearing chicks on Mikura Island. Ornithol Sci. BioOne; 2012; 11:
9–19.
57. Neves VC, Nolf D, Clarke MR. Diet of Bulwer’s petrel (Bulweria bulwerii) in the Azores, NE Atlantic.
Waterbirds. BioOne; 2011; 34: 357–362.
58. Gould PJ. Nocturnal feeding of Sterna fuscata and Puffinus pacificus. Condor. JSTOR; 1967; 529.
59. Maeda H. Onoda A. & Tsuchiya K. Fishes and invertebrates collected by trawl net from the waters
around Okinotorisima Island and the Izu-Ogasawara Islands. Tokyo Metrop Res Fish Sci. 2006; 1: 31–
49.
60. Catry T, Ramos JA, Le Corre M, Phillips RA. Movements, at-sea distribution and behaviour of a tropical
pelagic seabird: the wedge-tailed shearwater in the western Indian Ocean. Mar Ecol Prog Ser. JSTOR;
2009; 391: 231–242.
61. Potier M, Marsac F, Cherel Y, Lucas V, Sabatie R, Maury O, et al. Forage fauna in the diet of three large
pelagic fishes (lancetfish, swordfish and yellowfin tuna) in the western equatorial Indian Ocean. Fish
Res. Elsevier; 2007; 83: 60–72.
62. Olson RJ, Duffy LM, Kuhnert PM, Galvan-Magana F, Bocanegra-Castillo N, Alatorre-Ramirez V.
Decadal diet shift in yellowfin tuna Thunnus albacares suggests broad-scale food web changes in the
eastern tropical Pacific Ocean. Mar Ecol Prog Ser. 2014; 497: 157–178.
63. Bartumeus F, Giuggioli L, Louzao M, Bretagnolle V, Oro D, Levin SA. Fishery discards impact on sea-
bird movement patterns at regional scales. Curr Biol. Elsevier; 2010; 20: 215–222. https://doi.org/10.
1016/j.cub.2009.11.073 PMID: 20116250
64. Louzao M, Igual JM, McMinn M, Aguilar JS, Triay R, Oro D. Small pelagic fish, trawling discards and
breeding performance of the critically endangered Balearic shearwater: improving conservation diagno-
sis. Mar Ecol Prog Ser. JSTOR; 2006; 318: 247–254.
65. Bicknell AWJ, Oro D, Camphuysen KCJ, Votier SC. Potential consequences of discard reform for sea-
bird communities. J Appl Ecol. Wiley Online Library; 2013; 50: 649–658.
66. Bourgeois K, Vorenger J, Faulquier L, Legrand J, Vidal E. Diet and contamination of the Yelkouan
Shearwater Puffinus yelkouan in the Hyères archipelago, Mediterranean Basin, France. J Ornithol.
Springer; 2011; 152: 947–953.
67. Gould P, Ostrom P, Walker W. Food of flesh-footed shearwaters Puffinus carneipes associated with
high-seas driftnets in the Central North Pacific Ocean. Emu-Austral Ornithol. Taylor & Francis; 1997;
97: 168–173.
68. Baduini CL, Hunt GL, Pinchuk AI, Coyle KO. Patterns in diet reveal foraging site fidelity of short-tailed
shearwaters in the southeastern Bering Sea. Mar Ecol Prog Ser. 2006; 320.
Diet analysis of wedge-tailed shearwaters by DNA metabarcoding
PLOS ONE | https://doi.org/10.1371/journal.pone.0195385 April 9, 2018 17 / 18

69. Tc Guilford, Meade J, Freeman R, Biro D, Evans T, Bonadonna F, et al. GPS tracking of the foraging
movements of Manx Shearwaters Puffinus puffinus breeding on Skomer Island, Wales. Ibis (Lond
1859). Blackwell Publishing Ltd; 2008; 150: 462–473.
70. Yamamoto T, Takahashi A, Oka N, Iida T, Katsumata N, Sato K, et al. Foraging areas of streaked
shearwaters in relation to seasonal changes in the marine environment of the Northwestern Pacific:
inter-colony and sex-related differences. Mar Ecol Prog Ser. 2011; 424: 191–204.
71. Ramos JA, Rodrigues I, Melo T, Geraldes P, Paiva VH. Variation in ocean conditions affects chick
growth, trophic ecology, and foraging range in Cape Verde Shearwater. Condor. BioOne; 2018; 120:
283–290.
72. Catry T, Ramos JA, Jaquemet S, Faulquier L, Berlincourt M, Hauselmann A, et al. Comparative foraging
ecology of a tropical seabird community of the Seychelles, western Indian Ocean. Mar Ecol Prog Ser.
JSTOR; 2009; 374: 259–272.
73. Kato K. An easy identification method on flyingfishes from the Ogasawara Islands waters, southern
Japan. Tokyo Metrop Res Fish Sci. 2011; 5: 17–32.
74. Ando K. Nishikori K. Tsuchiya K. Kimura J. Maeda H. Kawabe K., & Kakiuchi K. Some Fishery Biologi-
caI Data on Two Flying Squids Ommastrephes bartramii and Sthenoteuthis oualaniensis collected from
the Ogasawara Islands Waters,Southern Japan. Rep Tokyo Metrop Fish Exp Stn. 2004; 213: 23–33.
75. Cecere JG, Calabrese L, Rocamora G, Catoni C. Movement patterns and habitat selection of Wedge-
tailed Shearwaters (Puffinus pacificus) breeding at Aride Island, Seychelles. Waterbirds. BioOne; 2013;
36: 432–437.
76. McDUIE F, Weeks SJ, Miller MGR, Congdon B. Breeding tropical shearwaters use distant foraging
sites when self-provisioning. Mar Ornithol. Pacific Seabird Group; 2015; 43: 123–129.
77. Bond AL, McClelland GTW, Jones IL, Lavers JL, Kyser TK. Stable isotopes confirm community patterns
in foraging among Hawaiian Procellariiformes. Waterbirds. BioOne; 2010; 33: 50–58.
78. Kato K., Kawabe K., Okamura Y., & Kimura J. A fishery biological study on flyingfishes from the Ogasa-
wara Islands waters, southern Japan. Tokyo Metrop Res Fish Sci. 2008; 1–27.
79. Navarro J, Gonzalez-Solıs J, Viscor G. Nutritional and feeding ecology in Cory’s shearwater Calonectris
diomedea during breeding. Mar Ecol Prog Ser. JSTOR; 2007; 351: 261–271.
80. Suryan RM, Irons DB, Kaufman M, Benson J, Jodice PGR, Roby DD, et al. Short-term fluctuations in
forage fish availability and the effect on prey selection and brood-rearing in the black-legged kittiwake
Rissa tridactyla. Mar Ecol Prog Ser. JSTOR; 2002; 236: 273–287.
81. DAVOREN GK, BURGER AE. Differences in prey selection and behaviour during self-feeding and
chick provisioning in rhinoceros auklets. Anim Behav. Elsevier; 1999; 58: 853–863. https://doi.org/10.
1006/anbe.1999.1209 PMID: 10512659
Diet analysis of wedge-tailed shearwaters by DNA metabarcoding
PLOS ONE | https://doi.org/10.1371/journal.pone.0195385 April 9, 2018 18 / 18