direct measurements of floodwater infiltration into shallow alluvial aquifers
TRANSCRIPT
Journal of Hydrology (2007) 344, 157–170
ava i lab le a t www.sc iencedi rec t . com
journal homepage: www.elsevier .com/ locate / jhydrol
Direct measurements of floodwater infiltration intoshallow alluvial aquifers
Ofer Dahan a,*, Yuval Shani a, Yehouda Enzel b, Yoseph Yechieli c,Alex Yakirevich a
a Zuckerberg Institute for Water Research (ZIWR), J. Blaustein Institutes for Desert Research,Ben-Gurion University of the Negev, Sede Boqer Campus 84990, Israelb Institute of Earth Sciences, The Hebrew University of Jerusalem, Israelc Geological Survey of Israel, Jerusalem, Israel
Received 30 August 2006; received in revised form 14 June 2007; accepted 18 June 2007
00do
*
65
KEYWORDSFlood;Infiltration;Vadose zone;Groundwater;Recharge;Arid land
22-1694/$ - see front mattei:10.1016/j.jhydrol.2007.06
Corresponding author. T96909.E-mail address: odahan@b
r ª 200.033
el.: +972
gu.ac.il (
Summary The relationship between floodwater infiltration and groundwater recharge ofa shallow alluvial aquifer in a hyper-arid desert was studied in the Arava valley, Israel. Thestudy implemented an experimental system that simultaneously monitors all three hydro-logical domains controlling the recharge process: (1) floodwater stages on land surface,(2) water-content variations in the deep vadose zone, and (3) groundwater response tothe infiltration. This experimental system makes use of a new technique for installing flex-ible time-domain reflectometry probes for continuous monitoring of the vadose zonemoisture profiles. Water infiltration was monitored in controlled infiltration experimentsand during a natural flood. The monitoring setup allowed real-time tracking of the wet-ting-front propagation velocities and assessment of water fluxes through the vadose zone.The results revealed a complex infiltration process that includes matrix and preferentialflow together with lateral flow.ª 2007 Elsevier B.V. All rights reserved.
Introduction
One of the most important water resources in arid lands isgroundwater from shallow alluvial aquifers. These aquifersare replenished by infiltrating floodwater (Abdulrazzak and
7 Elsevier B.V. All rights reserved
8 6596917; fax: +972 8
O. Dahan).
Morel-Seytoux, 1983; Jacobson et al., 1995; Lange, 2005;Scanlon, 2004; Sorman and Abdulrazzak, 1993). The floodsare generated by intense rain storms and are usually of shortduration, on the order of hours to days (Greenbaum et al.,1998; Murphey et al., 1977; Schick, 1988). In arid environ-ments, stream beds of ephemeral rivers are largely com-posed of permeable, coarse alluvial sediments thatpromote relatively rapid infiltration of floodwater whichthen recharges the local alluvial aquifers (Enzel, 1990;
.

Figure 1 Schematic illustration of the experimental setup.EC, electrical conductivity.
158 O. Dahan et al.
Izbicki, 2002; Izbicki et al., 2000; Scanlon, 2004; Schwartz,2001; Shentsis et al., 1999; Sorman and Abdulrazzak, 1993;Walters, 1990). The increasing demand for water in aridlands requires optimized usage of alluvial aquifers. Accord-ingly, sustainable management of that water resource re-quires proper evaluation of the floodwater-infiltrationprocess and groundwater-replenishment rate (Bueno andLang, 1980; Dalintzkey et al., 1975; Glazer and Dalintzkey,1973; Izbicki, 2002; Mintzker, 1997; Rosenthal, 1995; Sch-wartz, 2001; Sorman and Abdulrazzak, 1993).
Common approaches and methods that are traditionallyused for the investigation of floodwater infiltration andgroundwater recharge are based on the following concepts:(1) the water balance approach calculates infiltration ratesfrom measured transmission losses (Lane et al., 1971; Ler-ner et al., 1990; Osterkamp et al., 1994; Schwartz, 2001;Shentsis et al., 1997; Shentsis et al., 1998a; Shentsiset al., 1998b; Walters, 1990), (2) groundwater-level fluctu-ations provide information on aquifer storage increases as aconsequence of floodwater infiltration (Besbes et al., 1978;Sanford, 2002), (3) chemical and isotopic compositions ofthe water from the surface, vadose zone and groundwaterprovide information on the recharge process through thehydrogeochemical interaction of the different water bodieswith the rock, evaporation rate, ion accumulation and mix-ing ratios of the different water bodies (Adar and Neuman,1988; Adar et al., 1992; Dahan, 1993; Eriksson and Khunaka-sem, 1969; Flint et al., 2002; Izbicki et al., 2000; Plummeret al., 2004; Rosenthal et al., 1990),(4) heat transfer as atracer for water infiltration using the temporal variation inthe soil temperature profile (Bendjoudi et al., 2005; Chevi-ron et al., 2005; Constantz et al., 2003), and (5) numericalmodels, based on the implementation of flow equations(Gheith and Sultan, 2002; Izbicki, 2002; Mazi et al., 2004;McDonald and Harbaugh, 1988; Pilgrim et al., 1988; Pollock,1994; Simunek et al., 1998). Other methods measure theinfiltration rate near land surface using lysimeters (Levittet al., 1999), seepage meters (Lee and Cherry, 1978) orwater-flux meters (Hopmans et al., 2002). These methodspresent a wide range of approaches aimed at investigatingthe infiltration process through the vadose zone. Neverthe-less, most of these methods rely on indirect observations,rather than on direct measurements of the infiltration pro-cess. Data on transmission loss and changes in groundwaterlevel are used to interpret the infiltration process frominformation at the upper and lower boundaries, disregardingthe vadose zone. Models that simulate flow and transport inthe vadose zone are sensitive to the distribution of unknownphysical and hydrological parameters in the subsurface.Methods based on evaluating geochemical and isotopic trac-ers are influenced by long-term processes, which can hardlyaccount for the influence of a single infiltration event thatoccurs on a short time scale.
These limitations led us to a different approach and tothe development of a monitoring system aimed at reducingthe uncertainties in evaluations of recharge processes. Thismonitoring approach provides real-time data from all threehydrological domains (surface, vadose and ground waters)participating in the infiltration process: the surface wateris the upper boundary, the vadose zone links the surfaceto the groundwater below, and the groundwater responseto the recharge event is the lower boundary.
In this manuscript, we present a methodological conceptand results from a study on floodwater infiltration andgroundwater recharge of an alluvial aquifer underlying anephemeral stream in the hyper-arid Arava valley, Israel.The data were recovered from two field-scale infiltrationexperiments and from a small natural flood during 2003and 2004. The methodological concept implemented in thisresearch is designed to continuously monitor: (1) floodstage, (2) the variation in deep vadose water content in re-sponse to floods and (3) the response of water-table levelsand groundwater electrical conductivity (EC) to the re-charge event (Fig. 1). The variations in deep-vadose zonewater contents were continuously monitored using flexibletime-domain reflectometry (FTDR) probes which were spe-cifically designed and constructed for the monitoringscheme (Dahan et al., 2003).
Study area
The study area was located in the central Arava valley, Is-rael (Fig. 2) at an altitude of �100 m below sea level(bsl). The terminal base level of both surface water andgroundwater is the Dead Sea in the north, �420 m bls.The tributaries draining into the Arava from the west andeast are all ephemeral streams. The valley is hyper-arid(precipitation <50 mm/y; potential evaporation �3000mm/y; average temperature 25 �C). Here, we studied thereplenishment of the Arava Fill Aquifer, of Neogene-Quater-nary age, which geologically is the youngest of the five Ara-va aquifers (Naor et al., 2003; Yechieli, 1987). The depth ofthe aquifer varies, but it is continuous with a slight dip tothe north. Depth to groundwater of the uppermost alluvialaquifers (perched or regional) along the main stream chan-nel may vary from several meters to �20 m. In general, thelithological cross-section under the stream bed in the studyarea is composed of coarse alluvial deposits varying fromcoarse sand and gravel to large pebbles. A 2-m thick claylayer at a depth of 6 m below the stream bed creates apurged aquifer. This purged aquifer on top of the clay layerextends throughout the entire studied area (Oren et al.,2004). The stream-bed surface area is covered in places

Figure 2 The study area.
Direct measurements of floodwater infiltration into shallow alluvial aquifers 159
with thin silt layers of several millimeters to several tens ofcentimeters. These silt deposits are more pronounced onthe flooding plains and terraces. In the main active channel,these silt deposits are either very thin or absent and thecoarse sediments are exposed to the surface. Note thatthese silt deposit are subjected to annual washout and rede-position by each flood (Alexandrov et al., 2003).
Methodology
Monitoring setup and field instrumentation
Prior to the installation of a full-scale monitoring station atWadi Arava, a small-scale preliminary experiment was con-ducted in Wadi Nekarot (a tributary of Wadi Arava). This pi-lot experiment was conducted in October 2003 as afeasibility study to determine the optimal conditions forinstallation of the vadose zone monitoring system. Even
though this experiment was only ‘‘technical and qualita-tive’’, it is presented here because some of its results shedlight on very important aspects of the infiltration process,and help to explain some of the results from the larger-scaleinfiltration experiment. Following the results from the pre-liminary experiment, a monitoring station (NAM1) was in-stalled in November 2003 in the stream channel of WadiArava near the village of Ein Yahav.
Vadose zone instrumentationThe vadose zone monitoring system used in this study waspreviously presented by Dahan et al. (2003). Nevertheless,for convenience, a short description of the method is pre-sented here. The FTDR probes are made of flexible wave-guides attached to a flexible PVC sleeve, which is insertedinto an uncased, slanted borehole. Once inserted into theborehole, the flexible sleeve is filled with liquid resin(two-component polyurethane). The hydrostatic pressuregenerated by the resin forces the sleeve to fill the entirevolume of the borehole while pressing the FTDR waveguidesagainst the upper borehole walls (Fig. 1). Installing the FTDRprobes in slanted boreholes ensures that each probe moni-tors a point at depth that represents a ‘‘relatively’’ undis-turbed vertical cross-section of the vadose zone above theprobe. The use of a flexible sleeve and a high-density liquidfilling material (�1.6 g/cm3) that solidifies quickly e nsuresthat the borehole is sealed and that there are no preferen-tial flow paths along it. An additional benefit to using flexi-ble sleeves and high-density liquid resin is that the pressurein the borehole restores the natural pressure in the sedi-ment column and tension-release cracks that could poten-tially be formed due to the drilling action probably closeand seal.
Infiltration through layered alluvial deposits is also ex-pected to be very heterogeneous (Heilig et al., 2003). Tobetter represent the infiltration process, three sets of FTDRreplicates were installed in three different boreholes drilledin different directions. The systems were installed in thelowest section of the stream channel to allow monitoringof even the lowest floods. The boreholes were drilled at40� from the vertical (Fig. 3). Sleeve NAM1-b was installedalong the stream-channel direction and sleeves NAM1-cand NAM1-d were installed perpendicular to the stream-channel direction. NAM1-c was installed toward the stream’sside bank where the topmost deposits in the stream channelare fine silts. NAM1-b and NAM1-d were installed where theupper sediments are composed of very coarse alluvium. Notethat each probes is 30 cm long, installed in a slanted bore-hole. Therefore, the measurement represents the averagewater content of an �20-cm long vertical column. For thesake of convenience, the presented installation depth ofeach probe refers to the probe’s deepest end.
Water-content measurements using TDR were carried outusing a TDR100 (Campbell Sci.) connecting all waveguidesthrough multiplexers (SDMX50) to a datalogger (CR10X).All waveguides were connected to the acquisition systemusing high-quality RG-58 coax cable. TDR principal is basedon measurement of the travel time of a pulsed electromag-netic signal along a waveguide (TDR probe) of known length(L). The travel time depends on the bulk dielectric constant(k) of the material surrounding the probe. Since the dielec-tric constant of water (�80) is significantly higher than that

Figure 3 Schematic illustration and photograph of the monitoring setup at the NAM1 monitoring station.
Figure 4 Calibration curve for water-content measurementsby FTDR probes. The data points present three different soiltextures from the study site.
160 O. Dahan et al.
of most natural soils (2–7), any change in the soil volumet-ric water content affects the soil dielectric constant (Her-kelrath et al., 1991; Ledieu et al., 1986; Topp et al.,1980). Accordingly, soil moisture attenuates the electro-magnetic pulse propagation velocity along the probe. Theactual travel time of the TDR signal along the probe in thesoil defines the apparent probe length (La), where La =cDt/2, c being the velocity of electromagnetic signals infree space and Dt the travel time. The ratio between theapparent length (La) and the real length (L) defines themedium dielectric constant ðLa=L ¼
ffiffiffi
kpÞ (Robinson et al.,
2003). Though universal calibration curves for standardTDR probes exist in the literature, the structure of the FTDRprobes required special calibration curves (Fig. 4). The cal-ibration showed a linear correlation between the TDR sig-nals (La/L) and volumetric water content for threedifferent soils from the study area. Special calibration forcable-length effect on TDR waveform and its analysis forwater-content evaluation were established using FTDRprobes of various cable lengths in several liquid solutionsof known permittivity (water, ethanol, and acetic acid).The results showed a linear relationship between the calcu-
lated apparent length and cable length. Accordingly, mea-sured apparent lengths were corrected as follows:Corrected La/L = measured La/L � cable length · 0.016.

Direct measurements of floodwater infiltration into shallow alluvial aquifers 161
Monitoring of floodwater and groundwaterA 300 piezometer was installed in the upper phreatic aquifer.The piezometer was installed in the main channel immedi-ately adjacent to the vadose zone monitoring system. Thepiezometer was protected from the flood by a 3-m highhydrodynamic tower (Fig. 3). The groundwater level andthe flood stage were monitored using pressure transducers(DRUCK, PTX-1830 and SOLINST LEVELOGGER, F15/M5).The pressure transducers were either compensated for orcorrelated to barometric pressure. The groundwater andfloodwater were monitored for electrical conductivity (EC)and temperature using S547A probes (Campbell Scientific).All instruments were programmed to execute measurementreadings at intervals ranging from several minutes to severalhours, depending on the season and required frequency.
Controlled infiltration experiment
To investigate the infiltration process under controlled con-ditions, an infiltration experiment was conducted on top ofthe instrumented section at the NAM1 site. The controlledinfiltration experiment was designed to simulate a floodevent and allow full monitoring of all hydrological compo-nents affecting deep infiltration during a flood. The experi-ment was conducted through a pond that was constructedaround the monitored section of the stream channel(Fig. 5). The dam of the pond was constructed with a claycore covered with polyethylene liner and coarse alluvialmaterial above the liner, to avoid clay dispersion into thepond. The surface area of the pond bed (�65 m2) coveredtwo sections of the stream channel. The lower section,which is the active channel, was composed of coarse alluvialmaterial, mainly gravel and pebbles in a coarse sand matrix.The upper section, covering �1/4 of the pond area, which was located next to the stream bank, was covered by a 20–30-cm layer of silt (Figs. 3 and 5). Sediments in the subsur-face, as detected in all boreholes that were drilled during
Figure 5 Schematic setup and photograph of the controlledinfiltration experiment at the NAM1 monitoring station.
the installation, were composed mainly of coarse gravel ina sandy matrix to a depth of 6 m, where a layer of denseclay was observed. Four large ring infiltrometers (0.58 mdiameter and 1 m height) were installed in the pond bedto monitor the infiltration rate in different parts of thestream bed during the experiment (Fig. 5). While rings 1,2 and 4 were installed in the main coarse-grained streamchannel, ring 3 was installed on the silt ledge above sleeveNAM1-c. The rings were lowered into a 15-cm deep narrowgroove and sealed with clay from their outer side. The waterlevel in the rings was kept as close as possible to that of thepond. Nevertheless, to avoid overestimation of the flux ratemeasured by the rings and ensure that water loss from therings is due to infiltration and not to the pond, the ringwater level was kept slightly lower than that of the pond.Accordingly, a drop in water level below that of the pondindicated that the ring is isolated from the pond and infil-trates independently. The pond volume at a maximumwater level of �65 cm reached �47 m3. The water for theflooding experiment was provided from a nearby farm.
Small natural flood
A small natural flood, which flowed for several hours at avery low water head, was monitored at NAM1 in October2004. The monitoring setup was the same as that used forthe controlled infiltration experiment. The dam used forthe controlled infiltration experiment had been removedand the natural stream channel restored. The vadose zonemoisture profile was restored to the natural moisture condi-tions prior to the infiltration experiment.
Results and discussion
The results from the controlled infiltration experiment andthe natural flood at the NAM1 monitoring station providedinsight into the complexity of the infiltration process. A de-tailed description of these results is presented here. Prior toelaborating upon the meaning of the results and their impli-cations, we briefly present a few observations from themuch smaller-scale preliminary experiment that was con-ducted in nearby Wadi Nekarot. These results enabled a bet-ter evaluation of the results from the larger-scale controlledinfiltration experiment and natural flood.
Wadi Nekarot: preliminary experiment
The Nekarot infiltration experiment was conducted in asmall, 2 m · 3 m infiltration pond above a FTDR probe thatwas installed at 1.2 m depth according to the aforede-scribed installation technique. The pond was constructedwith the soil embankment forming the pond boundaries ona section of the stream bed. The experiment was startedby flooding the pond to a constant water head of 6 cm. Aring infiltrometer (0.32 m diameter) installed in the pondjust above the FTDR probe showed an infiltration rate of�5 cm/h. The FTDR probe did not sense any moisturechange 7.5 h after flooding was initiated and the water con-tent remained a constant and low �5.5% (Fig. 6). Mean-while, an indication of the subsurface lateral flow thatdiverts water horizontally away from the pond was observed
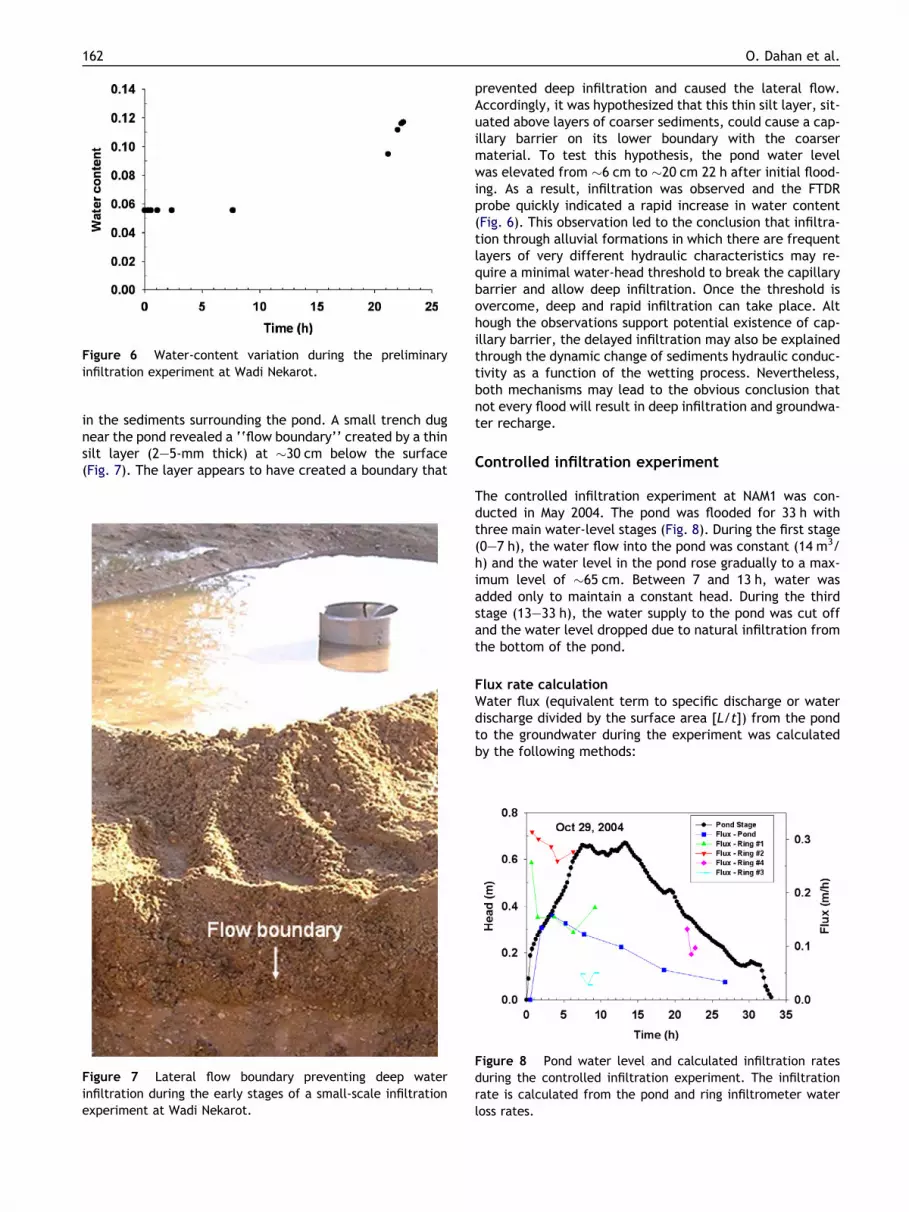
Figure 6 Water-content variation during the preliminaryinfiltration experiment at Wadi Nekarot.
162 O. Dahan et al.
in the sediments surrounding the pond. A small trench dugnear the pond revealed a ‘‘flow boundary’’ created by a thinsilt layer (2–5-mm thick) at �30 cm below the surface(Fig. 7). The layer appears to have created a boundary that
Figure 7 Lateral flow boundary preventing deep waterinfiltration during the early stages of a small-scale infiltrationexperiment at Wadi Nekarot.
prevented deep infiltration and caused the lateral flow.Accordingly, it was hypothesized that this thin silt layer, sit-uated above layers of coarser sediments, could cause a cap-illary barrier on its lower boundary with the coarsermaterial. To test this hypothesis, the pond water levelwas elevated from �6 cm to �20 cm 22 h after initial flood-ing. As a result, infiltration was observed and the FTDRprobe quickly indicated a rapid increase in water content(Fig. 6). This observation led to the conclusion that infiltra-tion through alluvial formations in which there are frequentlayers of very different hydraulic characteristics may re-quire a minimal water-head threshold to break the capillarybarrier and allow deep infiltration. Once the threshold isovercome, deep and rapid infiltration can take place. Although the observations support potential existence of cap-illary barrier, the delayed infiltration may also be explainedthrough the dynamic change of sediments hydraulic conduc-tivity as a function of the wetting process. Nevertheless,both mechanisms may lead to the obvious conclusion thatnot every flood will result in deep infiltration and groundwa-ter recharge.
Controlled infiltration experiment
The controlled infiltration experiment at NAM1 was con-ducted in May 2004. The pond was flooded for 33 h withthree main water-level stages (Fig. 8). During the first stage(0–7 h), the water flow into the pond was constant (14 m3/h) and the water level in the pond rose gradually to a max-imum level of �65 cm. Between 7 and 13 h, water wasadded only to maintain a constant head. During the thirdstage (13–33 h), the water supply to the pond was cut offand the water level dropped due to natural infiltration fromthe bottom of the pond.
Flux rate calculationWater flux (equivalent term to specific discharge or waterdischarge divided by the surface area [L/t]) from the pondto the groundwater during the experiment was calculatedby the following methods:
Figure 8 Pond water level and calculated infiltration ratesduring the controlled infiltration experiment. The infiltrationrate is calculated from the pond and ring infiltrometer waterloss rates.
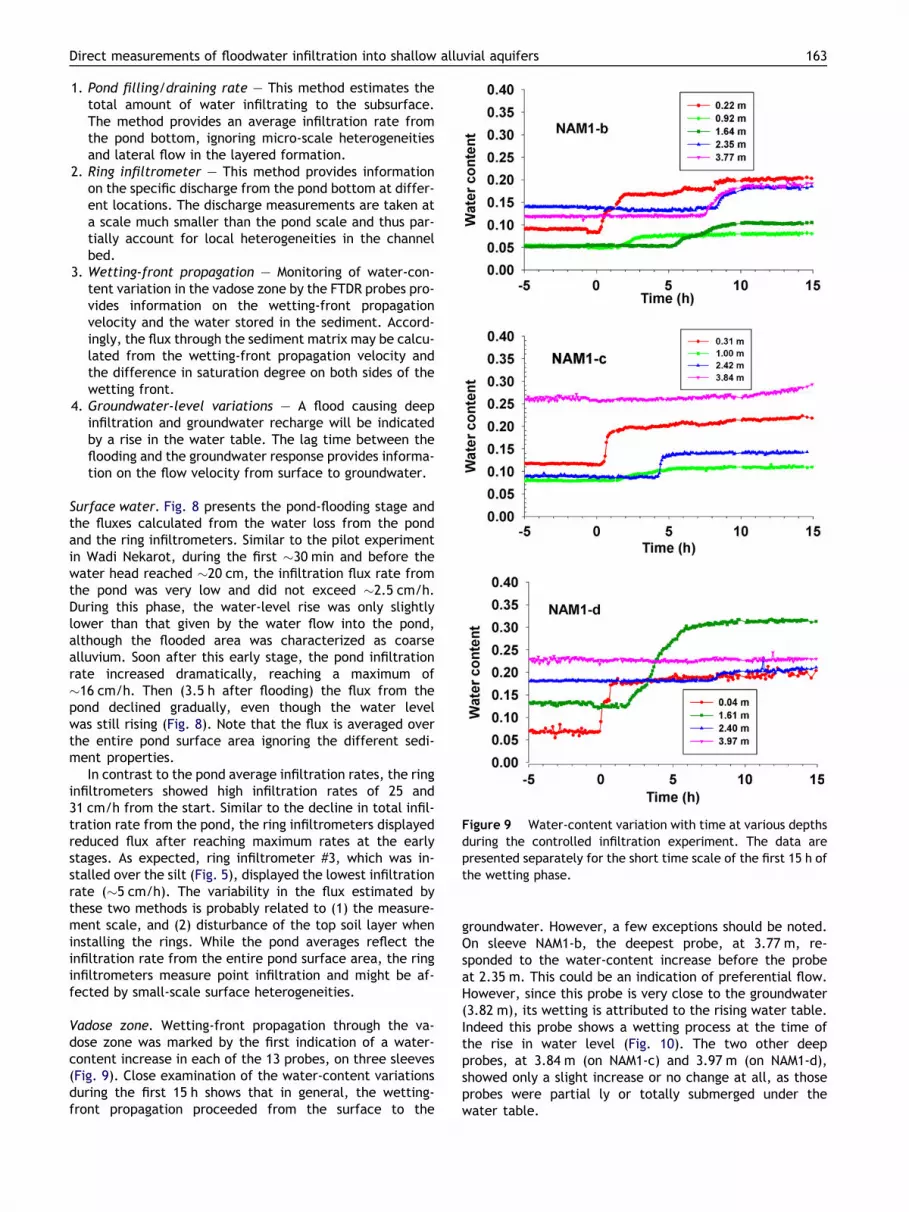
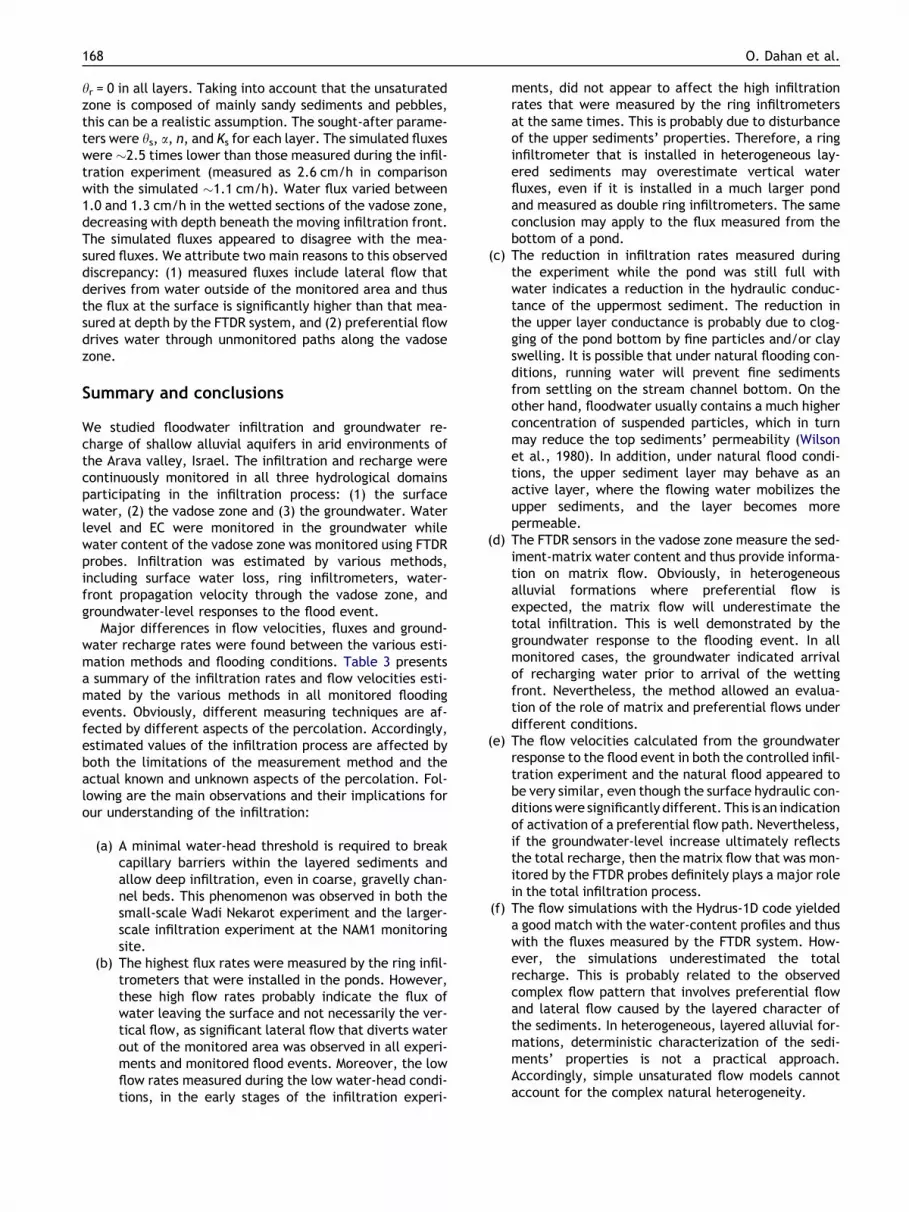
Figure 9 Water-content variation with time at various depthsduring the controlled infiltration experiment. The data arepresented separately for the short time scale of the first 15 h ofthe wetting phase.
Direct measurements of floodwater infiltration into shallow alluvial aquifers 163
1. Pond filling/draining rate – This method estimates thetotal amount of water infiltrating to the subsurface.The method provides an average infiltration rate fromthe pond bottom, ignoring micro-scale heterogeneitiesand lateral flow in the layered formation.
2. Ring infiltrometer – This method provides informationon the specific discharge from the pond bottom at differ-ent locations. The discharge measurements are taken ata scale much smaller than the pond scale and thus par-tially account for local heterogeneities in the channelbed.
3. Wetting-front propagation – Monitoring of water-con-tent variation in the vadose zone by the FTDR probes pro-vides information on the wetting-front propagationvelocity and the water stored in the sediment. Accord-ingly, the flux through the sediment matrix may be calcu-lated from the wetting-front propagation velocity andthe difference in saturation degree on both sides of thewetting front.
4. Groundwater-level variations – A flood causing deepinfiltration and groundwater recharge will be indicatedby a rise in the water table. The lag time between theflooding and the groundwater response provides informa-tion on the flow velocity from surface to groundwater.
Surface water. Fig. 8 presents the pond-flooding stage andthe fluxes calculated from the water loss from the pondand the ring infiltrometers. Similar to the pilot experimentin Wadi Nekarot, during the first �30 min and before thewater head reached �20 cm, the infiltration flux rate fromthe pond was very low and did not exceed �2.5 cm/h.During this phase, the water-level rise was only slightlylower than that given by the water flow into the pond,although the flooded area was characterized as coarsealluvium. Soon after this early stage, the pond infiltrationrate increased dramatically, reaching a maximum of�16 cm/h. Then (3.5 h after flooding) the flux from thepond declined gradually, even though the water levelwas still rising (Fig. 8). Note that the flux is averaged overthe entire pond surface area ignoring the different sedi-ment properties.
In contrast to the pond average infiltration rates, the ringinfiltrometers showed high infiltration rates of 25 and31 cm/h from the start. Similar to the decline in total infil-tration rate from the pond, the ring infiltrometers displayedreduced flux after reaching maximum rates at the earlystages. As expected, ring infiltrometer #3, which was in-stalled over the silt (Fig. 5), displayed the lowest infiltrationrate (�5 cm/h). The variability in the flux estimated bythese two methods is probably related to (1) the measure-ment scale, and (2) disturbance of the top soil layer wheninstalling the rings. While the pond averages reflect theinfiltration rate from the entire pond surface area, the ringinfiltrometers measure point infiltration and might be af-fected by small-scale surface heterogeneities.
Vadose zone. Wetting-front propagation through the va-dose zone was marked by the first indication of a water-content increase in each of the 13 probes, on three sleeves(Fig. 9). Close examination of the water-content variationsduring the first 15 h shows that in general, the wetting-front propagation proceeded from the surface to the
groundwater. However, a few exceptions should be noted.On sleeve NAM1-b, the deepest probe, at 3.77 m, re-sponded to the water-content increase before the probeat 2.35 m. This could be an indication of preferential flow.However, since this probe is very close to the groundwater(3.82 m), its wetting is attributed to the rising water table.Indeed this probe shows a wetting process at the time ofthe rise in water level (Fig. 10). The two other deepprobes, at 3.84 m (on NAM1-c) and 3.97 m (on NAM1-d),showed only a slight increase or no change at all, as thoseprobes were partial ly or totally submerged under thewater table.

Figure 10 Water levels and electrical conductivity of thefloodwater and groundwater during the controlled infiltrationexperiment.
164 O. Dahan et al.
The wetting process from initial water content to max-imum water content varied from 1 to 4 h, with changes insaturation degree ranging from 2% to 17%. Wetting-frontarrival time at each probe at the various depths can bemarked by the first indication of a water-content increase,or by the time that the maximum saturation degree isreached. For the sake of consistency, we chose the middlepoint between minimum and maximum water content tomark the wetting-front propagation travel time. Usingthe propagation time and depth from probe to probeyielded an average flow velocity of �42 cm/h. Combiningthe average flow velocity to each of the probes with thechange in saturation degree yielded an average flux of2.6 cm/h (Table 1).
Similar to the wetting, the drainage process in the va-dose zone is presented in Fig. 11 on a longer time scale.Interestingly, a reduction in water content, which is indic-ative of drainage, began in most upper probes long beforethe pond dried out. For example, all the upper probes inall of the sleeves recorded draining at 18–24 h afterflooding. Note that at this stage, the water head in thepond was still high, dropping from 50 to 30 cm. This phe-nomenon was not exclusive to the upper probe but wasobserved with the deeper probes as well. For example,
Table 1 Calculated wetting-front velocity (v) and fluxes (q)during the infiltration experiment
Depth (m) Wetting frontarrival time (h)
Dh v (m/h) q (m/h)
0.22 0.7 0.083 0.33 0.0270.31 0.6 0.072 0.49 0.0350.92 2.3 0.024 0.42 0.0101 3.0 0.022 0.29 0.0061.61 3.6 0.169 0.48 0.0821.64 7.1 0.052 0.15 0.0082.35 8.8 0.044 0.41 0.0182.4 8.3 0.016 0.17 0.0032.42 4.4 0.046 1.00 0.046Average – 0.0635 0.42 0.026
Figure 11 Water-content variation with time at variousdepths during the controlled infiltration experiment. The dataare presented for the long time scale of 80 h and includes thedrainage phase.
a reduction in water content was monitored by the probesat 1.64 m (NAM1-b) after 22 h and at 2.42 m (NAM1-c)after 25 h (Fig. 11). Closer inspection of the water-con-tent variations at a higher resolution shows that most ofthe probes indicated some drainage before the pond wentcompletely dry. The observed reduction in vadose zonewater content while the water level in the pond was stillrelatively high is in fact an indication of reduced flux.This reduction is in agreement with the reduction in fluxmeasured during the same time interval by the pondand infiltrometer rings on the surface (Fig. 8). This sug-gests that although the surface was flooded for a long

Figure 12 Water level and electrical conductivity of thefloodwater and groundwater during a flood event.
Direct measurements of floodwater infiltration into shallow alluvial aquifers 165
time, the vadose zone sediments never reached satura-tion, even very close to the surface. It is possible thatthe flux reduction is related to clay swelling and loweringof Ks near the surface, or due to fine silt settling on thepond bottom.
Vadose zone drainage responded quickly to the ponddrainage and in less than 20 h, it was nearly complete.The water-content profiles recovered, going back to theirinitial condition at �265 h (11 days).
Groundwater. The depth to the water table, as measuredin the piezometer prior to the flooding experiment, was3.815 m. Throughout the data analysis, the water-levelvariation will be presented as relative levels compared tothe water level prior to flooding. The first groundwater-le-vel response to the pond flooding was at �6 h after flood-ing initiation (Fig. 10), indicating a minimal down flowvelocity of 66 cm/h. The average wetting-front propaga-tion velocity calculated by the FTDR probes was only42 cm/h. The difference is mainly attributed to preferen-tial flow. Whereas FTDR probes respond mainly to matrixflow, the groundwater responds to the total bulk waterinfiltration, which is composed of both matrix and prefer-ential flow.
The infiltration proceeded for at least 50 h (Fig. 11),from the beginning of the flood event to the final stagesof the draining process. Nevertheless, the groundwater lev-els indicated a significant reduction in recharge flux �20 hafter flooding, when the water table began to fall off(Fig. 10). Interestingly, these results are in accordance withthe reduction in fluxes observed during this stage on landsurface and by the FTDR probes in the vadose zone.
Groundwater recharge was also indicated by the varia-tions in groundwater EC (Fig. 10). While the water table rose�6 h after flooding, a significant change in EC was detected4 h later, at �10 h after flooding. This lag time is explainedby the sensors being installed in a piezometer, about 1 mbelow the water table. Whereas the pressure instantly prop-agates from the water table to the pressure transducer, thechanges in EC require the advective flux of water with dif-ferent EC to the sensors. Therefore, the EC response tothe floodwater infiltration is delayed relative to that ofwater level.
Infiltration from a natural flood
The natural flood that was recorded in Wadi Arava by theNAM1 monitoring station was relatively small in durationand in water level. It flowed for only 6.5 h and its maximumwater level reached 28 cm (Fig. 12). When analyzing infiltra-tion during the natural flood and comparing it to the infiltra-tion experiment, the differences in the hydraulic conditionsof these two cases need to be emphasized: (1) the floodingtime in the controlled infiltration experiment was 33 h,compared with only 6 h in the flood, (2) the water head inthe infiltration experiment reached �65 cm and the maxi-mum water level during the natural flood reached only28 cm, a stage that lasted for only a very short time(Fig. 12), (3) the controlled experiment was conducted ina pond of limited size (�65 m2), while the flood covered amuch larger portion of the channel width and its entirelength (Figs. 3 and 5), and (4) the infiltration experiment
was conducted with ponded water compared to flowingwater in the flood. In addition, the pond experiment wasconducted with clean water from the village irrigation sys-tem which contains no suspended matter while the naturalflood water obviously carried much more suspended matterwith the flowing water.
Vadose zoneFig. 13 presents the water-content variations in the vadoseprofile. The FTDR probes detected different wetting-frontpropagation rates and saturation degrees of the vadoseprofile as compared to the infiltration experiment. The fig-ure shows that a few of the probes (e.g. 0.92 and 1.64 mon NAM1-b and 0.31 and 1 m on NAM1-c) indicated only asmall change in water content (0.5–1%). This change, how-ever, clearly marked the wetting-front propagation. Sincethe flood stage was very low, the silt inset area abovesleeve NAM1-c was not flooded during the entire flood(Figs. 5 and 12). Close examination of the wetting as mon-itored by NAM1-c indicated a different wetting patternthan in the other sleeves. For example, the NAM1-c probeat 2.4 m indicates wetting long before the upper probe at1 m (Fig. 13). Therefore, we assume that the observedwetting of the vadose zone in this area is partly due to lat-eral flow caused by the layered structure of the sedimentsand not necessarily to vertical infiltration from thesurface.
The average wetting-front propagation velocity, which iscalculated from the vertical distance between adjacentprobes and the propagation time, was �21 cm/h (Table2). This velocity is approximately half that measured duringthe controlled infiltration experiment (Table 1). The aver-age flux calculated from this velocity and the change in de-gree of saturation was 1.1 cm/h. Note that the velocity andflux are approximately half of those measured during thecontrolled infiltration experiment (Tables 2 and 3).
Vadose zone drainage after the flood was much slowerthan that observed after the infiltration experiment. It took60 days to return to the initial, pre-flood moisture condi-tions. It should be noted that the drying following theexperiment occurred during early summer, whereas thedrying following the flood occurred during the much coolerwinter.

Table 2 Calculated wetting-front velocity (v) and fluxes (q)during the flood event
Depth (m) Wetting frontarrival time (h)
Dh v (m/h) q (m/h)
0.22 0.5 0.083 0.44 0.0370.92 5.0 0.024 0.16 0.0041.64 15.5 0.052 0.07 0.0042.35 18.0 0.044 0.28 0.0120.04 0.5 0.107 0.08 0.0091.61 5.0 0.169 0.35 0.0592.4 13.5 0.016 0.09 0.001Average – 0.0635 0.21 0.018
Figure 13 Water-content variation with time at variousdepths during a small flood event.
166 O. Dahan et al.
GroundwaterA groundwater-level response to the flood was first sensed5.5 h after flooding initiation (Fig. 12). Therefore, a minimalflow velocity of �69 cm/h may be calculated from the tra-vel time of the water through the vadose zone. This rela-tively quick response of the groundwater to the floodevent indicates that water traversed the vadose zone at amuch higher velocity than that estimated from the vadosezone wetting process. In fact, the arrival time is very similarto that measured during the controlled infiltration experi-ment. This indicates an active preferential flow mechanismthat bypasses the porous matrix of the vadose zone. How-ever, the groundwater fluctuation pattern was very differ-ent from that of the controlled infiltration experiment.The flood caused the water level to rise after �5.5 h and
to reach a peak of �2.5 cm. Then, at 7 h, and almost atthe same time as the flood ended, the water table startedto drop. Up until this stage, the pattern of water-levelchange was very similar to that observed during the con-trolled infiltration experiment. However, there was one ma-jor difference: the maximal immediate water-level riseduring the experiment reached about 20 cm, whereas duringthe flood event the immediate water level rise was only2.5 cm. These observations indicate that although preferen-tial flow transfers water through the vadose zone relativelyquickly, the quantities are not as significant as those trans-ported via matrix flow. This is supported by the water levelrising again at �10.5 h (Fig. 13). At this stage, when theflooding has ceased and the surface has gone dry, preferen-tial flow paths become less active due to water imbibitionby the porous matrix. Nevertheless, the groundwater levelkept rising due to direct drainage of the vadose zone porewater.
Vadose zone drainage proceeded for �60 days. However,drainage alone cannot explain why the groundwater keptrising for �85 days to a maximum level of 35 cm abovethe original water level (presented only to day 60 onFig. 12). This long-term water-table rise probably reflectsgroundwater recharge upstream of the monitoring stationand the specific conditions of the shallow alluvial aquiferat the site. The natural hydraulic gradient in the area is inthe channel downstream direction. The shallow aquifer isconfined below by a clay layer forming a very shallow aqui-fer that is wedging downstream. Therefore, a flood that re-charges along the entire length of the channel results in twotypes of water-table rise. The first is a short-term responseto direct vertical infiltration. The second occurs due togroundwater flow in the aquifer in response to upstreamrecharge.
A gradual decrease in groundwater EC started �10 hafter the start of the flood and continued at a constantrate until �35 h. Then an abrupt, larger change in ECwas measured (Fig. 12). Note that during the infiltrationexperiment, the main change in EC occurred 10 h afterthe flooding and only �4 h after the percolating waterreached the water table (Fig. 10). We propose that themain reason for this difference is the area impacted byflooding and percolating water. In the experiment, a lim-ited water mound was generated immediately underneaththe pond. This mound generated high hydraulic gradientsin all directions away from it. Therefore, fast mixing of

Table 3 Flow velocity and flux rates estimated by various methods and flooding conditions
Method Infiltration experiment Natural flood
Water losses from the pond Starting from 0 at early stages, climbing to 16 cm/h,and decreasing to �4 cm/h towards the end of theexperiment
Not measured
Water losses through the ring infiltrometers Starting at �30 cm/h, decreasing to 3 cm/h Not measuredWetting-front propagation velocity measured byFTDR
42 cm/h 21 cm/h
Water fluxes estimated from the wetting-frontpropagation velocity measured by FTDR
2.6 cm/h 1.1 cm/h
Infiltration velocity estimated from the groundwaterresponse to flooding
66 cm/h 69 cm/h
Simulated matrix fluxes 1.1–1.3 cm/h
Figure 14 Observed and simulated water-content variationsat various depths during the controlled infiltration experiment.
Direct measurements of floodwater infiltration into shallow alluvial aquifers 167
the percolating water with the ambient water was inev-itable, pushing the fresh water layer down and awayfrom the center of the water mound to the sides, wherethe monitoring well was installed (Fig. 5). During thenatural flood that covered most of the channel widthand length, the infiltrating water was accumulated as anew water layer on top of the ambient groundwater.Since the local hydraulic gradients in the vicinity of thewell during the flood were smaller then those createdduring an infiltration experiment mixing of fresh waterlayer with the ambient saline water is more affectedby slow diffusion and hydrodynamic dispersion processes.As a result the measured changes in EC values in thewell during the natural flood event were slower and de-layed compare to those measured during the infiltrationexperiment.
Infiltration model
Infiltration simulations using the Hydrus-1D code (Simuneket al., 1998), based on the numerical solution of the Rich-ards equation, were conducted with the intent to recon-struct the flow conditions measured during the infiltrationexperiment. Suitable matching between the real resultsand the model simulation would allow an estimation ofthe hydraulic parameters and water fluxes through the soilmatrix. Upper and lower boundary conditions of the vari-able head with time were prescribed based on the moni-tored water levels in the pond and groundwater duringthe experiment, respectively. The water-content measure-ments by the FTDR probes were used for the initial condi-tions. The simulations were restricted to the first 15 h.During this time interval, the observed head at the upperboundary rose constantly for �7 h and was constant forthe next 8 h; the water-infiltration flux reached quasi-stea-dy-state values. The model could not predict the observedflux reduction while the upper boundary condition re-mained constant after 15 h. This was probably due to clog-ging of the pond bottom and decreasing hydraulicconductivity of the upper layer. The chosen hydraulicparameter was based on Van Genuchten’s approach (vanGenuchten, 1980):
Se ¼ ½1þ ðajwjÞn��m
KðSeÞ ¼ KsS0:5e ½1� ð1� S1=me Þ
m�2
where Se = (h � hr)/(hs � hr) is relative saturation, hs iswater content at saturation, hr is irreducible water content,Ks is the saturated hydraulic conductivity, a and n are vanGenuchten parameters, m = 1–1/n, and w is the pore waterpressure.
The stratigraphy in the simulations was initially dividedinto five layers according to the vadose zone’s initialwater-content profiles (0–0.07 m, 0.07–0.45 m, 0.45–1.35 m, 1.35–1.9 m, 1.9–3.9 m). Dividing the cross-sectioninto layers on the basis of the initial water content is basedon the known relation between soil water retention charac-teristics and soil properties. Properties of layers 2 and 5 werethe same. The simulations were carried out for data from allthree sleeves. However, for convenience, the presented sim-ulation is from sleeve 2. The upper four out of five FTDRprobes of sleeve 2 were chosen as the observation for thatsimulation. The information onmeasured water-content var-iation in the observation nodes during the infiltration exper-iment was incorporated into the model to solve the inverseproblem. We obtained a good fit between observed and sim-ulated water content (R2 = 0.99) at all observation points.Further improvement of the inverse solution was possibleafter introducing an additional layer (0–7 cm). Fig. 14 pre-sents the fit of the simulation to the experimental observa-tions measured with the FTDR probes. When solving theinverse problem, we assumed irreducible water content
168 O. Dahan et al.
hr = 0 in all layers. Taking into account that the unsaturatedzone is composed of mainly sandy sediments and pebbles,this can be a realistic assumption. The sought-after parame-ters were hs, a, n, and Ks for each layer. The simulated fluxeswere �2.5 times lower than those measured during the infil-tration experiment (measured as 2.6 cm/h in comparisonwith the simulated �1.1 cm/h). Water flux varied between1.0 and 1.3 cm/h in the wetted sections of the vadose zone,decreasing with depth beneath the moving infiltration front.The simulated fluxes appeared to disagree with the mea-sured fluxes. We attribute two main reasons to this observeddiscrepancy: (1) measured fluxes include lateral flow thatderives from water outside of the monitored area and thusthe flux at the surface is significantly higher than that mea-sured at depth by the FTDR system, and (2) preferential flowdrives water through unmonitored paths along the vadosezone.
Summary and conclusions
We studied floodwater infiltration and groundwater re-charge of shallow alluvial aquifers in arid environments ofthe Arava valley, Israel. The infiltration and recharge werecontinuously monitored in all three hydrological domainsparticipating in the infiltration process: (1) the surfacewater, (2) the vadose zone and (3) the groundwater. Waterlevel and EC were monitored in the groundwater whilewater content of the vadose zone was monitored using FTDRprobes. Infiltration was estimated by various methods,including surface water loss, ring infiltrometers, water-front propagation velocity through the vadose zone, andgroundwater-level responses to the flood event.
Major differences in flow velocities, fluxes and ground-water recharge rates were found between the various esti-mation methods and flooding conditions. Table 3 presentsa summary of the infiltration rates and flow velocities esti-mated by the various methods in all monitored floodingevents. Obviously, different measuring techniques are af-fected by different aspects of the percolation. Accordingly,estimated values of the infiltration process are affected byboth the limitations of the measurement method and theactual known and unknown aspects of the percolation. Fol-lowing are the main observations and their implications forour understanding of the infiltration:
(a) A minimal water-head threshold is required to breakcapillary barriers within the layered sediments andallow deep infiltration, even in coarse, gravelly chan-nel beds. This phenomenon was observed in both thesmall-scale Wadi Nekarot experiment and the larger-scale infiltration experiment at the NAM1 monitoringsite.
(b) The highest flux rates were measured by the ring infil-trometers that were installed in the ponds. However,these high flow rates probably indicate the flux ofwater leaving the surface and not necessarily the ver-tical flow, as significant lateral flow that diverts waterout of the monitored area was observed in all experi-ments and monitored flood events. Moreover, the lowflow rates measured during the low water-head condi-tions, in the early stages of the infiltration experi-
ments, did not appear to affect the high infiltrationrates that were measured by the ring infiltrometersat the same times. This is probably due to disturbanceof the upper sediments’ properties. Therefore, a ringinfiltrometer that is installed in heterogeneous lay-ered sediments may overestimate vertical waterfluxes, even if it is installed in a much larger pondand measured as double ring infiltrometers. The sameconclusion may apply to the flux measured from thebottom of a pond.
(c) The reduction in infiltration rates measured duringthe experiment while the pond was still full withwater indicates a reduction in the hydraulic conduc-tance of the uppermost sediment. The reduction inthe upper layer conductance is probably due to clog-ging of the pond bottom by fine particles and/or clayswelling. It is possible that under natural flooding con-ditions, running water will prevent fine sedimentsfrom settling on the stream channel bottom. On theother hand, floodwater usually contains a much higherconcentration of suspended particles, which in turnmay reduce the top sediments’ permeability (Wilsonet al., 1980). In addition, under natural flood condi-tions, the upper sediment layer may behave as anactive layer, where the flowing water mobilizes theupper sediments, and the layer becomes morepermeable.
(d) The FTDR sensors in the vadose zone measure the sed-iment-matrix water content and thus provide informa-tion on matrix flow. Obviously, in heterogeneousalluvial formations where preferential flow isexpected, the matrix flow will underestimate thetotal infiltration. This is well demonstrated by thegroundwater response to the flooding event. In allmonitored cases, the groundwater indicated arrivalof recharging water prior to arrival of the wettingfront. Nevertheless, the method allowed an evalua-tion of the role of matrix and preferential flows underdifferent conditions.
(e) The flow velocities calculated from the groundwaterresponse to the flood event in both the controlled infil-tration experiment and the natural flood appeared tobe very similar, even though the surface hydraulic con-ditionswere significantly different. This is an indicationof activation of a preferential flow path. Nevertheless,if the groundwater-level increase ultimately reflectsthe total recharge, then the matrix flow that was mon-itored by the FTDR probes definitely plays a major rolein the total infiltration process.
(f) The flow simulations with the Hydrus-1D code yieldeda good match with the water-content profiles and thuswith the fluxes measured by the FTDR system. How-ever, the simulations underestimated the totalrecharge. This is probably related to the observedcomplex flow pattern that involves preferential flowand lateral flow caused by the layered character ofthe sediments. In heterogeneous, layered alluvial for-mations, deterministic characterization of the sedi-ments’ properties is not a practical approach.Accordingly, simple unsaturated flow models cannotaccount for the complex natural heterogeneity.
Direct measurements of floodwater infiltration into shallow alluvial aquifers 169
Acknowledgements
We thank Michael Kugel for his technical assistance and cre-ative ideas in establishing the experimental setups, Mr. AmiShaham from the Arava Drainage Authority for providingvaluable assistance and data on the study area and Mr. IlanPolak for providing creative drilling solutions. This researchwas supported by the Israel Science Foundation (Grant#276/03), the 6th framework program of the European Com-mission (WADE, GOCE-CT-2003-506680), Israel waterauthority, and by funds provided to the International AridLands Consortium (IALC) by the USDA Forest Service andby the USDA Cooperative State Research, Education, andExtension Service. The authors are grateful to Prof G. deMarsily and the anonymous reviewer who significantly im-proved the manuscript through their constructivecomments.
References
Abdulrazzak, J.M., Morel-Seytoux, H.J., 1983. Recharge from anephemeral stream following wetting front arrival to water table.Water Resources Research 19 (1), 194–200.
Adar, E.M., Neuman, S.P., 1988. Estimation of spatial rechargedistribution using environmental isotopes and hydrochemicaldata: II. Application to Aravaipa Valley in Southern Arizona.Journal of Hydrology 97, 279–302.
Adar, E.M., Rosenthal, E., Issar, A.S., Batelaan, O., 1992. Quanti-tative assessment of flow pattern in the southern Arava Valley(Israel) by environmental tracers in a mixing cell model. Journalof Hydrology 136, 333–352.
Alexandrov, Y., Laronne, J.B., Reid, I., 2003. Suspended sedimentconcentration and its variation with water discharge in a drylandephemeral channel, northern Negev, Israel. Journal of AridEnvironments 53 (1), 73–84.
Bendjoudi, H., Cheviron, B., Guerin, R., Tabbagh, A., 2005.Determination of upward/downward groundwater fluxes usingtransient variations of soil profile temperature: test of themethod with Voyons (Aube, France) experimental data. Hydro-logical Processes 19 (18), 3735–3745.
Besbes, M., Delhomme, J.P., De Marsily, G., 1978. Estimatingrecharge from ephemeral streams in arid regions, a case study atKairouan, Tunisia. Water Resources Research 14 (2), 281–290.
Bueno, A., Lang, D.J., 1980. Aquifer discharge from the 1969 and1978 floods in the Mojave River basin. Open File Rep., USGeological Survey, Water Res. Invest., California, Denver,Colorado.
Cheviron, B., Guerin, R., Tabbagh, A., Bendjoudi, H., 2005.Determining long-term effective groundwater recharge by ana-lyzing vertical soil temperature profiles at meteorologicalstations. Water Resources Research 41 (9).
Constantz, J., Tyler, S.W., Kwicklis, E., 2003. Temperature-profilemethods for estimating percolation rates in arid environments.Vadose Zone Journal 2 (1), 12–24.
Dahan, O., 1993. Water flow and solute migration through unsat-urated chalk – Avdat group, Ramat Hovav. Master Thesis,Hebrew University of Jerusalem, Rehovot, p. 37.
Dahan, O., McDonald, E.V., Young, M.H., 2003. Flexible timedomain reflectometry probe for Deep Vadose Zone monitoring.Vadose Zone Journal 2 (2), 270–275.
Dalintzkey, Y., Glazer, A., Lachmi, C., 1975. A plant for streamflowcapture – NAMAG Hazeva, TAHAL, 01/75/14, Tel-Aviv, (inHebrew).
Enzel, Y., 1990. Hydrology of a large, closed arid watershed as abasis for paleohydrological and paleoclimatological studies in
the Mojave River drainage system, southern California. PhDThesis, University of New Mexico, p. 315.
Eriksson, E., Khunakasem, V., 1969. Chloride concentration ingroundwater, recharge rate and rate of deposition of Chloride inthe Israel coastal plain. Journal of Hydrology 7, 178–197.
Flint, A., Flint, L., Kwicklis, E., Fabryka-Martin, J., Bodvarsson, G.,2002. Estimating recharge at Yucca Mountain, Nevada, USA:comparison of methods. Hydrogeology Journal 10 (1), 180–204.
Gheith, H., Sultan, M., 2002. Construction of a hydrologic model forestimating Wadi runoff and groundwater recharge in the EasternDesert, Egypt. Journal of Hydrology 263 (1-4), 36–55.
Glazer, A., Dalintzkey, Y., 1973. North Arava-Faran and NeqarotNAMAG plants, first plan report, TAHAL, 01/73/30, Tel-Aviv (inHebrew).
Greenbaum, N., Margalit, A., Schick, A.P., Sharon, D., Baker, V.R.,1998. A high magnitude storm and flood in a hyperarid catch-ment, Nahal Zin, Negev Desert, Israel. Hydrological Processes 12(1), 1–23.
Heilig, A., Steenhuis, T.S., Walter, M.T., Herbert, S.J., 2003.Funneled flow mechanisms in layered soil: field investigations.Journal of Hydrology 279 (1-4), 210–223.
Herkelrath, W.N., Hamburg, S.P., Murphy, F., 1991. Automatic,real-time monitoring of soil moisture in a remote field area withtime domain reflectometry. Water Resources Research 27, 857–864.
Hopmans, J.W., Simunek, J., Bristow, K.L., 2002. Indirect estima-tion of soil thermal properties and water flux using heat pulseprobe measurements: geometry and dispersion effects. WaterResources Research 38 (1), 1–14.
Izbicki, J.A., 2002. Geologic and hydrologic controls on themovement of water through a thick, heterogeneous unsaturatedzone underlying an intermittent stream in the western MojaveDesert, southern California. Water Resources Research 38 (3),1–14.
Izbicki, J.A., Radyk, J., Michel, R.L., 2000. Water movementthrough a thick unsaturated zone underlying an intermittentstream in the western Mojave Desert, southern California, USA.Journal of Hydrology 238 (3-4), 194–217.
Jacobson, P.J., Jacobson, K.M., Seely, M.K., 1995. Ephemral Riversand their Catchments: Sustaining People and Development inWestern Namibia. Desert Research Foundation of Namibia,Windhoek.
Lane, L.J., Diskin, M.H., Renard, K.G., 1971. Input–output rela-tionships for an ephemeral stream channel system. Journal ofHydrology 13, 22–40.
Lange, J., 2005. Dynamics of transmission losses in a large aridstream channel. Journal of Hydrology 306 (1-4), 112–126.
Ledieu, J., de Ridder, P., De Clerck, P., Dautrebande, S., 1986. Amethod of measuring soil moisture by time-domain reflectom-etry. Journal of Hydrology 88, 319–328.
Lee, D.R., Cherry, J.A., 1978. A field exercise on groundwater flowusing seepage meters and mini piezometers. Journal of Geolog-ical Education 27, 6–10.
Lerner, D.E., Issar, A.S., Simmers, I., 1990. Groundwater Recharge:A guide to understanding and estimating natural rechargeInter-national Contributions to Hydrology, vol. 8. Verlag Hientz Hiese.
Levitt, D.G., Sully, M.J., Dozier, B.L., Lhorstorfer, C.F., 1999.Determining the performance of an arid zone radioactive wastesite through site characterization, modeling, and monitoring,Waste management ’99 conference, Tucson, AZ.
Mazi, K., Koussis, A.D., Restrepo, P.J., Koutsoyiannis, D., 2004. Agroundwater-based, objective-heuristic parameter optimisationmethod for a precipitation-runoff model and its application to asemi-arid basin. Journal of Hydrology 290 (3-4), 243–258.
McDonald, M.G., Harbaugh, A.W., 1988. A modular three-dimen-sional finite-difference ground-water flow model. USGS Tech-niques of Water Resour. Inv., book 6, chapter A1.

170 O. Dahan et al.
Mintzker, N., 1997. Policiy of the Development of CapturingStreamflow in Central Arava. Mekorot-Water Company Ltd.,Tel-Aviv (in Hebrew).
Murphey, J.B., Wallace, D.E., Lane, L.J., 1977. Geomorphicparameters predict hydrograph characteristics in the southwest.Water Resources Bulletin 13 (1), 25–38.
Naor, H., Granit, Y., Tzurieli, A., 2003. Central Arava: updating thehydrological and operational situation of the aquifers and wellsfor the year 2002, forecasts until 2006, and recommendationsfor new wells. TAHAL, IL/15010-03, (in Hebrew).
Oren, O., Yechieli, Y., Bohlke, J.K., Dody, A., 2004. Contaminationof groundwater under cultivated fields in an arid environment,central Arava Valley, Israel. Journal of Hydrology 290, 312–328.
Osterkamp, W.R., Lane, L.J., Savared, C.S., 1994. Rechargeestimates using a geomorphic/distributed-parameters simula-tion approach, Amargosa River Basin. Water Resources Research30 (3), 493–507.
Pilgrim, D.H., Chapman, T.G., Doran, D.G., 1988. Problems ofrainfall–runoff modeling in arid and semiarid regions. Hydro-logical Sciences Journal 33 (4), 379–400.
Plummer, L.N., Bexfield, L.M., Anderholm, S.K., Sanford, W.E.,Busenberg, E., 2004. Hydrochemical tracers in the middle RioGrande Basin, USA: 1. Conceptualization of groundwater flow.Hydrogeology Journal 12 (4), 359–388.
Pollock, D.W., 1994. User’s guide for MODPSTH; MODPATH_PLOTversion 3: a particle tracking post-processing package forMODFLOW, the US Geological Survey finite-difference ground-water flow model. USGS Open File Rept. 94-464, variouslypaginated.
Robinson, D.A., Jones, S.B., Wraith, J.M., Or, D., Friedman, S.P.,2003. A review of advances in dielectric and electrical conduc-tivity measurement in soils using time domain reflectometry.Vadose Zone Journal 2, 444–475.
Rosenthal, E., 1995. ‘Arava water potential’ project: summery forthe period 1.9.1995-1.12.1995, Ministry of agriculture andcountry development Netzivut Hamai’m – hydrology survey,Rupin, (in Hebrew).
Rosenthal, E., Adar, E.M., Issar, A.S., Batelaan, O., 1990. Definitionof groundwater flow patterns by environmental tracers in themultiple aquifer system of southern Arava Valley, Israel. Journalof Hydrology 117, 339–368.
Sanford, W., 2002. Recharge and groundwater models: an overview.Hydrogeology Journal 10 (1), 110–120.
Scanlon, B.R., 2004. Evaluation of methods of estimating rechargein semiarid and arid regions in the southwestern US. In: Hogan,J.F., Phillips, F.M., Scanlon, B.R. (Eds.), Groundwater Rechargein a Desert Environment: The Southwestern United States. WaterScience and Application 9. AGU, Washington, DC, pp. 235–354.
Schick, A.P., 1988. Hydrologic aspects of floods in extreme aridenvironments. In: Baker, V.R., Kochel, R.C., Patton, P.C.(Eds.), Flood Geomorphology. Wiley and sons, New York, pp.189–203.
Schwartz, U., 2001. Surface and near-surface responses to floods ina large channel (Nahal Zin) in the context of an alluvial aquifer ina hyper-arid environment. PhD Thesis, Hebrew university ofJerusalem, 135 pp.
Shentsis, I., Meirovich, L., Ben-Zvi, A., Rosenthal, E., 1997.Assessment of transmission lossess in the Tsin water courceand its contribution to the regional aquifer. Hyd/1/97, Hydro-logical Service, State of Israel (in Hebrew).
Shentsis, I., Meirovich, L., Ben-Zvi, A., Rosenthal, E., 1998a.Assessment of transmission lossess in Nahal Neqarot and itstributaries and their contribution to the regional aquifer. Hyd/7/98, Hydrological Service, State of Israel (in Hebrew).
Shentsis, I., Meirovich, L., Ben-Zvi, A., Rosenthal, E., 1998b.Assessment of transmission lossess in Nahal Paran water cource(Halamish-Bottle Neck Reach) and monitoring its contribution tothe regional aquifer. Hyd/10/98, Hydrological Service, State ofIsrael (in Hebrew).
Shentsis, I., Meirovich, L., Ben-Zvi, A., Rosenthal, E., 1999.Assessment of transmission losses and groundwater rechargefrom runoff events in a Wadi under shortage of data on lateralinflow, Negev, Israel. Hydrological Processes 13 (11), 1649–1663.
Simunek, J., Sejna, M., van Genuchten, M.T., 1998. The Hydrus-1Dsoftware package for simulating the one-dimensional movementof water, heat, and multiple solutes in variably-saturatedmedia, Vesion 2.0, IGWMC-TPS-70. International GroundwaterModeling Center, Colorado School of Mines, Golden, CO.
Sorman, A.U., Abdulrazzak, J., 1993. Infiltration-recharge throughWadi beds in arid regions. Hydrological Sciences 38 (3), 173–186.
Topp, G.C., Davis, J.L., Annan, A.P., 1980. Electromagneticdetermination of soil water content: measurements in coaxialtransmition line. Water Resources Bulletin 16, 574–582.
van Genuchten, M.T., 1980. A closed-form equation for predictingthe hydraulic conductivity of unsaturated soils. Soil ScienceSociety of America Journal 44, 892–898.
Walters, M.O., 1990. Transmission losses in arid regions. Journal ofHydraulic Engineering 116 (1), 129–138.
Wilson, L.G., DeCook, K.J., Neuman, S.P., 1980. Regional RechargeResearch for Southwest Alluvial BasinsUS Geological SurveySWAB/RASA Project. The University of Arizona, Tucson, Arizona.
Yechieli, Y., 1987. The geology of the northern Arava Valley andMachmal anticline, Hazeva region. M.Sc. Thesis, Hebrew Uni-versity, Jerusalem.