differential conditioning of alpha amplitude: a fresh look at an old phenomenon
TRANSCRIPT
Differential conditioning of alpha amplitude: A fresh
look at an old phenomenon
Jillene B. Harris*
School of Behavioural Sciences, University of Newcastle, Callaghan, NSW, Australia
Accepted 9 February 2005
Available online 28 March 2005
Abstract
Objective: To determine the latency and development of conditional suppression of alpha amplitude and its relationship to behaviour, alpha
amplitude (8–13 Hz) was measured in a differential conditioning procedure.
Methods: The CSC/K were tones and the US was a photic checkerboard. Alpha amplitude, CNV, RT and verbal responses were recorded
from 12 participants.
Results: The CSC/K difference in acquisition was greatest from 250 ms before the US. It was greatest from the trial where RT declined and
participants could report the CSC/US relationship. There was an amplitude increase in lower band activity 230 ms after the US. This looked
like a VEP but was produced by phase-locked activity starting before the US.
Conclusions: Predicting the US led to cortical priming. Amplitude change in acquisition is congruent with CNV, RT and verbal performance.
Significance: Prediction, expectancy and motor preparation are reflected in changes in alpha activity. These results provide converging
evidence for the functional role of 8–10 Hz activity. They complement the emerging picture of the role of alpha activity in cognition,
indicating that it extends to the acquisition of predictive knowledge.
q 2005 International Federation of Clinical Neurophysiology. Published by Elsevier Ireland Ltd. All rights reserved.
Keywords: Alpha desynchronisation; Event-related desynchronisation; Pavlovian conditioning; Associative learning; Differential conditioning; EEG
Detecting and responding to predictive signals in our
environment is critical for our survival. Predicting the
quality of food on the basis of its colour, the presence of
predators from the evidence of their scent, and the onset of
winter from the fall of leaves, are all cases where learning a
predictive signal has contributed to the survival of our
ancestors. Less dramatic, though no less important
examples occur throughout each day as people learn to
predict what will happen next. The past decade has
witnessed a significant increase in knowledge about the
way that predictive sequences of events are encoded. This
increase has been facilitated by technology with PET, fMRI,
ERP, MEG and EEG all contributing. The research reported
1388-2457/$30.00 q 2005 International Federation of Clinical Neurophysiology.
doi:10.1016/j.clinph.2005.02.003
* Address: School of Social Sciences and Liberal Studies, Charles Sturt
University, The McDonogh Building, Bathurst, NSW 2795, Australia.
Tel.: C61 2 6338 4295; fax: C61 2 6338 4401.
E-mail address: [email protected]
here focused on EEG alpha activity in a human differential
conditioning procedure.
The study of Pavlovian conditioning (Pavlov,
1927/1960) provided a basis for understanding how
predictive learning might take place. By presenting the
learner with two consecutive stimuli, a conditional stimulus
(CS), which does not elicit a response, and an unconditional
stimulus (US), which is response evoking, a conditional
response (CR) is elicited to the CS. It is now widely
acknowledged that the CR indicates that a predictive
relationship has been learned between the CS and US
(Dickinson and Shanks, 1989; Mackintosh, 1977; Rescorla,
1988; Turkan, 1989; Wasserman and Miller, 1997). The
study of conditional changes in alpha amplitude com-
menced soon after the alpha rhythm was first reported
(cf. Putney, 1966). In these studies, a photic visual stimulus
was used as the US as it blocks occipital alpha, or reduces its
amplitude. Conditioning occurs by preceding US onset with
Clinical Neurophysiology 116 (2005) 1433–1443
www.elsevier.com/locate/clinph
Published by Elsevier Ireland Ltd. All rights reserved.
J.B. Harris / Clinical Neurophysiology 116 (2005) 1433–14431434
a neutral auditory or tactile CS, after which the CS came to
elicit conditional alpha suppression.
The term ‘event related desynchronisation’ (ERD) has
been used to describe a reduction in alpha amplitude in a test
epoch (e.g. the ISI) when compared to a baseline level (e.g.
pre-stimulus) (Pfurtscheller, 1977). With the increased
capacity to record data, ERD has been demonstrated to
reflect activation of modality specific cortical regions in
response to the onset of an imperative stimulus (S2) in a
warned RT task. In the period preceding a predicted event,
ERD occurs before a motor response (Pfurtscheller and
Aranibar, 1977; Pfurtscheller and Berghold, 1989; Stancak
and Pfurtscheller, 1996). Further, ERD in the lower band
(8–10 Hz) occurs before S2 in a warned category judgement
task (Klimesch et al., 1992).
The latency of ERD preceding an expected event in these
studies is of interest. This latency has been demonstrated to
coincide with both neural and behavioural activity related to
predicting the US in conditioning. In addition, a delay of
250 ms between CS and US is known to be optimal for
producing conditioned associations (Gormenzano and
Kehoe, 1975). Evidence that significant EEG activity occurs
in this period was more recently demonstrated by Miltner
et al. (1999). They employed a differential conditioning task
where the CS was visual and the US was finger shock and
found that in this period there was coherence between the
area representing fingers and the occipital cortex.
Putney (1973) found that during conditioning, the most
robust conditional alpha suppression occurred just after US
onset. However, given the research on upper and lower band
activity, it seems plausible that a decrease would occur
before the US, and further that it should be greatest in the
lower band. One reason that Putney may have not seen a
decrease before the US is that he did not have a suitable
comparison. It is noteworthy that in Putney’s era, quantify-
ing amplitude involved manual measurement of each alpha
wave, and he used a paradigm which employed a single CS.
Employing a second CS which is not paired with a US
(a CSK) may be a more sensitive way to measure temporal
differences in amplitude. It may also yield more information
about the topography of this response. Moreover, demon-
strating that alpha shows conditional desynchronisation may
help to unite the early conditioning literature on alpha with
the current literature on ERD. It will indicate whether the
results reported for upper and lower band activity extend to
conditioning.
The current research employed a differential design with
a CSC and CSK. The idea was to evaluate the temporal
and topographical characteristics of alpha amplitude during
learning. Participants were required to make a button press
response to the onset of the US. They were also interviewed
at the end of the learning session to see if they could
describe the CSC/US relationship. Additional evidence for
learning was therefore provided by verbal report, RT and the
CNV. The latter is well recognised as being a marker of
learning, with increased negativity occurring in preparation
for a stimulus that requires a response (Hultin et al., 1996;
Rockstroh et al., 1982; Walter et al., 1964).
The current literature distinguishes between different
types of alpha in relation to the onset of a relevant stimulus
(Basar et al., 1997). Evoked alpha occurs in response to a
stimulus and is time-locked to it. This is in contrast to
induced alpha, which occurs in response to a stimulus but is
not time-locked. Basar et al. (1997) have also described
alpha which is emitted. This third type of alpha occurs in
anticipation of a stimulus that is missed. The aim of this
study was to find out what happens to the amplitude of
spontaneous alpha when a person learns to anticipate a
stimulus which suppresses the alpha rhythm. Therefore a
priori, it was difficult to say whether the alpha in question
was evoked, induced or emitted. Further, whether the alpha
response occurred following the US or preceding it, was
also an open question.
The research questions were whether there would be
greater alpha suppression to the CSC when compared to the
CSK, and whether comparing CSC/K would afford
greater sensitivity in detecting amplitude change before
the US. Of specific interest was whether CSC suppression
occurred in the final 250 ms before the US, and whether this
activity would be more prominent within the lower alpha
band. Any change in the amplitude difference between
CSC/K that occurred during acquisition was also of
interest. If alpha can provide information about processes
that occur during acquisition, monitoring change during
learning was a critical observation. The final question
concerned the relationship between the onset of alpha
suppression and behavioural learning: Do they occur
together, or does one precede the other?
1. Method
1.1. Participants
Twelve psychology students from the University of
Newcastle participated in the study in return for course
credit. Their ages ranged from 18 to 39 years. Two
participants were male. Two participants were left-handed.
The study was approved by the Hunter Area Research Ethics
Committee and written informed consent was obtained from
all participants.
1.2. Stimuli
The conditional stimuli (CSC and CSK) were 70 dB
tones with frequencies of 600 and 1200 Hz, counterbalanced
across participants. They were of 2 s duration. The only
difference between these two stimuli was what happened in
acquisition. The CSC was always overlapped by the
unconditional stimulus (US), a photic (10 Hz reversal rate)
black and white checkerboard (rectangles 6.5 cm!5 cm).
It lasted for 1 s duration, and occupied the whole

J.B. Harris / Clinical Neurophysiology 116 (2005) 1433–1443 1435
(32 cm!23 cm) computer screen. Throughout all sessions
of the experiment, except when the US occurred, a blue
fixation cross (4 cm wide!3.5 cm high) appeared on the
screen. Stimulus presentations were co-ordinated by Micro
Experimental Laboratory (MEL) software (Psychology
Software Tools, Inc., 1995), run on an IBM PC Pen-
tium133 MHz computer using Fujitsu ICL Ergo Pro monitor
with a 16.6 ms/frame refresh rate. Tones were presented at
70 dB via Hi Tex CB18 speakers situated 1 m in front of the
participant. A MEL (Psychology Software Tools, Inc.,
1995) response box recorded RT in millisecond.
1.3. Procedure
Participants were seated in a chair 1 m eye distance from
the computer screen. They were asked to refrain from
caffeine products for 1 h prior to testing. The experiment
took place in a dimly lit, sound attenuated room. There was
an initial 5 min resting session, where participants were
given instructions about keeping their eyes on the fixation
point.
The experiment consisted of three sessions: habituation,
acquisition and extinction, in set order with a short break
between each. Habituation and extinction sessions were
identical. Both consisted of tone only trials, 15 of each CSCand CSK. The only difference between these two sessions
was that habituation occurred before the acquisition session,
whilst extinction occurred after it. There were also 15 trials
of each CSC and CSK in the acquisition (learning) session.
The key difference between acquisition and the other
sessions was that the CSC was overlapped 1 s later by the
US. Offset of both CSC and US occurred simultaneously.
Before the start of acquisition the participants were told
that the next part of the experiment was the learning session.
They were asked to try to predict the occurrence of the US,
and to detect a clue that would make prediction easier. The
participants were asked to make a button press response
whenever they saw the US. They were encouraged to
respond quickly. However, in order to keep the epoch
preceding the onset of the US free from movement artifacts,
they were instructed to wait until the US actually occurred.
In each session, trials occurred in pseudo-random order,
with no more than three consecutive presentations of the
same trial type.
A structured interview followed the acquisition session.
It was designed to find out if the participants were aware of
the CSC/US relationship. The questions were:
Could you tell when a checkerboard was about to occur?
How could you tell?
In this experiment there may have been a signal which
indicated that a checkerboard was about to occur. Can
you tell me anything about this signal?
The interview proceeded until it was clear whether or not
the CSC/US relationship could be reported. Those who
could report it were asked how many times they had seen the
checkerboard before they noticed that it was signalled by
one of the tones. Following the interview, the participants
were led to believe that there would be another session
where they would once again be responding to the US. The
extinction session followed with 15 CSC and CSK trials,
identical to the habituation session.
1.4. EEG recording
EEGs were record from sites: Fz, Cz, C3, C4, Pz, P3, P4,
T5, T6, O1, O2 using tin electrodes mounted in an
electrocap, with impedances maintained at 5 kU or less.
The data was referenced offline to averaged mastoids. EEG
signals were amplified via a 32-channel Grass model 12B
amplifier using a bandpass of 0.01–30 Hz and gains of 5000
for frontal and EOG sites and 20,000 for others. Data was
sampled at 500 Hz using Neuroscan Version 4 software.
Eye movements were monitored using four Ag/AgCl
electrodes. Vertical eye movements were recorded above
and below the left eye, and horizontal movements from the
left and right outer canthus.
After a minimum inter-trial interval of 5, 7 or 10 s trial
onset was delayed until the onset of alpha. O1 and O2 were
monitored for alpha activity by a second IBM PC 486DX66
with an RTI800 A/D interface card using Asyst software.
After amplification and bandpass filtering the EEG was
sampled at 50 Hz. The amplitude and latency of peaks and
troughs in the ongoing EEG were recorded.
There were two criteria for alpha:
1.
Three consecutive peak to trough cycles with a durationof 230–375 ms.
2.
The amplitude of each peak trough cycle was greaterthan 10 mV.
Upon detecting alpha, a digital signal was transmitted to
the computer which generated the stimuli. If there was no
alpha after 15 s, a trial was initiated anyway.
This procedure was similar to that documented by Smith
and Putney (1979), however, in this study it was computer
controlled. In addition, a random delay of 50–150 ms was
interposed between the detection of alpha and the initiation
of a trial, so that the presentation of a stimulus was not time-
locked to the phase of the alpha signal.
1.5. Data processing and analyses
1.5.1. Alpha
The continuous EEG data recorded from the 11 sites was
divided into 4096 ms epochs starting 1000 ms before the
onset of the CS until 1096 ms after the offset of the US. Eye
artifact correction was performed using the Gratton et al.
(1983) procedure. The data were baseline corrected over the
entire epoch and linear ramp functions were removed. It
was fast Fourier transformed (FFT), then a bandpass filter
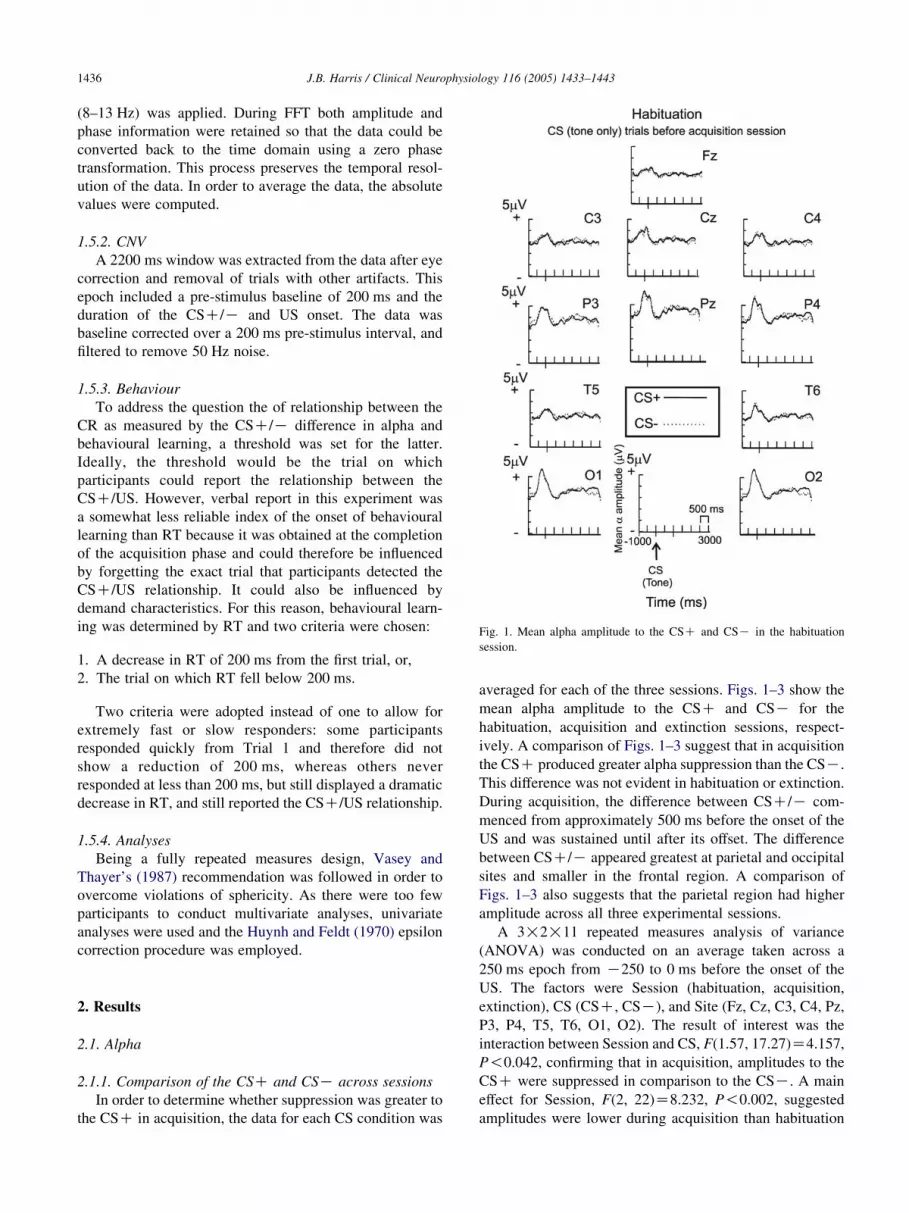
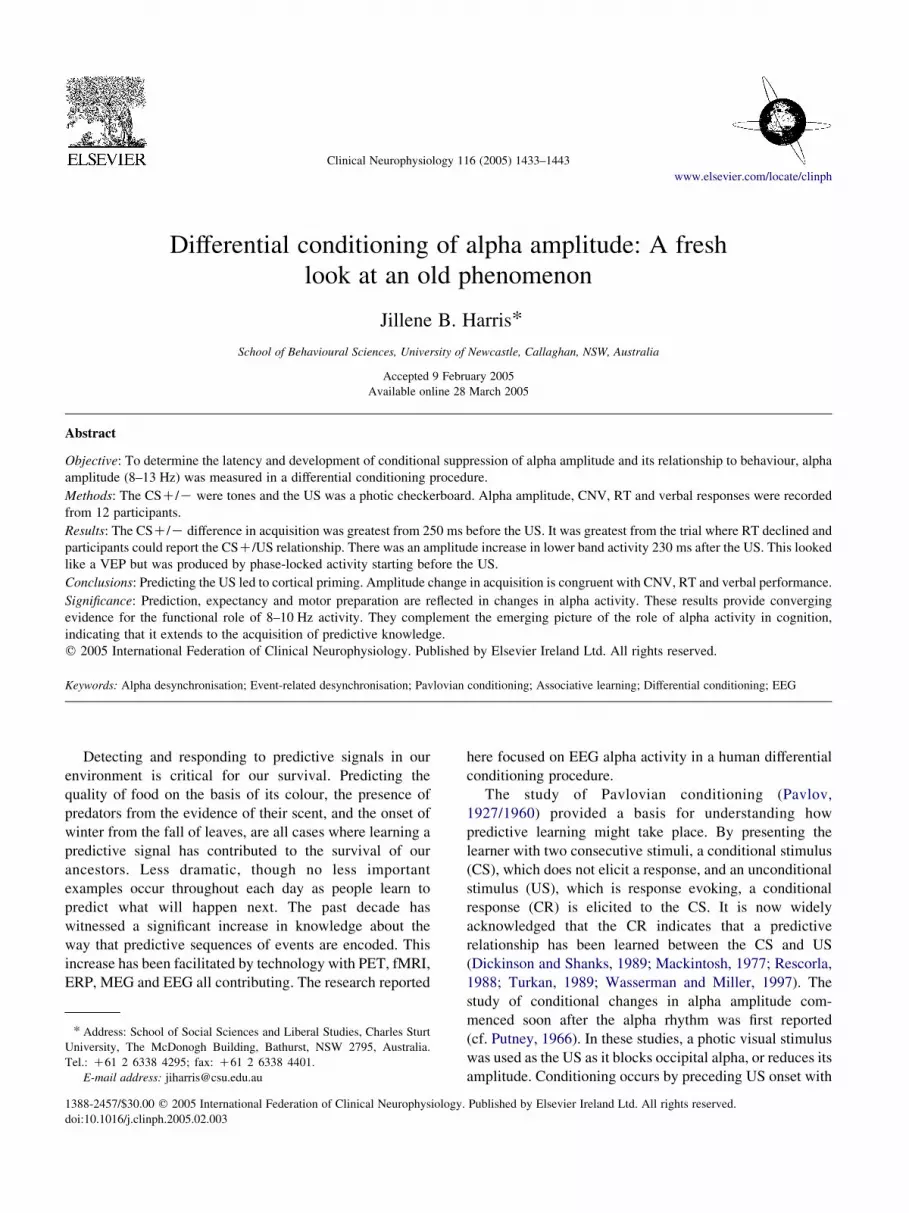
Fig. 1. Mean alpha amplitude to the CSC and CSK in the habituation
J.B. Harris / Clinical Neurophysiology 116 (2005) 1433–14431436
(8–13 Hz) was applied. During FFT both amplitude and
phase information were retained so that the data could be
converted back to the time domain using a zero phase
transformation. This process preserves the temporal resol-
ution of the data. In order to average the data, the absolute
values were computed.
1.5.2. CNV
A 2200 ms window was extracted from the data after eye
correction and removal of trials with other artifacts. This
epoch included a pre-stimulus baseline of 200 ms and the
duration of the CSC/K and US onset. The data was
baseline corrected over a 200 ms pre-stimulus interval, and
filtered to remove 50 Hz noise.
1.5.3. Behaviour
To address the question the of relationship between the
CR as measured by the CSC/K difference in alpha and
behavioural learning, a threshold was set for the latter.
Ideally, the threshold would be the trial on which
participants could report the relationship between the
CSC/US. However, verbal report in this experiment was
a somewhat less reliable index of the onset of behavioural
learning than RT because it was obtained at the completion
of the acquisition phase and could therefore be influenced
by forgetting the exact trial that participants detected the
CSC/US relationship. It could also be influenced by
demand characteristics. For this reason, behavioural learn-
ing was determined by RT and two criteria were chosen:
session.
1. A decrease in RT of 200 ms from the first trial, or,2.
The trial on which RT fell below 200 ms.Two criteria were adopted instead of one to allow for
extremely fast or slow responders: some participants
responded quickly from Trial 1 and therefore did not
show a reduction of 200 ms, whereas others never
responded at less than 200 ms, but still displayed a dramatic
decrease in RT, and still reported the CSC/US relationship.
1.5.4. Analyses
Being a fully repeated measures design, Vasey and
Thayer’s (1987) recommendation was followed in order to
overcome violations of sphericity. As there were too few
participants to conduct multivariate analyses, univariate
analyses were used and the Huynh and Feldt (1970) epsilon
correction procedure was employed.
2. Results
2.1. Alpha
2.1.1. Comparison of the CSC and CSK across sessions
In order to determine whether suppression was greater to
the CSC in acquisition, the data for each CS condition was
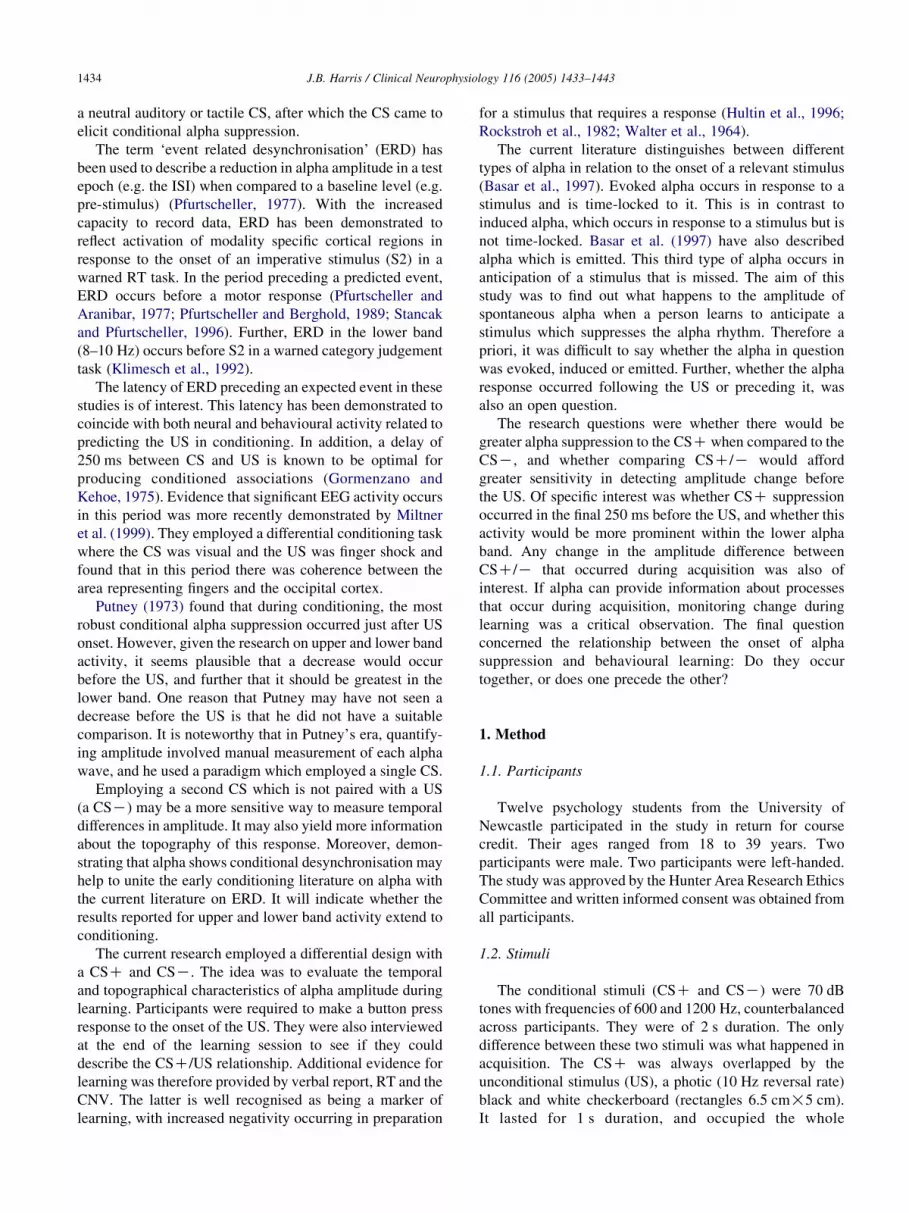
averaged for each of the three sessions. Figs. 1–3 show the
mean alpha amplitude to the CSC and CSK for the
habituation, acquisition and extinction sessions, respect-
ively. A comparison of Figs. 1–3 suggest that in acquisition
the CSC produced greater alpha suppression than the CSK.
This difference was not evident in habituation or extinction.
During acquisition, the difference between CSC/K com-
menced from approximately 500 ms before the onset of the
US and was sustained until after its offset. The difference
between CSC/K appeared greatest at parietal and occipital
sites and smaller in the frontal region. A comparison of
Figs. 1–3 also suggests that the parietal region had higher
amplitude across all three experimental sessions.
A 3!2!11 repeated measures analysis of variance
(ANOVA) was conducted on an average taken across a
250 ms epoch from K250 to 0 ms before the onset of the
US. The factors were Session (habituation, acquisition,
extinction), CS (CSC, CSK), and Site (Fz, Cz, C3, C4, Pz,
P3, P4, T5, T6, O1, O2). The result of interest was the
interaction between Session and CS, F(1.57, 17.27)Z4.157,
P!0.042, confirming that in acquisition, amplitudes to the
CSC were suppressed in comparison to the CSK. A main
effect for Session, F(2, 22)Z8.232, P!0.002, suggested
amplitudes were lower during acquisition than habituation
Fig. 2. Mean alpha amplitude to the CSC and CSK in the acquisition
session.
Fig. 3. Mean alpha amplitude to the CSC and CSK in the extinction
session.
J.B. Harris / Clinical Neurophysiology 116 (2005) 1433–1443 1437
or extinction. There was no main effect for CS, F(1, 11)Z3.78, P!0.08.
A key question in this study was whether there were
differences in alpha amplitude across the scalp, and in
particular during acquisition. There was no three-way
interaction, F(4, 44.05)Z1.65, P!0.180, indicating that
the pattern of greater suppression to the CSC during
acquisition occurred throughout the scalp. However, both
two-way interactions involving Site, Session and Site,
F(7.11, 78.25)Z3.054, P!0.007, and CS and Site,
F(3.46, 38.06)Z3.433, P!0.022, indicated that even
though alpha suppression to the CSC during acquisition
was a distributed effect, the difference between CSC and
CSK was greater in some regions than in others.
One question about the two-way interactions involving
Site is whether they stem from overall differences in alpha
amplitude across the scalp. The data confirmed this idea
with a main effect for Site, F(2.61, 28.68)Z9.296,
P!0.0001. Inspection of the means indicated that within
each region there were no differences between sites. For
example there was no difference between C3, Cz and C4 in
the central region. The main effect occurred because
amplitudes were higher in the parietal region and lower at
Fz. This raised the possibility that the interactions involving
Site were a by-product of this overall power difference.
Inspection of the data indicated that in both of the
interactions involving Site, the region with the highest
amplitude, the parietal region, showed the greatest differ-
ence between CSC and CSK during acquisition. Hence,
regions with greatest alpha power showed effects of greatest
magnitude.
Two other features of these data warrant comment. First,
in both CSC/K conditions and all three phases, there was
an increase in amplitude just before CS onset. This increase
reflected the initiation of trials upon detection of alpha.
Thus, the increase occurred because there was alpha in this
period on the majority of trials. The second feature was a
positive deflection in the CSC condition that occurred in
acquisition, approximately 130 ms after the onset of the US.
The latency and polarity of this deflection suggested that it
was a visual evoked potential (VEP).
2.1.2. Upper and lower band activity
To analyse the upper (11–13 Hz) and lower (8–10 Hz)
frequency bands, three 250 ms epochs were extracted from
the averaged data from the acquisition session. The first was
the period immediately before the US (Pre; K250 to 0 ms),
the second was immediately after it (Post1; 0–250 ms),
J.B. Harris / Clinical Neurophysiology 116 (2005) 1433–14431438
and a third, Post2 was from 350 to 600 ms after the US. In
conditioning terms, Pre and Post1 reflect the CR, whereas
Post2 reflects the UR (Putney, 1973). A 2!3!2!11
repeated measures ANOVA was conducted on these data.
The factors were Frequency (upper band (11–13 Hz), and
lower band (8–10 Hz)), Time (Pre, Post1, and Post2), CS
(CSC and CSK), and Site (Fz, Cz, C3, C4, Pz, P3, P4, T5,
T6, O1, and O2).
The main interest in this analysis was whether there were
differences between upper and lower band alpha in relation
to the onset of the US. That is, do the CR and the
unconditional response manifest in a different frequency
range.
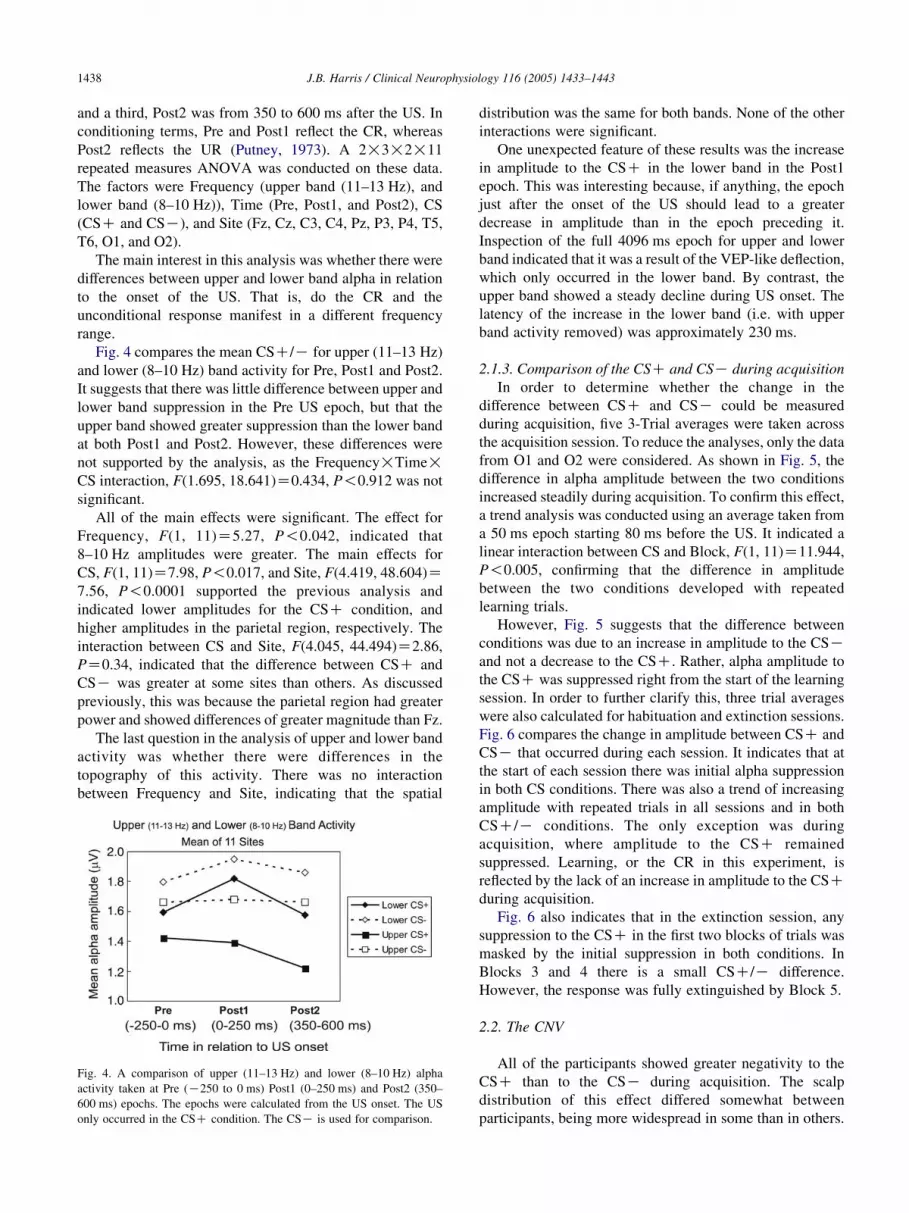
Fig. 4 compares the mean CSC/K for upper (11–13 Hz)
and lower (8–10 Hz) band activity for Pre, Post1 and Post2.
It suggests that there was little difference between upper and
lower band suppression in the Pre US epoch, but that the
upper band showed greater suppression than the lower band
at both Post1 and Post2. However, these differences were
not supported by the analysis, as the Frequency!Time!CS interaction, F(1.695, 18.641)Z0.434, P!0.912 was not
significant.
All of the main effects were significant. The effect for
Frequency, F(1, 11)Z5.27, P!0.042, indicated that
8–10 Hz amplitudes were greater. The main effects for
CS, F(1, 11)Z7.98, P!0.017, and Site, F(4.419, 48.604)Z7.56, P!0.0001 supported the previous analysis and
indicated lower amplitudes for the CSC condition, and
higher amplitudes in the parietal region, respectively. The
interaction between CS and Site, F(4.045, 44.494)Z2.86,
PZ0.34, indicated that the difference between CSC and
CSK was greater at some sites than others. As discussed
previously, this was because the parietal region had greater
power and showed differences of greater magnitude than Fz.
The last question in the analysis of upper and lower band
activity was whether there were differences in the
topography of this activity. There was no interaction
between Frequency and Site, indicating that the spatial
Fig. 4. A comparison of upper (11–13 Hz) and lower (8–10 Hz) alpha
activity taken at Pre (K250 to 0 ms) Post1 (0–250 ms) and Post2 (350–
600 ms) epochs. The epochs were calculated from the US onset. The US
only occurred in the CSC condition. The CSK is used for comparison.
distribution was the same for both bands. None of the other
interactions were significant.
One unexpected feature of these results was the increase
in amplitude to the CSC in the lower band in the Post1
epoch. This was interesting because, if anything, the epoch
just after the onset of the US should lead to a greater
decrease in amplitude than in the epoch preceding it.
Inspection of the full 4096 ms epoch for upper and lower
band indicated that it was a result of the VEP-like deflection,
which only occurred in the lower band. By contrast, the
upper band showed a steady decline during US onset. The
latency of the increase in the lower band (i.e. with upper
band activity removed) was approximately 230 ms.
2.1.3. Comparison of the CSC and CSK during acquisition
In order to determine whether the change in the
difference between CSC and CSK could be measured
during acquisition, five 3-Trial averages were taken across
the acquisition session. To reduce the analyses, only the data
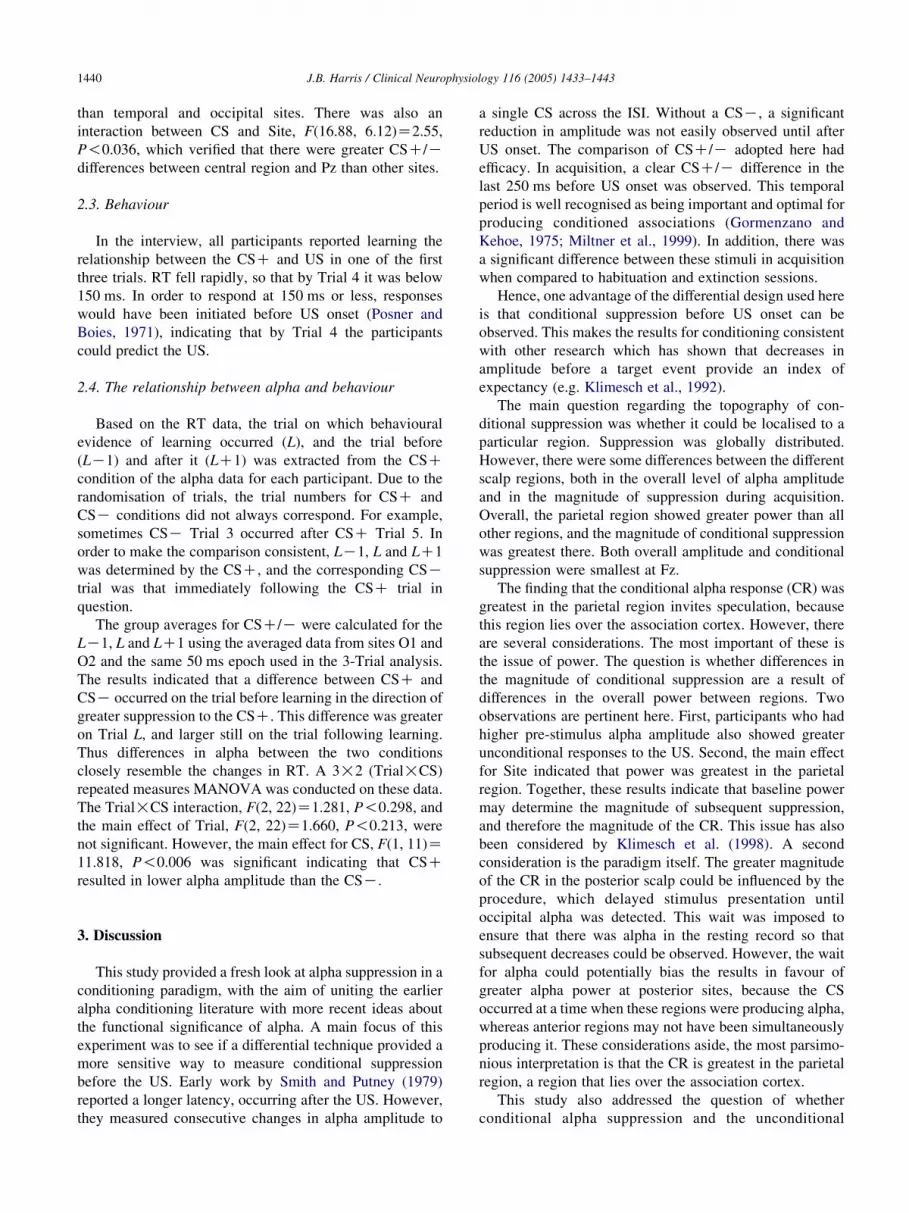
from O1 and O2 were considered. As shown in Fig. 5, the
difference in alpha amplitude between the two conditions
increased steadily during acquisition. To confirm this effect,
a trend analysis was conducted using an average taken from
a 50 ms epoch starting 80 ms before the US. It indicated a
linear interaction between CS and Block, F(1, 11)Z11.944,
P!0.005, confirming that the difference in amplitude
between the two conditions developed with repeated
learning trials.
However, Fig. 5 suggests that the difference between
conditions was due to an increase in amplitude to the CSKand not a decrease to the CSC. Rather, alpha amplitude to
the CSC was suppressed right from the start of the learning
session. In order to further clarify this, three trial averages
were also calculated for habituation and extinction sessions.
Fig. 6 compares the change in amplitude between CSC and
CSK that occurred during each session. It indicates that at
the start of each session there was initial alpha suppression
in both CS conditions. There was also a trend of increasing
amplitude with repeated trials in all sessions and in both
CSC/K conditions. The only exception was during
acquisition, where amplitude to the CSC remained
suppressed. Learning, or the CR in this experiment, is
reflected by the lack of an increase in amplitude to the CSCduring acquisition.
Fig. 6 also indicates that in the extinction session, any
suppression to the CSC in the first two blocks of trials was
masked by the initial suppression in both conditions. In
Blocks 3 and 4 there is a small CSC/K difference.
However, the response was fully extinguished by Block 5.
2.2. The CNV
All of the participants showed greater negativity to the
CSC than to the CSK during acquisition. The scalp
distribution of this effect differed somewhat between
participants, being more widespread in some than in others.
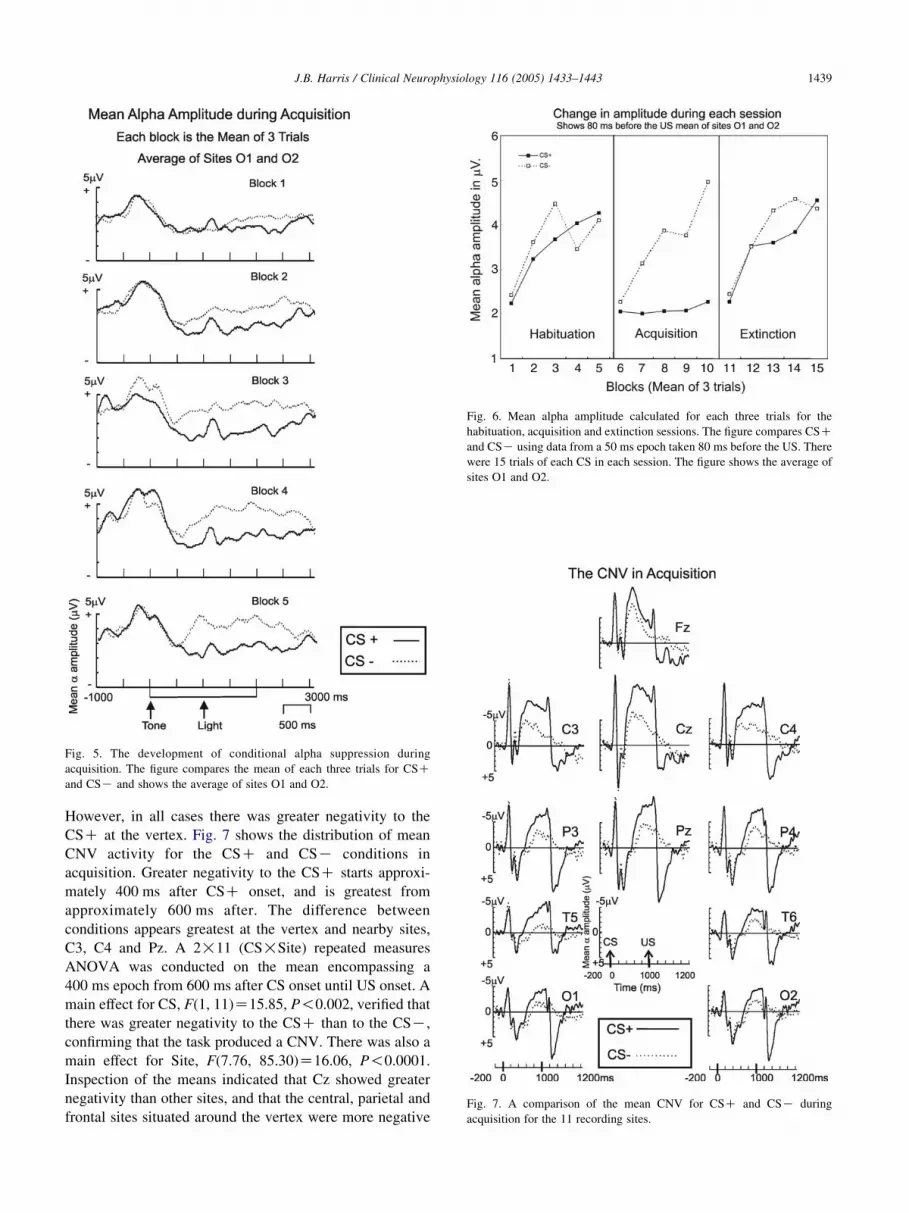
Fig. 6. Mean alpha amplitude calculated for each three trials for the
habituation, acquisition and extinction sessions. The figure compares CSC
and CSK using data from a 50 ms epoch taken 80 ms before the US. There
were 15 trials of each CS in each session. The figure shows the average of
sites O1 and O2.
Fig. 7. A comparison of the mean CNV for CSC and CSK during
acquisition for the 11 recording sites.
Fig. 5. The development of conditional alpha suppression during
acquisition. The figure compares the mean of each three trials for CSC
and CSK and shows the average of sites O1 and O2.
J.B. Harris / Clinical Neurophysiology 116 (2005) 1433–1443 1439
However, in all cases there was greater negativity to the
CSC at the vertex. Fig. 7 shows the distribution of mean
CNV activity for the CSC and CSK conditions in
acquisition. Greater negativity to the CSC starts approxi-
mately 400 ms after CSC onset, and is greatest from
approximately 600 ms after. The difference between
conditions appears greatest at the vertex and nearby sites,
C3, C4 and Pz. A 2!11 (CS!Site) repeated measures
ANOVA was conducted on the mean encompassing a
400 ms epoch from 600 ms after CS onset until US onset. A
main effect for CS, F(1, 11)Z15.85, P!0.002, verified that
there was greater negativity to the CSC than to the CSK,
confirming that the task produced a CNV. There was also a
main effect for Site, F(7.76, 85.30)Z16.06, P!0.0001.
Inspection of the means indicated that Cz showed greater
negativity than other sites, and that the central, parietal and
frontal sites situated around the vertex were more negative
J.B. Harris / Clinical Neurophysiology 116 (2005) 1433–14431440
than temporal and occipital sites. There was also an
interaction between CS and Site, F(16.88, 6.12)Z2.55,
P!0.036, which verified that there were greater CSC/Kdifferences between central region and Pz than other sites.
2.3. Behaviour
In the interview, all participants reported learning the
relationship between the CSC and US in one of the first
three trials. RT fell rapidly, so that by Trial 4 it was below
150 ms. In order to respond at 150 ms or less, responses
would have been initiated before US onset (Posner and
Boies, 1971), indicating that by Trial 4 the participants
could predict the US.
2.4. The relationship between alpha and behaviour
Based on the RT data, the trial on which behavioural
evidence of learning occurred (L), and the trial before
(LK1) and after it (LC1) was extracted from the CSCcondition of the alpha data for each participant. Due to the
randomisation of trials, the trial numbers for CSC and
CSK conditions did not always correspond. For example,
sometimes CSK Trial 3 occurred after CSC Trial 5. In
order to make the comparison consistent, LK1, L and LC1
was determined by the CSC, and the corresponding CSKtrial was that immediately following the CSC trial in
question.
The group averages for CSC/K were calculated for the
LK1, L and LC1 using the averaged data from sites O1 and
O2 and the same 50 ms epoch used in the 3-Trial analysis.
The results indicated that a difference between CSC and
CSK occurred on the trial before learning in the direction of
greater suppression to the CSC. This difference was greater
on Trial L, and larger still on the trial following learning.
Thus differences in alpha between the two conditions
closely resemble the changes in RT. A 3!2 (Trial!CS)
repeated measures MANOVA was conducted on these data.
The Trial!CS interaction, F(2, 22)Z1.281, P!0.298, and
the main effect of Trial, F(2, 22)Z1.660, P!0.213, were
not significant. However, the main effect for CS, F(1, 11)Z11.818, P!0.006 was significant indicating that CSCresulted in lower alpha amplitude than the CSK.
3. Discussion
This study provided a fresh look at alpha suppression in a
conditioning paradigm, with the aim of uniting the earlier
alpha conditioning literature with more recent ideas about
the functional significance of alpha. A main focus of this
experiment was to see if a differential technique provided a
more sensitive way to measure conditional suppression
before the US. Early work by Smith and Putney (1979)
reported a longer latency, occurring after the US. However,
they measured consecutive changes in alpha amplitude to
a single CS across the ISI. Without a CSK, a significant
reduction in amplitude was not easily observed until after
US onset. The comparison of CSC/K adopted here had
efficacy. In acquisition, a clear CSC/K difference in the
last 250 ms before US onset was observed. This temporal
period is well recognised as being important and optimal for
producing conditioned associations (Gormenzano and
Kehoe, 1975; Miltner et al., 1999). In addition, there was
a significant difference between these stimuli in acquisition
when compared to habituation and extinction sessions.
Hence, one advantage of the differential design used here
is that conditional suppression before US onset can be
observed. This makes the results for conditioning consistent
with other research which has shown that decreases in
amplitude before a target event provide an index of
expectancy (e.g. Klimesch et al., 1992).
The main question regarding the topography of con-
ditional suppression was whether it could be localised to a
particular region. Suppression was globally distributed.
However, there were some differences between the different
scalp regions, both in the overall level of alpha amplitude
and in the magnitude of suppression during acquisition.
Overall, the parietal region showed greater power than all
other regions, and the magnitude of conditional suppression
was greatest there. Both overall amplitude and conditional
suppression were smallest at Fz.
The finding that the conditional alpha response (CR) was
greatest in the parietal region invites speculation, because
this region lies over the association cortex. However, there
are several considerations. The most important of these is
the issue of power. The question is whether differences in
the magnitude of conditional suppression are a result of
differences in the overall power between regions. Two
observations are pertinent here. First, participants who had
higher pre-stimulus alpha amplitude also showed greater
unconditional responses to the US. Second, the main effect
for Site indicated that power was greatest in the parietal
region. Together, these results indicate that baseline power
may determine the magnitude of subsequent suppression,
and therefore the magnitude of the CR. This issue has also
been considered by Klimesch et al. (1998). A second
consideration is the paradigm itself. The greater magnitude
of the CR in the posterior scalp could be influenced by the
procedure, which delayed stimulus presentation until
occipital alpha was detected. This wait was imposed to
ensure that there was alpha in the resting record so that
subsequent decreases could be observed. However, the wait
for alpha could potentially bias the results in favour of
greater alpha power at posterior sites, because the CS
occurred at a time when these regions were producing alpha,
whereas anterior regions may not have been simultaneously
producing it. These considerations aside, the most parsimo-
nious interpretation is that the CR is greatest in the parietal
region, a region that lies over the association cortex.
This study also addressed the question of whether
conditional alpha suppression and the unconditional

J.B. Harris / Clinical Neurophysiology 116 (2005) 1433–1443 1441
response to the US would manifest at different frequency
ranges. Regarding upper and lower band alpha activity, the
main difference occurred in the interval immediately
following the US (Post1) in the CSC condition, where an
increase in amplitude in the lower band contrasted with the
steadily decreasing amplitude of the upper band. This
difference is related to the VEP, given its polarity and
latency, and because the US was visual. In most other
respects, there was little difference between upper and lower
band alpha. Both displayed greater suppression to the CSCwhen compared to the CSK, and there was little difference
between them in two of the three time periods that were
evaluated (Pre and Post2). They also displayed a similar
spatial distribution. These results seem inconsistent with
Klimesch et al. (1992) research. Instead, these authors
reported that suppression in the upper band is more strictly
localised than the lower band and less active before a target
event. The results from this study could therefore indicate
that, the differences between upper and lower band activity
that occur in warned RT tasks do not occur in conditioning.
However, it seems more plausible that the lack of difference
between frequency bands may have been due to the overlap
of a number of processes all occurring in the period before
the US. Both motor preparation (Pfurtscheller and Berghold,
1989; Pfurtscheller et al., 1996), and preparation for
visual processing (Pfurtscheller et al., 1994), are known to
produce upper band ERD, in modality specific regions. The
current task would engage motor, auditory and visual
systems along with associative processes. As a result, there
may have been suppression at various sub-frequencies and
in distributed modalities, but in sum, they manifested
as suppression across the full 8–13 Hz range in a broad
scalp distribution.
The technique of comparing the CSC/K in considering
upper and lower band activity adopted here differs from the
ERD method that is more typically reported (Pfurtscheller
and Aranibar, 1977). The reason for choosing the current
method was that it provided an optimal way of measuring
conditional amplitude change. Having done so, these results
contribute to the findings of research which has used ERD
and shown decreases in amplitude before a target event (e.g.
Klimesch et al., 1992). In most of this research, the effect of
expectancy has not been assessed with a control for the
effect of the modality of the warning stimulus itself. By
employing a CSK, this study demonstrates that there is
greater alpha suppression in the lead up to an expected
target, even when the effect of the modality of the warning
stimulus is controlled for. It therefore provides converging
evidence for ERD research, and bolsters the finding of
amplitude suppression in expectation of a target event.
A further difference in this study was that the onset of
CSC and CSK stimuli were contingent upon occipital
alpha production within a limited timeframe. This is an
important difference with the potential to bias the results.
For example, as previously mentioned, this may have biased
the topography effects toward greater power and differences
in the posterior scalp. A comparison of both behavioural and
EEG results during alpha present and alpha absent
conditions would provide more reliable results regarding
the functional significance of the alpha oscillations during
conditioning.
A key aim in the current research was to see if
measurement of changes in alpha amplitude were sensitive
enough to monitor differences during the acquisition
session. The goal here was to measure changes in alpha
activity during learning. The data indicated that the
difference in alpha amplitude between CSC and CSKemerged on approximately the fourth trial and increased
with repeated presentations. However, the change between
conditions occurred through an increase in amplitude to the
CSK, while the CSC amplitude remained suppressed.
Examining the data from the habituation and extinction
sessions revealed that the CS initially produces alpha
suppression in all sessions. The most likely interpretation of
this response is orienting, which dishabituates at the start of
each new session. This initial suppression was followed by
an increase in amplitude due to habituation in all conditions
and sessions except for one. Suppression to the CSC in
acquisition did not habituate. This finding suggests that the
CR occurred after several trials in the acquisition session,
and was evident by the lack of an increase in amplitude to
the CSC.
The current experiment therefore demonstrates that the
method is sufficiently sensitive to measure changes in
cortical activation during acquisition. It adds to the growing
knowledge about the neural basis of associative learning
which have investigated neural activity during acquisition
(Armony and Dolan, 2002; Fletcher et al., 2001; Miltner
et al., 1999; Montaldi et al., 1998; Morris et al., 2001;
Ploghaus et al., 2000; Ramnani et al., 2000; Rose et al.,
2001; Sadato et al., 1998).
Converging evidence that alpha suppression in this
experiment was due to predictive learning was provided
by behavioural evidence (RT and verbal report) and by the
CNV which is widely acknowledged as an index of cortical
expectancy (Rockstroh et al., 1982). The group data
indicated greater CNV negativity to the CSC than to the
CSK. Indeed, all of the participants who showed CSC/Kdifferences in alpha amplitude also showed a greater CNV
to the CSC. This invites the question of whether alpha
suppression and the CNV index the same underlying
process.
The differences in the topography of alpha and the CNV
alone suggest that they are underpinned by different
processes. Alpha power and suppression were greatest in
the parietal region, whereas CNV differences were greatest
at the vertex. Evidence from similar studies has also drawn
this conclusion (Grunewald-Zuberbier et al., 1978; Hultin
et al., 1996; Mantanus et al., 1981; Pfurtscheller and
Aranibar, 1977). Only one study, Mantanus et al. (1981),
found a negative correlation between the amplitude of the
early CNV and the percentage of alpha suppression.

J.B. Harris / Clinical Neurophysiology 116 (2005) 1433–14431442
Of those studies where alpha suppression and the CNV have
occurred together, fairly simple manipulations of the
paradigm (e.g. removing the motor response) have produced
a dissociation between them (Grunewald-Zuberbier et al.,
1978; Pfurtscheller and Aranibar, 1977). It has been
suggested that the CNV in simple paradigms like the
current one, is most likely a product of motor preparation
(Grunewald- Zuberbier et al., 1978). By contrast, Putney et
al. (1972) have demonstrated that alpha suppression in the
occipital region was attenuated but still significant in the
absence of a motor response to the US. This suggests that
alpha suppression is not solely due to motor preparation.
However, the results reported here did not distinguish
between alphas that are sensitive to particular types of
stimulation. Considering the Mu rhythm which is specific to
motor activity (Kuhlman, 1978), may yield a different result.
Regarding the question of whether alpha is reflecting
significant aspects of associative learning it is useful to
consider these results in relation to those reported in other
frequencies. In learning, the encoding and integration
of associative relationships has also been linked to theta
(4–7 Hz) and gamma (O20 Hz) activity. Regarding theta,
Klimesch (1999) has suggested that synchronisation reflects
the introduction of cortical activation via cortico-hippo-
campal feedback loops, and has demonstrated that task-
related increases in theta power are related to the successful
encoding of new information in episodic memory
(Klimesch, 1999; Klimesch et al., 1994). Klimesch (1999)
has noted that alpha and theta dissociate on tasks of
cognitive performance, with superior cognitive and memory
performance related to an increase in theta power and a
decrease in alpha power. Regarding alpha, Klimesch (1999)
has proposed that widespread desynchronisation at the
scalp, as reflected by a decrease in amplitude in the current
task, indicates decoupling of neural assemblies. He suggests
that this occurs when smaller functional areas are engaging
in Type II synchronisation. This synchronisation occurs in
smaller functional units and is suggested to reflect
information processing. Thus the decrease in amplitude to
the CSC in the current task should coincide with a
simultaneous increase in theta synchronisation, and
Type II alpha synchronisation.
Gamma activity has been implicated in the formation of
associations between event and outcome in both operant and
Pavlovian conditioning. In an operant shaping procedure,
Keil et al. (2001) provided monetary reinforcement for
participants based on their ability to make a response 3 s
after a signal. Performance was compared in three
conditions, in one of these it was contingent on the accuracy
of the timed response. They found that following the
response there was an increase in 20–30 Hz activity in the
left frontal region in the contingent condition. PET studies
have also reported activity in this region, and have
suggested that it is integral in the representation of the
contingency between response and reinforcement (Molchan
et al., 1994). While in a Pavlovian differential conditioning
procedure Miltner et al. (1999) found that greater gamma
coherence occurred between the visual areas receiving
inputs from CSC/K and the region receiving input for
finger shock. This activity occurred in the final 250 ms
before US onset. In conditioning terms this is precisely both
when and where the representation of the association
between CS and US would be expected. The current study
also showed that the difference between CSC/K in alpha
amplitude commenced at approximately the same latency.
The dynamic coherence measures of gamma used by
Miltner et al. (1999) and the measurement of alpha
amplitude reported here are not directly comparable. Even
so, these two results appear to provide converging evidence
of a coupling process in a window well recognised as
optimal for producing CS/US associations.
The question is whether alpha may be reflecting a
specific dimension of stimulus encoding, such as timing of
the US, or whether it reflects the processing of more abstract
features of this relationship? Here Klimesch (1999) has
suggested that alpha and theta activity reflect the integration
of more abstract comparisons between features. The idea
that alpha and theta have a role in top-down processing
related to expectancy and behaviourally relevant stimuli,
has also been proposed by von Stein et al. (2000).
In summary, the current experiment demonstrates that
like S1–S2 paradigms and warned RT tasks, when an event
can be predicted, cortical areas become activated in
preparation (Pfurtscheller and Klimesch, 1992), and further,
that this activity is closely related to behavioural learning.
The finding that changes in alpha closely reflects beha-
vioural performance further exemplifies that the current
method provides a useful index of associative processes.
The current study therefore adds to earlier research reported
by Putney (1973) in three respects. First, it provides an
alternative method to measure the latency of conditional
alpha suppression. Second, it provides information about the
topography of the response. Third, it unites the early
literature on alpha conditioning with the more recent
literature on the functional role of upper and lower band
activity.
References
Armony JL, Dolan RJ. Modulation of spatial attention by fear conditioned
stimuli: an event related fMRI study. Neuropsychologia 2002;40:
817–26.
Basar E, Schurmann M, Basar-Eroglu C, Karakas S. Alpha oscillations in
brain functioning: an integrative theory. Int J Psychophysiol 1997;26:
5–29.
Dickinson A, Shanks D. Animal conditioning and human causality
judgement. In: Nilsson LG, Archer T, editors. Perspectives on
aversively motivated behavior. Hillsdale, NJ: Lawrence Erlbaum;
1989. p. 167–91.
Fletcher PC, Anderson JM, Shanks DR, Honey R, Carpenter T, Donovan T,
Papadakis N, Bullmore ET. Responses to human frontal cortex to
surprising events are predicted by formal associative learning theory.
Nat Neurosci 2001;10:1043–8.
J.B. Harris / Clinical Neurophysiology 116 (2005) 1433–1443 1443
Gormenzano I, Kehoe EJ. Classical conditioning: some methodological-
conceptual issues. In: Estes WK, editor. Handbook of learning and
cognitive processes, vol. 2. Hillsdale, NJ: Lawrence Erlbaum; 1975. p.
143–79.
Gratton G, Coles MGH, Donchin E. A new method for off-line removal of
ocular artifact. Electroencephalogr Clin Neurophysiol 1983;55:468–84.
Grunewald-Zuberbier E, Grunewald G, Rasche A, Netz J. Contingent
negative variation and alpha attenuation responses in children with
different abilities to concentrate. Electroencephalogr Clin Neurophysiol
1978;44:37–47.
Hultin L, Rossini P, Romani GL, Hogstedt P, Tecchio F, Pizella V.
Neuromagnetic localization of the late component of the negative
contingent variation. Electroencephalogr Clin Neurophysiol 1996;98:
435–48.
Huynh H, Feldt LS. Conditions under which the mean square ratios in
repeated measures designs have exact F distributions. J Am Stat Assoc
1970;65:1582–9.
Keil A, Muller MM, Gruber T, Weinbruch C, Elbert T. Human large-scale
oscillatory activity during an operant shaping procedure. Brain Res
Cogn Brain Res 2001;12:397–407.
Klimesch W. EEG alpha and theta oscillations reflect cognitive and
memory performance: a review and analysis. Brain Res Brain Res Rev
1999;29:169–95.
Klimesch W, Pfurtscheller G, Schimke H. Pre- and post-stimulus processes
in category judgement tasks as measured by event-related desynchro-
nization (ERD). J Psychophysiol 1992;6:185–203.
Klimesch W, Schimke H, Schwaiger J. Episodic and semantic memory: an
analysis in the EEG-theta and alpha band. Electroencephalogr Clin
Neurophysiol 1994;91:428–41.
Klimesch W, Doppelmayr M, Russegger H, Pachinger J, Schwaiger J.
Induced alpha band power changes in the human EEG and attention.
Neurosci Lett 1998;244:73–6.
Kuhlman WN. Functional topography of the human mu rhythm.
Electroencephalogr Clin Neurophysiol 1978;44:83–93.
Mackintosh NJ. Conditioning as the perception of causal relations. In:
Butts RE, Hintika J, editors. Foundation problems in the special
sciences. Dortrecht: Reidel; 1977. p. 241–50.
Mantanus H, Timsit-Berthier M, Gerono A, von Frenckell R. A correlation
study of contingent negative variation, reaction time and EEG power
spectrum in control and pathological populations. Biol Psychol 1981;
13:227–39.
Miltner WH, Braun C, Arnold M, Witte H, Taub E. Coherence of gamma-
band EEG activity as a basis for associative learning. Nature 1999;397:
434–6.
Molchan SE, Sunderland T, McIntosh AR, Herscovitch P, Schreurs BG. A
functional anatomical study of associative learning in humans. Proc
Natl Acad Sci USA 1994;91:8122–6.
Montaldi D, Mayes AR, Barnes A, Pirie H, Hadley DM, Patterson J,
Wyper DJ. Associative encoding of pictures activates the medial
temporal lobes. Hum Brain Mapp 1998;6:85–104.
Morris JS, Buchel C, Dolan RJ, Wyper DJ. Parallel neural responses in
amygdala subregions and sensory cortex during implicit fear con-
ditioning. Neuroimage 2001;13:1044–52.
Pavlov IP. Conditioned reflexes (GV Anrep Trans). NY: Dover; 1960
(Original work published 1927).
Pfurtscheller G. Graphical display and statistical evaluation of event-related
desynchronization (ERD). Electroencephalogr Clin Neurophysiol 1977;
43:757–60.
Pfurtscheller G, Aranibar A. Event-related cortical desynchronization
detected by power measurements of scalp EEG. Electroencephalogr
Clin Neurophysiol 1977;42:817–26.
Pfurtscheller G, Berghold A. Patterns of cortical activation during planning
of voluntary movement. Electroencephalogr Clin Neurophysiol 1989;
72:250–8.
Pfurtscheller G, Klimesch W. Event-related synchronisation and desyn-
chronisation of alpha and beta waves in a cognitive task. In: Basar E,
Bullock TH, editors. Induced rhythms in the brain. Boston, MA:
Birkhauser; 1992. p. 117–28.
Pfurtscheller GD, Flotzinger D, Neuper C. Differentiation between finger,
toe and tongue movement in man based on 40 Hz EEG. Electro-
encephalogr Clin Neurophysiol 1994;90:456–60.
Pfurtscheller G, Stancak Jr A, Neuper Ch. Event-related synchronization
(ERS) in the alpha band—an electrophysiological correlate of cortical
idling: a review. Int J Psychophysiol 1996;24:39–46.
Ploghaus A, Tracey I, Clare S, Gati JS, Rawlins JNP, Mathews PM.
Learning about pain: the neural substrate of the prediction error for
aversive events. Proc Natl Acad Sci USA 2000;97(16):9281–6.
Posner MI, Boies SJ. Components of attention. Psychol Rev 1971;78:
391–408.
Psychology Software Tools, Inc. Micro experimental laboratory. Pittsburg,
PA: Author; 1995.
Putney RT. A quantitative evaluation of conditioned blocking, enhance-
ment, and inhibition of reinforcement of the alpha rhythm. [Disser-
tation]. Columbia (MO):University of Missouri; 1966. [Dissertation
Abstracts International B27(09)3317:67–930].
Putney RT. Conditioned alpha blocking re-examined with the measurement
of individual wave amplitudes. Electroencephalogr Clin Neurophysiol
1973;34:485–93.
Putney RT, Erwin TJ, Smith TS. The facilitation of conditioned alpha
blocking with an overt response. Psychon Sci 1972;26:16–18.
Ramnani N, Toni I, Josephs O, Ashburner J, Passingham RE. Learning and
expectation-related changes in the human brain during motor learning.
J Neurophysiol 2000;84(6):3026–35.
Rescorla RA. Pavlovian conditioning: it’s not what you think it is. Am
Psychol 1988;43:151–60.
Rockstroh B, Elbert T, Birbaumer N, Lutzenberger W. Slow brain
potentials and behavior. Baltimore, MD: Urban & Schwartzenberg;
1982.
Rose M, Verleger R, Wascher E. ERP correlates of associative learning.
Psychophysiology 2001;38:440–50.
Sadato N, Nakamura S, Oohashi T, Nishina E, Fuwamoto Y, Waki A,
Yonekura Y. Neural networks for generation and suppression of alpha
rhythm: a PET study. Neuroreport 1998;9:893–7.
Smith ST, Putney RT. Temporal factors in the sensitivity of the alpha
rhythm to habituation and conditioning. Physiol Psychol 1979;7:381–6.
Stancak Jr A, Pfurtscheller G. The effects of handedness and type of
movement on the contralateral preponderance of m-rhythm desynchro-
nisation. Electroencephalogr Clin Neurophysiol 1996;99:174–82.
Turkan JS. Classical conditioning: the new hegemony. Behav Brain Sci
1989;12:121–79.
Vasey MW, Thayer JF. The continuing problem of false positives in
repeated measures ANOVA in psychophysiology: a multivariate
solution. Psychophysiology 1987;24:479–86.
von Stein A, Chiang C, Kionig P. Top-down processing mediated by
interareal synchronization. Proc Natl Acad Sci USA 2000;97:1448–53.
Walter WG, Cooper R, Alderidge VJ, McCallum WC, Winter AL.
Contingent negative variation: an electric sign of sensorimotor
association and expectancy in the human brain. Nature 1964;203:
380–4.
Wasserman EA, Miller RR. What’s elementary about associative learning?
Ann Rev Psychol 1997;48:573–607.