air conditioning
TRANSCRIPT

UNIVERSITY OF MAURITIUS
Faculty of Engineering
Mechanical and Production Engineering Department
Programme: BEng (Hons) Mechanical Engineering
Module: REFRIGERATION, AIR CONDITIONING & ENERGY SYSTEMS
Module Code: MECH 4004Y
Assignment: 1
Name ID
BUNDHOO Hemrajsingh 1218587
LUXIMON Tejusvin 1243228
MUSTUN Sultan 1213309
RUGGOO Amar Kumar 1218592
Date of submission: 28.04.16

2
Table of Contents 1.0 Introduction ............................................................................................................................... 3
2.0 Basic Mechanisms and Principles ............................................................................................. 3
2.1 Inverter air conditioners ........................................................................................................ 4
2.2 Air conditioner as a heater .................................................................................................... 5
3.0 Types of air conditioning system ............................................................................................... 5
3.1 Split systems ........................................................................................................................... 5
3.2 Heat pumps ............................................................................................................................ 5
3.3 Packaged central air conditioners ......................................................................................... 5
3.4 Ductless mini-split systems .................................................................................................... 6
4.0 Health and safety ....................................................................................................................... 6
4.1 Humidity ................................................................................................................................ 7
4.2 Temperature/Humidity Ranges for Comfort ........................................................................ 8
4.3 BS 15780 and R22 .................................................................................................................. 8
4.4 Guidelines for air in the workplace ....................................................................................... 8
4.5 BS 15780 duct cleanliness ...................................................................................................... 9
4.6 The Montreal Protocol and R22 compliance......................................................................... 9
4.7 Air conditioning contingency planning ................................................................................. 9
4.8 Servicing and maintenance .................................................................................................. 10
5.0 Load Calculation...................................................................................................................... 11
5.1 Cooling load for walls, roofs and through glass .................................................................. 11
5.2 Solar load through glass ...................................................................................................... 11
5.3 Cooling load from partitions, ceilings and floors ................................................................ 11
6.0 Heat Transfer coefficient of different materials ..................................................................... 11
7.0 Heat gained from external wall ............................................................................................... 12
7.1 Area of Windows.................................................................................................................. 12
7.2 Area of External Walls ........................................................................................................ 13
7.3 Determination of the LM values .......................................................................................... 14
7.4 Heat gained from windows .................................................................................................. 16
7.5 Heat gained from roof.......................................................................................................... 17
8.0 Using software for load and flow calculations ........................................................................ 18
9.0 Cost Analysis ............................................................................................................................ 24
References ...................................................................................................................................... 25
Appendix ........................................................................................................................................ 26

3
1.0 Introduction Thermal comfort and good indoor air quality has always been a prevailing factor when
designing a building as with a better environment people tend to have a better work
productivity. Heating, Ventilating, and Air-Conditioning (HVAC) systems helps provide
close control of indoor air quality and overall room temperature through the use of
mechanical or heat-activated equipment. Most of the time a single system should provide
both the cooling and dehumidification so as to maintain good comfort conditions in the
building (O’Neal and Bryant, 2001 sec.4.2). But with the improvement of the standard of
living, expectations has gone beyond just space cooling or heating as demands for HVAC
systems that optimizes room comfort and provide a healthy indoor environment, reduces
energy consumption and maintenance costs, as well as provide a control flexibility are the
new norm.
2.0 Basic Mechanisms and Principles
Figure 1: Air Conditioner

4
Explanation: Every air conditioner (also pronounced as AC, A/C or Air Cooler in certain
regions of the world) has got a compressor inside it. It works to compress and pump the
refrigerant gas. Compression of refrigerant produces heat. To dissipate this heat, compressed
refrigerant is pumped to the condenser coils where a fan blows the heat out to outer
atmosphere. During this process, refrigerant takes the liquid form. This liquid refrigerant is
pumped towards expansion valve. Expansion valve has a temperature sensor connected to it
which works in correlation with thermostat settings. Expansion valve releases the appropriate
amount of refrigerant to evaporator (cooling coils) where liquefied refrigerant takes gaseous
form. Conversion from liquid to gaseous state due to expansion causes cooling because
energy is absorbed from the surrounding. Air when passes through fins (attached to coils)
gets cooled and blown to the room. The gaseous refrigerant in cooling coils then enters the
compressor and gets compressed once again. The cycle continues unless the compressor is
shut down.
In a nutshell, air conditioner draws heat from the indoor and releases it to the outdoor. Indoor
acts as a source and outdoor as a sink for heat.
In vehicle air conditioners, a Receiver-Drier is installed between condenser and expansion
valve. It serves to collect excessive refrigerant when not required for cooling operation. It
also has got a desiccant which absorbs any moisture present in the refrigerant.
2.1 Inverter air conditioners These air conditioners use an inverter to control the speed of compressor. Electricity is first
rectified to DC (direct current) and then inverted back to required frequency AC (alternating
current) using pulse width modulation. Thus compressor speed can increase and decrease
according to the room temperature. Such air conditioners are extremely energy efficient and
consume approximately 30-50 % less electricity than old fashioned air conditioners. If a 1 ton
non-inverter air conditioner consumes constant 1600 Watts of electricity, inverter air
conditioner consumes less than variable 800-1100 Watts depending upon the temperature of
room. Such air conditioners are expensive due to additional machinery inside them but cost is
slowly recovered in electricity bills. Their other benefits include quiet operation, faster
cooling, no indoor temperature fluctuations and no voltage peaks caused by compressor.

5
2.2 Air conditioner as a heater
When air conditioner is used as a heater, the process which is shown and explained above just
simply gets reversed. As a result of reverse mechanism, hot air is propelled towards indoor
and cool air towards outdoor.
3.0 Types of air conditioning system
3.1 Split systems
These are the most common type of central air conditioner found in the U.S. Inside the house,
tucked in a cabinet, is the evaporator coil, which removes heat and moisture from the air.
Outside the house, a metal case contains the condenser coil, which releases the heat, and the
compressor, which pumps refrigerant between the two coils.
The indoor component of the air conditioner is connected to a network of ducts, and a blower
circulates the cold air through them to reach all parts of the house. This type of system is the
most economical to install in a house with a central furnace, because it can share the
ductwork used by the heating system. All of the central air conditioner systems in this report
are split systems.
3.2 Heat pumps
These are a variation of the traditional split system. During hot summer months, it pumps
heat from the house and releases it outside. In the wintertime, it extracts heat from the
outdoor air and uses it to warm the house.
Because of that, heat pumps can be used effectively for both heating and cooling in mild
climates. However, heat pumps do not generally work well when temperatures stay below
freezing for a long time, so they are not the best choice for cold climates. A specialized type
of heat pump, called a ground-source or geothermal heat pump, could be an option for colder
environments. It works by drawing heat out of the ground rather than the air. However, while
long term energy savings can be impressive, a geothermal heat pump costs much more than
other types of HVAC systems and not every contractor is familiar with or capable of doing
the installation.
3.3 Packaged central air conditioners
These combine the evaporator, condenser and compressor in a single unit. The air conditioner
is usually placed on a roof or a concrete slab near the foundation. Ducts running through the

6
exterior wall or roof draw air from inside the house and return cooled air indoors. This type
of air conditioner can also be used in small commercial buildings. When combined with a set
of heating coils or a natural gas furnace, it eliminates the need for a separate furnace inside
the building.
3.4 Ductless mini-split systems
These can be a good choice for houses that do not have ductwork. Like a basic split system,
the ductless mini-split combines an outdoor compressor and condenser with one or more
indoor air-handling units. These units are mounted high on the wall and have blowers
attached. Tubing connects the indoor and outdoor units and circulates refrigerant between
them. Each indoor unit is installed in a separate room and cools that room only, much like a
window air conditioner.
The main advantage of ductless mini-split systems is that they can be installed without
tearing up walls to install ductwork. They also allow the flow of cold air to be controlled
independently in each room (or shut off altogether in empty rooms). If used to cool an entire
house, mini-split systems are more expensive than ducted central air conditioning systems,
costing roughly 30 percent more for the same amount of cooling power. However, they are
also more efficient, since they avoid the energy loss associated with ductwork.
4.0 Health and safety
Generally, the temperature should vary according to the outside temperature, and should be
changed month by month. Mostly, it should be about 21 or 22 degrees, and it is suggested
that this would be a good place to start. Adjustments should then be made from that point,
checking that the air conditioning reaches all areas in the office, and that windows receiving
substantial quantities of sunlight are not causing problems.
Recent research undertaken in the Netherlands (on building efficiency) found however, that
women generally are more comfortable if the temperature is closer to 25 degrees C - about 3
degrees warmer than men. This too should be taken into account.
There is more information in the Australian Standard AS1668.2: The use of ventilation and
air-conditioning in buildings - Ventilation design for indoor air contaminant control.

7
Often the problem is that the air conditioning units need servicing, or that the rate and
direction of air flow are unsatisfactory.
Recommendations to improve thermal comfort:
Regulate air conditioning for temperature and humidity;
Avoid locating workstations directly in front of or below air conditioning outlets;
Install deflectors on air vents to direct airflow away from people. These measure will
prevent staff being annoyed by draughts;
Control direct sunlight (radiant heat) with blinds, louvres and the like;
Minimise draughts and thermal differences between the head and the feet (thermal
gradients);
Ensure adequate air flow. Feelings of stuffiness can result when air flow is low, and
draughts result when air flow is high. An air flow rate of between 0.1 and 0.2 metres
per second is desirable.
4.1 Humidity
With regard to humidity, if it is too high this will cause discomfort (excessive perspiration,
exacerbation of the effects of high temperature, feelings of 'closeness', etc) and if it's too low
it can cause respiratory problems. Optimum humidity levels are between 40% and 60% - but
in any case they should be kept between 30% and 70%. Humidity levels below 40% will
begin to cause problems for workers with conditions such as sinusitis. (Advice: from the
CSA Standard CAN/CSA Z412-00 (R2005) which gives acceptable ranges of temperature
and relative humidity for offices in Canada. These values are the same as recommended by
the American Society of Heating, Refrigerating, and Air Conditioning Engineers (ASHRAE)
Standard 55 - 2010 "Thermal Environmental Conditions for Human Occupancy". )

8
4.2 Temperature/Humidity Ranges for Comfort Table 1: Source: Canadian Centre for Occupational Health and Safety - Adapted from ASHRAE 55-
2010.
Conditions Relative humidity Acceptable Operating
Temperature
Summer (Light clothing) If 30% then
If 60% then
24.5 - 28 °C
23 - 25.5 °C
Winter (Warm clothing) If 30% then
If 60% then
20.5 - 25.5 °C
20 - 24 °C
If people are unhappy then the health and safety representative should approach management
to request that the following things be checked:
whether the system is working properly or needs maintenance, adjustment etc;
the temperature in various places within the building (this can vary according to a
number of things, including radiant heat, where the thermostats are located, etc);
air flow;
Humidity.
This is a duty under Section 21(4) (d) of the OHS Act: "monitor the conditions at any
workplace under the control and management of the employer.
4.3 BS 15780 and R22
2013 is The European Environment Agency’s (EEA) “Year of Air,” but air pollution and the
resultant health issues are not just an outdoor environment issue. Following the introduction
of British standard for cleanliness for cleanliness levels in the HVAC sector BS 15780 and
with the R22 deadline looming, facilities managers and anyone involved in the maintenance
of non-domestic property should be aware of what will be required of them in the next 18
months.
4.4 Guidelines for air in the workplace
The Health & Safety Executive guidelines state that between 13°C (56°F) and 30°C (86°F) is
the legally required temperature for the workplace. Relative humidity is required to be kept at
around 50%, with at least 10 litres per second per person of fresh air and 0.1-0.5 meters per

9
second air movement speed. To meet these criteria most companies will need to use air
conditioning systems.
4.5 BS 15780 duct cleanliness
Previous legislation regarding the cleanliness of ductwork did not have properly measurable,
standardized assessment criteria. However, the new BS 15780 has changed this, making it
very clear what is and what is not acceptable, in terms of air conditioning duct cleanliness.
The new legislation assesses the need and frequency of cleaning as well as how to inspect
systems and assess the outcome.
It is therefore important that employers and facilities managers ensure ductwork is inspected
and compliant levels of cleanliness maintained, especially following installation,
modification or refurbishment. Minimum standards of cleanliness depend on the type of
space being ventilated, from low occupancy storage rooms to tightly regulated hospital
treatment areas.
4.6 The Montreal Protocol and R22 compliance
The R22 legislation is another upcoming issue, with the Montreal Protocol phasing out ozone
depleting R22 HCFC refrigerant. It aims to reduce HCFC use by 90% by 2015.
HCFCs have been linked to thinning of the ozone, so reducing HCFC use is beneficial to the
environment. As a replacement, R417A is being used across much of Europe. The American
Society of Heating, Refrigerating and Air-Conditioning Engineers (ASHRAE) have given it
an A1/A1 rating. It is non-hazardous and can be used with mineral, alkyl benzene or fully
synthetic lubricants.
4.7 Air conditioning contingency planning
When R22 is phased out and maintenance is performed to comply with BS 15780, there is
likely to be a significant period where air conditioning units are disabled. In a tightly
regulated occupancy or during a period of hot weather, this could be potentially damaging to
business processes and efficiency. Compromised air quality condition, which could be in
breach of Health & Safety Executive Guidelines, lead to a loss of productivity and,
ultimately, potential litigation.
One of the simplest ways to mitigate these risks is to always have a contingency plan in
place. A good contingency plan would include ensuring that an employer is in contact with a

10
specialist air conditioning hire company who can guarantee suitable equipment can be
installed within an extremely short time frame.
By reviewing the British Standard and R22 legislation now and creating an appropriate action
plan, employers can pre-empt any potential issues in the most cost effective and efficient way
possible.
4.8 Servicing and maintenance
● Use suitable equipment for recovery, recycling, evacuation and charging when maintaining
or servicing air-conditioning systems;
● Train employees in the use of such equipment and supervise them where necessary;
● Train all staff involved in the emergency action for dealing with a spillage or release of gas,
particularly how to treat frostbite;
● Do not overfill containers of refrigerant and do store them in a safe place away from direct
heat;
● Never mix R12 and R134a when recharging the system;
● Do not deliberately release R12 or R134a to atmosphere;
● Do not allow hot work or smoking in areas near the refrigerant. The refrigerant must not be
allowed to come into contact with a hot surface;
● Wear appropriate personal protective equipment (PPE) at all times, including eye
protection and gloves. Consult the refrigerant supplier to ensure that the PPE will provide
adequate protection.

11
5.0 Load Calculation
5.1 Cooling load for walls, roofs and through glass
𝑞 = 𝑈 ∗ 𝐴 ∗ 𝐶𝐿𝑇𝐷
U = Design heat transfer coefficient for wall, roof and glass
A =Area of wall, roof or glass calculated from building plans
CLTD =corrected cooling load temperature difference for wall, roof or glass
5.2 Solar load through glass
𝑞 = 𝐴 ∗ 𝑆𝐶 ∗ 𝑆𝐶𝐿
SC = Shading Coefficient
SCL = solar cooling load factor with no interior shade or with shade
5.3 Cooling load from partitions, ceilings and floors
𝑞 = 𝑈 ∗ 𝐴 ∗ (𝑡𝑏 − 𝑡𝑟𝑐)
U = Design heat transfer coefficient for partition, ceiling or floor
A = Area of partition, ceiling or floor calculated from building plans
tb = temperature in adjacent space
trc = Inside temperature (constant) in conditioned space
6.0 Heat Transfer coefficient of different materials
Table 2: Heat Transfer coefficient of different materials
Materials Thermal Resistance, R (m2K/W)
Wall (200 mm high density Concrete Block) 0.196
Wall (100 mm concrete block) 0.142
Rendering (Stucco) 0.037
Inside Air 0.121
Outside air 0.059
Window 0.175

12
7.0 Heat gained from external wall
7.1 Area of Windows
The areas of the windows are obtained by the following formula:
Area = Height * breadth
The dimensions of all the window structures were 900mm * 2000mm.
Table 3: Area of Windows
Glass
Ground Floor Room Window Wall Face Area/m2
1a 2 W 3.3
1b 3 W 3.3
1c 5 S 3.3
2a 6 S 3.3
2b 8 E 6.6
1st floor 3a 10 E 3.3
11 N 9.9
12 W 3.3

13
7.2 Area of External Walls
The areas of the external wall surfaces were obtained from the subtraction of the area of the
windows from the actual area of the side considered. These are recorded in the table below.
Table 4: Area of External Walls
Mauritius being situated at around 20° South latitude, the CLTD values which are at a
latitude of 40° North are corrected using the equation below:
𝐶𝐿𝑇𝐷𝑐𝑜𝑟𝑟𝑒𝑐𝑡𝑒𝑑 = 𝐶𝐿𝑇𝐷 + 𝐿𝑀 + (25.5 − 𝑡𝑟) + (𝑡𝑚 − 29.4)
tr = inside temperature
tm = mean outdoor temperature
= mean outdoor temperature – ((daily range) / 2)
= 30 – ((30 – 24) /2)
= 28°C
Given tr = 24°C and tm = 27.5°C
𝐶𝐿𝑇𝐷𝑐𝑜𝑟𝑟𝑒𝑐𝑡𝑒𝑑 = 𝐶𝐿𝑇𝐷 + 𝐿𝑀 + (25.5 − 24) + (28 − 29.4)
𝐶𝐿𝑇𝐷𝑐𝑜𝑟𝑟𝑒𝑐𝑡𝑒𝑑 = 𝐶𝐿𝑇𝐷 + 𝐿𝑀 + (25.5 − 24) + (28 − 29.4)
𝐶𝐿𝑇𝐷𝑐𝑜𝑟𝑟𝑒𝑐𝑡𝑒𝑑 = 𝐶𝐿𝑇𝐷 + 𝐿𝑀 − 1.4
Area of External Surface
Room Wall
Wall
Face Area/m
2
Ground
Floor 1a 1
N 10
2 W 7
1b 3 W 7
4 S 8.2
1c 5 S 9.9
2a 6 S 8.2
2b 7 S 5.9
8 E 14
9 N 14
Room
Area
First
Floor 3a 10
N 33
11 W 7.9
12 E 7.9
3b 13 E 10
14 S 19
3c 15 S 13

14
7.3 Determination of the LM values LM is calculated using from interpolation of standard values from ASHRAY. The values are
taken for the month of June.
Latitude North East/West South
0 12 -3 -8
8 9 -2 -7
16 6 -1 0
24 3 0 -6
32 1 0 -4
40 1 1 -1
The values are then interpolated to obtain for a latitude of 20° south for Mauritius.
The corrected values for LM are as follows:
Table 5: LM values
Direction oC
North 2.3
East/West -0.2
South -1.7
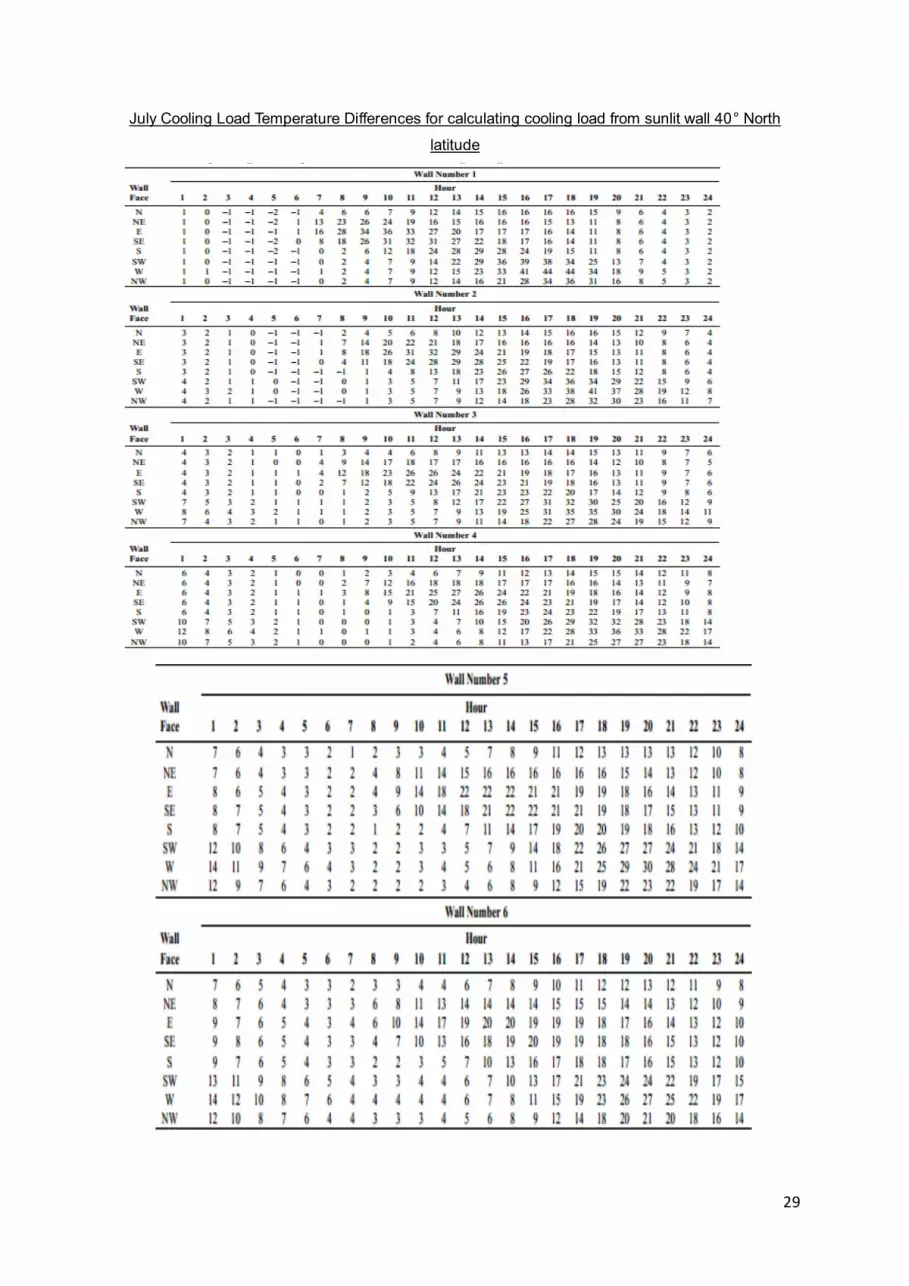
The wall number is take to be number 3.
Hour
Direction 8 9 10 11 12 13 14 15 16 17 18
North 3 4 4 6 8 9 11 13 13 14 14
East 12 18 23 26 26 24 22 21 19 18 17
South 1 2 5 9 13 17 21 23 23 22 20
West 1 2 3 5 7 9 13 19 25 31 35
Using the equation below, the corrected CLTD values are shown below:
𝐶𝐿𝑇𝐷𝑐𝑜𝑟𝑟𝑒𝑐𝑡𝑒𝑑 = 𝐶𝐿𝑇𝐷 + 𝐿𝑀 − 1.4
Hour
Direction 8 9 10 11 12 13 14 15 16 17 18
North 3.9 4.9 4.9 6.9 8.9 9.9 11.9 13.9 13.9 14.9 14.9
East 10.4 16.4 21.4 24.4 24.4 22.4 20.4 19.4 17.4 16.4 15.4
South -0.6 0.4 3.4 7.4 11.4 15.4 19.4 21.4 21.4 20.4 18.4
West -2.1 -1.1 -0.1 1.9 3.9 5.9 9.9 15.9 21.9 27.9 31.9

15
The heat gained from the external walls are calculated. These are shown in the table below:
Table 6: Heat gained from external walls
Room Wall
Wall Face
Area Overall
R U 8 9 10 11 12 13 14 15 16 17 18 max
Ground Floor
1a 1 N
10 0.45 2.22 98.5 123.8 123.8 174.3 224.8 250.1 300.6 351.2 351.2 376.4 376.4 376.4
2 W 7 0.45 2.22 -37.3 -19.5 -1.8 33.7 69.2 104.7 175.7 282.2 388.7 495.1 566.1 566.1
1b 3 W 7 0.45 2.22 -37.3 -19.5 -1.8 33.7 69.2 104.7 175.7 282.2 388.7 495.1 566.1 566.1
4 S 8.2 0.45 2.22 -12.4 8.3 70.5 154.4 236.3 319.2 402.1 443.6 443.6 422.8 381.4 443.6
1c 5 S 9.9 0.45 2.22 -15 10 85.2 185.5 285.7 385.9 486.2 536.3 536.3 511.3 461.1 536.3
2a 6 S 8.2 0.45 2.22 -12.4 8.3 70.2 152.7 235.3 317.8 400.4 441.7 441.7 421 379.8 441.7
2b 7 S 5.9 0.45 2.22 -9 6 50.8 110.6 170.4 230.1 290 319.8 319.8 304.8 275 319.8
8 E 14 0.45 2.22 374.4 590.5 770.5 878.5 878.5 806.5 734.5 690.5 626.5 590.5 554.5 878.5
9 N 14 0.45 2.22 142.4 178.9 178.9 251.9 324.9 361.4 434.4 507.4 507.4 543.9 543.9 543.9
Room
Area
First Floor
3a 10 N
33 0.45 2.22 326.3 410 410 577.5 744.8 828.5 995.9 1163.3 1163.3 1247 1247 1247
11 W 7.9 0.45 2.22 -41.9 -22 -2 38 78 118 198 317.9 437.8 557.8 637.8 637.8
12 E 7.9 0.45 2.22 207.9 327.9 427.8 487.8 487.8 447.8 407.8 387.8 347.8 327.8 307.8 487.8
3b 13 E 10 0.45 2.22 265.4 418.5 546 622.6 622.6 571.5 520.5 495 444 418.5 392.9 622.6
14 S 19 0.45 2.22 -29 19.4 164.6 358.1 551.7 745.3 938.9 1035.7 1035.7 987.3 890.5 1035.7
3c 15 S 13 0.45 2.22 -20 -13.3 113.4 246.7 380.1 513.4 646.8 713.5 713.5 680.1 613.5 713.5

16
7.4 Heat gained from windows
Taking Uglass to be 5.7 W/m2.K, the heat gained is calculated and shown in the table below:
Table 7: Heat gained from windows
Glass
q
Ground Floor Room window
Wall Face Area U 8 9 10 11 12 13 14 15 16 17 18
1a 2 W 3.3 5.7 -39.3 -20.6 -1.9 35.6 73 110.5 185.4 297.7 410.1 522.4 597.3
1b 3 W 3.3 5.7 -39.3 -20.6 -1.9 35.6 73 110.5 185.4 297.7 410.1 522.4 597.3
1c 5 S 3.3 5.7 -11.2 7.5 63.7 138.6 213.5 288.4 363.3 400.7 400.7 382 344.5
2a 6 S 3.3 5.7 -11.2 7.5 63.7 138.6 213.5 288.4 363.3 400.7 400.7 382 344.5
2b 8 E 6.6 5.7 389.4 614.2 801.4 913.8 913.8 838.8 763.8 726.5 651.6 614.2 576.7
1st floor 3a 10 E 3.3 5.7 194.7 307.1 400.7 456.9 456.9 419.4 382 363.3 325.8 307.1 288.4
11 N 9.9 5.7 219.1 275.3 275.3 387.6 500 556.1 668.5 780.8 780.8 836.9 836.9
12 W 3.3 5.7 -39.3 -20.6 -1.9 35.6 73 110.5 185.4 297.7 410.1 522.4 597.3

17
7.5 Heat gained from roof
From ASHRAE 1997 Standard table, the roof having a 32 cm thickness and made up of heavy weight concrete is determine to be of the type 2.
R = 0.45 K.m2/W
U is determined as R = 1/U
Using the CLTDcorrected equation and LM to be -0.2, the values are tabulated below:
Hr 8 9 10 11 12 13 14 15 16 17 18
CLTD 1 2 3 5 7 9 13 19 25 31 35
Cltd
corrected -0.6 0 1.4 3.4 5.4 7.4 11.4 17.4 23.4 29.4 33.4
Table of cooling load for roof
Table 8: Heat gained from roof
Roof Area q
3a 66.56 -88 58 204 495.7 787.3 1078.9 1662.1 2536.9 3411.7 4286.5 4869.7
3b 26.67 -35 24 82 199.5 316.8 434.2 668.9 1020.9 1372.8 1725 1959.7
3c 18.38 -24 16 57 137.5 218.4 299.2 461 703.6 946.2 1188.8 1350.6

18
8.0 Using software for load and flow calculations
The calculations were based on the above mentioned building and to further enhance the
latter, a simulation using the software DesignBuilder was carried out. To start with, a 2D plan
of the building was drawn in Autodesk Autocad and imported in the former software, along
with the required input parameters and the simulation was run.
Figure 2: 2D layout of the ground floor
Figure 3: 2D layout of the first floor

19
For simulation purposes the 3D model was simplified with the removal of the partitions in the
building, which were not taken into consideration, as carried out with the manual calculation
of cooling load, with the exception of the toilet and stairs. The cooling load for each floors
were required and hence a cooling design simulation has been carried out and the results are
shown in Figure 3 and Table 1. For each floor their respective number of occupants, types of
activities carried out and lightings were inserted as parametric inputs.
Figure 4: Results from DesignBuilder for the cooling load
Table 9: Results from the cooling load simulation
Zone
Design
Capacity
(kW)
Design Flow
Rate (m3/s)
Total Cooling
Load (kW)
Sensible
(kW)
Latent
(kW)
Air
Temperature
(°C)
Ground
Level 14.298 9.925 12.433 11.928 0.506 25
First
Floor 6.547 4.551 5.693 5.473 0.220 25
Total: 28.45 14.476 18.126 17.401 0.725 25
From the above Table 1, representing the simulated load in the building, the obtained total
value of cooling load was compared with the value obtained from manual calculation. The
total cooling load from manual calculation is 27.5 kW while the cooling load from the

20
software DesignBuilder is 28.45 KW and the percentage difference between these two values
is 3.5% which point out that the results showed the same trend.
Further simulations for solar insolation and flow within the building were computed using
Autodesk Simulation CFD. The following figures were the output results for the solar
insolation at location 20.2569S and 57.4167E:
Figure 5: Global result for the solar insolation
In the above Figure 4, the X-axis represents the north, and thus it can be shown that during
midday the southern face of the building is in complete shadow.

21
Figure 6: Global view of the solar insolation through the glass windows and doors
Figure 7: Top view of the ground floor representing the infiltration through the doors and
windows
The above two figures depict the maximum casted solar insolation through the glass doors
and windows at midday for the above mentioned coordinate points, and were calculated for
the 10th of January 2016, and Figure 6 represents the infiltration through each of the doors
and sliding windows for the ground floor of the building.

22
In order to investigate the flow of air within the rooms of the building, a final simulation was
undertaken with the implementation of the system, and the flow within each room and ducts
were computed as shown below:
Figure 8: Global view of a planar section through the building
Figure 9: Frontal view of the trace plots of the particles in the system, throughout both floors

23
Figure 10: Vector flow velocities on the ground floor
Figure 11: Vector flow velocities on the first floor
Figure 9 and 10 show the vector representation of the velocities on the ground and first floor
respectively. At no point in the above simulated flows, were the velocities of any concern in
terms of speed which would otherwise cause a noise disturbance.

24
9.0 Cost Analysis
The following costing table is derived from company Rey and Lenferna Ltd figures and
according to this particular supplier of air conditioning systems in Mauritius, the costing
details has been observed.
Table 10: Cost Analysis
AC costing for first floor
ITEM DESCRIPTION UNIT QTY RATE AMOUNT(Rs)
1 Supply and installation of AC system No 1 158,000 158,000
2 Supply and install electrical protection including breaker for indoor units and outdoor unit No 1 6,200 6,200
3 Supply and installation of refrigerant Copper pipes c/w insulation No 5 2,400 12,000
4 Charging of all refrigerant pipings with R410A. (NON - CFC Refrigerant) No 1 2,155 2,155
5 Supply and install PVC drain pipe of appropriate No 1 6,560 6,560
TOTAL EXCLUDING VAT ( MUR) 188,563
TOTAL INCLUDING 15% VAT ( MUR ) 216,854
Cost Analysis
Rs
Initial cost 216,854
Running Cost per year
48,412
Maintenance cost per year
6,500
Annual Cost 54,912

25
References
Guo Z., Shao J., Li X., Wang W., Tian X. 2015. Application of pump-assisted
separate heat pipe on dehumidifying enhancement in air conditioning system.
Sciencedirect
Karunakaran R., Iniyan S., Goic R. 2009. Energy efficient fuzzy based combined
variable refrigerant volume and variable air volume air conditioning system for
buildings. Sciencedirect
Martinez P., Ruiz J., Cutillas C., Kaiser A., Lucas M. 2016. Experimental study on
energy performance of a split air-conditioner by using variable thickness evaporative
cooling pads coupled to the condenser. Sciencedirect
Mauritius Meteorological Services, (2015). Mauritius Meteorological Services.
[online] Metservice.intnet.mu. Available at: http://metservice.intnet.mu/ [Accessed 9
Dec. 2015].
Porumb R., Porumb B., Balan M. 2015. Baseline evaluation of potential to use solar
radiation in air conditioning applications. Sciencedirect
Zhu Y., Jin X., Du Z., Fan B., Fang X. 2013. Simulation of variable refrigerant flow
air conditioning system in heating mode combined with outdoor air processing unit.
Sciencedirect
1997 ASHRAE handbook. (1997). Atlanta, GA: ASHRAE.

26
Appendix

27
Thermal properties and code numbers of layers used in wall and roof description

28
Wall types, mass evenly distributed
29
July Cooling Load Temperature Differences for calculating cooling load from sunlit wall 40° North
latitude

30
CLTD correction for latitude and months, applied to wall and roofs.

31
Fenestration properties table
Values of CLTD for window

32
Property table for window
Solar Heat Gain Factor Table

33
Human being heat rates table
Zone type table

34
CLF table for people and unhooded equipment

35
CLF table for lights

36
Roof types numbers
July Cooling Load Temperature Differences for calculating load from flat roofs at 40° North latitude