diabetic cardiomyopathy-associated dysfunction in spatially distinct mitochondrial subpopulations
TRANSCRIPT
1
Diabetic Cardiomyopathy-Associated Dysfunction in Spatially Distinct
Mitochondrial Subpopulations
Erinne R. Dabkowski1, Courtney L. Williamson1, Valerie C. Bukowski3, Rebecca S. Chapman3,
Stephen S. Leonard3, Cody J. Peer2, Patrick S. Callery2, and John M. Hollander1
1West Virginia University School of Medicine, Division of Exercise Physiology and Center for
Interdisciplinary Research in Cardiovascular Sciences, Morgantown, WV 26506 2West Virginia University School of Pharmacy, Department of Basic Pharmaceutical Sciences,
Morgantown, WV 26506 3National Institute for Occupational Safety and Health (NIOSH), Health Effects Laboratory
Division, Morgantown, WV 26506
Running Title: Mitochondria and Diabetic Cardiomyopathy
Corresponding Author:
John M. Hollander, Ph.D.
West Virginia University School of Medicine
Division of Exercise Physiology
Center for Interdisciplinary Research in Cardiovascular Sciences
1 Medical Center Drive
Morgantown, WV 26506
Tel: (304) 293-3683
Fax: (304) 293-7105
Email: [email protected]
Articles in PresS. Am J Physiol Heart Circ Physiol (December 5, 2008). doi:10.1152/ajpheart.00467.2008
Copyright © 2008 by the American Physiological Society.

2
ABSTRACT
Diabetic cardiomyopathy is the leading cause of heart failure among diabetic patients, and
mitochondrial dysfunction has been implicated as an underlying cause in the pathogenesis.
Cardiac mitochondria consist of two spatially, functionally, and morphologically distinct
subpopulations, termed subsarcolemmal mitochondria (SSM) and interfibrillar mitochondria
(IFM). SSM are situated beneath the plasma membrane, while IFM are embedded between the
myofibrils. The goal of this study was to determine whether spatially distinct cardiac
mitochondrial subpopulations respond differently to a diabetic phenotype. Swiss Webster mice
were subjected to intraperitoneal injection of streptozotocin or citrate saline vehicle. Five weeks
following injection, diabetic hearts displayed decreased rates of contraction, relaxation, and left
ventricular developed pressures (P<0.05, for all three). Mitochondrial size (FSC; P<0.01) and
complexity (SSC; P<0.01) were both decreased in diabetic IFM, but not in diabetic SSM.
Electron transport chain complex II respiration was decreased in diabetic SSM (P<0.05) and
diabetic IFM (P<0.01), with the decrease being greater in IFM. Further, IFM complex I
respiration and complex III activity were decreased with diabetes (P<0.01), but were unchanged
in SSM. Superoxide (O2•-) production was increased only in diabetic IFM (P<0.01). Oxidative
damage to proteins and lipids, indexed through nitrotyrosine residues and lipid peroxidation,
were higher in diabetic IFM (P<0.05 and P<0.01, respectively). The mitochondrial-specific
phospholipid, cardiolipin, was decreased in diabetic IFM (P<0.01), but not in SSM. These
results indicate that diabetes mellitus imposes a greater stress on the IFM subpopulation which is
associated, in part, with increased O2•- generation and oxidative damage, resulting in
morphological and functional abnormalities that may contribute to the pathogenesis of diabetic
cardiomyopathy.
Diabetes, Free Radical, Mitochondria

3
INTRODUCTION
Diabetic cardiomyopathy has been implicated as a primary cause of heart failure among
diabetic patients and it is thought to occur independent of vascular pathogenesis (22, 27, 39, 52,
63). The hyperglycemic environment presented by diabetes mellitus leads to enhanced reactive
oxygen species (ROS) generation and though many potential sources of ROS exist, the
mitochondrion is considered to be the primary site (6, 8, 15, 28, 50). Several sites in the electron
transport chain (ETC) are particularly prone to the formation of ROS and include oxidizable
electron carriers in the inner mitochondrial membrane (12, 32). This has implications for ETC
proteins because a major constituent of these structures is their iron-sulphur centers (39), which
can react with ROS such as superoxide (O2•-) or hydrogen peroxide (H2O2) and produce the
highly reactive hydroxyl radical (•OH) (14). Increased mitochondrial ROS production has been
linked to mitochondrial dysfunction (13, 50, 51, 53, 54) which can in turn alter the integrity of
the inner mitochondrial membrane, facilitating further dysfunction in the mitochondria. In
particular, proteins and lipids within the mitochondria are critical targets of elevated ROS
production, and their oxidative modification potentiates mitochondrial dysfunction, by limiting
adequate production of ATP. One potential target of mitochondrial dysfunction is the
mitochondrial-specific phospholipid, cardiolipin. Cardiolipin is a diphosphatidylglycerol
enriched in the inner membrane, containing oxidatively-sensitive acyl groups that may act as
selective targets for ROS (33, 34, 46). Cardiolipin interacts with a number of mitochondrial
proteins including F0F1-ATPase, ANT, cytochrome C, and ETC complexes I, III, and IV, and its
oxidative modification may be a critical event for apoptosis initiation (23).
The cardiac myocyte contains two distinct mitochondrial subpopulations that are
characterized by their spatial arrangement within the cell. These two disparate populations have
been termed subsarcolemmal mitochondria (SSM) and interfibrillar mitochondria (IFM) due to
their subcellular locations which either abut the sarcolemma or situate between the contractile
apparatus (44, 49). In addition to spatial differences, mitochondrial subpopulations differ in
structure, size, ATP levels, protein import rates, substrate utilization, and other biochemical
properties (1, 21, 26, 28, 31, 34, 38, 44). Morphologically, IFM are smaller, more compact and
possess functionally greater respiratory rates, supplying ATP mainly for contractile function.

4
SSM are larger, more variable in shape, producing ATP primarily for electrolyte and protein
transport across the plasma membrane (44). The two mitochondrial subpopulations respond
differently to physiological stimuli, including exercise, aging, obesity, fasting, apoptotic
initiators, and ischemia/reperfusion (I/R) injury (1, 31, 34, 38, 48, 57). Decreased ETC function
and elevated oxidative stress has been reported in SSM following myocardial I/R, with no
difference observed in the IFM (33). Using electron microscopy, Kelley et al. observed
decreased IFM size in skeletal muscle of type 2 diabetic patients, which was not observed in
SSM (28). Others have observed decreased IFM ETC function with aging (21, 26). These
findings indicate that though mitochondria are similar in their central role in cellular function,
spatially distinct populations are influenced by pathological states differently, requiring careful
examination of individual mitochondrial subpopulations.
Because much of the previous work examining the impact of diabetes mellitus on
mitochondrial disposition has been performed on total mitochondria, it is difficult to assess the
impact of the pathology on spatially distinct mitochondrial populations. The goal of this study
was to determine the differential response of individual mitochondrial subpopulations subjected
to a diabetic phenotype, to further our understanding of their specific contribution to the
pathogenesis of diabetic cardiomyopathy. Our results indicate that the IFM subpopulation is
affected by diabetes mellitus to a greater extent than SSM as reflected by greater morphological
changes, elevated ROS, and enhanced oxidative damage. This study is the first to determine the
spatial influence of the diabetic phenotype on cardiac mitochondrial dysfunction.

5
MATERIALS AND METHODS
Experimental Animals and Diabetes Induction
The animal experiments in this study conformed to the National Institutes of Health
(NIH) guidelines for the care and use of laboratory animals and were approved by the West
Virginia University Animal Care and Use Committee (WVU-ACUC). Female Swiss Webster
mice (Harlan, Indianapolis, IN), were housed in the West Virginia University Health Sciences
Center animal facility. Mice were given unlimited access to a rodent diet and water. Diabetes
was induced in eight week old mice following the protocol of the Animal Models of Diabetic
Complications Consortium (AMDCC), using multiple low-dose streptozotocin (STZ; Sigma, St.
Louis, MO) injections. A multiple low-dose STZ protocol was chosen, because previous reports
indicate that this model limits the body weight losses associated with diabetic protocols (24, 29).
Injections of 50 mg/kg body weight STZ dissolved in sodium citrate buffer (pH 4.5), were
performed daily for five consecutive days following six hours of fasting. Mice that served as
vehicle controls were given the same volume per body weight of sodium citrate buffer. One
week post injection, hyperglycemia was confirmed by measuring urinary glucose (Chemstrip
2GP Urine test strips, Roche Diagnostics, Indianapolis, IN), where >2000 mg/dL was considered
diabetic. To confirm the diabetic phenotype urinary glucose levels were monitored weekly using
a DiaScreen 50 Urine Chemistry Analyzer (Arkray, Edina, MN), and DiaScreen 10 reagent
strips. Five weeks post hyperglycemia onset, animals were sacrificed for further
experimentation.
Cardiac Contractile Function
Hearts from diabetic and control animals were isolated and transferred to a Langendorff
set-up for contractile studies as previously described (19, 20, 59). In brief, hearts were removed
from anesthetized mice, and immersed in cold cardioplegic solution. After cannulation of the
aorta on a luer stub, hearts were perfused retrograde at 37°C with a modified Krebs-Henseleit
buffer (in mmol/L: 0.5 pyruvate, 0.4 caprylic acid, 118 NaCl, 4.7 KCl, 2.25 CaCl2, 1.2 MgSO4,
1.2 KH2PO4, 25 NaHCO3, 0.5 Na2EDTA, 5.5 glucose) that was subject to oxygenation. A small

6
fluid-filled balloon was inserted into the left ventricular (LV) cavity and coupled to a pressure
transducer (Argon Medical Devices, Athens, TX). The balloon was inflated until the end-
diastolic pressure reached 10 mmHg. Platinum wires were placed on the surface of the right
atrium and used to pace the heart at 420 beats/min (7 Hz) with increasing voltage until the heart
rate was consistent (captured). During this time period, hearts remained submerged in a 37°C
jacketed chamber, and a heat lamp attached to a variable AC transformer was utilized to maintain
temperature which was monitored by a needle temperature probe inserted just prior to the luer
cannula (Physitemp, Clifton, NJ). Hearts were perfused for 15 minutes to achieve a stable
cardiac function, and then followed for an additional 45 minutes yielding a total protocol time of
1 hour. During this time, digitized recordings of the LV pressure and its first derivative, as well
as heart rate were captured on an IBM-compatible PC using ChartPro software (AD Instruments,
Colorado Springs, CO). LV peak systolic pressure (PSP), developed pressure (DP), maximum
speed of contraction (+dP/dt), and maximum speed of relaxation (-dP/dt) were analyzed from the
recordings using ChartPro software.
Preparation of Individual Mitochondrial Subpopulations
Five weeks following hyperglycemia onset, animals were sacrificed and hearts removed.
Hearts were rinsed in phosphate buffered saline (PBS, pH 7.4), then blotted dry and weighed.
Subsarcolemmal mitochondria (SSM) and interfibrillar mitochondria (IFM) were isolated on ice
following the methods of Palmer et al. with minor modifications (44). Briefly, the ventricles
were minced and homogenized 1:10 (w/v) in cold Chappel-Perry buffer (in mmol/L: 100 KCl, 40
Tris HCl, 10 Tris-Base, 5 MgCl2, 1 ATP, 1 EDTA, pH 7.4). The homogenates were than
centrifuged at 800 x g for 10 minutes. The supernatant was extracted and centrifuged again at
9,000 x g to isolate the SSM. The SSM pellet was washed and centrifuged two more times at
9,000 x g and once more at 5,000 x g to obtain a clean SSM fraction. The remaining pellet from
the 800 x g spin was resuspended in Buffer 2 (in mmol/L: 100 KCl, 5 MgSO4, 5 EGTA, 50 Tris
HCl, pH 7.4) and exposed to 5 mg/kg of trypsin for 10 minutes (49). After 10 minutes, the IFM
pellet was diluted two-fold with buffer and spun down at 5,000 x g for 5 minutes. The
supernatant was discarded and the pellet was resuspended in buffer and spun down at 800 x g for
10 minutes. The supernatant was saved and the pellet resuspended and spun down again at 800 x

7
g for 10 minutes to maximize IFM yield. Next, supernatants were combined and spun down at
9,000 x g to yield the IFM. IFM were washed several times and spun down at a final spin of
5,000 x g for 10 minutes. Pellets were resuspended in a sucrose buffer (in mmol/L: 220 sucrose,
70 mannitol, 10 Tris HCl, 1 EDTA, pH 7.4) and protein concentrations were determined using
the Bradford method and bovine serum albumin as a standard (4). Superoxide (O2•-) production,
oxygen consumption, nitrotyrosine protein and lipid peroxidation were assessed on freshly
isolated subfractions.
Mitochondria Size and Internal Complexity
To index mitochondrial subpopulation size and complexity, we performed flow
cytometry analyses using a FACS Calibur equipped with a 15 mw 488 nm argon laser and 633
red diode laser (Becton and Dickinson, San Jose, CA, USA) as previously described (8, 9). Each
individual parameter (gating, size, and complexity) was performed using specific light sources
(laser, photomultiplier tube) and specific detectors. MitoTracker Deep Red 633 (Invitrogen,
Carlsbad, CA) which moves into intact mitochondria due to membrane potential, was used to
selectively stain intact mitochondria (EM: 633 nm; fluorescent 633 red diode laser) and exclude
debris which contains no membrane potential, enabling accurate gating (R1) of the mitochondria.
Once the gating parameters were established, gated events (20,000 per sample) were
subsequently examined using the forward scatter detector (FSC; 488 nm argon laser and diode
detector) and side scatter detector (SSC; photomultiplier tube and 90° collection lens) and
represented in FSC vs. SSC density plots. Geometric mean (arbitrary units, AU) representing
FSC (logarithmic scale) was used as an indicator of size while values from SSC (logarithmic
scale) were used to indicate complexity in the subpopulations. Though the FSC arbitrary unit is
proportional to the individual mitochondria particle size, the absolute value still remains an
arbitrary unit. Thus, to confirm the absolute mitochondria size, we utilized a flow cytometry size
calibration kit (Invitrogen, Carlsbad, CA) which utilizes a set of microsphere suspensions (0.5
µm – 6 µm) to serve as reliable size references for flow cytometric analyses. All flow
cytometric measurements were performed under the supervision of the West Virginia University
Flow Cytometry Core Facility.

8
Mitochondrial Cardiolipin Content
Cardiolipin was determined as previously described (16). Briefly, isolated mitochondrial
subpopulations (200 µg) were incubated with a synthetic phospholipid 1,1’,2,2’-
tetramyristoylcardiolipin (T14:0 CL; Avanti Polar Lipids, Alabaster, AL) that served as an
internal standard. Total lipids, including the internal standard, were extracted using the method
of Bligh and Dyer (3). Briefly, MeOH/H2O and chloroform were added to the sample, mixed,
and then centrifuged at approximately 200 x g for 10 minutes. The chloroform layer was
extracted from each sample then dried under a nitrogen stream. Each sample was resuspended in
4 mL of chloroform:MeOH (1:1) and washed with 1.8 mL of 20 mM LiCl aqueous solution. The
organic layer was dried under a nitrogen stream and the residue resuspended in 1 mL of
chloroform and then filtered through a 0.2 µm PTFE syringe filter into a 5 mL glass centrifuge
tube. The filtrate was filtered a second time with a 0.2 µm PTFE syringe filter and then dried
under a nitrogen stream. Samples were resuspended in 500 µL/mg protein in chloroform/MeOH
(1:1) and diluted further before injection into the mass spectrometer. LiOH (50 nmol/mg of
protein) was added to each sample just prior to analysis.
Cardiolipin detection was performed by electrospray ionization mass spectrometry (ESI-
MS) using a quadrupole ion trap Finnigan LCQ DECA (ThermoFisher, Waltham, MA) operated
in the negative-ion mode. Mass spectrometer instrument conditions included a spray voltage of
5.2 kV, capillary voltage of -4V, heated capillary temperature of 300 °C, and a sheath gas (N2)
flow rate of 40 arbitrary units. The cardiolipin solution was infused using a 100 µL syringe at a
flow rate of 5 µL per minute. Mitochondrial cardiolipin and internal standard spectra were
identified in the full scan mode. The peak intensities of cardiolipin:internal standard were
estimated using single ion monitoring on doubly charged m/z 723 and m/z 619 in both diabetic
and control mitochondria.
Electron Transport Chain (ETC) Respiration
State 4 respiratory capacity was assessed in isolated mitochondrial subpopulations
following the method of Hofhaus et al. (18), with slight modifications (19). Following

9
mitochondrial subpopulation isolation, samples were resuspended in respiration buffer (in
mmol/L: 20 Hepes, 10 MgCl2, 250 sucrose) and equal volumes were loaded into a Gilson
chamber (Gilson, Middleton, WI) attached to a YSI 5300 biological oxygen monitor (YSI Inc.
Yellow Springs, OH). Respiration through complex I, complex II, and complex IV were
determined by measuring the rate of oxygen consumed in the presence of specific substrates.
These substrates included glutamate/ malate for complex I, succinate for complex II and,
ascorbate/N, N, N’, N’-tetramethyl-p-phenylenediamine (TMPD) for complex IV and was
calculated as the fraction that was sensitive to the specific inhibitors rotenone (complex I),
antimycin (complex II), and sodium cyanide (complex IV). Assessment of complex III activity
was performed spectrophotometrically as previously described by following the reduction of
cytochrome c in the presence of reduced decylubiquinone (60). Protein content was determined
following the Bradford method as above, and values expressed as nanomoles of O2 consumed
per minute, per mg protein (complex 1, II, IV), or reduction of cytochrome c in nanomoles
(activity) per minute per mg protein (complex III).
Electron Paramagnetic Resonance (EPR) Spectroscopy
An EPR spin trapping technique was used to detect short-lived free radicals such as
hydroxyl (•OH) and superoxide (O2•-) (62). This method is based on the reaction of a short-lived
radical binding with a paramagnetic compound to form a relatively long-lived free radical
product (spin adduct). This adduct can then be observed using conventional EPR whereby the
intensity of the signal is used to measure the amount of short-lived radicals trapped. The
hyperfine couplings of the spin adduct are generally characteristics of the original trapped
radicals. This method is ideal for detection and identification of free radicals because of its
specificity and sensitivity. All EPR measurements were conducted using a Bruker EMX
spectrometer (Bruker Instruments Inc., Billerica, MA) and a flat cell assembly. Hyperfine
couplings were measured (to 0.1 G) directly from magnetic field separation using potassium
tetraperoxochromate (K3CrO8) and 1,1-diphenyl-2-picrylhydrazyl (DPPH) as reference standards
(5, 25). The Acquisit program was used for data acquisitions and analyses (Bruker Instruments
Inc., Billerica, MA 01821). Isolated heart mitochondria subpopulations were resuspended in 500
µl of 1 x PBS (pH 7.4). One hundred µg of each sample was brought up to 200 µL with PBS

10
and incubated with the spin trap 5,5-dimethyl-1-pyrroline-N-oxide (DMPO, 200 mM) in the
presence or absence of excess complex I respiratory substrates glutamate and malate reaching an
end volume of 500 µL. Samples were incubated for three minutes at 37°C and then transferred
to an EPR flat cell for measurement at room temperature with instrument settings of 63.6
milliwatt, modulation amplitude 1G, receiver gain 1.00 X 10⁵, conversion time 40.960 ms, and
time constant 40.960 ms. All spectra shown are in accumulation of three scans. The reaction of
xanthine and xanthine oxidase was used as a reference. The relative radical concentration was
estimated by measuring the peak-to-peak height (mm) of the observed spectra.
Protein Nitrotyrosine Content
Oxidatively- modified proteins were examined by measuring nitrosylated groups
introduced into protein side chains using a commercially available kit (Cell Sciences, Canton,
MA). Nitrotyrosine-containing proteins were measured using a solid-phase enzyme-linked
immunosorbent assay based on the sandwich principle. Samples were incubated in microtiter
wells coated with antibodies recognizing nitrotyrosine residues. Following incubation and
washing, a biotinylated secondary antibody (tracer) was added, followed by washing and
addition of a streptavidin-peroxidase conjugate. Color development was measured
spectrophotometrically at 450 nm, following addition of tetramethylbenzidine (TMB) using a
Biotek Synergy HT plate reader (Biotek, Winooski, VT), and values were compared against
known nitrotyrosine standards.
Lipid Peroxidation Products
Peroxidation of lipids was assessed by measurement of malondialdehyde (MDA) and 4-
hydroxyalkenals (4-HAE), stable end products formed from the oxidation of polyunsaturated
fatty acids and esters. Equal volumes of freshly isolated mitochondrial subpopulations were
analyzed for MDA and 4-HAE by using a colorimetric assay kit (Oxford Biomedical Research
Company, Oxford, MI). This assay is based on the reaction of a chromogenic reagent, N-
methyl-2-phenylindole with MDA and 4-HAE at 45°C. One molecule of either MDA or 4-HAE
reacts with two molecules of the reagent to yield a stable chromophore with maximal absorbance

11
at 586 nm. Absorbance was measured on a Biotek Synergy HT plate reader (Biotek, Winooski,
VT), and protein content was assessed as above with final values expressed per mg of protein.
Statistics
Means and standard errors were calculated for all data sets. Data were analyzed with a
one-way analysis of variance (ANOVA) method to evaluate the main treatment effect, diabetes
induction (Systat; version 5.03, Evanston, IL). Fisher’s Least Significant Difference (LSD) post
hoc tests were performed to determine the significant differences among means. When
appropriate a Student’s T-test was employed. P<0.05 was considered significant.

12
RESULTS
Cardiac Contractile Function in the Diabetic Heart
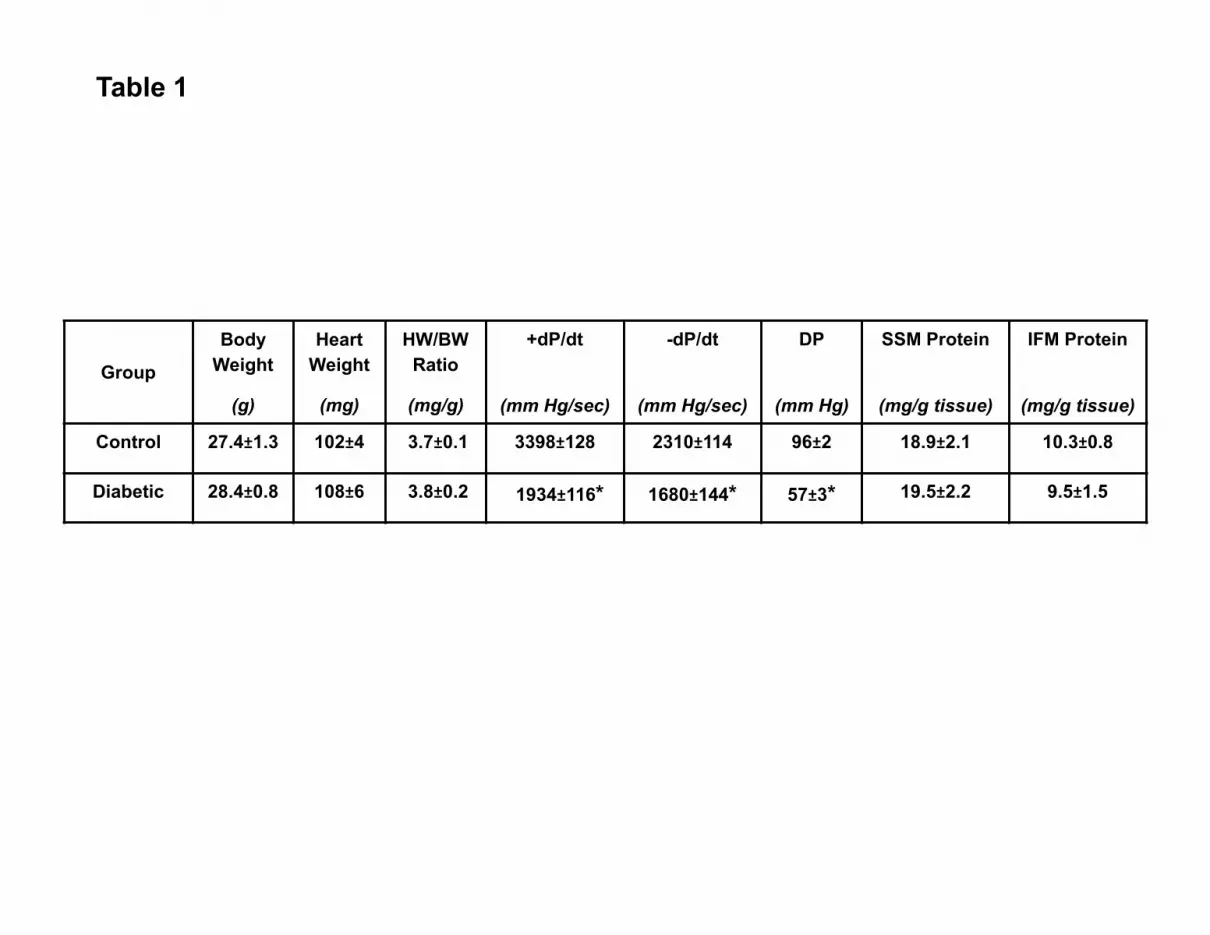
Heart weight, body weight, and heart weight/body weight ratios were not significantly
altered following STZ treatment (Table 1) which is in agreement with other studies utilizing
multiple low-dose STZ protocols (24, 29). Analyses of non-fasting urinary ketone levels five
weeks after the onset of diabetes were negative for diabetic animals (data not shown). Five
weeks after the onset of diabetes and hyperglycemia, animals were sacrificed and the heart
removed for measurement of contractile function using a Langendorff perfusion apparatus.
Rates of contraction (+dP/dt) and relaxation (-dP/dt), as well as developed pressures (DP) were
significantly decreased in diabetic vs. control hearts (Table 1; P<0.05, for all three),
demonstrating decreased contractile function. These data are in agreement with others
examining the influence of the diabetic phenotype using STZ injection as a model (15, 52, 56,
58).
Mitochondrial Subpopulation Morphology
Mitochondrial subpopulations were isolated, and yields were similar between control and
diabetic hearts (Table 1). To determine morphological differences between control and diabetic
mitochondrial subpopulations, we used a novel flow cytometry approach in which gating was
performed to make an accurate estimation of mitochondrial size and complexity. Assessment of
forward-scattered light (FSC) was used to estimate size, while assessment of side-scattered light
(SSC), was used to estimate mitochondrial complexity, both of which were based on a
logarithmic scale. Individual mitochondria subpopulations were stained with MitoTracker Deep
Red 633, which incorporates into intact mitochondria. In Figure 1A, a typical dot plot, showing
MitoTracker Deep Red 633 stained mitochondria is shown, with intact mitochondria indicated in
red and unstained debris indicated in black. Using this information, we gated the mitochondria
(R1) to exclude unstained debris, and applied the R1 gate to analyses on the individual
subpopulations. These analyses lend insight into relative morphological differences between the
two subpopulations, and help to confirm success of the isolation procedure. To confirm

13
differences in absolute mitochondria size, we included size calibration beads composed of
microsphere suspensions ranging in size from 0.5 µm to 6 µm to serve as reliable size references.
Using this approach, SSM were larger in size (FSC) and possessed greater internal complexity
(SSC) as compared to IFM, which were smaller and more compact (Figures 1B and 1C). These
results are consistent with previously published reports (28, 48, 49, 55). Mitochondrial size was
significantly decreased by 35 % (P<0.01) in the diabetic IFM as compared to control IFM, while
SSM showed no significant changes (Figure 1D). Mitochondrial complexity in the diabetic IFM
was also significantly decreased, by 40 % (P<0.01), as compared to control IFM (Figure 1E).
No significant differences in SSC were observed in the SSM population (Figure 1E). These
results indicate that only IFM morphology is impacted as a result of STZ-induced diabetic insult.
Electron Transport Chain (ETC) Respiration
Mitochondrial ETC function is altered with hyperglycemia but it is unclear whether these
alterations are uniform between mitochondrial subpopulations. We used polarography to assess
changes in ETC complexes I, II, and IV respiration and spectrometry to measure complex III
activity within individual mitochondrial subpopulations from diabetic and control hearts.
Complex I, II, and III were significantly decreased in diabetic IFM, relative to control (Figure 2A
and 2B, P<0.01, for both; Figure 2C; P<0.05), while only complex II was significantly decreased
in the SSM (Figure 2B; P<0.05). No significant changes were observed with complex IV in
either subpopulation (Figure 2D). These data indicate that STZ-induced diabetic insult impacts
both SSM and IFM, but these effects are greater in IFM.
Reactive Oxygen Species (ROS) Production
Because the mitochondrion is centrally involved in the formation of ROS, we determined
whether the diabetic phenotype enhanced ROS formation in a subpopulation specific manner.
Mitochondrial subpopulations were incubated with complex I substrates glutamate/malate to fuel
the ETC, and ROS generation analyzed using EPR spectroscopy. We observed increases in
diabetic IFM spin-trapping peaks, relative to control IFM (Figure 3C, 3D, and 3H; P<0.01), and
these differences were not observed in SSM (Figures 3A, 3B, and 3H). The spin-trapping pattern
14
observed was indicative of O2•-, and addition of superoxide dismutase (SOD) confirmed the
observed spectra as O2•- (Figures 3E and 3F). A spectrum for xanthine oxidase, a known O2
•-
generator, is included for spin-trapping pattern comparison (Figure 3G). These data suggest that
ROS generation is significantly increased in the IFM, which may be the result of enhanced O2•-
production.
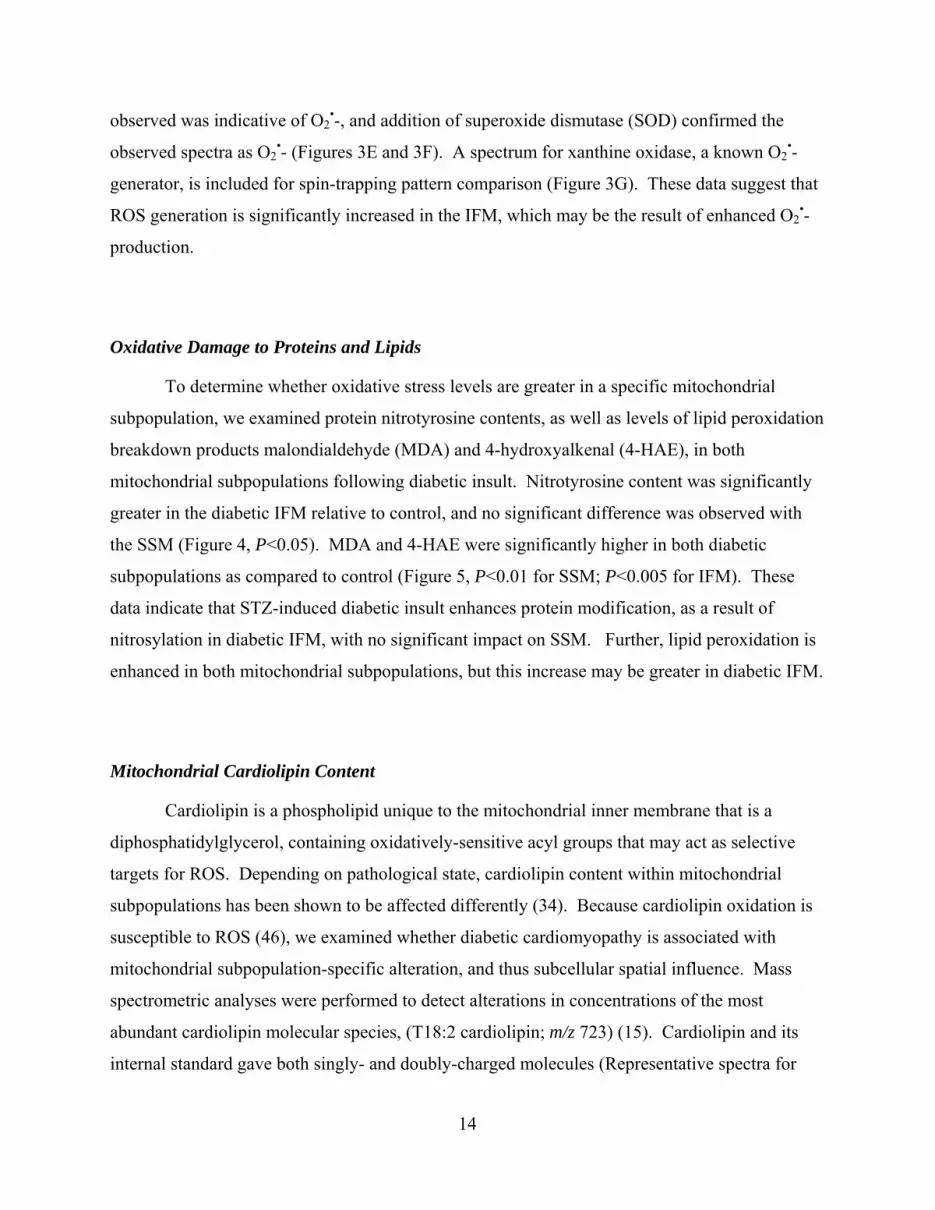
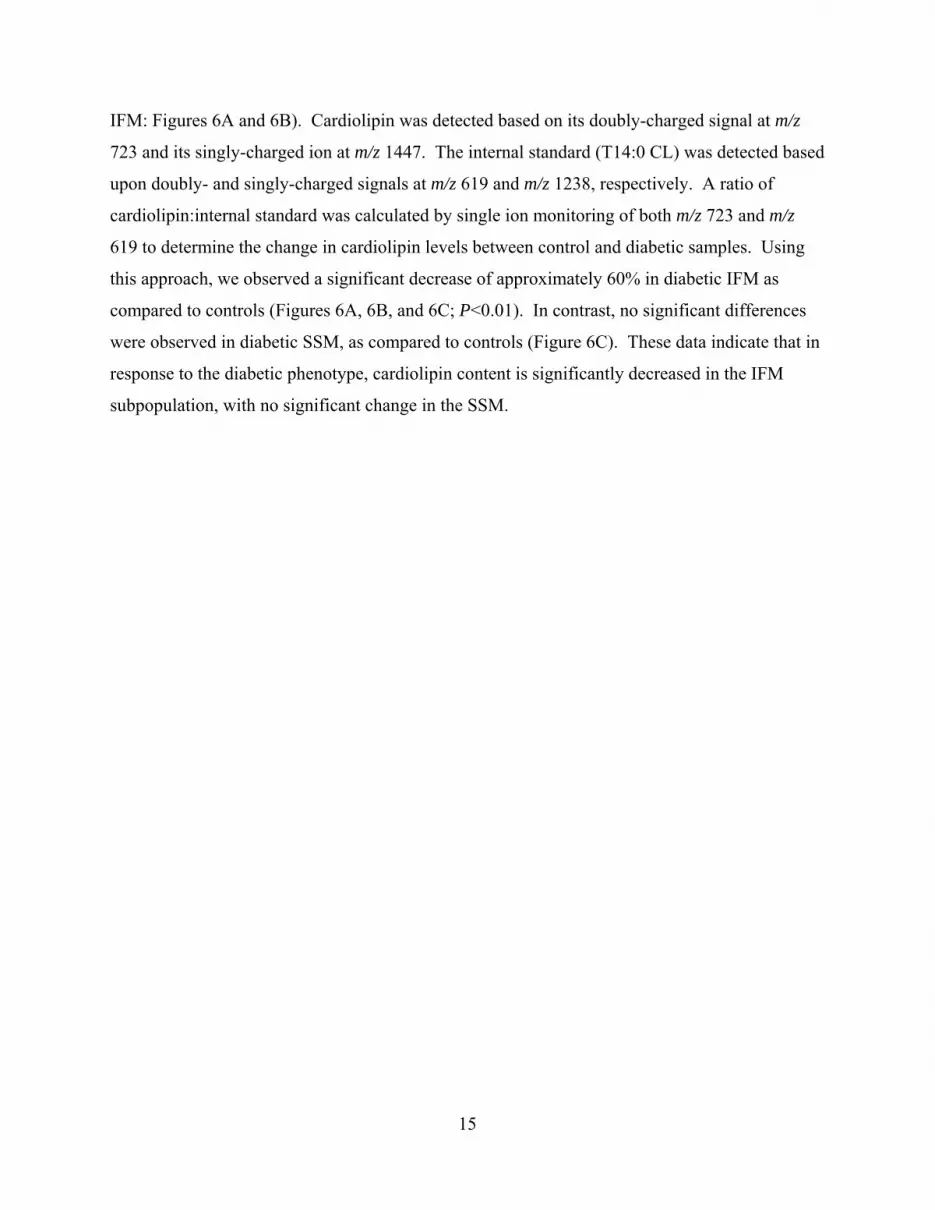
Oxidative Damage to Proteins and Lipids
To determine whether oxidative stress levels are greater in a specific mitochondrial
subpopulation, we examined protein nitrotyrosine contents, as well as levels of lipid peroxidation
breakdown products malondialdehyde (MDA) and 4-hydroxyalkenal (4-HAE), in both
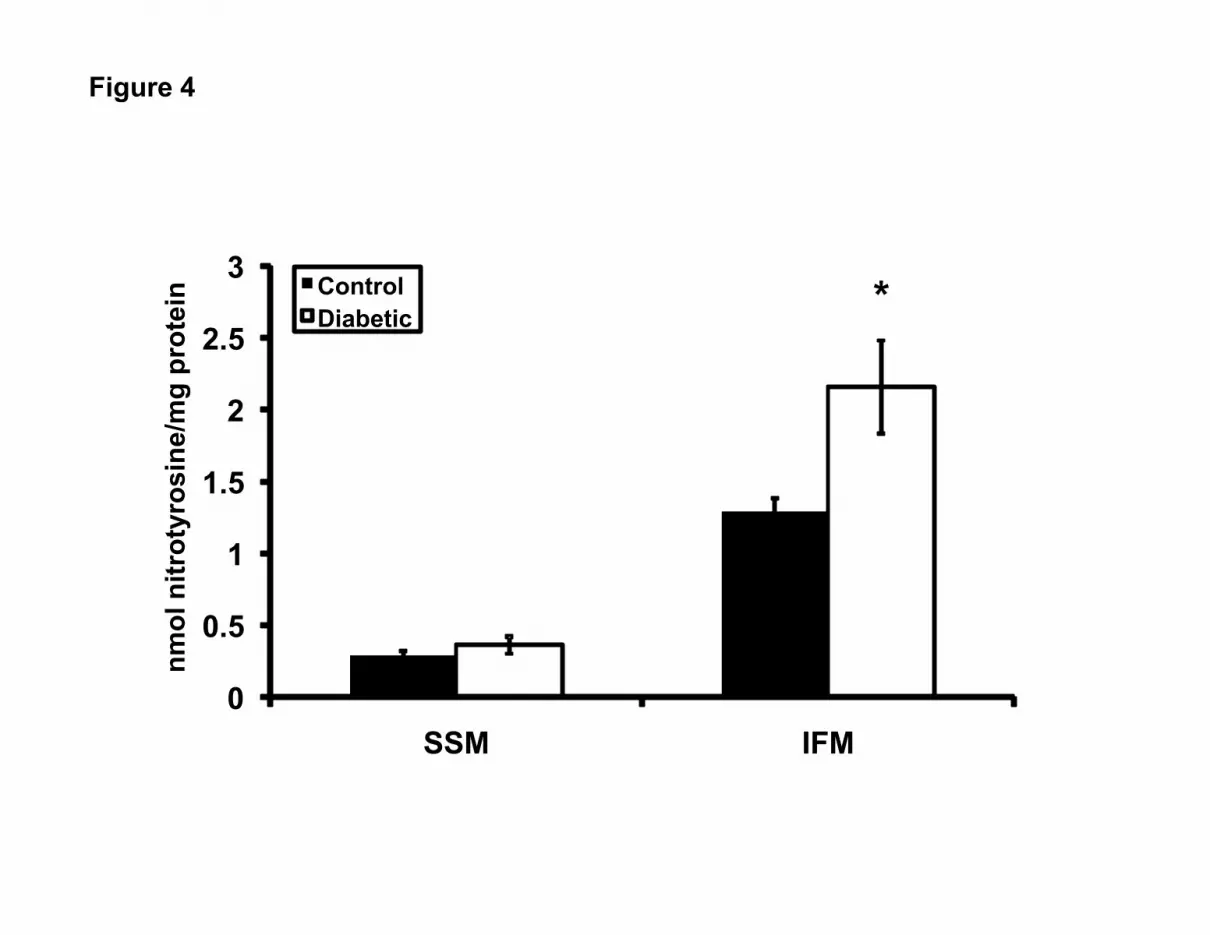
mitochondrial subpopulations following diabetic insult. Nitrotyrosine content was significantly
greater in the diabetic IFM relative to control, and no significant difference was observed with
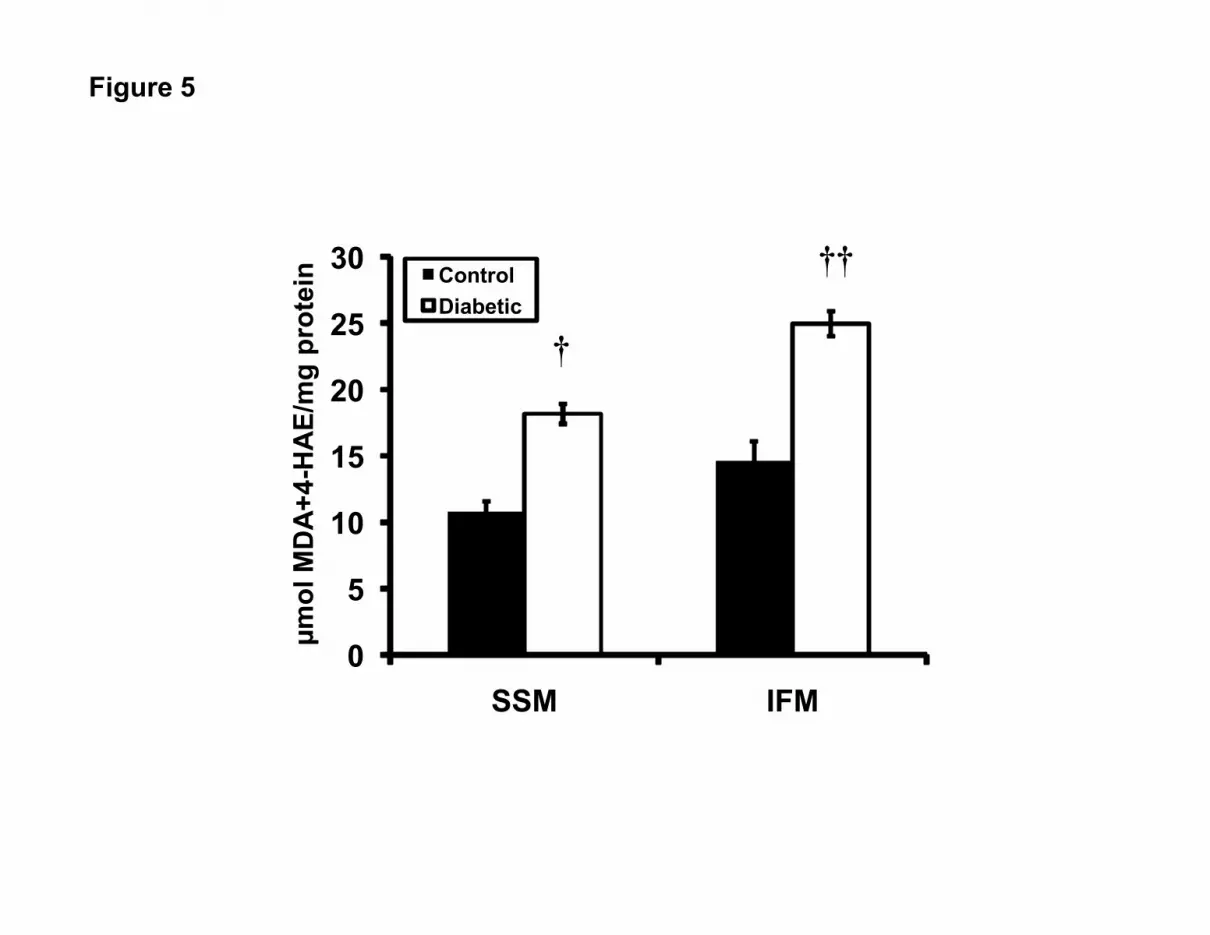
the SSM (Figure 4, P<0.05). MDA and 4-HAE were significantly higher in both diabetic
subpopulations as compared to control (Figure 5, P<0.01 for SSM; P<0.005 for IFM). These
data indicate that STZ-induced diabetic insult enhances protein modification, as a result of
nitrosylation in diabetic IFM, with no significant impact on SSM. Further, lipid peroxidation is
enhanced in both mitochondrial subpopulations, but this increase may be greater in diabetic IFM.
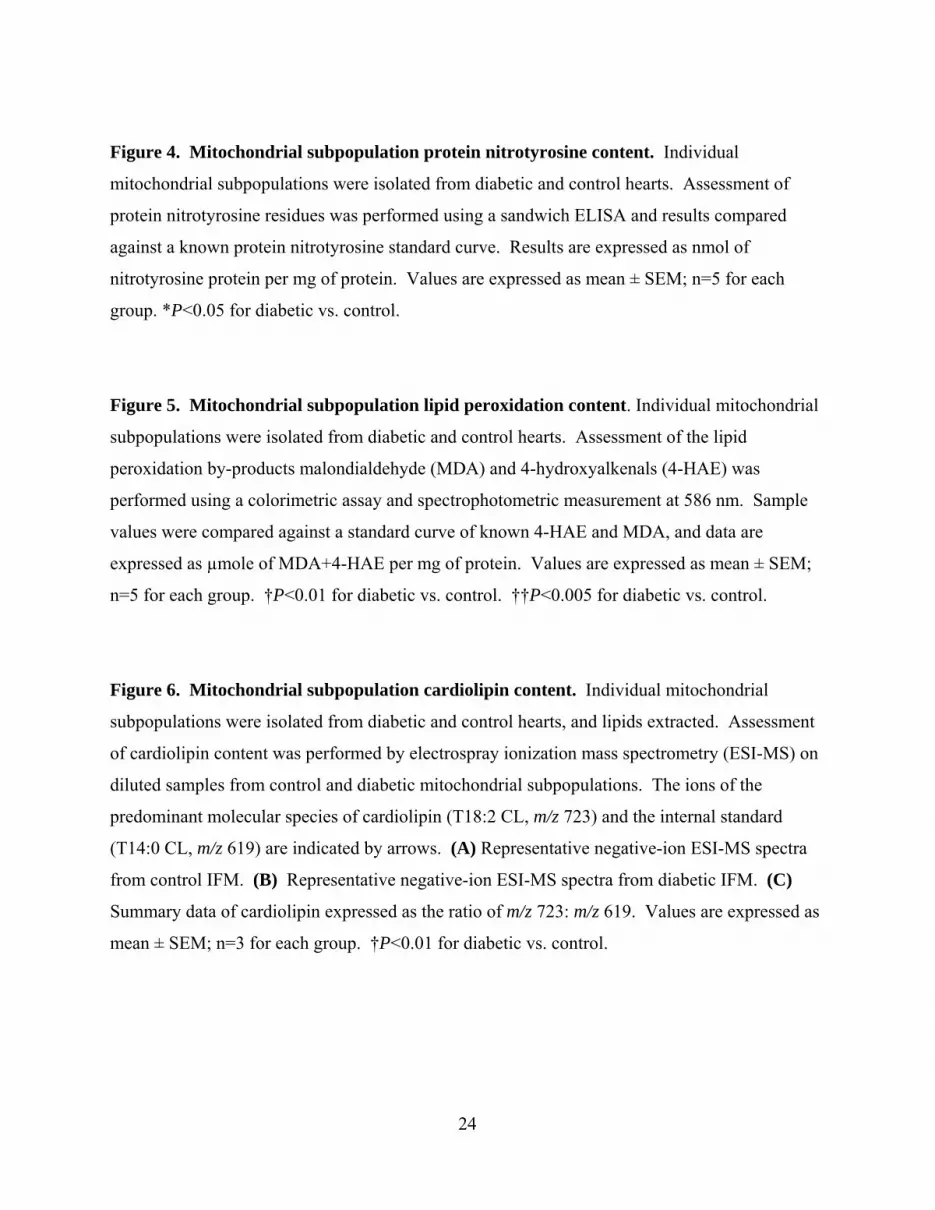
Mitochondrial Cardiolipin Content
Cardiolipin is a phospholipid unique to the mitochondrial inner membrane that is a
diphosphatidylglycerol, containing oxidatively-sensitive acyl groups that may act as selective
targets for ROS. Depending on pathological state, cardiolipin content within mitochondrial
subpopulations has been shown to be affected differently (34). Because cardiolipin oxidation is
susceptible to ROS (46), we examined whether diabetic cardiomyopathy is associated with
mitochondrial subpopulation-specific alteration, and thus subcellular spatial influence. Mass
spectrometric analyses were performed to detect alterations in concentrations of the most
abundant cardiolipin molecular species, (T18:2 cardiolipin; m/z 723) (15). Cardiolipin and its
internal standard gave both singly- and doubly-charged molecules (Representative spectra for
15
IFM: Figures 6A and 6B). Cardiolipin was detected based on its doubly-charged signal at m/z
723 and its singly-charged ion at m/z 1447. The internal standard (T14:0 CL) was detected based
upon doubly- and singly-charged signals at m/z 619 and m/z 1238, respectively. A ratio of
cardiolipin:internal standard was calculated by single ion monitoring of both m/z 723 and m/z
619 to determine the change in cardiolipin levels between control and diabetic samples. Using
this approach, we observed a significant decrease of approximately 60% in diabetic IFM as
compared to controls (Figures 6A, 6B, and 6C; P<0.01). In contrast, no significant differences
were observed in diabetic SSM, as compared to controls (Figure 6C). These data indicate that in
response to the diabetic phenotype, cardiolipin content is significantly decreased in the IFM
subpopulation, with no significant change in the SSM.

16
DISCUSSION
Diabetes mellitus is associated with a cardiomyopathy that is independent of
atherosclerosis and characterized by abnormal ventricular contractile function (2, 15, 22, 27, 52,
63). Diabetic cardiomyopathy has been shown to progress to heart failure in both type 1 and
type 2 diabetic models, though at a much higher rate in the type 1 setting (15, 52). Using a well
described and utilized model of diabetes induction, STZ injection, we sought to determine the
effect of diabetic insult on cardiac contractile function. STZ treatment had no significant impact
on heart weight, body weight, or heart weight:body weight ratios (Table 1). In contrast, STZ
treatment significantly decreased rates of contraction (+dP/dt), rates of relaxation (-dP/dt), and
developed pressure (DP), as compared to citrate saline-injected controls (Table 1). Our
observations are in agreement with others who have observed similar cardiac contractile deficits
in the diabetic context, characteristic of diabetic cardiomyopathy (2, 15, 22, 52, 63).
As the primary source of energy for the cardiac myocyte, mitochondria play a central role
in cellular homeostasis. Not surprisingly, disruption of this critical organelle is regarded as a key
contributor to the development of pathological states, including diabetic cardiomyopathy (50, 53,
54). Nevertheless, examination of mitochondria is complicated by the fact that two
mitochondrial subpopulations are present in the cardiac myocyte, interfibrillar mitochondria
(IFM), which situate between the contractile apparatus and subsarcolemmal mitochondria
(SSM), which exist beneath the plasma membrane. These two disparate mitochondrial
subpopulations are distinguished by specific spatial arrangements, distinct functional properties,
and differential responses to pathological conditions. In general, SSM have been reported to be
larger and more complex internally, while the IFM tend to be smaller, elongated and densely
packed between the myofibrils (21, 31, 38, 44). Using flow cytometric analyses, we observed
morphological differences between SSM and IFM that were similar to other reports utilizing
electron microscopy in cells and in isolated mitochondria (Figure 1) (44, 49). Examination of
mitochondrial subpopulations from hearts subjected to STZ-treatment revealed decreases in both
size and complexity of the IFM population, with no significant effect on the SSM population
(Figure 1). Our findings are in agreement with those of Ritov et al. who observed decreases in
the size of mitochondria located along the Z line (presumably reflective of IFM) in the vastus

17
lateralis of type 2 diabetic patients (28). In contrast, Shen et al. observed mitochondrial swelling
in a novel model of type 1 diabetes (the OVE26 mouse), suggestive of an enhanced apoptotic
program (54). These conflicting results may be due to a number of differences between the
studies. The OVE26 mouse model utilizes transgenic modification to alter calmodulin levels in
the pancreatic β cell, precipitating a profound early-onset diabetic phenotype (10). Further,
OVE26 transgenic mice are examined at approximately 4 months of age, a substantially longer
time period of diabetes exposure than our current study of 5 weeks. It is possible that
mitochondria display a biphasic morphological response during diabetic insult, characterized by
an initial decrease in size, followed by an increase in size. In addition, examination of the total
mitochondria fraction may be incapable of resolving the differences between individual
mitochondrial subpopulations. In either case, these data indicate that mitochondria display
changes in overall morphology as a result of diabetic insult, and that these changes may be
specific for a distinct subpopulation.
Because of its enhanced propensity for ROS-mediated damage, mitochondrial ETC
function can be profoundly affected by oxidative stress-associated pathologies, including
diabetes mellitus. We have previously observed changes in ETC respiration during diabetic
insult (8), which is in agreement with other reports (28, 30). Specifically, we observed significant
decreases in oxygen consumption at both complex I and complex II, but not at complex IV (8).
However, examination of the effect of diabetes on individual mitochondrial subpopulations
revealed a differential response with decreased respiration at complex I and II, and decreased
activity at complex III in IFM, while only complex II respiration was decreased in SSM (Figure
2). Though not significant, we observed a decrease in complex IV respiration of diabetic IFM
(Figure 2C). These results are similar to others that have found decreased complex III and
complex IV respiration in the IFM population with no effect in the SSM population, in response
to aging (11, 22). Taken together, our findings indicate that ETC complex II may be a specific
locus for the deleterious effects associated with STZ insult, imparting damage to both IFM and
SSM subpopulations, while effects on complex I and III may be specific to the IFM. Our results
suggest that with type 1 diabetes mellitus, ETC function is compromised impacting both
subpopulations with the effects being greatest in the IFM. Because the IFM population provides
ATP for the contractile process, the compromise in ETC function of this mitochondrial

18
population may be particularly detrimental to cardiac contractile function, contributing to the
contractile deficits associated with diabetic cardiomyopathy.
It has been suggested that an increase in ROS in response to hyperglycemia is the
proximal defect that leads to many of the subsequent pathological consequences resulting from
diabetes mellitus (6, 13, 28, 50). Studies indicate that various ROS are increased during diabetes
mellitus in the heart, including O2•- (7, 35), peroxynitrite (OONO•-) (43), •OH (41, 45), and
hydrogen peroxide (H2O2) (36). Using the non-specific fluorometric probe, dichlorofluorescein
(DCF), we previously observed an increase in ROS production in total diabetic mitochondria (8).
Our results are in agreement with others observing similar increases in ROS presence resulting
from diabetic insult, using DCF as a probe (50). However, because the DCF probe detects ROS
in a non-specific manner, we extended our findings by determining the specific reactants that are
increased in cardiac diabetic mitochondria, using EPR/spin trapping methodology. Our results
indicate that diabetic insult significantly increases O2•- only in the IFM, suggesting that increased
ROS occurs in a subpopulation specific manner (Figure 3). Verification of O2•- presence was
accomplished by addition of exogenous superoxide dismutase (SOD) which essentially abolished
the signal (Figure 3E and 3F). Comparison of the observed spectra to the spectra of a known
O2•- generator, xanthine oxidase (Figure 3G), provided further confirmation to the nature of the
reactant. These results are interesting indicating that enhanced ROS presence as a result of
diabetes mellitus, is particularly relevant in the IFM subpopulation and that O2•- appears to be a
primary ROS generated in diabetic mitochondria. Our findings are similar to others examining
different cardiac pathologies using DCF detection or amplex red assay (26, 57). Moghaddas et
al. found an increase in H2O2 from complex III in the IFM with aging, and no differences in the
SSM (37). Indirectly, our results indicating enhanced O2•- presence are also in agreement with
Shen et al. who observed restoration of mitochondrial function in MnSOD transgenic mice
crossed with OVE26 mice (53). It should be pointed out that the primary sites for ROS
generation in the mitochondrion are at complex I and III, thus decreases in respiration of these
complexes, as observed in the IFM, should limit electron flux into complex III attenuating ROS
generation. Our results do not support this scenario, but rather may be the function of enhanced
oxidative damage to proteins in these complexes such that, though electron flux through these
complexes is decreased, electron leakage is greater resulting in amplification of ROS generation.
The results warrant further investigation.

19
Overproduction of ROS represents an initial event in the pathogenesis of diabetic
cardiomyopathy creating an oxidative imbalance in the cell. The resulting oxidative milieu
promotes damage to subcellular components such as membranes and proteins. Submitochondrial
targets are particularly prone to damage from enhanced ROS due to their close proximity to the
source of generation. Because we observed increases in mitochondrial ROS generation as a
result of STZ exposure, we examined oxidative modification to both protein and lipid
components in individual mitochondrial subpopulations to determine whether oxidative damage
occurs in subpopulation specific manner. Assessment of protein modification was performed by
analysis of nitrotyrosine adducts. Our results indicate that only proteins from the IFM
population display enhanced nitrosylated proteins in response to STZ exposure (Figure 4). These
findings are similar with others who have demonstrated enhanced protein carbonyl groups in
cardiac IFM, as a result of aging (26). Interestingly, these authors also observed an increase in
protein carbonyls in the SSM population as a result of aging, though this increase was not as
great as that observed in the IFM (26). The reason for these differences may be related to the
pathologies studied (aging vs. diabetes mellitus), and/or the specific protein modification
examined (nitrotyrosine vs. carbonyl). Lipid peroxidation was determined by the combined
assessment of both MDA and 4-HAE (Figure 5). Our results indicate that STZ exposure
increases lipid peroxidation in both the SSM and IFM subpopulations, though the increase may
be greater in the IFM (Figure 5). Our findings are somewhat in agreement with others who have
observed increases in lipid peroxidation primarily in cardiac IFM as a result of aging (26, 57).
Of particular interest in the current study was our observation that STZ exposure enhanced lipid
peroxidation in both subpopulations, though the increase appeared to be larger in the IFM. Our
findings are in contrast to previous reports and may be a function of the different pathologies
examined and/or assay methodology (26, 57). These studies examined lipid peroxidation in
aging cardiac mitochondrial subpopulations by assessing 4-HAE via Western blot analyses
and/or MDA via spectrophotometric measurement of thiobarbituric acid reactive substances
(TBARS). In our current study, we assessed lipid peroxidation by assessing a combination of
MDA and 4-HAE spectrophotometrically, using the chromogenic reagent, N-methyl-2-
phenylindole. Additionally, oxidative stress to mitochondrial lipid components may be different
in the aging context as compared to diabetic insult. It is important to point out that while STZ
effects are believed to be primarily associated with the pancreas its short-term administration has

20
been associated with ROS generation and oxidative damage to other tissues such as kidney and
liver (47). Thus, one must consider the potential for a direct effect of STZ on the heart,
independent of enhanced glucose content resulting from pancreatic β-cell loss.
Diabetic mitochondria display increases in mitochondrial permeability transition pore
(mPTP) opening (42), as well as changes in mitochondrial membrane fluidity, which may
contribute to changes in mitochondrial membrane potential (ΔΨm) (61). These effects may be
influenced by phospholipid content and in particular, cardiolipin, which would have a profound
impact on mitochondrial function (16). Cardiolipin is a diphosphatidylglycerol enriched in the
inner membrane, containing oxidatively-sensitive acyl groups that may act as selective targets
for ROS (17, 40). Cardiolipin interacts with a number of mitochondrial proteins including
components of the mPTP, cytochrome C, and ETC complexes, thus, its oxidative modification
may be a critical event for the initiation of pathological states (23). We determined whether
cardiolipin was a specific lipid target of STZ-induced diabetic insult. Our findings indicate that
cardiolipin loss occurs as a result of STZ exposure only in the IFM subpopulation (Figure 6C).
Our results are in contrast to those of Lesnefsky et al. who observed a selective decrease in
cardiolipin content in SSM following I/R insult (34). These authors suggest that SSM possess a
decreased capacity, relative to IFM, for calcium (Ca2+) accumulation which is a hallmark of I/R
insult. As a result, SSM sustain a faster onset for ischemic damage as compared to IFM (34).
Though increased Ca2+ content may be involved in the pathogenesis of diabetes mellitus, its
involvement has much greater effects during myocardial I/R, which may account for the
difference in the results observed in the studies.
In conclusion, we report for the first time, that STZ-induced diabetic insult differentially
affects morphological, functional, and oxidative properties of spatially distinct mitochondrial
subpopulations. Type 1 diabetic insult is associated with a greater stress on the IFM
subpopulation as indicated by increased ROS and oxidative damage, impacting ETC function
and cardiolipin content, all of which may contribute to cardiac contractile dysfunction. The
heterogeneous response displayed by individual mitochondrial subpopulations during diabetic
insult emphasizes the importance of incorporating spatial influence into the study of
mitochondria in disease states.

21
ACKNOWLEDGEMENTS
This work was supported by National Institutes of Health Award # DP2DK083095 (J. M.
H.) from the National Institutes of Diabetes and Digestive and Kidney Diseases (NIDDK). This
work was also supported by American Heart Association Beginning Grant-In-Aid #0665237B (J.
M. H.) and Grant-In-Aid #0855484D (J. M. H.). Erinne Dabkowski is a recipient of an
American Heart Association Predoctoral Fellowship (#0815406D). We would like to thank Dr.
Christopher Cuff and the contributions from the West Virginia University Flow Cytometry Core
facility. Flow cytometry studies were supported in part by grants #RR020866 and #RR16440.
Disclaimer: The findings and conclusions in this report are those of the author(s) and do not
necessarily represent views of the National Institute for Occupational Safety and Health.

22
FIGURE LEGENDS
Table 1. Heart weight, body weight, contractile function, and mitochondrial yields. Heart
weight (HW), body weight (BW), and heart weight/body weight ratios (HW/BW) five weeks
following STZ-treatment (Diabetic) or citrate saline injection (Control). HW is expressed in
milligrams (mg), BW is expressed in grams (g), and HW/BW is expressed as mg/g. Functional
measurements were performed in Langendorff-perfused hearts, and are expressed as rate of
contraction (+dP/dt), rate of relaxation (-dP/dt), and developed pressure (DP). +dP/dt and –dP/dt
are expressed in mm Hg/sec, and DP is expressed in mm Hg. Individual mitochondrial
subpopulation protein yields expressed in mg/g wet tissue. Values are expressed as mean ±
SEM; n=8 for each group. *P<0.05 for diabetic vs. control.
Figure 1. Mitochondria subpopulation morphological assessment. Determination of relative
size and internal complexity of distinct mitochondrial subpopulations using flow cytometric
analyses. (A) Representative density plot of isolated mitochondria stained with MitoTracker
Deep Red 633, which incorporates into intact mitochondria. Intact mitochondria that take up the
MitoTracker Deep Red 633 dye are gated (R1) and represented in red. Noise and debris, which
does not take up the MitoTracker Deep Red 633 is excluded from measurements (outside the R1
gate) and indicated in black. (B) Representative gated density plot indicating size (FSC;
forward scatter) vs. internal complexity (SSC; side scatter) of isolated SSM. (C) Representative
gated density plot indicating size (FSC; forward scatter) vs. internal complexity (SSC; side
scatter) of isolated IFM. Analysis of forward scatter and side scatter were calculated per 20,000
gated events for all mitochondrial subpopulations. Red hash lines indicate microsphere size
references from left to right; 0.5, 1, 2, 4, and 6 µM, respectively. (D) Analysis of cardiac SSM
and IFM size (FSC) in control and diabetic. (E) Analysis of cardiac SSM and IFM complexity
(SSM) in control and diabetic. Values for size and complexity are expressed as arbitrary units
(AU) ± SEM; n=3 for each group. †P<0.01 for diabetic vs. control.

23
Figure 2. Mitochondria subpopulation respiration. Individual mitochondrial subpopulations
were isolated from diabetic and control hearts and polarographic measurements performed to
index oxygen consumption under state 4 respiration conditions. Respiration of individual ETC
complexes was defined as the rate of oxygen consumed in the presence of specific substrates,
glutamate/malate (complex I), succinate (complex II), and ascorbate/N,N,N’,N’-tetramethyl-p-
phenylenediamine (complex IV), and were calculated as the fraction that was sensitive to the
specific inhibitors rotenone (complex I), antimycin (complex II), and sodium cyanide (complex
IV). Measurement of complex III was performed spectrophotometrically by assessment of the
reduction of cytochrome c in the presence of reduced decylubiquinone. (A) Complex I. (B)
Complex II. (C) Complex III. (D) Complex IV. Values are expressed as mean ± SEM; n=7 for
each group. *P<0.05 for diabetic vs. control; †P<0.01 for diabetic vs. control.
Figure 3. Mitochondria subpopulation reactive oxygen species (ROS) generation.
Individual mitochondrial subpopulations were isolated from diabetic and control hearts and
electron paramagnetic resonance (EPR) spectroscopy performed to index ROS generation.
Isolated mitochondrial subpopulations were incubated with DMPO in the presence or absence of
excess complex I respiratory substrates glutamate and malate, incubated for three minutes at
37°C and then transferred to an EPR flat cell for measurement at room temperature with
instrument settings of 63.6 milliwatt, modulation amplitude 1G, receiver gain 1.00 x 10⁵,
conversion time 40.960 ms, and time constant 40.960 ms. All spectra shown are in accumulation
of three scans. (A) Representative spectra for control SSM; (B) representative spectra for
diabetic SSM; (C) representative spectra for control IFM; (D) representative spectra for diabetic
IFM; (E) Representative spectra for SSM with the inclusion of superoxide dismutase (SOD) into
the assay medium to confirm the superoxide (O2•-) signal; (F) representative spectra for IFM
with the inclusion of superoxide dismutase (SOD) into the assay medium to confirm the
superoxide (O2•-) signal; (G) xanthine oxidase spectra was included as a representative of the
O2•- spectra pattern. (H) ROS formation was significantly increased in diabetic IFM compared
to control IFM. Values are expressed as mean ± SEM; n=4 for each group. †P<0.01 for diabetic
vs. control.
24
Figure 4. Mitochondrial subpopulation protein nitrotyrosine content. Individual
mitochondrial subpopulations were isolated from diabetic and control hearts. Assessment of
protein nitrotyrosine residues was performed using a sandwich ELISA and results compared
against a known protein nitrotyrosine standard curve. Results are expressed as nmol of
nitrotyrosine protein per mg of protein. Values are expressed as mean ± SEM; n=5 for each
group. *P<0.05 for diabetic vs. control.
Figure 5. Mitochondrial subpopulation lipid peroxidation content. Individual mitochondrial
subpopulations were isolated from diabetic and control hearts. Assessment of the lipid
peroxidation by-products malondialdehyde (MDA) and 4-hydroxyalkenals (4-HAE) was
performed using a colorimetric assay and spectrophotometric measurement at 586 nm. Sample
values were compared against a standard curve of known 4-HAE and MDA, and data are
expressed as µmole of MDA+4-HAE per mg of protein. Values are expressed as mean ± SEM;
n=5 for each group. †P<0.01 for diabetic vs. control. ††P<0.005 for diabetic vs. control.
Figure 6. Mitochondrial subpopulation cardiolipin content. Individual mitochondrial
subpopulations were isolated from diabetic and control hearts, and lipids extracted. Assessment
of cardiolipin content was performed by electrospray ionization mass spectrometry (ESI-MS) on
diluted samples from control and diabetic mitochondrial subpopulations. The ions of the
predominant molecular species of cardiolipin (T18:2 CL, m/z 723) and the internal standard
(T14:0 CL, m/z 619) are indicated by arrows. (A) Representative negative-ion ESI-MS spectra
from control IFM. (B) Representative negative-ion ESI-MS spectra from diabetic IFM. (C)
Summary data of cardiolipin expressed as the ratio of m/z 723: m/z 619. Values are expressed as
mean ± SEM; n=3 for each group. †P<0.01 for diabetic vs. control.

25
REFERENCES
1. Adhihetty PJ, Ljubicic V, Menzies KJ, and Hood DA. Differential susceptibility of subsarcolemmal and intermyofibrillar mitochondria to apoptotic stimuli. Am J Physiol 289: C994-C1001, 2005. 2. An D and Rodrigues B. Role of changes in cardiac metabolism in development of diabetic cardiomyopathy. Am J Physiol Heart Circ Physiol 291: H1489-1506, 2006. 3. Bligh EG and Dyer WJ. A rapid method of total lipid extraction and purification. Can J Biochem Physiol 37: 911-917, 1959. 4. Bradford MM. A rapid and sensitive method for the quantitation of microgram quantities of protein utilizing the principle of protein-dye binding. Anal Biochem 72: 248-254, 1976. 5. Buettner GR. Spin trapping: ESR parameters of spin adducts. Free Radic Biol Med 3: 259-303, 1987. 6. Cai L, Li W, Wang G, Guo L, Jiang Y, and Kang YJ. Hyperglycemia-induced apoptosis in mouse myocardium: mitochondrial cytochrome C-mediated caspase-3 activation pathway. Diabetes 51: 1938-1948, 2002. 7. Cai L, Wang J, Li Y, Sun X, Wang L, Zhou Z, and Kang YJ. Inhibition of superoxide generation and associated nitrosative damage is involved in metallothionein prevention of diabetic cardiomyopathy. Diabetes 54: 1829-1837, 2005. 8. Dabkowski ER, Williamson CL, and Hollander JM. Increased susceptibility of mitochondrial subpopulations to diabetic cardiomyopathy associated dysfunction. FASEB J 21: 732.25, 2007. 9. Dabkowski ER, Williamson CL, and Hollander JM. Mitochondria-specific transgenic overexpression of phospholipid hydroperoxide glutathione peroxidase (GPx4) attenuates ischemia/reperfusion-associated cardiac dysfunction. Free Radic Biol Med 45: 855-865, 2008. 10. Epstein PN, Overbeek PA, and Means AR. Calmodulin-induced early-onset diabetes in transgenic mice. Cell 58: 1067-1073, 1989. 11. Fannin SW, Lesnefsky EJ, Slabe TJ, Hassan MO, and Hoppel CL. Aging selectively decreases oxidative capacity in rat heart interfibrillar mitochondria. Arch Biochem Biophys 372: 399-407, 1999. 12. Ferrari R, Ceconi C, Curello S, Cargnoni A, De Giuli F, and Visioli O. Occurrence of oxidative stress during myocardial reperfusion. Mol Cell Biochem 111: 61-69, 1992. 13. Flarsheim CE, Grupp IL, and Matlib MA. Mitochondrial dysfunction accompanies diastolic dysfunction in diabetic rat heart. Am J Physiol 271: H192-202, 1996. 14. Fridovich I. Superoxide radical and superoxide dismutases. Annu Rev Biochem 64: 97-112, 1995. 15. Hamblin M, Friedman DB, Hill S, Caprioli RM, Smith HM, and Hill MF. Alterations in the diabetic myocardial proteome coupled with increased myocardial oxidative stress underlies diabetic cardiomyopathy. J Mol Cell Cardiol 42: 884-895, 2007. 16. Han X, Yang J, Cheng H, Yang K, Abendschein DR, and Gross RW. Shotgun lipidomics identifies cardiolipin depletion in diabetic myocardium linking altered substrate utilization with mitochondrial dysfunction. Biochemistry 44: 16684-16694, 2005. 17. Hoch FL. Cardiolipins and biomembrane function. Biochim Biophys Acta 1113: 71-133, 1992.

26
18. Hofhaus G, Shakeley RM, and Attardi G. Use of polarography to detect respiration defects in cell cultures. Methods Enzymol 264: 476-483, 1996. 19. Hollander JM, Lin KM, Scott BT, and Dillmann WH. Overexpression of PHGPx and HSP60/10 protects against ischemia/reoxygenation injury. Free Radic Biol Med 35: 742-751, 2003. 20. Hollander JM, Martin JL, Belke DD, Scott BT, Swanson E, Krishnamoorthy V, and Dillmann WH. Overexpression of wild-type heat shock protein 27 and a nonphosphorylatable heat shock protein 27 mutant protects against ischemia/reperfusion injury in a transgenic mouse model. Circulation 110: 3544-3552, 2004. 21. Hoppel CL, Moghaddas S, and Lesnefsky EJ. Interfibrillar cardiac mitochondrial complex III defects in the aging rat heart. Biogerontology 3: 41-44, 2002. 22. Hoppel CL, Tandler B, Parland W, Turkaly JS, and Albers LD. Hamster cardiomyopathy. A defect in oxidative phosphorylation in the cardiac interfibrillar mitochondria. J Biol Chem 257: 1540-1548, 1982. 23. Imai H and Nakagawa Y. Biological significance of phospholipid hydroperoxide glutathione peroxidase (PHGPx, GPx4) in mammalian cells. Free Radic Biol Med 34: 145-169, 2003. 24. Inada A, Kanamori H, Arai H, Akashi T, Araki M, Weir GC, and Fukatsu A. A model for diabetic nephropathy: advantages of the inducible cAMP early repressor transgenic mouse over the streptozotocin-induced diabetic mouse. J Cell Physiol 215: 383-391, 2008. 25. Janzen E and Blackburn B. Detection and identification of short-lived free radicals by and electron spin resonance trapping technique. J Am Chem Soc 90: 5909-5910, 1968. 26. Judge S, Jang YM, Smith A, Hagen T, and Leeuwenburgh C. Age-associated increases in oxidative stress and antioxidant enzyme activities in cardiac interfibrillar mitochondria: implications for the mitochondrial theory of aging. FASEB J 19: 419-421, 2005. 27. Kannel WB and McGee DL. Diabetes and cardiovascular disease. The Framingham study. JAMA 241: 2035-2038, 1979. 28. Kelley DE, He J, Menshikova EV, and Ritov VB. Dysfunction of mitochondria in human skeletal muscle in type 2 diabetes. Diabetes 51: 2944-2950, 2002. 29. Kim E, Sohn S, Lee M, Jung J, Kineman RD, and Park S. Differential responses of the growth hormone axis in two rat models of streptozotocin-induced insulinopenic diabetes. J Endocrinol 188: 263-270, 2006. 30. King KL, Young ME, Kerner J, Huang H, O'Shea KM, Alexson SE, Hoppel CL, and Stanley WC. Diabetes or peroxisome proliferator-activated receptor alpha agonist increases mitochondrial thioesterase I activity in heart. J Lipid Res 48: 1511-1517, 2007. 31. Koves TR, Noland RC, Bates AL, Henes ST, Muoio DM, and Cortright RN. Subsarcolemmal and intermyofibrillar mitochondria play distinct roles in regulating skeletal muscle fatty acid metabolism. Am J Physiol Cell Physiol 288: C1074-1082, 2005. 32. Lashin O and Romani A. Mitochondria respiration and susceptibility to ischemia-reperfusion injury in diabetic hearts. Arch Biochem Biophys 420: 298-304, 2003. 33. Lesnefsky EJ, Chen Q, Slabe TJ, Stoll MS, Minkler PE, Hassan MO, Tandler B, and Hoppel CL. Ischemia, rather than reperfusion, inhibits respiration through cytochrome oxidase in the isolated, perfused rabbit heart: role of cardiolipin. Am J Physiol Heart Circ Physiol 287: H258-267, 2004.

27
34. Lesnefsky EJ, Slabe TJ, Stoll MS, Minkler PE, and Hoppel CL. Myocardial ischemia selectively depletes cardiolipin in rabbit heart subsarcolemmal mitochondria. Am J Physiol Heart Circ Physiol 280: H2770-2778, 2001. 35. Midaoui AE, Elimadi A, Wu L, Haddad PS, and de Champlain J. Lipoic acid prevents hypertension, hyperglycemia, and the increase in heart mitochondrial superoxide production. Am J Hypertens 16: 173-179, 2003. 36. Mikrut K, Paluszak J, Kozlik J, Sosnowski P, Krauss H, and Grzeskowiak E. The effect of bradykinin on the oxidative state of rats with acute hyperglycaemia. Diabetes Res Clin Pract 51: 79-85, 2001. 37. Moghaddas S, Stoll MS, Minkler PE, Salomon RG, Hoppel CL, and Lesnefsky EJ. Preservation of cardiolipin content during aging in rat heart interfibrillar mitochondria. J Gerontol A Biol Sci Med Sci 57: B22-28, 2002. 38. Mollica MP, Lionetti L, Crescenzo R, D'Andrea E, Ferraro M, Liverini G, and Iossa S. Heterogeneous bioenergetic behavior of subsarcolemmal and intermyofibrillar mitochondria in fed and fasted rats. Cell Mol Life Sci 63: 358-366, 2006. 39. Newsholme E and AR L. Biochemistry for the Medical Sciences. Chichester: John Wiley & Sons, 1983. 40. O'Brien PJ and Little C. Intracellular mechanisms for the decomposition of a lipid peroxide. II. Decomposition of a lipid peroxide by subcellular fractions. Can J Biochem 47: 493-499, 1969. 41. Ohkuwa T, Sato Y, and Naoi M. Hydroxyl radical formation in diabetic rats induced by streptozotocin. Life Sci 56: 1789-1798, 1995. 42. Oliveira PJ, Seica R, Coxito PM, Rolo AP, Palmeira CM, Santos MS, and Moreno AJ. Enhanced permeability transition explains the reduced calcium uptake in cardiac mitochondria from streptozotocin-induced diabetic rats. FEBS Lett 554: 511-514, 2003. 43. Pacher P and Szabo C. Role of peroxynitrite in the pathogenesis of cardiovascular complications of diabetes. Curr Opin Pharmacol 6: 136-141, 2006. 44. Palmer JW, Tandler B, and Hoppel CL. Biochemical properties of subsarcolemmal and interfibrillar mitochondria isolated from rat cardiac muscle. J Biol Chem 252: 8731-8739, 1977. 45. Pennathur S, Wagner JD, Leeuwenburgh C, Litwak KN, and Heinecke JW. A hydroxyl radical-like species oxidizes cynomolgus monkey artery wall proteins in early diabetic vascular disease. J Clin Invest 107: 853-860, 2001. 46. Petrosillo G, Ruggiero FM, and Paradies G. Role of reactive oxygen species and cardiolipin in the release of cytochrome c from mitochondria. FASEB J 17: 2202-2208, 2003. 47. Petzold GL and Swenberg JA. Detection of DNA damage induced in vivo following exposure of rats to carcinogens. Cancer Res 38: 1589-1594, 1978. 48. Ritov VB, Menshikova EV, He J, Ferrell RE, Goodpaster BH, and Kelley DE. Deficiency of subsarcolemmal mitochondria in obesity and type 2 diabetes. Diabetes 54: 8-14, 2005. 49. Riva A, Tandler B, Loffredo F, Vazquez E, and Hoppel C. Structural differences in two biochemically defined populations of cardiac mitochondria. Am J Physiol Heart Circ Physiol 289: H868-872, 2005. 50. Rolo AP and Palmeira CM. Diabetes and mitochondrial function: role of hyperglycemia and oxidative stress. Toxicol Appl Pharmacol 212: 167-178, 2006. 51. Santos DL, Palmeira CM, Seica R, Dias J, Mesquita J, Moreno AJ, and Santos MS. Diabetes and mitochondrial oxidative stress: a study using heart mitochondria from the diabetic Goto-Kakizaki rat. Mol Cell Biochem 246: 163-170, 2003.

28
52. Severson DL. Diabetic cardiomyopathy: recent evidence from mouse models of type 1 and type 2 diabetes. Can J Physiol Pharmacol 82: 813-823, 2004. 53. Shen X, Zheng S, Metreveli NS, and Epstein PN. Protection of cardiac mitochondria by overexpression of MnSOD reduces diabetic cardiomyopathy. Diabetes 55: 798-805, 2006. 54. Shen X, Zheng S, Thongboonkerd V, Xu M, Pierce WM, Jr., Klein JB, and Epstein PN. Cardiac mitochondrial damage and biogenesis in a chronic model of type 1 diabetes. Am J Physiol Endocrinol Metab 287: E896-905, 2004. 55. Shimada T, Horita K, Murakami M, and Ogura R. Morphological studies of different mitochondrial populations in monkey myocardial cells. Cell Tissue Res 238: 577-582, 1984. 56. Stanley WC, Lopaschuk GD, and McCormack JG. Regulation of energy substrate metabolism in the diabetic heart. Cardiovasc Res 34: 25-33, 1997. 57. Suh JH, Heath SH, and Hagen TM. Two subpopulations of mitochondria in the aging rat heart display heterogeneous levels of oxidative stress. Free Radic Biol Med 35: 1064-1072, 2003. 58. Taegtmeyer H, McNulty P, and Young ME. Adaptation and maladaptation of the heart in diabetes: Part I: general concepts. Circulation 105: 1727-1733, 2002. 59. Trost SU, Belke DD, Bluhm WF, Meyer M, Swanson E, and Dillmann WH. Overexpression of the sarcoplasmic reticulum Ca(2+)-ATPase improves myocardial contractility in diabetic cardiomyopathy. Diabetes 51: 1166-1171, 2002. 60. Trounce IA, Kim YL, Jun AS, and Wallace DC. Assessment of mitochondrial oxidative phosphorylation in patient muscle biopsies, lymphoblasts, and transmitochondrial cell lines. Methods Enzymol 264: 484-509, 1996. 61. Waczulikova I, Habodaszova D, Cagalinec M, Ferko M, Ulicna O, Mateasik A, Sikurova L, and Ziegelhoffer A. Mitochondrial membrane fluidity, potential, and calcium transients in the myocardium from acute diabetic rats. Can J Physiol Pharmacol 85: 372-381, 2007. 62. Wang Y, Fang J, Leonard SS, and Rao KM. Cadmium inhibits the electron transfer chain and induces reactive oxygen species. Free Radic Biol Med 36: 1434-1443, 2004. 63. Zarich SW and Nesto RW. Diabetic cardiomyopathy. Am Heart J 118: 1000-1012, 1989.

A)
B) C)
Figure 1

D)
E)
††
075
150225300375450
SSM IFM
(AU
)
ControlDiabetic
†
†
†
E)
0
50
100
150
200
SSM IFM
(AU)
ControlDiabetic
†
0
50
100
150
200
SSM IFM
(AU)
ControlDiabetic
†
0
50
100
150
200
SSM IFM
ControlDiabetic
†(AU
)†
Figure 1
Group
Body Weight
(g)
Heart Weight
(mg)
HW/BW Ratio
(mg/g)
+dP/dt
(mm Hg/sec)
-dP/dt
(mm Hg/sec)
DP
(mm Hg)
SSM Protein
(mg/g tissue)
IFM Protein
(mg/g tissue)
Control 27.4±1.3 102±4 3.7±0.1 3398±128 2310±114 96±2 18.9±2.1 10.3±0.8
Diabetic 28.4±0.8 108±6 3.8±0.2 1934±116* 1680±144* 57±3* 19.5±2.2 9.5±1.5
Table 1

Figure 2A
†
02468
10121416
SSM IFM
Complex IControlDiabetic
nmol
O2
cons
umed
/min
/mg
prot
ein

†
*
010203040506070
SSM IFM
Complex IIControlDiabetic
nmol
O2
cons
umed
/min
/mg
prot
ein
Figure 2B

0
500
1000
1500
2000
2500
3000
3500
4000
SSM IFM
nmol
/min
/mg
of p
rote
inControlDiabetic
*
Complex III
Figure 2C

0
75
150
225
300
375
450
SSM IFM
Complex IV
nmol
O2
cons
umed
/min
/mg
prot
ein
ControlDiabetic
Figure 2D

SSM
Control Diabetic
IFM
+SOD
SSM
IFM
+SOD
A
C
E
B
D
F
XO
Figure 3
G

†††
010203040506070
SSM IFM
Peak
Hei
ght (
mm
)
ControlDiabetic
†
Figure 3H
*
0
0.5
1
1.5
2
2.5
3
SSM IFM
ControlDiabetic
nmol
nitr
otyr
osin
e/m
g pr
otei
n
Figure 4
†
††
0
5
10
15
20
25
30
SSM IFM
ControlDiabetic
µmol
MD
A+4-
HA
E/m
g pr
otei
n
Figure 5

Figure 6A-B
B
m/z 723
9 646.1675.1
695.1 709.3736.7
748.3
747.3
m/z 619
A
m/z 619
m/z 723
640.3 650.8 668.9695.1
711.2737
747.3
IFM Diabetic
IFM Control

0
2
4
6
8
10
12
SSM IFM
Rat
io 7
23/6
19 P
eak
ControlDiabetic
*
Figure 6C
†