study of membrane potential in t lymphocytes subpopulations using flow cytometry
TRANSCRIPT
BioMed CentralBMC Immunology
ss
Open AcceMethodology articleStudy of membrane potential in T lymphocytes subpopulations using flow cytometryFernanda Mello de Queiroz*1,2, Cristiano G Ponte2,3, Adriana Bonomo4,5, Rosane Vianna-Jorge2,6 and Guilherme Suarez-Kurtz2,7Address: 1Molekulare Biologie Neuronaler Signale, Max-Planck-Institut für Experimentelle Medizin, Hermann-Rein-Strasse 3, 37075 Göttingen, Germany, 2Divisão de Farmacologia, Coordenação de Pesquisa, Instituto Nacional de Câncer, Rio de Janeiro, Brazil, 3Centro Federal de Educação Tecnológica de Química do Rio de Janeiro, Rio de Janeiro, Brazil, 4Divisão de Medicina Experimental, Coordenação de Pesquisa, Instituto Nacional de Câncer, Rio de Janeiro, Brazil, 5Instituto de Microbiologia Professor Paulo de Góes, Universidade Federal do Rio de Janeiro, Rio de Janeiro, Brazil, 6Departamento de Farmacologia Básica e Clínica, Universidade Federal do Rio de Janeiro, Rio de Janeiro, Brazil and 7Departamento de Bioquímica Médica, Universidade Federal do Rio de Janeiro, Rio de Janeiro, Brazil
Email: Fernanda Mello de Queiroz* - [email protected]; Cristiano G Ponte - [email protected]; Adriana Bonomo - [email protected]; Rosane Vianna-Jorge - [email protected]; Guilherme Suarez-Kurtz - [email protected]
* Corresponding author
AbstractBackground: Ion channels are involved in the control of membrane potential (ψ) in a variety ofcells. The maintenance of ψ in human T lymphocytes is essential for T-cell activation and wassuggested to depend mostly on the voltage-gated Kv1.3 channel. Blockage of Kv1.3 inhibits cytokineproduction and lymphocyte proliferation in vitro and suppresses immune response in vivo. Tlymphocytes are a heterogeneous cell population and the expression of Kv1.3 varies among cellsubsets. Oxonol diBA-C4-(3) was used to determine ψ by flow cytometry. The presence of distinctT cell subsets was evaluated by immunophenotyping techniques and the contribution of Kv1.3channels for the maintenance of ψ was investigated using selective blockers.
Results: The distribution of ψ in T lymphocytes varied among blood donors and did not alwaysfollow a unimodal pattern. T lymphocytes were divided into CD3+/CD45RO- and CD3+/CD45RO+
subsets, whose peak channel values of ψ were -58 ± 3.6 mV and -37 ± 4.1 mV, respectively. MgTX(specific inhibitor of Kv1.3 channels) had no significant effect in the ψ of CD3+/CD45RO- subsetsbut depolarized CD3+/CD45RO+ cells to -27 ± 5.1 mV.
Conclusion: Combination of optical methods for determination of ψ by flow cytometry withimmuophenotyping techniques opens new possibilities for the study of ion channels in the biologyof heterogeneous cell populations such as T lymphocyte subsets.
BackgroundElectrical potential differences are generated across thecytoplasmic membranes of animal cells by concentrationgradients of ions such as Na+, K+, Cl- and H+. The mainte-nance of membrane potential (ψ) depends on ion chan-
nels, ion pumps and eletrogenic transporters. Ionchannels also regulate various cell functions such as: elec-trical excitability of myocytes and neurons [1], cell prolif-eration [2-4] and hormone secretion [5,6]. The study of ψvariations require the use of electrophysiological methods
Published: 3 November 2008
BMC Immunology 2008, 9:63 doi:10.1186/1471-2172-9-63
Received: 23 May 2008Accepted: 3 November 2008
This article is available from: http://www.biomedcentral.com/1471-2172/9/63
© 2008 de Queiroz et al; licensee BioMed Central Ltd. This is an Open Access article distributed under the terms of the Creative Commons Attribution License (http://creativecommons.org/licenses/by/2.0), which permits unrestricted use, distribution, and reproduction in any medium, provided the original work is properly cited.
Page 1 of 11(page number not for citation purposes)
BMC Immunology 2008, 9:63 http://www.biomedcentral.com/1471-2172/9/63
[1,7], the patch-clamp being the gold-standard technique[7], because it allows detailed biophysical characteriza-tion of ion channels [8,9] and, combined with pharmaco-logical tools, the study of their contribution to ψ [9,10].However, patch-clamp analysis is restricted to one cell ata time, limiting its application for the study of large andheterogeneous cell populations. Optical methods for thedetermination of ψ were introduced by Cohen et al. [11]and are an alternative for the study of ψ variations in alarge number of cells within a reasonably short period oftime. These optical methods are based on the use of fluo-rescent dyes, which respond to membrane polarity stimulicausing changes in fluorescence [12]. Combination ofoptical methods for the measurement of ψ with flowcytometry (Fluorescence Activated Cell Sorter – FACS)techniques opens new possibilities for the study of ionchannels in the biology of heterogeneous cell popula-tions.
Human T lymphocytes are a good example of a heteroge-neous cell population in which the study of ion channelsand their contribution for ψ is of great interest. The activa-tion of T lymphocytes during the immune responserequires continuous Ca2+ influx across the plasma mem-brane [13,14]. The voltage-gated K+ channel, Kv1.3 [8,15]and the Ca2+-activated-K+ channel, KCa3.1 modulate cal-cium influx by regulating the ψ and providing electricaldriving force for continuous Ca2+ entry [8,16]. WhileKCa3.1 blockers are able to prevent proliferation inmitogen-activated lymphocytes [16], blockage of Kv1.3channels by specific inhibitors, such as margatoxin(MgTX) prevent proliferation in resting T cells. Blockageof Kv1.3 channels causes a depolarization of the ψ leadingto a reduction in the intracellular Ca2+ concentration[8,16]. As a consequence, cytokine production and cellproliferation are inhibited [15], which attenuatesimmune response in vivo [2]. Data in the literature regard-ing expression of Kv1.3 and control of ψ were obtainedwith path-clamp techniques on isolated T cells activated invitro [17-19]. Peripheral T cells, however, are composed ofnon-activated (naive) T cells, pre-activated T blasts andmemory T cells. Data obtained by optical methods esti-mate that the ψ of peripheral T cells vary between -70 and-45 mV [20-22], suggesting that different subsets of T cellspresent in peripheral blood have distinct ψ.
The membrane potential-sensitive fluorescent dye oxonol(diBA-C4-(3) was chosen due to advantages over otherdyes: i) it is non-cytotoxic, ii) not shown to block ionchannels and iii) it is not extruded by the glycoproteinefflux pump [23,24]. In the present work we combineoxonol with FACS-immunophenotyping techniques inorder to characterize the ψ in specific sub-populations ofhuman T lymphocytes [25]. We use specific inhibitors ofpotassium channels to evaluate the role of voltage-gated
K+ channels in controlling the ψ in naive and in memoryT cells.
ResultsValidation of FACS estimates of ψThe calculation of ψ was based on the Nernst equation: ψ= RT/F*ln(Oxi/Oxe), where R is the universal gas constant,T is the absolute temperature, F is the Faraday's constantand Oxi and Oxe are the internal and external concentra-tions of oxonol, respectively. The calibration curve wasdetermined using different concentrations of extracellularoxonol. Since the external and internal concentrations ofthe dye are equal when the ψ is the same (Oxi = Oxe *expψF/RT), one can assume a new calibration curve based onOxi. The ratio Oxi/Oxe was calculated based on the acqui-sition of a fixed sample (ψ equal to 0 mV) using the sameOxe for both. Afterwards the ratio value of Oxi/Oxe wasused to calculate the ψ based on the Nernst equation [26].
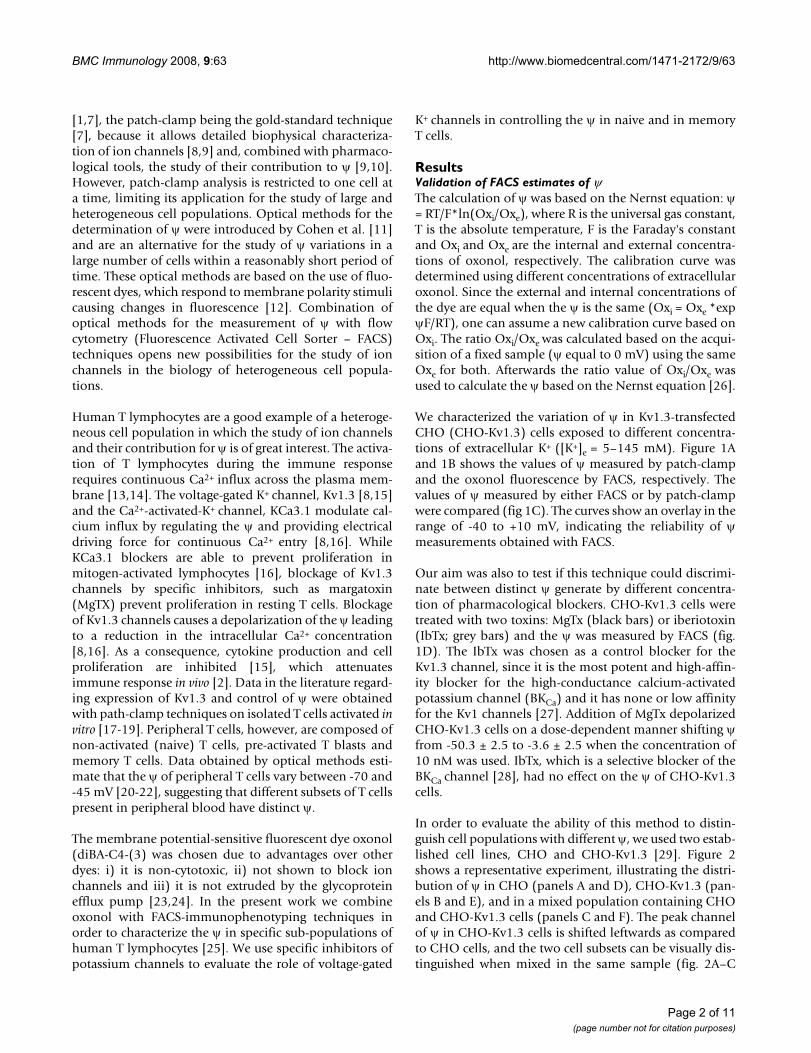
We characterized the variation of ψ in Kv1.3-transfectedCHO (CHO-Kv1.3) cells exposed to different concentra-tions of extracellular K+ ([K+]e = 5–145 mM). Figure 1Aand 1B shows the values of ψ measured by patch-clampand the oxonol fluorescence by FACS, respectively. Thevalues of ψ measured by either FACS or by patch-clampwere compared (fig 1C). The curves show an overlay in therange of -40 to +10 mV, indicating the reliability of ψmeasurements obtained with FACS.
Our aim was also to test if this technique could discrimi-nate between distinct ψ generate by different concentra-tion of pharmacological blockers. CHO-Kv1.3 cells weretreated with two toxins: MgTx (black bars) or iberiotoxin(IbTx; grey bars) and the ψ was measured by FACS (fig.1D). The IbTx was chosen as a control blocker for theKv1.3 channel, since it is the most potent and high-affin-ity blocker for the high-conductance calcium-activatedpotassium channel (BKCa) and it has none or low affinityfor the Kv1 channels [27]. Addition of MgTx depolarizedCHO-Kv1.3 cells on a dose-dependent manner shifting ψfrom -50.3 ± 2.5 to -3.6 ± 2.5 when the concentration of10 nM was used. IbTx, which is a selective blocker of theBKCa channel [28], had no effect on the ψ of CHO-Kv1.3cells.
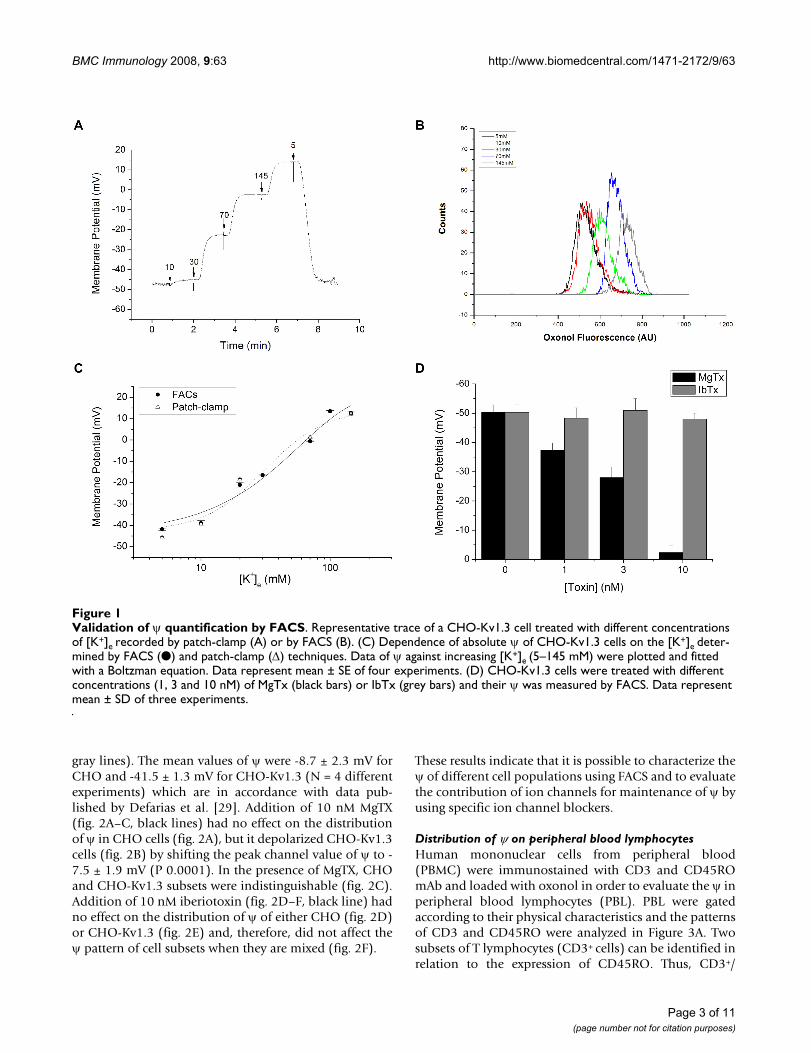
In order to evaluate the ability of this method to distin-guish cell populations with different ψ, we used two estab-lished cell lines, CHO and CHO-Kv1.3 [29]. Figure 2shows a representative experiment, illustrating the distri-bution of ψ in CHO (panels A and D), CHO-Kv1.3 (pan-els B and E), and in a mixed population containing CHOand CHO-Kv1.3 cells (panels C and F). The peak channelof ψ in CHO-Kv1.3 cells is shifted leftwards as comparedto CHO cells, and the two cell subsets can be visually dis-tinguished when mixed in the same sample (fig. 2A–C
Page 2 of 11(page number not for citation purposes)
BMC Immunology 2008, 9:63 http://www.biomedcentral.com/1471-2172/9/63
gray lines). The mean values of ψ were -8.7 ± 2.3 mV forCHO and -41.5 ± 1.3 mV for CHO-Kv1.3 (N = 4 differentexperiments) which are in accordance with data pub-lished by Defarias et al. [29]. Addition of 10 nM MgTX(fig. 2A–C, black lines) had no effect on the distributionof ψ in CHO cells (fig. 2A), but it depolarized CHO-Kv1.3cells (fig. 2B) by shifting the peak channel value of ψ to -7.5 ± 1.9 mV (P 0.0001). In the presence of MgTX, CHOand CHO-Kv1.3 subsets were indistinguishable (fig. 2C).Addition of 10 nM iberiotoxin (fig. 2D–F, black line) hadno effect on the distribution of ψ of either CHO (fig. 2D)or CHO-Kv1.3 (fig. 2E) and, therefore, did not affect theψ pattern of cell subsets when they are mixed (fig. 2F).
These results indicate that it is possible to characterize theψ of different cell populations using FACS and to evaluatethe contribution of ion channels for maintenance of ψ byusing specific ion channel blockers.
Distribution of ψ on peripheral blood lymphocytesHuman mononuclear cells from peripheral blood(PBMC) were immunostained with CD3 and CD45ROmAb and loaded with oxonol in order to evaluate the ψ inperipheral blood lymphocytes (PBL). PBL were gatedaccording to their physical characteristics and the patternsof CD3 and CD45RO were analyzed in Figure 3A. Twosubsets of T lymphocytes (CD3+ cells) can be identified inrelation to the expression of CD45RO. Thus, CD3+/
Validation of ψ quantification by FACSFigure 1Validation of ψ quantification by FACS. Representative trace of a CHO-Kv1.3 cell treated with different concentrations of [K+]e recorded by patch-clamp (A) or by FACS (B). (C) Dependence of absolute ψ of CHO-Kv1.3 cells on the [K+]e deter-mined by FACS (●) and patch-clamp (Δ) techniques. Data of ψ against increasing [K+]e (5–145 mM) were plotted and fitted with a Boltzman equation. Data represent mean ± SE of four experiments. (D) CHO-Kv1.3 cells were treated with different concentrations (1, 3 and 10 nM) of MgTx (black bars) or IbTx (grey bars) and their ψ was measured by FACS. Data represent mean ± SD of three experiments.
Page 3 of 11(page number not for citation purposes)
BMC Immunology 2008, 9:63 http://www.biomedcentral.com/1471-2172/9/63
CD45RO- are in the upper left gate (R2), whereas theCD3+/CD45RO+ are in the upper right gate (R3). Figure3B shows the CD45RO+ subset according to the oxonolfluorescence distribution. The distribution of ψ in CD3+
cells did not always follow a unimodal pattern, as theexample illustrated in figure 3B. In two out of six blooddonors, we obtained a bimodal distribution of ψ. Separa-tion of CD3+ cells according to the expression of CD45ROallowed characterization of ψ in the two cell subsets. Thus,CD3+/CD45RO- cells were hyperpolarized in relation toCD3+/CD45RO+ cells (fig. 3C), the peak channel values ofψ being -58 ± 3.6 mV and -37 ± 4.1 mV, respectively (P =0.0087).
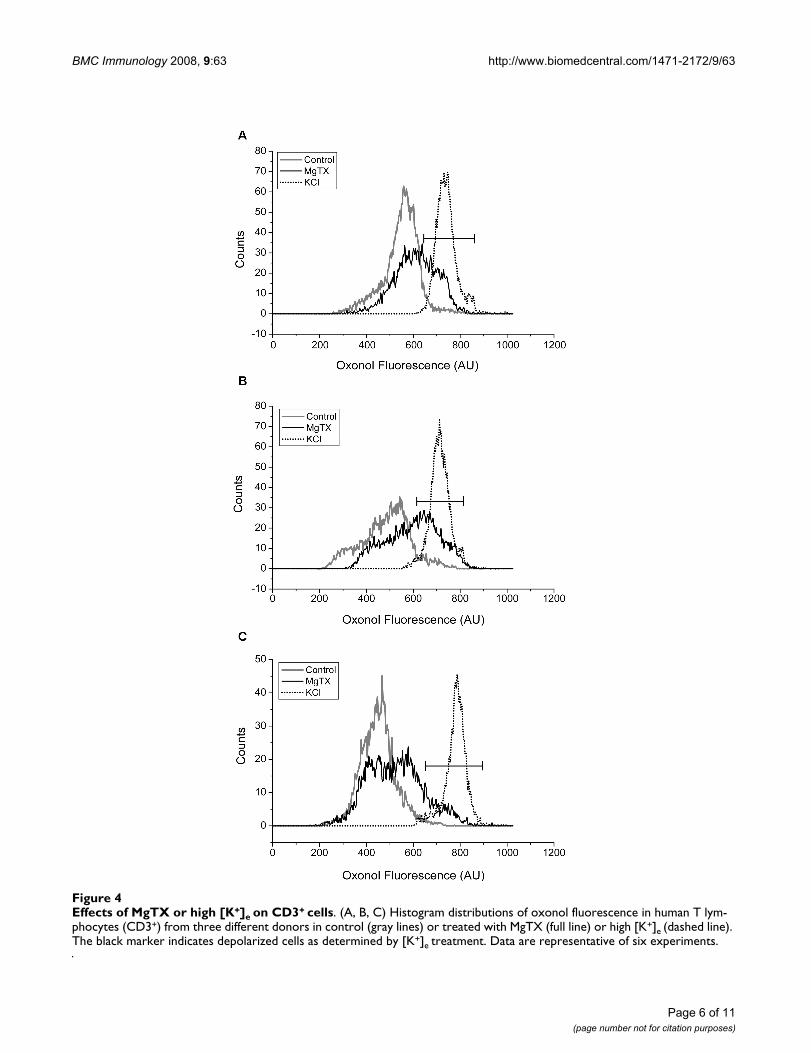
Effects of MgTX or high [K+]e on the ψ of PBLFigure 4 shows the histograms of ψ distribution obtainedwith CD3+ cells from three different donors (A, B and C)in control (gray line) and upon treatment with either 10nM MgTX (black line) or high [K+]e (145 mM; dottedline). The three control CD3+ samples represent the dis-tinct distribution patterns of ψ. Thus, donors A and Cshowed a unimodal pattern on the control trace, whereasdonor B showed a bimodal pattern. Addition of high [K+]edepolarized all the samples to approximately 0 mV (peakchannel evaluation) and generated a unimodal pattern in
all histograms studied. In contrast, addition of MgTX pro-duced diverse degrees of response, causing partial depo-larization, which broadened the ψ distribution (Fig. 4A)or generated a bimodal pattern (Fig. 4C). Percentage ofcells which depolarized upon treatment with MgTx andoverlapped with the histogram acquire after treatmentwith high [K+]e were determined. Addition of MgTx didnot depolarize all population when compared with thehigh [K+]e treatment; it rather depolarized a small part(black marker) which accounts for 27, 39 and 12% ofCD3+ cells from the different blood donors (fig. 4A,B and4C, respectively).
In order to characterize the distinct degrees of depolariza-tion upon exposure to MgTX in activated T lymphocytes,we investigated the presence of CD45RO- and CD45RO+
cells in the different samples and evaluated the sensitivityof each cell subset to MgTX. The proportion of CD45RO-
and CD45RO+ varied among donors and the individualswith higher amounts of CD45RO+ cells among T lym-phocytes (N = 4) showed significant depolarization upontreatment with MgTX (from -45 to -15 mV, P = 0.0025),whereas those with low proportion of CD45RO+ cells (N= 2) were not affected by MgTX exposure (data notshown).
FACS measurement of ψ distinguishes CHO-Kv1.3 from CHO cellsFigure 2FACS measurement of ψ distinguishes CHO-Kv1.3 from CHO cells. Histograms of oxonol fluorescence in CHO (A, D), CHO-Kv1.3 (B, E) and a combination of CHO and CHO-Kv1.3 (C, F) untreated (gray lines) or treated (black lines) with MgTX (A, B, C) or IbTX (D, E, F). The ψ values in mV are depicted. Data are representative of four experiments.
Page 4 of 11(page number not for citation purposes)

BMC Immunology 2008, 9:63 http://www.biomedcentral.com/1471-2172/9/63
Page 5 of 11(page number not for citation purposes)
Distinct ψ in different subsets of PBLFigure 3Distinct ψ in different subsets of PBL. (A) Dot-plot of control PBL stained with anti-CD3 (y-axis) and anti-CD45RO (x-axis). The CD3+/CD45RO- and CD3+/CD45RO+ sets are depicted in the upper left (R2) and upper right gate (R3), respec-tively. (B) Dot-plot of the CD45RO sub-population according to the oxonol fluorescence distribution. Numbers displayed inside the dot-plot represent the percentage of cells contained in each quadrant. (C) Histograms distributions of oxonol fluo-rescence in control PBL cells gated on R2 (red) or R3 (black). Numbers depicted represent the ψ values. Data are representa-tive of six experiments.
BMC Immunology 2008, 9:63 http://www.biomedcentral.com/1471-2172/9/63
Page 6 of 11(page number not for citation purposes)
Effects of MgTX or high [K+]e on CD3+ cellsFigure 4Effects of MgTX or high [K+]e on CD3+ cells. (A, B, C) Histogram distributions of oxonol fluorescence in human T lym-phocytes (CD3+) from three different donors in control (gray lines) or treated with MgTX (full line) or high [K+]e (dashed line). The black marker indicates depolarized cells as determined by [K+]e treatment. Data are representative of six experiments.
BMC Immunology 2008, 9:63 http://www.biomedcentral.com/1471-2172/9/63
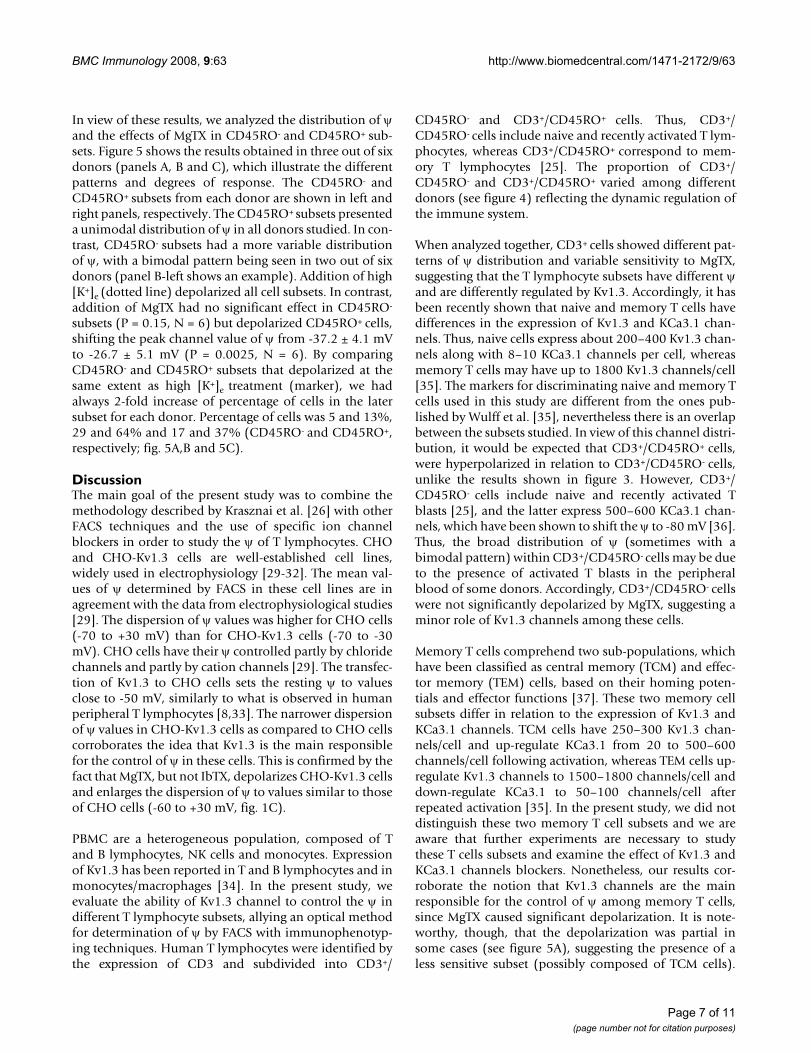
In view of these results, we analyzed the distribution of ψand the effects of MgTX in CD45RO- and CD45RO+ sub-sets. Figure 5 shows the results obtained in three out of sixdonors (panels A, B and C), which illustrate the differentpatterns and degrees of response. The CD45RO- andCD45RO+ subsets from each donor are shown in left andright panels, respectively. The CD45RO+ subsets presenteda unimodal distribution of ψ in all donors studied. In con-trast, CD45RO- subsets had a more variable distributionof ψ, with a bimodal pattern being seen in two out of sixdonors (panel B-left shows an example). Addition of high[K+]e (dotted line) depolarized all cell subsets. In contrast,addition of MgTX had no significant effect in CD45RO-
subsets (P = 0.15, N = 6) but depolarized CD45RO+ cells,shifting the peak channel value of ψ from -37.2 ± 4.1 mVto -26.7 ± 5.1 mV (P = 0.0025, N = 6). By comparingCD45RO- and CD45RO+ subsets that depolarized at thesame extent as high [K+]e treatment (marker), we hadalways 2-fold increase of percentage of cells in the latersubset for each donor. Percentage of cells was 5 and 13%,29 and 64% and 17 and 37% (CD45RO- and CD45RO+,respectively; fig. 5A,B and 5C).
DiscussionThe main goal of the present study was to combine themethodology described by Krasznai et al. [26] with otherFACS techniques and the use of specific ion channelblockers in order to study the ψ of T lymphocytes. CHOand CHO-Kv1.3 cells are well-established cell lines,widely used in electrophysiology [29-32]. The mean val-ues of ψ determined by FACS in these cell lines are inagreement with the data from electrophysiological studies[29]. The dispersion of ψ values was higher for CHO cells(-70 to +30 mV) than for CHO-Kv1.3 cells (-70 to -30mV). CHO cells have their ψ controlled partly by chloridechannels and partly by cation channels [29]. The transfec-tion of Kv1.3 to CHO cells sets the resting ψ to valuesclose to -50 mV, similarly to what is observed in humanperipheral T lymphocytes [8,33]. The narrower dispersionof ψ values in CHO-Kv1.3 cells as compared to CHO cellscorroborates the idea that Kv1.3 is the main responsiblefor the control of ψ in these cells. This is confirmed by thefact that MgTX, but not IbTX, depolarizes CHO-Kv1.3 cellsand enlarges the dispersion of ψ to values similar to thoseof CHO cells (-60 to +30 mV, fig. 1C).
PBMC are a heterogeneous population, composed of Tand B lymphocytes, NK cells and monocytes. Expressionof Kv1.3 has been reported in T and B lymphocytes and inmonocytes/macrophages [34]. In the present study, weevaluate the ability of Kv1.3 channel to control the ψ indifferent T lymphocyte subsets, allying an optical methodfor determination of ψ by FACS with immunophenotyp-ing techniques. Human T lymphocytes were identified bythe expression of CD3 and subdivided into CD3+/
CD45RO- and CD3+/CD45RO+ cells. Thus, CD3+/CD45RO- cells include naive and recently activated T lym-phocytes, whereas CD3+/CD45RO+ correspond to mem-ory T lymphocytes [25]. The proportion of CD3+/CD45RO- and CD3+/CD45RO+ varied among differentdonors (see figure 4) reflecting the dynamic regulation ofthe immune system.
When analyzed together, CD3+ cells showed different pat-terns of ψ distribution and variable sensitivity to MgTX,suggesting that the T lymphocyte subsets have different ψand are differently regulated by Kv1.3. Accordingly, it hasbeen recently shown that naive and memory T cells havedifferences in the expression of Kv1.3 and KCa3.1 chan-nels. Thus, naive cells express about 200–400 Kv1.3 chan-nels along with 8–10 KCa3.1 channels per cell, whereasmemory T cells may have up to 1800 Kv1.3 channels/cell[35]. The markers for discriminating naive and memory Tcells used in this study are different from the ones pub-lished by Wulff et al. [35], nevertheless there is an overlapbetween the subsets studied. In view of this channel distri-bution, it would be expected that CD3+/CD45RO+ cells,were hyperpolarized in relation to CD3+/CD45RO- cells,unlike the results shown in figure 3. However, CD3+/CD45RO- cells include naive and recently activated Tblasts [25], and the latter express 500–600 KCa3.1 chan-nels, which have been shown to shift the ψ to -80 mV [36].Thus, the broad distribution of ψ (sometimes with abimodal pattern) within CD3+/CD45RO- cells may be dueto the presence of activated T blasts in the peripheralblood of some donors. Accordingly, CD3+/CD45RO- cellswere not significantly depolarized by MgTX, suggesting aminor role of Kv1.3 channels among these cells.
Memory T cells comprehend two sub-populations, whichhave been classified as central memory (TCM) and effec-tor memory (TEM) cells, based on their homing poten-tials and effector functions [37]. These two memory cellsubsets differ in relation to the expression of Kv1.3 andKCa3.1 channels. TCM cells have 250–300 Kv1.3 chan-nels/cell and up-regulate KCa3.1 from 20 to 500–600channels/cell following activation, whereas TEM cells up-regulate Kv1.3 channels to 1500–1800 channels/cell anddown-regulate KCa3.1 to 50–100 channels/cell afterrepeated activation [35]. In the present study, we did notdistinguish these two memory T cell subsets and we areaware that further experiments are necessary to studythese T cells subsets and examine the effect of Kv1.3 andKCa3.1 channels blockers. Nonetheless, our results cor-roborate the notion that Kv1.3 channels are the mainresponsible for the control of ψ among memory T cells,since MgTX caused significant depolarization. It is note-worthy, though, that the depolarization was partial insome cases (see figure 5A), suggesting the presence of aless sensitive subset (possibly composed of TCM cells).
Page 7 of 11(page number not for citation purposes)
BMC Immunology 2008, 9:63 http://www.biomedcentral.com/1471-2172/9/63
Page 8 of 11(page number not for citation purposes)
Effects of MgTX or high [K+]e on subsets of CD3+ cellsFigure 5Effects of MgTX or high [K+]e on subsets of CD3+ cells. Histograms distribution of oxonol fluorescence in CD3+/CD45RO- and CD3+/CD45RO+ untreated cells (gray lines) and treated with MgTX (full lines) or high [K+]e (dashed lines). The proportions of CD3+/CD45RO- and CD3+/CD45RO+ were 30% and 60% (A), 60% and 30% (B) and 45% and 35% (C) for the CD45RO- and CD45RO+ populations of the total CD3+, respectively. The black marker indicates depolarized cells as deter-mined by [K+]e treatment. Data are representative of six experiments.
BMC Immunology 2008, 9:63 http://www.biomedcentral.com/1471-2172/9/63
The correlation between a specific channel and its abilityto maintain the resting potential of a particular popula-tion of cells requires the use of more specific blocker sincemany of the available pharmacological channel blockerstarget more than one channel. Nevertheless, we can sug-gest that the Kv1.3 channel is involved in the regulation ofψ from the CD3+/CD45RO+ subset of T lymphocytes (fig.5).
The fact that Kv1.3 channel is functionally restrictedregarding tissue distribution together with the improve-ment of experimental autoimmune encephalomyelitis[38] and delayed type hypersensitivity in animal modelswithout causing obvious side effects has made Kv1.3 aninteresting therapeutic target [2,39,40]. A rapid screeningof new ion channel blockers and the determination of theexact subset of cells affected by these blockers would be ofgreat interest in the development of new immunossupres-sive therapies.
ConclusionIn summary, our results indicate that FACS determinationof ψ can be used for identification of ψ heterogeneityamong cell populations. Combination of this methodwith other FACS techniques could also be used for deter-mination of ψ in different cell cycle phases, developmen-tal stages or activation patterns and for rapid screening ofnew ion channel blockers. This represents a new strategyfor studying the role of ion channels in cell growth anddifferentiation of normal and tumoral cells.
MethodsCellsCHO cells were obtained from Rio de Janeiro Cell Bank(PABCAM, Federal University, Rio de Janeiro, RJ, Brazil)and CHO-Kv1.3 cells [29] were a kind gift from Dr. MariaL. Garcia (Merck & Co., Rahway, NJ, USA). Both cell lineswere maintained in α-Minimum Essential Medium(Gibco-BRL – Life Technologies, Inc., Grand Island, NY,USA) supplemented with 10% (v/v) heat-inactivatedbovine fetal serum (Gibco), 60 mg/L penicillin (SigmaChemical Co., St Louis, MO, USA), 100 mg/L streptomy-cin (Sigma) 2.4 g/L HEPES (Sigma). Cultures were grownin a humidified incubator at 37°C, 5% CO2.
PBMC were isolated from the peripheral blood of healthydonors by centrifugation on a Ficoll gradient. PBMC werewashed and incubated with RPMI 1640 medium (Sigma)supplemented with 10% (v/v) heat-inactivated bovinefetal serum (Gibco), 60 mg/L penicillin (Sigma), 100 mg/L streptomycin (Sigma) for 30 minutes (37°C, 5% CO2humidified atmosphere). The study was evaluated by theNational Cancer Institute (INCa-Brazil/RJ) Ethical Com-mittee and the informed consent of all participating sub-jects was obtained.
Samples were fixed with ice-cold 2% formaldehyde andkept at 40°C for 60 minutes. Cells were washed with PBSand kept at room temperature before the measurements.
ReagentsBis(1,3-dibutylbarbituric acid(5)) trimethine oxonol(diBA-C4-(3)), obtained from Molecular Probes (Invitro-gen, Carlsbad, CA, USA), was dissolved in DMSO andstored in aliquots (1 mM) at -20°C, under protectionfrom light. Aliquots were added to the cell suspensions toyield the desired final concentration (5–1500 nM). Theoxonol concentration of 100 nM was used for the mem-brane potential measurements. The DMSO final concen-tration (0.1% (v/v)) had no effect on cell viability. Stocksolutions of MgTX (kindly provided by Dr. Maria L. Gar-cia, Merck & Co.) and IbTX (Alamone Labs, Jerusalem,Israel) were prepared in a saline solution with 100 mMNaCl, 20 mM Tris-HCl (pH 7.4), and 0.1% (w/v) BSA. Allother reagents were of analytical grade.
ElectrophysiologyMembrane potentials of CHO-Kv1.3 cells were measuredby whole-cell patch-clamp recordings obtained with anEPC-7 amplifier (Axon Instruments, Foster City, CA, USA)in current clamp mode with a 2 KHz analogical filter. Thesignals were digitized at 5 KHz (interface DigiData 1200 –Axon Instruments) and analyzed with the softwarepClamp 6.0 (Axon Instruments). Membrane voltageswere corrected for liquid junction potentials before patch-ing the cell at the voltage clamp mode. Pipettes with resist-ances of 3–6 M, were pulled from thin-walled borosilicateglass capillaries (Rochester Scientific Co. Inc., Rochester,NY, USA), and filled with a solution containing (in mM):140 KCl, 2 MgCl2, 0.123 CaCl2, 0.2 K2-EGTA, 10 Hepes(pH 7.4). The extracellular medium, designated PSS(physiological saline solution), contained (in mM): 140NaCl, 5 KCl, 2 MgCl2, 1 CaCl2, 10 HEPES (pH 7.4). HighK+ solutions (10 – 145 mM) were obtained by isotonicreplacement of NaCl with KCl in the PSS. Experimentswere performed at room temperature (22–25°C). The liq-uid junction potential correction was performed using thesoftware JPCalc [41].
Flow Cytometry (FACS)We used the method described by Krasznai et al. [26] fordetermination of ψ. The phosphate buffer solution (PBS)was replaced by the PSS, which is the standard solution inall experiments of electrophysiology in our laboratory.The method was validated using the PSS in CHO cells andin human lymphocytes.
PBMC were labeled with a PercP-conjugated anti-humanCD3 or PE-conjugated CD45RO mouse antibody (Phar-migen, San Diego, CA, USA), Fc receptor being blockedwith normal mouse serum (1:50) in PBS buffer. After a 20
Page 9 of 11(page number not for citation purposes)
BMC Immunology 2008, 9:63 http://www.biomedcentral.com/1471-2172/9/63
minute-incubation with the antibody at 4°C, cells werewashed with PSS kept at room temperature and re-sus-pended at a concentration of 106 ml-1.
Measurements were carried out at room temperature,using a Becton Dickison FACScan flow cytometer and datawere analyzed using Cell Quest or FlowJo program. For-ward-scatter (FSC) and side-scatter (SSC) lights were usedfor gating of data acquisition. Non-viable cells were iden-tified with propidium iodide (Sigma), and were excludedfrom analysis. All samples were excited with the 488 nmline and oxonol, PE and PercP fluorescence emission werecaptured at 530/30 nm, 585/42 nm and 670 nm longpass, respectively. The calculated values of ψ within a cellsubset are presented in histogram distributions and thepeak channels were used for comparative analysis. All theexperiments were performed at least four times and thedata are presented as mean ± standard error.
Statistical AnalysisUnpaired t test was performed for comparison of the val-ues of ψ between cell subsets and paired t test was used forcomparisons of ψ after different treatments within a givencell subset. The software GraphPad Prism version 4 wasapplied for the analysis.
Authors' contributionsFMQ carried out all flow cytometry experiments, anddrafted the manuscript. CGP carried out all electrophysi-ology experiments. AB contributed with intellectualexpertise to the flow cytometry data and drafted the man-uscript. RVJ and GK helped to draft the manuscript. Allauthors read and approved the final manuscript.
AcknowledgementsWe wish to thank Dr Luis A. Pardo for critically reading and helpful sugges-tions on the manuscript. We wish to thank our grant sponsor: Conselho Nacional de Pesquisa (CNPq, grant number: 400.866/2005–6) and
Fundação de Apoio à Pesquisa do Estado do Rio de Janeiro (FAPERJ, grant number: E-26/152,004/2004).
References1. Hille B: Ion Channels of Excitable Membranes Sinauer Associates Inc;
2001. 2. Koo GC, Blake JT, Talento A, Nguyen M, Lin S, Sirotina A, Shah K,
Mulvany K, Hora D, Cunningham P, et al.: Blockade of the voltage-gated potassium channel Kv1.3 inhibits immune responses invivo. J Immunol 1997, 158:5120-5128.
3. Nilius B, Wohlrab W: Potassium channels and regulation ofproliferation of human melanoma cells. J Physiol 1992,445:537-548.
4. Wang L, Xu B, White RE, Lu L: Growth factor-mediated K+channel activity associated with human myeloblastic ML-1cell proliferation. Am J Physiol 1997, 273:C1657-C1665.
5. Shibasaki T, Sunaga Y, Fujimoto K, Kashima Y, Seino S: Interactionof ATP sensor, cAMP sensor, Ca2+ sensor, and voltage-dependent Ca2+ channel in insulin granule exocytosis. J BiolChem 2004, 279:7956-7961.
6. Rossi NF: Cation channel mechanisms in ET-3-induced vaso-pressin secretion by rat hypothalamo-neurohypophysialexplants. Am J Physiol 1995, 268:E467-E475.
7. Hamill OP, Marty A, Neher E, Sakmann B, Sigworth FJ: Improvedpatch-clamp techniques for high-resolution current record-ing from cells and cell-free membrane patches. Pflugers Arch1981, 391:85-100.
8. Leonard RJ, Garcia ML, Slaughter RS, Reuben JP: Selective blockersof voltage-gated K+ channels depolarize human T lym-phocytes: mechanism of the antiproliferative effect ofcharybdotoxin. Proc Natl Acad Sci USA 1992, 89:10094-10098.
9. Zegarra-Moran O, Rasola A, Rugolo M, Porcelli AM, Rossi B, GaliettaLJ: HIV-1 nef expression inhibits the activity of a Ca2+-dependent K+ channel involved in the control of the restingpotential in CEM lymphocytes. J Immunol 1999, 162:5359-5366.
10. Wang L, Zhou P, Craig RW, Lu L: Protection from cell death bymcl-1 is mediated by membrane hyperpolarization inducedby K(+) channel activation. J Membr Biol 1999, 172:113-120.
11. Cohen LB: Changes in neuron structure during action poten-tial propagation and synaptic transmission. Physiol Rev 1973,53:373-418.
12. Waggoner AS: Dye indicators of membrane potential. Annu RevBiophys Bioeng 1979, 8:47-68.
13. Dolmetsch RE, Xu K, Lewis RS: Calcium oscillations increase theefficiency and specificity of gene expression. Nature 1998,392:933-936.
14. Lewis RS: Calcium signaling mechanisms in T lymphocytes.Annu Rev Immunol 2001, 19:497-521.
15. Lin CS, Boltz RC, Blake JT, Nguyen M, Talento A, Fischer PA, SpringerMS, Sigal NH, Slaughter RS, Garcia ML: Voltage-gated potassiumchannels regulate calcium-dependent pathways involved inhuman T lymphocyte activation. J Exp Med 1993, 177:637-645.
16. Ghanshani S, Wulff H, Miller MJ, Rohm H, Neben A, Gutman GA,Cahalan MD, Chandy KG: Up-regulation of the IKCa1 potas-sium channel during T-cell activation. Molecular mechanismand functional consequences. J Biol Chem 2000,275:37137-37149.
17. Verheugen JA: Elevation of intracellular Ca2+ in the physiolog-ically relevant range does not inhibit voltage-gated K+ chan-nels in human T lymphocytes. J Physiol 1998, 508(Pt 1):167-177.
18. Verheugen JA, Korn H: A charybdotoxin-insensitive conduct-ance in human T lymphocytes: T cell membrane potential isset by distinct K+ channels. J Physiol 1997, 503(Pt 2):317-331.
19. Rader RK, Kahn LE, Anderson GD, Martin CL, Chinn KS, Gregory SA:T cell activation is regulated by voltage-dependent and cal-cium-activated potassium channels. J Immunol 1996,156:1425-1430.
20. Wilson HA, Chused TM: Lymphocyte membrane potential andCa2+-sensitive potassium channels described by oxonol dyefluorescence measurements. J Cell Physiol 1985, 125:72-81.
21. Grinstein S, Smith JD: Calcium-independent cell volume regula-tion in human lymphocytes. Inhibition by charybdotoxin. JGen Physiol 1990, 95:97-120.
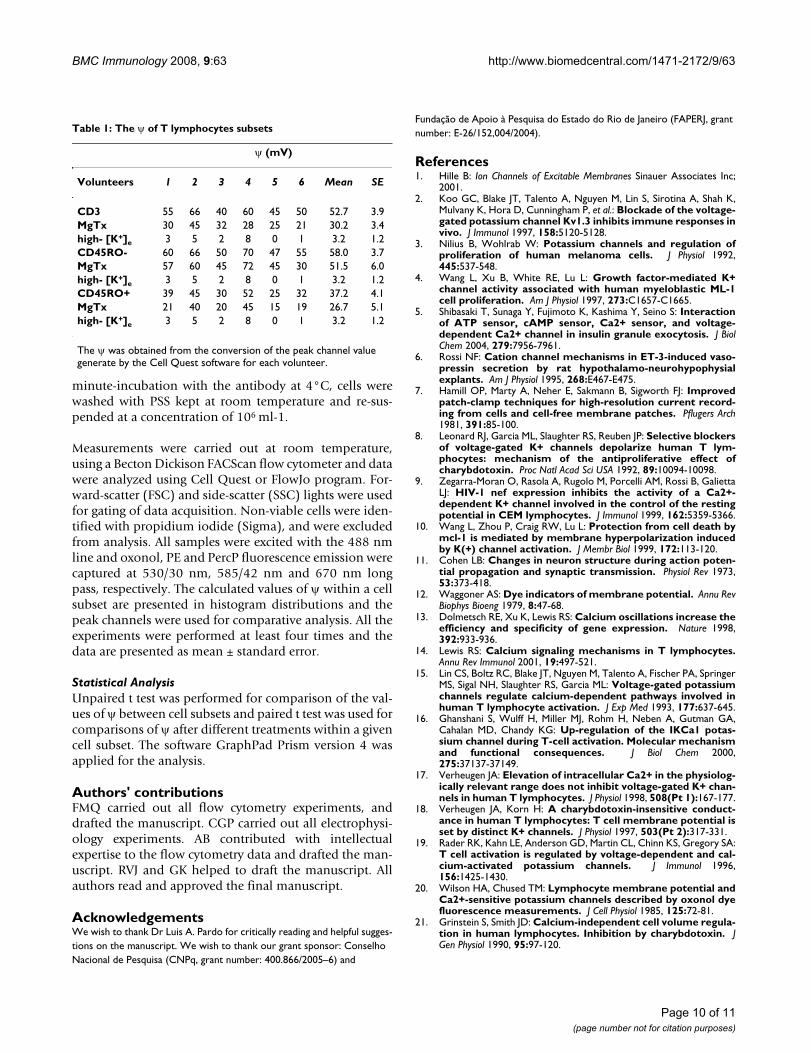
Table 1: The ψ of T lymphocytes subsets
ψ (mV)
Volunteers 1 2 3 4 5 6 Mean SE
CD3 55 66 40 60 45 50 52.7 3.9MgTx 30 45 32 28 25 21 30.2 3.4high- [K+]e 3 5 2 8 0 1 3.2 1.2CD45RO- 60 66 50 70 47 55 58.0 3.7MgTx 57 60 45 72 45 30 51.5 6.0high- [K+]e 3 5 2 8 0 1 3.2 1.2CD45RO+ 39 45 30 52 25 32 37.2 4.1MgTx 21 40 20 45 15 19 26.7 5.1high- [K+]e 3 5 2 8 0 1 3.2 1.2
The ψ was obtained from the conversion of the peak channel value generate by the Cell Quest software for each volunteer.
Page 10 of 11(page number not for citation purposes)
BMC Immunology 2008, 9:63 http://www.biomedcentral.com/1471-2172/9/63
Publish with BioMed Central and every scientist can read your work free of charge
"BioMed Central will be the most significant development for disseminating the results of biomedical research in our lifetime."
Sir Paul Nurse, Cancer Research UK
Your research papers will be:
available free of charge to the entire biomedical community
peer reviewed and published immediately upon acceptance
cited in PubMed and archived on PubMed Central
yours — you keep the copyright
Submit your manuscript here:http://www.biomedcentral.com/info/publishing_adv.asp
BioMedcentral
22. Aszalos A: Cyclosporin elicits a non-responsive state and ashift in K+ fluxes in the early phase of activation of humanlymphocytes with anti-CD3. Eur J Pharmacol 1991, 205:125-133.
23. Epps DE, Wolfe ML, Groppi V: Characterization of the steady-state and dynamic fluorescence properties of the potential-sensitive dye bis-(1,3-dibutylbarbituric acid)trimethine oxo-nol (Dibac4(3)) in model systems and cells. Chem Phys Lipids1994, 69:137-150.
24. Shapiro HM: Membrane potential estimation by flow cytome-try. Methods 2000, 21:271-279.
25. Dutton RW, Bradley LM, Swain SL: T cell memory. Annu Rev Immu-nol 1998, 16:201-223.
26. Krasznai Z, Márián T, Balkay L, Emri M, Trón L: Flow cytometricdetermination of absolute membrane potential of cells. J Pho-tochem Photobiol B 1995, 28:93-99.
27. Garcia M, Galvez A, Garcia-Calvo M, King VF, Vazquez J, Kraczo-rowski GJ: Use of toxins to study potassium channels. J BioenergBiomembr 1991, 23:615-646.
28. Galvez A, Gimenez-Gallego G, Reuben JP, Roy-Contancin L, Feigen-baum P, Kaczorowski GJ, Garcia ML: Purification and characteri-zation of a unique, potent, peptidyl probe for the highconductance calcium-activated potassium channel fromvenom of the scorpion Buthus tamulus. J Biol Chem 1990,265:11083-11090.
29. Defarias FP, Stevens SP, Leonard RJ: Stable expression of humanKv1.3 potassium channels resets the resting membranepotential of cultured mammalian cells. Receptors Channels 1995,3:273-281.
30. Choi JS, Hahn SJ, Rhie DJ, Yoon SH, Jo YH, Kim MS: Mechanism offluoxetine block of cloned voltage-activated potassium chan-nel Kv1.3. J Pharmacol Exp Ther 1999, 291:1-6.
31. Felix JP, Bugianesi RM, Schmalhofer WA, Borris R, Goetz MA,Hensens OD, Bao JM, Kayser F, Parsons WH, Rupprecht K, et al.:Identification and biochemical characterization of a novelnortriterpene inhibitor of the human lymphocyte voltage-gated potassium channel, Kv1.3. Biochemistry 1999,38:4922-4930.
32. Hahn SJ, Wang LY, Kaczmarek LK: Inhibition by nystatin of Kv1.3channels expressed in Chinese hamster ovary cells. Neurop-harmacology 1996, 35:895-901.
33. Deutsch CJ, Holian A, Holian SK, Daniele RP, Wilson DF: Trans-membrane electrical and pH gradients across human eryth-rocytes and human peripheral lymphocytes. J Cell Physiol 1979,99:79-93.
34. Aiyar J: Potassium channels in leukocytes and toxins thatblock them: structure, function and therapeutic implica-tions. Persp Drug Disc Desig 1999, 15/16:257-280.
35. Wulff H, Calabresi PA, Allie R, Yun S, Pennington M, Beeton C,Chandy KG: The voltage-gated Kv1.3 K(+) channel in effectormemory T cells as new target for MS. J Clin Invest 2003,111:1703-1713.
36. Cahalan MD, Wulff H, Chandy KG: Molecular properties andphysiological roles of ion channels in the immune system. JClin Immunol 2001, 21:235-252.
37. Sallusto F, Lenig D, Förster R, Lipp M, Lanzavecchia A: Two subsetsof memory T lymphocytes with distinct homing potentialsand effector functions. Nature 1999, 401:708-712.
38. Beeton C, Barbaria J, Giraud P, Devaux J, Benoliel AM, Gola M, Saba-tier JM, Bernard D, Crest M, Béraud E: Selective blocking of volt-age-gated K+ channels improves experimental autoimmuneencephalomyelitis and inhibits T cell activation. J Immunol2001, 166:936-944.
39. Valverde P, Kawai T, Taubman MA: Selective blockade of voltage-gated potassium channels reduces inflammatory boneresorption in experimental periodontal disease. J Bone MinerRes 2004, 19:155-164.
40. Beeton C, Wulff H, Barbaria J, Clot-Faybesse O, Pennington M, Ber-nard D, Cahalan MD, Chandy KG, Béraud E: Selective blockade ofT lymphocyte K(+) channels ameliorates experimentalautoimmune encephalomyelitis, a model for multiple sclero-sis. Proc Natl Acad Sci USA 2001, 98:13942-13947.
41. Keramidas A, Kuhlmann L, Moorhouse AJ, Barry PH: Measurementof the limiting equivalent conductivities and mobilities of themost prevalent ionic species of EGTA (EGTA2- and EGTA3-) for use in electrophysiological experiments. J Neurosci Meth-ods 1999, 89:41-47.
Page 11 of 11(page number not for citation purposes)