bivariate flow cytometry dna/brdurd analysis of plant cell cycle
TRANSCRIPT
1. Introduction
Cell cycle analysis is of relevance in many areas ofbasic and applied biological research. First studieson DNA replication, cell cycle traverse and cellproliferation have been performed using radioactiveDNA precursors (e.g. 3H-thymidine) [21], but theiruse has many drawbacks including time consuminganalysis and safety problems; therefore, attemptswere made to replace them by other techniques.
Flow cytometry is well suited to obtain distribu-tions of DNA content in large populations of plantcells [3, 11, 13]. Because the nuclear DNA contentreflects the position of a cell within the cell cycle[18], DNA flow cytometry has been used frequentlyfor cell cycle analysis also in plants [4, 28, 32] andmathematical models are then needed for deconvo-lution of DNA content distributions into cell cyclecompartments [6]. Most important, this kind ofanalysis is not suitable for cell kinetic parameterssuch as cycle traverse rates and phase transit timesin asynchronous cell populations [36].
A possibility to detect cells synthesizing DNAspecifically labelled by a thymidine analogue 5-bromo-2-deoxyuridine (BrdUrd) greatly increased thepotential of flow cytometry for cell cycle analysis.So far, three approaches have been developed toquantify the amount of incorporated BrdUrd usingflow cytometry. BrdUrd-Hoechst technique is basedon the observation that incorporated BrdUrdquenches the fluorescence of DNA-specific fluo-rochromes Hoechst 33258 or 33342 bound to DNA[24]. Simultaneous analysis of Hoechst fluorescenceand fluorescence of propidium iodide (or ethidiumbromide) which quantitatively intercalate DNA andwhose fluorescence is not affected by BrdUrd, allowsdiscrimination of cell cycle phases [23, 39]. Thesecond approach involves the staining with twoDNA-specific fluorochromes Hoechst 33342 andmithramycin whose fluorescence is not affected byBrdUrd. The difference between the fluorescenceemitted by mithramycin and Hoechst is used as ameasure of the amount of BrdUrd incorporated [5].
The third and most widely used technique is based
Methods in Cell Science 21: 155–166 (1999). 1999 Kluwer Academic Publishers. Printed in the Netherlands.
Bivariate flow cytometry DNA/BrdUrd analysis of plant cell cycle
Sergio Lucretti1, Luca Nardi1, Paola Trionfetti Nisini1, Filippo Moretti1, Giuliana Gualberti2 & Jaroslav Dole
zel3
1 ENEA, C.R. Casaccia, Department INN, Biotechnology and Agriculture Division, Via Anguillarese 301, C.P.2400, I-00100 Rome, Italy; 2 Department of Genetics and Molecular Biology, University of Rome ‘La Sapienza’, Rome,Italy; 3 De Montfort University Norman Borlaug Centre for Plant Science Research, Inst. Exp. Bot., DepartmentPlant Biotechnology, Olomouc, Czech Republic
Accepted in revised form 29 March 1999
Abstract. We describe a protocol for flow cytometryanalysis of cell cycle in plants using indirectimmunolabelling staining and Vicia faba, Pisumsativum and Zea mays root tip cells as model systems.The protocol is based on simultaneous analysis oftwo fluorescent signals. The first, obtained afterstaining with propidium iodide, is used to quantifynuclear DNA content. The second, obtained afterindirect immunofluorescent staining of bromo-deoxyuridine (BrdUrd), is used to quantify theamount of BrdUrd incorporated into nuclear DNA.In an attempt to standardize the procedure, the effectsof various conditions for partial DNA denaturationusing HCl, as well as of BrdUrd concentration and
Key words: Bromodeoxyuridine, Immunofluorescence, Pisum sativum, Vicia faba, Zea mays
Abbreviations: BrdUrd = 5-bromo-2-deoxyuridine; FITC = fluorescein-5-isothiocyanate; hexylene glycol =2-methyl-2,4-pentanediol; PI = propidium iodide; TRIS = tris(hydroxymethyl)aminomethane
incorporation time on flow cytometry DNA / BrdUrdcontent analysis have been studied. MaximumBrdUrd-linked fluorescence was observed after a30 min pulse with 10
µM BrdUrd and after DNAdenaturation with 1.5 N HCl (final concentration) for30 min at 25 °C. Under these conditions, DNAcontent histograms with relatively small coefficientof variation (< 4%, full peak) could be obtained. Toavoid non-specific staining of cytoplasm and cellwalls, the protocol involves the use of nuclei isolatedfrom formaldehyde-fixed tissues. Fixed isolatednuclei are stable and may be stored in hexyleneglycol 0.75 M at 4 °C for prolonged periods prior toactual staining and analysis.
on the simultaneous immunofluorescent detection ofincorporated BrdUrd using a monoclonal antibody toBrdUrd [17] and DNA content estimation usingpropidium iodide [8] and flow cytometry. Themethod is very sensitive and allows the estimation ofthe frequency of cells in various S-Phases of the cellcycle, estimation of cell cycle traverse rates andphase durations as well as the fraction of activelyproliferating cells [19]. Contrary to its wide use forcell cycle analysis in animal and human cell popu-lations, the method has been used rarely in plants[31].
Here we describe a development of a protocol forflow cytometric analysis of cell cycle in plants usinga monoclonal antibody against BrdUrd. To permitaccess of the monoclonal antibody to incorporatedBrdUrd, DNA must be partially denaturate [40]. Thisprocess has to be carefully performed to obtainsensitive revelation of BrdUrd without alteringquantitative binding of the DNA fluorochrome (e.g.propidium iodide) used at the same time to evaluatedouble-stranded DNA content. Besides, BrdUrdconcentration and labelling time are established toallow for the best discrimination of S-Phase nuclei.In order to avoid non-specific binding of antibodyand to ensure optimal DNA staining, the techniqueinvolves the use of a high yield procedure for nucleiisolation from formaldehyde-fixed tissues [20]. Fixednuclei show to be stable during the immunolabellingprocedure and can be stored for a prolonged periodprior to analysis.
2. Materials
A. Equipment01. Incubator.1
02. Air pump.2
03. Automatic pipet aid.04. Low speed centrifuge, ALC4227R.3
05. Omogenizer Ultra Turrax T25, with gener-ator probe S25N/8G.4
06. Fluorescence microscope with epillumina-tion.5
07. Fluorescence filter blok I2/3.5
08. Pipettors (adjustable volume): 10 µl, 20 µl,and 100 µl.6
09. pH meter.10. Flow cytometer and cell sorter.7
11. Refrigerator (+4 °C).12. Freezer (–20 °C).13. Microscope photograpic equipment.5
B. Glassware and plastics01. 15 ml polystirene centrifuge tubes, cod.
2054.8
02. Pipets: 10 ml, No. 7510.8
03. Air diffuser (e.g. for aquarium).04. Plastic tray (e.g. 22 cm L × 17 cm W × 10
cm H) for seed germination.
05. Plastic tray, internal volume approx. 1000 ml(e.g. 20 cm L × 14 cm W × 8 cm H)including open-work basket to hold germi-nated seeds.
06. Glass petri dishes (diameter 60–90 mm).07. Perlite, approx. 3 litres (inert substrate for
seed germination).08. Chemical glassware (cilinders, beckers, glass
pipets).09. Tweezers.10. Scalpels.11. Nylon filters (51 µm, and 10 µm), squares
4 × 4 cm.12. Ice bucket.13. Syringe filters for sterilization (mesh 0.22
µm).C. Medium and chemicals9
01. BrdUrd, No. B-5002.02. PI, No. P-4170.03. Mouse anti-BrdUrd monoclonal antibody,
No. 347580.7
04. Goat serum, No. G-9023.05. F(ab′)2 goat anti-mouse IgG antibody, No.
F-2653.06. Hexylene glycol, No. M-9671.All chemicals were purchased from SIGMA if notstated otherwise.
3. Procedure
A. Preparation of solutions1. Hoagland's nutrient solution [16]
Hoagland's solution is made of four differentstock solutions which are mixed together justbefore use. Salts in stock solutions are dis-solved indipendently in ddH2O and blendedtogether to reach final volume.– Stock A. Dissolve 9.4 g Ca(NO3)2 · 4H2O,
5.2 g MgSO4·7H2O, 6.6 g KNO3 and 1.2 gNH4H2PO4 in 900 ml ddH2O.
– Stock B. Dissolve 700 mg H3BO3, 850 mgMnSO4 ·H2O, 25 mg CuSO4 ·H2O, 55 mgZnSO4·H2O, 6.75 mg Na2MoO4·H2O in 250ml ddH2O.
– Stock C. Dilute 0.5 ml H2SO4 37% in 100ml ddH2O.
– Stock Fe. Dissolve 3.722 g Na2EDTA·2H2Oand 2.785 g FeSO4·7H2O under continousstirring at 70 °C in 500 ml ddH2O. Prolongheating till the solution gets a gold-yellowcolour.
To prepare 1000 ml Hoagland's Nutrientsolution dissolve 90 ml stock A, 1 ml stockB, 0.1 ml stock C to 800 ml ddH2O. Add 5 mlstock Fe and bring to 1000 ml final volume.Stock solutions can be preserved at 5 °C for amonth.
156
2. TRIS bufferDissolve 605.7 mg TRIS, 1.861 g Na2EDTA,2.922 g NaCl in 500 ml ddH2O. Adjust thefinal pH of the solution to 7.5 using 1N NaOH.
3. TRIS buffer fixativeDissolve 302.85 mg TRIS, 930.6 mgNa2EDTA·2H2O, 1.461 g NaCl, 250 µl TritonX-100 (0.1%) in 200 ml ddH2O. Add 27 or13.5 ml formaldehyde 38% (4% or 2%, respec-tively); add ddH2O up to 250 ml and adjust pHup to 7.5 by NaOH. TRIS fixative solutionmust be prepared just before using.
4. LB01 Lysis Buffer [10]Dissolve 363 mg TRIS, 148.9 mg Na2EDTA,20.2 mg spermine, 1.193g KCl, 233.8 mgNaCl, 200 µl TRITON X-100 in 200 mlddH2O. Adjust the final pH of the solution to7.5 using 1N NaOH.
Filter through a 0.22 µm filter to removesmall particles. Add 220 µl mercaptoethanol(final conc. 15 mM) and mix well. Store at–20 °C in 10 ml aliquots. Before using,clearify the solution by 0.45 µm filtration.
B. Plant materialVicia faba L. cv. ‘Inovec’ (Dr. Ondro, HornaStreda, Slovak Rep.), Pisum sativum L. cv‘Lincoln’ (Ingegnoli, Milan, Italy) and Zea mayshybrid line ‘Plenus’ (DeKalb, Milan, Italy) seedswere imbibed in aerated distilled water at 25 °Cin the dark for 24 h. Seeds were then sown intoperlite moistened by Hoagland's solution andgrown for 48 h [27]. Seedlings with main rootsabout 3 cm long were transferred to containerswith solutions as described below. If not statedotherwise, all incubations were performed at25 °C in the dark, and the solutions were aerated.
C. BrdUrd incorporation To set the optimal incorporation time and BrdUrdconcentration, V. faba roots were incubated fortimes ranging from 5 min to 120 min inHoagland's solution containing BrdUrd at threedifferent concentrations (3, 10, and 30 µM).
In pea (Pisum sativum L.) and corn (Z. mays)root tips were incubated in Hoagland's solutioncontaining 3, 10 and 30 µM BrdUrd for 30 min.
In a pulse-chase experiment, V. faba roots wereincubated in Hoagland's solution containing10 µM BrdUrd for 30 min. Seedlings were thentransferred to Hoagland's solution without BrdUrdand grown for up to 18 h. Samples of 15 rootseach were taken at 0, 1, 3, 5, 7, 9, 11, 14 and 17hours after BrdUrd pulse.
D. Isolation of nuclei– Vicia faba
15 roots were cut 1 cm from the root tip, rinsedin distilled water and fixed for 30 min at 4 °Cin 4% (v/v) formaldehyde made up in TRISbuffer. Then, roots were washed three times(20 min each) in Tris buffer at 5 °C. Meristem
tips (1.5–2.0 mm in length) were homogenizedfor 15 sec at 13500 rpm in 5 ml polystyrenetubes containing 0.5–1 ml LB01 lysis buffer[10]
– P. sativum and Z. maisRoots from pea and corn seedlings were fixedwith 2% and 4% formaldehyde in TRIS buffer,respectively. Root tips omogeneization wascarried on at 9500 rpm with the same proce-dure as already described for V. faba [20].
The suspensions of released nuclei werepassed through a 21 µm pore-size nylon filterto remove large tissue and cellular fragmentsand were diluted up to 2 ml with TRIS buffer.To assess the effectiveness of the isolationprotocol, 10 µl of each sample were stainedwith propidium iodide at final concentration of20 µg ml–1, dropped on a slide and observedusing a fluorescence microscope.
E. Immunofluorescent detection of BrdUrd– Vicia faba
1 ml of V. faba nuclei suspension was addedto 1 ml of 3N HCl in a 15 ml round bottom testtube and incubated for periods ranging from 0to 120 min at 25 °C. The hydrolysis wasstopped by the addition of 12 ml of 0.1 MNa2B4O7 for 10 min.
For indirect immunolabelling, nuclei werethen centrifuged for 10 min at 1500 rpm andincubated for 1 h, at room temperature in thedark, in 500 µl of TRIS buffer containing40 µl of mouse anti-BrdUrd monoclonal and25 µl of goat. After then, the nuclei werepelleted (1000 rpm/10 min) and immediatelyincubated for 1 h in 500 µl of TRIS buffer con-taining 1:100 diluition of FITC-conjugatedF(ab′)2 goat anti-mouse IgG antibody and25 µl of goat serum, at room temperature in thedark. Aliquots of BrdUrd labelled nuclei sus-pensions were incubated with the secondaryantibody only as negative controls for thesetting of non specific fluorescence regions onflow cytometry histograms.
– P. sativum and Z. maisAfter DNA denaturation, nuclei in suspensionwere buffered with 12 ml 0.1 M Na2B4O7 for10 min. Centrifugation was carried on at 1500rpm for 20 min. Pelleted nuclei were resus-pended in TRIS buffer containing anti-BrdUrdmonoclonal antibody and treated as alreadydescribed.
If samples were not to be analysed on thesame day, hexylene glycol was added to a finalconcentration of 0.75 M to prevent nucleiclumping and they were stored at 4 °C.
F. DNA staining and flow cytometry analysisPrior to DNA staining, nuclei were pelleted andresuspended in 2 ml of TRIS buffer containing 25µl of goat serum, syringed once through a 27G
157
needle and filtered with a 21 µm nylon mesh.Afterwards, PI was added to a final concentra-tion of 10 µg/ml to stain nuclear DNA. After 30min staining on ice, the samples were run in aFACStarPLUS flow cytometer equipped with anargon-ion laser tuned on 488 nm and 200 mWoutput at a rate of 100 ÷ 200 counts sec–1. BrdUrd-linked FITC fluorescence was measured with a530 nm band-pass filter using a logarithmicamplifier (4 decades). PI fluorescence wasanalysed with a 620 nm long-pass filter and alinear amplifier. Electronic compensation wasused to reduce crosstalk between the green-yellowemission of fluorescein and the orange-redfluorescence of PI. 2 × 10⁴ nuclei were analysedin each sample and error bars in graphic presen-tations indicate standard deviations from threeexperiments.
The coefficient of variation of G1/G0 nucleipeak fluorescence was calculated with the‘Rectangle Fit’ method from the CellFIT software(Becton Dickinson, USA).
G. Sorting of nucleiSorting gates were set on biparametric dot plotsof relative linear red fluorescence pulse area (PI)versus logarithmic amplified green fluorescencepulse height (FITC). The flow cytometer operatedwith a 100 µm ceramic nozzle vibrating at 30KHz and a sheath pressure of 15 psi. A filtersterilized (0.22 µm) solution made of 80 mM KCl,20 mM NaCl, pH 7.2, was used as sheath fluid.Sorting envelops of 1.5 droplets containinglabelled nuclei were selected; to evaluate sortingpurity 100 nuclei were sorted directly onto micro-scope slides at a rate of 20 sec–1.
H. Fluorescence microscopy and microphotographySorted nuclei on microscope slides were allowedto dry, mounted in 10 µl LB01 buffer containing10 µg ml–1 PI (final concentration). Samples wereanalysed with a filter set suitable for FITC andPI dual analysis (excitation λ = 450–490; dichroicmirror λ = 515 nm; emission filter λ = 530 nmlong pass). Photographs were taken using a Leitz‘Vario Orthomat 2’ automatic microscope camerawith ISO 400 Kodak Ecktachrome film and ISO100 Kodak T-MAX black and white film.
I. Reproducibility and safety precautionsThe methodology outlined in this paper allowslabelling of DNA synthesizing nuclei in three dif-ferent plant species. The procedure was originallydeveloped for V. faba and then adopted for peaand corn with minor adjustments only. In differenttypes of explant, BrdUrd concentration and itsincorporation time have to be carefully deter-mined according to cell cycle duration and cellgrowth fraction (e.g. root meristems, cell suspen-sions). Furthermore, not obvious but importantpoints to pay attention to are: defining optimalconcentration of formaldehyde for a high yield
of nuclei in suspension which is relevant to obtaina final sample with at least 105 ml–1 nuclei forflow cytometric analysis; neutralisation of acidtreatment with Na2B4O7 to block DNA denatura-tion and to allow correct fluorescent emission ofPI and fluorescein; speed and duration of cen-trifugations to avoid clumping and aspecificlabelling. The use of strong acids and/or toxicvolatile compounds like HCl and formaldehyde,requires handling with gloves in a chemical hood;PI is a known mutagen and special care must beused during manipulations avoiding any directcontact and breathing of dust.
4. Results and discussion
One of the most useful techniques for measuring thepercentage of cells in different phases of the cellcycle is to pulse-label the explant with BrdUrd anduse a specific antibody for labelling. The method,based on simultaneous measurements of the nuclearDNA content and the amount of incorporatedBrdUrd, was originally developed using animal cellsas a model system [8] and since then it has been usedto analyse cell cycle kinetics in basic as well asclinical studies [38, 43]. In plants, the use of anti-BrdUrd antibody was reported by Wang et al. [42]and Stroobants et al. [37] for labelling and visualscreening of S-Phase cells. Concomitantly, Levi et al.[25, 26] applied anti-BrdUrd antibody in bivariateDNA/BrdUrd analyses using static cytofluorimetry.This procedure is time consuming and sometimeslabelling of cells is difficult; consequently, most ofthe information about the cell cycle in plants has beenderived directly from the DNA histograms. Onlyrecently, a few authors reported the use of flowcytometry in plants for the analysis of cell cycle inisolated nuclei from root tips [31] and cell suspen-sions [44].
Immunofluorescent detection of BrdUrd requiresdenaturation of DNA because currently availableanti-BrdUrd antibodies bind to BrdUrd in single-stranded DNA [9]. The denaturation may be per-formed either with strong HCl [8], or heating in thepresence of formamide [9], or in low ionic strengthbuffer [1, 30], or using DNA endonucleases [7]. Inour hands, when compared to acid treatment, heatingdenaturation results in a higher sensitivity of theassay, but the cell loss is also significantly higher[1, 9]. Since PI (used to quantitate DNA) intercalatesinto double stranded DNA, nuclear DNA must bedenatured only partially to leave sufficient double-stranded DNA for PI binding. Flow cytometry foundsone of the main limitations in the quality of cellsuspensions to be analysed since large amounts ofdebris and damaged cells can impair the analysis [27,44]. Thus the denaturation step, which is the mostcrucial point in the procedure, is a compromise and
158
must be experimentally determined for a given celltype [30].
In this work, we present an optimized procedurefor bivariate flow cytometric analysis of indirectimmunolabelled nuclei in plants using a monoclonalantibody against BrdUrd.
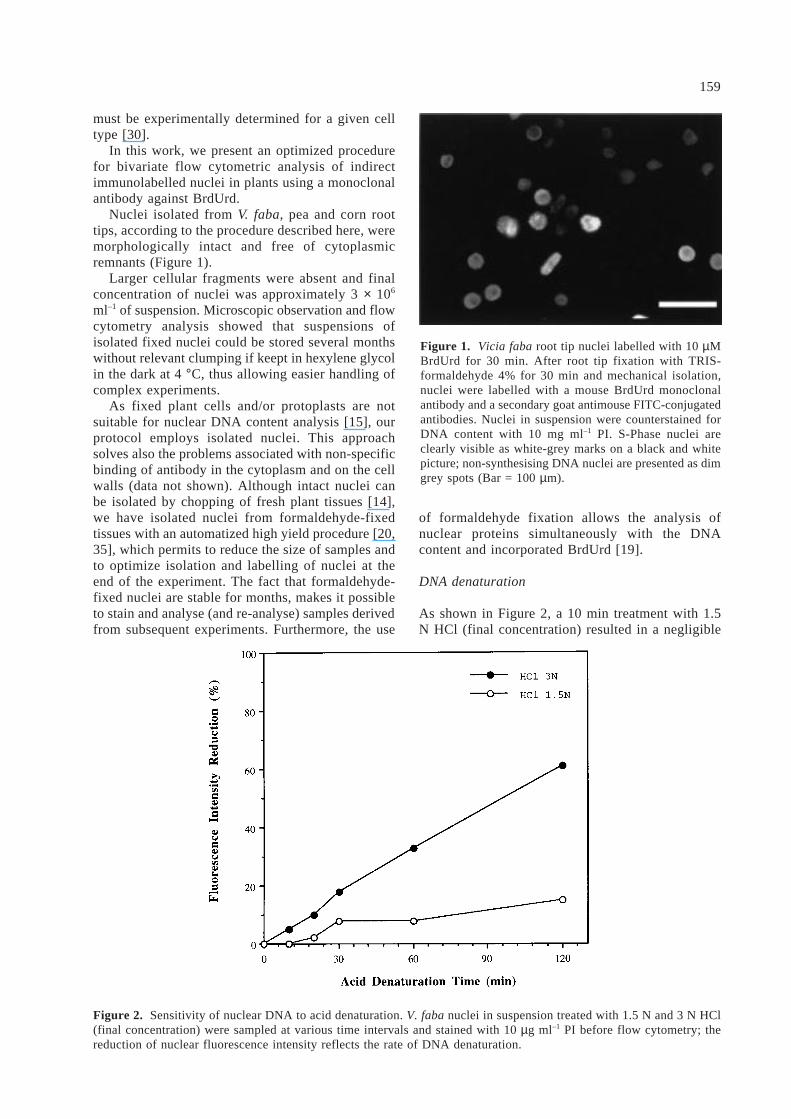
Nuclei isolated from V. faba, pea and corn roottips, according to the procedure described here, weremorphologically intact and free of cytoplasmicremnants (Figure 1).
Larger cellular fragments were absent and finalconcentration of nuclei was approximately 3 × 10⁶
ml–1 of suspension. Microscopic observation and flowcytometry analysis showed that suspensions ofisolated fixed nuclei could be stored several monthswithout relevant clumping if keept in hexylene glycolin the dark at 4 °C, thus allowing easier handling ofcomplex experiments.
As fixed plant cells and/or protoplasts are notsuitable for nuclear DNA content analysis [15], ourprotocol employs isolated nuclei. This approachsolves also the problems associated with non-specificbinding of antibody in the cytoplasm and on the cellwalls (data not shown). Although intact nuclei canbe isolated by chopping of fresh plant tissues [14],we have isolated nuclei from formaldehyde-fixedtissues with an automatized high yield procedure [20,35], which permits to reduce the size of samples andto optimize isolation and labelling of nuclei at theend of the experiment. The fact that formaldehyde-fixed nuclei are stable for months, makes it possibleto stain and analyse (and re-analyse) samples derivedfrom subsequent experiments. Furthermore, the use
of formaldehyde fixation allows the analysis ofnuclear proteins simultaneously with the DNAcontent and incorporated BrdUrd [19].
DNA denaturation
As shown in Figure 2, a 10 min treatment with 1.5N HCl (final concentration) resulted in a negligible
159
Figure 1. Vicia faba root tip nuclei labelled with 10 µMBrdUrd for 30 min. After root tip fixation with TRIS-formaldehyde 4% for 30 min and mechanical isolation,nuclei were labelled with a mouse BrdUrd monoclonalantibody and a secondary goat antimouse FITC-conjugatedantibodies. Nuclei in suspension were counterstained forDNA content with 10 mg ml–1 PI. S-Phase nuclei areclearly visible as white-grey marks on a black and whitepicture; non-synthesising DNA nuclei are presented as dimgrey spots (Bar = 100 µm).
Figure 2. Sensitivity of nuclear DNA to acid denaturation. V. faba nuclei in suspension treated with 1.5 N and 3 N HCl(final concentration) were sampled at various time intervals and stained with 10 µg ml–1 PI before flow cytometry; thereduction of nuclear fluorescence intensity reflects the rate of DNA denaturation.
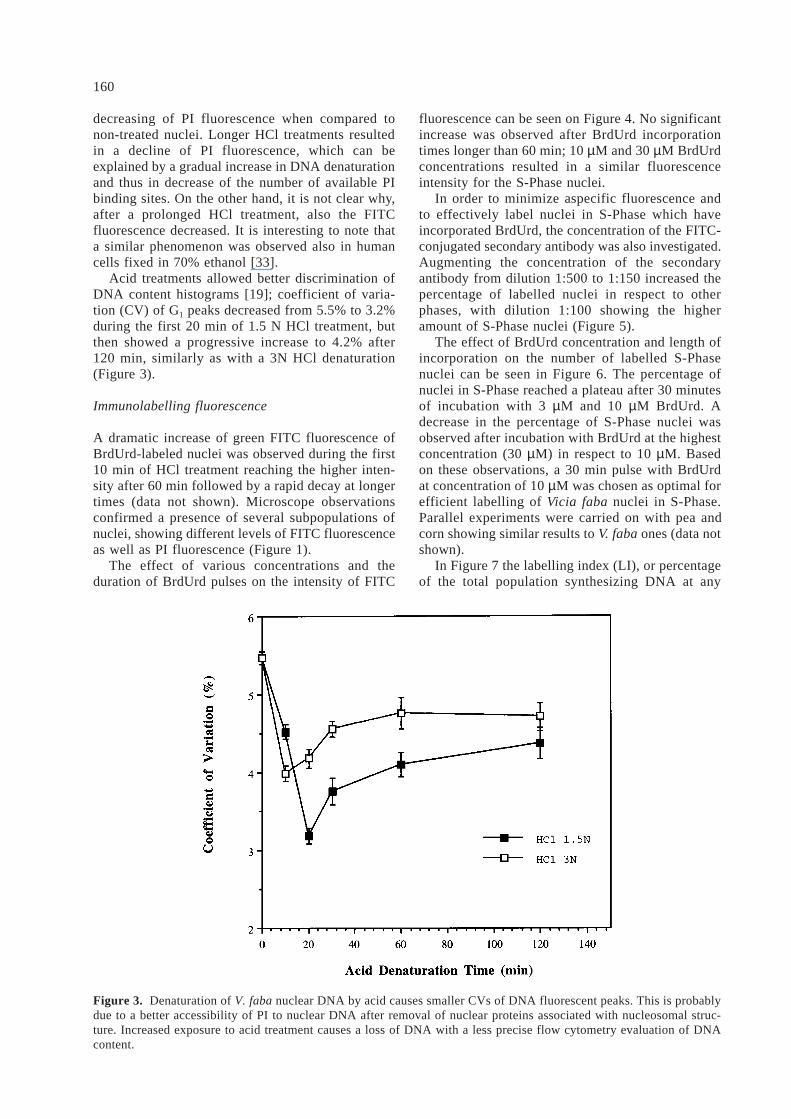
decreasing of PI fluorescence when compared tonon-treated nuclei. Longer HCl treatments resultedin a decline of PI fluorescence, which can beexplained by a gradual increase in DNA denaturationand thus in decrease of the number of available PIbinding sites. On the other hand, it is not clear why,after a prolonged HCl treatment, also the FITCfluorescence decreased. It is interesting to note thata similar phenomenon was observed also in humancells fixed in 70% ethanol [33].
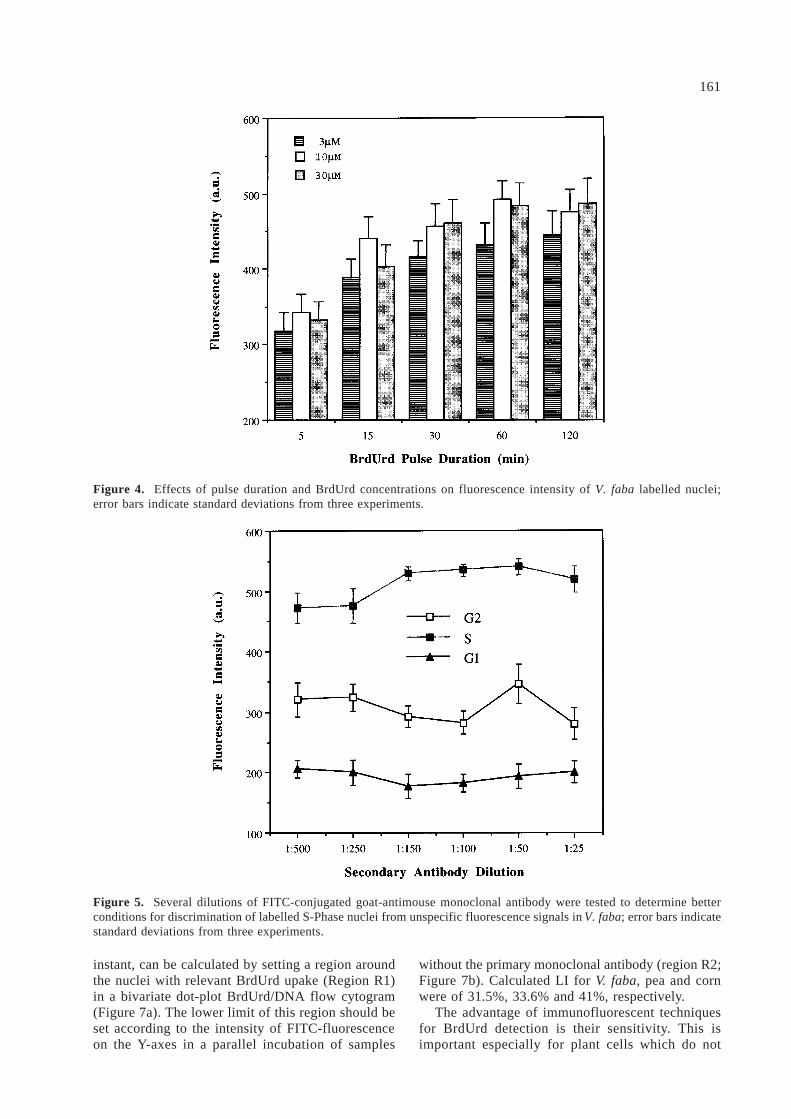
Acid treatments allowed better discrimination ofDNA content histograms [19]; coefficient of varia-tion (CV) of G1 peaks decreased from 5.5% to 3.2%during the first 20 min of 1.5 N HCl treatment, butthen showed a progressive increase to 4.2% after120 min, similarly as with a 3N HCl denaturation(Figure 3).
Immunolabelling fluorescence
A dramatic increase of green FITC fluorescence ofBrdUrd-labeled nuclei was observed during the first10 min of HCl treatment reaching the higher inten-sity after 60 min followed by a rapid decay at longertimes (data not shown). Microscope observationsconfirmed a presence of several subpopulations ofnuclei, showing different levels of FITC fluorescenceas well as PI fluorescence (Figure 1).
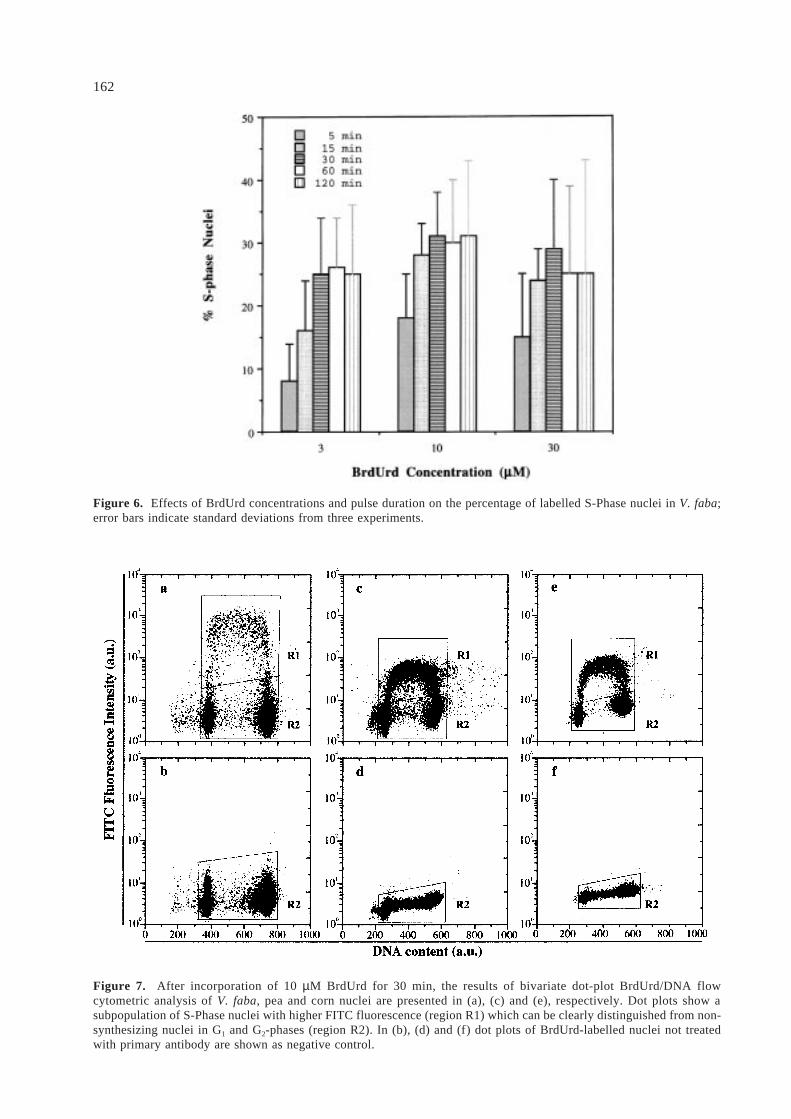
The effect of various concentrations and theduration of BrdUrd pulses on the intensity of FITC
fluorescence can be seen on Figure 4. No significantincrease was observed after BrdUrd incorporationtimes longer than 60 min; 10 µM and 30 µM BrdUrdconcentrations resulted in a similar fluorescenceintensity for the S-Phase nuclei.
In order to minimize aspecific fluorescence andto effectively label nuclei in S-Phase which haveincorporated BrdUrd, the concentration of the FITC-conjugated secondary antibody was also investigated.Augmenting the concentration of the secondaryantibody from dilution 1:500 to 1:150 increased thepercentage of labelled nuclei in respect to otherphases, with dilution 1:100 showing the higheramount of S-Phase nuclei (Figure 5).
The effect of BrdUrd concentration and length ofincorporation on the number of labelled S-Phasenuclei can be seen in Figure 6. The percentage ofnuclei in S-Phase reached a plateau after 30 minutesof incubation with 3 µM and 10 µM BrdUrd. Adecrease in the percentage of S-Phase nuclei wasobserved after incubation with BrdUrd at the highestconcentration (30 µM) in respect to 10 µM. Basedon these observations, a 30 min pulse with BrdUrdat concentration of 10 µM was chosen as optimal forefficient labelling of Vicia faba nuclei in S-Phase.Parallel experiments were carried on with pea andcorn showing similar results to V. faba ones (data notshown).
In Figure 7 the labelling index (LI), or percentageof the total population synthesizing DNA at any
160
Figure 3. Denaturation of V. faba nuclear DNA by acid causes smaller CVs of DNA fluorescent peaks. This is probablydue to a better accessibility of PI to nuclear DNA after removal of nuclear proteins associated with nucleosomal struc-ture. Increased exposure to acid treatment causes a loss of DNA with a less precise flow cytometry evaluation of DNAcontent.
161
Figure 5. Several dilutions of FITC-conjugated goat-antimouse monoclonal antibody were tested to determine betterconditions for discrimination of labelled S-Phase nuclei from unspecific fluorescence signals in V. faba; error bars indicatestandard deviations from three experiments.
Figure 4. Effects of pulse duration and BrdUrd concentrations on fluorescence intensity of V. faba labelled nuclei;error bars indicate standard deviations from three experiments.
instant, can be calculated by setting a region aroundthe nuclei with relevant BrdUrd upake (Region R1)in a bivariate dot-plot BrdUrd/DNA flow cytogram(Figure 7a). The lower limit of this region should beset according to the intensity of FITC-fluorescenceon the Y-axes in a parallel incubation of samples
without the primary monoclonal antibody (region R2;Figure 7b). Calculated LI for V. faba, pea and cornwere of 31.5%, 33.6% and 41%, respectively.
The advantage of immunofluorescent techniquesfor BrdUrd detection is their sensitivity. This isimportant especially for plant cells which do not
162
Figure 6. Effects of BrdUrd concentrations and pulse duration on the percentage of labelled S-Phase nuclei in V. faba;error bars indicate standard deviations from three experiments.
Figure 7. After incorporation of 10 µM BrdUrd for 30 min, the results of bivariate dot-plot BrdUrd/DNA flowcytometric analysis of V. faba, pea and corn nuclei are presented in (a), (c) and (e), respectively. Dot plots show asubpopulation of S-Phase nuclei with higher FITC fluorescence (region R1) which can be clearly distinguished from non-synthesizing nuclei in G1 and G2-phases (region R2). In (b), (d) and (f) dot plots of BrdUrd-labelled nuclei not treatedwith primary antibody are shown as negative control.
readily incorporate BrdUrd into newly synthesizedDNA and can experience toxic effects due to a highBrdUrd concentration. For instance, to detect sisterchromatid exchanges using a fluorescence-plus-Giemsa method, cells must be incubated with BrdUrdat higher concentrations (> 100 µM) in the presenceof 5-fluoro-2-deoxyuridine to inhibit endogenousthymidilate synthesis [12]. Using the protocoldescribed here, it is possible to detect nuclei withDNA replicated in the presence of 10 µM BrdUrdor less. Such sensitivity is fully comparable to thatobtained with animal cells [38] and cell suspensionsof Solanum aviculare [44]. In this respect, it is impor-tant to check carefully the concentration and lengthof BrdUrd treatments and keep both factors as lowas possible, to avoid toxic effects and the rise of anintracellular pool, both of which can affect cell cyclephase traverse rate and labelling index [22].
Cell cycle kinetics
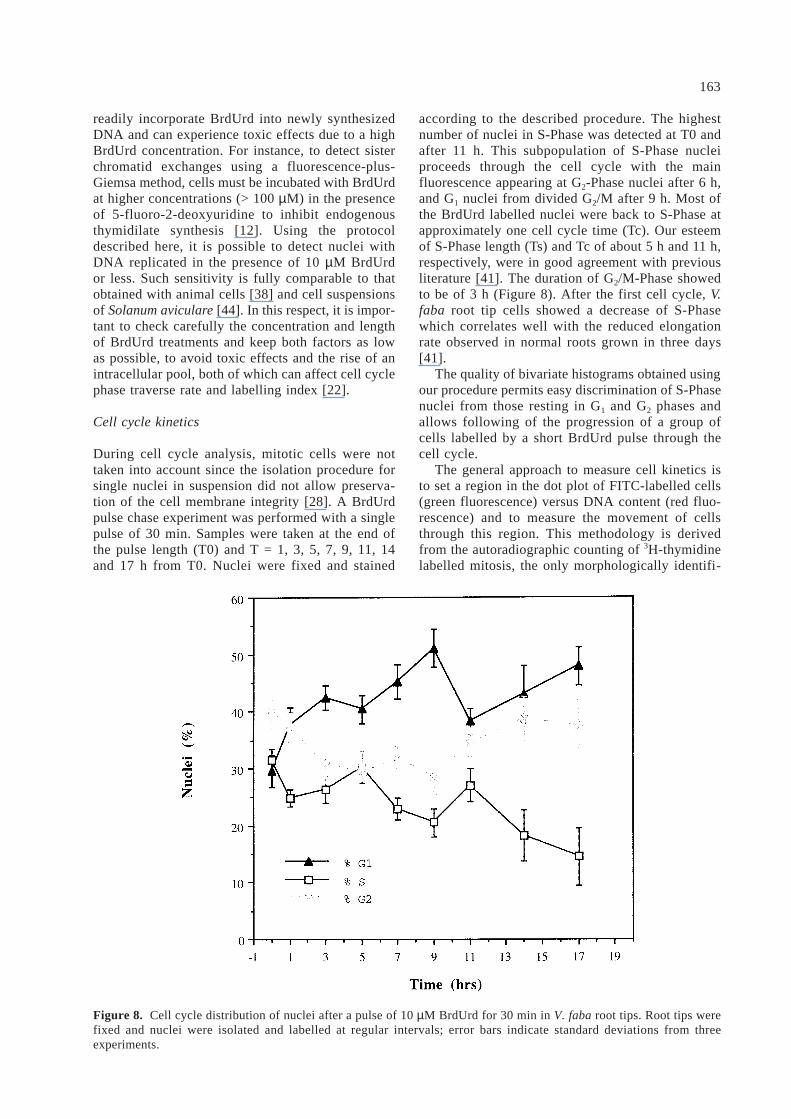
During cell cycle analysis, mitotic cells were nottaken into account since the isolation procedure forsingle nuclei in suspension did not allow preserva-tion of the cell membrane integrity [28]. A BrdUrdpulse chase experiment was performed with a singlepulse of 30 min. Samples were taken at the end ofthe pulse length (T0) and T = 1, 3, 5, 7, 9, 11, 14and 17 h from T0. Nuclei were fixed and stained
according to the described procedure. The highestnumber of nuclei in S-Phase was detected at T0 andafter 11 h. This subpopulation of S-Phase nucleiproceeds through the cell cycle with the mainfluorescence appearing at G2-Phase nuclei after 6 h,and G1 nuclei from divided G2/M after 9 h. Most ofthe BrdUrd labelled nuclei were back to S-Phase atapproximately one cell cycle time (Tc). Our esteemof S-Phase length (Ts) and Tc of about 5 h and 11 h,respectively, were in good agreement with previousliterature [41]. The duration of G2/M-Phase showedto be of 3 h (Figure 8). After the first cell cycle, V.faba root tip cells showed a decrease of S-Phasewhich correlates well with the reduced elongationrate observed in normal roots grown in three days[41].
The quality of bivariate histograms obtained usingour procedure permits easy discrimination of S-Phasenuclei from those resting in G1 and G2 phases andallows following of the progression of a group ofcells labelled by a short BrdUrd pulse through thecell cycle.
The general approach to measure cell kinetics isto set a region in the dot plot of FITC-labelled cells(green fluorescence) versus DNA content (red fluo-rescence) and to measure the movement of cellsthrough this region. This methodology is derivedfrom the autoradiographic counting of 3H-thymidinelabelled mitosis, the only morphologically identifi-
163
Figure 8. Cell cycle distribution of nuclei after a pulse of 10 µM BrdUrd for 30 min in V. faba root tips. Root tips werefixed and nuclei were isolated and labelled at regular intervals; error bars indicate standard deviations from threeexperiments.
able phase by which it is possible to measure themovement of cells initially in DNA synthesis [41].
Usually, the middle area of the S-Phase (mid-S)is selected for the measurement; the mean greenfluorescence in mid-S should stay at his maximumvalue for a period equal to half of the S-Phaseduration, Ts, then fall and remain low for a periodequal to the cell cycle time, Tc, without Ts, then riseagain. The cell cycle time can be obtained from themean value of the second peak. In an unperturbedpopulation, the time when the first labelled cellsappears in G1 will also give an estimate of theduration of TG2/M [29]. Using this method, labellingindexes were determined for V. faba, pea and corn.Cell cycle kinetic measurements were done for V.faba and different phases of cell cycle were deter-mined, confirming the data already available ofautoradiography. In studies of mixed populations ofproliferating normal and malignant cells in vivo andin suspensions [22, 44], a number of differentformulae have been developed to calculate LI andTs and potential doubling time, that is the prolifera-tive capability of a given cell population in absenceof cell loss.
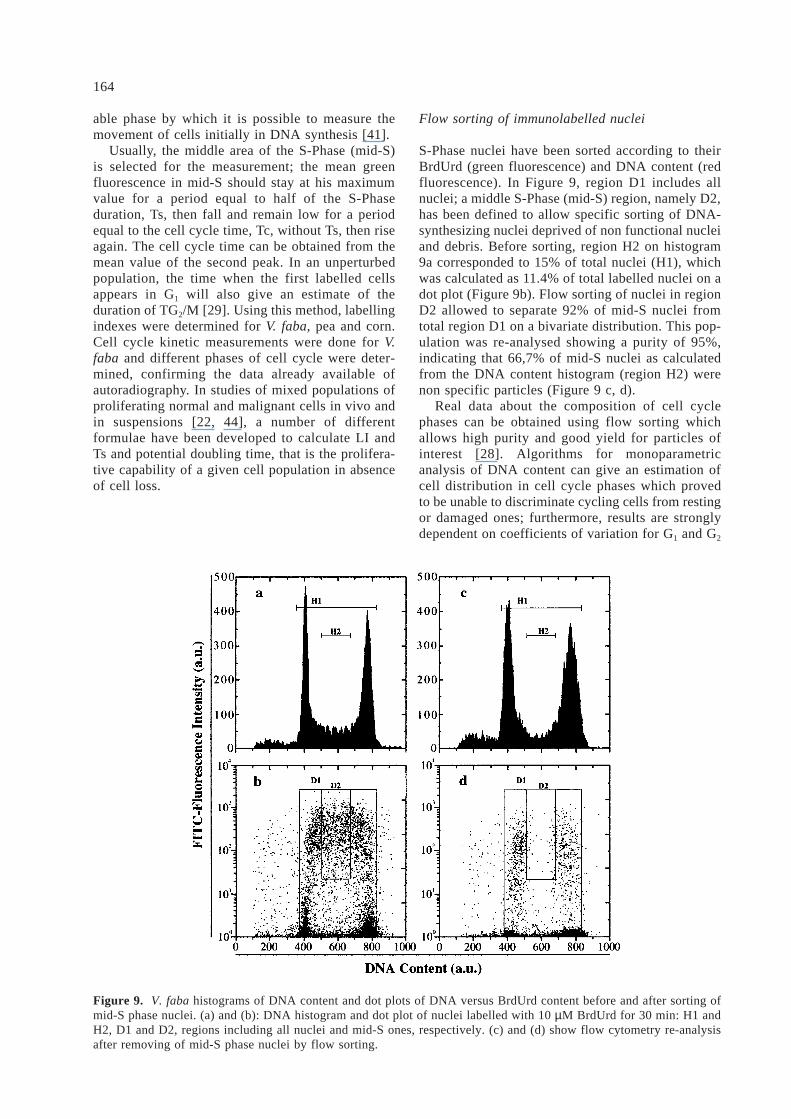
Flow sorting of immunolabelled nuclei
S-Phase nuclei have been sorted according to theirBrdUrd (green fluorescence) and DNA content (redfluorescence). In Figure 9, region D1 includes allnuclei; a middle S-Phase (mid-S) region, namely D2,has been defined to allow specific sorting of DNA-synthesizing nuclei deprived of non functional nucleiand debris. Before sorting, region H2 on histogram9a corresponded to 15% of total nuclei (H1), whichwas calculated as 11.4% of total labelled nuclei on adot plot (Figure 9b). Flow sorting of nuclei in regionD2 allowed to separate 92% of mid-S nuclei fromtotal region D1 on a bivariate distribution. This pop-ulation was re-analysed showing a purity of 95%,indicating that 66,7% of mid-S nuclei as calculatedfrom the DNA content histogram (region H2) werenon specific particles (Figure 9 c, d).
Real data about the composition of cell cyclephases can be obtained using flow sorting whichallows high purity and good yield for particles ofinterest [28]. Algorithms for monoparametricanalysis of DNA content can give an estimation ofcell distribution in cell cycle phases which provedto be unable to discriminate cycling cells from restingor damaged ones; furthermore, results are stronglydependent on coefficients of variation for G1 and G2
164
Figure 9. V. faba histograms of DNA content and dot plots of DNA versus BrdUrd content before and after sorting ofmid-S phase nuclei. (a) and (b): DNA histogram and dot plot of nuclei labelled with 10 µM BrdUrd for 30 min: H1 andH2, D1 and D2, regions including all nuclei and mid-S ones, respectively. (c) and (d) show flow cytometry re-analysisafter removing of mid-S phase nuclei by flow sorting.
distributions [19]. Combining flow cytometryanalysis and sorting with immunolabelling of BrdUrdincorporated cells can overcome such limitations andit opens new possibilities in plants, not only for rapidand convenient analysis of cell cycle but also in otherstudies including the detection of DNA repair syn-thesis and specific effects of chemicals on cellproliferation [2, 34, 39].
Acknowledgments
Part of this work was financed by Research ContractNo. 95.0150.CT14 from the Italian National Councilof Research – CNR.
Notes on suppliers
01. New Brunswick Scientific Co, NJ, USA02. Millipore, Bedford, MA, USA03. ALC, Milan, Italy04. Janke & Kunkel GmbH, Staufen, Germany05. Leica Microsystem S.p.A., Milan, Italy06. Eppendorf Netheler, Hamburg, Germany07. Becton Dickinson Immunocytometry, San Jose CA,
USA08. Falcon, Becton Dickinson Italia, Milan, Italy09. SIGMA-Aldrich S.r.l., Milan, Italy
References
01. Beisker W, Dolbeare F, Gray JW (1987). An improvedimmunocytochemical procedure for high-sensitivitydetection of incorporated bromodeoxyuridine.Cytometry 8: 235–239.
02. Beisker W, Hittelman WN (1988). Measurement ofthe kinetics of DNA repair synthesis after uv irradia-tion using immunochemical staining of incorporated5-bromo-2′-deoxyuridine and flow cytometry. ExpCell Res 174: 156–167.
03. Brown SC, Bergounioux C, Tallet S, Marie D (1991).Flow cytometry of nuclei for ploidy and cell cycleanalysis. In: Negrutiu I, Gharti-Chhetri G. (eds), Alaboratory guide for cellular and molecular plantbiology, pp 326–345. Basel: Birhauser.
04. Conia J, Alexander RG, Wilder ME, Richards KR,Rice ME, Jackson PJ (1990). Reversible accumulationof plant suspension cell cultures in G1 phase andsubsequent synchronous traverse of the cell cycle.Plant Physiol 94: 1568–1574.
05. Crissman HA, Steinkamp JA (1987). A new methodfor rapid and sensitive detection of bromodeoxyuri-dine in DNA replicating cells. Exp Cell Res 173:256–261.
06. Dean P (1986). Data analysis in cell kinetics research.In: Gray J, Darzynkiewicz Z (eds), Techniques in cellcycle analysis, pp 207–254. Clifton, NJ: HumanaPress.
07. Dolbeare F, Gray JW (1988). Use of restrictionendonucleases and exonuclease III to expose halo-
genated pyrimidines for immunochemical staining.Cytometry 9: 631–635.
08. Dolbeare F, Gratzner H, Pallavicini MG, Gray JW(1983). Flow cytometric measurement of total DNAcontent and incorporated bromodeoxyuridine. ProcNatl Acad Sci USA 80: 5573–5577.
09. Dolbeare F, Beisker W, Pallavicini MG, VanderlaanM, Gray JW (1985). Cytochemistry for bromo-deoxyuridine/DNA analysis: Stoichiometry and sen-sitivity. Cytometry 6: 521–530.
10. Dolezel J, Binarova P, Lucretti S (1989). Analysis ofnuclear DNA content in plant cells by flow cytometry.Biol Plant 31: 113–120.
11. Dolezel J (1991). Flow cytometric analysis of nuclearDNA content in higher plants. Phytochem Analysis 2:143–154.
12. Dolezel J, Novák FJ (1986). Sister chromatidexchanges in garlic (Allium sativum L.) callus cells.Plant Cell Reports 5: 280–283.
13. Dolezel J, Greilhuber J, Lucretti S, Meister A, LysákMA, Nardi L, Obermayer R (1998). Plant genome sizeestimation by flow cytometry: Inter-laboratory com-parison. Annals of Botany 82 (suppl A): 17–26.
14. Galbraith DW, Harkins KR, Maddox JM, Ayres NM,Sharma DP, Firoozabady E (1983). Rapid flow cyto-metric analysis of the cell cycle in intact plant tissues.Science 220: 1049–1051.
15. Galbraith DW (1990). Flow cytometric analysis ofplant genomes. In: Darzynkiewicz Z, Crissman HA(eds), Methods in cell biology, vol 33, Flow cyto-metry, pp 549–562. San Diego: Academic Press Inc.
16. Gamborg OL, Wetter LR (eds) (1975). Plant tissueculture methods. Saskatoon: N.R.C. of Canada.
17. Gratzner HG (1982). Monoclonal antibody to 5-bromo- and 5-iododeoxyuridine: A new reagent fordetection of DNA replication. Science 218: 474–475.
18. Gray JW, Dolberare F, Pallavicini MG, Beisker W,Waldman F (1986). Cell cycle analysis using flowcytometry. Int J Radiat Biol 49: 237–253.
19. Gray JW, Dolberare F, Pallavicini MG (1990).Quantitative cell cycle analysis. In: Darzynkiewicz Z,Crissman HA (eds), Flow cytometry and sorting, pp445–467, Second Edition. New York, Wiley-Liss, Inc.
20. Gualberti G, Dolezel J, Macas J, Lucretti S (1996).Preparation of pea (Pisum sativum L.) chromosomesand nuclei in suspension from single root tip. TheorAppl Gen 92(6): 744–751.
21. Howard A, Pelc SR (1953). Synthesis of deoxyri-bonucleic acid in normal and irradiated cells and itsrelation to chromosome breakage. Heredity 6 (Suppl.):261–273.
22. Johansson MC, Johansson R, Baldetorp B, OredssonSM (1998). Comparison of different labelling indexformulae used on bromodeoxyuridine-flow cytometrydata. Cytometry 32: 233–240.
23. Kubbies M (1992). High-resolution cell cycleanalysis: The flow cytometric bromodeoxyuridine-Hoechst quenching technique. In: Radbruch A (ed),Flow cytometry and sorting, pp 75–85. Berlin:Springer-Verlag.
24. Latt SA (1973). Microfluorometric detection ofdeoxyribonucleic acid replication in human metaphasechromosomes. Proc Natl Acad Sci USA 70: 3395–3399.
165
25. Levi M, Sparvoli E, Sgorbati S, Chiatante D (1987).Rapid immunofluorescent determination of cells in theS-phase in pea root meristems: An alternative toautoradiography. Physiol Plant 71: 68–72.
26. Levi M, Sparvoli E, Sgorbati S, Chiatante D (1990).Biotin-streptavidin immunofluorescent detection ofDNA replication in root meristems through BrdUrdincorporation: Cytological and microfluorimetricapplications. Physiol Plant 79: 231–235.
27. Lucretti S, Dolezel J, Schubert I, Fuchs J (1993). Flowkaryotyping and sorting of Vicia faba chromosomes.Theor Appl Genet 85: 665–672.
28. Lucretti S, Dolezel J (1995). Cell cycle synchroniza-tion, chromosome isolation and flow sorting in plants.In: Galbraith DW, Bohnert H, Bouque DP (eds),Methods in cell biology, vol 50, pp 58–81. Orlando,FL: Plant Cell Biology Academic Press Inc.
29. McNally NJ, Wilson GD (1990). Measurements oftumor cell kinetics by the bromodeoxyuridine method.In: Ormerod MG (ed), Flow cytometry: A practicalapproach, pp 87–104. Oxford, UK: Oxford UniversityPress.
30. Moran R, Darzynkiewicz Z, Staiano-Coico L,Melamed MR (1985). Detection of 5-bromodeoxyuri-dine (BrdUrd) incorporation by monoclonal anti-bodies: Role of the DNA denaturation step. JHistochem Cytochem 33: 821–827.
31. Moretti F, Lucretti S, Dolezel J (1992). Plant cellcycle analysis on isolated nuclei using a monoclonalantibody against Brd Urd. Eur J Histochem 36: 367.
32. Pfosser M (1989). Improved method for criticalcomparaison of cell cycle data of asynchronouslydividing and synchronized cell cultures of Nicotianatabacum. J Plant Physiol 134: 741–745.
33. Sasaki K, Adachi S, Yamamoto T, Murakami T,Tanaka K, Takahashi M (1988). Effects of denatura-tion with HCl on the immunological staining ofbromodeoxyuridine incorporated into DNA.Cytometry 9: 93–96.
34. Seldon JR, Dolbeare F, Clair JH, Nichols WW, MillerJE, Kleemeyer KM, Hyland RJ, DeLuca JG (1993).Statistical confirmation that immunofluorescentdetection of DNA repair in human fibroblasts bymeasurement of bromodeoxyuridine incorporation isstoichiometric and sensitive. Cytometry 14: 154–167.
35. Sgorbati S, Levi M, Sparvoli E, Trezzi F, Lucchini G(1986). Cytometry and flow cytometry of 4′,6-diamidino-2-phenylindole (DAPI)-stained suspensions
of nuclei released from fresh and fixed tissues ofplants. Physiol Plant 68: 471–476.
36. Sgorbati S, Sparvoli E, Levi M, Galli M, Citterio S,Chiatante D (1991). Cell cycle kinetic analysis withflow cytometry in pea root meristem synchronizedwith aphidicolin. Physiol Plant 81: 507–512.
37. Stroobants C, Sossountzov L, Miginiac E (1990).DNA synthesis in excised tobacco leaves afterbromodeoxyuridine incorporation: Immunohisto-chemical detection in semi-thin Spurr sections. JHistochem Cytochem 38: 641–647.
38. Ten Velde GPM, Schutte B, Reijnders MMJ, BosmanFT, Blijham GH (1989). Cytokinetic analysis of lungcancer by bromodeoxyuridine labeling of cytologyspecimens. Cytometry 10: 807–810.
39. Tréin C, Planchais S, Glab N, Perennes C, Tregear J,Bergonioux C (1998). Cell cycle regulation by plantgrowth regulators: Involvement of auxin and cyto-chinin in the re-entry of Petunia protoplasts into thecell cycle. Planta 206: 215–224.
40. Vanderlaan M, Thomas CB (1985). Characterizationof monoclonal antibodies to bromodeoxyuridine.Cytometry 6: 501–505.
41. Van’t Hof J (1974). The duration of chromosomalDNA synthesis, of the mitotic cycle, and of meiosisof higher plants. In: King RC (ed), Handbook ofgenetics, vol II, pp 363–377. New York, PlenumPress.
42. Wang H, Cutler AJ, Salem M, Fowke LC (1989).Immunocytochemical detection of DNA synthesis inplant cells. J Plant Physiol 135: 15–20.
43. White RA, Fallon JF, Savage MP (1992). On themeasurement of cytokinetics by continuous labelingwith bromodeoxyuridine with applications to chickwing buds. Cytometry 13: 553–556.
44. Yanpaisan W, King NJC, Doran PM (1998). Analysisof cell cycle activity and population dynamics inheterogeneous plant cell suspensions using flowcytometry. Biotech Bioeng 58: 515–528.
Address for correspondence: Dr. Sergio Lucretti, c/oENEA Casaccia Research Centre, Department INN,Biotechnology and Agriculture Division, Via Anguillarese301, 00060 S.M. di Galeria (Rome), ItalyPhone: +39/06-30483191; Fax: +39/06-30484808E-mail: [email protected]
166