robust estimation of bivariate copulas
TRANSCRIPT

Report
Reference
Robust Estimation of Bivariate Copulas
GUERRIER, Stéphane, ORSO, Samuel, VICTORIA-FESER, Maria-Pia
Abstract
Copula functions are very convenient for modelling multivariate observations. Popular es-
timation methods are the two-stage maximum likelihood and an alternative semi-parametric
with empirical cumulative distribution functions (cdf) for the margins. Unfortunately, they can
be hastily biased whenever relatively small model deviations occur at the marginal (empirical
or parametric) and/or copula levels. In this paper we propose three robust estimators that do
not share this undesirable feature. Since heavy skewed and heavy tailed parametric
marginals are often considered in applications, we also propose a bounded-bias robust
estimator that is corrected for consistency by means of indirect inference. In a simulation
study we show that the robust estimators outperform the popular approaches.
GUERRIER, Stéphane, ORSO, Samuel, VICTORIA-FESER, Maria-Pia. Robust Estimation of
Bivariate Copulas. 2013
Available at:
http://archive-ouverte.unige.ch/unige:30307
Disclaimer: layout of this document may differ from the published version.
[ Downloaded 22/06/2016 at 23:39:22 ]
1 / 1

Working paper
Robust Estimation of Bivariate Copulas
September 30, 2013
Stephane Guerrier†, Samuel Orso† & Maria-Pia Victoria-Feser†
†Research Center for Statistics & HEC GeneveUniversity of Geneva, Geneva, Switzerland

Abstract
Copula functions are very convenient for modelling multivariate observations. Popular es-timation methods are the two-stage maximum likelihood and an alternative semi-parametricwith empirical cumulative distribution functions (cdf) for the margins. Unfortunately, theycan be hastily biased whenever relatively small model deviations occur at the marginal (em-pirical or parametric) and/or copula levels. In this paper we propose three robust estimatorsthat do not share this undesirable feature. Since heavy skewed and heavy tailed paramet-ric marginals are often considered in applications, we also propose a bounded-bias robustestimator that is corrected for consistency by means of indirect inference. In a simulationstudy we show that the robust estimators outperform the popular approaches.
Keywords. M-estimators; Indirect Inference; Income distribution; semi-parametric estima-tion; Gumbel copula.
2

1 Introduction
Multivariate data modeling with copulas has gained in popularity for a wide range of applicationsand is nowadays an essential method in many fields such as finance, actuarial science, economics,biostatistics and hydrology. It offers a more general framework for the modeling of the dependencestructure among variables than the usual linear dependence modeled by multivariate ellipticaldistributions, the multivariate normal being one of the most well known. Even in the situationwhere no multivariate distribution is known copulas allow to construct models for dependentvariables. It starts from the univariate marginal distribution of each of the variables, of whichone has usually a better knowledge, and then copulas enable then to link the marginal univariatedistributions in an easy and elegant manner. This process leads, among others, to more generalversions of dependence structures than the classical linear correlation.
Broadly speaking a copula is any function respecting fundamental conditions for multivariateprobability distribution. Those conditions can be summarized as follows
Definition 1 (Copula) A 2-dimensional copula C(u1, u2) is a mapping function C : [0, 1]2 7→[0, 1].
The next properties are sufficient and necessary conditions for a bivariate cumulative distributionfunction (cdf)
1. C is 2-increasing, i.e. for all (a1, a2), (b1, b2) ∈ [0, 1]2 and a1 ≤ b1, a2 ≤ b2 we have(rectangle inequality) C(b1, b2) − C(a1, b2) − C(b1, a2) + C(a1, a2) ≥ 0. It ensures thatP (a1 ≤ u1 ≤ b1, a2 ≤ u2 ≤ b2) is non-negative.
2. C is grounded, i.e. C(u1, 0) = 0 = C(0, u2)
3. C(1, u2) = u2 and C(u1, 1) = u1
But the main feature arises from Sklar’s Theorem Sklar (1959) who demonstrates that arbitrarymarginal distributions can be joined together by means of a function, a copula, to produce aproper multivariate distribution function. Thus, copula offers a flexible way of modeling multi-variate data. We present the theorem for bivariate distributions.
Theorem 1 (Sklar’s Theorem.) Let F be a joint cumulative distribution with univariate mar-gins F1 and F2.Then there exists a copula C such that for all x1, x2 in R
F (x1, x2) = C(F1(x1), F2(x2)) (1)
If the margins are continuous, then C is unique; otherwise C is uniquely determined on RanF1×RanF2, the multiplicative ranges of the marginal distributions. Conversely, if C is a copula andthe margins are distribution functions, then the function F defined by (1) is a joint distributionfunction with margins F1, F2.
In equation (1) the bivariate cdf is expressed in term of a copula. It can be presented inverselyby
C(u1, u2) = F(F
(−1)1 (u1), F
(−1)2 (u2)
)(2)
3

where F(−1)j is the quasi-inverse function of Fj : F
(−1)j (uj) = supx|Fj(x) ≤ uj, j = 1, 2. Note
that if Fj is strictly increasing we obtain the ordinary inverse F−1j .
The converse of Sklar’s theorem provides a useful representation of a multivariate functionwith arbitrary copula and arbitrary margins. One can then construct a very large number ofmultivariate function choosing the univariate margins and the copula function, such a functionis called a meta distribution. Few examples are given in the simulation study.
General references are Joe (1997) and Nelsen (2006). A good review with application infinance and insurance is McNeil et al. (2005, chap. 5, 7). Moreover Cherubini et al. (2004) is adedicated monograph to copula in finance. In Genest and Favre (2007) the authors summarizein one article the main features on the subject. To be more complete we should also mention theprolific literature on copula’s applications in hydrology1.
A crucial step when modeling multivariate data with copulas is the estimation of the model’sparameters. Several estimation methods for copulas have been developed, including the methodsof concordance (Oakes 1982), fully maximum likelihood, two-stage semi-parametric (SP) estima-tion or pseudo maximum likelihood (Genest et al. 1995; Shih and Louis 1995), which uses theempirical cumulative distribution function for the margins in the fully maximum likelihood, an-other with minimum distance estimating function (Tsukahara 2005) and a two-stage maximumlikelihood, or inference function for margins (IFM) (Joe 1997, 2005). Yet one supposes that themarginal (parametric) distributions and/or the copula are the exact data generating distributionwhich, of course, on the one hand it might be difficult to justify, but on the other hand it mightbe wrong since in practice one tends to choose distributions because they are easy to understandand to handle. When the data shows small deviations from those assumptions, e.g. like in theform of spurious observations that have extreme values relative to the bulk of data and/or rela-tive to the postulated model, the classical (two-stage and fully maximum likelihood) estimatorscan be dramatically affected. This can also happen in the non parametric setting (empiricaldistributions for the marginals) as shown in Cowell and Victoria-Feser (2002, 2006, 2007, 2008)in the context of stochastic dominance.
In this paper, we develop robust estimators for the estimation of multivariate distributionsusing copulas. We focus on the bivariate case, but our results can easily be translated in themore general multivariate setting. The concept of robustness in fitting copula has been usedby some authors for the SP estimator, in the sense that it is robust against misspecificationof the marginal distributions (since they consider the empirical distribution) (see e.g. Kimet al. 2007). Here we deal with the situation when relatively small model deviations occur bothat the marginal (empirical or parametric) level and/or at the copula level. Robust methodsare built to limit the influence on the estimates due to (small) model’s deviations, so that theestimate represent information provided by the bulk of the data. A first attempt was made inMendes et al. (2007), who rely on multivariate outlier detection based on the Gaussian model.Denecke and Muller (2011) propose a parametric robust estimation method based on likelihooddepth (see also Rousseeuw and Hubert 1999) and Kim and Lee (2013) use a SP approach with aminimum density power divergence estimator for the copula’s parameter estimator which showssome resistance to some types of outliers. Nevertheless, we propose here an alternative approach,based on the IFM, and show, by means of the Influence Fuction (IF ) of Hampel (1968, 1974)that this is the appropriate approach to use to bound the influence of outlying observations. We
1On the website of the International Commission on Statistical Hydrology http://www.stahy.org/Activities/
STAHYReferences/ReferencesonCopulaFunctiontopic/tabid/78/Default.aspx (last consulted the 03/30/2013),applicative articles in hydrology are referred showing a booming interest on copulas during the last decade.
4

rely on a well-established literature on parametric robust statistics Hampel et al. (1986), Huberand Ronchetti (2009), Maronna et al. (2006) and Heritier et al. (2009).
In the second section we develop the influence function (IF) for the classical estimators of theparameters of bivariate joint distributions. The aim is to identify the potential source of bias forthe classical estimators. We then propose a robust version for the two-stage estimators. In thethird section we compare the performance of the different estimators by means of a simulationstudy. The design of the simulation includes the situation of clean data and a variety of datacontaminated patterns.
2 Fitting bivariate copula
In the first part of this section we briefly present two popular estimation procedures for copulas,namely the IFM and the SP and in a second part we also propose a class of M -estimators for thetwo-stage estimation procedure and a computational strategy to compute it. In the third partwe develop and compute the IF for bivariate copula in order to analyze potential sources of biasand choose a robust estimator in the class of M -estimators.
2.1 Two-stage classical estimator
Two-stage estimation procedures appeared naturally for fitting multivariate data to copulas.Indeed it simplifies the estimation into two separated parts: one estimates first the parametersof marginal distributions and secondly the dependence copula parameter conditionally on thefirst stage. Since estimating copula dependence parameter requires only the cdf from marginaldistributions, one can choose a non-parametric estimator at the first stage (see also Charpentieret al. 2007). In this paper we consider the ML for the the second stage, which supposes thata copula density c = ∂C(u1, u2)/∂u1∂u2 exists, so that the two estimators, SP and IFM, aredefined as follows.
Definition 2 (IFM for bivariate copula) Let Cθ,β1,β2 (Fβ1(x1), Fβ2(x2)) be a parametric cop-ula with dependence parameter θ ∈ Θ ⊆ R, and Fβj margins with set of parameter βj ∈ Γj ⊆ Rpj ,j = 1, 2, and let xji, j = 1, 2, i = 1, . . . , n, be a sample of n realizations of the bivariate copuladistribution, if the copula density exists, the two-stage maximum likelihood is
(1) βMLj = arg max
βj∈Γj
n∑i=1
log(fβj (xji)
), j = 1, 2
(2) θIFM = arg maxθ∈Θ
n∑i=1
logcθ,β1,β2
(Fβ1(x1i; β
ML1 ), Fβ2(x2i; β
ML2 )
)
ML stands for maximum likelihood and IFM for the two-stage maximum likelihood estimator.The only role played by the estimates from the first stage is to compute the parametric cdf forthe second stage. However, the copula is indexed by the parameters θ, β1 and β2 because italso depends on the parameters of the marginal distribution. If one is only interested in thedependence parameter, one can alternatively use non-parametric methods to obtain a cdf.
5

The SP approach with empirical cdf at the first stage is as follows.
Definition 3 (SP rank-based estimation for bivariate copula) Let Cθ (F1(x1), F2(x2)) bea parametric copula with dependence parameter θ ∈ Θ ⊆ R, and let xji, j = 1, 2, i = 1, . . . , n,be a sample of n realizations of the bivariate copula distribution, if the copula density exists, theSP rank-based estimation is
(1) Fj(x) =1
n+ 1
n∑i=1
1xji≤x, j = 1, 2
(2) θSP = arg maxθ∈Θ
n∑i=1
logcθ
(F1(x1i), F2(x2i)
)
where 1 is the indicator function. The denominator n+1 of the empirical cdf avoids the copula’sdensity to be evaluated at the boundary, which might be problematic (McNeil et al. 2005, chap.5,p.233). The last procedure is computationally faster for a relatively small loss in efficiency.
Instead of empirical cdf one may use smoothed version of non-parametric estimators such askernel estimators as in Fermanian and Scaillet (2003) in the dependent case. Splines and waveletsrelated techniques have also been examined in Chen et al. (2006) and Genest et al. (2009) forinstance. In this paper we will restrict ourselves to the rank-based estimator for the semi-parametric part. Even if more sophisticated non-parametric methods as smoothed estimatorsoffer certainly a gain in efficiency, and even some robustness (see Kozek 2003), we adopt here aparametric approach to deal with model deviation.
2.2 Two-stage robust estimator
To define a robust estimator, one first has to specify a class in which an estimator is chosen thathas robustness properties. As in Zhelonkin et al. (2012), we also propose a two-stage procedurewith (possibly different) M -estimators (Huber 1964) based on ψ-functions at each stage. As willbe demonstrated in the next section, to obtain a robust estimator for the copula’s parameter,one need to choose bounded ψ-functions at each stage in the IFM case (see also Zhelonkin et al.2012). For the SP approach, we don’t propose here an alternative, but study the finite sampleproperties of a SP with a robust M -estimator at the second stage in the simulation exercise.
For the two-sate parametric procedure, an M -estimators is defined as follows.
Definition 4 (M-estimator for bivariate parametric copula) Let Cθ,β1,β2 (Fβ1(x1), Fβ2(x2))be a parametric copula with dependence parameter θ ∈ Θ ⊆ R, and Fβj margins with set of pa-rameter βj ∈ Γj ⊆ Rpj , j = 1, 2, and let xji, j = 1, 2, i = 1, . . . , n, be a sample of n realizationsof the bivariate copula distribution, if the copula density exists the two-stage M -estimator is
(1) βψ1j
j = arg maxβj∈Γj
n∑i=1
ψ1j (xji;βj , k1j) , j = 1, 2
(2) θψ2 = arg maxθ∈Θ
n∑i=1
ψ2
cθ,β1,β2
(Fβ1(x1i; β
ψ11
1 ), Fβ2(x2i; βψ12
2 ))
; θ, k2
(3)
6

where the ψ-functions satisfy some mild asumptions for the resulting estimator to be asymp-totically normal (see Huber and Ronchetti 2009, chap. 3) and k11, k12, k2 are tuning constantassociated with the ψ-functions and for bounded ψ-functions they control the relative efficiencyof the M -estimator to the MLE and can be determined for that purpose (see e.g. Heritier et al.2009, chap. 2). Numerical methods are typically needed to find the solution of the equations indefinition 4.
The MLE belongs to the class of M -estimators. One actually recovers the IFM by replacingthe ψ-functions in definition 4 by the log-density.
A special type of M -estimators is given by weighted maximum likelihood estimators (WMLE)(see Field and Smith 1994; Dupuis and Morgenthaler 2002).It has the form
n∑i=1
w (xi; ξ, k) s (xi; ξ) = 0 (4)
with s(·) the score function, w(·) a weight function that ensures that ψ(x; ξ, k) = w(x; ξ, k)s(x; ξ)is bounded, and ξ a set of parameters. A common choice for the weight function to producebounded ψ-functions is the Tukey’s biweight function
w(xi; ξ, k) =
[1−
(||s(xi;ξ)||
k
)2]2
, ||s(xi; ξ)|| ≤ k
0, ||s(xi; ξ)|| > k
(5)
Hence w ∈ [0, 1], ∀xi, ξ, k.
Generally, robust estimators as defined in (4) are not consistent and a correction, usuallynoted a(ξ), may be added to ensure Fisher consistency. In particular for the WMLE (4) we havethe robust consistent estimator
1
n
n∑i=1
w (xi; ξ, k) s (xi; ξ)−∫w(x; ξ, k)s(x; ξ)dFξ(x) = 0 (6)
where the integral corresponds to the correction term a(ξ). Unfortunately the last equationhas in most cases no analytical expression. Dupuis and Morgenthaler (2002) proposed a biascorrection that is added to the biased estimator (4).
An alternative and maybe simpler method for consistency correction is indirect inference(Gourieroux et al. 1993) as presented in Moustaki and Victoria-Feser (2006) and Victoria-Feser(2007). A robust generalization is proposed in Genton and de Luna (2000) and Genton andRonchetti (2003) and for its use in the context of robust consistent estimation of income dis-tributions see Guerrier and Victoria-Feser (2011). Indirect inference works as follows: one firstdefines an inconsistent estimator for the parameter ξ of the model, say π, that is relatively easyto compute. Then, one find the value for ξ such that when simulating data from the model withthis value, the π has the same value as the one obtained from the original sample.
More formally, let πj(ξ) denote the estimator obtained on the j-th simulated sample of size
n, j = 1, . . . , l, simulated from Fξ, and let π(ξ) = 1l
∑lj=1 π
j(ξ), the indirect estimator is thengiven by
ξ := arg minξ
(π(F (n))− π(ξ)
)TΩ(π(F (n))− π(ξ)
)(7)
7

where Ω is a positive definite matrix set to maximize the efficiency.
To solve (7) we propose to use a Newton-Raphson type algorithm as proposed in Moustakiand Victoria-Feser (2006) with Ω = I as follows
ξ(h+1) = ξ(h) − S−1(π(F (n)), ξ(h)
) n∑i=1
ψ(xi(ξ
(h)); π(F (n)))
where
S(π(F (n)), ξ) =
n·l∑i=1
ψ(xi(ξ); π(F (n))
)sT(xi(ξ); ξ
)and xi(ξ), i = 1, . . . , n · l, are the pseudo-observations of size n · l drawn from Fξ for a given ξ.Through our experiments presented in the next section, we found out that the more the auxiliaryparameter estimated on the sample, π, is biased, the slower the convergence rate of the Newtonstep, even the algorithm may not converge in the worst cases.
Hence, the robust two-stage WMLE ξ = [β1, β2, θ)]T we propose is given by (3) with (6) as
ψ-functions. A semi-parametric version is also studied, for which, in the first step, the marginaldistributions are estimated by their empirical ones (hence ξ = θ).
To compute the asymptotic variance of ξ, one can use the IF (see Section ??), i.e.
V (ξ, Fξ) =
∫IF (x; ξ, Fξ)IF
T (x; ξ, Fξ)dFξ(x) (8)
with Fξ the multivariate joint distribution. The M -estimator depends on a tuning constant kthat needs to be chosen a priori. The lower the value, the more robust the resulting estimator,but the higher, the more efficient (at the true model). k can be therefore chosen as a trade-offbetween robustness and efficiency relative to the MLE, i.e. by choosing k so that
tr([∫
s(x; ξ)sT (x; ξ)dFξ]−1)
tr(∫IF (x; ξ, Fξ)IFT (x; ξ, Fξ)dFξ(x)
) (9)
attains a given level, say 95%. Equation (9) can also be interpreted as the ratio of the asymptoticmean squared errors (MSE) (see Hampel et al. 1986) and can be estimated by replacing ξ by theM -estimate.
2.3 IF of the two-stage M -estimator
To compute the IF , one specifies a small model deviation as a contamination distribution of theform
Fε = (1− ε)Fθ,β1,β2+ ε∆z (10)
where Fθ,β1,β2is a multivariate cumulative distribution (here the copula), ε is an infinitesimal
proportion of contaminations generated by ∆z, the point-mass distribution which puts mass 1 atany points z ∈ R2 in the bivariate case. This contamination model has been widely establishedever since the beginning of robust modern theory (Huber 1964; Tukey 1960). It has been shown inHampel et al. (1986) to produce the worst asymptotic bias on the resulting estimator. Therefore,bounding the influence of such a model contamination, ensures robustness for all types of (small
8

amounts) of model deviation. Specific forms of this multivariate contamination function arediscussed in Alqallaf et al. (2009) for instance. We give two examples in the simulation studynext section.
In the two-stage setting, one can imaging different forms of contaminations, one of whichbeing a independent contamination of size εj at each margin, or a common contamination at themultivariate level. To derive the IF , without loss of generality, we suppose that one can writeε := g(ε1, ε2) and that g satisfies the following assumption
∂
∂ε1
∂
∂ε2g(ε1, ε2)
∣∣∣ε1=ε2=0
= 1 (11)
We then suppose that instead of Fβ1 , Fβ2 , (Fβ1 , Fβ2), the data generating mechanism is respec-tively Fε1 , Fε2 , Fε, with Fεj , j = 1, 2 corresponding to (10) in the univariate case with Fβj , εjand zj . In that case, the estimator given in definition 4 can be written in a functional form as
θ := EFε[ψ2
cθ,β1,β2
(Fβ1
(x1; βψ11
1 (Fε1)), Fβ2(x2; βψ12
2 (Fε2)))
; θ(Fε), k2
]= 0
The following Theorem provides the expression of the IF of the two-stage M -estimator forbivariate copula.
Theorem 2 Let (10) be data generating distribution. Assuming (11) and consistency of theM-estimators, the IF for the two-stage M -estimator for the dependence parameter of bivariatecopula is
IF(z, θ, Fθ,β1,β2) =
[−∫
∂
∂θψ2 (x;β1, β2, θ) dFθ,β1,β2(x)
]−1ψ2 (z; θ, β1, β2) +
2∑j=1
∫∂
∂βjψ2 (x;β1, β2, θ) dFθ,β1,β2
(x) · IF(zj , βj , Fβj )
where x = (x1, x2), z = (z1, z2) and IF(zj , βj , Fβj ), j = 1, 2, are IF of the first stage M -estimators.
The proof is given in Appendix A
A straightforward implication of this influence function is to remark that first-stage estimatorsas well as the ψ-function for copula, ψC , must be bounded for the dependence copula parameter tobe robust. Hence, a robust version of the IFM is, among others, to replace first and second stagesestimators by the consistent WMLE (6), so that the resulting estimating procedure providesrobust and consistent estimators at both stages.
3 Simulation study
In this section we explore the performance of the different estimators for bivariate copula, robustor non-robust, presented in the last section. The goal is twofold: compare the different estimatorsand explore their robustness. Therefore we estimate copulas and their margins under the modeland in the case of contaminations. We vary different parameters and models that we describein the first part. Then we discuss and illustrate the most significant results of the study in thesecond part. The complete results are available in Appendix C.
9

3.1 Design of the simulation study
We study two bivariate copulas:
• Clayton copula (Clayton 1978): CClθ (u1, u2) = (u−θ1 + u−θ2 − 1)1/θ, θ > 0,
• Gumbel-Hougaard copula (Gumbel 1960; Hougaard 1986): CGHθ =
exp−[(− log u1)θ + (− log u2)θ
]1/θ, θ > 1.
Two values of θ are considered, θ = 0.5 and θ = 8 for the Clayton copula and θ = 1.25 and θ = 5for the Gumbel-Hougaard copula. They correspond to Kendall’s τ of 0.2 and 0.8 respectively(see e.g. Nelsen 2006, chap. 5). For both margins of each copula we use the 3-parameters Singh-Maddala income distribution (Singh and Maddala 1976) with parametrization β1 = (3.5, 7, 2.5)for the first margin and β2 = (3, 2, 1) for the second. The probability distribution function is
Fβ(x) =aqx(a−1)[
ba(1 +
(xb
)a)(1+q)]
Modeling joint income distribution suit perfectly our purpose since their asymmetric shape avoidsalmost automatically the use of multivariate normal distribution (see for instance Vinh et al.2010). Moreover income distributions such as the Singh-Maddala are known to be sensitive todata contaminations (see e.g. Victoria-Feser and Ronchetti 1994; Victoria-Feser 1995; Ronchettiand Victoria-Feser 1997; Cowell and Victoria-Feser 2000; Victoria-Feser 2000). A robust estima-tor using indirect inference was successfully implemented in Guerrier and Victoria-Feser (2011).We derive the log-likelihood and the score function of the copulas and the Singh-Maddala distri-bution in Appendix B.
For robust estimation purpose one needs to specify the tuning constant that fixes the levelof efficiency compared to MLE (9). The robust estimators for the margins as well as for thecopulas need specific tuning constants depending on the parametrization. In order to computethe tuning constants for the robust indirect estimators we adapt our framework to the methoddescribed in Moustaki and Victoria-Feser (2006). In short we determine the tuning constantsfor each margin or copula by, first, drawing 3000 pseudo-observations, and then, computing theefficiency corresponding to a set of tuning constants’ values. We retain the tuning constant’svalue corresponding to approximatively 70% and 95% of relative efficiency. Through experimentswe obtain k11 = [3.65(70%); 7.20(95%)] for the first margin and k12 = [5.7(70%); 13.5(95%)] for
the second. For the Clayton copula we have kC,τ12 = [3(70%); 6(95%)] for θ = 0.5 and kC,τ22 =
[0.96(70%); 1.20(95%)] for θ = 8. Similarly, for the Gumbel-Hougaard copula we get kGH,τ12 =
[3.1(70%); 7.1(95%)] for θ = 1.25 and kC,τ22 = [1.03(70%); 1.85(95%)] for θ = 5.
All data generating processes are resumed in a tree below. First we consider two types ofcontamination models due to Alqallaf et al. (2009). Let (x1, x2)T be two realizations from themodel Fθ,β1,β2 , z = (z1, z2)T two realizations from a contaminating distribution G and[
y1
y2
]=
[1−W1 0
0 1−W2
] [x1
x2
]+
[W1 00 W2
] [z1
z2
]where W1 and W2 are Bernoulli random variable with probability P (Wj = 1) = εj , j = 1, 2. Thejoint distribution of (W1,W2) is still to be specified. In our experiments we use two emblematiccases covering a wide scope of situations:
10
• (W1,W2) are fully dependent (later FDCM), hence P (W1 = W2) = 1 and ε1 = ε2 = ε. Weobserve non-contaminated data exactly at the same level in both dimension with probability(1− ε).
• (W1,W2) are fully independent (hereafter FICM): P (W1 = W2) = 0. The probability toobserve jointly clean data decreases to (1− ε1)(1− ε2).
Then we consider two proportions of data contaminated in the marginal distribution, εj =[0.8%, 8%], j = 1, 2, with the restriction ε1 = ε2 for both contamination models. 0.8% is arelatively small proportion of data contaminated whereas 8% is quite large. For the contaminantsz we take into consideration four deviation’s patterns:
1. Aberrant value: zj = 1000, j = 1, 2.
2. Extreme value: the contaminants correspond to the 99th quantile of the Singh-Maddaladistribution. Hence in our case z1 ≈ 11.28 for the first margin and z2 ≈ 9.25 for the second.
3. Permutation: the contaminants are (randomly chosen) permuted observations of the samemargin, thus zij = xi′j , i 6= i′, j = 1, 2.
4. Mixture distribution: zj ∼ Singh-Maddala(10, 1, 10), j = 1, 2.
The first pattern is typical for an univariate case: the marginal MLE is very sensitive toaberrant values and we expect the robust estimators to overcome this problem. The secondpattern has similar effect but it is more difficult for the robust estimator to identify outlyingvalue since they are more likely to be observed. Robust estimators with tuning parameterscorresponding to 70% of efficiency might be less influenced by deviations in this case. The thirdpattern breaks the dependence structure while there is no effect on the margins. The fourthpattern is inspired from Dell’Aquila and Embrechts (2006) where the same idea is applied to theGumbel extreme value distribution.
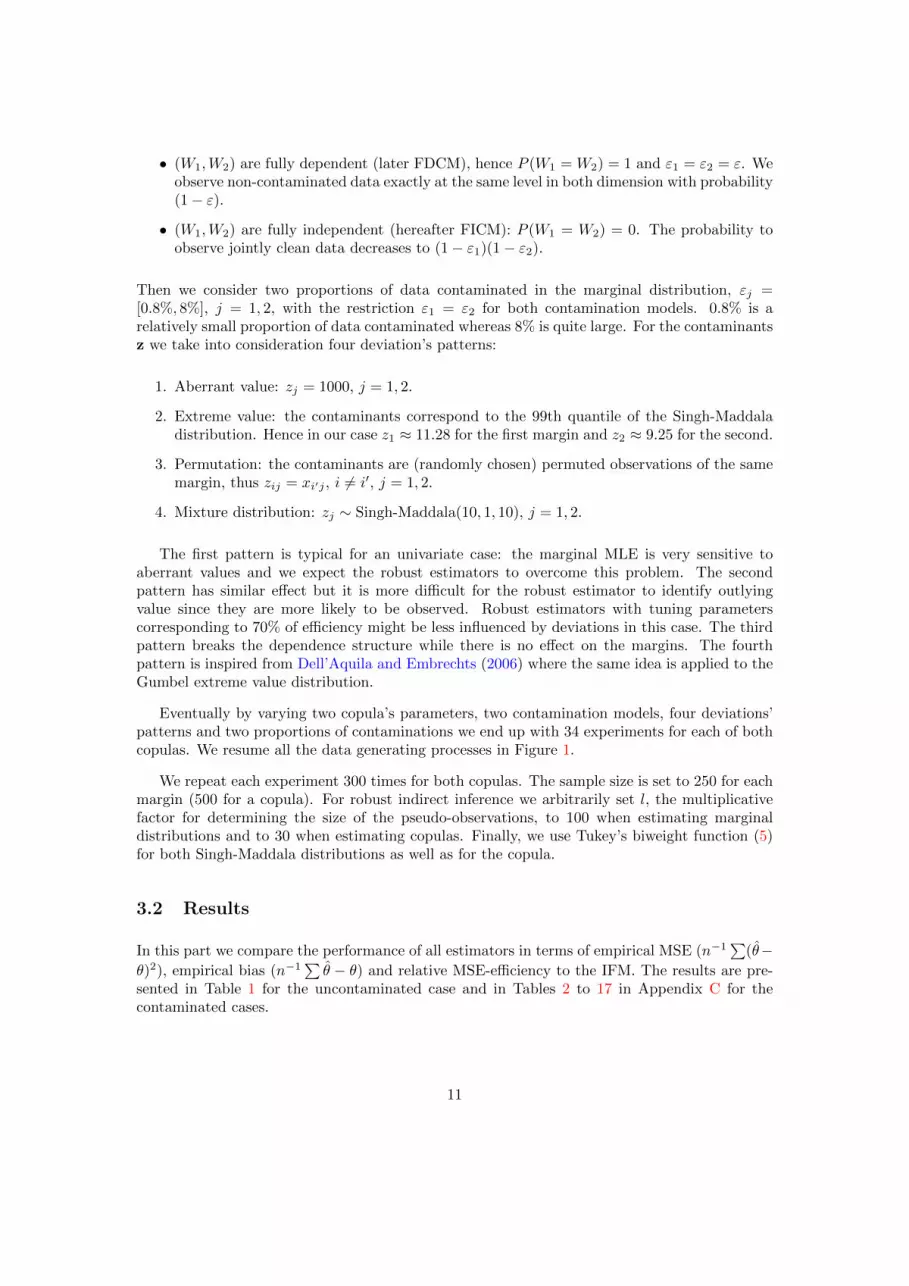
Eventually by varying two copula’s parameters, two contamination models, four deviations’patterns and two proportions of contaminations we end up with 34 experiments for each of bothcopulas. We resume all the data generating processes in Figure 1.
We repeat each experiment 300 times for both copulas. The sample size is set to 250 for eachmargin (500 for a copula). For robust indirect inference we arbitrarily set l, the multiplicativefactor for determining the size of the pseudo-observations, to 100 when estimating marginaldistributions and to 30 when estimating copulas. Finally, we use Tukey’s biweight function (5)for both Singh-Maddala distributions as well as for the copula.
3.2 Results
In this part we compare the performance of all estimators in terms of empirical MSE (n−1∑
(θ−θ)2), empirical bias (n−1
∑θ − θ) and relative MSE-efficiency to the IFM. The results are pre-
sented in Table 1 for the uncontaminated case and in Tables 2 to 17 in Appendix C for thecontaminated cases.
11

DGP
No contamination
Experiments : 1, 18
τ : [0.2; 0.8](ε =
0)
Contamination
FDCM
Experiments(τ=0.2)
: 6→ 9, 14→ 17
Experiments(τ=0.8)
: 23→ 26, 31→ 34
4 deviation’s
patterns
FICM
Experiments(τ=0.2)
: 2→ 5, 10→ 13
Experiments(τ=0.8)
: 19→ 22, 27→ 304 deviat
ion’s
patter
ns
τ : [0.2; 0.
8]
ε :[0.
8%; 8%]
Figure 1: The 34 experimental settings for evaluating the statistical performances of the differentclassical and robust estimators. DGP stands for Data Generating Process and FICM/FDCM forFully Independent/Dependent Contamination Model. Deviation’s patterns are in the same orderas presented above, i.e. aberrant value, extreme value, permutation and mixture distribution.
When estimating the Clayton’s copula with θ = 8 and the WMLE corresponding to 70% ofefficiency, we encountered some numerical convergence problems at the second stage. Thereforein this setting, the copula dependence estimators is the (biased) WMLE (4).
With uncontaminated data, the IFM is overall non-surprisingly the most efficient estimator;see Table 1. Robust estimators have efficiency successfully controlled, except apparently withthe Gumbel-Hougaard(θ = 1.25) copula where observed efficiency is around 50% instead of70%. In Figure 2 is compared the performance of the IFM, SP and the WMLE (95% efficiency)with aberrant values (experiment no 19) and extreme values (experiment no 20) and 0.8% ofcontamination. One can see that a small proportion of contamination, i.e. about 2 observationsout of 250 for one margin, is large enough to produce biased IFM. The SP estimator, although it isnon parametric in the first stage, also has an relatively important bias. The WMLE is on the otherhand not biased. With larger proportion of data contamination (FICM case, εj = 8%, j = 1, 2),the WMLE has a larger MSE but always smaller than the one of the non-robust estimators.
In Figure 3 are presented the finite sample performance of different two-stage estimators with8% (experiment 28) and 0.8% (experiment 25) contamination. The WMLE and the NP-ROBestimators show very similar performance when contamination occurs in the bivariate settingonly (experiment 25). However, if the marginals are contaminated (experiment 28), a semiparametric approach in the first stage together with a robust approach in the second stage, isnot sufficient to produce a robust estimator.
Varying the tuning constant (i.e. the efficiency level) gives an insight on what affects thefinal efficiency, that of the copula dependence estimators. In general we observe that first stage
12

Clayton
θ = 0.5 θ = 8
Stage 1 Stage 2 MSE Bias Efficiency MSE Bias Efficiency
MLE MLE 0.0113 0.0049 100.00 0.5297 -0.1485 100.00
NP MLE 0.0130 0.0258 86.75 0.5505 -0.2056 96.24
NP ROB(95%) 0.0129 0.0182 87.06 0.5257 0.2095 100.76
ROB(95%) ROB(95%) 0.0120 0.0003 93.87 0.5473 0.1983 96.80
NP ROB(70%) 0.0171 0.0154 66.11 2.7412 -1.6245 19.32
ROB(70%) ROB(70%) 0.0161 0.0001 69.85 2.7829 -1.6407 19.04
Gumbel-Hougaard
θ = 1.25 θ = 5
Stage 1 Stage 2 MSE Bias Efficiency MSE Bias Efficiency
MLE MLE 0.0042 0.0024 100.00 0.1219 -0.0122 100.00
NP MLE 0.0046 0.0127 91.83 0.1249 -0.0360 97.56
NP ROB(95%) 0.0048 0.0088 87.96 0.1345 -0.0243 90.63
ROB(95%) ROB(95%) 0.0044 0.0009 95.30 0.1364 -0.0212 89.32
NP ROB(70%) 0.0084 0.0151 50.11 0.1817 0.0044 67.05
ROB(70%) ROB(70%) 0.0080 0.0022 52.33 0.1848 -0.0685 65.95
Table 1: Experiments 1 and 18: uncontaminated data (ε1 = ε2 = 0). ROB(70%) orROB(95%) indicate that the tuning constant of the corresponding WMLE correspond to re-spectively 70% or 95% of relative efficiency. Experiments are described in Figure 1.
estimators have negligible impact on the efficiency compared to the second stage estimators. Itis obvious when comparing the combination of robust estimators, ROB(70%)→ROB(95%) andROB(95%)→ROB(70%), in the uncontaminated data situation.
13

Experiment 19Gumbel−Hougaard( 5 )
θ−
θ
MLE NP ROB(95%)Stage 1:MLE MLE ROB(95%)Stage 2:
−3
−2
−1
01
23
Experiment 20Clayton( 8 )
θ−
θMLE NP ROB(95%)Stage 1:MLE MLE ROB(95%)Stage 2:
−4
−2
02
4
Figure 2: IFM (MLE-MLE), SP (NP-MLE) and WMLE (ROB-ROB) finite sample performancewith 0.8% of contaminated data. Experiments are described in Figure 1.
References
Alqallaf, F., Van Aelst, S., Yohai, V. J., and Zamar, R. H. (2009). Propagation of outliers inmultivariate data. The Annals of Statistics, 37:311–331. 9, 10
Charpentier, A., Fermanian, J.-D., and Scaillet, O. (2007). The estimation of copulas: theory andpractice. In J., R., editor, Copulas: From theory to application in finance. Risk Publications,London. Section 2. 5
Chen, X., Fan, Y., and Tsyrennikov, V. (2006). Efficient estimation of semiparametric multi-variate copula models. Journal of the American Statistical Association, 101(475):1228–1240.6
Cherubini, U., Luciano, E., and Vecchiato, W. (2004). Copula methods in finance. Wiley. 4
Clayton, D. G. (1978). A model for association in bivariate life tables and its application in epi-demiological studies of familial tendency in chronic disease incidence. Biometrika, 65(1):141–151. 10
Cowell, F. A. and Victoria-Feser, M.-P. (2000). Distributional analysis: A robust approach. InAtkinson, A. B., Glennerster, H., and Stern, N., editors, Putting Economics To Work, volumein honour of Michio Morishima. STICERD, LSE, London, UK. 10
Cowell, F. A. and Victoria-Feser, M.-P. (2002). Welfare rankings in the presence of contaminateddata. Econometrica, 70:1221–1233. 4
Cowell, F. A. and Victoria-Feser, M.-P. (2006). Distributional dominance with trimmed data.Journal of Business and Economics Statistics, 24:291–300. 4
14

Experiment 28Gumbel−Hougaard( 5 )
θ−
θ
ROB(95%) MLE ROB(95%) NP NPStage 1:MLE ROB(95%) ROB(95%) ROB(95%) MLEStage 2:
−4
−2
02
4
Experiment 25Clayton( 8 )
θ−
θ
ROB(95%) MLE ROB(95%) NP NPStage 1:MLE ROB(95%) ROB(95%) ROB(95%) MLEStage 2:
−4
−2
02
4Figure 3: Finite sample performance of different two-stage estimators with 8% (experiment 28)and 0.8% (experiment 25) contamination: ROB-MLE, MLE-ROB, WMLE (ROB-ROB), NP-ROB, SP (NP-MLE). Experiment 28 is extreme value independent contamination, experiment25 is permutation contamination. Experiments are described in Figure 1.
Cowell, F. A. and Victoria-Feser, M.-P. (2007). Robust stochastic dominance: A semi-parametricapproach. Journal of Economic Inequality, 7:21–37. 4
Cowell, F. A. and Victoria-Feser, M.-P. (2008). Modelling Lorenz curves: robust and semi-parametric issues. In Chotikapanich, D., editor, Modelling Income Distributions and LorenzCurves, Statistics for Industry and Technology Series, pages 241–254. Springer. 4
Dell’Aquila, R. and Embrechts, P. (2006). Extremes and robustness: a contradiction? FinancialMarkets and Portfolio Management, 20(1):103–118. 11
Denecke, L. and Muller, C. H. (2011). Robust estimators and tests for bivariate copulas basedon likelihood depth. Computational Statistics and Data Analisys, 55:2724–2738. 4
Dupuis, D. J. and Morgenthaler, S. (2002). Robust weighted likelihood estimators with anapplication to bivariate extremevalue problems. Canadian Journal of Statistics, 30:17–36. 7
Fermanian, J.-D. and Scaillet, O. (2003). Nonparametric estimation of copulas for time series.Journal of Risk, 95:25–54. 6
Field, C. and Smith, B. (1994). Robust estimation - a weighted maximum likelihood approach.International Statistical Review, 62:405–424. 7
Genest, C. and Favre, A.-C. (2007). Everything you always wanted to know about copulamodeling but were afraid to ask. Journal of Hydrologic Engineering, 12(4):347–368. 4
15

Genest, C., Ghoudi, K., and Rivest, L. P. (1995). A semiparametric estimation procedure ofdependence parameters in multivariate families of distributions. Biometrika. 4
Genest, C., Masiello, E., and Tribouley, K. (2009). Estimating copula densities through wavelets.Insurance: Mathematics and Economics, 44(2):170–181. 6
Genton, M. G. and de Luna, X. (2000). Robust simulation-based estimation. Statistics andProbability Letters, 48:253–259. 7
Genton, M. G. and Ronchetti, E. (2003). Robust indirect inference. Journal of the AmericanStatistical Association, 98:1–10. 7
Gourieroux, C., Monfort, A., and Renault, A. E. (1993). Indirect inference. Journal of AppliedEconometrics, 8 (supplement):S85–S118. 7
Guerrier, S. and Victoria-Feser, M.-P. (2011). Robust simulation based estimation of incomedistributions. Working Paper. 7, 10
Gumbel, E. J. (1960). Distributions des valeurs extremes en plusieurs dimensions. Publ. Inst.Statist. Univ. Paris, 9:171–173. 10
Hampel, F. R. (1968). Contribution to the Theory of Robust Estimation. PhD thesis, Universityof California, Berkeley. 4
Hampel, F. R. (1974). The influence curve and its role in robust estimation. Journal of theAmerican Statistical Association, 69:383–393. 4
Hampel, F. R., Ronchetti, E. M., Rousseeuw, P. J., and Stahel, W. A. (1986). Robust Statistics:The Approach Based on Influence Functions. John Wiley, New York. 5, 8
Heritier, S., Cantoni, E., Copt, S., and Victoria-Feser, M. (2009). Robust Methods in Biostatistics.Wiley. 5, 7
Hougaard, P. (1986). A class of multivariate failure time distributions. Biometrika, 73(3):671–678. 10
Huber, P. J. (1964). Robust estimation of a location parameter. Annals of Mathematical Statis-tics, 35:73–101. 6, 8
Huber, P. J. and Ronchetti, E. (2009). Robust Statistics. Wiley. 5, 7
Joe, H. (1997). Multivariate Models and Multivariate Dependence Concepts. Chapman & Hall,London. 4
Joe, H. (2005). Asymptotic efficiency of the two-stage estimation method for copula-basedmodels. Journal of Multivariate Analysis, 94:401–419. 4
Kim, B. and Lee, S. (2013). Robust estimation for copula parameter in scomdy models. Journalof Time Series Analysis, 34(3):302–314. 4
Kim, G., Silvapulle, M. J., and Silvapulle, P. (2007). Comparison of semiparametric and para-metric methods for estimating copulas. Computational Statistics & Data Analysis, 51(6):2836–2850. 4
Kozek, A. S. (2003). M-estimators and normal quantiles. The Annals of Statistics, 31:1170–1185.6
16

Maronna, R., Martin, R., and Yohai, V. (2006). Robust statistics. J. Wiley. 5
McNeil, A. J., Frey, R., and Embrechts, P. (2005). Quantitative risk management: concepts,techniques, and tools. Princeton university press. 4, 6
Mendes, B. V. M., de Melo, E. F. L., and Nelsen, R. B. (2007). Robust fits for copula models.Communications in Statistics - Simulation and Computation, 36(5):997–1017. 4
Moustaki, I. and Victoria-Feser, M.-P. (2006). Bounded-bias robust inference for generalizedlinear latent variable models. Journal of the American Statistical Association, 101:644–653. 7,8, 10
Nelsen, R. B. (2006). An introduction to copulas. Springer. 4, 10
Oakes, D. (1982). A model for association in bivariate survival data. Journal of the RoyalStatistical Society, Series B, 44:414–422. 4
Ronchetti, E. and Victoria-Feser, M.-P. (1997). Resistant modelling of income distribution andinequality measures. In Brillinger, D. R., Fernholz, L. T., and Morgenthaler, S., editors, ThePractice of Data Analysis: Festschrift in Honout of John W. Tukey forhis 80th Birthday.Princeton University Press, Princeton. 10
Rousseeuw, P. J. and Hubert, M. (1999). Regression depth. Journal of the American StatisticalAssociation, 94:388–402. 4
Shih, J. H. and Louis, T. A. (1995). Inferences on the association parameter in copula modelsfor bivariate survival data. Biometrics, pages 1384–1399. 4
Singh, S. K. and Maddala, G. S. (1976). A function for size distribution of incomes. Econometrica,44(5):963–70. 10
Sklar, M. (1959). Fonctions de repartition a n dimensions et leurs marges. Universite Paris 8. 3
Tsukahara, H. (2005). Semiparametric estimation in copula models. Canadian Journal of Statis-tics, 33. 4
Tukey, J. W. (1960). A survey of sampling from contaminated distributions. In Olkin, I., editor,Contributions to Probability and Statistics, pages 448–485. Stanford University Press, Stanford(CA). 8
Victoria-Feser, M.-P. (1995). Robust methods for personal income distribution models withapplication to Dagum’s model. In Dagum, C. and Lemmi, A., editors, Research on EconomicInequality, Volume 6: Income Distribution, Social Welfare,Inequality and Poverty, pages 225–239. JAI Press, Greenwich. 10
Victoria-Feser, M.-P. (2000). A general robust approach to the analysis of income distribution,inequalityand poverty. International Statistical Review, 68:277–293. 10
Victoria-Feser, M.-P. (2007). De-biasing weighted MLE via indirect inference: The case ofgeneralized linear latent variable models. Revstat Statistical Journal, 5:85–96. 7
Victoria-Feser, M.-P. and Ronchetti, R. (1994). Robust methods for personal income distributionmodels. The Canadian Journal of Statistics, 22:247–258. 10
17

Vinh, A., Griffiths, W. E., and Chotikapanich, D. (2010). Bivariate income distributions forassessing inequality and poverty under dependent samples. Economic Modelling, 27(6):1473–1483. 10
Zhelonkin, M., Genton, M. G., and Ronchetti, E. (2012). On the robustness of two-stage esti-mators. Statistics & Probability Letters, 82:726–732. 6
A Proof of Theorem 2
In functional form the marginal estimators are solution of the following expectations
β1 := EFβ1ψ11
[x1; β1(Fβ1
)]
= 0
for the first marginal. And for the second marginal
β2 := EFβ2ψ12
[x2; β2(Fβ2)
]= 0
where EF∗. . . =∫. . . dF∗. Those two estimators are the first step of the estimation procedure.
The second stage is the solution of the equation
θ := EFθ,β1,β2ψ2
[x; β1(Fβ1
), β2(Fβ2), θ(Fθ)
]= 0
where x = (x1, x2).
When Fε is of the form described in (10) we therefore have
θ := (1−ε)EFθ,β1,β2ψ2
[x; β1(Fε1), β2(Fε2), θ(Fε)
]+εE∆z
ψ2
[x; β1(Fε1), β2(Fε2), θ(Fε)
]= 0
(12)
The second term of (12) is a slight abuse of notation. In fact there is no integral over thepoint-mass distribution. Therefore the notation is simplified as follows
E∆z
ψ2
[x; β1(Fε1), β2(Fε2), θ(Fε)
]=
∫ψ2
[x; β1(Fε1), β2(Fε2), θ(Fε)
]d∆z
= ψ2
[z; β1(Fε1), β2(Fε2), θ(Fε)
]Consequently the equation (12) is
(1− ε)EFθ,β1,β2ψ2
[x; β1(Fε1), β2(Fε2), θ(Fε)
]+ εψ2
[z; β1(Fε1), β2(Fε2), θ(Fε)
]= 0 (13)
Before computing the influence function any further we first need to define the expression ofthe influence function we want to isolate. By definition it is
IF(z, θ, F ) =∂
∂εθ(Fε)
∣∣∣ε=0
=∂
∂ε1
∂
∂ε2θ(Fε)
∣∣∣ε1=ε2=0
We note concisely IF(θ).
18

At this point, in order to develop the influence function of a bivariate copula function weneed to take the derivative of (13) with respect to ε = 0. Then we may isolate the expression ofthe influence function with its explicit form by factorization. Let’s develop
0 =∂
∂ε(1− ε)EFθ,β1,β2
ψ2
[x; β1(Fε1), β2(Fε2), θ(Fε)
]∣∣∣ε=0︸ ︷︷ ︸
(i)
+∂
∂εεψ2
[z; β1(Fε1), β2(Fε2), θ(Fε)
]∣∣∣ε=0︸ ︷︷ ︸
(ii)
From (i), assumption (11) and consistent estimators, i.e. β1(Fβ1) = β1, β2(Fβ2
) = β2, θ(Fθ) = θ,so that EFθ,β1,β2 ψ2[x;β1, β2, θ] = 0, we have
EFθ,β1,β2
∂
∂εψ2
[x; β1(Fε1), β2(Fε2), θ(Fε)
]∣∣∣ε=0
(14)
And from (ii) and (11)ψ2 [z;β1, β2, θ]
The expectation (14) still contains a derivative to be computed. In fact it contains the desiredinfluence function. The derivative is computed as follows
∂
∂εψ2
[x; β1(Fε1), β2(Fε2), θ(Fε)
]∣∣∣ε=0
=∂
∂µψ2 [x;µ]
∂µ(Fε)
∂ε
∣∣∣ε=0
with µ(F ) = [β1(Fβ1), β2(Fβ2
), θ(Fθ)] and µ = [β1, β2, θ]. Hence,
∂
∂εψ2
[x; β1(Fε1), β2(Fε2), θ(Fε)
]∣∣∣ε=0
=∂
∂β1ψ2 [x;β1, β2, θ] IF(z1, β1, Fβ1
)
+∂
∂β2ψ2 [x;β1, β2, θ] IF(z2, β2, Fβ2)
+∂
∂θψ2 [x;β1, β2, θ] IF(θ)
Indeed IF(θ) is the sought-after influence function for bivariate copula. The two other IF are theunivariate influence functions. They are defined as follows
IF(zj , βj , Fβj ) =∂
∂εjβj(Fεj )
∣∣∣εj=0
, j = 1, 2
From the last developments the equation (14) is then
EFθ,β1,β2
∂
∂β1ψ2 [x;β1, β2, θ] IF(z1, β1, Fβ1
)
+ EFθ,β1,β2
∂
∂β2ψ2 [x;β1, β2, θ] IF(z2, β2, Fβ2
)
+ EFθ,β1,β2
∂
∂θψ2 [x;β1, β2, θ] IF(θ)
Eventually, since (12) is equal to 0, factorizing the IF(θ) yields the influence function of abivariate copula function.
19

B Characteristics of some distributions
Distributions Features
Singh-Madalla(x; a, b, q) b: scale parameter, a, q: shape parameters.
support & domain x > 0, a > 0, b > 0, q > 0
cdf Fa,b,q(x) = 1−(
1 +(xb
)a)−qpdf fa,b,q(x) =
aqx(a−1)[ba(1 +
(xb
)a)(1+q)]
log-likelihood `a,b,q(x) = log[aqx(a−1)
]− log
ba[1 +
(xb
)a](1+q)
score sa,b,q(x) =
sa(x)
sb(x)
sq(x)
=
1a + [log(x)−log(b)][ba−qxa]
ba+xa
(ab
) (qxa−baxa+ba
)1q −
log(ba+xa)ba
Clayton(u1, u2; θ) θ: dependence parameter.
support & domain u1, u2 ∈ [0, 1], θ > 0
cdf CClθ (u1, u2) =
(u−θ1 + u−θ2 − 1
)−1/θ
pdf cClθ (u1, u2) = θ2 Γ
(1θ + 2
)Γ(
1θ
) (uθ1 + uθ2 − 1
)−1/θ−2(u1u2)−θ−1
log-likelihood `Clθ (u1, u2) = 2 log(θ) + log
(Γ(
1θ + 2
))− log
(Γ(
1θ
))−(
1θ + 2
)log(u−θ1 + u−θ2 − 1
)− (θ + 1) [log(u1) + log(u2)]
score sClθ (u1, u2) = 2
θ −1θ2 Γ
(1θ + 2
)+ 1
θ2 Γ(
1θ
)+ 1
θ2 log(u−θ1 + u−θ2 − 1
)−(
1θ + 2
) u−θ1 log(u1)+u−θ2 log(u2)
u−θ1 +u−θ2 −1− [log(u1) + log(u2)]
where Γ(t) =∂
∂tlog (Γ(t))
Gumbel-Hougaard(u1, u2; θ) θ: dependence parameter.
support & domain u1, u2 ∈ [0, 1], θ > 1
cdf CGHθ (u1, u2) = exp
−[(− log u1)θ + (− log u2)θ
]1/θpdf cGH
θ (u1, u2) =CGHθ (u1, u2) [− log(u1)− log(u2)]
θ−1(u1u2)−1
(A1/θ + θ − 1
)A2−1/θ
where A = (− log(u1))θ + (− log(u2))θ
log-likelihood `GHθ (u1, u2) = −A1/θ − log(u1u2) + (θ − 1) log [(− log(u1))(− log(u2)]
−(2− 1
θ
)log(A) + log
[A1/θ + θ − 1
]score sGH
θ (u1, u2) = log [log(u1) log(u2)]− log(A)θ2 +
(1θ − 2
)BA−1 + log(A)A1/θ
θ2 − A1/θ−1Bθ
+ θ−1A1/θ−1B−θ−2 log(A)A1/θ+1θ+A1/θ−1
where B =∂
∂θA =
[(− log(u1))θ
]log (− log(u1)) +
[(− log(u2))θ
]log (− log(u2))
20

C Supplementary simulation results
Clayton Gumbel-Hougaard
θ = 0.5 θ = 8 θ = 1.25 θ = 5
Stage 1 Stage 2 MSE Bias Efficiency MSE Bias Efficiency MSE Bias Efficiency MSE Bias Efficiency
MLE MLE 0.0118 -0.0082 100.00 1.4434 -0.8480 100.00 0.0044 -0.0154 100.00 0.8129 -0.7761 100.00
NP MLE 0.0131 0.0143 89.83 1.5329 -0.9084 94.16 0.0044 -0.0046 101.09 0.7824 -0.7613 103.90
NP ROB(95%) 0.0130 0.0083 90.76 0.4989 0.0677 289.31 0.0045 0.0000 97.31 0.1494 0.0164 544.15
ROB(95%) ROB(95%) 0.0122 -0.0106 96.40 0.5425 0.0507 266.05 0.0044 -0.0069 100.94 0.1608 0.0080 505.36
ROB(70%) ROB(95%) 0.0130 -0.0133 90.67 0.5123 0.1007 281.73 0.0047 -0.0112 93.45 0.1728 -0.0377 470.35
NP ROB(70%) 0.0169 0.0073 69.67 2.9132 -1.6752 49.55 0.0086 0.0175 51.23 0.2045 0.0447 397.53
ROB(95%) ROB(70%) 0.0167 -0.0076 70.66 3.0004 -1.7015 48.11 0.0082 0.0111 54.20 0.2050 0.0100 396.50
ROB(70%) ROB(70%) 0.0173 -0.0082 68.23 2.9052 -1.6781 49.68 0.0081 0.0040 54.69 0.2224 -0.0255 365.42
Table 2: Experiments 2 and 19: FICM, extreme value, ε1 = ε2 = 0.8%. ROB(70%) orROB(95%) indicate that the tuning constant of the corresponding WMLE correspond to respec-tively 70% or 95% of relative efficiency. Experiments are described in Figure 1.
Clayton Gumbel-Hougaard
θ = 0.5 θ = 8 θ = 1.25 θ = 5
Stage 1 Stage 2 MSE Bias Efficiency MSE Bias Efficiency MSE Bias Efficiency MSE Bias Efficiency
MLE MLE 0.0132 -0.0510 100.00 1.9162 -1.0989 100.00 0.0052 -0.0084 100.00 2.2885 -1.4010 100.00
NP MLE 0.0131 0.0141 100.66 1.5420 -0.9126 124.27 0.0043 -0.0088 121.96 1.0532 -0.9275 217.28
NP ROB(95%) 0.0130 0.0079 101.73 0.4994 0.0709 383.72 0.0047 0.0039 111.17 0.1497 -0.0014 1529.06
ROB(95%) ROB(95%) 0.0125 -0.0106 105.51 0.5089 0.0522 376.52 0.0045 -0.0138 115.01 0.1362 -0.0282 1679.76
ROB(70%) ROB(95%) 0.0120 -0.0092 109.83 0.5350 0.0610 358.15 0.0048 -0.0155 108.09 0.1506 -0.0865 1519.20
NP ROB(70%) 0.0169 0.0069 78.09 2.9169 -1.6764 65.69 0.0095 0.0249 54.97 0.1989 0.0125 1150.68
ROB(95%) ROB(70%) 0.0167 -0.0085 78.99 2.9879 -1.7001 64.13 0.0080 0.0032 65.02 0.1780 -0.0276 1286.01
ROB(70%) ROB(70%) 0.0164 -0.0078 80.53 2.9680 -1.6945 64.56 0.0081 0.0011 64.08 0.1901 -0.0772 1203.68
Table 3: Experiments 3 and 20: FICM, aberrant value, ε1 = ε2 = 0.8%. ROB(70%) orROB(95%) indicate that the tuning constant of the corresponding WMLE correspond to respec-tively 70% or 95% of relative efficiency. Experiments are described in Figure 1.
Clayton Gumbel-Hougaard
θ = 0.5 θ = 8 θ = 1.25 θ = 5
Stage 1 Stage 2 MSE Bias Efficiency MSE Bias Efficiency MSE Bias Efficiency MSE Bias Efficiency
MLE MLE 0.0151 -0.0594 100.00 8.3324 -2.5636 100.00 0.0043 -0.0066 100.00 0.3921 -0.4786 100.00
NP MLE 0.0117 -0.0151 129.25 7.2741 -2.4301 114.55 0.0045 0.0041 95.35 0.3736 -0.4607 104.96
NP ROB(95%) 0.0121 0.0006 124.74 0.4474 -0.0127 1862.21 0.0047 0.0021 91.48 0.1353 -0.0626 289.83
ROB(95%) ROB(95%) 0.0124 -0.0054 121.59 0.6007 0.1248 1387.00 0.0044 -0.0057 97.78 0.1295 -0.0556 302.72
ROB(70%) ROB(95%) 0.0120 -0.0099 125.12 0.5788 0.2302 1439.50 0.0046 -0.0097 92.48 0.1453 -0.1224 269.77
NP ROB(70%) 0.0173 0.0242 87.09 3.1231 -1.7404 266.80 0.0081 0.0125 52.46 0.1817 -0.0005 215.81
ROB(95%) ROB(70%) 0.0168 0.0145 89.66 2.9956 -1.6960 278.15 0.0077 0.0029 55.19 0.1731 -0.0219 226.55
ROB(70%) ROB(70%) 0.0164 0.0078 91.97 2.7771 -1.6381 300.04 0.0078 -0.0019 54.72 0.1835 -0.0796 213.71
Table 4: Experiments 4 and 21: FICM, mixture distribution, ε1 = ε2 = 0.8%. ROB(70%)or ROB(95%) indicate that the tuning constant of the corresponding WMLE correspond torespectively 70% or 95% of relative efficiency. Experiments are described in Figure 1.
21

Clayton Gumbel-Hougaard
θ = 0.5 θ = 8 θ = 1.25 θ = 5
Stage 1 Stage 2 MSE Bias Efficiency MSE Bias Efficiency MSE Bias Efficiency MSE Bias Efficiency
MLE MLE 0.0112 -0.0003 100.00 1.0806 -0.5853 100.00 0.0042 -0.0010 100.00 0.1892 -0.1781 100.00
NP MLE 0.0128 0.0209 87.58 1.1113 -0.6335 97.24 0.0046 0.0092 93.20 0.1965 -0.1985 96.27
NP ROB(95%) 0.0127 0.0138 88.43 0.5080 0.1428 212.72 0.0047 0.0058 89.44 0.1391 -0.0606 136.00
ROB(95%) ROB(95%) 0.0118 -0.0031 94.84 0.5304 0.1350 203.73 0.0044 -0.0019 95.67 0.1405 -0.0571 134.66
ROB(70%) ROB(95%) 0.0116 -0.0034 96.54 0.5546 0.1540 194.84 0.0047 -0.0042 90.17 0.1529 -0.1112 123.75
NP ROB(70%) 0.0165 0.0127 67.89 2.8154 -1.6472 38.38 0.0083 0.0134 51.45 0.1842 -0.0110 102.73
ROB(95%) ROB(70%) 0.0159 -0.0014 70.69 2.9157 -1.6784 37.06 0.0078 0.0035 54.39 0.1811 -0.0359 104.49
ROB(70%) ROB(70%) 0.0154 -0.0027 72.63 2.8416 -1.6593 38.03 0.0079 0.0005 53.54 0.1912 -0.0837 98.95
Table 5: Experiments 5 and 22: FICM, permutation, ε1 = ε2 = 0.8%. ROB(70%) orROB(95%) indicate that the tuning constant of the corresponding WMLE correspond to respec-tively 70% or 95% of relative efficiency. Experiments are described in Figure 1.
Clayton Gumbel-Hougaard
θ = 0.5 θ = 8 θ = 1.25 θ = 5
Stage 1 Stage 2 MSE Bias Efficiency MSE Bias Efficiency MSE Bias Efficiency MSE Bias Efficiency
MLE MLE 0.0119 0.0169 100.00 0.5235 -0.0810 100.00 0.0065 0.0430 100.00 0.1499 0.1394 100.00
NP MLE 0.0143 0.0400 83.23 0.5348 -0.1565 97.89 0.0077 0.0528 84.08 0.1463 0.1067 102.48
NP ROB(95%) 0.0141 0.0342 84.22 0.5528 0.2630 94.69 0.0073 0.0450 88.53 0.1637 0.1261 91.55
ROB(95%) ROB(95%) 0.0128 0.0154 93.16 0.6021 0.2480 86.95 0.0065 0.0381 99.72 0.1698 0.1279 88.26
ROB(70%) ROB(95%) 0.0119 0.0126 99.80 0.6219 0.2628 84.17 0.0063 0.0330 101.90 0.1818 0.0126 82.43
NP ROB(70%) 0.0189 0.0368 62.98 2.6632 -1.6029 19.66 0.0110 0.0457 58.74 0.2223 0.1618 67.42
ROB(95%) ROB(70%) 0.0180 0.0238 65.96 2.7580 -1.6318 18.98 0.0103 0.0378 62.52 0.2104 0.1337 71.23
ROB(70%) ROB(70%) 0.0177 0.0218 67.20 2.7509 -1.6313 19.03 0.0096 0.0310 67.32 0.2242 0.0144 66.86
Table 6: Experiments 6 and 23: FDCM, extreme value, ε1 = ε2 = 0.8%. ROB(70%) orROB(95%) indicate that the tuning constant of the corresponding WMLE correspond to respec-tively 70% or 95% of relative efficiency. Experiments are described in Figure 1.
Clayton Gumbel-Hougaard
θ = 0.5 θ = 8 θ = 1.25 θ = 5
Stage 1 Stage 2 MSE Bias Efficiency MSE Bias Efficiency MSE Bias Efficiency MSE Bias Efficiency
MLE MLE 0.0112 -0.0252 100.00 0.5667 -0.0964 100.00 0.0293 0.1375 100.00 0.1639 0.1961 100.00
NP MLE 0.0143 0.0406 77.83 0.5342 -0.1451 106.09 0.0095 0.0648 306.69 0.1708 0.1684 95.98
NP ROB(95%) 0.0143 0.0349 78.27 0.5627 0.2758 100.70 0.0086 0.0530 339.70 0.1870 0.1815 87.65
ROB(95%) ROB(95%) 0.0126 0.0151 88.66 0.5693 0.2488 99.54 0.0051 0.0196 571.77 0.1376 0.0201 119.15
ROB(70%) ROB(95%) 0.0122 0.0158 91.27 0.6080 0.2643 93.20 0.0054 0.0169 542.77 0.1458 -0.0500 112.43
NP ROB(70%) 0.0188 0.0372 59.25 2.6649 -1.6032 21.27 0.0127 0.0539 231.32 0.2496 0.2195 65.66
ROB(95%) ROB(70%) 0.0172 0.0210 65.02 2.7344 -1.6295 20.72 0.0090 0.0231 324.66 0.1791 0.0337 91.50
ROB(70%) ROB(70%) 0.0176 0.0216 63.28 2.6896 -1.6165 21.07 0.0092 0.0203 319.67 0.1854 -0.0320 88.40
Table 7: Experiments 7 and 24: FDCM, aberrant value, ε1 = ε2 = 0.8%. ROB(70%)or ROB(95%) indicate that the tuning constant of the corresponding WMLE correspond torespectively 70% or 95% of relative efficiency. Experiments are described in Figure 1.
22

Clayton Gumbel-Hougaard
θ = 0.5 θ = 8 θ = 1.25 θ = 5
Stage 1 Stage 2 MSE Bias Efficiency MSE Bias Efficiency MSE Bias Efficiency MSE Bias Efficiency
MLE MLE 0.0102 0.0153 100.00 2.8824 -1.3964 100.00 0.0049 0.0220 100.00 0.1211 -0.0598 100.00
NP MLE 0.0160 0.0642 64.08 2.1581 -1.2287 133.56 0.0056 0.0310 88.04 0.1220 -0.0420 99.27
NP ROB(95%) 0.0145 0.0510 70.41 0.4362 0.0558 660.81 0.0057 0.0282 86.81 0.1330 -0.0383 91.09
ROB(95%) ROB(95%) 0.0111 0.0039 92.58 0.5376 0.2323 536.18 0.0050 0.0210 97.29 0.1356 -0.0683 89.31
ROB(70%) ROB(95%) 0.0110 -0.0042 93.42 0.6247 0.3413 461.37 0.0050 0.0160 98.47 0.1577 -0.1400 76.80
NP ROB(70%) 0.0164 0.0326 62.37 3.0186 -1.7112 95.49 0.0101 0.0382 48.77 0.1805 -0.0206 67.12
ROB(95%) ROB(70%) 0.0173 0.0115 59.08 2.7660 -1.6362 104.21 0.0088 0.0285 55.84 0.1760 -0.0375 68.82
ROB(70%) ROB(70%) 0.0171 0.0078 59.73 2.6226 -1.5920 109.90 0.0086 0.0230 57.35 0.1923 -0.0962 63.00
Table 8: Experiments 8 and 25: FDCM, mixture distribution, ε1 = ε2 = 0.8%. ROB(70%)or ROB(95%) indicate that the tuning constant of the corresponding WMLE correspond torespectively 70% or 95% of relative efficiency. Experiments are described in Figure 1.
Clayton Gumbel-Hougaard
θ = 0.5 θ = 8 θ = 1.25 θ = 5
Stage 1 Stage 2 MSE Bias Efficiency MSE Bias Efficiency MSE Bias Efficiency MSE Bias Efficiency
MLE MLE 0.0113 0.0049 100.00 0.5297 -0.1485 100.00 0.0042 0.0024 100.00 0.1219 -0.0122 100.00
NP MLE 0.0130 0.0258 86.75 0.5505 -0.2056 96.24 0.0046 0.0127 91.83 0.1249 -0.0360 97.56
NP ROB(95%) 0.0129 0.0181 87.14 0.5257 0.2095 100.76 0.0048 0.0088 87.96 0.1345 -0.0243 90.63
ROB(95%) ROB(95%) 0.0120 0.0007 94.25 0.5472 0.1983 96.80 0.0044 0.0009 95.30 0.1364 -0.0212 89.32
ROB(70%) ROB(95%) 0.0118 -0.0003 95.49 0.5745 0.2148 92.21 0.0047 -0.0013 89.41 0.1448 -0.0754 84.17
NP ROB(70%) 0.0170 0.0154 66.17 2.7415 -1.6245 19.32 0.0084 0.0151 50.11 0.1817 0.0044 67.05
ROB(95%) ROB(70%) 0.0163 0.0000 69.04 2.8019 -1.6460 18.91 0.0078 0.0049 53.46 0.1772 -0.0206 68.75
ROB(70%) ROB(70%) 0.0161 0.0002 69.85 2.7958 -1.6440 18.95 0.0080 0.0022 52.33 0.1848 -0.0685 65.95
Table 9: Experiments 9 and 26: FDCM, permutation, ε1 = ε2 = 0.8%. ROB(70%) orROB(95%) indicate that the tuning constant of the corresponding WMLE correspond to respec-tively 70% or 95% of relative efficiency. Experiments are described in Figure 1.
Clayton Gumbel-Hougaard
θ = 0.5 θ = 8 θ = 1.25 θ = 5
Stage 1 Stage 2 MSE Bias Efficiency MSE Bias Efficiency MSE Bias Efficiency MSE Bias Efficiency
MLE MLE 0.0213 -0.0984 100.00 21.4413 -4.5862 100.00 0.0127 -0.0972 100.00 8.6916 -2.9413 100.00
NP MLE 0.0198 -0.0853 107.44 21.0018 -4.5383 102.09 0.0100 -0.0790 126.94 7.9980 -2.8208 108.67
NP ROB(95%) 0.0188 -0.0822 112.84 1.6331 -1.1213 1312.91 0.0084 -0.0686 150.85 0.4134 0.3617 2102.25
ROB(95%) ROB(95%) 0.0206 -0.0560 103.36 3.9337 -1.7682 545.06 0.0123 -0.0900 103.65 0.4145 0.3286 2096.92
ROB(70%) ROB(95%) 0.0232 -0.0945 91.71 5.6512 -1.8673 379.41 0.0129 -0.0906 98.82 0.6200 0.0025 1401.80
NP ROB(70%) 0.0213 -0.0711 99.79 4.8907 -2.1836 438.41 0.0083 0.0010 153.74 0.8773 0.6671 990.75
ROB(95%) ROB(70%) 0.0231 -0.0406 92.22 6.6613 -2.5287 321.88 0.0175 0.0455 72.60 0.6160 0.4460 1410.99
ROB(70%) ROB(70%) 0.0232 -0.0744 91.83 48.3783 -1.4868 44.32 0.0066 -0.0205 193.75 0.7970 0.1419 1090.55
Table 10: Experiments 10 and 27: FICM, extreme value, ε1 = ε2 = 8%. ROB(70%) orROB(95%) indicate that the tuning constant of the corresponding WMLE correspond to respec-tively 70% or 95% of relative efficiency. Experiments are described in Figure 1.
23

Clayton Gumbel-Hougaard
θ = 0.5 θ = 8 θ = 1.25 θ = 5
Stage 1 Stage 2 MSE Bias Efficiency MSE Bias Efficiency MSE Bias Efficiency MSE Bias Efficiency
MLE MLE 0.0265 -0.1157 100.00 21.6897 -4.6071 100.00 0.0518 -0.2268 100.00 14.9729 -3.8686 100.00
NP MLE 0.0200 -0.0864 132.58 21.1480 -4.5545 102.56 0.0113 -0.0858 458.63 8.5063 -2.9109 176.02
NP ROB(95%) 0.0192 -0.0835 138.06 1.5460 -1.0793 1402.99 0.0083 -0.0667 625.72 0.5158 0.4372 2902.70
ROB(95%) ROB(95%) 0.0180 -0.0874 147.00 1.6615 -1.1115 1305.41 0.0173 -0.1185 298.51 0.1606 -0.0337 9321.40
ROB(70%) ROB(95%) 0.0174 -0.0850 152.37 1.7387 -1.1372 1247.43 0.0176 -0.1191 293.84 0.1769 -0.1056 8463.65
NP ROB(70%) 0.0214 -0.0707 123.53 4.8687 -2.1781 445.49 0.0096 0.0266 539.70 0.9518 0.6807 1573.10
ROB(95%) ROB(70%) 0.0188 -0.0706 140.57 5.0826 -2.2279 426.75 0.0106 0.0064 487.50 0.2050 -0.0142 7302.25
ROB(70%) ROB(70%) 0.0187 -0.0673 141.95 5.1685 -2.2446 419.65 0.0104 0.0043 497.34 0.2173 -0.0798 6891.19
Table 11: Experiments 11 and 28: FICM, aberrant value, ε1 = ε2 = 8%. ROB(70%)or ROB(95%) indicate that the tuning constant of the corresponding WMLE correspond torespectively 70% or 95% of relative efficiency. Experiments are described in Figure 1.
Clayton Gumbel-Hougaard
θ = 0.5 θ = 8 θ = 1.25 θ = 5
Stage 1 Stage 2 MSE Bias Efficiency MSE Bias Efficiency MSE Bias Efficiency MSE Bias Efficiency
MLE MLE 0.1014 -0.3078 100.00 51.8944 -7.1994 100.00 0.0077 -0.0675 100.00 6.6780 -2.5710 100.00
NP MLE 0.0628 -0.2314 161.42 47.0068 -6.8510 110.40 0.0068 -0.0582 113.61 5.8712 -2.4072 113.74
NP ROB(95%) 0.0482 -0.1963 210.44 0.7422 0.3847 6991.79 0.0069 -0.0549 112.92 0.5359 -0.6566 1246.11
ROB(95%) ROB(95%) 0.0758 -0.2584 133.80 2.2080 -0.9678 2350.31 0.0071 -0.0607 109.30 0.5550 -0.6699 1203.22
ROB(70%) ROB(95%) 0.0682 -0.2412 148.77 0.9305 0.3307 5577.25 0.0073 -0.0638 106.38 0.5063 -0.6362 1318.86
NP ROB(70%) 0.0276 -0.0957 366.93 2.9076 -1.6710 1784.81 0.0081 -0.0248 95.94 0.2522 -0.2609 2647.86
ROB(95%) ROB(70%) 0.0222 -0.0605 456.31 6.5979 -2.4783 786.53 0.0085 -0.0369 90.98 0.3141 -0.3523 2125.81
ROB(70%) ROB(70%) 0.0228 -0.0506 444.13 3.0791 -1.7030 1685.36 0.0088 -0.0345 87.84 0.2383 -0.2571 2802.39
Table 12: Experiments 12 and 29: FICM, mixture distribution, ε1 = ε2 = 8%. ROB(70%)or ROB(95%) indicate that the tuning constant of the corresponding WMLE correspond torespectively 70% or 95% of relative efficiency. Experiments are described in Figure 1.
Clayton Gumbel-Hougaard
θ = 0.5 θ = 8 θ = 1.25 θ = 5
Stage 1 Stage 2 MSE Bias Efficiency MSE Bias Efficiency MSE Bias Efficiency MSE Bias Efficiency
MLE MLE 0.0185 -0.0854 100.00 19.3218 -4.3373 100.00 0.0055 -0.0424 100.00 3.7263 -1.9008 100.00
NP MLE 0.0168 -0.0681 110.50 19.1325 -4.3188 100.99 0.0051 -0.0333 109.21 3.6683 -1.8859 101.58
NP ROB(95%) 0.0168 -0.0710 110.38 1.1717 -0.9052 1649.09 0.0056 -0.0344 98.24 0.4850 -0.6146 768.33
ROB(95%) ROB(95%) 0.0180 -0.0836 102.97 1.1581 -0.8913 1668.34 0.0058 -0.0406 95.66 0.4747 -0.6068 784.97
ROB(70%) ROB(95%) 0.0179 -0.0849 103.33 1.1440 -0.8753 1689.02 0.0061 -0.0416 90.73 0.5332 -0.6536 698.90
NP ROB(70%) 0.0196 -0.0644 94.72 4.4847 -2.0917 430.83 0.0088 -0.0237 63.22 0.2556 -0.2824 1458.14
ROB(95%) ROB(70%) 0.0212 -0.0767 87.31 4.5265 -2.1025 426.86 0.0085 -0.0306 65.04 0.2583 -0.2982 1442.47
ROB(70%) ROB(70%) 0.0210 -0.0764 88.06 4.4956 -2.0953 429.79 0.0087 -0.0319 63.57 0.2928 -0.3485 1272.84
Table 13: Experiments 13 and 30: FICM, permutation, ε1 = ε2 = 8%. ROB(70%) orROB(95%) indicate that the tuning constant of the corresponding WMLE correspond to respec-tively 70% or 95% of relative efficiency. Experiments are described in Figure 1.
24

Clayton Gumbel-Hougaard
θ = 0.5 θ = 8 θ = 1.25 θ = 5
Stage 1 Stage 2 MSE Bias Efficiency MSE Bias Efficiency MSE Bias Efficiency MSE Bias Efficiency
MLE MLE 0.0464 0.1666 100.00 0.5290 0.1338 100.00 0.1322 0.3461 100.00 1.8469 1.2580 100.00
NP MLE 0.0503 0.1792 92.29 0.6575 0.2578 80.45 0.1289 0.3414 102.59 1.7449 1.1859 105.85
NP ROB(95%) 0.0556 0.1912 83.47 1.0792 0.7185 49.02 0.1334 0.3457 99.10 2.3700 1.4209 77.93
ROB(95%) ROB(95%) 0.1101 0.2614 42.16 1.0461 -0.0860 50.57 0.1567 0.3712 84.39 1.2165 0.6526 151.83
ROB(70%) ROB(95%) 0.0382 0.1416 121.55 4.9482 -0.2571 10.69 0.0510 0.1949 259.48 1.6563 0.5958 111.51
NP ROB(70%) 0.0884 0.2503 52.53 2.4609 -1.5364 21.50 0.1640 0.3757 80.64 3.0237 1.6105 61.08
ROB(95%) ROB(70%) 0.1652 0.3404 28.11 3.6850 -1.8656 14.35 0.1796 0.3865 73.62 1.2873 0.6477 143.48
ROB(70%) ROB(70%) 0.0658 0.2076 70.53 5.6399 -2.0325 9.38 0.0523 0.1796 252.71 1.6097 0.6839 114.74
Table 14: Experiments 14 and 31: FDCM, extreme value, ε1 = ε2 = 8%. ROB(70%)or ROB(95%) indicate that the tuning constant of the corresponding WMLE correspond torespectively 70% or 95% of relative efficiency. Experiments are described in Figure 1.
Clayton Gumbel-Hougaard
θ = 0.5 θ = 8 θ = 1.25 θ = 5
Stage 1 Stage 2 MSE Bias Efficiency MSE Bias Efficiency MSE Bias Efficiency MSE Bias Efficiency
MLE MLE 0.1163 0.2784 100.00 4.1824 1.8384 100.00 0.8030 0.8726 100.00 1.9899 1.3049 100.00
NP MLE 0.0529 0.1856 219.87 0.7527 0.3641 555.68 0.1793 0.4051 447.96 2.3880 1.4303 83.33
NP ROB(95%) 0.0585 0.1979 198.68 1.2930 0.8368 323.47 0.1719 0.3939 467.25 2.6576 1.5141 74.88
ROB(95%) ROB(95%) 0.0435 0.1612 267.61 1.2472 0.8028 335.35 0.0409 0.1846 1962.47 0.3294 0.3804 604.08
ROB(70%) ROB(95%) 0.0438 0.1631 265.32 1.3032 0.8022 320.92 0.0403 0.1819 1992.09 0.6864 0.3649 289.92
NP ROB(70%) 0.0945 0.2610 123.06 2.3570 -1.5065 177.45 0.1874 0.4048 428.49 3.4073 1.7210 58.40
ROB(95%) ROB(70%) 0.0770 0.2290 151.09 2.5237 -1.5741 165.72 0.0667 0.2261 1203.32 0.5054 0.5141 393.74
ROB(70%) ROB(70%) 0.0771 0.2293 150.80 2.5595 -1.5826 163.41 0.0665 0.2240 1208.35 0.4799 0.4752 414.69
Table 15: Experiments 15 and 32: FDCM, aberrant value, ε1 = ε2 = 8%. ROB(70%)or ROB(95%) indicate that the tuning constant of the corresponding WMLE correspond torespectively 70% or 95% of relative efficiency. Experiments are described in Figure 1.
Clayton Gumbel-Hougaard
θ = 0.5 θ = 8 θ = 1.25 θ = 5
Stage 1 Stage 2 MSE Bias Efficiency MSE Bias Efficiency MSE Bias Efficiency MSE Bias Efficiency
MLE MLE 0.0597 0.2208 100.00 29.3686 -5.4069 100.00 0.0436 0.1885 100.00 0.2985 -0.4784 100.00
NP MLE 0.1366 0.3498 43.70 17.5514 -4.1599 167.33 0.0334 0.1619 130.32 0.1053 -0.0973 283.58
NP ROB(95%) 0.1448 0.3579 41.21 0.5734 0.4277 5122.15 0.0372 0.1720 117.18 0.1217 -0.0971 245.25
ROB(95%) ROB(95%) 0.0295 0.1400 202.10 0.9640 -0.8291 3046.43 0.0454 0.1936 95.92 0.4040 -0.5653 73.89
ROB(70%) ROB(95%) 0.0091 0.0321 657.31 0.8087 0.6033 3631.42 0.0294 0.1522 148.34 0.5083 -0.6425 58.72
NP ROB(70%) 0.1692 0.3757 35.28 2.6669 -1.6144 1101.24 0.0646 0.2274 67.44 0.1699 -0.0487 175.67
ROB(95%) ROB(70%) 0.0142 0.0544 420.58 5.7529 -2.3759 510.50 0.0613 0.2224 71.09 0.5615 -0.6559 53.16
ROB(70%) ROB(70%) 0.0140 -0.0408 427.68 2.6073 -1.5924 1126.39 0.0425 0.1791 102.47 0.4607 -0.5515 64.79
Table 16: Experiments 16 and 33: FDCM, mixture distribution, ε1 = ε2 = 8%. ROB(70%)or ROB(95%) indicate that the tuning constant of the corresponding WMLE correspond torespectively 70% or 95% of relative efficiency. Experiments are described in Figure 1.
25

Clayton Gumbel-Hougaard
θ = 0.5 θ = 8 θ = 1.25 θ = 5
Stage 1 Stage 2 MSE Bias Efficiency MSE Bias Efficiency MSE Bias Efficiency MSE Bias Efficiency
MLE MLE 0.0113 0.0049 100.00 0.5297 -0.1485 100.00 0.0042 0.0024 100.00 0.1219 -0.0122 100.00
NP MLE 0.0130 0.0258 86.75 0.5505 -0.2056 96.24 0.0046 0.0127 91.83 0.1249 -0.0360 97.56
NP ROB(95%) 0.0129 0.0181 87.16 0.5257 0.2095 100.76 0.0048 0.0088 87.96 0.1345 -0.0243 90.63
ROB(95%) ROB(95%) 0.0121 0.0002 93.20 0.5472 0.1983 96.80 0.0044 0.0009 95.30 0.1364 -0.0212 89.32
ROB(70%) ROB(95%) 0.0117 0.0003 96.12 0.5745 0.2148 92.21 0.0047 -0.0013 89.41 0.1448 -0.0754 84.17
NP ROB(70%) 0.0170 0.0155 66.21 2.7193 -1.6190 19.48 0.0084 0.0151 50.11 0.1817 0.0044 67.05
ROB(95%) ROB(70%) 0.0162 0.0000 69.38 2.7795 -1.6403 19.06 0.0078 0.0049 53.46 0.1772 -0.0206 68.75
ROB(70%) ROB(70%) 0.0162 0.0002 69.47 2.8228 -1.6510 18.77 0.0080 0.0022 52.33 0.1848 -0.0685 65.95
Table 17: Experiments 17 and 34: FDCM, permutation, ε1 = ε2 = 8%. ROB(70%) orROB(95%) indicate that the tuning constant of the corresponding WMLE correspond to respec-tively 70% or 95% of relative efficiency. Experiments are described in Figure 1.
26