voltammetry at spatially heterogeneous electrodes
TRANSCRIPT

REVIEW
Trevor J. Davies Æ Craig E. Banks Æ Richard G. Compton
Voltammetry at spatially heterogeneous electrodes
Received: 19 April 2005 / Accepted: 25 April 2005 / Published online: 1 June 2005� Springer-Verlag 2005
Abstract Recent advances are overviewed which enablesimulation of the voltammetric behaviour of surfaceswhich respond in an electrochemically spatially hetero-geneous fashion. By use of the concept of a ‘‘diffusiondomain’’ computationally expensive three-dimensionalsimulations may be reduced to tractable two-dimen-sional equivalents. In this way the electrochemical re-sponse of partially blocked electrodes andmicroelectrode arrays may be predicted, and are foundto be consistent with experimental data. It is, further-more, possible to adapt the ‘‘blocked’’ electrode analysisto enable the voltammetric sizing of inert particlespresent on an electrode surface. Finally theory of thistype predicts the voltammetric behaviour of electro-chemically heterogeneous electrodes—for examplecomposites whose different spatial zones display con-trasting electrochemical behaviour toward the same re-dox couple.
Keywords Heterogeneous electrodes Æ Cyclicvoltammetry Æ Diffusion domain approximation ÆMicroelectrode arrays Æ Partially blocked electrodes
Introduction
Electrodes which are spatially heterogeneous in theelectrochemical sense embrace porous electrodes, par-tially blocked electrodes, microelectrode arrays, elec-trodes made of composite materials, and some modifiedelectrodes [1, 2, 3, 4]. The simulation of electrode re-sponses at such surfaces is challenging both because of
the surface variation and because of the often randomdistribution of the zones of different electrode activity.
Recent simulation advances suggest that the use ofthe diffusion domain approach enables reduction ofthese complex three-dimensional problems to a readilytractable two-dimensional form which gives results inexcellent agreement with experiment. The purposes ofthis paper are to overview these advances and illustratethe progress made.
Partially blocked electrodes
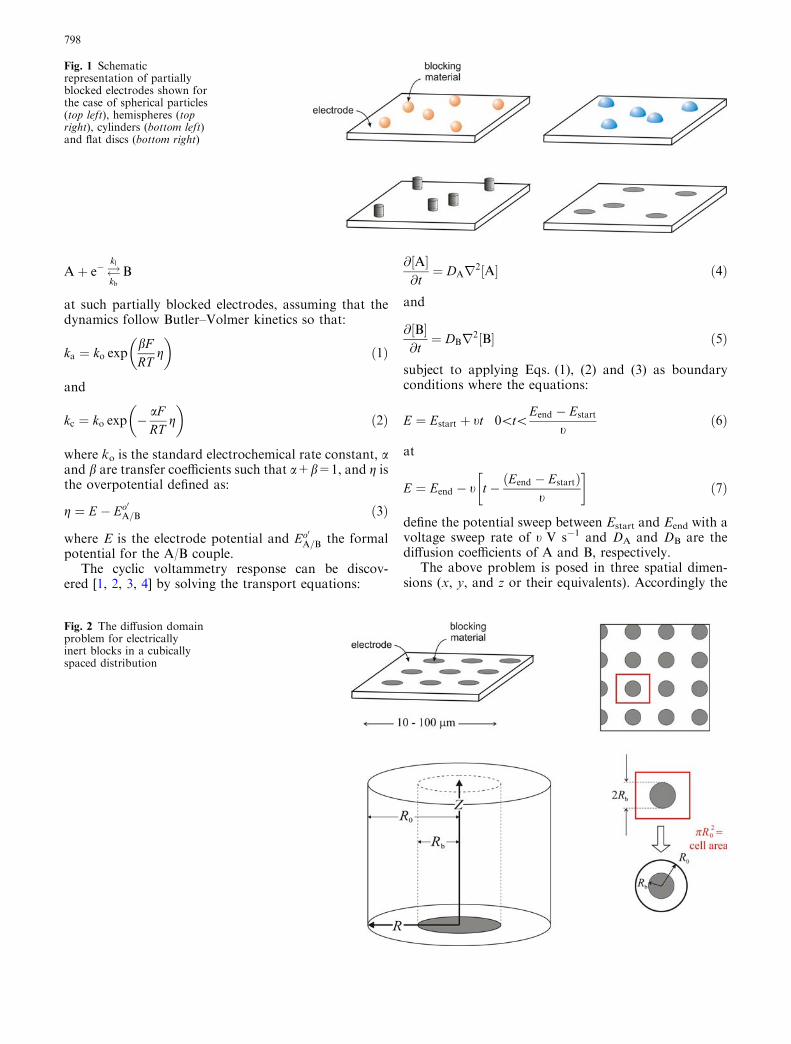
Figure 1 illustrates the concept of a partially blockedelectrode. It shows four macro electrodes partially cov-ered with particles of material distinct from that of theunderlying electrode material. In the following discus-sion these particles are first assumed to be inert, so thatthey partially block the electrode towards electrolyticreactions. Subsequently they take the form of eitherelectro-active particles on an inert substrate, as in amicrodisc array or a nano-particle-modified electrode.As Fig. 1 implies, the particles, be they inert or electro-active, may take a variety of possible shapes. We haveidentified the voltammetric conditions under which thisneeds to be addressed in the modelling [3]; except whereexplicitly stated, the flat disc approximation was adop-ted (Fig. 1)
The diffusion domain approximation and partially blockedelectrodes
Figure 2 shows an array of electrically inert blockssupported on a flat electrochemically active substrate.The blocks are disc spaced and arranged in a cubicdistribution. Subtly, Fig. 3 shows a similar array exceptthat the blocks are now randomly distributed over theelectrode surface. It is interesting to consider thevoltammetric behaviour of the simple process
T. J. Davies Æ C. E. Banks Æ R. G. Compton (&)Physical and Theoretical Chemistry Laboratory,University of Oxford, South Parks Road,Oxford, OX1 3QX, UKE-mail: [email protected].: +44-1865-275413Fax: +44-1865-275410
J Solid State Electrochem (2005) 9: 797–808DOI 10.1007/s10008-005-0699-x
Aþ e��kl
kbB
at such partially blocked electrodes, assuming that thedynamics follow Butler–Volmer kinetics so that:
ka ¼ ko expbFRT
g
� �ð1Þ
and
kc ¼ ko exp �aFRT
g
� �ð2Þ
where ko is the standard electrochemical rate constant, aand b are transfer coefficients such that a+b=1, and g isthe overpotential defined as:
g ¼ E � Eo0A=B ð3Þ
where E is the electrode potential and Eo0A=B the formal
potential for the A/B couple.The cyclic voltammetry response can be discov-
ered [1, 2, 3, 4] by solving the transport equations:
@ A½ �@t¼ DAr2 A½ � ð4Þ
and
@ B½ �@t¼ DBr2 B½ � ð5Þ
subject to applying Eqs. (1), (2) and (3) as boundaryconditions where the equations:
E ¼ Estart þ tt 0\t\Eend � Estart
tð6Þ
at
E ¼ Eend � t t � Eend � Estartð Þt
� �ð7Þ
define the potential sweep between Estart and Eend with avoltage sweep rate of t V s�1 and DA and DB are thediffusion coefficients of A and B, respectively.
The above problem is posed in three spatial dimen-sions (x, y, and z or their equivalents). Accordingly the
Fig. 2 The diffusion domainproblem for electricallyinert blocks in a cubicallyspaced distribution
Fig. 1 Schematicrepresentation of partiallyblocked electrodes shown forthe case of spherical particles(top left), hemispheres (topright), cylinders (bottom left)and flat discs (bottom right)
798
solution for regularly distributed blocks is computa-tionally expensive and that for the random distributionis essentially intractable. Accordingly we introduce thediffusion domain approximation.
Figures 2 and 3 illustrate the diffusion domainapproximation for cubic and random arrays respec-tively. In Fig. 2 it can be seen that the electrode surfaceis first split into unit square cells each of the same area.The diffusion domain approximation involves replacingthis by a circular domain to equal total area. Thus if theradius of the circular domain is R0, then:
p2 ¼ pR2o
where p is the centre-to-centre distance between adjacentblocks or, equally, the length of the side of the squareunit cell. Accordingly:
Ro ¼ 0:564p
similarly, for a hexagonal area of blocks,
Ro ¼ 0:5258p
Having made this approximation the diffusionequations, Eqs. (4) and (5), are solved within the cylin-drical unit shown in Fig. 2 where Z is the directionnormal to the electrode surface and R is the radialcoordinate with R0 defining the radius of the cylinderand Rb the size of the block. Within this approximationEqs. (4) and (5) become:
@ A½ �@t¼ DA
@2 A½ �@r2
þ DA
r@ A½ �@rþ DA
@2 A½ �@z2
ð8Þ
and
@ B½ �@t¼ DB
@2 B½ �@r2
þ DB
r@ B½ �@rþ DB
@2 B½ �@z2
ð9Þ
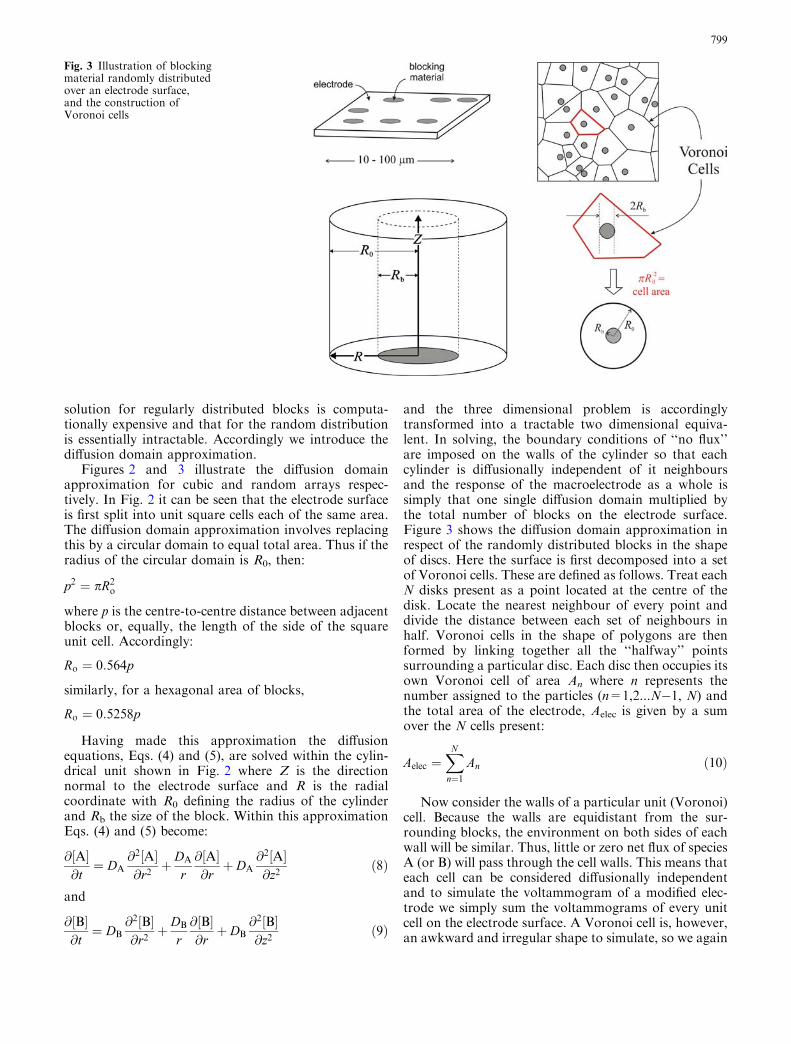
and the three dimensional problem is accordinglytransformed into a tractable two dimensional equiva-lent. In solving, the boundary conditions of ‘‘no flux’’are imposed on the walls of the cylinder so that eachcylinder is diffusionally independent of it neighboursand the response of the macroelectrode as a whole issimply that one single diffusion domain multiplied bythe total number of blocks on the electrode surface.Figure 3 shows the diffusion domain approximation inrespect of the randomly distributed blocks in the shapeof discs. Here the surface is first decomposed into a setof Voronoi cells. These are defined as follows. Treat eachN disks present as a point located at the centre of thedisk. Locate the nearest neighbour of every point anddivide the distance between each set of neighbours inhalf. Voronoi cells in the shape of polygons are thenformed by linking together all the ‘‘halfway’’ pointssurrounding a particular disc. Each disc then occupies itsown Voronoi cell of area An where n represents thenumber assigned to the particles (n=1,2...N�1, N) andthe total area of the electrode, Aelec is given by a sumover the N cells present:
Aelec ¼XN
n¼1An ð10Þ
Now consider the walls of a particular unit (Voronoi)cell. Because the walls are equidistant from the sur-rounding blocks, the environment on both sides of eachwall will be similar. Thus, little or zero net flux of speciesA (or B) will pass through the cell walls. This means thateach cell can be considered diffusionally independentand to simulate the voltammogram of a modified elec-trode we simply sum the voltammograms of every unitcell on the electrode surface. A Voronoi cell is, however,an awkward and irregular shape to simulate, so we again
Fig. 3 Illustration of blockingmaterial randomly distributedover an electrode surface,and the construction ofVoronoi cells
799

make use of the diffusion domain approximation: weapproximate the base of each Voronoi cell as a circle ofthe same area containing the same block (Fig. 3). Asillustrated in Fig. 3, this results in a cylindrical unit cell(a diffusion domain) with radius R0, which is mucheasier to simulate. An important property of diffusiondomains is the microscopic coverage, h, given byEq. (11):
h ¼ pR2b
pR20
¼ Rb
R0
� �2
ð11Þ
where h is the block coverage [1, 2, 3, 4].Simulation of the cyclic voltammetry problem for the
random distributed partially blocked electrode then in-volves solving Eqs. (8) and (9) as above but for a rangeof R0 values. In the case of randomly distributed blocksthe nearest neighbours show a Poisson distribution:
P Roð Þ ¼2pRoN
Aelecexp
�pR2oN
Aelec
� �ð12Þ
where the probability of finding domains of radius R0 isgiven by P(R0) and the probability of finding domains ofradius R0+d R0 is given by P(R0)d R0 . The cyclic vol-tammograms calculated for different R0 must beweighted accordingly to produce the final voltammo-gram; Fig. 4 shows the procedure.
The results of the simulation can be illustrated withreference to the following ‘‘thought experiment’’. Weconsider a naked macroelectrode, say of dimension4 mm · 4 mm, and explore the cyclic voltammetric re-sponse resulting from an A/B couple with ‘‘typical’’aqueous solution properties a=0.5, ko=10�2 cm s�1
and DA=DB=10�5 cm2 s�1. We assume a voltage scanrate of t=0.01 V s�1. The expected voltammogram isshown in Fig. 5 for a completely unblocked electrode.
We next pose the question: what does the voltammo-gram look like if the electrode is 50% blocked? In par-ticular we consider the responses when the blocks are ofdifferent size but in each case the total block coverage ish=0.5. Figure 5 illustrates these three results—firstwhen the electrode has a single macro-block ofR0=0.18 cm ( p·0.182=0.5·0.4·0.4), second when theelectrode is covered with 50 lm radius blocks spread200 lm apart in a cubic array, and third when theelectrode is half covered with 1 lm radius blocks. Thedifferent cyclic voltammetric responses are shown inFig. 5. It can be seen that the single macro-block(R0=0.18 cm) produces a voltammetric response that isclose to giving just one half the current of the unblockedelectrode. In contrast the effect of blocking the electrodewith many 1 lm blocks is tiny; the voltammogram isonly slightly reduced in magnitude in comparison withthe unblocked electrode. The voltammetry seen with theelectrode blocked by 50 lm lies intermediate betweenthe unblocked and the macroscopically blocked case.
The reason for the contrasting behaviour can beseen from the consideration of the concentration pro-files of A with the different diffusion domain of thethree examples. These are shown in Fig. 6. For thesingle block there is ‘‘linear’’ diffusion to the active partof the electrode whilst the concentration of A remainsclose to its bulk value over the zone of the block. Forthe 50-lm blocks the ‘‘linear’’ diffusion to the activeelectrode is augmented by significant radial diffusionthat is sufficient to reduce, but not exhaust, the amountof A in the block zone. Finally for the 1-lm blocks theradial diffusion is enough to enable the near completeelectrolysis of all A arriving at the electrode so that thepartially blocked electrode behaves almost like an un-blocked electrode even though 50% of its surface is notactive!
Fig. 4 Illustration of the stepsinvolved in the simulation ofcyclic voltammograms for arandom ensemble of diffusiondomains
800

It is clear that the voltammograms in Fig. 5 cover arange of voltammetric behaviour for a heterogeneouselectrode part of which is active and part inert. In factfour categories of response can be defined and these areillustrated in Fig. 7. We next discuss each category inturn.
Case 1
In this limit both the blocked and unblocked surface aremacroscopically ‘‘large’’. Accordingly the unblockedelectrode experiences linear diffusion, as at an ordinaryelectrode of the same active dimension, whilst the con-centration of the electro-active species in the vicinity ofthe block is essentially unchanged from that of the bulksolution. In this limit the voltammogram observed issimply the same as that measured for an unblocked
electrode of the same size except that the current scale isreduced by the factor (1�h).
Case 2
In this case the size of the electro-active zones are ‘‘mi-cro’’ in size but are separated with sufficiently large inertblocking material such that the electrode as a wholebehaves as a collection of isolated microelectrodes, eachof which experiences convergent diffusion (radial andaxial) as illustrated in Fig. 7.
Case 3
In this situation the electro-active parts of the macro-electrode behave with ‘‘microelectrode’’ character; their
Fig. 5 The expectedvoltammetric responses fordifferent sized blocks eachcorresponding to a totalcoverage of h=0.5
Fig. 6 Concentration profilesof A within different diffusiondomains
801
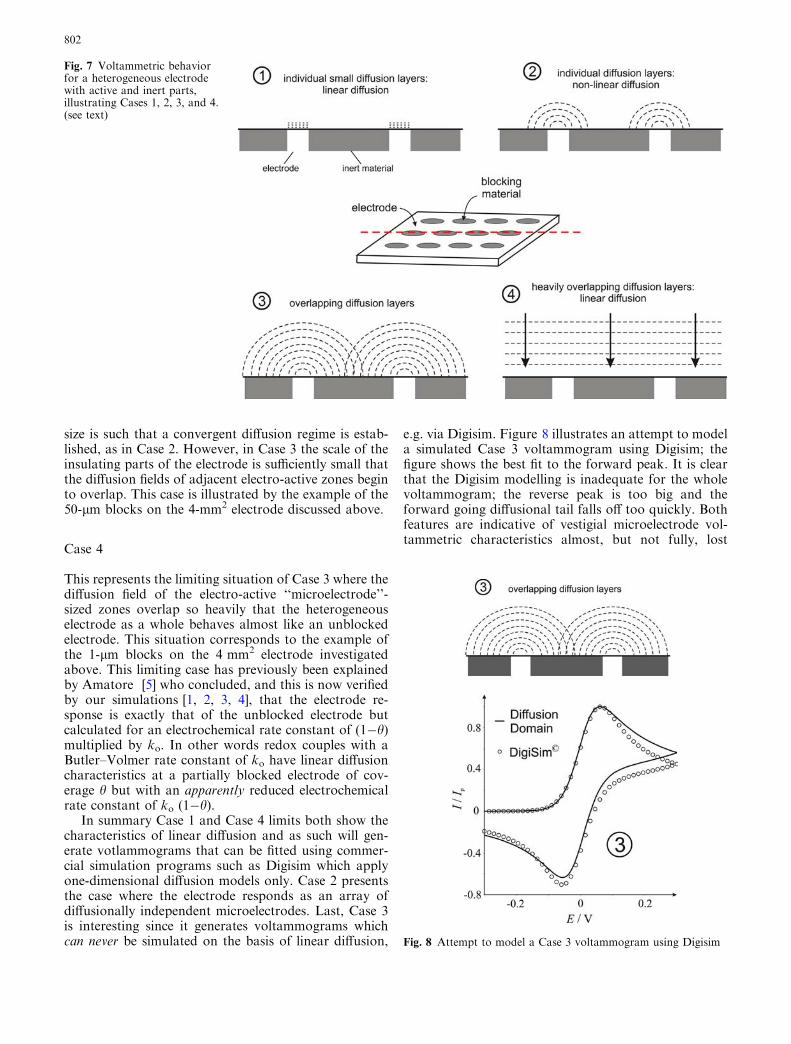
size is such that a convergent diffusion regime is estab-lished, as in Case 2. However, in Case 3 the scale of theinsulating parts of the electrode is sufficiently small thatthe diffusion fields of adjacent electro-active zones beginto overlap. This case is illustrated by the example of the50-lm blocks on the 4-mm2 electrode discussed above.
Case 4
This represents the limiting situation of Case 3 where thediffusion field of the electro-active ‘‘microelectrode’’-sized zones overlap so heavily that the heterogeneouselectrode as a whole behaves almost like an unblockedelectrode. This situation corresponds to the example ofthe 1-lm blocks on the 4 mm2 electrode investigatedabove. This limiting case has previously been explainedby Amatore [5] who concluded, and this is now verifiedby our simulations [1, 2, 3, 4], that the electrode re-sponse is exactly that of the unblocked electrode butcalculated for an electrochemical rate constant of (1�h)multiplied by ko. In other words redox couples with aButler–Volmer rate constant of ko have linear diffusioncharacteristics at a partially blocked electrode of cov-erage h but with an apparently reduced electrochemicalrate constant of ko (1�h).
In summary Case 1 and Case 4 limits both show thecharacteristics of linear diffusion and as such will gen-erate votlammograms that can be fitted using commer-cial simulation programs such as Digisim which applyone-dimensional diffusion models only. Case 2 presentsthe case where the electrode responds as an array ofdiffusionally independent microelectrodes. Last, Case 3is interesting since it generates voltammograms whichcan never be simulated on the basis of linear diffusion,
e.g. via Digisim. Figure 8 illustrates an attempt to modela simulated Case 3 voltammogram using Digisim; thefigure shows the best fit to the forward peak. It is clearthat the Digisim modelling is inadequate for the wholevoltammogram; the reverse peak is too big and theforward going diffusional tail falls off too quickly. Bothfeatures are indicative of vestigial microelectrode vol-tammetric characteristics almost, but not fully, lost
Fig. 7 Voltammetric behaviorfor a heterogeneous electrodewith active and inert parts,illustrating Cases 1, 2, 3, and 4.(see text)
Fig. 8 Attempt to model a Case 3 voltammogram using Digisim
802

through the overlapping of adjacent microelectrodediffusional fields.
How big is ‘‘big’’ and how small is ‘‘small’’? The Einsteinequation provides the answer
In our above analysis of partially blocked electrodes thedifference between macroelectrodes and microelectrodes,between ‘‘big’’ and ‘‘small’’, was critical. How can we tellwhether the dimensions of the electro-active or inertzones of heterogeneous electrodes fall into one categoryor another (Cases 1, 2, 3 or 4)? Without recourse tosimulation we can answer we such question using theEinstein equation [6].
The Einstein equation indicates that the approximatedistance, d, diffused by a species with a diffusion coeffi-cient, D, in a time, t, is:
d ¼ffiffiffiffiffiffiffiffi2Dtp
ð13Þ
In considering the cyclic voltammetry problem abovewe can estimate the appropriate value of t, by consid-ering the appropriate potential ‘‘width’’ of the voltam-mogram, DE so that:
d ¼ffiffiffiffiffiffiffiffiffiffiffiffiffi2D
DEt
rð14Þ
for a typical nearly ‘‘reversible’’ voltammogram a DE ofthe order 0.1 to 0.15 V, as illustrated in Fig. 9.Accordingly if we return to the concentration profilesreported in Fig. 6, using the parameters adapted in thesimulations and a value of DE of 0.15 V we can estimatethat:
d � 55 lm
It can be seen that this approximately corresponds tothe thickness of the diffusion layer associated with thelinear diffusion part of the macroelectrode partiallyblocked with the single 0.18 cm ‘‘macro block’’ in Fig. 6(Case 1) and to that in the heavily overlapping diffusioncase for the 1-lm blocks (Case 4). On the other hand,this value of d roughly corresponds to the size of theblocks in the case they were assumed to be of 50 lmradius. Accordingly in this last case Fig. 6 shows sig-nificant diffusional depletion over the block in this case.It follows that simply using Eq. (14) to estimate thediffusional distance, and noting that this is comparablewith the block size, immediately indicates that cyclicvoltammetry conducted at 0.1 V s�1 (as used to generateFig. 6) will fall into Class 3. As such it will not beaccurately modelled by assuming linear diffusion (as, forexample, via Digisim).
In conclusion, use of Eq. (14) permits the determi-nation of Classes 1, 2, 3 and 4 for partially blockedelectrodes; the Einstein equation generates values of dwhich ‘‘benchmark’’ whether the electrodes and blocksare ‘‘big’’ or ‘‘small’’ compared with diffusion layerthicknesses.
Partially blocked electrodes: results
To test the theory above we lithographically constructedpartially blocked electrodes comprising macroelectrodespartially covered with inert discs of a fixed size arrangedin either a cubic or hexagonal array [1, 2]. Electrodeswith different coverage and different radii were con-structed with gold as the electrode material. The oxi-dation of 1,4-N,N,N¢,N¢-tetramethylphenylenediamine(TMPD) in acetonitrile was studied as a function ofvoltage scan rate with the peak current measured.Excellent agreement between theory and experiment wasnoted [1, 2].
Next, partially blocked electrodes with random arraysof disc-shaped blocks were fabricated [2]; Fig. 10 showsa typical electrode. Again variable scan rate voltamme-try with the TMPD–acetonitrile system was examined toverify the diffusion domain theory. Figure 11 shows themeasured peak current as a function of the square rootof the voltage scan rate, t. The solid line shows the ex-pected behaviour for an unblocked electrode; the pointsshow excellent agreement between theory and experi-ment for the two different coverages (h) of 0.1 and 0.5.
The above experiments serve to validate the diffusiondomain approximation both in the context of regularlyand randomly heterogeneous electrodes. We havetherefore applied this approach more generally in avariety of contexts which we now briefly address.
Electrochemical particle sizing
Implicit in the discussion above is the notion that vol-tammetric measurements made on partially blockedFig. 9 The potential ‘‘width’’ of a voltammogram
803

electrode can give us information about the coverage orsize of the material on the surface of an electrode. Thatis to say, that in principle, voltammetry has the capa-bility for particle sizing [7].
To illustrate proof-of-concept we modified an edge-plane pyrolytic graphite electrode with known masses,mblock, of monodisperse (approximately spherical) par-ticles of alumina of diameter 1 lm using the procedureoutlined in Fig. 12. The aqueous ferricyanide/ferrocya-nide redox couple was used for voltammetric measure-ments with these modified (blocked) electrodes and withthe corresponding unblocked electrodes. Typical dataare shown in Fig. 13; the effect of an increased mass ofalumina particles on the electrode surface was to reducethe peak currents while slightly increasing the peak-to-peak voltage separation. The data were modelledassuming blocking by monodisperse inert spheres ofradius Rb. For a given radius the number of blockingparticle was calculated as:
Nblock ¼3mblock
4qpR3b
ð15Þ
where q is the density of the alumina. Figure 14 shows acomparison of experiment and theory generated fordifferent values of Rb. Almost perfect fit is seen for
Fig. 11 The measured peakcurrent as a function of thesquare root of the voltage scanrate, t, using the experimentalsystem of TMPD in acetonitrileto verify the diffusion domaintheory
Fig. 10 A lithographically fabricated partially blocked electrodewith random arrays of discs on the surface
804
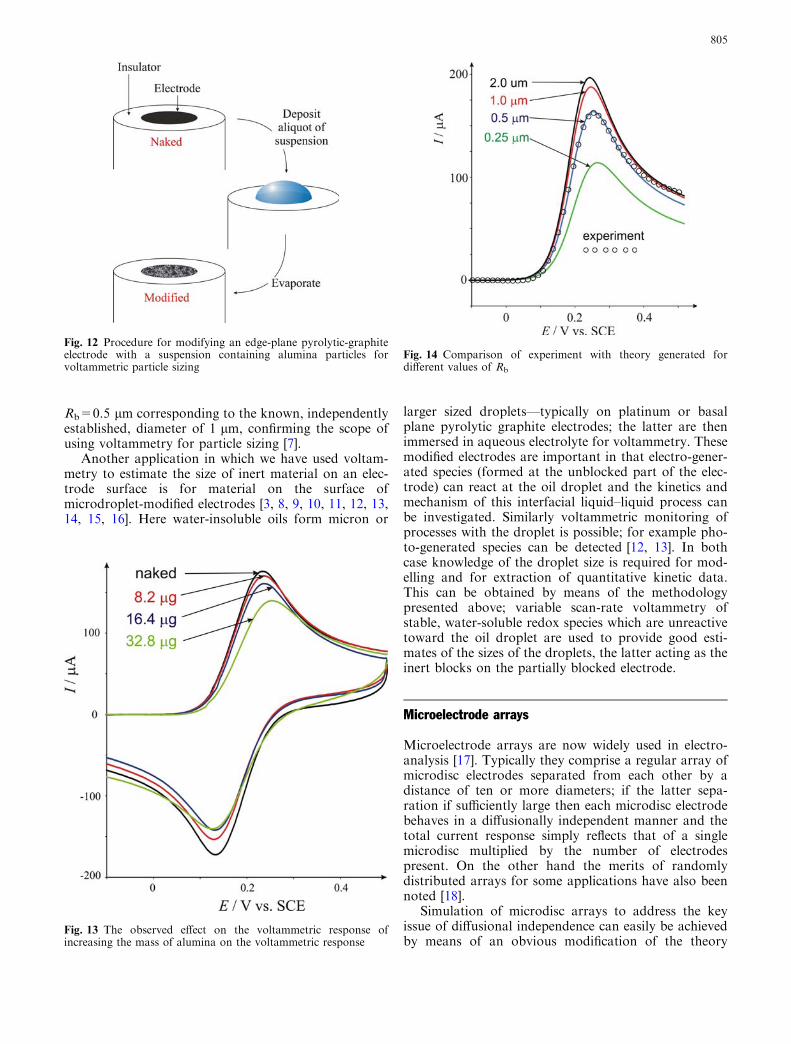
Rb=0.5 lm corresponding to the known, independentlyestablished, diameter of 1 lm, confirming the scope ofusing voltammetry for particle sizing [7].
Another application in which we have used voltam-metry to estimate the size of inert material on an elec-trode surface is for material on the surface ofmicrodroplet-modified electrodes [3, 8, 9, 10, 11, 12, 13,14, 15, 16]. Here water-insoluble oils form micron or
larger sized droplets—typically on platinum or basalplane pyrolytic graphite electrodes; the latter are thenimmersed in aqueous electrolyte for voltammetry. Thesemodified electrodes are important in that electro-gener-ated species (formed at the unblocked part of the elec-trode) can react at the oil droplet and the kinetics andmechanism of this interfacial liquid–liquid process canbe investigated. Similarly voltammetric monitoring ofprocesses with the droplet is possible; for example pho-to-generated species can be detected [12, 13]. In bothcase knowledge of the droplet size is required for mod-elling and for extraction of quantitative kinetic data.This can be obtained by means of the methodologypresented above; variable scan-rate voltammetry ofstable, water-soluble redox species which are unreactivetoward the oil droplet are used to provide good esti-mates of the sizes of the droplets, the latter acting as theinert blocks on the partially blocked electrode.
Microelectrode arrays
Microelectrode arrays are now widely used in electro-analysis [17]. Typically they comprise a regular array ofmicrodisc electrodes separated from each other by adistance of ten or more diameters; if the latter sepa-ration if sufficiently large then each microdisc electrodebehaves in a diffusionally independent manner and thetotal current response simply reflects that of a singlemicrodisc multiplied by the number of electrodespresent. On the other hand the merits of randomlydistributed arrays for some applications have also beennoted [18].
Simulation of microdisc arrays to address the keyissue of diffusional independence can easily be achievedby means of an obvious modification of the theory
Fig. 13 The observed effect on the voltammetric response ofincreasing the mass of alumina on the voltammetric response
Fig. 14 Comparison of experiment with theory generated fordifferent values of Rb
Fig. 12 Procedure for modifying an edge-plane pyrolytic-graphiteelectrode with a suspension containing alumina particles forvoltammetric particle sizing
805
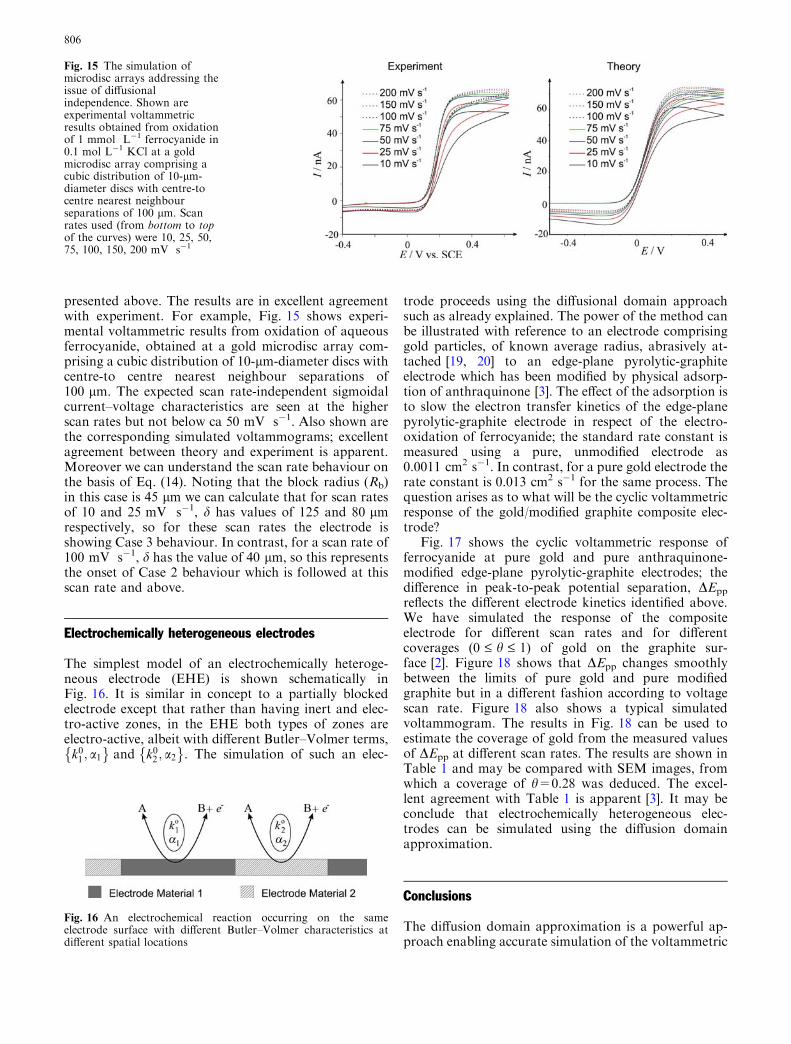
presented above. The results are in excellent agreementwith experiment. For example, Fig. 15 shows experi-mental voltammetric results from oxidation of aqueousferrocyanide, obtained at a gold microdisc array com-prising a cubic distribution of 10-lm-diameter discs withcentre-to centre nearest neighbour separations of100 lm. The expected scan rate-independent sigmoidalcurrent–voltage characteristics are seen at the higherscan rates but not below ca 50 mV s�1. Also shown arethe corresponding simulated voltammograms; excellentagreement between theory and experiment is apparent.Moreover we can understand the scan rate behaviour onthe basis of Eq. (14). Noting that the block radius (Rb)in this case is 45 lm we can calculate that for scan ratesof 10 and 25 mV s�1, d has values of 125 and 80 lmrespectively, so for these scan rates the electrode isshowing Case 3 behaviour. In contrast, for a scan rate of100 mV s�1, d has the value of 40 lm, so this representsthe onset of Case 2 behaviour which is followed at thisscan rate and above.
Electrochemically heterogeneous electrodes
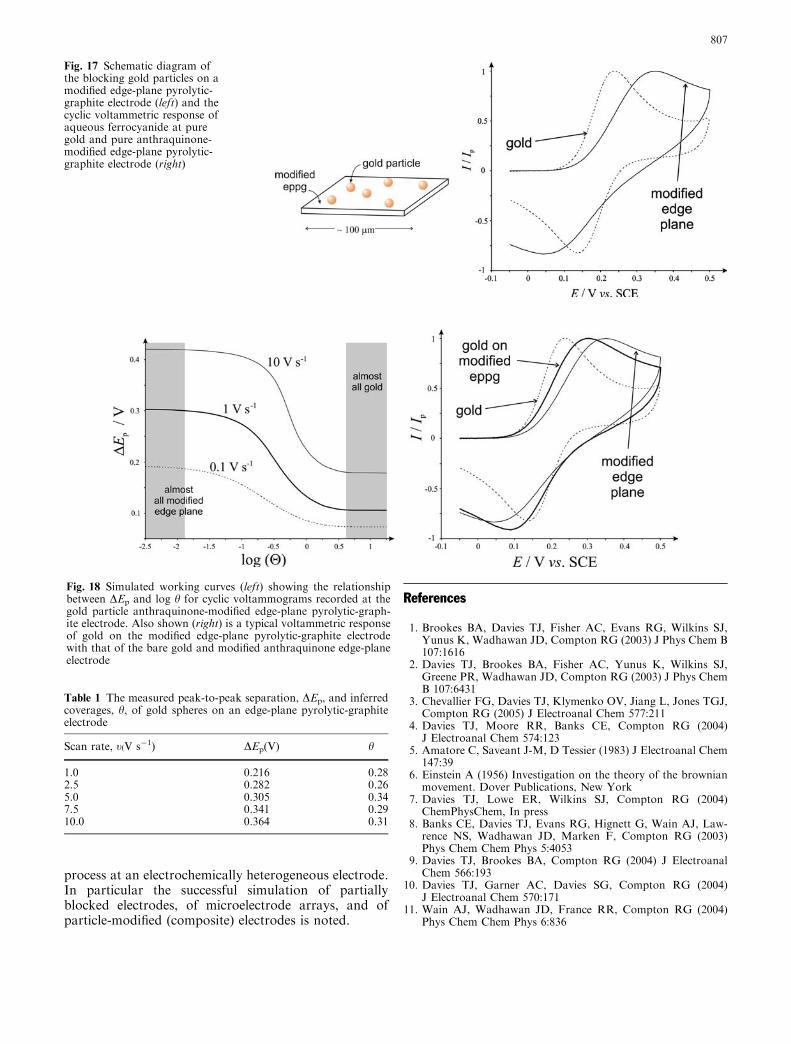
The simplest model of an electrochemically heteroge-neous electrode (EHE) is shown schematically inFig. 16. It is similar in concept to a partially blockedelectrode except that rather than having inert and elec-tro-active zones, in the EHE both types of zones areelectro-active, albeit with different Butler–Volmer terms,
k01 ; a1� �
and k02 ; a2� �
. The simulation of such an elec-
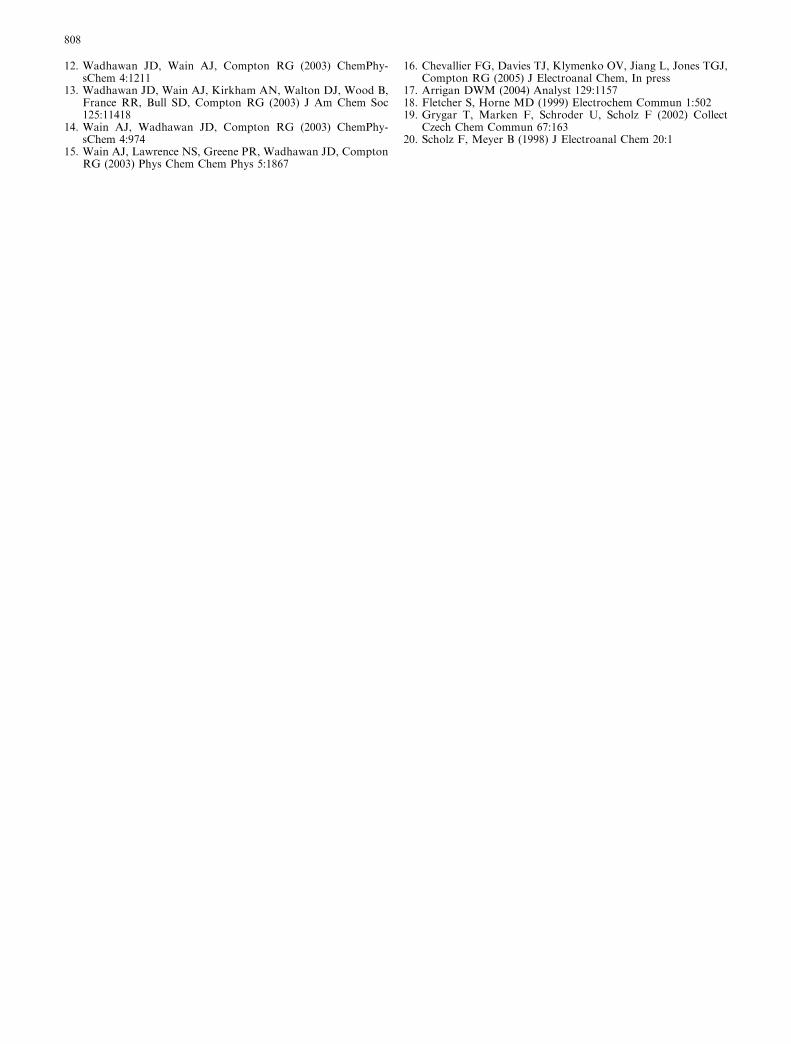
trode proceeds using the diffusional domain approachsuch as already explained. The power of the method canbe illustrated with reference to an electrode comprisinggold particles, of known average radius, abrasively at-tached [19, 20] to an edge-plane pyrolytic-graphiteelectrode which has been modified by physical adsorp-tion of anthraquinone [3]. The effect of the adsorption isto slow the electron transfer kinetics of the edge-planepyrolytic-graphite electrode in respect of the electro-oxidation of ferrocyanide; the standard rate constant ismeasured using a pure, unmodified electrode as0.0011 cm2 s�1. In contrast, for a pure gold electrode therate constant is 0.013 cm2 s�1 for the same process. Thequestion arises as to what will be the cyclic voltammetricresponse of the gold/modified graphite composite elec-trode?
Fig. 17 shows the cyclic voltammetric response offerrocyanide at pure gold and pure anthraquinone-modified edge-plane pyrolytic-graphite electrodes; thedifference in peak-to-peak potential separation, DEpp
reflects the different electrode kinetics identified above.We have simulated the response of the compositeelectrode for different scan rates and for differentcoverages (0 £ h £ 1) of gold on the graphite sur-face [2]. Figure 18 shows that DEpp changes smoothlybetween the limits of pure gold and pure modifiedgraphite but in a different fashion according to voltagescan rate. Figure 18 also shows a typical simulatedvoltammogram. The results in Fig. 18 can be used toestimate the coverage of gold from the measured valuesof DEpp at different scan rates. The results are shown inTable 1 and may be compared with SEM images, fromwhich a coverage of h=0.28 was deduced. The excel-lent agreement with Table 1 is apparent [3]. It may beconclude that electrochemically heterogeneous elec-trodes can be simulated using the diffusion domainapproximation.
Conclusions
The diffusion domain approximation is a powerful ap-proach enabling accurate simulation of the voltammetric
Fig. 15 The simulation ofmicrodisc arrays addressing theissue of diffusionalindependence. Shown areexperimental voltammetricresults obtained from oxidationof 1 mmol L�1 ferrocyanide in0.1 mol L�1 KCl at a goldmicrodisc array comprising acubic distribution of 10-lm-diameter discs with centre-tocentre nearest neighbourseparations of 100 lm. Scanrates used (from bottom to topof the curves) were 10, 25, 50,75, 100, 150, 200 mV s�1
Fig. 16 An electrochemical reaction occurring on the sameelectrode surface with different Butler–Volmer characteristics atdifferent spatial locations
806
process at an electrochemically heterogeneous electrode.In particular the successful simulation of partiallyblocked electrodes, of microelectrode arrays, and ofparticle-modified (composite) electrodes is noted.
References
1. Brookes BA, Davies TJ, Fisher AC, Evans RG, Wilkins SJ,Yunus K, Wadhawan JD, Compton RG (2003) J Phys Chem B107:1616
2. Davies TJ, Brookes BA, Fisher AC, Yunus K, Wilkins SJ,Greene PR, Wadhawan JD, Compton RG (2003) J Phys ChemB 107:6431
3. Chevallier FG, Davies TJ, Klymenko OV, Jiang L, Jones TGJ,Compton RG (2005) J Electroanal Chem 577:211
4. Davies TJ, Moore RR, Banks CE, Compton RG (2004)J Electroanal Chem 574:123
5. Amatore C, Saveant J-M, D Tessier (1983) J Electroanal Chem147:39
6. Einstein A (1956) Investigation on the theory of the brownianmovement. Dover Publications, New York
7. Davies TJ, Lowe ER, Wilkins SJ, Compton RG (2004)ChemPhysChem, In press
8. Banks CE, Davies TJ, Evans RG, Hignett G, Wain AJ, Law-rence NS, Wadhawan JD, Marken F, Compton RG (2003)Phys Chem Chem Phys 5:4053
9. Davies TJ, Brookes BA, Compton RG (2004) J ElectroanalChem 566:193
10. Davies TJ, Garner AC, Davies SG, Compton RG (2004)J Electroanal Chem 570:171
11. Wain AJ, Wadhawan JD, France RR, Compton RG (2004)Phys Chem Chem Phys 6:836
Fig. 17 Schematic diagram ofthe blocking gold particles on amodified edge-plane pyrolytic-graphite electrode (left) and thecyclic voltammetric response ofaqueous ferrocyanide at puregold and pure anthraquinone-modified edge-plane pyrolytic-graphite electrode (right)
Fig. 18 Simulated working curves (left) showing the relationshipbetween DEp and log h for cyclic voltammograms recorded at thegold particle anthraquinone-modified edge-plane pyrolytic-graph-ite electrode. Also shown (right) is a typical voltammetric responseof gold on the modified edge-plane pyrolytic-graphite electrodewith that of the bare gold and modified anthraquinone edge-planeelectrode
Table 1 The measured peak-to-peak separation, DEp, and inferredcoverages, h, of gold spheres on an edge-plane pyrolytic-graphiteelectrode
Scan rate, t(V s�1) DEp(V) h
1.0 0.216 0.282.5 0.282 0.265.0 0.305 0.347.5 0.341 0.2910.0 0.364 0.31
807
12. Wadhawan JD, Wain AJ, Compton RG (2003) ChemPhy-sChem 4:1211
13. Wadhawan JD, Wain AJ, Kirkham AN, Walton DJ, Wood B,France RR, Bull SD, Compton RG (2003) J Am Chem Soc125:11418
14. Wain AJ, Wadhawan JD, Compton RG (2003) ChemPhy-sChem 4:974
15. Wain AJ, Lawrence NS, Greene PR, Wadhawan JD, ComptonRG (2003) Phys Chem Chem Phys 5:1867
16. Chevallier FG, Davies TJ, Klymenko OV, Jiang L, Jones TGJ,Compton RG (2005) J Electroanal Chem, In press
17. Arrigan DWM (2004) Analyst 129:115718. Fletcher S, Horne MD (1999) Electrochem Commun 1:50219. Grygar T, Marken F, Schroder U, Scholz F (2002) Collect
Czech Chem Commun 67:16320. Scholz F, Meyer B (1998) J Electroanal Chem 20:1
808