deriving vulnerability curves using italian earthquake damage data
TRANSCRIPT
Bull Earthquake Eng (2008) 6:485–504DOI 10.1007/s10518-008-9073-6
ORIGINAL RESEARCH PAPER
Deriving vulnerability curves using Italian earthquakedamage data
Miriam Colombi · Barbara Borzi · Helen Crowley ·Mauro Onida · Fabrizio Meroni · Rui Pinho
Received: 10 September 2007 / Accepted: 10 June 2008 / Published online: 17 July 2008© Springer Science+Business Media B.V. 2008
Abstract The concerted effort to collect earthquake damage data in Italy over the past30 years has led to the development of an extensive database from which vulnerability pre-dictions for the Italian building stock can be derived. A methodology to derive empiricalvulnerability curves with the aforementioned data is presented herein and the resulting curveshave been directly compared with mechanics-based vulnerability curves. However, it has beenfound that a valid comparison between the empirical and analytical vulnerability curves isnot possible mainly due to a number of shortcomings in the database of surveyed buildings.A detailed discussion of the difficulties in deriving vulnerability curves from the currentobserved damage database is thus also presented.
Keywords Vulnerability curves · Damage data · Italian building stock · Loss estimation ·Analytical methods
1 Introduction
The definition of the seismic vulnerability of buildings at an urban scale is a fundamentalcomponent of a loss model and much research has been carried out over the past 30 years inthis field as summarised in Calvi et al. (2006). The first predictions of structural vulnerabilityat a large geographical scale were based on the observed damage from earthquakes in theform of damage probability matrices. Damage probability matrices express, in a discreteform, the conditional probability of obtaining a damage level j , due to a ground motion of
M. Colombi · B. Borzi (B) · H. Crowley · M. OnidaEUCENTRE, European Centre for Training and Research in Earthquake Engineering, Via Ferrata 1,Pavia, Italye-mail: [email protected]
F. MeroniIstituto Nazionale di Geofisica e Vulcanologia (INGV), Via Bassini 15, Milano, Italy
R. PinhoDipartimento di Meccanica Strutturale, Università degli Studi di Pavia, Via Ferrata 1, Pavia, Italy
123
486 Bull Earthquake Eng (2008) 6:485–504
intensity i, P[D = j/ i]. Vulnerability functions, which are continuous functions expressingthe probability of exceeding a given damage state given a function of the earthquake intensity,were later proposed, but were still based initially on the observed damage from earthquakes.There are many advantages of using observed data to study the vulnerability of the existingbuilding stock, with the main advantage at the present time being the possibility to use suchdata to calibrate or attempt to validate analytically derived vulnerability curves.
The first damage probability matrices were developed by Whitman et al. (1973) and werebased on the observed damage to different structural typologies from the 1971 San Fernandoearthquake. One of the first European versions of a damage probability matrix was producedby Braga et al. (1982) and was based on the damage data of Italian buildings after the 1980Irpinia earthquake. The buildings were separated into three vulnerability classes (A, B andC) and a DPM based on the MSK intensity scale was evaluated for each class. The use ofDPMs is still popular in Italy and proposals have recently been made to update the originalDPMs of Braga et al. (1982). Di Pasquale et al. (2005) have changed the DPMs from theMSK intensity scale to the MCS scale (Mercalli-Cancani-Sieberg) because the Italian seismiccatalogue is mainly based on this intensity and the number of buildings has been replacedby the number of dwellings so that the matrices could be used in conjunction with the 1991Census data, collected by ISTAT (Italian National Institute of Statistics). Dolce et al. (2003)have also adapted the original matrices by adding a vulnerability class D, using the EMS98scale (Grünthal 1998), to account for the buildings that have been constructed since 1980,which should have a lower vulnerability as they would either have been retrofitted or designedto recent seismic design codes.
Continuous vulnerability functions based directly on the damage of buildings from pastearthquakes were introduced slightly later than DPMs; one obstacle to their derivation beingthe fact that macroseismic intensity is not a continuous variable. This problem was overcomeby Spence et al. (1992) through the use of their Parameterless Scale of Intensity (PSI) to derivevulnerability functions based on the observed damage of buildings using the MSK damagescale. Orsini (1999) also used the PSI ground-motion parameter to derive vulnerability curvesfor apartment units in Italy. Both studies subsequently converted the PSI to peak groundacceleration (PGA) using empirical correlation functions so that intensity was not beingused both for the definition of the damage and the ground motion.
Sabetta et al. (1998) used post-earthquake surveys of approximately 50,000 buildingsdamaged by destructive Italian earthquakes in order to derive vulnerability curves. The da-tabase was sorted into three structural classes and six damage levels according to the MSKmacroseismic scale. A mean damage index, calculated as the weighted average of the fre-quencies of each damage level, was derived for each municipality where damage occurred,and for each structural class. Empirical fragility curves with a binomial distribution werederived as a function of PGA, Arias Intensity and effective peak acceleration. Rota et al.(2006) have also used the post-earthquake damage surveys of approximately 90,000 buil-dings in Italy in order to derive typological fragility curves for typical building classes (e.g.seismically designed reinforced concrete buildings of 1–3 storeys). Observational damageprobability matrices were first produced and then processed to obtain lognormal fragilitycurves relating the probability of reaching or exceeding a given damage state to the meanpeak ground acceleration at the coordinate of the municipality where the damaged buildingswere located. The PGA has been derived using the magnitude of the event and the distanceto the site based on the Sabetta and Pugliese (1987) attenuation relation, assuming rock siteconditions.
Alternative empirical vulnerability functions have also been proposed, generally with nor-mal or lognormal distributions, which do not use macroseismic intensity or PGA to charac-
123
Bull Earthquake Eng (2008) 6:485–504 487
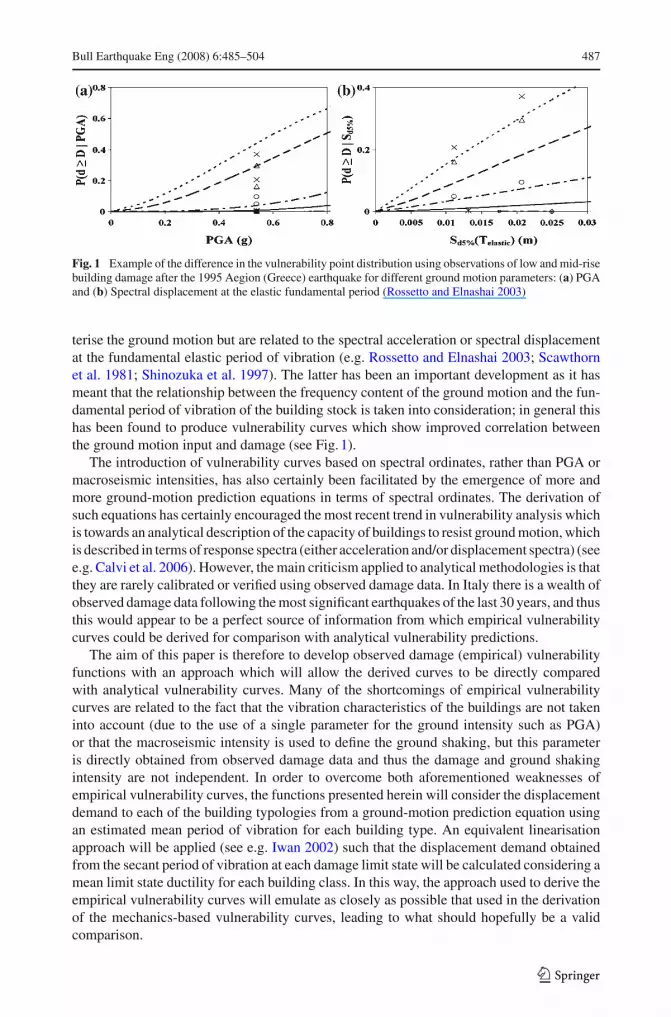
Fig. 1 Example of the difference in the vulnerability point distribution using observations of low and mid-risebuilding damage after the 1995 Aegion (Greece) earthquake for different ground motion parameters: (a) PGAand (b) Spectral displacement at the elastic fundamental period (Rossetto and Elnashai 2003)
terise the ground motion but are related to the spectral acceleration or spectral displacementat the fundamental elastic period of vibration (e.g. Rossetto and Elnashai 2003; Scawthornet al. 1981; Shinozuka et al. 1997). The latter has been an important development as it hasmeant that the relationship between the frequency content of the ground motion and the fun-damental period of vibration of the building stock is taken into consideration; in general thishas been found to produce vulnerability curves which show improved correlation betweenthe ground motion input and damage (see Fig. 1).
The introduction of vulnerability curves based on spectral ordinates, rather than PGA ormacroseismic intensities, has also certainly been facilitated by the emergence of more andmore ground-motion prediction equations in terms of spectral ordinates. The derivation ofsuch equations has certainly encouraged the most recent trend in vulnerability analysis whichis towards an analytical description of the capacity of buildings to resist ground motion, whichis described in terms of response spectra (either acceleration and/or displacement spectra) (seee.g. Calvi et al. 2006). However, the main criticism applied to analytical methodologies is thatthey are rarely calibrated or verified using observed damage data. In Italy there is a wealth ofobserved damage data following the most significant earthquakes of the last 30 years, and thusthis would appear to be a perfect source of information from which empirical vulnerabilitycurves could be derived for comparison with analytical vulnerability predictions.
The aim of this paper is therefore to develop observed damage (empirical) vulnerabilityfunctions with an approach which will allow the derived curves to be directly comparedwith analytical vulnerability curves. Many of the shortcomings of empirical vulnerabilitycurves are related to the fact that the vibration characteristics of the buildings are not takeninto account (due to the use of a single parameter for the ground intensity such as PGA)or that the macroseismic intensity is used to define the ground shaking, but this parameteris directly obtained from observed damage data and thus the damage and ground shakingintensity are not independent. In order to overcome both aforementioned weaknesses ofempirical vulnerability curves, the functions presented herein will consider the displacementdemand to each of the building typologies from a ground-motion prediction equation usingan estimated mean period of vibration for each building type. An equivalent linearisationapproach will be applied (see e.g. Iwan 2002) such that the displacement demand obtainedfrom the secant period of vibration at each damage limit state will be calculated considering amean limit state ductility for each building class. In this way, the approach used to derive theempirical vulnerability curves will emulate as closely as possible that used in the derivationof the mechanics-based vulnerability curves, leading to what should hopefully be a validcomparison.
123
488 Bull Earthquake Eng (2008) 6:485–504
2 Italian earthquake damage databases
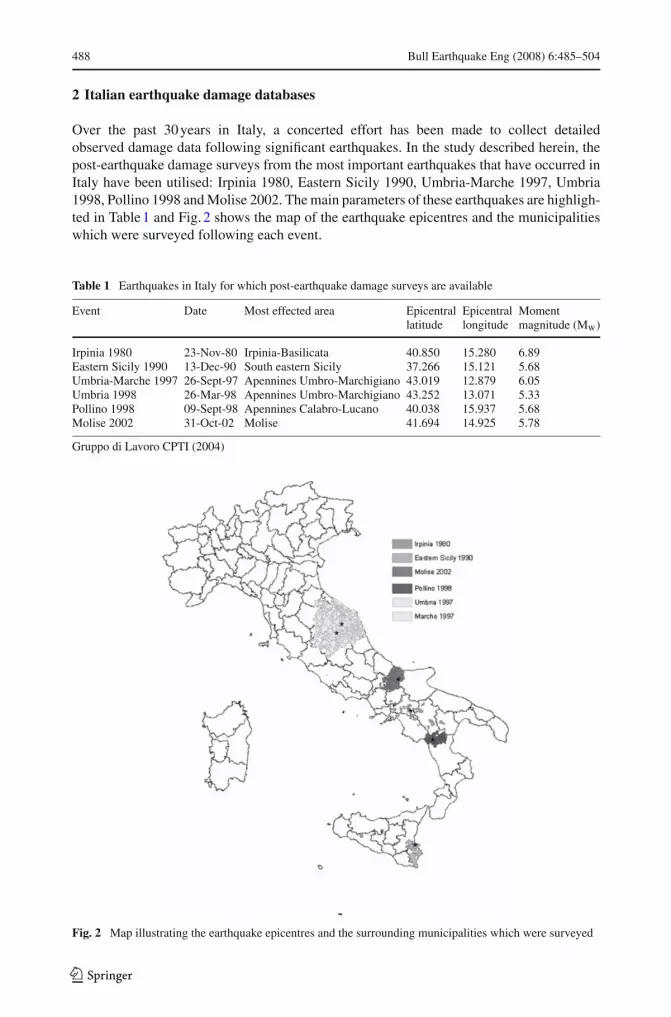
Over the past 30 years in Italy, a concerted effort has been made to collect detailedobserved damage data following significant earthquakes. In the study described herein, thepost-earthquake damage surveys from the most important earthquakes that have occurred inItaly have been utilised: Irpinia 1980, Eastern Sicily 1990, Umbria-Marche 1997, Umbria1998, Pollino 1998 and Molise 2002. The main parameters of these earthquakes are highligh-ted in Table 1 and Fig. 2 shows the map of the earthquake epicentres and the municipalitieswhich were surveyed following each event.
Table 1 Earthquakes in Italy for which post-earthquake damage surveys are available
Event Date Most effected area Epicentral Epicentral Momentlatitude longitude magnitude (Mw)
Irpinia 1980 23-Nov-80 Irpinia-Basilicata 40.850 15.280 6.89Eastern Sicily 1990 13-Dec-90 South eastern Sicily 37.266 15.121 5.68Umbria-Marche 1997 26-Sept-97 Apennines Umbro-Marchigiano 43.019 12.879 6.05Umbria 1998 26-Mar-98 Apennines Umbro-Marchigiano 43.252 13.071 5.33Pollino 1998 09-Sept-98 Apennines Calabro-Lucano 40.038 15.937 5.68Molise 2002 31-Oct-02 Molise 41.694 14.925 5.78
Gruppo di Lavoro CPTI (2004)
Fig. 2 Map illustrating the earthquake epicentres and the surrounding municipalities which were surveyed
123
Bull Earthquake Eng (2008) 6:485–504 489
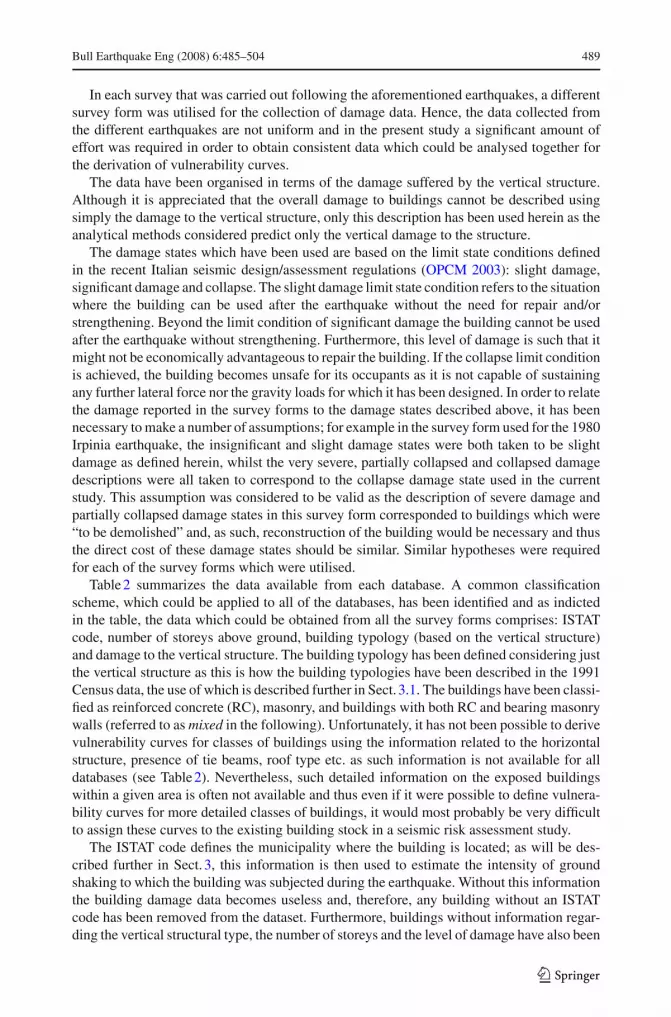
In each survey that was carried out following the aforementioned earthquakes, a differentsurvey form was utilised for the collection of damage data. Hence, the data collected fromthe different earthquakes are not uniform and in the present study a significant amount ofeffort was required in order to obtain consistent data which could be analysed together forthe derivation of vulnerability curves.
The data have been organised in terms of the damage suffered by the vertical structure.Although it is appreciated that the overall damage to buildings cannot be described usingsimply the damage to the vertical structure, only this description has been used herein as theanalytical methods considered predict only the vertical damage to the structure.
The damage states which have been used are based on the limit state conditions definedin the recent Italian seismic design/assessment regulations (OPCM 2003): slight damage,significant damage and collapse. The slight damage limit state condition refers to the situationwhere the building can be used after the earthquake without the need for repair and/orstrengthening. Beyond the limit condition of significant damage the building cannot be usedafter the earthquake without strengthening. Furthermore, this level of damage is such that itmight not be economically advantageous to repair the building. If the collapse limit conditionis achieved, the building becomes unsafe for its occupants as it is not capable of sustainingany further lateral force nor the gravity loads for which it has been designed. In order to relatethe damage reported in the survey forms to the damage states described above, it has beennecessary to make a number of assumptions; for example in the survey form used for the 1980Irpinia earthquake, the insignificant and slight damage states were both taken to be slightdamage as defined herein, whilst the very severe, partially collapsed and collapsed damagedescriptions were all taken to correspond to the collapse damage state used in the currentstudy. This assumption was considered to be valid as the description of severe damage andpartially collapsed damage states in this survey form corresponded to buildings which were“to be demolished” and, as such, reconstruction of the building would be necessary and thusthe direct cost of these damage states should be similar. Similar hypotheses were requiredfor each of the survey forms which were utilised.
Table 2 summarizes the data available from each database. A common classificationscheme, which could be applied to all of the databases, has been identified and as indictedin the table, the data which could be obtained from all the survey forms comprises: ISTATcode, number of storeys above ground, building typology (based on the vertical structure)and damage to the vertical structure. The building typology has been defined considering justthe vertical structure as this is how the building typologies have been described in the 1991Census data, the use of which is described further in Sect. 3.1. The buildings have been classi-fied as reinforced concrete (RC), masonry, and buildings with both RC and bearing masonrywalls (referred to as mixed in the following). Unfortunately, it has not been possible to derivevulnerability curves for classes of buildings using the information related to the horizontalstructure, presence of tie beams, roof type etc. as such information is not available for alldatabases (see Table 2). Nevertheless, such detailed information on the exposed buildingswithin a given area is often not available and thus even if it were possible to define vulnera-bility curves for more detailed classes of buildings, it would most probably be very difficultto assign these curves to the existing building stock in a seismic risk assessment study.
The ISTAT code defines the municipality where the building is located; as will be des-cribed further in Sect. 3, this information is then used to estimate the intensity of groundshaking to which the building was subjected during the earthquake. Without this informationthe building damage data becomes useless and, therefore, any building without an ISTATcode has been removed from the dataset. Furthermore, buildings without information regar-ding the vertical structural type, the number of storeys and the level of damage have also been
123
490 Bull Earthquake Eng (2008) 6:485–504
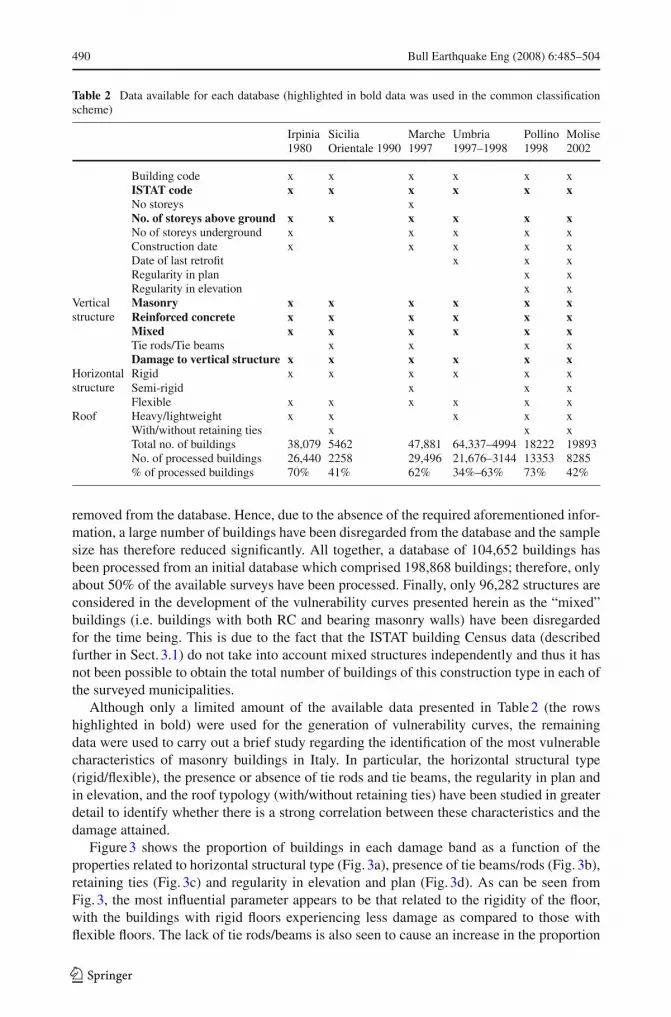
Table 2 Data available for each database (highlighted in bold data was used in the common classificationscheme)
Irpinia Sicilia Marche Umbria Pollino Molise1980 Orientale 1990 1997 1997–1998 1998 2002
Building code x x x x x xISTAT code x x x x x xNo storeys xNo. of storeys above ground x x x x x xNo of storeys underground x x x x xConstruction date x x x x xDate of last retrofit x x xRegularity in plan x xRegularity in elevation x x
Vertical Masonry x x x x x xstructure Reinforced concrete x x x x x x
Mixed x x x x x xTie rods/Tie beams x x x xDamage to vertical structure x x x x x x
Horizontal Rigid x x x x x xstructure Semi-rigid x x x
Flexible x x x x x xRoof Heavy/lightweight x x x x x
With/without retaining ties x x xTotal no. of buildings 38,079 5462 47,881 64,337–4994 18222 19893No. of processed buildings 26,440 2258 29,496 21,676–3144 13353 8285% of processed buildings 70% 41% 62% 34%–63% 73% 42%
removed from the database. Hence, due to the absence of the required aforementioned infor-mation, a large number of buildings have been disregarded from the database and the samplesize has therefore reduced significantly. All together, a database of 104,652 buildings hasbeen processed from an initial database which comprised 198,868 buildings; therefore, onlyabout 50% of the available surveys have been processed. Finally, only 96,282 structures areconsidered in the development of the vulnerability curves presented herein as the “mixed”buildings (i.e. buildings with both RC and bearing masonry walls) have been disregardedfor the time being. This is due to the fact that the ISTAT building Census data (describedfurther in Sect. 3.1) do not take into account mixed structures independently and thus it hasnot been possible to obtain the total number of buildings of this construction type in each ofthe surveyed municipalities.
Although only a limited amount of the available data presented in Table 2 (the rowshighlighted in bold) were used for the generation of vulnerability curves, the remainingdata were used to carry out a brief study regarding the identification of the most vulnerablecharacteristics of masonry buildings in Italy. In particular, the horizontal structural type(rigid/flexible), the presence or absence of tie rods and tie beams, the regularity in plan andin elevation, and the roof typology (with/without retaining ties) have been studied in greaterdetail to identify whether there is a strong correlation between these characteristics and thedamage attained.
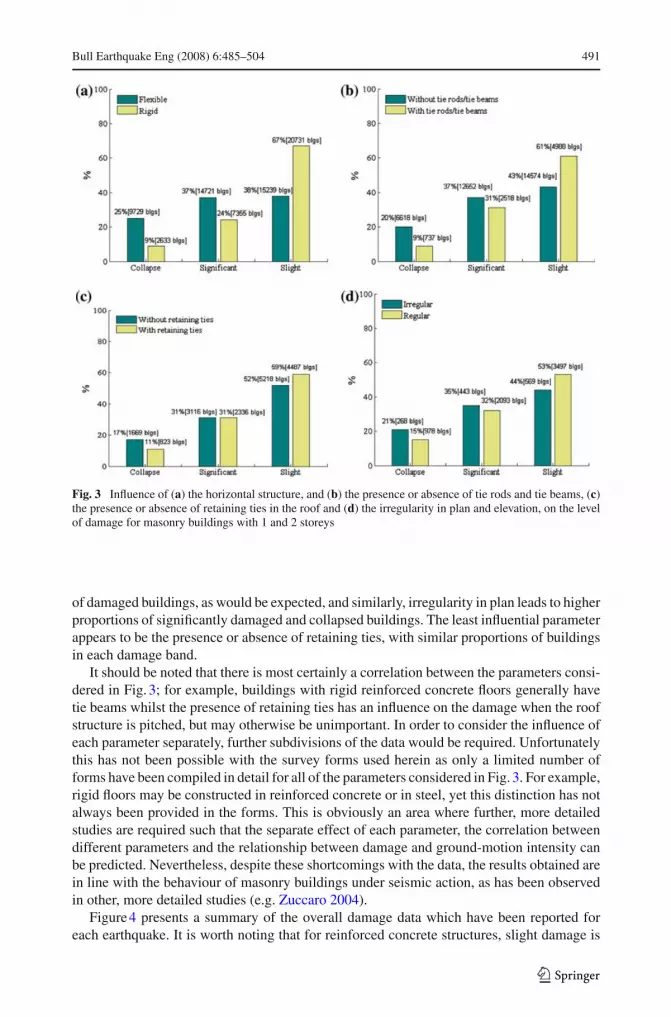
Figure 3 shows the proportion of buildings in each damage band as a function of theproperties related to horizontal structural type (Fig. 3a), presence of tie beams/rods (Fig. 3b),retaining ties (Fig. 3c) and regularity in elevation and plan (Fig. 3d). As can be seen fromFig. 3, the most influential parameter appears to be that related to the rigidity of the floor,with the buildings with rigid floors experiencing less damage as compared to those withflexible floors. The lack of tie rods/beams is also seen to cause an increase in the proportion
123
Bull Earthquake Eng (2008) 6:485–504 491
Fig. 3 Influence of (a) the horizontal structure, and (b) the presence or absence of tie rods and tie beams, (c)the presence or absence of retaining ties in the roof and (d) the irregularity in plan and elevation, on the levelof damage for masonry buildings with 1 and 2 storeys
of damaged buildings, as would be expected, and similarly, irregularity in plan leads to higherproportions of significantly damaged and collapsed buildings. The least influential parameterappears to be the presence or absence of retaining ties, with similar proportions of buildingsin each damage band.
It should be noted that there is most certainly a correlation between the parameters consi-dered in Fig. 3; for example, buildings with rigid reinforced concrete floors generally havetie beams whilst the presence of retaining ties has an influence on the damage when the roofstructure is pitched, but may otherwise be unimportant. In order to consider the influence ofeach parameter separately, further subdivisions of the data would be required. Unfortunatelythis has not been possible with the survey forms used herein as only a limited number offorms have been compiled in detail for all of the parameters considered in Fig. 3. For example,rigid floors may be constructed in reinforced concrete or in steel, yet this distinction has notalways been provided in the forms. This is obviously an area where further, more detailedstudies are required such that the separate effect of each parameter, the correlation betweendifferent parameters and the relationship between damage and ground-motion intensity canbe predicted. Nevertheless, despite these shortcomings with the data, the results obtained arein line with the behaviour of masonry buildings under seismic action, as has been observedin other, more detailed studies (e.g. Zuccaro 2004).
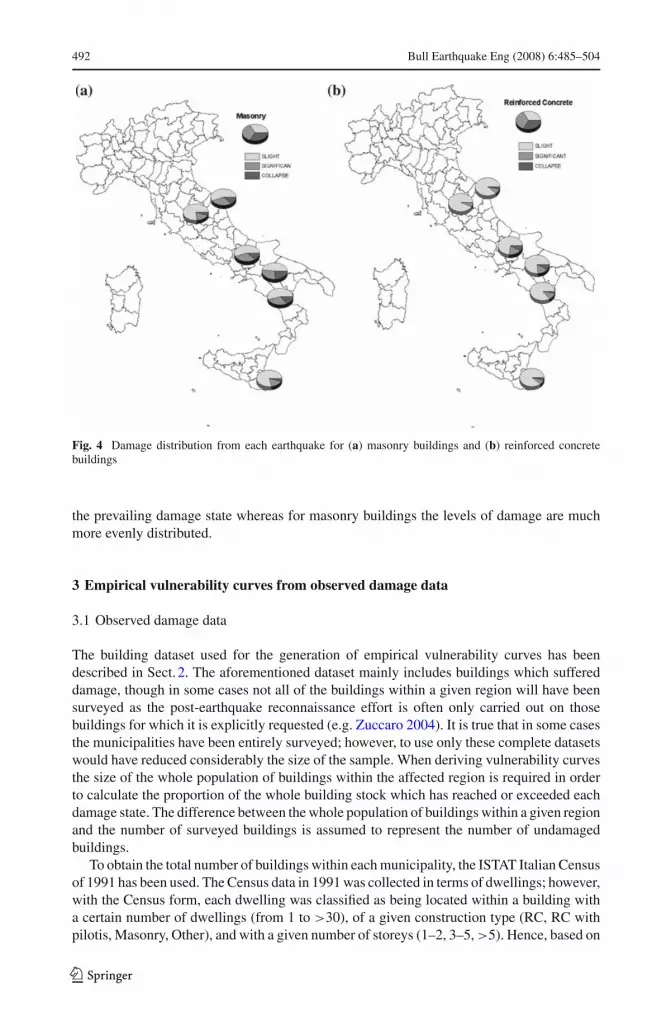
Figure 4 presents a summary of the overall damage data which have been reported foreach earthquake. It is worth noting that for reinforced concrete structures, slight damage is
123
492 Bull Earthquake Eng (2008) 6:485–504
Fig. 4 Damage distribution from each earthquake for (a) masonry buildings and (b) reinforced concretebuildings
the prevailing damage state whereas for masonry buildings the levels of damage are muchmore evenly distributed.
3 Empirical vulnerability curves from observed damage data
3.1 Observed damage data
The building dataset used for the generation of empirical vulnerability curves has beendescribed in Sect. 2. The aforementioned dataset mainly includes buildings which suffereddamage, though in some cases not all of the buildings within a given region will have beensurveyed as the post-earthquake reconnaissance effort is often only carried out on thosebuildings for which it is explicitly requested (e.g. Zuccaro 2004). It is true that in some casesthe municipalities have been entirely surveyed; however, to use only these complete datasetswould have reduced considerably the size of the sample. When deriving vulnerability curvesthe size of the whole population of buildings within the affected region is required in orderto calculate the proportion of the whole building stock which has reached or exceeded eachdamage state. The difference between the whole population of buildings within a given regionand the number of surveyed buildings is assumed to represent the number of undamagedbuildings.
To obtain the total number of buildings within each municipality, the ISTAT Italian Censusof 1991 has been used. The Census data in 1991 was collected in terms of dwellings; however,with the Census form, each dwelling was classified as being located within a building witha certain number of dwellings (from 1 to >30), of a given construction type (RC, RC withpilotis, Masonry, Other), and with a given number of storeys (1–2, 3–5, >5). Hence, based on
123

Bull Earthquake Eng (2008) 6:485–504 493
Table 3 Summary of the masonry and reinforced concrete (RC) buildings used in the vulnerability studydivided into storey classes
No. of surveyed No. of processed No. of buildings registeredbuildings buildings in the Census of 1991
Masonry RC Masonry RC Masonry RC
1–2 storey 85,418 5130 67,762 1688 309,823 117,2053–5 storey 27,491 2804 24,557 1832 84,747 62,536>5 storey 356 313 226 217 527 4544
the Census forms compiled for all dwellings within each census tract/municipality, Meroniet al. (2000) have estimated the number of buildings classified according to the period ofconstruction, number of storeys and the vertical structural type within each municipality.The errors associated with the use of Census data based on the number of dwellings toarrive at the number of buildings are recognised by the authors and have been identified andquantified in some areas of Italy (see e.g. Frassine and Giovinazzi 2004). However, withoutthe presence of detailed exposure data it is necessary to make some sort of hypothesis inorder to obtain the number of buildings of a given construction type and with a given numberof storeys.
The inclusion of the period of construction in the Census data has allowed the buildingswhich were constructed between 1981–1991 to be removed from the database such that thenumber of buildings at the time of the 1980 Irpinia earthquake could be estimated. However,the buildings which collapsed during the 1980 Irpinia and 1990 Eastern Sicily earthquakewere no longer present at the time of the 1991 ISTAT Census, yet they were present at thetime of the earthquake, and thus there are problems with the definition of the number ofbuildings within the municipality when the earthquake occurred. In order to overcome thisproblem, the number of collapsed buildings in the database from the Irpinia and EasternSicily earthquakes have been added to the ’91 Census data.
In Table 3, a complete summary of the total number of buildings registered in the Censusof 1991, the number of damaged buildings in the database and the number of processedbuildings is given for both masonry and reinforced concrete buildings. The data are dividedinto three different classes of storey: 1–2, 3–5 and >5 storeys. It is noted that a significantproportion of the surveyed buildings are missing from the first two columns of Table 3 asthey correspond to those forms for which either the number of storeys, the type of verticalstructure, or the damage to the vertical structure was missing. Hence, the difference betweenthe number of processed buildings and the number of surveyed buildings is even larger thanthat which can be interpreted from Table 3.
The buildings sample is further classified as a function of damage level in Table 4 for bothmasonry and reinforced concrete buildings. As discussed in Sect. 2, a significant number ofstructures have been removed from the database because of incompleteness and deficienciesin the survey forms; as seen in Table 4 such problems have effected mainly the reinforcedconcrete buildings and the high-rise masonry buildings.
3.2 Ground-motion prediction equations
As discussed in the Introduction, vulnerability curves express the probability of reachingor exceeding a given damage state, given a function of the earthquake intensity. In order toestimate the level of ground shaking at each of the municipalities where the damaged buil-
123

494 Bull Earthquake Eng (2008) 6:485–504
Table 4 Summary of the masonry and reinforced concrete (RC) buildings used in the vulnerability studydivided into storey and damage classes
Damage Masonry Reinforced concrete
No. of No. of Percentage of No of No of Percentage ofsurveyed processed processed surveyed processed processedbuildings buildings buildings (%) buildings buildings buildings (%)
1–2 storey Collapsesignificantslight
15,245 12,156 80 626 80 13
26,475 20,548 78 998 226 2343,698 35,058 80 3506 1382 39
3–5 storey Collapsesignificantslight
2954 2540 86 198 97 49
7708 6728 87 363 204 5616,829 15,289 91 2243 1531 68
>5 storey Collapsesignificantslight
32 14 44 18 10 56
94 54 57 38 15 39230 158 69 257 192 75
dings were surveyed, ground-motion prediction equations in terms of displacement spectralordinates have been used; displacement spectra have been used as it is well known that thereis a strong correlation between observed damage and displacement demand. The predictionequation proposed by Sabetta and Pugliese (1996) and the relationship recently derived byFaccioli et al. (2007) have been considered for the prediction of ground shaking intensity asthey have both been used in seismic hazard assessments in Italy.
The Sabetta and Pugliese (1996) equation is representative of the ground shaking expectedfrom Italian earthquakes as it was generated through the regression analysis of analog acce-lerograms recorded in Italy. The equation provides pseudo-spectral velocity ordinates from0.04 to 4s as a function of magnitude (moment magnitude Mw was considered herein), epi-central distance and soil conditions; the spectral velocity at 5% damping can be transformedinto the spectral displacement via the pseudo-spectral relationships. Faccioli et al. (2007)have developed a ground-motion prediction equation for spectral displacement ordinates upto 15 s by fitting data from a worldwide database of digitally recorded accelerograms ofshallow crustal earthquakes; some Italian analog accelerograms from the 1980 Irpinia earth-quake were added to the database after a careful scrutiny of their long period characteristics.This equation directly provides the spectral displacement at 5% damping as a function ofthe magnitude, hypocentral distance and soil conditions. The difference in the maximumresponse period between the two ground-motion prediction equations is due to the fact thatanalog accelerograms have been used by Sabetta and Pugliese (1996) for which it is difficultto obtain an accurate prediction of the displacement at large periods (when double integrationof the acceleration is carried out, errors are accumulated for the low frequency contents ofthe ground motion).
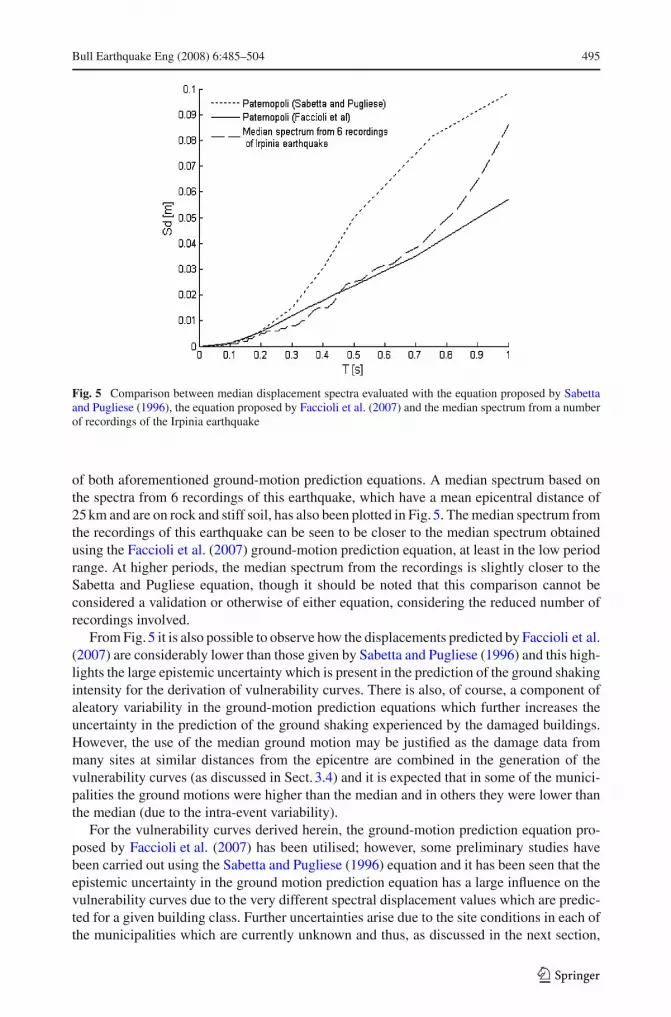
A comparison between the median displacement spectra with 5% damping predicted withthe two relationships is reported in Fig. 5 for the Irpinia 1980 earthquake (Ms = 6.9) forthe municipality of Paternopoli (which is at an epicentral distance of 25 km). The Irpiniaearthquake has been chosen as recordings from this earthquake were used in the regression
123
Bull Earthquake Eng (2008) 6:485–504 495
Fig. 5 Comparison between median displacement spectra evaluated with the equation proposed by Sabettaand Pugliese (1996), the equation proposed by Faccioli et al. (2007) and the median spectrum from a numberof recordings of the Irpinia earthquake
of both aforementioned ground-motion prediction equations. A median spectrum based onthe spectra from 6 recordings of this earthquake, which have a mean epicentral distance of25 km and are on rock and stiff soil, has also been plotted in Fig. 5. The median spectrum fromthe recordings of this earthquake can be seen to be closer to the median spectrum obtainedusing the Faccioli et al. (2007) ground-motion prediction equation, at least in the low periodrange. At higher periods, the median spectrum from the recordings is slightly closer to theSabetta and Pugliese equation, though it should be noted that this comparison cannot beconsidered a validation or otherwise of either equation, considering the reduced number ofrecordings involved.
From Fig. 5 it is also possible to observe how the displacements predicted by Faccioli et al.(2007) are considerably lower than those given by Sabetta and Pugliese (1996) and this high-lights the large epistemic uncertainty which is present in the prediction of the ground shakingintensity for the derivation of vulnerability curves. There is also, of course, a component ofaleatory variability in the ground-motion prediction equations which further increases theuncertainty in the prediction of the ground shaking experienced by the damaged buildings.However, the use of the median ground motion may be justified as the damage data frommany sites at similar distances from the epicentre are combined in the generation of thevulnerability curves (as discussed in Sect. 3.4) and it is expected that in some of the munici-palities the ground motions were higher than the median and in others they were lower thanthe median (due to the intra-event variability).
For the vulnerability curves derived herein, the ground-motion prediction equation pro-posed by Faccioli et al. (2007) has been utilised; however, some preliminary studies havebeen carried out using the Sabetta and Pugliese (1996) equation and it has been seen that theepistemic uncertainty in the ground motion prediction equation has a large influence on thevulnerability curves due to the very different spectral displacement values which are predic-ted for a given building class. Further uncertainties arise due to the site conditions in each ofthe municipalities which are currently unknown and thus, as discussed in the next section,
123
496 Bull Earthquake Eng (2008) 6:485–504
average site conditions have been considered. Only the results based on the Faccioli et al.(2007) equation will be presented herein as this prediction equation has been directly deve-loped in terms of spectral displacement and the data used for the regression analysis of thisequation were from digital records, considered to be more reliable in terms of displacementprediction, but which unfortunately were not available when the Sabetta and Pugliese (1996)relationship was developed.
3.3 Calculation of limit state displacement demand for each structural type
The ground shaking intensity in terms of spectral displacement, Sd, for each building classwithin a given municipality (i.e. for a certain epicentral/hypocentral distance and site condi-tion) for a given earthquake scenario (i.e. for a certain MW) has been calculated using theFaccioli et al. (2007) ground motion prediction equation using the mean period of vibrationof the surveyed buildings, which is related to structural type, level of damage and number ofstoreys, as will be discussed below. As the site conditions within each of the municipalitiesare unknown at the locations of the damaged buildings, average soil mechanical characte-ristics have been assumed in the ground-motion prediction equation: 50% site B (with ashear wave velocity, Vs30, between 360 m s−1 and 800 m s−1), and 50% site C (with 180m s−1 ≤ Vs30 ≤ 360 m s−1).
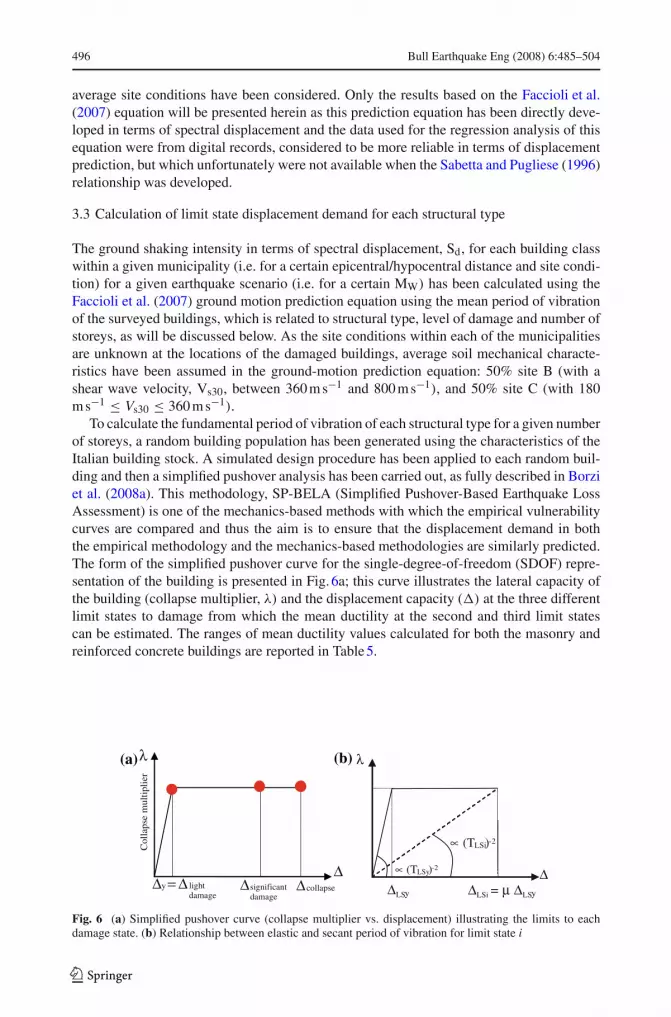
To calculate the fundamental period of vibration of each structural type for a given numberof storeys, a random building population has been generated using the characteristics of theItalian building stock. A simulated design procedure has been applied to each random buil-ding and then a simplified pushover analysis has been carried out, as fully described in Borziet al. (2008a). This methodology, SP-BELA (Simplified Pushover-Based Earthquake LossAssessment) is one of the mechanics-based methods with which the empirical vulnerabilitycurves are compared and thus the aim is to ensure that the displacement demand in boththe empirical methodology and the mechanics-based methodologies are similarly predicted.The form of the simplified pushover curve for the single-degree-of-freedom (SDOF) repre-sentation of the building is presented in Fig. 6a; this curve illustrates the lateral capacity ofthe building (collapse multiplier, λ) and the displacement capacity (�) at the three differentlimit states to damage from which the mean ductility at the second and third limit statescan be estimated. The ranges of mean ductility values calculated for both the masonry andreinforced concrete buildings are reported in Table 5.
λ
∆
Col
laps
e m
ulti
plie
r
∆y = ∆ ∆ ∆significant damage
collapse light damage
∝
(TLSy)-2∝
(TLSi)-2
∆ LSi = ∆ µ ∆LSy∆LSy
λ (a) (b)
Fig. 6 (a) Simplified pushover curve (collapse multiplier vs. displacement) illustrating the limits to eachdamage state. (b) Relationship between elastic and secant period of vibration for limit state i
123
Bull Earthquake Eng (2008) 6:485–504 497
Table 5 Summary of the meanductility values calculated for themasonry and reinforced concrete(RC) buildings
Masonry Reinforced concrete
µ2 µ3 µ2 µ3
1–2 storey 2.6 5.3 2.0 2.83–5 storey 1.6 2.6 1.7 2.0>5 storey – – 1.6 1.9
The fundamental period of vibration (at the first limit state, Ty) of each of the randombuildings in the population is calculated using the following formula:
Ty = 2π
√�y
gλ(3.1)
The mean fundamental period of vibration of the masonry buildings was found to varybetween 0.2 s and 0.4 s for low-rise and between 0.4 and 0.8 s for mid-rise. For reinforcedconcrete buildings the mean period of vibration for the low-rise buildings ranged between0.5 s and 0.9 s and for mid-rise it was seen to vary between 1.2 s and 1.7 s. The period ofvibration at the higher damage states is calculated considering an equivalent linearisationapproach based on the secant stiffness at the limit state under consideration and hence therelationship between the elastic period of vibration and that corresponding to a limit state iis given by the following relationship (which can be deduced from Fig. 6b):
TLSi = TLSy√
µLSi (3.2)
The equivalent linearisation approach presented in Fig. 6b assumes the structure behaveslinearly, whereas in reality structures have a non-linear hysteretic behaviour. To accountfor this energy dissipation, a displacement reduction factor η is introduced to reduce thedisplacement demand associated with the damaged buildings. The reduction factor can berelated to the equivalent viscous damping, ξeq, through the following expression, as presentedin EC8 (CEN 2003):
η =√
10
5 + ξeq(3.3)
In order to calculate the equivalent viscous damping ξeq, the recent expressions proposed byDwairi et al. (2007) have been used. For masonry buildings, the expression which relates tothe Small Takeda Hysteretic System has been assumed due to the reduced energy dissipationin masonry structures, as opposed to concrete structures:
ξeq = ξv + CST
(µ − 1
πµ
)%
CST = 50 + 40(1 − Teq
)Teq < 1 sec
CST = 50 Teq ≥ 1 sec(3.4)
In Eq. 3.4, ζv represents the damping ratio characterising the elastic response, commonlyassumed to be 5%, µ represents the ductility of the system and Teq is the equivalent/secantperiod of vibration. The expression relating to the Large Takeda Hysteretic System (Dwairiet al. 2007) has been used for reinforced concrete structures:
ξeq = ξv + CLT
(µ − 1
πµ
)%
123
498 Bull Earthquake Eng (2008) 6:485–504
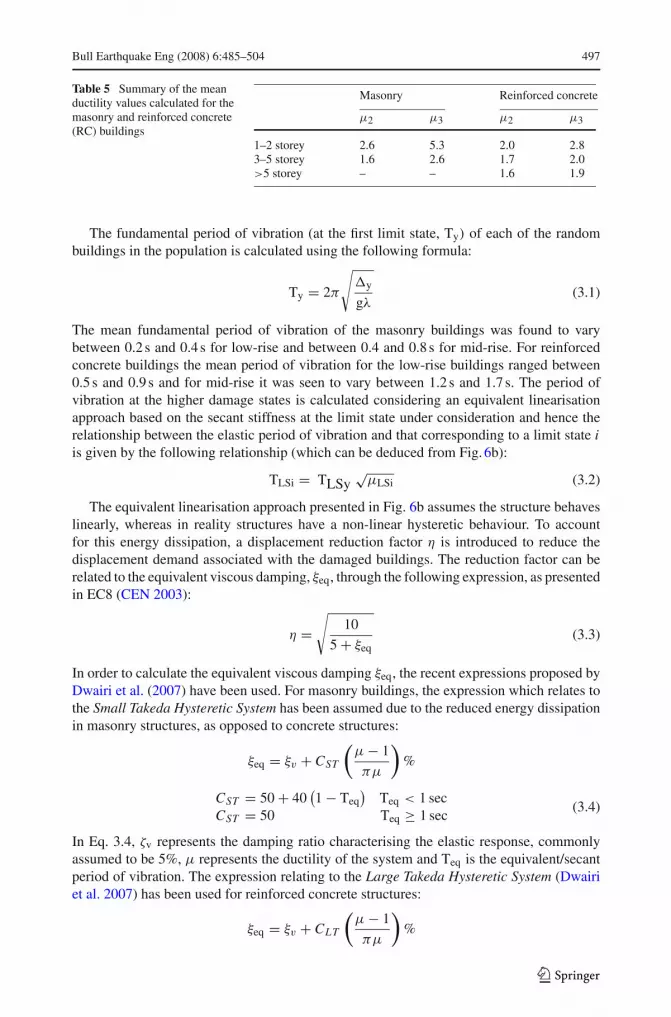
Fig. 7 Predicted spectral ordinates Sd (metres) in each municipality for 2 storey masonry buildings for the(a) slight damage and (b) collapse damage states
CLT = 65 + 50(1 − Teq) Teq < 1 secCLT = 65 Teq ≥ 1 sec
(3.5)
Hence, once the mean period of vibration of the building class has been calculated accordingto the height, structural typology and level of damage, an overdamped spectral displacementvalue can be associated to each building of the database based on the earthquake magnitude,hypocentral distance of the municipality within which the buildings are located, the soilconditions and the spectral reduction factor (Eq. 3.3). Discrete bins of imposed displacementdemand have been considered for each limit state such that the number of damaged buildingswithin each range would be statistically significant. As an illustrative example, the predictedspectral ordinates Sd in each of the surveyed municipalities after the event of Umbria-Marche1997 are reported in Fig. 7; these spectral ordinates represent the displacement demand tothe 2 storey masonry buildings within each of the municipalities at the first and third limitstates.
From Fig. 7 it can be seen that the number of municipalities reduces from the slight tothe collapse damage states as the displacement demand has only been calculated for thosemunicipalities where a given damage state was observed within the building stock.
3.4 Generation of vulnerability curves
Once the spectral displacements for a given building type (i.e. construction type and numberof storeys) have been calculated for the three levels of damage, as illustrated in Fig. 7, thenumber of buildings of that building class in a given damage state within each displacement
123

Bull Earthquake Eng (2008) 6:485–504 499
Fig. 8 Vulnerability curves for masonry buildings (a) 1–2 storey (b) 3–5 storey. LS1: slight damage, LS2:significant damage and LS3: collapse
Fig. 9 Vulnerability curves for reinforced concrete buildings (a) 1–2 storey (b) 3–5 storey. LS1: slight damage,LS2: significant damage and LS3: collapse
range for all of the earthquakes has been integrated. For each building class, the numberof buildings which reach a given damage state (none, slight, significant and collapse) canthen be found and divided by the number of buildings within all the municipalities whichwere subject to the considered displacement range. The probability of reaching each limitstate is then used to calculate the probability of exceedance, as required for the generation ofvulnerability curves. Figures 8 and 9 show the produced vulnerability curves obtained usingthis procedure for masonry and reinforced concrete buildings, respectively. Vulnerabilitycurves for buildings with more than 5 storeys have not been developed herein as there arevery few data for this class (see Table 3) and the majority of the surveyed structures werecollapsed and thus it would not be possible to generate vulnerability curves for all three limitstates.
The vulnerability curves for the three limit states can be seen in some of the previousfigures to cross; this is obviously not physically possible but arises from the fact that muchof the observed data collected on the damaged buildings were not utilised. Hence, there aresome ranges of displacement within which data for only one limit state are available. Somesensitivity analyses have been run to observe the influence of the size of the bins of spectraldisplacement on the generated curves as this has an influence on the damage data which areused for each range of spectral displacement; although a change in the bin size was seen toincrease the number of limit states which are represented in some displacement ranges, in
123
500 Bull Earthquake Eng (2008) 6:485–504
others there was a reduction in the number of limit states. The influence of changing the binsize was thus seen to have a negligible influence on the crossing vulnerability curves.
4 Comparison of empirical and analytical vulnerability curves
In this section a comparison of the derived vulnerability curves (Figs. 8, 9) with those pro-duced by two different mechanics-based methodologies is presented. The mechanics-basedmethodologies which have been considered are those which are being developed by the au-thors: DBELA, Displacement-Based Earthquake Loss Assessment (Crowley et al. 2004) andSP-BELA (Borzi et al. 2008a,b).
For what concerns reinforced concrete buildings, DBELA considers two different types ofresponse mechanisms and thus two distinct vulnerability curves. For the purpose of the currentstudy only one response mechanism has been considered: the column-sway (soft-storey)mechanism, as this is assumed to represent the behaviour of the surveyed buildings whichare mainly non-seismically designed. For the SP-BELA methodology, the aforementionedassumption on the collapse mechanism is not required. As mentioned previously, in SP-BELAthe buildings are designed and their capacity is then calculated and the collapse mechanismis checked; the buildings for the current study have been designed for gravity-loads only. Inboth methodologies, a random building population is simulated where each building has arandomly defined set of structural characteristics (material properties, geometrical propertiesetc.) and the period of vibration and displacement capacity of each building at each of thethree limit states is calculated.
In both methods, the bare frame reinforced concrete buildings have been consideredbecause the displacement capacity is mainly ruled by the frames and not by the infillpanels, which govern, on the other hand, the building stiffness. This latter characteristiconly has a limited influence on the mechanics-based vulnerability curves derived herein asthe displacement demand (Sd) is an imposed parameter and thus does not depend on thevibration characteristics of the buildings. For each level of displacement demand, the num-ber of randomly generated buildings which have a limit state displacement capacity lowerthen the displacement demand are counted and the probability of exceeding the limit state isthus obtained.
In Figs. 10 and 11, the observed and mechanics-based vulnerability curves are compa-red for masonry and reinforced concrete buildings, respectively. Only a limited number ofcomparisons have been reported as it is felt that only those related to the most statisticallysignificant data, as presented previously in Table 4, are valid for comparison purposes. Hencefor masonry buildings only the low-rise slight damage and collapse limit state curves arereported whilst for reinforced concrete the mid-rise slight and significant damage curveshave been compared. As can be deduced from Figs. 10, 11, the vulnerability curves produ-ced by the mechanics-based methodologies are more conservative than the curves fit to theobserved damage data.
The main factors which contribute to the differences in the vulnerability predictions bet-ween the analytical and empirical methodologies are as follows:
• The resistance provided by non-structural elements (e.g. partition walls) play a role interms of the overall building performance which is not taken into account in the numericalmodels considered herein. Furthermore, the period of vibration of the reinforced concretebuildings used to calculate the displacement demand in the empirical vulnerability curves(see Sect. 3.3) currently relates to bare frames and thus it is expected that, at least forthe slight damage state, the displacement demands have been overestimated.
123

Bull Earthquake Eng (2008) 6:485–504 501
Fig. 10 Comparison between vulnerability curves fit to observed data and curves produced by mechanicsbased methodologies for masonry buildings with 1–2 storeys with slight damage: (a) SP-BELA method(b) DBELA method, and collapse: (c) SP-BELA method (d) DBELA method
• As a consequence of the incomplete compilation of the survey forms, or due to compi-lation errors, about 50% of the surveyed buildings have been removed from the datasetof observed data. Hence, there is surely an underestimation of the number of damagedbuildings. Since the building type, number of storeys or location of these surveyed buil-dings cannot be identified, it has been impossible to implement an equivalent reductionin the total number of buildings within each municipality which is used to calculate theproportion of buildings exceeding each damage state.
However, it is worth noting that the comparison between the vulnerability curves is rela-tively satisfactory for masonry buildings with 1–2 storeys. As a matter of fact, the samplesize of this class of masonry buildings is the most statistically significant; the size of theobserved data is about 70% of the entire database. On the other hand, the comparison isvery poor for reinforced concrete buildings which, however, correspond to only about 4% ofthe total database and therefore, for this structural type, the curves fit to the observed dataare not statistically significant. Moreover, as reported in Tables 3 and 4, around 80% of thesurveyed low-rise masonry buildings have been processed for the limit states presented inFig. 10 whilst only about 60% of the surveyed mid-rise reinforced concrete structures havebeen utilised for the limit states presented in Fig.11.
5 Discussion and conclusions
During the post-processing of the observed damage data presented herein, a number of diffi-culties and unresolved issues have arisen. These difficulties mainly relate to: the uncertainty
123
502 Bull Earthquake Eng (2008) 6:485–504
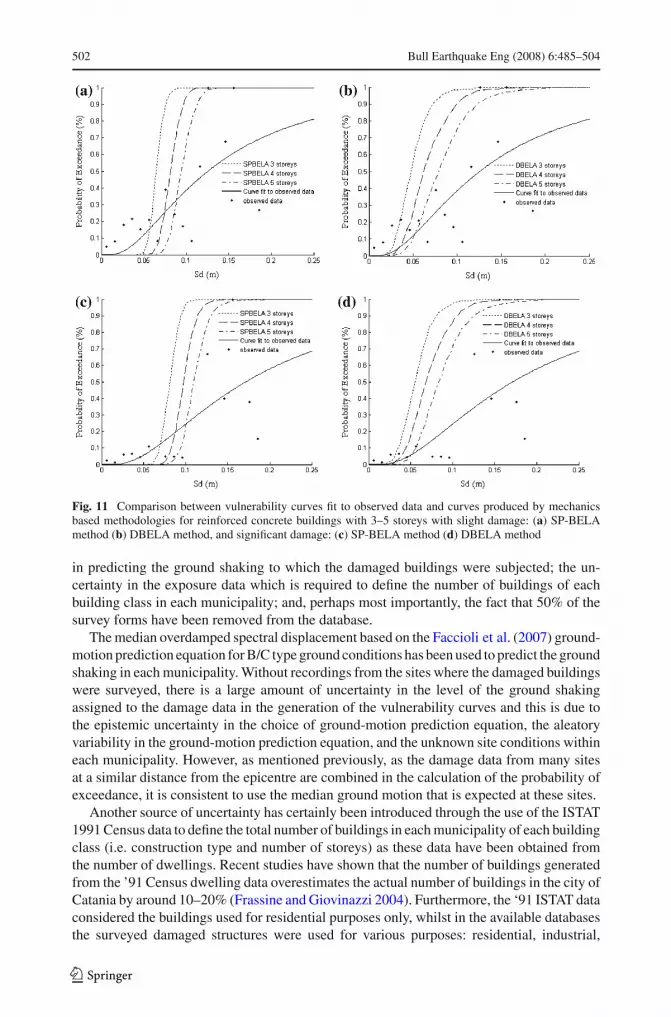
Fig. 11 Comparison between vulnerability curves fit to observed data and curves produced by mechanicsbased methodologies for reinforced concrete buildings with 3–5 storeys with slight damage: (a) SP-BELAmethod (b) DBELA method, and significant damage: (c) SP-BELA method (d) DBELA method
in predicting the ground shaking to which the damaged buildings were subjected; the un-certainty in the exposure data which is required to define the number of buildings of eachbuilding class in each municipality; and, perhaps most importantly, the fact that 50% of thesurvey forms have been removed from the database.
The median overdamped spectral displacement based on the Faccioli et al. (2007) ground-motion prediction equation for B/C type ground conditions has been used to predict the groundshaking in each municipality. Without recordings from the sites where the damaged buildingswere surveyed, there is a large amount of uncertainty in the level of the ground shakingassigned to the damage data in the generation of the vulnerability curves and this is due tothe epistemic uncertainty in the choice of ground-motion prediction equation, the aleatoryvariability in the ground-motion prediction equation, and the unknown site conditions withineach municipality. However, as mentioned previously, as the damage data from many sitesat a similar distance from the epicentre are combined in the calculation of the probability ofexceedance, it is consistent to use the median ground motion that is expected at these sites.
Another source of uncertainty has certainly been introduced through the use of the ISTAT1991 Census data to define the total number of buildings in each municipality of each buildingclass (i.e. construction type and number of storeys) as these data have been obtained fromthe number of dwellings. Recent studies have shown that the number of buildings generatedfrom the ’91 Census dwelling data overestimates the actual number of buildings in the city ofCatania by around 10–20% (Frassine and Giovinazzi 2004). Furthermore, the ‘91 ISTAT dataconsidered the buildings used for residential purposes only, whilst in the available databasesthe surveyed damaged structures were used for various purposes: residential, industrial,
123

Bull Earthquake Eng (2008) 6:485–504 503
commercial, etc. Another problem which has arisen with the ‘91 ISTAT data is that thestructures built after 1991 are not included and thus for the events considered in this reportwhich occurred after 1991 (of which there are four), the size of the building sample that wasutilised has probably been underestimated.
The incompleteness and deficiencies in the survey forms and the errors produced in thecomputerisation of the data led to a notable reduction of the database during post-processing.About 50% of the surveyed buildings were removed from the dataset because fundamentalinformation was missing: the ISTAT code (required to define the location of the building andthus ground shaking intensity), the number of storeys, or the construction type. The initialdatabase was comprised of 198,868 buildings, out of which only 93,911 have been processedfor the presented curves. This factor is probably the most influential of all of those discus-sed herein as it means that the vulnerability curves derived in Sect. 3.4 are underestimated,especially for the reinforced concrete buildings and the mid-rise masonry buildings. Onlythose related to low-rise masonry buildings have been based on a significant proportion ofthe collected damage data.
To improve the vulnerability curves presented herein it will therefore be necessary toimprove the estimation of the exposure at the time of the earthquake and to complete theobservational database in order to ensure all the information on the surveyed buildings canbe processed. It is unlikely that this will be something which can be carried out in a theshort-term and thus, in the meantime, the authors will continue to develop the methodologiesused to produce the presented mechanics-based vulnerability functions. A positive outcomeof this study has been that the mechanics-based vulnerability curves for low-rise unreinforcedmasonry buildings compared well with the observed damage data and, considering that themajority of the processed data related to this building class, this result could be construed asa preliminary validation of these mechanics-based methodologies.
Acknowledgements The authors would like to acknowledge the support and assistance of the ItalianDepartment of Civil Protection (DPC—Dipartimento della Protezione Civile), from which the majority ofthe damage data related to past earthquakes in Italy was obtained. In particular, the assistance of AgostinoGoretti and Giacomo di Pasquale in gaining access to such material was very truly valuable. In addition, theauthors would also like to acknowledge the support of the Italian Ministry of Research and Higher Education(MIUR – Ministero dell’Università e della Ricerca) through the financing of the project AIRPLANE (Advan-cing Interdisciplinary Research PLAtform on volcanoes aNd Earthquakes). Finally, the collaboration of MartaFaravelli in some of the elaborations carried out during this work is also gratefully acknowledged.
References
Borzi B, Pinho R, Crowley H (2008a) Simplified pushover-based vulnerability analysis for large scale assess-ment of RC buildings. Eng Struct 30(3):804–820
Borzi B, Crowley H, Pinho R (2008b) Simplified pushover-based earthquake loss assessment (SP-BELA) formasonry buildings. Int J Archit Herit (in press)
Braga F, Dolce M, Liberatore D (1982) A statistical study on damaged buildings and ensuing review of theMSK-76 scale. In: Proceedings of 7th European conference on earthquake engineering, Athens, September
Calvi GM, Pinho R, Magenes G, Bommer JJ, Restrepo-Veléz LF, Crowley H (2006) The development ofseismic vulnerability assessment methodologies for variable geographical scales over the past 30 years.ISET J Earthq Technol 43(3):75–104; Paper No. 472
CEN—Comite Europeen de Normalisation (2003) Eurocode 8, design of structures for earthquake resistance– part 1: general rules, seismic actions and rules for buildings. Pr-EN 1998-1. Final Draft. December 2003
Crowley H, Pinho R, Bommer JJ (2004) A probabilistic displacement-based vulnerability assessment proce-dure for earthquake loss estimation. Bull Earthq Eng 2(2):173–219. doi:10.1007/s10518-004-2290-8
Di Pasquale G, Orsini G, Romeo RW (2005) New developments in seismic risk assessment in Italy. BullEarthq Eng 3(1):101–128. doi:10.1007/s10518-005-0202-1
123

504 Bull Earthquake Eng (2008) 6:485–504
Dolce M, Masi A, Marino M, Vona M (2003) Earthquake damage scenarios of the building stock or Potenza(Southern Italy) including site effects. Bull Earthq Eng 1(1):115–140. doi:10.1023/A:1024809511362
Dwairi HM, Kowalsky MJ, Nau JM (2007) Equivalent damping in support of direct displacement-based design.J Earthq Eng 11(4):512–530
Faccioli E, Cauzzi C, Paolucci R, Vanini M, Villani M, Finazzi D (2007) Long period strong motion and its useas input to displacement based design. In: Proceedings of the 4th international conference on earthquakegeotechnical engineering, Thessaloniki, Greece
Frassine L, Giovinazzi S (2004) Basi di dati a confronto nell’analisi di vulnerabilità sismica dell’ediliziaresidenziale: un’applicazione per la città di Catania. In: Proceedings of the XI Congresso Nazionale“L’ingegneria Sismica in Italia”, Genova 25–29 January 2004 (in Italian)
Grünthal G (1998) “European macroseismic scale 1998,” Cahier du Centre Europeén de Géodynamique et deSéismologie, vol 15, Luxembourg
Gruppo di lavoro CPTI (2004). Catalogo Parametrico dei Terremoti Italiani, versione 2004 (CPTI04). INGV,Bologna
Iwan WD (2002) The use of equivalent linearization in performance based engineering. In: Proceedings ofinternational conference on advanced and new challenges in earthquake engineering research, Harbin,China
Meroni F, Petrini V, Zonno G (2000) “Distribuzione nazionale della vulnerabilità” Chapter 6 of: BernadiniA (ed) La vulnerabilità degli edifici: valutazione a scala nazionale della vulnerabilità sismica degli edificiordinari, CNR-Gruppo Nazionale per la Difesa dai Terremoti—Roma, 2000, 175 pp. + CD-ROM allegato(in Italian)
Orsini G (1999) A model for buildings’ vulnerability assessment using the parameterless scale of seismicintensity (PSI). Earthq Spectra 15(3):463–483. doi:10.1193/1.1586053
Ordinanza del Presidente del Consiglio dei Ministri (OPCM) n, 3274 del 20 Marzo 2003 [2003] Primi elementiin materia di criteri generali per la classificazione sismica del territorio nazionale e di normative tecnicheper le costruzioni in zona sismica. G.U. n. 72 del 8-5-2003. (in Italian)
Rossetto T, Elnashai A (2003) Derivation of vulnerability functions for European-type RC structures basedon observational data. Eng Struct 25:1241–1263. doi:10.1016/S0141-0296(03)00060-9
Rota M, Penna A, Strobbia C (2006) Typological fragility curves from Italian earthquake damage data. Pro-ceedings 1st European conference on earthquake engineering and seismology, Geneva, paper no. 386
Sabetta F, Pugliese A (1987) Attenuation of peak horizontal acceleration and velocity from Italian strong-motion records. Bull Seismol Soc Am 77:1491–1513
Sabetta F, Pugliese A (1996) Estimation of response spectra and simulation of nonstationary earthquake groundmotions. Bull Seismol Soc Am 86(2):337–352
Sabetta F, Goretti A, Lucantoni A (1998) Empirical fragility curves from damage surveys and estimated strongground motion. In: Proceedings of 11th European conference on earthquake engineering, Paris
Scawthorn C, Iemura H, Yamada Y (1981) Seismic damage estimation for low- and mid-rise buildings inJapan. Earthq Eng Struct Dyn 9:93–115. doi:10.1002/eqe.4290090202
Shinozuka M, Chang SE, Eguchi RT, Abrams DP, Hwang HHM, Rose A (1997) Advances in earthquake lossestimation and application to Memphis, Tennessee. Earthq Spectra 13(4):739–758. doi:10.1193/1.1585978
Spence R, Coburn RW, Pomonis A (1992) Correlation of ground motion with building damage: the definitionof a new damage-based seismic intensity scale. In: Proceedings of 10th World conference on earthquakeengineering, Rotterdam
Whitman RV, Reed JW, Hong ST (1973) Earthquake damage probability matrices. In: Proceedings of the FifthWorld conference on earthquake engineering
Zuccaro G (ed) (2004) Inventario e vulnerabilità del patrimonio edilizio residenziale del territorio nazionale,mappe di rischio e perdite socio – economiche. Available from URL: http://www.ingv.it/gndt/Att_scient/Prodotti_attesi_2004/Dolce_Zuccaro/Mappe/Start2.htm. (in Italian)
123