density measurement sensitivity to varying borehole angle and tool azimuth in medium to thin beds
TRANSCRIPT

SPWLA 48th Annual Logging Symposium, June 3-6, 2007
1
DENSITY MEASUREMENT SENSITIVITY TO VARYING BOREHOLE ANGLE AND TOOL AZIMUTH IN MEDIUM TO THIN BEDS
A. Badruzzaman,* A. Mendoza,† E. J. Stockhausen,** B. A. Reik*
Copyright 2007, held jointly by the Society of Petrophysicists and Well Log Analysts (SPWLA) and the submitting authors. This paper was prepared for presentation at the SPWLA 48th Annual Logging Symposium held in Austin, Texas, United States, June 3-6, 2007. ABSTRACT We report on a Monte Carlo radiation transport simulation study that assesses the effect on the estimated bulk density due to variation of three key parameters in horizontal/ high-angle (HA/HZ) wells. These parameters are 1) the hole-angle, 2) bed thickness and 3) tool azimuth as the tool traverses beds of varying thickness. The major findings were, 1) significant errors can result from using standard compensation in thin beds, 2) density correction decreases at higher well-bore inclination, 3) benefit from enhanced or so-called alpha processing decreases as bore-hole angle increases and may even add to errors, 4) the tool azimuth angle has a significant effect in bed boundary detection, but a lesser effect on resolution, and 5) the density log response can see a non-symmetric volume based on whether one exits or enters lower density bed. Comparison with field data from Africa indicated a clear presence of the effects seen from modeling. INTRODUCTION As the number of high-angle/horizontal (HA/HZ) wells drilled increase, accurate estimation of porosity using nuclear techniques has been of considerable concern. Recent field examples (Renderio et al., 2005, Radtke et al., 2006, Badruzzaman et al., 2007) have shown that the estimated porosity in typical reservoir-quality thin-bedded formations may be 3-4 porosity units (p.u.) higher than would be from vertical wells. Such uncertainty can impact reserves estimates and the quality of geosteering. Badruzzaman et al., 2007 also reported an example where the density obtained in the presence of medium to thin beds through HA/HZ wells agreed well with core data while density through vertical wells did not. Badruzzaman et. al., 2007, also discuss a number of issues that may affect the accuracy of porosity estimated though HA/HZ well in medium to thin beds.
These include highlights of the effect of hole-angle variation on estimated density described in detail in the present paper, LWD tool placement relative to interfaces of thin beds, variable standoff in LWD, and gas absorption by certain muds which can result in a dynamic variation of the properties of the invasion fluid and hence of the tool response. Density measurements through HA/HZ wells, especially in reservoirs with thin beds have been of particular interest recently, as we log more wells with LWD density only to estimate the bulk density and construct images. In vertical wells, source-to-detector (S-D) spacing governs the limits of a tool to resolve thin (horizontal) beds. This has led to use of the short-detector response to compensate or “alpha-process” in order to improve the accuracy of the long-spaced detector density (in a dual-detector tool) to obtain the final density. In horizontal wells, the resolution of such beds will be governed by the depth of investigation (DOI) of the detector. At angles in-between it will be a combination of the two, thus raising issues about the adequacy of usual density compensation/correction procedures in HA/HZ wells. Previous analysis in such wells included, 1) a study of hole-angle effects in 16” laminations (Mendoza et al., 2006), 2) effect of density contrast across interfaces of contrasting beds (Yin et al., 2006), and 3) effects in thin beds at two end points defined by a vertical and a horizontal well (Radtke et al., 2006). In this paper we study the effect of three key parameters in HA/HZ wells, 1) hole-inclination, 2) bed thickness and 3) tool azimuth, on measured density. The bed thicknesses studied were 8, 6, 4 and 2 inches. We utilize three-dimensional Monte Carlo radiation transport code, MCNP, from Los Alamos (Edited by Briesmeister, 2003) to compute detector fluxes of a model dual-detector density tool in these conditions. We construct long-spaced (LS) and short-spaced (SS) densities from the fluxes utilizing usual procedures. We then construct a compensated bulk density by using the spine-and-ribs approach. We also compute the so-called enhanced or alpha-processed density. We examine two alternative density correction procedures, based on using the SS density. We then compare the conclusions of the modeling study with field data from a high-angle/horizontal well with thin beds.
___________________ *Chevron Energy Technology Company, San Ramon, CA †University of Texas, Austin, TX: 2006 Summer intern at Chevron Energy Technology Co., San Ramon, CA **Chevron Energy Technology Company, Houston, TX
J

SPWLA 48th Annual Logging Symposium, June 3-6, 2007
2
SIMULATION: METHODOLOY, MODEL TOOL CHARACTERISTICS AND DENSITY INTERPRETATION Methodology and Model Density Tool Characteristics: In the present study, we utilize MCNP code to simulate the response of the so-called Longhorn model density tool reported by Mendoza, at al., 2005. It consists of a 1.5-curie Cs137 source with two sodium iodide detectors. The source and the detectors are placed within a tungsten-pad housing which in turn is located inside the tool wall made of iron. Usual windows are placed into the tool pad to allow gamma rays from the source reaching the formation and back-scattered gamma ray reaching the detectors from the formation. The long-spaced (LS) and short-spaced (SS) detectors are located at 18 inches and 9 inches, respectively, from the source. The model tool is a wireline tool. In the simulation we will place it along the borehole wall. Thus, the configuration would closely mimic the bottom quadrant of an LWD tool. We do not study the effect of standoff or mudcake. Formation Properties: In the present study we construct thin beds using a reservoir quality rock of 2.0 gm/cc and a non-reservoir rock of 2.6 gm/cc, picked based on our examination of core data graphically displayed in Figure 1. The actual composition of each rock type used in the model is listed in Table 1 and was adapted from Radtke et al., 2006, who also utilized the information in Figure 1. Density Interpretation- Standard Approach: The Monte Carlo simulation provides fluxes which are then processed into a density for each detector using the usual approach. We utilize a MATLIB script to automate the procedure for the several thousand Monte Carlo simulations the study required. We then construct the compensated density from
)( ρρρ Δ+= LSB , (1) where ρLS is the LS density and Δρ is the correction from the usual “spine-and-ribs” methodology. Since the depth of investigation (DOI) determines the bed resolution in horizontal wells, we compute this for each detector by obtaining the sensitivity of detector response to the signal coming from various radial depths. Figure 2 displays this for a 25-p.u. water-filled quartz formation. We estimate that 90% of the response of the SS detector comes from within 2.42 inches of the formation thickness relative to borehole wall and that of the LS detector arises from
within 4.43 inches. We will term these the DOI of SS detector and LS detector, respectively. Since we would simulate the tool response across bed-boundaries, as we rotate the tool along the borehole wall, we estimated the angle of transition across the interface of the 2 gm/cc bed and the 2.6 g/cc bed from Monte Carlo results. From Figure 3 we note that the angle of transition is approximately 45 degrees. Note the asymmetry between the two detectors as they transition from the high-density zone into the low-density zone and vice versa. Bed Resolution-Enhanced or Alpha Processing: As we will see, the correction entailed in Eq. 1 can degrade the vertical resolution. In order to improve this, we test a procedure developed by Flaum et al., 1987, for vertical wells. It incorporates the vertical information contained in the SS detector. Specifically, the procedure modifies, as follows, the bulk-density computed in Eq. 1:
)( SSSSBenh ρρρρ −+= , (2) where ρB is the standard “spine-and-ribs” density, ρSS is the un-averaged SS detector density and SSρ is its value averaged to match the vertical resolution of
Bρ . Bed Resolution- Alternative Processing: We will note later in the paper that the usual enhanced or alpha-processing noted in Eq. 2, generally overcomes the erroneous behavior of the compensated density in vertical wells with thin beds. However, the value of this processing technique diminishes as the hole-angle increases and at very high angles it can add to the error. Consequently, we examine the two following conceptual approaches to overcome these challenges. Resolution-matched Short-spaced Density (N-rm): In order to match the resolution, we use a filter that is an average of the SS density for an interval of 10 sample points in units of 1.2 inches. The half size of the filter is 6 inches. Thus, one point is the average of the previous 5 and the next 5 sample points. SS-Compensated Density: We define this by
)( ρρρ Δ+=− SSCompSS . (3) The above approach was examined based on the premise, as borne out by our results, that for thin beds in HA/HZ wells, the SS density is more accurate and shows the correct trend relative to standard

SPWLA 48th Annual Logging Symposium, June 3-6, 2007
3
compensated or enhanced density, especially as the hole angle increases. However, this is not a standard approach and can have its own challenges. For example, the short-spaced detector can have a large borehole correction from hole rugosity. HOLE-ANGLE AND BED-THICKNESS VARIATION 8-inch Beds: Figure 4 displays the hole angles studied with 8-inch thick beds. In each case the sampling point is at the true vertical depth (TVD). Figure 5 displays the individual detector density, the compensated density from Eq. 1 and the enhanced density from Eq. 2. Note that at zero degrees (vertical well), the SS detector density is the most accurate. This is not surprising since the S-D spacing of this detector which determines its vertical resolution, is of the order of the bed thickness. The S-D spacing of the LS detector is over twice as large as the bed thickness and thus the detector is unlikely to resolve the bed. This is illustrated by the LS density response in Figure 5. The compensated density displayed in Figure 5 shows an interesting feature in the vertical well, namely, an anti-correlation with the actual density Note that this anti-correlation is also shown at 25 degrees. An extrapolation showed that the correct trend would pick up around a 40-degree hole-inclination. These arise from the rather large correction, Δρ, displayed in Figure 6 for hole-angles up to 50 degrees. For example, the maximum “correction” in the thin lower density bed +0.10 gm/c at the maximum point and while it was more than -0.15 gm/cc in the thin high density bed. The enhanced density in Figure 5 shows the correct trend in the vertical well and all hole angles. However, it does not add value beyond 50 degrees and in fact can add errors at higher angles. We note that at 85 degrees it may lower the density of the 2 gm/cc bed by approximately 0.1 gm/cc. From Figure 7 we note that the resolution matching improves the SS-spaced response interpretation at high angles. Figure 8 shows that at high angles SS-Compensated density does better than the enhanced density which had shown a considerable error in the low-density bed. 4-inch Beds: Figure 9 displays the various estimates of density in this bed size as the hole-angle varies. Note that at zero degree (vertical), the SS response shows the best correlation. All density estimates
show an asymmetry at interfaces. This is most prominent for compensated and enhanced techniques. The anti-correlation seen in the compensated density for eight-inch beds is not present at the four-inch bed thickness. This is because the correction (Δρ) is smaller, as displayed in Figure 10. Citing results of a study of the response of a commercial LWD density sonde, in horizontal vs. vertical wells, Badruzzaman et al., 2007, noted that the compensated density from the LWD density tool will show an anti-correlation with four-inch beds, while for the model tool we note that the anti-correlation arises for eight-inch beds but not with four-inch beds. The model tool is not an LWD tool and the design features will be different. This clearly points to a possible effect of the interplay of design details of the tool and the bed thickness. From results not displayed in the paper we saw that at low hole-angles (near-vertical), the SS density displays more sensitivity than the SS-resolution-matched density (N-rm). However, the two coalesce at high angles. We also saw that the SS-Compensated density from Eq. 3 is a bit less sensitive than the SS-density but it exhibits less asymmetry near bed boundary. However, the benefit of the procedure was not as significant as was for the eight-inch beds. TOOL AZIMUTH- ROTATION Figure 11 displays the various tool azimuth orientations studied in a horizontal well. The zero degree is defined when the tool is looking up relative to the (horizontal) interface. For each angle, the well is initially placed at the interfaces of two beds. The well is then moved down (in the model) across the beds at a 1.2 inch steps. The procedure is then repeated for each tool azimuth angle displayed in Figure 11. 8-inch Beds: Figure 12 displays the density in a horizontal well across 8-inch beds for several angles of rotation (or tool azimuth angles.) The reference depth is with respect to the depth position of the two detectors. The modeled points shown connected should not be construed as a log. Note the asymmetry seen at zero degrees as the well moves across the boundary from the high to low density zone and vice versa. The response also indicates a small but noticeable horn-like behavior for the SS detector. The asymmetry shifts to higher relative depth as the tool azimuth angle at which the tool points to increases as the borehole is moved across the interface. When the angle is 90 degrees, one achieves the maximum symmetry. As the angle
J

SPWLA 48th Annual Logging Symposium, June 3-6, 2007
4
increases farther, the pattern shifts to the other end of relative depth. However the behavior at 180 degrees when the tool is pointing down is not a mirror image of the behavior at zero when the tool is pointing up. This is related to the forward-peaked nature of Compton scattering which makes the density response asymmetric between whether one is going from high density to low density or vice versa. Figure 12 also shows that at zero degree tool azimuth (tool looking up), the compensated density pushes the low-density estimate into the high density zone below the reference depth. The same happens at 180 degrees but above the reference depth. Note the zero-degree and 180-degree behavior are almost mirror images. Also note that one would obtain an accurate estimate of the density around the mid-region of the bed when the tool azimuth is 90 degrees. Figure 12 further displays the behavior of the enhanced density. The asymmetry seen at low angles and high angles, and the near-symmetry at 90 degrees, similar to that seen for the compensated density is evident. However, note the significant error the procedure adds to the estimated density of the bed. From results not displayed here we saw that resolution matching approach smooths out the horns seen in the SS-density and reduces the asymmetry significantly yielding a fairly accurate density of the thin low-density bed. The SS-Compensated procedure does display an asymmetry but it is considerably more accurate than the enhanced density. 4-inch Beds: Figure 13 displays the individual detector density, the compensated density and the enhanced density when the problem in Figure 11 is repeated with four-inch beds. Note the shift in the asymmetry in the individual detector response as one moves from one end of the tool azimuth angle range to the other. As in the case of eight-inch beds, maximum symmetry occurs at 90 degrees. Figure 13 also displays an anti-correlation of the compensated density. The enhanced density does not significantly alter the anti-correlation. Here the SS-resolution-matched (N-rm) density reduces the asymmetry of the SS density significantly. The SS-Compensated density has a somewhat better density response behavior than the enhanced density, in terms of staying within the density bounds of the beds and asymmetry. 2-inch beds: Figure 14 displays that the LS density, not unexpectedly, does not show much sensitivity
traversing the bed boundary, except that the asymmetry is still noticeable. The SS density shows the asymmetry seen for eight-inch and four-inch beds but is still able to display noticeable density sensitivity. This is not surprising in view of its shallow DOI (2.43 inches vs. the two-inch thickness of the beds here). The compensated density displays the anti-correlation seen in four-inch beds. The enhanced density does show the correct trend but also displays the progression of asymmetry seen for other bed thicknesses. We found that the resolution-matched density (N-rm) did not show much contrast to the density variation across beds. Also, the SS-Compensated density looked very similar to the SS-density. The compensation did not add much value here because the bed thickness is approximately of the order of the DOI of the SS detector and thus compensation would not change its character. DENSITY IMAGES Figure 15 displays, in the form of density images, the results of tool azimuth variation in Figure 11, in four-inch beds. As expected, the largest contrast in density is between SS- and LS-density images. However, since we are dealing with a horizontal well, where depth of investigation determines the bed resolution, these differences are much less than would be in a vertical well, where the source-detector spacing determines bed resolution. The LS-density image shows a somewhat thicker bed than the SS-density image or a larger transition from one density to the other (colored cells between the red and the blue). This is because of the greater depth of investigation of the LS detector. As expected, the compensated density has a resolution similar to that of the LS density. The image from the enhanced density reflects what we saw previously, namely enhanced processing does not add value at high angle wells. We saw similar behavior for other bed thicknesses. Since we modeled a wireline tool, the images in Figure 15 have no standoff anywhere around the perimeter of the borehole. Thus, the sinusoid is continuous and has a constant true stratigraphic thickness (TST) which would not normally be the case for an LWD image. However, even in this “ideal” setting, with no standoff, we note that images display much less contrast than we saw in the quantitative density values seen in Figure 9. This points to the need for care in using density images constructed in HA/HZ wells.
SPWLA 48th Annual Logging Symposium, June 3-6, 2007
5
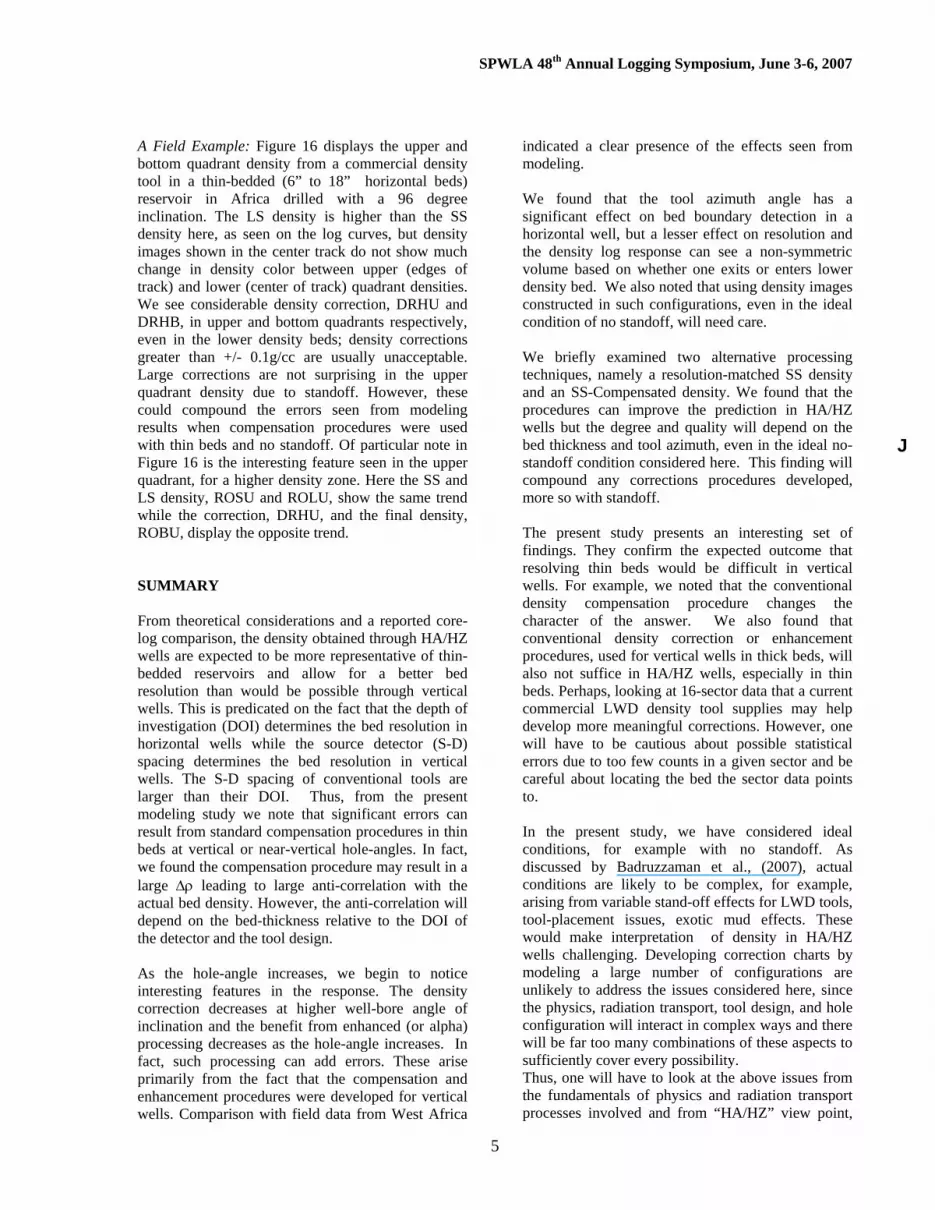
A Field Example: Figure 16 displays the upper and bottom quadrant density from a commercial density tool in a thin-bedded (6” to 18” horizontal beds) reservoir in Africa drilled with a 96 degree inclination. The LS density is higher than the SS density here, as seen on the log curves, but density images shown in the center track do not show much change in density color between upper (edges of track) and lower (center of track) quadrant densities. We see considerable density correction, DRHU and DRHB, in upper and bottom quadrants respectively, even in the lower density beds; density corrections greater than +/- 0.1g/cc are usually unacceptable. Large corrections are not surprising in the upper quadrant density due to standoff. However, these could compound the errors seen from modeling results when compensation procedures were used with thin beds and no standoff. Of particular note in Figure 16 is the interesting feature seen in the upper quadrant, for a higher density zone. Here the SS and LS density, ROSU and ROLU, show the same trend while the correction, DRHU, and the final density, ROBU, display the opposite trend. SUMMARY From theoretical considerations and a reported core-log comparison, the density obtained through HA/HZ wells are expected to be more representative of thin-bedded reservoirs and allow for a better bed resolution than would be possible through vertical wells. This is predicated on the fact that the depth of investigation (DOI) determines the bed resolution in horizontal wells while the source detector (S-D) spacing determines the bed resolution in vertical wells. The S-D spacing of conventional tools are larger than their DOI. Thus, from the present modeling study we note that significant errors can result from standard compensation procedures in thin beds at vertical or near-vertical hole-angles. In fact, we found the compensation procedure may result in a large Δρ leading to large anti-correlation with the actual bed density. However, the anti-correlation will depend on the bed-thickness relative to the DOI of the detector and the tool design. As the hole-angle increases, we begin to notice interesting features in the response. The density correction decreases at higher well-bore angle of inclination and the benefit from enhanced (or alpha) processing decreases as the hole-angle increases. In fact, such processing can add errors. These arise primarily from the fact that the compensation and enhancement procedures were developed for vertical wells. Comparison with field data from West Africa
indicated a clear presence of the effects seen from modeling. We found that the tool azimuth angle has a significant effect on bed boundary detection in a horizontal well, but a lesser effect on resolution and the density log response can see a non-symmetric volume based on whether one exits or enters lower density bed. We also noted that using density images constructed in such configurations, even in the ideal condition of no standoff, will need care. We briefly examined two alternative processing techniques, namely a resolution-matched SS density and an SS-Compensated density. We found that the procedures can improve the prediction in HA/HZ wells but the degree and quality will depend on the bed thickness and tool azimuth, even in the ideal no-standoff condition considered here. This finding will compound any corrections procedures developed, more so with standoff. The present study presents an interesting set of findings. They confirm the expected outcome that resolving thin beds would be difficult in vertical wells. For example, we noted that the conventional density compensation procedure changes the character of the answer. We also found that conventional density correction or enhancement procedures, used for vertical wells in thick beds, will also not suffice in HA/HZ wells, especially in thin beds. Perhaps, looking at 16-sector data that a current commercial LWD density tool supplies may help develop more meaningful corrections. However, one will have to be cautious about possible statistical errors due to too few counts in a given sector and be careful about locating the bed the sector data points to. In the present study, we have considered ideal conditions, for example with no standoff. As discussed by Badruzzaman et al., (2007), actual conditions are likely to be complex, for example, arising from variable stand-off effects for LWD tools, tool-placement issues, exotic mud effects. These would make interpretation of density in HA/HZ wells challenging. Developing correction charts by modeling a large number of configurations are unlikely to address the issues considered here, since the physics, radiation transport, tool design, and hole configuration will interact in complex ways and there will be far too many combinations of these aspects to sufficiently cover every possibility. Thus, one will have to look at the above issues from the fundamentals of physics and radiation transport processes involved and from “HA/HZ” view point,
J

SPWLA 48th Annual Logging Symposium, June 3-6, 2007
6
instead of using procedures developed for vertical wells or trying to devise “correction” charts in a conventional manner. Perhaps, adding sensors or additional measurements would alleviate the challenges. We can possibly utilize the anti-correlation displayed by the compensated density in the presence of thin beds, in conjunction with individual detector densities, to diagnose the presence of thin beds which can then allow us to judiciously utilize correction algorithms. Finally, we found that due to the complexity of the conditions considered here, the Monte Carlo technique was essential to study them. However, the computational resources required were enormous. We ran over 3600 simulations on multiple, dedicated Linux machines and utilized over 2200 CPU hours in a span of two months. Clearly, access to such resources is not common-place. Thus, we need to consider alternative modeling approaches. Three-dimensional deterministic radiation transport methods, which were less intensive, were tested successfully for neutron transport in logging problems (Badruzzaman, 1991). But such methods are unlikely to sufficiently represent the mix that arises here of very complicated geometry and the photon transport which is inherently more directional. One alternative could be an adequately benchmarked sensitivity function technique. Such techniques were utilized previously in the nuclear reactor applications (Cacuci, 1980, Badruzzaman and Becker, 1981) and also reported previously by Watson, et al., 1987 and Case et al., 1994 for modeling nuclear tool response. The present proceedings also report on such an adaptation (Mendoza, et al., 2007) for studying nuclear tool response. REFERENCES
Badruzzaman, A and Becker, M., 1981, Simplified Procedures for Fast Reactor Fuel Cycle and Sensitivity Analysis, Nuclear Technology, Vol. 52, p198-213. Badruzzaman, A., 1991, Computational Methods in Nuclear Geophysics, Progress in Nuclear Energy, Vol. 25, No. 2-3, pp265-290. Badruzzaman, A., Stockhausen, E. J., and Reik, B. A., 2007, Accuracy of Porosity Measured in High-angle and Horizontal Wells: An Overview, in First SPWLA India Symposium Transactions, Mumbai, India, March 19-20. Briesmeister, J, Editor, 2003 MCNP, A General Monte Carlo N-Particle Transport Code, Version 5, Los Alamos National Laboratory, Los Alamos, NM, USA.
Case, C., Watson, C., Lawrence, R., 1994, Sensitivity function technique for modeling nuclear tools, US Patent No. 5334833, Issued August 2. Cacuci, D., 1980, Generalized sensitivity theory for systems of coupled nonlinear equations, Report NUREG/CR-1003;ORNL/NUREG/TM-349, Oak Ridge National Lab., TN, January 1. Flaum., C, Galford, J. E., Hasting, A., 1987, Enhanced Vetical Resolution Processing of Dual- Detector Gamma-Gamma Density Logs,” Paper M: in 28th Annual Logging Symposium Transactions: Society of Petrophysicists & Well Log Analysts. Mendoza, A., Preeg, W. E., Torres-Verdin, C., and Alpak, F. O., 2005, Monte Carlo Modeling of Nuclear Measurements I Vertical and Horizontal Wells in the presence of Mud Filtrate Invasion and Salt Mixing, Paper PP: in 46th Annual Logging Symposium Transactions: Society of Petrophysicists & Well Log Analysts. Mendoza, A., Torres-Verdin, C., Preeg, W. E., 2006, Environmental and Petrophysical Effects on Density and Neutron Porosity Logs Acquired in Highly Deviated Wells, Paper EEE: in 47th Annual Logging Symposium Transactions: Society of Petrophysicists & Well Log Analysts. Mendoza, A., Torres-Verdin, C., and Preeg, W. E., 2007, Rapid Simulation of Borehole Nuclear Measurements with Spatial Flux-Scattering Functions, in 48th Annual Logging Symposium Transactions: Society of Petrophysicists & Well Log Analysts. Radtke, R. J., Evans, M, Rasmus, J. C., Ellis, D. V., Chiaramonte, J. M., Case, C. R., Stockhausen, E. J., 2006, LWD Density Response to Bed Laminations in Horizontal and Vertical Wells, Paper ZZ: in 47th Annual Logging Symposium Transactions: Society of Petrophysicists & Well Log Analysts. Rendeiro, C., Passey, Q. R., Yin, H., and Fitz, D. E., 2005, The Conundrum of Formation Evaluation in High-Angle/ Horizontal Well: Observations and Recommendations, SPE 96898: in Transactions Annual Technical Conference and Exhibition, Society of Petroleum Engineers. Watson, C. C., 1984, Monte Carlo Computation of Differential Sensitivity Function, Trans. American Nuclear. Society, Vol. 46, p655. Yin, H., Han, X., XU, L., Guo, W., Shehata, A., Gardener, R. P., 2006, Field and Benchmark Studies of LWD Nuclear Tool Response in High Angle and Horizontal Wells, Paper AAA: in 47th Annual Logging Symposium Transactions: Society of Petrophysicists & Well Log Analysts. ACKNOWLEDGEMENT The authors thank Don Seeburger of Chevron for reading the manuscript and suggesting changes. They

SPWLA 48th Annual Logging Symposium, June 3-6, 2007
7
thank Chevron Energy Technology Co for supporting the research and permission to publish. ABOUT THE AUTHORS Ahmed Badruzzaman specializes in advanced subsurface nuclear measurement and computational techniques. He leads the R&D effort in Chevron to utilize these techniques in their operations worldwide. At University of California, Berkeley, he teaches a graduate course and guides doctoral research on these topics. His current research interests are nuclear tool response in HA/HZ wells, saturation monitoring, nuclear spectroscopy and “deep-look” nuclear probing. Ahmed was an Adjunct Professor at Texas A&M University, College Station in 1994-97. He came to Chevron in 1991 via Babcock & Wilcox, Schlumberger-Doll Research and Sandia National Laboratories where he had led nuclear R&D projects. Ahmed is a Fellow of American Nuclear Society and a 2006-2007 Distinguished Lecturer of the SPE. He was a 2002-2003 Distinguished Speaker of the SPWLA and Chairman of the 1999 SPE North America Forum on Cased-hole Technology. He is the coordinator of the Oil Industry Special Interest Group on Nuclear Logging. Ahmed earned a Ph.D in Nuclear Engineering & Science from Rensselaer Polytechnic Institute, Troy, New York in 1979. Contact: [email protected] Alberto Mendoza is a Graduate Research Assistant and a PhD student in the Department of Petroleum and Geosystems Engineering at The University of Texas at Austin. He received both Bachelor of Science and Master of Science degrees in Petroleum Engineering from The University of Texas at Austin in 2002 and 2005, respectively. From 2002 to 2003 he worked for Schlumberger as a field engineer in well testing. He has been an intern at Schlumberger-Doll Research and Chevron. He was granted a 2003-2004 scholarship by the SPWLA. His research interests include petrophysics, log analysis, inverse problems, and well testing. Ed Stockhausen is a Senior Research Scientist at Chevron Energy Technology Company and is based in Houston, Texas. He graduated from University of Florida with an MS degree in geology in 1981. Over the next 16 years, he held various exploration and production positions in Chevron, New Orleans, focusing on Gulf of Mexico developments. For the past eight years, Ed has been responsible for leading development and deployment of geo-steering technology for Chevron worldwide. He has presented posters and papers at various technical conferences, forums, and society meetings on horizontal well case histories, geo-steering methods, the design of well paths, and the pitfalls of directional surveying practices. Barry Reik is a petrophysicist for Chevron Energy Technology Company in San Ramon, California. His
main interests are probabilistic analysis for minerals and facies, analyzing and modeling Logging While Drilling data, and formation pressure integration into whole field reservoir characterization models. He leads the Chevron corporation petrophysical training efforts, and has been an instructor at The University of Missouri at Rolla and a guest instructor at Stanford University. Barry Reik graduated in 1976 from the University of Wisconsin -Milwaukee with a bachelor’s degree in Geological Sciences and graduated in 1980 from Florida State University with a M.S. in Geology. He worked at the Florida Bureau of Geology before spending the last 26 years with Chevron. He served in numerous official roles in local SPWLA chapters and co-chaired the 1992 SPWLA Topical Conference on Invasion and Permeability.
Table 1 Low- and high-density bed composition
(Adopted from Radtke et al., 2006).
Low- Density
Bed High- Density
Bed Composition (Vol. %) (Vol. %)
Quartz 60.00% 62.00% Calcite 0.00% 30.00% Illite 0.00% 4.00%
Water 40.00% 4.00% Density (g/cc) 2.00 2.60
Figure 1. Core End Member Points Utilized in Modeling
Core
1 ft
Core
1 ft1 ft1 ft
Siltstone and SS:– High porosity– Good oil saturation– ρ = 2.0 g/cm3
Silty limestone:– Low porosity– Little or no oil saturation– ρ = 2.6 g/cm3
Sections from core plugs
Calcite shaded pinkCalcite shaded pink
Pore space shaded blue
J

SPWLA 48th Annual Logging Symposium, June 3-6, 2007
8
Figure 3. Determination of tool azimuth sensitivity across an interface in a horizontal well. The x-axis shows tool azimuth angle in the borehole from the top. The left (shaded) layer is the low density material and the right is the high density material. A transition zone of approximately 45 degrees represents the total tool azimuth sensitivity.
Transition ZoneTransition Zone
Figure 2. Percent of total sensitivity for the SS and LS detectors as a function of radial depth into the formation.

SPWLA 48th Annual Logging Symposium, June 3-6, 2007
9
Figure 4. Density tool measurement of the same sampling point in True Vertical Depth (TVD) at different hole-inclination angles. The figure shows the different volumes of the two rocks within the resolution of the tool at the same relative depth in TVD for several hole-angles.
0
4
8
12
16
-4
-8
-12
-16
-20
-24
X Y
ρ = 2.0 g/cm3
ρ = 2.6 g/cm3
borehole angle = 0 °
0
4
8
12
16
-4
-8
-12
-16
-20
-24
X
Y
ρ = 2.0 g/cm3
ρ = 2.6 g/cm3
borehole angle = 75 °
0
4
8
12
16
-4
-8
-12
-16
-20
-24
X Y
ρ = 2.0 g/cm3
ρ = 2.6 g/cm3
borehole angle = 25 °
0
4
8
12
16
-4
-8
-12
-16
-20
-24
X Y
ρ = 2.0 g/cm3
ρ = 2.6 g/cm3
borehole angle = 50 °
0
4
8
12
16
-4
-8
-12
-16
-20
-24
X
Y
ρ = 2.0 g/cm3
ρ = 2.6 g/cm3
borehole angle = 85 °
J

SPWLA 48th Annual Logging Symposium, June 3-6, 2007
10
Figure 5. SS, LS, compensated and enhanced density from of a model density tool vs. hole-angle in 8-inch beds, from Monte Carlo simulation. Shaded beds are low-density (2.0 gm/cc) and white beds are high density (2.6 gm/cc). Note the anti-correlation at zero-degree hole-inclination (vertical) and at 25 degrees. Also, note the overestimation by the enhanced density at 75 and 85 degrees. Figure 6. Density correction (Δρ) to compute compensated density across 8-inch beds for several hole-inclination angles in relative TVD.

SPWLA 48th Annual Logging Symposium, June 3-6, 2007
11
Figure 7. SS resolution-matched density (N-rm) vs. SS density for enhanced processing across 8-inch beds for several hole-inclination angles in relative TVD. Figure 8. Enhanced density and the SS-Compensated density across 8-inch beds for several hole-inclination angles in relative TVD.
J

SPWLA 48th Annual Logging Symposium, June 3-6, 2007
12
Figure 9. SS, LS, compensated and enhanced density from a model density tool vs. hole-angle in 4-inch beds. Shaded beds are low-density (2.0 gm/cc) and white beds are high density (2.6 gm/cc) Figure 10. Density correction (Δρ) across 4-inch beds for hole-inclination angles in relative TVD.

SPWLA 48th Annual Logging Symposium, June 3-6, 2007
13
xy
8”
ρ = 2.6 g/cm3
ρ = 2.6 g/cm3
ρ = 2.6 g/cm3
0
4
8
12
-4
-8
-12 xy
8”
ρ = 2.6 g/cm3
ρ = 2.6 g/cm3
ρ = 2.6 g/cm3
0
4
8
12
-4
-8
-12 xy
8”
ρ = 2.6 g/cm3
ρ = 2.6 g/cm3
ρ = 2.6 g/cm3
0
4
8
12
-4
-8
-12
xy
8”
ρ = 2.6 g/cm3
ρ = 2.6 g/cm3
ρ = 2.6 g/cm3
0
4
8
12
-4
-8
-12 xy
8”
ρ = 2.6 g/cm3
ρ = 2.6 g/cm3
ρ = 2.6 g/cm3
0
4
8
12
-4
-8
-12
xy
8”
ρ = 2.6 g/cm3
ρ = 2.6 g/cm3
ρ = 2.6 g/cm3
0
4
8
12
-4
-8
-12 xy
8”
ρ = 2.6 g/cm3
ρ = 2.6 g/cm3
ρ = 2.6 g/cm3
0
4
8
12
-4
-8
-12 xy
8”
ρ = 2.6 g/cm3
ρ = 2.6 g/cm3
ρ = 2.6 g/cm3
0
4
8
12
-4
-8
-12
0 deg
67.5 deg 90 deg 112.5 deg
135 deg 157.5 deg 180 deg
22.5 deg
xy
8”
ρ = 2.6 g/cm3
ρ = 2.6 g/cm3
ρ = 2.6 g/cm3
0
4
8
12
-4
-8
-12
45 deg
xy
8”
ρ = 2.6 g/cm3
ρ = 2.6 g/cm3
ρ = 2.6 g/cm3
0
4
8
12
-4
-8
-12xy
8”
ρ = 2.6 g/cm3
ρ = 2.6 g/cm3
ρ = 2.6 g/cm3
0
4
8
12
-4
-8
-12xy
8”
ρ = 2.6 g/cm3
ρ = 2.6 g/cm3
ρ = 2.6 g/cm3
0
4
8
12
-4
-8
-12 xy
8”
ρ = 2.6 g/cm3
ρ = 2.6 g/cm3
ρ = 2.6 g/cm3
0
4
8
12
-4
-8
-12xy
8”
ρ = 2.6 g/cm3
ρ = 2.6 g/cm3
ρ = 2.6 g/cm3
0
4
8
12
-4
-8
-12xy
8”
ρ = 2.6 g/cm3
ρ = 2.6 g/cm3
ρ = 2.6 g/cm3
0
4
8
12
-4
-8
-12 xy
8”
ρ = 2.6 g/cm3
ρ = 2.6 g/cm3
ρ = 2.6 g/cm3
0
4
8
12
-4
-8
-12xy
8”
ρ = 2.6 g/cm3
ρ = 2.6 g/cm3
ρ = 2.6 g/cm3
0
4
8
12
-4
-8
-12xy
8”
ρ = 2.6 g/cm3
ρ = 2.6 g/cm3
ρ = 2.6 g/cm3
0
4
8
12
-4
-8
-12
xy
8”
ρ = 2.6 g/cm3
ρ = 2.6 g/cm3
ρ = 2.6 g/cm3
0
4
8
12
-4
-8
-12xy
8”
ρ = 2.6 g/cm3
ρ = 2.6 g/cm3
ρ = 2.6 g/cm3
0
4
8
12
-4
-8
-12xy
8”
ρ = 2.6 g/cm3
ρ = 2.6 g/cm3
ρ = 2.6 g/cm3
0
4
8
12
-4
-8
-12 xy
8”
ρ = 2.6 g/cm3
ρ = 2.6 g/cm3
ρ = 2.6 g/cm3
0
4
8
12
-4
-8
-12xy
8”
ρ = 2.6 g/cm3
ρ = 2.6 g/cm3
ρ = 2.6 g/cm3
0
4
8
12
-4
-8
-12xy
8”
ρ = 2.6 g/cm3
ρ = 2.6 g/cm3
ρ = 2.6 g/cm3
0
4
8
12
-4
-8
-12 xy
8”
ρ = 2.6 g/cm3
ρ = 2.6 g/cm3
ρ = 2.6 g/cm3
0
4
8
12
-4
-8
-12xy
8”
ρ = 2.6 g/cm3
ρ = 2.6 g/cm3
ρ = 2.6 g/cm3
0
4
8
12
-4
-8
-12xy
8”
ρ = 2.6 g/cm3
ρ = 2.6 g/cm3
ρ = 2.6 g/cm3
0
4
8
12
-4
-8
-12
0 deg0 deg
67.5 deg 90 deg 112.5 deg
135 deg 157.5 deg 180 deg
22.5 deg22.5 deg
xy
8”
ρ = 2.6 g/cm3
ρ = 2.6 g/cm3
ρ = 2.6 g/cm3
0
4
8
12
-4
-8
-12
45 deg
xy
8”
ρ = 2.6 g/cm3
ρ = 2.6 g/cm3
ρ = 2.6 g/cm3
0
4
8
12
-4
-8
-12xy
8”
ρ = 2.6 g/cm3
ρ = 2.6 g/cm3
ρ = 2.6 g/cm3
0
4
8
12
-4
-8
-12xy
8”
ρ = 2.6 g/cm3
ρ = 2.6 g/cm3
ρ = 2.6 g/cm3
0
4
8
12
-4
-8
-12
45 deg
Figure 11. Density tool measurement at several tool azimuth angles in the wellbore. A sampling point is calculated for each tool location the borehole as the borehole is moved down across the beds at a rate of 1.2 inches. Figure 12. SS, LS, compensated and enhanced density in a horizontal well across 8-inch beds for several tool azimuth angles. The reference depth is with respect to the position of the tool detectors in TVD.
J

SPWLA 48th Annual Logging Symposium, June 3-6, 2007
14
Figure 13. SS, LS, compensated and enhanced density in a horizontal well across 4-inch beds for several tool azimuth angles. The reference depth is with respect to the position of the tool detectors in TVD. Figure 14. SS, LS, compensated and enhanced density in a horizontal well across 2-inch beds for several tool azimuth angles. The reference depth is with respect to the position of the tool detectors in TVD.

SPWLA 48th Annual Logging Symposium, June 3-6, 2007
15
Figure 15. Density images obtained using various processing approaches in a horizontal well across 4-inch beds for several tool azimuth angles. The reference depth is with respect to the bottom of the borehole in TVD. Refer to Figure 11 for a graphical description of the geometry. Figure 16. A commercial LWD tool in a West African section of horizontal beds 6”-18” thick as measured in a 96 degree near –horizontal well. The lower quadrant data shows higher density for long -spaced measurement, but the compensated density shows very little difference between upper and lower quadrants in log values and in the center track image which is a color of azimuthal density data. Density corrections for this real example have standoff and invasion factors, unlike our models. Corrections average about +0.1 in the lower quadrant here, but corrections are much higher in the top quadrant where tool standoff is greater.
Bottom Density
Up Density
Image
10’ md
+/-0.1
+/-0.1
J