slowness and azimuth determination for bucovina array (burar) applying multiple signal techniques
TRANSCRIPT
J SeismolDOI 10.1007/s10950-011-9228-9
ORIGINAL ARTICLE
Slowness and azimuth determination for Bucovina array(BURAR) applying multiple signal techniques
Felix Borleanu · Mihaela Popa ·Mircea Radulian · Johannes Schweitzer
Received: 20 July 2009 / Accepted: 13 January 2011© Springer Science+Business Media B.V. 2011
Abstract The BURAR seismic array, located inNorthern Romania (Bucovina region), is designedto monitor events located in an area poorly cov-ered by other existing seismic stations. In orderto use the BURAR array for single-station lo-cations, it is crucial to calibrate the azimuth andslowness parameters, which are currently used inarray techniques to locate earthquakes, blasts ornuclear explosions. The goal of this study is toapply “f–k” and plane wave fit techniques in orderto constrain the slowness and azimuth parametersat BURAR for teleseismic, regional and localevents. The analysis was carried out using P and Swaves recorded for events occurred between 2004and 2008 within a radius of 50◦ around BURAR.The azimuth values obtained applying both meth-ods strongly deviated from the theoretical val-ues for regions like Central Turkey, Bulgaria,Dodecanese Islands and other parts of Greece,while the ray parameter deviations with respect toa 1-D IASP91 reference model are less significant.For the local events, the anomalies are smaller, ex-
F. Borleanu (B) · M. Popa · M. RadulianNational Institute for Earth Physics,Magurele, Romaniae-mail: [email protected]
J. SchweitzerNORSAR, Gunnar Randers vei 15,2007 Kjeller, Norway
cept the particular case of Vrancea intermediate-depth earthquakes for which strong azimuth de-viations (33.5◦), both positive and negative, areobserved. We investigate how these systematicdeviations in azimuth are explained by the struc-ture lateral heterogeneities which characterize thestudy region.
Keywords Array techniques · f–k analysis ·Plane wave fit · BURAR array
1 Introduction
Seismological arrays can be used in many differentways to study the lateral heterogeneities from thelithosphere and upper mantle structure. For thispurpose, many different, specialized array tech-niques have been developed and applied to anincreasing number of high-quality array datasets.Most of these methods use the ability of seis-mic arrays to measure the velocity of an incidentwave front and its backazimuth. This informationcan be used to distinguish between different seis-mic phases, separate waves from different seis-mic events and improve the signal-to-noise ratio(SNR) by stacking with respect to the varyingslowness of different phases (e.g., Schweitzer et al.2002; Rost and Thomas 2002).
The Bucovina array (BURAR) is located in thenorthern part of Romania in the neighborhood
J Seismol
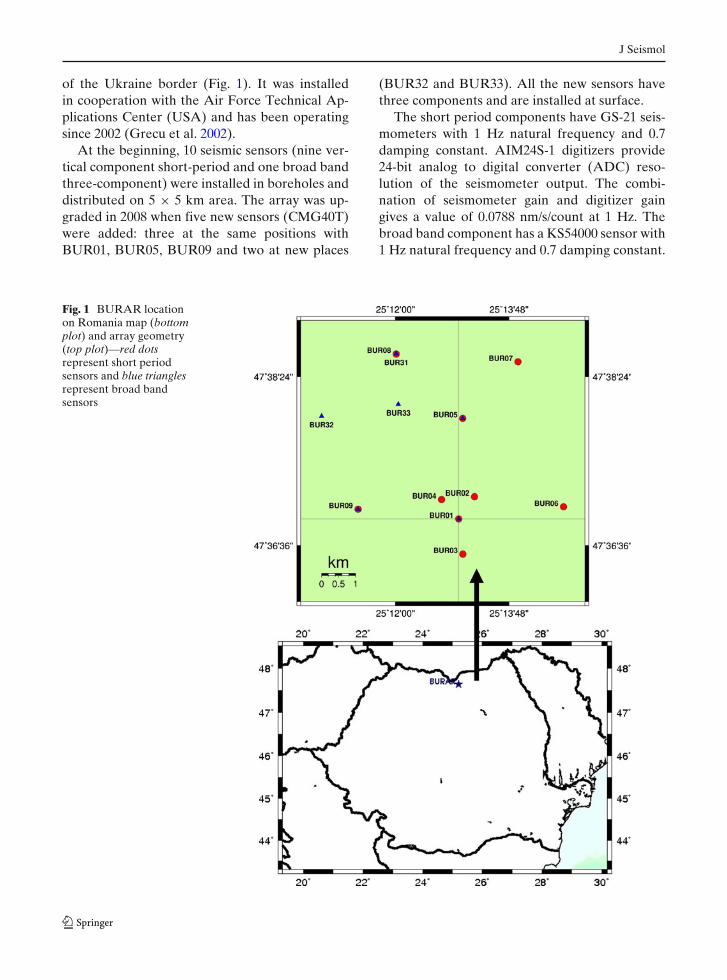
of the Ukraine border (Fig. 1). It was installedin cooperation with the Air Force Technical Ap-plications Center (USA) and has been operatingsince 2002 (Grecu et al. 2002).
At the beginning, 10 seismic sensors (nine ver-tical component short-period and one broad bandthree-component) were installed in boreholes anddistributed on 5 × 5 km area. The array was up-graded in 2008 when five new sensors (CMG40T)were added: three at the same positions withBUR01, BUR05, BUR09 and two at new places
(BUR32 and BUR33). All the new sensors havethree components and are installed at surface.
The short period components have GS-21 seis-mometers with 1 Hz natural frequency and 0.7damping constant. AIM24S-1 digitizers provide24-bit analog to digital converter (ADC) reso-lution of the seismometer output. The combi-nation of seismometer gain and digitizer gaingives a value of 0.0788 nm/s/count at 1 Hz. Thebroad band component has a KS54000 sensor with1 Hz natural frequency and 0.7 damping constant.
Fig. 1 BURAR locationon Romania map (bottomplot) and array geometry(top plot)—red dotsrepresent short periodsensors and blue trianglesrepresent broad bandsensors
J Seismol
AIM24S-3 digitizers provide 24-bit A-D resolu-tion of the seismometer output. The combina-tion of seismometer gain and digitizer gain givesa value of 0.0404 nm/s/count at 1 Hz. The newCMG40T sensors have 1 Hz natural frequencyand 0.7 damping constant and Quantera 330 dig-itizers provide 24-bit analog to digital converter(ADC) resolution of the seismometer output. Thecombination of seismometer gain and digitizergain gives a value of 1.192 nm/s/count at 1 HzWe record continuous data with a stream of 40samples per second (sps).
The position of the BURAR array is of highestinterest since it monitors a large area with poorseismicity, including the East European Platform,the Black Sea shield, Ukraine and the northernpart of Romania. It is of equal interest to detectand locate regional events in South-Eastern Eu-rope, the Caucasus and Central Asia. Therefore,we are very interested to calibrate as much as pos-sible the earthquake location parameters, slow-ness and backazimuth, using the BURAR array.
In this study, the f–k and plane wave fit analy-ses are used in order to evaluate the ray pa-rameter and backazimuth values as recorded bythe BURAR array. Likewise, the Velocity Spec-trum Analysis (VESPA) (Davies et al. 1971) tech-nique is applied to investigate the scattering ofP waves. The frequency–wave number analysis(f–k analysis) is able to measure the completeslowness vector (i.e., backazimuth and horizontalslowness) simultaneously. The f–k analysis calcu-lates the power distributed among different slow-nesses and directions of incidence (Capon 1973;Harjes and Henger 1973; Aki and Richards 1980)in the frequency domain. Plane wave fit analy-sis (e.g., Schweitzer et al. 2002) also measuresslowness vector and backazimuth but in the timedomain.
If a plane wave arrives at an array, the sig-nal is recorded at the array stations with a cer-tain time offset depending on the slowness vectorof the wave and the position of the station inthe array. These time delays are used to specifythe slowness or backazimuth of the wave front.The VESPA process estimates the seismic energyarriving at the array for a given backazimuthand different horizontal slowness values. Alterna-tively, the VESPA process can be used for a fixed
slowness and varying backazimuths. The result ofthe VESPA process is displayed as a VESPA-gram, a diagram of the seismic energy content(amplitudes) of the incoming signals as a functionof slowness or backazimuth and time.
The parameters determined using BURARrecords are compared with the theoretical valuespredicted by the source and station geometry andstandard Earth models. Finally, the emphasizeddeviations are correlated with the tectonic fea-tures and lateral heterogeneities as observed inthe Balkan region from the previous studies.
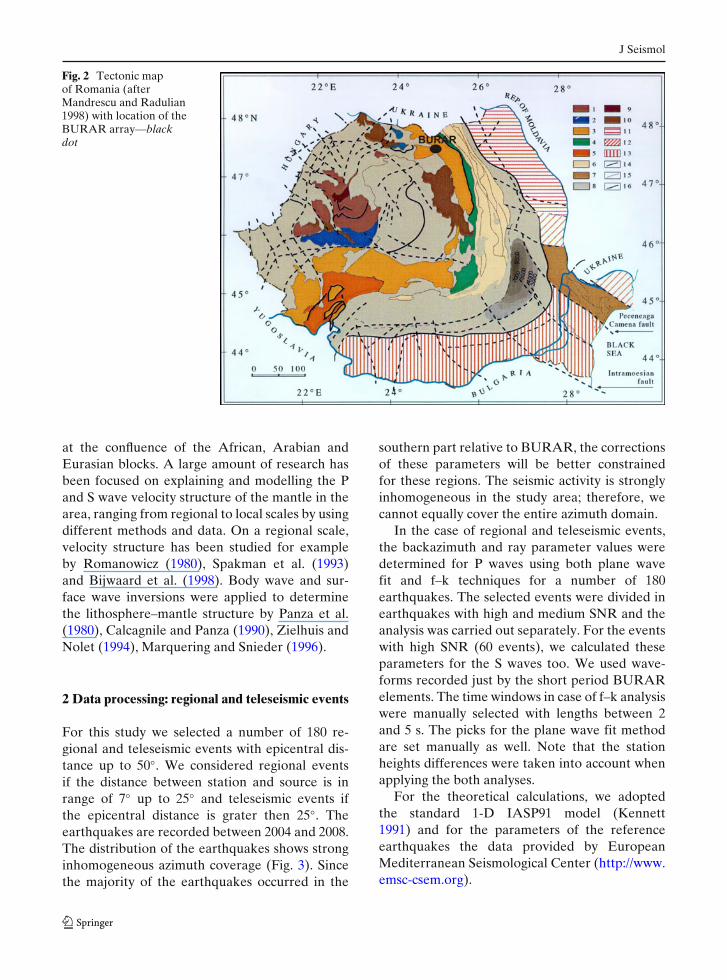
The BURAR array is located in the East-ern Carpathian Mountains at an altitude of over1000 m, in a complex tectonic setting character-ized by continental collision at the contact zonebetween the East European Craton and Carpathi-ans orogen area (Fig. 2).
The Carpathians fold belt represents a segmentof the Tethyan Chain placed and deformed duringthe Mesozoic and Cenozoic periods (Sandulescuand Visariom 2000) and consists of tectonic unitsemerging from the deformed lithosphere belong-ing to both the Tethys Ocean (the Main TethyanSuture) and its continental margins (Southern andEastern Carpathians).
In the Carpathians domain three types of crustcan be distinguished:
– The underthrusted forelandic crust type issituated below the cover nappes of theCarpathian Flysch and belongs to the Moesianand Scythian Platforms. Its thickness is vari-able, having the largest values of 45–50 km inthe Carpathian Arc Bend Zone.
– The second crust type is located in Transylva-nia, placed between the Main Tethyan SutureZone and the “satellite” suture, being char-acterized by a thickness of 26–28 km. Here,the basaltic layer is normally developed, whilethe granite layer becomes thicker under thecentral part of the Transylvanian Basin.
– The third type is the Pannonian crust, whichhas a thickness of 24–26 km, including a thinbasaltic layer (Stanica et al. 2000).
The lateral inhomogeneous structure charac-terizes also the entire Alpine-Mediterranean area,which is a wide and complex geophysical system
J Seismol
Fig. 2 Tectonic mapof Romania (afterMandrescu and Radulian1998) with location of theBURAR array—blackdot
at the confluence of the African, Arabian andEurasian blocks. A large amount of research hasbeen focused on explaining and modelling the Pand S wave velocity structure of the mantle in thearea, ranging from regional to local scales by usingdifferent methods and data. On a regional scale,velocity structure has been studied for exampleby Romanowicz (1980), Spakman et al. (1993)and Bijwaard et al. (1998). Body wave and sur-face wave inversions were applied to determinethe lithosphere–mantle structure by Panza et al.(1980), Calcagnile and Panza (1990), Zielhuis andNolet (1994), Marquering and Snieder (1996).
2 Data processing: regional and teleseismic events
For this study we selected a number of 180 re-gional and teleseismic events with epicentral dis-tance up to 50◦. We considered regional eventsif the distance between station and source is inrange of 7◦ up to 25◦ and teleseismic events ifthe epicentral distance is grater then 25◦. Theearthquakes are recorded between 2004 and 2008.The distribution of the earthquakes shows stronginhomogeneous azimuth coverage (Fig. 3). Sincethe majority of the earthquakes occurred in the
southern part relative to BURAR, the correctionsof these parameters will be better constrainedfor these regions. The seismic activity is stronglyinhomogeneous in the study area; therefore, wecannot equally cover the entire azimuth domain.
In the case of regional and teleseismic events,the backazimuth and ray parameter values weredetermined for P waves using both plane wavefit and f–k techniques for a number of 180earthquakes. The selected events were divided inearthquakes with high and medium SNR and theanalysis was carried out separately. For the eventswith high SNR (60 events), we calculated theseparameters for the S waves too. We used wave-forms recorded just by the short period BURARelements. The time windows in case of f–k analysiswere manually selected with lengths between 2and 5 s. The picks for the plane wave fit methodare set manually as well. Note that the stationheights differences were taken into account whenapplying the both analyses.
For the theoretical calculations, we adoptedthe standard 1-D IASP91 model (Kennett1991) and for the parameters of the referenceearthquakes the data provided by EuropeanMediterranean Seismological Center (http://www.emsc-csem.org).
J Seismol
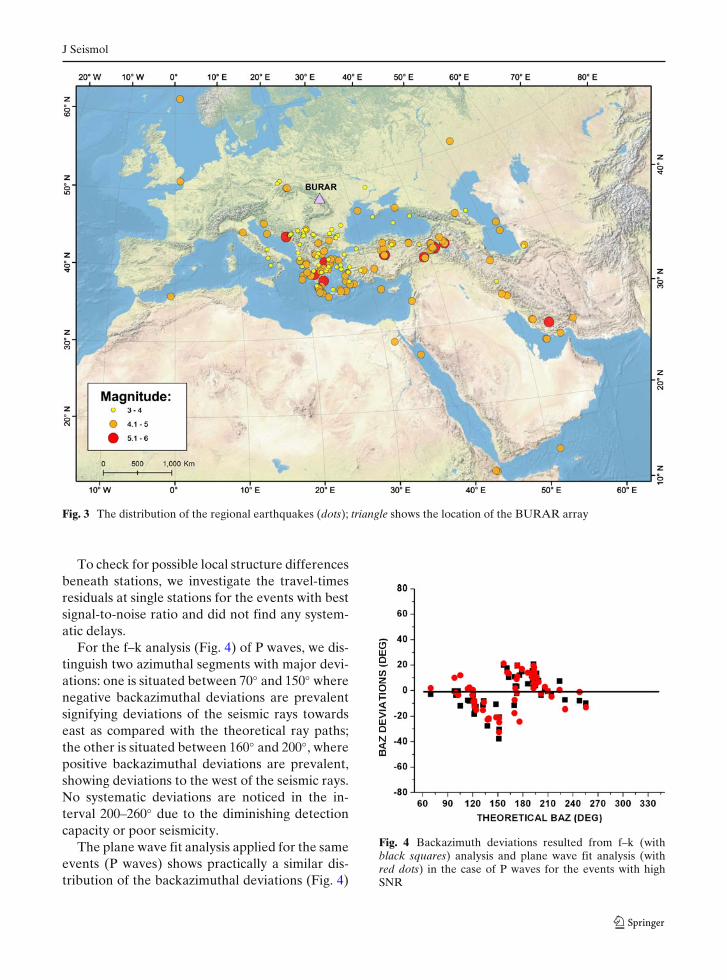
Fig. 3 The distribution of the regional earthquakes (dots); triangle shows the location of the BURAR array
To check for possible local structure differencesbeneath stations, we investigate the travel-timesresiduals at single stations for the events with bestsignal-to-noise ratio and did not find any system-atic delays.
For the f–k analysis (Fig. 4) of P waves, we dis-tinguish two azimuthal segments with major devi-ations: one is situated between 70◦ and 150◦ wherenegative backazimuthal deviations are prevalentsignifying deviations of the seismic rays towardseast as compared with the theoretical ray paths;the other is situated between 160◦ and 200◦, wherepositive backazimuthal deviations are prevalent,showing deviations to the west of the seismic rays.No systematic deviations are noticed in the in-terval 200–260◦ due to the diminishing detectioncapacity or poor seismicity.
The plane wave fit analysis applied for the sameevents (P waves) shows practically a similar dis-tribution of the backazimuthal deviations (Fig. 4)
Fig. 4 Backazimuth deviations resulted from f–k (withblack squares) analysis and plane wave fit analysis (withred dots) in the case of P waves for the events with highSNR
J Seismol
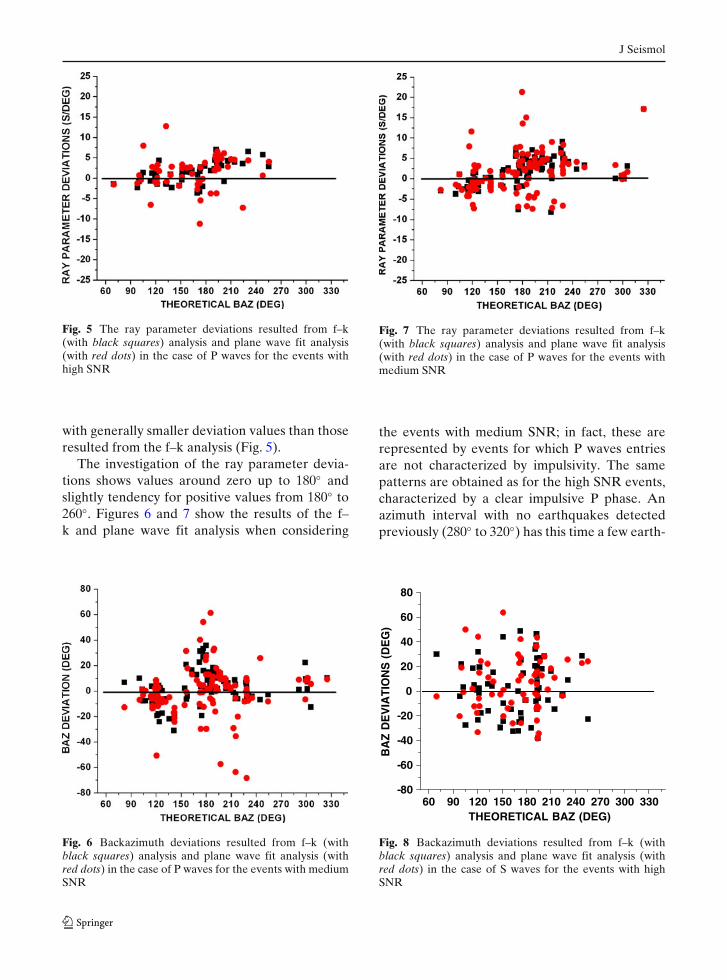
Fig. 5 The ray parameter deviations resulted from f–k(with black squares) analysis and plane wave fit analysis(with red dots) in the case of P waves for the events withhigh SNR
with generally smaller deviation values than thoseresulted from the f–k analysis (Fig. 5).
The investigation of the ray parameter devia-tions shows values around zero up to 180◦ andslightly tendency for positive values from 180◦ to260◦. Figures 6 and 7 show the results of the f–k and plane wave fit analysis when considering
Fig. 6 Backazimuth deviations resulted from f–k (withblack squares) analysis and plane wave fit analysis (withred dots) in the case of P waves for the events with mediumSNR
Fig. 7 The ray parameter deviations resulted from f–k(with black squares) analysis and plane wave fit analysis(with red dots) in the case of P waves for the events withmedium SNR
the events with medium SNR; in fact, these arerepresented by events for which P waves entriesare not characterized by impulsivity. The samepatterns are obtained as for the high SNR events,characterized by a clear impulsive P phase. Anazimuth interval with no earthquakes detectedpreviously (280◦ to 320◦) has this time a few earth-
60 90 120 150 180 210 240 270 300 330-80
-60
-40
-20
0
20
40
60
80
BA
Z D
EV
IAT
ION
S (
DE
G)
THEORETICAL BAZ (DEG)
Fig. 8 Backazimuth deviations resulted from f–k (withblack squares) analysis and plane wave fit analysis (withred dots) in the case of S waves for the events with highSNR
J Seismol
60 90 120 150 180 210 240 270 300 330-25
-20
-15
-10
-5
0
5
10
15
20
25R
AY
PA
RA
ME
TE
R D
EV
IAT
ION
S (
S/D
EG
)
THEORETICAL BAZ (DEG)
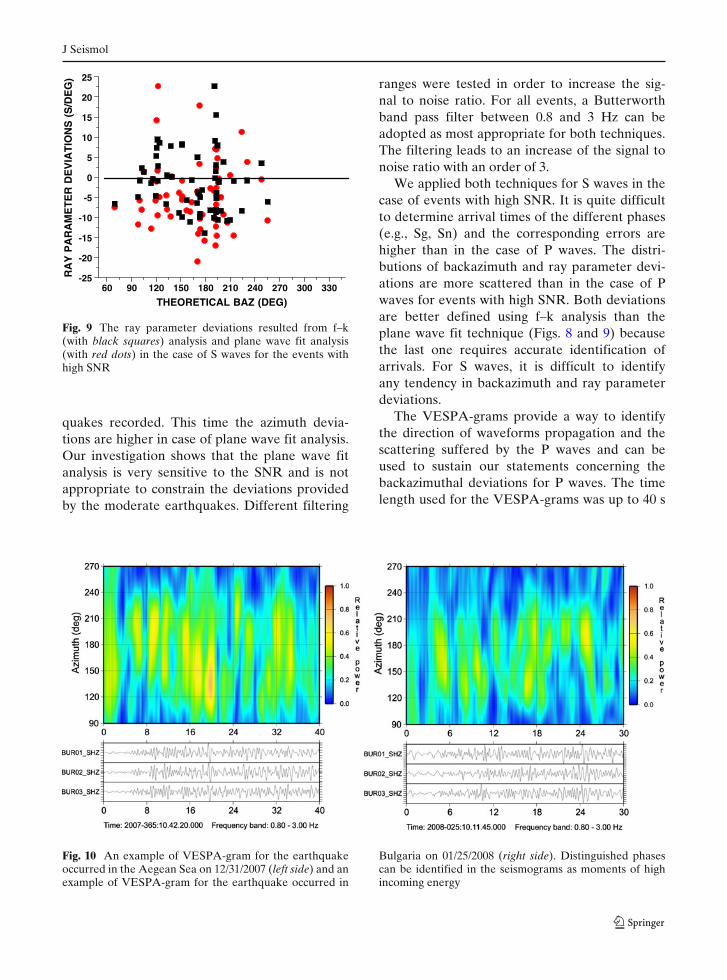
Fig. 9 The ray parameter deviations resulted from f–k(with black squares) analysis and plane wave fit analysis(with red dots) in the case of S waves for the events withhigh SNR
quakes recorded. This time the azimuth devia-tions are higher in case of plane wave fit analysis.Our investigation shows that the plane wave fitanalysis is very sensitive to the SNR and is notappropriate to constrain the deviations providedby the moderate earthquakes. Different filtering
ranges were tested in order to increase the sig-nal to noise ratio. For all events, a Butterworthband pass filter between 0.8 and 3 Hz can beadopted as most appropriate for both techniques.The filtering leads to an increase of the signal tonoise ratio with an order of 3.
We applied both techniques for S waves in thecase of events with high SNR. It is quite difficultto determine arrival times of the different phases(e.g., Sg, Sn) and the corresponding errors arehigher than in the case of P waves. The distri-butions of backazimuth and ray parameter devi-ations are more scattered than in the case of Pwaves for events with high SNR. Both deviationsare better defined using f–k analysis than theplane wave fit technique (Figs. 8 and 9) becausethe last one requires accurate identification ofarrivals. For S waves, it is difficult to identifyany tendency in backazimuth and ray parameterdeviations.
The VESPA-grams provide a way to identifythe direction of waveforms propagation and thescattering suffered by the P waves and can beused to sustain our statements concerning thebackazimuthal deviations for P waves. The timelength used for the VESPA-grams was up to 40 s
Fig. 10 An example of VESPA-gram for the earthquakeoccurred in the Aegean Sea on 12/31/2007 (left side) and anexample of VESPA-gram for the earthquake occurred in
Bulgaria on 01/25/2008 (right side). Distinguished phasescan be identified in the seismograms as moments of highincoming energy
J Seismol
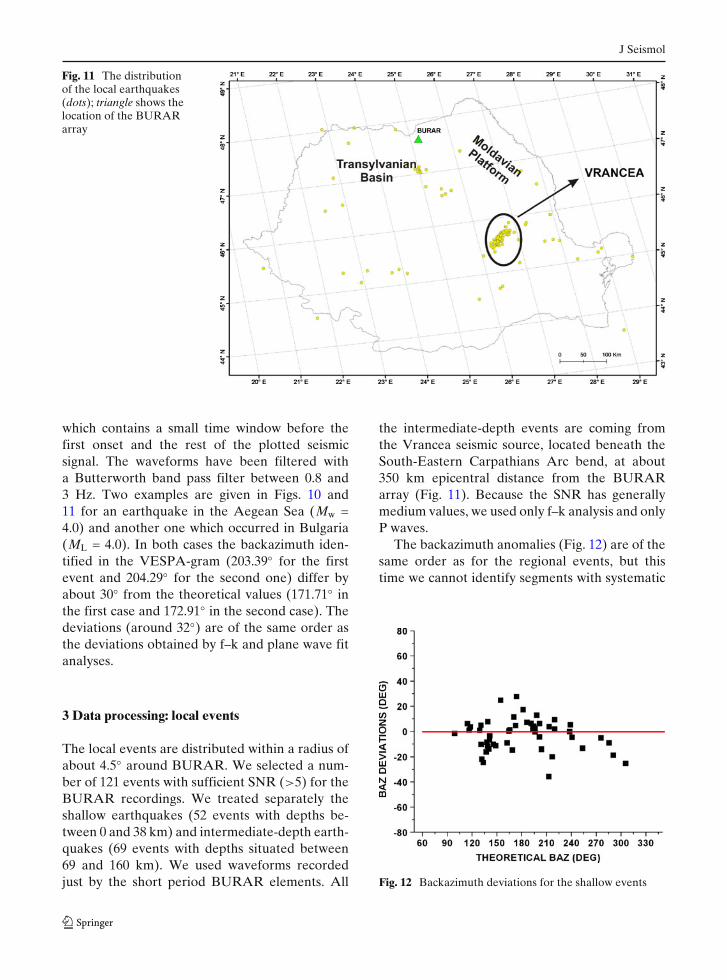
Fig. 11 The distributionof the local earthquakes(dots); triangle shows thelocation of the BURARarray
which contains a small time window before thefirst onset and the rest of the plotted seismicsignal. The waveforms have been filtered witha Butterworth band pass filter between 0.8 and3 Hz. Two examples are given in Figs. 10 and11 for an earthquake in the Aegean Sea (Mw =4.0) and another one which occurred in Bulgaria(ML = 4.0). In both cases the backazimuth iden-tified in the VESPA-gram (203.39◦ for the firstevent and 204.29◦ for the second one) differ byabout 30◦ from the theoretical values (171.71◦ inthe first case and 172.91◦ in the second case). Thedeviations (around 32◦) are of the same order asthe deviations obtained by f–k and plane wave fitanalyses.
3 Data processing: local events
The local events are distributed within a radius ofabout 4.5◦ around BURAR. We selected a num-ber of 121 events with sufficient SNR (>5) for theBURAR recordings. We treated separately theshallow earthquakes (52 events with depths be-tween 0 and 38 km) and intermediate-depth earth-quakes (69 events with depths situated between69 and 160 km). We used waveforms recordedjust by the short period BURAR elements. All
the intermediate-depth events are coming fromthe Vrancea seismic source, located beneath theSouth-Eastern Carpathians Arc bend, at about350 km epicentral distance from the BURARarray (Fig. 11). Because the SNR has generallymedium values, we used only f–k analysis and onlyP waves.
The backazimuth anomalies (Fig. 12) are of thesame order as for the regional events, but thistime we cannot identify segments with systematic
Fig. 12 Backazimuth deviations for the shallow events
J Seismol
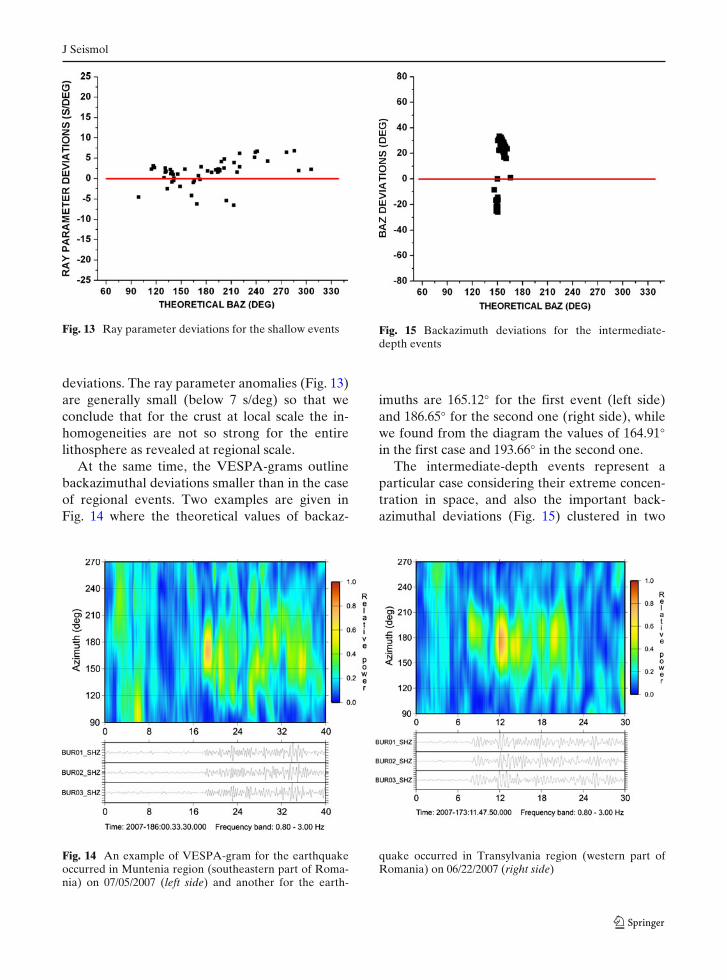
Fig. 13 Ray parameter deviations for the shallow events
deviations. The ray parameter anomalies (Fig. 13)are generally small (below 7 s/deg) so that weconclude that for the crust at local scale the in-homogeneities are not so strong for the entirelithosphere as revealed at regional scale.
At the same time, the VESPA-grams outlinebackazimuthal deviations smaller than in the caseof regional events. Two examples are given inFig. 14 where the theoretical values of backaz-
Fig. 15 Backazimuth deviations for the intermediate-depth events
imuths are 165.12◦ for the first event (left side)and 186.65◦ for the second one (right side), whilewe found from the diagram the values of 164.91◦in the first case and 193.66◦ in the second one.
The intermediate-depth events represent aparticular case considering their extreme concen-tration in space, and also the important back-azimuthal deviations (Fig. 15) clustered in two
Fig. 14 An example of VESPA-gram for the earthquakeoccurred in Muntenia region (southeastern part of Roma-nia) on 07/05/2007 (left side) and another for the earth-
quake occurred in Transylvania region (western part ofRomania) on 06/22/2007 (right side)
J Seismol
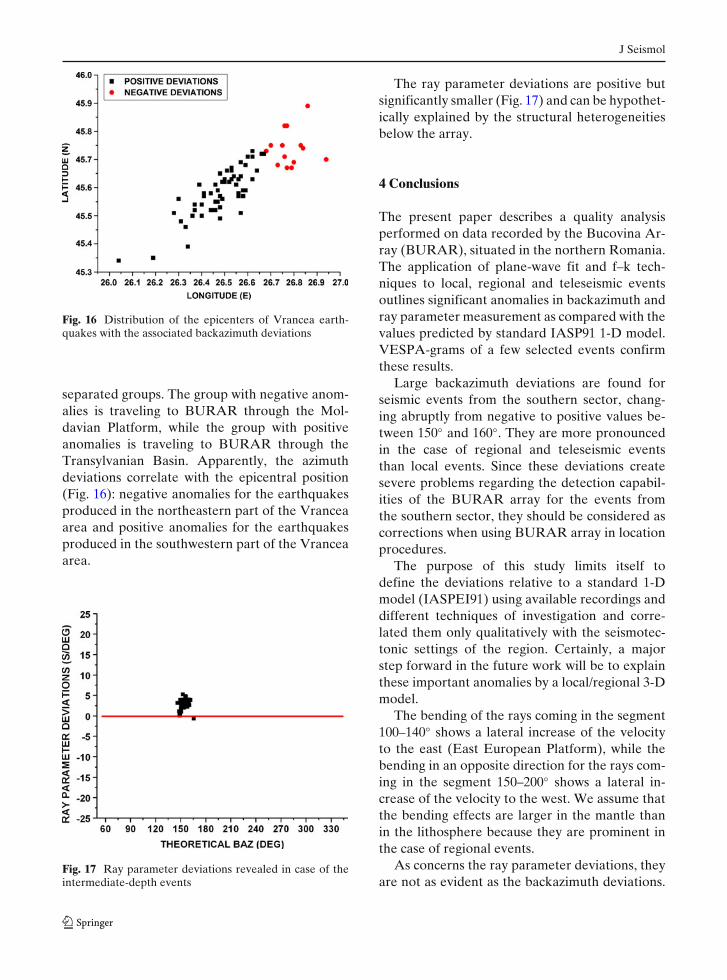
Fig. 16 Distribution of the epicenters of Vrancea earth-quakes with the associated backazimuth deviations
separated groups. The group with negative anom-alies is traveling to BURAR through the Mol-davian Platform, while the group with positiveanomalies is traveling to BURAR through theTransylvanian Basin. Apparently, the azimuthdeviations correlate with the epicentral position(Fig. 16): negative anomalies for the earthquakesproduced in the northeastern part of the Vranceaarea and positive anomalies for the earthquakesproduced in the southwestern part of the Vranceaarea.
Fig. 17 Ray parameter deviations revealed in case of theintermediate-depth events
The ray parameter deviations are positive butsignificantly smaller (Fig. 17) and can be hypothet-ically explained by the structural heterogeneitiesbelow the array.
4 Conclusions
The present paper describes a quality analysisperformed on data recorded by the Bucovina Ar-ray (BURAR), situated in the northern Romania.The application of plane-wave fit and f–k tech-niques to local, regional and teleseismic eventsoutlines significant anomalies in backazimuth andray parameter measurement as compared with thevalues predicted by standard IASP91 1-D model.VESPA-grams of a few selected events confirmthese results.
Large backazimuth deviations are found forseismic events from the southern sector, chang-ing abruptly from negative to positive values be-tween 150◦ and 160◦. They are more pronouncedin the case of regional and teleseismic eventsthan local events. Since these deviations createsevere problems regarding the detection capabil-ities of the BURAR array for the events fromthe southern sector, they should be considered ascorrections when using BURAR array in locationprocedures.
The purpose of this study limits itself todefine the deviations relative to a standard 1-Dmodel (IASPEI91) using available recordings anddifferent techniques of investigation and corre-lated them only qualitatively with the seismotec-tonic settings of the region. Certainly, a majorstep forward in the future work will be to explainthese important anomalies by a local/regional 3-Dmodel.
The bending of the rays coming in the segment100–140◦ shows a lateral increase of the velocityto the east (East European Platform), while thebending in an opposite direction for the rays com-ing in the segment 150–200◦ shows a lateral in-crease of the velocity to the west. We assume thatthe bending effects are larger in the mantle thanin the lithosphere because they are prominent inthe case of regional events.
As concerns the ray parameter deviations, theyare not as evident as the backazimuth deviations.
J Seismol
The ray parameter anomalies for regional andlocal events may be not significant, as (1) the inci-dence angle for Pn does not change with distanceand (2) the comparison with IASPEI91 may betoo much simplified, considering the complex ge-ological situation of the study area. For example,the encounter of high-velocity material descend-ing in the asthenosphere beneath the Vrancearegion could induce negative anomalies of theray parameter for the rays passing through thiszone.
It is well known that in many cases, the ob-served direction deviations are caused by localstructure directly beneath the stations. Our testsfor BURAR using single station travel time de-lays for the events with high signal-to-noise ratiodo not indicate systematic delays, so that, to afirst approximation, we can assume that lateraldifferences in the local structure beneath the arraydo not significantly influence our interpretation.
The main conclusion of our investigation is theobservation of considerable anomalies when usingBURAR array data for regional and teleseismicevents situated in the southern domain as com-pared with standard IASPEI91 model. Clearly,they show significant heterogeneities in the man-tle along this sector and require insertion of ar-ray corrections for location procedures. At thesame time, the raw measurements of azimuth andray parameter as input for corrections containconsiderable scatter. Therefore, future efforts arerecommended to remove outliers and to definesmoothed functions over azimuth and ray para-meter for correction procedures (either as tableor fitted analytic function). Alternatively, a list ofselected, representative events can be considered,where the closest match can be transferred tothe new event. The increase of available databasefor BURAR and the improving of interpretationby considering regional 3-D modeling are crucialsteps to implement the results of the present work.
Acknowledgements This study was performed during avisit to NORSAR under the NERIES program (EC project026130/2006). We are grateful to the Selection Committeeof NERIES for that grant. These results are based onthe data recorded by BURAR array installed and main-tained in the framework of the bilateral cooperation be-tween the Air Force Technical Application Center (USA)and the National Institute for Earth Physics (Romania).
We are grateful to the editor Frank Krueger and to thetwo reviewers whom suggestions and critical remarks con-tributed to improve significantly the quality of the paperpresentation. The maps form Fig. 1 and the VESPA-gramswere plotted with the GMT software (Wessel and Smith1995). The maps form Figs. 3 and 11 were plotted with GIS(ESRI) software.
References
Aki K, Richards PG (1980) Quantitative seismology, vol. Iand II. Freeman, San Francisco, pp 932
Bijwaard H, Spakman W, Engdahl ER (1998) Closing thegap between regional and global travel time tomogra-phy. J Geophys Res 103:30055–30078
Calcagnile G, Panza GF (1990) Crust and upper mantlestructure of the Mediterranean area derived from sur-face wave data. Phys Earth Planet Inter 60:163–168
Capon J (1973) Signal processing and frequency wavenum-ber spectrum analysis for a large aperture seismicarray. In: Bolt B (ed) Methods in ComputationalPhysics, vol 13. Academic, New York, pp 473
Davies D, Kelly EJ, Filson JR (1971) The VESPA processfor the analysis of seismic signals. Nature 232:8–13
Grecu B, Ghica D, Popa M, Rizescu M, Ionescu C (2002)Earthquake monitoring by the seismic network of theNational Institute for Earth Phyisics. Rev Roum Geo-phys 46:47–57, Bucuresti
Harjes H-P, Henger M (1973) Array-seismologie. Z Geo-phys 39:865–905 (in German)
Kennett BLN (ed) (1991) IASPEI 1991 Seismological Ta-bles. Research School of Earth Sciences, AustralianNational University, pp 167
Mandrescu N, Radulian M (1998) Characterization of seis-mogenic zones of Romania, EEC Tehnical Report,Project CIPA-CT94-0238
Marquering H, Snieder R (1996) Surface-wave velocitystructure beneath Europe, the northeastern Atlanticand weastern Asia from waveform inversion includingsurface-wave mode coupling. Geophys J Int 127:283–304
Panza GF, Calcagnile G, Scandone P, Mueller S (1980)Struttura profonda dell’area mediterranea. Le Scienze24:60–69
Romanowicz BA (1980) A study of large-scale lateral vari-ations of P velocity in the upper mantle beneath West-ern Europe. Geophys J R Astr Soc 6(1):217–232
Rost S, Thomas C (2002) Array seismology: methods andapplications. Rev Geophys 40(3):1008. doi:10.1029/20000RG000100
Sandulescu M, Visariom M (2000) Crustal structure andevolution of Carpathian-western Black Sea areas. FirstBreak 18:103–108
Schweitzer J, Fyen S, Mykkeltveit, T Kvcrna (2002)IASPEI – New manual of seismological Observatorypractice, tom 1, Chapter 9, Potsdam
Spakman W, van der Lee S, van der Hilst RD (1993)Travel-time tomography of the European- Mediter-

J Seismol
ranean mantle down to 1400 km. Phys Earth PlanetInter 79:3–74
Stanica D, Stanica M, Asimpolos L (2000) The mainTethyan suture zone revealed by magnetoteluric to-mography. Rev Roum Geophys 44:123–130, Bucuresti
Wessel P, Smith WHF (1995) New version of the genericmapping tools released. Eos Trans 76:329
Zielhuis A, Nolet G (1994) Shear-wave velocity variationsin the upper mantle beneath central Europe. GeophysJ Int 117:695–715