data analytics studio operations
TRANSCRIPT
Operations 1
Data Analytics Studio OperationsDate of Publish: 2020-01-24
https://docs.hortonworks.com
Operations | Contents | ii
Contents
DAS overview............................................................................................................ 4
Manage queries......................................................................................................... 4Search for queries................................................................................................................................................. 5Refine query search using filters......................................................................................................................... 5Save the search..................................................................................................................................................... 5
Compose queries....................................................................................................... 5
Compare queries....................................................................................................... 6
View query details.................................................................................................... 6Viewing the query recommendations...................................................................................................................7Viewing the query details.....................................................................................................................................7Viewing the visual explain for a query............................................................................................................... 7Viewing the Hive configurations for a query...................................................................................................... 7Viewing the query timeline..................................................................................................................................7Viewing the task-level DAG information............................................................................................................8Viewing the DAG flow...................................................................................................................................... 12Viewing the DAG counters................................................................................................................................13
Manage databases................................................................................................... 13Using the database explorer............................................................................................................................... 13Searching for tables............................................................................................................................................ 13Managing tables..................................................................................................................................................13Creating tables.................................................................................................................................................... 14Uploading tables................................................................................................................................................. 14Editing tables...................................................................................................................................................... 15Deleting tables.................................................................................................................................................... 15Managing columns..............................................................................................................................................16Managing partitions............................................................................................................................................ 16Viewing storage information.............................................................................................................................. 16Viewing detailed information.............................................................................................................................16Viewing table and column statistics.................................................................................................................. 16Previewing tables using Data Preview...............................................................................................................17
Manage reports....................................................................................................... 17Viewing the Read and Write report...................................................................................................................17Viewing the Join report......................................................................................................................................17
Running a query on a different Hive instance.................................................... 18
Operations | Contents | iii
Modifying the session cookie timeout value.........................................................19
Creating system tables to run query on Hive and Tez DAG events.................. 19
Cleaning up old queries, DAG information, and reports data...........................19
Operations DAS overview
DAS overview
Data Analytics Studio (DAS) helps you to perform operations on Hive tables and provides recommendations tooptimize the performance of your queries.
DAS has two variants: DAS and DAS-Lite. DAS is the one that has all the features. The free version, called as DAS-Lite, comes with fewer features. The following features that are available in DAS are not available in DAS-Lite:
• Query optimization recommendation• Table optimization recommendation• Read and write report• Join report
To upgrade from DAS-Lite to DAS, see Upgrading Data Analytics Studio.
Note: DAS and DAS-Lite have the same release versions. However, the binaries for DAS and DAS-Liteare different for a given version. Make sure that you download the appropriate binary before starting theinstallation.
Administrators can perform operations such as managing the databases.
You can perform the following operations using DAS:
• Search queries: You can search for queries executed on Hive tables in a database. You can further refine yoursearch results using filters. Data Analytics Studio provides recommendations to optimize the performance of yourqueries on Hive tables. You can view the recommendations and edit your queries.
Note: The query optimization recommendations are not provided in the DAS-Lite version.
• Compose and execute queries: You can compose queries using the intuitive query composer. It has context basedauto-complete to help editing a query faster. You can also view the visual explain of the query after executingit. You can save queries to view them later and edit them. You can edit the existing, saved queries and then savethem as new queries. When you try to edit a query, you can use the query composer to easily create and executeyour queries.
• Compare queries: You can compare two queries to know how each query is performing in terms of speed and costeffectiveness. DAS compares various aspects of the two queries, based on which you can identify what changedbetween the execution of those two queries, and you can also debug performance-related issues between differentruns of the same query.
• Manage databases: Using the Database Explorer, you can manage existing databases by creating new tables,editing existing tables, and deleting tables. You can also create new database and add tables to it. You can manageexisting tables by editing them to modify existing columns or add new columns. You can create new tables inDAS or upload existing tables available in CSV, JSON, and XML formats. You can edit columns in tables andalso view suggestions for partitions and implement these recommendations.
• View reports: You can view which columns and tables are used for joins and make changes to the data layout tooptimize the performance of the query with different search criteria.
Note: The view reports feature is not available in the DAS-Lite version.
Manage queries
Using the Data Analytics Studio, you can manage search for queries, compose them, and refine your search resultsbased on various filters.
Data Analytics Studio uses Hive that enables users familiar with SQL to query the data.
4
Operations Compose queries
Search for queriesYou can search for queries and see the list of queries that have been searched. You can refine your search results onthe basis of parameters such as status of the query, queue to which the query belongs, the user of the query, tablesread for the query, and tables written for the query, and execution modes.
Procedure
1. Enter your search query.
2. Click the time range drop down to select the from and to dates. You can also click to select one of the quickranges provided in the list.
3. In the Refine tab, click the plus icon to further refine your search result. All options to refine your search appear.Select the required parameters and click Apply.
4. In the Actions column, click the pencil icon to open and edit the query in Composer view.
5. In the Actions column, click the i icon to view the query details.
Refine query search using filtersYou can further refine your query search results using various filters.
Procedure
1. Click + in the Refine tab.
2. Select the filters from the list by clicking each filter.
3. Click Apply.
Note: The total number of items in every facet, such as User, Queue, Tables Read, etc. is displayed inparentheses next to the facet title in the Refine section. For optimum resource utilization, DAS does notrefresh the result set every time you filter items. For example, if there are three users: hive, admin, andadmin1, and you select only admin and click Apply, DAS does not show User (1). It still displays User(3).
Save the searchYou can save your search for future use.
Click the save icon to save your search and the results.
Compose queries
You can write and edit queries using the Composer.
Procedure
1. Select a database from the database dropdown menu.
All the tables within the database along with the table count are displayed.
2. Search for the required tables. You can also search for a table using the Search field.
3. Enter the query in the worksheet tab.
Each worksheet is identified by a unique name and you can add worksheets clicking the plus icon. The worksheettab provides auto completion features. As you start entering the query, the worksheet suggests SQL commands,keywords, and table columns according to the query.
5
Operations Compare queries
4. Perform the desired operation on the query.
• Click Execute to run the query, or press Ctrl + Enter on Windows and control + return on XOS. Make surethat you press the keyboard shortcut while you are in the query editor.
• Click Stop to stop the query execution.• You can save the result table in HDFS or you can also download it on your local computer in the CSV format
by clicking the download button.• Click Explain to view the query details in the form of a block diagram.• You can download the explain plan on your local computer in the JSON format by clicking the download
button.• Click the save icon on the worksheet tab to save the worksheet with a different name.• Click the Saved tab to view saved queries. You can also edit or delete the saved queries.
Compare queries
You can compare two queries to know how each query is performing in terms of speed and cost effectiveness. DAScompares various aspects of the two queries, based on which you can identify what changed between the executionsof those two queries, and you can debug performance-related issues between different runs of the same query.
About this taskThe query comparison report provides you a detailed side-by-side comparison of your queries, includingrecommendations for each query, metadata about the queries, visual explain for each query, query configuration, timetaken at each stage of the query execution, and Directed Acyclic Graphs (DAG) information and DAG counters.
To compare two queries:
Procedure
1. Sign in to DAS and click Queries.
2. Under ACTIONS, click the Compare button to select a query.
The selected query is displayed on the comparison toolbar.
3. Next, select the query that you want to compare y clicking the Compare button.
The selected query is displayed on the comparison tool bar next to the query that you initially selected.
4. Click COMPARE.
The comparison report is displayed.
5. To remove any query from the comparison toolbar, click x.
6. To change the order of the queries that are being compared, click the Swap queries button on the comparisontoolbar.
View query details
For a given query, you can view the optimization recommendations, query details, the visual representation of theexplain plan, Hive configurations, the time taken to compile, build and run the query, and the DAG information.
To view the query details, you can either click on a particular query or the i icon under the Actions column on theQueries page.
6
Operations View query details
Viewing the query recommendationsThe Recommendations tab provides information about how you can improve the performance of the query andoptimize its cost.
Viewing the query detailsThe Query Details tab provides information such as, the Hive query ID of the query, the user who executed thequery, the start time, the end time, the total time taken to execute the query, the tables that were read and written, theapplication ID, the DAG ID, the session ID, the thread ID, and the queue against which the query was run.
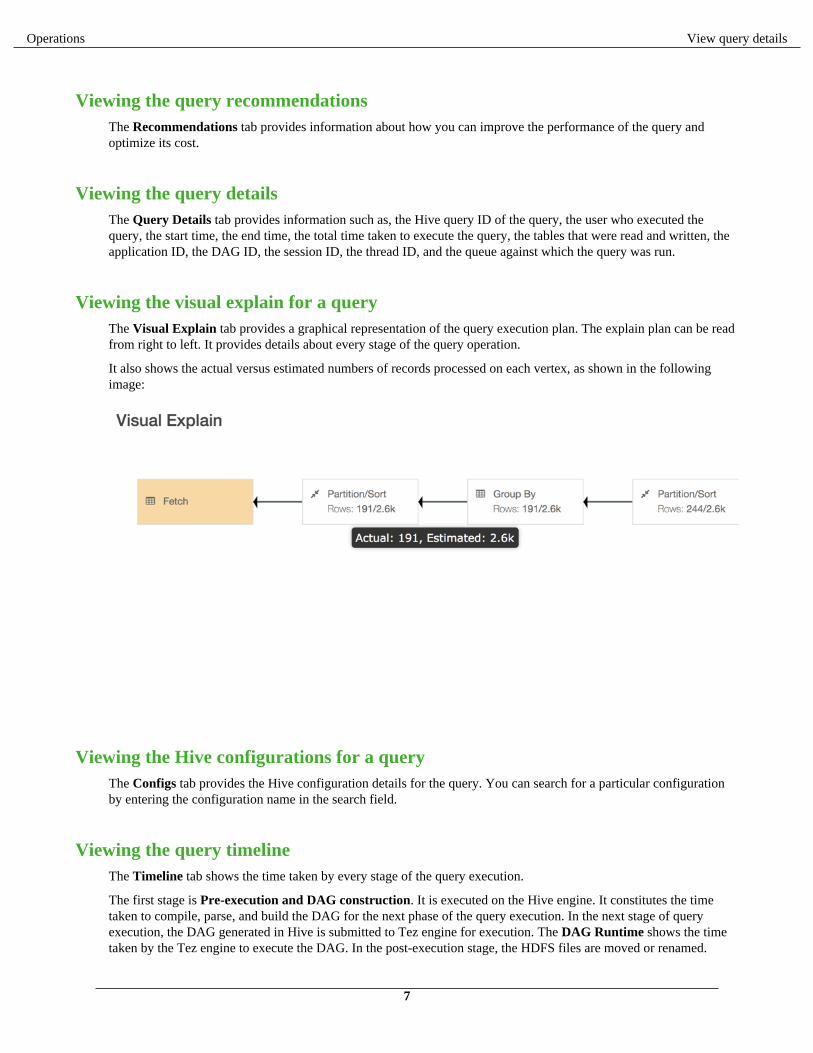
Viewing the visual explain for a queryThe Visual Explain tab provides a graphical representation of the query execution plan. The explain plan can be readfrom right to left. It provides details about every stage of the query operation.
It also shows the actual versus estimated numbers of records processed on each vertex, as shown in the followingimage:
Viewing the Hive configurations for a queryThe Configs tab provides the Hive configuration details for the query. You can search for a particular configurationby entering the configuration name in the search field.
Viewing the query timelineThe Timeline tab shows the time taken by every stage of the query execution.
The first stage is Pre-execution and DAG construction. It is executed on the Hive engine. It constitutes the timetaken to compile, parse, and build the DAG for the next phase of the query execution. In the next stage of queryexecution, the DAG generated in Hive is submitted to Tez engine for execution. The DAG Runtime shows the timetaken by the Tez engine to execute the DAG. In the post-execution stage, the HDFS files are moved or renamed.
7
Operations View query details
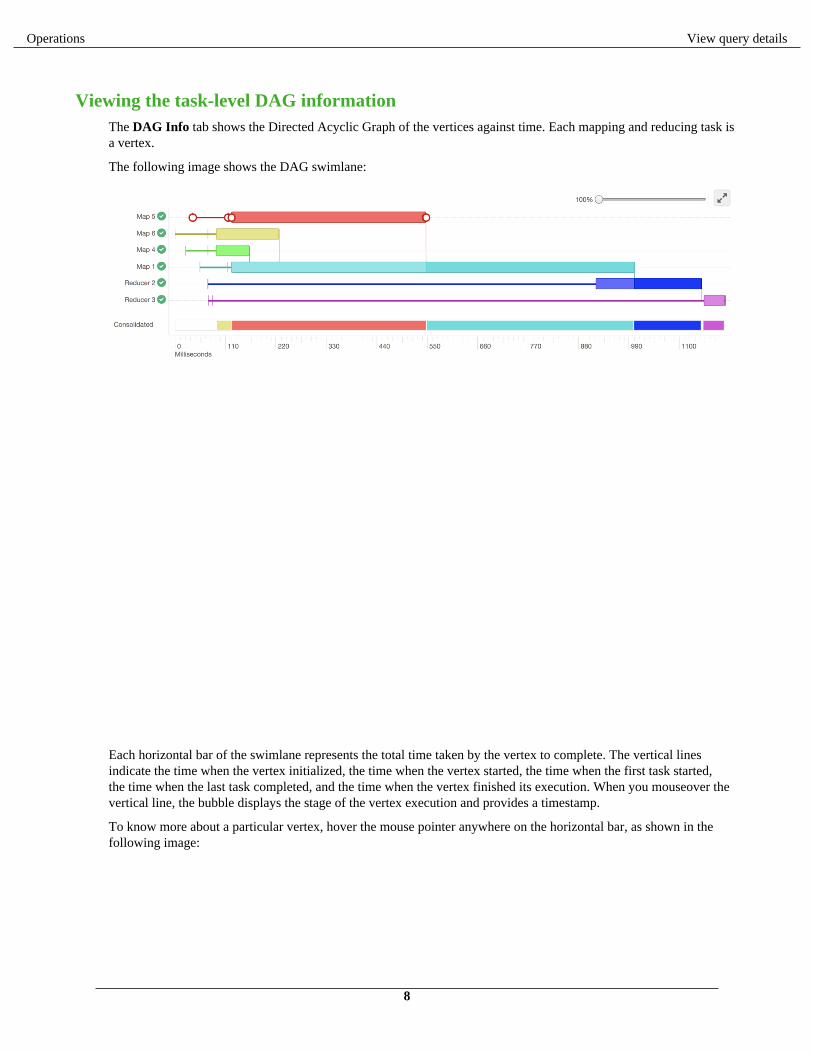
Viewing the task-level DAG informationThe DAG Info tab shows the Directed Acyclic Graph of the vertices against time. Each mapping and reducing task isa vertex.
The following image shows the DAG swimlane:
Each horizontal bar of the swimlane represents the total time taken by the vertex to complete. The vertical linesindicate the time when the vertex initialized, the time when the vertex started, the time when the first task started,the time when the last task completed, and the time when the vertex finished its execution. When you mouseover thevertical line, the bubble displays the stage of the vertex execution and provides a timestamp.
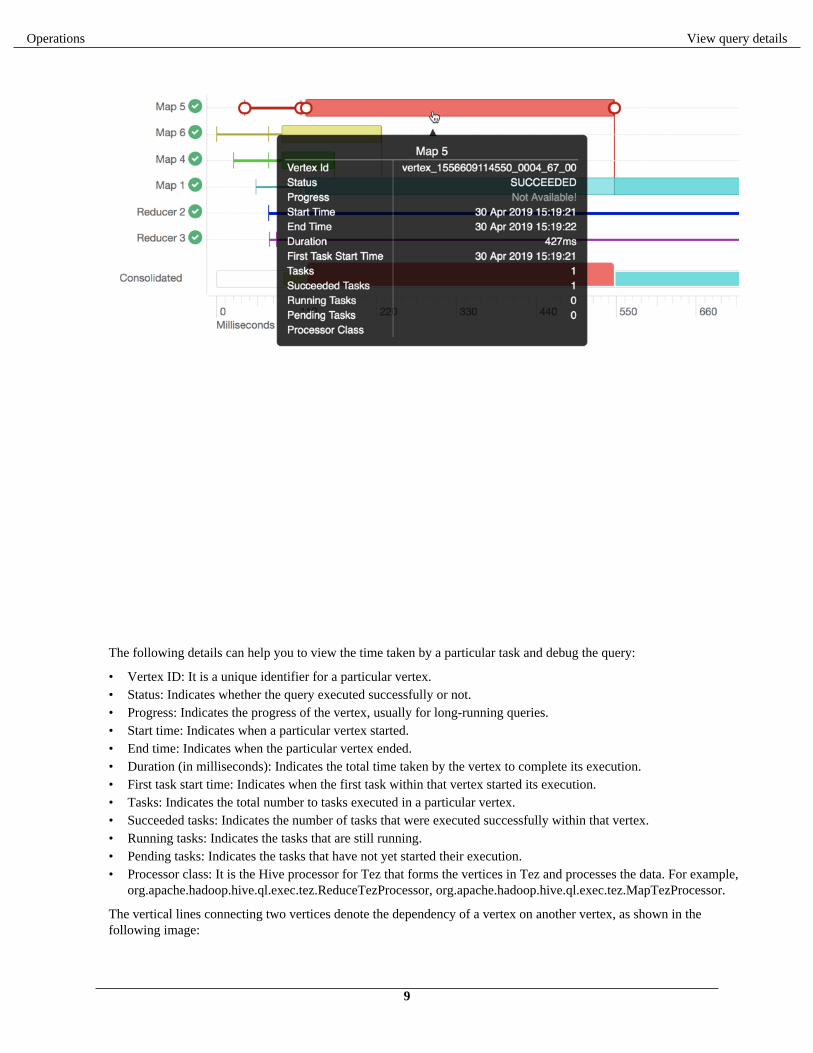
To know more about a particular vertex, hover the mouse pointer anywhere on the horizontal bar, as shown in thefollowing image:
8
Operations View query details
The following details can help you to view the time taken by a particular task and debug the query:
• Vertex ID: It is a unique identifier for a particular vertex.• Status: Indicates whether the query executed successfully or not.• Progress: Indicates the progress of the vertex, usually for long-running queries.• Start time: Indicates when a particular vertex started.• End time: Indicates when the particular vertex ended.• Duration (in milliseconds): Indicates the total time taken by the vertex to complete its execution.• First task start time: Indicates when the first task within that vertex started its execution.• Tasks: Indicates the total number to tasks executed in a particular vertex.• Succeeded tasks: Indicates the number of tasks that were executed successfully within that vertex.• Running tasks: Indicates the tasks that are still running.• Pending tasks: Indicates the tasks that have not yet started their execution.• Processor class: It is the Hive processor for Tez that forms the vertices in Tez and processes the data. For example,
org.apache.hadoop.hive.ql.exec.tez.ReduceTezProcessor, org.apache.hadoop.hive.ql.exec.tez.MapTezProcessor.
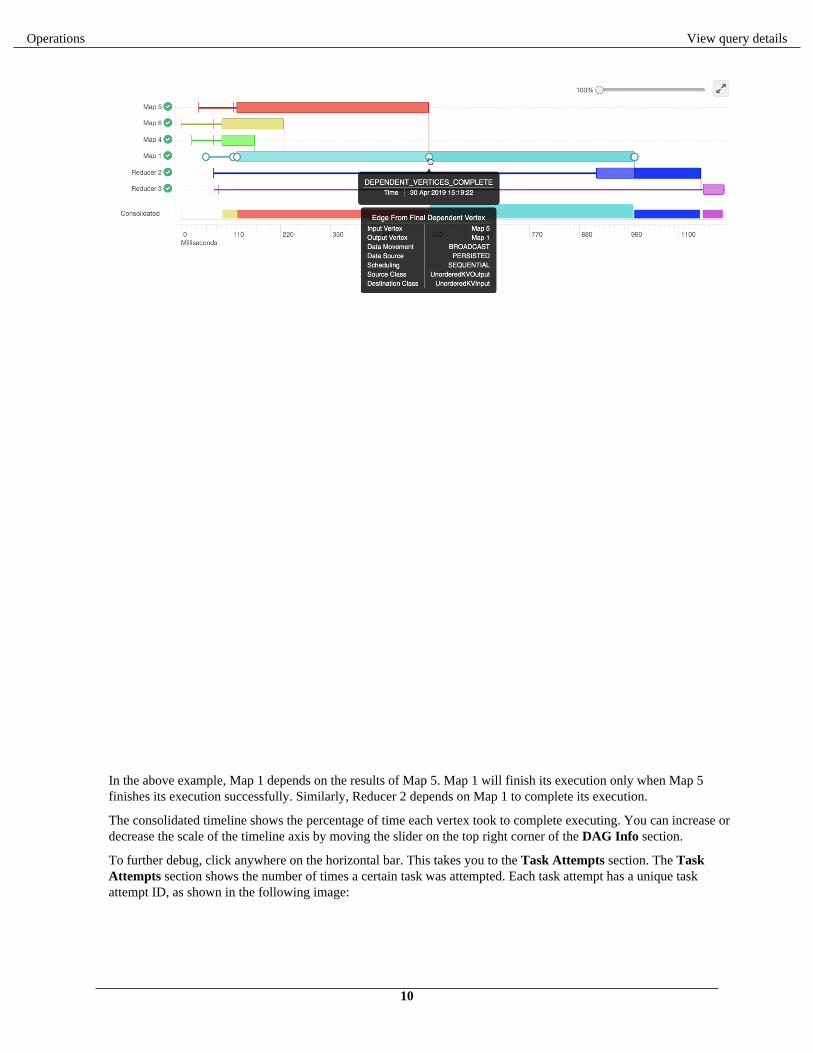
The vertical lines connecting two vertices denote the dependency of a vertex on another vertex, as shown in thefollowing image:
9
Operations View query details
In the above example, Map 1 depends on the results of Map 5. Map 1 will finish its execution only when Map 5finishes its execution successfully. Similarly, Reducer 2 depends on Map 1 to complete its execution.
The consolidated timeline shows the percentage of time each vertex took to complete executing. You can increase ordecrease the scale of the timeline axis by moving the slider on the top right corner of the DAG Info section.
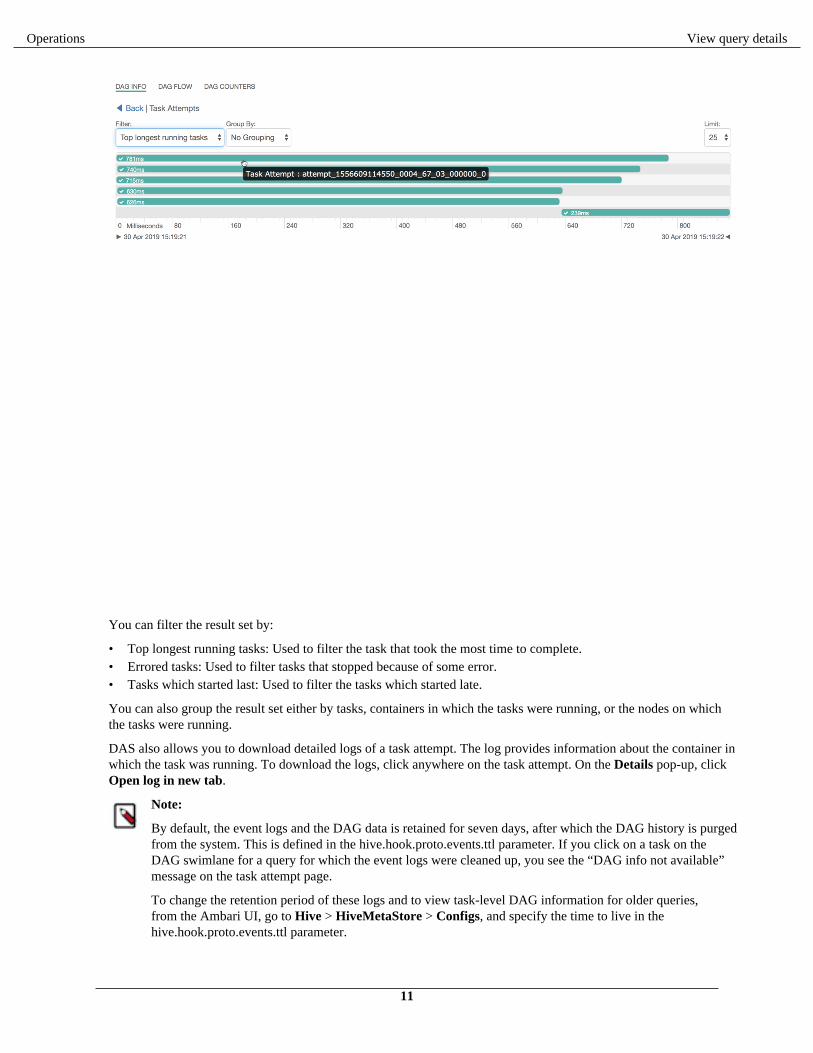
To further debug, click anywhere on the horizontal bar. This takes you to the Task Attempts section. The TaskAttempts section shows the number of times a certain task was attempted. Each task attempt has a unique taskattempt ID, as shown in the following image:
10
Operations View query details
You can filter the result set by:
• Top longest running tasks: Used to filter the task that took the most time to complete.• Errored tasks: Used to filter tasks that stopped because of some error.• Tasks which started last: Used to filter the tasks which started late.
You can also group the result set either by tasks, containers in which the tasks were running, or the nodes on whichthe tasks were running.
DAS also allows you to download detailed logs of a task attempt. The log provides information about the container inwhich the task was running. To download the logs, click anywhere on the task attempt. On the Details pop-up, clickOpen log in new tab.
Note:
By default, the event logs and the DAG data is retained for seven days, after which the DAG history is purgedfrom the system. This is defined in the hive.hook.proto.events.ttl parameter. If you click on a task on theDAG swimlane for a query for which the event logs were cleaned up, you see the “DAG info not available”message on the task attempt page.
To change the retention period of these logs and to view task-level DAG information for older queries,from the Ambari UI, go to Hive > HiveMetaStore > Configs, and specify the time to live in thehive.hook.proto.events.ttl parameter.
11
Operations View query details
For example, to retain the logs for 30 days and view task-level DAG information for queries that were run 30days ago, specify 30d.
Currently, the task-level logs are disabled for LLAP.
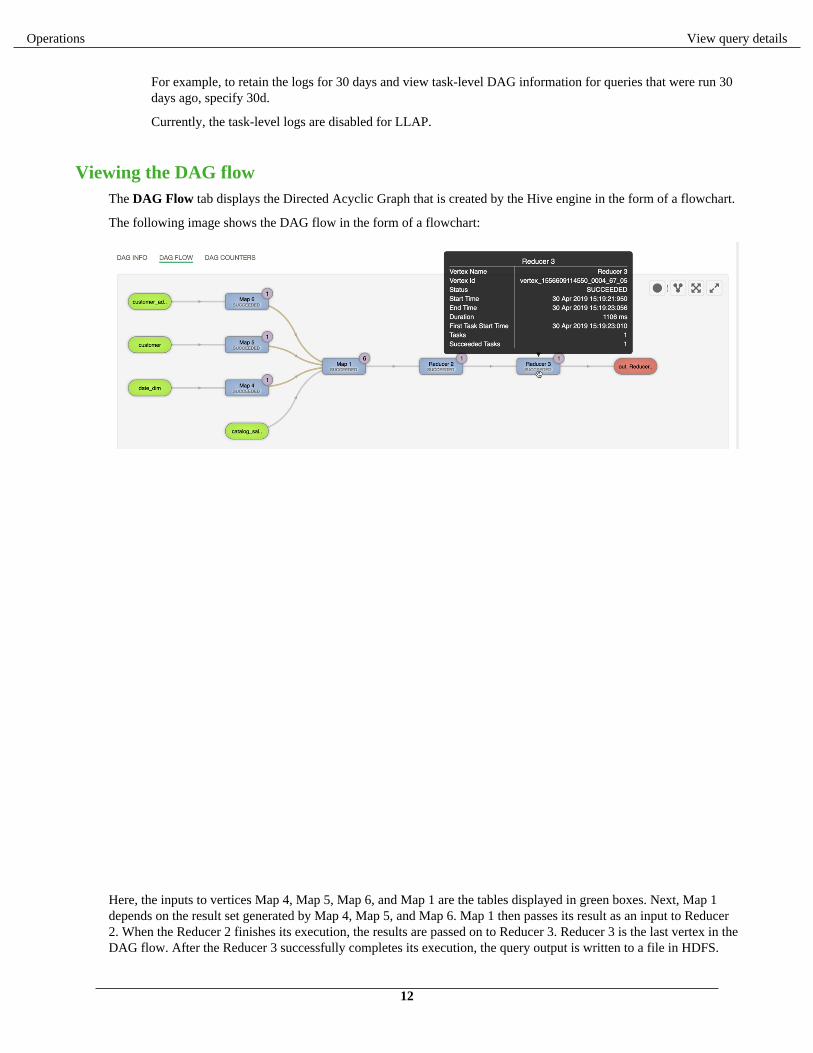
Viewing the DAG flowThe DAG Flow tab displays the Directed Acyclic Graph that is created by the Hive engine in the form of a flowchart.
The following image shows the DAG flow in the form of a flowchart:
Here, the inputs to vertices Map 4, Map 5, Map 6, and Map 1 are the tables displayed in green boxes. Next, Map 1depends on the result set generated by Map 4, Map 5, and Map 6. Map 1 then passes its result as an input to Reducer2. When the Reducer 2 finishes its execution, the results are passed on to Reducer 3. Reducer 3 is the last vertex in theDAG flow. After the Reducer 3 successfully completes its execution, the query output is written to a file in HDFS.
12
Operations Manage databases
There are a few options to change the layout of the DAG flow. You can hide the input and the output nodes to viewonly the task vertices by clicking the Toggle source/sink visibility icon. You can switch between the horizontal andvertical orientation by clicking the Toggle orientation icon.
Viewing the DAG countersThe DAG counters provide a way to measure the progress or the number of operations that occur within a generatedDAG. Counters are used to gather statistics for quality control purposes or problem diagnosis.
The DAG counters provide details, such as:
• Number of bytes read and written• Number of tasks that initiated and ran successfully• Amount of CPU and memory consumed
Manage databases
You can select the database on which you want to perform operations.
You can also create and drop a database, and search for tables within a database.
Using the database explorerUsing the Database Explorer, you can select a database to manage it, create a new database, or drop a database.
Once you select a database, the tables list gets refreshed to list all the tables from the selected database.
You can perform the following actions using the Database Explorer:
• Select a database• Create a database• Drop a database• Search for a table within a database• Create a table
Searching for tablesAfter selecting a database, the tables tab is refreshed to list all the tables in the database.
To search for a table, start entering the name of the table in the Search box. The list gets refreshed as you enter yoursearch string to narrow the list down to your desired table.
Click the Refresh icon to refresh the list of tables.
Managing tablesUsing the Database Explorer UI, you can view information about table columns, partitions, storage, and metadata, aswell as preview a few rows from the table. This enables you to ensure that your table contains exactly the informationthat you intend it to.
For each table, the following tabs provide respective details:
• Columns: You can view the details of each column of the table. You can also search for columns using the Searchbox.
13
Operations Manage databases
• Partitions: You can view the details of columns that are partitions in the table. You can also search from the list ofcolumns.
• Storage Information: You can view the storage information such as input format, output format, if the table iscompressed, number of buckets, buck columns, and so on.
• Detailed Information: You can view details such as the name of the database, the owner of the table, the createdtime, the last accessed time, table type, and so on.
• Statistics: You can view the table statistics and column statistics.• Data Preview: You can preview a few rows from the table.
Creating tablesYou can create a new table or upload an existing table to add it to a particular database.
Procedure
1. On the Database Explorer tab, click the + icon in the Tables section.
The Create Table screen appears.
2. Enter the name of the table.
3. Click Add New Column to add columns to the table.
4. For each column, specify the following detail:
a) Enter the name of the column.b) Select the data type of the column from the drop down list.c) Click Advanced to add advanced details of each column.
5. Click Advanced tab of the Create Table page.
a) Select Transactional if you want the table to be a transactional table.b) Click Add Location if you want to specify a location for the table.c) Select a file format from the drop down list of Add File Format section.d) Click Add Row Format to specify details for the rows.
6. Click Properties to add key-value properties of the table.
7. Click Create.
Uploading tablesYou can upload existing tables in CSV, JSON, or XML format to create new tables in the database.
Procedure
1. Click the Upload Table icon.
The upload table wizard is displayed.
2. On the Upload File page, select the source of the table file.
a) Upload from HDFS: Select this option to upload files from HDFS.b) Upload from Local: Select this option to upload files from your local computer.
The table details automatically appear as preview. Click Preview if the table details do not load automatically.DAS updates the name of the table, names of the columns, and the data types of each column.
3. On the Select File Format page, specify the following:
a) File type: Select the file type from the drop-down list.b) Field Delimiter: This appears if you select CSV as the file format. Enter a delimiter character such as comma
(,).
14
Operations Manage databases
c) Escape Character: This appears if you select CSV as the file format. Enter an escape character such as abacklash (\).
d) Quote Character: This appears if you select CSV as the file format. Enter a double quote character (").e) If the first row is header, click the Is the first row header checkbox.f) If the file contains endlines, click the Contains endlines checkbox.g) Click Preview to generate table preview.
The first ten columns are displayed.
If you are satisfied with the way your uploaded table looks, click Next.
4. On the Table Schema page, specify the table name.
Modify the column names, and specify the corresponding data type and size.
You can also delete column(s) by clicking the corresponding DELETE button.
5. Click the Advanced icon to add a comment for the selected column, and select where you want to partition thetable or keep it clustered.
6. Click Create.
The Create Table page shows the detailed progress as your table is being created.
7. To exit the Upload Table wizard at any stage, and to return back to the Database Explorer page, click Cancel.
Editing tablesYou can edit tables to add new columns, update existing columns, and make changes to the properties of the table.
Procedure
1. On the Database Explorer tab, select a database.
2. From the list of tables, select the table that you want to edit.
3. From the Table view, click the Actions menu.
4. Click Edit.
5. Edit the details of existing columns.
6. Click Add New Column to add columns to the table.
7. For each column, specify the following details:
a) Enter the name of the column.b) Select the data type of the column from the drop down list.c) Click Advanced to add more details for each column.
8. Click the Advanced tab on the Create Table page to specify the following additional options:
a) Select Transactional if you want the table to be a transactional table.b) Click Add Location if you want to specify a location for the table.c) Select a file format from the drop down list of Add File Format section.d) Click Add Row Format to specify details for the rows.
9. Click Properties to add or edit key-value properties of the table.
10. Click Edit to save the changes you made to the table.
Deleting tablesYou can delete a table using the Database Explorer.
Procedure
1. On the Database Explorer tab, select the database.
15
Operations Manage databases
2. From the list of tables, select the table that you need to delete.
3. From the Table view, click the Actions menu.
4. Click Delete.
5. In the dialog box that appears, click Confirm.
Managing columnsUsing the Columns tab, you can view the details of each column of the table.
You can also search for columns using the Search box.
To search for a column, enter the name of the column in the search box and click Regex Search.
Managing partitionsOn the Partitions tab, you can view the details of columns that are partitions in the table.
You can also search from the list of columns.
To search for a column that is a partition, enter the name of the column in the search box and click Regex Search.
Viewing storage informationUsing the Storage Information tab, you can view the storage information of the table such as input format, outputformat, if the table is compressed, number of buckets, number of columns, and more details.
To search for particular details, enter the name in the search box and click Regex Search.
Viewing detailed informationUsing the Detailed Information tab, you can view details such as the name of the database, the owner of the table, thecreated time, the last accessed time, table type, and more details.
To search for particular details, enter the name in the search box and click Regex Search.
Viewing table and column statisticsOn the Statistics tab, you can view table statistics and column statistics.
To view the statistics of each column, click Show. The following details are displayed:
• Min• Max• Number of Nulls• Distinct Count• Average Column Length• Max Column Length• Number of True• Number of False
If a message appears that the statistics might be stale, select Include Columns and click Recompute at the top of thepage.
16
Operations Manage reports
Previewing tables using Data PreviewOn the Data Preview tab, you can preview a few rows from the table.
Manage reports
As a database administrator, you can view which columns and tables are used for joins and make changes to the datalayout to optimize the performance of the query.
Note: The view reports feature is not available in the DAS-Lite version.
Viewing the Read and Write reportThe Read and Write report displays a list of tables belonging to the selected database along with the read count, writecount, and other details for each table.
To view the Read and Write report, click Reports > Read and Write Report. The Relations page is displayed.
The left side lists the tables within the selected database along with the read count, write count, and so on. The rightside shows these details in the form of an entity relationship diagram.
You can switch between the databases using the Database dropdown menu.
To further refine your search based on time, select the time period from the dropdown. After you select the timeperiod, the corresponding “to” and “from” dates representing the selection are displayed along with the time zone.The time zone that is displayed is that of the DAS server.
For each table, select one of the following counts from the drop down list of counts:
• Projection Count• Aggregation Count• Filter Count• Join Count
Viewing the Join reportThe Join report provides you the details of joins between all the tables in a database.
To view the join report, click Reports > Join Report. You can change the database from the dropdown list to viewthe join diagram for that database.
You can switch between the databases using the Database dropdown menu.
To refine your search based on time, select the time period from the dropdown. After you select the time period, thecorresponding “to” and “from” dates representing the selection are displayed along with the time zone. The time zonethat is displayed is that of the DAS server.
You can further refine your join diagram using the following join algorithms:
• Join• Hash Join• Merge Join• Lateral View Join• Sorted Merge
The diagram gets refreshed based on your selection.
17
Operations Running a query on a different Hive instance
If you hover over a particular column, then all the joins with the selected column are highlighted. If you hover overa particular connection line, then the number of times the two columns were joined (also known as the join count) isdisplayed. The join count that is displayed is for the time period that you select.
For every table present on the Join report, DAS displays the database in which that table belongs. If you select aparticular database from the dropdown menu, then the Join report predominantly displays all the joins originatingfrom the tables within the selected database to the tables belonging to other databases.
Running a query on a different Hive instance
By default, ZooKeeper redirects your query to run on a Hive instance that is available at that time. However, if youhave optimized a certain Hive instance, and you want to run your workload on that particular Hive instance, then youcan switch to that instance by specifying the HiveServer2 host name and the port in the JDBC connection field on theDAS user interface.
About this taskThe JDBC connection string is defined by the hive.zookeeper.quorum property under Ambari > Services > Hive >CONFIGS > ADVANCED > Advanced hive-site.
Note:
The JDBC connection string that you specify through the web interface is a temporary configuration and islimited to that particular browser session.
Alternatively, you can go to Ambari > Data Analytics Studio > CONFIGS > Advanceddata_analytics_studio-properties, and specify a configuration string in the Hive session params field asshown in the following example along with the rest of the parameters such as truststore and password:
serviceDiscoveryMode=zooKeeper;hive.server2.zookeeper.namespace=<hs2-zk-namespace>
To update the JDBC connection string through the web interface:
Procedure
1. Sign in to the DAS portal.
2. Click the profile icon on the top right corner and then click About.
3. On the Configurations window, click Edit under the JDBC connection field.
4. Specify the HiveServer2 host name and port that you want to connect to in the following format:
jdbc:hive2//HiveServer2-host:port/
Note: The Hive instance that you want to switch to should be within the same cluster.
5. To save the changes, click Update.
6. To revert any changes that you have made to the original connection string, click Reset.
7. To go back to the Configurations window, click Cancel.
8. To exit, click OK.
ResultsWhen you run your query after updating the JDBC connection string, the query is executed on that particular Hiveinstance instead of being redirected to any Hive instance by ZooKeeper.
18
Operations Modifying the session cookie timeout value
Modifying the session cookie timeout value
By default, the session cookie expire in 86400 seconds (or 24 hours). Depending on your organizational requirement,you can increase or decrease the session cookie timeout duration from Ambari. To modify the session cookie timeoutduration:
Procedure
1. From Ambari, go to Data Analytics Studio > Config > Advanced data_analytics_studio-webapp-propertiesand specify the timeout duration in the Session timeout in seconds field.
2. Save the changes and restart the required services by clicking RESTART > Restart All Required.
Creating system tables to run query on Hive and Tez DAGevents
The Tez DAG events are exposed in the dag_data table, and the Hive query events are exposed in the query_datatable in the sys database. You can run Hive queries from DAS to process these events and generate custom reports.
About this taskYou need to create these system tables before you can run queries on them.
Procedure
1. From Ambari, go to Data Analytics Studio.
2. Click Actions > Create Tables.
3. Navigate through the table creation wizard and make sure that the operation completes successfully.
You can view the dag_data and the query_data tables under the sys database in the DAS UI.
Cleaning up old queries, DAG information, and reports data
The DAS Postgres database stores all the queries that you run from the DAS UI or beeline, and all the data that isused to generate the DAG information and reports. Over a period of time, this can grow in size. To optimize theavailable capacity, DAS has a cleanup mechanism that, by default, purges all the queries and DAG informationolder than 30 days and purges old reports after 365 days. However, you can customize the cleanup frequency byadding the cleanup.query-info.interval, and cleanup.report-info.interval configurations, and the Cron expression:cleanup.cron.expression in the das-event-processor.json file from Ambari.
Procedure
1. From the Ambari UI, go to Data Analytics Studio > CONFIGS > Advanced data_analytics_studio-event_processor-properties.
2. To customize the cleanup intervals, under Data Analytics Studio Event Processor config file template, add thethree new configurations in the event-processing section as shown in the following example:
"event-processing": { "hive.hook.proto.base-directory": "{{data_analytics_studio_event_processor_hive_base_dir}}", "tez.history.logging.proto-base-dir": "{{data_analytics_studio_event_processor_tez_base_dir}}", "meta.info.sync.service.delay.millis": 5000,
19
Operations Cleaning up old queries, DAG information, and reports data
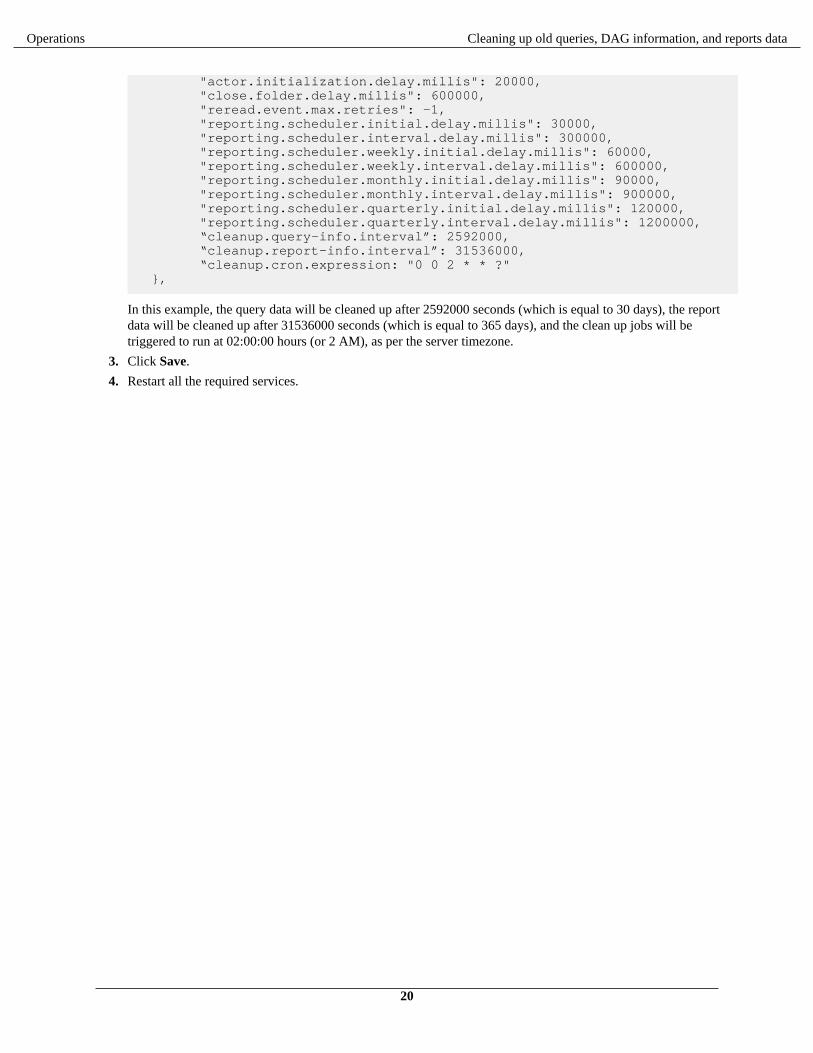
"actor.initialization.delay.millis": 20000, "close.folder.delay.millis": 600000, "reread.event.max.retries": -1, "reporting.scheduler.initial.delay.millis": 30000, "reporting.scheduler.interval.delay.millis": 300000, "reporting.scheduler.weekly.initial.delay.millis": 60000, "reporting.scheduler.weekly.interval.delay.millis": 600000, "reporting.scheduler.monthly.initial.delay.millis": 90000, "reporting.scheduler.monthly.interval.delay.millis": 900000, "reporting.scheduler.quarterly.initial.delay.millis": 120000, "reporting.scheduler.quarterly.interval.delay.millis": 1200000, “cleanup.query-info.interval”: 2592000, “cleanup.report-info.interval”: 31536000, “cleanup.cron.expression: "0 0 2 * * ?" },
In this example, the query data will be cleaned up after 2592000 seconds (which is equal to 30 days), the reportdata will be cleaned up after 31536000 seconds (which is equal to 365 days), and the clean up jobs will betriggered to run at 02:00:00 hours (or 2 AM), as per the server timezone.
3. Click Save.
4. Restart all the required services.
20