laboratory operational & clinical analytics:
TRANSCRIPT
LABORATORY OPERATIONAL & CLINICAL ANALYTICS:
USE & BENEFITS
Dennis WinstenDennis Winsten & Associates, Inc.Healthcare Systems ConsultantsTucson, [email protected]
DISCLOSURE
In the past 12 months, Dennis Winsten &Associates, Inc. has not had anysignificant financial interest or otherrelationship with the manufacturers of theproducts or providers of the services thatwill be discussed in the presentation.
OVERVIEW
• Timely access to accurate performance metrics is the single biggest requirement for labs wanting to improve both operational and financial performance while concurrently contributing to enhanced patient care.
• This session will describe the characteristics of analytics, provide examples of analytical tools and criteria for selection of an analytical system for your laboratory
LEARNING OBJECTIVES
n Identify how analytics can improve clarity of the operational and clinical characteristics of the laboratory
n Gain insights on how other laboratories are using analytics in daily practice
n Define key characteristics and evaluation criteria in the selection, acquisition and implementation of analytics software
PROGRESSION
BIG DATA
DATA
DATA
PRESSURE, PRESSURE, PRESSURE!• Medical laboratories and pathology groups face enormous levels of change in
their clinical, regulatory and financial environments.
• With reduced reimbursement, laboratories are under increasing pressure to optimize business practices, improve utilization and cut costs.
• Laboratories are seeing downward pressure on reimbursement at both the federal and payer levels, coupled with increased emphasis on efficiency and quality.
• With a shift from fee-for-service reimbursement to fee-for-quality reimbursement strategies, and clinical laboratories and pathology groups are being driven to find tools that increase their competitiveness
• Today’s clinical and pathology laboratories are being asked to perform increased volumes of tests at higher quality for less money.
WHAT ARE REAL-TIME ANALYTICS (RTA)?• Wikipedia defines analytics as “the discovery and communication of
meaningful patterns in data.”
• Business Dictionary’s definition: “Analytics involves studying past historical data to research potential trends, to analyze the effects of certain decisions or events, or to evaluate the performance of a given tool or scenario.
• The goal of analytics is to improve the business by gaining knowledge which can be used to make improvements or changes.”
• Analytics uses mathematics, statistics, predictive modeling and machine learning to correlate, find patterns in data and present the findings in an easily interpretable form, e.g. graphs, dashboards, scorecards.
WHY REAL-TIME ANALYTICS (RTA)?
• Timely access to accurate performance metrics is the single biggest requirement for labs/pathology groups wanting to improve performance to best practice levels.
• Many labs are handicapped in meeting their goals because the performance metrics they use are typically based on data from weeks or even months earlier.
• Lab management must look at key performance metrics every day, yet few labs have the Real Time Analytics systems in place that can provide up-to the-minute metrics.
WHY REAL-TIME ANALYTICS (RTA)?
• Analytics will be crucial to achieving the systematic quality improvements and cost reductions demanded by healthcare reform– how can you fix what you can’t measure? – This new age of analytics will require a foundational set of analytics
platforms that many executives are actively exploring.
• Competing in a challenging market laboratory management will require the ability to understand and quickly interpret its laboratory’s operational characteristics.
• To meet this challenge, laboratory managers know they must get better at using metrics to support the many operational decisions required to boost productivity and quality while simultaneously reducing overall costs throughout their labs.
• Timely data in an easily interpretable form showing deviations from expected performance can provide insights for management remediation. Real time analytics offers such capabilities.
USES OF REAL-TIME ANALYTICS
• Analytics can be used for:
– Retrospective and Prospective Performance Measures
– Utilization Measurement and Monitoring
– Regulatory Reporting, Compliance and Transparency
– Quality Improvement
– Service Level Benchmarking
– Clinical Decision Support
– Population Health Management
– Comparative Effectiveness
HIERARCHY OF ANALYTICS -1
The first or lowest level of analytics is “Descriptive” which collates and summarizes raw data for interpretation:
• Describes what HAS happened, i.e. “hindsight”.
• This is the most common application of analytics in laboratories today.
• This level can help answer questions like, what happened? What is the problem?
HIERARCHY OF ANALYTICS -2
The next higher level is “Predictive” analytics which uses advanced analytics tools including statistical modeling and algorithms:
• Determines what COULD or is LIKELY TO HAPPEN, i.e. “insight”.
• This analytics model is becoming more commonly used.
• Questions that can be answered include: Why is this happening? What will happen next? Why will it happen?
HIERARCHY OF ANALYTICS -3
The third and most sophisticated level which is in early stages of development is “Prescriptive” analytics that uses mathematically based techniques of optimization, simulation, game theory, artificial intelligence, and metaheuristics:
• Suggests decision options most likely to optimize outcomes.
• This analytics model Indicates what SHOULD happen or the predicted BEST COURSE OF ACTION, e.g. “foresight”.
• Answers to questions as what should we do? What are the possible outcomes?
WHAT IS THE MEANING AND SIGNIFICANCE OF “REAL TIME” IN RTA?
• Real Time implies that the data is available for analysis and review virtually at the moment data is available.
• In reality, “real time” means that the available data can be displayed immediately at the request of the laboratory manager.
• It does not necessarily imply that the data displayed is “up to the minute”.
WHAT IS THE MEANING AND SIGNIFICANCE OF “REAL TIME” IN RTA?
• The issue of timeliness of data accessible for display and interpretation is an important consideration in the selection and implementation of an analytics application for your laboratory
• Is the analytics database refreshed with laboratory data every second? Every minute? Every hour? Daily?
• Different types of data have different timeliness requirements, e.g. patient results might justify updates every second while turn-around-time data could be minutes and financial data daily.
• The cycle of updating will affect system performance requirements.
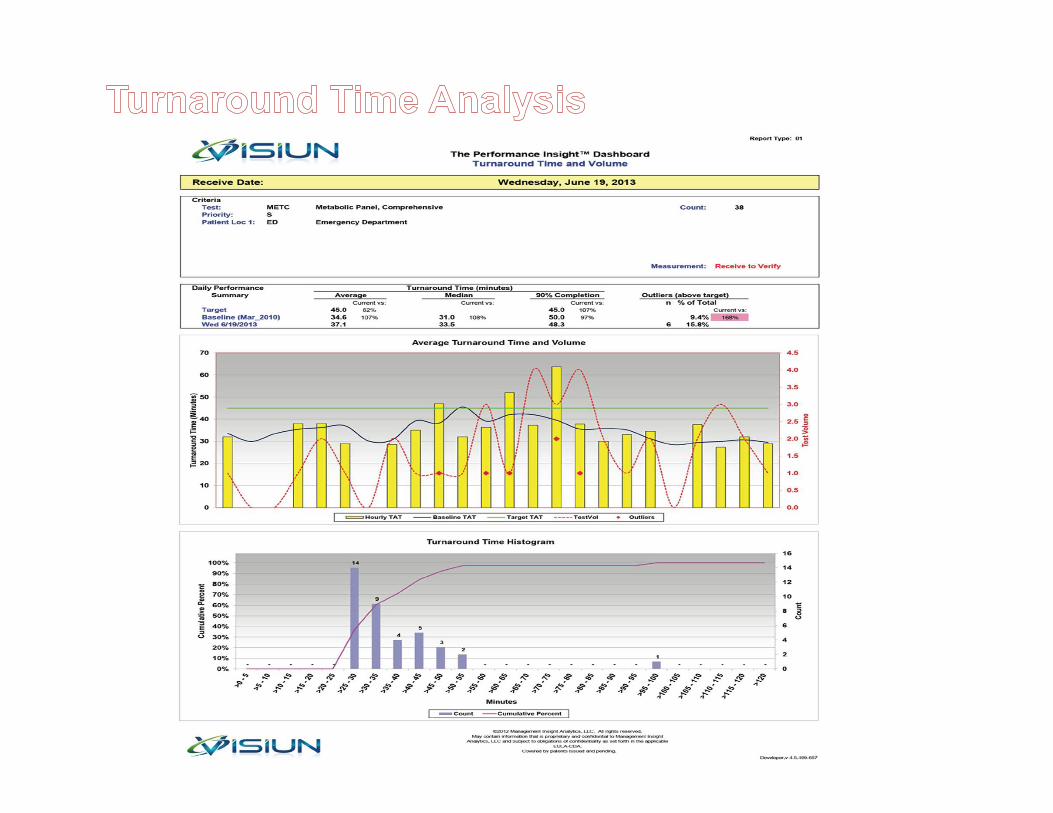
EXAMPLES OF RTA ANALYTICS
The following examples have been provided by various RTA vendors.
Dennis Winsten & Associates, Inc has no relationship with any noted vendors, nor does presentation of their examples imply any endorsement.
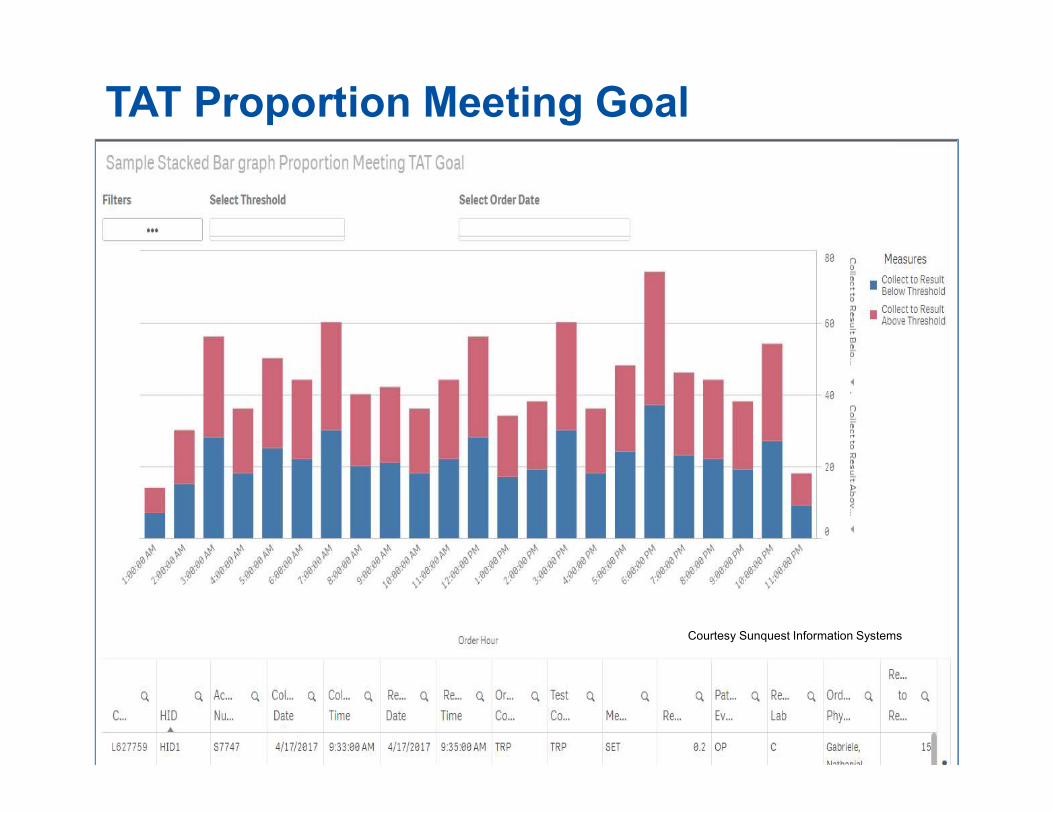
TAT Proportion Meeting Goal
Courtesy Sunquest Information Systems
Proprietary and Confidential © | hc1.com Inc. Personalizing the Healthcare Experience® 19
Director ∨Help∨
Recent Items ∨
Collaboration Center Dashboard Clients Contacts Campaigns Activities Opportunities Reports Orders and Patients
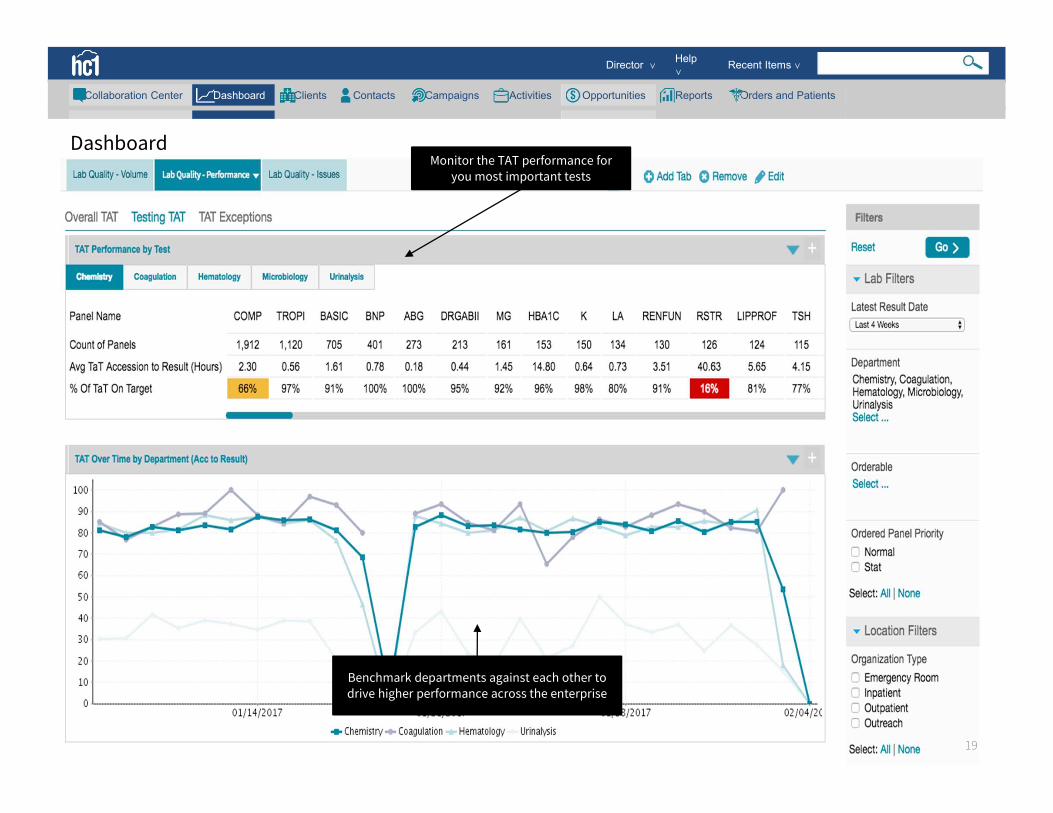
DashboardMonitor the TAT performance for
you most important tests
Benchmark departments against each other to drive higher performance across the enterprise
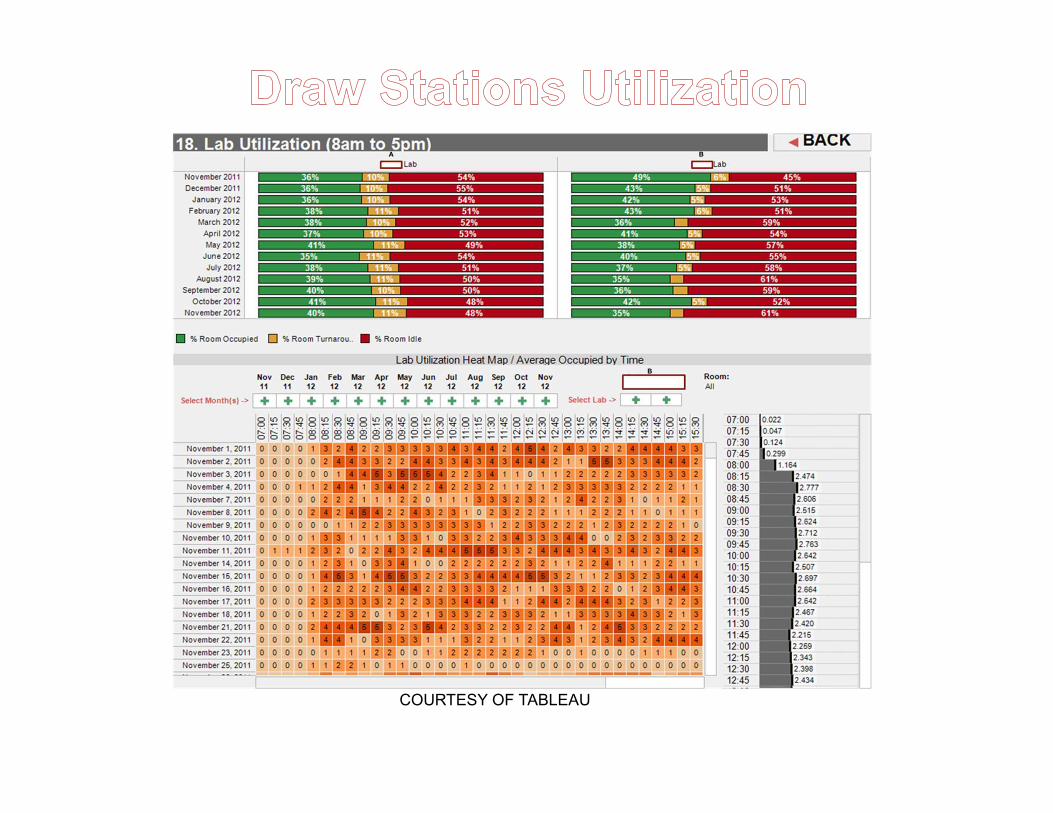
COURTESY OF TABLEAU
A B
B
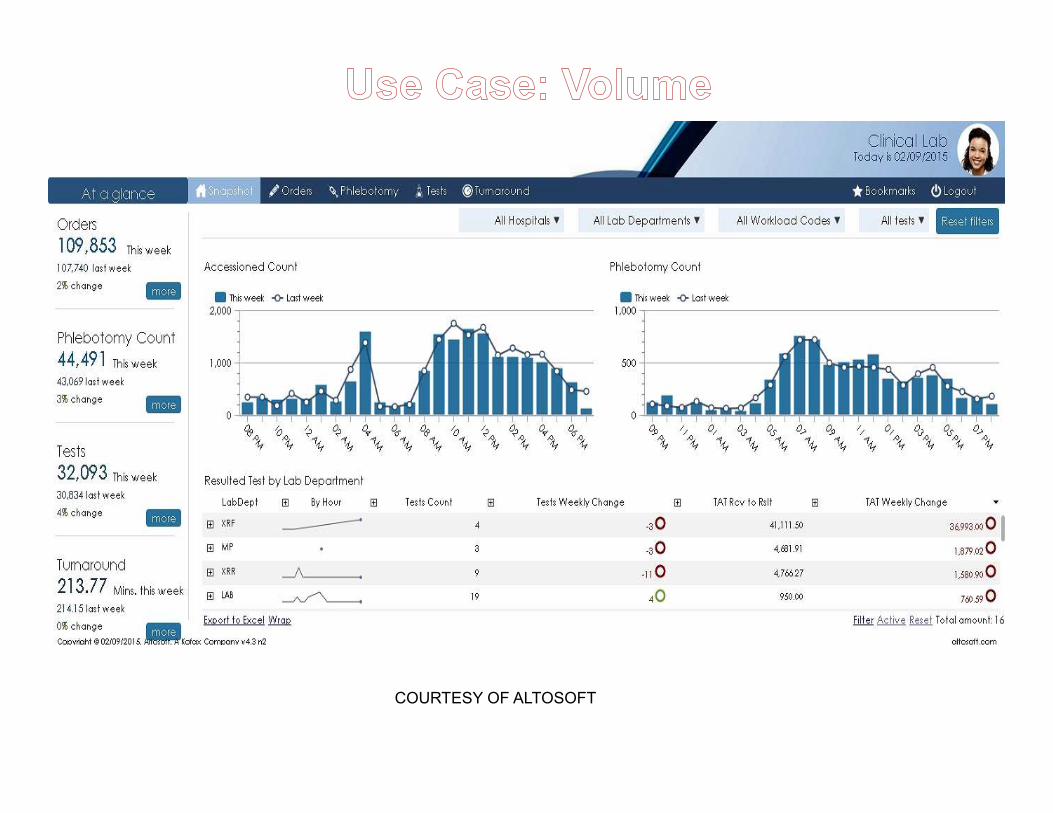
COURTESY OF ALTOSOFT
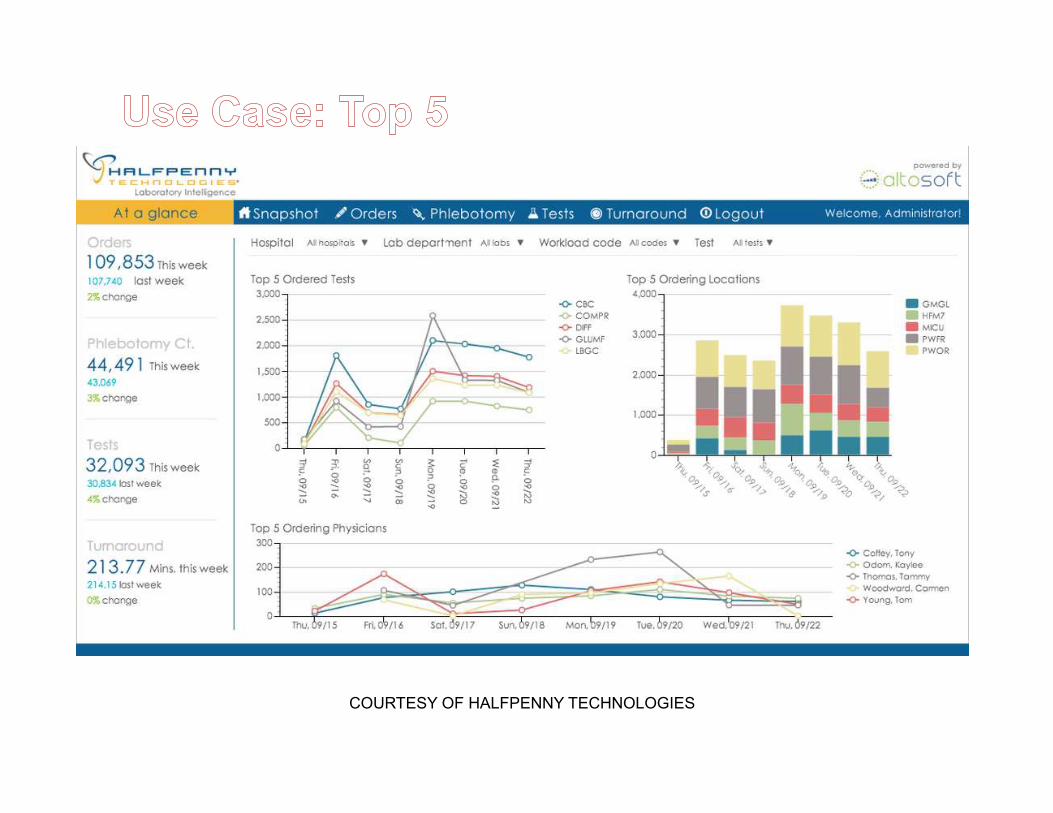
COURTESY OF HALFPENNY TECHNOLOGIES
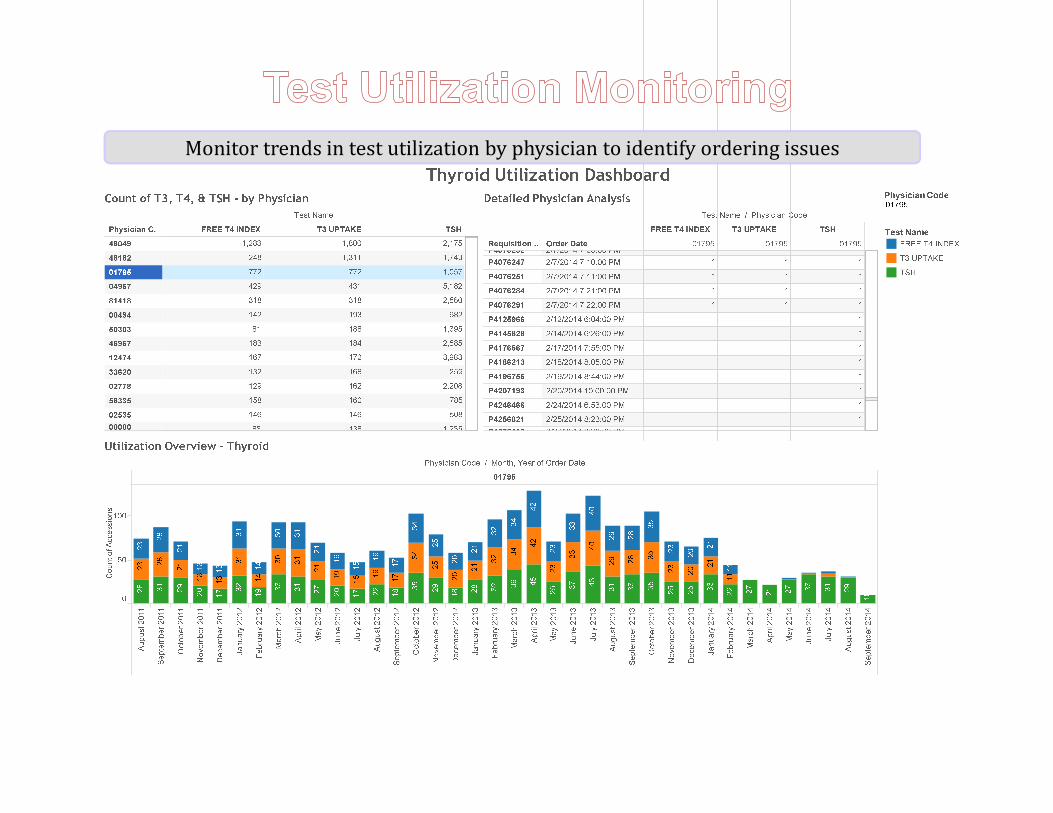
Monitor trends in test utilization by physician to identify ordering issues
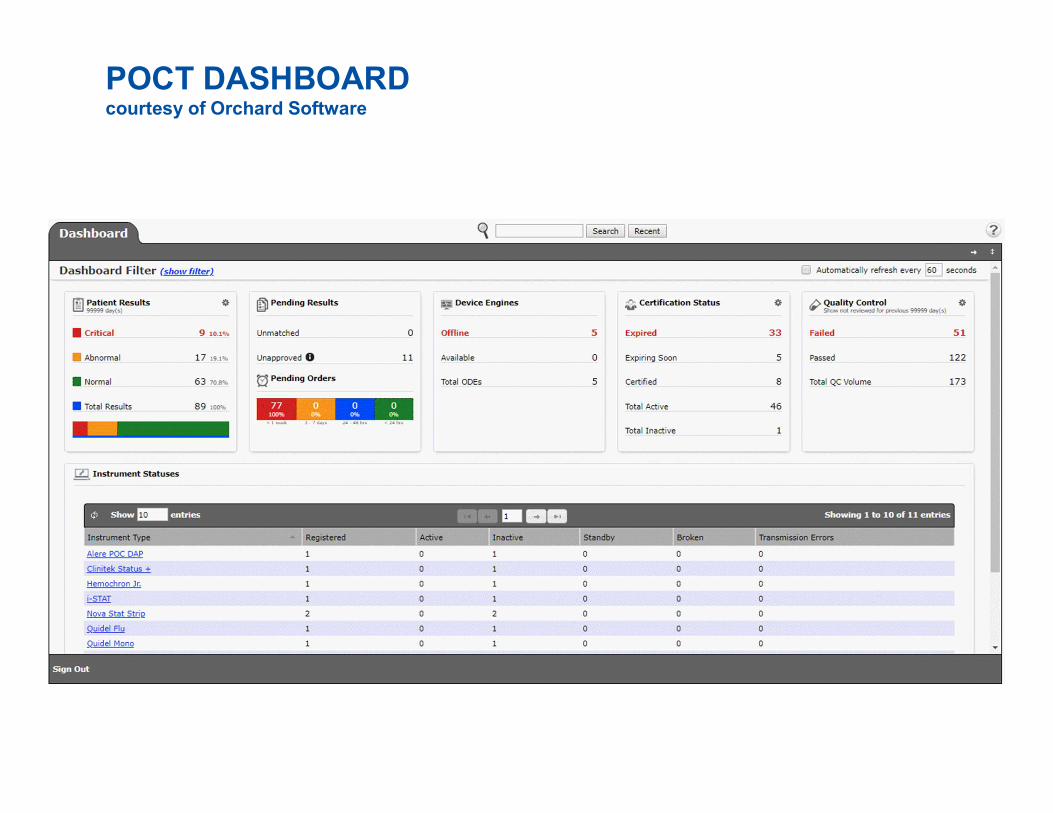
POCT DASHBOARDcourtesy of Orchard Software
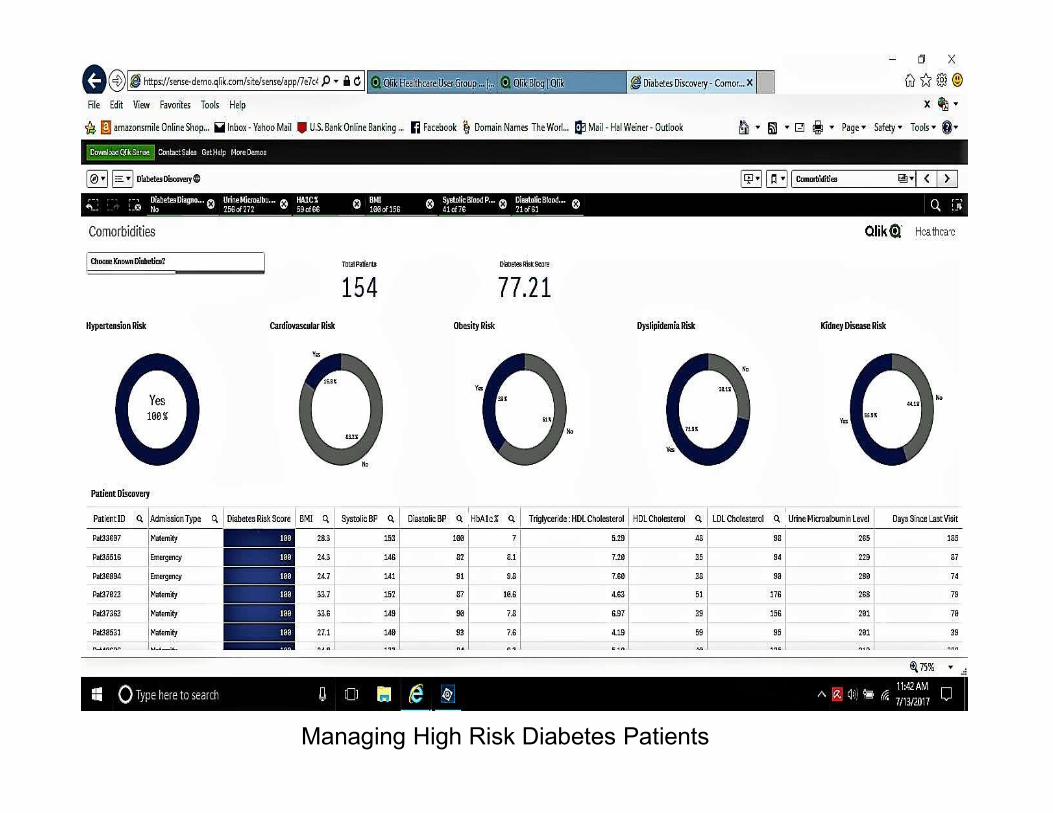
Managing High Risk Diabetes Patients
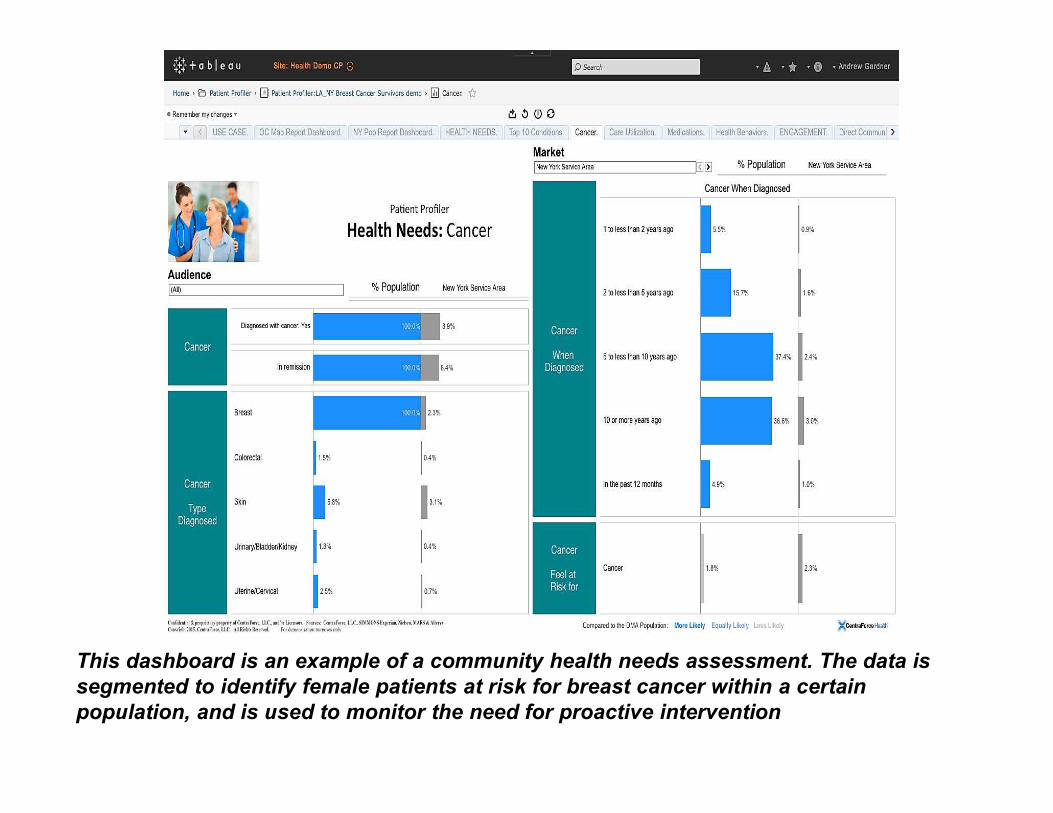
This dashboard is an example of a community health needs assessment. The data is segmented to identify female patients at risk for breast cancer within a certain population, and is used to monitor the need for proactive intervention
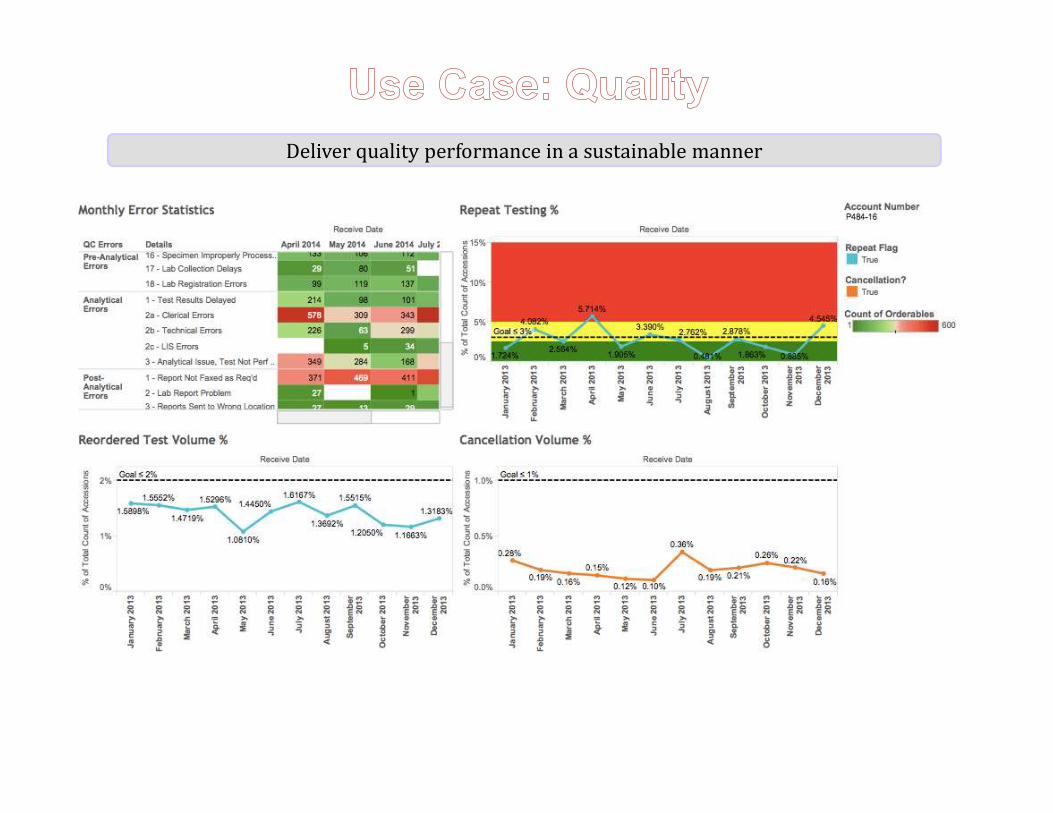
Deliver quality performance in a sustainable manner
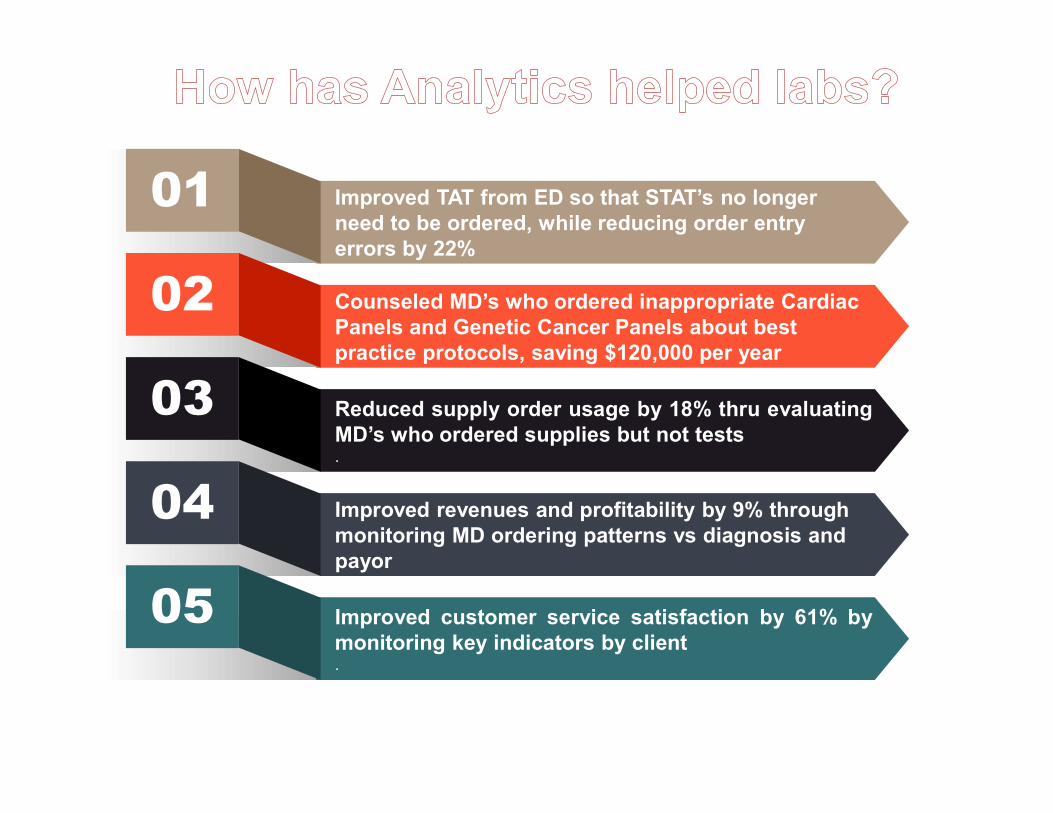
01 Improved TAT from ED so that STAT’s no longer need to be ordered, while reducing order entry errors by 22%
Counseled MD’s who ordered inappropriate Cardiac Panels and Genetic Cancer Panels about best practice protocols, saving $120,000 per year
02
Reduced supply order usage by 18% thru evaluatingMD’s who ordered supplies but not tests.
03
Improved revenues and profitability by 9% through monitoring MD ordering patterns vs diagnosis and payor
04
Improved customer service satisfaction by 61% bymonitoring key indicators by client.
05
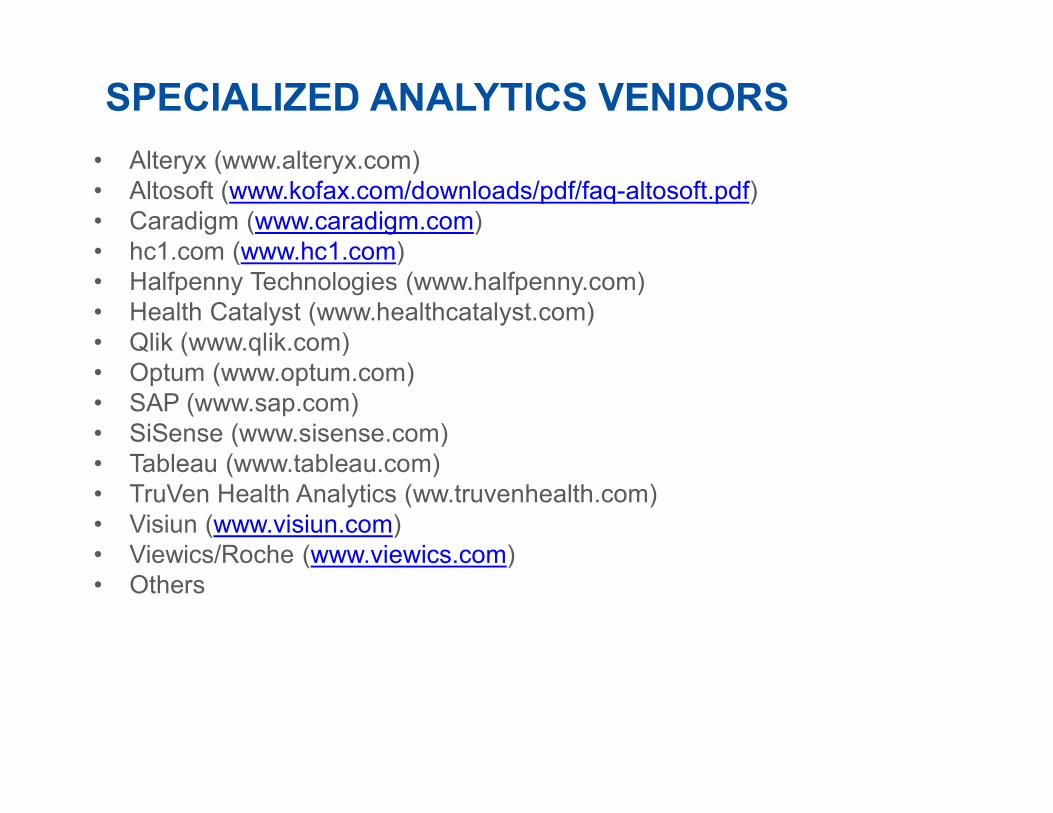
SPECIALIZED ANALYTICS VENDORS
• Alteryx (www.alteryx.com) • Altosoft (www.kofax.com/downloads/pdf/faq-altosoft.pdf)• Caradigm (www.caradigm.com) • hc1.com (www.hc1.com)• Halfpenny Technologies (www.halfpenny.com)• Health Catalyst (www.healthcatalyst.com)• Qlik (www.qlik.com)• Optum (www.optum.com)• SAP (www.sap.com)• SiSense (www.sisense.com)• Tableau (www.tableau.com)• TruVen Health Analytics (ww.truvenhealth.com)• Visiun (www.visiun.com)• Viewics/Roche (www.viewics.com)• Others
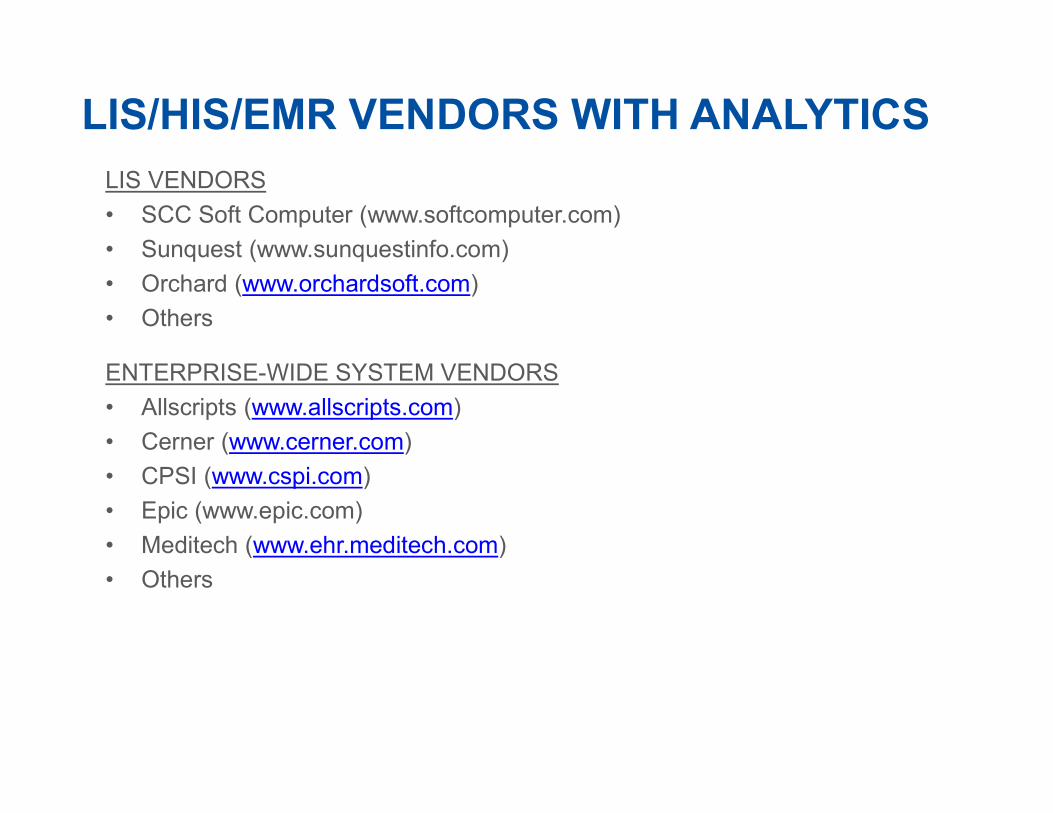
LIS/HIS/EMR VENDORS WITH ANALYTICSLIS VENDORS
• SCC Soft Computer (www.softcomputer.com)
• Sunquest (www.sunquestinfo.com)
• Orchard (www.orchardsoft.com)
• Others
ENTERPRISE-WIDE SYSTEM VENDORS
• Allscripts (www.allscripts.com)
• Cerner (www.cerner.com)
• CPSI (www.cspi.com)
• Epic (www.epic.com)
• Meditech (www.ehr.meditech.com)
• Others

WHERE DO WE GO FROM HERE?
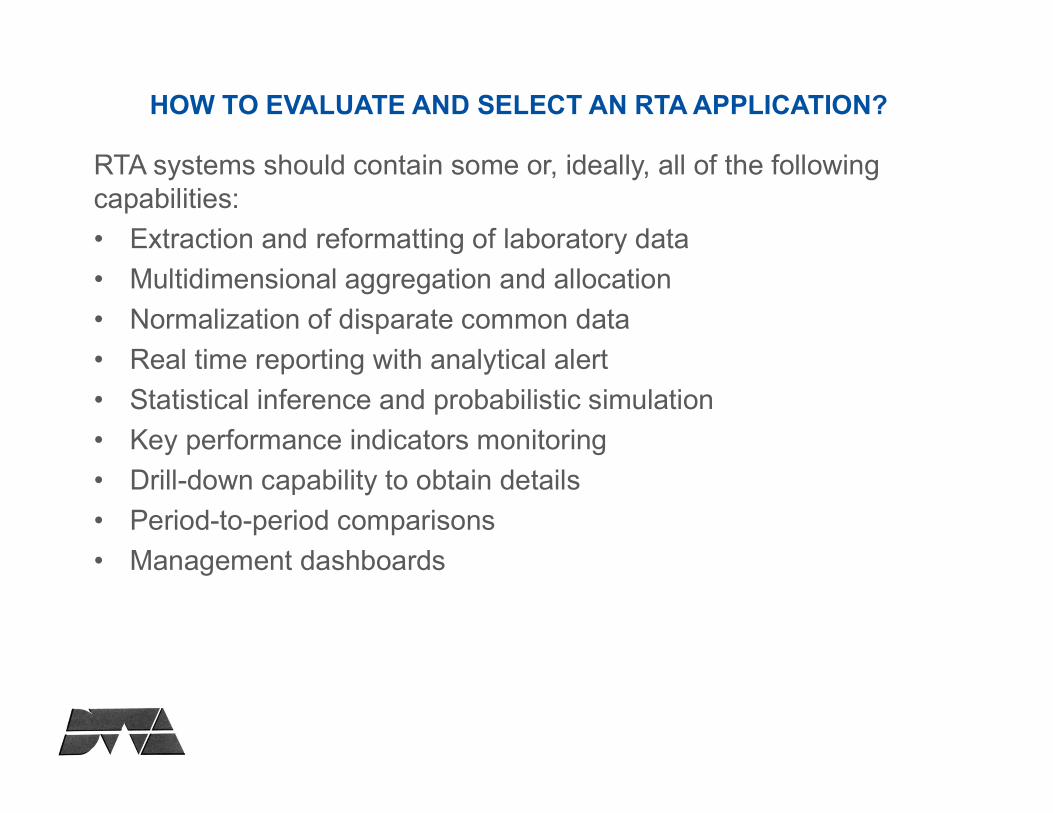
HOW TO EVALUATE AND SELECT AN RTA APPLICATION?
RTA systems should contain some or, ideally, all of the following capabilities:
• Extraction and reformatting of laboratory data
• Multidimensional aggregation and allocation
• Normalization of disparate common data
• Real time reporting with analytical alert
• Statistical inference and probabilistic simulation
• Key performance indicators monitoring
• Drill-down capability to obtain details
• Period-to-period comparisons
• Management dashboards
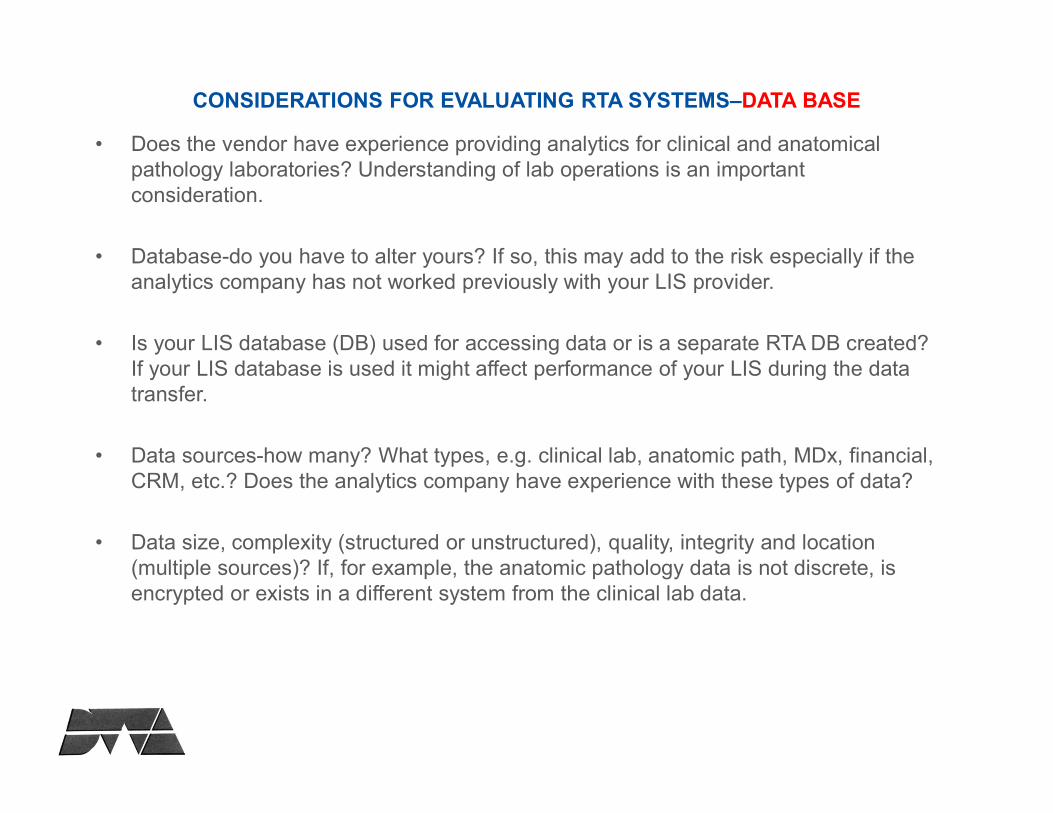
CONSIDERATIONS FOR EVALUATING RTA SYSTEMS–DATA BASE
• Does the vendor have experience providing analytics for clinical and anatomical pathology laboratories? Understanding of lab operations is an important consideration.
• Database-do you have to alter yours? If so, this may add to the risk especially if the analytics company has not worked previously with your LIS provider.
• Is your LIS database (DB) used for accessing data or is a separate RTA DB created? If your LIS database is used it might affect performance of your LIS during the data transfer.
• Data sources-how many? What types, e.g. clinical lab, anatomic path, MDx, financial, CRM, etc.? Does the analytics company have experience with these types of data?
• Data size, complexity (structured or unstructured), quality, integrity and location (multiple sources)? If, for example, the anatomic pathology data is not discrete, is encrypted or exists in a different system from the clinical lab data.
CONSIDERATIONS FOR EVALUATING RTA SYSTEMS-DATA BASE
• What data sources can be tapped, e.g. databases (Oracle, SQL, Caché), Excel, Web pages, etc.? Does the analytics company have experience utilizing the DB of your LIS, HIS or EMR?
• Where does the DB reside? Cloud? Servers at your lab? Do you have a preference? Evaluate the tradeoffs of these options.
• How frequently is the RTA DB updated? Real-time? Hourly? Daily? If not real-time, is the frequency of RTA updates consistent with your needs for data timeliness?
• Are alerts based on rules (limits, ranges, Boolean logic, etc.) with link to backup data triggering the alert? Can you set the logical criteria for the analytics application to issue alerts?
• What is the impact on performance with DB updates? Will analytics usage affect your LIS, HIS or EMR performance?
CONSIDERATIONS FOR EVALUATING RTA SYSTEMS-SCOPE & USE
• How secure is your data? How is your data protected from loss, from unauthorized access or hacking?
• What is the scope of RTA? Financials. e.g. revenue by client? Operating data, e.g. TAT, utilization, quality, outreach services? Clinical results? Will the scope of your analytics needs be provided?
• Is the RTA simply Descriptive or better yet, Predictive or best, Prescriptive? Is the level of analytics complexity suitable for your needs?
• What is the granularity of the RTA data-is there sufficient detail? How detailed and precise are your analytics requirements?
• How easy is it to create RTA query templates? Can lab staff do it or must the analytics vendor be involved?
• Ease of use of the software? Evaluate during a demonstration. Will users be lab staff and/or I.T. staff?
CONSIDERATIONS FOR EVALUATING RTA SYSTEMS-STAFF
• How much staff time required to set up RTA? Lab? I.T.? Will it disrupt lab operations?
• How much staff time required to support changes to RTA for lab staff, I.T. staff? Changes will be required. Will trained lab staff be available? Will the analytics vendors have to be involved?
• Will you require a data base administrator (DBA)? If maintenance of the analytics DB is complex either a lab DBA or assistance from the vendor will, be required.
• The number of people that can run queries at the same time? Who and how many lab staff will access analytics?
• The number of user licenses needed? Dependent of the number of direct analytics users.
CONSIDERATIONS FOR EVALUATING RTA SYSTEMS - COST
• How is the RTA application priced? Subscription? License? What is your preference for financing the analytics application?
• What are initial costs and five (5) year support/maintenance costs? Require as part of your analytics vendor evaluation.
• What is the projected ROI? ROI is usually Rarely Obtained Information. May be difficult but should be a consideration.
RTA ACQUISITION STRATEGIES
There are two options for acquisition of RTA:
• Subscription
or
• Licensing
RTA ACQUISITION STRATEGIESCharacteristics of the Subscription approach include:
• Minimal upfront cost
• Typically, SaaS Software as a Service– resident in the “Cloud”
• Annual renewals – option to discontinue if unsatisfactory
• Support and maintenance costs built into the annual subscription cost
• Minor and major upgrades are included in the subscription cost
RTA ACQUISITION STRATEGIES
The Licensing option:
• May have substantial upfront cost
• Annual fees of 18% to 20% of the initial purchase price for support, releases and upgrades
• Software operates on your servers, under your control
• Potential for integration with other applications
PITFALLS TO AVOID WHEN IMPLEMENTING AND USING RTA
Before embarking on a RTA Project laboratory management should assure that sufficient resources are available to carry the project to successful fruition. The following should be confirmed:
• The level of commitment and sponsorship of the project from laboratory management
• The level of the laboratory’s need for creating a RTA implementation
• The amount and quality of laboratory data available
• Budget sufficiency to license/subscribe, install and support a RTA system
• Staff availability to implement and support RTA operations and the support to be provided by RTA vendor
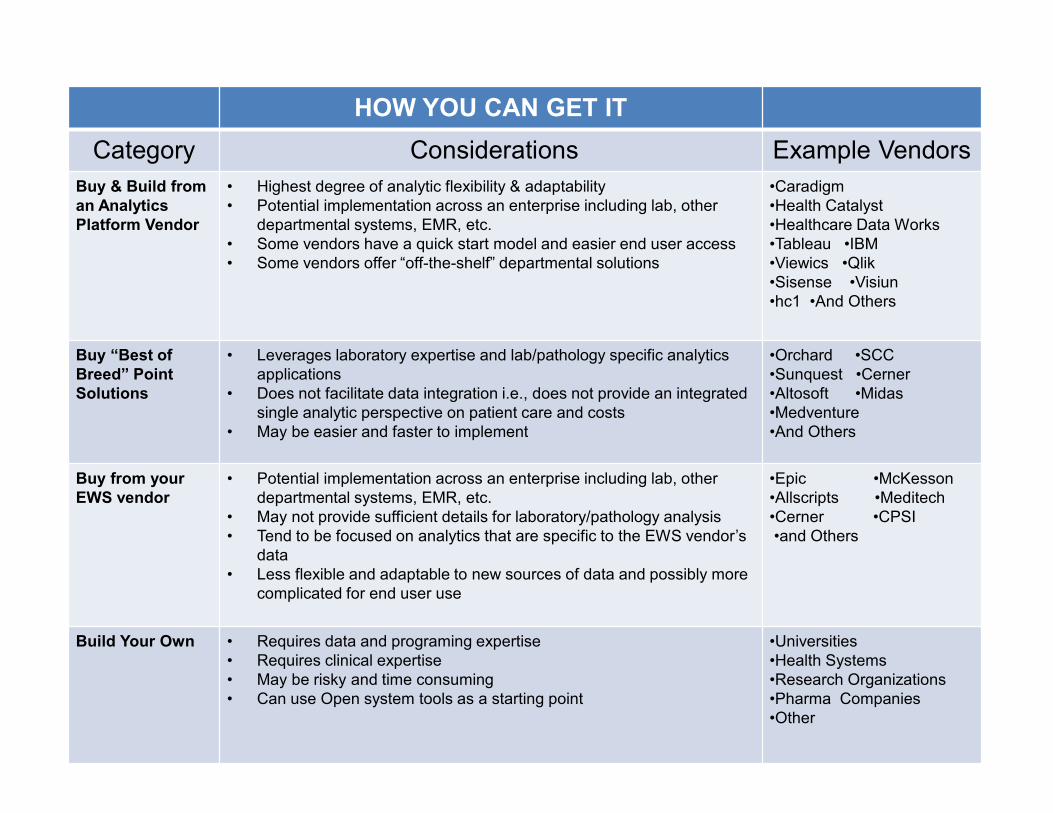
HOW YOU CAN GET IT
Category Considerations Example VendorsBuy & Build from an Analytics Platform Vendor
• Highest degree of analytic flexibility & adaptability• Potential implementation across an enterprise including lab, other
departmental systems, EMR, etc.• Some vendors have a quick start model and easier end user access• Some vendors offer “off-the-shelf” departmental solutions
•Caradigm•Health Catalyst•Healthcare Data Works•Tableau •IBM •Viewics •Qlik•Sisense •Visiun•hc1 •And Others
Buy “Best of Breed” PointSolutions
• Leverages laboratory expertise and lab/pathology specific analytics applications
• Does not facilitate data integration i.e., does not provide an integrated single analytic perspective on patient care and costs
• May be easier and faster to implement
•Orchard •SCC•Sunquest •Cerner•Altosoft •Midas•Medventure•And Others
Buy from your EWS vendor
• Potential implementation across an enterprise including lab, other departmental systems, EMR, etc.
• May not provide sufficient details for laboratory/pathology analysis• Tend to be focused on analytics that are specific to the EWS vendor’s
data• Less flexible and adaptable to new sources of data and possibly more
complicated for end user use
•Epic •McKesson•Allscripts •Meditech•Cerner •CPSI •and Others
Build Your Own • Requires data and programing expertise• Requires clinical expertise• May be risky and time consuming• Can use Open system tools as a starting point
•Universities•Health Systems•Research Organizations•Pharma Companies•Other
SUMMARY
• RTA can be a significant benefit to laboratories
• Laboratories need real-time information to track workflow and activities across the full spectrum of lab functions.
• Using real time analytics can provide business, logistical, and medical data extracted from your existing information system(s)
• RTA can help you to more effectively make changes to improve workflow, increase efficiency, and identify, evaluate, and solve problems as, or before they occur.
• Careful evaluation of the characteristics of any proposed RTA system before its selection is imperative.
• RTA applications should offer a range of capabilities and be responsive to a set of key evaluation criteria.
• RTA can be obtained from RTA specialist companies or from your LIS or enterprise-wide EWS vendor.
THE FUTURE
• Increased clinical applications for patient care to improve diagnostics and therapies using predictive and prescriptive analytics.
• Enhanced Precision and Personalized Medicine
– Machine Learning
– Artificial Intelligence
– Image Recognition and Analysis
– BioBanking
– Genomic Databases
Questions
If you wish copies of this presentation, have questions or would like assistance with RTA e-mail us at:
Or call 520-331-4656