technical and vocational education analytics
TRANSCRIPT
TECHNICAL AND VOCATIONAL EDUCATIONANALYTICS USING PUNJAB TEVTA STUDENTS’ DATA
QUDSIA SALEEM1, ARSLAN ASIF
1, MALIK TAHIR HASSAN1`
1Department of Software Engineering, University of Management and Technology,Lahore, Punjab, Pakistan
Email: [email protected]
ABSTRACT. The development of informative workforce that is skilled in a specificprofession is considered as the most recommended and desirable feature of anyadvanced state. Technical Education & Vocational Trainings provide goldenopportunity of growth regarding the output of individuals and prosperity of employers.Subsequently it is the dire need of developing countries to invest in public vocationaleducation and training sector (VET) for the progression of skillful societies. Process ofmanual predictions and analysis on the basis of students’ data to make decisions thatwill improve the overall teaching and learning is very difficult and tiring. Data miningis exceptionally helpful when we are talking about education data analysis andprediction. Data mining techniques are being used successfully in different areasespecially in student educational and learning analytics called as Educational DataMining (EDM). In this work, TEVTA students’ data is shaped as a ready-to-mine dataset and then various data mining techniques are applied to derive interesting patternsthat can potentially derive important decisions for improvement of learning process,enhancement of teaching method and overall development of whole system of technicaleducation and vocational trainings. Besides presenting interesting analytics of TEVTAdata, we develop classification problems to predict status of students after completingTEVTA courses. This classification can also help in evaluating success of TEVTAprograms. This work can help in analyzing and predicting the aspects affectingstudents’ as well as institutes’ performance from different dimensions.Keywords: Educational Data Mining; Technical Education and Vocational Training;TEVTA; Classification
1. Introduction. Today it is challenging to improve the system of education and decision making using dataanalysis. As the complexity of educational entities increases, the decision-making process of managementbecomes more difficult. These days, in order to improve decision making for better planning and management,educational institutes are looking for the latest technologies. In this regard, data mining techniques are the mostpopular techniques, which are used to get meaningful patterns from huge datasets.
Data mining that is also called knowledge discovery in databases (KDD) plays a vital role indiscovering unknown traits from a large set of data [1]. Its advantages have landed its application in numerousfields including e-commerce, bioinformatics and lately, within the educational research [2]. Educational DataMining (EDM) is an emerging discipline concerned with developing new methods for exploring the uniquetypes of data that come from the educational setting, and using those methods to better understand students, andthe settings, which they learn in. EDM often stresses on the improvement of student models that denote thestudent’s current knowledge, motivation, cognition, and attitudes [3].
Data mining methodology is helpful in analysis and visualization of students’ academic data andstudents’ employment as well as looking to improve their performance, clustering/grouping them, organizationof their enrollment, target job profiles and suggesting appropriate courses [4]. Main drive to use EDM is toexamine the educational data to resolve the current educational research matters. Usually there are five
30
VFAST Transactions on Software Engineeringhttp://vfast.org/journals/index.php/VTSE@ 2018 ISSN(e): 2309-3978;ISSN(p): 2411-6246Volume 6, Number 1, January-December, 2018 pp. 30-41
categories of stake holders (learners, teachers, course developers, administrators and institutes) of EDM. Withthe help of analysis and results, EDM can guide learners to choose further courses after studying a basic levelof education. It also helps teachers in predicting their learner’s performance, behavior and improvement inpedagogical skills. With the help of EDM course developers can decide the courses, curricula, area to launch anew course, etc. [5].
By the help of this research, we have elaborated a study on various EDM techniques and how theycould be beneficial for all the stakeholders in the educational system. Classification (naïve Bayesian) techniquehas been used to predict status for number of pass outs. The knowledge we learned can assist the educationalinstitutes to overcome the problem of low employment and poor performance hence accordingly actions to betaken to improve the overall academic performance.
2. Literature Review. Different computational techniques in data mining are used to analyze educational dataand the aim is to study useful questions. There are many researchers who have worked on EDM and itsapplications in improving educational process.
A. Empirical study of data mining techniques in education system [8] used to extract useful informationfrom huge data sets, also provided analytical tool for viewing information to use for decision makingprocess.
B. Clustering Algorithms Applied in Educational Data Mining [9] recommend the investigators with themethodology of how huge amounts of educational data of the institutes can predicted for the strategicpurposes exploiting Data Mining Techniques. Meanwhile it shortens the design of system whichdeveloped from data; using data mining approaches i.e. clustering, classification, and predictionalgorithms.
C. Educational Data Mining: a Case Study [10] discussed how Data Mining algorithms can pickpedagogically important sources contained in the data stores obtained from the educational system.
D. A Comprehensive Study of Educational Data Mining [11] provides stakeholders a better understandingof learners and environmental settings which will ultimately helped to learn and develop models for theimprovement of education environment.
E. An Approach of Improving Student’s Academic Performance by using K-means clustering algorithm andDecision tree[12] uses a model which is based on hybrid procedure of Decision Tree method and DataClustering (especially the K-Means) This will help teachers/educators to predict student’s GPA so thatteacher can take suitable changes to enhance student curriculum performance.
F. An Educational Data Mining Model for Predicting Student Performance in Programming Course [13]
Student performance in specific courses (programming) proposed an educational data mining model. Thereare three phases in proposed solution; data pre-processing, attribute selection and rule extraction algorithm.The students' data includes 10 predictive attributes and one target attribute. The predictive attributes areStudentID, High school mathematics grade, mathematical background, problem solving, programmingaptitude, prior experience, previous computer programming experience, gender, locality, and e learning usage.The target attribute is the Grade (student performance in programming course).
31
G. A Decision Support System for Predicting Student Performance[15] uses Naive Bayes algorithm (NB)approach. The applicant data gathered from the University of Tuzla, the Faculty of Economics, academicyear 2010-2011, among first year students and the data taken during the enrolment
H. Using Programming Process Data to Detect Differences in Students' Patterns of Programming’ [19]EDM also helps us to predict students’ programming ability w.r.t. particular assignment. The method,based on tracing PSM programming sequences, can be used as a basis for dynamically tailoring learninginterventions that better serve students as they learn to program. Their model also helped them to identifydifferences between students as well.
I. A Systematic Review of Educational Data Mining [21] provides a complete detailed review from1983-2016 on evolution of EDM specifically involving clustring algorthims and its applicability andresuability in terms of EDM.
J. Plagiarism in Take-home Exams: Help-seeking, Collaboration, and Systematic Cheating [20]. We canalso find plagiarism in educational data using EDM practices. During the interview process with studentswho were suspected of plagiarism, three behavior types stood out: (1) help-seeking, (2) collaboration and(3) systematic cheating
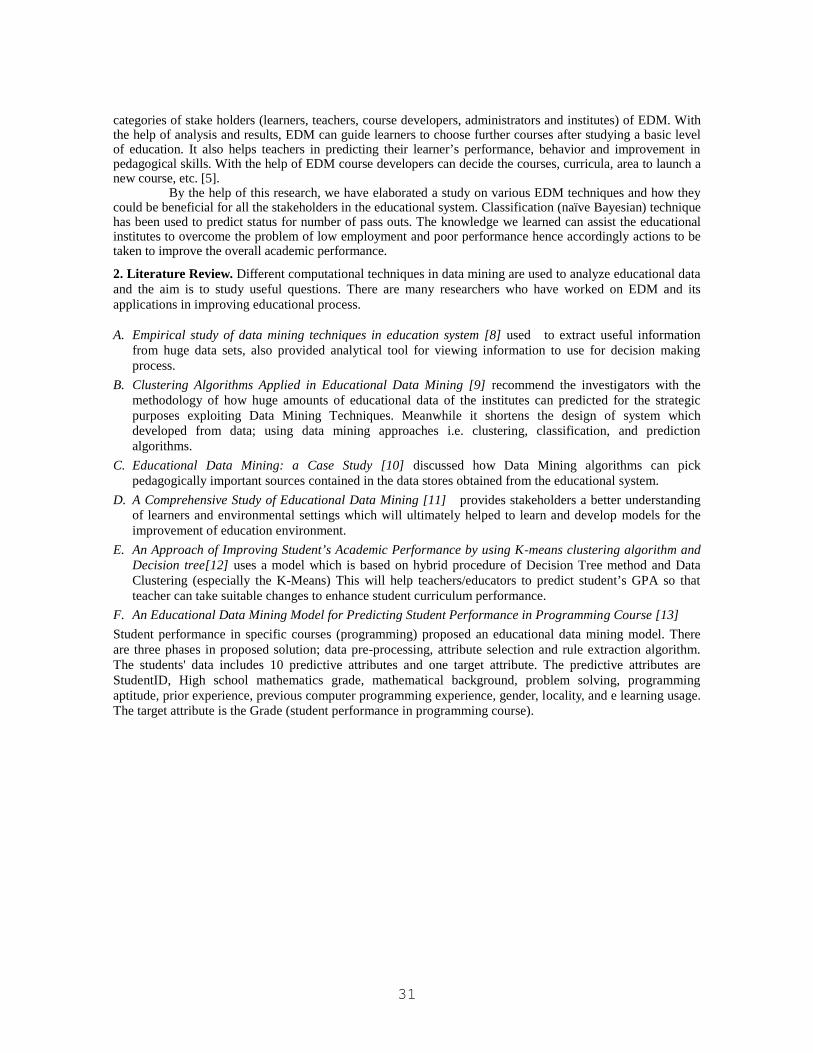
K. Predicting Students Academic Performance Using Education Data Mining [16] uses association rulemining for predicting students’ performance in final exam on the basics of their performance inassignments, unit tests, graduation percentage and attendance. The following work methodology is used:
Figure 1:- Association rule mining [16]
After doing literature review, it is conculded that education data mining is an emerging and widescaleddomain which has its implications both at acedemia and industry. Researchers have applied different EDMalgorthims to get useful results like clustring and classification. Our main focus in this study is onclassification algorithms applied on TEVTA dataset.
3. Technical Education and Vocational Training Background.
A. Importance of Technical Education & Vocational Training
Technical Education & Vocational Training provides necessary competencies in order to increase theproductivity of individuals and prosperity of employers which is badly required in a democratic society.Training acquisition plays a dynamic role to improve our economic growth which can result in providingopportunity of earning to under privileged groups in a state [6].
B. Technical Education & Vocational Training Authority (TEVTA), Punjab
The main motif of TEVTA Punjab is to heighten worldwide educational competitiveness in Punjab, byproducing a productive workforce based on demand driven, standardized, technical education and vocationaltraining service.After matriculation students are awarded by TEVTA (3) years of education and vocational training courses aswell as six months duration vocational certificate programs. These diploma and certificates are offered inalmost all technologies for both girls and boys.
32

4. Methodology. The methodology we use in our research is first we have extracted raw data fromTEVTA website1 by selecting all criteria. First, we perform preprocessing in which different attributesincluding zones, districts, institutes, trades, unit-duration, exam-body, gender, domicile-district andstatus have been assigned numerical codes according to their frequencies (occurrences) hence reducingspace complexity. We have also truncated long and useless strings attached with some data attributeshence cleaning data for further processing. Afterwards, we computed basic data statistics and analyticsfrom this data set including finding top ten and bottom ten records from different dimensions andattribute perspectives. Then we split our data in training and test set 66% to 34% in ratio and usedclassification techniques like Naïve Bayes, J48, Bayes net, lazy IBK. After applying classificationtechniques, we compare them in terms of accuracy. For the obtained results, we provide suggestionswhich can be helpful for the stakeholders in decision-making process, e.g., in predicting launch ofTEVTA courses in different districts, their success evaluation, etc.
A) Data Analytics
Basic data set statistics are shown in Table 1.Table 1. Data set Information
Data Characteristics Multivariate
No of Instances 306744
Attribute Characteristics Mixed
No of Attributes 23
Data Duration 2009-2016
Missing Values Yes
Conditions used to extract data from TEVTA website are shown in Table 2.
Table 2. DATA ExtractionYear of Passing Selected all (2009-2016)Districts Selected all (36 districts of Punjab)Institutes Selected allTrade Duration Selected all
categories(1,2,3,4,6,9,12,18,24,36,48)Institutes Types Selected allInstitute Gender Selected both (M/F)Traceability Status Selected all (Employed, Self
Employed, Un Employed, HigherStudies, Not Interested in Job,Untraceable)
Duration Units Month/WeekTrades Selected all
Important attribute details are explained in Table 3.
Table 3. Attribute DetailSr.# Attribute Name Type Detail1 Zone Categorical 3 zones (North, Center & South zone)
2 Districts Categorical 36 districts3 Gender Categorical 2 genders (male, Female)4 Marks Obtained Mixed5 Status Categorical (Self Employed, Employed, Unemployed,
Higher Studies, Untraceable, NotInterested in Job
1http://tdcc.tevta.gop.pk/Rpt_InstYearTracWise_GradDetail_P.aspx
33
Useful statistics (e.g., top and bottom values) and other details of individual attributes are presented next.
1) Zone AttributeThere are three zones in Punjab, i.e. North, Center and South. All 36 districts come under these three zones.Number of students in different zones are shown in Table 4.
Table 4. No. of students (zone wise)
Sr.# ZoneNo ofStudents
%
1 North Zone 115035 33.052 Center Zone 101388 37.503 South Zone 90321 29.44
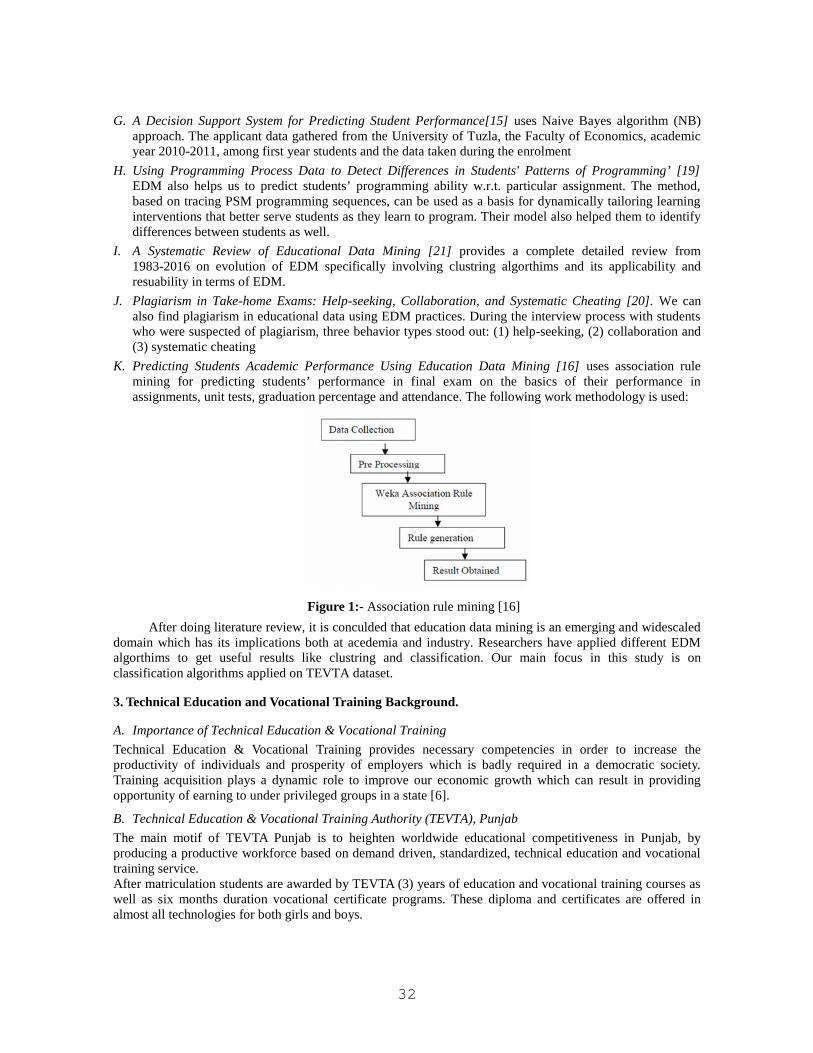
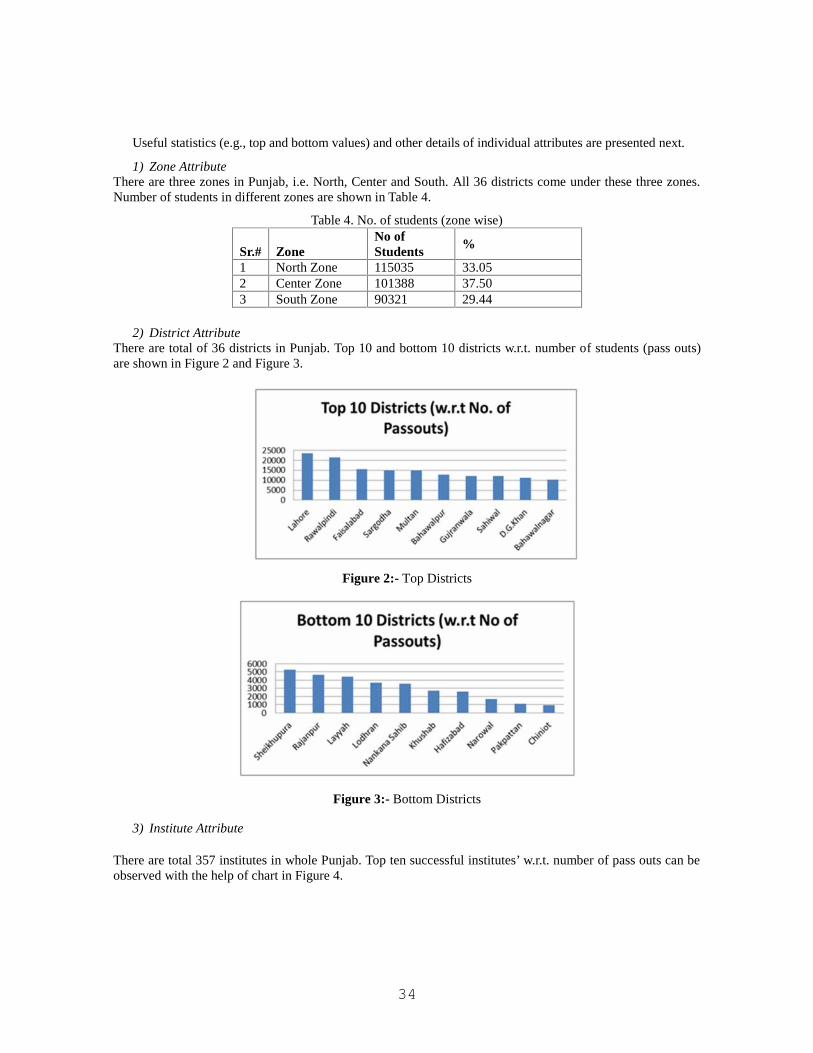
2) District AttributeThere are total of 36 districts in Punjab. Top 10 and bottom 10 districts w.r.t. number of students (pass outs)are shown in Figure 2 and Figure 3.
Figure 2:- Top Districts
Figure 3:- Bottom Districts
3) Institute Attribute
There are total 357 institutes in whole Punjab. Top ten successful institutes’ w.r.t. number of pass outs can beobserved with the help of chart in Figure 4.
34

Figure 4:- Top Institutes
Similarly, we can observe the bottom institutes having less number of pass outs from 2009-2016 data set, inFigure 5.
Figure 5:- Bottom Institutes
4) Year of Passing AttributeAs this data set is from 2009 to 2016, the chart in Figure 6 clearly depicts that 2015 was most successful yearwith respect to no of pass out students. The potential reason identified was special interest and stress ofTEVTA’s administration in data collection and course management.
Figure 6:- Year of passing5) Gender Attribute
Results from dataset are clearly indicating that females are choosing such courses, which help them to work athome, e.g., dress making, etc., while male students are choosing technical courses like certificate in computerapplication, civil DAE, mechanical DAE, electrical DAE, etc., (Figure 7 and Figure 8).
35
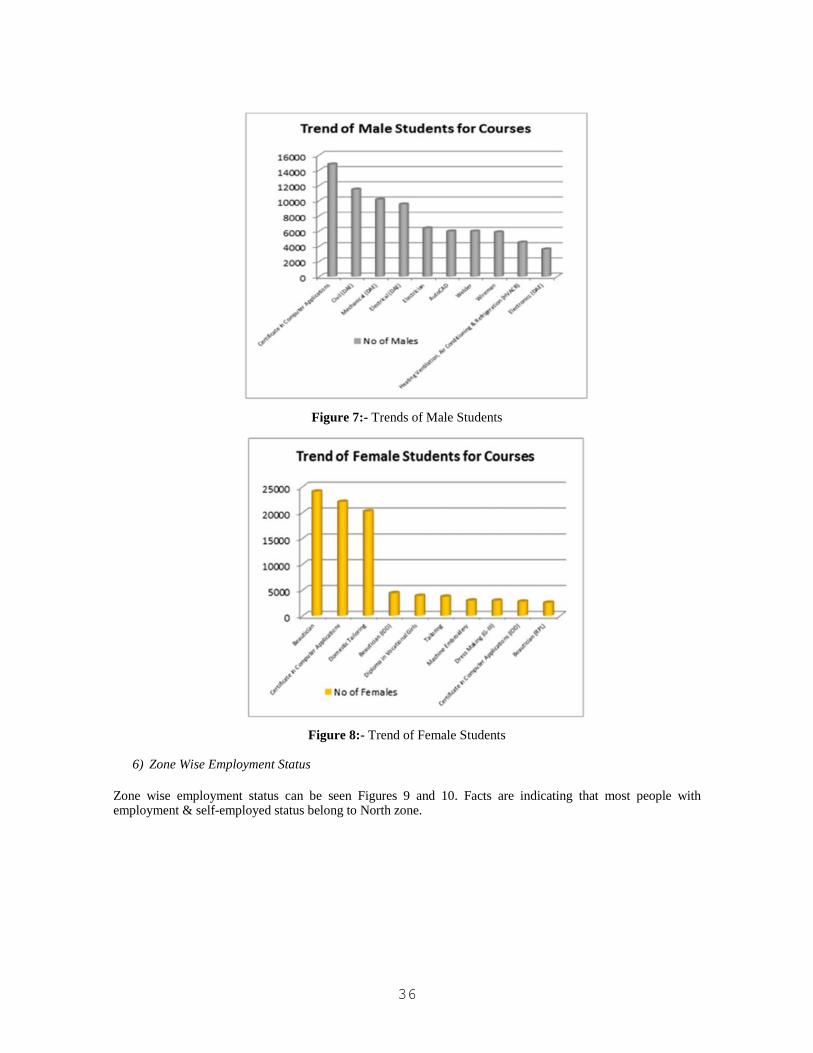
Figure 7:- Trends of Male Students
Figure 8:- Trend of Female Students
6) Zone Wise Employment Status
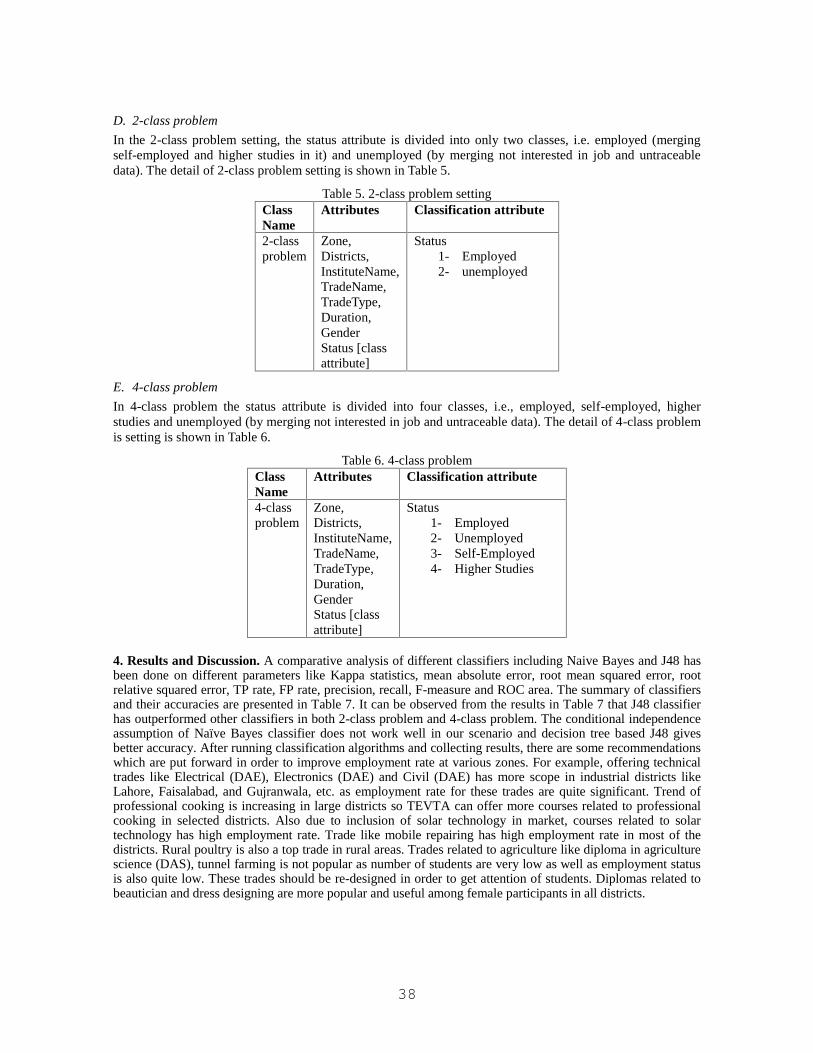
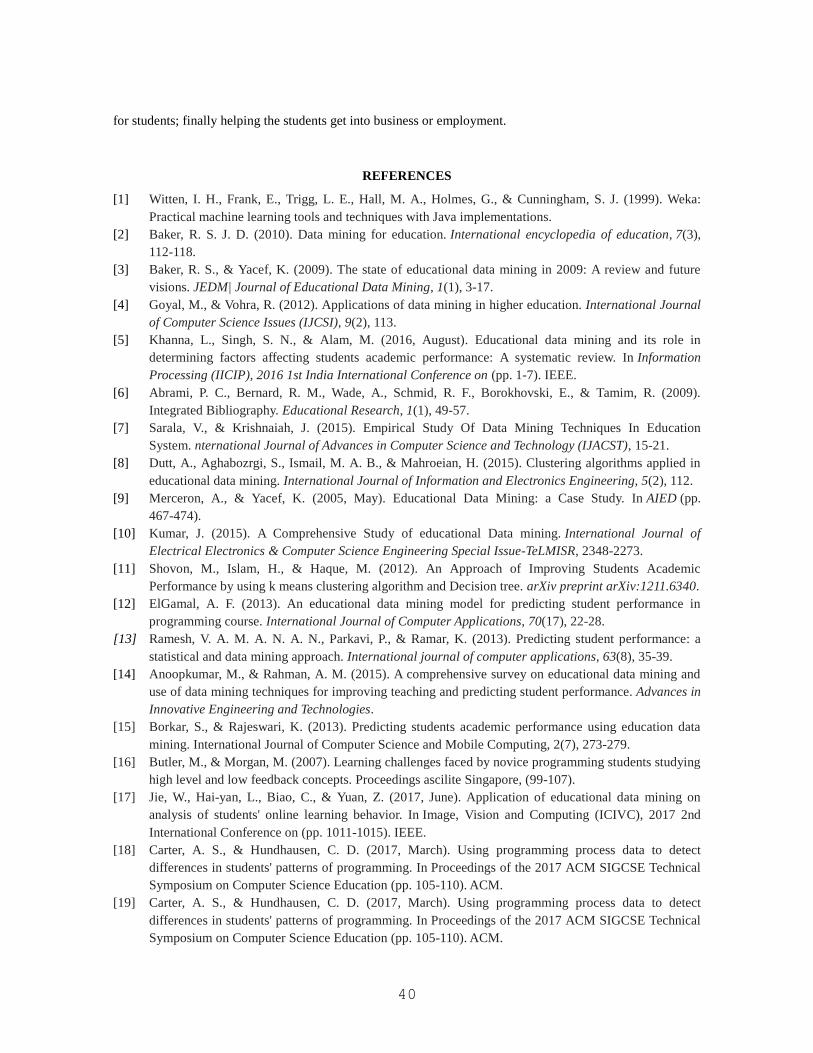
Zone wise employment status can be seen Figures 9 and 10. Facts are indicating that most people withemployment & self-employed status belong to North zone.
36
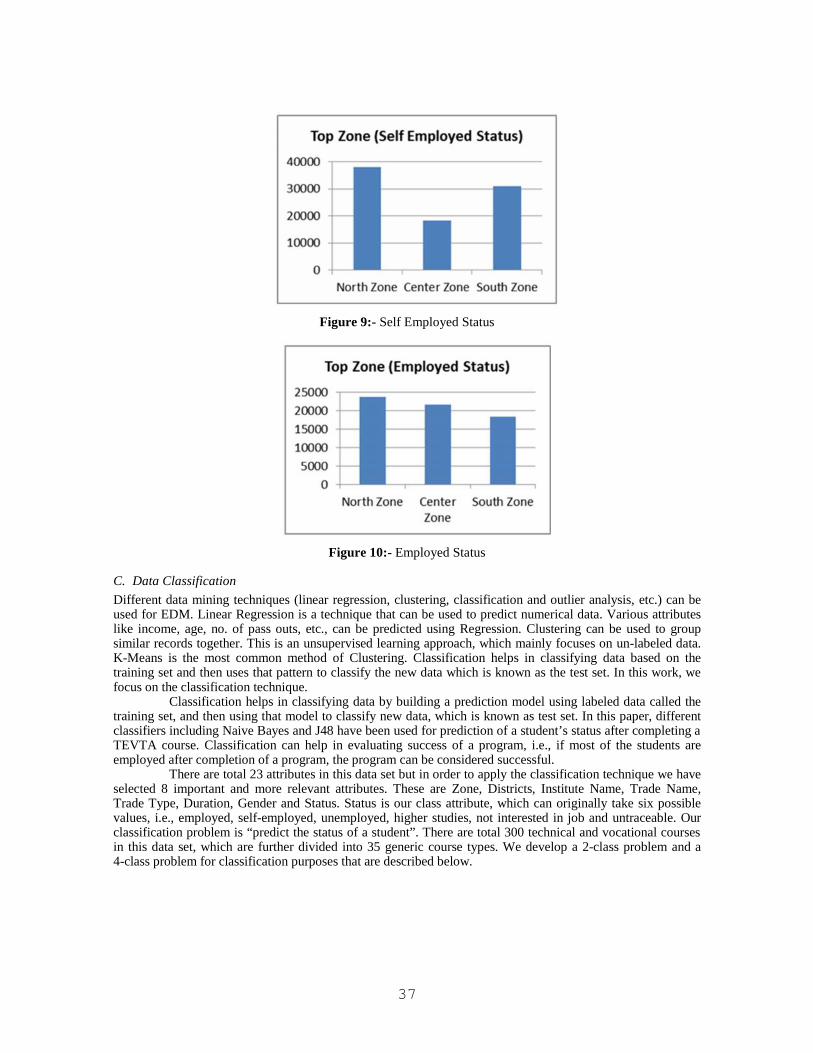
Figure 9:- Self Employed Status
Figure 10:- Employed Status
C. Data Classification
Different data mining techniques (linear regression, clustering, classification and outlier analysis, etc.) can beused for EDM. Linear Regression is a technique that can be used to predict numerical data. Various attributeslike income, age, no. of pass outs, etc., can be predicted using Regression. Clustering can be used to groupsimilar records together. This is an unsupervised learning approach, which mainly focuses on un-labeled data.K-Means is the most common method of Clustering. Classification helps in classifying data based on thetraining set and then uses that pattern to classify the new data which is known as the test set. In this work, wefocus on the classification technique.
Classification helps in classifying data by building a prediction model using labeled data called thetraining set, and then using that model to classify new data, which is known as test set. In this paper, differentclassifiers including Naive Bayes and J48 have been used for prediction of a student’s status after completing aTEVTA course. Classification can help in evaluating success of a program, i.e., if most of the students areemployed after completion of a program, the program can be considered successful.
There are total 23 attributes in this data set but in order to apply the classification technique we haveselected 8 important and more relevant attributes. These are Zone, Districts, Institute Name, Trade Name,Trade Type, Duration, Gender and Status. Status is our class attribute, which can originally take six possiblevalues, i.e., employed, self-employed, unemployed, higher studies, not interested in job and untraceable. Ourclassification problem is “predict the status of a student”. There are total 300 technical and vocational coursesin this data set, which are further divided into 35 generic course types. We develop a 2-class problem and a4-class problem for classification purposes that are described below.
37
D. 2-class problem
In the 2-class problem setting, the status attribute is divided into only two classes, i.e. employed (mergingself-employed and higher studies in it) and unemployed (by merging not interested in job and untraceabledata). The detail of 2-class problem setting is shown in Table 5.
Table 5. 2-class problem settingClassName
Attributes Classification attribute
2-classproblem
Zone,Districts,InstituteName,TradeName,TradeType,Duration,GenderStatus [classattribute]
Status1- Employed2- unemployed
E. 4-class problem
In 4-class problem the status attribute is divided into four classes, i.e., employed, self-employed, higherstudies and unemployed (by merging not interested in job and untraceable data). The detail of 4-class problemis setting is shown in Table 6.
Table 6. 4-class problemClassName
Attributes Classification attribute
4-classproblem
Zone,Districts,InstituteName,TradeName,TradeType,Duration,GenderStatus [classattribute]
Status1- Employed2- Unemployed3- Self-Employed4- Higher Studies
4. Results and Discussion. A comparative analysis of different classifiers including Naive Bayes and J48 hasbeen done on different parameters like Kappa statistics, mean absolute error, root mean squared error, rootrelative squared error, TP rate, FP rate, precision, recall, F-measure and ROC area. The summary of classifiersand their accuracies are presented in Table 7. It can be observed from the results in Table 7 that J48 classifierhas outperformed other classifiers in both 2-class problem and 4-class problem. The conditional independenceassumption of Naïve Bayes classifier does not work well in our scenario and decision tree based J48 givesbetter accuracy. After running classification algorithms and collecting results, there are some recommendationswhich are put forward in order to improve employment rate at various zones. For example, offering technicaltrades like Electrical (DAE), Electronics (DAE) and Civil (DAE) has more scope in industrial districts likeLahore, Faisalabad, and Gujranwala, etc. as employment rate for these trades are quite significant. Trend ofprofessional cooking is increasing in large districts so TEVTA can offer more courses related to professionalcooking in selected districts. Also due to inclusion of solar technology in market, courses related to solartechnology has high employment rate. Trade like mobile repairing has high employment rate in most of thedistricts. Rural poultry is also a top trade in rural areas. Trades related to agriculture like diploma in agriculturescience (DAS), tunnel farming is not popular as number of students are very low as well as employment statusis also quite low. These trades should be re-designed in order to get attention of students. Diplomas related tobeautician and dress designing are more popular and useful among female participants in all districts.
38

Table 7. The summary of classifiers and their accuracies
Conclusion. Efficiency of individuals and progress of employers both are dependent on Technical Education& Vocational Training. The two terms like technical and vocational are very difficult to be defined even by thelinguists. As a matter of fact, both are meant to remove unemployment and joblessness. These days quality isthe most concerned area of Technical Education. There are many parameters, which are affecting quality ofeducation like students’ parameters/characteristics, students’ employment rate, market oriented courses anddiverse teaching skills, etc. Educational institutes are doing their best to support decision-making processesand people, and to formulate healthier management plans. These results are achieved by utilizing valuableunseen knowledge, which is hidden in the huge educational data. Determining the relevant parameters whichmay affect the Performance of Students and teaching learning process in Education is the leading researcharea in the arena of data mining. Significant information can be driven from huge data set using miningtechniques.
In this work, we have tried to explore and analyze a so far less attended area of technical educationand vocational trainings in Pakistan. Interesting analytics based on gender, districts, institutes, etc., arepresented. In addition, classification problems are formulated to predict status of students after completing aTEVTA course. These findings can be very useful for all TEVTA stakeholders including students, instructors,institutes and administrators.Future Work. Current work is a step forward towards more effective and successful technical education andvocational trainings in Pakistan, based on quantitative analysis. Future Research will focus on gathering moredata including the enrollment and dropouts. Outlier Analysis can be performed to find whichinstitutes/districts are producing more number of pass outs and which institutes/districts are having highemployment rate. It can also help in finding which institutes or districts are having lowest un-employment rateso that we can change the strategies at those institutes/districts to increase employment rate. This can help toexplore more areas to improve the teaching-learning process thus enhancing the quality of technical andvocational education. Besides exploring more classifiers, other EDM techniques can be applied in future, likeclustering and association rule mining; to know what changes need to be made, which course should beoffered to whom and in which area, identify the reasons of dropouts and to make learning a better experience
Problemdata class
Classifier Accuracy Test Option
2-C
lass
Pro
blem
Naive Bayes Classifier 72.2934 % Percentage split (66%)
Naive Bayes Classifier 72.3248 % Cross-validation (folds 10)
J48 pruned tree 79.7877 % Percentage split (66%)
J48 pruned tree 80.0325 % Cross-validation (folds 10)BayesNet 72.3951 % Percentage split (66%)BayesNet 72.5559 % Cross-validation (folds 10)lazy.IBk 79.8615 % Percentage split (66%)AttributeSelectedClassifier 75.8843 % Percentage split (66%)
meta.Stacking 68.8445 % Percentage split (66%)rules.ZeroR 68.8445 % Percentage split (66%)
4-C
lass
Pro
blem
Naive Bayes Classifier 52.691 % Percentage split (66%)Naive Bayes Classifier 52.7287 % Cross-validation (folds 10)J48 pruned tree 60.4604 % Percentage split (66%)J48 pruned tree 60.6734 % Cross-validation (folds 10)
BayesNet 52.829 % Percentage split (66%)BayesNet 52.788 % Cross-validation (folds 10)lazy.IBk 60.6273 % Percentage split (66%)AttributeSelectedClassifier 60.0175 % Percentage split (66%)
39
for students; finally helping the students get into business or employment.
REFERENCES
[1] Witten, I. H., Frank, E., Trigg, L. E., Hall, M. A., Holmes, G., & Cunningham, S. J. (1999). Weka:Practical machine learning tools and techniques with Java implementations.
[2] Baker, R. S. J. D. (2010). Data mining for education. International encyclopedia of education, 7(3),112-118.
[3] Baker, R. S., & Yacef, K. (2009). The state of educational data mining in 2009: A review and futurevisions. JEDM| Journal of Educational Data Mining, 1(1), 3-17.
[4] Goyal, M., & Vohra, R. (2012). Applications of data mining in higher education. International Journalof Computer Science Issues (IJCSI), 9(2), 113.
[5] Khanna, L., Singh, S. N., & Alam, M. (2016, August). Educational data mining and its role indetermining factors affecting students academic performance: A systematic review. In InformationProcessing (IICIP), 2016 1st India International Conference on (pp. 1-7). IEEE.
[6] Abrami, P. C., Bernard, R. M., Wade, A., Schmid, R. F., Borokhovski, E., & Tamim, R. (2009).Integrated Bibliography. Educational Research, 1(1), 49-57.
[7] Sarala, V., & Krishnaiah, J. (2015). Empirical Study Of Data Mining Techniques In EducationSystem. nternational Journal of Advances in Computer Science and Technology (IJACST), 15-21.
[8] Dutt, A., Aghabozrgi, S., Ismail, M. A. B., & Mahroeian, H. (2015). Clustering algorithms applied ineducational data mining. International Journal of Information and Electronics Engineering, 5(2), 112.
[9] Merceron, A., & Yacef, K. (2005, May). Educational Data Mining: a Case Study. In AIED (pp.467-474).
[10] Kumar, J. (2015). A Comprehensive Study of educational Data mining. International Journal ofElectrical Electronics & Computer Science Engineering Special Issue-TeLMISR, 2348-2273.
[11] Shovon, M., Islam, H., & Haque, M. (2012). An Approach of Improving Students AcademicPerformance by using k means clustering algorithm and Decision tree. arXiv preprint arXiv:1211.6340.
[12] ElGamal, A. F. (2013). An educational data mining model for predicting student performance inprogramming course. International Journal of Computer Applications, 70(17), 22-28.
[13] Ramesh, V. A. M. A. N. A. N., Parkavi, P., & Ramar, K. (2013). Predicting student performance: astatistical and data mining approach. International journal of computer applications, 63(8), 35-39.
[14] Anoopkumar, M., & Rahman, A. M. (2015). A comprehensive survey on educational data mining anduse of data mining techniques for improving teaching and predicting student performance. Advances inInnovative Engineering and Technologies.
[15] Borkar, S., & Rajeswari, K. (2013). Predicting students academic performance using education datamining. International Journal of Computer Science and Mobile Computing, 2(7), 273-279.
[16] Butler, M., & Morgan, M. (2007). Learning challenges faced by novice programming students studyinghigh level and low feedback concepts. Proceedings ascilite Singapore, (99-107).
[17] Jie, W., Hai-yan, L., Biao, C., & Yuan, Z. (2017, June). Application of educational data mining onanalysis of students' online learning behavior. In Image, Vision and Computing (ICIVC), 2017 2ndInternational Conference on (pp. 1011-1015). IEEE.
[18] Carter, A. S., & Hundhausen, C. D. (2017, March). Using programming process data to detectdifferences in students' patterns of programming. In Proceedings of the 2017 ACM SIGCSE TechnicalSymposium on Computer Science Education (pp. 105-110). ACM.
[19] Carter, A. S., & Hundhausen, C. D. (2017, March). Using programming process data to detectdifferences in students' patterns of programming. In Proceedings of the 2017 ACM SIGCSE TechnicalSymposium on Computer Science Education (pp. 105-110). ACM.
40
[20] Dutt, A., Ismail, M. A., & Herawan, T. (2017). A systematic review on educational data mining. IEEEAccess, 5, 15991-16005.
[21] Khan, Y. D., Ahmad, F., & Anwar, M. W. (2012). A neuro-cognitive approach for iris recognition usingback propagation. World Applied Sciences Journal, 16(5), 678-685.
[22] Khan, Y. D., Khan, S. A., Ahmad, F., & Islam, S. (2014). Iris recognition using image moments andk-means algorithm. The Scientific World Journal, 2014. [24] Khan, Y. D., Ahmed, F., & Khan, S. A.(2014). Situation recognition using image moments and recurrent neural networks. Neural Computingand Applications, 24(7-8), 1519-1529.
41