damage reconstruction of 3d frames using genetic algorithms with levenberg–marquardt local search
TRANSCRIPT

ARTICLE IN PRESS
Soil Dynamics and Earthquake Engineering ] (]]]]) ]]]– ]]]
Contents lists available at ScienceDirect
Soil Dynamics and Earthquake Engineering
0267-72
doi:10.1
� Corr
E-m
(Z. Zem
URL
(Z. Zem1 Te
PleasLeve
journal homepage: www.elsevier.com/locate/soildyn
Damage reconstruction of 3D frames using genetic algorithms withLevenberg– Marquardt local search
Seweryn Kokot �, Zbigniew Zembaty 1
Opole University of Technology, Ul. Mikolajczyka 5, 45-271 Opole, Poland
a r t i c l e i n f o
Article history:
Received 4 September 2007
Accepted 2 March 2008
Keywords:
Vibrations
Damage detection
Beams
Frames
Stiffness loss
61/$ - see front matter & 2008 Elsevier Ltd. A
016/j.soildyn.2008.03.001
esponding author. Tel.: +48 508 263173; fax:
ail addresses: [email protected] (S. Kokot),
baty).
: http://www.skokot.po.opole.pl (S. Kokot), ht
baty).
l.: +48 602 183 655; fax: +48 4 543 318.
e cite this article as: Kokot S,nberg–Marquardt local search. Soil D
a b s t r a c t
A damage detection method based on harmonic structural vibrations has been applied to reconstruct
typical damage patterns of reinforced concrete beams and frames vibrating in three dimensions. It has
been shown that comparison of harmonic vibrations of damaged and intact structures makes it possible
to formulate optimization criterion which can be solved effectively for large number of unknowns. The
application of combined genetic algorithms and Levenberg–Marquardt local search enabled to
reconstruct vectors of distinct stiffness distributions containing up to 32 elements with stiffness loss
as low as 5% and with accuracy of 1%. To test the algorithm in more realistic environment of practical
data acquisition, measuring noise with various levels has been added to the analyzed signal. Such a
method of damage detection can be quite effective during post-earthquake assessment of civil
engineering structures or if one wants to control the stiffness loss of a reinforced concrete structure
after it was accidentally overloaded.
& 2008 Elsevier Ltd. All rights reserved.
1. Introduction
The post-earthquake assessment of civil engineering structuresis one of the most important issues of local authorities after amajor earthquake. In addition to conventional visual inspections,special non-destructive damage detection (NDE) methodsemerged in recent years. Among them, the most important arethe damage assessment methods based on observations ofstructural vibrations (see, e.g., review papers by Doebling et al.[1], Sohn et al. [2], Salawu [3], etc.). Most of these methods arebased on detection of characteristic patterns of changes in thenatural frequencies of the structure [3–8], or on observations ofdifferences in the shapes of their natural modes [9–14], staticdeflections [15–18], as well as on accumulated strain energy[19,20].
However, in many cases of the civil engineering structures likemasonry or reinforced concrete (r/c) structures simple forms ofdamages modeled by localized stiffness ‘‘cuts’’ are not appropriateand the actual research trends aim either at their constantmonitoring [21,22] or detection of damages using automaticobservations or similar methods [23]. Particularly important
ll rights reserved.
+48 4 543 318.
tp://www.zet.po.opole.pl
Zembaty Z. Damage reyn Earthquake Eng (2008)
example of unclear damage definition is encountered in case ofreinforced concrete structures which are often cracked duringtheir normal exploitation and such a cracked state is oftenaccepted at the stage of their design. What is more, their elasticproperties differ between the stages of design, erection and evenchange during the whole lifespan of these structures. That is whythe actual damage measures of r/c structures require carefulstudies [24]. The difficulty in the predictions of actual displace-ments of r/c structures under service loads proves such acomplicated behavior of these structures. It is so because twoopposite phenomena influence the overall elastic properties of ther/c structures, namely:
�
con, do
an increase of their stiffness due to constant increase ofconcrete strength with time and
� loss of stiffness due to development of cracks from shrinkage,corrosion, excessive thermal effects and overloads.
This is particularly true for r/c bridges which accumulatevarious forms of damages during their normal exploitations andoften sustain strong overloads from heavy trucks [25] or seismiceffects [26]. When carrying out post-earthquake inspections of r/cstructures [27] or observing their damage during controlledlaboratory experiments [9,10,28,29], it is observed that thedamage is spread on wide parts of beams, with intensitydepending on the actual load distribution during damage. As aconsequence the structural health monitoring of r/c structuresshould rather be aimed at identification of their actual, distributed
struction of 3D frames using genetic algorithms withi:10.1016/j.soildyn.2008.03.001
ARTICLE IN PRESS
S. Kokot, Z. Zembaty / Soil Dynamics and Earthquake Engineering ] (]]]]) ]]]–]]]2
damages than on localizing single damages. Such goal oftenrequires reconstruction of the actual distribution of the stiffnessproperties of the whole structure so it is much more difficult toachieve than the detection of localized damages.
It was probably Gladwell [30], who used for the first time theterm ‘‘reconstruction’’ with respect to identification of dynamicsystems. In his paper from 1986, he presented general overviewon the formulation of respective inverse problem and its solutionfor some simple examples of dynamic systems. Non-uniqueness ofthe solutions of inverse problems makes it impractical to try toreconstruct all possible damage distributions. Instead some morelikely damage scenarios shall be learned based on the laboratorytests [28,29,31,32] or ‘‘in situ’’ observations of damages [25,27].The possibility of the recovery of some more likely damagescenarios by the existing damage detection methods should beparticularly studied if one wants the r/c structures to be includedin the domain of vibration-based structural health monitoring.The stiffness reconstruction methods can also be viewed upon asthe finite element model updating [33] when a well-developedFEM model of the analyzed structure is available.
When it comes to monitoring of structural damages duringseismic vibrations the most challenging method would be toactually perform ‘‘on-line’’ tests during destructive earthquakes toimmediately indicate damage locations what leads, however, todifficult problems of on-line, non-linear FEM update [34]. Analternative approach is to carry out the diagnostic tests after thestructure was overloaded. The structure may be inspected in thesepotential places of damage which can easily be accessed. In case ofinvisible damages or places with difficult access, one may try toapply special non-destructive methods like ultrasonic measure-ments or special, indirect acoustic emission methods [35]. Thepost-earthquake damages can also be examined by using classicmodal analyses [27], advanced Fourier analysis of structuralresponse [36] or one may try to deduce damage by appropriatelyobserving propagation of waves excited in the building by laterminor earthquakes, e.g., aftershocks [37–41]. This requires,however, well-synchronized arrays of many measuring devicesbuild into the structures. Recently, some methods of damagedetection using harmonic vibrations became available [42] or[43]. In such cases, an application of special shakers is requiredwhich complicates damage assessments but there is also anadvantage because unlike for ‘‘on-line’’ monitoring, multipletests of the structure can be carried out using very few oreven one measuring device. In addition, the effectiveness ofdamage identification can be increased during the subse-quent vibration tests by sweeping through the excitationfrequencies to choose the most optimum one or adapting theshaker positions to particular structural configuration and specificdamage distributions.
In present paper, the method of damage detection based onharmonic structural vibrations is examined to test its applicabilityto monitor variations of spatial stiffness distributions of r/cstructures. In particular, the application of genetic algorithms (GA)with Levenberg–Marquardt (Levenberg-Margquardt) localsearch is investigated in detail with respect to its ability foreffective reconstruction of typical damage patterns of r/c beamsand 3D frames.
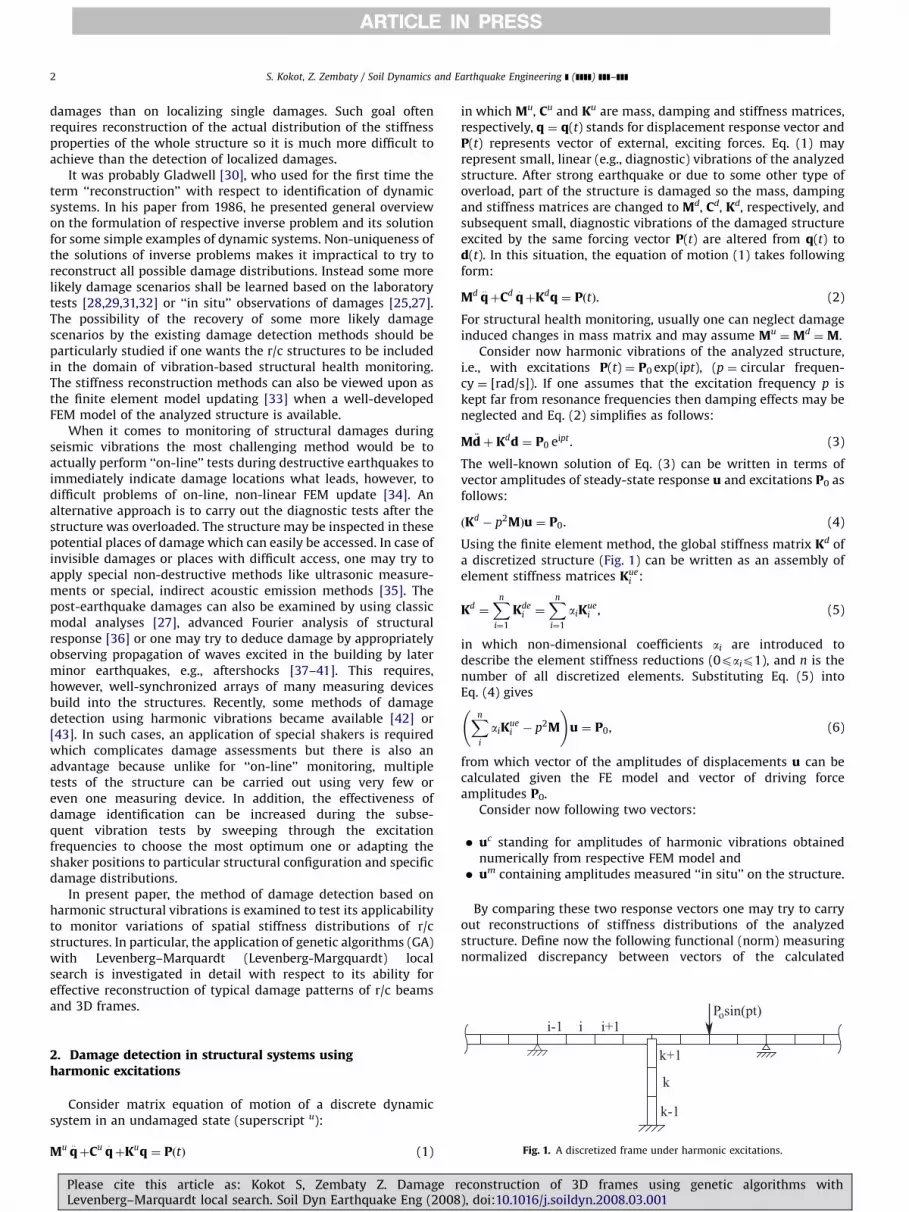
Fig. 1. A discretized frame under harmonic excitations.
2. Damage detection in structural systems usingharmonic excitations
Consider matrix equation of motion of a discrete dynamicsystem in an undamaged state (superscript u):
Mu q::þCu q
:þKuq ¼ PðtÞ (1)
Please cite this article as: Kokot S, Zembaty Z. Damage rLevenberg–Marquardt local search. Soil Dyn Earthquake Eng (2008
in which Mu, Cu and Ku are mass, damping and stiffness matrices,respectively, q ¼ q(t) stands for displacement response vector andP(t) represents vector of external, exciting forces. Eq. (1) mayrepresent small, linear (e.g., diagnostic) vibrations of the analyzedstructure. After strong earthquake or due to some other type ofoverload, part of the structure is damaged so the mass, dampingand stiffness matrices are changed to Md, Cd, Kd, respectively, andsubsequent small, diagnostic vibrations of the damaged structureexcited by the same forcing vector P(t) are altered from q(t) tod(t). In this situation, the equation of motion (1) takes followingform:
Md q::þCd q
:þKdq ¼ PðtÞ. (2)
For structural health monitoring, usually one can neglect damageinduced changes in mass matrix and may assume Mu
¼Md¼M.
Consider now harmonic vibrations of the analyzed structure,i.e., with excitations P(t) ¼ P0 exp(ipt), (p ¼ circular frequen-cy ¼ [rad/s]). If one assumes that the excitation frequency p iskept far from resonance frequencies then damping effects may beneglected and Eq. (2) simplifies as follows:
M €dþ Kdd ¼ P0 eipt . (3)
The well-known solution of Eq. (3) can be written in terms ofvector amplitudes of steady-state response u and excitations P0 asfollows:
ðKd� p2MÞu ¼ P0. (4)
Using the finite element method, the global stiffness matrix Kd ofa discretized structure (Fig. 1) can be written as an assembly ofelement stiffness matrices Kue
i :
Kd¼Xn
i¼1
Kdei ¼
Xn
i¼1
aiKuei , (5)
in which non-dimensional coefficients ai are introduced todescribe the element stiffness reductions (0paip1), and n is thenumber of all discretized elements. Substituting Eq. (5) intoEq. (4) gives
Xn
i
aiKuei � p2M
!u ¼ P0, (6)
from which vector of the amplitudes of displacements u can becalculated given the FE model and vector of driving forceamplitudes P0.
Consider now following two vectors:
�
eco), d
uc standing for amplitudes of harmonic vibrations obtainednumerically from respective FEM model and
� um containing amplitudes measured ‘‘in situ’’ on the structure.By comparing these two response vectors one may try to carryout reconstructions of stiffness distributions of the analyzedstructure. Define now the following functional (norm) measuringnormalized discrepancy between vectors of the calculated
nstruction of 3D frames using genetic algorithms withoi:10.1016/j.soildyn.2008.03.001
ARTICLE IN PRESS
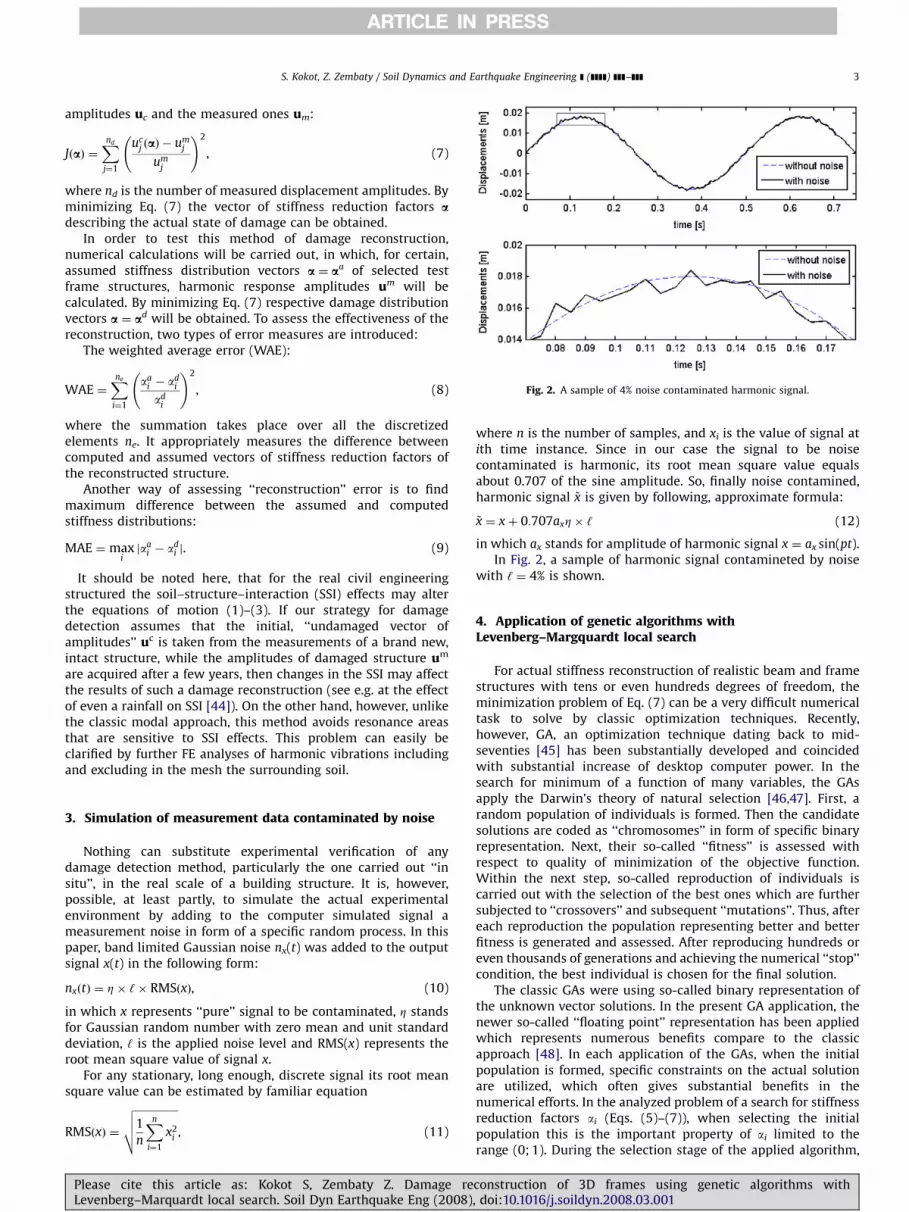
Fig. 2. A sample of 4% noise contaminated harmonic signal.
S. Kokot, Z. Zembaty / Soil Dynamics and Earthquake Engineering ] (]]]]) ]]]–]]] 3
amplitudes uc and the measured ones um:
JðaÞ ¼Xnd
j¼1
ucj ðaÞ � um
j
umj
!2
, (7)
where nd is the number of measured displacement amplitudes. Byminimizing Eq. (7) the vector of stiffness reduction factors adescribing the actual state of damage can be obtained.
In order to test this method of damage reconstruction,numerical calculations will be carried out, in which, for certain,assumed stiffness distribution vectors a ¼ aa of selected testframe structures, harmonic response amplitudes um will becalculated. By minimizing Eq. (7) respective damage distributionvectors a ¼ ad will be obtained. To assess the effectiveness of thereconstruction, two types of error measures are introduced:
The weighted average error (WAE):
WAE ¼Xne
i¼1
aai � ad
i
adi
!2
, (8)
where the summation takes place over all the discretizedelements ne. It appropriately measures the difference betweencomputed and assumed vectors of stiffness reduction factors ofthe reconstructed structure.
Another way of assessing ‘‘reconstruction’’ error is to findmaximum difference between the assumed and computedstiffness distributions:
MAE ¼ maxijaa
i � adi j. (9)
It should be noted here, that for the real civil engineeringstructured the soil–structure–interaction (SSI) effects may alterthe equations of motion (1)–(3). If our strategy for damagedetection assumes that the initial, ‘‘undamaged vector ofamplitudes’’ uc is taken from the measurements of a brand new,intact structure, while the amplitudes of damaged structure um
are acquired after a few years, then changes in the SSI may affectthe results of such a damage reconstruction (see e.g. at the effectof even a rainfall on SSI [44]). On the other hand, however, unlikethe classic modal approach, this method avoids resonance areasthat are sensitive to SSI effects. This problem can easily beclarified by further FE analyses of harmonic vibrations includingand excluding in the mesh the surrounding soil.
3. Simulation of measurement data contaminated by noise
Nothing can substitute experimental verification of anydamage detection method, particularly the one carried out ‘‘insitu’’, in the real scale of a building structure. It is, however,possible, at least partly, to simulate the actual experimentalenvironment by adding to the computer simulated signal ameasurement noise in form of a specific random process. In thispaper, band limited Gaussian noise nx(t) was added to the outputsignal x(t) in the following form:
nxðtÞ ¼ Z� ‘ � RMSðxÞ, (10)
in which x represents ‘‘pure’’ signal to be contaminated, Z standsfor Gaussian random number with zero mean and unit standarddeviation, ‘ is the applied noise level and RMS(x) represents theroot mean square value of signal x.
For any stationary, long enough, discrete signal its root meansquare value can be estimated by familiar equation
RMSðxÞ ¼
ffiffiffiffiffiffiffiffiffiffiffiffiffiffiffiffi1
n
Xn
i¼1
x2i
vuut , (11)
Please cite this article as: Kokot S, Zembaty Z. Damage reLevenberg–Marquardt local search. Soil Dyn Earthquake Eng (2008)
where n is the number of samples, and xi is the value of signal atith time instance. Since in our case the signal to be noisecontaminated is harmonic, its root mean square value equalsabout 0.707 of the sine amplitude. So, finally noise contamined,harmonic signal ~x is given by following, approximate formula:
~x ¼ xþ 0:707axZ� ‘ (12)
in which ax stands for amplitude of harmonic signal x ¼ ax sin(pt).In Fig. 2, a sample of harmonic signal contamineted by noise
with ‘ ¼ 4% is shown.
4. Application of genetic algorithms withLevenberg–Margquardt local search
For actual stiffness reconstruction of realistic beam and framestructures with tens or even hundreds degrees of freedom, theminimization problem of Eq. (7) can be a very difficult numericaltask to solve by classic optimization techniques. Recently,however, GA, an optimization technique dating back to mid-seventies [45] has been substantially developed and coincidedwith substantial increase of desktop computer power. In thesearch for minimum of a function of many variables, the GAsapply the Darwin’s theory of natural selection [46,47]. First, arandom population of individuals is formed. Then the candidatesolutions are coded as ‘‘chromosomes’’ in form of specific binaryrepresentation. Next, their so-called ‘‘fitness’’ is assessed withrespect to quality of minimization of the objective function.Within the next step, so-called reproduction of individuals iscarried out with the selection of the best ones which are furthersubjected to ‘‘crossovers’’ and subsequent ‘‘mutations’’. Thus, aftereach reproduction the population representing better and betterfitness is generated and assessed. After reproducing hundreds oreven thousands of generations and achieving the numerical ‘‘stop’’condition, the best individual is chosen for the final solution.
The classic GAs were using so-called binary representation ofthe unknown vector solutions. In the present GA application, thenewer so-called ‘‘floating point’’ representation has been appliedwhich represents numerous benefits compare to the classicapproach [48]. In each application of the GAs, when the initialpopulation is formed, specific constraints on the actual solutionare utilized, which often gives substantial benefits in thenumerical efforts. In the analyzed problem of a search for stiffnessreduction factors ai (Eqs. (5)–(7)), when selecting the initialpopulation this is the important property of ai limited to therange (0; 1). During the selection stage of the applied algorithm,
construction of 3D frames using genetic algorithms with, doi:10.1016/j.soildyn.2008.03.001
ARTICLE IN PRESS
S. Kokot, Z. Zembaty / Soil Dynamics and Earthquake Engineering ] (]]]]) ]]]–]]]4
the so-called Stochastic Universal Sampling Technique [49] wasapplied. It is an extension of classic Roulette wheel selectionmethod. The main idea of SUS is that more than one indicator onthe Roulette wheel is used. Such approach improved thenumerical calculations by providing more diversity in thepopulation and prevented premature convergence.
As far as crossover of parent individuals is concerned, in ourcase, an appropriate recombination method should be appliedfor floating point representation of individuals. The best recombi-nation operations turned out to be the intermediate recombina-tion and the linear recombination [50]. In terms of hypergeometry, the intermediate recombination leads to createnew ‘‘offspring’’ within a slightly larger hypercube than thehypercube created by the ‘‘parents’’. Second method of recombi-nation was, in our case, linear recombination. In this method, aline crossing two parent points is drawn and the new offspring,randomly chosen on this line is created. In our problem of
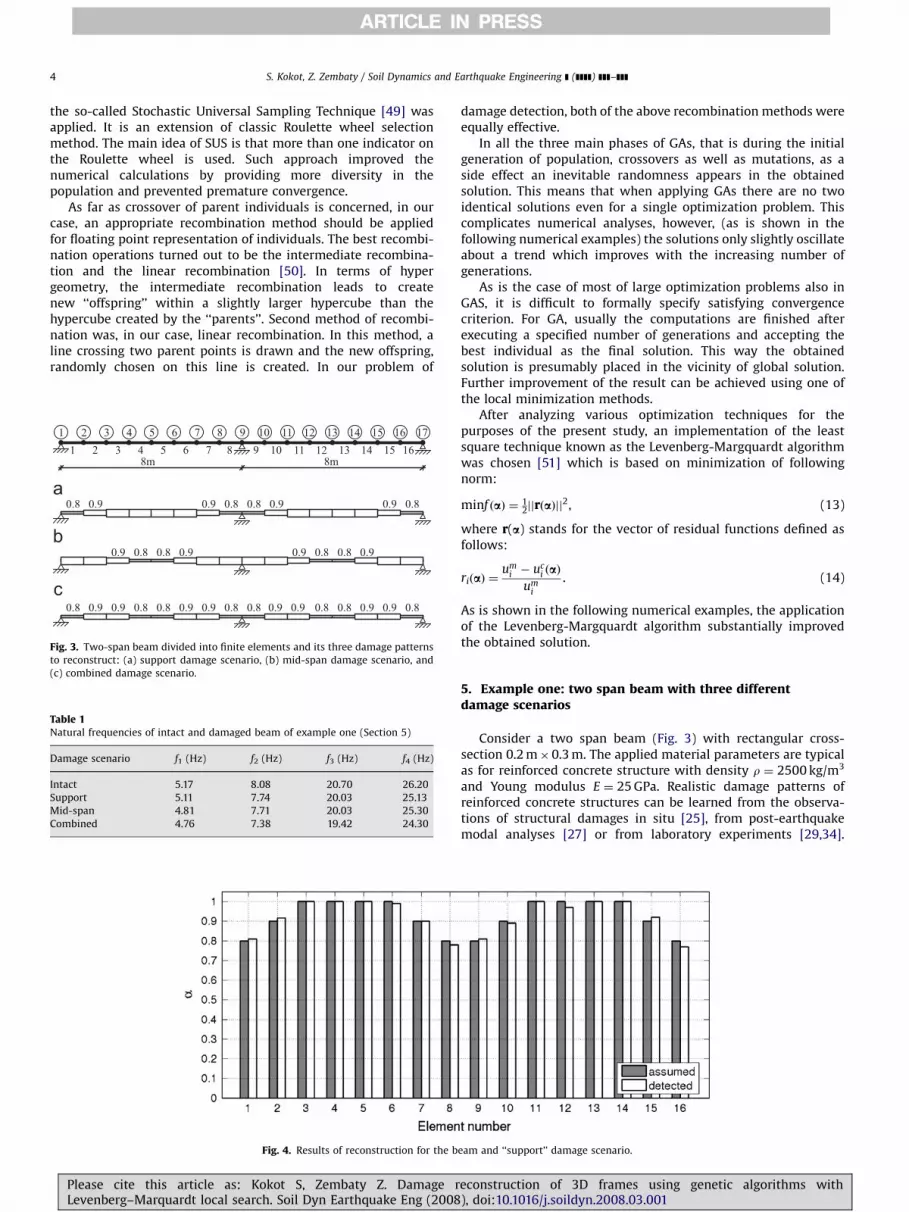
Fig. 3. Two-span beam divided into finite elements and its three damage patterns
to reconstruct: (a) support damage scenario, (b) mid-span damage scenario, and
(c) combined damage scenario.
Table 1Natural frequencies of intact and damaged beam of example one (Section 5)
Damage scenario f1 (Hz) f2 (Hz) f3 (Hz) f4 (Hz)
Intact 5.17 8.08 20.70 26.20
Support 5.11 7.74 20.03 25.13
Mid-span 4.81 7.71 20.03 25.30
Combined 4.76 7.38 19.42 24.30
Fig. 4. Results of reconstruction for the b
Please cite this article as: Kokot S, Zembaty Z. Damage rLevenberg–Marquardt local search. Soil Dyn Earthquake Eng (2008
damage detection, both of the above recombination methods wereequally effective.
In all the three main phases of GAs, that is during the initialgeneration of population, crossovers as well as mutations, as aside effect an inevitable randomness appears in the obtainedsolution. This means that when applying GAs there are no twoidentical solutions even for a single optimization problem. Thiscomplicates numerical analyses, however, (as is shown in thefollowing numerical examples) the solutions only slightly oscillateabout a trend which improves with the increasing number ofgenerations.
As is the case of most of large optimization problems also inGAS, it is difficult to formally specify satisfying convergencecriterion. For GA, usually the computations are finished afterexecuting a specified number of generations and accepting thebest individual as the final solution. This way the obtainedsolution is presumably placed in the vicinity of global solution.Further improvement of the result can be achieved using one ofthe local minimization methods.
After analyzing various optimization techniques for thepurposes of the present study, an implementation of the leastsquare technique known as the Levenberg-Margquardt algorithmwas chosen [51] which is based on minimization of followingnorm:
minf ðaÞ ¼ 12jjrðaÞjj
2, (13)
where r(a) stands for the vector of residual functions defined asfollows:
riðaÞ ¼um
i � uci ðaÞ
umi
. (14)
As is shown in the following numerical examples, the applicationof the Levenberg-Margquardt algorithm substantially improvedthe obtained solution.
5. Example one: two span beam with three differentdamage scenarios
Consider a two span beam (Fig. 3) with rectangular cross-section 0.2 m�0.3 m. The applied material parameters are typicalas for reinforced concrete structure with density r ¼ 2500 kg/m3
and Young modulus E ¼ 25 GPa. Realistic damage patterns ofreinforced concrete structures can be learned from the observa-tions of structural damages in situ [25], from post-earthquakemodal analyses [27] or from laboratory experiments [29,34].
eam and ‘‘support’’ damage scenario.
econstruction of 3D frames using genetic algorithms with), doi:10.1016/j.soildyn.2008.03.001
ARTICLE IN PRESS
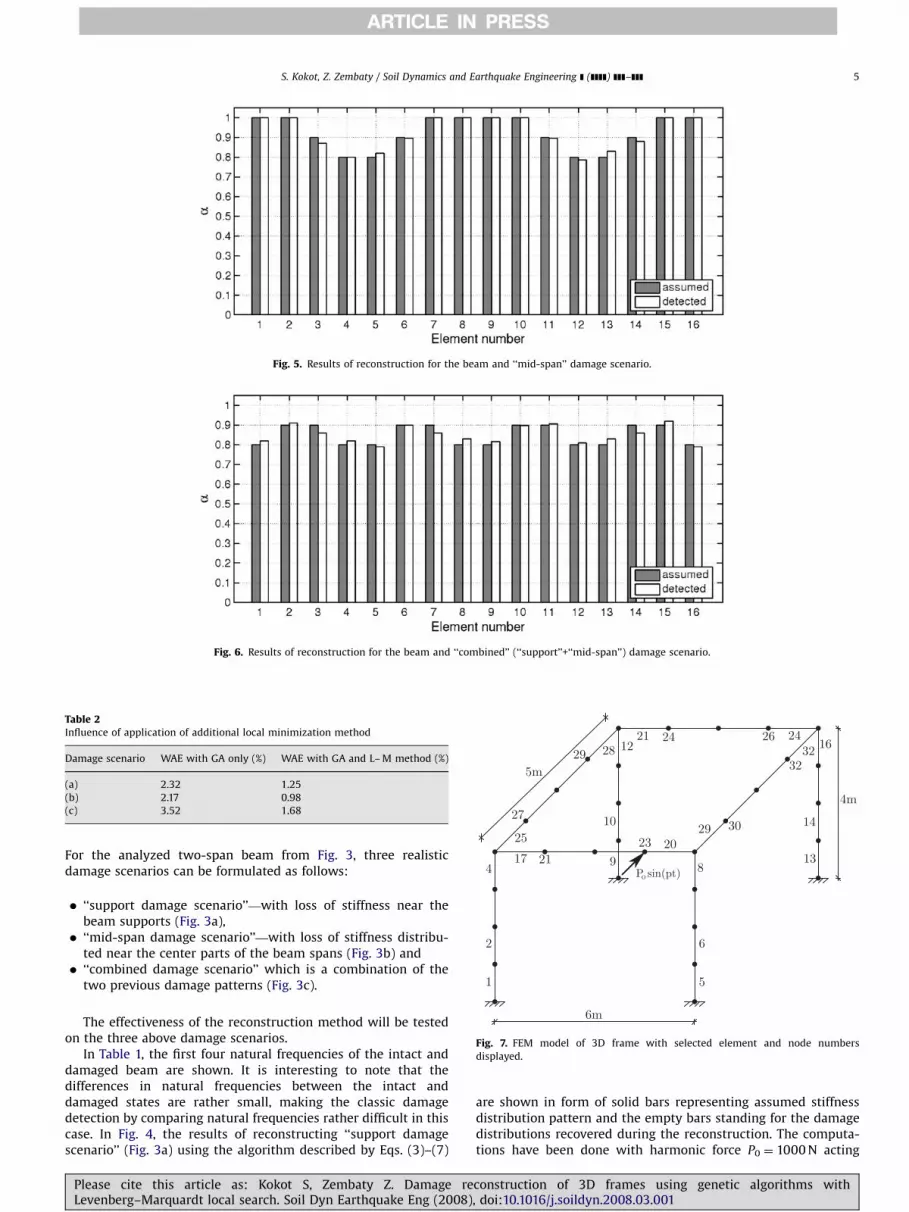
Fig. 5. Results of reconstruction for the beam and ‘‘mid-span’’ damage scenario.
Fig. 6. Results of reconstruction for the beam and ‘‘combined’’ (‘‘support’’+‘‘mid-span’’) damage scenario.
Table 2Influence of application of additional local minimization method
Damage scenario WAE with GA only (%) WAE with GA and L– M method (%)
(a) 2.32 1.25
(b) 2.17 0.98
(c) 3.52 1.68
S. Kokot, Z. Zembaty / Soil Dynamics and Earthquake Engineering ] (]]]]) ]]]–]]] 5
For the analyzed two-span beam from Fig. 3, three realisticdamage scenarios can be formulated as follows:
�
PL
‘‘support damage scenario’’—with loss of stiffness near thebeam supports (Fig. 3a),
� ‘‘mid-span damage scenario’’—with loss of stiffness distribu-ted near the center parts of the beam spans (Fig. 3b) and
�Fig. 7. FEM model of 3D frame with selected element and node numbers
displayed.
‘‘combined damage scenario’’ which is a combination of thetwo previous damage patterns (Fig. 3c).
The effectiveness of the reconstruction method will be testedon the three above damage scenarios.
In Table 1, the first four natural frequencies of the intact anddamaged beam are shown. It is interesting to note that thedifferences in natural frequencies between the intact anddamaged states are rather small, making the classic damagedetection by comparing natural frequencies rather difficult in thiscase. In Fig. 4, the results of reconstructing ‘‘support damagescenario’’ (Fig. 3a) using the algorithm described by Eqs. (3)–(7)
lease cite this article as: Kokot S, Zembaty Z. Damage reevenberg–Marquardt local search. Soil Dyn Earthquake Eng (2008)
are shown in form of solid bars representing assumed stiffnessdistribution pattern and the empty bars standing for the damagedistributions recovered during the reconstruction. The computa-tions have been done with harmonic force P0 ¼ 1000 N acting
construction of 3D frames using genetic algorithms with, doi:10.1016/j.soildyn.2008.03.001

ARTICLE IN PRESS
S. Kokot, Z. Zembaty / Soil Dynamics and Earthquake Engineering ] (]]]]) ]]]–]]]6
perpendicularly in node 7 (Fig. 3) with frequency 3.6 Hz (circularfrequency pE22.6 rad/s). Thus, the excitation frequency is lowerthan the first natural frequency of the beam. It can be seen from
Table 3Natural frequencies of intact 3D frame of example two (Section 6)
Mode no.
1 2 3 4 5 6
Frequency (Hz) 4.866 5.937 9.604 10.186 17.688 18.957
Fig. 8. Damage scenarios of 3D frame: (a) dam
Fig. 9. Results of damage reconstruction of 3D frame for column d
Fig. 10. Results of damage reconstruction of 3D frame for column damage
Please cite this article as: Kokot S, Zembaty Z. Damage rLevenberg–Marquardt local search. Soil Dyn Earthquake Eng (2008
Fig. 4 that the obtained coefficients ai are very close to theassumed ones. The greatest difference given by ME (Eq. (9)) equalsin this case 3%. The overall effectiveness of the reconstruction canbe assessed by calculating the WAE (Eq. (8)). In the analyzed caseof ‘‘support damage scenario’’, when implementing only GAs WAEequaled 2.32%. After adding the Levenberg-Margquardt localsearch, WAE dropped to 1.25%.
In Fig. 5, the results of reconstructing the ‘‘mid-span damagescenario’’ (Fig. 3b) are shown. Again the excitation frequencyequals 3.6 Hz but the excitation force acts in node 5. As in theprevious case, the recovered stiffness drop coefficients ai are veryclose to the assumed ones. The maximum difference between the
age of columns and (b) corner damages.
amage scenario with 10% and 5% stiffness loss at all supports.
scenario with 10% and 5% stiffness loss at all supports (2% noise level).
econstruction of 3D frames using genetic algorithms with), doi:10.1016/j.soildyn.2008.03.001
ARTICLE IN PRESS
S. Kokot, Z. Zembaty / Soil Dynamics and Earthquake Engineering ] (]]]]) ]]]–]]] 7
assumed and computed coefficients (ME) is similar as for thesupport damage scenario and equals 3%. The obtained WAE valueswere as follows: 2.17% (GA only) and 0.98% (combined GA andLevenberg-Margquardt method).
In Fig. 6, the results of reconstruction are shown for the
’’combined damage scenario’’ (Fig. 3c) with excitation harmonic
force acting in node 5 with frequency 3.6 Hz. Clearly, thereconstruction was more difficult in this case and the maximumerror equaled 4% while the value of WAE equaled 3.52% (GA) and1.68% (combined GA with Levenberg-Margquardt method). InTable 2, all the WAE values without and with the Levenberg-
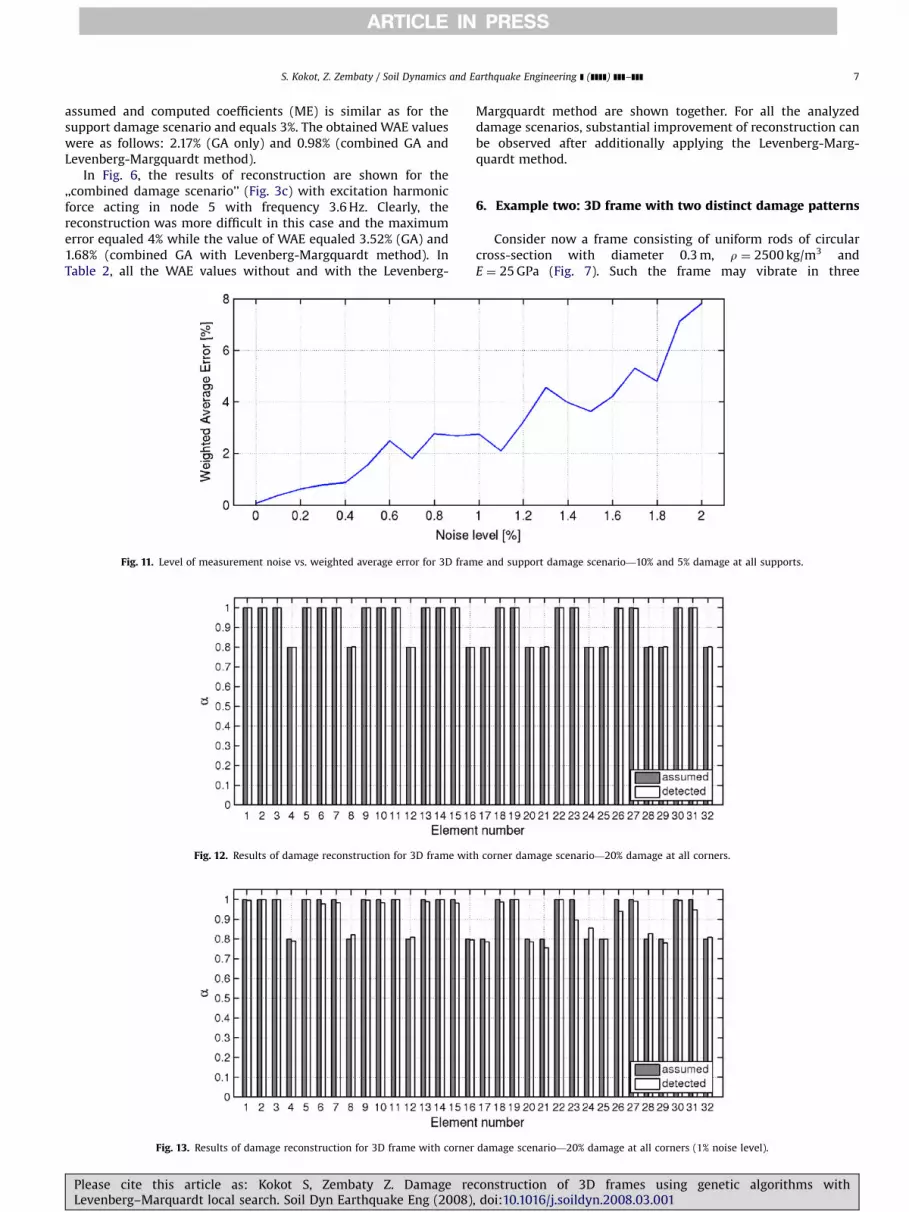
Fig. 11. Level of measurement noise vs. weighted average error for 3D fram
Fig. 12. Results of damage reconstruction for 3D frame wit
Fig. 13. Results of damage reconstruction for 3D frame with corner
Please cite this article as: Kokot S, Zembaty Z. Damage reLevenberg–Marquardt local search. Soil Dyn Earthquake Eng (2008)
Margquardt method are shown together. For all the analyzeddamage scenarios, substantial improvement of reconstruction canbe observed after additionally applying the Levenberg-Marg-quardt method.
6. Example two: 3D frame with two distinct damage patterns
Consider now a frame consisting of uniform rods of circularcross-section with diameter 0.3 m, r ¼ 2500 kg/m3 andE ¼ 25 GPa (Fig. 7). Such the frame may vibrate in three
e and support damage scenario—10% and 5% damage at all supports.
h corner damage scenario—20% damage at all corners.
damage scenario—20% damage at all corners (1% noise level).
construction of 3D frames using genetic algorithms with, doi:10.1016/j.soildyn.2008.03.001
ARTICLE IN PRESS
Fig. 14. Level of measurement noise vs. weighted average error for 3D frame with corner damage scenario—20% damage at all corners.
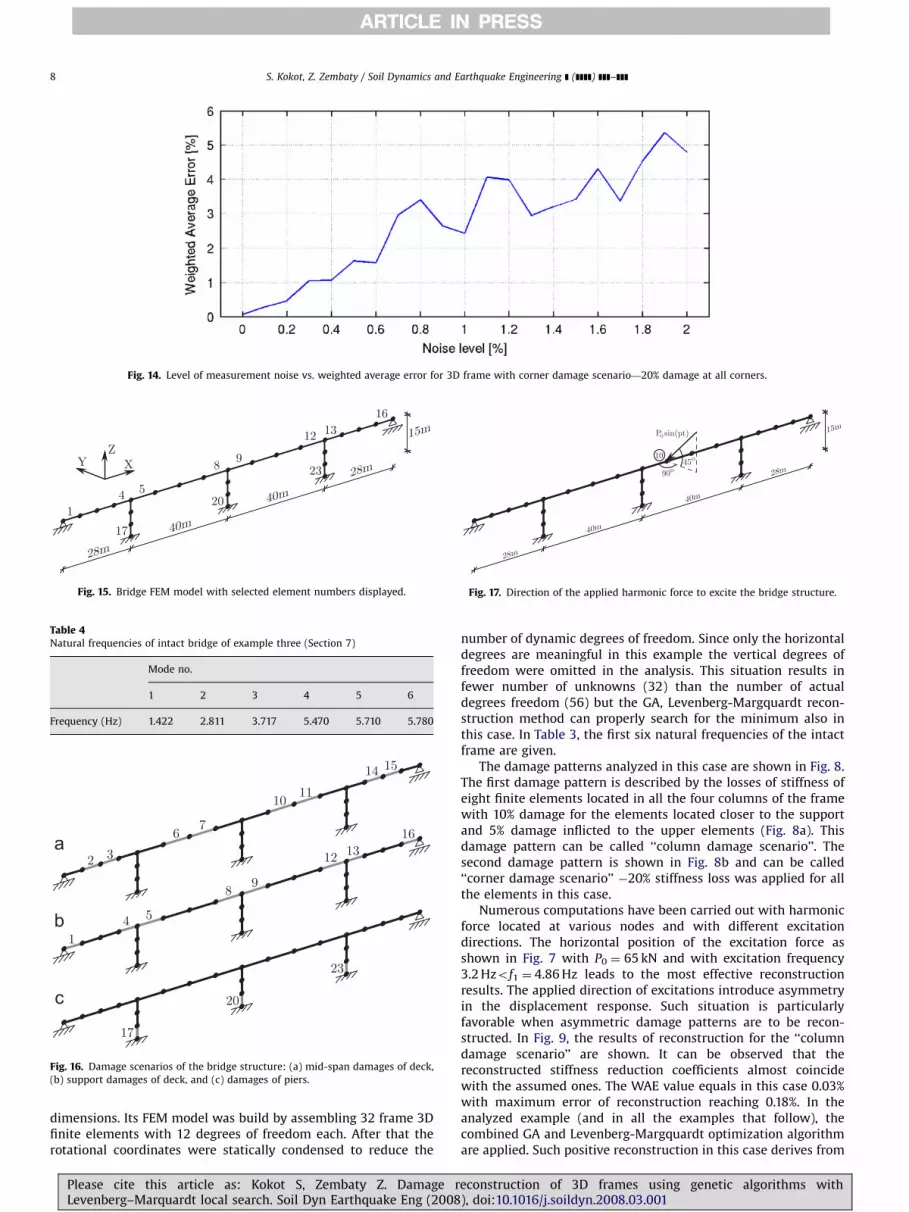
Fig. 15. Bridge FEM model with selected element numbers displayed.
Table 4Natural frequencies of intact bridge of example three (Section 7)
Mode no.
1 2 3 4 5 6
Frequency (Hz) 1.422 2.811 3.717 5.470 5.710 5.780
Fig. 16. Damage scenarios of the bridge structure: (a) mid-span damages of deck,
(b) support damages of deck, and (c) damages of piers.
Fig. 17. Direction of the applied harmonic force to excite the bridge structure.
S. Kokot, Z. Zembaty / Soil Dynamics and Earthquake Engineering ] (]]]]) ]]]–]]]8
dimensions. Its FEM model was build by assembling 32 frame 3Dfinite elements with 12 degrees of freedom each. After that therotational coordinates were statically condensed to reduce the
Please cite this article as: Kokot S, Zembaty Z. Damage rLevenberg–Marquardt local search. Soil Dyn Earthquake Eng (2008
number of dynamic degrees of freedom. Since only the horizontaldegrees are meaningful in this example the vertical degrees offreedom were omitted in the analysis. This situation results infewer number of unknowns (32) than the number of actualdegrees freedom (56) but the GA, Levenberg-Margquardt recon-struction method can properly search for the minimum also inthis case. In Table 3, the first six natural frequencies of the intactframe are given.
The damage patterns analyzed in this case are shown in Fig. 8.The first damage pattern is described by the losses of stiffness ofeight finite elements located in all the four columns of the framewith 10% damage for the elements located closer to the supportand 5% damage inflicted to the upper elements (Fig. 8a). Thisdamage pattern can be called ‘‘column damage scenario’’. Thesecond damage pattern is shown in Fig. 8b and can be called‘‘corner damage scenario’’ �20% stiffness loss was applied for allthe elements in this case.
Numerous computations have been carried out with harmonicforce located at various nodes and with different excitationdirections. The horizontal position of the excitation force asshown in Fig. 7 with P0 ¼ 65 kN and with excitation frequency3.2 Hzof1 ¼ 4.86 Hz leads to the most effective reconstructionresults. The applied direction of excitations introduce asymmetryin the displacement response. Such situation is particularlyfavorable when asymmetric damage patterns are to be recon-structed. In Fig. 9, the results of reconstruction for the ‘‘columndamage scenario’’ are shown. It can be observed that thereconstructed stiffness reduction coefficients almost coincidewith the assumed ones. The WAE value equals in this case 0.03%with maximum error of reconstruction reaching 0.18%. In theanalyzed example (and in all the examples that follow), thecombined GA and Levenberg-Margquardt optimization algorithmare applied. Such positive reconstruction in this case derives from
econstruction of 3D frames using genetic algorithms with), doi:10.1016/j.soildyn.2008.03.001
ARTICLE IN PRESS
S. Kokot, Z. Zembaty / Soil Dynamics and Earthquake Engineering ] (]]]]) ]]]–]]] 9
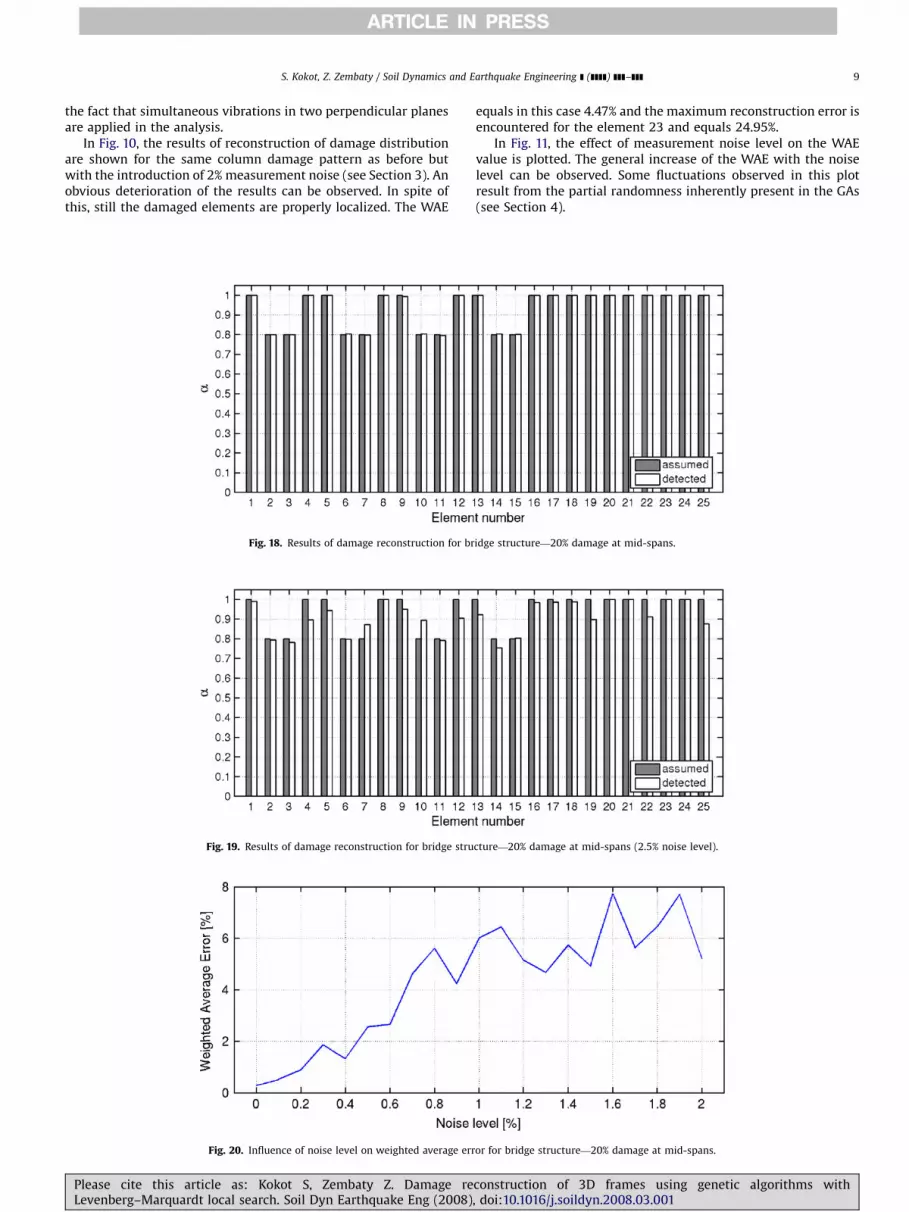
the fact that simultaneous vibrations in two perpendicular planesare applied in the analysis.
In Fig. 10, the results of reconstruction of damage distributionare shown for the same column damage pattern as before butwith the introduction of 2% measurement noise (see Section 3). Anobvious deterioration of the results can be observed. In spite ofthis, still the damaged elements are properly localized. The WAE
Fig. 18. Results of damage reconstruction for br
Fig. 19. Results of damage reconstruction for bridge stru
Fig. 20. Influence of noise level on weighted average err
Please cite this article as: Kokot S, Zembaty Z. Damage reLevenberg–Marquardt local search. Soil Dyn Earthquake Eng (2008)
equals in this case 4.47% and the maximum reconstruction error isencountered for the element 23 and equals 24.95%.
In Fig. 11, the effect of measurement noise level on the WAEvalue is plotted. The general increase of the WAE with the noiselevel can be observed. Some fluctuations observed in this plotresult from the partial randomness inherently present in the GAs(see Section 4).
idge structure—20% damage at mid-spans.
cture—20% damage at mid-spans (2.5% noise level).
or for bridge structure—20% damage at mid-spans.
construction of 3D frames using genetic algorithms with, doi:10.1016/j.soildyn.2008.03.001
ARTICLE IN PRESS
S. Kokot, Z. Zembaty / Soil Dynamics and Earthquake Engineering ] (]]]]) ]]]–]]]10
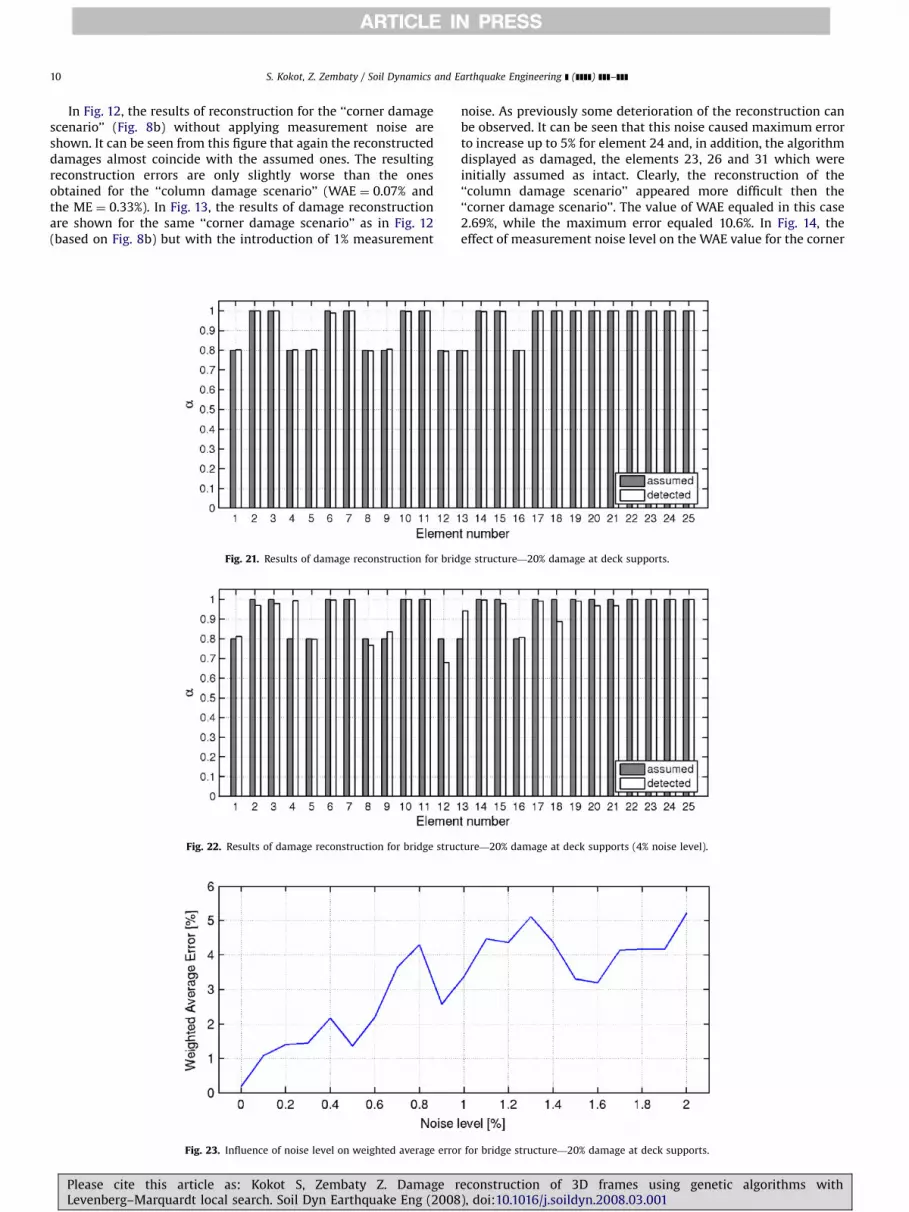
In Fig. 12, the results of reconstruction for the ‘‘corner damagescenario’’ (Fig. 8b) without applying measurement noise areshown. It can be seen from this figure that again the reconstructeddamages almost coincide with the assumed ones. The resultingreconstruction errors are only slightly worse than the onesobtained for the ‘‘column damage scenario’’ (WAE ¼ 0.07% andthe ME ¼ 0.33%). In Fig. 13, the results of damage reconstructionare shown for the same ‘‘corner damage scenario’’ as in Fig. 12(based on Fig. 8b) but with the introduction of 1% measurement
Fig. 21. Results of damage reconstruction for brid
Fig. 22. Results of damage reconstruction for bridge struc
Fig. 23. Influence of noise level on weighted average erro
Please cite this article as: Kokot S, Zembaty Z. Damage rLevenberg–Marquardt local search. Soil Dyn Earthquake Eng (2008
noise. As previously some deterioration of the reconstruction canbe observed. It can be seen that this noise caused maximum errorto increase up to 5% for element 24 and, in addition, the algorithmdisplayed as damaged, the elements 23, 26 and 31 which wereinitially assumed as intact. Clearly, the reconstruction of the‘‘column damage scenario’’ appeared more difficult then the‘‘corner damage scenario’’. The value of WAE equaled in this case2.69%, while the maximum error equaled 10.6%. In Fig. 14, theeffect of measurement noise level on the WAE value for the corner
ge structure—20% damage at deck supports.
ture—20% damage at deck supports (4% noise level).
r for bridge structure—20% damage at deck supports.
econstruction of 3D frames using genetic algorithms with), doi:10.1016/j.soildyn.2008.03.001

ARTICLE IN PRESS
S. Kokot, Z. Zembaty / Soil Dynamics and Earthquake Engineering ] (]]]]) ]]]–]]] 11
damage scenario is shown. Similarly as in Fig. 11, the generalincrease of the WAE with increasing noise level can be observedalthough some fluctuations can also be observed.
7. Example three: bridge structure vibrating inthree dimensions
As the last example consider box type reinforced concretebridge with detailed data taken from paper by Leger et al. [52].The finite element model of the bridge is shown in Fig. 15. The
Fig. 24. Results of damage reconstruction for brid
Fig. 25. Results of damage reconstruction for bridge struc
Fig. 26. Influence of noise level on weighted average erro
Please cite this article as: Kokot S, Zembaty Z. Damage reLevenberg–Marquardt local search. Soil Dyn Earthquake Eng (2008)
cross-section area of the deck of this bridge equals 3.77 m2, whilethe area of its circular columns equal 2.011 m2. The material dataof the bridge are the same as in the previous examples. Seismicresponse of the same bridge was also analyzed in the paper byZembaty [26]. Table 4 contains the first six natural frequencies ofthe intact bridge. It is interesting to note that the last three naturalfrequencies shown in Table 3 (4th, 5th and 6th) are rather closelyspaced so the damage detection by observing changes in naturalfrequencies can be difficult as one can even expect some naturalmodes to interchange after damage.
ge structure—20% damage at pier supports.
ture—20% damage at pier supports (3% noise level).
r for bridge structure—20% damage at pier supports.
construction of 3D frames using genetic algorithms with, doi:10.1016/j.soildyn.2008.03.001

ARTICLE IN PRESS
S. Kokot, Z. Zembaty / Soil Dynamics and Earthquake Engineering ] (]]]]) ]]]–]]]12
Three damage scenarios considered for this structure (Fig. 16)are as follows:
�
mid-span damage scenario (Fig. 16a), � support damage scenario (Fig. 16b) and � pier damage scenario (Fig. 16c).Fig. 27. Sketch showing practical implementation of the reconstruction method:
(a) multiple sensor application and (b) single sensor shifted to all required
positions.
Various points and directions of the harmonic force wereanalyzed. The reconstructions were the most effective withexcitation harmonic force acting at an angle of 451 to bothvertical and horizontal planes of the deck (Fig. 17). In this position,the structure vibrates in 3D which contributes to the effectivenessof the reconstructions techniques. The amplitude of harmonicforce equals 2300 kN and excitation frequency equals 4.5 Hzwhich is located in the middle between the 3rd and 4th naturalfrequency. In Fig. 18, results of the reconstruction for the mid-spandamage scenario (Fig. 16a) with 20% stiffness loss are shown.A good accuracy of the reconstruction can again be observed. Themaximum reconstruction error equaled in this case 0.73% whileWAE was equal to 0.18%. Fig. 19 presents results of reconstructionof the same damage pattern but including 2.5% measurementnoise. In this case, the maximum error increased to 12.57% whileWAE was equal to 4.40%. In Fig. 20, the effect of the measuringerror on the WAE coefficient is shown. This error increases moreevidently after ‘ crosses approximately 0.6%. In Fig. 21, the resultsof the reconstruction of support damage scenario (Fig. 16b) with20% stiffness loss are shown. Again very good accuracy ofreconstruction was achieved with the maximum reconstructionerror equal to 1.09% and WAE ¼ 0.3%. In Fig. 22, the results ofreconstruction are shown for the same damage patter, but with 4%noise level. The ME and WAE increased in this case up to 24.03%and 4.01%, respectively. In Fig. 23, the effect of the measuringnoise on WAE is shown with quite similar results as in all theprevious examples. In Fig. 24, the results of the damagereconstruction for the pier damage scenario are shown, while inFig. 25 the same results of reconstruction are shown taking intoaccount 2% measurement noise. Respective values of reconstruc-tion errors equaled ME ¼ 18.62% and WAE ¼ 2.47%. And finally,Fig. 26 presents the effect of noise level on the WAE value for thepier damage scenario. The WAE value increases up to the noiselevel 0.6% and then oscillates about 4% value.
8. Final remarks and conclusions
An efficient application of GAs in vibration-based damagereconstruction of structural systems have been shown for varioustypes of beam and frame structures. It has been already knownthat harmonic excitations are quite effective in damage detection,particularly when applied out of the resonance zones what makessuch methods particularly good for many types of civil engineer-ing structures with substantial and random material damping. Butwhen applied with GAs enhanced by Levenberg-Margquardt localsearch, the harmonic vibrations proved to be very efficient inreconstructing complicated damage patterns, characteristic forreinforced concrete structures. Detailed numerical analyses ofSections 5–7 have shown, that it was possible to reconstructstiffness losses as low as 5% with the accuracy of about 1%. Withthe presence of measurement noise, the effectiveness of recon-struction dropped, but still was acceptable for noise levels 2–3%. Itis quite good result compared to other damage detection methods.For example, the application of wavelet approach requires thedamages to be much deeper to be successfully identified [15,16].
The reconstruction results using harmonic excitations withGAs and Levenberg-Margquardt local search appeared to be betterfor the structure vibrating in three dimensions due to more
Please cite this article as: Kokot S, Zembaty Z. Damage rLevenberg–Marquardt local search. Soil Dyn Earthquake Eng (2008
information passed to the objective function. The favorablepositions and frequencies of the excitation forces were formedand chosen to further tests.
The analyzed method of damage detection has many advan-tages over the classic methods based on modal analyses, as itdetects multiple damages without utilizing higher natural modesand is not affected by closely spaced natural frequencies.It has, however, also some disadvantages as the application ofharmonic exciters may require putting the analyzed structure outof service (e.g., a bridge). The application of harmonic excitationsmay, however, be also advantageous for the accuracy of themethod as it allows to repeat the diagnostic vibrationswith the same or various frequencies, which will improve thequality of the results. The method requires the application ofmeasuring devices in all the characteristic points of the testedstructure which may be quite expensive. It is, however, alsopossible to apply it with only one measuring device and repeateddata acquisitions (see Fig. 27). However, the costs of measuringdevices are dropping down recently and one can expect them tobe installed in great number for the important structures to beused within the scope of planned structural health monitoringstrategies, in case of accidental overload or after a strongearthquake.
Acknowledgments
A partial support of Polish NSF Grant ‘‘vibration-basedstructural damage detection’’ (Regd. No. 1717/T07/2005/29) isgratefully acknowledged.
References
[1] Doebling SW, Farrar CR, Prime MB, Shevitz DW. Damage identification andhealth monitoring of structural and mechanical systems from changes in theirvibration characteristics: a literature review, Los Alamos National Laboratory,Report LA-13070-MS, 1996.
[2] Sohn H, Farrar CR, Hemez FM, Shunk DD, Stinemates DW, Nadler BR. A reviewof structural health monitoring literature: 1996–2001, Los Alamos NationalLaboratory Report LA-13976-MS, 2003.
[3] Salawu OS. Detection of structural damage through changes in frequency: areview. Eng Struct 1997;19(9):718–23.
[4] Hassiotis S, Jeong GD. Identification of stiffness reductions using naturalfrequencies. J Eng Mech ASCE 1995;121:1106–13.
[5] Capecchi D, Vestroni F. Monitoring of structural systems by using frequencydata. Earthquake Eng Struct Dyn 1999;28:447–61.
[6] Xia Y, Hao H. Statistical damage identification of structures with frequencychanges. J Sound Vib 2002;263:853–70.
[7] Morassi A, Rovere N. Localizing a notch in a steel frame from frequencymeasurements. J Eng Mech ASCE 1997;123:422–32.
[8] Kim JT, Stubbs N. Crack detection in beam-type structures using frequencydata. J Sound Vib 2003;259:145–60.
[9] Maeck J, De Roeck G. Dynamic bending and torsion stiffness derivation frommodal curvatures and torsion rates. J Sound Vib 1999;225(1):153–70.
econstruction of 3D frames using genetic algorithms with), doi:10.1016/j.soildyn.2008.03.001
ARTICLE IN PRESS
S. Kokot, Z. Zembaty / Soil Dynamics and Earthquake Engineering ] (]]]]) ]]]–]]] 13
[10] Ndambi JM, Vantomme J, Harri K. Damage assessment in reinforced concretebeams using eigenfrequecies and mode shape derivatives. Eng Struct 2002;24:501–15.
[11] Xia Y, Hao H, Brownjohn JMW, Xia P-Q. Damage identification of structureswith uncertain frequency and mode shape data. Earthquake Eng Struct Dyn2002;31:1053–66.
[12] Maia NM, Silva JMM, Almas EAM. Damage detection in structures: from modeshapes frequency response function methods. Mech Syst Signal Process2003;17(3):489–98.
[13] Kim J-T, Ryu Y-S, Cho H-M, Stubbs N. Damage identification in beam-typestructures: frequency-based method vs. mode-shape-based method. EngStruct 2003;25:57–67.
[14] Gorl E, Link M. Damage identification using changes of eigenfrequencies andmode shapes. Mech Syst Signal Process 2003;17(1):103–10.
[15] Rucka M, Wilde P. Crack identification using wavelets on experimental staticdeflection profiles. Eng Struct 2006;28(2):279–88.
[16] Rucka M, Wilde K. Application of continuous wavelet transform in vibrationbased damage detection method for beams and plates. J Sound Vib 2006;297:536–50.
[17] Pai FP, Young LG. Damage detection of beams using operational deflectionshapes. Int J Solids Struct 2001;38:3161–92.
[18] Oh BH, Jung BS. Structural damage assessment with combined data of staticand modal tests. J Struct Eng ASCE 1998;124:956–65.
[19] Cornwell P, Doebling SW, Farrar CR. Application of the strain energy damagedetection method to plate-like structures. In: Proceedings of the IMAC15, 15thinternational modal analysis conference, Orlando, FL, 2002. p. 1312–18.
[20] Zhang D, Quiong W, Link M. A structural damage identification approachbased on element modal strain energy. In: Proceedings of ISMA23, noise andvibration engineering, Leuven, Belgium, 1998.
[21] De Stefano. Structural identification and health monitoring on the historicalarchitectural heritage. Key Eng Mater 2007;347:37–54.
[22] Valente C, Spina D, Gabriele S. Experimental modal analysis for damagedetection of buildings via Gabor transform technique. Key Eng Mater 2007;347:259–64.
[23] Armestola J, Arias P, Ordonez C, Lorenzo H, Caparrini N. Damage quantifica-tion and monitoring in masonry monuments through digital photogramme-try. Key Eng Mater 2007;347:291–6.
[24] Nielsen SRK, Koyluoglu HU, Cakmak AS. One and two dimensional maximumsoftening damage indicators for reinforced concrete structures under seismicexcitation. Soil Dyn Earthquake Eng 1993;11:435–43.
[25] Ryzynski A. Serviceability problems of locally damaged concrete bridges.Arch Civil Eng 1994;XL(3–4):437–52.
[26] Zembaty Z. Vibrations of bridge structure under kinematic wave excitations. JStruct Eng ASCE 1997;123:479–88.
[27] Bolton R, Sikorsky C, Park S, Choi S, Stubbs N. Modal property changes of aseismically damaged concrete bridge. J Bridge Eng ASCE 2005;10:415–28.
[28] Ren W-X, De Rock G. Structural damage identification using modal data. II:Test verification. J Struct Eng ASCE 2002;128:96–104.
[29] Zembaty Z, Kowalski M, Pospisil S. Dynamic identification of a reinforcedconcrete frame in progressive states of damage. Eng Struct 2006;28(5):668–81.
[30] Gladwell GML. Inverse problems in vibration. Martinus Noordhoff; 1986.[31] Koyluoglu HU, Cakmak AS, Nielsen SRK. Midbroken reinforced concrete shear
frames due to earthquakes. A hysteretic model to quantify damage at thestory level. Soil Dyn Earthquake Eng 1997;16:95–112.
Please cite this article as: Kokot S, Zembaty Z. Damage reLevenberg–Marquardt local search. Soil Dyn Earthquake Eng (2008)
[32] Skjaerbraek PS, Taskin B, Kirkegaard PH, Nielsen SRK. An experimental-studyof a midbroken 2-bay, 6-story reinforced-concrete frame subject to earth-quakes. Soil Dyn Earthquake Eng 1997;16:373–84.
[33] Friswell MI, Mottershead JE. Finite element model updating in structuraldynamics. Dordrecht: Kluwer; 1995.
[34] Skjaerbaek PS, Nielsen SRK, Cakmak AS. Identification of damage inreinforced concrete structures from earthquake records—optimal locationof sensors. Soil Dyn Earthquake Eng 1996;15:347–58.
[35] Luo X, Haya H, Inaba T, Shiotani T. Seismic diagnosis of railway substructuresby using secondary acoustic emission. Soil Dyn Earthquake Eng 2006;26:1101–10.
[36] Todorovska MI, Trifunac MD. Earthquake damage detection in the ImperialCounty Services Building I: The data and time-frequency analysis. Soil DynEarthquake Eng 2007;27:564–76.
[37] Todorovska MI, Ivanovic SS, Trifunac MD. Wave propagation in a seven-storyreinforced concrete building: I. Theoretical models. Soil Dyn Earthquake Eng2001;21:211–23.
[38] Todorovska MI, Ivanovic SS, Trifunac MD. Wave propagation in a seven-storyreinforced concrete building: II. Observed wavenumbers. Soil Dyn EarthquakeEng 2001;21:225–36.
[39] Trifunac MD, Ivanovic SS, Todorovska MI. Wave propagation in a seven-storyreinforced concrete building: III. Damage detection via changes in wave-numbers. Soil Dyn Earthquake Eng 2003;23:65–75.
[40] Todorovska MI, Trifunac MD. Impulse response analysis of the Van Nuys7-story hotel during 11 earthquakes and earthquake damage detection. StructControl Health Monit 2008;15(1):90–116.
[41] Todorovska MI, Trifunac MD. Earthquake damage detection in theimperial county services building III: analysis of wave traveltimes via impulse response functions. Soil Dyn Earthquake Eng 2008,(in press).
[42] Swiercz A, Ko"akowski P, Holnicki-Szulc J. Structural damage identificationusing low frequency non-resonance harmonic excitation. Key Eng Mater2007;374:427–32.
[43] Liu GR, Chen SC. A novel technique for inverse identification of distributedstiffness factor in structures. J Sound Vib 2002;254:823–35.
[44] Todorovska MI, Al Rjoub Y. Effects of rainfall on soil–structure systemfrequency: examples based on poroelasticity and a comparison with full-scalemeasurements. Soil Dyn Earthquake Eng 2006;26:708–17.
[45] Holland JH. Adaptation in natural and artificial systems. Ann Arbor, MI:University of Michigan Press; 1975.
[46] Goldberg DE. Genetic algorithms in search, optimization and machinelearning. Addison-Wesley; 1989.
[47] Michalewicz Z. Genetic algorithms+data structures ¼ evolution. Springer;1992.
[48] Rawlins JE, editor. Foundations of genetic algorithms. Morgan Kaufmann;1991.
[49] Baker JE. Reducing bias and inefficiency in the selection algorithm. In:Proceedings of the second international conference on genetic algorithms andtheir application, 1987. p. 14–21.
[50] Muhlenbein H, Schlierkamp-Voosen D. Predictive models for the breedergenetic algorithm: I. Continuous parameter optimization. Evol Comput1993;1(1):25–49.
[51] Nocedal J, Wright SJ. Numerical optimization. New York: Springer; 1999.[52] Leger P, Ide IM, Paultre P. Multiple-support seismic analysis of large
structures. Comput Struct 1990;36:1153–8.
construction of 3D frames using genetic algorithms with, doi:10.1016/j.soildyn.2008.03.001