current practices, innovations, and emerging mobility futures
TRANSCRIPT
A Growing Economy and Freight Demand 1
NOTICE
This document is disseminated under the sponsorship of the United States Department of
Transportation (USDOT) in the interest of information exchange. The U.S. Government assumes no
liability for the use of the information contained in this document.
The U.S. Government does not endorse products or manufacturers. Trademarks or manufacturers’ names appear in this report only because they are considered essential to the objective of the
document.
QUALITY ASSURANCE STATEMENT
The United States Department of Transportation (USDOT) provides high-quality information to serve
Government, industry, and the public in a manner that promotes public understanding. Standards
and policies are used to ensure and maximize the quality, objectivity, utility, and integrity of its
information. USDOT periodically reviews quality issues and adjusts its programs and processes to
ensure continuous quality improvement.
Cover images (clockwise from top left): Shutterstock, n.d.; Getty Images, n.d.; Getty Images, n.d.;
and Shutterstock, n.d.
Technical Report Documentation Page
1. Report No.
FHWA-JPO-20-792
2. Government Accession No. 3. Recipient’s Catalog No.
4. Title and Subtitle
Mobility on Demand Planning and Implementation: Current Practices, Innovations, and Emerging Mobility Futures
5. Report Date
March 2020
6. Performing Organization Code
7. Author(s)
Susan Shaheen (UC Berkeley), Adam Cohen (UC Berkeley), Jacquelyn Broader (UC Berkeley), Richard Davis (UC Berkeley), Les Brown (ICF), Radha Neelakantan (ICF), Deepak Gopalakrishna (ICF)
8. Performing Organization Report No.
9. Performing Organization Name and Address
ICF Transportation Sustainability Research Center 9300 Lee Highway University of California, Berkeley Fairfax, VA 22031 408 McLaughlin Hall
Berkeley, CA 94720
10. Work Unit No. (TRAIS)
11. Contract or Grant No.
DTFH6116D00052L
12. Sponsoring Agency Name and Address
U.S. Department of Transportation Office of the Assistant Secretary for Research and Technology, Intelligent Transportation Systems Joint Program Office 1200 New Jersey Avenue, SE Washington, DC 20590
13. Type of Report and Period Covered
September 2018 to March 2020
14. Sponsoring Agency Code
15. Supplementary Notes
Corbin Davis, FHWA Task Manager Robert Sheehan, ITS JPO Task Manager
16. Abstract
This report provides Mobility on Demand (MOD) planning and implementation practices and tools to support
communities. The report discusses different stakeholders in the MOD ecosystem and the role of partnerships in
filling spatial, temporal, and other service gaps. Additionally, the report discusses how MOD can be integrated into
transportation planning and modeling. The report also discusses shared mobility implementation considerations,
such as rights-of-way management, multimodal integration, data sharing, equity, labor impacts, and the role of
pilot evaluations. Finally, the report discusses technology developments with implications for the MOD ecosystem,
such as shared automated vehicles (SAVs), urban air mobility (UAM), and last-mile delivery innovations. This
report is a practical resource with: 1) current practices for planning and implementing MOD; 2) case studies and
lessons learned; 3) considerations to help public agencies advance MOD in their communities; and 4) resources
and recommended reading.
17. Keywords
Mobility on Demand, MOD, Shared Mobility, Planning, Implementation, Last-Mile Delivery, Emerging Mobility Futures, Shared Automated Vehicles, SAVs, Urban Air Mobility, UAM
18. Distribution Statement
19. Security Classif. (of this report) 20. Security Classif. (of this page) 21. No. of Pages
182
22. Price
Form DOT F 1700.7 (8-72) Reproduction of completed page authorized
Acknowledgements
ICF and the Transportation Sustainability Research Center (TSRC) of the Institute of Transportation
Studies at the University of California, Berkeley would like to thank the USDOT for generously
funding this study. The authors would like to thank the transportation professionals, public agencies,
and service providers who made this research possible. The contents of this report reflect the views
of the authors and do not necessarily indicate sponsor endorsement.
Table of Contents
U.S. Department of Transportation
Office of the Assistant Secretary for Research and Technology
Intelligent Transportation Systems Joint Program Office
i
U.S. Department of Transportation
Office of the Assistant Secretary for Research and Technology
Intelligent Transportation Systems Joint Program Office
ii
-
List of Figures
Figure 1. Ubigo Interface...........................................................................................................13
Figure 2. Architecture for MOD and Multimodal Management ...................................................14
Figure 3. MOD Stakeholders.....................................................................................................22
Figure 4. Supply and Demand in the Transportation Ecosystem ...............................................34
Figure 5. TSMO Strategies........................................................................................................35
Figure 6. Five Common Built Environments in the U.S..............................................................51
Figure 7. Environments to Implement Shared Modes................................................................52
Figure 8. Atlanta BeltLine..........................................................................................................59
Figure 9. Integrated Fare Payment Types .................................................................................70
Figure 10. Cal ITP Service Design............................................................................................71
Figure 11. Potential Stakeholder Impacts..................................................................................75
Figure 12. Decision Making Factors in Travel Behavior.............................................................76
Figure 13. MOD Pilot Project Design and Evaluation Framework..............................................84
Figure 14. MOD Sandbox at a Glance ......................................................................................88
Figure 15. The Complete Trip ...................................................................................................96
Figure 16. Adaptive Scooter......................................................................................................98
Figure 17. Adaptive Cycle .........................................................................................................98
Figure 18. SAE Levels of Automation......................................................................................105
Figure 19. SWOT Analysis of Potential AV and SAV Outcomes..............................................109
Figure 20. EasyMile ................................................................................................................113
Figure 21. Ultimate Urban Corridor .........................................................................................113
Figure 22. Waymo...................................................................................................................114
Figure 23. FAA Airspace Classifications..................................................................................118
Figure 24. UAM Taxonomy .....................................................................................................121
Figure 25. Vertipad .................................................................................................................123
Figure 26. Vertiport .................................................................................................................123
Figure 27. Vertihub .................................................................................................................123
Figure 28. Uber Elevate Delivery Service................................................................................130
Figure 29. Delivery Robots......................................................................................................131
Figure 30. Small Delivery Robot..............................................................................................131
Figure 31. Large Delivery Robot .............................................................................................131
Figure 32. ADV with Locker.....................................................................................................134
U.S. Department of Transportation
Office of the Assistant Secretary for Research and Technology
Intelligent Transportation Systems Joint Program Office
iii
-
- -
- -
-
-
List of Tables Table E 1. Key Takeaways ........................................................................................................ 4
Table 1. MOD Business Models................................................................................................15
Table 2. Examples of Potential Opportunities and Challenges for MOD Stakeholders ..............22
Table 3. Local, Regional, and State Planning Processes ..........................................................29
Table 4. Transportation Network Goals and TSMO Strategies ..................................................36
Table 5. Definitions of Common, Innovative, and Emerging Shared Modes ..............................39
Table 6. Summary of Carsharing Impacts .................................................................................42
Table 7. TNC Mode Substitution Impacts ..................................................................................48
Table 8. Common Built Environment Challenges ......................................................................50
Table 9. Selected Use Cases for Shared Mobility Across Built Environment Types ..................53
Table 10. Shared Mobility Implementation Policy Frameworks..................................................55
Table 11. Considerations in Rights of Way Allocation ...............................................................58
Table 12. Rights of Way Management Strategies .....................................................................60
Table 13. Methods Used to Address Competition Among Operators.........................................61
Table 14. Mobility Hub Key Features and Potential Actions for Physical Integration .................66
Table 15. Multimodal Planners and Policy Considerations ........................................................69
Table 16. Last Mile Delivery Innovations...................................................................................73
Table 17. Last Mile Delivery Innovations in Practice .................................................................74
Table 18. Potential Practices for Addressing Common Issues with MOD Data..........................81
Table 19. Sample MOD Transportation Performance Metrics ...................................................85
Table 20. Labor Issues and Policy Considerations....................................................................92
Table 21. Equity and MOD Case Studies ................................................................................100
Table 22. AV and SAV Deployment Framework......................................................................107
Table 23. Potential SAV Policies .............................................................................................111
Table 24: Potential Lane Classifications for AVs .....................................................................112
Table 25. Definitions and Common Terms ..............................................................................119
Table 26. UAM Skyport Typologies and Characteristics..........................................................124
Table 27. UAM Skyports as Mobility Hubs ..............................................................................125
Table 28. FAA UAS IPP Lead Projects ...................................................................................129
Table 29. Key Takeaways.......................................................................................................139
U.S. Department of Transportation
Office of the Assistant Secretary for Research and Technology
Intelligent Transportation Systems Joint Program Office
iv
EXECUTIVE SUMMARY
EXECUTIVE SUMMARY
Mobility on Demand (MOD) envisions a seamless mobility and goods delivery ecosystem that is safe,
reliable, and equitable for all users. The United States Department of Transportation (USDOT)
achieves this vision by leveraging innovative technologies and facilitating public-private partnerships
that allow for a user-centric, mode-neutral, technology-enabled, and partnership-driven approach that
can enhance mobility options for all travelers and support seamless delivery of goods and services.
The USDOT’s MOD Program is guided by the following principles:
• User-centric – promotes choice in personal mobility and utilizes universal design principles to
satisfy the needs of all users.
• Mode-neutral– supports connectivity and interoperability where all modes of transportation
work together to achieve the complete trip vision and efficient delivery of goods and services.
• Technology-enabled – leverages emerging and innovative use of technologies to enable and
incentivize smart decision-making by all users and operators in the mobility ecosystem.
• Partnership driven – encourages partnerships, both public and private, to accelerate innovation
and deployment of proven mobility strategies to benefit all.
The USDOT’s MOD Program is a multimodal program initiated by the Intelligent Transportation
Systems Joint Program Office (ITS JPO), Federal Transit Administration (FTA) and the Federal
Highway Administration (FHWA) to study emerging mobility services; public transportation networks
and operations; goods delivery services; real-time data services; and ITS that can enhance access to
mobility, goods, and services for all users.
In recent years, on-demand mobility has undergone rapid change due to advancements in technology,
changing consumer preferences, and a variety of socio-demographic forces. Technology, mobility, and
societal trends are changing the way people travel and consume resources, disrupting both supply of
mobility and delivery options and demand for all types of trips. A core component of MOD is the
provision of a dynamic supply of transportation services, providing an array of mobility and delivery
options. Consumers can access mobility, goods, and services on demand by dispatching or using
public transportation, shared mobility, delivery services, and other innovative strategies through an
integrated and connected multimodal network. The sharing economy also allows for consumers to
become mobility providers and couriers in a dynamic fashion.
MOD is based on the principle that transportation is a commodity where transportation modes have
economic values that are distinguishable in terms of cost, journey time, wait time, number of
connections, convenience, and other attributes. MOD enables an integrated and multimodal operations
management approach that can influence the supply and demand sides of a marketplace. The supply
side of the marketplace consists of the providers, operators, and devices that offer transportation
services for people or goods and service delivery. The demand side of the marketplace is comprised of
U.S. Department of Transportation
Office of the Assistant Secretary for Research and Technology
Intelligent Transportation Systems Joint Program Office
1
EXECUTIVE SUMMARY
travelers and goods, including their choices and preferences. A variety of stakeholders both influence
and are impacted by MOD, including federal agencies, state agencies, regional agencies, local
governments, policymakers, the private sector, and other institutions.
Public-private partnerships can play a key role in addressing several policy challenges that could
maximize the potential benefits of MOD. A few common public-private partnerships include data
sharing, integration with third-party apps, rights-of-way access, risk sharing, paratransit service, off-
peak service, low-density service, and first- and last- mile connections to public transportation.
Stakeholders can plan and prepare for MOD by incorporating shared modes into transportation
planning and modeling. In addition to planning and modeling the impacts of MOD, transportation
network managers and systems operators can leverage MOD for transportation systems management
and operations (TSMO) to aid in managing supply and demand.
Shared mobility services, such as carsharing, microtransit, shared micromobility (bikesharing and
scooter sharing), and transportation network companies (TNCs), typically result in a variety of travel
behavior, environmental, land use, and social impacts, often influenced by the context in which they
are implemented. While MOD can be employed in a variety of built environments, the partnerships,
policies, and deployment characteristics are almost always tailored to local context. Policies integrating
shared mobility into the public rights-of-way, zoning for new and existing developments, and
multimodal integration can create a network effect multiplying the effectiveness of MOD.
The impacts of MOD on data privacy, equity, and labor are common concerns associated with on-
demand mobility. Sharing traveler information can help enable integrated services, such as fare
payment and trip planning. However, MOD service providers typically collect an array of sensitive and
personally identifiable information that requires data protection. Additionally, MOD can enhance
access and opportunities for underserved communities, but it may also have adverse impacts if a
particular population or community bears a disproportionate share of the benefits or adverse impacts
of MOD.
MOD stakeholders may be able to overcome key equity barriers through policies and programs that
enhance access to unbanked and underbanked communities (households without debit or credit card
access), providing alternative access mechanisms that do not require a smartphone or the Internet to
access, and providing access to physical and digital services for people with disabilities. MOD is
creating new employment opportunities in some sectors of the transportation industry but is also
disrupting existing labor in other transportation sectors where demand for other services have
declined, such as taxis and liveries. In addition to changing the number and types of jobs available,
MOD is also disrupting traditional labor practices, contributing to the growth of part-time, flexible
schedule, and independent contractor work.
In the coming decades, shared automated vehicles (SAVs), urban air mobility (UAM), and last-mile
delivery innovations have the potential to transform communities and mobility, both positively and
negatively. The impacts of emerging technologies on auto ownership, land use, parking, and travel
behavior remain to be seen. However, as these technologies come online, policymakers may need
proactive policy to facilitate sustainable and equitable outcomes. What is clear is that these new
technologies could likely have a disruptive impact on communities. Thoughtful planning and
U.S. Department of Transportation
Office of the Assistant Secretary for Research and Technology
Intelligent Transportation Systems Joint Program Office
2
EXECUTIVE SUMMARY
implementation, continued research, and a keen understanding of MOD’s impacts on the transportation network will be critical to balance public goals with commercial interests and to harness
and maximize the social, economic, and environmental effects of these innovations.
The USDOT is eager to understand how the growth of transportation services and on-demand mobility
coupled with shifts in traveler and consumer behavior can help the nation reimagine the
transportation network. The USDOT’s foundational research, the MOD Operational Concept Report,
provides an overview of MOD and its evolution, a description of the MOD ecosystem, and reviews the
key enablers of the mobility system, including business models and partnerships, land use and
different urbanization scenarios, social equity and environmental justice, policies and standards, and
enabling technologies.
Recognizing the importance of multimodal transportation, the growth of MOD, and the
commoditization of transportation services, the USDOT is pleased to present Mobility on Demand
Planning and Implementation: Current Practices, Innovations, and Emerging Mobility Futures.
This document was developed using a multi-method approach, including a review of current literature
and studies; experts representing the public and private sectors, academia, and non-governmental
organizations; and webinars with thought leaders. Collectively, this information was used to develop
this document. The purpose of this document is to serve as a practical resource that helps inform
pilots, demonstrations, integration, research, and policies for MOD. The primer aims to provide an
overview of this emerging field and current understanding—as in the years to come, MOD will
continue to evolve and develop. In light of this evolution, ongoing tracking and longitudinal analysis
are recommended to support sound planning and policymaking in the future.
This document provides an overview of current practices and emerging innovations. Leveraging the
case studies, findings, current practices, and potential policies in this document can help stakeholders:
• Engage in public-private partnerships to bridge gaps in the transportation network;
• Prepare communities by integrating MOD into current planning and modeling practices;
• Manage network supply and demand through MOD strategies such as TSMO;
• Integrate shared mobility with existing transportation services in a variety of built environment types to support multimodal trips for all users;
• Prepare for the potential impacts of MOD through a variety of public policies;
• Integrate shared mobility and delivery services through mobility hubs, integrated fare payment, and information integration;
• Prepare for, and respond to, the impacts of MOD on labor and equity through data sharing, pilots, and research; and
• Prepare communities for innovative and emerging transportation technologies such as SAVs and UAM.
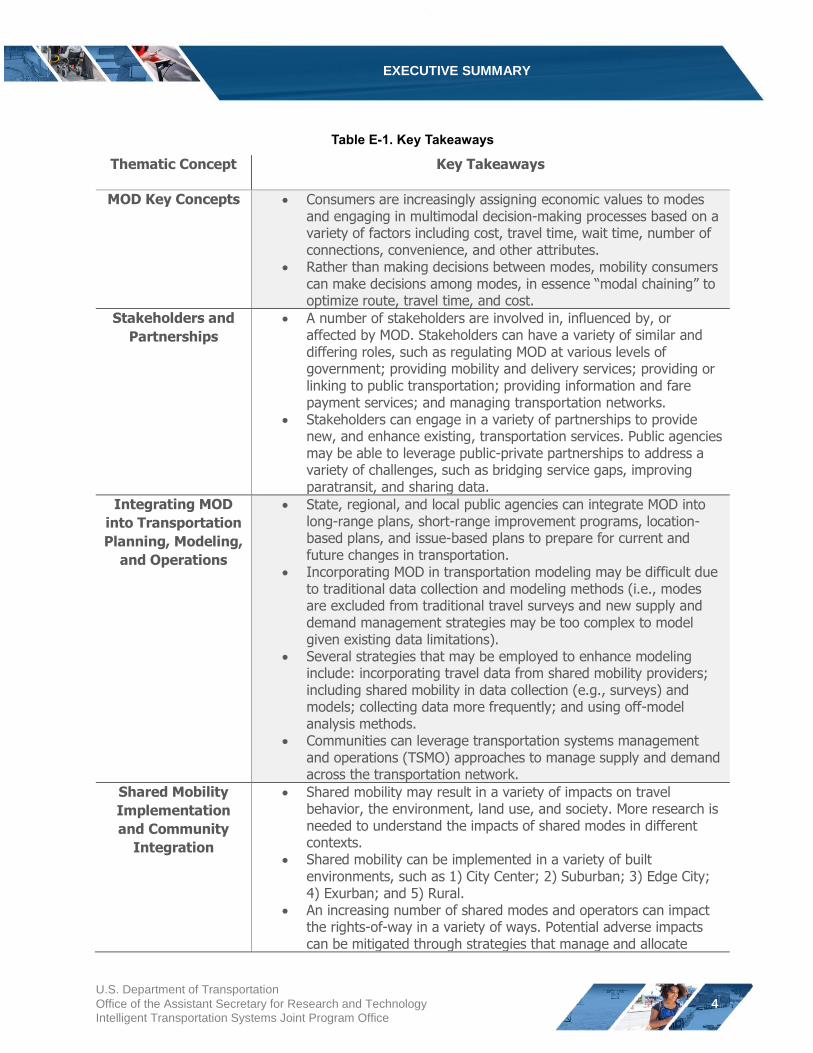
Table E-1 on the following pages provides some key takeaways for this report. Detailed takeaways are
provided by topic area in each section of the report.
U.S. Department of Transportation
Office of the Assistant Secretary for Research and Technology
Intelligent Transportation Systems Joint Program Office
3
EXECUTIVE SUMMARY
Table E-1. Key Takeaways
Thematic Concept Key Takeaways
MOD Key Concepts Consumers are increasingly assigning economic values to modes and engaging in multimodal decision-making processes based on a variety of factors including cost, travel time, wait time, number of connections, convenience, and other attributes.
Rather than making decisions between modes, mobility consumers can make decisions among modes, in essence “modal chaining” to optimize route, travel time, and cost.
Stakeholders and
Partnerships
A number of stakeholders are involved in, influenced by, or affected by MOD. Stakeholders can have a variety of similar and differing roles, such as regulating MOD at various levels of government; providing mobility and delivery services; providing or linking to public transportation; providing information and fare payment services; and managing transportation networks.
Stakeholders can engage in a variety of partnerships to provide new, and enhance existing, transportation services. Public agencies may be able to leverage public-private partnerships to address a variety of challenges, such as bridging service gaps, improving paratransit, and sharing data.
Integrating MOD
into Transportation
Planning, Modeling,
and Operations
State, regional, and local public agencies can integrate MOD into long-range plans, short-range improvement programs, location-based plans, and issue-based plans to prepare for current and future changes in transportation.
Incorporating MOD in transportation modeling may be difficult due to traditional data collection and modeling methods (i.e., modes are excluded from traditional travel surveys and new supply and demand management strategies may be too complex to model given existing data limitations).
Several strategies that may be employed to enhance modeling include: incorporating travel data from shared mobility providers; including shared mobility in data collection (e.g., surveys) and models; collecting data more frequently; and using off-model analysis methods.
Communities can leverage transportation systems management and operations (TSMO) approaches to manage supply and demand across the transportation network.
Shared Mobility
Implementation
and Community
Integration
Shared mobility may result in a variety of impacts on travel behavior, the environment, land use, and society. More research is needed to understand the impacts of shared modes in different contexts.
Shared mobility can be implemented in a variety of built environments, such as 1) City Center; 2) Suburban; 3) Edge City; 4) Exurban; and 5) Rural.
An increasing number of shared modes and operators can impact the rights-of-way in a variety of ways. Potential adverse impacts can be mitigated through strategies that manage and allocate
U.S. Department of Transportation
Office of the Assistant Secretary for Research and Technology
Intelligent Transportation Systems Joint Program Office
4
EXECUTIVE SUMMARY
Thematic Concept Key Takeaways
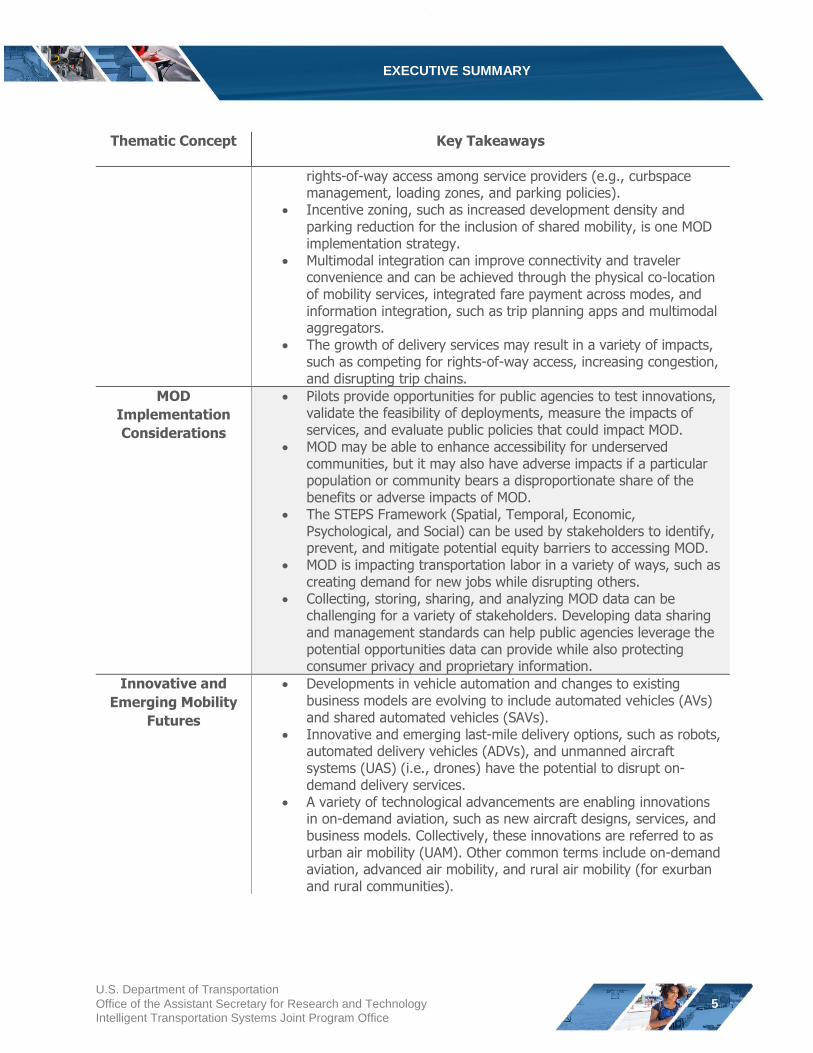
rights-of-way access among service providers (e.g., curbspace management, loading zones, and parking policies).
Incentive zoning, such as increased development density and parking reduction for the inclusion of shared mobility, is one MOD implementation strategy.
Multimodal integration can improve connectivity and traveler convenience and can be achieved through the physical co-location of mobility services, integrated fare payment across modes, and information integration, such as trip planning apps and multimodal aggregators.
The growth of delivery services may result in a variety of impacts, such as competing for rights-of-way access, increasing congestion, and disrupting trip chains.
MOD
Implementation
Considerations
Pilots provide opportunities for public agencies to test innovations, validate the feasibility of deployments, measure the impacts of services, and evaluate public policies that could impact MOD.
MOD may be able to enhance accessibility for underserved communities, but it may also have adverse impacts if a particular population or community bears a disproportionate share of the benefits or adverse impacts of MOD.
The STEPS Framework (Spatial, Temporal, Economic, Psychological, and Social) can be used by stakeholders to identify, prevent, and mitigate potential equity barriers to accessing MOD.
MOD is impacting transportation labor in a variety of ways, such as creating demand for new jobs while disrupting others.
Collecting, storing, sharing, and analyzing MOD data can be challenging for a variety of stakeholders. Developing data sharing and management standards can help public agencies leverage the potential opportunities data can provide while also protecting consumer privacy and proprietary information.
Innovative and
Emerging Mobility
Futures
Developments in vehicle automation and changes to existing business models are evolving to include automated vehicles (AVs) and shared automated vehicles (SAVs).
Innovative and emerging last-mile delivery options, such as robots, automated delivery vehicles (ADVs), and unmanned aircraft systems (UAS) (i.e., drones) have the potential to disrupt on-demand delivery services.
A variety of technological advancements are enabling innovations in on-demand aviation, such as new aircraft designs, services, and business models. Collectively, these innovations are referred to as urban air mobility (UAM). Other common terms include on-demand aviation, advanced air mobility, and rural air mobility (for exurban and rural communities).
U.S. Department of Transportation
Office of the Assistant Secretary for Research and Technology
Intelligent Transportation Systems Joint Program Office
5
COMMON TERMS
COMMON TERMS
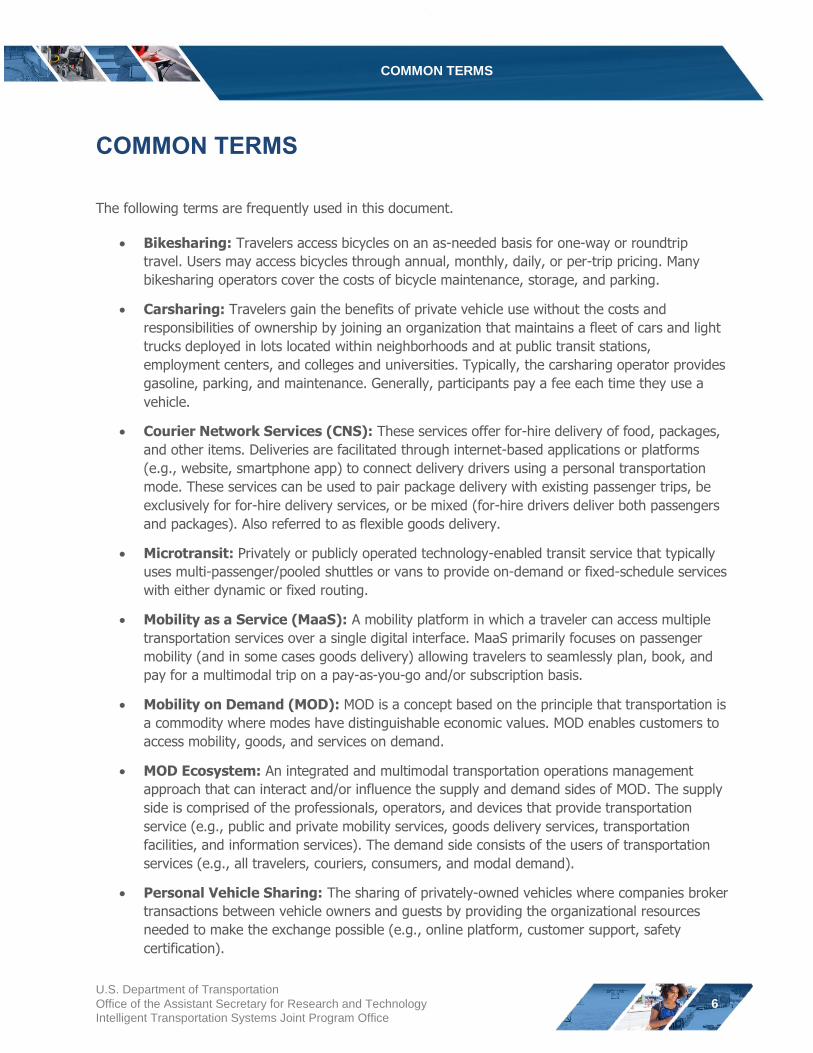
The following terms are frequently used in this document.
Bikesharing: Travelers access bicycles on an as-needed basis for one-way or roundtrip
travel. Users may access bicycles through annual, monthly, daily, or per-trip pricing. Many
bikesharing operators cover the costs of bicycle maintenance, storage, and parking.
Carsharing: Travelers gain the benefits of private vehicle use without the costs and
responsibilities of ownership by joining an organization that maintains a fleet of cars and light
trucks deployed in lots located within neighborhoods and at public transit stations,
employment centers, and colleges and universities. Typically, the carsharing operator provides
gasoline, parking, and maintenance. Generally, participants pay a fee each time they use a
vehicle.
Courier Network Services (CNS): These services offer for-hire delivery of food, packages,
and other items. Deliveries are facilitated through internet-based applications or platforms
(e.g., website, smartphone app) to connect delivery drivers using a personal transportation
mode. These services can be used to pair package delivery with existing passenger trips, be
exclusively for for-hire delivery services, or be mixed (for-hire drivers deliver both passengers
and packages). Also referred to as flexible goods delivery.
Microtransit: Privately or publicly operated technology-enabled transit service that typically
uses multi-passenger/pooled shuttles or vans to provide on-demand or fixed-schedule services
with either dynamic or fixed routing.
Mobility as a Service (MaaS): A mobility platform in which a traveler can access multiple
transportation services over a single digital interface. MaaS primarily focuses on passenger
mobility (and in some cases goods delivery) allowing travelers to seamlessly plan, book, and
pay for a multimodal trip on a pay-as-you-go and/or subscription basis.
Mobility on Demand (MOD): MOD is a concept based on the principle that transportation is
a commodity where modes have distinguishable economic values. MOD enables customers to
access mobility, goods, and services on demand.
MOD Ecosystem: An integrated and multimodal transportation operations management
approach that can interact and/or influence the supply and demand sides of MOD. The supply
side is comprised of the professionals, operators, and devices that provide transportation
service (e.g., public and private mobility services, goods delivery services, transportation
facilities, and information services). The demand side consists of the users of transportation
services (e.g., all travelers, couriers, consumers, and modal demand).
Personal Vehicle Sharing: The sharing of privately-owned vehicles where companies broker
transactions between vehicle owners and guests by providing the organizational resources
needed to make the exchange possible (e.g., online platform, customer support, safety
certification).
U.S. Department of Transportation
Office of the Assistant Secretary for Research and Technology
Intelligent Transportation Systems Joint Program Office
6
COMMON TERMS
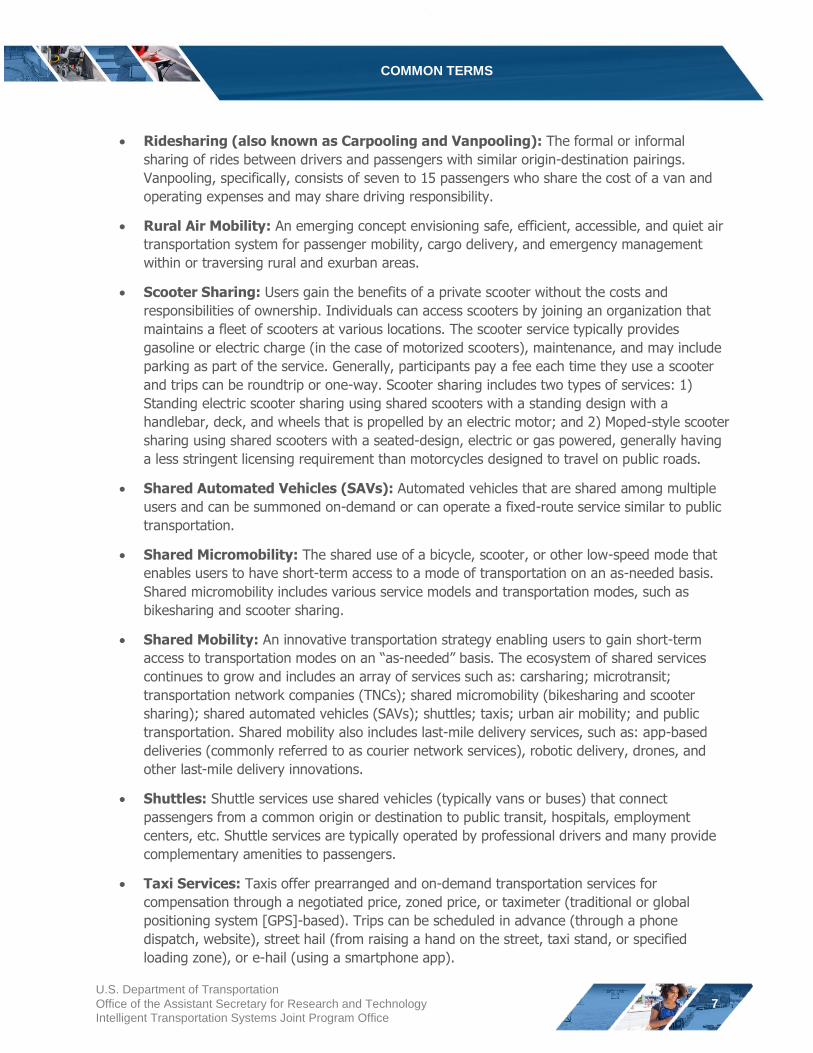
Ridesharing (also known as Carpooling and Vanpooling): The formal or informal
sharing of rides between drivers and passengers with similar origin-destination pairings.
Vanpooling, specifically, consists of seven to 15 passengers who share the cost of a van and
operating expenses and may share driving responsibility.
Rural Air Mobility: An emerging concept envisioning safe, efficient, accessible, and quiet air
transportation system for passenger mobility, cargo delivery, and emergency management
within or traversing rural and exurban areas.
Scooter Sharing: Users gain the benefits of a private scooter without the costs and
responsibilities of ownership. Individuals can access scooters by joining an organization that
maintains a fleet of scooters at various locations. The scooter service typically provides
gasoline or electric charge (in the case of motorized scooters), maintenance, and may include
parking as part of the service. Generally, participants pay a fee each time they use a scooter
and trips can be roundtrip or one-way. Scooter sharing includes two types of services: 1)
Standing electric scooter sharing using shared scooters with a standing design with a
handlebar, deck, and wheels that is propelled by an electric motor; and 2) Moped-style scooter
sharing using shared scooters with a seated-design, electric or gas powered, generally having
a less stringent licensing requirement than motorcycles designed to travel on public roads.
Shared Automated Vehicles (SAVs): Automated vehicles that are shared among multiple
users and can be summoned on-demand or can operate a fixed-route service similar to public
transportation.
Shared Micromobility: The shared use of a bicycle, scooter, or other low-speed mode that
enables users to have short-term access to a mode of transportation on an as-needed basis.
Shared micromobility includes various service models and transportation modes, such as
bikesharing and scooter sharing.
Shared Mobility: An innovative transportation strategy enabling users to gain short-term
access to transportation modes on an “as-needed” basis. The ecosystem of shared services continues to grow and includes an array of services such as: carsharing; microtransit;
transportation network companies (TNCs); shared micromobility (bikesharing and scooter
sharing); shared automated vehicles (SAVs); shuttles; taxis; urban air mobility; and public
transportation. Shared mobility also includes last-mile delivery services, such as: app-based
deliveries (commonly referred to as courier network services), robotic delivery, drones, and
other last-mile delivery innovations.
Shuttles: Shuttle services use shared vehicles (typically vans or buses) that connect
passengers from a common origin or destination to public transit, hospitals, employment
centers, etc. Shuttle services are typically operated by professional drivers and many provide
complementary amenities to passengers.
Taxi Services: Taxis offer prearranged and on-demand transportation services for
compensation through a negotiated price, zoned price, or taximeter (traditional or global
positioning system [GPS]-based). Trips can be scheduled in advance (through a phone
dispatch, website), street hail (from raising a hand on the street, taxi stand, or specified
loading zone), or e-hail (using a smartphone app).
U.S. Department of Transportation
Office of the Assistant Secretary for Research and Technology
Intelligent Transportation Systems Joint Program Office
7
COMMON TERMS
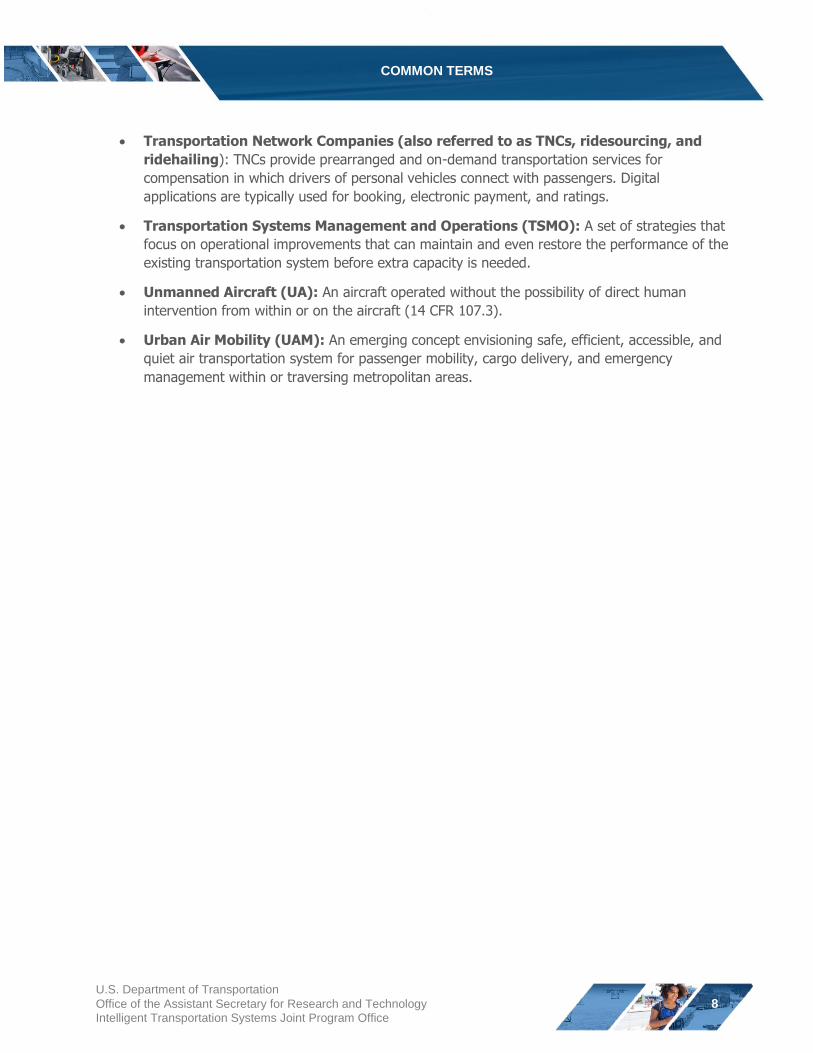
Transportation Network Companies (also referred to as TNCs, ridesourcing, and
ridehailing): TNCs provide prearranged and on-demand transportation services for
compensation in which drivers of personal vehicles connect with passengers. Digital
applications are typically used for booking, electronic payment, and ratings.
Transportation Systems Management and Operations (TSMO): A set of strategies that
focus on operational improvements that can maintain and even restore the performance of the
existing transportation system before extra capacity is needed.
Unmanned Aircraft (UA): An aircraft operated without the possibility of direct human
intervention from within or on the aircraft (14 CFR 107.3).
Urban Air Mobility (UAM): An emerging concept envisioning safe, efficient, accessible, and
quiet air transportation system for passenger mobility, cargo delivery, and emergency
management within or traversing metropolitan areas.
U.S. Department of Transportation
Office of the Assistant Secretary for Research and Technology
Intelligent Transportation Systems Joint Program Office
8
ACRONYMS
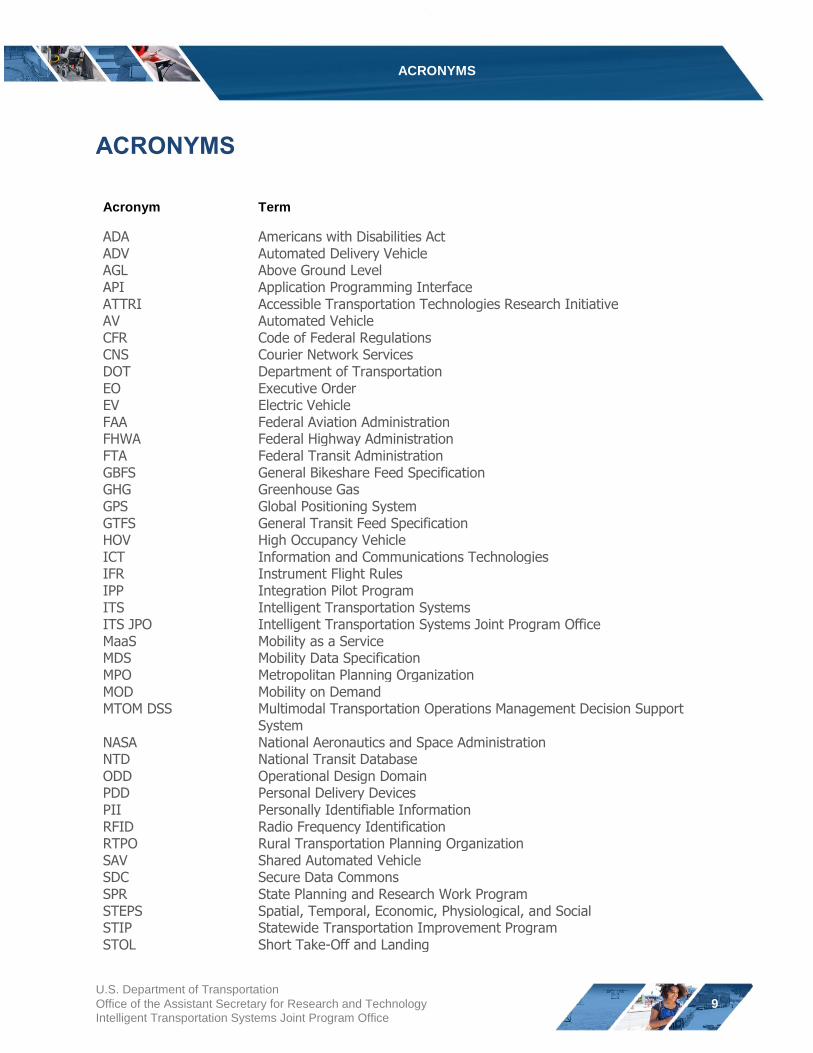
ACRONYMS
Acronym Term
ADA Americans with Disabilities Act ADV Automated Delivery Vehicle AGL Above Ground Level API Application Programming Interface ATTRI Accessible Transportation Technologies Research Initiative AV Automated Vehicle CFR Code of Federal Regulations CNS Courier Network Services DOT Department of Transportation EO Executive Order EV Electric Vehicle FAA Federal Aviation Administration FHWA Federal Highway Administration FTA Federal Transit Administration GBFS General Bikeshare Feed Specification GHG Greenhouse Gas GPS Global Positioning System GTFS General Transit Feed Specification HOV High Occupancy Vehicle ICT Information and Communications Technologies IFR Instrument Flight Rules IPP Integration Pilot Program ITS Intelligent Transportation Systems ITS JPO Intelligent Transportation Systems Joint Program Office MaaS Mobility as a Service MDS Mobility Data Specification MPO Metropolitan Planning Organization MOD Mobility on Demand MTOM DSS Multimodal Transportation Operations Management Decision Support
System NASA National Aeronautics and Space Administration NTD National Transit Database ODD Operational Design Domain PDD Personal Delivery Devices PII Personally Identifiable Information RFID Radio Frequency Identification RTPO Rural Transportation Planning Organization SAV Shared Automated Vehicle SDC Secure Data Commons SPR State Planning and Research Work Program STEPS Spatial, Temporal, Economic, Physiological, and Social STIP Statewide Transportation Improvement Program STOL Short Take-Off and Landing
U.S. Department of Transportation
Office of the Assistant Secretary for Research and Technology
Intelligent Transportation Systems Joint Program Office
9
ACRONYMS
Acronym Term
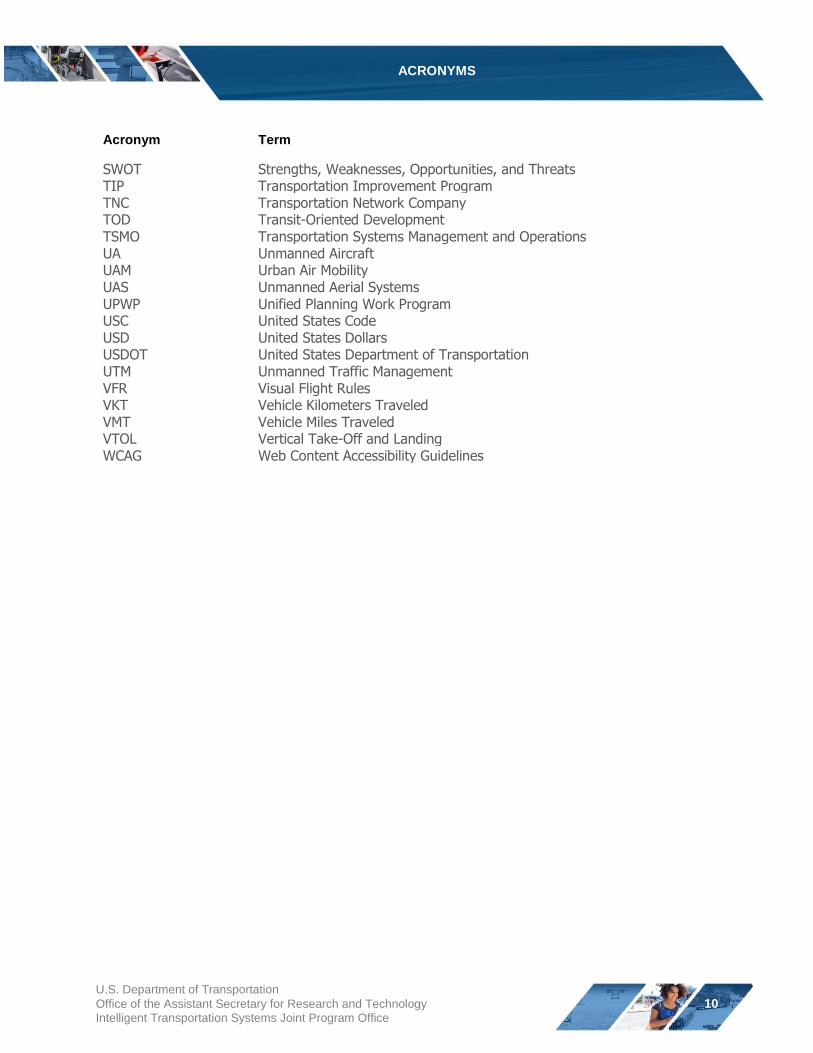
SWOT Strengths, Weaknesses, Opportunities, and Threats TIP Transportation Improvement Program TNC Transportation Network Company TOD Transit-Oriented Development TSMO Transportation Systems Management and Operations UA Unmanned Aircraft UAM Urban Air Mobility UAS Unmanned Aerial Systems UPWP Unified Planning Work Program USC United States Code USD United States Dollars USDOT United States Department of Transportation UTM Unmanned Traffic Management VFR Visual Flight Rules VKT Vehicle Kilometers Traveled VMT Vehicle Miles Traveled VTOL Vertical Take-Off and Landing WCAG Web Content Accessibility Guidelines
U.S. Department of Transportation
Office of the Assistant Secretary for Research and Technology
Intelligent Transportation Systems Joint Program Office
10
CHAPTER 1: Introduction
CHAPTER 1: Introduction
In recent years, changing consumer preferences ⎯ coupled with advancements in technology, social
networking, location-based services, wireless services,
and cloud technologies ⎯ are contributing to
transportation innovation and the growth of Mobility on
Demand (MOD). In communities around the world, a
number of converging innovations are transforming how
people access and consume mobility, goods, and services.
These converging trends contributing to the growth of
MOD include:
The Growth of Shared Mobility, Shared
Micromobility, and Last-Mile Delivery:
Shared mobility is an innovative transportation
strategy enabling users to gain short-term access
to transportation modes on an “as-needed” basis.
The ecosystem of shared services continues to
grow and includes an array of services such as:
carsharing; microtransit; transportation network
companies (TNCs); shared micromobility
(bikesharing and scooter sharing); shared
automated vehicles (SAVs); shuttles; taxis; urban
air mobility (UAM); and public transportation.
Shared mobility also includes last-mile delivery
services, such as: app-based deliveries
(commonly referred to as courier network
services), robotic delivery, drones, and other last-
mile delivery innovations. The growth of these
services is having a transformative effect on
communities by creating new opportunities for
access, mobility, and delivery;
Electrification: Electric drive vehicles (EVs) and
electric devices (e.g., scooters, e-bikes, etc.) that
use one or more electric or traction motors for
propulsion can reduce greenhouse gases (GHGs)
and other emissions, mitigating many of the
The MOD Vision
MOD envisions a seamless mobility and
goods delivery ecosystem that is safe,
reliable, and equitable for all users.
USDOT achieves this vision by leveraging
innovative technologies and facilitating
public-private partnerships that allow for a
user-centric, mode-neutral, technology-
enabled, and partnership-driven approach
that can enhance mobility options for all
travelers and support seamless delivery of
goods and services.
The USDOT’s MOD Program is guided by
the following principles:
User-centric – promotes choice in
personal mobility and utilizes universal
design principles to satisfy the needs
of all users.
Mode-neutral– supports connectivity and interoperability where all modes of
transportation work together to
achieve the complete trip vision and
efficient delivery of goods and
services.
Technology-enabled – leverages emerging and innovative use of
technologies to enable and incentivize
smart decision making by all users
and operators in the mobility
ecosystem.
Partnership driven – encourages partnerships, both public and private,
to accelerate innovation and
deployment of proven mobility
strategies to benefit all.
transportation-related impacts associated with increased urbanization in cities. Lower pollution
and maintenance requirements are contributing to increased investment, improved
performance (increased range and reduced charge times), and the growing popularity of EV
technology;
U.S. Department of Transportation
Office of the Assistant Secretary for Research and Technology
Intelligent Transportation Systems Joint Program Office
11
CHAPTER 1: Introduction
Connected and Automated Vehicles: Connected and automated vehicles that are capable
of sensing the environment and moving with little or no input from a human driver have the
potential to improve safety and increase vehicle occupancy (with policy levers). Automated
vehicles also have the potential to create opportunities for shared services and public
transportation, such as automated pick-up and drop-off and potentially more economical and
convenient demand-responsive services.
Digital Information and Fare Payment Integration: With a growing number of mobility
innovations, there is demand for data-enabled technologies that aggregate modes, facilitate
multimodal trip planning, and integrate payment. A growing number of digital information and
fare payment services are increasingly offering seamless information and payment connectivity
among different transportation modes. These services can help bridge information gaps, make
multimodal travel and public transportation more convenient, and enhance decision making
with dynamic and real-time information throughout an entire journey; and
The Commodification of Transportation: Increasingly, consumers are assigning economic
values to modes and engaging in multimodal decision-making processes based on a variety of
factors including cost, travel time, wait time, number of connections, convenience, and other
attributes. Rather than making decisions between modes, mobility consumers can make
decisions among modes, in essence “modal chaining” to optimize route, travel time, and cost.
Key MOD Characteristics
MOD is characterized by five defining attributes:
1. Commodifying transportation choices into economic terms based on cost, journey time, wait
time, number of connections, convenience, and other attributes;
2. Embracing the needs of all users (travelers and couriers), public and private market
participants, and services across all modes—including motor vehicles, pedestrians, bicycles,
public transit, for-hire vehicle services, carpooling/vanpooling, goods delivery, and other
transportation services;
3. Improving the efficiency and reliability of the transportation system and increasing the
accessibility and mobility of all travelers;
4. Enabling transportation system operators and their partners to monitor, predict, and adapt to
changing transportation conditions across the entire mobility ecosystem (network); and
5. Maintaining the ability to receive data inputs from multiple sources and provide responsive
strategies targeting an array of operational objectives.
U.S. Department of Transportation
Office of the Assistant Secretary for Research and Technology
Intelligent Transportation Systems Joint Program Office
12
CHAPTER 1: Introduction
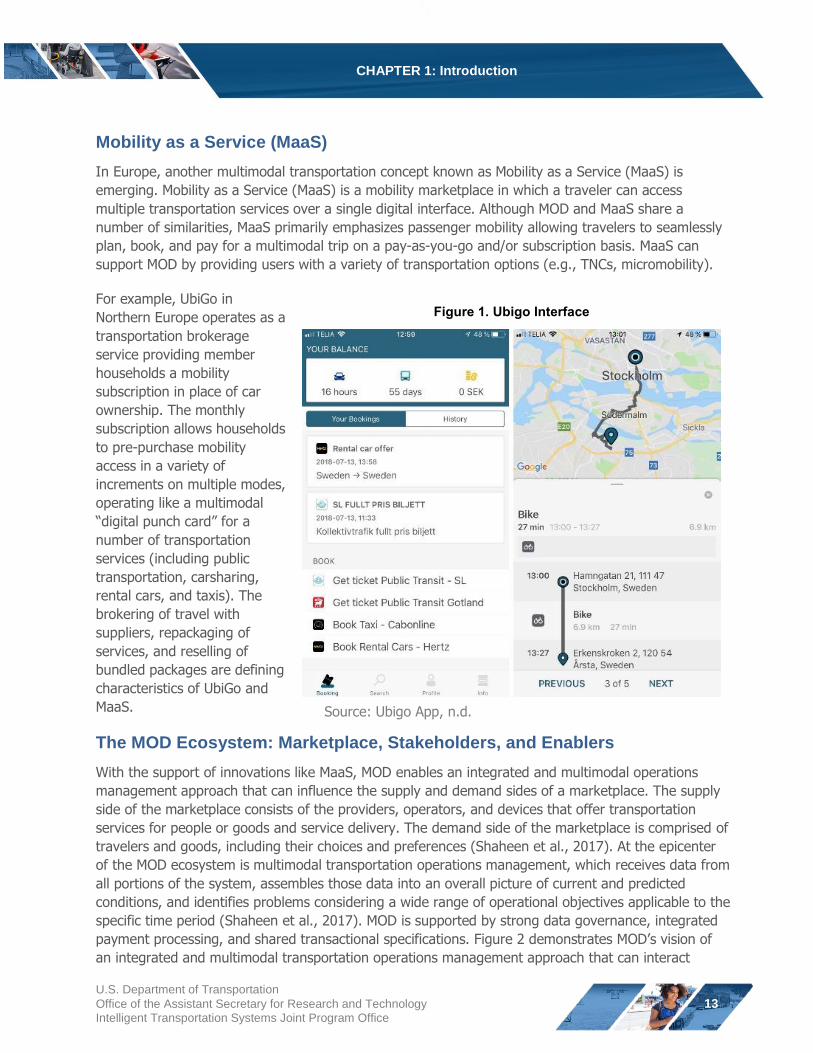
Mobility as a Service (MaaS)
In Europe, another multimodal transportation concept known as Mobility as a Service (MaaS) is
emerging. Mobility as a Service (MaaS) is a mobility marketplace in which a traveler can access
multiple transportation services over a single digital interface. Although MOD and MaaS share a
number of similarities, MaaS primarily emphasizes passenger mobility allowing travelers to seamlessly
plan, book, and pay for a multimodal trip on a pay-as-you-go and/or subscription basis. MaaS can
support MOD by providing users with a variety of transportation options (e.g., TNCs, micromobility).
For example, UbiGo in Figure 1. Ubigo Interface Northern Europe operates as a
transportation brokerage
service providing member
households a mobility
subscription in place of car
ownership. The monthly
subscription allows households
to pre-purchase mobility
access in a variety of
increments on multiple modes,
operating like a multimodal
“digital punch card” for a number of transportation
services (including public
transportation, carsharing,
rental cars, and taxis). The
brokering of travel with
suppliers, repackaging of
services, and reselling of
bundled packages are defining
characteristics of UbiGo and
MaaS.
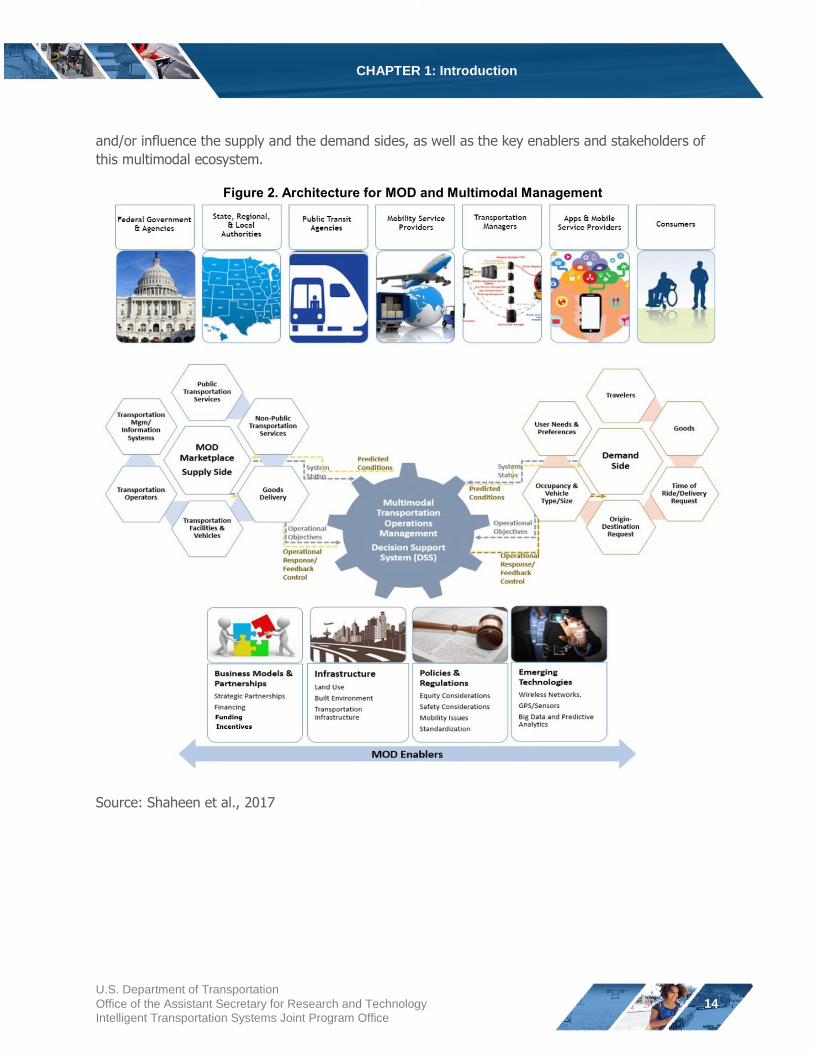
The MOD Ecosystem: Marketplace, Stakeholders, and Enablers
With the support of innovations like MaaS, MOD enables an integrated and multimodal operations
management approach that can influence the supply and demand sides of a marketplace. The supply
side of the marketplace consists of the providers, operators, and devices that offer transportation
services for people or goods and service delivery. The demand side of the marketplace is comprised of
travelers and goods, including their choices and preferences (Shaheen et al., 2017). At the epicenter
of the MOD ecosystem is multimodal transportation operations management, which receives data from
all portions of the system, assembles those data into an overall picture of current and predicted
conditions, and identifies problems considering a wide range of operational objectives applicable to the
specific time period (Shaheen et al., 2017). MOD is supported by strong data governance, integrated
payment processing, and shared transactional specifications. Figure 2 demonstrates MOD’s vision of an integrated and multimodal transportation operations management approach that can interact
Source: Ubigo App, n.d.
U.S. Department of Transportation
Office of the Assistant Secretary for Research and Technology
Intelligent Transportation Systems Joint Program Office
13
CHAPTER 1: Introduction
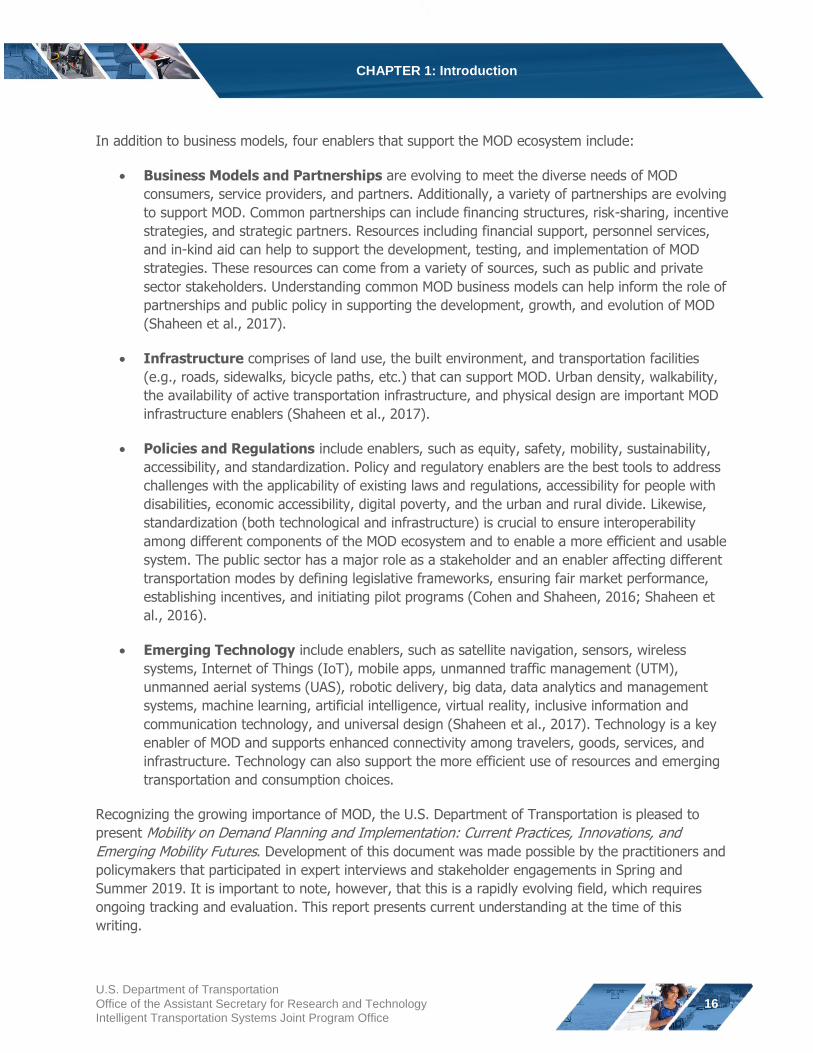
and/or influence the supply and the demand sides, as well as the key enablers and stakeholders of
this multimodal ecosystem.
Figure 2. Architecture for MOD and Multimodal Management
Source: Shaheen et al., 2017
U.S. Department of Transportation
Office of the Assistant Secretary for Research and Technology
Intelligent Transportation Systems Joint Program Office
14
CHAPTER 1: Introduction
The Multimodal Transportation Operations Management Decision Support System (MTOM DSS)
provides an architecture for the multimodal mobility ecosystem, which includes transportation
operators as a system element. Mobility providers are included within this element and have a role
within the supply side of the ecosystem. Major elements of the MTOM DSS are:
• The multimodal transportation ecosystem—the transportation systems, facilities, services and
associated stakeholders that serve mobility needs;
• The data and information that the mobility ecosystem feeds into the MTOM DSS; and
• The DSS that combines real-time, historic, and predicted system condition information;
analyzes alternative response strategies to address current or predicted problems; analyzes
the tradeoffs associated with strategies that support a number of operational objectives that
vary dynamically; and produces recommended strategies for implementation by system
operators.
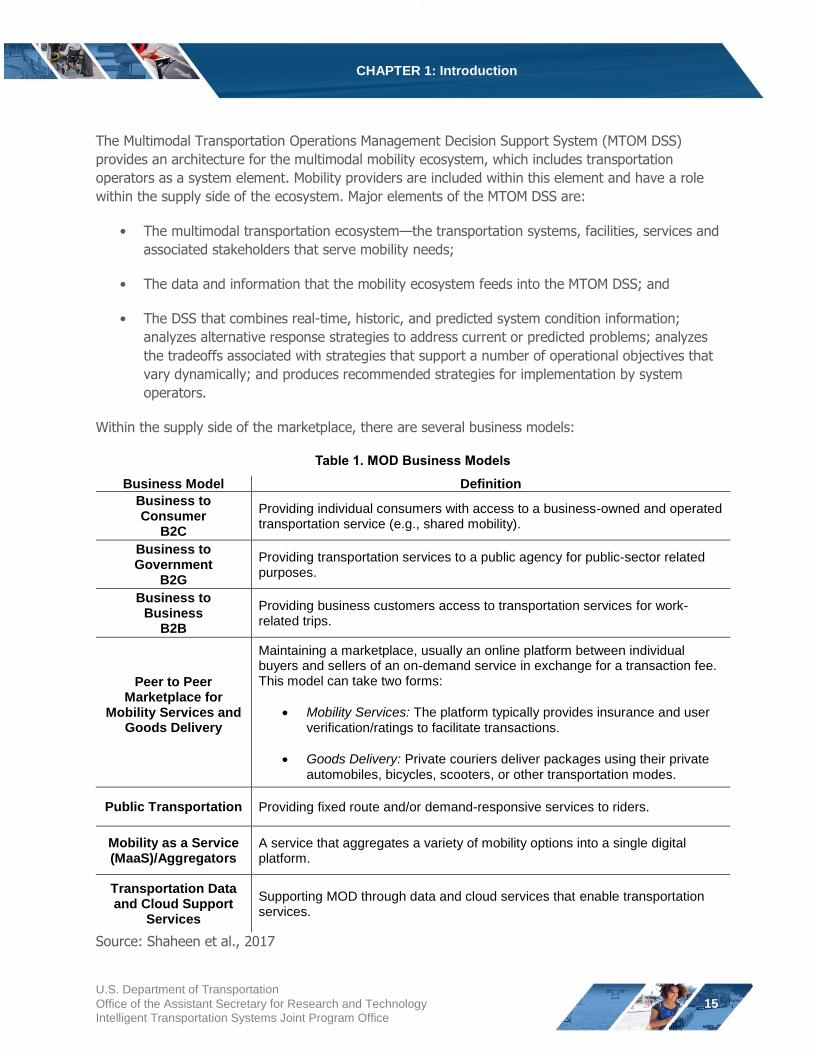
Within the supply side of the marketplace, there are several business models:
Table 1. MOD Business Models
Business Model Definition
Business to Consumer
B2C
Providing individual consumers with access to a business-owned and operated transportation service (e.g., shared mobility).
Business to Government
B2G
Providing transportation services to a public agency for public-sector related purposes.
Business to Business
B2B
Providing business customers access to transportation services for work-related trips.
Peer to Peer Marketplace for
Mobility Services and Goods Delivery
Maintaining a marketplace, usually an online platform between individual buyers and sellers of an on-demand service in exchange for a transaction fee. This model can take two forms:
Mobility Services: The platform typically provides insurance and user verification/ratings to facilitate transactions.
Goods Delivery: Private couriers deliver packages using their private automobiles, bicycles, scooters, or other transportation modes.
Public Transportation Providing fixed route and/or demand-responsive services to riders.
Mobility as a Service (MaaS)/Aggregators
A service that aggregates a variety of mobility options into a single digital platform.
Transportation Data and Cloud Support
Services
Supporting MOD through data and cloud services that enable transportation services.
Source: Shaheen et al., 2017
U.S. Department of Transportation
Office of the Assistant Secretary for Research and Technology
Intelligent Transportation Systems Joint Program Office
15
CHAPTER 1: Introduction
In addition to business models, four enablers that support the MOD ecosystem include:
Business Models and Partnerships are evolving to meet the diverse needs of MOD
consumers, service providers, and partners. Additionally, a variety of partnerships are evolving
to support MOD. Common partnerships can include financing structures, risk-sharing, incentive
strategies, and strategic partners. Resources including financial support, personnel services,
and in-kind aid can help to support the development, testing, and implementation of MOD
strategies. These resources can come from a variety of sources, such as public and private
sector stakeholders. Understanding common MOD business models can help inform the role of
partnerships and public policy in supporting the development, growth, and evolution of MOD
(Shaheen et al., 2017).
Infrastructure comprises of land use, the built environment, and transportation facilities
(e.g., roads, sidewalks, bicycle paths, etc.) that can support MOD. Urban density, walkability,
the availability of active transportation infrastructure, and physical design are important MOD
infrastructure enablers (Shaheen et al., 2017).
Policies and Regulations include enablers, such as equity, safety, mobility, sustainability,
accessibility, and standardization. Policy and regulatory enablers are the best tools to address
challenges with the applicability of existing laws and regulations, accessibility for people with
disabilities, economic accessibility, digital poverty, and the urban and rural divide. Likewise,
standardization (both technological and infrastructure) is crucial to ensure interoperability
among different components of the MOD ecosystem and to enable a more efficient and usable
system. The public sector has a major role as a stakeholder and an enabler affecting different
transportation modes by defining legislative frameworks, ensuring fair market performance,
establishing incentives, and initiating pilot programs (Cohen and Shaheen, 2016; Shaheen et
al., 2016).
Emerging Technology include enablers, such as satellite navigation, sensors, wireless
systems, Internet of Things (IoT), mobile apps, unmanned traffic management (UTM),
unmanned aerial systems (UAS), robotic delivery, big data, data analytics and management
systems, machine learning, artificial intelligence, virtual reality, inclusive information and
communication technology, and universal design (Shaheen et al., 2017). Technology is a key
enabler of MOD and supports enhanced connectivity among travelers, goods, services, and
infrastructure. Technology can also support the more efficient use of resources and emerging
transportation and consumption choices.
Recognizing the growing importance of MOD, the U.S. Department of Transportation is pleased to
present Mobility on Demand Planning and Implementation: Current Practices, Innovations, and
Emerging Mobility Futures. Development of this document was made possible by the practitioners and
policymakers that participated in expert interviews and stakeholder engagements in Spring and
Summer 2019. It is important to note, however, that this is a rapidly evolving field, which requires
ongoing tracking and evaluation. This report presents current understanding at the time of this
writing.
U.S. Department of Transportation
Office of the Assistant Secretary for Research and Technology
Intelligent Transportation Systems Joint Program Office
16
CHAPTER 1: Introduction
How to Use this Document
This document was developed using a multi-method approach, including a review of current literature
and studies; experts representing the public and private sectors, academia, and non-governmental
organizations; and webinars with thought leaders. Collectively, this information was used to develop
this document.
The purpose of this document is to serve as a practical resource that helps inform pilots,
demonstrations, integration, research, and policies for MOD. Due to a variety of stakeholders that
influence and are impacted by MOD, this report provides information and noteworthy practices for the
public and private sectors, as well as other stakeholders interested in planning and implementing
MOD. This document contains:
Practices for planning MOD across different spatial and temporal scales;
Practices for implementing MOD;
Case studies and lessons learned for incorporating MOD into the planning process;
Considerations to help public agencies advance MOD in their communities; and
Resources and recommended reading.
The following are some suggestions for how different readers can use this document:
Federal Agencies: Use the provided information to support nationwide implementation of
MOD.
State Agencies: Use the practices and strategies presented in this document to inform
statewide transportation plans and strategies.
Regional Agencies: Understand the potential benefits of MOD and ways MOD can be
incorporated into regional transportation planning and modeling.
Local Agencies: Learn current MOD strategies and implement them in communities.
Elected Officials and Policymakers: Reference this document to aid public policy
development.
Private Sector: Use this document to inform best practices for operations and the
development of shared mobility strategies, such as partnerships and business models.
Non-governmental Organizations: Access information about current practices and
emerging lessons learned for shared mobility planning and implementation.
Academia and Researchers: Use this document to gain an understanding about the current
state of MOD and identify potential areas of research.
U.S. Department of Transportation
Office of the Assistant Secretary for Research and Technology
Intelligent Transportation Systems Joint Program Office
17
CHAPTER 1: Introduction
Mobility on Demand Planning and Implementation Overview
Mobility on Demand Planning and Implementation provides an overview of current practices and
emerging innovations. This report is organized into eight chapters:
Chapter 1: Introduction. This chapter introduces the concept of MOD, including definitions,
key concepts, and examples of how to use this document.
Chapter 2: MOD Stakeholders and Partnerships. This chapter discusses different
stakeholders in the MOD ecosystem and the role of partnerships in filling spatial, temporal,
and other service gaps.
Chapter 3: Integrating MOD into Transportation Planning, Modeling, and
Operations. This chapter presents examples of how MOD is being integrated into
transportation planning and modeling. This chapter also discusses ways that transportation
system management and operations (TSMO) strategies can be used to more effectively
integrate MOD.
Chapter 4: Shared Mobility Implementation and Community Integration. This
chapter discusses how shared mobility can be implemented in a variety of built environments
and methods for implementation, such as the allocation of rights-of-way, incentive zoning, and
multimodal integration.
Chapter 5: MOD Implementation Considerations. This chapter describes different
considerations of MOD implementation including potential impacts on data sharing and
management, on the labor force, and on equity in the transportation network.
Chapter 6: Innovative and Emerging Mobility Futures. This chapter summarizes
technology developments that have the potential to disrupt the transportation ecosystem, such
as shared automated vehicles, urban air mobility, and last-mile delivery innovations.
Chapter 7: Conclusion. This chapter summarizes key findings from this report.
Chapter 8: Recommended Reading and Resources. This chapter offers recommended
reading and additional information on MOD topics discussed in this document.
U.S. Department of Transportation
Office of the Assistant Secretary for Research and Technology
Intelligent Transportation Systems Joint Program Office
18
CHAPTER 2: MOD Stakeholders and Partnerships
CHAPTER 2: MOD Stakeholders and Partnerships
The supply side of the MOD ecosystem is enabled by a variety of stakeholders and partnerships.
Innovative and emerging transportation services can present a wide variety of policy, financial, and
communication challenges, among others. Strategic partnerships can help stakeholders confront these
challenges and aid the growth and mainstreaming of MOD. Public-private partnerships can include an
array of assistance ranging from financial and marketing support to providing rights-of-way and
integrating shared mobility into planning processes, local ordinances, and public transit. Public-private
partnerships can also provide support in the establishment of standards, data sharing, inclusion of
MOD into public policy, and risk sharing. This chapter discusses MOD stakeholders, potential
opportunities and challenges, and the role of public-private partnerships in supporting MOD.
MOD Stakeholders
A number of public and private sector stakeholders are involved in, influenced by, or affected by MOD.
These stakeholders can have a variety of similar and differing roles, such as:
Establishing strategies, policies, and regulations for transportation and MOD;
Managing multimodal transportation networks;
Providing or linking to public transportation;
Commodifying passenger mobility and goods delivery;
Offering on-demand access to mobility and goods delivery strategies for users;
Increasing accessibility and goods availability through partnerships and use cases; and
Disseminating real-time information and facilitating trip planning, payment, and data access.
Common MOD stakeholders include:
Federal Government: Many branches of the government can influence MOD, including the
United States Department of Transportation (USDOT), Department of Energy (DOE),
Department of Labor (DOL), Department of Commerce (DOC), and Department of Defense
(DOD), among others. These organizations, albeit from different angles, can play a role in
establishing transportation strategies, policies, and regulations. They can also implement those
strategies, make investments in pilot programs and research, and provide guidance for
nationwide development of strategies:
o U.S. Access Board: This federal agency promotes equality for people with disabilities
through accessible design. The board helps develop accessibility guidelines and
standards for the built environment, communication, information technology, medical
diagnostic equipment, and transportation.
U.S. Department of Transportation
Office of the Assistant Secretary for Research and Technology
Intelligent Transportation Systems Joint Program Office
19
CHAPTER 2: MOD Stakeholders and Partnerships
o U.S. Department of Transportation (USDOT): The USDOT works to keep the
traveling public safe and secure, increase mobility, and have the U.S. transportation
system contribute to the nation’s economic growth and development. The USDOT
provides funding for investments in highways, roads, bridges, public transportation,
and other transportation services and infrastructure. In addition, the USDOT maintains
national standards for transportation system safety and oversees funding recipients
and transportation providers for safety and compliance.
Federal Highway Administration (FHWA): The FHWA offers financial and
technical assistance to state, regional, and local governments to support the
design, construction, and maintenance of the National Highway System. The
goal of the FHWA is to ensure that America’s highways, roads, and bridges are safe and technologically sound.
Federal Transit Administration (FTA): The FTA provides financial
assistance for the development of new transit systems and for improvements,
maintenance, and operations of existing systems. The FTA also monitors grants
and federally funded projects to ensure recipients adhere to mandated
procedures.
Intelligent Transportation Systems Joint Program Office (ITS JPO):
The goal of the ITS JPO is to create an intelligent transportation system
through the integration of intelligent vehicles and intelligent infrastructure. The
ITS JPO provides investments in major research initiatives, exploratory studies,
and deployment support programs.
State, Regional, and Local Authorities: These agencies implement policies and regulations
by administering programs and activities, such as issuing permits, managing public rights-of-
way, conducting local and regional transportation planning, and operating traffic management
centers (Barbour et al., 2019). These stakeholders also serve as mobility integrators who work
to combine various travel modes physically and digitally.
o State Departments of Transportation (DOTs): State DOTs provide funding to
plan, design, operate, and maintain roads and transportation systems. State DOTs also
coordinate with other State agencies (e.g., Departments of Motor Vehicles (DMVs),
State Departments of Insurance) that are responsible for the enforcement of safety
standards in transportation systems (U.S. Department of Transportation, 2016).
o Metropolitan Planning Organizations (MPOs): MPOs undertake regional
transportation planning activities for urbanized areas with populations over 50,000
people. MPOs are responsible for establishing regional priorities for federal
transportation funding by implementing a continuous, comprehensive, and cooperative
planning process among the state DOTs and local governments within the metropolitan
planning organization, public transit providers, local elected officials, the public, and
other stakeholder groups (Federal Transit Administration, 2019).
U.S. Department of Transportation
Office of the Assistant Secretary for Research and Technology
Intelligent Transportation Systems Joint Program Office
20
CHAPTER 2: MOD Stakeholders and Partnerships
o Rural Transportation Planning Organizations (RTPOs): RTPOs are
multijurisdictional organizations of nonmetropolitan (rural) area local officials and
transportation system operators that States may assemble to assist in the statewide
and nonmetropolitan transportation planning processes. RTPOs emphasize rural areas
of the State. An RTPO may have additional representatives from the State, private
businesses, transportation service providers, economic development practitioners, and
the public (Federal Highway Administration and Federal Transit Administration, n.d.).
o Public Transportation Agencies: Public transportation agencies operate and
maintain public transit services to the general public in urban, suburban, and rural
areas, including fixed-route transit, demand responsive transportation, and paratransit
services. Some of the services include buses, trolleys, subways, light rail, commuter
rail, and passenger ferries.
o Transportation/Traffic Managers: These include transportation management
centers that monitor network operations and, as necessary, respond to needs and
allocate resources.
Mobility Service Providers: These include bikesharing, car rentals, carsharing, TNCs,
microtransit, scooter sharing, taxis, paratransit, and other service providers.
Supply Chain Managers: These include logistics management and food, medical, and goods
delivery providers who manage and run the flow of goods and materials from origin to
destination, in addition to handling inventory, warehousing, packaging, security, and
dispatching functions.
Apps and Mobile Service Providers: These are third-party information and
communications technologies (ICT) services and providers enabling on-demand service, mobile
ticketing, payment, and navigation services.
Consumers: These are the users of MOD who create demand for mobility, delivery, and
digital services.
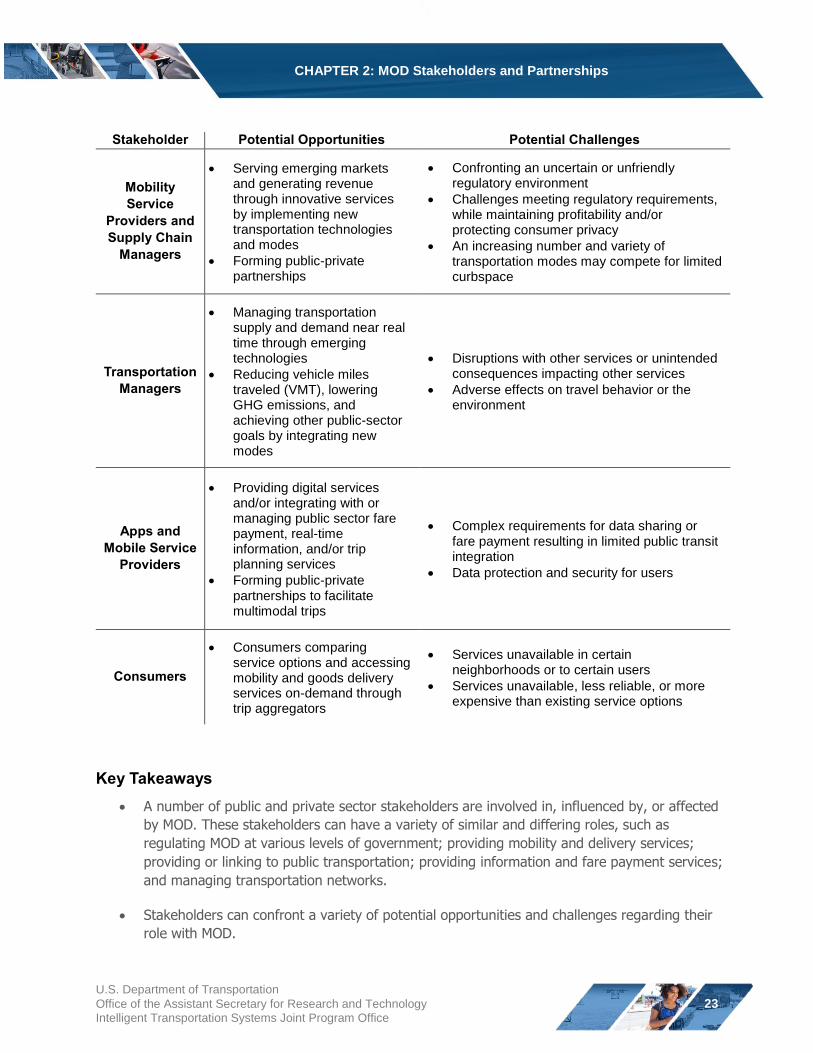
The benefits, opportunities, and challenges of MOD can vary by stakeholder. Table 2 provides
examples of the diverse opportunities and challenges that can confront the range of MOD
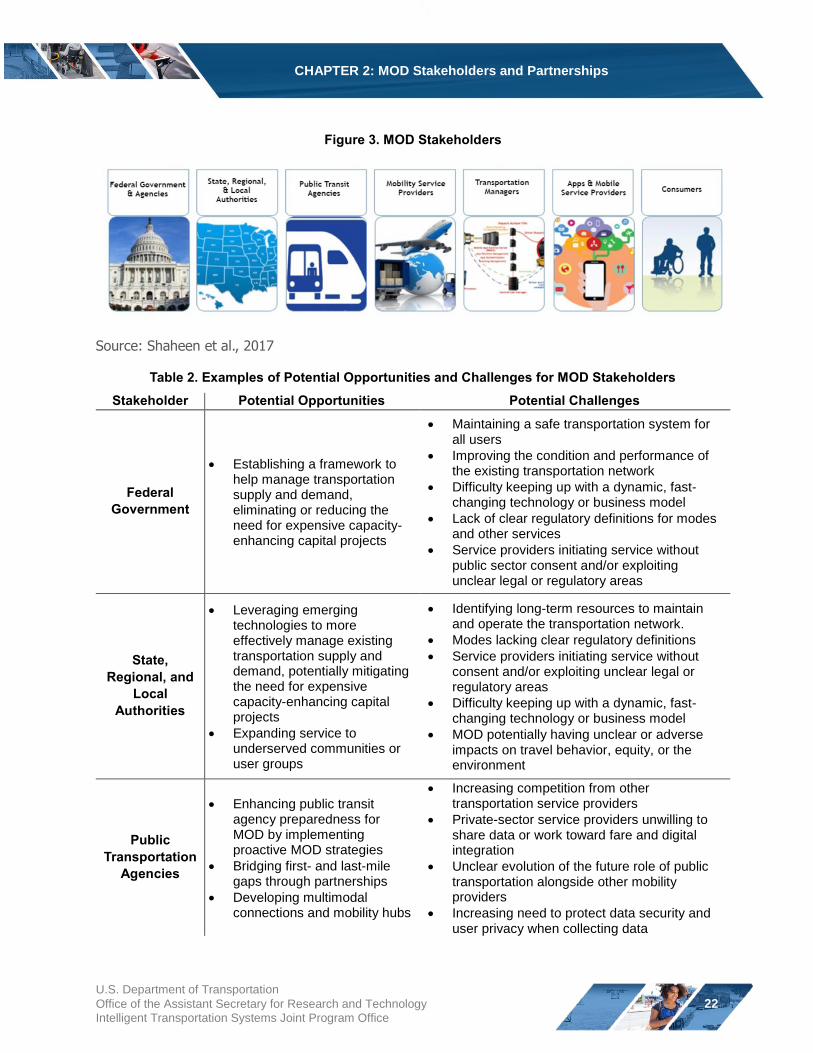
stakeholders. Figure 3 illustrates MOD stakeholders from public sector stakeholders on the left, service
providers in the middle, and MOD consumers on the right.
U.S. Department of Transportation
Office of the Assistant Secretary for Research and Technology
Intelligent Transportation Systems Joint Program Office
21
CHAPTER 2: MOD Stakeholders and Partnerships
Figure 3. MOD Stakeholders
Source: Shaheen et al., 2017
Table 2. Examples of Potential Opportunities and Challenges for MOD Stakeholders
Stakeholder Potential Opportunities Potential Challenges
Federal Government
Establishing a framework to help manage transportation supply and demand, eliminating or reducing the need for expensive capacity-enhancing capital projects
Maintaining a safe transportation system for all users
Improving the condition and performance of the existing transportation network
Difficulty keeping up with a dynamic, fast-changing technology or business model
Lack of clear regulatory definitions for modes and other services
Service providers initiating service without public sector consent and/or exploiting unclear legal or regulatory areas
State,
Regional, and Local
Authorities
Leveraging emerging technologies to more effectively manage existing transportation supply and demand, potentially mitigating the need for expensive capacity-enhancing capital projects
Expanding service to underserved communities or user groups
Identifying long-term resources to maintain and operate the transportation network.
Modes lacking clear regulatory definitions
Service providers initiating service without consent and/or exploiting unclear legal or regulatory areas
Difficulty keeping up with a dynamic, fast-changing technology or business model
MOD potentially having unclear or adverse impacts on travel behavior, equity, or the environment
Public Transportation
Agencies
Enhancing public transit agency preparedness for MOD by implementing proactive MOD strategies
Bridging first- and last-mile gaps through partnerships
Developing multimodal connections and mobility hubs
Increasing competition from other transportation service providers
Private-sector service providers unwilling to share data or work toward fare and digital integration
Unclear evolution of the future role of public transportation alongside other mobility providers
Increasing need to protect data security and user privacy when collecting data
U.S. Department of Transportation
Office of the Assistant Secretary for Research and Technology
Intelligent Transportation Systems Joint Program Office
22
CHAPTER 2: MOD Stakeholders and Partnerships
Stakeholder Potential Opportunities Potential Challenges
Mobility Service
Providers and Supply Chain
Managers
Serving emerging markets and generating revenue through innovative services by implementing new transportation technologies and modes
Forming public-private partnerships
Confronting an uncertain or unfriendly regulatory environment
Challenges meeting regulatory requirements, while maintaining profitability and/or protecting consumer privacy
An increasing number and variety of transportation modes may compete for limited curbspace
Transportation Managers
Managing transportation supply and demand near real time through emerging technologies
Reducing vehicle miles traveled (VMT), lowering GHG emissions, and achieving other public-sector goals by integrating new modes
Disruptions with other services or unintended consequences impacting other services
Adverse effects on travel behavior or the environment
Apps and Mobile Service
Providers
Providing digital services and/or integrating with or managing public sector fare payment, real-time information, and/or trip planning services
Forming public-private partnerships to facilitate multimodal trips
Complex requirements for data sharing or fare payment resulting in limited public transit integration
Data protection and security for users
Consumers
Consumers comparing service options and accessing mobility and goods delivery services on-demand through trip aggregators
Services unavailable in certain neighborhoods or to certain users
Services unavailable, less reliable, or more expensive than existing service options
Key Takeaways
A number of public and private sector stakeholders are involved in, influenced by, or affected
by MOD. These stakeholders can have a variety of similar and differing roles, such as
regulating MOD at various levels of government; providing mobility and delivery services;
providing or linking to public transportation; providing information and fare payment services;
and managing transportation networks.
Stakeholders can confront a variety of potential opportunities and challenges regarding their
role with MOD.
U.S. Department of Transportation
Office of the Assistant Secretary for Research and Technology
Intelligent Transportation Systems Joint Program Office
23
CHAPTER 2: MOD Stakeholders and Partnerships
The Role of Public-Private Partnerships
Public agencies may partner with mobility service providers to enhance the public sector’s role in transportation planning, public transportation, and rights-of-way management. Public-private
partnerships can play a key role in addressing several policy challenges that could enhance the
potential benefits of MOD (Shaheen et al., 2016). A few common public-private partnerships include:
Data Sharing: Sharing data among mobility service providers, institutions, and public
agencies can increase the understanding of MOD’s impacts on travel behavior, equity, and the
environment and benefit all parties. For example, Google maps has partnered with DOTs to
provide information on travel speed in return for information on road closures (Sada Systems,
2018). Additionally, the California Transit Association has developed standards to improve data
sharing between agencies and service providers. These standards require data to be shared in
an accessible, secure, and interoperable way and can be used for managing local streets,
curbspace, and travel.
First- and Last-Mile Connections: Travelers may have difficulty getting to or from public
transportation (commonly referred to as the first- and last-mile challenge). Public transit
agencies are engaging in a variety of partnerships with mobility service providers to bridge
these spatial gaps and increase access to public transportation. For example, Florida’s Pinellas Suncoast Transit Authority (PSTA) subsidizes on-demand rides that begin or end at a transit
station.
Integration with Third-Party Apps: Public agencies can incorporate traveler information
into digital platforms (e.g., websites, apps) to provide travelers with integrated trip planning
and fare payment. For example, Denver’s Regional Transportation District (RTD) has partnered with Uber Transit to provide information on RTD routes and RTD tickets on the Uber app.
Low-density Service: Lower-density built environments may have less frequent transit
service and lower transit ridership that increases the cost of providing public transportation
service. Lower ridership and higher operational costs can contribute to lower levels of service
for consumers (e.g., longer wait times and fewer routes). To help overcome this challenge,
some public agencies are partnering with mobility service providers to offer gap filling services
in lower density communities. For example, the Livermore Amador Valley Transit Authority’s GoDublin! program subsidizes shared, on-demand rides within the suburban community of
Dublin, California.
U.S. Department of Transportation
Office of the Assistant Secretary for Research and Technology
Intelligent Transportation Systems Joint Program Office
24
CHAPTER 2: MOD Stakeholders and Partnerships
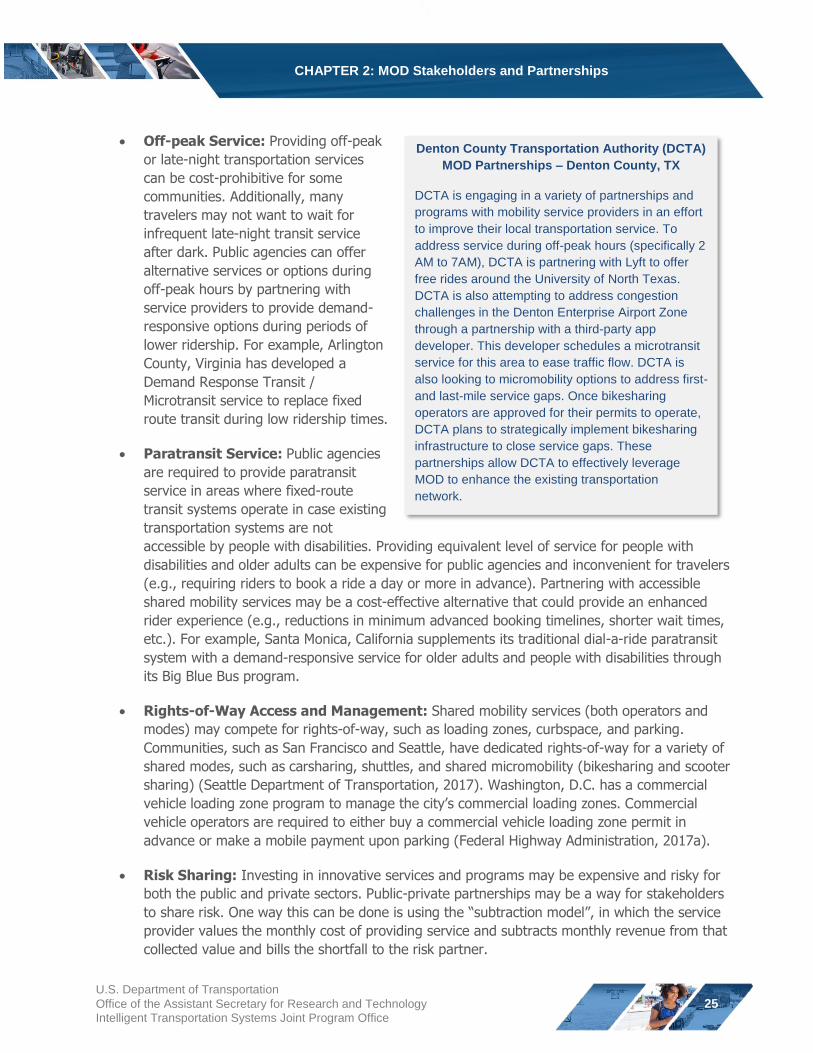
Off-peak Service: Providing off-peak
or late-night transportation services
can be cost-prohibitive for some
communities. Additionally, many
travelers may not want to wait for
infrequent late-night transit service
after dark. Public agencies can offer
alternative services or options during
off-peak hours by partnering with
service providers to provide demand-
responsive options during periods of
lower ridership. For example, Arlington
County, Virginia has developed a
Demand Response Transit /
Microtransit service to replace fixed
route transit during low ridership times.
Paratransit Service: Public agencies
are required to provide paratransit
service in areas where fixed-route
transit systems operate in case existing
transportation systems are not
Denton County Transportation Authority (DCTA)
MOD Partnerships – Denton County, TX
DCTA is engaging in a variety of partnerships and
programs with mobility service providers in an effort
to improve their local transportation service. To
address service during off-peak hours (specifically 2
AM to 7AM), DCTA is partnering with Lyft to offer
free rides around the University of North Texas.
DCTA is also attempting to address congestion
challenges in the Denton Enterprise Airport Zone
through a partnership with a third-party app
developer. This developer schedules a microtransit
service for this area to ease traffic flow. DCTA is
also looking to micromobility options to address first-
and last-mile service gaps. Once bikesharing
operators are approved for their permits to operate,
DCTA plans to strategically implement bikesharing
infrastructure to close service gaps. These
partnerships allow DCTA to effectively leverage
MOD to enhance the existing transportation
network.
accessible by people with disabilities. Providing equivalent level of service for people with
disabilities and older adults can be expensive for public agencies and inconvenient for travelers
(e.g., requiring riders to book a ride a day or more in advance). Partnering with accessible
shared mobility services may be a cost-effective alternative that could provide an enhanced
rider experience (e.g., reductions in minimum advanced booking timelines, shorter wait times,
etc.). For example, Santa Monica, California supplements its traditional dial-a-ride paratransit
system with a demand-responsive service for older adults and people with disabilities through
its Big Blue Bus program.
Rights-of-Way Access and Management: Shared mobility services (both operators and
modes) may compete for rights-of-way, such as loading zones, curbspace, and parking.
Communities, such as San Francisco and Seattle, have dedicated rights-of-way for a variety of
shared modes, such as carsharing, shuttles, and shared micromobility (bikesharing and scooter
sharing) (Seattle Department of Transportation, 2017). Washington, D.C. has a commercial
vehicle loading zone program to manage the city’s commercial loading zones. Commercial
vehicle operators are required to either buy a commercial vehicle loading zone permit in
advance or make a mobile payment upon parking (Federal Highway Administration, 2017a).
Risk Sharing: Investing in innovative services and programs may be expensive and risky for
both the public and private sectors. Public-private partnerships may be a way for stakeholders
to share risk. One way this can be done is using the “subtraction model”, in which the service
provider values the monthly cost of providing service and subtracts monthly revenue from that
collected value and bills the shortfall to the risk partner.
U.S. Department of Transportation
Office of the Assistant Secretary for Research and Technology
Intelligent Transportation Systems Joint Program Office
25
CHAPTER 2: MOD Stakeholders and Partnerships
MOD stakeholders are engaging in a variety of public-private partnerships and certain stakeholders,
like public transit agencies, have started undergoing organizational readiness changes to better
accommodate these partnerships.
Los Angeles Metro Office of Extraordinary Innovations – Los Angeles, CA
The Los Angeles Metro Office of Extraordinary Innovation (OEI) was established to help identify, evaluate,
develop, and implement new approaches to transportation innovation and mobility. To carry out this work,
OEI has three program areas:
Strategic Planning – Metro Vision 2028: This is LA Metro’s plan to improve mobility in Los Angeles County and explains what the public can expect from the agency over the next 10 years. This plan
includes adding more transportation options in Los Angeles, improving transportation service quality,
and working collaboratively to enhance accessibility and mobility.
Unsolicited Proposals Program: This program allows private sector companies working on
transportation innovations to present new ideas directly to the agency for review and evaluation, jump-
starting the traditional public procurement process. Proposals could lead to a demonstration, a pilot
project, or in the most successful cases, full deployment across the agency’s system. Partnership
models could include finance-based Public-Private Partnerships (P3s) for innovative delivery of major
capital investments, or new partnership models that allow the agency to leverage private sector
innovation to enhance project outcomes. For example, one project that is currently being considered
from an unsolicited proposal is an aerial tram connecting LA Metro’s Union Station to Dodger Stadium.
New Mobility Program: This program leverages pilot projects to test new service delivery methods
that include greater private sector involvement, more focus on customer experience, and improved
mobility and access. For example, LA Metro is currently working on developing a transit corridor in the
eastern portion of the San Fernando Valley. This transit corridor will extend the current light rail system,
add additional public transit stops, and adapt streets to prioritize active and public transportation.
These programs allow LA Metro to quickly explore emerging ideas and technologies and develop plans to
implement new innovations. In November 2019 Metro hosted CoMotion LA, a global conference on urban
mobility trends, to highlight emerging technologies and policies for a more connected, innovative, and
sustainable future.
Key Takeaways
MOD stakeholders can engage in a variety of partnerships to provide new, and enhance
existing, transportation services.
Federal, state, and local transportation agencies are responsible for the funding, operations,
maintenance, and safety of the national transportation system and can help prepare
infrastructure for MOD.
Public agencies may be able to leverage public-private partnerships to address a variety of
challenges, such as bridging service gaps, improving paratransit, and sharing data.
U.S. Department of Transportation
Office of the Assistant Secretary for Research and Technology
Intelligent Transportation Systems Joint Program Office
26
CHAPTER 3: Integrating MOD into Transportation Planning, Modeling and Operations
CHAPTER 3: Integrating MOD into Transportation Planning, Modeling, and Operations
Public agencies and stakeholders can plan for and model the potential impacts of MOD on the
transportation network (McCoy et al., 2018). The U.S. Code and Code of Federal regulations (CFR)
require MPOs, RTPOs, and state DOTs to continuously carry out cooperative, comprehensive
transportation planning processes. These planning processes facilitate the safe and efficient
management, operation, and development of multimodal transportation systems and facilities that
serve mobility and freight needs (CIVITAS, 2015). Public agencies can access federal transportation
funding for capital improvements, non-capital improvements, planning, and research through their
respective MPO and/or state DOT transportation planning processes (Federal Transit Administration,
2019b). Working with MPOs and state DOTs can also assist public agencies in:
Coordinating a shared vision for MOD and the associated goals, objectives, and strategies for
implementation;
Identifying customer needs and concerns through public involvement, stakeholder outreach,
and demographic analysis;
Evaluating regional impacts of transportation decisions through data collection, modeling,
analysis, and scenarios;
Maximizing agency resources (e.g., funding, staff time, data) and avoiding unnecessary
duplication and redundancy;
Managing transportation assets in a state of good repair (e.g., sidewalks, pavements, bridges,
traffic signals, signage, transit vehicles and facilities); and
Facilitating a seamless, efficient, and high-performing multimodal transportation system
regarding safety, accessibility, reliability, congestion, equity, and sustainability.
In addition to planning and modeling the impacts of MOD, transportation network managers and
systems operators can leverage MOD for TSMO to aid in managing supply and demand.
MOD and the Planning Process
Planning processes allow public agencies to document the current state of transportation networks
and establish future goals for public policy and infrastructure investments. Transportation planning is
cooperative and performance-driven and involves stakeholders, such as MPOs, state agencies, transit
operators, local governments, and elected officials. Transportation planning allows these stakeholders
to use input from the public, businesses, community and environmental organizations, and freight
operators to develop short- and long-term priorities and goals. States, MPOs, local governments, and
public transit agencies often revise their transportation plans and programs to plan for and respond to
27
changing needs, risks, and priorities. Revisions to transportation plans and programs can allow for the
U.S. Department of Transportation
Office of the Assistant Secretary for Research and Technology
Intelligent Transportation Systems Joint Program Office
CHAPTER 3: Integrating MOD into Transportation Planning, Modeling and Operations
integration of innovations like MOD. Incorporating MOD in transportation planning can allow public
agencies to leverage the potential positive impacts of MOD, such as increased infrastructure efficiency,
and mitigate potential negative impacts, such as traffic congestion and air pollution.
Planning can be done by a variety of jurisdictions covering an array of time horizons. Table 3 describes
a variety of planning efforts that may be done by local governments, MPOs, and state DOTs. These
planning efforts include:
Long-Range Plans: These plans are used to identify transportation policies, strategies, and investments to address community needs and achieve goals, objectives, and performance targets. Long-range plans may have an individual chapter or subsection discussing MOD or incorporate considerations for MOD throughout the document.
Short-Range Improvement Programs: These programs allocate transportation funding for capital and non-capital investments, planning activities, and research. Short-range improvement programs may provide funding for projects that directly support MOD implementation (e.g., bikesharing stations, mobility hubs, demand response transit services) or indirectly support MOD implementation (e.g., sidewalk construction, pavement resurfacing, travel demand modeling, household travel survey).
Location-Based Plans: This type of plan evaluates existing and forecasted conditions in specific communities and corridors to address current and future transportation demand. Location-based plans may identify policies, strategies, and investments needed to support MOD.
Issue-Based Plans: These plans examine transportation modes, services, technologies, and other topics to inform future policies, strategies, and investments. Issued-based plans may focus on MOD entirely or incorporate considerations for MOD in other topics (e.g., transportation safety, freight, transit).
U.S. Department of Transportation
Office of the Assistant Secretary for Research and Technology
Intelligent Transportation Systems Joint Program Office
28
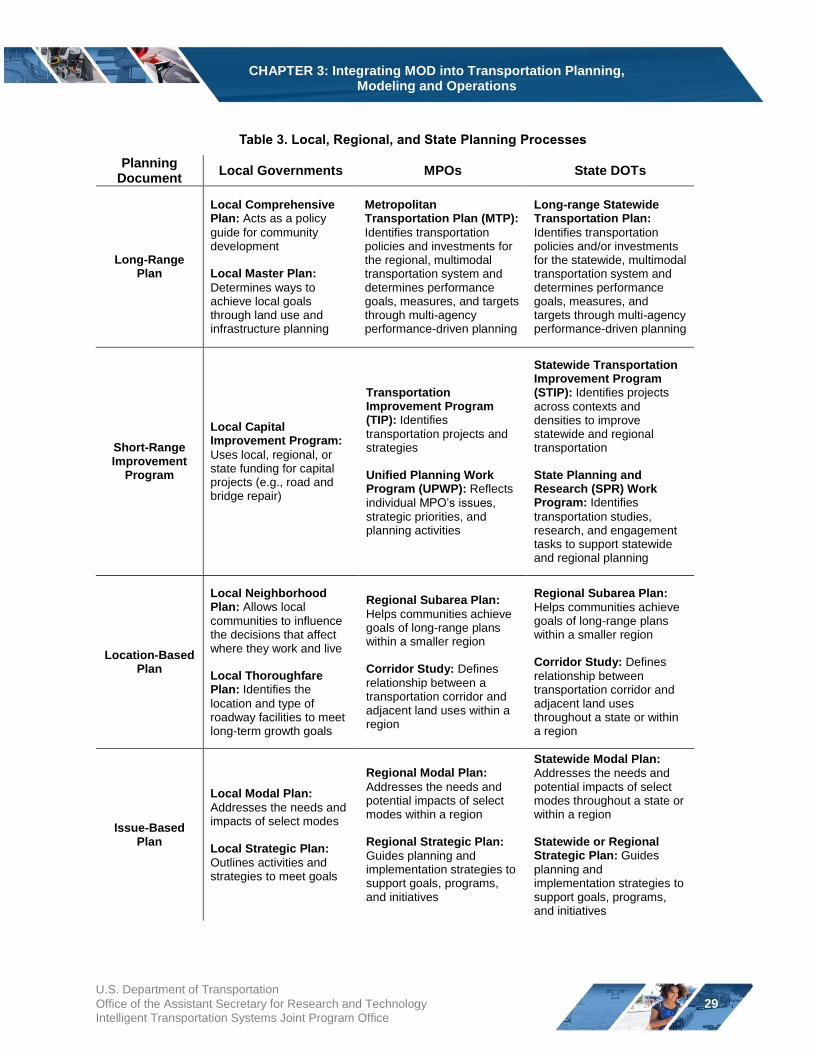
CHAPTER 3: Integrating MOD into Transportation Planning, Modeling and Operations
Table 3. Local, Regional, and State Planning Processes
Planning Document
Local Governments MPOs State DOTs
Long-Range Plan
Local Comprehensive Plan: Acts as a policy
guide for community development
Local Master Plan:
Determines ways to achieve local goals through land use and infrastructure planning
Metropolitan Transportation Plan (MTP):
Identifies transportation policies and investments for the regional, multimodal transportation system and determines performance goals, measures, and targets through multi-agency performance-driven planning
Long-range Statewide Transportation Plan:
Identifies transportation policies and/or investments for the statewide, multimodal transportation system and determines performance goals, measures, and targets through multi-agency performance-driven planning
Short-Range Improvement
Program
Local Capital Improvement Program:
Uses local, regional, or state funding for capital projects (e.g., road and bridge repair)
Transportation Improvement Program (TIP): Identifies
transportation projects and strategies
Unified Planning Work Program (UPWP): Reflects
individual MPO’s issues, strategic priorities, and planning activities
Statewide Transportation Improvement Program (STIP): Identifies projects
across contexts and densities to improve statewide and regional transportation
State Planning and Research (SPR) Work Program: Identifies
transportation studies, research, and engagement tasks to support statewide and regional planning
Location-Based Plan
Local Neighborhood Plan: Allows local
communities to influence the decisions that affect where they work and live
Local Thoroughfare Plan: Identifies the
location and type of roadway facilities to meet long-term growth goals
Regional Subarea Plan:
Helps communities achieve goals of long-range plans within a smaller region
Corridor Study: Defines
relationship between a transportation corridor and adjacent land uses within a region
Regional Subarea Plan:
Helps communities achieve goals of long-range plans within a smaller region
Corridor Study: Defines
relationship between transportation corridor and adjacent land uses throughout a state or within a region
Issue-Based
Local Modal Plan:
Addresses the needs and impacts of select modes
Regional Modal Plan:
Addresses the needs and potential impacts of select modes within a region
Statewide Modal Plan:
Addresses the needs and potential impacts of select modes throughout a state or within a region
Plan Local Strategic Plan:
Outlines activities and strategies to meet goals
Regional Strategic Plan:
Guides planning and implementation strategies to support goals, programs, and initiatives
Statewide or Regional Strategic Plan: Guides
planning and implementation strategies to support goals, programs, and initiatives
U.S. Department of Transportation
Office of the Assistant Secretary for Research and Technology
Intelligent Transportation Systems Joint Program Office
29
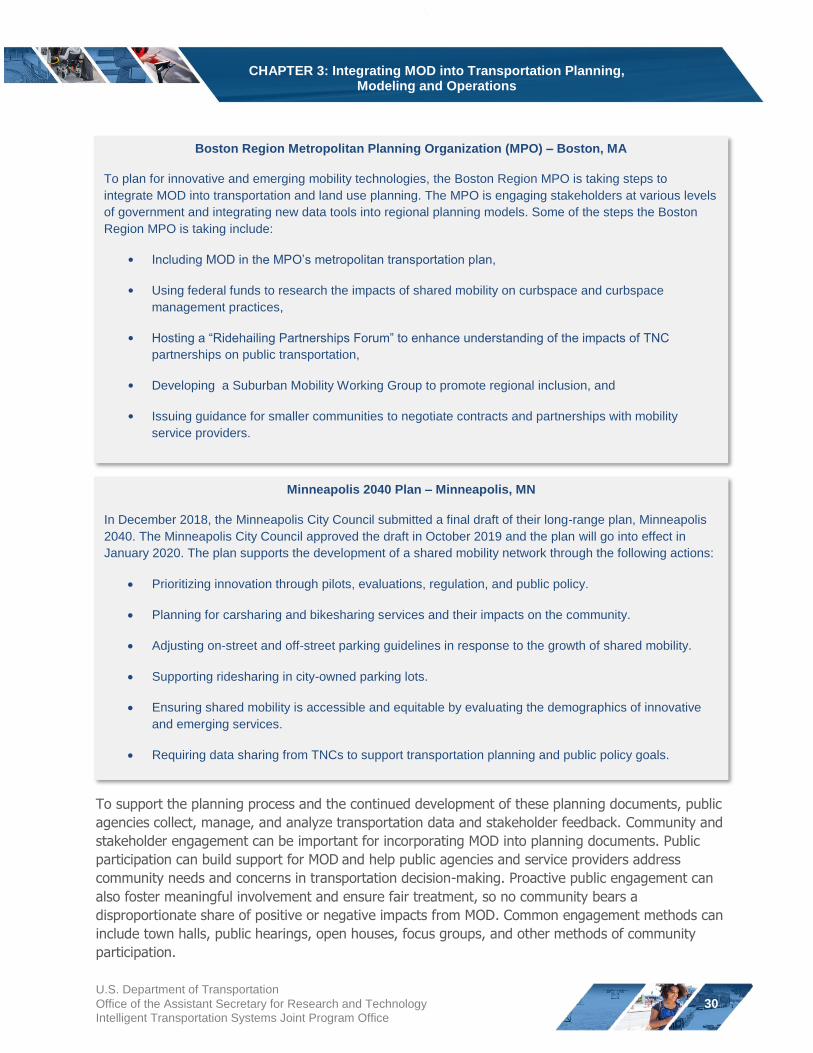
CHAPTER 3: Integrating MOD into Transportation Planning, Modeling and Operations
Boston Region Metropolitan Planning Organization (MPO) – Boston, MA
To plan for innovative and emerging mobility technologies, the Boston Region MPO is taking steps to
integrate MOD into transportation and land use planning. The MPO is engaging stakeholders at various levels
of government and integrating new data tools into regional planning models. Some of the steps the Boston
Region MPO is taking include:
• Including MOD in the MPO’s metropolitan transportation plan,
• Using federal funds to research the impacts of shared mobility on curbspace and curbspace
management practices,
• Hosting a “Ridehailing Partnerships Forum” to enhance understanding of the impacts of TNC
partnerships on public transportation,
• Developing a Suburban Mobility Working Group to promote regional inclusion, and
• Issuing guidance for smaller communities to negotiate contracts and partnerships with mobility
service providers.
Minneapolis 2040 Plan – Minneapolis, MN
In December 2018, the Minneapolis City Council submitted a final draft of their long-range plan, Minneapolis
2040. The Minneapolis City Council approved the draft in October 2019 and the plan will go into effect in
January 2020. The plan supports the development of a shared mobility network through the following actions:
Prioritizing innovation through pilots, evaluations, regulation, and public policy.
Planning for carsharing and bikesharing services and their impacts on the community.
Adjusting on-street and off-street parking guidelines in response to the growth of shared mobility.
Supporting ridesharing in city-owned parking lots.
Ensuring shared mobility is accessible and equitable by evaluating the demographics of innovative
and emerging services.
Requiring data sharing from TNCs to support transportation planning and public policy goals.
To support the planning process and the continued development of these planning documents, public
agencies collect, manage, and analyze transportation data and stakeholder feedback. Community and
stakeholder engagement can be important for incorporating MOD into planning documents. Public
participation can build support for MOD and help public agencies and service providers address
community needs and concerns in transportation decision-making. Proactive public engagement can
also foster meaningful involvement and ensure fair treatment, so no community bears a
disproportionate share of positive or negative impacts from MOD. Common engagement methods can
include town halls, public hearings, open houses, focus groups, and other methods of community
participation.
U.S. Department of Transportation
Office of the Assistant Secretary for Research and Technology
Intelligent Transportation Systems Joint Program Office
30
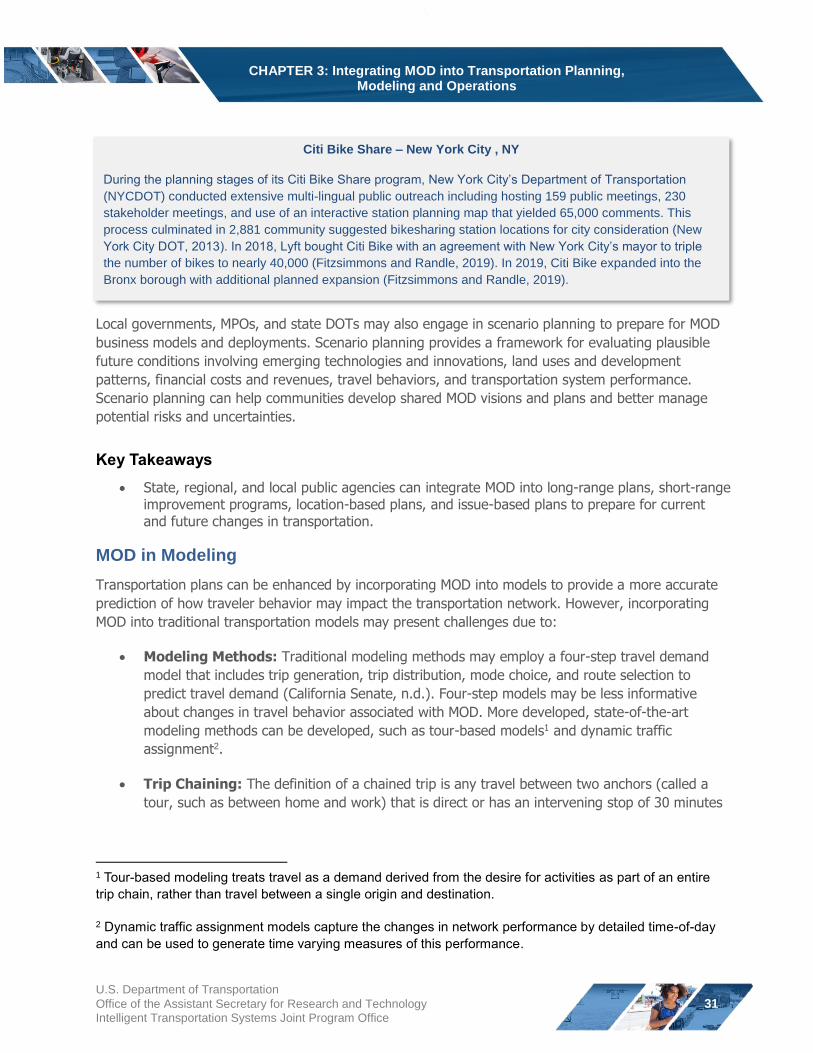
CHAPTER 3: Integrating MOD into Transportation Planning, Modeling and Operations
Citi Bike Share – New York City , NY
During the planning stages of its Citi Bike Share program, New York City’s Department of Transportation
(NYCDOT) conducted extensive multi-lingual public outreach including hosting 159 public meetings, 230
stakeholder meetings, and use of an interactive station planning map that yielded 65,000 comments. This
process culminated in 2,881 community suggested bikesharing station locations for city consideration (New
York City DOT, 2013). In 2018, Lyft bought Citi Bike with an agreement with New York City’s mayor to triple
the number of bikes to nearly 40,000 (Fitzsimmons and Randle, 2019). In 2019, Citi Bike expanded into the
Bronx borough with additional planned expansion (Fitzsimmons and Randle, 2019).
Local governments, MPOs, and state DOTs may also engage in scenario planning to prepare for MOD
business models and deployments. Scenario planning provides a framework for evaluating plausible
future conditions involving emerging technologies and innovations, land uses and development
patterns, financial costs and revenues, travel behaviors, and transportation system performance.
Scenario planning can help communities develop shared MOD visions and plans and better manage
potential risks and uncertainties.
Key Takeaways
State, regional, and local public agencies can integrate MOD into long-range plans, short-range improvement programs, location-based plans, and issue-based plans to prepare for current and future changes in transportation.
MOD in Modeling
Transportation plans can be enhanced by incorporating MOD into models to provide a more accurate
prediction of how traveler behavior may impact the transportation network. However, incorporating
MOD into traditional transportation models may present challenges due to:
Modeling Methods: Traditional modeling methods may employ a four-step travel demand
model that includes trip generation, trip distribution, mode choice, and route selection to
predict travel demand (California Senate, n.d.). Four-step models may be less informative
about changes in travel behavior associated with MOD. More developed, state-of-the-art
modeling methods can be developed, such as tour-based models1 and dynamic traffic
assignment2 .
Trip Chaining: The definition of a chained trip is any travel between two anchors (called a
tour, such as between home and work) that is direct or has an intervening stop of 30 minutes
1 Tour-based modeling treats travel as a demand derived from the desire for activities as part of an entire
trip chain, rather than travel between a single origin and destination.
2 Dynamic traffic assignment models capture the changes in network performance by detailed time-of-day and can be used to generate time varying measures of this performance.
U.S. Department of Transportation
Office of the Assistant Secretary for Research and Technology
Intelligent Transportation Systems Joint Program Office
31
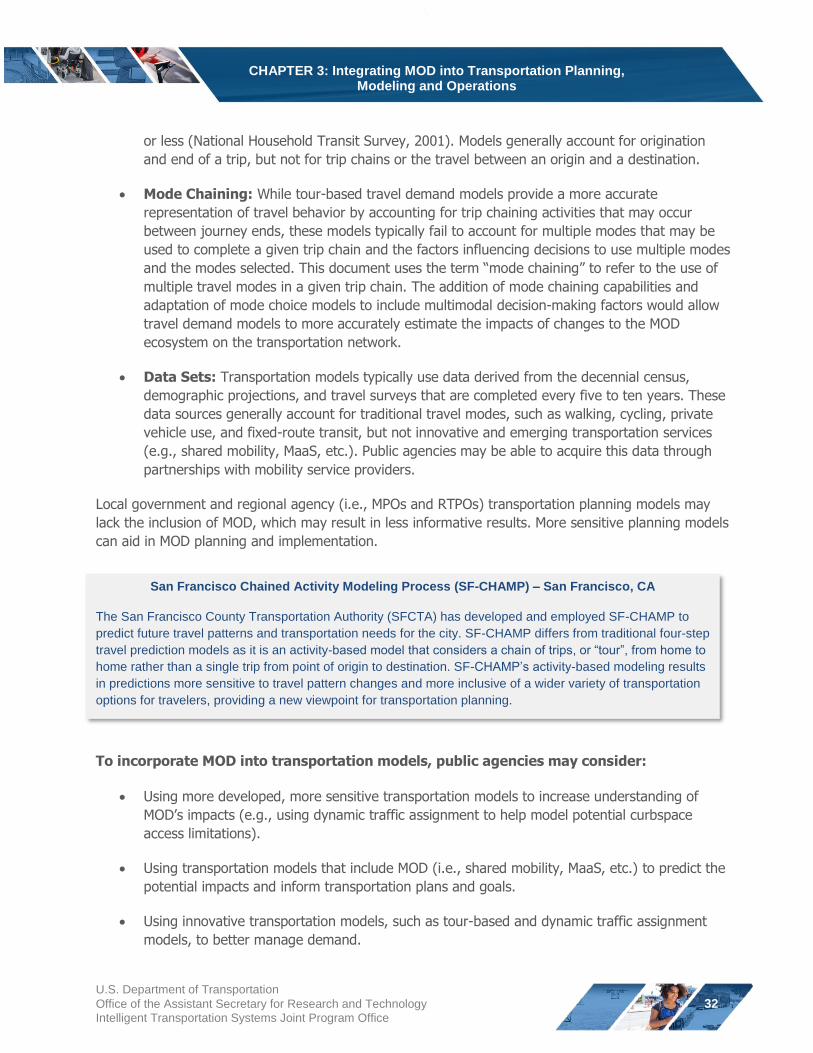
CHAPTER 3: Integrating MOD into Transportation Planning, Modeling and Operations
or less (National Household Transit Survey, 2001). Models generally account for origination
and end of a trip, but not for trip chains or the travel between an origin and a destination.
Mode Chaining: While tour-based travel demand models provide a more accurate
representation of travel behavior by accounting for trip chaining activities that may occur
between journey ends, these models typically fail to account for multiple modes that may be
used to complete a given trip chain and the factors influencing decisions to use multiple modes
and the modes selected. This document uses the term “mode chaining” to refer to the use of
multiple travel modes in a given trip chain. The addition of mode chaining capabilities and
adaptation of mode choice models to include multimodal decision-making factors would allow
travel demand models to more accurately estimate the impacts of changes to the MOD
ecosystem on the transportation network.
Data Sets: Transportation models typically use data derived from the decennial census,
demographic projections, and travel surveys that are completed every five to ten years. These
data sources generally account for traditional travel modes, such as walking, cycling, private
vehicle use, and fixed-route transit, but not innovative and emerging transportation services
(e.g., shared mobility, MaaS, etc.). Public agencies may be able to acquire this data through
partnerships with mobility service providers.
Local government and regional agency (i.e., MPOs and RTPOs) transportation planning models may
lack the inclusion of MOD, which may result in less informative results. More sensitive planning models
can aid in MOD planning and implementation.
San Francisco Chained Activity Modeling Process (SF-CHAMP) – San Francisco, CA
The San Francisco County Transportation Authority (SFCTA) has developed and employed SF-CHAMP to
predict future travel patterns and transportation needs for the city. SF-CHAMP differs from traditional four-step
travel prediction models as it is an activity-based model that considers a chain of trips, or “tour”, from home to
home rather than a single trip from point of origin to destination. SF-CHAMP’s activity-based modeling results
in predictions more sensitive to travel pattern changes and more inclusive of a wider variety of transportation
options for travelers, providing a new viewpoint for transportation planning.
To incorporate MOD into transportation models, public agencies may consider:
Using more developed, more sensitive transportation models to increase understanding of
MOD’s impacts (e.g., using dynamic traffic assignment to help model potential curbspace
access limitations).
Using transportation models that include MOD (i.e., shared mobility, MaaS, etc.) to predict the
potential impacts and inform transportation plans and goals.
Using innovative transportation models, such as tour-based and dynamic traffic assignment
models, to better manage demand.
U.S. Department of Transportation
Office of the Assistant Secretary for Research and Technology
Intelligent Transportation Systems Joint Program Office
32
CHAPTER 3: Integrating MOD into Transportation Planning, Modeling and Operations
Including MOD (i.e., shared mobility, MaaS, etc.) in travel surveys to understand what modes
travelers are using, the trip chain, and the nature of multimodal behavior to provide agencies
with more data and allow models to predict the impacts of MOD on traveler behavior and the
transportation network based on changes in pricing, routes, hours of operations, and other
factors.
Collecting data more frequently, rather than the traditional data collection time periods (often
five or 10 years). More frequent data collection allows public agencies to be more responsive
to innovative and emerging transportation technologies.
Using off-model analysis methods (i.e., analysis methods that do not use traditional models,
such as quantitative research) to analyze data that may not be considered with traditional
modeling methods. Off-model analysis could support more sensitive model forecasts.
Key Takeaways
Incorporating MOD in transportation modeling may be difficult due to traditional data
collection and modeling methods (i.e., modes are excluded from traditional travel surveys and
new supply and demand management strategies may be too complex to model given existing
data limitations).
Several strategies may be employed to enhance modeling, including: incorporating travel data
from shared mobility providers; including shared mobility in data collection (e.g., surveys) and
models; collecting data more frequently; and using off-model analysis methods.
Transportation Systems Management and Operations (TSMO)
In addition to including MOD in the planning process and models, other strategies, such as
Transportation Systems Management and Operations (TSMO), may be employed to include MOD.
TSMO is a systems-based method3 for coordinating strategies, such as MOD, to enable public agencies
to optimize the performance of existing transportation systems to meet travel demand (Bauer et al.,
2017; WSP, 2019; Bauer et al., 2018). TSMO can be used in a variety of ways, such as improving
communication between transportation managers and incident responders in the case of roadway
incidents and providing travelers with accurate and real-time information (Smith et al., 2018). TSMO
strategies can also be used to leverage MOD to manage supply and demand within the transportation
network to create a safer, more effective, and more comprehensive system. For example, New York
City’s Department of Education recently contracted with microtransit provider Via to use the
company’s routing software to more efficiently schedule and route the city’s 10,000 school buses. Via
uses algorithms to optimize transportation performance (similar to TSMO strategies).
3 A systems-based method is a problem-solving approach that requires collaborative effort between stakeholders to direct them towards an established, shared goal (CSCRS, 2019).
U.S. Department of Transportation
Office of the Assistant Secretary for Research and Technology
Intelligent Transportation Systems Joint Program Office
33
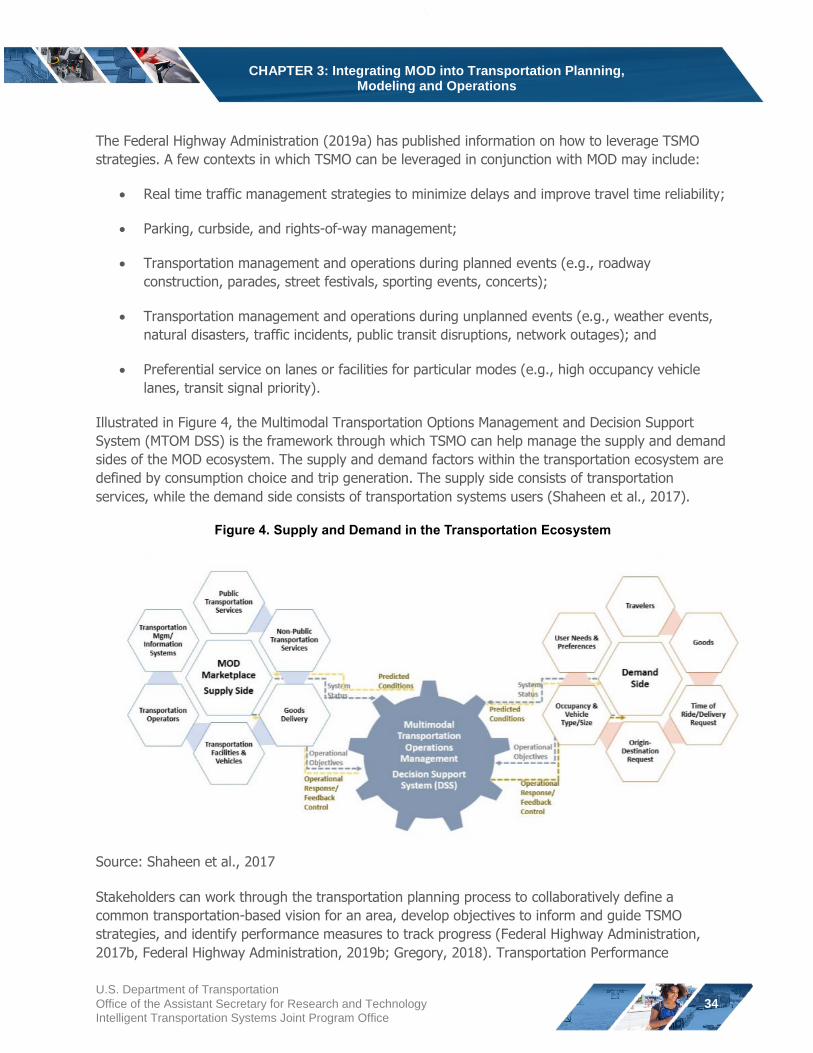
CHAPTER 3: Integrating MOD into Transportation Planning, Modeling and Operations
The Federal Highway Administration (2019a) has published information on how to leverage TSMO
strategies. A few contexts in which TSMO can be leveraged in conjunction with MOD may include:
Real time traffic management strategies to minimize delays and improve travel time reliability;
Parking, curbside, and rights-of-way management;
Transportation management and operations during planned events (e.g., roadway
construction, parades, street festivals, sporting events, concerts);
Transportation management and operations during unplanned events (e.g., weather events,
natural disasters, traffic incidents, public transit disruptions, network outages); and
Preferential service on lanes or facilities for particular modes (e.g., high occupancy vehicle
lanes, transit signal priority).
Illustrated in Figure 4, the Multimodal Transportation Options Management and Decision Support
System (MTOM DSS) is the framework through which TSMO can help manage the supply and demand
sides of the MOD ecosystem. The supply and demand factors within the transportation ecosystem are
defined by consumption choice and trip generation. The supply side consists of transportation
services, while the demand side consists of transportation systems users (Shaheen et al., 2017).
Figure 4. Supply and Demand in the Transportation Ecosystem
Source: Shaheen et al., 2017
Stakeholders can work through the transportation planning process to collaboratively define a
common transportation-based vision for an area, develop objectives to inform and guide TSMO
strategies, and identify performance measures to track progress (Federal Highway Administration,
2017b, Federal Highway Administration, 2019b; Gregory, 2018). Transportation Performance
U.S. Department of Transportation
Office of the Assistant Secretary for Research and Technology
Intelligent Transportation Systems Joint Program Office
34
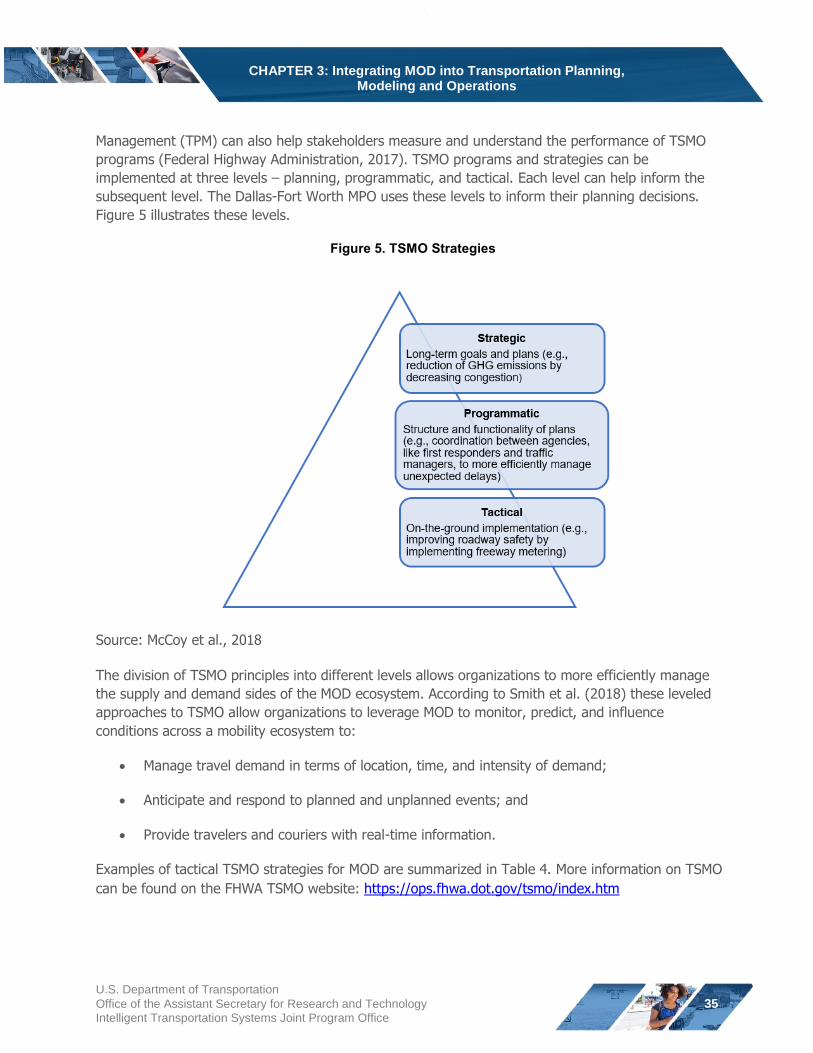
CHAPTER 3: Integrating MOD into Transportation Planning, Modeling and Operations
Management (TPM) can also help stakeholders measure and understand the performance of TSMO
programs (Federal Highway Administration, 2017). TSMO programs and strategies can be
implemented at three levels – planning, programmatic, and tactical. Each level can help inform the
subsequent level. The Dallas-Fort Worth MPO uses these levels to inform their planning decisions.
Figure 5 illustrates these levels.
Figure 5. TSMO Strategies
Source: McCoy et al., 2018
The division of TSMO principles into different levels allows organizations to more efficiently manage
the supply and demand sides of the MOD ecosystem. According to Smith et al. (2018) these leveled
approaches to TSMO allow organizations to leverage MOD to monitor, predict, and influence
conditions across a mobility ecosystem to:
Manage travel demand in terms of location, time, and intensity of demand;
Anticipate and respond to planned and unplanned events; and
Provide travelers and couriers with real-time information.
Examples of tactical TSMO strategies for MOD are summarized in Table 4. More information on TSMO
can be found on the FHWA TSMO website: https://ops.fhwa.dot.gov/tsmo/index.htm
U.S. Department of Transportation
Office of the Assistant Secretary for Research and Technology
Intelligent Transportation Systems Joint Program Office
35
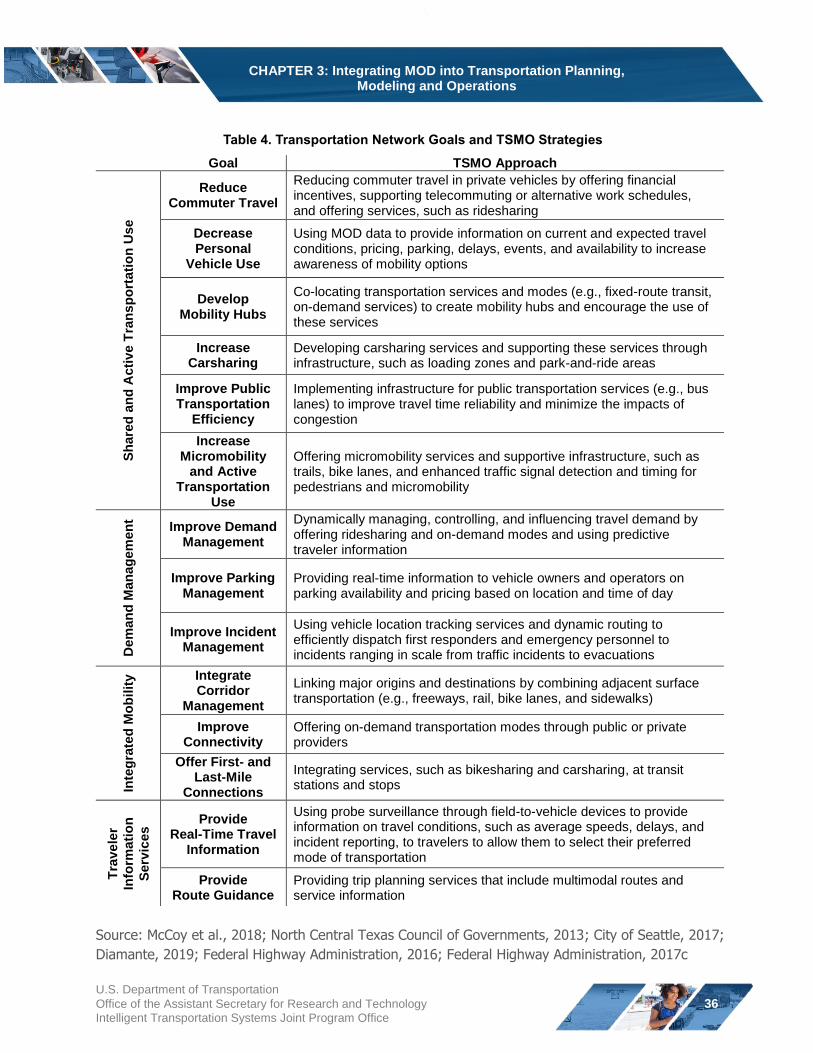
CHAPTER 3: Integrating MOD into Transportation Planning, Modeling and Operations
Table 4. Transportation Network Goals and TSMO Strategies
Goal TSMO Approach
Sh
are
d a
nd
Acti
ve T
ran
sp
ort
ati
on
Use
Reduce Commuter Travel
Reducing commuter travel in private vehicles by offering financial incentives, supporting telecommuting or alternative work schedules, and offering services, such as ridesharing
Decrease Personal
Vehicle Use
Using MOD data to provide information on current and expected travel conditions, pricing, parking, delays, events, and availability to increase awareness of mobility options
Develop Mobility Hubs
Co-locating transportation services and modes (e.g., fixed-route transit, on-demand services) to create mobility hubs and encourage the use of these services
Increase Carsharing
Developing carsharing services and supporting these services through infrastructure, such as loading zones and park-and-ride areas
Improve Public Transportation
Efficiency
Implementing infrastructure for public transportation services (e.g., bus lanes) to improve travel time reliability and minimize the impacts of congestion
Increase Micromobility
and Active Transportation
Use
Offering micromobility services and supportive infrastructure, such as trails, bike lanes, and enhanced traffic signal detection and timing for pedestrians and micromobility
Dem
an
d M
an
ag
em
en
t
Improve Demand Management
Dynamically managing, controlling, and influencing travel demand by offering ridesharing and on-demand modes and using predictive traveler information
Improve Parking Management
Providing real-time information to vehicle owners and operators on parking availability and pricing based on location and time of day
Improve Incident Management
Using vehicle location tracking services and dynamic routing to efficiently dispatch first responders and emergency personnel to incidents ranging in scale from traffic incidents to evacuations
Inte
gra
ted
Mo
bil
ity Integrate
Corridor Management
Linking major origins and destinations by combining adjacent surface transportation (e.g., freeways, rail, bike lanes, and sidewalks)
Improve Connectivity
Offering on-demand transportation modes through public or private providers
Offer First- and Last-Mile
Connections
Integrating services, such as bikesharing and carsharing, at transit stations and stops
Tra
ve
ler
Info
rmati
on
Serv
ices Provide
Real-Time Travel Information
Using probe surveillance through field-to-vehicle devices to provide information on travel conditions, such as average speeds, delays, and incident reporting, to travelers to allow them to select their preferred mode of transportation
Provide Route Guidance
Providing trip planning services that include multimodal routes and service information
Source: McCoy et al., 2018; North Central Texas Council of Governments, 2013; City of Seattle, 2017;
Diamante, 2019; Federal Highway Administration, 2016; Federal Highway Administration, 2017c
U.S. Department of Transportation
Office of the Assistant Secretary for Research and Technology
Intelligent Transportation Systems Joint Program Office
36
CHAPTER 3: Integrating MOD into Transportation Planning, Modeling and Operations
Leveraging MOD for Emergence Response and Recovery
Natural and man-made disasters are more common than many people realize and evacuations remain a
common strategy to ensure safety. Due to the heavy reliance on private vehicles in the U.S., evacuations
using personally-owned automobiles have historically been the focus of many emergency managers (Wong
and Shaheen, 2019). However, this can be problematic for public transit-dependent and carless households
who may lack transportation access in an emergency. Research has found that one-third of the 50 largest
cities in the U.S. do not have evacuation plans, and less than half of the cities with evacuation plans mention
carless or vulnerable populations (Wong and Shaheen, 2019). Two strategies that may be used to increase
transportation and housing capacity and redundancy during emergency evacuations and their aftermath
include:
Homesharing: the sharing of a residence, and
Shared mobility: the shared use of a transportation mode for passenger mobility and goods delivery.
Shared mobility and homesharing present opportunities for emergency management agencies and
emergency support functions to incorporate on-demand transportation and shelter resources into disaster
preparedness planning and emergency response. During the California wildfires in 2017-18, Airbnb, Lyft,
and Uber waived fees and offered various promotions to provide supplemental emergency transportation
and housing (Wong and Shaheen, 2019). Similarly, Waze has worked with public agencies to provide
information on road closures and shelter availability to tropical storm and hurricane evacuees along the
Eastern Seaboard (Waze, 2019).
Waze Connected Citizen Program – Boston, MA
Waze’s Connected Citizens Program provides communities with crowdsourced data to aid in infrastructure
and planning decisions to improve roadway operations (Waze, 2018). In Boston, Massachusetts, the city
used Waze data to improve congestion by identifying high-traffic intersections as part of Waze’s Connected
Citizen Program. Boston adjusted the signal timing at the identified intersections to improve traffic flow.
Boston also used Waze data to create a heat map of the city to identify areas that were prone to vehicle
double parking so the city could dispatch traffic officers. According to a Waze-authored analysis, the city
improved congestion 18% month-over-month from these efforts (Waze, 2018).
Key Takeaways
Communities can leverage TSMO approaches to manage supply and demand across the
transportation network.
U.S. Department of Transportation
Office of the Assistant Secretary for Research and Technology
Intelligent Transportation Systems Joint Program Office
37
CHAPTER 4: Shared Mobility Implementation and Community Integration
CHAPTER 4: Shared Mobility Implementation and Community Integration
Implementing MOD through shared mobility and community integration can support seamless
multimodal trips. This section discusses how shared mobility can be implemented in a variety of built
environments. In addition, this chapter discusses implementation methods, such as the allocation of
rights-of-way, incentive zoning, and multimodal integration. The chapter also discusses pilot projects,
and how they can be used to evaluate the impacts of shared mobility. Finally, the chapter discusses
the role of last-mile delivery innovations in disrupting mobility and the trip chain.
Shared Mobility Implementation
A core component of the MOD ecosystem is shared mobility—the shared use of a vehicle, bicycle, or
other mode that enables users to gain short-term access to transportation modes on an as-needed
basis. This section provides definitions of shared modes, an overview of the current understanding of
shared mobility’s impacts, and policy frameworks for implementing shared mobility services.
Shared mobility includes various travel modes and service models that meet the diverse needs of
users including: carsharing, microtransit, personal vehicle sharing, public transportation, ridesharing
(carpooling and vanpooling), shared micromobility (bikesharing and scooter sharing), shuttles, taxis,
and transportation network companies (also known as TNCs, ridesourcing, and ridehailing). Sharing
can include sequential sharing (i.e., different users share the same transportation vehicle or
equipment, one after the other) or concurrent sharing (i.e., sharing of the same transportation vehicle
or equipment by multiple non-household users for the same trip).
U.S. Department of Transportation
Office of the Assistant Secretary for Research and Technology
Intelligent Transportation Systems Joint Program Office
38
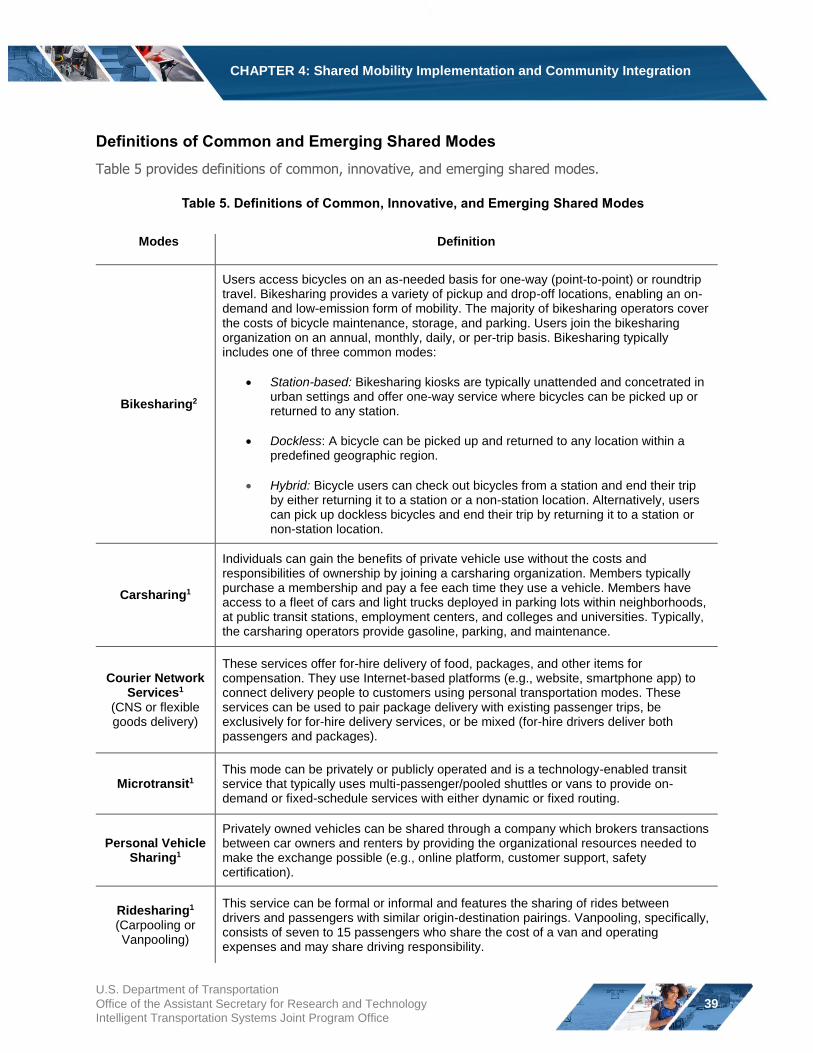
CHAPTER 4: Shared Mobility Implementation and Community Integration
Definitions of Common and Emerging Shared Modes
Table 5 provides definitions of common, innovative, and emerging shared modes.
Table 5. Definitions of Common, Innovative, and Emerging Shared Modes
Modes Definition
Bikesharing2
Users access bicycles on an as-needed basis for one-way (point-to-point) or roundtrip travel. Bikesharing provides a variety of pickup and drop-off locations, enabling an on-demand and low-emission form of mobility. The majority of bikesharing operators cover the costs of bicycle maintenance, storage, and parking. Users join the bikesharing organization on an annual, monthly, daily, or per-trip basis. Bikesharing typically includes one of three common modes:
Station-based: Bikesharing kiosks are typically unattended and concetrated in urban settings and offer one-way service where bicycles can be picked up or returned to any station.
Dockless: A bicycle can be picked up and returned to any location within a predefined geographic region.
Hybrid: Bicycle users can check out bicycles from a station and end their trip by either returning it to a station or a non-station location. Alternatively, users can pick up dockless bicycles and end their trip by returning it to a station or non-station location.
Carsharing1
Individuals can gain the benefits of private vehicle use without the costs and responsibilities of ownership by joining a carsharing organization. Members typically purchase a membership and pay a fee each time they use a vehicle. Members have access to a fleet of cars and light trucks deployed in parking lots within neighborhoods, at public transit stations, employment centers, and colleges and universities. Typically, the carsharing operators provide gasoline, parking, and maintenance.
Courier Network Services1
(CNS or flexible goods delivery)
These services offer for-hire delivery of food, packages, and other items for compensation. They use Internet-based platforms (e.g., website, smartphone app) to connect delivery people to customers using personal transportation modes. These services can be used to pair package delivery with existing passenger trips, be exclusively for for-hire delivery services, or be mixed (for-hire drivers deliver both passengers and packages).
Microtransit1
This mode can be privately or publicly operated and is a technology-enabled transit service that typically uses multi-passenger/pooled shuttles or vans to provide on-demand or fixed-schedule services with either dynamic or fixed routing.
Personal Vehicle Sharing1
Privately owned vehicles can be shared through a company which brokers transactions between car owners and renters by providing the organizational resources needed to make the exchange possible (e.g., online platform, customer support, safety certification).
Ridesharing1 This service can be formal or informal and features the sharing of rides between drivers and passengers with similar origin-destination pairings. Vanpooling, specifically,
(Carpooling or consists of seven to 15 passengers who share the cost of a van and operating
Vanpooling) expenses and may share driving responsibility.
U.S. Department of Transportation
Office of the Assistant Secretary for Research and Technology
Intelligent Transportation Systems Joint Program Office
39
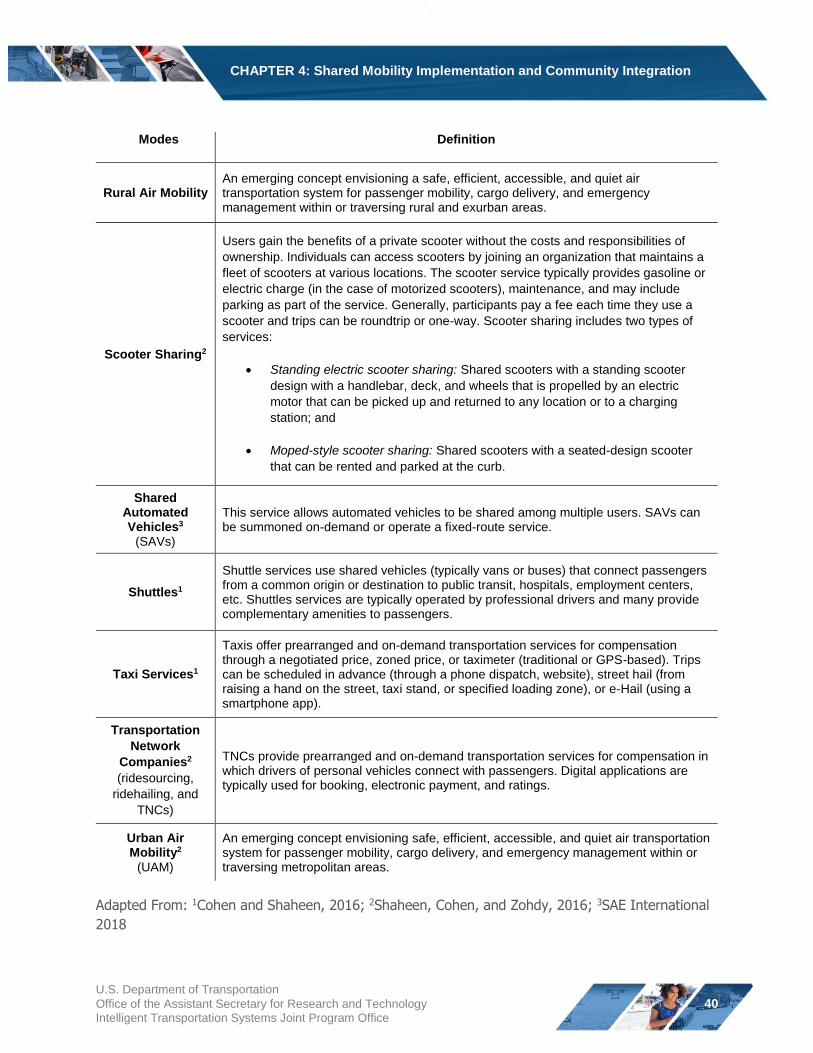
CHAPTER 4: Shared Mobility Implementation and Community Integration
Modes Definition
Rural Air Mobility An emerging concept envisioning a safe, efficient, accessible, and quiet air transportation system for passenger mobility, cargo delivery, and emergency management within or traversing rural and exurban areas.
Scooter Sharing2
Users gain the benefits of a private scooter without the costs and responsibilities of
ownership. Individuals can access scooters by joining an organization that maintains a
fleet of scooters at various locations. The scooter service typically provides gasoline or
electric charge (in the case of motorized scooters), maintenance, and may include
parking as part of the service. Generally, participants pay a fee each time they use a
scooter and trips can be roundtrip or one-way. Scooter sharing includes two types of
services:
Standing electric scooter sharing: Shared scooters with a standing scooter
design with a handlebar, deck, and wheels that is propelled by an electric
motor that can be picked up and returned to any location or to a charging
station; and
Moped-style scooter sharing: Shared scooters with a seated-design scooter
that can be rented and parked at the curb.
Shared Automated Vehicles3
(SAVs)
This service allows automated vehicles to be shared among multiple users. SAVs can be summoned on-demand or operate a fixed-route service.
Shuttles1
Shuttle services use shared vehicles (typically vans or buses) that connect passengers from a common origin or destination to public transit, hospitals, employment centers, etc. Shuttles services are typically operated by professional drivers and many provide complementary amenities to passengers.
Taxi Services1
Taxis offer prearranged and on-demand transportation services for compensation through a negotiated price, zoned price, or taximeter (traditional or GPS-based). Trips can be scheduled in advance (through a phone dispatch, website), street hail (from raising a hand on the street, taxi stand, or specified loading zone), or e-Hail (using a smartphone app).
Transportation
Network
Companies2
(ridesourcing,
ridehailing, and
TNCs)
TNCs provide prearranged and on-demand transportation services for compensation in which drivers of personal vehicles connect with passengers. Digital applications are typically used for booking, electronic payment, and ratings.
Urban Air Mobility2
(UAM)
An emerging concept envisioning safe, efficient, accessible, and quiet air transportation system for passenger mobility, cargo delivery, and emergency management within or traversing metropolitan areas.
Adapted From: 1Cohen and Shaheen, 2016; 2Shaheen, Cohen, and Zohdy, 2016; 3SAE International
2018
U.S. Department of Transportation
Office of the Assistant Secretary for Research and Technology
Intelligent Transportation Systems Joint Program Office
40
CHAPTER 4: Shared Mobility Implementation and Community Integration
Impacts of Shared Mobility: Current Understanding
Shared mobility has resulted in a number of social, environmental, and behavioral impacts, and an
increasing body of empirical evidence supports many of these relationships. The various effects can be
grouped into four categories:
1. Travel behavior;
2. Environmental impacts (e.g., GHG emissions);
3. Land use; and
4. Social.
The effects of shared services can be both positive and negative, and vary by mode and deployment
context, such as population density, the built environment, and public transit accessibility. More
research is needed to gain a better understanding of the factors that may influence the impacts of
shared mobility. This section summarizes key findings from impact studies of carsharing, microtransit,
ridesharing, shared micromobility, and TNCs.
Impacts of Carsharing
A number of studies have documented the impacts of carsharing, predominantly based on self-
reported survey data. These studies collectively show the following commonly associated outcomes of
carsharing:
Sold vehicles or delayed or foregone vehicle purchases;
Increased use of some alternative modes of transportation (e.g., walking, biking);
Reduced vehicle miles/kilometers traveled (VMT/VKT);
Increased access and mobility for formerly carless households;
Reduced fuel consumption and GHG emissions; and
Greater environmental awareness.
From: Cohen and Shaheen, 2016.
Table 6 provides a summary of key findings from roundtrip, one-way, and peer-to-peer carsharing studies in North America.
U.S. Department of Transportation
Office of the Assistant Secretary for Research and Technology
Intelligent Transportation Systems Joint Program Office
41
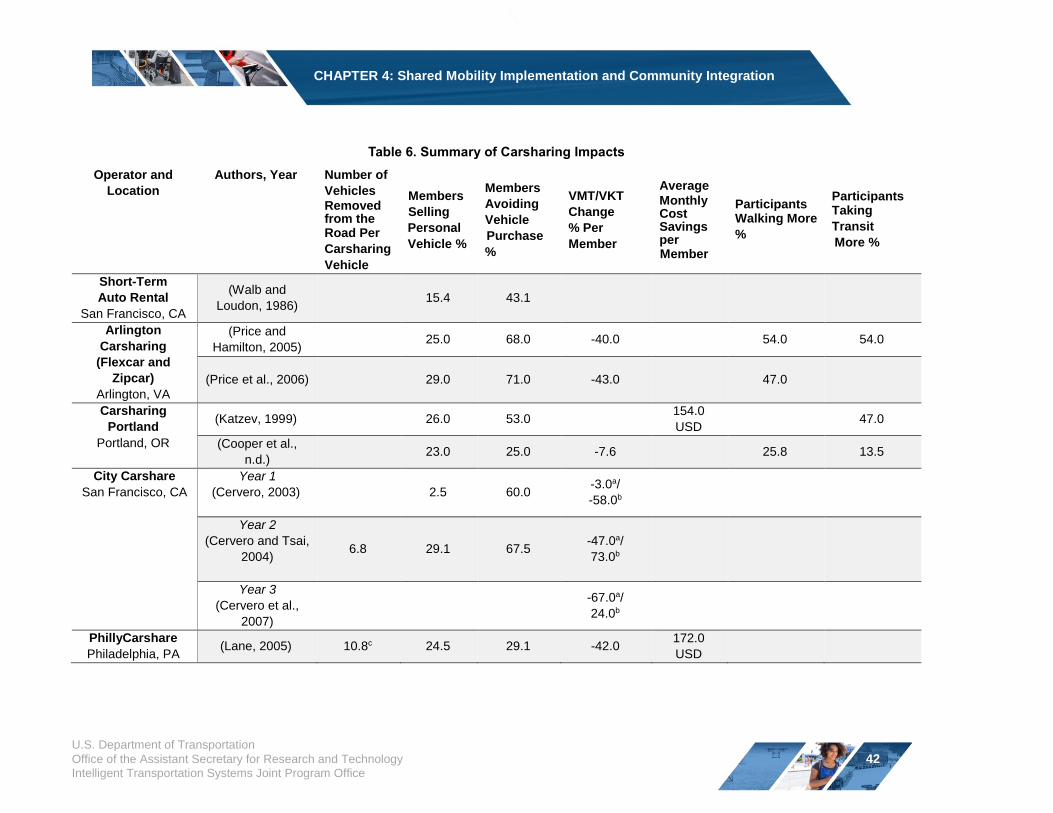
CHAPTER 4: Shared Mobility Implementation and Community Integration
Table 6. Summary of Carsharing Impacts
Operator and Authors, Year Number of
Location Vehicles
Removed from the Road Per
Carsharing
Members
Selling
Personal
Vehicle %
Members
Avoiding
Vehicle
Purchase
%
VMT/VKT
Change
% Per
Member
Average
Monthly Cost Savings per Member
Participants Walking More
%
Participants Taking
Transit
More %
Vehicle
Short-Term
Auto Rental
San Francisco, CA
(Walb and
Loudon, 1986) 15.4 43.1
Arlington
Carsharing
(Flexcar and
Zipcar)
Arlington, VA
(Price and
Hamilton, 2005) 25.0 68.0 -40.0 54.0 54.0
(Price et al., 2006) 29.0 71.0 -43.0 47.0
Carsharing
Portland
Portland, OR
(Katzev, 1999) 26.0 53.0 154.0
47.0 USD
(Cooper et al.,
n.d.) 23.0 25.0 -7.6 25.8 13.5
City Carshare
San Francisco, CA
Year 1
(Cervero, 2003) 2.5 60.0 -3.0a/
-58.0b
Year 2
(Cervero and Tsai, 6.8
2004) 29.1 67.5
-47.0a/
73.0b
Year 3
(Cervero et al.,
2007)
-67.0a/
24.0b
PhillyCarshare
Philadelphia, PA (Lane, 2005) 10.8c 24.5 29.1 -42.0
172.0
USD
U.S. Department of Transportation
Office of the Assistant Secretary for Research and Technology
Intelligent Transportation Systems Joint Program Office
42
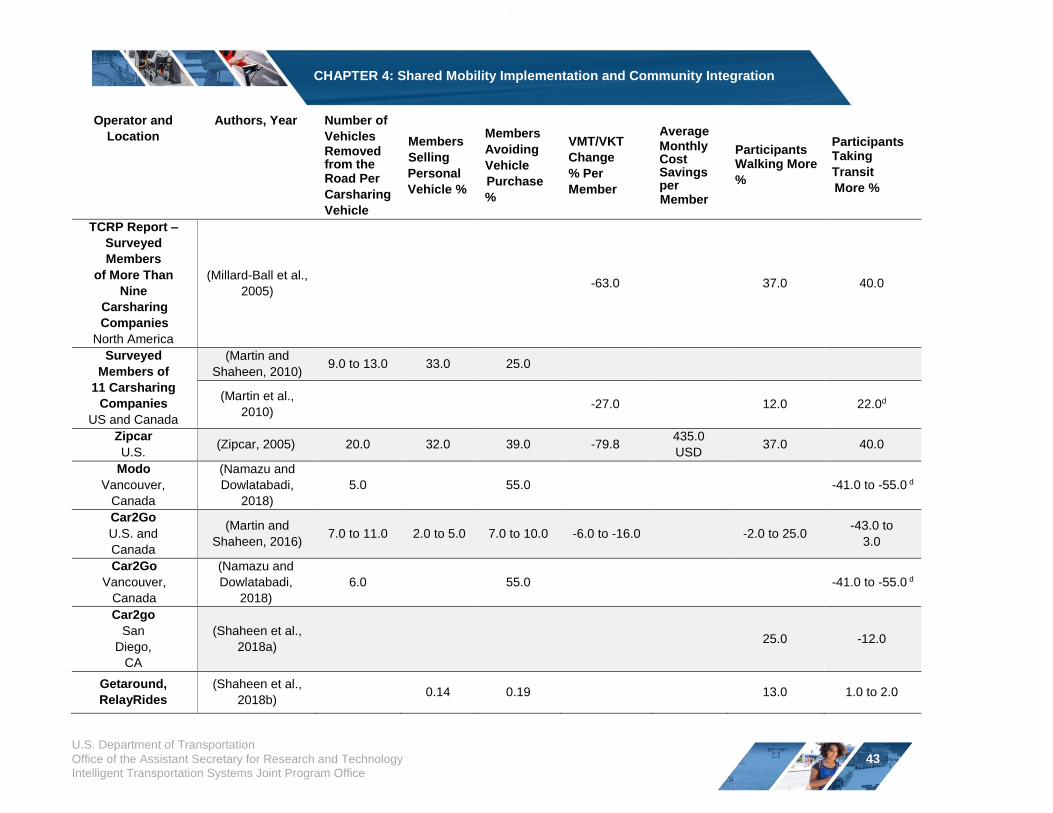
CHAPTER 4: Shared Mobility Implementation and Community Integration
Operator and Authors, Year Number of
Location Vehicles
Removed from the Road Per
Carsharing
Members
Selling
Personal
Vehicle %
Members
Avoiding
Vehicle
Purchase
%
VMT/VKT
Change
% Per
Member
Average
Monthly Cost Savings per Member
Participants Walking More
%
Participants Taking
Transit
More %
Vehicle
TCRP Report – Surveyed
Members
of More Than
Nine
Carsharing
Companies
North America
(Millard-Ball et al.,
2005) -63.0 37.0 40.0
Surveyed
Members of
11 Carsharing
Companies
US and Canada
(Martin and
Shaheen, 2010) 9.0 to 13.0 33.0 25.0
(Martin et al.,
2010) -27.0 12.0 22.0d
Zipcar
U.S. (Zipcar, 2005) 20.0 32.0 39.0
435.0 -79.8
USD 37.0 40.0
Modo
Vancouver,
Canada
(Namazu and
Dowlatabadi,
2018)
5.0 55.0 -41.0 to -55.0 d
Car2Go
U.S. and
Canada
(Martin and
Shaheen, 2016) 7.0 to 11.0 2.0 to 5.0 7.0 to 10.0 -6.0 to -16.0 -2.0 to 25.0
-43.0 to
3.0
Car2Go
Vancouver,
Canada
(Namazu and
Dowlatabadi,
2018)
6.0 55.0 -41.0 to -55.0 d
Car2go
San (Shaheen et al., 25.0 -12.0
Diego, 2018a)
CA
Getaround,
RelayRides
(Shaheen et al.,
2018b) 0.14 0.19 13.0 1.0 to 2.0
U.S. Department of Transportation
Office of the Assistant Secretary for Research and Technology
Intelligent Transportation Systems Joint Program Office
43
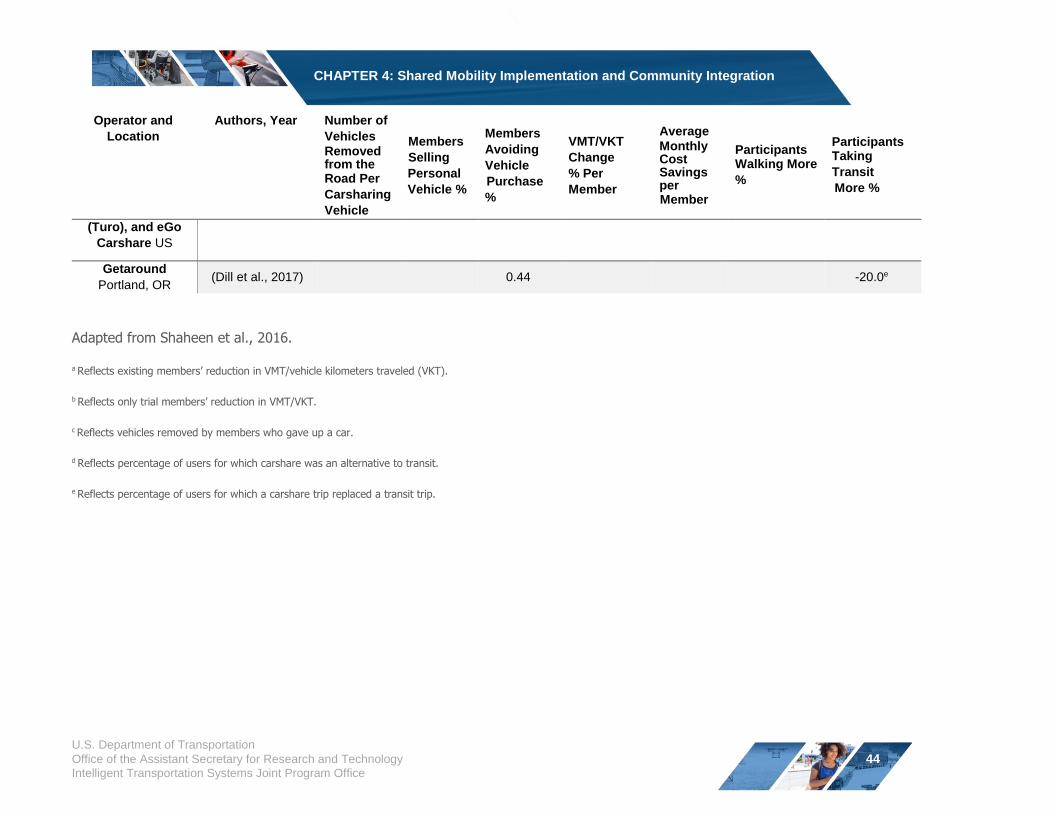
CHAPTER 4: Shared Mobility Implementation and Community Integration
Operator and
Location
Authors, Year Number of
Vehicles
Removed from the Road Per
Carsharing
Vehicle
Members
Selling
Personal
Vehicle %
Members
Avoiding
Vehicle
Purchase
%
VMT/VKT
Change
% Per
Member
Average
Monthly Cost Savings per Member
Participants Walking More
%
Participants Taking
Transit
More %
(Turo), and eGo
Carshare US
Getaround
Portland, OR (Dill et al., 2017) 0.44 -20.0e
Adapted from Shaheen et al., 2016.
a Reflects existing members’ reduction in VMT/vehicle kilometers traveled (VKT).
b Reflects only trial members’ reduction in VMT/VKT.
c Reflects vehicles removed by members who gave up a car.
d Reflects percentage of users for which carshare was an alternative to transit.
e Reflects percentage of users for which a carshare trip replaced a transit trip.
U.S. Department of Transportation
Office of the Assistant Secretary for Research and Technology
Intelligent Transportation Systems Joint Program Office
44
CHAPTER 4: Shared Mobility Implementation and Community Integration
Table 6 illustrates the high percentage of study participants (15% to 33%) who sold their car as a
result of participation in carsharing programs. These studies generally indicate that carsharing
encourages members to delay or avoid vehicle purchases. Some studies, specifically those in
Portland and Philadelphia, also document potential cost savings for members participating in
carsharing programs (Briggs, 2019). Many studies also show a decrease in VMT/VKT (from 3% to
79%) as well as in increases in walking and public transit ridership.
Impacts of Microtransit
While studies on the impacts of microtransit are still emerging, a study of the former microtransit
service, Bridj, and the Kansas City Area Transportation Authority (KCATA) found:
Affordability and convenience were the most common motivations for using microtransit. 56% of survey respondents said they used microtransit because it was cheaper than other options, and 39% said it was more comfortable than alternatives. Approximately 33% of respondents used microtransit because it allowed greater flexibility than alternative transportation modes.
The majority of respondents (89%) walked to or from a RideKC: Bridj stop. It took about one third of the respondents five minutes or less to get to the RideKC: Bridj stop from their residence or workplace.
More than half of the respondents used RideKC: Bridj only in the afternoon. This could potentially be because the service operated in the areas surrounding the University of Kansas Medical Center which had many hospital workers with shifts outside typical working hours.
Approximately one third of respondents would have driven alone for their most recent trips had RideKC: Bridj not been available. Another third of respondents would have taken a typical KCATA bus if RideKC: Bridj was not available. Roughly 22% of respondents would have used a TNC.
Respondents (25%) stated that they drove alone less often because of RideKC: Bridj and 16% of respondents rode the KCATA streetcar more frequently because of RideKC: Bridj.
All of the respondents stated that they would possibly, probably, or definitely use RideKC: Bridj for a $2 fare. However, 23% of respondents said they would not use RideKC: Bridj if the fare was $3.
Respondents (67%) said they were interested in RideKC: Bridj if the service area was expanded. This suggests that the service area may have been a factor in limiting microtransit ridership.
Further information on the partnership between KCATA and Bridj can be found in RideKC: Bridj Pilot
Evaluation: Impact, Operational, and Institutional Analysis.
U.S. Department of Transportation
Office of the Assistant Secretary for Research and Technology
Intelligent Transportation Systems Joint Program Office
45
CHAPTER 4: Shared Mobility Implementation and Community Integration
Impacts of Ridesharing
A number of societal, employer, and individual benefits have been attributed to ridesharing, and an
increasing body of empirical evidence supports many of these relationships—although the
magnitude of ridesharing’s costs and benefits for travelers is unclear. Carpools are difficult for researchers to observe and record, and as a result carpooling has often been referred to as the
“invisible mode” (Minett, n.d.; Burris and Winn, 2006; GCN, 2019). The available findings, however,
do shed light on the demographic characteristics and travel behavior patterns of carpoolers.
Empirical and anecdotal evidence indicates that carpooling provides numerous benefits including:
Expanded accessibility and economic opportunity for carless households or households
unable to obtain drivers’ licenses (Liu and Painter, 2012);
Congestion mitigation and reduced fuel consumption (Minett and Pearce, 2011; Erhardt et
al., 2019);
Reduced parking demand and need for parking space (Shoup, 2011);
Reduced energy consumption and emissions (Environmental Protection Agency, 2005;
Bureau of Transportation Statistics; 2003);
Reduced VMT for workplace commutes (Noland et al., 2006);
Cost savings for public agencies and employers (Herzog et al., 2006; Boarnet et al., 2014);
Shared travel costs (Boarnet et al., 2014);
Travel time savings from high occupancy vehicle (HOV) lanes (City of Seattle, 2017); and
Reduced commute stress (Dorinson et al., 2009).
Despite the uncertain magnitude of impacts, ridesharing participants have reported experiencing
cost savings due to shared travel costs, travel-time savings through use of HOV lanes, and reduced
commute stress potentially as the result of shared driving responsibilities. Additionally, commuters
who participate in ridesharing frequently have access to preferential parking and additional
incentives, such as rewards programs that provide money or gift cards for carpooling. As fleets
become cleaner and more efficient, the proportion of aggregate emission reduction due to
ridesharing will be lessened. It is also important to note that carpooling could lead to induced
demand due to reduced travel times and costs, this should be factored into calculations of the net
VMT impacts of this mode (Chan and Shaheen, 2012).
U.S. Department of Transportation
Office of the Assistant Secretary for Research and Technology
Intelligent Transportation Systems Joint Program Office
46
CHAPTER 4: Shared Mobility Implementation and Community Integration
Impacts of Shared Micromobility
A number of North American studies have documented the impacts of station-based bikesharing,
while the early studies of dockless bikesharing and dockless scooter sharing are emerging. Studies
of shared micromobility have documented impacts in four key areas:
Accessibility: Shared mobility, such as micromobility devices, may block access for
pedestrians or individuals with disabilities.
Environment: Several studies indicate that shared micromobility reduces GHG emissions by
replacing personal vehicle trips (Shaheen et al., Forthcoming). However, additional
environmental considerations include lifecycle impacts associated with support staff using
vehicles to rebalance the devices, as well as manufacturing, recycling, and replacing devices
and batteries (Fishman et al., 2014; Fischer et al., 2012).
Mode Substitution: Mode replacement of shared micromobility systems (station-based and
dockless) appear to vary by service model, device, and location of the study (LDA
Consulting, 2013). Additional studies will be needed to clarify impacts on mode choice.
Public Health: Shared micromobility may increase the use of active modes. A study of
station-based bikesharing in Oregon found an increase in physical activity among users. An
assessment of Portland’s four-month pilot of standing electric scooter sharing found that
scooter sharing attracted new people to active transportation (such as walking and biking)
(Portland Bureau of Transportation, 2019).
Safety: Studies indicate that shared micromobility users often do not wear helmets, but
additional research is needed to determine if these modes are more dangerous than other
transportation modes (Fishman et al., 2014; Fishman et al., 2015). Although studies have
documented a high-number of scooter-related injuries and hospitalizations, more research
needs to be conducted to understand risky riding behavior, safe speeds, and riding locations
that most contribute to injury for scooter sharing users (Shaheen et al., Forthcoming).
Impacts of Transportation Network Companies (TNCs)
Studies on the impacts of TNCs have documented varied impacts on VMT, mode choice, vehicle
ownership and use, and public transit ridership. These impacts are typically impacted by local
characteristics such as urban density, the built environment, public transit accessibility, public policy,
and other factors (Alemi et al. 2018; Brown and Taylor, 2018; Clewlow and Mishra, 2017; Feigon
and Murphy, 2018; Hampshire et al., 2017; Henao 2017; Martin et al., 2019). TNCs may have some
of the following impacts:
Increasing access and mobility for non-vehicle owners;
Increasing for-hire vehicle service availability, particularly in the evening and on weekends
and in smaller markets where taxi service is limited or unavailable; and
U.S. Department of Transportation
Office of the Assistant Secretary for Research and Technology
Intelligent Transportation Systems Joint Program Office
47
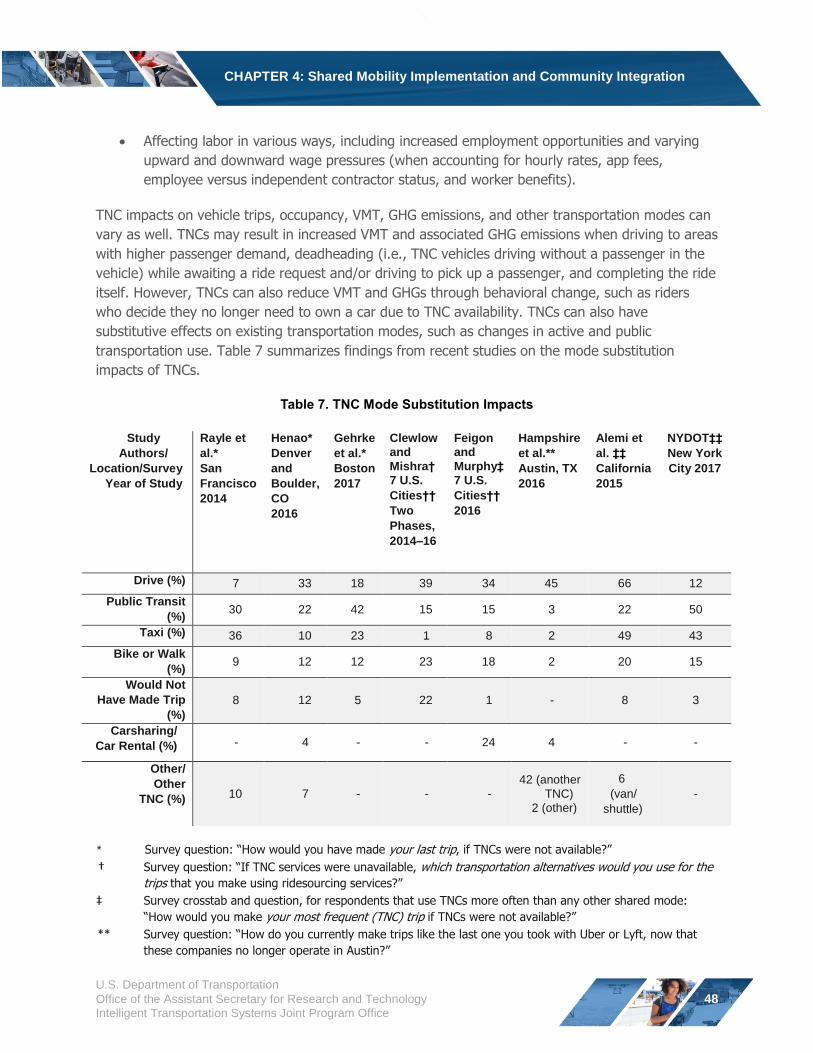
CHAPTER 4: Shared Mobility Implementation and Community Integration
Affecting labor in various ways, including increased employment opportunities and varying
upward and downward wage pressures (when accounting for hourly rates, app fees,
employee versus independent contractor status, and worker benefits).
TNC impacts on vehicle trips, occupancy, VMT, GHG emissions, and other transportation modes can
vary as well. TNCs may result in increased VMT and associated GHG emissions when driving to areas
with higher passenger demand, deadheading (i.e., TNC vehicles driving without a passenger in the
vehicle) while awaiting a ride request and/or driving to pick up a passenger, and completing the ride
itself. However, TNCs can also reduce VMT and GHGs through behavioral change, such as riders
who decide they no longer need to own a car due to TNC availability. TNCs can also have
substitutive effects on existing transportation modes, such as changes in active and public
transportation use. Table 7 summarizes findings from recent studies on the mode substitution
impacts of TNCs.
Table 7. TNC Mode Substitution Impacts
Study
Authors/
Location/Survey
Year of Study
Rayle et
al.*
San
Francisco
2014
Henao*
Denver
and
Boulder,
CO
2016
Gehrke
et al.*
Boston
2017
Clewlow
and
Mishra† 7 U.S.
Cities††
Two
Phases,
2014–16
Feigon
and
Murphy‡ 7 U.S.
Cities††
2016
Hampshire
et al.**
Austin, TX
2016
Alemi et
al. ‡‡ California
2015
NYDOT‡‡ New York
City 2017
Drive (%) 7 33 18 39 34 45 66 12
Public Transit
(%) 30 22 42 15 15 3 22 50
Taxi (%) 36 10 23 1 8 2 49 43
Bike or Walk
(%) 9 12 12 23 18 2 20 15
Would Not
Have Made Trip
(%)
8 12 5 22 1 - 8 3
Carsharing/
Car Rental (%) - 4 - - 24 4 - -
Other/
Other
TNC (%) 10 7 - - -
42 (another
TNC)
2 (other)
6
(van/
shuttle)
-
* Survey question: “How would you have made your last trip, if TNCs were not available?”
† Survey question: “If TNC services were unavailable, which transportation alternatives would you use for the
trips that you make using ridesourcing services?”
‡ Survey crosstab and question, for respondents that use TNCs more often than any other shared mode:
“How would you make your most frequent (TNC) trip if TNCs were not available?”
** Survey question: “How do you currently make trips like the last one you took with Uber or Lyft, now that
these companies no longer operate in Austin?”
U.S. Department of Transportation
Office of the Assistant Secretary for Research and Technology
Intelligent Transportation Systems Joint Program Office
48
CHAPTER 4: Shared Mobility Implementation and Community Integration
†† The impacts in these studies were aggregated across Austin, Boston, Chicago, Los Angeles, San Francisco,
Seattle, and Washington, D.C.
‡‡ These studies allowed multiple responses to the question: “How would you have made your most recent
TNC trip (if at all) if these services had not been available?” Therefore, the percentages add up to more than 100 percent, making it challenging to directly compare to the other studies.
The studies show that TNC rides replace a relatively high percentage of trips among users that
would have otherwise been completed by driving a personal vehicle or taking public transportation.
Depending on the city, the study results also highlight taxi rides as a similar option to TNCs rides, as
taxis rides would have been taken had TNC rides not been available. The studies also demonstrate
TNCs’ ability to increase mobility by allowing people to make trips that they would not have made otherwise.
However, some of these studies do have limitations. First, studies aggregated across multiple cities
run the risk of obscuring city-specific differences in TNC impacts. Second, if respondents are asked
in a general manner what transportation mode they would take in contrast to TNCs (instead of what
mode they would have used for their last TNC trip), responses may be less representative of a
respondent’s mode replacement decision.
Key Takeaways
The impacts of shared modes can generally be classified in terms of travel behavior,
environment, land use, and social.
The impacts of shared mobility vary by mode and local context in which it is deployed. In
many cases, more research is needed to understand the contextual factors that influence the
magnitude and direction of shared mobility impacts.
Understanding the Role of the Built Environment
Between 1800 and 2000, the U.S. population grew from 4 million to more than 250 million. Over this
same period, the percentage of Americans living in urban areas increased from less than 5% to
more than 80% (Platt et al., 2013). Today, more than eight in ten Americans live in metropolitan
areas and an estimated 75% of U.S. households reside in single-family or mobile homes (Frey,
2012). Recent studies indicate that America is becoming more suburban. Between 2000 and 2010,
suburban growth exceeded urban growth in 81 of the largest 100 U.S. metropolitan areas.
Additionally, job centers are growing outside of urban cores and in various suburban nodes, such as
“edge cities” (suburbs with high concentrations of employment density, such as office parks). One study found that employment decentralized between 1996 and 2006 with 95 out of 98 metropolitan
areas decreasing the share of jobs located within three miles of downtown (Kneebone, 2016). This
study also concluded that only 21% of employees in the top 98 metropolitan areas worked within
three miles of downtown, while 45% worked more than 10 miles away from the city center.
U.S. Department of Transportation
Office of the Assistant Secretary for Research and Technology
Intelligent Transportation Systems Joint Program Office
49
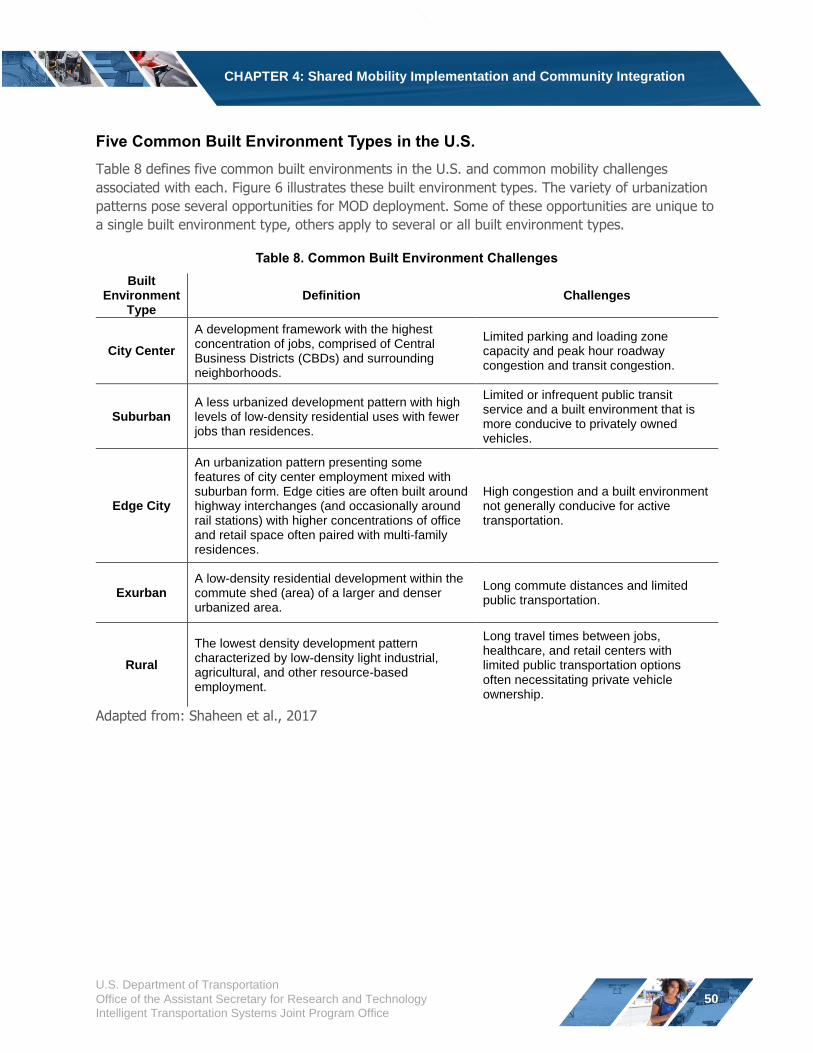
CHAPTER 4: Shared Mobility Implementation and Community Integration
Five Common Built Environment Types in the U.S.
Table 8 defines five common built environments in the U.S. and common mobility challenges
associated with each. Figure 6 illustrates these built environment types. The variety of urbanization
patterns pose several opportunities for MOD deployment. Some of these opportunities are unique to
a single built environment type, others apply to several or all built environment types.
Table 8. Common Built Environment Challenges
Built Environment
Type Definition Challenges
City Center
A development framework with the highest concentration of jobs, comprised of Central Business Districts (CBDs) and surrounding neighborhoods.
Limited parking and loading zone capacity and peak hour roadway congestion and transit congestion.
Suburban A less urbanized development pattern with high levels of low-density residential uses with fewer jobs than residences.
Limited or infrequent public transit service and a built environment that is more conducive to privately owned vehicles.
Edge City
An urbanization pattern presenting some features of city center employment mixed with suburban form. Edge cities are often built around highway interchanges (and occasionally around rail stations) with higher concentrations of office and retail space often paired with multi-family residences.
High congestion and a built environment not generally conducive for active transportation.
Exurban A low-density residential development within the commute shed (area) of a larger and denser urbanized area.
Long commute distances and limited public transportation.
Rural
The lowest density development pattern characterized by low-density light industrial, agricultural, and other resource-based employment.
Long travel times between jobs, healthcare, and retail centers with limited public transportation options often necessitating private vehicle ownership.
Adapted from: Shaheen et al., 2017
U.S. Department of Transportation
Office of the Assistant Secretary for Research and Technology
Intelligent Transportation Systems Joint Program Office
50
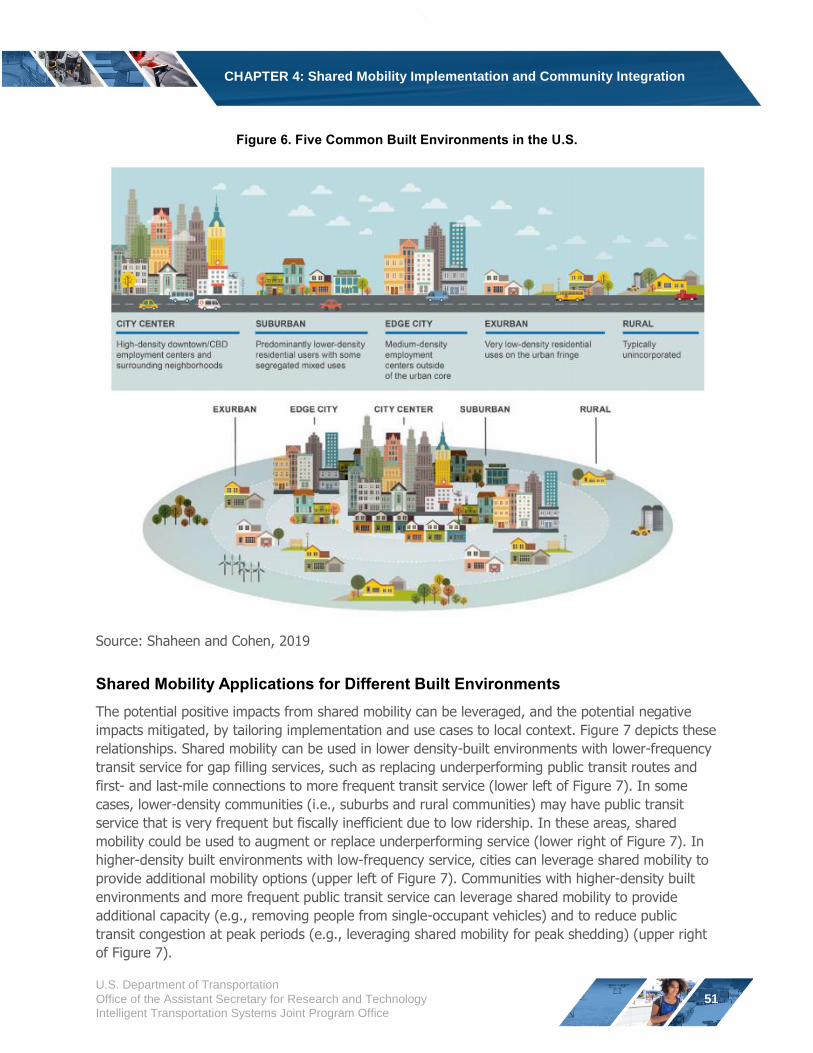
CHAPTER 4: Shared Mobility Implementation and Community Integration
Figure 6. Five Common Built Environments in the U.S.
Source: Shaheen and Cohen, 2019
Shared Mobility Applications for Different Built Environments
The potential positive impacts from shared mobility can be leveraged, and the potential negative
impacts mitigated, by tailoring implementation and use cases to local context. Figure 7 depicts these
relationships. Shared mobility can be used in lower density-built environments with lower-frequency
transit service for gap filling services, such as replacing underperforming public transit routes and
first- and last-mile connections to more frequent transit service (lower left of Figure 7). In some
cases, lower-density communities (i.e., suburbs and rural communities) may have public transit
service that is very frequent but fiscally inefficient due to low ridership. In these areas, shared
mobility could be used to augment or replace underperforming service (lower right of Figure 7). In
higher-density built environments with low-frequency service, cities can leverage shared mobility to
provide additional mobility options (upper left of Figure 7). Communities with higher-density built
environments and more frequent public transit service can leverage shared mobility to provide
additional capacity (e.g., removing people from single-occupant vehicles) and to reduce public
transit congestion at peak periods (e.g., leveraging shared mobility for peak shedding) (upper right
of Figure 7).
U.S. Department of Transportation
Office of the Assistant Secretary for Research and Technology
Intelligent Transportation Systems Joint Program Office
51
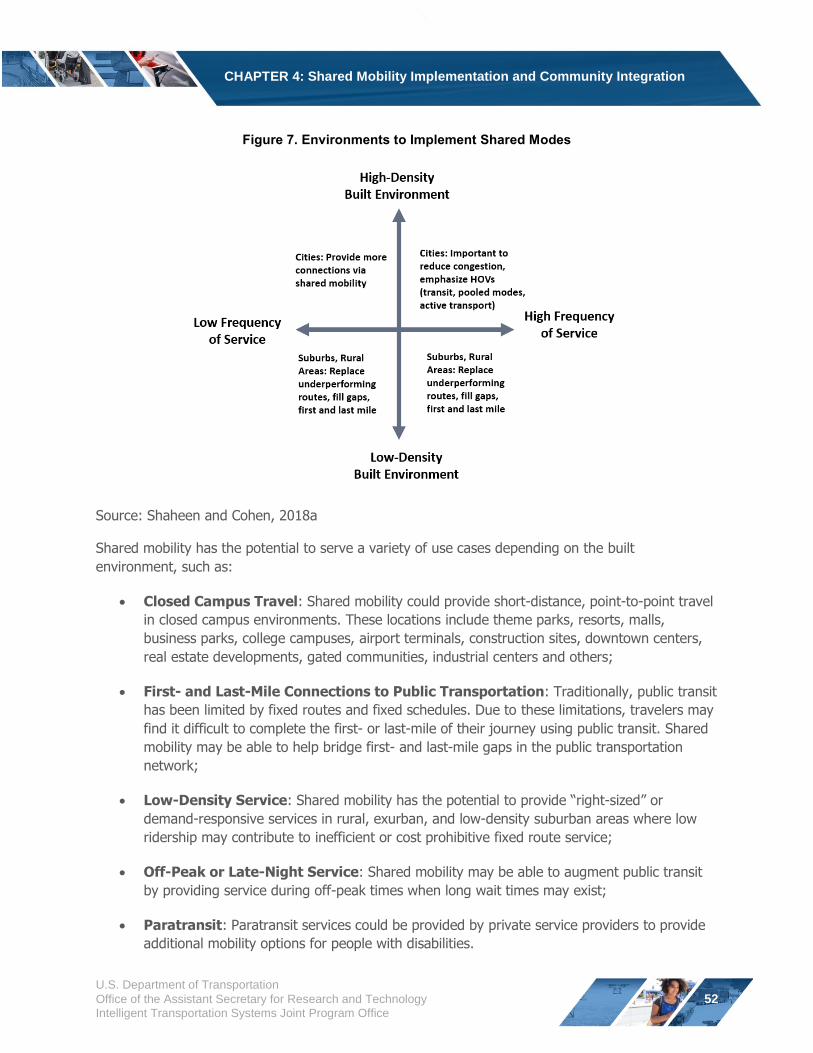
CHAPTER 4: Shared Mobility Implementation and Community Integration
Figure 7. Environments to Implement Shared Modes
Source: Shaheen and Cohen, 2018a
Shared mobility has the potential to serve a variety of use cases depending on the built
environment, such as:
Closed Campus Travel: Shared mobility could provide short-distance, point-to-point travel
in closed campus environments. These locations include theme parks, resorts, malls,
business parks, college campuses, airport terminals, construction sites, downtown centers,
real estate developments, gated communities, industrial centers and others;
First- and Last-Mile Connections to Public Transportation: Traditionally, public transit
has been limited by fixed routes and fixed schedules. Due to these limitations, travelers may
find it difficult to complete the first- or last-mile of their journey using public transit. Shared
mobility may be able to help bridge first- and last-mile gaps in the public transportation
network;
Low-Density Service: Shared mobility has the potential to provide “right-sized” or
demand-responsive services in rural, exurban, and low-density suburban areas where low
ridership may contribute to inefficient or cost prohibitive fixed route service;
Off-Peak or Late-Night Service: Shared mobility may be able to augment public transit
by providing service during off-peak times when long wait times may exist;
Paratransit: Paratransit services could be provided by private service providers to provide
additional mobility options for people with disabilities.
U.S. Department of Transportation
Office of the Assistant Secretary for Research and Technology
Intelligent Transportation Systems Joint Program Office
52
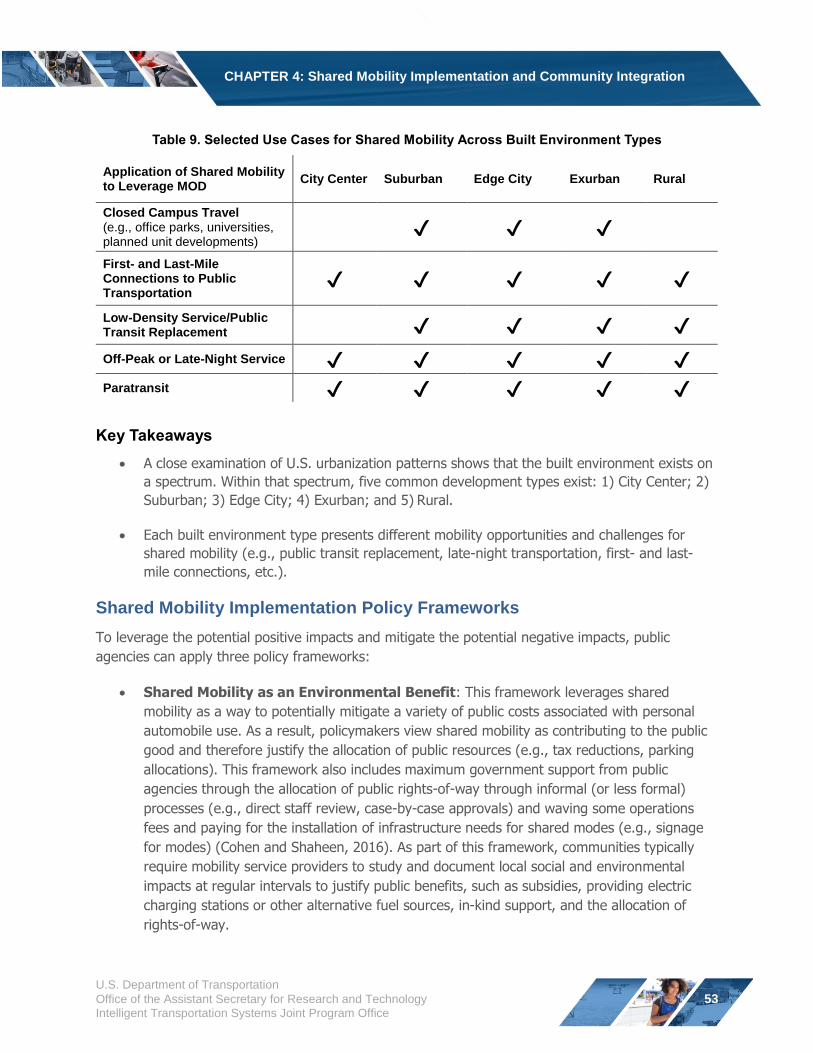
CHAPTER 4: Shared Mobility Implementation and Community Integration
Table 9. Selected Use Cases for Shared Mobility Across Built Environment Types
Application of Shared Mobility to Leverage MOD
City Center Suburban Edge City Exurban Rural
Closed Campus Travel (e.g., office parks, universities, ✔ ✔ ✔ planned unit developments)
First- and Last-Mile Connections to Public ✔ ✔ ✔ ✔ ✔ Transportation
Low-Density Service/Public Transit Replacement ✔ ✔ ✔ ✔ Off-Peak or Late-Night Service ✔ ✔ ✔ ✔ ✔ Paratransit ✔ ✔ ✔ ✔ ✔
Key Takeaways
A close examination of U.S. urbanization patterns shows that the built environment exists on
a spectrum. Within that spectrum, five common development types exist: 1) City Center; 2)
Suburban; 3) Edge City; 4) Exurban; and 5) Rural.
Each built environment type presents different mobility opportunities and challenges for
shared mobility (e.g., public transit replacement, late-night transportation, first- and last-
mile connections, etc.).
Shared Mobility Implementation Policy Frameworks
To leverage the potential positive impacts and mitigate the potential negative impacts, public
agencies can apply three policy frameworks:
Shared Mobility as an Environmental Benefit: This framework leverages shared
mobility as a way to potentially mitigate a variety of public costs associated with personal
automobile use. As a result, policymakers view shared mobility as contributing to the public
good and therefore justify the allocation of public resources (e.g., tax reductions, parking
allocations). This framework also includes maximum government support from public
agencies through the allocation of public rights-of-way through informal (or less formal)
processes (e.g., direct staff review, case-by-case approvals) and waving some operations
fees and paying for the installation of infrastructure needs for shared modes (e.g., signage
for modes) (Cohen and Shaheen, 2016). As part of this framework, communities typically
require mobility service providers to study and document local social and environmental
impacts at regular intervals to justify public benefits, such as subsidies, providing electric
charging stations or other alternative fuel sources, in-kind support, and the allocation of
rights-of-way.
U.S. Department of Transportation
Office of the Assistant Secretary for Research and Technology
Intelligent Transportation Systems Joint Program Office
53
CHAPTER 4: Shared Mobility Implementation and Community Integration
Shared Mobility as a Sustainable Business: This framework considers shared mobility
as a resource that can yield social and environmental benefits, while simultaneously a
revenue-generating business for each operator. This view results in communities providing
more limited support and infrastructure, and mobility operators are expected to carry a
larger share of the operational costs (Cohen and Shaheen, 2016). As part of this framework,
mobility service providers may be required to study and document local social and
environmental impacts on a one-time basis or at regular intervals.
Shared Mobility as a Business: This framework views shared mobility similarly to other
commercial operators, thus providers bear the full costs of operations (e.g., operators pay
the full cost for public rights-of-way). In this laissez-faire approach, public agencies often
provide little or no support for shared mobility, and shared mobility is regulated through
highly formalized processes, supply-and-demand management, and pricing that typically
generates costs plus revenue for a jurisdiction (Cohen and Shaheen, 2016). In this
regulatory framework, mobility service providers are not required to study or document any
social or environmental impacts because they are not receiving any form of monetary or in-
kind public support.
Common provisions for allocating rights-of-way, fees, permitting, signage installation, impact
studies, and community engagement are summarized for each shared mobility policy framework in
Table 10.
U.S. Department of Transportation
Office of the Assistant Secretary for Research and Technology
Intelligent Transportation Systems Joint Program Office
54
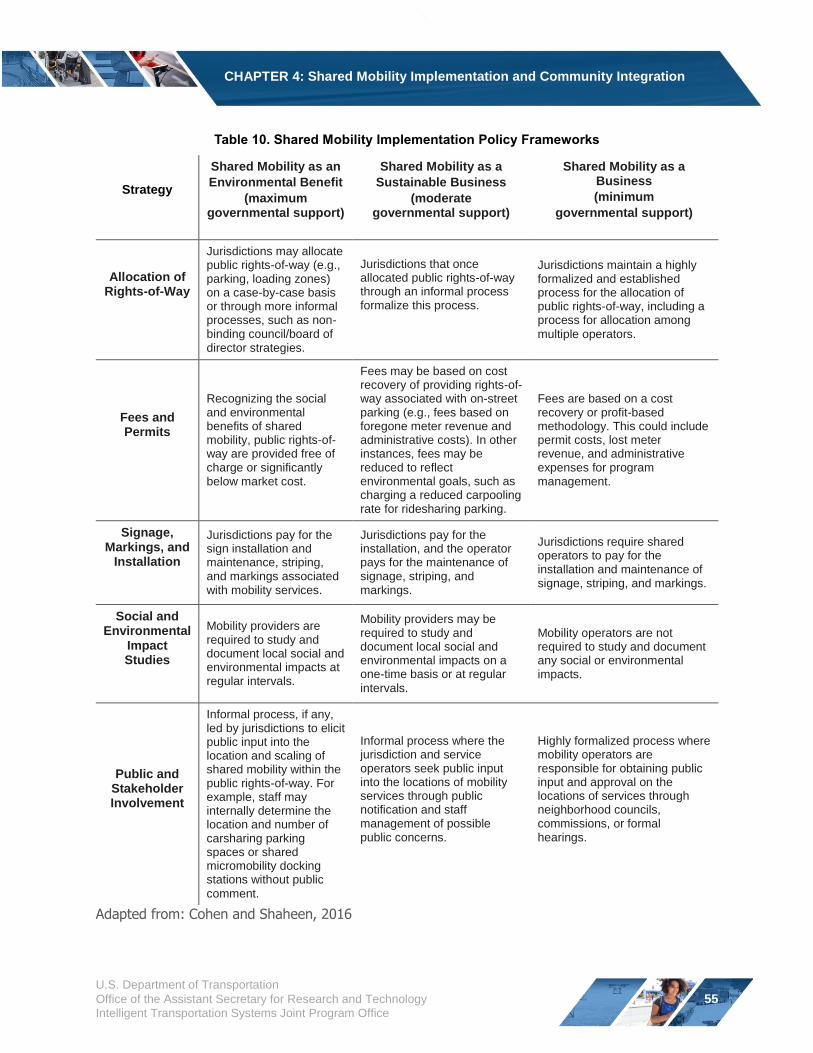
CHAPTER 4: Shared Mobility Implementation and Community Integration
Table 10. Shared Mobility Implementation Policy Frameworks
Strategy
Shared Mobility as an
Environmental Benefit
(maximum governmental support)
Shared Mobility as a
Sustainable Business
(moderate governmental support)
Shared Mobility as a Business
(minimum
governmental support)
Allocation of Rights-of-Way
Jurisdictions may allocate public rights-of-way (e.g., parking, loading zones) on a case-by-case basis or through more informal processes, such as non-binding council/board of director strategies.
Jurisdictions that once allocated public rights-of-way through an informal process formalize this process.
Jurisdictions maintain a highly formalized and established process for the allocation of public rights-of-way, including a process for allocation among
multiple operators.
Fees and Permits
Recognizing the social and environmental benefits of shared mobility, public rights-of-way are provided free of charge or significantly below market cost.
Fees may be based on cost recovery of providing rights-of-way associated with on-street parking (e.g., fees based on foregone meter revenue and administrative costs). In other instances, fees may be reduced to reflect environmental goals, such as charging a reduced carpooling rate for ridesharing parking.
Fees are based on a cost recovery or profit-based methodology. This could include permit costs, lost meter revenue, and administrative expenses for program management.
Signage, Markings, and
Installation
Jurisdictions pay for the sign installation and maintenance, striping, and markings associated with mobility services.
Jurisdictions pay for the installation, and the operator pays for the maintenance of signage, striping, and markings.
Jurisdictions require shared operators to pay for the installation and maintenance of signage, striping, and markings.
Social and Environmental
Impact Studies
Mobility providers are required to study and document local social and environmental impacts at regular intervals.
Mobility providers may be required to study and document local social and environmental impacts on a one-time basis or at regular
intervals.
Mobility operators are not required to study and document any social or environmental impacts.
Public and Stakeholder Involvement
Informal process, if any, led by jurisdictions to elicit public input into the location and scaling of shared mobility within the public rights-of-way. For example, staff may internally determine the location and number of carsharing parking spaces or shared micromobility docking stations without public
comment.
Informal process where the jurisdiction and service operators seek public input into the locations of mobility services through public notification and staff management of possible public concerns.
Highly formalized process where mobility operators are responsible for obtaining public input and approval on the locations of services through neighborhood councils, commissions, or formal hearings.
Adapted from: Cohen and Shaheen, 2016
U.S. Department of Transportation
Office of the Assistant Secretary for Research and Technology
Intelligent Transportation Systems Joint Program Office
55
CHAPTER 4: Shared Mobility Implementation and Community Integration
Key Takeaways
Public agencies can use three policy frameworks for shared mobility implementation. These
frameworks consist of:
o Shared Mobility as an Environmental Benefit that leverages shared mobility to
mitigate potential negative consequences of personal vehicle use and justifies
maximum public-sector support.
o Shared Mobility as a Sustainable Business that leverages shared mobility as a
resource that may offer environmental benefits that warrants moderate public-sector
support.
o Shared Mobility as a Business that views shared mobility as a business and
provides limited public-sector support.
U.S. Department of Transportation
Office of the Assistant Secretary for Research and Technology
Intelligent Transportation Systems Joint Program Office
56
CHAPTER 4: Shared Mobility Implementation and Community Integration
Rights-of-Way and Shared Mobility
Rights-of-way is a term used to describe the legal passage of people (and their means of
transportation) along public and, sometimes, private property. Rights-of-way includes transportation
infrastructure, such as streets, bicycle lanes, sidewalks, and other public and quasi-public spaces
(such as an outdoor plazas). A number of communities have developed a combination of formal and
informal policies to manage and allocate rights-of-way such as curbspace, loading zones, and
parking for MOD (Howell et al., 2019). Many of these policies focus on:
Allocating rights-of-way for shared mobility;
Managing demand among multiple modes and operators;
Determining the monetary value of rights-of-way;
Defining a shared or on-demand service for regulation and code enforcement; and
Addressing a variety of related administrative issues, such as enforcement, insurance, and
indemnification (i.e., protection for one party against the damages and/or expenses caused
by another party).
Allocating rights-of-way can also support the development of complete streets by accomodating and
integrating multiple transportation modes, services, and facilities. The concept of complete streets
involves a transportation policy and design approach that requires streets to be planned, designed,
operated, and maintained to enable safe, convenient, and comfortable travel and access for users of
all ages and abilities regardless of their mode of transportation. Complete streets vary based on
community contexts but typically include multimodal infrastructure and design considerations, such
as general travel lanes, bike lanes, sidewalks, frequent and safe crosswalks, accessible pedestrian
signals, transit facilities and accomodations, and designated parking and loading zones.
This section provides an overview of shared mobility’s impacts on rights-of-way; practices for
managing and allocating rights-of-way (e.g., curbspace, loading zones, and parking); and methods
for managing competition among modes and services.
Impacts of Shared Mobility on Rights-of-Way
Shared Mobility can have a number of impacts on the public right-of-way, such as:
Increased use of parking, loading zones, and curbspace by shared modes that can create
competition among modes and service providers for a limited amount of space;
Increased modal and operator activity may also create safety hazards, such as modal
conflicts and congestion in high-traffic locations; and
U.S. Department of Transportation
Office of the Assistant Secretary for Research and Technology
Intelligent Transportation Systems Joint Program Office
57
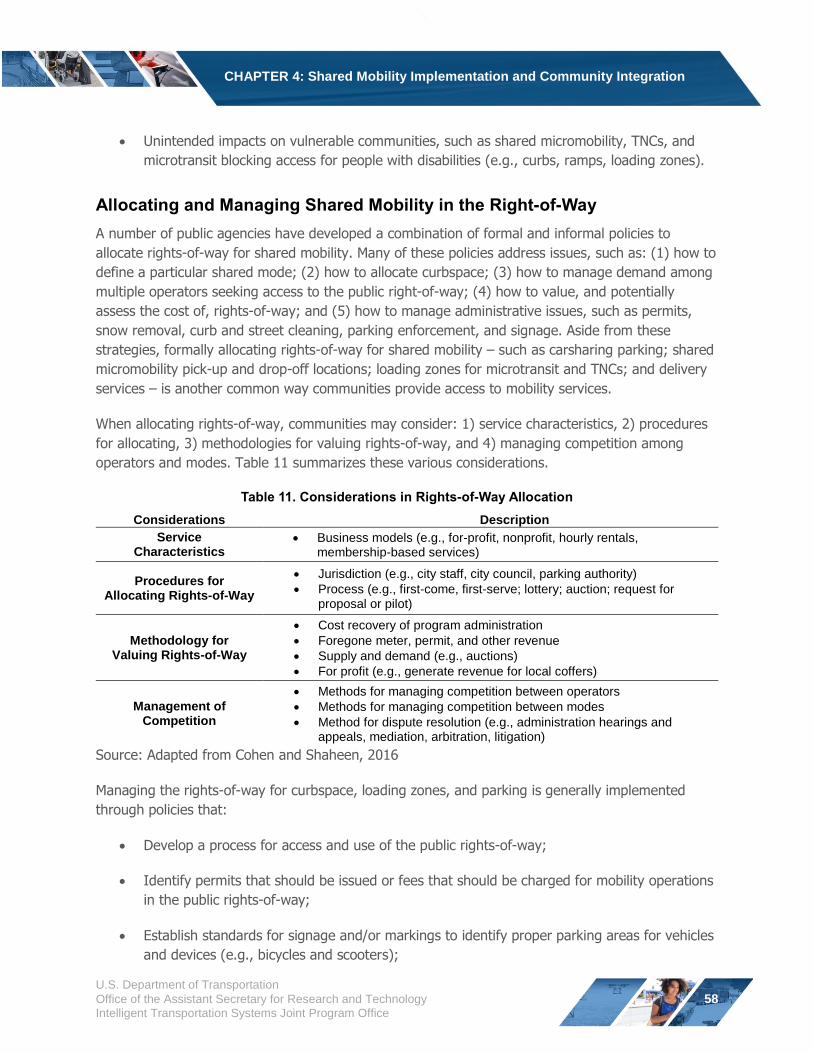
CHAPTER 4: Shared Mobility Implementation and Community Integration
Unintended impacts on vulnerable communities, such as shared micromobility, TNCs, and
microtransit blocking access for people with disabilities (e.g., curbs, ramps, loading zones).
Allocating and Managing Shared Mobility in the Right-of-Way
A number of public agencies have developed a combination of formal and informal policies to
allocate rights-of-way for shared mobility. Many of these policies address issues, such as: (1) how to
define a particular shared mode; (2) how to allocate curbspace; (3) how to manage demand among
multiple operators seeking access to the public right-of-way; (4) how to value, and potentially
assess the cost of, rights-of-way; and (5) how to manage administrative issues, such as permits,
snow removal, curb and street cleaning, parking enforcement, and signage. Aside from these
strategies, formally allocating rights-of-way for shared mobility – such as carsharing parking; shared
micromobility pick-up and drop-off locations; loading zones for microtransit and TNCs; and delivery
services – is another common way communities provide access to mobility services.
When allocating rights-of-way, communities may consider: 1) service characteristics, 2) procedures
for allocating, 3) methodologies for valuing rights-of-way, and 4) managing competition among
operators and modes. Table 11 summarizes these various considerations.
Table 11. Considerations in Rights-of-Way Allocation
Considerations Description
Service Business models (e.g., for-profit, nonprofit, hourly rentals, Characteristics membership-based services)
Jurisdiction (e.g., city staff, city council, parking authority) Procedures for
Process (e.g., first-come, first-serve; lottery; auction; request for Allocating Rights-of-Way
proposal or pilot)
Cost recovery of program administration
Methodology for Foregone meter, permit, and other revenue Valuing Rights-of-Way Supply and demand (e.g., auctions)
For profit (e.g., generate revenue for local coffers)
Methods for managing competition between operators
Management of Methods for managing competition between modes Competition Method for dispute resolution (e.g., administration hearings and
appeals, mediation, arbitration, litigation)
Source: Adapted from Cohen and Shaheen, 2016
Managing the rights-of-way for curbspace, loading zones, and parking is generally implemented
through policies that:
Develop a process for access and use of the public rights-of-way;
Identify permits that should be issued or fees that should be charged for mobility operations
in the public rights-of-way;
Establish standards for signage and/or markings to identify proper parking areas for vehicles
and devices (e.g., bicycles and scooters);
U.S. Department of Transportation
Office of the Assistant Secretary for Research and Technology
Intelligent Transportation Systems Joint Program Office
58
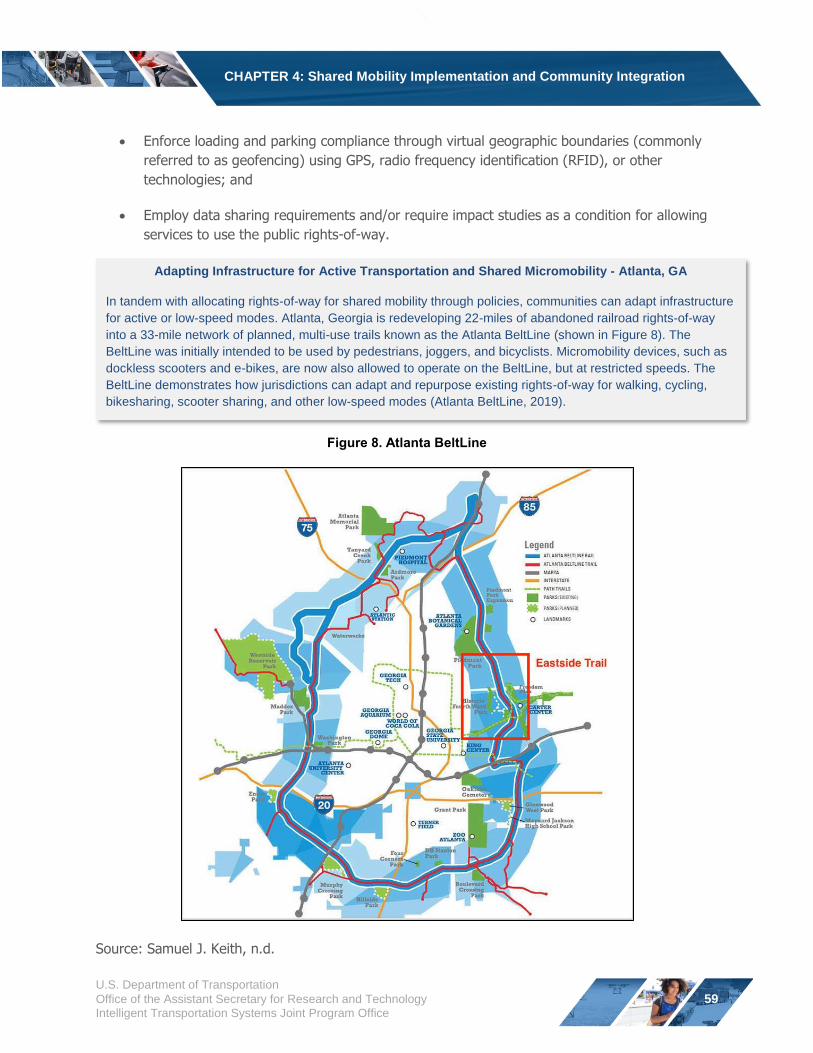
CHAPTER 4: Shared Mobility Implementation and Community Integration
Enforce loading and parking compliance through virtual geographic boundaries (commonly
referred to as geofencing) using GPS, radio frequency identification (RFID), or other
technologies; and
Employ data sharing requirements and/or require impact studies as a condition for allowing
services to use the public rights-of-way.
Adapting Infrastructure for Active Transportation and Shared Micromobility - Atlanta, GA
In tandem with allocating rights-of-way for shared mobility through policies, communities can adapt infrastructure
for active or low-speed modes. Atlanta, Georgia is redeveloping 22-miles of abandoned railroad rights-of-way
into a 33-mile network of planned, multi-use trails known as the Atlanta BeltLine (shown in Figure 8). The
BeltLine was initially intended to be used by pedestrians, joggers, and bicyclists. Micromobility devices, such as
dockless scooters and e-bikes, are now also allowed to operate on the BeltLine, but at restricted speeds. The
BeltLine demonstrates how jurisdictions can adapt and repurpose existing rights-of-way for walking, cycling,
bikesharing, scooter sharing, and other low-speed modes (Atlanta BeltLine, 2019).
Figure 8. Atlanta BeltLine
Source: Samuel J. Keith, n.d.
U.S. Department of Transportation
Office of the Assistant Secretary for Research and Technology
Intelligent Transportation Systems Joint Program Office
59
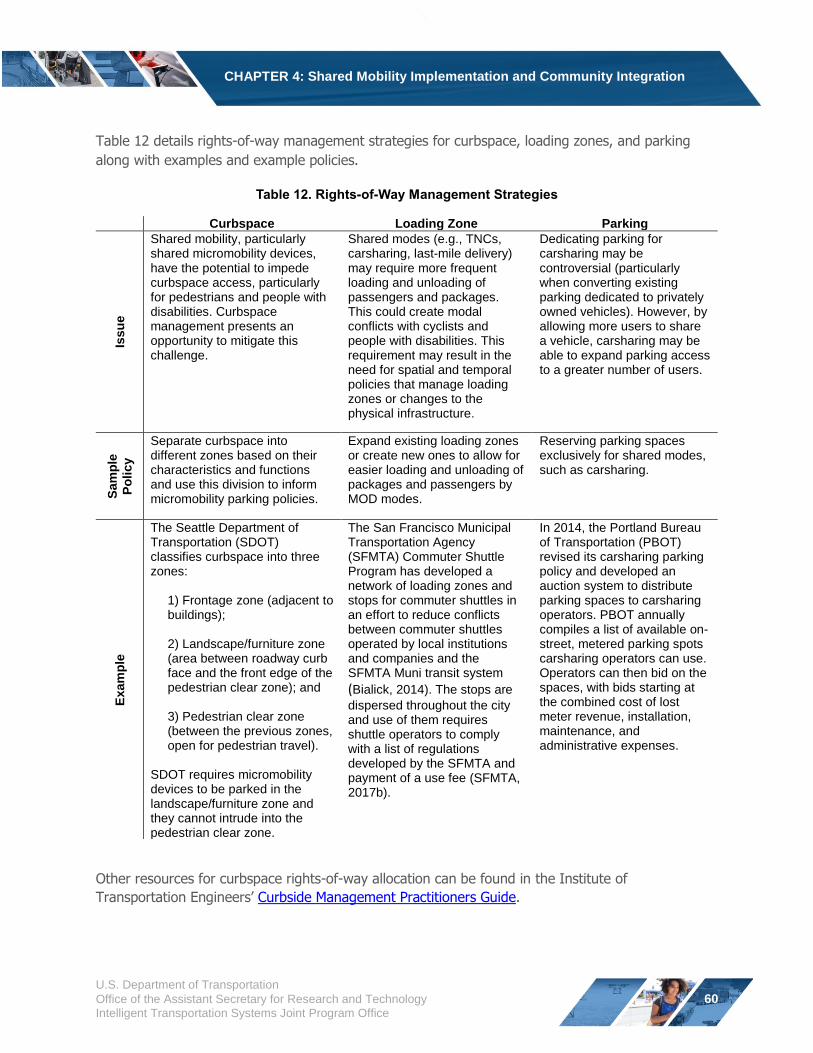
CHAPTER 4: Shared Mobility Implementation and Community Integration
Table 12 details rights-of-way management strategies for curbspace, loading zones, and parking
along with examples and example policies.
Table 12. Rights-of-Way Management Strategies
Curbspace Loading Zone Parking
Issu
e
Shared mobility, particularly shared micromobility devices, have the potential to impede curbspace access, particularly for pedestrians and people with disabilities. Curbspace management presents an opportunity to mitigate this
Shared modes (e.g., TNCs, carsharing, last-mile delivery) may require more frequent loading and unloading of passengers and packages. This could create modal conflicts with cyclists and people with disabilities. This
Dedicating parking for carsharing may be controversial (particularly when converting existing parking dedicated to privately owned vehicles). However, by allowing more users to share a vehicle, carsharing may be
challenge. requirement may result in the need for spatial and temporal policies that manage loading zones or changes to the physical infrastructure.
able to expand parking access to a greater number of users.
Sam
ple
Po
licy
Separate curbspace into different zones based on their characteristics and functions and use this division to inform micromobility parking policies.
Expand existing loading zones or create new ones to allow for easier loading and unloading of packages and passengers by MOD modes.
Reserving parking spaces exclusively for shared modes, such as carsharing.
Exam
ple
The Seattle Department of Transportation (SDOT) classifies curbspace into three zones:
1) Frontage zone (adjacent to buildings);
2) Landscape/furniture zone (area between roadway curb face and the front edge of the pedestrian clear zone); and
The San Francisco Municipal Transportation Agency (SFMTA) Commuter Shuttle Program has developed a network of loading zones and stops for commuter shuttles in an effort to reduce conflicts between commuter shuttles operated by local institutions and companies and the SFMTA Muni transit system
(Bialick, 2014). The stops are
dispersed throughout the city
In 2014, the Portland Bureau of Transportation (PBOT) revised its carsharing parking policy and developed an auction system to distribute parking spaces to carsharing operators. PBOT annually compiles a list of available on-street, metered parking spots carsharing operators can use. Operators can then bid on the spaces, with bids starting at the combined cost of lost
3) Pedestrian clear zone (between the previous zones, open for pedestrian travel).
SDOT requires micromobility devices to be parked in the landscape/furniture zone and they cannot intrude into the pedestrian clear zone.
and use of them requires shuttle operators to comply with a list of regulations developed by the SFMTA and payment of a use fee (SFMTA, 2017b).
meter revenue, installation, maintenance, and administrative expenses.
Other resources for curbspace rights-of-way allocation can be found in the Institute of
Transportation Engineers’ Curbside Management Practitioners Guide.
U.S. Department of Transportation
Office of the Assistant Secretary for Research and Technology
Intelligent Transportation Systems Joint Program Office
60
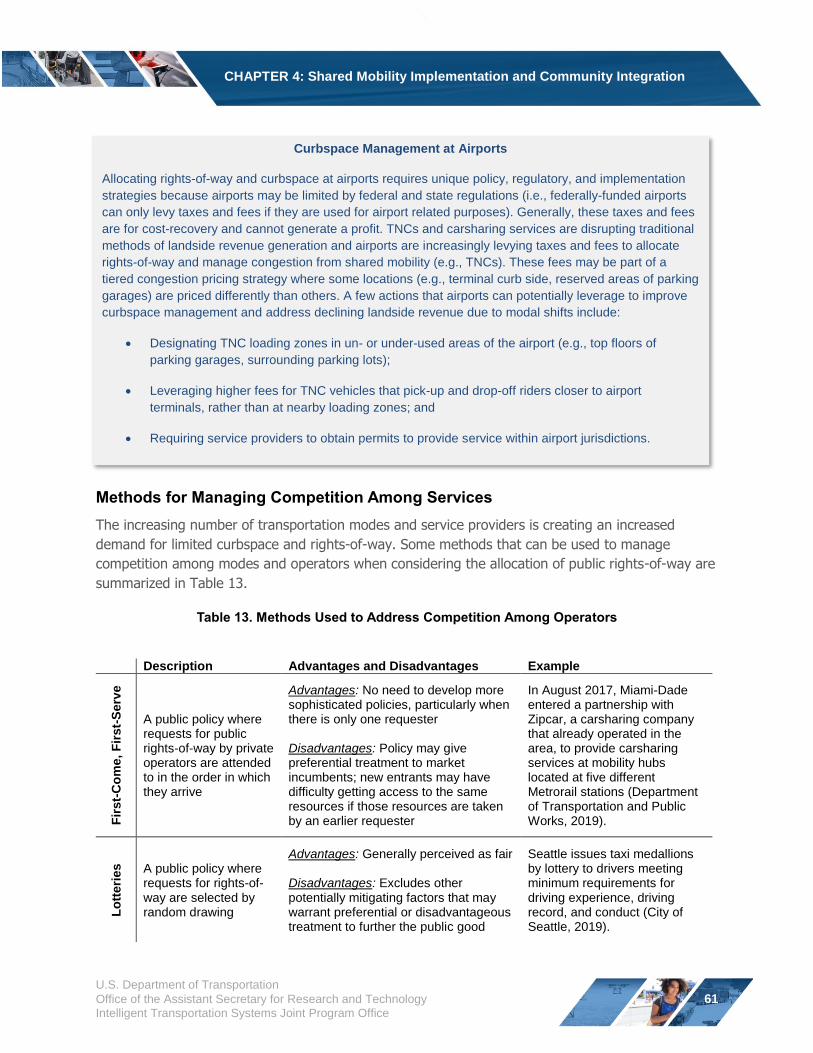
CHAPTER 4: Shared Mobility Implementation and Community Integration
Curbspace Management at Airports
Allocating rights-of-way and curbspace at airports requires unique policy, regulatory, and implementation
strategies because airports may be limited by federal and state regulations (i.e., federally-funded airports
can only levy taxes and fees if they are used for airport related purposes). Generally, these taxes and fees
are for cost-recovery and cannot generate a profit. TNCs and carsharing services are disrupting traditional
methods of landside revenue generation and airports are increasingly levying taxes and fees to allocate
rights-of-way and manage congestion from shared mobility (e.g., TNCs). These fees may be part of a
tiered congestion pricing strategy where some locations (e.g., terminal curb side, reserved areas of parking
garages) are priced differently than others. A few actions that airports can potentially leverage to improve
curbspace management and address declining landside revenue due to modal shifts include:
Designating TNC loading zones in un- or under-used areas of the airport (e.g., top floors of
parking garages, surrounding parking lots);
Leveraging higher fees for TNC vehicles that pick-up and drop-off riders closer to airport
terminals, rather than at nearby loading zones; and
Requiring service providers to obtain permits to provide service within airport jurisdictions.
Methods for Managing Competition Among Services
The increasing number of transportation modes and service providers is creating an increased
demand for limited curbspace and rights-of-way. Some methods that can be used to manage
competition among modes and operators when considering the allocation of public rights-of-way are
summarized in Table 13.
Table 13. Methods Used to Address Competition Among Operators
Description Advantages and Disadvantages Example
Fir
st-
Co
me, F
irst-
Serv
e
A public policy where requests for public rights-of-way by private operators are attended to in the order in which they arrive
Advantages: No need to develop more sophisticated policies, particularly when there is only one requester
Disadvantages: Policy may give preferential treatment to market incumbents; new entrants may have difficulty getting access to the same resources if those resources are taken by an earlier requester
In August 2017, Miami-Dade entered a partnership with Zipcar, a carsharing company that already operated in the area, to provide carsharing services at mobility hubs located at five different Metrorail stations (Department of Transportation and Public Works, 2019).
Lo
tteri
es A public policy where
requests for rights-of-way are selected by random drawing
Advantages: Generally perceived as fair
Disadvantages: Excludes other potentially mitigating factors that may warrant preferential or disadvantageous treatment to further the public good
Seattle issues taxi medallions by lottery to drivers meeting minimum requirements for driving experience, driving record, and conduct (City of Seattle, 2019).
U.S. Department of Transportation
Office of the Assistant Secretary for Research and Technology
Intelligent Transportation Systems Joint Program Office
61
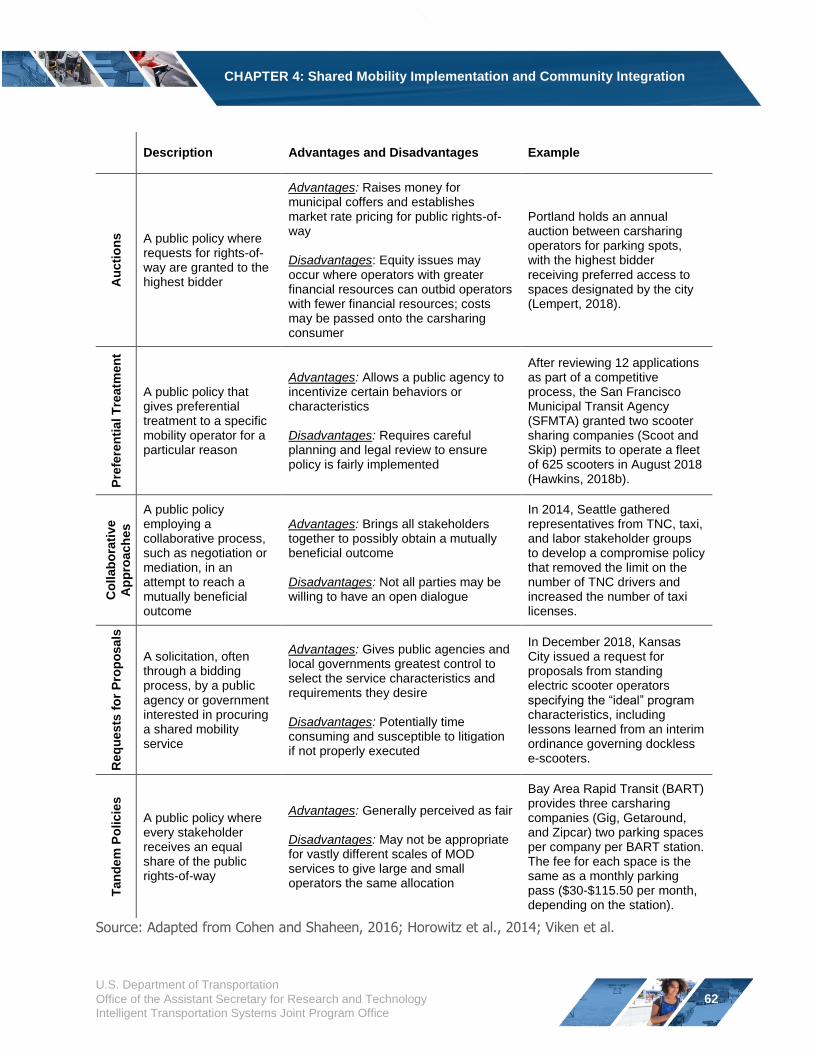
CHAPTER 4: Shared Mobility Implementation and Community Integration
Description Advantages and Disadvantages Example
Au
cti
on
s A public policy where requests for rights-of-way are granted to the highest bidder
Advantages: Raises money for municipal coffers and establishes market rate pricing for public rights-of-way
Disadvantages: Equity issues may occur where operators with greater financial resources can outbid operators with fewer financial resources; costs may be passed onto the carsharing consumer
Portland holds an annual auction between carsharing operators for parking spots, with the highest bidder receiving preferred access to spaces designated by the city (Lempert, 2018).
Pre
fere
nti
al T
reatm
en
t
A public policy that gives preferential treatment to a specific mobility operator for a particular reason
Advantages: Allows a public agency to incentivize certain behaviors or characteristics
Disadvantages: Requires careful planning and legal review to ensure policy is fairly implemented
After reviewing 12 applications as part of a competitive process, the San Francisco Municipal Transit Agency (SFMTA) granted two scooter sharing companies (Scoot and Skip) permits to operate a fleet of 625 scooters in August 2018 (Hawkins, 2018b).
Co
llab
ora
tive
Ap
pro
ach
es
A public policy employing a collaborative process, such as negotiation or mediation, in an attempt to reach a mutually beneficial outcome
Advantages: Brings all stakeholders together to possibly obtain a mutually beneficial outcome
Disadvantages: Not all parties may be willing to have an open dialogue
In 2014, Seattle gathered representatives from TNC, taxi, and labor stakeholder groups to develop a compromise policy that removed the limit on the number of TNC drivers and increased the number of taxi licenses.
Req
uests
fo
r P
rop
osals
A solicitation, often through a bidding process, by a public agency or government interested in procuring a shared mobility service
Advantages: Gives public agencies and local governments greatest control to select the service characteristics and requirements they desire
Disadvantages: Potentially time consuming and susceptible to litigation if not properly executed
In December 2018, Kansas City issued a request for proposals from standing electric scooter operators specifying the “ideal” program characteristics, including lessons learned from an interim ordinance governing dockless e-scooters.
Tan
de
m P
olicie
s
A public policy where every stakeholder receives an equal share of the public rights-of-way
Advantages: Generally perceived as fair
Disadvantages: May not be appropriate for vastly different scales of MOD services to give large and small operators the same allocation
Bay Area Rapid Transit (BART) provides three carsharing companies (Gig, Getaround, and Zipcar) two parking spaces per company per BART station. The fee for each space is the same as a monthly parking pass ($30-$115.50 per month, depending on the station).
Source: Adapted from Cohen and Shaheen, 2016; Horowitz et al., 2014; Viken et al.
U.S. Department of Transportation
Office of the Assistant Secretary for Research and Technology
Intelligent Transportation Systems Joint Program Office
62
CHAPTER 4: Shared Mobility Implementation and Community Integration
Key Takeaways
An increasing number of shared modes and operators can impact the rights-of-way in a
number of ways. Potential adverse impacts can be mitigated through strategies that manage
and allocate rights-of-way access among service providers.
Rights-of-way policies can be broadly categorized into curbspace, loading zones, and parking
policies. These categories can help communities develop and implement more targeted
rights-of-way management strategies.
When allocating rights-of-way, communities may consider service characteristics and
procedures for allocating and valuing rights-of-way and managing competition among
operators and modes.
Incentive Zoning
Parking can be a major expense for communities and developers, with spaces costing upwards of
tens of thousands of dollars to construct. Integrating shared mobility into existing and new
developments offers an opportunity to expand transportation options and reduce the need for, and
cost of, parking. Communities can implement an array of policies aimed at easing zoning regulations
and parking minimums to promote the inclusion of shared mobility in new developments (Cohen and
Shaheen, 2016). Commonly referred to as incentive zoning, these policies can be categorized as:
Policies that reduce required parking for the inclusion of shared mobility, and
Policies that increase development density for the inclusion of shared mobility.
Parking reduction policies are ideal in urban areas with particularly high housing or parking
construction costs. This strategy can help make housing more affordable by reducing per-unit costs
and can encourage neighborhood redevelopment and revitalization by making it easier for
developers to have positive cash flows and higher capitalization rates on real estate projects.
Similarly, parking substitution (i.e., replacing general-use parking with parking for shared modes)
can be employed in both new and existing developments (Cohen and Shaheen, 2016).
Policies that allow increased density generally include greater floor-to-area ratios, more dwelling
units permitted per acre, and greater height allowances. Similar to parking reduction, policies that
allow for increased density aim at making development more lucrative for developers and real estate
investors. Rather than reducing per-unit or overall project costs, these policies increase the overall
cash flow of development projects. Allowing increased density is most appropriate for cities seeking
to increase overall urban density, residential density, or both. These strategies can be particularly
effective at encouraging brownfield redevelopment because these parcels are often more expensive
to repurpose due to the costs commonly associated with environmental remediation (Cohen and
Shaheen 2016).
U.S. Department of Transportation
Office of the Assistant Secretary for Research and Technology
Intelligent Transportation Systems Joint Program Office
63
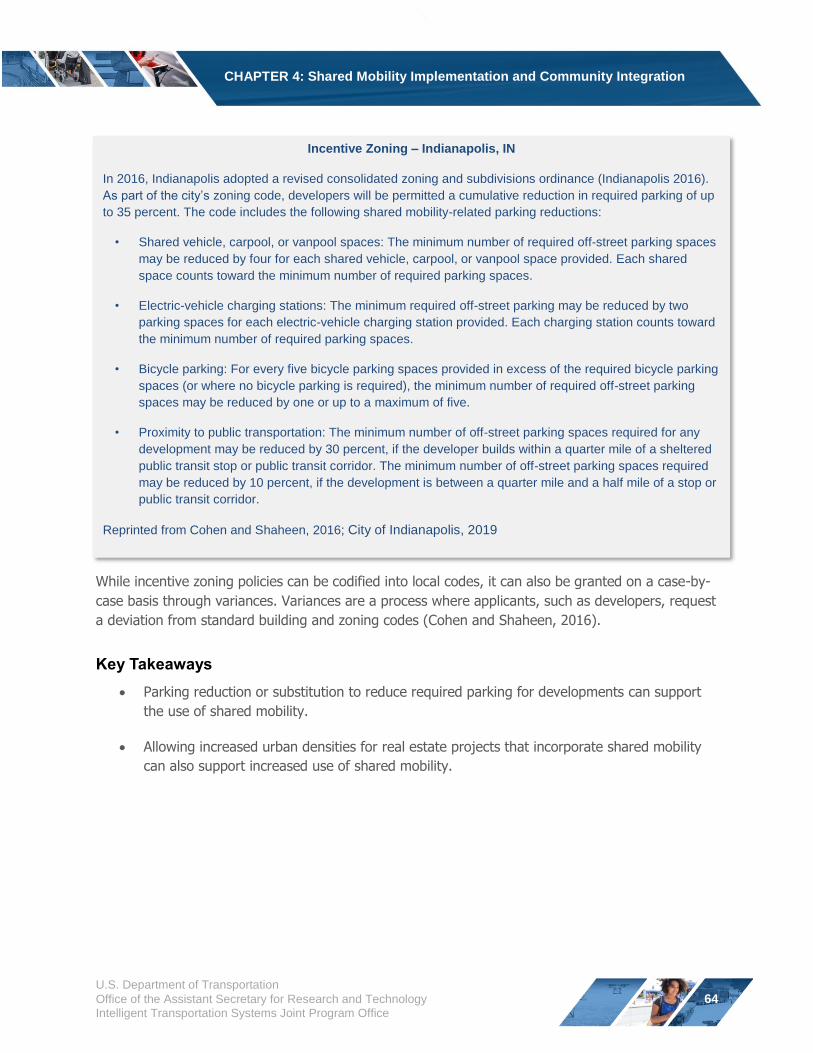
CHAPTER 4: Shared Mobility Implementation and Community Integration
Incentive Zoning – Indianapolis, IN
In 2016, Indianapolis adopted a revised consolidated zoning and subdivisions ordinance (Indianapolis 2016).
As part of the city’s zoning code, developers will be permitted a cumulative reduction in required parking of up
to 35 percent. The code includes the following shared mobility-related parking reductions:
• Shared vehicle, carpool, or vanpool spaces: The minimum number of required off-street parking spaces
may be reduced by four for each shared vehicle, carpool, or vanpool space provided. Each shared
space counts toward the minimum number of required parking spaces.
• Electric-vehicle charging stations: The minimum required off-street parking may be reduced by two
parking spaces for each electric-vehicle charging station provided. Each charging station counts toward
the minimum number of required parking spaces.
• Bicycle parking: For every five bicycle parking spaces provided in excess of the required bicycle parking
spaces (or where no bicycle parking is required), the minimum number of required off-street parking
spaces may be reduced by one or up to a maximum of five.
• Proximity to public transportation: The minimum number of off-street parking spaces required for any
development may be reduced by 30 percent, if the developer builds within a quarter mile of a sheltered
public transit stop or public transit corridor. The minimum number of off-street parking spaces required
may be reduced by 10 percent, if the development is between a quarter mile and a half mile of a stop or
public transit corridor.
Reprinted from Cohen and Shaheen, 2016; City of Indianapolis, 2019
While incentive zoning policies can be codified into local codes, it can also be granted on a case-by-
case basis through variances. Variances are a process where applicants, such as developers, request
a deviation from standard building and zoning codes (Cohen and Shaheen, 2016).
Key Takeaways
Parking reduction or substitution to reduce required parking for developments can support
the use of shared mobility.
Allowing increased urban densities for real estate projects that incorporate shared mobility
can also support increased use of shared mobility.
U.S. Department of Transportation
Office of the Assistant Secretary for Research and Technology
Intelligent Transportation Systems Joint Program Office
64
CHAPTER 4: Shared Mobility Implementation and Community Integration
Multimodal Integration
Multimodal integration can improve connectivity and traveler convenience, helping reduce traveler
reliance on private vehicles. Multimodal integration can be achieved through the physical co-location
of mobility services, integrated fare payment across modes, and information integration, such as trip
planning apps and multimodal aggregators. Each of these are discussed in the context of policies
and practices in the following sections.
Please be aware that FHWA publishes a Fostering Multimodal Connectivity Newsletter to provide
transportation professionals with real-world examples of strategies for multimodal transportation.
The goal is that these investments will promote economic revitalization, provide access to jobs, and
achieve safer communities through support of accelerated project delivery, technology and design
innovation, and public-private partnerships. The newsletter communicates FHWA and partner efforts
in support of the USDOT Strategic Plan for improving connectivity, accessibility, safety, and
convenience for all users.
Physical Integration
Fundamentally, physical integration is about providing places where people can make seamless
connections between travel modes (e.g., shared mobility, public transportation, etc.). Co-locating
services (both passenger mobility and goods delivery) and public transportation can create a
network effect that can multiply the effectiveness of MOD. MPOs and other public agencies have
begun developing best practices to encourage mobility hubs and transit-oriented developments
(TOD) around transportation nodes (Federal Highway Administration, 2018b; Federal Transit
Administration, 2015a). Although similar in approach, TOD focuses on increasing density around
corridors and mobility hubs with the goal of increasing transit ridership and shared mobility use
(Cervero and Dai, 2014). Mobility hubs present an opportunity to equitably integrate shared mobility
and TOD (Anderson et al., 2017). The Broward Metropolitan Planning Organization has developed
mobility hub typologies comprising of:
Gateway Hubs that have a high number of boardings and disembarkings, are surrounded
by high-density mixed-use areas, and serve at least two high capacity transit lines;
Anchor Hubs that have a moderate to high number of boardings and disembarkings, are
surrounded by employment centers and major institutions, and serve at least one high
capacity transit line; and
Community Hubs that serve more local trips than regional trips and serve local bus routes.
Source: Broward Metropolitan Planning Organization, 2009
Table 14 provides key characteristics that are typically included with most mobility hubs and
potential actions public agencies can take to implement these characteristics (Broward Metropolitan
Planning Organization, 2009; SANDAG, 2017).
U.S. Department of Transportation
Office of the Assistant Secretary for Research and Technology
Intelligent Transportation Systems Joint Program Office
65
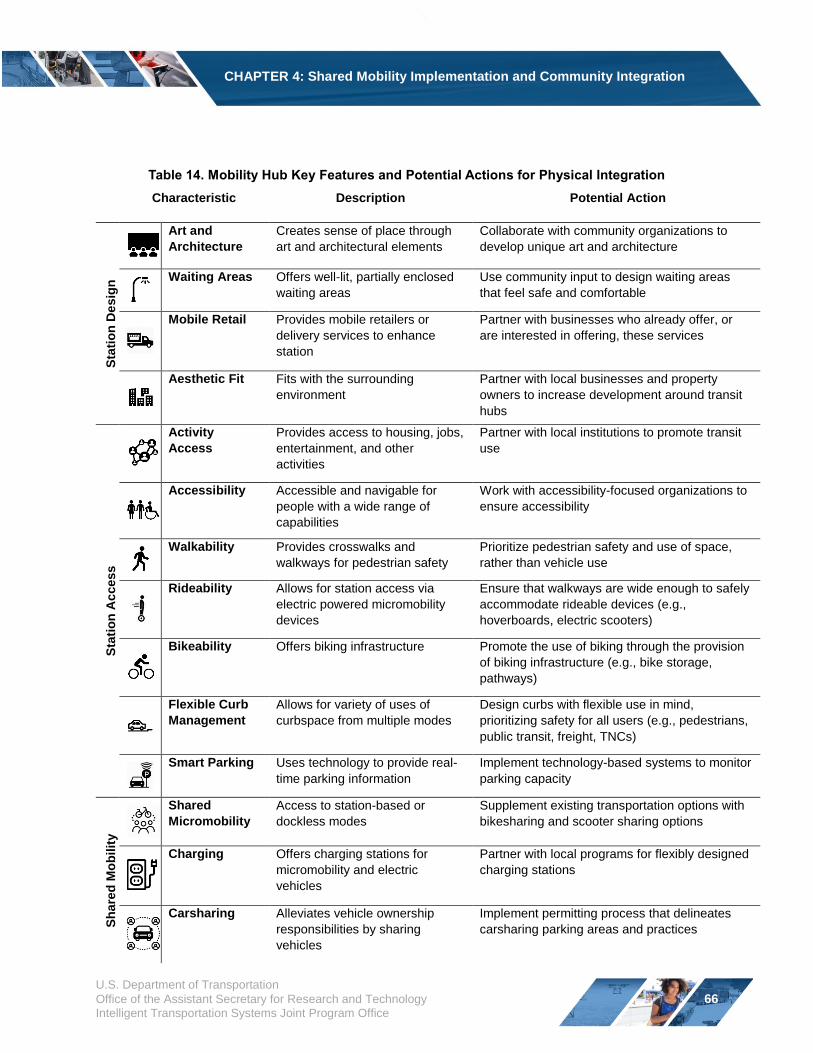
CHAPTER 4: Shared Mobility Implementation and Community Integration
Table 14. Mobility Hub Key Features and Potential Actions for Physical Integration
Characteristic Description Potential Action
Sta
tio
n D
esig
n
Art and
Architecture
Creates sense of place through
art and architectural elements
Collaborate with community organizations to
develop unique art and architecture
Waiting Areas Offers well-lit, partially enclosed
waiting areas
Use community input to design waiting areas
that feel safe and comfortable
Mobile Retail Provides mobile retailers or
delivery services to enhance
station
Partner with businesses who already offer, or
are interested in offering, these services
Aesthetic Fit Fits with the surrounding
environment
Partner with local businesses and property
owners to increase development around transit
hubs
Sta
tio
n A
ccess
Activity
Access
Provides access to housing, jobs,
entertainment, and other
activities
Partner with local institutions to promote transit
use
Accessibility Accessible and navigable for
people with a wide range of
capabilities
Work with accessibility-focused organizations to
ensure accessibility
Walkability Provides crosswalks and
walkways for pedestrian safety
Prioritize pedestrian safety and use of space,
rather than vehicle use
Rideability Allows for station access via
electric powered micromobility
devices
Ensure that walkways are wide enough to safely
accommodate rideable devices (e.g.,
hoverboards, electric scooters)
Bikeability Offers biking infrastructure Promote the use of biking through the provision
of biking infrastructure (e.g., bike storage,
pathways)
Flexible Curb
Management
Allows for variety of uses of
curbspace from multiple modes
Design curbs with flexible use in mind,
prioritizing safety for all users (e.g., pedestrians,
public transit, freight, TNCs)
Smart Parking Uses technology to provide real-
time parking information
Implement technology-based systems to monitor
parking capacity
Sh
are
d M
ob
ilit
y
Shared
Micromobility
Access to station-based or
dockless modes
Supplement existing transportation options with
bikesharing and scooter sharing options
Charging Offers charging stations for
micromobility and electric
vehicles
Partner with local programs for flexibly designed
charging stations
Carsharing Alleviates vehicle ownership
responsibilities by sharing
vehicles
Implement permitting process that delineates
carsharing parking areas and practices
U.S. Department of Transportation
Office of the Assistant Secretary for Research and Technology
Intelligent Transportation Systems Joint Program Office
66
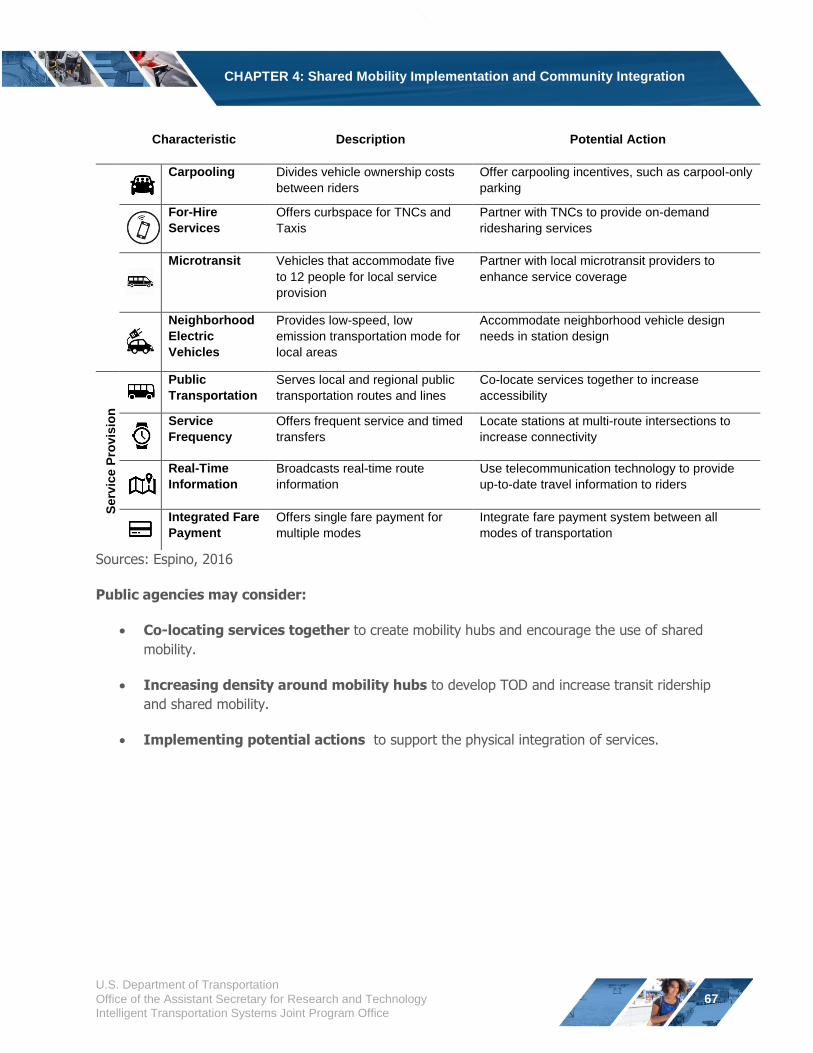
CHAPTER 4: Shared Mobility Implementation and Community Integration
Characteristic Description Potential Action
Carpooling Divides vehicle ownership costs Offer carpooling incentives, such as carpool-only
between riders parking
For-Hire Offers curbspace for TNCs and Partner with TNCs to provide on-demand
Services Taxis ridesharing services
Microtransit Vehicles that accommodate five Partner with local microtransit providers to
to 12 people for local service enhance service coverage
provision
Neighborhood Provides low-speed, low Accommodate neighborhood vehicle design
Electric emission transportation mode for needs in station design
Vehicles local areas
Public Serves local and regional public Co-locate services together to increase
Transportation transportation routes and lines accessibility
Service Offers frequent service and timed Locate stations at multi-route intersections to
Frequency transfers increase connectivity
Real-Time Broadcasts real-time route Use telecommunication technology to provide
Information information up-to-date travel information to riders
Integrated Fare Offers single fare payment for Integrate fare payment system between all
Payment multiple modes modes of transportation
Sources: Espino, 2016
Public agencies may consider:
Co-locating services together to create mobility hubs and encourage the use of shared
mobility.
Increasing density around mobility hubs to develop TOD and increase transit ridership
and shared mobility.
Implementing potential actions to support the physical integration of services.
Serv
ice
Pro
vis
ion
U.S. Department of Transportation
Office of the Assistant Secretary for Research and Technology
Intelligent Transportation Systems Joint Program Office
67
CHAPTER 4: Shared Mobility Implementation and Community Integration
Information Integration
Increasingly, consumers are engaging in multimodal decision-making based on a variety of factors
including cost, travel time, wait time, number of connections, convenience, environmental impact,
and other attributes. Rather than making decisions between modes, mobility consumers can make
decisions among modes, “modal chaining” to optimize route, travel time, and cost. Information
integration, such as multimodal aggregators and trip planners can enhance traveler access to trip
planning and real-time travel information across multiple modes.
Trip Planners and Multimodal Aggregators
Smartphone apps are transforming mobility by enhancing access to traveler information. In recent
years, more travelers are using trip planners and multimodal aggregators to: 1) search routes,
schedules, near-term arrival predictions, and connections; 2) compare travel times, connection
information, distance, and costs across multiple routes and modes of transportation; and 3) access
real-time travel information across multiple modes. A number of communities, such as Dallas, Texas
and Denver, Colorado have developed websites and smartphone apps to allow users to plan and pay
for multimodal trips. In Europe, another service, UbiGo, has piloted MaaS by bundling and
repackaging transportation services through a single platform. Table 15 describes how these
platforms vary in level of integration and services offered.
U.S. Department of Transportation
Office of the Assistant Secretary for Research and Technology
Intelligent Transportation Systems Joint Program Office
68
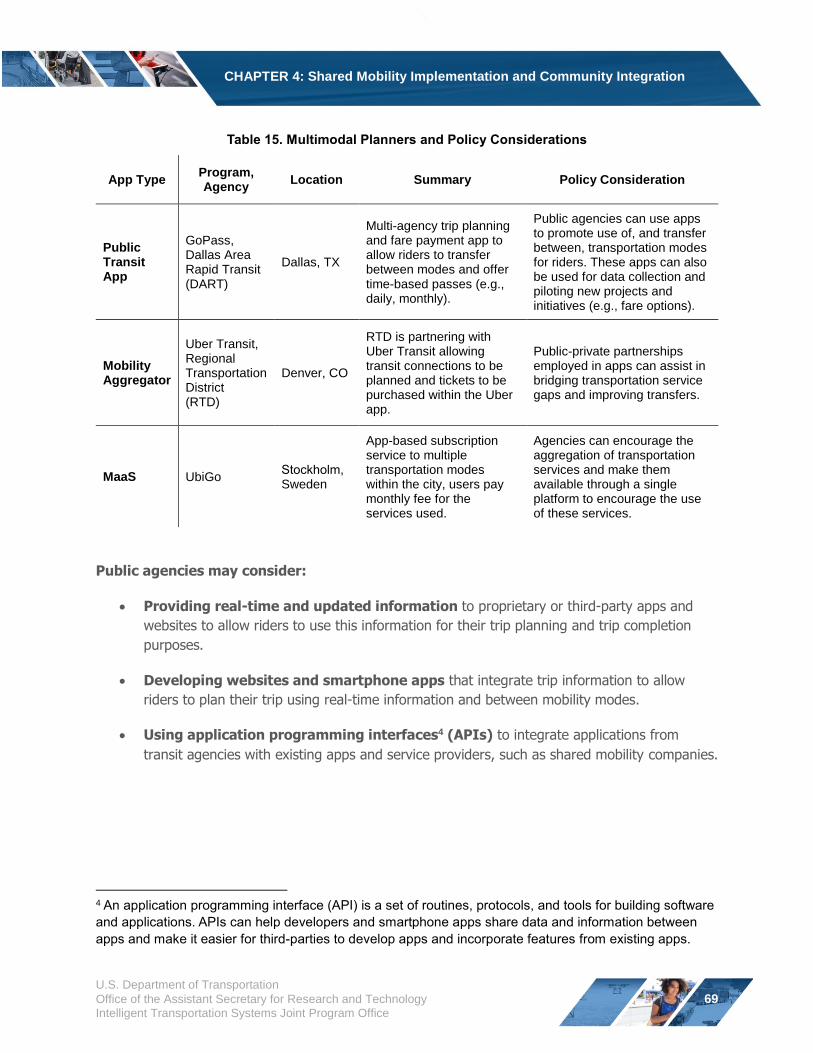
CHAPTER 4: Shared Mobility Implementation and Community Integration
Table 15. Multimodal Planners and Policy Considerations
App Type Program, Agency
Location Summary Policy Consideration
Public Transit App
GoPass, Dallas Area Rapid Transit (DART)
Dallas, TX
Multi-agency trip planning and fare payment app to allow riders to transfer between modes and offer time-based passes (e.g., daily, monthly).
Public agencies can use apps to promote use of, and transfer between, transportation modes for riders. These apps can also be used for data collection and piloting new projects and initiatives (e.g., fare options).
Mobility Aggregator
Uber Transit, Regional Transportation District (RTD)
Denver, CO
RTD is partnering with Uber Transit allowing transit connections to be planned and tickets to be purchased within the Uber app.
Public-private partnerships employed in apps can assist in bridging transportation service gaps and improving transfers.
MaaS UbiGo Stockholm, Sweden
App-based subscription service to multiple transportation modes within the city, users pay monthly fee for the services used.
Agencies can encourage the aggregation of transportation services and make them available through a single platform to encourage the use of these services.
Public agencies may consider:
Providing real-time and updated information to proprietary or third-party apps and
websites to allow riders to use this information for their trip planning and trip completion
purposes.
Developing websites and smartphone apps that integrate trip information to allow
riders to plan their trip using real-time information and between mobility modes.
Using application programming interfaces4 (APIs) to integrate applications from
transit agencies with existing apps and service providers, such as shared mobility companies.
4 An application programming interface (API) is a set of routines, protocols, and tools for building software
and applications. APIs can help developers and smartphone apps share data and information between
apps and make it easier for third-parties to develop apps and incorporate features from existing apps.
U.S. Department of Transportation
Office of the Assistant Secretary for Research and Technology
Intelligent Transportation Systems Joint Program Office
69
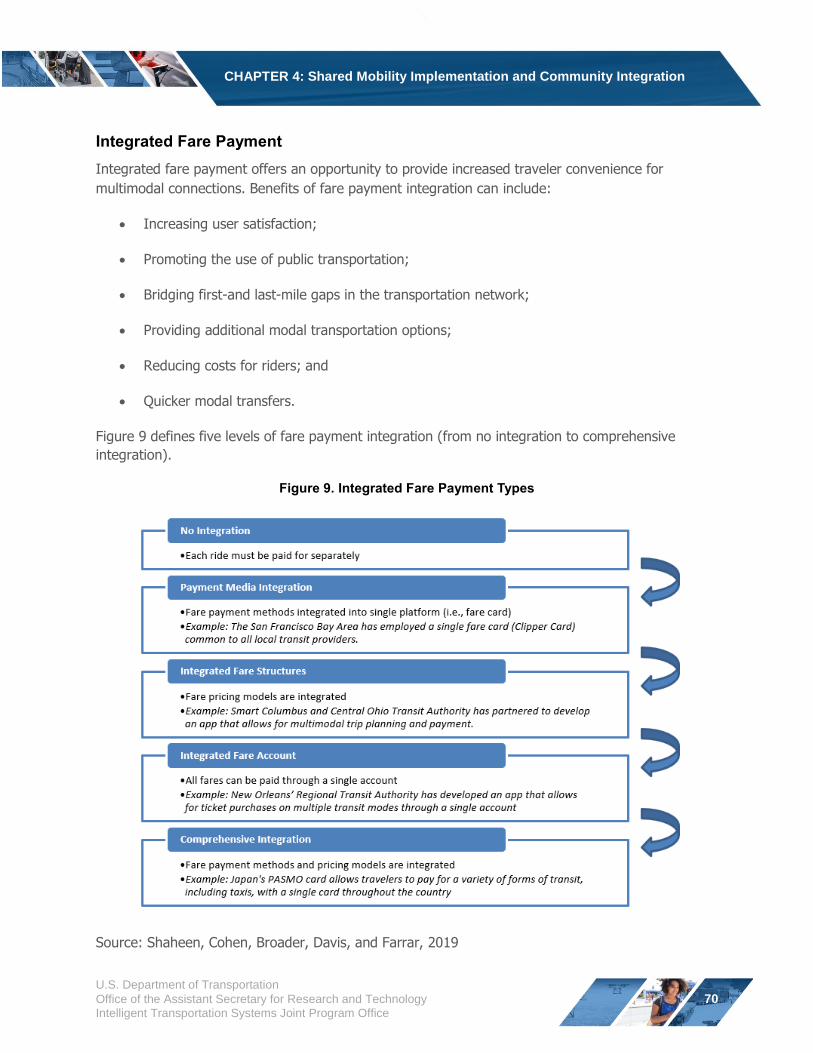
CHAPTER 4: Shared Mobility Implementation and Community Integration
Integrated Fare Payment
Integrated fare payment offers an opportunity to provide increased traveler convenience for
multimodal connections. Benefits of fare payment integration can include:
Increasing user satisfaction;
Promoting the use of public transportation;
Bridging first-and last-mile gaps in the transportation network;
Providing additional modal transportation options;
Reducing costs for riders; and
Quicker modal transfers.
Figure 9 defines five levels of fare payment integration (from no integration to comprehensive
integration).
Figure 9. Integrated Fare Payment Types
Source: Shaheen, Cohen, Broader, Davis, and Farrar, 2019
U.S. Department of Transportation
Office of the Assistant Secretary for Research and Technology
Intelligent Transportation Systems Joint Program Office
70
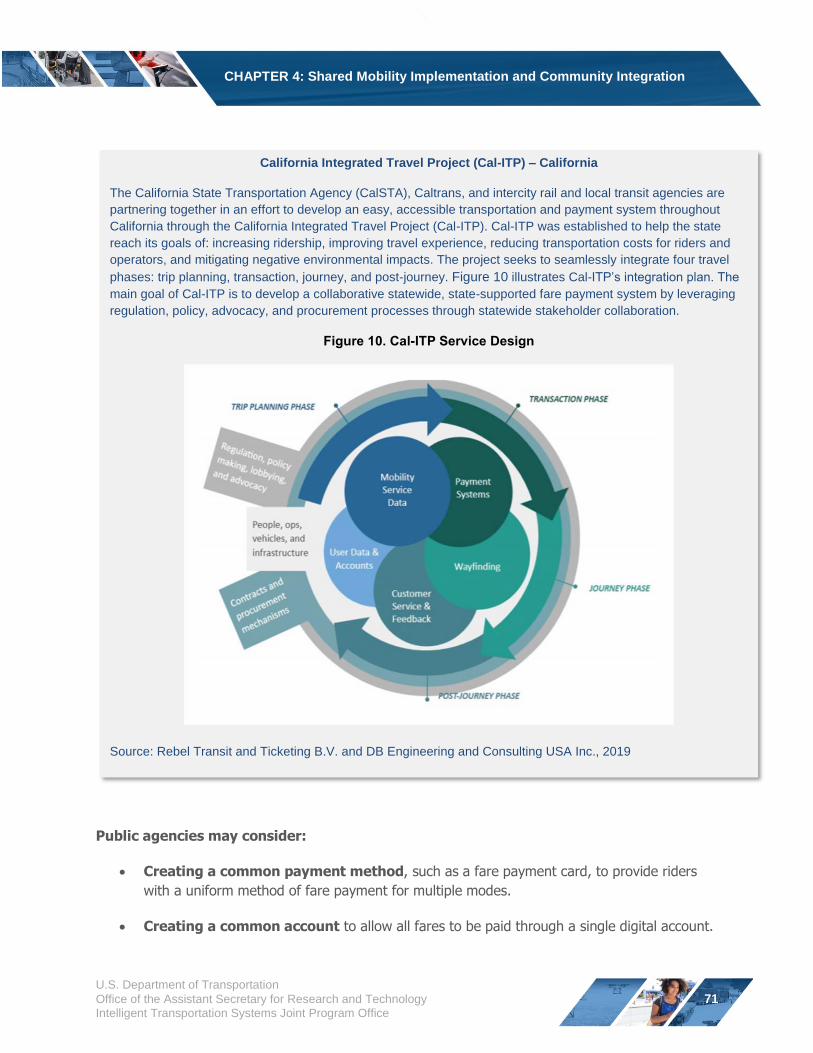
CHAPTER 4: Shared Mobility Implementation and Community Integration
California Integrated Travel Project (Cal-ITP) – California
The California State Transportation Agency (CalSTA), Caltrans, and intercity rail and local transit agencies are
partnering together in an effort to develop an easy, accessible transportation and payment system throughout
California through the California Integrated Travel Project (Cal-ITP). Cal-ITP was established to help the state
reach its goals of: increasing ridership, improving travel experience, reducing transportation costs for riders and
operators, and mitigating negative environmental impacts. The project seeks to seamlessly integrate four travel
phases: trip planning, transaction, journey, and post-journey. Figure 10 illustrates Cal-ITP’s integration plan. The
main goal of Cal-ITP is to develop a collaborative statewide, state-supported fare payment system by leveraging
regulation, policy, advocacy, and procurement processes through statewide stakeholder collaboration.
Figure 10. Cal-ITP Service Design
Source: Rebel Transit and Ticketing B.V. and DB Engineering and Consulting USA Inc., 2019
Public agencies may consider:
Creating a common payment method, such as a fare payment card, to provide riders
with a uniform method of fare payment for multiple modes.
Creating a common account to allow all fares to be paid through a single digital account.
U.S. Department of Transportation
Office of the Assistant Secretary for Research and Technology
Intelligent Transportation Systems Joint Program Office
71
CHAPTER 4: Shared Mobility Implementation and Community Integration
Exploring potential partnerships to assist in capitalizing upon existing assets (e.g.,
common payment card) or partnering with third-party payment providers (e.g., Apple Pay).
Interagency cooperation to establish a common pricing model that is sustainable for all
agencies.
Integrating new systems with existing systems so fare payments (e.g., common
payment card) can be used to pay for other existing systems.
Expanding integrated fare payment systems to a larger geographic region to provide
seamless transfers between public and private mobility modes.
Source: Rich, 2013; California Integrated Travel Project, 2018
Key Takeaways
Transportation services can be co-located and integrated into their surrounding
environments to create mobility hubs.
Trip planners and multimodal aggregators can assist users with multimodal trip planning and
decision-making during a traveler’s journey.
Integrated fare payment provides the opportunity for enhanced customer convenience with
varying levels of integration from basic integration (e.g., payment media integration) to
comprehensive integration.
Last-Mile Delivery
In recent years, last-mile delivery services for food and Personal Delivery Vehicles -
small packages have grown rapidly due to technology Singapore
advancements, changing consumer patterns, and a Singapore’s Land Use Authority (SLA)
growing consumer recognition that goods delivery can faced opposition from food couriers
serve as substitutes for personal trips to access goods and after banning the use of e-scooters on
services. Together these trends are transforming the retail sidewalks. As a result, the SLA is now
sector from “just in time inventory” where retailers order offering $5.1 million (USD) in grants to
inventory and stock shelves on an as-needed basis, to help food couriers pay for power-
assisted bicycles (Coconuts “just in time delivery" with goods delivered directly to Singapore, 2019). consumers on demand (Shaheen and Cohen, 2018b).
The following section highlights innovations in last-mile delivery and the potential impacts this could
have on broader traveler behavior.
U.S. Department of Transportation
Office of the Assistant Secretary for Research and Technology
Intelligent Transportation Systems Joint Program Office
72
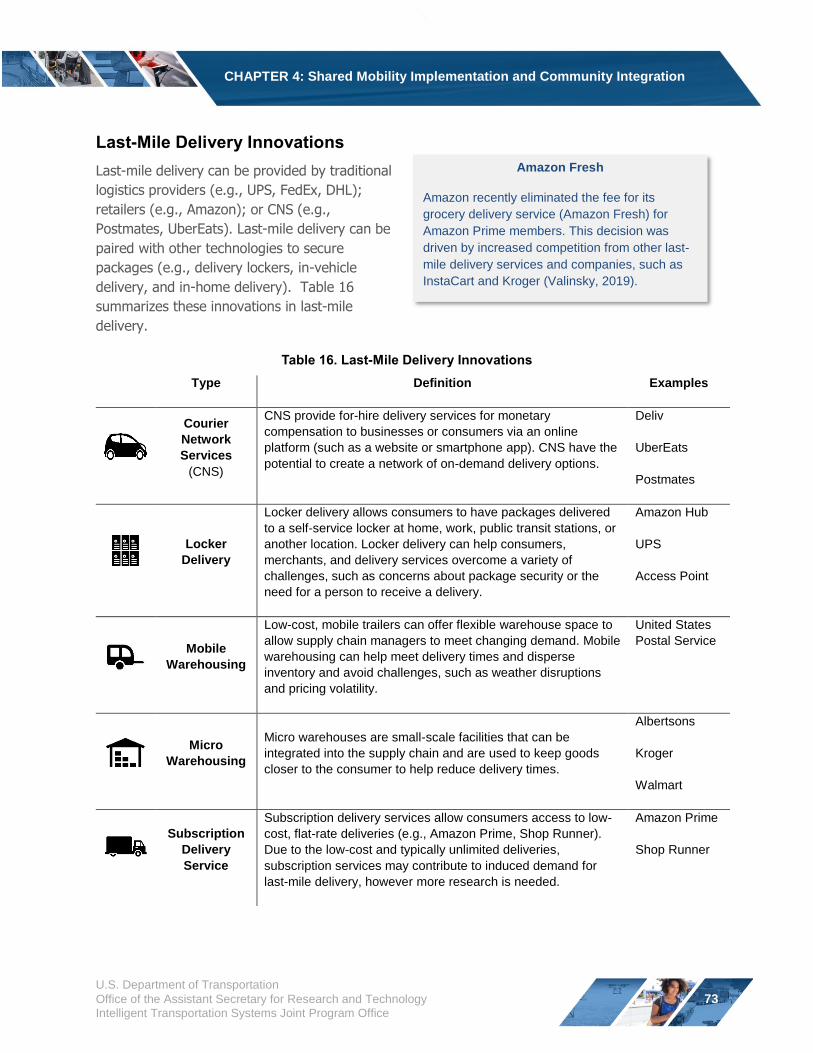
CHAPTER 4: Shared Mobility Implementation and Community Integration
Last-Mile Delivery Innovations
Last-mile delivery can be provided by traditional
logistics providers (e.g., UPS, FedEx, DHL);
retailers (e.g., Amazon); or CNS (e.g.,
Postmates, UberEats). Last-mile delivery can be
paired with other technologies to secure
packages (e.g., delivery lockers, in-vehicle
delivery, and in-home delivery). Table 16
summarizes these innovations in last-mile
delivery.
Amazon Fresh
Amazon recently eliminated the fee for its
grocery delivery service (Amazon Fresh) for
Amazon Prime members. This decision was
driven by increased competition from other last-
mile delivery services and companies, such as
InstaCart and Kroger (Valinsky, 2019).
Table 16. Last-Mile Delivery Innovations
Type Definition Examples
Courier
Network
Services
(CNS)
CNS provide for-hire delivery services for monetary
compensation to businesses or consumers via an online
platform (such as a website or smartphone app). CNS have the
potential to create a network of on-demand delivery options.
Deliv
UberEats
Postmates
Locker
Delivery
Locker delivery allows consumers to have packages delivered
to a self-service locker at home, work, public transit stations, or
another location. Locker delivery can help consumers,
merchants, and delivery services overcome a variety of
challenges, such as concerns about package security or the
need for a person to receive a delivery.
Amazon Hub
UPS
Access Point
Mobile
Warehousing
Low-cost, mobile trailers can offer flexible warehouse space to
allow supply chain managers to meet changing demand. Mobile
warehousing can help meet delivery times and disperse
inventory and avoid challenges, such as weather disruptions
and pricing volatility.
United States
Postal Service
Micro
Warehousing
Micro warehouses are small-scale facilities that can be
integrated into the supply chain and are used to keep goods
closer to the consumer to help reduce delivery times.
Albertsons
Kroger
Walmart
Subscription
Delivery
Service
Subscription delivery services allow consumers access to low-
cost, flat-rate deliveries (e.g., Amazon Prime, Shop Runner).
Due to the low-cost and typically unlimited deliveries,
subscription services may contribute to induced demand for
last-mile delivery, however more research is needed.
Amazon Prime
Shop Runner
U.S. Department of Transportation
Office of the Assistant Secretary for Research and Technology
Intelligent Transportation Systems Joint Program Office
73
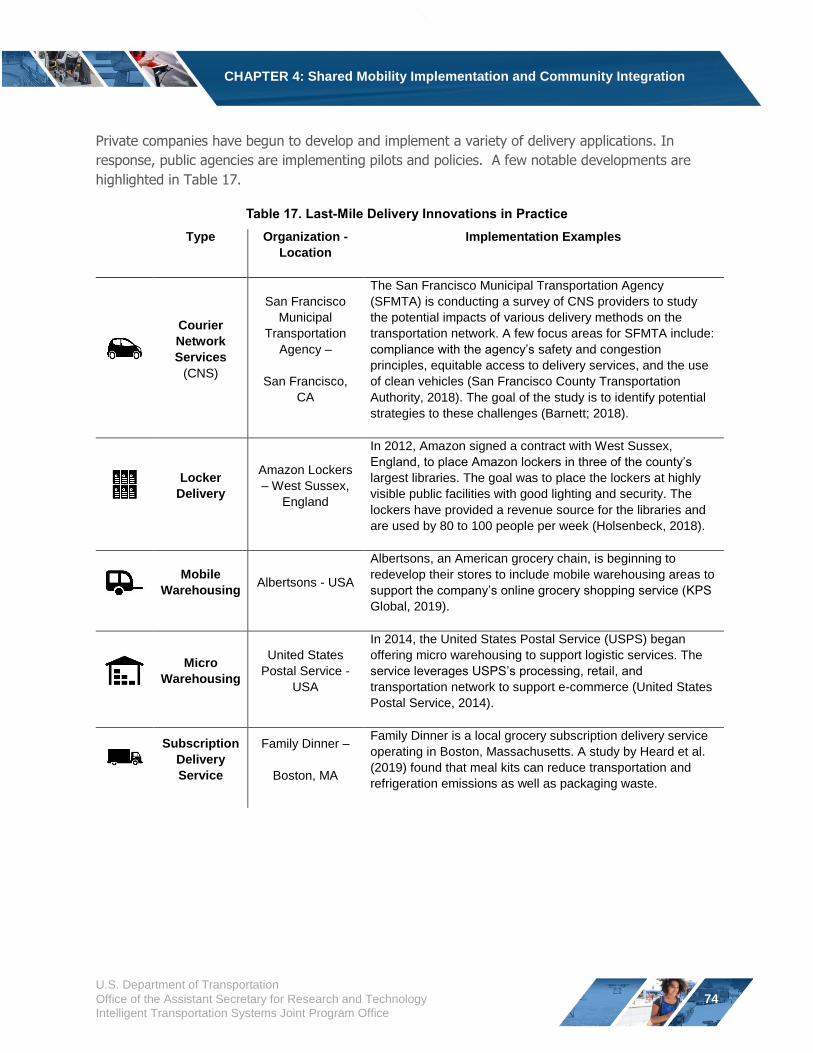
CHAPTER 4: Shared Mobility Implementation and Community Integration
Private companies have begun to develop and implement a variety of delivery applications. In
response, public agencies are implementing pilots and policies. A few notable developments are
highlighted in Table 17.
Table 17. Last-Mile Delivery Innovations in Practice
Type Organization -
Location
Implementation Examples
Courier
Network
Services
(CNS)
San Francisco
Municipal
Transportation
Agency –
San Francisco,
CA
The San Francisco Municipal Transportation Agency
(SFMTA) is conducting a survey of CNS providers to study
the potential impacts of various delivery methods on the
transportation network. A few focus areas for SFMTA include:
compliance with the agency’s safety and congestion
principles, equitable access to delivery services, and the use
of clean vehicles (San Francisco County Transportation
Authority, 2018). The goal of the study is to identify potential
strategies to these challenges (Barnett; 2018).
In 2012, Amazon signed a contract with West Sussex,
Locker
Delivery
Amazon Lockers
– West Sussex,
England
England, to place Amazon lockers in three of the county’s largest libraries. The goal was to place the lockers at highly
visible public facilities with good lighting and security. The
lockers have provided a revenue source for the libraries and
are used by 80 to 100 people per week (Holsenbeck, 2018).
Mobile
Warehousing Albertsons - USA
Albertsons, an American grocery chain, is beginning to
redevelop their stores to include mobile warehousing areas to
support the company’s online grocery shopping service (KPS Global, 2019).
Micro
Warehousing
United States
Postal Service -
USA
In 2014, the United States Postal Service (USPS) began
offering micro warehousing to support logistic services. The
service leverages USPS’s processing, retail, and transportation network to support e-commerce (United States
Postal Service, 2014).
Subscription
Delivery
Service
Family Dinner –
Boston, MA
Family Dinner is a local grocery subscription delivery service
operating in Boston, Massachusetts. A study by Heard et al.
(2019) found that meal kits can reduce transportation and
refrigeration emissions as well as packaging waste.
U.S. Department of Transportation
Office of the Assistant Secretary for Research and Technology
Intelligent Transportation Systems Joint Program Office
74
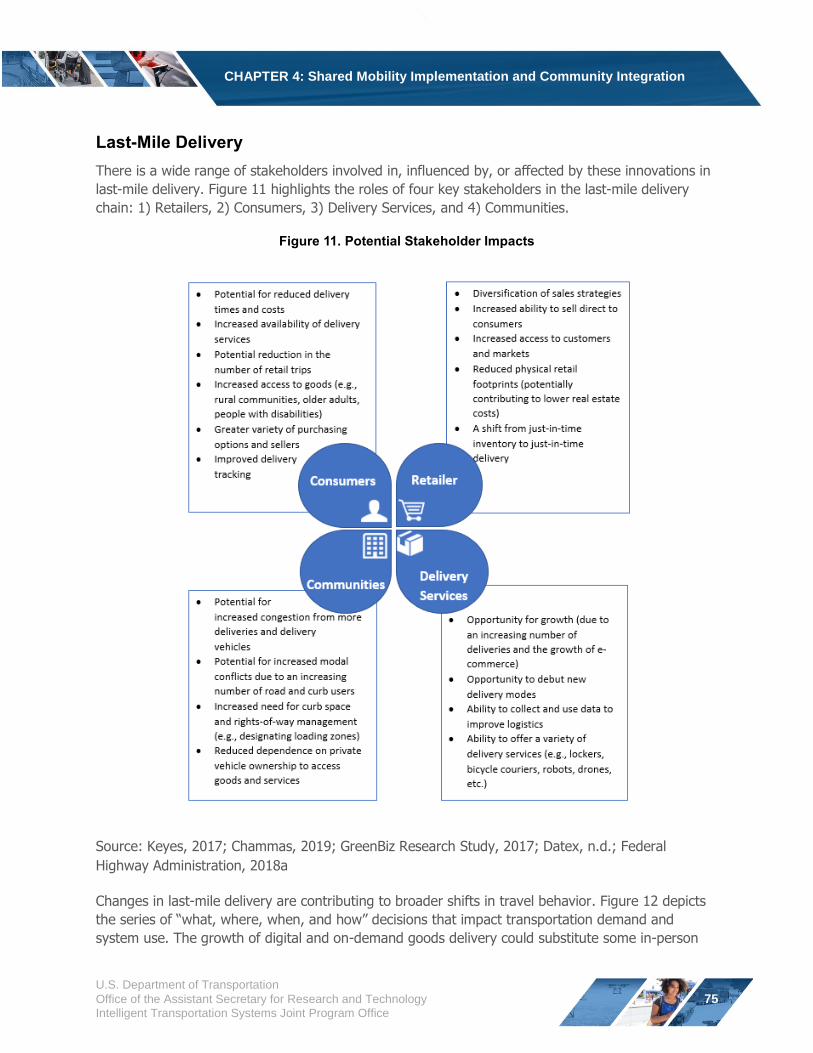
CHAPTER 4: Shared Mobility Implementation and Community Integration
Last-Mile Delivery
There is a wide range of stakeholders involved in, influenced by, or affected by these innovations in
last-mile delivery. Figure 11 highlights the roles of four key stakeholders in the last-mile delivery
chain: 1) Retailers, 2) Consumers, 3) Delivery Services, and 4) Communities.
Figure 11. Potential Stakeholder Impacts
Source: Keyes, 2017; Chammas, 2019; GreenBiz Research Study, 2017; Datex, n.d.; Federal
Highway Administration, 2018a
Changes in last-mile delivery are contributing to broader shifts in travel behavior. Figure 12 depicts
the series of “what, where, when, and how” decisions that impact transportation demand and system use. The growth of digital and on-demand goods delivery could substitute some in-person
U.S. Department of Transportation
Office of the Assistant Secretary for Research and Technology
Intelligent Transportation Systems Joint Program Office
75
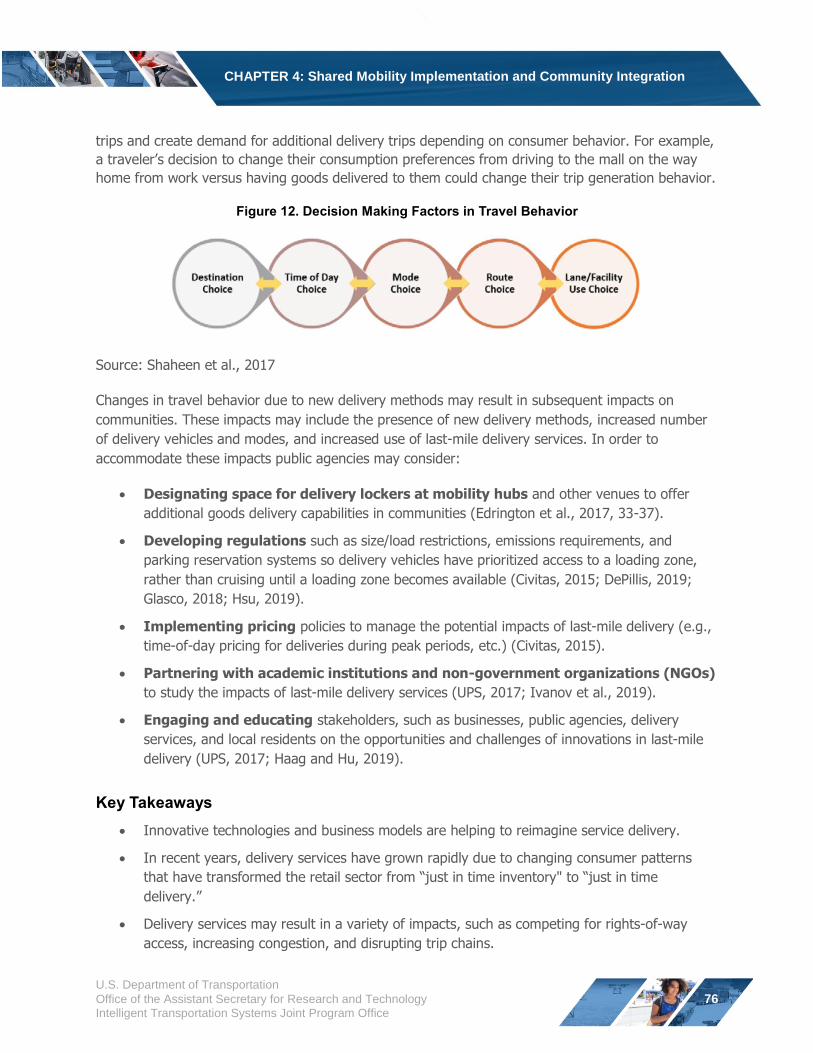
CHAPTER 4: Shared Mobility Implementation and Community Integration
trips and create demand for additional delivery trips depending on consumer behavior. For example,
a traveler’s decision to change their consumption preferences from driving to the mall on the way home from work versus having goods delivered to them could change their trip generation behavior.
Figure 12. Decision Making Factors in Travel Behavior
Source: Shaheen et al., 2017
Changes in travel behavior due to new delivery methods may result in subsequent impacts on
communities. These impacts may include the presence of new delivery methods, increased number
of delivery vehicles and modes, and increased use of last-mile delivery services. In order to
accommodate these impacts public agencies may consider:
Designating space for delivery lockers at mobility hubs and other venues to offer
additional goods delivery capabilities in communities (Edrington et al., 2017, 33-37).
Developing regulations such as size/load restrictions, emissions requirements, and
parking reservation systems so delivery vehicles have prioritized access to a loading zone,
rather than cruising until a loading zone becomes available (Civitas, 2015; DePillis, 2019;
Glasco, 2018; Hsu, 2019).
Implementing pricing policies to manage the potential impacts of last-mile delivery (e.g.,
time-of-day pricing for deliveries during peak periods, etc.) (Civitas, 2015).
Partnering with academic institutions and non-government organizations (NGOs)
to study the impacts of last-mile delivery services (UPS, 2017; Ivanov et al., 2019).
Engaging and educating stakeholders, such as businesses, public agencies, delivery
services, and local residents on the opportunities and challenges of innovations in last-mile
delivery (UPS, 2017; Haag and Hu, 2019).
Key Takeaways
Innovative technologies and business models are helping to reimagine service delivery.
In recent years, delivery services have grown rapidly due to changing consumer patterns
that have transformed the retail sector from “just in time inventory" to “just in time
delivery.”
Delivery services may result in a variety of impacts, such as competing for rights-of-way
access, increasing congestion, and disrupting trip chains.
U.S. Department of Transportation
Office of the Assistant Secretary for Research and Technology
Intelligent Transportation Systems Joint Program Office
76
CHAPTER 5: MOD Implementation Considerations
CHAPTER 5: MOD Implementation Considerations
This chapter discusses MOD implementation considerations for data sharing and management,
including how data is commonly used and concerns with the use of data. MOD data is important for
measuring and evaluating pilot projects and informing decisions within the MOD ecosystem on both
the demand and supply sides of the marketplace. This chapter also discusses the potential impacts
of MOD on transportation labor and on equity within the transportation network. MOD presents an
opportunity to enhance transportation equity by providing a greater variety of transportation
options; however, MOD may also present a number of equity challenges as well.
MOD Data Sharing and Management
Collecting, storing, sharing, and analyzing MOD data can be challenging for a variety of
stakeholders. This section discusses common uses of MOD data, challenges collecting and using
data, and potential practices to overcome these challenges.
Sharing Data
Establishing Data Standards – Municipal Open Data Policy – Las Vegas, NV
Standardized data can help facilitate data
sharing between public agencies and Las Vegas has established an open data
other stakeholders. Data standards can initiative with the goal of informing the public of
be established by identifying useful data, available resources and increasing government
determining suitable data forms, and transparency. The Open Data Steering
Committee governs the initiative, ensures thatrequiring two-way data sharing when real-time data is available in a usable format possible. Data standards include the type through an online portal, and provides annual
of data desired (e.g., shared mobility status reports on the initiative (City of Las
trips originating or terminating at public Vegas, n.d.).
transit stops) and the data format (e.g.,
General Bikeshare Feed Specification
[GBFS]).
Providing Open Data – The public and private sectors can develop policies to encourage
data sharing. Open data (i.e., publicly available information for download and re-use) may
be released real-time or at periodic intervals. Open data can aid service providers in creating
smartphone apps and integrating multiple shared modes. For example, Austin, Texas shares
dockless micromobility data monthly through its open data website.
Forming Data Exchanges – The public and private sectors, academia, and standards
organizations (e.g., Institute of Electronic and Electrical Engineers [IEEE], SAE International,
ITS JPO), can develop data exchanges to facilitate data sharing. Data exchanges can be
public facing or for internal agency use only. Internal data exchanges may contain sensitive
information intended for use by a limited number of parties. Public facing data exchanges,
on the other hand, are intended to provide the broader public with open information.
U.S. Department of Transportation
Office of the Assistant Secretary for Research and Technology
Intelligent Transportation Systems Joint Program Office
77
CHAPTER 5: MOD Implementation Considerations
Common Uses for MOD Data
Stakeholders can use data to better understand the impacts of MOD on travelers, society, and the
environment. Common uses for MOD data include:
Trip Planning
Integrated Trip-Planning and Payment – The public and private sectors can
disseminate real-time data about their services (e.g., vehicle locations, service cost, and
availability) and integrate data into apps that can help travelers plan, navigate, and pay for
trips (Gettman et al., 2017). Integrated payment cards (e.g., California Bay Area’s Clipper card) can be used to pay for multiple modes during one trip and help facilitate multimodal
trip planning (Desouza and Smith, 2016).
Transportation Planning
Agency Transportation Service Planning – Public agencies can examine performance
metrics, such as response times (the time from customer request to pick-up or goods
delivery) and service areas, to identify and respond to spatial and temporal service gaps.
Identifying these gaps may allow agencies to more efficiently deliver services through
targeted use cases and partnerships. Operational characteristics may include geographic
area of service, times of operation, and demographics served.
Performance-Based Transportation Planning – Data can be used to identify
appropriate strategies to integrate MOD considerations into performance-based
transportation planning. For example, data identifying TNC hotspots can be used to plan
infrastructure (e.g., loading zones) to support MOD. Refer to the FHWA’s Performance Based
Planning and Programming Guidebook for more information and examples on using
performance goals, measures, and targets to guide transportation investment and policy
decisions.
Transportation Service Performance Compliance
Service Auditing and Enforcement – Public agencies can use data for compliance
purposes (e.g., ensuring compliance with wheelchair accessible vehicle requirements, fleet
size, or vehicle/device parking locations) (Deshais, 2019). For example, public agencies can
monitor mobility service providers, such as TNCs, to evaluate how many vehicles within a
fleet are accessible to people with disabilities.
Service Effectiveness and Accounting – Public and private sector organizations can
analyze transportation operations data (e.g., origin-destination pairs, travel time, or vehicle
occupancy) to evaluate the performance of the service and the behavior of users. For
example, mobility services can be compared to traditional fixed-route service to compare trip
times between modes. For public agencies, traveler fare or cost data can be used to monitor
revenue, costs, and subsidies.
U.S. Department of Transportation
Office of the Assistant Secretary for Research and Technology
Intelligent Transportation Systems Joint Program Office
78
CHAPTER 5: MOD Implementation Considerations
Common Concerns with MOD Data Management and Sharing
The use of data can raise a number of policy and privacy issues. Numerous studies indicate that
people are either unaware of what private information they are exposing or they do not understand
what information they are consenting to share (Miller, 2014). As of November 2019, 31 states have
established laws regulating the secure destruction or disposal of personal data, such as financial
information (Help Net Security, 2019). Common concerns associated with data management and
sharing include:
Data Privacy
Traveler Privacy – Apps may intentionally or unintentionally collect an array of sensitive
and personally identifiable information (PII), such as location history, email addresses,
phone numbers, financial information, usage history of the apps installed on their phone,
and mobile Internet browsing history (Shaheen et al., 2016; D’Agostino et al., 2018).
Private Sector Trade Secrets – Mobility or goods delivery service providers may generate
or rely on proprietary information, such as information on business strategies, trade secrets,
or other sensitive material (e.g., passenger matching, and vehicle dispatch and routing
algorithms) (Shared-Use Mobility Center, 2019). Proprietary data can be important to a
company’s business plan or growth strategy raising concerns about what type of data is
shared, particularly if it is subject to release under public records laws if a private provider is
receiving public funding or partnered with a public agency.
Public Records Laws – Intelligent Transportation Systems Joint Program Office Data used by a public
DataHub agency may be subject to
public records requests The USDOT’s Intelligent Transportation Systems Joint
(Kimley-Horn and IBI Group, Program Office (ITS JPO) established the ITS DataHub as a 2019). This can present a data exchange for the USDOT’s publicly available ITS data. By
challenge to public agencies creating the ITS DataHub, the ITS JPO hopes to encourage
seeking to protect traveler third-party research that investigates the effectiveness of
emerging ITS technologies, development of apps, and privacy or company trade increasing compatibility of datasets. The ITS DataHub is home secrets. Private companies to over 100 datasets that are stored based on their may be reluctant to share classifications (e.g., emerging data sets are stored in sandbox
data with public agencies testing environments to allow flexibility with their use). The ITS
because it may cause the DataHub has information on a variety of topics including
data to become a public connected vehicle data, incident data, and travel times, and record and subject to public data is quality-checked, well-documented, and free.
release (Kimley-Horn and IBI
Group, 2019). Concerns over
personal and proprietary data should be considered to balance the interests of the public
sector, private companies, and records requesters (Dickey, 2019).
U.S. Department of Transportation
Office of the Assistant Secretary for Research and Technology
Intelligent Transportation Systems Joint Program Office
79
CHAPTER 5: MOD Implementation Considerations
Public Sector-Specific Issues
National Transit Database (NTD) Formula-Based Funding – When public transit
agencies receive financial support from the FTA, they are required to report their data
through the National Transit Database (NTD) (GAO, 2018). However, the FTA does not
require MOD trip characteristic data to be reported when appropriating funding (GAO, 2018).
Staff Capability Constraints – Public agencies may lack the staff expertise, technical
resources, and/or funding to develop an in-house capability to handle, store, and analyze the
large volumes of data shared by mobility providers (Shaheen et al., 2016).
Data Standards, Management, and Security
Data Security – Handling and storing data can present a security risk for data managers
(Shaheen et al., 2016). Security risks can include security breaches, data theft, and cyber
espionage (D’Agostino et al., 2019).
Lack of Universal Data Standards and Reporting Requirements – Service providers
may provide data about their service in a non-standardized format (Shared-Use Mobility
Center, 2019). This can create challenges for service providers generating data in different
formats for different partners and for public agencies trying to analyze data from multiple
sources.
Examples of MOD Data Standards
Providing standardized and open data allows public agencies to understand the impacts of transportation
modes, identify transportation network gaps, and offer multimodal, real-time information through a variety of
platforms. A few data standards include:
General Bikeshare Feed Specification (GBFS): A common data format that provides real-time,
operational bikesharing data, but excludes historical data and PII;
General Transit Feed Specification (GTFS): A common data format typology that public agencies can
use to publish transit schedules and geographic information in order to make the data accessible to a
wide variety of software programs; and
Mobility Data Specification (MDS): A data standard and application programing interface (API) that can
be used by cities to gather, analyze, and compare real-time and historical data from shared mobility
providers. MDS includes data such as mobility trips and routes, location and status of vehicles/equipment
(e.g., available, in-use, out-of-service), and service provider coverage areas.
U.S. Department of Transportation
Office of the Assistant Secretary for Research and Technology
Intelligent Transportation Systems Joint Program Office
80
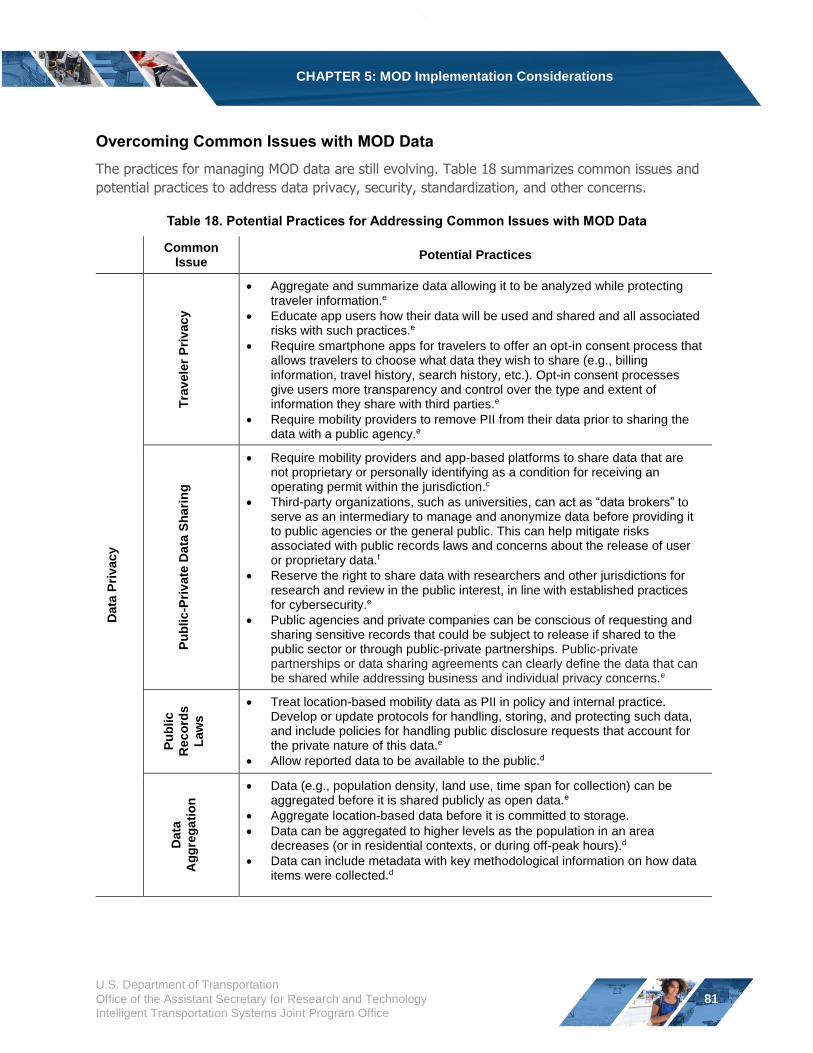
CHAPTER 5: MOD Implementation Considerations
Overcoming Common Issues with MOD Data
The practices for managing MOD data are still evolving. Table 18 summarizes common issues and
potential practices to address data privacy, security, standardization, and other concerns.
Table 18. Potential Practices for Addressing Common Issues with MOD Data
Common Issue
Potential Practices
Data
Pri
vac
y
Tra
vele
r P
rivac
y
Aggregate and summarize data allowing it to be analyzed while protecting traveler information.e
Educate app users how their data will be used and shared and all associated risks with such practices.e
Require smartphone apps for travelers to offer an opt-in consent process that allows travelers to choose what data they wish to share (e.g., billing information, travel history, search history, etc.). Opt-in consent processes give users more transparency and control over the type and extent of information they share with third parties.e
Require mobility providers to remove PII from their data prior to sharing the edata with a public agency.
Pu
blic
-Pri
vate
Da
ta S
hari
ng
Require mobility providers and app-based platforms to share data that are not proprietary or personally identifying as a condition for receiving an
coperating permit within the jurisdiction.
Third-party organizations, such as universities, can act as “data brokers” to serve as an intermediary to manage and anonymize data before providing it to public agencies or the general public. This can help mitigate risks associated with public records laws and concerns about the release of user or proprietary data.f
Reserve the right to share data with researchers and other jurisdictions for research and review in the public interest, in line with established practices for cybersecurity.e
Public agencies and private companies can be conscious of requesting and sharing sensitive records that could be subject to release if shared to the public sector or through public-private partnerships. Public-private partnerships or data sharing agreements can clearly define the data that can
ebe shared while addressing business and individual privacy concerns.
Pu
blic
Reco
rds
Law
s
Treat location-based mobility data as PII in policy and internal practice. Develop or update protocols for handling, storing, and protecting such data, and include policies for handling public disclosure requests that account for the private nature of this data.e
Allow reported data to be available to the public.d
Data
Ag
gre
ga
tio
n
Data (e.g., population density, land use, time span for collection) can be aggregated before it is shared publicly as open data.e
Aggregate location-based data before it is committed to storage.
Data can be aggregated to higher levels as the population in an area decreases (or in residential contexts, or during off-peak hours).d
Data can include metadata with key methodological information on how data items were collected.d
U.S. Department of Transportation
Office of the Assistant Secretary for Research and Technology
Intelligent Transportation Systems Joint Program Office
81
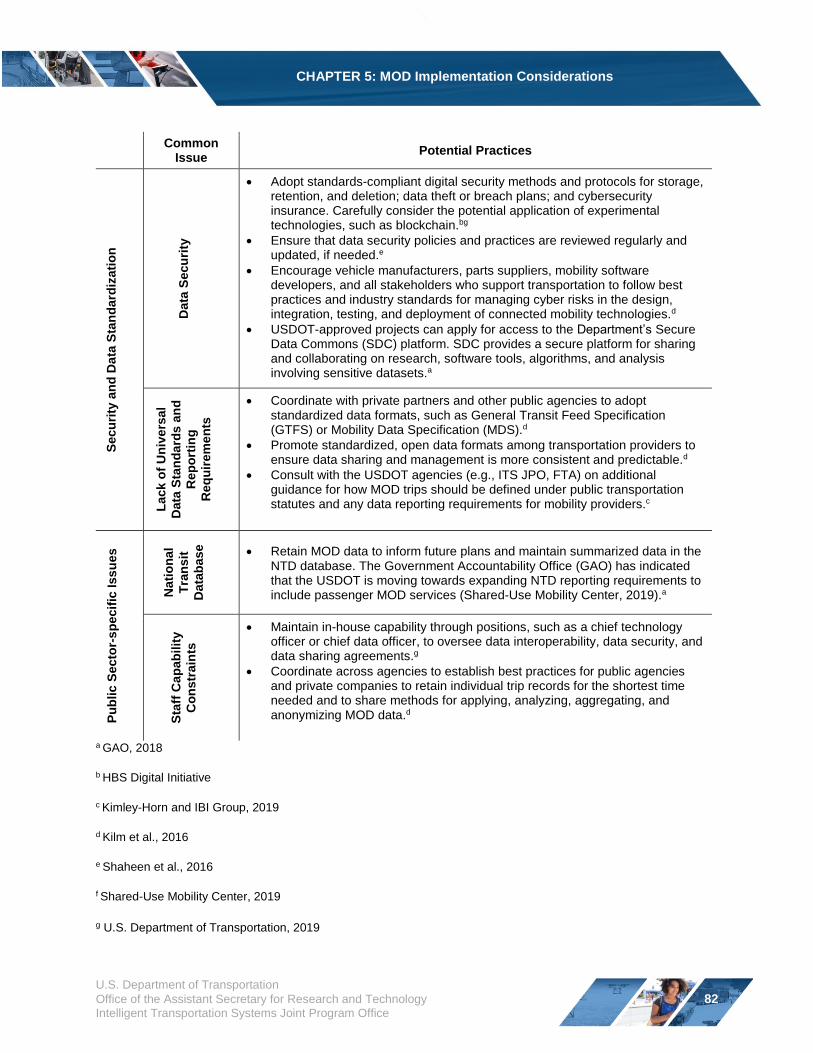
CHAPTER 5: MOD Implementation Considerations
Common Issue
Potential Practices
Secu
rity
an
d D
ata
Sta
nd
ard
izati
on
Data
Secu
rity
Adopt standards-compliant digital security methods and protocols for storage,
retention, and deletion; data theft or breach plans; and cybersecurity insurance. Carefully consider the potential application of experimental technologies, such as blockchain.bg
Ensure that data security policies and practices are reviewed regularly and updated, if needed.e
Encourage vehicle manufacturers, parts suppliers, mobility software developers, and all stakeholders who support transportation to follow best practices and industry standards for managing cyber risks in the design, integration, testing, and deployment of connected mobility technologies.d
USDOT-approved projects can apply for access to the Department’s Secure Data Commons (SDC) platform. SDC provides a secure platform for sharing and collaborating on research, software tools, algorithms, and analysis involving sensitive datasets.a
Lack o
f U
niv
ers
al
Data
Sta
nd
ard
s a
nd
Rep
ort
ing
Req
uir
em
en
ts
Coordinate with private partners and other public agencies to adopt standardized data formats, such as General Transit Feed Specification (GTFS) or Mobility Data Specification (MDS).d
Promote standardized, open data formats among transportation providers to ensure data sharing and management is more consistent and predictable.d
Consult with the USDOT agencies (e.g., ITS JPO, FTA) on additional guidance for how MOD trips should be defined under public transportation statutes and any data reporting requirements for mobility providers.c
Pu
blic S
ecto
r-s
pecif
ic Iss
ues
Nati
on
al
Tra
nsit
Data
base
Retain MOD data to inform future plans and maintain summarized data in the NTD database. The Government Accountability Office (GAO) has indicated that the USDOT is moving towards expanding NTD reporting requirements to include passenger MOD services (Shared-Use Mobility Center, 2019).a
Sta
ff C
ap
ab
ilit
y
Co
nstr
ain
ts
Maintain in-house capability through positions, such as a chief technology officer or chief data officer, to oversee data interoperability, data security, and data sharing agreements.g
Coordinate across agencies to establish best practices for public agencies and private companies to retain individual trip records for the shortest time needed and to share methods for applying, analyzing, aggregating, and anonymizing MOD data. d
a GAO, 2018
b HBS Digital Initiative
c Kimley-Horn and IBI Group, 2019
d Kilm et al., 2016
e Shaheen et al., 2016
f Shared-Use Mobility Center, 2019
g U.S. Department of Transportation, 2019
U.S. Department of Transportation
Office of the Assistant Secretary for Research and Technology
Intelligent Transportation Systems Joint Program Office
82
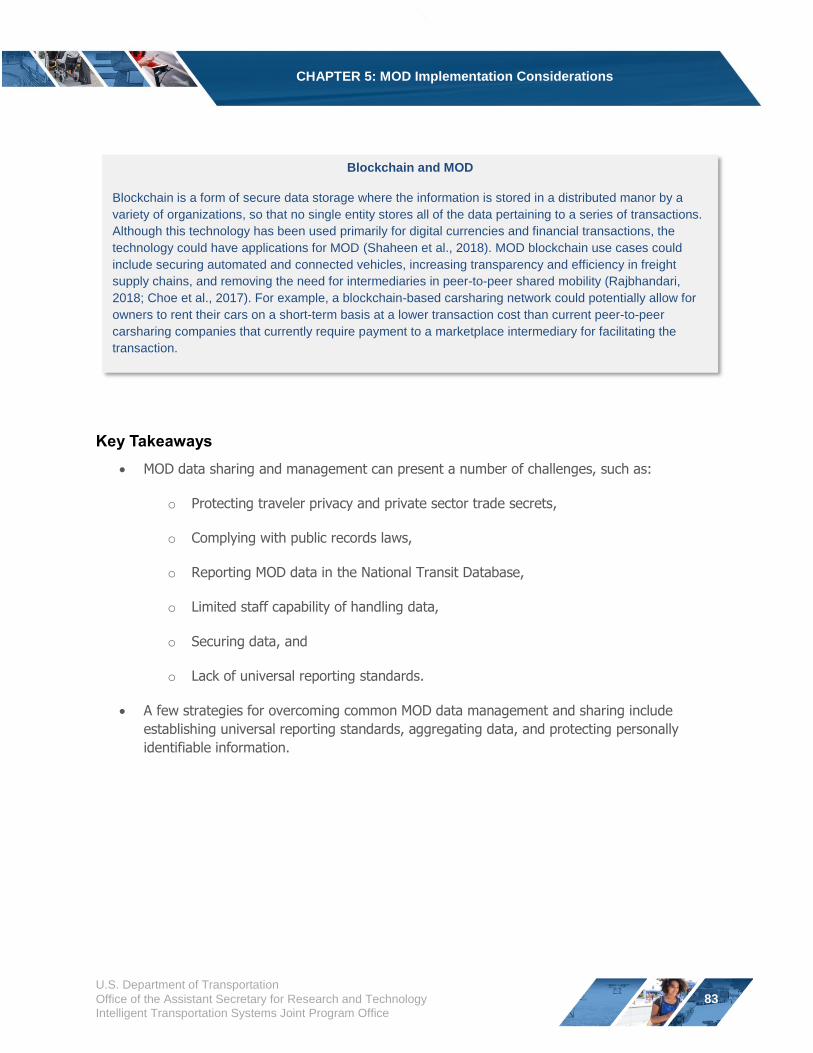
CHAPTER 5: MOD Implementation Considerations
Blockchain and MOD
Blockchain is a form of secure data storage where the information is stored in a distributed manor by a
variety of organizations, so that no single entity stores all of the data pertaining to a series of transactions.
Although this technology has been used primarily for digital currencies and financial transactions, the
technology could have applications for MOD (Shaheen et al., 2018). MOD blockchain use cases could
include securing automated and connected vehicles, increasing transparency and efficiency in freight
supply chains, and removing the need for intermediaries in peer-to-peer shared mobility (Rajbhandari,
2018; Choe et al., 2017). For example, a blockchain-based carsharing network could potentially allow for
owners to rent their cars on a short-term basis at a lower transaction cost than current peer-to-peer
carsharing companies that currently require payment to a marketplace intermediary for facilitating the
transaction.
Key Takeaways
MOD data sharing and management can present a number of challenges, such as:
o Protecting traveler privacy and private sector trade secrets,
o Complying with public records laws,
o Reporting MOD data in the National Transit Database,
o Limited staff capability of handling data,
o Securing data, and
o Lack of universal reporting standards.
A few strategies for overcoming common MOD data management and sharing include
establishing universal reporting standards, aggregating data, and protecting personally
identifiable information.
U.S. Department of Transportation
Office of the Assistant Secretary for Research and Technology
Intelligent Transportation Systems Joint Program Office
83
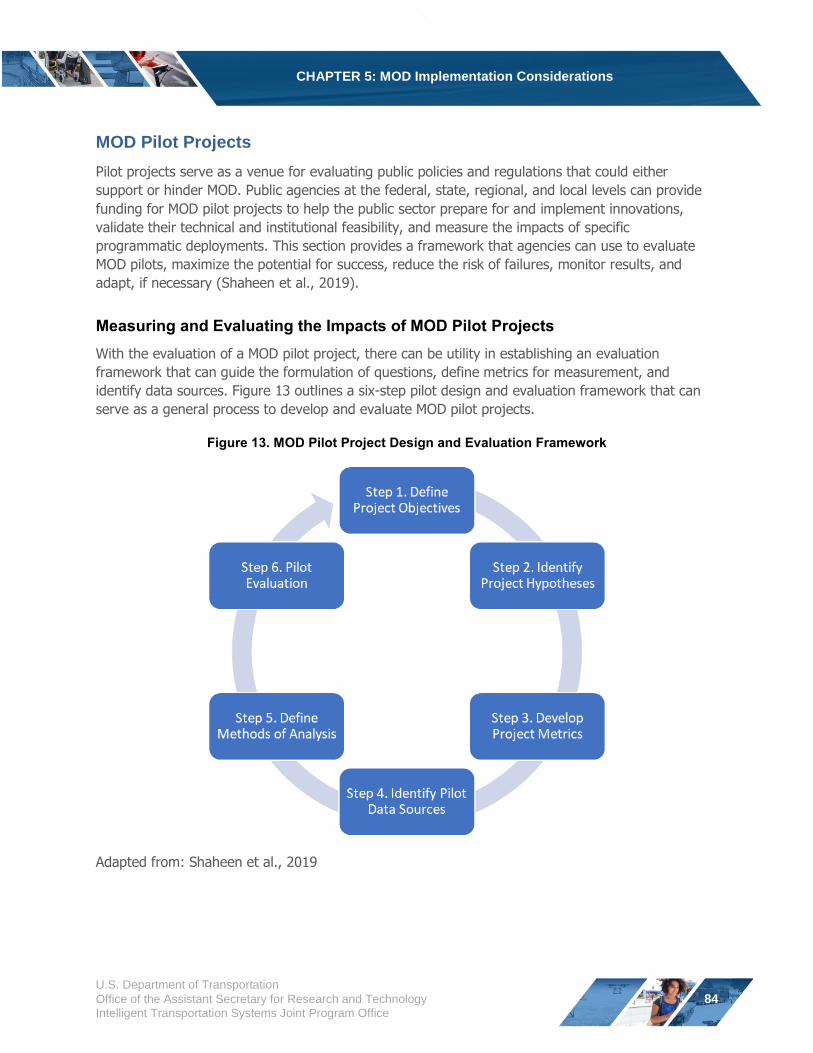
CHAPTER 5: MOD Implementation Considerations
MOD Pilot Projects
Pilot projects serve as a venue for evaluating public policies and regulations that could either
support or hinder MOD. Public agencies at the federal, state, regional, and local levels can provide
funding for MOD pilot projects to help the public sector prepare for and implement innovations,
validate their technical and institutional feasibility, and measure the impacts of specific
programmatic deployments. This section provides a framework that agencies can use to evaluate
MOD pilots, maximize the potential for success, reduce the risk of failures, monitor results, and
adapt, if necessary (Shaheen et al., 2019).
Measuring and Evaluating the Impacts of MOD Pilot Projects
With the evaluation of a MOD pilot project, there can be utility in establishing an evaluation
framework that can guide the formulation of questions, define metrics for measurement, and
identify data sources. Figure 13 outlines a six-step pilot design and evaluation framework that can
serve as a general process to develop and evaluate MOD pilot projects.
Figure 13. MOD Pilot Project Design and Evaluation Framework
Adapted from: Shaheen et al., 2019
U.S. Department of Transportation
Office of the Assistant Secretary for Research and Technology
Intelligent Transportation Systems Joint Program Office
84
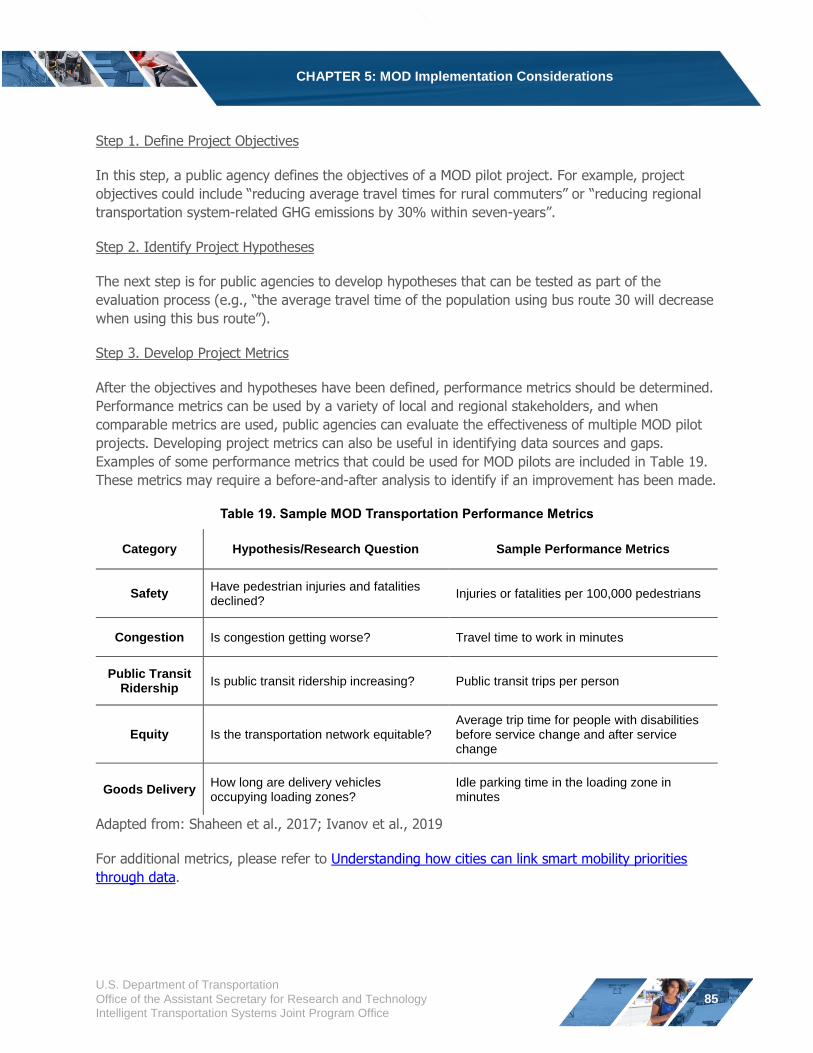
CHAPTER 5: MOD Implementation Considerations
Step 1. Define Project Objectives
In this step, a public agency defines the objectives of a MOD pilot project. For example, project
objectives could include “reducing average travel times for rural commuters” or “reducing regional
transportation system-related GHG emissions by 30% within seven-years”.
Step 2. Identify Project Hypotheses
The next step is for public agencies to develop hypotheses that can be tested as part of the
evaluation process (e.g., “the average travel time of the population using bus route 30 will decrease
when using this bus route”).
Step 3. Develop Project Metrics
After the objectives and hypotheses have been defined, performance metrics should be determined.
Performance metrics can be used by a variety of local and regional stakeholders, and when
comparable metrics are used, public agencies can evaluate the effectiveness of multiple MOD pilot
projects. Developing project metrics can also be useful in identifying data sources and gaps.
Examples of some performance metrics that could be used for MOD pilots are included in Table 19.
These metrics may require a before-and-after analysis to identify if an improvement has been made.
Table 19. Sample MOD Transportation Performance Metrics
Category Hypothesis/Research Question Sample Performance Metrics
Safety Have pedestrian injuries and fatalities declined?
Injuries or fatalities per 100,000 pedestrians
Congestion Is congestion getting worse? Travel time to work in minutes
Public Transit Ridership
Is public transit ridership increasing? Public transit trips per person
Equity Is the transportation network equitable? Average trip time for people with disabilities before service change and after service change
Goods Delivery How long are delivery vehicles occupying loading zones?
Idle parking time in the loading zone in minutes
Adapted from: Shaheen et al., 2017; Ivanov et al., 2019
For additional metrics, please refer to Understanding how cities can link smart mobility priorities
through data.
U.S. Department of Transportation
Office of the Assistant Secretary for Research and Technology
Intelligent Transportation Systems Joint Program Office
85
CHAPTER 5: MOD Implementation Considerations
Step 4. Identify Pilot Project Data Sources
During this step, a public agency defines data sources needed to evaluate project performance
metrics and works with project partners to develop data sharing and data use agreements. When
data limitations are encountered, using alternative data collection methods or proxies may be
considered. For example, TNC vehicle occupancy can be approximated based on reported national
averages, trends, or surveys.
Step 5. Define Methods of Analysis
In this step, a public agency defines the methodologies that will guide data analysis. Advanced
models or statistical analyses are not always required, certain metrics can be evaluated by
aggregating or plotting data to find averages or basic trends. Qualitative evaluation methods, such
as expert interviews or rider interviews and shadowing, may also be appropriate.
Step 6. Pilot Project Evaluation
The final step is for a public agency to conduct the evaluation using the planned evaluation
methods. Data to evaluate the project can be obtained through a review of performance metrics,
agency and rider interviews, and other data collection techniques. Results of the evaluation will be
used to validate the pilot project’s hypotheses. Lessons learned from the evaluation can influence
the next iteration of pilot testing through a reconsideration of the project’s approach to satisfying the project objectives. Findings should be documented and shared with peer communities and public
agencies for feedback.
Funding for MOD Pilot Projects
Public agencies at the federal, state, regional, and local levels can provide funding for MOD pilot
projects. In 2016, FTA provided $8 million to 11 recipients through the MOD Sandbox Program to
enhance transit industry preparedness for MOD. The pilot projects focused on incentive strategies,
TNCs for first- and last-mile connections to public transportation, integrated bikesharing, carpooling
and ridesharing, data interoperability, on-demand paratransit, and multimodal apps and payments.
FTA anticipates funding additional pilot projects through the Integrated Mobility Innovation (IMI)
and Accelerating Innovative Mobility (AIM) programs.
U.S. Department of Transportation
Office of the Assistant Secretary for Research and Technology
Intelligent Transportation Systems Joint Program Office
86
CHAPTER 5: MOD Implementation Considerations
Federal Transit Administration’s MOD Sandbox Program
The FTA’s MOD Sandbox Program provides a venue where MOD concepts and strategies, supported
through local partnerships, are demonstrated in real-world settings. Key goals of the MOD Sandbox include:
Improving transportation efficiency by promoting agile, responsive, accessible, and seamless multimodal service inclusive of transit through enabling technologies and innovative partnerships.
Increasing transportation effectiveness by ensuring that transit is fully integrated and a vital element of a regional transport network that provides consistent, reliable, and accessible service to every traveler.
Enhancing the customer experience by providing each individual equitable, accessible, traveler-centric service leveraging public transportation’s long-standing capability and traditional role in this respect.
Eleven MOD Sandbox grantees are piloting a variety of MOD use cases and enabling technologies, such
as smart phone trip planners, first- and last-mile programs using shared mobility, and paratransit service
using innovative demand-responsive technologies. The MOD Sandbox Independent Evaluation, a review of
the performance and impacts of the MOD Sandbox projects, will be completed in 2020. Early lessons
learned from the MOD Sandbox demonstration sites include:
Some public transit agencies liked the ability to name partners without a traditional procurement method, while others would have preferred to issue a request for proposal to solicit prospective vendors.
Public agencies and private sector partners were ambitious in their initial MOD project designs. This resulted in the rescoping or downscaling of many pilot projects.
Several public agencies noted challenges in working with private vendors, particularly related to contracting and data agreements. In some cases, partners were unable to agree to terms. In others, partners employed a range of techniques to more narrowly tailor data sharing requests to include: less frequent reporting, more aggregate data reporting, and higher levels of geo-spatial data to protect consumer and proprietary vendor information.
A number of public agencies expressed ongoing concerns about the reliability of private sector partners, such as 1) partners that overpromised and underdelivered; 2) partners that promised data but were unwilling to share sufficient data for the public agency to report key data metrics to FTA; and 3) partners whose business models evolved through the course of the pilot projects, causing project continuation after the MOD Sandbox deployment to be challenging.
Some project sites reported challenges transitioning from the Sandbox demonstration to regular post-demonstration service because of the drug and alcohol testing currently required for federally funded initiatives.
Identifying sustainable business models and partnerships is key to enabling the continuation of successful programs post pilot.
U.S. Department of Transportation
Office of the Assistant Secretary for Research and Technology
Intelligent Transportation Systems Joint Program Office
87
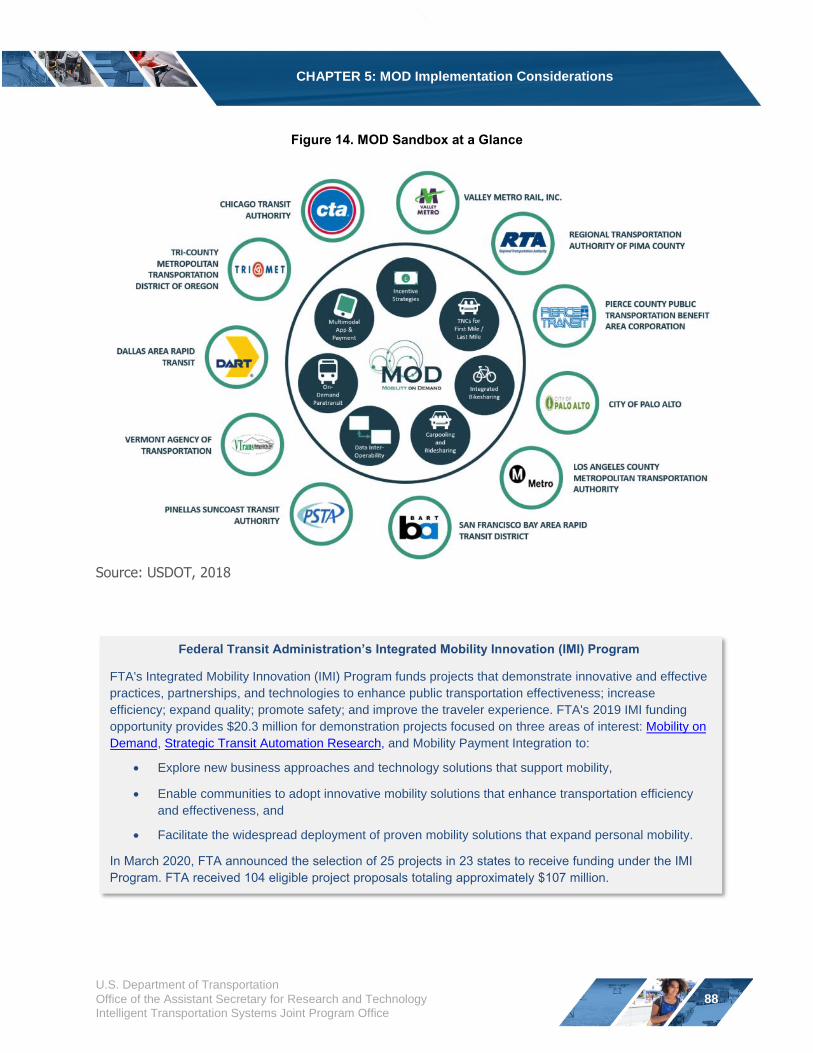
CHAPTER 5: MOD Implementation Considerations
Figure 14. MOD Sandbox at a Glance
Source: USDOT, 2018
Federal Transit Administration’s Integrated Mobility Innovation (IMI) Program
FTA's Integrated Mobility Innovation (IMI) Program funds projects that demonstrate innovative and effective
practices, partnerships, and technologies to enhance public transportation effectiveness; increase
efficiency; expand quality; promote safety; and improve the traveler experience. FTA's 2019 IMI funding
opportunity provides $20.3 million for demonstration projects focused on three areas of interest: Mobility on
Demand, Strategic Transit Automation Research, and Mobility Payment Integration to:
• Explore new business approaches and technology solutions that support mobility,
• Enable communities to adopt innovative mobility solutions that enhance transportation efficiency
and effectiveness, and
• Facilitate the widespread deployment of proven mobility solutions that expand personal mobility.
In March 2020, FTA announced the selection of 25 projects in 23 states to receive funding under the IMI Program. FTA received 104 eligible project proposals totaling approximately $107 million.
U.S. Department of Transportation
Office of the Assistant Secretary for Research and Technology
Intelligent Transportation Systems Joint Program Office
88
CHAPTER 5: MOD Implementation Considerations
Federal Transit Administration’s Accelerating Innovative Mobility (AIM) Program
FTA's Accelerating Innovative Mobility (AIM) Program will provide $11 million in challenge grants to help
transit agencies experiment with new ways of doing business, such as exploring new service models that
provide more efficient and frequent service. The AIM Program will advance transportation innovation by
promoting forward-thinking approaches to finance, system design, and service. FTA announced a Notice of Funding Opportunity for the AIM Program in March 2020.
Key Takeaways
Pilot projects provide an opportunity for public agencies to test innovations, validate the
feasibility of deployments, and measure the impacts of services, and also serve as a venue
for evaluating public policies that could impact MOD.
A six-step project design and evaluation framework can be used as a general process to
develop and evaluate MOD pilots. Six key steps include: 1) Define Project Objectives; 2)
Identify Project Hypothesis; 3) Develop Project Metrics; 4) Identify Pilot Data Sources; 5)
Define Methods of Analysis; and 6) Pilot Evaluations.
U.S. Department of Transportation
Office of the Assistant Secretary for Research and Technology
Intelligent Transportation Systems Joint Program Office
89
CHAPTER 5: MOD Implementation Considerations
MOD and Labor
The growth of MOD is changing traditional labor roles, creating new employment opportunities, and
disrupting incumbent industries. This section discusses the various impacts of MOD on labor and
other stakeholders and considerations for overcoming potential labor challenges.
Impacts of MOD on Labor
MOD is contributing to employment growth in some sectors of transportation, such as increased
demand for CNS, TNCs, and microtransit drivers. However, MOD is also disrupting existing
employment where demand for other services have declined, such as taxis and liveries (Cohen and
Shaheen, 2016). In addition to changes in the number and types of jobs available, MOD is also
disrupting traditional labor practices, often contributing to the growth of part-time, flexible schedule,
and independent contractor work (Hall and Kruger, 2016). Key MOD labor issues typically include:
Worker-Company Relationship: App-based workers may be classified as employees or
independent contractors which can impact a worker’s compensation, taxes, and benefits. Generally, an individual is considered an independent contractor if the payer has the right to
control or direct only the result of the work and not what will be done and how it will be
done. Typically, a person who performs services for an employer is considered an employee
if the employer can control what will be done and how it will be done (i.e., dictating the
nature of the work and how it is completed) (Gould, 2017);
Benefits: Depending on their employment classification, transportation workers may be
eligible for different benefits (e.g., overtime pay, health insurance);
Wages: In many jurisdictions, mobility service providers may not have a minimum wage,
reducing the cost of services for consumers but also contributing downward wage pressure
on incumbent modes (e.g., taxis);
Skills: MOD is impacting the skills, number of employees, and job classifications in the
transportation sector (e.g., cashless payments through smartphones allow public transit
agencies to phase out farebox cash handlers);
Training: As MOD evolves, staff may need to be retrained or new staff may need to be
hired with different skillsets (e.g., public agencies may need to hire data analysts); and
Emerging Positions: MOD can create new job classifications (e.g., personnel that
rebalance and/or recharge shared micromobility fleets) (Charge Ahead California, 2012).
Connected and automated vehicle applications will likely continue to impact the types of jobs and
skills required for labor in the future.
U.S. Department of Transportation
Office of the Assistant Secretary for Research and Technology
Intelligent Transportation Systems Joint Program Office
90
CHAPTER 5: MOD Implementation Considerations
Key Stakeholders in the Labor Impacts of MOD
There are a variety of labor stakeholders, such as regulators, mobility service providers, workers,
and unions. These stakeholders include:
Regulators
Federal government defines “employee” and “independent contractor” classifications in the National Labor Relations Act. Federal protections for employees pertaining to wages,
hours, and other working conditions may also be implemented through federal legislation
and regulation, such as income, Social Security, Medicare, and unemployment taxes paid to
the Internal Revenue Service by employers.
State, airport, and local authorities establish regulatory requirements, such as
background checks and liability insurance for mobility service providers, employees, and
independent contractors within their jurisdictions. Issues states typically regulate include:
insurance, driver licensing, motor vehicle registrations, livery laws, and volunteer
protections. In the absence of statewide regulation, local authorities may establish their own
labor regulations (Ashbaugh, 2003). In some jurisdictions, airport authorities may be granted
unique authority to regulate MOD, including labor-related issues and contracts.
Service Providers
Supply chain managers provide long-distance goods delivery and shipping and face long-
term impacts from automated long-haul trucks. Federal regulation regarding the role of
human drivers in automated trucks is under development. State regulations for human
drivers vary, complicating inter-state trucking. The USDOT regulates the number of hours
drivers can work and the minimum amount of time drivers must spend resting between
shifts. For example, drivers can work a maximum of 60 hours over seven consecutive days
with a required 10 hours off duty per day.
Mobility service providers maintain their own hiring practices, typically classifying most
workers as independent contractors for many job classifications.
Public transit agencies typically rely on represented (i.e., unionized) and unrepresented
(i.e., non-unionized) employees to provide their services. Public transit agencies receiving
federal funds must provide certain benefits to their employees, such as health insurance and
retirement options.5
Taxi companies are encountering competitive pressure from TNCs and other demand
responsive services that may be regulated differently.
5 Protections for public transportation workers in public transit agencies that receive federal funds are set forth in 49 USC § 5333(b),
also known as Section 13(c) of the Federal Transit Act.
U.S. Department of Transportation
Office of the Assistant Secretary for Research and Technology
Intelligent Transportation Systems Joint Program Office
91
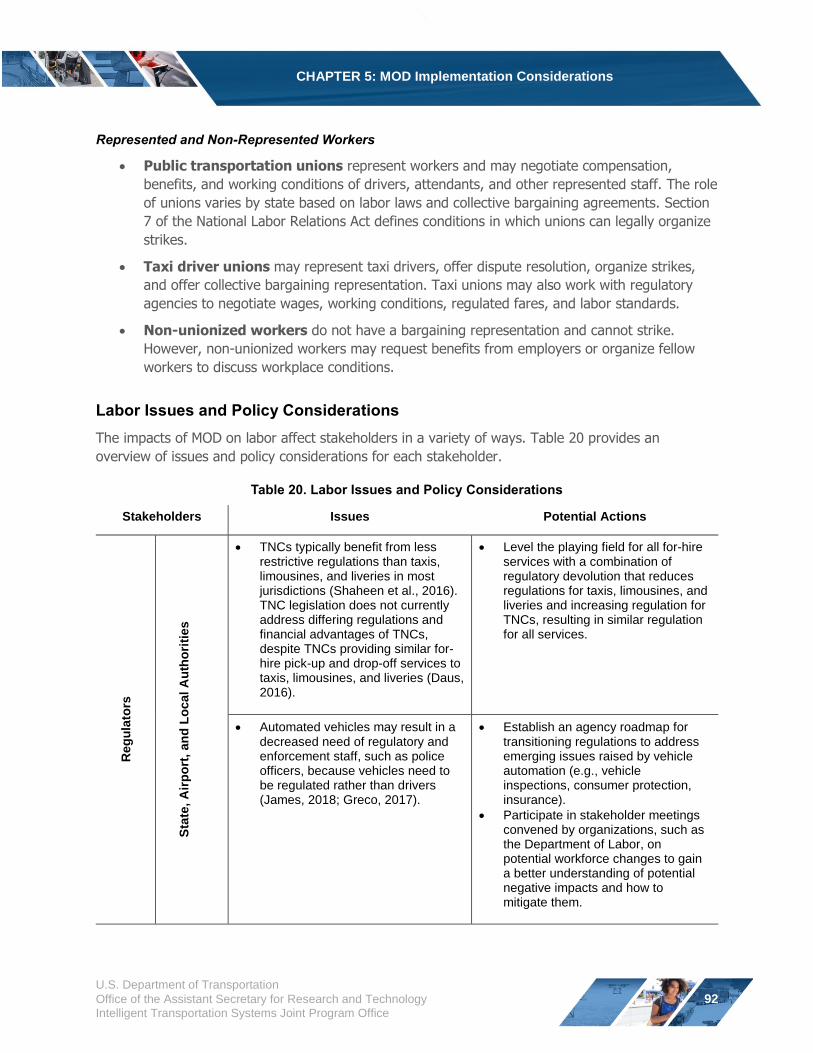
CHAPTER 5: MOD Implementation Considerations
Represented and Non-Represented Workers
Public transportation unions represent workers and may negotiate compensation,
benefits, and working conditions of drivers, attendants, and other represented staff. The role
of unions varies by state based on labor laws and collective bargaining agreements. Section
7 of the National Labor Relations Act defines conditions in which unions can legally organize
strikes.
Taxi driver unions may represent taxi drivers, offer dispute resolution, organize strikes,
and offer collective bargaining representation. Taxi unions may also work with regulatory
agencies to negotiate wages, working conditions, regulated fares, and labor standards.
Non-unionized workers do not have a bargaining representation and cannot strike.
However, non-unionized workers may request benefits from employers or organize fellow
workers to discuss workplace conditions.
Labor Issues and Policy Considerations
The impacts of MOD on labor affect stakeholders in a variety of ways. Table 20 provides an
overview of issues and policy considerations for each stakeholder.
Table 20. Labor Issues and Policy Considerations
Stakeholders Issues Potential Actions
Reg
ula
tors
Sta
te, A
irp
ort
, an
d L
ocal A
uth
ori
ties
TNCs typically benefit from less restrictive regulations than taxis, limousines, and liveries in most jurisdictions (Shaheen et al., 2016). TNC legislation does not currently address differing regulations and financial advantages of TNCs, despite TNCs providing similar for-hire pick-up and drop-off services to taxis, limousines, and liveries (Daus, 2016).
Level the playing field for all for-hire services with a combination of regulatory devolution that reduces regulations for taxis, limousines, and liveries and increasing regulation for TNCs, resulting in similar regulation for all services.
Automated vehicles may result in a decreased need of regulatory and enforcement staff, such as police officers, because vehicles need to be regulated rather than drivers (James, 2018; Greco, 2017).
Establish an agency roadmap for transitioning regulations to address emerging issues raised by vehicle automation (e.g., vehicle inspections, consumer protection, insurance).
Participate in stakeholder meetings convened by organizations, such as the Department of Labor, on potential workforce changes to gain a better understanding of potential negative impacts and how to mitigate them.
U.S. Department of Transportation
Office of the Assistant Secretary for Research and Technology
Intelligent Transportation Systems Joint Program Office
92
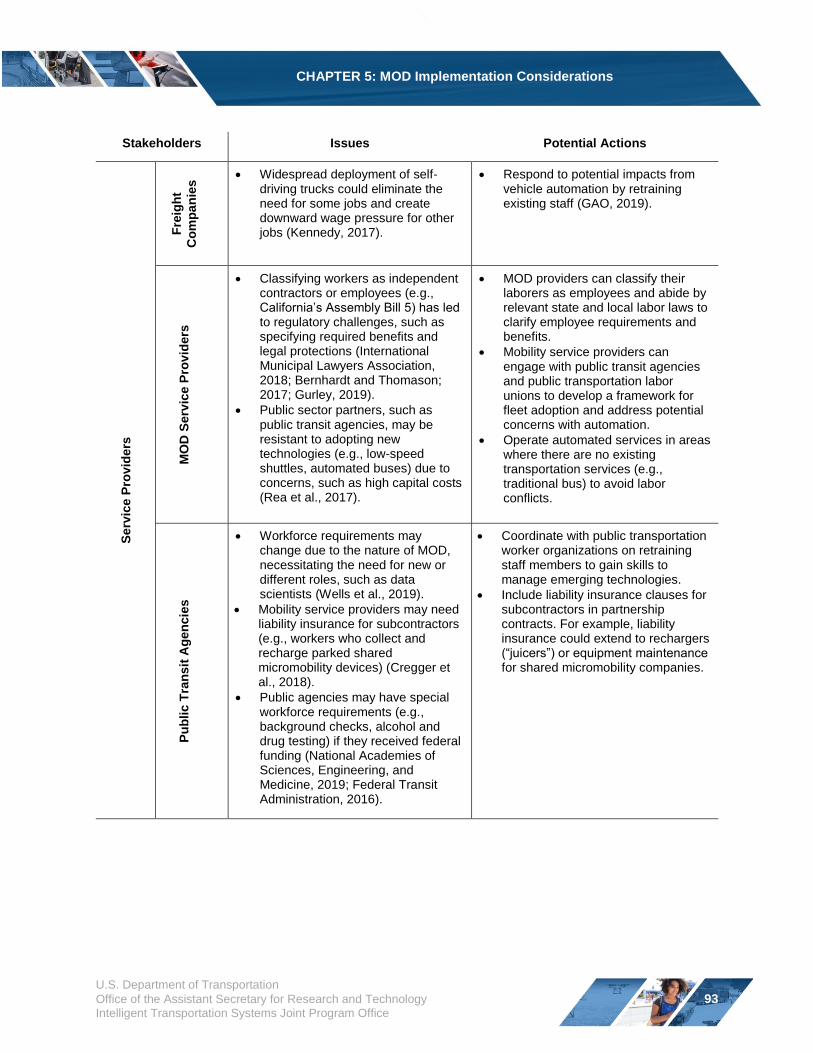
CHAPTER 5: MOD Implementation Considerations
Stakeholders Issues Potential Actions
Serv
ice
Pro
vid
ers
Fre
igh
t
Co
mp
an
ies Widespread deployment of self-
driving trucks could eliminate the need for some jobs and create downward wage pressure for other jobs (Kennedy, 2017).
Respond to potential impacts from vehicle automation by retraining existing staff (GAO, 2019).
MO
D S
erv
ice
Pro
vid
ers
Classifying workers as independent contractors or employees (e.g., California’s Assembly Bill 5) has led to regulatory challenges, such as specifying required benefits and legal protections (International Municipal Lawyers Association, 2018; Bernhardt and Thomason; 2017; Gurley, 2019).
Public sector partners, such as public transit agencies, may be resistant to adopting new technologies (e.g., low-speed shuttles, automated buses) due to concerns, such as high capital costs (Rea et al., 2017).
MOD providers can classify their laborers as employees and abide by relevant state and local labor laws to clarify employee requirements and benefits.
Mobility service providers can engage with public transit agencies and public transportation labor unions to develop a framework for fleet adoption and address potential concerns with automation.
Operate automated services in areas where there are no existing transportation services (e.g., traditional bus) to avoid labor conflicts.
Pu
blic T
ran
sit
Ag
en
cie
s
Workforce requirements may change due to the nature of MOD, necessitating the need for new or different roles, such as data scientists (Wells et al., 2019).
Mobility service providers may need liability insurance for subcontractors (e.g., workers who collect and recharge parked shared micromobility devices) (Cregger et al., 2018).
Public agencies may have special workforce requirements (e.g., background checks, alcohol and drug testing) if they received federal funding (National Academies of Sciences, Engineering, and Medicine, 2019; Federal Transit Administration, 2016).
Coordinate with public transportation worker organizations on retraining staff members to gain skills to manage emerging technologies.
Include liability insurance clauses for subcontractors in partnership contracts. For example, liability insurance could extend to rechargers (“juicers”) or equipment maintenance for shared micromobility companies.
U.S. Department of Transportation
Office of the Assistant Secretary for Research and Technology
Intelligent Transportation Systems Joint Program Office
93
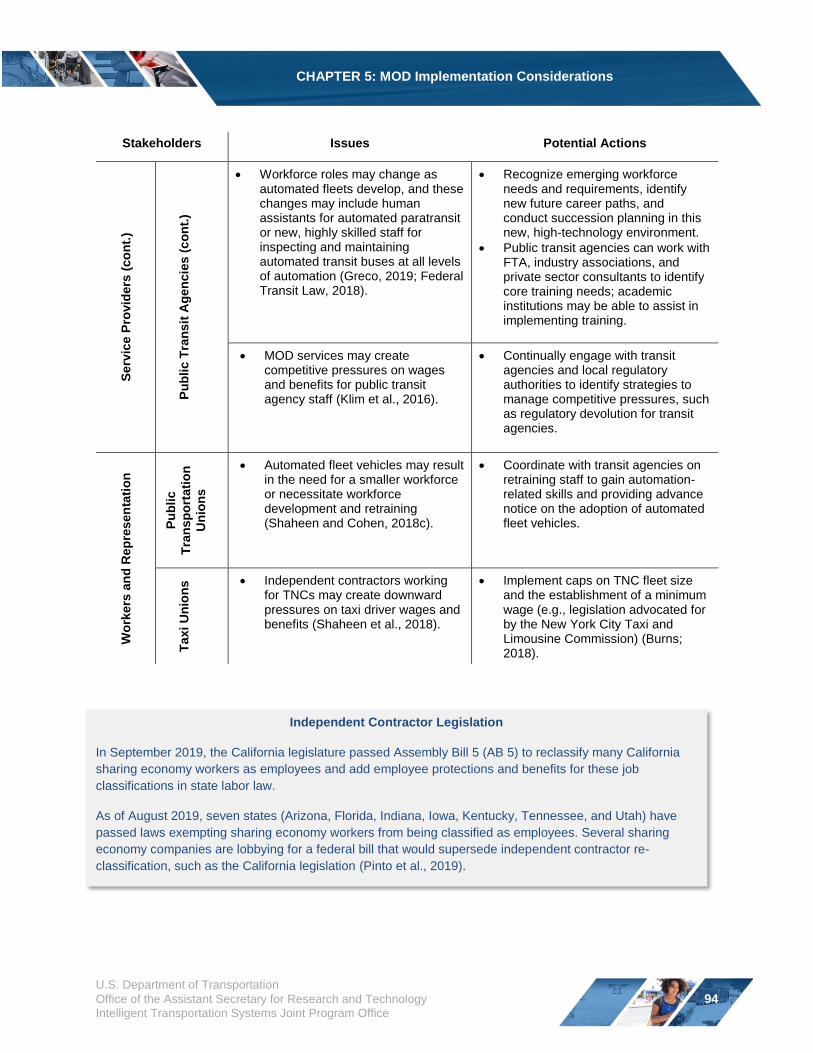
CHAPTER 5: MOD Implementation Considerations
Stakeholders Issues Potential Actions
Serv
ice
Pro
vid
ers
(co
nt.
)
Pu
blic T
ran
sit
Ag
en
cie
s (
co
nt.
) Workforce roles may change as
automated fleets develop, and these changes may include human assistants for automated paratransit or new, highly skilled staff for inspecting and maintaining automated transit buses at all levels of automation (Greco, 2019; Federal Transit Law, 2018).
Recognize emerging workforce needs and requirements, identify new future career paths, and conduct succession planning in this new, high-technology environment.
Public transit agencies can work with FTA, industry associations, and private sector consultants to identify core training needs; academic institutions may be able to assist in implementing training.
MOD services may create competitive pressures on wages and benefits for public transit agency staff (Klim et al., 2016).
Continually engage with transit agencies and local regulatory authorities to identify strategies to manage competitive pressures, such as regulatory devolution for transit agencies.
Wo
rkers
an
d R
ep
rese
nta
tio
n
Pu
blic
Tra
nsp
ort
ati
on
Un
ion
s
Automated fleet vehicles may result in the need for a smaller workforce or necessitate workforce development and retraining (Shaheen and Cohen, 2018c).
Coordinate with transit agencies on retraining staff to gain automation-related skills and providing advance notice on the adoption of automated fleet vehicles.
Taxi U
nio
ns Independent contractors working
for TNCs may create downward pressures on taxi driver wages and benefits (Shaheen et al., 2018).
Implement caps on TNC fleet size and the establishment of a minimum wage (e.g., legislation advocated for by the New York City Taxi and Limousine Commission) (Burns; 2018).
Independent Contractor Legislation
In September 2019, the California legislature passed Assembly Bill 5 (AB 5) to reclassify many California
sharing economy workers as employees and add employee protections and benefits for these job
classifications in state labor law.
As of August 2019, seven states (Arizona, Florida, Indiana, Iowa, Kentucky, Tennessee, and Utah) have
passed laws exempting sharing economy workers from being classified as employees. Several sharing
economy companies are lobbying for a federal bill that would supersede independent contractor re-
classification, such as the California legislation (Pinto et al., 2019).
U.S. Department of Transportation
Office of the Assistant Secretary for Research and Technology
Intelligent Transportation Systems Joint Program Office
94
CHAPTER 5: MOD Implementation Considerations
Key Takeaways
MOD is impacting transportation labor in a variety of ways, such as creating demand for new
jobs while disrupting others.
Key stakeholders in transportation labor include regulators, service providers, represented
workers, and non-represented workers.
The potential negative impacts of MOD on labor could be addressed in a variety of ways,
such as labor regulation (e.g., establishing a minimum wage) and workforce development.
U.S. Department of Transportation
Office of the Assistant Secretary for Research and Technology
Intelligent Transportation Systems Joint Program Office
95
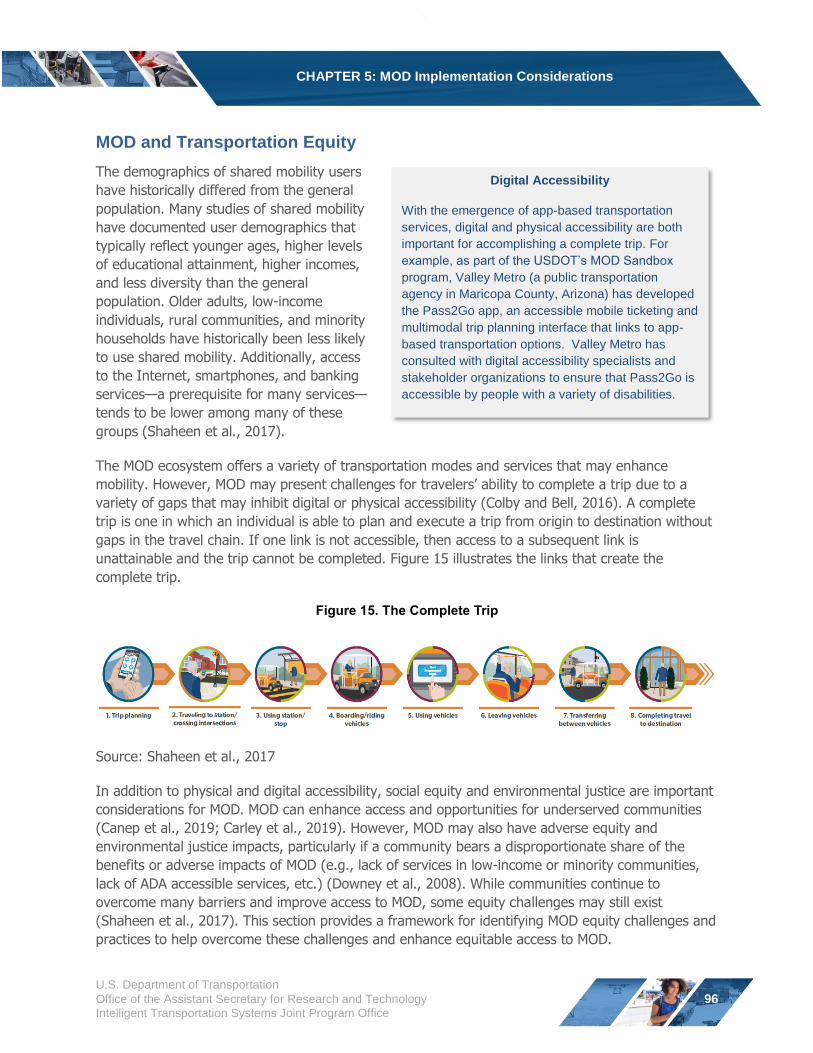
CHAPTER 5: MOD Implementation Considerations
MOD and Transportation Equity
The demographics of shared mobility users
have historically differed from the general Digital Accessibility
population. Many studies of shared mobility With the emergence of app-based transportation
have documented user demographics that services, digital and physical accessibility are both
typically reflect younger ages, higher levels important for accomplishing a complete trip. For
of educational attainment, higher incomes, example, as part of the USDOT’s MOD Sandbox
and less diversity than the general
population. Older adults, low-income
individuals, rural communities, and minority
program, Valley Metro (a public transportation
agency in Maricopa County, Arizona) has developed
the Pass2Go app, an accessible mobile ticketing and
multimodal trip planning interface that links to app-households have historically been less likely based transportation options. Valley Metro has to use shared mobility. Additionally, access consulted with digital accessibility specialists and
to the Internet, smartphones, and banking stakeholder organizations to ensure that Pass2Go is
services—a prerequisite for many services— accessible by people with a variety of disabilities.
tends to be lower among many of these
groups (Shaheen et al., 2017).
The MOD ecosystem offers a variety of transportation modes and services that may enhance
mobility. However, MOD may present challenges for travelers’ ability to complete a trip due to a
variety of gaps that may inhibit digital or physical accessibility (Colby and Bell, 2016). A complete
trip is one in which an individual is able to plan and execute a trip from origin to destination without
gaps in the travel chain. If one link is not accessible, then access to a subsequent link is
unattainable and the trip cannot be completed. Figure 15 illustrates the links that create the
complete trip.
Figure 15. The Complete Trip
Source: Shaheen et al., 2017
In addition to physical and digital accessibility, social equity and environmental justice are important
considerations for MOD. MOD can enhance access and opportunities for underserved communities
(Canep et al., 2019; Carley et al., 2019). However, MOD may also have adverse equity and
environmental justice impacts, particularly if a community bears a disproportionate share of the
benefits or adverse impacts of MOD (e.g., lack of services in low-income or minority communities,
lack of ADA accessible services, etc.) (Downey et al., 2008). While communities continue to
overcome many barriers and improve access to MOD, some equity challenges may still exist
(Shaheen et al., 2017). This section provides a framework for identifying MOD equity challenges and
practices to help overcome these challenges and enhance equitable access to MOD.
U.S. Department of Transportation
Office of the Assistant Secretary for Research and Technology
Intelligent Transportation Systems Joint Program Office
96
CHAPTER 5: MOD Implementation Considerations
The Spatial, Temporal, Economic, Physiological, and Social (STEPS) to
Transportation Equity Framework
The STEPS framework can be used to address environmental justice6 challenges. To understand
potential equity challenges impacting users, stakeholders can apply the STEPS framework (Shaheen
et al., 2017). STEPS stands for Spatial – Temporal – Economic – Physiological – Social. These
barriers are defined as:
Spatial barriers create physical gaps in the transportation network, such as the lack of
service availability in a particular neighborhood, excessively long distances between
destinations, and lack of public transit within walking distance.
Temporal barriers create gaps in the transportation network during particular travel
times, such as the inability to complete off-peak or late night trips due to lack of services
(e.g., very long public transportation headways during the late night hours).
Economic barriers include financial challenges, such as high direct costs (e.g., fares,
tolls), indirect costs (e.g., smartphone ownership), and structural barriers (e.g., banking
access) that may preclude users from using MOD.
Physiological barriers include physical and cognitive limitations that make using
standard transportation modes difficult or impossible for certain individuals (e.g., people
with disabilities, older adults, etc.).
Social barriers include social, cultural, safety, and language challenges that may inhibit a
potential rider’s comfort with using transportation modes and services (e.g., poorly targeted marketing, lack of multi-language information, neighborhood crime).
More information on the STEPS framework can be found in Travel Behavior: Shared Mobility and
Transportation Equity.
6 The USDOT defines environmental justice as the fair treatment and meaningful involvement of all people regardless of race, color, national origin, or income with respect to the development,
implementation, and enforcement of transportation services, laws, regulations, and policies. Fair treatment means that no group of people should have disproportionate access to a service as a result of government and commercial transportation operations or policies. Meaningful involvement means that: 1)
people have an opportunity to participate in decisions about activities that may affect them, 2) the public’s contribution can influence regulatory agencies’ decisions, 3) people’s concerns will be considered in the decision-making process, and 4) policymakers will seek out and facilitate the involvement of people specifically affected. For more information on the USDOT’s environmental justice policy, please see Transportation Policy - Environmental Justice.
U.S. Department of Transportation
Office of the Assistant Secretary for Research and Technology
Intelligent Transportation Systems Joint Program Office
97
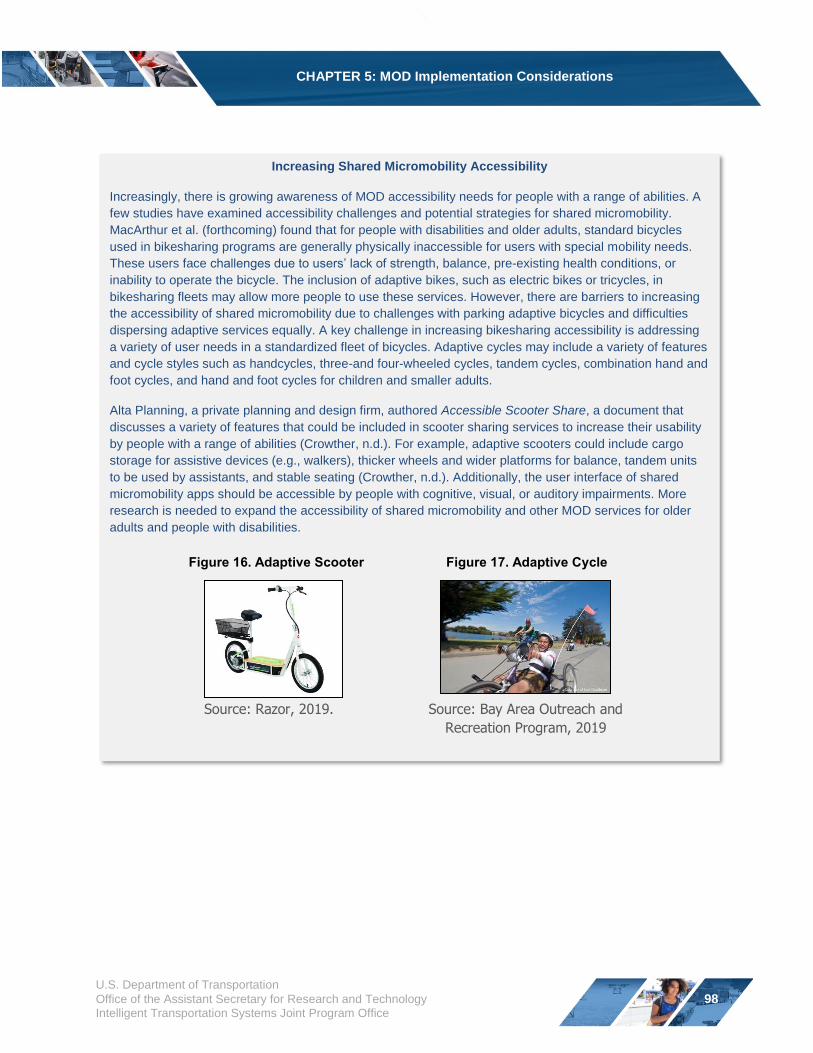
CHAPTER 5: MOD Implementation Considerations
Increasing Shared Micromobility Accessibility
Increasingly, there is growing awareness of MOD accessibility needs for people with a range of abilities. A
few studies have examined accessibility challenges and potential strategies for shared micromobility.
MacArthur et al. (forthcoming) found that for people with disabilities and older adults, standard bicycles
used in bikesharing programs are generally physically inaccessible for users with special mobility needs.
These users face challenges due to users’ lack of strength, balance, pre-existing health conditions, or
inability to operate the bicycle. The inclusion of adaptive bikes, such as electric bikes or tricycles, in
bikesharing fleets may allow more people to use these services. However, there are barriers to increasing
the accessibility of shared micromobility due to challenges with parking adaptive bicycles and difficulties
dispersing adaptive services equally. A key challenge in increasing bikesharing accessibility is addressing
a variety of user needs in a standardized fleet of bicycles. Adaptive cycles may include a variety of features
and cycle styles such as handcycles, three-and four-wheeled cycles, tandem cycles, combination hand and
foot cycles, and hand and foot cycles for children and smaller adults.
Alta Planning, a private planning and design firm, authored Accessible Scooter Share, a document that
discusses a variety of features that could be included in scooter sharing services to increase their usability
by people with a range of abilities (Crowther, n.d.). For example, adaptive scooters could include cargo
storage for assistive devices (e.g., walkers), thicker wheels and wider platforms for balance, tandem units
to be used by assistants, and stable seating (Crowther, n.d.). Additionally, the user interface of shared
micromobility apps should be accessible by people with cognitive, visual, or auditory impairments. More
research is needed to expand the accessibility of shared micromobility and other MOD services for older
adults and people with disabilities.
Figure 16. Adaptive Scooter Figure 17. Adaptive Cycle
Source: Razor, 2019. Source: Bay Area Outreach and
Recreation Program, 2019
U.S. Department of Transportation
Office of the Assistant Secretary for Research and Technology
Intelligent Transportation Systems Joint Program Office
98
CHAPTER 5: MOD Implementation Considerations
Common Equity Challenges and Potential Actions
The STEPS framework can be used to identify a variety of equity challenges for users accessing
MOD. Four common equity challenges include:
Access by Un-or Under-Banked Households – MOD services may require a credit card,
debit card, or credit hold to access services, which may not be feasible for households that
do not have access to financial institutions.
Digital Divide – MOD services may require a smartphone or Internet access. These
requirements may present themselves as a barrier for low-income or rural households.
Accessibility – Digital platforms (e.g., smartphone apps) and mobility services (e.g.,
vehicles, bicycles, scooters, etc.) may not be accessible to people with physical, cognitive,
auditory, visual, or other disabilities.
Affordability – MOD may be more expensive compared to traditional transportation modes
(e.g., cycling, walking, public transportation) that could limit financial accessibility to these
services.
Table 21 provides examples of additional equity challenges and use cases that MOD may be able to
help overcome.
U.S. Department of Transportation
Office of the Assistant Secretary for Research and Technology
Intelligent Transportation Systems Joint Program Office
99
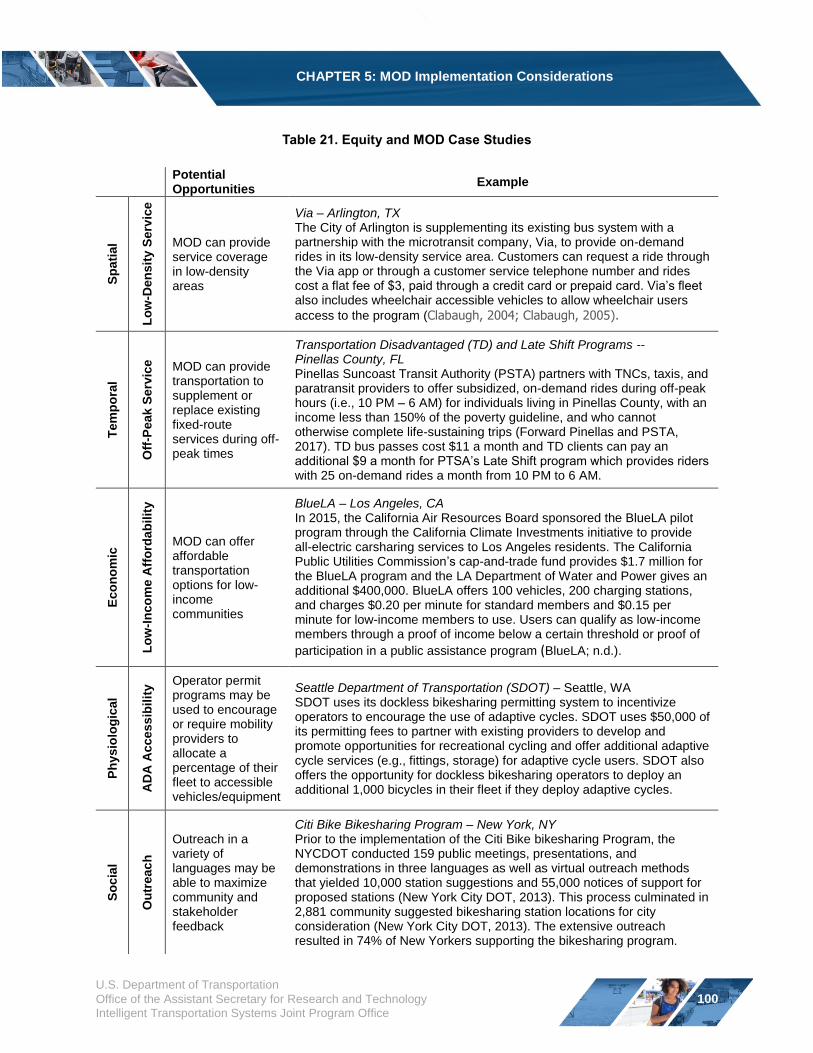
CHAPTER 5: MOD Implementation Considerations
Table 21. Equity and MOD Case Studies
Potential Opportunities
Example
Sp
ati
al
Lo
w-D
en
sit
y S
erv
ice
MOD can provide service coverage in low-density areas
Via – Arlington, TX The City of Arlington is supplementing its existing bus system with a partnership with the microtransit company, Via, to provide on-demand rides in its low-density service area. Customers can request a ride through the Via app or through a customer service telephone number and rides cost a flat fee of $3, paid through a credit card or prepaid card. Via’s fleet also includes wheelchair accessible vehicles to allow wheelchair users
access to the program (Clabaugh, 2004; Clabaugh, 2005).
Tem
po
ral
Off
-Peak S
erv
ice MOD can provide
transportation to supplement or replace existing fixed-route services during off-peak times
Transportation Disadvantaged (TD) and Late Shift Programs --Pinellas County, FL Pinellas Suncoast Transit Authority (PSTA) partners with TNCs, taxis, and paratransit providers to offer subsidized, on-demand rides during off-peak hours (i.e., 10 PM – 6 AM) for individuals living in Pinellas County, with an income less than 150% of the poverty guideline, and who cannot otherwise complete life-sustaining trips (Forward Pinellas and PSTA, 2017). TD bus passes cost $11 a month and TD clients can pay an additional $9 a month for PTSA’s Late Shift program which provides riders with 25 on-demand rides a month from 10 PM to 6 AM.
Eco
no
mic
Lo
w-I
nco
me A
ffo
rda
bilit
y
MOD can offer affordable transportation options for low-income communities
BlueLA – Los Angeles, CA In 2015, the California Air Resources Board sponsored the BlueLA pilot program through the California Climate Investments initiative to provide all-electric carsharing services to Los Angeles residents. The California Public Utilities Commission’s cap-and-trade fund provides $1.7 million for the BlueLA program and the LA Department of Water and Power gives an additional $400,000. BlueLA offers 100 vehicles, 200 charging stations, and charges $0.20 per minute for standard members and $0.15 per minute for low-income members to use. Users can qualify as low-income members through a proof of income below a certain threshold or proof of
participation in a public assistance program (BlueLA; n.d.).
Ph
ysio
log
ical
AD
A A
ccess
ibilit
y
Operator permit programs may be used to encourage or require mobility providers to allocate a percentage of their fleet to accessible vehicles/equipment
Seattle Department of Transportation (SDOT) – Seattle, WA SDOT uses its dockless bikesharing permitting system to incentivize operators to encourage the use of adaptive cycles. SDOT uses $50,000 of its permitting fees to partner with existing providers to develop and promote opportunities for recreational cycling and offer additional adaptive cycle services (e.g., fittings, storage) for adaptive cycle users. SDOT also offers the opportunity for dockless bikesharing operators to deploy an additional 1,000 bicycles in their fleet if they deploy adaptive cycles.
So
cia
l
Ou
treac
h
Outreach in a variety of languages may be able to maximize community and stakeholder feedback
Citi Bike Bikesharing Program – New York, NY Prior to the implementation of the Citi Bike bikesharing Program, the NYCDOT conducted 159 public meetings, presentations, and demonstrations in three languages as well as virtual outreach methods that yielded 10,000 station suggestions and 55,000 notices of support for proposed stations (New York City DOT, 2013). This process culminated in 2,881 community suggested bikesharing station locations for city consideration (New York City DOT, 2013). The extensive outreach resulted in 74% of New Yorkers supporting the bikesharing program.
U.S. Department of Transportation
Office of the Assistant Secretary for Research and Technology
Intelligent Transportation Systems Joint Program Office
100
CHAPTER 5: MOD Implementation Considerations
Legislation and Regulation Supporting MOD Equity
Legislation and regulation requiring minimum service standards for MOD can help ensure that users
and communities with a variety of needs have access to the potential benefits of on-demand
mobility. Some existing legislative examples that may be applicable to promoting equitable access
include:
Americans with Disabilities Act of 1990 (ADA): The ADA prohibits discrimination
against people with disabilities on the basis of their disability and requires public agencies to
provide equitable service to people with disabilities if they are not able to use existing
services.
o The Rehabilitation Act of 1998 - Section 508: This section of the ADA requires
that federal agencies must ensure all electronic and information technology,
including websites and mobile apps, are accessible by people with disabilities.
Accessibility features of technology may include use of phones’ haptic (i.e., touch-
based responses, such as vibrations) capabilities or ability of text to be processed by
screen readers.
Civil Restoration Act of 1987: This law prohibits discrimination within an organization or
agency if the organization or agency receives federal funding.
The Rehabilitation Act of 1973: This law prohibits programs, agencies, or activities that
receive federal funding from discriminating against people with disabilities.
Title VI of the Civil Rights Act of 1964: This law prohibits discrimination based on race,
color, and/or national origin in any program or activity that receives federal funding. This
title prohibits discrimination in federally funded programs and requires equivalent service
provision for individuals who are unable to access certain services, such as banking and
smartphones.
Regulation can also play a key role ensuring equal access to MOD. A few key pieces of landmark
federal regulation that may be applicable to MOD include:
Title 49 CFR Part 21: This regulation implements provisions of Title VI for any program or
activity receiving federal funding from the USDOT.
Title 49 CFR 37.105: This regulation implements equivalent service provisions with respect
to schedules/headways; response time; fares; geographic area of service; hours and days of
service; availability of information; reservations capability; constraints on capacity and
service availability; and restrictions based on trip purpose.
The federal government can also ensure equity through other means, such as the U.S. Access
Board, executive orders, and international efforts to increase equity. Some examples include:
U.S. Department of Transportation
Office of the Assistant Secretary for Research and Technology
Intelligent Transportation Systems Joint Program Office
101
CHAPTER 5: MOD Implementation Considerations
U.S. Access Board: The U.S. Access Board is an independent federal agency that promotes
equality for people with disabilities through leadership in accessible design and the
development of accessibility guidelines and standards. Created in 1973 to ensure access to
federally funded facilities, the U.S. Access Board is a leading source of information on
accessible design. The Board develops and maintains design criteria for the built
environment, transit vehicles, telecommunications equipment, medical diagnostic equipment,
and information technology. The Board also provides technical assistance and training on
accessible design and continues to enforce accessibility standards that cover federally
funded facilities.
Executive Order (EO) 12898 – Federal Actions to Address Environmental Justice
in Minority Populations and Low-Income Populations: This Executive Order requires
federal agencies to prioritize environmental justice as a way to increase transportation equity
for minority and low-income communities.
Web Content Accessibility Guidelines (WCAG) 2.0: These guidelines are published by
the Web Accessibility Initiative of the World Wide Web Consortium, an international non-
governmental organization that guides international Internet standards. The WCAG informs
agencies of what accessibility elements should be considered in website and app
developments including the ability to understand error alerts, auditory accessibility, and
visual understanding.
Examples of State and Local Legislation
At the state and local levels of government, regulation and legislation can also be important for ensuring
equitable access to MOD. For example, California and the City of Sacramento have implemented the
following laws and ordinances:
California’s Disabled Persons Act: This law prohibits discrimination against people with
disabilities in transportation by requiring equal access to all modes of transportation available to the
general public.
California’s Unruh Civil Rights Act: This law prohibits discrimination against protected classes
and guarantees the right to full and equal accommodations, advantages, facilities, privileges, or
services in all business establishments.
Sacramento’s City Code Regulating Shared-Rideable Business and Operations: In April
2019, the City of Sacramento amended sections of its city code regarding “shared-rideables” (i.e.,
shared dockless scooters or bikesharing bicycles). These amendments require the distribution of
20% of fleets into areas classified as opportunity areas, the development of equity plans, and the
leveraging of fines for shared devices that block or restrict walkway or ramp access.
Communities, such as Chicago, San Francisco, and Seattle, are attempting to address accessibility
challenges by leveraging fees on shared mobility, such as TNC accessibility fees. These fees contribute
to accessibility funds that the communities can use to improve their transportation networks.
U.S. Department of Transportation
Office of the Assistant Secretary for Research and Technology
Intelligent Transportation Systems Joint Program Office
102
CHAPTER 5: MOD Implementation Considerations
Organizations such as the American Federation of Labor and Congress of Industrial Organizations
(AFL-CIO) and the Canadian Labour Congress (CLC) have also supported equity in transportation by
reviewing efforts of transit agencies and their partnerships to provide accessible demand response
services for people with disabilities (American Federation of Labor and Congress of Industrial
Organizations and the Canadian Labour Congress, 2016).
Key Takeaways
MOD may be able to enhance accessibility for underserved communities, but it may also
have adverse impacts if a particular population or community bears a disproportionate share
of the benefits or adverse impacts of MOD.
Physical and digital accessibility are key considerations for some vulnerable populations to
accomplish a complete trip.
The STEPS Framework (Spatial, Temporal, Economic, Psychological, and Social) can be used
by stakeholders to identify, prevent, and mitigate potential equity barriers to accessing MOD.
MOD stakeholders may be able to address common STEPS barriers by:
o Requiring or incentivizing mobility service providers to serve underserved
communities.
o Facilitating off-peak partnerships to provide late-night transportation service using
shared mobility.
o Subsidizing access to shared mobility for qualifying low-income users and offering
alternative access modes (e.g., telephone concierge service, text messaging access,
etc.) that do not require a smartphone or high-speed data access.
o Expanding access for people with disabilities and older adults through wheelchair
accessible vehicles (WAVs), adaptive devices, personal assistants, and assistive
technologies.
o Preventing the blocking of access to pedestrians and people with disabilities (e.g.,
sidewalks, curbs, and ramps) by shared mobility services (e.g., bikes, scooters,
TNCs, etc.).
o Conducting education and outreach to an array of potential users, such as low-
income, minority, and immigrant households, for example.
The public sector can play an important role ensuring equitable access to MOD through
regulation and legislation.
U.S. Department of Transportation
Office of the Assistant Secretary for Research and Technology
Intelligent Transportation Systems Joint Program Office
103
CHAPTER 6: Innovative and Emerging Mobility Futures
CHAPTER 6: Innovative and Emerging Mobility Futures
The transportation landscape is changing and assessing how best to accommodate shared,
automated, and aerial modes. Developments in vehicle automation and changes to existing business
models are evolving to include automated vehicles (AVs) and shared automated vehicles (SAVs).
Similar technological developments in aircraft and the aviation industry are supporting urban and
rural air mobility pilots. The impacts of these technological developments can also be seen in
emerging last-mile delivery options, which feature modes such as robots, automated delivery
vehicles (ADVs), and unmanned aircraft systems (i.e., drones). Other innovations, such as 3D
printing (i.e., building a three-dimensional object from a computer-aided design) could have many
applications for MOD, such as reducing the cost of creating devices and vehicles and enabling
consumers to print adaptive devices to enhance the accessibility of MOD.
This chapter discusses innovative and emerging technologies that could have a transformative effect
on communities in the future. The first section discusses the potential impacts of shared automated
vehicles. The next section introduces key concepts and planning considerations for urban air
mobility. The final section discuses last-mile delivery strategies, including unmanned aerial vehicles
and automated delivery robots and vehicles.
Shared Automated Vehicles (SAVs)
The convergence of shared mobility, vehicle automation, and electric-drive technology has the
potential to transform the way people travel and access goods. Vehicle automation and
electrification coupled with pooling could result in shared automated vehicles (SAVs) that offer for-
hire services that could be less expensive on a per mile basis than privately owned vehicles. SAVs
are AVs that are shared among multiple users and can be summoned on-demand, similar to taxis
and TNCs, or can operate a fixed-route service similar to public transportation (Shaheen and Cohen,
2018a). SAVs could have a disruptive impact on traveler and consumer behavior (Shaheen and
Cohen, 2018c). This section summarizes various levels of automation, development trends for AVs
and SAVs, business models, potential impacts, case studies, and future trends.
Levels of Automation
SAE International, a global mobility standards organization, has established five levels of vehicle
automation. These levels of automation define the level of control needed from the human operator
or provided by the vehicle. SAE’s levels of automation are:
Level 0: Vehicles are not automated and drivers perform all of the tasks.
Level 1: Vehicles automate only one primary control function (e.g., self-parking or adaptive
cruise control).
U.S. Department of Transportation
Office of the Assistant Secretary for Research and Technology
Intelligent Transportation Systems Joint Program Office
104
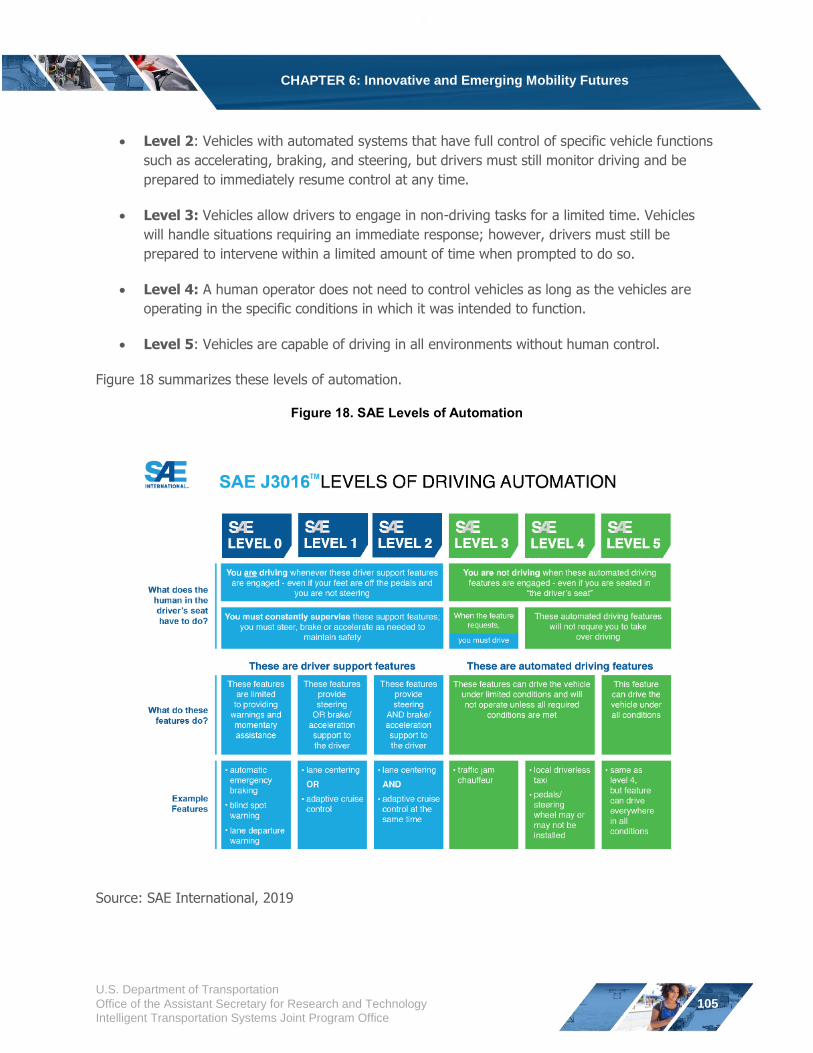
CHAPTER 6: Innovative and Emerging Mobility Futures
Level 2: Vehicles with automated systems that have full control of specific vehicle functions
such as accelerating, braking, and steering, but drivers must still monitor driving and be
prepared to immediately resume control at any time.
Level 3: Vehicles allow drivers to engage in non-driving tasks for a limited time. Vehicles
will handle situations requiring an immediate response; however, drivers must still be
prepared to intervene within a limited amount of time when prompted to do so.
Level 4: A human operator does not need to control vehicles as long as the vehicles are
operating in the specific conditions in which it was intended to function.
Level 5: Vehicles are capable of driving in all environments without human control.
Figure 18 summarizes these levels of automation.
Figure 18. SAE Levels of Automation
Source: SAE International, 2019
U.S. Department of Transportation
Office of the Assistant Secretary for Research and Technology
Intelligent Transportation Systems Joint Program Office
105
CHAPTER 6: Innovative and Emerging Mobility Futures
Automated Vehicle (AV) Business Models
Business models could likely impact the evolution and deployment of AVs and SAVs. AVs and SAVs
could eventually evolve from present day ownership and business models similar to how shared
mobility and micromobility services are currently deployed (Stocker and Shaheen, 2017). Potential
ownership and business models could include:
Business-to-Consumer (B2C) – A company owns or leases a fleet of SAVs that are
accessible to riders via a membership or per-use fee.
Peer-to-Peer (P2P) – A company provides the resources to facilitate the short-term use of
a vehicle between a host (the owner) and a guest (the lessee).
Fractional Ownership – Multiple parties share the cost of purchasing and maintaining an
AV in exchange for personal use and access.
Private Ownership – An owner buys or leases an AV for personal use, similar to private
vehicle ownership.
Publicly Owned and/or Operated – A public agency owns and operates AVs similar to
public transportation. This could include both large vehicles (e.g., buses) and smaller
vehicles (e.g., shuttles and SAVs).
Increasing levels of automation and potential ownership and business models are anticipated to
impact how and where AVs and SAVs are deployed. Table 22 details anticipated AV and SAV levels
of automation from Level 3 to Level 5 automation, operational design domains, areas of
deployment, and potential impacts. An operational design domain (ODD) is the specific conditions an
automated system is designed to function in, including limitations, such as geography, traffic, speed,
and roadway typology (Stocker et al., Forthcoming).
U.S. Department of Transportation
Office of the Assistant Secretary for Research and Technology
Intelligent Transportation Systems Joint Program Office
106
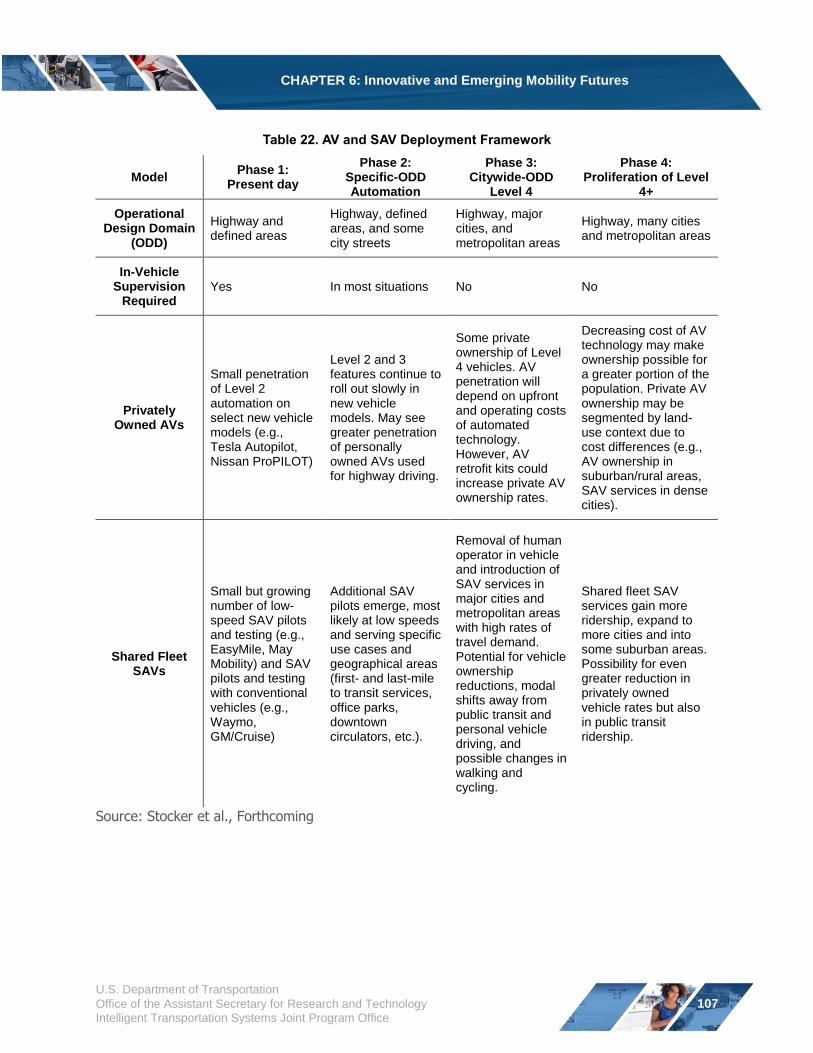
CHAPTER 6: Innovative and Emerging Mobility Futures
Table 22. AV and SAV Deployment Framework
Model Phase 1:
Present day
Phase 2: Specific-ODD Automation
Phase 3: Citywide-ODD
Level 4
Phase 4: Proliferation of Level
4+
Operational Design Domain
(ODD)
Highway and defined areas
Highway, defined areas, and some city streets
Highway, major cities, and metropolitan areas
Highway, many cities and metropolitan areas
In-Vehicle Supervision
Required Yes In most situations No No
Privately Owned AVs
Small penetration of Level 2 automation on select new vehicle models (e.g., Tesla Autopilot, Nissan ProPILOT)
Level 2 and 3 features continue to roll out slowly in new vehicle models. May see greater penetration of personally owned AVs used for highway driving.
Some private ownership of Level 4 vehicles. AV penetration will depend on upfront and operating costs of automated technology. However, AV retrofit kits could increase private AV ownership rates.
Decreasing cost of AV technology may make ownership possible for a greater portion of the population. Private AV ownership may be segmented by land-use context due to cost differences (e.g., AV ownership in suburban/rural areas, SAV services in dense cities).
Shared Fleet SAVs
Small but growing number of low-speed SAV pilots and testing (e.g., EasyMile, May Mobility) and SAV pilots and testing with conventional vehicles (e.g., Waymo, GM/Cruise)
Additional SAV pilots emerge, most likely at low speeds and serving specific use cases and geographical areas (first- and last-mile to transit services, office parks, downtown circulators, etc.).
Removal of human operator in vehicle and introduction of SAV services in major cities and metropolitan areas with high rates of travel demand. Potential for vehicle ownership reductions, modal shifts away from public transit and personal vehicle driving, and possible changes in walking and cycling.
Shared fleet SAV services gain more ridership, expand to more cities and into some suburban areas. Possibility for even greater reduction in privately owned vehicle rates but also in public transit ridership.
Source: Stocker et al., Forthcoming
U.S. Department of Transportation
Office of the Assistant Secretary for Research and Technology
Intelligent Transportation Systems Joint Program Office
107
CHAPTER 6: Innovative and Emerging Mobility Futures
Potential Impacts of AVs and SAVs
Vehicle automation could result in fundamental changes by altering the built environment and land
use, household transportation costs, commute patterns, and mode choice. The adoption of AVs and
SAVs may be impacted by the public’s perceptions towards automation and the potential safety
impacts (Automated Vehicles for Safety, 2017). Public agencies can pursue a variety of policies to
prevent and mitigate potential adverse impacts of vehicle automation and maximize the likelihood of
sustainable outcomes (Autonomous Vehicles State Bill Tracking Database, 2019). Potential impacts
that public agencies may have to address include:
Environment and Land Use Impacts – Reduced vehicle ownership due to SAVs could
result in more compact urban centers and shorter commutes due to the repurposing of
parking for infill development. Sharing vehicles or commute trips amongst multiple
individuals would require people to live relatively close to one another and their respective
jobs. However, the growth of telecommuting and AVs could also make longer commutes
more practical, which could shift consumer preferences in favor of living in less dense built
environments (e.g., suburbs, exurbs, and edge cities).
Labor and Economic Impacts – The impacts of vehicle automation
on public transit, goods delivery, and
other sectors of the transportation
workforce are uncertain. Automation
reduces costs associated with
passenger and goods transportation
and creates new job opportunities
associated with research and
development, vehicular maintenance,
and transportation security,
supporting economic growth.
However, vehicle automation could
result in job losses in transportation
operations and logistics.
Social Equity Impacts – The
impacts of vehicle automation on
equity and access are uncertain.
Preparing Labor for the Impacts of Automation
The USDOT is working with other federal agencies
(e.g., Equal Employment Opportunity Commission
[EEOC], Economic Development Agency [EDA]) on a
comprehensive analysis of the employment and
workforce impacts of automated vehicles. The USDOT
has also begun reaching out to stakeholders and
sponsoring research on workforce issues affecting their
respective modes of transportation.
Entities involved in developing and deploying
automation technologies may want to consider how to
assess potential workforce effects, future needs for
new skills and capabilities, and how the workforce will
transition into new roles over time. Identifying potential
impacts and training needs now will help prepare the
American workforce for the appropriate skills to support
innovative transportation technologies (U.S.
Department of Transportation, 2019).
Vehicle automation could reduce transportation costs for low-income households and create
new opportunities for healthcare and job access. However, if vehicle automation lacks
services for people with disabilities, or requires a credit card or a smartphone to use
services, some travelers may not be able to access mobility services.
U.S. Department of Transportation
Office of the Assistant Secretary for Research and Technology
Intelligent Transportation Systems Joint Program Office
108
CHAPTER 6: Innovative and Emerging Mobility Futures
Travel Behavior Impacts – The impacts of vehicle automation on travel behavior are
uncertain. Vehicle automation could result in more or less congestion depending on how
vehicles are used (e.g., traveling without passengers [deadheading], single passenger use,
or pooled use).
Public Transit Ridership – SAVs could lead to a decreased need for parking, resulting in
the repurposing of parking for infill development and increased density, which would support
public transit ridership. AVs and SAVs could also reduce transit operating costs, which could
potentially pass savings on to riders as reduced fares and increase the appeal and
competitiveness of public transit. Alternatively, AVs and SAVs could reduce transit ridership
due to telecommuting and AVs supporting longer commutes and shifting consumer
preferences towards suburban and exurban living (Shaheen and Cohen, 2018c). This change
in preferences could result in fewer workers commuting with public transportation. More
research is needed to conclusively determine the impacts of automated vehicles on transit
ridership.
SAVs present a number of potential opportunities and challenges. These potential outcomes are
organized in a Strengths, Weaknesses, Opportunities, and Threats (SWOT) analysis in Figure 19. A
SWOT analysis divides potential impacts between external and internal components, and positive
and negative impacts.
U.S. Department of Transportation
Office of the Assistant Secretary for Research and Technology
Intelligent Transportation Systems Joint Program Office
109
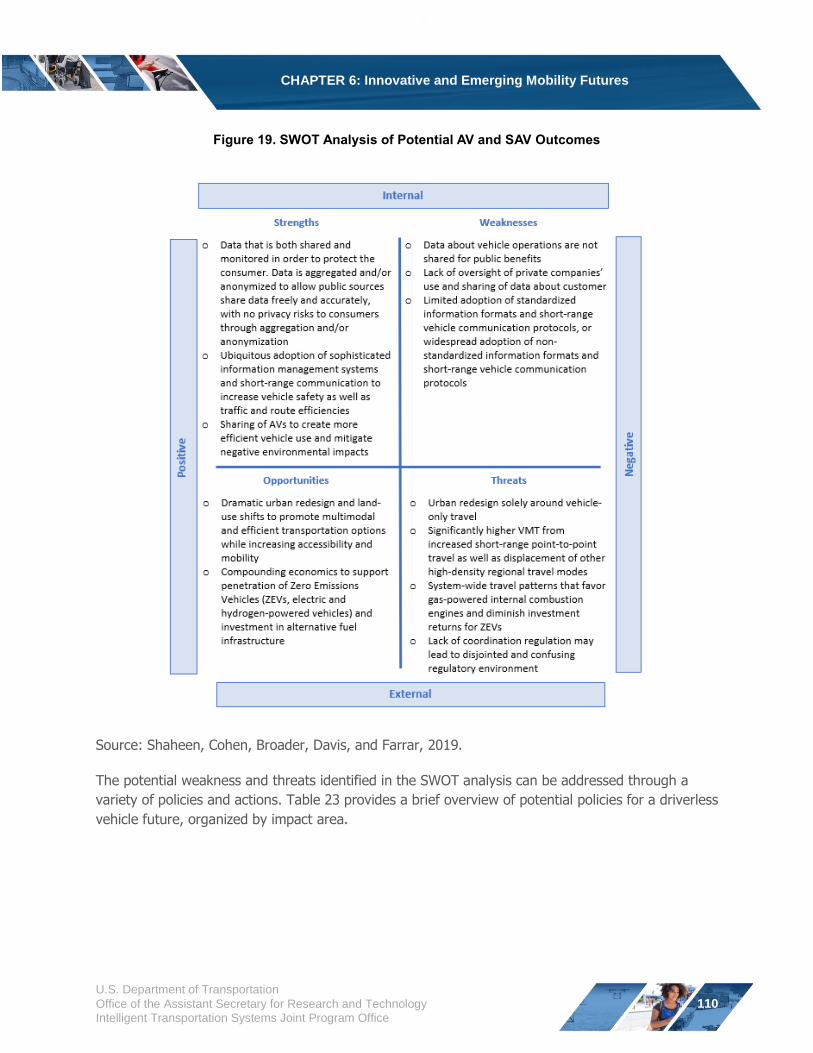
CHAPTER 6: Innovative and Emerging Mobility Futures
Figure 19. SWOT Analysis of Potential AV and SAV Outcomes
Source: Shaheen, Cohen, Broader, Davis, and Farrar, 2019.
The potential weakness and threats identified in the SWOT analysis can be addressed through a
variety of policies and actions. Table 23 provides a brief overview of potential policies for a driverless
vehicle future, organized by impact area.
U.S. Department of Transportation
Office of the Assistant Secretary for Research and Technology
Intelligent Transportation Systems Joint Program Office
110
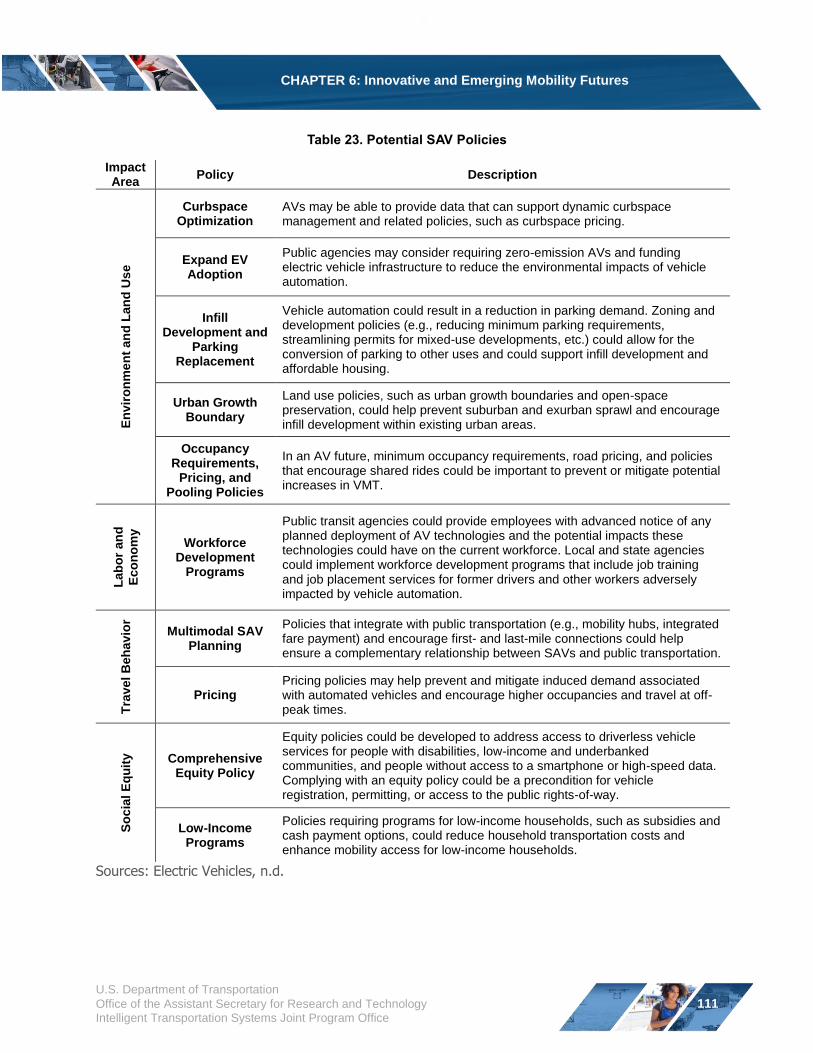
CHAPTER 6: Innovative and Emerging Mobility Futures
Table 23. Potential SAV Policies
Impact Area
Policy Description
En
vir
on
me
nt
an
d L
an
d U
se
Curbspace Optimization
AVs may be able to provide data that can support dynamic curbspace management and related policies, such as curbspace pricing.
Expand EV Adoption
Public agencies may consider requiring zero-emission AVs and funding electric vehicle infrastructure to reduce the environmental impacts of vehicle automation.
Infill Development and
Parking Replacement
Vehicle automation could result in a reduction in parking demand. Zoning and development policies (e.g., reducing minimum parking requirements, streamlining permits for mixed-use developments, etc.) could allow for the conversion of parking to other uses and could support infill development and affordable housing.
Urban Growth Boundary
Land use policies, such as urban growth boundaries and open-space preservation, could help prevent suburban and exurban sprawl and encourage infill development within existing urban areas.
Occupancy Requirements,
Pricing, and Pooling Policies
In an AV future, minimum occupancy requirements, road pricing, and policies that encourage shared rides could be important to prevent or mitigate potential increases in VMT.
Lab
or
an
d
Eco
no
my
Workforce Development
Programs
Public transit agencies could provide employees with advanced notice of any planned deployment of AV technologies and the potential impacts these technologies could have on the current workforce. Local and state agencies could implement workforce development programs that include job training and job placement services for former drivers and other workers adversely impacted by vehicle automation.
Tra
vel
Beh
avio
r
Multimodal SAV Planning
Policies that integrate with public transportation (e.g., mobility hubs, integrated fare payment) and encourage first- and last-mile connections could help ensure a complementary relationship between SAVs and public transportation.
Pricing Pricing policies may help prevent and mitigate induced demand associated with automated vehicles and encourage higher occupancies and travel at off-peak times.
So
cia
l E
qu
ity Comprehensive
Equity Policy
Equity policies could be developed to address access to driverless vehicle services for people with disabilities, low-income and underbanked communities, and people without access to a smartphone or high-speed data. Complying with an equity policy could be a precondition for vehicle registration, permitting, or access to the public rights-of-way.
Low-Income Programs
Policies requiring programs for low-income households, such as subsidies and cash payment options, could reduce household transportation costs and enhance mobility access for low-income households.
Sources: Electric Vehicles, n.d.
U.S. Department of Transportation
Office of the Assistant Secretary for Research and Technology
Intelligent Transportation Systems Joint Program Office
111
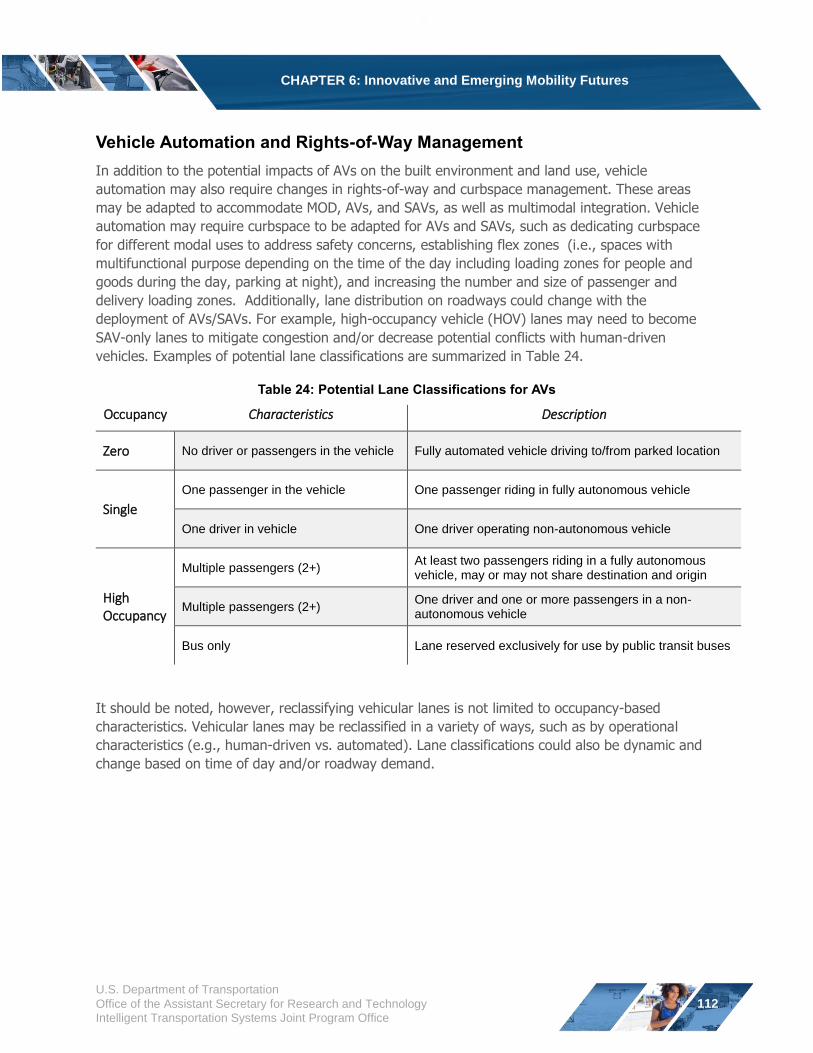
CHAPTER 6: Innovative and Emerging Mobility Futures
Vehicle Automation and Rights-of-Way Management
In addition to the potential impacts of AVs on the built environment and land use, vehicle
automation may also require changes in rights-of-way and curbspace management. These areas
may be adapted to accommodate MOD, AVs, and SAVs, as well as multimodal integration. Vehicle
automation may require curbspace to be adapted for AVs and SAVs, such as dedicating curbspace
for different modal uses to address safety concerns, establishing flex zones (i.e., spaces with
multifunctional purpose depending on the time of the day including loading zones for people and
goods during the day, parking at night), and increasing the number and size of passenger and
delivery loading zones. Additionally, lane distribution on roadways could change with the
deployment of AVs/SAVs. For example, high-occupancy vehicle (HOV) lanes may need to become
SAV-only lanes to mitigate congestion and/or decrease potential conflicts with human-driven
vehicles. Examples of potential lane classifications are summarized in Table 24.
Table 24: Potential Lane Classifications for AVs
Occupancy Characteristics Description
Zero No driver or passengers in the vehicle Fully automated vehicle driving to/from parked location
Single
One passenger in the vehicle One passenger riding in fully autonomous vehicle
One driver in vehicle One driver operating non-autonomous vehicle
High Occupancy
Multiple passengers (2+) At least two passengers riding in a fully autonomous vehicle, may or may not share destination and origin
Multiple passengers (2+) One driver and one or more passengers in a non-autonomous vehicle
Bus only Lane reserved exclusively for use by public transit buses
It should be noted, however, reclassifying vehicular lanes is not limited to occupancy-based
characteristics. Vehicular lanes may be reclassified in a variety of ways, such as by operational
characteristics (e.g., human-driven vs. automated). Lane classifications could also be dynamic and
change based on time of day and/or roadway demand.
U.S. Department of Transportation
Office of the Assistant Secretary for Research and Technology
Intelligent Transportation Systems Joint Program Office
112
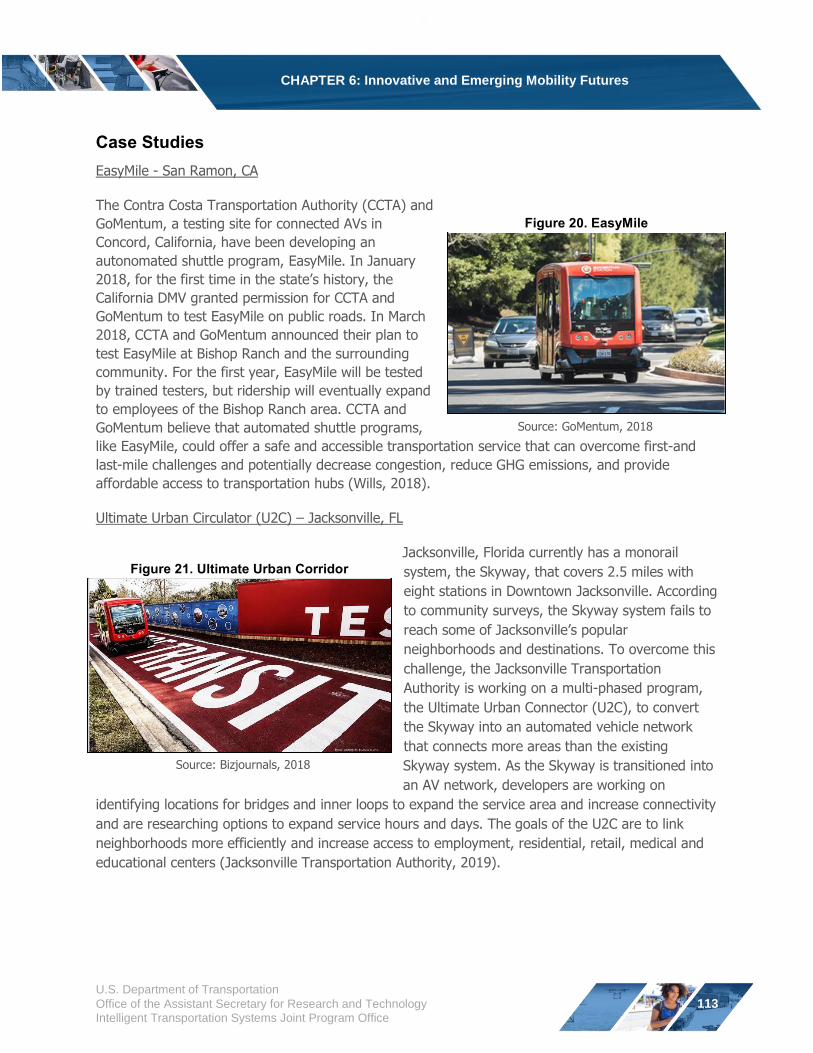
CHAPTER 6: Innovative and Emerging Mobility Futures
Case Studies
EasyMile - San Ramon, CA
The Contra Costa Transportation Authority (CCTA) and
GoMentum, a testing site for connected AVs in Figure 20. EasyMile
Concord, California, have been developing an
autonomated shuttle program, EasyMile. In January
2018, for the first time in the state’s history, the California DMV granted permission for CCTA and
GoMentum to test EasyMile on public roads. In March
2018, CCTA and GoMentum announced their plan to
test EasyMile at Bishop Ranch and the surrounding
community. For the first year, EasyMile will be tested
by trained testers, but ridership will eventually expand
to employees of the Bishop Ranch area. CCTA and
GoMentum believe that automated shuttle programs,
like EasyMile, could offer a safe and accessible transportation service that can overcome first-and
last-mile challenges and potentially decrease congestion, reduce GHG emissions, and provide
affordable access to transportation hubs (Wills, 2018).
Ultimate Urban Circulator (U2C) – Jacksonville, FL
Jacksonville, Florida currently has a monorail Figure 21. Ultimate Urban Corridor system, the Skyway, that covers 2.5 miles with
eight stations in Downtown Jacksonville. According
to community surveys, the Skyway system fails to
reach some of Jacksonville’s popular
neighborhoods and destinations. To overcome this
challenge, the Jacksonville Transportation
Authority is working on a multi-phased program,
the Ultimate Urban Connector (U2C), to convert
the Skyway into an automated vehicle network
that connects more areas than the existing
Skyway system. As the Skyway is transitioned into
an AV network, developers are working on
identifying locations for bridges and inner loops to expand the service area and increase connectivity
and are researching options to expand service hours and days. The goals of the U2C are to link
neighborhoods more efficiently and increase access to employment, residential, retail, medical and
educational centers (Jacksonville Transportation Authority, 2019).
Source: GoMentum, 2018
Source: Bizjournals, 2018
U.S. Department of Transportation
Office of the Assistant Secretary for Research and Technology
Intelligent Transportation Systems Joint Program Office
113
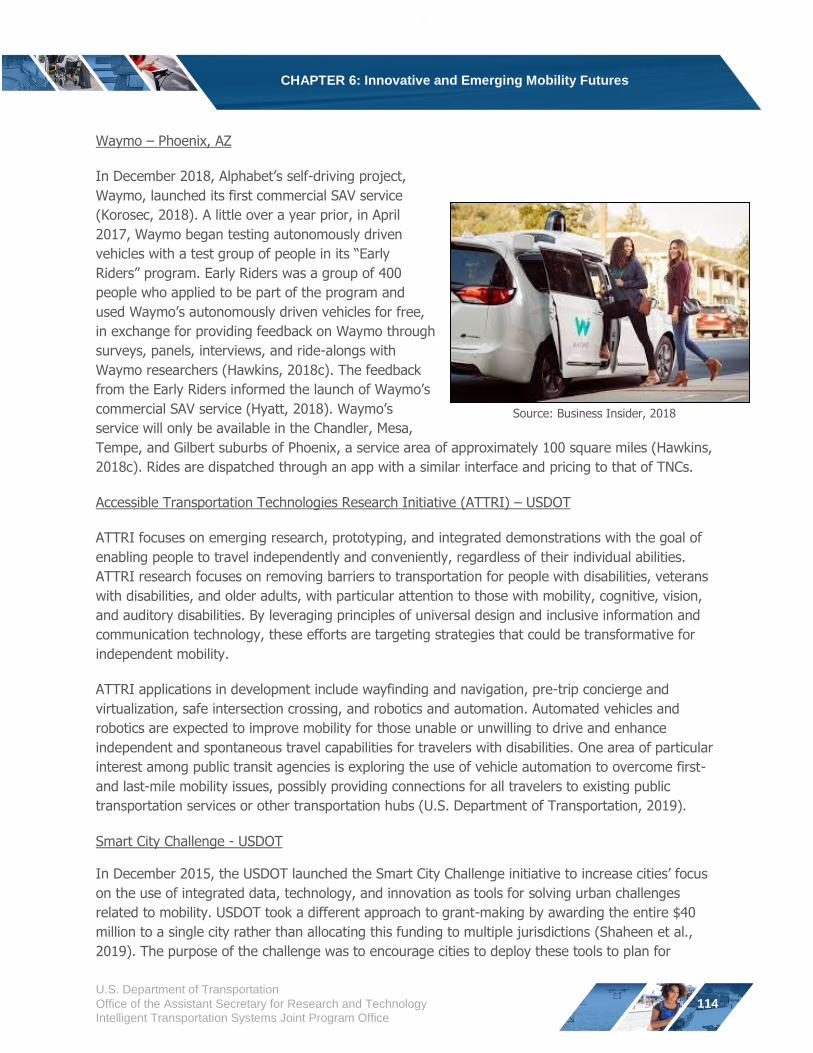
CHAPTER 6: Innovative and Emerging Mobility Futures
Waymo – Phoenix, AZ
Figure 22. Waymo
In December 2018, Alphabet’s self-driving project,
Waymo, launched its first commercial SAV service
(Korosec, 2018). A little over a year prior, in April
2017, Waymo began testing autonomously driven
vehicles with a test group of people in its “Early
Riders” program. Early Riders was a group of 400
people who applied to be part of the program and
used Waymo’s autonomously driven vehicles for free, in exchange for providing feedback on Waymo through
surveys, panels, interviews, and ride-alongs with
Waymo researchers (Hawkins, 2018c). The feedback
from the Early Riders informed the launch of Waymo’s
commercial SAV service (Hyatt, 2018). Waymo’s
service will only be available in the Chandler, Mesa,
Tempe, and Gilbert suburbs of Phoenix, a service area of approximately 100 square miles (Hawkins,
2018c). Rides are dispatched through an app with a similar interface and pricing to that of TNCs.
Accessible Transportation Technologies Research Initiative (ATTRI) – USDOT
ATTRI focuses on emerging research, prototyping, and integrated demonstrations with the goal of
enabling people to travel independently and conveniently, regardless of their individual abilities.
ATTRI research focuses on removing barriers to transportation for people with disabilities, veterans
with disabilities, and older adults, with particular attention to those with mobility, cognitive, vision,
and auditory disabilities. By leveraging principles of universal design and inclusive information and
communication technology, these efforts are targeting strategies that could be transformative for
independent mobility.
ATTRI applications in development include wayfinding and navigation, pre-trip concierge and
virtualization, safe intersection crossing, and robotics and automation. Automated vehicles and
robotics are expected to improve mobility for those unable or unwilling to drive and enhance
independent and spontaneous travel capabilities for travelers with disabilities. One area of particular
interest among public transit agencies is exploring the use of vehicle automation to overcome first-
and last-mile mobility issues, possibly providing connections for all travelers to existing public
transportation services or other transportation hubs (U.S. Department of Transportation, 2019).
Smart City Challenge - USDOT
In December 2015, the USDOT launched the Smart City Challenge initiative to increase cities’ focus on the use of integrated data, technology, and innovation as tools for solving urban challenges
related to mobility. USDOT took a different approach to grant-making by awarding the entire $40
million to a single city rather than allocating this funding to multiple jurisdictions (Shaheen et al.,
2019). The purpose of the challenge was to encourage cities to deploy these tools to plan for
Source: Business Insider, 2018
U.S. Department of Transportation
Office of the Assistant Secretary for Research and Technology
Intelligent Transportation Systems Joint Program Office
114
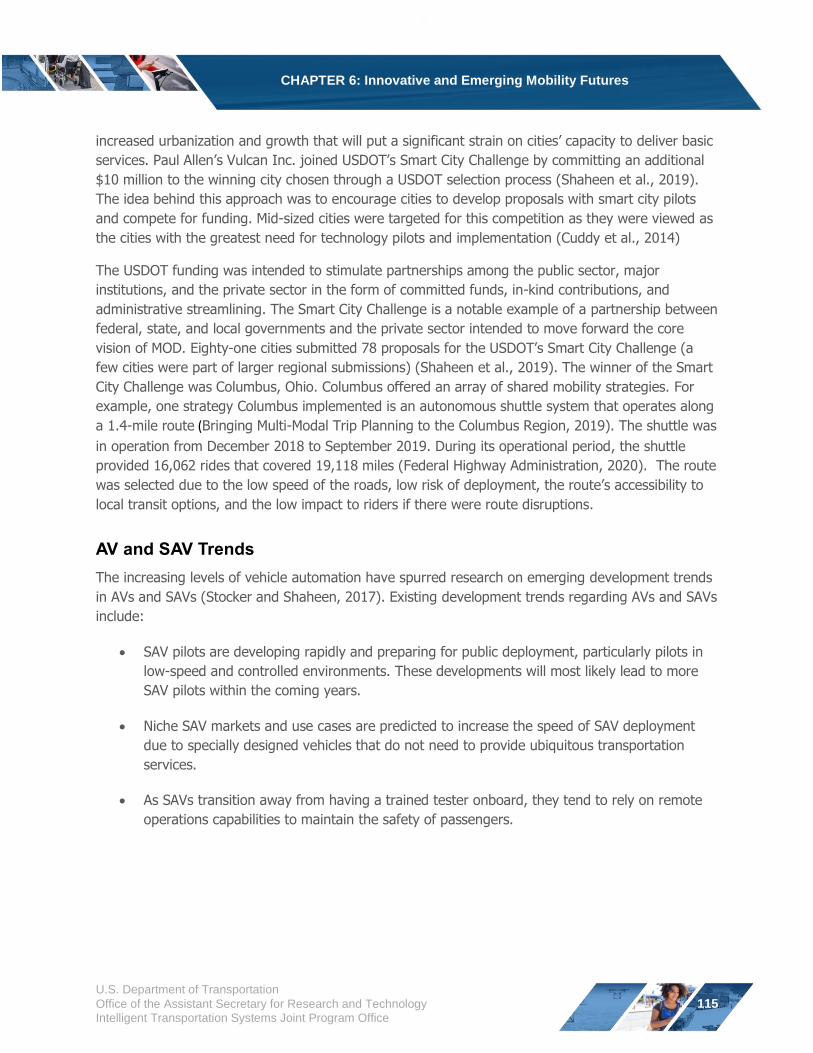
CHAPTER 6: Innovative and Emerging Mobility Futures
increased urbanization and growth that will put a significant strain on cities’ capacity to deliver basic
services. Paul Allen’s Vulcan Inc. joined USDOT’s Smart City Challenge by committing an additional
$10 million to the winning city chosen through a USDOT selection process (Shaheen et al., 2019).
The idea behind this approach was to encourage cities to develop proposals with smart city pilots
and compete for funding. Mid-sized cities were targeted for this competition as they were viewed as
the cities with the greatest need for technology pilots and implementation (Cuddy et al., 2014)
The USDOT funding was intended to stimulate partnerships among the public sector, major
institutions, and the private sector in the form of committed funds, in-kind contributions, and
administrative streamlining. The Smart City Challenge is a notable example of a partnership between
federal, state, and local governments and the private sector intended to move forward the core
vision of MOD. Eighty-one cities submitted 78 proposals for the USDOT’s Smart City Challenge (a few cities were part of larger regional submissions) (Shaheen et al., 2019). The winner of the Smart
City Challenge was Columbus, Ohio. Columbus offered an array of shared mobility strategies. For
example, one strategy Columbus implemented is an autonomous shuttle system that operates along
a 1.4-mile route (Bringing Multi-Modal Trip Planning to the Columbus Region, 2019). The shuttle was
in operation from December 2018 to September 2019. During its operational period, the shuttle
provided 16,062 rides that covered 19,118 miles (Federal Highway Administration, 2020). The route
was selected due to the low speed of the roads, low risk of deployment, the route’s accessibility to local transit options, and the low impact to riders if there were route disruptions.
AV and SAV Trends
The increasing levels of vehicle automation have spurred research on emerging development trends
in AVs and SAVs (Stocker and Shaheen, 2017). Existing development trends regarding AVs and SAVs
include:
SAV pilots are developing rapidly and preparing for public deployment, particularly pilots in
low-speed and controlled environments. These developments will most likely lead to more
SAV pilots within the coming years.
Niche SAV markets and use cases are predicted to increase the speed of SAV deployment
due to specially designed vehicles that do not need to provide ubiquitous transportation
services.
As SAVs transition away from having a trained tester onboard, they tend to rely on remote
operations capabilities to maintain the safety of passengers.
U.S. Department of Transportation
Office of the Assistant Secretary for Research and Technology
Intelligent Transportation Systems Joint Program Office
115
CHAPTER 6: Innovative and Emerging Mobility Futures
Key Takeaways
As vehicles become increasingly automated their impacts on the built environment, travel
behavior, and society are uncertain but may result in positive or adverse impacts.
The deployment of AVs and SAVs will most likely be influenced by existing and future
ownership and business models.
AVs and SAVs offer a variety of potential strengths, weaknesses, opportunities, and threats,
and these possible outcomes may be guided by relevant policies for environment and land
use, labor and economy, travel behavior, and social equity.
Trends, such as the development of niche uses and remote operations, are predicted for the
future development and use of AVs and SAVs.
Urban Air Mobility (UAM) NASA’s Urban Air Mobility (UAM) Vision
A variety of technological advancements in
electrification, automation, and short and vertical The National Aeronautics and Space
take-off and landing (STOL and VTOL) are enabling Administration’s (NASA) vision for urban air
mobility (UAM) is to transform mobility on-demand aviation. These aviation innovations around metropolitan areas by enabling a include new aircraft designs, services, and business safe, efficient, convenient, affordable, and
models. While numerous societal concerns have accessible air transportation system for
been raised about these approaches (e.g., privacy, passengers and cargo. safety, security, social equity), these technologies
have the potential to create new passenger
mobility and goods delivery services in urban areas using small aircraft and piloted and pilotless
aircraft. Collectively, these innovations are referred to as urban air mobility (UAM). Other common
terms include rural air mobility, on-demand aviation, and advanced air mobility.
Between the 1950s and 1970s, several helicopter services began providing early UAM services in Los
Angeles, New York City, San Francisco, and other communities. In recent years, on-demand aviation
services similar to TNCs have entered the market. In New York City, BLADE provides helicopter
services booked through a smartphone app. BLADE uses third-party operators that own, manage,
and maintain their aircraft under Federal Aviation Administration (FAA) regulation 14 CFR Part 135,
which governs intrastate air taxis and commuter services, including licensing and training of pilots
and crews and required aircraft maintenance. BLADE passengers are required to check-in using valid
government identification, and flier and baggage weight must fall within permissible limits.
In Los Angeles, SkyRyde operates similarly, linking passengers to pilots with privately owned four-
passenger helicopters. SkyRyde is currently undergoing 14 CFR Part 135 certification. Additionally,
Uber Copter has been testing on-demand helicopter service in New York City since 2016. In July
2019, Uber Copter made rides available to Uber Rewards members who have reached Platinum and
Diamond status. The service can be booked up to five days in advance on the Uber app and offers
U.S. Department of Transportation
Office of the Assistant Secretary for Research and Technology
Intelligent Transportation Systems Joint Program Office
116
CHAPTER 6: Innovative and Emerging Mobility Futures
eight-minute flights between Manhattan and the John F. Kennedy airport, typically costing $200 to
$225 USD per person.
Similar helicopter services such as Airbus’ Voom are operational in Mexico City, Sao Paulo, and the
San Francisco Bay Area. Travelers can use Voom to request on-demand rides from partner air taxi
companies. Trips can be booked anytime between one hour to 90 days in advance through the
Voom app or website. Singapore is also supporting the development of electric vertical takeoff and
landing (eVOTL) aircraft by constructing facilities to test UAV takeoff and landings. Programs, such
as the U.S. Voluntary Airport Low Emissions (VALE) program, which provides funding to projects
that support improved air quality at airports, may also support the development of eVOTL (Federal
Aviation Administration, 2018c).
NASA’s Advanced Air Mobility National Campaign
NASA’s Advanced Air Mobility National Campaign aims to improve UAM safety and accelerate scalability through integrated demonstrations by hosting a series of UAM ecosystem-wide challenges beginning in 2020. The series of challenges will support the Federal Aviation Administration in developing an approval process for UAM vehicle certification; develop flight procedure guidelines; evaluate communication, navigation, and surveillance requirements; define airspace operations management activities; and characterize vehicle noise levels.
The first testing opportunity in the National Campaign will focus on the developmental testing of U.S. developed aircraft and will include airspace operations management services to explore architectures and technologies needed to support future safety and scalability of UAM operations. Participants selected for the developmental testing will have the opportunity to fly at NASA’s Armstrong Flight Research Center at Edwards Air Force Base in Kern County, California, or a range of their choice, and participate in collaborative airspace operations simulations.
Developmental testing is the first step toward the National Campaign in 2022, which will involve broad industry participation, including domestic vehicle and airspace partners and international vehicle companies that will have the opportunity to fly more complex UAM aircraft operations at testing locations within the United States.
The first series of increasingly complex challenges will require participants to demonstrate safe operation of a piloted or remotely piloted aircraft capable of carrying a payload equivalent to at least one adult passenger within a complex simulated urban environment. Participants will test UAM technologies against key barriers to UAM integration in the U.S. national airspace, such as adverse weather, emergency landings, surveillance, loss of communication, and operations scheduling and routing. The scenarios developed for the National Campaign are designed to represent real-world UAM operations and address barriers for aircraft certification, operational safety, and community acceptance.
NASA’s Advanced Air Mobility National Campaign is a subproject under the Aeronautics Research Mission Directorate’s Advanced Air Mobility project. The National Campaign is structured to work with the UAM community to identify and address the key challenges to achieving NASA’s vision for advanced air mobility.
U.S. Department of Transportation
Office of the Assistant Secretary for Research and Technology
Intelligent Transportation Systems Joint Program Office
117

CHAPTER 6: Innovative and Emerging Mobility Futures
Airspace Classifications
Many community policymakers and planners without aviation experience, may not be familiar with airspace
classifications, an area of aeronautical knowledge. The Federal Aviation Administration (FAA) has six airspace
classifications (denoted by letters A-E and G). These classes are summarized below:
Class A: Airspace 18,000 feet and above (up to Flight Level 600, approximately 60,000 feet). UAM should
never fly in this space.
Class B: This is airspace (generally up to 10,000 feet) around large airports with high levels of commercial
traffic. All aircraft are subject to air traffic control.
Class C: A busy airspace (typically 1,200 feet to 4,000 feet above airports) that is similar to Class B, with
lower levels of traffic. All aircraft are subject to air traffic control.
Class D: Airspace (generally up to 2,500 feet) around smaller and regional airports with control towers.
Class E: This is all controlled airspace other than Class A-D. Typically, Class E extends from 700 feet to
1,200 feet above ground level (AGL) all the way to the beginning of Class A. In some areas, Class E may
begin at the surface instead.
Class G: Uncontrolled airspace. This is the only airspace where operators do not need to ask air traffic
control permission to fly.
Airspace heights may vary by location. In many cases, UAs/drones will operate below 400 feet AGL. A FAA
waiver is required to fly above this altitude. Typically, UAM aircraft with passengers will have a service ceiling of
approximately 5,000 feet AGL; however, the service ceiling will vary by aircraft.
Figure 23. FAA Airspace Classifications
Source: faasafety.gov, n.d.
MSL: Mean Seal Level, AGL: Above Ground Level, FL: Flight Level
U.S. Department of Transportation
Office of the Assistant Secretary for Research and Technology
Intelligent Transportation Systems Joint Program Office
118
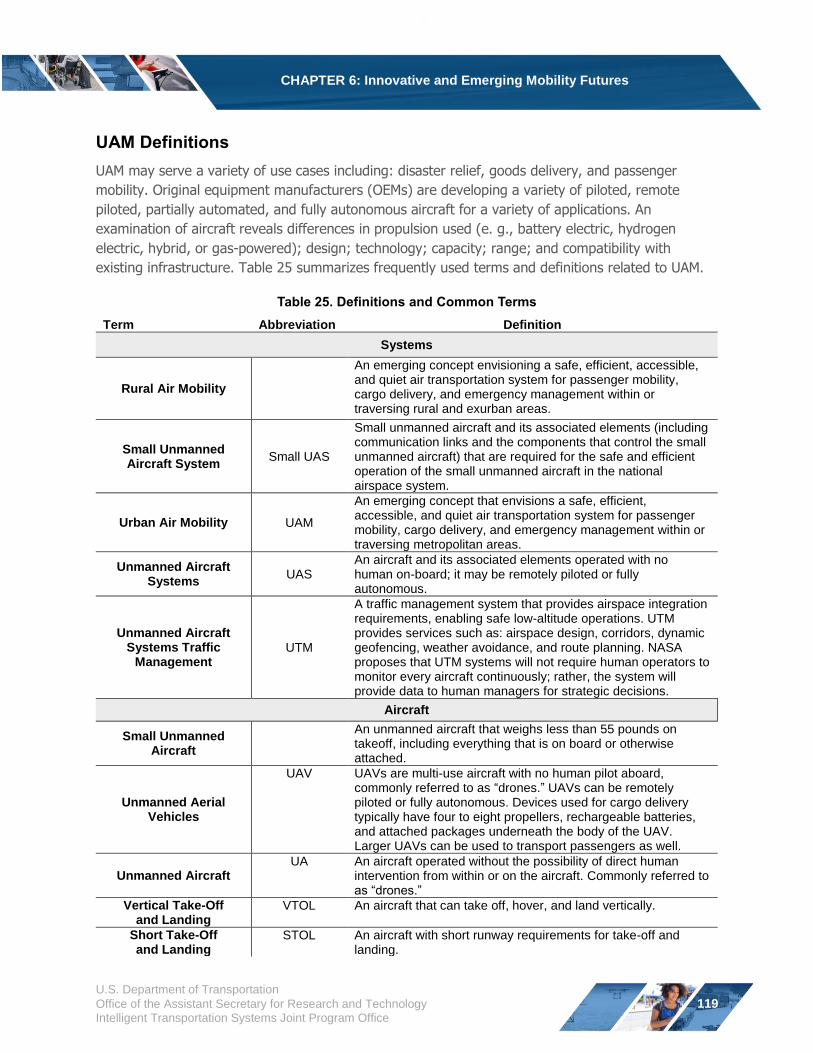
CHAPTER 6: Innovative and Emerging Mobility Futures
UAM Definitions
UAM may serve a variety of use cases including: disaster relief, goods delivery, and passenger
mobility. Original equipment manufacturers (OEMs) are developing a variety of piloted, remote
piloted, partially automated, and fully autonomous aircraft for a variety of applications. An
examination of aircraft reveals differences in propulsion used (e. g., battery electric, hydrogen
electric, hybrid, or gas-powered); design; technology; capacity; range; and compatibility with
existing infrastructure. Table 25 summarizes frequently used terms and definitions related to UAM.
Table 25. Definitions and Common Terms
Term Abbreviation Definition
Systems
Rural Air Mobility
An emerging concept envisioning a safe, efficient, accessible, and quiet air transportation system for passenger mobility, cargo delivery, and emergency management within or traversing rural and exurban areas.
Small Unmanned Aircraft System
Small UAS
Small unmanned aircraft and its associated elements (including communication links and the components that control the small unmanned aircraft) that are required for the safe and efficient operation of the small unmanned aircraft in the national airspace system.
Urban Air Mobility UAM
An emerging concept that envisions a safe, efficient, accessible, and quiet air transportation system for passenger mobility, cargo delivery, and emergency management within or traversing metropolitan areas.
Unmanned Aircraft Systems
UAS An aircraft and its associated elements operated with no human on-board; it may be remotely piloted or fully autonomous.
Unmanned Aircraft Systems Traffic
Management UTM
A traffic management system that provides airspace integration requirements, enabling safe low-altitude operations. UTM provides services such as: airspace design, corridors, dynamic geofencing, weather avoidance, and route planning. NASA proposes that UTM systems will not require human operators to monitor every aircraft continuously; rather, the system will provide data to human managers for strategic decisions.
Aircraft
Small Unmanned Aircraft
An unmanned aircraft that weighs less than 55 pounds on takeoff, including everything that is on board or otherwise attached.
Unmanned Aerial Vehicles
UAV UAVs are multi-use aircraft with no human pilot aboard, commonly referred to as “drones.” UAVs can be remotely piloted or fully autonomous. Devices used for cargo delivery typically have four to eight propellers, rechargeable batteries, and attached packages underneath the body of the UAV. Larger UAVs can be used to transport passengers as well.
Unmanned Aircraft UA An aircraft operated without the possibility of direct human
intervention from within or on the aircraft. Commonly referred to as “drones.”
Vertical Take-Off and Landing
VTOL An aircraft that can take off, hover, and land vertically.
Short Take-Off and Landing
STOL An aircraft with short runway requirements for take-off and landing.
U.S. Department of Transportation
Office of the Assistant Secretary for Research and Technology
Intelligent Transportation Systems Joint Program Office
119
CHAPTER 6: Innovative and Emerging Mobility Futures
Source: Cohen et al., Forthcoming; 14 CFR 107.3
UAM can be classified according to the following characteristics:
Design characteristics, such as passenger capacity, propulsion, airframe, or aircraft types
(e.g., wingless designs, electric rotorcraft, aircraft that use any of its thrusters for vertical lift
and cruise versus aircraft that use independent thrusters for vertical lift and cruise);
Operational characteristics, such as VTOL and aircraft that can fly and be driven on roads
(sometimes referred to as roadable aircraft);
Training and knowledge requirements for pilots and operators;
Airworthiness certification approaches, based in part or in whole on established FAA and
international processes;
Service type or use case (e.g., scheduled service, charter service, unscheduled service,
passenger mobility, goods delivery, emergency management, etc.); and
Distinctions based on piloted, remotely piloted/operated, and levels of aircraft automation
(with respect to specific aircraft systems and phases of flight).
Source: (Booz Allen Hamilton, 2018)
Figure 24 provides a taxonomy of UAM that blends these key characteristics with three broad use
cases:
1) Passenger mobility comprised of aircraft and rotorcraft;
2) Urban goods delivery (comprised of a broad ecosystem of manned and unmanned delivery systems); and
3) Hybrid systems (intended to be a broad category used to describe systems that blur traditional categories, such as roadable aircraft, aerial warehousing concepts, and trucking/UAV systems).
Within each of these broad categories, distinctions can be made depending on whether there is a:
1) Pilot on-board, including fully piloted and partially automated flight (i.e., partially automating a particular phase of flight, such as take-off and landing);
2) The aircraft is remotely piloted or operated (e.g., operations centers with remote operators controlling multiple aircraft); or
3) The aircraft and/or unmanned aerial vehicles (often called UAVs or drones) are fully autonomous or pilotless.
U.S. Department of Transportation
Office of the Assistant Secretary for Research and Technology
Intelligent Transportation Systems Joint Program Office
120
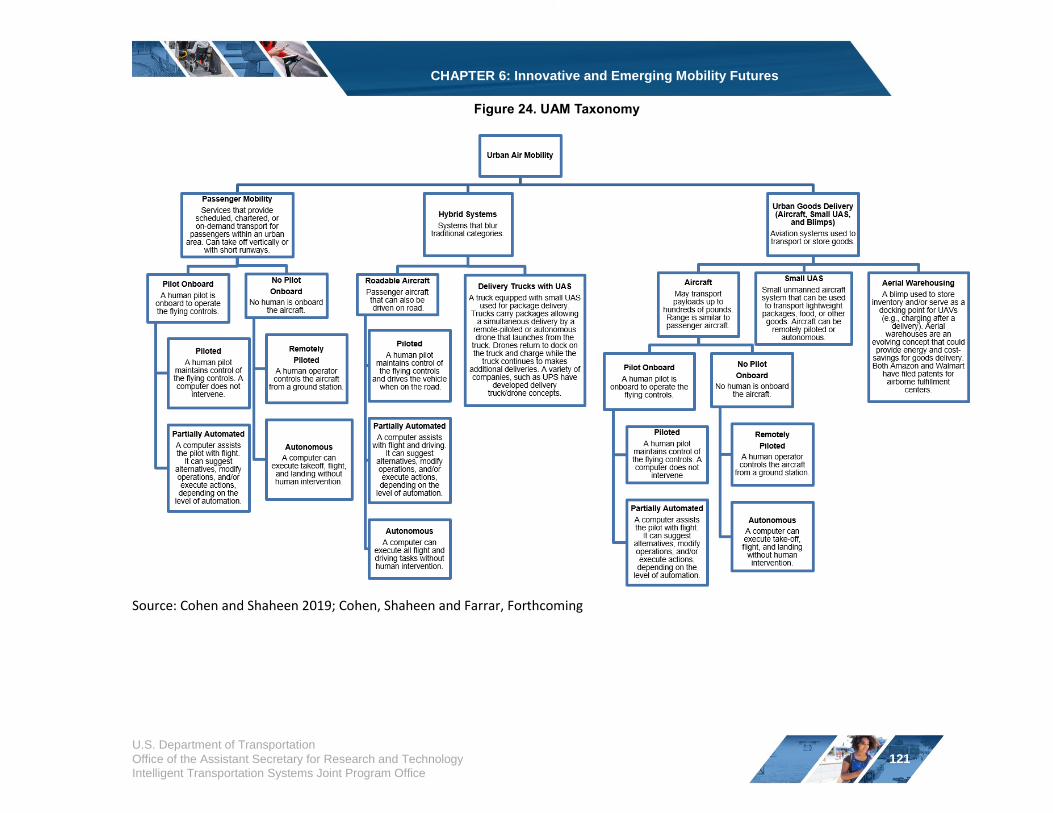
CHAPTER 6: Innovative and Emerging Mobility Futures
Figure 24. UAM Taxonomy
Source: Cohen and Shaheen 2019; Cohen, Shaheen and Farrar, Forthcoming
U.S. Department of Transportation
Office of the Assistant Secretary for Research and Technology
Intelligent Transportation Systems Joint Program Office
121
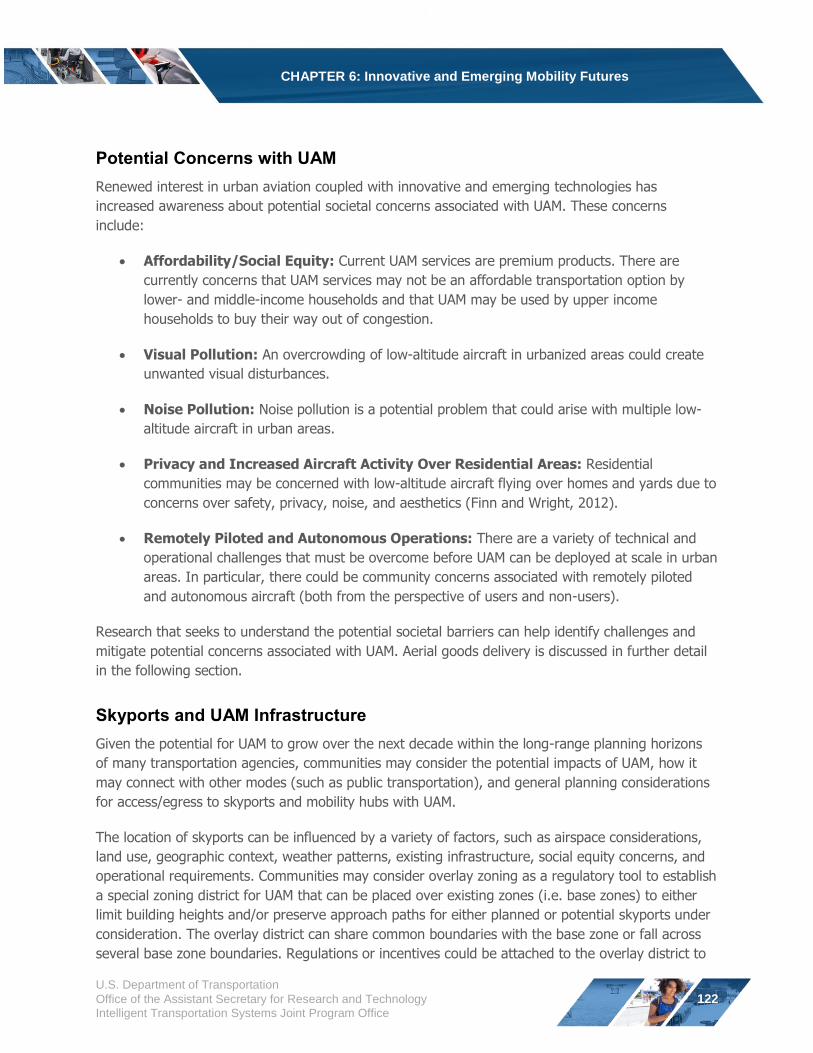
CHAPTER 6: Innovative and Emerging Mobility Futures
Potential Concerns with UAM
Renewed interest in urban aviation coupled with innovative and emerging technologies has
increased awareness about potential societal concerns associated with UAM. These concerns
include:
Affordability/Social Equity: Current UAM services are premium products. There are
currently concerns that UAM services may not be an affordable transportation option by
lower- and middle-income households and that UAM may be used by upper income
households to buy their way out of congestion.
Visual Pollution: An overcrowding of low-altitude aircraft in urbanized areas could create
unwanted visual disturbances.
Noise Pollution: Noise pollution is a potential problem that could arise with multiple low-
altitude aircraft in urban areas.
Privacy and Increased Aircraft Activity Over Residential Areas: Residential
communities may be concerned with low-altitude aircraft flying over homes and yards due to
concerns over safety, privacy, noise, and aesthetics (Finn and Wright, 2012).
Remotely Piloted and Autonomous Operations: There are a variety of technical and
operational challenges that must be overcome before UAM can be deployed at scale in urban
areas. In particular, there could be community concerns associated with remotely piloted
and autonomous aircraft (both from the perspective of users and non-users).
Research that seeks to understand the potential societal barriers can help identify challenges and
mitigate potential concerns associated with UAM. Aerial goods delivery is discussed in further detail
in the following section.
Skyports and UAM Infrastructure
Given the potential for UAM to grow over the next decade within the long-range planning horizons
of many transportation agencies, communities may consider the potential impacts of UAM, how it
may connect with other modes (such as public transportation), and general planning considerations
for access/egress to skyports and mobility hubs with UAM.
The location of skyports can be influenced by a variety of factors, such as airspace considerations,
land use, geographic context, weather patterns, existing infrastructure, social equity concerns, and
operational requirements. Communities may consider overlay zoning as a regulatory tool to establish
a special zoning district for UAM that can be placed over existing zones (i.e. base zones) to either
limit building heights and/or preserve approach paths for either planned or potential skyports under
consideration. The overlay district can share common boundaries with the base zone or fall across
several base zone boundaries. Regulations or incentives could be attached to the overlay district to
U.S. Department of Transportation
Office of the Assistant Secretary for Research and Technology
Intelligent Transportation Systems Joint Program Office
122
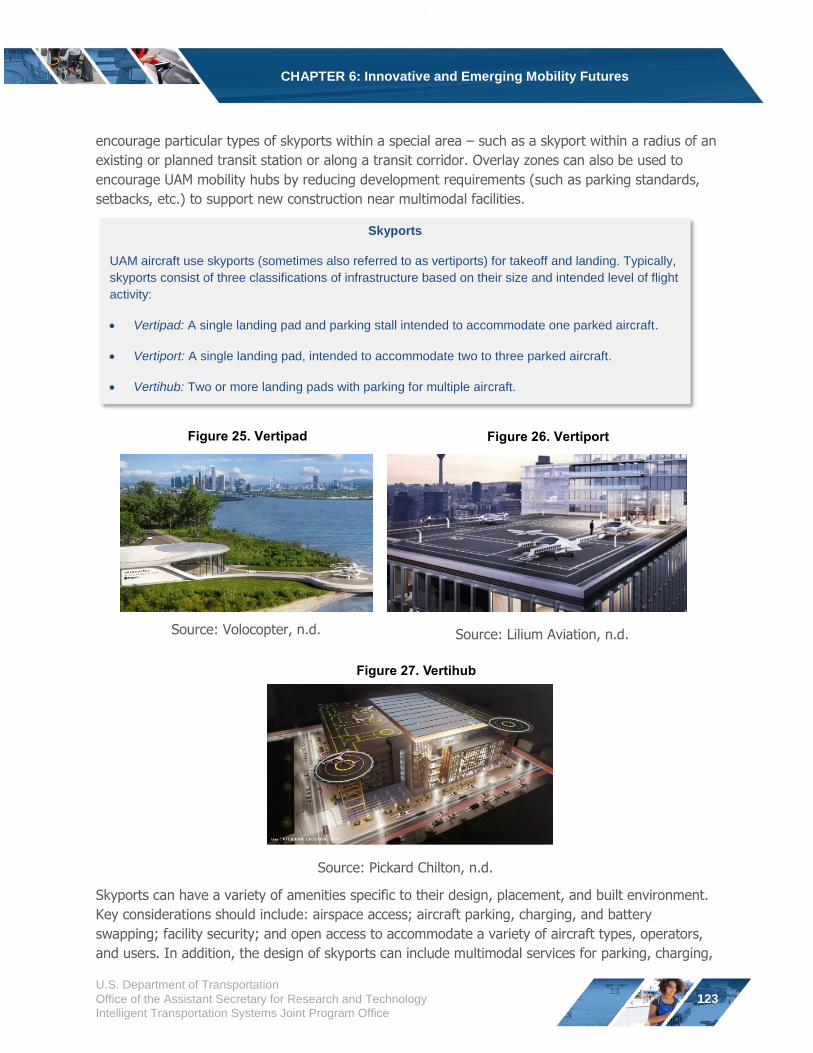
CHAPTER 6: Innovative and Emerging Mobility Futures
encourage particular types of skyports within a special area – such as a skyport within a radius of an
existing or planned transit station or along a transit corridor. Overlay zones can also be used to
encourage UAM mobility hubs by reducing development requirements (such as parking standards,
setbacks, etc.) to support new construction near multimodal facilities.
Skyports
UAM aircraft use skyports (sometimes also referred to as vertiports) for takeoff and landing. Typically,
skyports consist of three classifications of infrastructure based on their size and intended level of flight
activity:
Vertipad: A single landing pad and parking stall intended to accommodate one parked aircraft.
Vertiport: A single landing pad, intended to accommodate two to three parked aircraft.
Vertihub: Two or more landing pads with parking for multiple aircraft.
Figure 25. Vertipad Figure 26. Vertiport
Source: Volocopter, n.d. Source: Lilium Aviation, n.d.
Figure 27. Vertihub
Source: Pickard Chilton, n.d.
Skyports can have a variety of amenities specific to their design, placement, and built environment.
Key considerations should include: airspace access; aircraft parking, charging, and battery
swapping; facility security; and open access to accommodate a variety of aircraft types, operators,
and users. In addition, the design of skyports can include multimodal services for parking, charging,
U.S. Department of Transportation
Office of the Assistant Secretary for Research and Technology
Intelligent Transportation Systems Joint Program Office
123
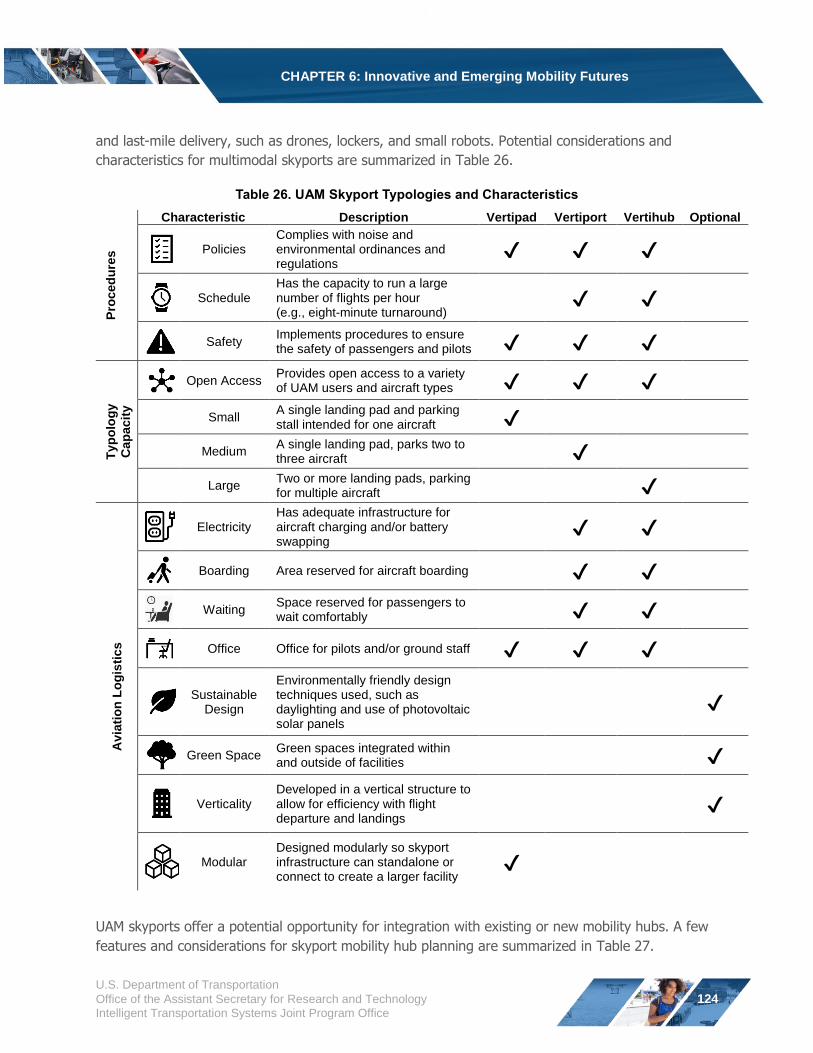
CHAPTER 6: Innovative and Emerging Mobility Futures
and last-mile delivery, such as drones, lockers, and small robots. Potential considerations and
characteristics for multimodal skyports are summarized in Table 26.
Table 26. UAM Skyport Typologies and Characteristics
Characteristic Description Vertipad Vertiport Vertihub Optional
Complies with noise and
s Policies environmental ordinances and ✔ ✔ ✔
ed
ure regulations
Has the capacity to run a large
Pro
c Schedule number of flights per hour ✔ ✔ (e.g., eight-minute turnaround)
Safety Implements procedures to ensure the safety of passengers and pilots ✔ ✔ ✔
Typ
olo
gy
Cap
acit
y
Open Access Provides open access to a variety of UAM users and aircraft types ✔ ✔ ✔
Small A single landing pad and parking stall intended for one aircraft ✔
Medium A single landing pad, parks two to three aircraft ✔
Large Two or more landing pads, parking for multiple aircraft ✔ Has adequate infrastructure for
Electricity aircraft charging and/or battery ✔ ✔
Avia
tio
n L
og
isti
cs
swapping
Boarding Area reserved for aircraft boarding ✔ ✔
Waiting Space reserved for passengers to wait comfortably ✔ ✔
Office Office for pilots and/or ground staff ✔ ✔ ✔
Sustainable Design
Environmentally friendly design techniques used, such as daylighting and use of photovoltaic solar panels
✔
Green Space Green spaces integrated within and outside of facilities ✔
Developed in a vertical structure to Verticality allow for efficiency with flight ✔
departure and landings
Designed modularly so skyport Modular infrastructure can standalone or ✔
connect to create a larger facility
UAM skyports offer a potential opportunity for integration with existing or new mobility hubs. A few
features and considerations for skyport mobility hub planning are summarized in Table 27.
U.S. Department of Transportation
Office of the Assistant Secretary for Research and Technology
Intelligent Transportation Systems Joint Program Office
124
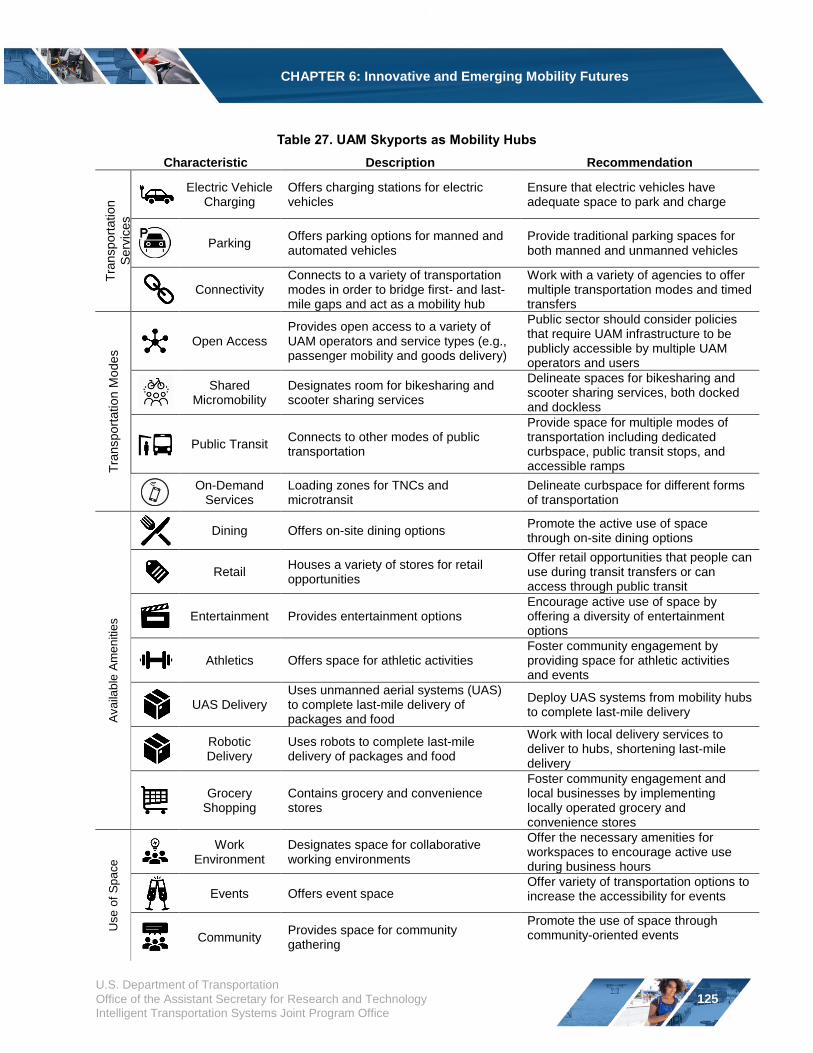
CHAPTER 6: Innovative and Emerging Mobility Futures
Table 27. UAM Skyports as Mobility Hubs
Characteristic Description Recommendation
Tra
nsport
ation
Serv
ices
Electric Vehicle Charging
Offers charging stations for electric vehicles
Ensure that electric vehicles have adequate space to park and charge
Parking Offers parking options for manned and automated vehicles
Provide traditional parking spaces for both manned and unmanned vehicles
Connectivity Connects to a variety of transportation modes in order to bridge first- and last-mile gaps and act as a mobility hub
Work with a variety of agencies to offer multiple transportation modes and timed transfers
Tra
nsport
ation M
odes Open Access
Provides open access to a variety of UAM operators and service types (e.g., passenger mobility and goods delivery)
Public sector should consider policies that require UAM infrastructure to be publicly accessible by multiple UAM operators and users
Shared Micromobility
Designates room for bikesharing and scooter sharing services
Delineate spaces for bikesharing and scooter sharing services, both docked and dockless
Public Transit Connects to other modes of public transportation
Provide space for multiple modes of transportation including dedicated curbspace, public transit stops, and accessible ramps
On-Demand Services
Loading zones for TNCs and microtransit
Delineate curbspace for different forms of transportation
Ava
ilab
le A
me
nitie
s
Dining Offers on-site dining options Promote the active use of space through on-site dining options
Retail Houses a variety of stores for retail opportunities
Offer retail opportunities that people can use during transit transfers or can access through public transit
Entertainment Provides entertainment options Encourage active use of space by offering a diversity of entertainment options
Athletics Offers space for athletic activities Foster community engagement by providing space for athletic activities and events
UAS Delivery Uses unmanned aerial systems (UAS) to complete last-mile delivery of packages and food
Deploy UAS systems from mobility hubs to complete last-mile delivery
Robotic Delivery
Uses robots to complete last-mile delivery of packages and food
Work with local delivery services to deliver to hubs, shortening last-mile delivery
Grocery Shopping
Contains grocery and convenience stores
Foster community engagement and local businesses by implementing locally operated grocery and convenience stores
Use
of
Sp
ace
Work Environment
Designates space for collaborative working environments
Offer the necessary amenities for workspaces to encourage active use during business hours
Events Offers event space Offer variety of transportation options to increase the accessibility for events
Community Provides space for community gathering
Promote the use of space through community-oriented events
U.S. Department of Transportation
Office of the Assistant Secretary for Research and Technology
Intelligent Transportation Systems Joint Program Office
125
CHAPTER 6: Innovative and Emerging Mobility Futures
Emergency Helicopter Landing Facility (EHLF) Requirement – Los Angeles, CA
Prior to 2014, the City of Los Angeles Emergency Helicopter Landing Facility (EHLF) fire code required that
every high-rise building have an approved emergency helicopter landing facility. The policy that had been in
effect since the 1970s, has resulted in a high-level of helipads in the city’s densest areas. However,
because the emergency helipads were not intended to operate as a private use helistop or heliport, no
notice for an airspace evaluation was required to be filed with the FAA. However, the requirement to
construct helipads could make Los Angeles ready for UAM in the future.
Key Takeaways
Advancements in electrification, automation, and vertical takeoff and landing are
contributing to the development of advanced air mobility, such as UAM and rural air mobility.
Renewed interest in urban aviation coupled with innovative and emerging technologies has
increased awareness about potential societal concerns associated with UAM. These concerns
can include affordability, visual pollution, noise pollution, privacy, and safety concerns.
Innovative and Emerging Last-Mile Delivery Technologies
Changing consumer behavior coupled with new delivery technologies could continue to transform
consumer preferences and travel behavior through goods delivery (Ganzarski, 2017). This section
discusses three potential transformative and disruptive last-mile delivery technologies:
Unmanned Aircraft (UA): An aircraft operated without the possibility of direct human
intervention from within or on the aircraft that delivers food or packages;
Delivery Robots: Short-range, unmanned, ground-based devices that deliver food or
packages; and
Automated Delivery Vehicles (ADVs): Medium-range, automated (at least Level 4
automation), vehicles that deliver food or packages to businesses and consumers.
In general, last-mile delivery technologies are dispatched on-demand when a customer requests an
order. Typically, both retailers and customers can track a delivery technology’s location during the delivery process through a smartphone app or web interface. For security, the cargo bay of delivery
robots and ADVs are mechanically locked throughout the journey and can only be opened by the
recipient through their smartphone or an unlock code sent to the intended recipient. Each of these
delivery applications are discussed in greater detail in the sections that follow.
U.S. Department of Transportation
Office of the Assistant Secretary for Research and Technology
Intelligent Transportation Systems Joint Program Office
126
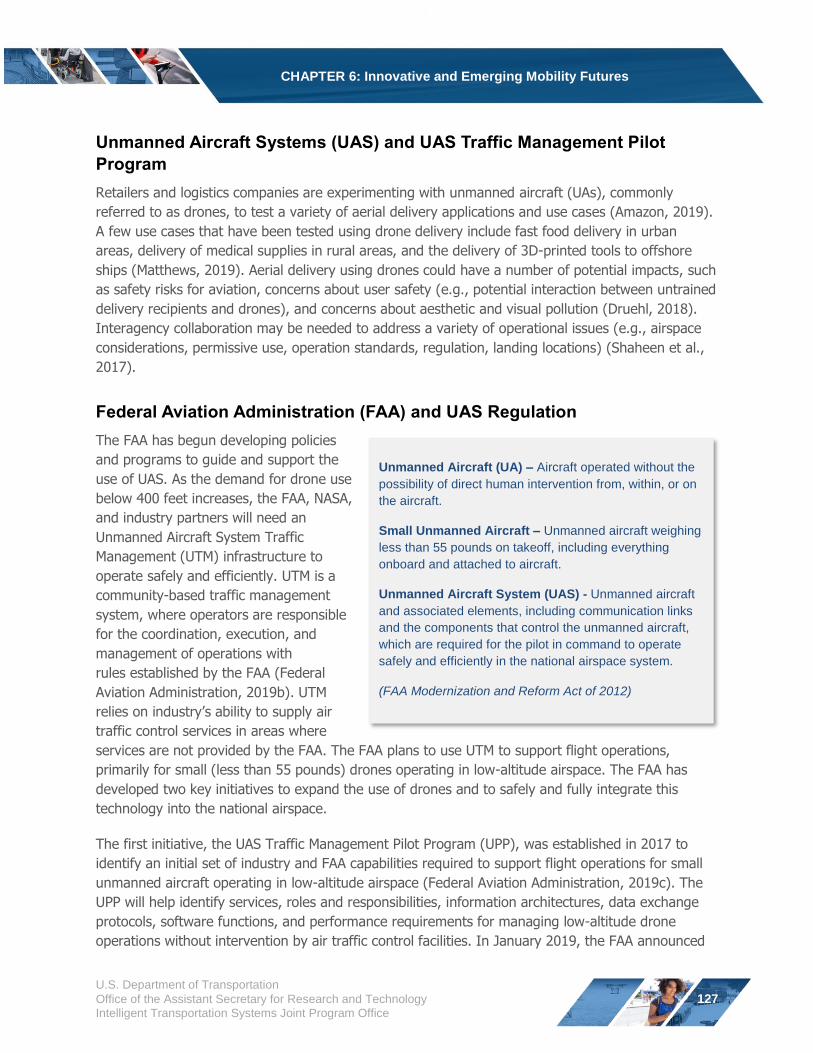
CHAPTER 6: Innovative and Emerging Mobility Futures
Unmanned Aircraft Systems (UAS) and UAS Traffic Management Pilot
Program
Retailers and logistics companies are experimenting with unmanned aircraft (UAs), commonly
referred to as drones, to test a variety of aerial delivery applications and use cases (Amazon, 2019).
A few use cases that have been tested using drone delivery include fast food delivery in urban
areas, delivery of medical supplies in rural areas, and the delivery of 3D-printed tools to offshore
ships (Matthews, 2019). Aerial delivery using drones could have a number of potential impacts, such
as safety risks for aviation, concerns about user safety (e.g., potential interaction between untrained
delivery recipients and drones), and concerns about aesthetic and visual pollution (Druehl, 2018).
Interagency collaboration may be needed to address a variety of operational issues (e.g., airspace
considerations, permissive use, operation standards, regulation, landing locations) (Shaheen et al.,
2017).
Federal Aviation Administration (FAA) and UAS Regulation
The FAA has begun developing policies
services are not provided by the FAA. The FAA plans to use UTM to support flight operations,
primarily for small (less than 55 pounds) drones operating in low-altitude airspace. The FAA has
developed two key initiatives to expand the use of drones and to safely and fully integrate this
technology into the national airspace.
The first initiative, the UAS Traffic Management Pilot Program (UPP), was established in 2017 to
identify an initial set of industry and FAA capabilities required to support flight operations for small
unmanned aircraft operating in low-altitude airspace (Federal Aviation Administration, 2019c). The
UPP will help identify services, roles and responsibilities, information architectures, data exchange
protocols, software functions, and performance requirements for managing low-altitude drone
operations without intervention by air traffic control facilities. In January 2019, the FAA announced
and programs to guide and support the
use of UAS. As the demand for drone use
below 400 feet increases, the FAA, NASA,
and industry partners will need an
Unmanned Aircraft System Traffic
Management (UTM) infrastructure to
operate safely and efficiently. UTM is a
community-based traffic management
system, where operators are responsible
for the coordination, execution, and
management of operations with
rules established by the FAA (Federal
Aviation Administration, 2019b). UTM
relies on industry’s ability to supply air
traffic control services in areas where
Unmanned Aircraft (UA) – Aircraft operated without the
possibility of direct human intervention from, within, or on
the aircraft.
Small Unmanned Aircraft – Unmanned aircraft weighing
less than 55 pounds on takeoff, including everything
onboard and attached to aircraft.
Unmanned Aircraft System (UAS) - Unmanned aircraft
and associated elements, including communication links
and the components that control the unmanned aircraft,
which are required for the pilot in command to operate
safely and efficiently in the national airspace system.
(FAA Modernization and Reform Act of 2012)
U.S. Department of Transportation
Office of the Assistant Secretary for Research and Technology
Intelligent Transportation Systems Joint Program Office
127
CHAPTER 6: Innovative and Emerging Mobility Futures
the selection of three FAA UAS Test Sites to partner with the agency in the UPP – Nevada Institute
for Autonomous Systems (NIAS), Northern Plains UAS Test Site (NPUASTS), and the Virginia Tech
Mid Atlantic Aviation Partnership (MAAP) (Federal Aviation Administration, 2019a). The results from
the UPP will provide a proof of concept for UTM capabilities currently in research and development
and will provide the basis for initial deployment of UTM capabilities.
The second initiative, the UAS Integration Pilot Program (IPP) has brought state, local, and tribal
governments together with private sector entities, such as UAS operators or manufacturers, to
accelerate safe drone integration (Federal Aviation Administration, 2018a). The program is helping
the USDOT and the FAA develop new rules that support more complex low-altitude operations by:
Identifying ways to balance local and national interests related to drone integration;
Improving communications with local, state, and tribal jurisdictions;
Addressing security and privacy risks; and
Accelerating the approval of operations that currently require special authorizations.
FAA Regulations and Certification Processes
The FAA certifies the design of aircraft and components that are used in civil aviation operations in the U.S.
The FAA grants certifications based on the operational areas and service types of applicants. Interstate,
foreign, overseas, or mail carrying applicants receive an air carrier certificate, while intrastate transportation
applicants receive an operating certificate. Certification types are also based on service types – on-demand
or commuter (scheduled). Communities with on-demand aviation services should understand the regulations
and certification processes in these parts of Title 14 of the CFR:
Part 23: Airworthiness standards for normal airplanes
Part 25: Rules governing airworthiness standards
Part 27: Airworthiness standards for normal rotorcraft (i.e., helicopters)
Part 29: Airworthiness standards for transport helicopters
Part 91: General operating and flight rules (general aviation)
Part 107: Designed to allow the use of small UAS weighing up to 55 pounds
Part 121: Rules for scheduled air carriers (i.e., regional and major airlines)
Part 133: Rules governing external load operations for helicopters
Part 135: Rules for commuter and on-demand operations (i.e., corporate, government, all helicopter operations)
Part 135 is a common certification pathway for on-demand aviation services involving passenger mobility
and goods delivery. Part 135 regulates aircraft requirements, instrument flight rules (IFR), visual flight rules
(VFR), recordkeeping, staffing, training, and safety procedures. Additional requirements and special
conditions may apply.
U.S. Department of Transportation
Office of the Assistant Secretary for Research and Technology
Intelligent Transportation Systems Joint Program Office
128
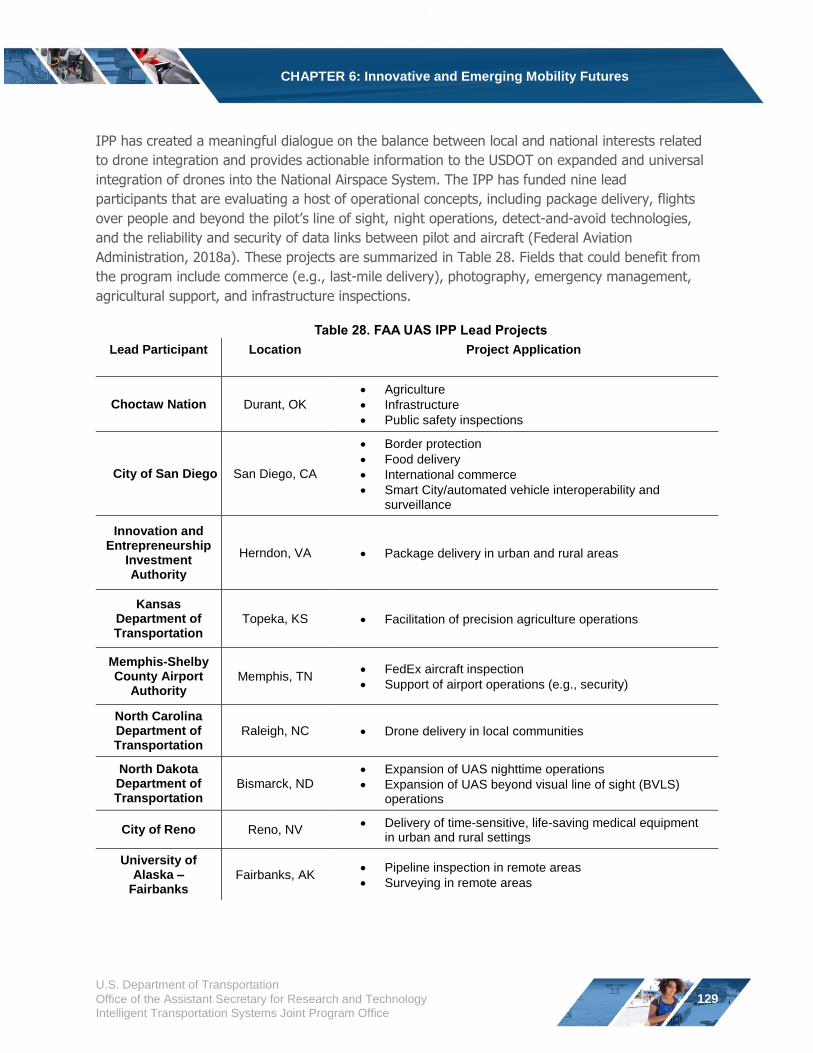
CHAPTER 6: Innovative and Emerging Mobility Futures
IPP has created a meaningful dialogue on the balance between local and national interests related
to drone integration and provides actionable information to the USDOT on expanded and universal
integration of drones into the National Airspace System. The IPP has funded nine lead
participants that are evaluating a host of operational concepts, including package delivery, flights
over people and beyond the pilot’s line of sight, night operations, detect-and-avoid technologies,
and the reliability and security of data links between pilot and aircraft (Federal Aviation
Administration, 2018a). These projects are summarized in Table 28. Fields that could benefit from
the program include commerce (e.g., last-mile delivery), photography, emergency management,
agricultural support, and infrastructure inspections.
Table 28. FAA UAS IPP Lead Projects
Lead Participant Location Project Application
Choctaw Nation Durant, OK
Agriculture
Infrastructure
Public safety inspections
City of San Diego San Diego, CA
Border protection
Food delivery
International commerce
Smart City/automated vehicle interoperability and surveillance
Innovation and Entrepreneurship
Investment Authority
Herndon, VA Package delivery in urban and rural areas
Kansas Department of Transportation
Topeka, KS Facilitation of precision agriculture operations
Memphis-Shelby County Airport
Authority Memphis, TN
FedEx aircraft inspection
Support of airport operations (e.g., security)
North Carolina Department of Transportation
Raleigh, NC Drone delivery in local communities
North Dakota Department of Transportation
Bismarck, ND
Expansion of UAS nighttime operations
Expansion of UAS beyond visual line of sight (BVLS) operations
City of Reno Reno, NV Delivery of time-sensitive, life-saving medical equipment
in urban and rural settings
University of Alaska –
Fairbanks Fairbanks, AK
Pipeline inspection in remote areas
Surveying in remote areas
U.S. Department of Transportation
Office of the Assistant Secretary for Research and Technology
Intelligent Transportation Systems Joint Program Office
129
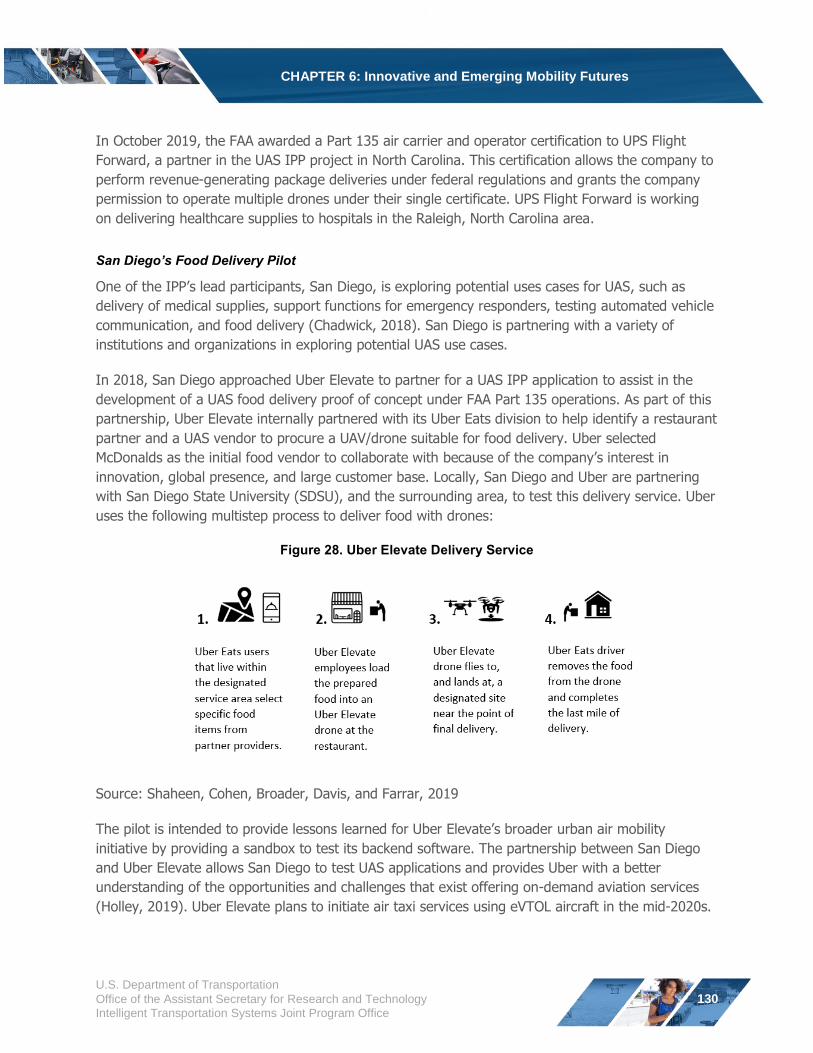
CHAPTER 6: Innovative and Emerging Mobility Futures
In October 2019, the FAA awarded a Part 135 air carrier and operator certification to UPS Flight
Forward, a partner in the UAS IPP project in North Carolina. This certification allows the company to
perform revenue-generating package deliveries under federal regulations and grants the company
permission to operate multiple drones under their single certificate. UPS Flight Forward is working
on delivering healthcare supplies to hospitals in the Raleigh, North Carolina area.
San Diego’s Food Delivery Pilot
One of the IPP’s lead participants, San Diego, is exploring potential uses cases for UAS, such as
delivery of medical supplies, support functions for emergency responders, testing automated vehicle
communication, and food delivery (Chadwick, 2018). San Diego is partnering with a variety of
institutions and organizations in exploring potential UAS use cases.
In 2018, San Diego approached Uber Elevate to partner for a UAS IPP application to assist in the
development of a UAS food delivery proof of concept under FAA Part 135 operations. As part of this
partnership, Uber Elevate internally partnered with its Uber Eats division to help identify a restaurant
partner and a UAS vendor to procure a UAV/drone suitable for food delivery. Uber selected
McDonalds as the initial food vendor to collaborate with because of the company’s interest in
innovation, global presence, and large customer base. Locally, San Diego and Uber are partnering
with San Diego State University (SDSU), and the surrounding area, to test this delivery service. Uber
uses the following multistep process to deliver food with drones:
Figure 28. Uber Elevate Delivery Service
Source: Shaheen, Cohen, Broader, Davis, and Farrar, 2019
The pilot is intended to provide lessons learned for Uber Elevate’s broader urban air mobility
initiative by providing a sandbox to test its backend software. The partnership between San Diego
and Uber Elevate allows San Diego to test UAS applications and provides Uber with a better
understanding of the opportunities and challenges that exist offering on-demand aviation services
(Holley, 2019). Uber Elevate plans to initiate air taxi services using eVTOL aircraft in the mid-2020s.
U.S. Department of Transportation
Office of the Assistant Secretary for Research and Technology
Intelligent Transportation Systems Joint Program Office
130
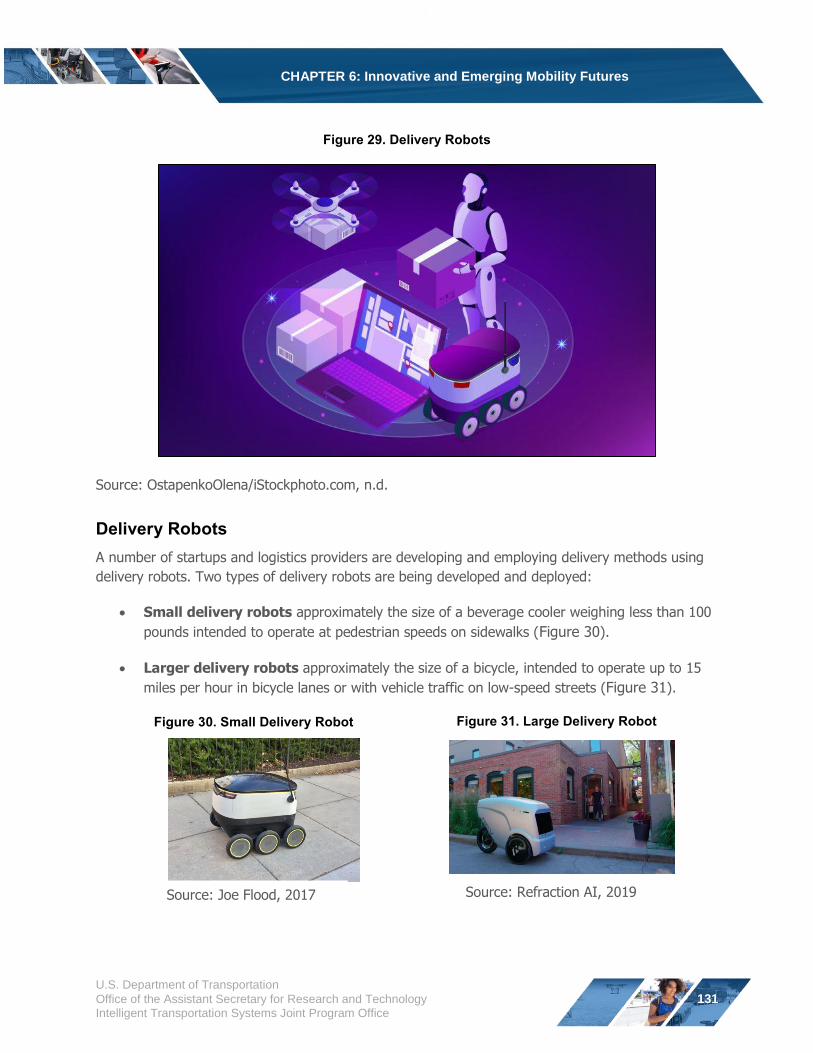
CHAPTER 6: Innovative and Emerging Mobility Futures
Figure 29. Delivery Robots
Source: OstapenkoOlena/iStockphoto.com, n.d.
Delivery Robots
A number of startups and logistics providers are developing and employing delivery methods using
delivery robots. Two types of delivery robots are being developed and deployed:
Small delivery robots approximately the size of a beverage cooler weighing less than 100
pounds intended to operate at pedestrian speeds on sidewalks (Figure 30).
Larger delivery robots approximately the size of a bicycle, intended to operate up to 15
miles per hour in bicycle lanes or with vehicle traffic on low-speed streets (Figure 31).
Figure 30. Small Delivery Robot Figure 31. Large Delivery Robot
Source: Refraction AI, 2019 Source: Joe Flood, 2017
U.S. Department of Transportation
Office of the Assistant Secretary for Research and Technology
Intelligent Transportation Systems Joint Program Office
131
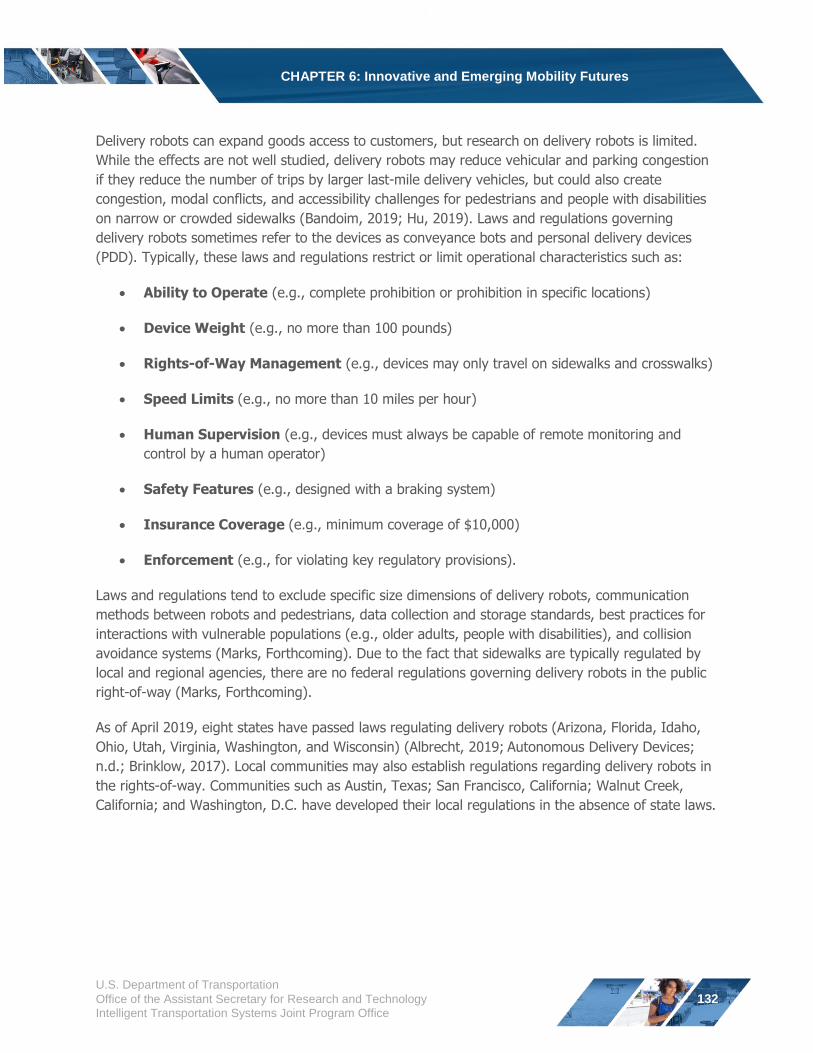
CHAPTER 6: Innovative and Emerging Mobility Futures
Delivery robots can expand goods access to customers, but research on delivery robots is limited.
While the effects are not well studied, delivery robots may reduce vehicular and parking congestion
if they reduce the number of trips by larger last-mile delivery vehicles, but could also create
congestion, modal conflicts, and accessibility challenges for pedestrians and people with disabilities
on narrow or crowded sidewalks (Bandoim, 2019; Hu, 2019). Laws and regulations governing
delivery robots sometimes refer to the devices as conveyance bots and personal delivery devices
(PDD). Typically, these laws and regulations restrict or limit operational characteristics such as:
Ability to Operate (e.g., complete prohibition or prohibition in specific locations)
Device Weight (e.g., no more than 100 pounds)
Rights-of-Way Management (e.g., devices may only travel on sidewalks and crosswalks)
Speed Limits (e.g., no more than 10 miles per hour)
Human Supervision (e.g., devices must always be capable of remote monitoring and
control by a human operator)
Safety Features (e.g., designed with a braking system)
Insurance Coverage (e.g., minimum coverage of $10,000)
Enforcement (e.g., for violating key regulatory provisions).
Laws and regulations tend to exclude specific size dimensions of delivery robots, communication
methods between robots and pedestrians, data collection and storage standards, best practices for
interactions with vulnerable populations (e.g., older adults, people with disabilities), and collision
avoidance systems (Marks, Forthcoming). Due to the fact that sidewalks are typically regulated by
local and regional agencies, there are no federal regulations governing delivery robots in the public
right-of-way (Marks, Forthcoming).
As of April 2019, eight states have passed laws regulating delivery robots (Arizona, Florida, Idaho,
Ohio, Utah, Virginia, Washington, and Wisconsin) (Albrecht, 2019; Autonomous Delivery Devices;
n.d.; Brinklow, 2017). Local communities may also establish regulations regarding delivery robots in
the rights-of-way. Communities such as Austin, Texas; San Francisco, California; Walnut Creek,
California; and Washington, D.C. have developed their local regulations in the absence of state laws.
U.S. Department of Transportation
Office of the Assistant Secretary for Research and Technology
Intelligent Transportation Systems Joint Program Office
132
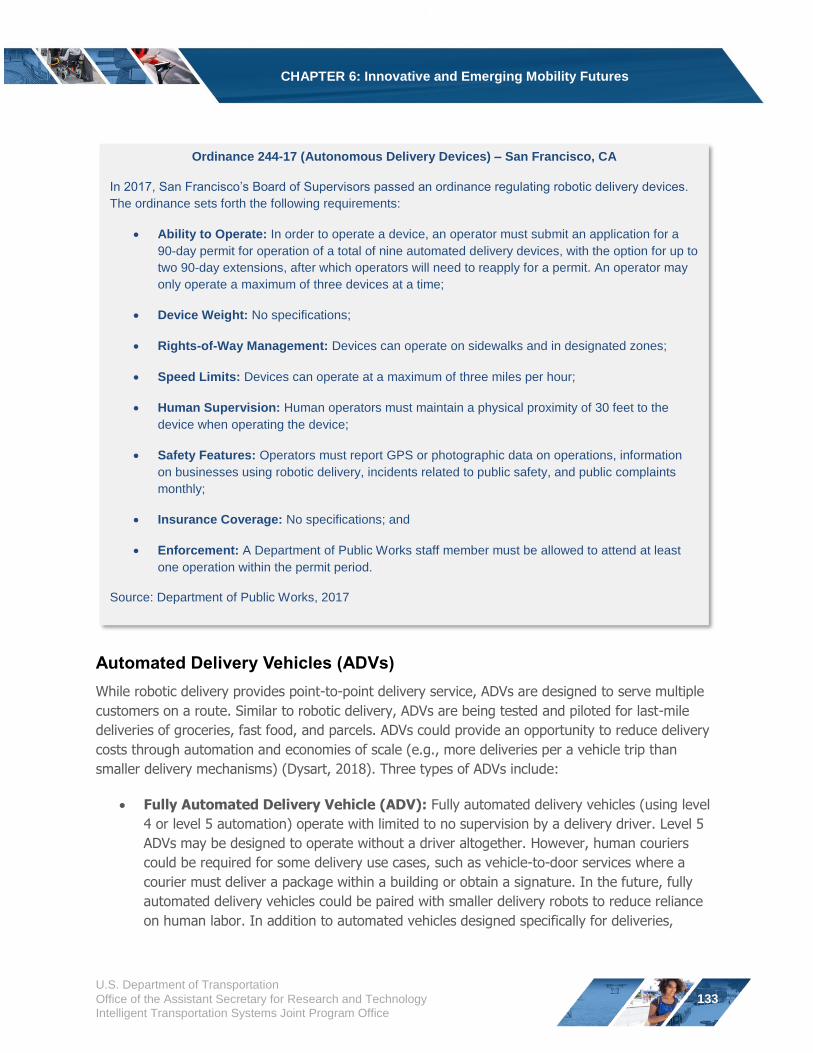
CHAPTER 6: Innovative and Emerging Mobility Futures
Ordinance 244-17 (Autonomous Delivery Devices) – San Francisco, CA
In 2017, San Francisco’s Board of Supervisors passed an ordinance regulating robotic delivery devices.
The ordinance sets forth the following requirements:
Ability to Operate: In order to operate a device, an operator must submit an application for a
90-day permit for operation of a total of nine automated delivery devices, with the option for up to
two 90-day extensions, after which operators will need to reapply for a permit. An operator may
only operate a maximum of three devices at a time;
Device Weight: No specifications;
Rights-of-Way Management: Devices can operate on sidewalks and in designated zones;
Speed Limits: Devices can operate at a maximum of three miles per hour;
Human Supervision: Human operators must maintain a physical proximity of 30 feet to the
device when operating the device;
Safety Features: Operators must report GPS or photographic data on operations, information
on businesses using robotic delivery, incidents related to public safety, and public complaints
monthly;
Insurance Coverage: No specifications; and
Enforcement: A Department of Public Works staff member must be allowed to attend at least
one operation within the permit period.
Source: Department of Public Works, 2017
Automated Delivery Vehicles (ADVs)
While robotic delivery provides point-to-point delivery service, ADVs are designed to serve multiple
customers on a route. Similar to robotic delivery, ADVs are being tested and piloted for last-mile
deliveries of groceries, fast food, and parcels. ADVs could provide an opportunity to reduce delivery
costs through automation and economies of scale (e.g., more deliveries per a vehicle trip than
smaller delivery mechanisms) (Dysart, 2018). Three types of ADVs include:
Fully Automated Delivery Vehicle (ADV): Fully automated delivery vehicles (using level
4 or level 5 automation) operate with limited to no supervision by a delivery driver. Level 5
ADVs may be designed to operate without a driver altogether. However, human couriers
could be required for some delivery use cases, such as vehicle-to-door services where a
courier must deliver a package within a building or obtain a signature. In the future, fully
automated delivery vehicles could be paired with smaller delivery robots to reduce reliance
on human labor. In addition to automated vehicles designed specifically for deliveries,
U.S. Department of Transportation
Office of the Assistant Secretary for Research and Technology
Intelligent Transportation Systems Joint Program Office
133
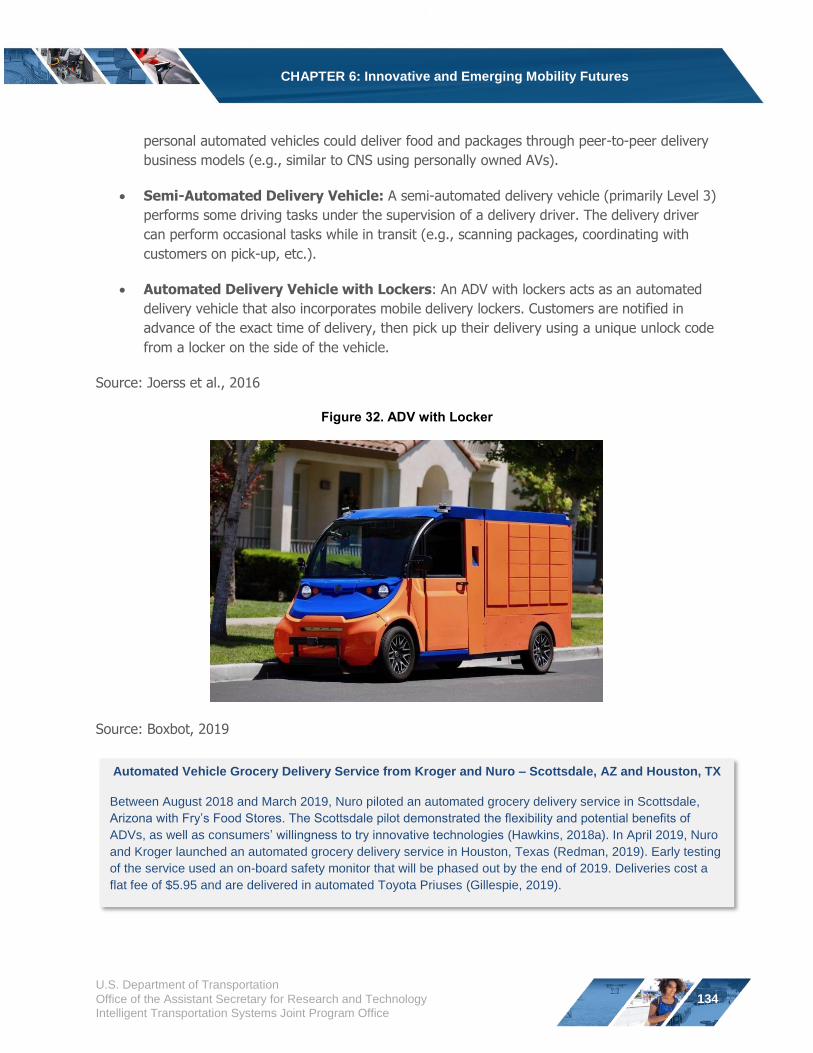
CHAPTER 6: Innovative and Emerging Mobility Futures
personal automated vehicles could deliver food and packages through peer-to-peer delivery
business models (e.g., similar to CNS using personally owned AVs).
Semi-Automated Delivery Vehicle: A semi-automated delivery vehicle (primarily Level 3)
performs some driving tasks under the supervision of a delivery driver. The delivery driver
can perform occasional tasks while in transit (e.g., scanning packages, coordinating with
customers on pick-up, etc.).
Automated Delivery Vehicle with Lockers: An ADV with lockers acts as an automated
delivery vehicle that also incorporates mobile delivery lockers. Customers are notified in
advance of the exact time of delivery, then pick up their delivery using a unique unlock code
from a locker on the side of the vehicle.
Source: Joerss et al., 2016
Figure 32. ADV with Locker
Source: Boxbot, 2019
Automated Vehicle Grocery Delivery Service from Kroger and Nuro – Scottsdale, AZ and Houston, TX
Between August 2018 and March 2019, Nuro piloted an automated grocery delivery service in Scottsdale,
Arizona with Fry’s Food Stores. The Scottsdale pilot demonstrated the flexibility and potential benefits of ADVs, as well as consumers’ willingness to try innovative technologies (Hawkins, 2018a). In April 2019, Nuro
and Kroger launched an automated grocery delivery service in Houston, Texas (Redman, 2019). Early testing
of the service used an on-board safety monitor that will be phased out by the end of 2019. Deliveries cost a
flat fee of $5.95 and are delivered in automated Toyota Priuses (Gillespie, 2019).
U.S. Department of Transportation
Office of the Assistant Secretary for Research and Technology
Intelligent Transportation Systems Joint Program Office
134
CHAPTER 6: Innovative and Emerging Mobility Futures
ADVs are commonly regulated under the same rules as AVs, either by legislation or executive order.
Some communities, such as Arlington, Texas and Austin, Texas have launched ADV pilot programs.
In May 2019, California’s Department of Motor Vehicles (DMV) announced that they may consider a separate class of testing for automated light-duty delivery vehicles (Descant, 2019).
Potential Concerns with Last-Mile Delivery Vehicles
While innovative last-mile delivery vehicles have the potential to increase access to goods, there are
concerns over the potential impacts of these delivery options. Potential impacts of emerging last-
mile delivery modes include:
Affordability: Fees for emerging last-mile delivery modes may not be affordable for certain
populations, such as low-income households.
Access: Last-mile delivery devices themselves, or the platforms used to access them (e.g.,
websites, smartphone apps), may be inaccessible for certain users, such as people with
disabilities; households without smartphone, Internet or credit/debit card access; and older
adults.
Increased Congestion and Rights-of-Way Access: An increasing number of last-mile
delivery vehicles, robots, and drones can increase street, curbspace, and airspace
congestion. Additionally, an increasing number of services may create competition for rights-
of-way management.
Impacts on Pedestrians, Cyclists, and People with Disabilities: Automated delivery
vehicles and delivery robots could create conflicts with active transportation and block ADA
access (e.g., loading zones, ramps, etc.) for people with disabilities.
Visual Pollution: An overcrowding of robots and drone deliveries could create unwanted
visual disturbances in urbanized areas.
Noise Pollution: Noise pollution is a potential problem that could arise with additional
delivery vehicle, robot, and drone use. For example, with drones the sound of spinning
rotors may be tolerable in a single unit but create additional disturbances when multiple
aircraft fly overhead.
Privacy: Drones are capable of highly advanced surveillance and are already used by law
enforcement. They may be equipped with various types of equipment, such as live-feed
video cameras, infrared cameras, heat sensors, and radar. This can raise a number of
concerns for privacy and civil liberties.
Infrastructure Maintenance: Increased use of infrastructure from more delivery devices
could require increased maintenance of infrastructure such as roadways, sidewalks, curbs,
and landing pads.
U.S. Department of Transportation
Office of the Assistant Secretary for Research and Technology
Intelligent Transportation Systems Joint Program Office
135
CHAPTER 6: Innovative and Emerging Mobility Futures
More research is needed to understand the impacts of these emerging modes and potential
mitigation measures.
Key Takeaways
Innovations in last-mile delivery technologies (e.g., robotic delivery, ADVs, UAS) may disrupt
goods delivery in a number of ways, such as competing for space in the public right-of-way
(both surface and airspace) and potentially creating the need for new regulations.
Last-mile delivery innovations also may result in a variety of impacts including congestion,
noise and visual pollution, privacy concerns, and equity challenges.
Laws regulating the use of emerging last-mile technologies could be implemented at the
federal, state, or local level, but in many cases, have not been widely adopted.
The FAA is guiding and supporting the use of UAS through the UAS Traffic Management Pilot
Program (UPP) and the UAS Integration Pilot Program (IPP).
U.S. Department of Transportation
Office of the Assistant Secretary for Research and Technology
Intelligent Transportation Systems Joint Program Office
136
CHAPTER 7: Conclusion
CHAPTER 7: Conclusion
Changing consumer preferences ⎯ coupled with advancements in technology, social networking,
location-based services, wireless services, and cloud technologies ⎯ are contributing to
transportation innovation and the growth of MOD. MOD is a concept based on the principle that
transportation is a commodity where modes have distinguishable economic values. MOD allows
customers to access mobility, goods, and services on demand and can support an integrated and
multimodal operations management approach that can influence the supply and demand sides of a
marketplace. The supply side of the marketplace consists of the providers, operators, and devices
that offer transportation services for people or goods and service delivery. The demand side of the
marketplace is comprised of travelers and goods, including their choices and preferences.
The MOD ecosystem is enabled by an array of stakeholders in a variety of disciplines. Common MOD
stakeholders include public agencies at the local, regional, state, and federal levels of government,
private companies, non-governmental organizations, academic institutions, and consumers. MOD
stakeholders can engage in a variety of public-private partnerships (e.g., data sharing, gap-filling
services, and others) to expand access to MOD. Stakeholders can plan and prepare for MOD by
incorporating shared modes into transportation planning and modeling. In addition to planning and
modeling the impacts of MOD, transportation network managers and systems operators can
leverage MOD for transportation systems management and operations (TSMO) to aid in managing
supply and demand.
Shared mobility services, such as carsharing, microtransit, shared micromobility (bikesharing and
scooter sharing), and transportation network companies (TNCs) typically result in a variety of travel
behavior, environmental, land use, and social impacts, often influenced by the environment in which
they are implemented. Other innovative and emerging modes, such as urban air mobility (UAM),
shared automated vehicles (SAVs), and last-mile delivery innovations (including robots, automated
delivery vehicles, and drones) have not been extensively studied.
While MOD can be employed in a variety of built environments, partnerships, policies, and
deployment characteristics are almost always tailored to local context. Communities are leveraging a
number of common partnerships, such as first- and last- mile services, low-density service, off-peak
service, and paratransit to help bridge spatial and temporal gaps in the transportation network.
Policies integrating shared mobility into the public rights-of-way, zoning for new and existing
developments, and multimodal integration (including fare and digital integration) can create a
network effect multiplying the effectiveness of MOD. Pilot project evaluations may allow
communities to study and assess the impacts of MOD.
The impacts of MOD on data privacy, equity, and labor are common concerns associated with on-
demand mobility. Sharing traveler information can help enable integrated services, such as fare
payment and trip planning. However, sharing MOD data may result in a variety of challenges (e.g.,
protecting traveler privacy). Many of these challenges may be mitigated through strategies, such as
U.S. Department of Transportation
Office of the Assistant Secretary for Research and Technology
Intelligent Transportation Systems Joint Program Office
137
CHAPTER 7: Conclusion
developing universal reporting standards, data security, and data aggregation. Additionally, MOD
can enhance access and opportunities for underserved communities, but it may also have adverse
impacts if a particular population or community bears a disproportionate share of the benefits or
adverse impacts of MOD. Equity concerns may be understood through the STEPS framework to
identify and mitigate spatial, temporal, economic, physiological, and social barriers. Communities
may be able to overcome equity barriers through policies and programs that enhance access to
unbanked and underbanked communities (households without debit or credit card access), providing
alternative access mechanisms for digitally impoverished households, and providing accessible
physical and digital services for people with disabilities.
MOD is creating new employment opportunities in some sectors of the transportation industry but is
also disrupting existing labor in other transportation sectors where demand for other services have
declined, such as taxis and liveries. In addition to changing the number and types of jobs available,
MOD is also disrupting traditional labor practices, contributing to the growth of part-time, flexible
schedule, and independent contractor work. Labor regulations coupled with workforce development
may help communities leverage the potential benefits of MOD on labor while mitigating potential
disruption, such as anticipated job losses associated with vehicle automation.
Developments in vehicle automation, electric aviation, and last-mile delivery are enabling new
services and business models that could have a variety of impacts (both positive and negative) on
communities. While the effects of these and other technological innovations on auto ownership, land
use, parking, equity, and travel behavior remain to be seen, what is clear is that these innovations
could have a disruptive impact on travelers and society. However, as these technologies come
online, policymakers may need proactive policy to facilitate socially desirable outcomes. Leveraging
the case studies, findings, current practices, and potential policies in this document can help
stakeholders to:
• Engage in public-private partnerships to bridge gaps in the transportation network;
• Prepare communities by integrating MOD into current planning and modeling practices;
• Manage network supply and demand through MOD strategies, such as TSMO;
• Integrate shared mobility with existing transportation services in a variety of built environment types to support multimodal trips for all users;
• Prepare for the potential impacts of MOD through a variety of public policies;
• Integrate shared mobility and delivery services through mobility hubs, integrated fare payment, and information integration;
• Prepare for, and respond to, the impacts of MOD on labor and equity through data sharing, pilots, and research; and
• Prepare communities for innovative and emerging transportation technologies, such as AVs, SAVs, UAM, UAS, delivery robots, and ADVs.
Table 29 provides some key takeaways from this report.
U.S. Department of Transportation
Office of the Assistant Secretary for Research and Technology
Intelligent Transportation Systems Joint Program Office
138
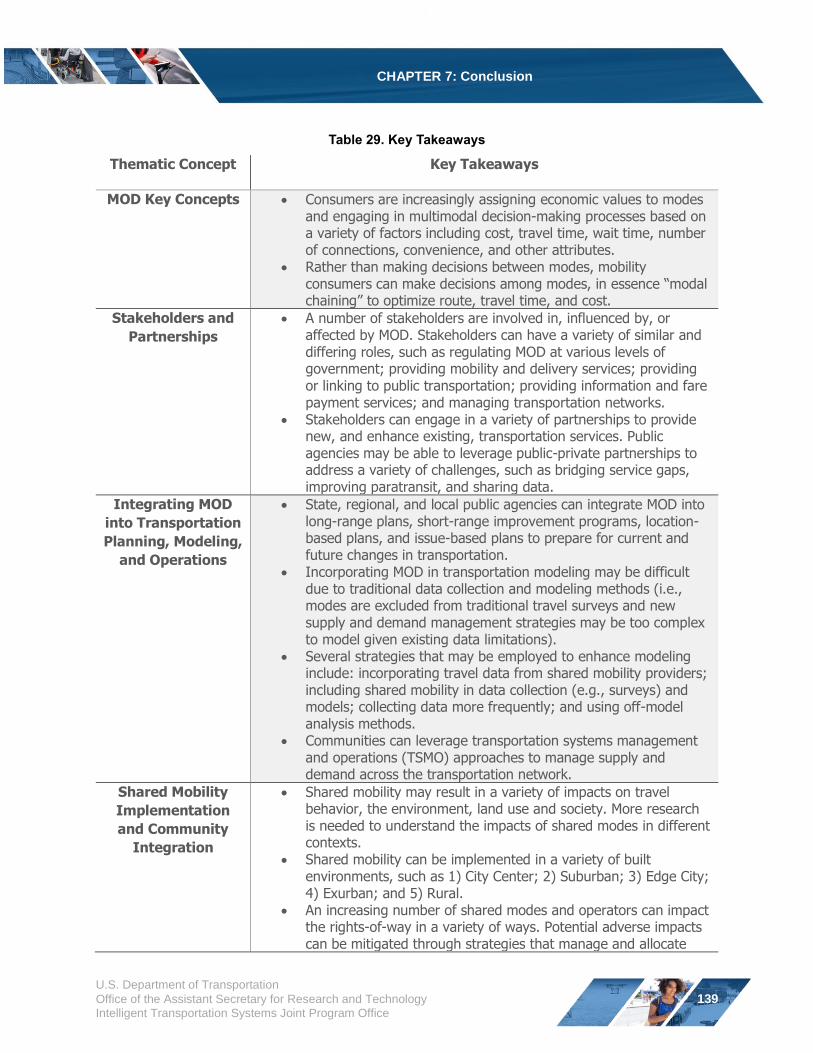
CHAPTER 7: Conclusion
Table 29. Key Takeaways
Thematic Concept Key Takeaways
MOD Key Concepts Consumers are increasingly assigning economic values to modes and engaging in multimodal decision-making processes based on a variety of factors including cost, travel time, wait time, number of connections, convenience, and other attributes.
Rather than making decisions between modes, mobility consumers can make decisions among modes, in essence “modal chaining” to optimize route, travel time, and cost.
Stakeholders and
Partnerships
A number of stakeholders are involved in, influenced by, or affected by MOD. Stakeholders can have a variety of similar and differing roles, such as regulating MOD at various levels of government; providing mobility and delivery services; providing or linking to public transportation; providing information and fare payment services; and managing transportation networks.
Stakeholders can engage in a variety of partnerships to provide new, and enhance existing, transportation services. Public agencies may be able to leverage public-private partnerships to address a variety of challenges, such as bridging service gaps, improving paratransit, and sharing data.
Integrating MOD
into Transportation
Planning, Modeling,
and Operations
State, regional, and local public agencies can integrate MOD into long-range plans, short-range improvement programs, location-based plans, and issue-based plans to prepare for current and future changes in transportation.
Incorporating MOD in transportation modeling may be difficult due to traditional data collection and modeling methods (i.e., modes are excluded from traditional travel surveys and new supply and demand management strategies may be too complex to model given existing data limitations).
Several strategies that may be employed to enhance modeling include: incorporating travel data from shared mobility providers; including shared mobility in data collection (e.g., surveys) and models; collecting data more frequently; and using off-model analysis methods.
Communities can leverage transportation systems management and operations (TSMO) approaches to manage supply and demand across the transportation network.
Shared Mobility
Implementation
and Community
Integration
Shared mobility may result in a variety of impacts on travel behavior, the environment, land use and society. More research is needed to understand the impacts of shared modes in different contexts.
Shared mobility can be implemented in a variety of built environments, such as 1) City Center; 2) Suburban; 3) Edge City; 4) Exurban; and 5) Rural.
An increasing number of shared modes and operators can impact the rights-of-way in a variety of ways. Potential adverse impacts can be mitigated through strategies that manage and allocate
U.S. Department of Transportation
Office of the Assistant Secretary for Research and Technology
Intelligent Transportation Systems Joint Program Office
139
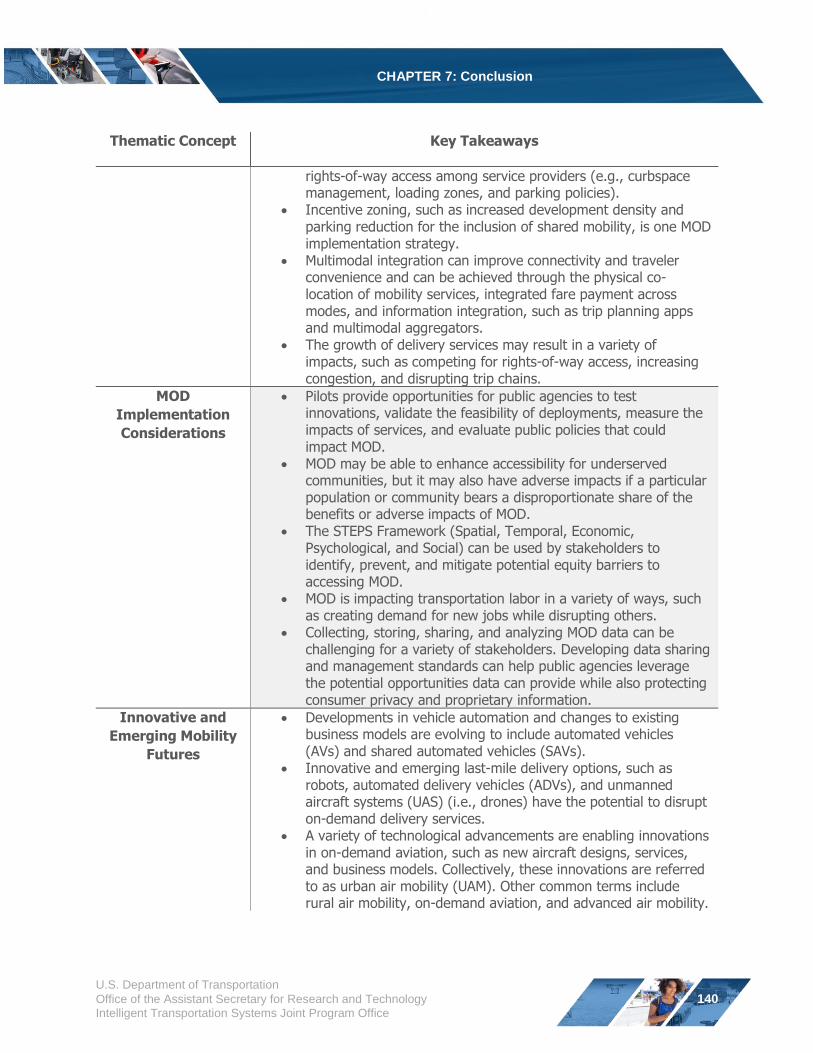
CHAPTER 7: Conclusion
Thematic Concept Key Takeaways
rights-of-way access among service providers (e.g., curbspace management, loading zones, and parking policies).
Incentive zoning, such as increased development density and parking reduction for the inclusion of shared mobility, is one MOD implementation strategy.
Multimodal integration can improve connectivity and traveler convenience and can be achieved through the physical co-location of mobility services, integrated fare payment across modes, and information integration, such as trip planning apps and multimodal aggregators.
The growth of delivery services may result in a variety of impacts, such as competing for rights-of-way access, increasing congestion, and disrupting trip chains.
MOD
Implementation
Considerations
Pilots provide opportunities for public agencies to test innovations, validate the feasibility of deployments, measure the impacts of services, and evaluate public policies that could impact MOD.
MOD may be able to enhance accessibility for underserved communities, but it may also have adverse impacts if a particular population or community bears a disproportionate share of the benefits or adverse impacts of MOD.
The STEPS Framework (Spatial, Temporal, Economic, Psychological, and Social) can be used by stakeholders to identify, prevent, and mitigate potential equity barriers to accessing MOD.
MOD is impacting transportation labor in a variety of ways, such as creating demand for new jobs while disrupting others.
Collecting, storing, sharing, and analyzing MOD data can be challenging for a variety of stakeholders. Developing data sharing and management standards can help public agencies leverage the potential opportunities data can provide while also protecting consumer privacy and proprietary information.
Innovative and
Emerging Mobility
Futures
Developments in vehicle automation and changes to existing business models are evolving to include automated vehicles (AVs) and shared automated vehicles (SAVs).
Innovative and emerging last-mile delivery options, such as robots, automated delivery vehicles (ADVs), and unmanned aircraft systems (UAS) (i.e., drones) have the potential to disrupt on-demand delivery services.
A variety of technological advancements are enabling innovations in on-demand aviation, such as new aircraft designs, services, and business models. Collectively, these innovations are referred to as urban air mobility (UAM). Other common terms include rural air mobility, on-demand aviation, and advanced air mobility.
U.S. Department of Transportation
Office of the Assistant Secretary for Research and Technology
Intelligent Transportation Systems Joint Program Office
140
CHAPTER 7: Conclusion
Thoughtful planning and implementation, continued research, and continued study of the impacts of
MOD on communities will be necessary to balance commercial innovation with public goals and
maximize the potential of these innovations.
U.S. Department of Transportation
Office of the Assistant Secretary for Research and Technology
Intelligent Transportation Systems Joint Program Office
141
CHAPTER 8: Recommended Reading and Resources
CHAPTER 8: Recommended Readings and Resources
Bikesharing (Dockless)
(Forthcoming). JUMP Pilot Program Evaluation Report.
Berkeley, CA: Transportation Sustainability Research
Center.
City of Chicago Department of Transportation. (2019,
May 14). “Chicago Dockless Bikeshare Pilot Program” Retrieved from the City of Chicago:
https://www.chicago.gov/content/dam/city/depts/cdo
t/Misc/Chicago%20Dockless%20Bikeshare%20Pilot%
20Report.pdf
Seattle Department of Transportation. (2018,
August). “2017 Free-floating Bike Share Pilot
Evaluation Report.” Retrieved from the City of Seattle: http://www.seattle.gov/Documents/Departments/SDO
T/BikeProgram/2017_BikeShare_Evaluation_Report_1
13018.pdf
Lazarus, Jessica, Jean Carpentier Pourquier, Frank
Feng, Henry Hammel, and Susan Shaheen. (2018).
“Bikesharing Evolution and Expansion: Understanding How Docked and Dockless Models Complement and
Compete – A Case Study of San Francisco.” Report
Number 19-02761, TRB 98th Annual Meeting
Compendium of Papers.
Bikesharing (Station-Based)
Gleason, Rebecca and Laurie Miskimins. (2012).
Exploring Bicycle Options for Federal Lands: Bike
Sharing, Rentals and Employee Fleets. Report Number
FHWA-WFL/TD-12-001, FHWA. Available at:
http://www.nps.gov/transportation/pdfs/FHWA_bicycl
e_options.pdf
Institute for Transportation and Development Policy.
(2013). “Riding the Bike-Share Boom: The Top Five
Components of a Successful System.” Available at: http://www.itdp.org/riding-the-bike-share-boom-the-
top-five-components-of-a-successful-system/
Martin, Elliot, Adam Cohen, Jan Botha, and Susan
Shaheen. (2016). Bikesharing and Bicycle Safety. San
Jose, CA: Mineta Transportation Institute. Available
at: http://transweb.sjsu.edu/PDFs/research/1204-
bikesharing-and-bicycle-safety.pdf
McNeil, N., J. Dill, J. MacArthur, and J. Broach.
(2017). Breaking Barriers to Bike Share: Insights from
Bike Share Users. Portland: Portland State University.
Available at:
https://pdxscholar.library.pdx.edu/trec_reports/154/
Nair, Rahul, Elise Miller-Hooks, Robert Hampshire,
and Ana Busic. (2013). “Large-Scale Vehicle Sharing
Systems: An Analysis of Vélib’.” International Journal
of Sustainable Transportation 7 (1): 85–106. Available
at: https://doi.org/10.1080/15568318.2012.660115
Shaheen, Susan, Stacey Guzman, and Hua Zhang.
(2011). “Bikesharing in Europe, the Americas, and Asia: Past, Present, and Future.” Transportation
Research Record 2143: 159–167. Available at:
https://escholarship.org/uc/item/79v822k5
Shaheen, Susan, Elliot Martin, Nelson Chan, Adam
Cohen, and Mike Pogodzinski. (2014). Public
Bikesharing in North America During A Period of Rapid
Expansion: Understanding Business Models, Industry
Trends and User Impacts. San Jose, CA: Mineta
Transportation Institute. Available at:
http://transweb.sjsu.edu/project/1131.html
Shaheen, Susan, Elliot Martin, and Adam Cohen.
(2013). “Public Bikesharing and Modal Shift Behavior: A Comparative Study of Early Bikesharing Systems in
North America.” International Journal of
Transportation 1 (1): 35–54. Available at:
http://article.nadiapub.com/IJT/vol1_no1/3.pdf
Carsharing (Business to Consumer)
Firnkorn, Jörg, and Martin Müller. (2012). “Selling Mobility Instead of Cars: New Business Strategies for
Automakers and the Impact of Private Vehicle
Holdings.” Business Strategy and The Environment 21
(4): 264–280. Available at:
https://doi.org/10.1002/bse.738
U.S. Department of Transportation
Office of the Assistant Secretary for Research and Technology
Intelligent Transportation Systems Joint Program Office
142
CHAPTER 8: Recommended Reading and Resources
Shaheen, Susan, and Adam Cohen. (2013).
“Carsharing and Personal Vehicle Services: Worldwide Market Developments and Emerging Trends.”
International Journal of Sustainable Transportation 7
(1): 5–34. Available at:
https://doi.org/10.1080/15568318.2012.660103
Shaheen, Susan, Adam Cohen, and Elliot Martin.
(2010). “Carsharing Parking Policy: Review of North
American Practices and San Francisco, California, Bay
Area Case Study.” Transportation Research Record
2187: 146–156. Available at:
https://doi.org/10.3141/2187-19
Shaheen, Susan, Adam Cohen, and Mark Jaffee.
(2018). Innovative Mobility: Carsharing Outlook.
Retrieved from UC Berkeley:
https://escholarship.org/uc/item/49j961wb
Shaheen, Susan, Nelson Chan, and Helen Micheaux.
(2015). “One-Way Carsharing’s Evolution and Operator Perspectives from the Americas.”
Transportation 42: 519–536. Available at:
https://doi.org/10.1007/s11116-015-9607-0
Carsharing (Peer-to-Peer)
Ballús-Armet, Ingrid, Susan Shaheen, Kelly Conts, and
David Weinzimmer. (2014). “Peer-to-Peer Carsharing:
Exploring Public Perception and Market Characteristics
in the San Francisco Bay Area, California.”
Transportation Research Record 2416: 27–36.
Available at: https://doi.org/10.3141/2416-04
Dill, Jennifer, Anais Mathez, Nathan McNeil, and
Steven Howland. (2015). “Who Uses Peer-to-Peer
Carsharing? An Early Exploration.” Report Number 15-
3881, TRB 94th Annual Meeting Compendium of
Papers.
Shaheen, Susan, Mark Mallery, and Karla Kingsley.
(2012). “Personal Vehicle Sharing Services in North
America.” Research in Transportation Business &
Management 3: 71–81. Available at:
https://doi.org/10.1016/j.rtbm.2012.04.005
Shaheen, Susan, Elliot Martin, and Apaar Bansal.
(2018). Peer-To-Peer (P2P) Carsharing:
Understanding Early Markets, Social Dynamics, and
Behavioral Impacts. Retrieved from UC Berkeley:
https://escholarship.org/uc/item/7s8207tb
Data Management, Integrated Fare Payment and Smartphone
Applications
Bailey, Charlie. (2018, October). Micromobility Data
Policies: A Survey of City Needs. Remix. Available at:
https://www.remix.com/policy-library
Cordahi, Gustave, Susan Shaheen, and Elliot Martin.
(2018, June). MOD Sandbox Demonstrations
Independent Evaluation (IE) Dallas Area Rapid Transit
(DART) – First and Last Mile Solution Evaluation Plan.
Report number: FHWA-JPO-18-677, Federal Highway
Administration (FHWA). Retrieved from the National
Transportation Library:
https://rosap.ntl.bts.gov/view/dot/36657
Cordahi, Gustave, Susan Shaheen, and Elliot Martin.
(2018, December). Mobility on Demand (MOD)
Sandbox Demonstrations Independent Evaluation (IE)
– Chicago Transit Authority (CTA) Integrated Fare
Systems From Transit Fare to Bike Share Project
Evaluation Plan. Report number: FHWA-JPO-18-696,
FHWA. Retrieved from the National Transportation
Library: https://rosap.ntl.bts.gov/view/dot/40262
National Association of City Transportation Officials
(NACTO), International Municipal Lawyers Association
(IMLA). (2019, May). Managing Mobility Data.
Retrieved from NACTO: https://nacto.org/wp-
content/uploads/2019/05/NACTO_IMLA_Managing-
Mobility-Data.pdf
National Academies of Sciences, Engineering, and
Medicine. (2017). Multiagency Electronic Fare
Payment Systems. Washington, DC: The National
Academies Press. Available at:
https://doi.org/10.17226/24733
Shaheen, Susan, Adam Cohen, Ismail Zohdy, and
Beaudry Kock. (2016). Smartphone Applications to
Influence Travel Choices: Practices and Policies.
Report number: FHWA-HOP-16-023, FHWA. Available
at:
http://www.ops.fhwa.dot.gov/publications/fhwahop16
023/fhwahop 16023.pdf
U.S. Department of Transportation
Office of the Assistant Secretary for Research and Technology
Intelligent Transportation Systems Joint Program Office
143
CHAPTER 8: Recommended Reading and Resources
Incorporating MOD into Planning and
Modeling
180330_Arthur_D.Little_&_UITP_Future_of_Mobility_
3_study.pdf
McCoy, Kevin, James Andrew, Russell Glynn, and
William Lyons. (2018, February). Integrating Shared
Mobility into Multimodal Transportation Planning:
Improving Regional Performance to Meet Public
Goals. Report number: FHWA-HEP-18-033, FHWA.
Retrieved from the National Transportation Library:
https://rosap.ntl.bts.gov/view/dot/34689
McCoy, Kevin, James Andrew, Russell Glynn, and
William Lyons. (2019, May). Integrating Shared
Mobility into Multimodal Transportation Planning:
Metropolitan Area Case Studies. Report number:
FHWA-HEP-19-036, FHWA. Retrieved from the
National Transportation Library:
https://rosap.ntl.bts.gov/view/dot/40582
Last-Mile Delivery
Elgart, Zachary, Kristi Miller, and Shuman Tan. (2019,
January). Last Mile Package Delivery via Rural Transit:
Project Summary and Pilot Outcomes. Retrieved from
Texas A&M Transportation Institute:
https://static.tti.tamu.edu/tti.tamu.edu/documents/0-
6891-R1.pdf
John A. Volpe National Transportation Systems
Center. (2018, May). Primer for Improved Urban
Freight Mobility and Delivery: Operations, Logistics,
and Technology Strategies. Report number: FHWA-
HOP-18-020, FHWA. Retrieved from the National
Transportation Library:
https://rosap.ntl.bts.gov/view/dot/37009
Supply Chain Transportation & Logistics Center.
(2018). The Final 50 Feet of the Urban Goods
Delivery System: Executive Summary. Retrieved from
University of Washington:
https://depts.washington.edu/sctlctr/sites/default/files
/SCTL_Final_50_ES.pdf
Mobility as a Service
A.D. Little. (2018, March). The Future of mobility 3.0:
Reinventing mobility in the era of disruption and
creativity. Retrieved from A.D. Little:
https://www.adlittle.com/futuremobilitylab/assets/file/
Laine, Anna, Tommi Lampikoski, Tuukka Rautiainen,
Marika Bröckl, Christian Bang, Nina Stokkendanl
Poulsen, and Anders Kofoed-Wiuff. (2018). Mobility as
a Service and Greener Transportation Systems in a
Nordic Context. Retrieved from Nordic Council of
Ministers: http://norden.diva-
portal.org/smash/get/diva2:1267951/FULLTEXT01.pdf
Mobility as a Service Alliance. (n.d.). “What is MaaS?”
Retrieved from MaaS Alliance: https://maas-
alliance.eu/homepage/what-is-maas/
National Center for Mobility Management. (2018,
March). Mobility as a Service: Concept and Practice.
Retrieved from NCMM:
https://nationalcenterformobilitymanagement.org/wp-
content/uploads/2018/03/2018_03_MaaS_Final.pdf
Sochor, Jana, Hans Arby, Marianne Karlsson, and
Steven Sarasini. (2018, June). “A topological approach to Mobility as a Service: A proposed tool for
understanding requirements and effects, and for
aiding the integration of societal goals.” Research in
Transportation & Business Management 27: 3-14.
Available at:
https://doi.org/10.1016/j.rtbm.2018.12.003
Mobility Hubs
Anderson, Karl, Samuel D. Blanchard, Derek Cheah,
and Drew Levitt. (2017, January 1). “Incorporating Equity and Resiliency in Municipal Transportation
Planning: Case Study of Mobility Hubs in Oakland,
CA.” Transportation Research Record 2653 (1): 65-
74. Available at: https://doi.org/10.3141/2653-08
San Diego County Association of Governments
(SANDAG). (2017, December 30). Mobility Hub
Features Catalog: Regional Mobility Hub
Implementation Strategy. Available at:
https://www.sdforward.com/fwddoc/mobipdfs/mobilit
yhubcatalog-features.pdf
Mobility on Demand
Klim, Terry, Anna Giragosian, Diane Newton, and
Elisabeth Bedsole. (2016, March). Integrated Corridor
U.S. Department of Transportation
Office of the Assistant Secretary for Research and Technology
Intelligent Transportation Systems Joint Program Office
144
CHAPTER 8: Recommended Reading and Resources
Management, Transit, and Mobility on Demand.
Report number: FHWA-HOP-16-036, FHWA. Retrieved
from FHWA:
https://ops.fhwa.dot.gov/publications/fhwahop16036/
fhwahop16036.pdf
McCoy, K., Andrew, J., Glynn, R., & Lyons, W. (2018).
Integrating Shared Mobility into Multimodal
Transportation Planning: Improving Regional
Performance to Meet Public Goals.
Shaheen, Susan, and Adam Cohen. (Forthcoming). “A
Seismic Shift in Transportation” in Shared Mobility and
Automated Vehicles. London: IET Books.
Shaheen, Susan, and Adam Cohen. (Forthcoming).
“Mobility on Demand in the United States: From
Operational Concepts and Definitions to Early Pilot
Projects and Future Automation” in Control and
Optimization Analytics for the Sharing Economy.
Springer, Cham.
Shaheen, Susan, Adam Cohen, Balaji Yelchuru, and
Sara Sarkhili. (2017, September). Mobility on Demand
Operational Concept Report. Report number: FHWA-
JPO-18-611, FHWA. Retrieved from the National
Transportation Library:
https://rosap.ntl.bts.gov/view/dot/34258
Shaheen, Susan, Bell, Corwin, Cohen, Adam, and
Yelchuru, Balaji (2017). Travel Behavior: Shared
Mobility and Transportation Equity. Report number:
FHWA-HOP-16-022, FHWA. Retrieved from:
https://www.fhwa.dot.gov/policy/otps/shared_use_m
obility_equity_final.pdf
Paratransit
Cervero, Robert. (1997, January 14). Paratransit in
America: Redefining Mass Transportation. Westport,
CT: Praeger.
Cordahi, Gustave, Susan Shaheen, and Elliot Martin.
(2018, October). Mobility on Demand (MOD) Sandbox
Demonstrations Independent Evaluation (IE)-Pinellas
Suncoast Transit Authority (PSTA)-Public Private-
Partnership for Paratransit Mobility on Demand
Demonstration (P4MOD) Evaluation Plan. Report
number: FHWA-JPO-18-68, FHWA. Retrieved from the
National Transportation Library:
https://rosap.ntl.bts.gov/view/dot/40259
Cordahi, Gustave, Susan Shaheen, and Elliot Martin.
(2018, August). Mobility on Demand (MOD) Sandbox
Demonstrations Independent Evaluation (IE) – Regional Transportation Authority (RTA) of Pima
County Adaptive Mobility With Reliability and
Efficiency (AMORE) Project Evaluation Plan. Report
number: FHWA-JPO-18-680, FHWA. Retrieved from
the National Transportation Library:
https://rosap.ntl.bts.gov/view/dot/37169
National Academies of Sciences, Engineering, and
Medicine. (2016). Use of Taxis in Public
Transportation for People with Disabilities and Older
Adults. Washington, DC: The National Academies
Press. https://doi.org/10.17226/24628
Vechione, Matthew, Corina Marrufo, Raul Alejandro
Vargas-Acosta, Maria Guadalupe Jimenez-Velasco,
Okan Gurbuz, Assel Dmitriyeva…Joseph Y. J. Chow. (2019, January 1). “Smart Mobility for Seniors: Challenges and Strategies in El Paso, TX and New
York, NY.” New York: Center for Connected Cities for
Smart Mobility towards Accessible and Resilient
Transportation. Retrieved from the National
Transportation Library:
https://rosap.ntl.bts.gov/view/dot/40268
Ridesharing (Carpooling and
Vanpooling)
Chan, Nelson, and Susan Shaheen. (2012).
“Ridesharing in North America: Past, Present, and Future.” Transport Reviews 32 (1): 93–112. Available
at: https://doi.org/10.1080/01441647.2011.621557
Deakin, Elizabeth, Karen Trapenberg Frick, and Kevin
Shivley. (2012). “Dynamic Ridesharing.” Access Magazine 40: 23–28. Available at:
http://www.accessmagazine.org/spring-
2012/dynamic-ridesharing/
Shaheen, Susan, and Adam Cohen. (2018). “Shared ride services in North America: definitions, impacts,
and the future of pooling.” Transport Reviews 39 (4):
427-442. Available at:
https://doi.org/10.1080/01441647.2018.1497728
U.S. Department of Transportation
Office of the Assistant Secretary for Research and Technology
Intelligent Transportation Systems Joint Program Office
145
CHAPTER 8: Recommended Reading and Resources
Shaheen, Susan, Adam Cohen, and Alexandre Bayen.
(2018, October). The Benefits of Carpooling.
Retrieved from UC Berkeley:
https://escholarship.org/uc/item/7jx6z631
Shared and Connected Automated
Vehicles
Crute, Jeremy, William Riggs, Timothy Chapin, and
Lindsay Stevens. (2018). Planning for Autonomous
Mobility. Chicago: American Planning Association.
Krechmer, Daniel, Katherine Blizzard, May Gin
Cheung, Robert Campbell, Vassili Alexiadis, Jason
Hyde, James Osborne, Mark Jensen, and Jason
Bitner. (2016, June). Connected Vehicle Impacts on
Transportation Planning – Primer and Final Report.
Retrieved from National Transportation Library:
https://rosap.ntl.bts.gov/view/dot/31397
McGuckin, Timothy, Julie Lambert, Diane Newton,
Adrian Pearmine, and Elliot Hubbard. (2017, January).
Leveraging the Promise of Connected and
Autonomous Vehicles to Improve Integrated Corridor
Management and Operations: A Primer. Report
number: FHWA-HOP-17-001, FHWA.
Retrieved from FHWA:
https://ops.fhwa.dot.gov/publications/fhwahop17001/
fhwahop17001.pdf
National Academies of Sciences, Engineering, and
Medicine. (2018). Updating Regional Transportation
Planning and Modeling Tools to Address Impacts of
Connected and Automated Vehicles Volume 1:
Executive Summary. Retrieved from Transportation
Review Board:
http://onlinepubs.trb.org/onlinepubs/nchrp/nchrp_rpt
_896v1.pdf
Stocker, Adam, and Susan Shaheen. (2019). “Shared Automated Vehicle (SAV) Pilots and Automated
Vehicle Policy in the U.S.: Current and Future
Developments.” In: Meyer G., Beiker S. (eds) Road
Vehicle Automation 5. Lecture Notes in Mobility.
Springer, Cham. Available at:
https://doi.org/10.1007/978-3-319-94896-6_12
Shared Micromobility
NACTO. (2019, September). “Guidelines for
Regulating Shared Micromobility.” Version 2.
Retrieved from NACTO: https://nacto.org/wp-
content/uploads/2019/09/NACTO_Shared_Micromobili
ty_Guidelines_Web.pdf
National League of Cities (NLC). (2019, April).
Micromobility in Cities: A History and Policy Overview.
Retrieved from NLC:
https://www.nlc.org/resource/micromobility-in-cities-
a-history-and-policy-overview
Shaheen, Susan, and Adam Cohen. (2019, April).
Shared Micromobility Policy Toolkit: Docked and
Dockless Bike and Scooter Sharing. Retrieved from UC
Berkeley: https://escholarship.org/uc/item/00k897b5
Transportation 4 America. (2019). Micromobility
Equity Toolkit. Retrieved from Transportation 4
America: https://playbook.t4america.org/equity/
The Sharing Economy, Shared
Mobility, and Millennials
Cohen, Adam and Susan Shaheen. (2016). Planning
for Shared Mobility. Chicago: American Planning
Association.
Gansky, Lisa. (2010). The Mesh: Why the Future Is
Sharing. New York: Portfolio.
Harris, Malcolm, and Neal Gorenflo. (2012). Share or
Die: Voices of the Get Lost Generation in the Age of
Crisis. Gabriola Island, British Columbia: New Society
Publishers.
Parker, Geoffrey G., Marshall W. Van Alstyne, and
Sangeet Paul Choudary. (2017). Platform Revolution.
New York: W. W. Norton & Company.
Shaheen, Susan, Adam Cohen, and Ismail Zohdy.
(2016). Shared Mobility: Current Practices and
Guiding Principles. Report number: FHWA-HOP-16-
022, FHWA. Available at:
https://ops.fhwa.dot.gov/publications/fhwahop16022/
fhwahop16022.pdf
U.S. Department of Transportation
Office of the Assistant Secretary for Research and Technology
Intelligent Transportation Systems Joint Program Office
146
CHAPTER 8: Recommended Reading and Resources
Shared and Digital Mobility Committee. (2018,
September 24). “Taxonomy and Definitions for Terms Related to Shared Mobility and Enabling
Technologies.” SAE International Standard: J3163_201809. Available at:
https://doi.org/10.4271/J3163_201809
Transit Cooperative Research Program. (2013).
Millennials and Mobility: Understanding the Millennial
Mindset and New Opportunities for Transit Providers.
Prepared by Neela Sakaria and Natalie Stehfest,
Latitude Research. Available at:
http://onlinepubs.trb.org/onlinepubs/tcrp/tcrp_w61.p
df
Transportation Research Board. (2016). Between
Public and Private Mobility: Examining the Rise of
Technology-Enabled Transportation Services.
Available at:
http://onlinepubs.trb.org/onlinepubs/sr/sr319.pdf
Standing Electric Scooter Sharing
Fang, Kevin, Asha Weinstein Agrawal, Jeremy Steele,
John J. Hunter, and Ashley M. Hooper. (2018). Where
Do Riders Park Dockless, Shared Electric Scooters?
San Jose: Mineta Transportation Institute. Available
at:
https://scholarworks.sjsu.edu/mti_publications/251/
Portland Bureau of Transportation (PBOT). (2018).
2018 E-Scooter Findings Report. Retrieved from
PBOT:
https://www.portlandoregon.gov/transportation/articl
e/709719
San Francisco Metropolitan Transportation Authority
(SFMTA). (2019, August). Powered Scooter Share
Mid-Pilot Evaluation. Retrieved from SFMTA:
https://www.sfmta.com/sites/default/files/reports-
and-
documents/2019/04/powered_scooter_share_mid-
pilot_evaluation_final.pdf
Trivedi, Tarak K., Charles Liu, Anna Liza M. Antonio,
Natasha Wheaton, Vanesa Kreger, Anna Yap…Joann G. Elmore. (2019, January 25). Injuries Associated
with Standing Electric Scooter Use. Journal of the
American Medical Association, 1-9. Retrieved from
JAMA Network:
https://jamanetwork.com/journals/jamanetworkopen/
fullarticle/2722574.
Transportation Network Companies (TNCs) and Taxis
City of Montreal Taxi Bureau. (2016). Study for a
Centralized Application for Taxis in Montréal. Prepared
by Matthew W. Daus, Sharon Klein, Salma Mallah,
Andrew Matera, Jason Mischel, and Brook Taye.
Windels Marx Lane & Mittendorf. Available at:
http://www.windelsmarx.com/resources/documents/S
tudy%20for%20a%20Centralized%20
Application%20for%20Taxis%20in%20Montreal%20-
%20 April%202016.pdf
Daus, Matthew W. (2016, August). The Expanding
Transportation Network Company “Equity Gap”: Adverse Impacts on Passengers with Disabilities,
Underserved Communities, the Environment & the
On-Demand Workforce. Retrieved from Who’s Driving
You: http://www.whosdrivingyou.org/wp-
content/uploads/2016/08/Equity-Report-FINAL-
11232642.pdf
Daus, Matthew W., and Jasmine K. Le Veaux. (2014).
The Disruptive Transportation Technology
Movement—A Litigation Primer and Roadmap.
Windels Marx Lane & Mittendorf. Available at:
http://www.windelsmarx.com/resources/documents/S
tudy%20for%20a%20Centralized%20Application%20
for%20Taxis%20in%20Montreal%20-
%20April%202016.pdf
Daus, Matthew W., and Jason R. Mischel. (2014).
“Accessible Transportation Reform: Transforming the Public Paratransit and Private For-Hire Ground
Transportation Systems.” The Transportation Lawyer
17 (2): 37–41. Available at:
http://www.beneschlaw.com/Files/Publication/0f84dd
11-9c46-4ccc-b1e9-
5fed7d22db70/Presentation/Publication
Attachment/603fac98-36e9-4b0f-a446-
6a63f40d74cf/TTL%20October%202015_Web.pdf
Daus, Matthew W., and Pasqualino Russo. (2015).
One Standard for All: Criminal Background Checks for
Taxicab, For-Hire, and Transportation Network
Company (TNC) Drivers. Available at:
U.S. Department of Transportation
Office of the Assistant Secretary for Research and Technology
Intelligent Transportation Systems Joint Program Office
147
CHAPTER 8: Recommended Reading and Resources
http://www.utrc2.org/sites/default/files/pubs/Backgro
und%20Check%20Report.pdf Urban Air Mobility
Mississauga, City of (Ontario). (2016). Study of
Regulations for Transportation Network Companies
(“TNCs”). Prepared by Windels Marx Lane & Mittendorf. Available at:
http://www.windelsmarx.com/resources/documents/U
pdated%20 Mississauga%20Report%20-
%20Transportation%20 Group%20(11187023).pdf
National Academies of Sciences, Engineering, and
Medicine. (2019). Partnerships Between Transit
Agencies and Transportation Network Companies.
Washington, DC: The National Academies Press.
Available at: https://doi.org/10.17226/25425
Rayle, Lisa, Danielle Dai, Nelson Chan, Robert
Cervero, and Susan Shaheen. (2016, January). “Just a better taxi? A survey-based comparison of taxis,
transit, and ridesourcing services in San Francisco.”
Transport Policy 45: 168-178. Available at:
https://doi.org/10.1016/j.tranpol.2015.10.004
Wells, Katie J., (2019). The Uber Workplace in D.C.
Retrieved from Georgetown University:
https://lwp.georgetown.edu/wp-
content/uploads/Uber-Workplace.pdf
Transportation Systems Management and Operations (TSMO)
Smith, Michael C., Jocelyn Bauer, Matthew Edelman,
and Nagham Matout. (2018, December).
Transportation Systems Management and Operations
in Smart and Connected Communities. Report
number: FHWA-HOP-19-004, FHWA. Retrieved from
FHWA:
https://ops.fhwa.dot.gov/publications/fhwahop19004/
fhwahop19004.pdf
FHWA. (2018, December). “Enhancing Transportation: Connecting TSMO and Planning.”
Retrieved from FHWA:
https://ops.fhwa.dot.gov/publications/fhwahop18096/
index.htm
Lascara, Brock, Thomas Spencer, Matthew DeGarmo,
Andrew Lacher, David Maroney, Michael Guterres.
(2018, April). Urban Air Mobility Landscape Report:
Initial Examination of a New Air Transportation
System. Retrieved from MITRE Corporation:
https://www.mitre.org/sites/default/files/publications/
pr-18-0154-4-urban-air-mobility-landscape-
report_0.pdf
Metcalfe, Matthew, Fernando, Chris, Shaheen, Susan,
Bonnefoy, Philippe, Serrao, Jacqueline, Thompson,
Robert, Kimmel, Shawn, McConachie, Dominic,
Reiche, Colleen, Hannick, John, Cohen, Adam, Goyal,
Rohit. (2018, November 21). Urban Air Mobility (UAM)
Market Study. Retrieved from National Aeronautics
and Space Administration (NASA):
https://ntrs.nasa.gov/archive/nasa/casi.ntrs.nasa.gov/
20190001472.pdf
Patterson, M. D., Antcliff, K. R., & Kohlman, L. W.
(2018). A Proposed Approach to Studying Urban Air
Mobility Missions Including an Initial Exploration of
Mission Requirements.
Reiche, Colleen, Rohit Goyal, Adam Cohen, Jacqueline
Serrao, Shawn Kimmel, Chris Fernando, and Susan
Shaheen. (2018). “Urban Air Mobility Market Study.”
National Aeronautics and Space Administration.
https://escholarship.org/uc/item/0fz0x1s2
Reiche, Colleen, Frank Brody, Christian McGillen, Joel
Siegel, and Adam Cohen. (2018). An Assessment of
the Potential Weather Barriers of Urban Air Mobility
(UAM). Retrieved from UC Berkeley:
https://escholarship.org/uc/item/2pc8b4wt
Serrao, Jacqueline, Sarah Nilsson, and Shawn
Kimmel. (2018). A Legal and Regulatory Assessment
for the Potential of Urban Air Mobility (UAM).
Retrieved from UC Berkeley:
https://escholarship.org/uc/item/49b8b9w0
Shaheen, Susan, Adam Cohen, and Emily Farrar.
(2018). The Potential Societal Barriers of Urban Air
Mobility (UAM). Retrieved from UC Berkeley:
https://escholarship.org/uc/item/7p69d2bg
U.S. Department of Transportation
Office of the Assistant Secretary for Research and Technology
Intelligent Transportation Systems Joint Program Office
148
CHAPTER 8: Recommended Reading and Resources
Thipphavong, David P., Rafael D. Apaza, Bryan E.
Barmore, Vernol Battiste, Barbara K. Burian, Quang V.
Dao…Savita A. Verma. (2018). “Urban Air Mobility Airspace Integration Concepts and Considerations.”
Retrieved from NASA:
https://ntrs.nasa.gov/archive/nasa/casi.ntrs.nasa.gov/
20180005218.pdf
Uber Elevate. (2016, October 27). Fast-Forwarding to
a Future of On-Demand Urban Air Transportation.
Retrieved from Uber:
https://www.uber.com/elevate.pdf
Vascik, P. D., & Hansman, R. J. (2018). Scaling
Constraints for Urban Air Mobility Operations: Air
Traffic Control, Ground Infrastructure, and
Noise. 2018 Aviation Technology, Integration, and
Operations Conference. Presented at the 2018
Aviation Technology, Integration, and Operations
Conference, Atlanta,
Georgia. https://doi.org/10.2514/6.2018-3849
Yedavalli, Pava, and Jessie Mooberry. (2018). An
Assessment of Public Perception of Urban Air Mobility
(UAM). Retrieved from Airbus:
https://storage.googleapis.com/blueprint/AirbusUTM_
Full_Community_PerceptionStudy.pdf
Academic and Non-Governmental
Organizations
3 Revolutions – https://3rev.ucdavis.edu
3 Revolutions Future of Mobility Program is the
innovative mobility research and policy outreach
division of University of California’s Institute of Transportation Studies at UC Davis. 3 Revolutions’
research activities includes analyzing and simulating
future transportation scenarios, developing forecasts
and simulation models to predict impacts of
innovative mobility, and analyzing environmental,
economic, and equity impacts of emerging
transportation trends.
Center for Advanced Multimodal Mobility
Strategies and Education at the University of
North Carolina Charlotte – https://cammse.uncc.edu
The Center for Advanced Multimodal Mobility
Strategies and Education is a transportation research
consortium of five major universities representing
North Carolina (University of North Carolina at
Charlotte), Texas (University of Texas at Austin and
Texas Southern University), Connecticut (University of
Connecticut), and Washington (Washington State
University – Pullman). Their research aims to support
economic development, reduce congestion, promote
safety and social equity, preserve the environment,
and significantly improve mobility of people and
goods while preserving the existing transportation
system.
Connected Cities for Smart Mobility toward
Accessible and Resilient Transportation
(C2SMART) at New York University – http://c2smart.engineering.nyu.edu
C2SMART, a research consortium consisting of New
York University, Rutgers, University of Washington,
University of Texas at El Paso, and The City College of
New York, partners with cities and state stakeholders
to pioneer innovative technological strategies to
pressing transportation problems, with the goal of
technology transfer from the research phase into the
real world. Areas of focus include connected and
autonomous vehicles, shared mobility, urban
analytics, and secure sharing of big data.
Eno Center for Transportation – www.enotrans.org
The Eno Center for Transportation is a neutral,
nonpartisan think tank promoting policy innovation
and providing professional development opportunities
to transportation professionals.
Frontier Group – www.frontiergroup.org
Frontier Group provides research and analysis to help
citizens address a range of issues, including fracking,
solar energy, global warming, transportation, and
clean water.
Innovative Mobility Research – http://innovativemobility.org
Innovative Mobility Research conducts research on
technology applications, behavioral response, and
U.S. Department of Transportation
Office of the Assistant Secretary for Research and Technology
Intelligent Transportation Systems Joint Program Office
149
CHAPTER 8: Recommended Reading and Resources
public policies that seek to expand and enhance
transportation choices, better manage demand for
transportation services, and improve the environment.
Institute for Transportation and Development
Policy – www.itdp.org
The Institute for Transportation and Development
Policy works with cities worldwide to develop
transport strategies that cut greenhouse gas
emissions, reduce poverty, and improve the quality of
urban life. The Institute has offices in Argentina,
Brazil, China, India, Indonesia, Mexico, and the
United States.
Living Cities – www.livingcities.org
Living Cities is a member organization of foundations
and financial institutions that works with leaders in
cities across the United States to improve the
economic well-being of low–income people.
Mineta Transportation Institute at San Jose
State University – http://transweb.sjsu.edu
The Mineta Transportation Institute conducts
research, develops education programs, and
facilitates information and technology transfer
focusing on multimodal surface transportation policy
and management issues.
Mobility21 National University Transportation
Center at Carnegie Mellon University – http://mobility21.cmu.edu
Mobility21 is a multi-disciplinary transportation
research collaboration among Carnegie Mellon
University, the University of Pennsylvania, the Ohio
State University, and the Community College of
Allegheny County. Mobility21’s primary mission is
research, with focus areas including innovative
transport technologies and analytical tools, assistive
technologies for people with disabilities, and
increasing access to quality transportation for
underserved communities. Pilot deployment and
technology transfer are goals for all their research
projects. Mobility21 also facilitates education and
workforce development and diversity initiatives.
Mobility Lab – http://mobilitylab.org
The Mobility Lab conducts research and provides best
practices guidance to advocates related to the
development of healthy, efficient, and sustainable
transportation options. One of Mobility Lab’s primary
goals is to measure the impacts of transportation
demand management services in Arlington County,
Virginia.
National Center for Mobility Management – http://nationalcenterformobilitymanagement.org
The National Center for Mobility Management helps
communities adopt transportation strategies that
increase mobility options and promote health,
economic development, and self-sufficiency. An
initiative of the United We Ride program, the Center
is supported through a cooperative agreement with
the Federal Transit Administration and operates
through a consortium between the American Public
Transportation Association, the Community
Transportation Association of America, and the Easter
Seals Transportation Group.
National Institute for Transportation and
Communities at Portland State University – https://nitc.trec.pdx.edu
The National Institute for Transportation and
Communities is a research partnership of the
University of Oregon, Oregon Institute of Technology,
University of Utah, University of Arizona, and
University of Texas at Arlington, led by Portland State
University. The Institute’s research is targeted
towards action by decisionmakers and seeks to
promote economic opportunity, improve health, and
reduce inequality by developing tools to enhance
data-driven decision making and optimize mobility for
all. The Institute develops education programs and
toolkits to produce a diverse, interdisciplinary
workforce at all levels and ages.
Natural Resources Defense Council – www.nrdc.org
The Natural Resources Defense Council is an
international environmental advocacy organization
with a staff of over 500 lawyers, scientists, and other
policy experts and more than two million members
U.S. Department of Transportation
Office of the Assistant Secretary for Research and Technology
Intelligent Transportation Systems Joint Program Office
150
CHAPTER 8: Recommended Reading and Resources
and online activists around the world working to
ensure the rights of all people to air, water, and the
wild.
PeopleForBikes – www.peopleforbikes.org
PeopleForBikes is a membership organization made
up of individual riders, businesses, community
leaders, and elected officials that works to promote
bicycling.
Shared-Use Mobility Center – http://sharedusemobilitycenter.org
The Shared-Use Mobility Center is a public-interest
partnership working to foster collaboration around
shared mobility and helping to connect the growing
industry with public transit agencies, cities, and
communities across the country.
Small Urban and Rural Transit Center at North
Dakota State University – https://www.surtc.org
The Small Urban and Rural Transit Center provides
transit stakeholders, users, providers, suppliers, and
agencies with research and workforce training
focused on public transportation, mobility, and
accessibility needs of small urban and rural locations
in the Upper Midwest.
Small Urban, Rural and Tribal Center on
Mobility at Montana State University –
https://westerntransportationinstitute.org/wti-
research-centers/small-urban-rural-and-tribal-center-
on-mobility-surtcom/
The Small Urban, Rural, and Tribal Center on Mobility
joins the Western Transportation Institute at Montana
State University, Upper Great Plains Transportation
Institute at North Dakota State University, and the
Urban and Regional Planning program at Eastern
Washington University into a single research
organization focused on enhancing mobility in small
urban, rural, and tribal communities. The organization
also provides leadership, education, workforce
development, and technology transfer on all
transportation-related aspects of mobility for people
and goods in the regions and communities it serves.
Sustainable Cities Institute at the University of
Oregon – https://sci.uoregon.edu
The Sustainable Cities Institute targets sustainability-
based research and education through applied
research, teaching, and community partnerships. The
Urbanism Next Center, a division of the Sustainable
Cities Institute, focuses on the role of autonomous
vehicles, e-commerce, and the sharing economy in
the future development of the form and function of
cities.
Transportation Research Board – www.trb.org
The Transportation Research Board (TRB) promotes
transportation innovation and progress through
research activities involving engineers, scientists,
researchers, and practitioners from the public and
private sectors and academia. TRB is one of seven
major programs of the National Research Council,
which is the principal operating agency of the
National Academies and is jointly administered by the
National Academy of Sciences, the National Academy
of Engineering, and the Institute of Medicine.
Transportation Sustainability Research Center
at the University of California, Berkeley – http://tsrc.berkeley.edu
The Transportation Sustainability Research Center
conducts analyses and evaluations to develop findings
and recommendations for key transportation issues of
interest to industry leaders and policy makers to aid
in decision making. The Center is part of the Institute
of Transportation Studies at the University of
California, Berkeley.
University of California Center on Economic
Competitiveness in Transportation – http://ucconnect.berkeley.edu
The University of California Center on Economic
Competitiveness in Transportation serves as the
University Transportation Center for federal Region 9,
supporting the faculty of its consortium of five
University of California campuses (Berkeley, Irvine,
Los Angeles, Riverside, and Santa Barbara) and its
affiliate, Cal Poly, Pomona. The Center pursues
research aligned with the broad theme of promoting
U.S. Department of Transportation
Office of the Assistant Secretary for Research and Technology
Intelligent Transportation Systems Joint Program Office
151
CHAPTER 8: Recommended Reading and Resources
economic competitiveness by enhancing multimodal
transport for California and the region.
United States Public Interest Research Group – www.uspirg.org
The United States Public Interest Research Group is a
consumer group focused on consumer health and
safety, financial security, and public participation.
Urban Mobility and Equity Center at Morgan
State University – https://www.morgan.edu/umec
The Urban Mobility and Equity Center is a three-
university research consortium including University of
Maryland and Virginia Tech, led by Morgan State
University. The Center’s research specialties include planning and operation for transit, paratransit, and
freight, economic planning for transportation, and
government promotion of connected and automated
vehicles. The Center provides educational programs
and community outreach to offer technical assistance
to communities and foster the next generation of
transportation professionals.
Industry and Public Sector
Associations
Aerospace Industries Association -
https://www.aia-aerospace.org/
Aerospace Industries Association (AIA) is a trade
association representing suppliers and manufacturers
in the aerospace industry. AIA has over 340 member
companies and strives to shape aerospace policy and
support national security efforts.
American Association of State Highway and
Transportation Officials – https://www.transportation.org
The American Association of State Highway and
Transportation Officials (AASHTO) represents highway
and transportation departments in the 50 states, the
District of Columbia, and Puerto Rico. AASHTO, a
nonprofit, nonpartisan association, represents all
transportation modes, including air, highways, public
transportation, active transportation, rail, and water.
Among its role as a supporter of an integrated
national transportation system, AASHTO issues
standards for the design and construction of highways
and bridges, materials, and many other technical
areas.
American Institute of Aeronautics and
Astronautics - https://www.aiaa.org/
The American Institute of Aeronautics and
Astronautics (AIAA) is a professional society that
represents experts in the field of aerospace
engineering. The AIAA is the U.S. representative on
the International Council of Aeronautical Sciences and
International Astronautical Federation and, since
2015, has over 30,000 members from 88 countries.
AIAA works towards fostering aerospace ingenuity
and collaboration.
American Planning Association –
https://www.planning.org
The American Planning Association (APA) represents
the nation’s urban planning professionals and organizes the American Institute of Certified Planners
(AICP) professional certification. A champion of the
development of vital communities around the world,
APA has 42,000 members from 100+ countries.
American Public Transportation Association – https://www.apta.com
The American Public Transportation Association
(APTA) represents a diverse membership of public
sector organizations, large and small private
companies that support bus and rail services
worldwide, government agencies, metropolitan
planning organizations, state departments of
transportation, academic institutions, and trade media
publishers. APTA serves members through public
advocacy, information sharing, and association-led
efforts to ensure that public transportation is available
and accessible in communities across the country.
Association for Commuter Transportation – http://actweb.org
The Association for Commuter Transportation (ACT) is
an international association and leading advocate for
commuter transportation and transportation demand
management policies. Members are served through
advocacy, education, and networking events.
U.S. Department of Transportation
Office of the Assistant Secretary for Research and Technology
Intelligent Transportation Systems Joint Program Office
152
CHAPTER 8: Recommended Reading and Resources
Association of Metropolitan Planning
Organizations – http://www.ampo.org
General Aviation Manufacturers Association – https://gama.aero
The Association of Metropolitan Planning
Organizations (AMPO), a nationwide nonprofit
membership organization established in 1994, serves
the needs and interests of transportation planning
agencies responsible for metropolitan regions. AMPO
offers its member MPOs technical assistance and
training, conferences and workshops, frequent and
informative print and electronic communications,
research, a forum for transportation policy
development and coalition building, and a variety of
other services.
CarSharing Association – http://carsharing.org
The CarSharing Association is a membership
organization that works to maximize the
environmental and social impacts of the carsharing
industry. Collectively, the Association represents more
than 4,000 shared vehicles and 125,000 drivers.
Community Transportation Association of
America – https://ctaa.org
The Community Transportation Association of America
(CTAA) is a membership organization that advocates
for access to safe, affordable, and reliable public
transportation for all Americans, regardless of age,
ability, geography, or income. CTAA has led a number
of federal grants in the public and community
transportation arena, offers informational resources,
and hosts an annual conference featuring learning
events and networking opportunities.
Community Air Mobility Initiative -
https://www.communityairmobility.org/
The Community Air Mobility Initiative (CAMI) is a
member organization that works to provide education
and resources on air mobility to the public,
decisionmakers, and the media. Member
organizations support the adoption of personal
aviation as a potential strategy to overcome
transportation challenges.
The General Aviation Manufacturers Association seeks
to foster and advance the general welfare, safety,
interests, and activities of the global aviation industry.
The Association serves a variety of advocacy roles,
promoting a better understanding of the aviation
industry and the important role the aviation industry
plays in economic growth and activity and in serving
the critical transportation needs of communities,
companies, and individuals worldwide.
Institute of Transportation Engineers – https://www.ite.org
The Institute of Transportation Engineers (ITE) is an
international membership association of more than
15,000 transportation professionals working in more
than 90 countries to promote mobility and safety for
all transportation system users. ITE fosters
professional development and career advancement
for its members, supports and encourages education,
develops technical resources including standards and
recommended practices, identifies necessary
research, and facilitates networking and the exchange
of professional information.
National Air Transportation Association –
https://www.nata.aero/
The National Air Transportation Association (NATA) is
a public policy group that represents the aviation
industry and aviation service companies to the federal
and local governments. NATA was founded in 1940
and now represents over 2,300 aviation businesses.
The goal of NATA is to empower its members to
manage safe and successful aviation businesses.
National Association of Counties –
https://www.naco.org
The National Association of Counties (NACO)
represents member county governments, with the
goal of uniting America’s 3,069 counties. NACO
provides collective advocacy on national policy,
educational outreach, research materials, sample
ordinances, model programs, free reports and policy
toolkits, data of all kinds, and informational resources.
U.S. Department of Transportation
Office of the Assistant Secretary for Research and Technology
Intelligent Transportation Systems Joint Program Office
153
CHAPTER 8: Recommended Reading and Resources
National Association of City Transportation
Officials – https://nacto.org
North American Bikeshare Association – http://nabsa.net
The National Association of City Transportation
Officials (NACTO) is an association of 68 major North
American cities and 11 transit agencies that seeks to
raise the state of practice for street design that
prioritizes transit and active transportation modes.
Through policy resources, design guides, trainings,
workshops, and networking events, NACTO empowers
cities and transportation officials to lead on
transportation policy at the local, state, and national
levels.
National Association of Development
Organizations – https://www.nado.org
The National Association of Development
Organizations (NADO) is a membership organization
for the nation’s regional development organizations, providing advocacy, education, research, and training.
NADO members work to elevate local and regional
quality of life by promoting economic and community
development across a variety of sectors, such as
disaster resilience, infrastructure, workforce
development, and transportation.
National League of Cities – https://www.nlc.org
The National League of Cities (NLC), representing
more than 2,000 member cities of all sizes from
across the United States, acts as a collective advocate
for the nation’s cities and their leaders. NLC hosts
educational events and provides learning and
networking events, opportunities for cost-saving
partnerships, as well as research, best practices, and
technical assistance for members.
The North American Bikeshare Association (NABSA) is
a member association of micromobility system
owners, managers, operators, and service vendors.
NABSA facilitates collaboration, sharing of experiences
and best practices, enhanced communication, and
guidance on the new and fast growing micromobility
industry.
Project for Public Spaces - https://www.pps.org/
The Project for Public Spaces (PPS) is a non-profit
organization that helps individuals and organizations
create and sustain public spaces that support a strong
community, including designs for pedestrians,
bicyclists, vehicles, and other transportation modes.
SAE International – https://www.sae.org
SAE International (initially established as Society of
Automobile Engineers) is a global association of more
than 128,000 engineers and technical experts in the
aerospace, automotive, and commercial-vehicle
industries. The organization focuses on voluntary
consensus standards development and advocating for
continuous professional development for engineers.
Vertical Flight Society - https://vtol.org/
The Vertical Flight Society, formerly the American
Helicopter Society, Inc., is an international technical
society for professionals working to advance vertical
flight technology. The Vertical Flight Society is
predominantly engineers and scientists who bring
together industry, academia, and government.
U.S. Department of Transportation
Office of the Assistant Secretary for Research and Technology
Intelligent Transportation Systems Joint Program Office
154
REFERENCES
REFERENCES
23 U.S. Code § 150—National goals and performance management measures. (n.d.). Retrieved July
17, 2019, from LII / Legal Information Institute website:
https://www.law.cornell.edu/uscode/text/23/150
AFL-CIO. (2019, March 11). Principles for the Transit Workforce in Automated Vehicle Legislation
and Regulations. Retrieved July 23, 2019, from Transportation Trades Department website:
https://ttd.org/policy/principles-for-the-transit-workforce-in-automated-vehicle-legislation-and-
regulations/
American Federation of Labor and Congress of Industrial Organizations (AFL-CIO) and the Canadian
Labour Congress (CLC). (2016). Abandoning Paratransit Service to Save It? Retrieved from
https://www.atu.org/atu-pdfs/fieldmobilization/ParatransitandTNCs.pdf
Albrecht, C. (2019, April 30). Washington State to Allow Delivery Robots on Sidewalks. Retrieved
August 8, 2019, from The Spoon website: https://thespoon.tech/washington-state-to-allow-delivery-
robots-on-sidewalks/
Alternative Fuels Data Center: Congestion Mitigation and Air Quality (CMAQ) Improvement Program.
(n.d.). Retrieved August 12, 2019, from Energy.gov website: https://afdc.energy.gov/laws/284
Alternative Fuels Data Center: Search Federal and State Laws and Incentives. (n.d.). Retrieved
August 12, 2019, from Energy.gov website: https://afdc.energy.gov/laws/search
Amazon. (2019). Amazon.com: Prime Air. Retrieved July 2, 2019, from
https://www.amazon.com/Amazon-Prime-Air/b?node=8037720011
Anderson, K., Blanchard, S. D., Cheah, D., and Levitt, D. (2017). Incorporating Equity and Resiliency
in Municipal Transportation Planning: Case Study of Mobility Hubs in Oakland, California.
Transportation Research Record: Journal of the Transportation Research Board, 2653(1), 65–74.
https://doi.org/10.3141/2653-08
Ashbaugh, S. (2003). An elected official’s guide to negotiating and costing labor contracts. Chicago,
IL: Government Finance Officers Association.
Atlanta Beltline. (2019). Atlanta BeltLine Overview. Retrieved August 26, 2019, from Atlanta Beltline
website: https://beltline.org/about/the-atlanta-beltline-project/atlanta-beltline-overview/
Automated Vehicles for Safety. (2017, September 7). Retrieved September 2, 2019, from NHTSA
website: https://www.nhtsa.gov/technology-innovation/automated-vehicles-safety
Autonomous Delivery Devices | Public Works. (n.d.). Retrieved August 13, 2019, from San Francisco
Public Works website: https://www.sfpublicworks.org/services/permits/autonomous-delivery-devices
U.S. Department of Transportation
Office of the Assistant Secretary for Research and Technology
Intelligent Transportation Systems Joint Program Office
155
REFERENCES
Autonomous Vehicles State Bill Tracking Database. (2019, June 24). Retrieved August 1, 2019, from
National Council of State Legislatures website:
http://www.ncsl.org/research/transportation/autonomous-vehicles-legislative-database.aspx
Bandoim, L. (2019, July 31). How Lightweight Robots Can Help Solve The Autonomous Last-Mile
Delivery Service Problem. Retrieved August 8, 2019, from Forbes website:
https://www.forbes.com/sites/lanabandoim/2019/07/31/how-lightweight-robots-can-help-solve-the-
autonomous-last-mile-delivery-service-problem/
Barber, R. J. (1964). Technological Change in American Transportation: The Role of Government
Action. In Virginia Law Review (Vol. 50, pp. 824–895). Virginia Law Review.
Barbour, L., Chatman, D. G., Doggett, S., Yip, S., and Santana, M. (2019). SB 743 implementation:
Challenges and Opportunities. Retrieved from UC Berkeley: Institute of Transportation Studies
website: https://escholarship.org/uc/item/4gj3n2n3
Barnett, B. (2018, October 2). Courier Network Services Survey. Retrieved July 23, 2019, from
SFMTA website: https://www.sfmta.com/blog/courier-network-services-survey
Bauer, J., Bedsole, L. K., Snyder, K., Neuner, M., and Smith, M. C. (2018). Expanding Traveler
Choices through the Use of Incentives: A Compendium of Examples (No. FHWA-HOP-18-071).
Retrieved from Federal Highway Administration website:
https://ops.fhwa.dot.gov/publications/fhwahop18071/fhwahop18071.pdf
Bauer, J., Platman, D., Grant, M., Smith, H., Ma, J., Martin, L., and Su, P. (2017). Planning for
Transportation Systems Management and Operations within Subareas. Retrieved from Federal
Highway Administration website: https://ops.fhwa.dot.gov/publications/fhwahop16074/ch3.htm
Bernhardt, A., and Thomason, S. (2017). What Do We Know About Gig Work in California? An
Analysis of Independent Contracting. Retrieved from UC Berkeley Center for Labor Research and
Education website: http://laborcenter.berkeley.edu/pdf/2017/What-Do-We-Know-About-Gig-Work-
in-California.pdf
Bialick, A. (2014, June). Are SFMTA’s Proposed Shuttle Stops Enough to End Muni Conflicts?
Retrieved August 16, 2019, from Streetsblog San Francisco website:
https://sf.streetsblog.org/2014/06/12/are-sfmtas-proposed-shuttle-stops-enough-to-end-muni-
conflicts/
BlueLA. (n.d.). Retrieved September 19, 2019, from BlueLA website: https://www.bluela.com/
Boarnet, M., Hsu, H., and Handy, S. (2014). Policy Brief on the Impacts of Employer-Based Trip
Reduction Based on a Review of the Empirical Literature (p. 8). Retrieved from California Air
Resources Board website: http://www.arb.ca.gov/cc/sb375/policies/ebtr/ebtr_brief.pdf
Booz Allen Hamilton. (2018, October). Executive Briefing: Urban Air Mobility Market Study.
Presented at the National Aeronautics and Space Administration - Aeronautics Research Mission
U.S. Department of Transportation
Office of the Assistant Secretary for Research and Technology
Intelligent Transportation Systems Joint Program Office
156
REFERENCES
Directorate. Retrieved from
https://www.nasa.gov/sites/default/files/atoms/files/bah_uam_executive_briefing_181005_tagged.p
df
Briggs, R. (2019, April). New “park anywhere” car-sharing service vying for a spot on Philly’s
jammed streets. Retrieved August 9, 2019, from PlanPhilly | New “park anywhere” car-sharing
service vying for a spot on Philly’s jammed streets website:
http://planphilly.com/articles/2019/04/25/new-park-anywhere-car-sharing-service-vying-for-a-spot-
on-philly-s-jammed-streets
Bringing Multi-Modal Trip Planning to the Columbus Region. (2019, September 4). Retrieved
September 26, 2019, from Smart Columbus website: https://smart.columbus.gov/playbook-
assets/multimodal-trip-planning---common-payment-system/bringing-multi-modal-trip-planning-to-
the-columbus-region
Brinklow, A. (2017, December 6). San Francisco bans robots from most sidewalks. Retrieved August
19, 2019, from Curbed SF website: https://sf.curbed.com/2017/12/6/16743326/san-francisco-
delivery-robot-ban
Broward Metropolitan Planning Organization. (2009). 2035 Broward Transformation Long Range
Transportation Plan. Retrieved from
http://www.browardmpo.org/images/WhatWeDo/LRTP/2035_Broward_Transformation_Long%20Ra
nge_Transportation_Plan_-_Amended_reduced.pdf
Bureau of Transportation Statistics. (2003, April). Transportation Energy Efficiency Trends in the
1990s. Retrieved August 20, 2019, from Bureau of Transportation Statistics website:
https://www.bts.gov/sites/bts.dot.gov/files/legacy/publications/special_reports_and_issue_briefs/iss
ue_briefs/number_02/pdf/entire.pdf
Burns, J. (2018, August 8). NYC Becomes First Major City To Limit Number of Uber And Lyft
Vehicles, Set Minimum Wage. Forbes. Retrieved from
https://www.forbes.com/sites/janetwburns/2018/08/08/nyc-becomes-first-major-city-to-limit-
number-of-uber-and-lyft-vehicles/#472466033dbf
Burris, M., and Winn, J. (2006). Slugging in Houston—Casual Carpool Passenger Characteristics.
Journal of Public Transportation, 9(5), 23–40. https://doi.org/10.5038/2375-0901.9.5.2
California Air Resources Board. (2019). Sustainable Communities Strategy Program and Evaluation
Guidelines. Retrieved from https://ww2.arb.ca.gov/sites/default/files/2019-
03/Draft_SCS_Evaluation_Guidelines_Report.pdf
California Senate. SB-375 Transportation planning: Travel demand models: Sustainable communities
strategy: Environment review. 375 §.
U.S. Department of Transportation
Office of the Assistant Secretary for Research and Technology
Intelligent Transportation Systems Joint Program Office
157
REFERENCES
Canepa, K., Hardman, S., and Tal, G. (2019). An early look at plug-in electric vehicle adoption in
disadvantaged communities in California. Transport Policy, 78, 19–30.
https://doi.org/10.1016/j.tranpol.2019.03.009
Carley, S., Zirogiannis, N., Siddiki, S., Duncan, D., and Graham, J. D. (2019). Overcoming the
shortcomings of U.S. plug-in electric vehicle policies. Renewable and Sustainable Energy Reviews, 1– 10, 109291. https://doi.org/10.1016/j.rser.2019.109291
Cervero, R., and Dai, D. (2014). BRT TOD: Leveraging transit oriented development with bus rapid
transit investments. Transport Policy, 36, 127–138. https://doi.org/10.1016/j.tranpol.2014.08.001
Chadwick, C. (2018, May). U.S. Transportation Department Selects San Diego as National
Unmanned Aircraft System Testing Partner. Retrieved July 11, 2019, from City of San Diego website:
https://www.sandiego.gov/mayor/news/releases/us-transportation-department-selects-san-diego-
national-unmanned-aircraft-system-testing
Chammas, K. (2019). Logistics in cities, the challenge of last-mile delivery. Retrieved July 25, 2019,
from AB European Real Estate website: https://www.ab-europeanrealestate.com/news/market-
commentary/last-mile-logistics/
Chan, N. D., and Shaheen, S. A. (2012). Ridesharing in North America: Past, Present, and Future.
Transport Reviews, 32(1), 93–112. https://doi.org/10.1080/01441647.2011.621557
Charge Ahead California. (2012). Electric Car-Sharing Programs in Underserved Communities.
Retrieved from http://greenlining.org/wp-content/ uploads/2014/12/Charge-Ahead-California_Car-
Sharing-v2.pdf
Choe, T., Garza, M., Rosenberger, S. A., and Woolfolk, J. (2017). The future of freight: How new
technology and new thinking can transform how goods are moved. Retrieved from
https://www2.deloitte.com/insights/us/en/focus/future-of-mobility/future-of-freight-simplifying-last-
mile-
logistics.html?id=us:2ps:3bi:confidence:eng:cons:102218:nonem:na:0WXA5Xlk:1124733138:775156
35339479:bb:RLSA_Future_of_Mobility:Freight_BMM:nb
City of Indianapolis. (2019). Consolidated Zoning/Subdivision Ordinance. Indianapolis, IN.
City of Seattle. (2017). Commute Trip Reduction Basic Information. Retrieved from
https://commuteseattle.com/wpcontent/ uploads/2017/03/CSToolkit_TBT_Ch1.pdf
City of Seattle. (2019). Taxicab Medallion Lottery—Business Regulations. Retrieved August 9, 2019,
from https://www.seattle.gov/business-regulations/taxis-for-hires-and-tncs/lottery
City of Vancouver. (2018, July 11). Density bonus zoning. Retrieved August 15, 2019, from
https://vancouver.ca/home-property-development/density-bonus-zoning.aspx
CIVITAS. (2015). Making urban freight logistics more sustainable. Civitas Policy Note, 1–63.
U.S. Department of Transportation
Office of the Assistant Secretary for Research and Technology
Intelligent Transportation Systems Joint Program Office
158
REFERENCES
Clabaugh, J. (2004, March 19). Arlington County to promote “car-sharing.” Washington Business
Journal.
Clabaugh, J. (2005, May 18). Flexcar, Zipcar add more Arlington cars. Washington Business Journal.
Clewlow, R. R. (2016). Carsharing and sustainable travel behavior: Results from the San Francisco
Bay Area. Transport Policy, 51, 158–164. https://doi.org/10.1016/j.tranpol.2016.01.013
Coconuts Singapore. (2019, November 8). Singapore announces S$7M fund to replace delivery
riders’ e-scooters. Retrieved November 8, 2019, from
https://coconuts.co/singapore/news/singapore-announces-s7m-fund-to-replace-delivery-riders-e-
scooters/?utm_source=Coconuts+Media+Mailing+Listandutm_campaign=fec6be2275-
EMAIL_CAMPAIGN_2019_08_29_10_19_COPY_01andutm_medium=emailandutm_term=0_c10d799
9ee-fec6be2275-81631945
Cohen, A., and Shaheen, S. (2016). Planning for Shared Mobility. Chicago, IL: American Planning
Association.
Colby, C., and Bell, K. (2016, April 14). The On-Demand Economy Is Growing, and Not Just for the
Young and Wealthy. Harvard Business Review. Retrieved from https://hbr.org/2016/04/the-on-
demand-economy-is-growing-and-not-just-for-the-young-and-wealthy
COTA launches new microtransit service. (2019, July 16). Retrieved July 23, 2019, from Metro
Magazine website: https://www.metro-magazine.com/mobility/news/734890/cota-launches-new-
microtransit-service
Cregger, J., Dawes, M., Fischer, S., Lowenthal, C., Machek, E., and Perlman, D. (2018). Low-Speed
Automated Shuttles: State of the Practice Final Report. Retrieved from the National Transportation
Library: https://rosap.ntl.bts.gov/view/dot/37060
Crowther, J. (n.d.). Accessible Scooter Share. Alta Planning.
CSCRS. (2019). Safe Systems. Retrieved August 22, 2019, from
https://www.roadsafety.unc.edu/about/safesystems/
Cuddy, M., Epstein, A., Maloney, C., Westrom, R., Hassol, J., Kim, A., Bettisworth, C. (2014). The
Smart/Connected City and Its Implications for Connected Transportation (No. FHWA-JPO-14-148).
Retrieved from U.S. Department of Transportation website:
https://www.its.dot.gov/itspac/Dec2014/Smart_Connected_City_FINAL_111314.pdf
D’Agostino, M., Pellaton, P., and Brown, A. (2019). Mobility Data Sharing: Challenges and Policy
Recommendations. Retrieved from University of California Davis: Policy Institute for Energy,
Environment and the Economy website: https://escholarship.org/uc/item/4gw8g9ms
U.S. Department of Transportation
Office of the Assistant Secretary for Research and Technology
Intelligent Transportation Systems Joint Program Office
159
REFERENCES
DatexCorp. (n.d.). What is Last Mile Delivery? Part 1: How Omnichannel Retail is Affecting
Transportation and Logistics. Retrieved from https://www.datexcorp.com/last-mile-delivery-part-1-
omni-channel-retail-affecting-transportation-logistics/
Daus, M. W. (2019). The Expanding Transportation Network Company “Equity Gap” (p. 73). New
York: Taxi and Limousine Commission.
Demographics of Mobile Device Ownership and Adoption in the United States. (n.d.). Retrieved
September 26, 2019, from Pew Research Center website: https://www.pewinternet.org/fact-
sheet/mobile/
Department of Energy. (2017). The Transforming Mobility Ecosystem: Enabling an Energy-Efficient
Future. Retrieved from
https://www.energy.gov/sites/prod/files/2017/01/f34/The%20Transforming%20Mobility%20Ecosyst
em%20Report.pdf
Department of Public Works. (2017, December). Autonomous Delivery Devices. Retrieved August 19,
2019, from San Francisco Public Works website:
https://www.sfpublicworks.org/services/permits/autonomous-delivery-devices
Department of Transportation. (2016, January 5). State DOT’s Responsibilities. Retrieved June 24, 2019, from U.S. Department of Transportation website: https://www.transportation.gov/civil-
rights/civil-rights-awareness-enforcement/state-dots-responsibilities
Department of Transportation and Public Works. (2019). Transit Development Plan. Miami-Dade
County, Florida. Retrieved from https://www.miamidade.gov/global/transportation/mdt-ahead.page
DePillis, L. (2019, July 15). The hidden cost of America’s addiction to fast shipping. Retrieved July
23, 2019, from https://www.msn.com/en-us/news/finance-companies/the-hidden-cost-of-americas-
addiction-to-fast-shipping/ar-AAElVJe
Descant, S. (2019, May 30). California DMV Considers Reworked Regs for AV Delivery Tests.
Retrieved August 30, 2019, from https://www.govtech.com/fs/automation/California-DMV-
Considers-Reworked-Regs-for-AV-Delivery-Tests.html
Deshais, N. (2019, March 7). Study Urges New Tech, Dynamic Pricing for City’s Parking. Retrieved September 12, 2019, from https://www.govtech.com/fs/Study-Urges-New-Tech-Dynamic-Pricing-
for-Citys-Parking.html
Desouza, K., and Smith, K. (2016). Big Data and Planning (PAS Report No. 585). Retrieved from
American Planning Association website: https://www.planning.org/publications/report/9116397/
Diamante, R. (2019, July 24). Austin City Council to Consider Incentives to Ride Public Transit.
Retrieved August 26, 2019, from https://spectrumlocalnews.com/tx/austin/news/2019/07/24/austin-
city-council-to-consider-incentives-to-ride-public-transit
U.S. Department of Transportation
Office of the Assistant Secretary for Research and Technology
Intelligent Transportation Systems Joint Program Office
160
REFERENCES
Dickey, M. R. (2019, March 19). Cities are getting more serious about micromobility data. Retrieved
August 13, 2019, from TechCrunch website: http://social.techcrunch.com/2019/03/19/cities-are-
getting-more-serious-about-micromobility-data/
Dorinson, D., Gay, D., Minett, P., and Shaheen, S. (2009). Flexible Carpooling: Exploratory Study.
Retrieved from UC Davis: Institute of Transportation Studies website:
https://escholarship.org/uc/item/5fk84617
Downey, L., Dubois, S., Hawkins, B., and Walker, M. (2008). Environmental Inequality in
Metropolitan America. Organization and Environment, 21(3), 270–294.
https://doi.org/10.1177/1086026608321327
Druehl, C. (2018, May 21). Drone Delivery: The Potential Impact on the Built Environment.
Retrieved August 30, 2019, from Real Estate Development Blog | George Mason University website:
http://business.gmu.edu/blog/realestate/2018/05/20/drone-delivery-potential-impact-built-
environment/
Dysart, J. (2018, December 4). The Drive Toward Self-Driving Food Delivery Vehicles. Retrieved
September 2, 2019, from Communications of the ACM website: https://cacm.acm.org/news/233168-
the-drive-toward-self-driving-food-delivery-vehicles/fulltext
Electric Vehicles: Stakeholder Solution Center. (n.d.). Retrieved September 10, 2019, from
Energy.gov website: https://www.energy.gov/eere/electricvehicles/electric-vehicles-stakeholder-
solution-center
Erhardt, G. D., Roy, S., Cooper, D., Sana, B., Chen, M., and Castiglione, J. (2019). Do transportation
network companies decrease or increase congestion? Science Advances, 5(5), eaau2670.
https://doi.org/10.1126/sciadv.aau2670
Espino, J. (2016). Electric Vehicles for All: An Equity Toolkit. Retrieved from Greenlining Institute
website: http://greenlining.org/publications-resources/electric-vehicles-for-all/
FAA Modernization and Reform Act of 2012. Pub. L. No. 112–95, 336 (2012).
Federal Aviation Administration. (2018a). UAS Integration Pilot Program. Retrieved July 10, 2019,
from United States Department of Transportation website:
https://www.faa.gov/uas/programs_partnerships/integration_pilot_program/
Federal Aviation Administration. (2018b, December). General Information. Retrieved July 11, 2019,
from U.S. Department of Transportation website:
https://www.faa.gov/about/initiatives/sas/135_certification/general_info/
Federal Aviation Administration. (2018c). Voluntary Airport Low Emissions Program (VALE) – Airports. Retrieved August 12, 2019, from https://www.faa.gov/airports/environmental/vale/
U.S. Department of Transportation
Office of the Assistant Secretary for Research and Technology
Intelligent Transportation Systems Joint Program Office
161
REFERENCES
Federal Aviation Administration. (2019a). UTM Pilot Program. Retrieved September 6, 2019, from
United States Department of Transportation website:
https://www.faa.gov/uas/research_development/traffic_management/utm_pilot_program/
Federal Aviation Administration. (2019b, April). Integration Pilot Program Lead Participants.
Retrieved July 11, 2019, from U.S. Department of Transportation website:
https://www.faa.gov/uas/programs_partnerships/integration_pilot_program/lead_participants/
Federal Aviation Administration. (2019c, June). Unmanned Aircraft Systems (UAS). Retrieved July
11, 2019, from U.S. Department of Transportation website: https://www.faa.gov/uas/
Federal Highway Administration. (2016, February). Advanced Transportation and Congestion
Management Technologies Deployment—FAST Act Fact Sheets. Retrieved July 11, 2019, from
https://www.fhwa.dot.gov/fastact/factsheets/advtranscongmgmtfs.cfm
Federal Highway Administration. (2017a, March). Commercial Loading Zone Management Program:
Washington, D.C. - FHWA Office of Operations. Retrieved August 1, 2019, from
https://ops.fhwa.dot.gov/publications/fhwahop17022/index.htm
Federal Highway Administration. (2017b, February 1). Performance Measurement Fundamentals— Operations Performance Measurement—FHWA Operations. Retrieved July 2, 2019, from
https://ops.fhwa.dot.gov/perf_measurement/fundamentals/index.htm
Federal Highway Administration. (2017c, June 28). TPM Regulations—TPM Implementation— Transportation Performance Management. Retrieved August 22, 2019, from
https://www.fhwa.dot.gov/tpm/about/regulations.cfm
Federal Highway Administration. (2018a). Primer for Improved Urban Freight Mobility and Deliver
Operations, Logistics, and Technology Strategies. Retrieved from
https://ops.fhwa.dot.gov/publications/fhwahop18020/index.htm
Federal Highway Administration. (2018b). Transit Oriented Development (TOD). Retrieved from
https://www.fhwa.dot.gov/ipd/pdfs/fact_sheets/program_value_cap_transit_oriented_development.
Federal Highway Administration. (2019a, February). Transportation Systems Management and
Operations (TSMO) Plans. Retrieved August 19, 2019, from
https://ops.fhwa.dot.gov/plan4ops/focus_areas/integrating/transportation_sys.htm
Federal Highway Administration. (2019b, December 11). What Is TPM? - TPM Implementation— Transportation Performance Management—Federal Highway Administration. Retrieved July 2, 2019,
from https://www.fhwa.dot.gov/tpm/about/tpm.cfm
Federal Highway Administration. (2020, January). FHWA’s Fostering Multimodal Connectivity Newsletter. Retrieved from
https://www.fhwa.dot.gov/livability/newsletter/january_2020/fhwahep20016.pdf
U.S. Department of Transportation
Office of the Assistant Secretary for Research and Technology
Intelligent Transportation Systems Joint Program Office
162
REFERENCES
Federal Highway Administration, and Federal Transit Administration. (n.d.). What Is a Regional
Transportation Planning Organization. Retrieved from
https://www.planning.dot.gov/documents/RTPO_factsheet_master.pdf
Federal Transit Administration. (2015a, November 10). Pilot Program for Transit-Oriented
Development Planning – Section 20005(b) [Text]. Retrieved July 18, 2019, from Federal Transit
Administration website: https://www.transit.dot.gov/TODPilot
Federal Transit Administration. (2015b, December 14). Public Involvement and Outreach [Text].
Retrieved July 11, 2019, from Federal Transit Administration website:
https://www.transit.dot.gov/regulations-and-guidance/transportation-planning/public-involvement-
outreach
Federal Transit Administration. (2016). FTA Drug and Alcohol Program Regulation Update. Retrieved
from
https://www.transit.dot.gov/sites/fta.dot.gov/files/FTA%20Drug%20and%20Alcohol%20Program%2
0Regulation%20Update%20Issue%2060.pdf
Federal Transit Administration. (2019, March). Metropolitan Planning Organization (MPO). Retrieved
June 24, 2019, from Federal Transit Administration website:
https://www.transit.dot.gov/regulations-and-guidance/transportation-planning/metropolitan-
planning-organization-mpo
Federal Transit Law. (2018, July 2). Retrieved from U.S. Department of Labor Office of Labor-
Management Standards website: https://www.dol.gov/olms/regs/compliance/compltransit.htm
Feigon, S. and Murphy, C. (2018). Broadening Understanding of the Interplay Between Public
Transit, Shared Mobility, and Personal Automobiles. https://doi.org/10.17226/24996
Finn, R. L., and Wright, D. (2012). Unmanned aircraft systems: Surveillance, ethics and privacy in
civil applications. Computer Law and Security Review, 28(2), 184–194.
https://doi.org/10.1016/j.clsr.2012.01.005
Fitzsimmons, E. G., and Randle, A. (2019, July 16). 6 Years Later, Citi Bike Comes to the Bronx.
(What Took So Long?). Retrieved from https://www.nytimes.com/2019/07/16/nyregion/citi-bike-
nyc-bronx.html
Forward Pinellas, and Pinellas Suncoast Transit Authority. (2019). Transportation Disadvantaged
Service Plan, 2017-2022 (p. 143). Retrieved from http://forwardpinellas.org/wp-
content/uploads/2017/10/TDSP-2017.pdf
Frey, W. (2012). Population Growth in Metro America since 1980: Putting the Volatile 2000s in
Perspective. Retrieved from https://www.brookings.edu/wp-
content/uploads/2016/06/0320_population_frey.pdf
U.S. Department of Transportation
Office of the Assistant Secretary for Research and Technology
Intelligent Transportation Systems Joint Program Office
163
REFERENCES
Ganzarski, R. (2017, July 18). Driverless vans, drones, and the next phase of automated deliveries.
Retrieved August 13, 2019, from VentureBeat website:
https://venturebeat.com/2017/07/18/driverless-vans-drones-and-the-next-phase-of-automated-
deliveries/
GAO. (2018). Public Transit Partnerships: Additional Information Needed to Clarify Data Reporting
and Share Best Practices (No. GAO-18-539). Retrieved from United States Government
Accountability Office website: https://www.gao.gov/assets/700/693518.pdf
GAO. (2019). Automated Trucking: Federal Agencies Should Take Additional Steps to Prepare for
Potential Workforce Effects (No. GAO-19-161). Retrieved from
https://www.gao.gov/assets/700/697353.pdf
GCN Staff (n.d.) GAO: Ride-sharing data needs more consistent reporting. Retrieved August 22,
2019, from GCN website: https://gcn.com/blogs/pulse/2018/07/gao-ride-sharing-data.aspx
Gehrke, S., Felix, A., and Reardon, T. (2018). Fare Choices: A Survey of Ride-Hailing Passengers in
Metro Boston. Boston, MA: Metro Area Planning Council. Retrieved from Metro Area Planning Council
website: http://www.mapc.org/wp-content/uploads/2018/02/Fare-Choices-MAPC.pdf
Gettman, D., Toppen, A., Hales, K., Voss, A., Engel, S., and El Azhari, D. (2017). Integrating
Emerging Data Sources into Operational Practice—Opportunities for Integration of Emerging Data
for Traffic Management and TMCs (No. FHWA-JPO-18-625). Retrieved from the National
Transportation Library: https://rosap.ntl.bts.gov/view/dot/34175
Gillespie, La. (2019, April). Kroger, Nuro debut driverless delivery in Houston. Retrieved August 19,
2019, from Houston Business Journal website:
https://www.bizjournals.com/houston/news/2019/04/16/photos-kroger-nuro-debut-driverless-
delivery-in.html
Glasco, J. (2018). Last Mile Delivery Solutions in Smart Cities and Communities. Retrieved from
https://hub.beesmart.city/solutions/en/smart-mobility/last-mile-delivery-solutions-in-smart-cities
Gould, W. (2017). The Future of the Gig Economy, Labor Law, and the Role of Unions: How Will
They Look Going Forward? (SSRN Scholarly Paper No. ID 3085038). Retrieved from Social Science
Research Network website: https://papers.ssrn.com/abstract=3085038
Greco, M. (2019, March 6). Labor Concerns Should Not Deter Deployment of AV Bus Tech. Retrieved
August 21, 2019, from https://www.metro-magazine.com/blogpost/733277/labor-concerns-should-
not-deter-deployment-of-av-bus-tech
GreenBiz Research Study. (2017). The Road to Sustainable Urban Logistics. Retrieved from
https://sustainability.ups.com/media/UPS_The_Road_to_Sustainable_Urban_Logistics.pdf
Gregory, J. (2018, December). Enhancing Transportation: Connecting TSMO and Planning. Retrieved
from https://ops.fhwa.dot.gov/publications/fhwahop18088/fhwahop18088.pdf
U.S. Department of Transportation
Office of the Assistant Secretary for Research and Technology
Intelligent Transportation Systems Joint Program Office
164
REFERENCES
Gurley, L. K. (2019, July 24). California Looks to Give Gig Workers Their Due. The New Republic.
Retrieved from https://newrepublic.com/article/154517/california-ab5-gig-workers-employees
Haag, M., and Hu, W. (2019, October 28). 1.5 Million Packages a Day: The Internet Brings Chaos to
N.Y. Streets. The New York Times. Retrieved from
https://www.nytimes.com/2019/10/27/nyregion/nyc-amazon-delivery.html
Hall, J., and Krueger, A. (2016). An Analysis of the Labor Market for Uber’s Driver-Partners in the
United States (No. w22843; p. w22843). https://doi.org/10.3386/w22843
Hampshire, R. C., Simek, C., Fabusuyi, T., and Chen, X. (2017). Measuring the Impact of an
Unanticipated Suspension of Ride-Sourcing in Austin, Texas. SSRN Electronic Journal.
https://doi.org/10.2139/ssrn.2977969
Hawkins, A. J. (2018a, January 30). Two ex-Google engineers built an entirely different kind of self-
driving car. Retrieved August 14, 2019, from The Verge website:
https://www.theverge.com/2018/1/30/16936548/nuro-self-driving-delivery-last-mile-google
Hawkins, A. J. (2018b, August 30). Scooters will return to San Francisco, but Bird and Lime aren’t invited. Retrieved August 16, 2019, from The Verge website:
https://www.theverge.com/2018/8/30/17800960/scooters-sf-permits-bird-lime-uber-lyft-scoot-skip
Hawkins, A. J. (2018c, December 5). Riding in Waymo One, the Google spinoff’s first self-driving taxi
service. Retrieved August 23, 2019, from The Verge website:
https://www.theverge.com/2018/12/5/18126103/waymo-one-self-driving-taxi-service-ride-safety-
alphabet-cost-app
HBS Digital Initiative. (2018). Blockchains Are a Bad Idea (James Mickens). Retrieved from
https://www.youtube.com/watch?v=15RTC22Z2xI
Help Net Security. Data privacy: A hot-button issue for Americans one year after GDPR. (2019, May
23). Retrieved August 7, 2019, from Help Net Security website:
https://www.helpnetsecurity.com/2019/05/23/american-gdpr-awareness/
Holley, P. (2019). Uber plans to start delivering fast food via drone this summer. Retrieved from
https://www.washingtonpost.com/technology/2019/06/13/uber-plans-start-delivering-mcdonalds-
hamburgers-by-drone-this-summer/?utm_term=.11981ff38ba6
Horowitz, A., Creasey, T., Pendyala, R., Chen, M., National Cooperative Highway Research Program,
Transportation Research Board, & National Academies of Sciences, Engineering, and Medicine.
(2014). Analytical Travel Forecasting Approaches for Project-Level Planning and Design.
https://doi.org/10.17226/22366
Holsenbeck, K. (2018, June). Everything you need to know about Amazon Locker. Retrieved July 24,
2019, from Amazon.com website: https://www.amazon.com/primeinsider/tips/amazon-locker-
qa.html
U.S. Department of Transportation
Office of the Assistant Secretary for Research and Technology
Intelligent Transportation Systems Joint Program Office
165
REFERENCES
Howell, A., Larco, N., Lewis, R., and Steckler, B. (2019). New Mobility in the Right-of-Way. Retrieved
from University of Oregon: Urbanism Next Center website: http://carbonneutralcities.org/wp-
content/uploads/2019/03/4.New-Mobility-in-the-Right-of-Way_March-2019.pdf
Hsu, J. (2019, February 19). Out of the Way, Human! Delivery Robots Want a Share of Your
Sidewalk. Retrieved September 2, 2019, from Scientific American website:
https://www.scientificamerican.com/article/out-of-the-way-human-delivery-robots-want-a-share-of-
your-sidewalk/
Hu, J. C. (2019, May 8). Delivery Bots Could Make Cities More Accessible for Everyone. Retrieved
September 2, 2019, from Slate Magazine website: https://slate.com/technology/2019/05/delivery-
bots-amazon-scout-accessibility.html
Hyatt, K. (2018, June). Waymo’s Phoenix, Ariz. Pilot program is a year old, so how is it going?
Retrieved August 23, 2019, from CNET website: https://www.cnet.com/roadshow/news/2018-
waymo-phoenix-arizona-self-driving-car-pilot-program-one-year/
Ivanov, B., Goodchild, A., and Eaves, C. (2019). Evidence-Based Methods for Cities to Actively
Manage the Final 50 Feet of the Urban Goods System to Gain Productivity. Retrieved from
http://www.trb.org/main/blurbs/179217.aspx
Jacksonville Transportation Authority. (2019). U2C System. Retrieved August 27, 2019, from
Ultimate Urban Circulator website: https://u2c.jtafla.com/system/
James, O. (2018, July 24). Uber and Lyft are lobbying states to prohibit local regulation. Retrieved
August 21, 2019, from Mobility Lab website: https://mobilitylab.org/2018/07/24/uber-and-lyft-are-
lobbying-states-to-prohibit-local-regulation/
Joerss, M., Schroder, J., Neujaus, F., Klink, C., and Mann, F. (2016). Parcel Delivery: The Future of
the Last Mile. Retrieved from McKinsey and Company website:
https://www.mckinsey.com/~/media/mckinsey/industries/travel%20transport%20and%20logistics/o
ur%20insights/how%20customer%20demands%20are%20reshaping%20last%20mile%20delivery/p
arcel_delivery_the_future_of_last_mile.ashx
Kennedy, E. J. (2017). Employed by an Algorithm: Labor Rights in the Gig Economy. Seattle
University Law Review, 40, 987–1037.
Keyes, D. (2017). The Future of Retail 2018: Delivery and Fulfillment.
Kimley-Horn, and IBI Group. (2019). Final Report: DRPT Statewide Integrated Mobility Initiative.
Retrieved from Virginia Department of Rail and Public Transportation website:
http://www.drpt.virginia.gov/media/2789/drpt-statewide-integrated-mobility-initiative-finalreport-
2019-05-16-1.pdf
U.S. Department of Transportation
Office of the Assistant Secretary for Research and Technology
Intelligent Transportation Systems Joint Program Office
166
REFERENCES
Klim, T., Giragosian, A., Newton, D., and Elisabeth, B. (2016). Integrated Corridor Management,
Transit, and Mobility on Demand. Retrieved from Federal Highway Administration website:
https://ops.fhwa.dot.gov/publications/fhwahop16036/fhwahop16036.pdf
Kneebone, E. (2016). Job Sprawl Revisited: The Changing Geography of Metropolitan Employment.
Korosec, K. (2018, December). Waymo launches self-driving car service Waymo One. Retrieved
August 23, 2019, from TechCrunch website: http://social.techcrunch.com/2018/12/05/waymo-
launches-self-driving-car-service-waymo-one/
KPS Global. (2019, May 13). Micro-Warehouses for Online Grocery Pickup: The Future of Click and
Collect. Retrieved January 9, 2020, from KPS Global website: https://kpsglobal.com/blog/micro-
warehouse/
Lempert, R. (2018). Supporting Carshare Vehicles in the City of Vancouver: North American Parking.
Retrieved from University of British Columbia website:
https://sustain.ubc.ca/sites/sustain.ubc.ca/files/GCS/2018_GCS/Reports/2018-
56b%20Supporting%20Carshare%20North%20American%20Parking%20Policies_Lempert.pdf
Los Angeles Metro. (2018). Office of Extraordinary Innovation. Retrieved September 1, 2019, from
Los Angeles Metro website: https://www.metro.net/projects/oei/
MacArthur, J., McNeil, N., Cummings, A., and Broach, J. (Forthcoming). Adaptive Bike Share:
Expanding Bike Share to People with Disabilities and Older Adults. Portland, OR: Transportation
Research and Education Center.
Marks, M. (Forthcoming). Robots in Space: Sharing Our World with Autonomous Delivery Vehicles.
We Robot.
Martin, E., and Shaheen, S. (2016). The Impacts of Car2go on Vehicle Ownership, Modal Shift,
Vehicle Miles Traveled, and Greenhouse Gas Emissions: An Analysis of Five North American Cities.
Retrieved from UC Berkeley, Transportation Sustainability Research Center website:
https://www.epa.gov/sites/production/files/2017-06/documents/05312017-martin.pdf
Martin, E., Shaheen, S. A., and Lidicker, J. (2010). Impact of Carsharing on Household Vehicle
Holdings: Results from North American Shared-Use Vehicle Survey. Transportation Research Record:
Journal of the Transportation Research Board, 2143(1), 150–158. https://doi.org/10.3141/2143-19
Matthews, K. (2019, August 15). Six drone delivery use cases and lessons for companies to use.
Retrieved August 30, 2019, from FreightWaves website: https://www.freightwaves.com/news/six-
drone-delivery-use-cases-and-lessons-for-companies-to-use
McCoy, K., Andrew, J., Glynn, R., and Lyons, W. (2018). Integrating Shared Mobility into Multimodal
Transportation Planning: Improving Regional Performance to Meet Public Goals. Federal Highway
Administration. Retrieved from the National Transportation Library:
https://rosap.ntl.bts.gov/view/dot/34689
U.S. Department of Transportation
Office of the Assistant Secretary for Research and Technology
Intelligent Transportation Systems Joint Program Office
167
REFERENCES
McCoy, K., Glynn, R., Lyons, W., and Andrew, J. (2019). Integrating Shared Mobility into Multimodal
Transportation Planning: Metropolitan Area Case Studies. Washington, D.C.: Federal Highway
Administration. Retrieved from the National Transportation Library:
https://rosap.ntl.bts.gov/view/dot/40582
Miller, C. C. (2014, November 12). Americans Say They Want Privacy, but Act as if They Don’t—The
New York Times. Retrieved August 7, 2019, from The New York Times website:
https://www.nytimes.com/2014/11/13/upshot/americans-say-they-want-privacy-but-act-as-if-they-
dont.html?smid=fb-
nytimesandsmtyp=curandbicmp=ADandbicmlukp=WT.mc_idandbicmst=1409232722000andbicmet=
1419773522000and_r=1andabt=0002andabg=0
Miller, M. A., Englisher, L., Kaplan, B., and Halvorsen, R. (2005). Transit Service Integration
Practices: A Survey of U.S. Experiences. Transportation Research Record: Journal of the
Transportation Research Board, 1927(1), 101–111. https://doi.org/10.1177/0361198105192700112
Murphy, S. F. and C., Transit Cooperative Research Program, Transportation Research Board, and
National Academies of Sciences, Engineering, and Medicine. (2016). Shared Mobility and the
Transformation of Public Transit. https://doi.org/10.17226/23578
National Academies of Sciences, Engineering, and Medicine. (2019). Partnerships Between Transit
Agencies and Transportation Network Companies (2019). Washington, DC: The National Academies
Press. https://doi.org/10.17226/25425
National Association of City Transportation Officials. (2018, December 31). Shared Micromobility in
the U.S.: 2018. Retrieved July 24, 2019, from https://nacto.org/shared-micromobility-2018/
National Association of City Transportation Officials, and International Municipal Lawyers
Association. (2019). NACTO Policy 2019: Managing Mobility Data. Retrieved from
https://nacto.org/wp-content/uploads/2019/05/NACTO_IMLA_Managing-Mobility-Data.pdf
New York City DOT. (2013). NYC Bikeshare. Retrieved from
https://www1.nyc.gov/html/dot/downloads/pdf/bike-share-outreach-report.pdf
North Central Texas Council of Governments. (2013). Congestion Management Process.
Office of the Inspector General. (2018). Summary Report: Public Perception of Delivery Robots in
the United States. (RARC Report No. RARC-WP-18-005; p. 35). Retrieved from United States Postal
Service website: https://www.oversight.gov/sites/default/files/oig-reports/RARC-WP-18-005.pdf
Pinellas Suncoast Transit Authority. (2019). Direct Connect. Retrieved July 1, 2019, from PSTA
website: https://www.psta.net/riding-psta/direct-connect/
Pinto, M., Smith, R., and Tung, I. (2019, March 25). Rights at Risk: Gig Companies’ Campaign to
Upend Employment as We Know It—National Employment Law Project. Retrieved August 21, 2019,
U.S. Department of Transportation
Office of the Assistant Secretary for Research and Technology
Intelligent Transportation Systems Joint Program Office
168
REFERENCES
from National Employment Law Project website: https://www.nelp.org/publication/rights-at-risk-gig-
companies-campaign-to-upend-employment-as-we-know-it/
Platt, B. L., Bunten, D., and Hearey, O. (2013). Urbanization in the United States, 1800-2000.
Cambridge, MA: National Bureau of Economic Research.
Rajbhandari, R. (2018). Exploring Blockchain – Technology behind Bitcoin and Implications for
Transforming Transportation (No. PRC 17-13 F). Retrieved from the National Transportation Library
website: https://rosap.ntl.bts.gov/view/dot/34863
Rea, B., Stachura, S., Wallace, L., and Pankratz, D. (2017). Making the future of mobility work.
Deloitte Review, (21), 182–199.
Rebel Transit and Ticketing B.V., and DB Engineering and Consulting USA Inc. (2019, August 8).
Cal-ITP Market Sounding. CalTrans. Retrieved from https://dot.ca.gov/-/media/dot-
media/documents/cal-itp/cal-itp-market-sounding-info-document-a11y.pdf
Redman, R. (2019, April 17). Kroger begins autonomous grocery delivery in Houston. Retrieved
August 9, 2019, from Supermarket News website: https://www.supermarketnews.com/online-
retail/kroger-begins-autonomous-grocery-delivery-houston
Regional Transportation District. (2019). RTD | Mobile Apps. Retrieved September 2, 2019, from
RTD website: http://www.rtd-denver.com/mobile.shtml
Rich, S. (2013, October). Dallas Agencies Launch Mobile Ticketing App. Government Technology.
Retrieved from https://www.govtech.com/local/Dallas-Transit-Agencies-Launch-Mobile-Ticketing-
App.html
Roberts, T. (2012, February 14). The problem with Open Data. Retrieved August 2, 2019, from
ComputerWeekly.com website: https://www.computerweekly.com/opinion/The-problem-with-Open-
Data
SAE International. (2019). Levels of Automation J3016.
San Francisco Country Transportation Authority. (n.d.). SF-CHAMP Modeling. Retrieved July 16,
2019, from https://www.sfcta.org/sf-champ-modeling
San Francisco County Transportation Authority. (2018). Emerging Mobility Evaluation Report.
Retrieved from
https://archive.sfcta.org/sites/default/files/Emerging%20Mobility%20Evaluation%20Report%200424
2018.pdf
SANDAG. (2017). Mobility Hub Features Catalog. Retrieved from
https://www.sdforward.com/fwddoc/mobipdfs/mobilityhubcatalog-features.pdf
U.S. Department of Transportation
Office of the Assistant Secretary for Research and Technology
Intelligent Transportation Systems Joint Program Office
169
REFERENCES
Schrock, S. (2018, June 20). City of Arlington Invites Companies to Test Robotic Sidewalk Delivery
Technology. Retrieved August 8, 2019, from City of Arlington, Texas website:
https://www.arlingtontx.gov/news/my_arlington_t_x/news_archive/2018_archived_news/june_2018
/city_of_arlington_invites_companies_to_test
Seattle Department of Transportation. (2017). Commute Trip Reduction Alternate Plan: 4 Year
Report. Retrieved from
https://www.seattle.gov/Documents/Departments/SDOT/TransportationOptionsProgram/Seattle_4yr
PilotEval_final.pdf
Seattle Department of Transportation. (2018). Free-Floating Bike Share Program Permit
Requirements. Seattle.
SFMTA. (2017). On-Street Car Sharing Pilot Program. San Francisco, CA.
Shaheen, S. A., Cohen, A. P., and Martin, E. (2010). Carsharing Parking Policy: Review of North
American Practices and San Francisco, California, Bay Area Case Study. Transportation Research
Record: Journal of the Transportation Research Board, 2187(1), 146–156.
https://doi.org/10.3141/2187-19
Shaheen, S., Bell, C., Cohen, A., and Yelchuru, B. (2017). Travel Behavior: Shared Mobility and
Transportation Equity. Washington, DC: FHWA. Retrieved from:
https://www.fhwa.dot.gov/policy/otps/shared_use_mobility_equity_final.pdf
Shaheen, S., and Cohen, A. (Forthcoming). Transportation Network Companies (TNCs) and the
Future of Public Transportation. In Encyclopedia of Transportation. SAGE Publications, Inc.
Shaheen, S., and Cohen, A. (2017, December 15). Impacts of Shared Mobility and Transportation
Demand Management: Move Forward – In-depth international coverage of future trends in mobility.
Retrieved July 25, 2019, from Move Forward website: https://medium.com/move-forward-
blog/impacts-of-shared-mobility-and-transportation-demand-management-cde9ec19eae8
Shaheen, S., and Cohen, A. (2018a). Is It Time for a Public Transit Renaissance? Journal of Public
Transportation, 21(1), 67–81.
Shaheen, S., and Cohen, A. (2018b, December). Seven Goods Delivery Innovations: Transforming
Transportation and Consumer Behavior. Retrieved from https://medium.com/move-forward-
blog/seven-goods-delivery-innovations-transforming-transportation-consumer-behavior-
e81799197cf5
Shaheen, S., and Cohen, A. (2018c, December 20). Convergence of Sharing and Automation: Need
for Proactive Public Policy and Research Understanding. Retrieved July 26, 2019, from Move Forward
website: https://medium.com/move-forward-blog/convergence-of-sharing-and-automation-need-for-
proactive-public-policy-and-research-understanding-b172680c4f50
U.S. Department of Transportation
Office of the Assistant Secretary for Research and Technology
Intelligent Transportation Systems Joint Program Office
170
REFERENCES
Shaheen, S., and Cohen, A. (2019a). Mobility on Demand in the United States: From Operational
Concepts and Definitions to Early Pilot Projects and Future Automation. In Control and Optimization
Analytics for the Sharing Economy.
Shaheen, S., and Cohen, A. (2019b). Shared Micromobility Policy Toolkit: Docked and Dockless Bike
and Scooter Sharing. Berkeley, CA: University of California.
Shaheen, S., and Cohen, A. (2019c). Shared ride services in North America: Definitions, impacts,
and the future of pooling. Transport Reviews, 39(4), 427–442.
https://doi.org/10.1080/01441647.2018.1497728
Shaheen, S., Cohen, A., and Bayen, A. (2018). The Benefits of Carpooling.
https://doi.org/10.7922/G2DZ06GF
Shaheen, S., Stocker, A., Lazarus, J., and Bhattacharyya, A. (2016). RideKC: Bridj Pilot Evaluation:
Impact, Operational, and Institutional Analysis. 67.
Shaheen, S., Cohen, A., Dowd, M., and Davis, R. (2019). A Framework for Integrating
Transportation into Smart Cities. San Jose: Mineta Transportation Institute. Retrieved from:
https://transweb.sjsu.edu/sites/default/files/1705-Shaheen-Framework-Transportation-Smart-
Cities.pdf
Shaheen, S., Cohen, A., Yelchuru, B., and Sarkhili, S. (2017). Mobility on Demand: Operational
Concept Report (No. FHWA-JPO-18-611). Retrieved from http://innovativemobility.org/wp-
content/uploads/2015/02/Robert-Sheehan-Mobility-on-Demand.pdf
Shaheen, S., Cohen, A., and Zohdy, I. (2016). Shared Mobility: Current Practices and Guiding
Principles. Washington, DC: FHWA. Retrieved from:
https://ops.fhwa.dot.gov/publications/fhwahop16022/fhwahop16022.pdf
Shaheen, S., Cohen, A., Zohdy, I., and Kock, B. (2016). Smartphone Applications To Influence
Travel Choices Practices and Policies. Washington, DC: FHWA. Retrieved from:
https://ops.fhwa.dot.gov/publications/fhwahop16023/fhwahop16023.pdf
Shaheen, S., Totte, H., and Stocker, A. (2018). Future of Mobility White Paper. Retrieved from UC
Berkeley: Institute of Transportation Studies website:
https://escholarship.org/uc/item/68g2h1qv#author
Shared-Use Mobility Center. (2019). Objective-Driven Data Sharing for Transit Agencies in Mobility
Partnerships: Executive Summary. Retrieved from Shared-Use Mobility Center website:
https://learn.sharedusemobilitycenter.org/overview/white-paper-objective-driven-data-sharing-for-
transit-agencies-in-mobility-partnerships/
Smith, M., Bauer, J., Edelman, M., and Matout, N. (2018). Transportation Systems Management and
Operations (TSMO) in Smart Connected Communities. Virginia: Federal Highway Administration.
Retrieved from https://ops.fhwa.dot.gov/publications/fhwahop19004/index.htm
U.S. Department of Transportation
Office of the Assistant Secretary for Research and Technology
Intelligent Transportation Systems Joint Program Office
171
REFERENCES
Stern, R. (2018, May 4). Nuro of California Plans to Test Self-Driving Delivery Vehicles in Arizona.
Retrieved August 30, 2019, from Phoenix New Times website:
https://www.phoenixnewtimes.com/news/nuro-self-driving-delivery-vehicles-no-backup-drivers-
arizona-10386457
Stocker, A., Nelms, A., and Shaheen, S. (Forthcoming). Policy and Regulatory Environment: Shared
Automated Vehicles.
Stocker, A., and Shaheen, S. (2017, July). Shared Automated Vehicles: Review of Business Models.
Retrieved from https://www.itf-oecd.org/sites/default/files/docs/shared-automated-vehicles-
business-models.pdf
Stocker, A., and Shaheen, S. (2019). Shared Automated Vehicle (SAV) Pilots and Automated Vehicle
Policy in the U.S.: Current and Future Developments. In G. Meyer and S. Beiker (Eds.), Road Vehicle
Automation 5 (pp. 131–147). https://doi.org/10.1007/978-3-319-94896-6_12
Teal, R. F. (1987). Carpooling: Who, how and why. Transportation Research Part A: General, 21(3),
203–214. https://doi.org/10.1016/0191-2607(87)90014-8
The National Transit Database (NTD). (2018, October 4). Retrieved August 2, 2019, from Federal
Transit Administration website: https://www.transit.dot.gov/ntd
TNCs divert riders from public transit, cost MBTA $20 million: Study. (2019, July 23). Retrieved July
23, 2019, from Metro Magazine website: https://www.metro-
magazine.com/mobility/news/734969/tncs-divert-riders-from-public-transit-cost-mbta-20-million-
study
Top Benefits of Big Data in the Transportation Industry. (2018, September 14). Retrieved June 26,
2019, from Business wire website:
https://www.businesswire.com/news/home/20180914005108/en/Top-Benefits-Big-Data-
Transportation-Industry-%E2%80%93
Transparency. (n.d.). Retrieved August 22, 2019, from City of Las Vegas, Nevada website:
https://lasvegasnevada.gov/Government/Transparency
United States Federal Government. Small Unmanned Aircraft Systems. Pub. L. No. 107, § Part 107— Small Unmanned Aircraft Systems, 107.3 Electronic Code of Federal Regulations.
United States Postal Service. (2014, March). Opportunities for the Postal Service—Micro-
Warehousing and Other Logistics Support Services. Retrieved from
https://www.oversight.gov/sites/default/files/oig-reports/ms-wp-14-003_0_0_1.pdf
Urban Infrastructure Lab. (2018). Transportation Data Collaborative. Washington: University of
Washington.
U.S. Department of Transportation
Office of the Assistant Secretary for Research and Technology
Intelligent Transportation Systems Joint Program Office
172
REFERENCES
U.S. Census Bureau. (2017). Sex of workers by means of transportation to work. American
community survey 1-year estimates, table B08006. Retrieved from U.S. Department of Commerce
website: https://factfinder.census.gov/faces/tableservices/jsf/pages/productview.xhtml?src=bkmk
U.S. Department of Transportation. (2018, January 29). Our Administrations. Retrieved June 24,
2019, from Transportation.gov website: https://www.transportation.gov/administrations
U.S. Department of Transportation. (2019). Automated Vehicles 3.0 Preparing for the Future of
Transportation. Retrieved from U.S. Department of Transportation website:
https://www.transportation.gov/sites/dot.gov/files/docs/policy-initiatives/automated-
vehicles/320711/preparing-future-transportation-automated-vehicle-30.pdf
U.S. Department of Transportation, Bureau of Transportation Statistics. (2018). Transportation
Statistics Annual Report 2018. Retrieved from
https://www.bts.dot.gov/sites/bts.dot.gov/files/docs/browse-statistical-products-and-
data/transportation-statistics-annual-reports/Preliminary-TSAR-Full-2018-a.pdf
USDOT Secure Data Commons. (n.d.). Retrieved from U.S. Department of Transportation website:
https://its.dot.gov/data/secure
Valinsky, J. (2019, October 29). Amazon makes grocery delivery free for Prime members. CNN.
Retrieved from https://www.cnn.com/2019/10/29/business/amazon-fresh-grocery-delivery-
free/index.html
Waze. (2018). Waze Connected Citizens Overview Packet. Waze.
Waze. (2019). Harnessing real-time, crowdsourced data to improve crisis response. Retrieved
August 28, 2019, from Waze Connected Citizens website:
https://www.waze.com/ccp/casestudies/harnessing_real_time_crowdsourced_data_to_improve_crisi
s_response
Waze. (n.d.) Free Driving Directions, Traffic Reports and GPS Navigation App. Retrieved August 22,
2019, from https://www.waze.com/forms/ccp
Wells, K. J., Attoh, K., and Cullen, D. (2019). The Uber Workplace in D.C. Washington, D.C.:
Georgetown University. Retrieved from https://lwp.georgetown.edu/wp-content/uploads/Uber-
Workplace.pdf
Wills, L. (2018, March 6). Testing of First Autonomous Shuttle on Public Roads in California Begins.
Retrieved from https://easymile.com/wp-content/uploads/2019/02/2018.03.06-Press_Release.pdf
Wong, S., and Shaheen, S. (2019). Current State of the Sharing Economy and Evacuations: Lessons
from California. Berkeley, CA: ITS.
WSP. (2019). Transportation Systems Management and Operations Program Planning.
U.S. Department of Transportation
Office of the Assistant Secretary for Research and Technology
Intelligent Transportation Systems Joint Program Office
173
REFERENCES
U.S. Department of Transportation
Office of the Assistant Secretary for Research and Technology 174Intelligent Transportation Systems Joint Program Office