comparative risk assessment at isla del carmen and cancun, mexico
TRANSCRIPT

1
COMPARATIVE RISK ASSESSMENT AT ISLA DEL CARMEN AND CANCUN, MEXICO
Mireille Escudero1, Edgar Mendoza1, Rodolfo Silva1 and Monique Villatoro1
Tropical cyclones and Cold-Fronts lead to storm surge and wave hazards annually in the coastal zones of the Gulf of Mexico and Caribbean Sea. Anthropogenic intervention over a wide extension of these coasts has affected their natural equilibrium and resilience to these extreme natural phenomena. An integrated risk analysis is presented here, which aims to prevent or reduce serious beach erosion damage and inundation of settlements next to these beaches. Two important coastal lagoon barriers in Mexico were selected to develop the risk assessment methodology: Isla del Carmen, on the Gulf of Mexico; and Cancun, on the Caribbean coast. While both are important for socio-economic and ecological reasons, the contrast between the high-poverty zones in Isla del Carmen and the luxurious tourist development of Cancun facilitates the integration of a common vulnerability approach, which can be applicable to any other location affected by similar hazards. This paper proposes a methodology to evaluate the socioeconomic risk of inundation; integrating the SPRC concept and the spatial variability of the risk, focusing on the parameters related to the resilience of the receptors and intangible indirect losses.
Keywords: inundation hazard; socioeconomic vulnerability; integrated risk assessment approach
INTRODUCTION The risk of inundation in the presence of storms is becoming a serious threat to communities
settled on lagoon barrier islands in Mexico. The annual passage of very strong winds of polar origin (from October to February principally) and tropical cyclones (during the summer and autumn seasons) generates high waves and damaging storm surge. Breaching, overtopping and overwash processes occasionally take place, which in turn produce flooding in settlements next to the beaches and sometimes even flow exchanges between the sea and the lagoons.
The risk analysis presented here looks at two ecologically valuable areas: Isla del Carmen and the beach system of Cancun, both of which are barrier island-lagoon systems affected by these natural phenomena. Isla del Carmen is a low lying island, separating Terminos Lagoon from the Gulf of Mexico; and the barrier island of Cancun, confined between the rocky points of Punta Cancun and Punta Nizuc, separates Nichupte Lagoon from the Caribbean Sea (Fig. 1).
Figure 1. Location of the study areas.
1 Engineering Institute, National Autonomous University of Mexico, Circuito Escolar s/n, Edificio 5, Mexico City,
Distrito Federal, 04510, Mexico
COASTAL ENGINEERING 2014 2
Ciudad del Carmen is the main city of Isla del Carmen (170,000 inhabitants), and home for thousands of employees of the Mexican petroleum company. On the other hand, Cancun is the largest tourist development in Mexico (35 % of Mexico’s tourist income), and the dense construction there covers up to 95 % of the land. The human interventions have affected the natural lagoon equilibrium, sediment balance and drainage of both barrier systems, causing chronic erosion of the beaches and an increase in inundation vulnerability for the population and tourists of the islands under storm conditions.
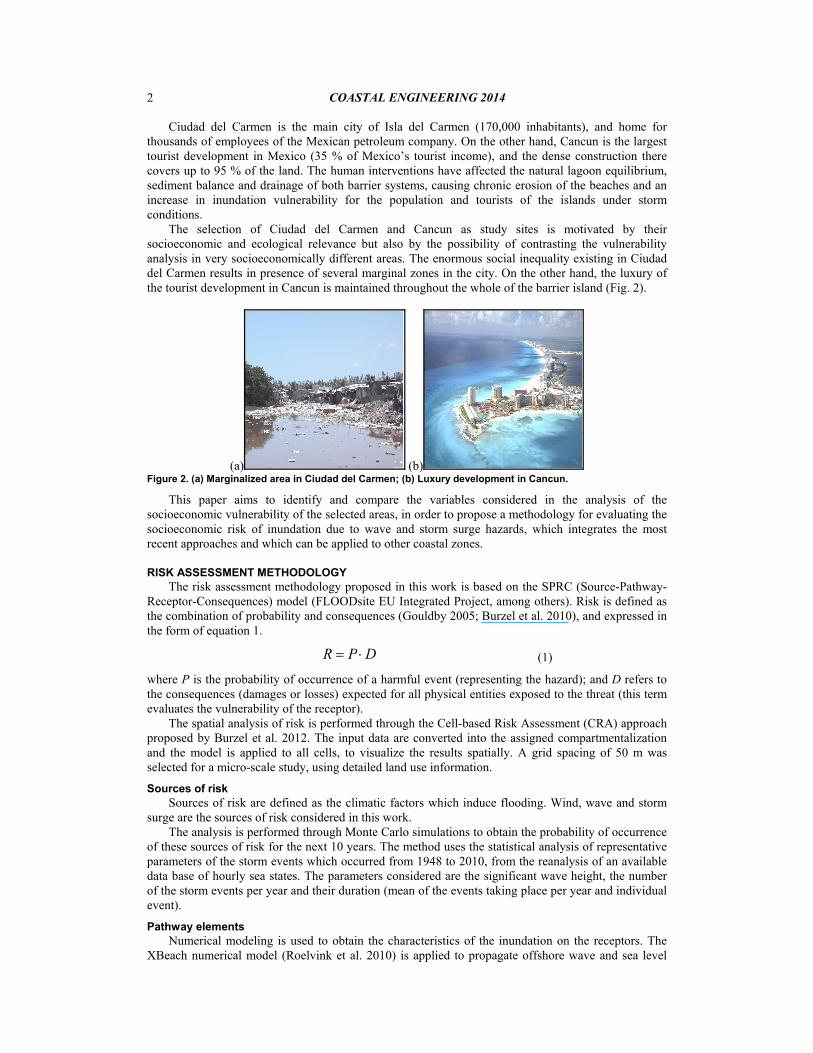
The selection of Ciudad del Carmen and Cancun as study sites is motivated by their socioeconomic and ecological relevance but also by the possibility of contrasting the vulnerability analysis in very socioeconomically different areas. The enormous social inequality existing in Ciudad del Carmen results in presence of several marginal zones in the city. On the other hand, the luxury of the tourist development in Cancun is maintained throughout the whole of the barrier island (Fig. 2).
(a) (b) Figure 2. (a) Marginalized area in Ciudad del Carmen; (b) Luxury development in Cancun.
This paper aims to identify and compare the variables considered in the analysis of the socioeconomic vulnerability of the selected areas, in order to propose a methodology for evaluating the socioeconomic risk of inundation due to wave and storm surge hazards, which integrates the most recent approaches and which can be applied to other coastal zones.
RISK ASSESSMENT METHODOLOGY The risk assessment methodology proposed in this work is based on the SPRC (Source-Pathway-
Receptor-Consequences) model (FLOODsite EU Integrated Project, among others). Risk is defined as the combination of probability and consequences (Gouldby 2005; Burzel et al. 2010), and expressed in the form of equation 1.
DPR (1)
where P is the probability of occurrence of a harmful event (representing the hazard); and D refers to the consequences (damages or losses) expected for all physical entities exposed to the threat (this term evaluates the vulnerability of the receptor).
The spatial analysis of risk is performed through the Cell-based Risk Assessment (CRA) approach proposed by Burzel et al. 2012. The input data are converted into the assigned compartmentalization and the model is applied to all cells, to visualize the results spatially. A grid spacing of 50 m was selected for a micro-scale study, using detailed land use information.
Sources of risk Sources of risk are defined as the climatic factors which induce flooding. Wind, wave and storm
surge are the sources of risk considered in this work. The analysis is performed through Monte Carlo simulations to obtain the probability of occurrence
of these sources of risk for the next 10 years. The method uses the statistical analysis of representative parameters of the storm events which occurred from 1948 to 2010, from the reanalysis of an available data base of hourly sea states. The parameters considered are the significant wave height, the number of the storm events per year and their duration (mean of the events taking place per year and individual event).
Pathway elements Numerical modeling is used to obtain the characteristics of the inundation on the receptors. The
XBeach numerical model (Roelvink et al. 2010) is applied to propagate offshore wave and sea level
COASTAL ENGINEERING 2014
3
conditions to the outer edge of the beach. On the other hand, as a first approximation, the inland inundation depth is considered as the difference between the water level on the beach and the terrain elevation data.
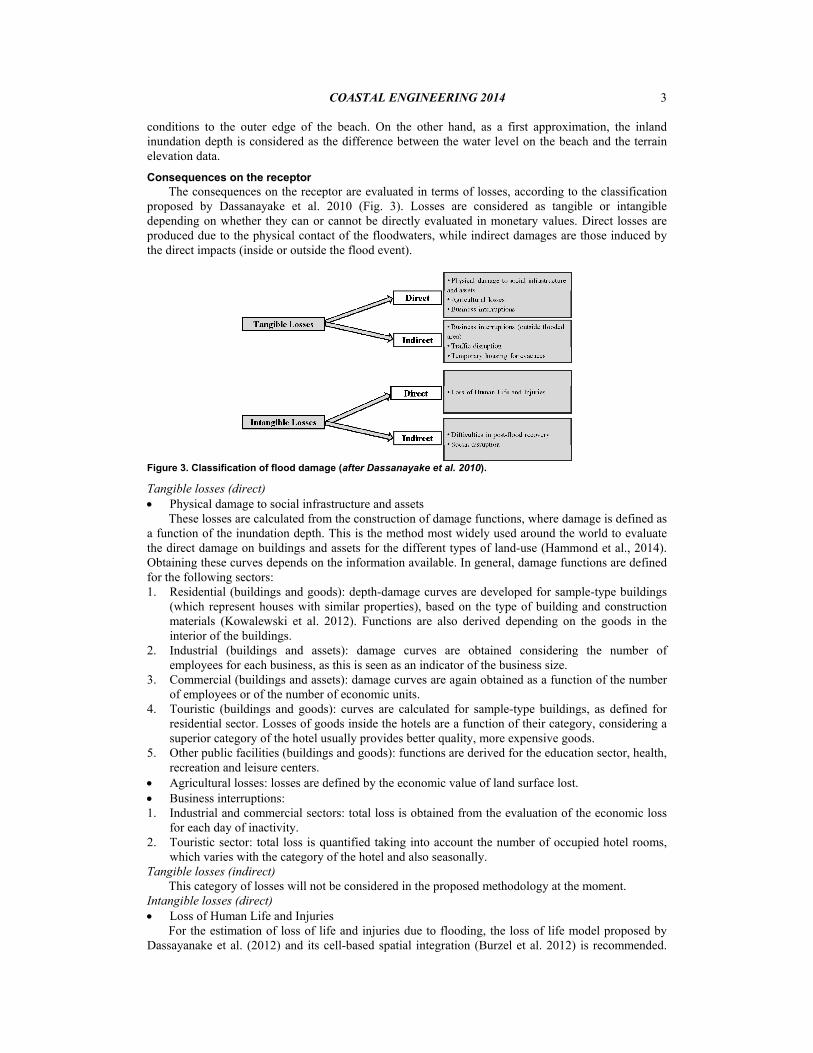
Consequences on the receptor The consequences on the receptor are evaluated in terms of losses, according to the classification
proposed by Dassanayake et al. 2010 (Fig. 3). Losses are considered as tangible or intangible depending on whether they can or cannot be directly evaluated in monetary values. Direct losses are produced due to the physical contact of the floodwaters, while indirect damages are those induced by the direct impacts (inside or outside the flood event).
Figure 3. Classification of flood damage (after Dassanayake et al. 2010).
Tangible losses (direct) Physical damage to social infrastructure and assets
These losses are calculated from the construction of damage functions, where damage is defined as a function of the inundation depth. This is the method most widely used around the world to evaluate the direct damage on buildings and assets for the different types of land-use (Hammond et al., 2014). Obtaining these curves depends on the information available. In general, damage functions are defined for the following sectors: 1. Residential (buildings and goods): depth-damage curves are developed for sample-type buildings
(which represent houses with similar properties), based on the type of building and construction materials (Kowalewski et al. 2012). Functions are also derived depending on the goods in the interior of the buildings.
2. Industrial (buildings and assets): damage curves are obtained considering the number of employees for each business, as this is seen as an indicator of the business size.
3. Commercial (buildings and assets): damage curves are again obtained as a function of the number of employees or of the number of economic units.
4. Touristic (buildings and goods): curves are calculated for sample-type buildings, as defined for residential sector. Losses of goods inside the hotels are a function of their category, considering a superior category of the hotel usually provides better quality, more expensive goods.
5. Other public facilities (buildings and goods): functions are derived for the education sector, health, recreation and leisure centers.
Agricultural losses: losses are defined by the economic value of land surface lost. Business interruptions: 1. Industrial and commercial sectors: total loss is obtained from the evaluation of the economic loss
for each day of inactivity. 2. Touristic sector: total loss is quantified taking into account the number of occupied hotel rooms,
which varies with the category of the hotel and also seasonally. Tangible losses (indirect)
This category of losses will not be considered in the proposed methodology at the moment. Intangible losses (direct) Loss of Human Life and Injuries
For the estimation of loss of life and injuries due to flooding, the loss of life model proposed by Dassayanake et al. (2012) and its cell-based spatial integration (Burzel et al. 2012) is recommended.
COASTAL ENGINEERING 2014 4
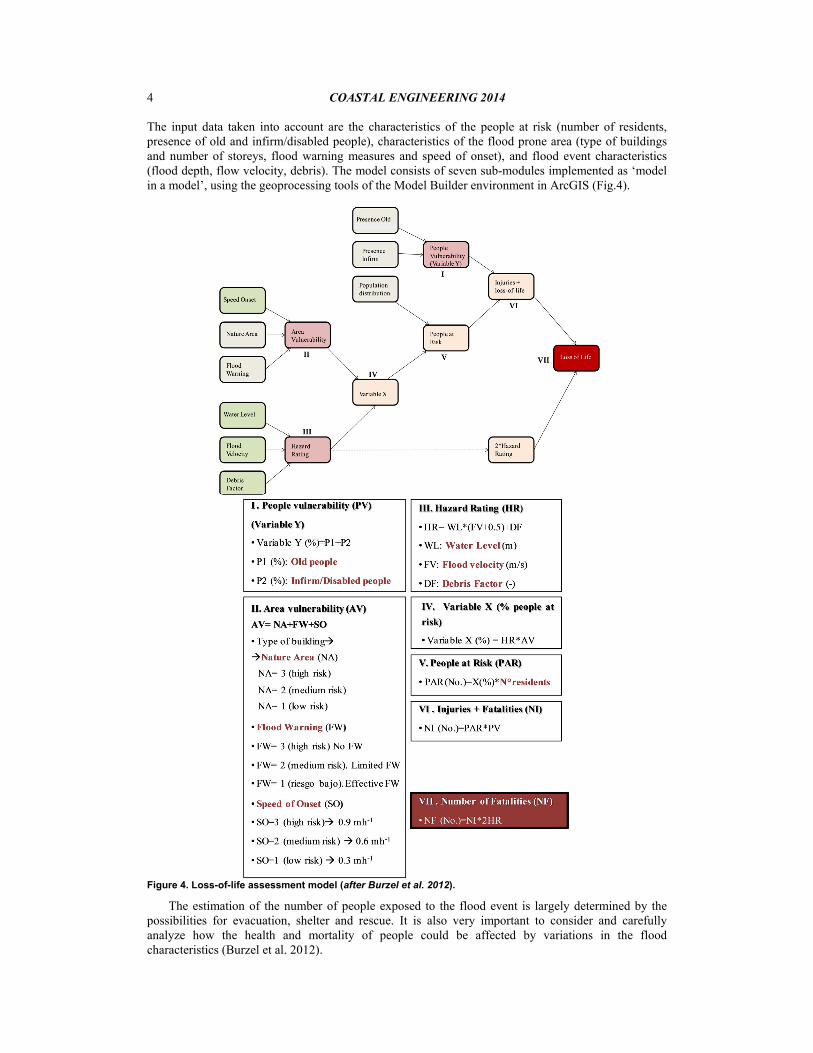
The input data taken into account are the characteristics of the people at risk (number of residents, presence of old and infirm/disabled people), characteristics of the flood prone area (type of buildings and number of storeys, flood warning measures and speed of onset), and flood event characteristics (flood depth, flow velocity, debris). The model consists of seven sub-modules implemented as ‘model in a model’, using the geoprocessing tools of the Model Builder environment in ArcGIS (Fig.4).
Figure 4. Loss-of-life assessment model (after Burzel et al. 2012).
The estimation of the number of people exposed to the flood event is largely determined by the possibilities for evacuation, shelter and rescue. It is also very important to consider and carefully analyze how the health and mortality of people could be affected by variations in the flood characteristics (Burzel et al. 2012).
COASTAL ENGINEERING 2014
5
Intangible losses (indirect) Difficulties in post-flood recovery
This classification of losses analyzes the resilience of the receptor to a flood event. The variables proposed for the evaluation are: 1. Productive sectors:
a) Tourism: the categories of the hotels. b) Industrial sector: number of employees (considered as a measure of the business size). c) Commercial sector: number of employees, number of economic units per area of land use.
2. Society: a) Economically active population per family. b) Social class.
3. Infrastructure and buildings: a) Drainage capacity of the roads: taking into account the existence or not of road drainage
systems and the building density. Social disruption (Health problems)
The effects considered are the diseases that people could contract from direct contact with floodwater. The sources of contamination of water taken into account are: 1. Areas with incompatible land use (eg. presence of housing and industrial zones). 2. Refuse sites, sewage plants and cemeteries. 3. Housing without sewage services.
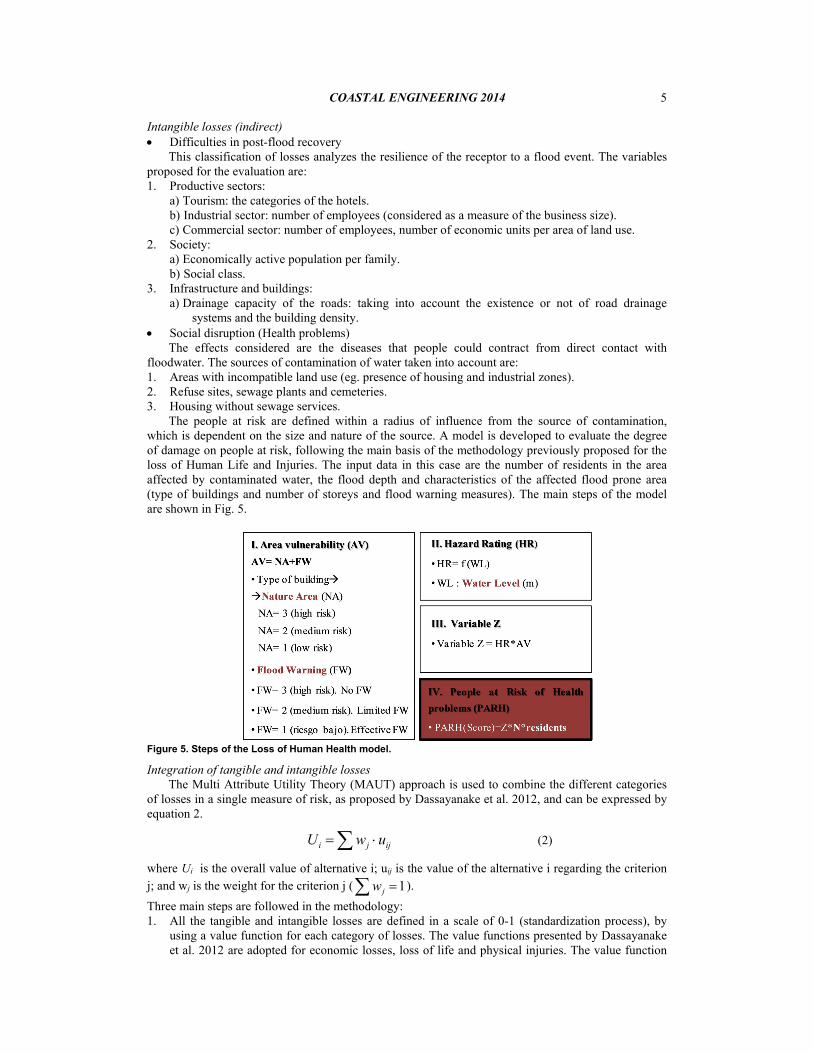
The people at risk are defined within a radius of influence from the source of contamination, which is dependent on the size and nature of the source. A model is developed to evaluate the degree of damage on people at risk, following the main basis of the methodology previously proposed for the loss of Human Life and Injuries. The input data in this case are the number of residents in the area affected by contaminated water, the flood depth and characteristics of the affected flood prone area (type of buildings and number of storeys and flood warning measures). The main steps of the model are shown in Fig. 5.
Figure 5. Steps of the Loss of Human Health model.
Integration of tangible and intangible losses The Multi Attribute Utility Theory (MAUT) approach is used to combine the different categories
of losses in a single measure of risk, as proposed by Dassayanake et al. 2012, and can be expressed by equation 2.
ijji uwU (2)
where Ui is the overall value of alternative i; uij is the value of the alternative i regarding the criterion
j; and wj is the weight for the criterion j ( 1 jw ).
Three main steps are followed in the methodology: 1. All the tangible and intangible losses are defined in a scale of 0-1 (standardization process), by
using a value function for each category of losses. The value functions presented by Dassayanake et al. 2012 are adopted for economic losses, loss of life and physical injuries. The value function
COASTAL ENGINEERING 2014 6
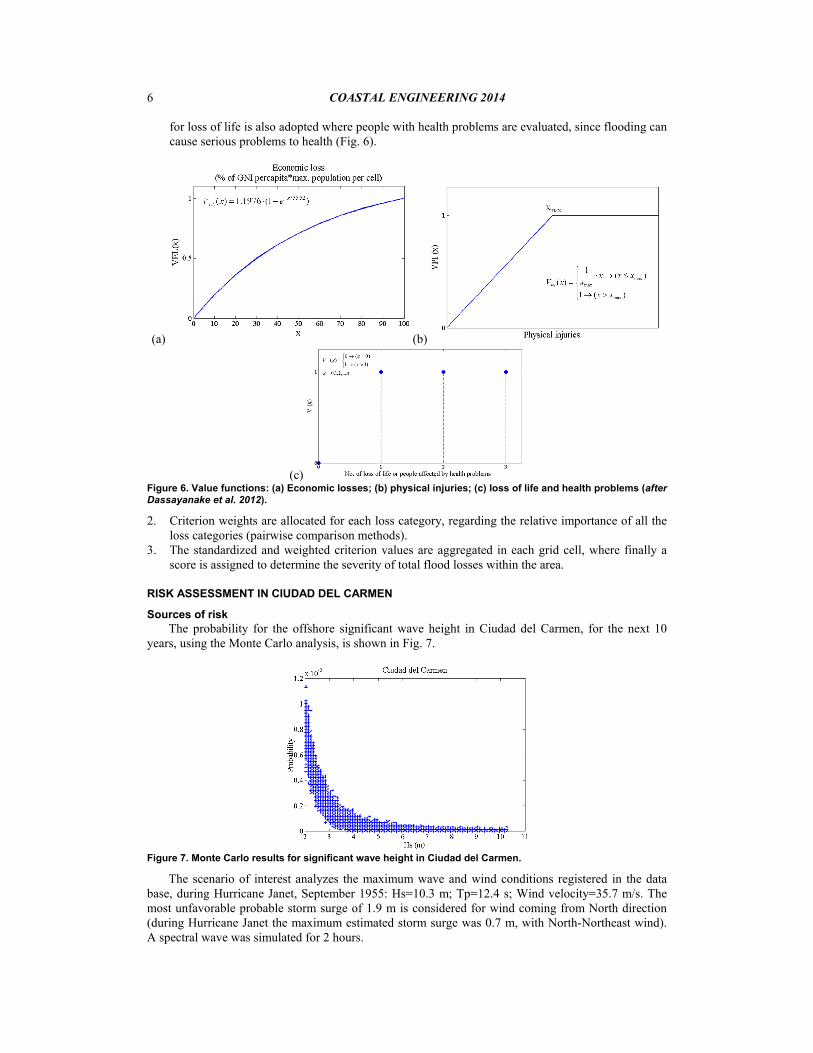
for loss of life is also adopted where people with health problems are evaluated, since flooding can cause serious problems to health (Fig. 6).
(a) (b)
(c) Figure 6. Value functions: (a) Economic losses; (b) physical injuries; (c) loss of life and health problems (after Dassayanake et al. 2012).
2. Criterion weights are allocated for each loss category, regarding the relative importance of all the loss categories (pairwise comparison methods).
3. The standardized and weighted criterion values are aggregated in each grid cell, where finally a score is assigned to determine the severity of total flood losses within the area.
RISK ASSESSMENT IN CIUDAD DEL CARMEN
Sources of risk The probability for the offshore significant wave height in Ciudad del Carmen, for the next 10
years, using the Monte Carlo analysis, is shown in Fig. 7.
Figure 7. Monte Carlo results for significant wave height in Ciudad del Carmen.
The scenario of interest analyzes the maximum wave and wind conditions registered in the data base, during Hurricane Janet, September 1955: Hs=10.3 m; Tp=12.4 s; Wind velocity=35.7 m/s. The most unfavorable probable storm surge of 1.9 m is considered for wind coming from North direction (during Hurricane Janet the maximum estimated storm surge was 0.7 m, with North-Northeast wind). A spectral wave was simulated for 2 hours.
COASTAL ENGINEERING 2014
7
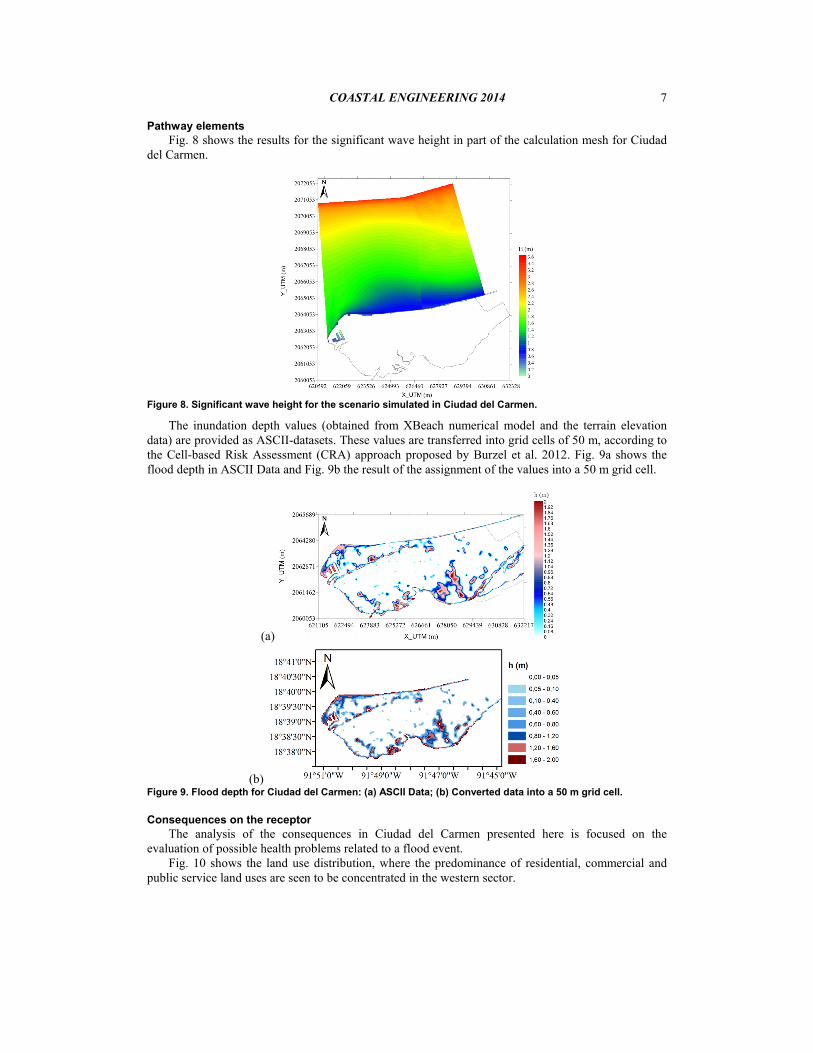
Pathway elements Fig. 8 shows the results for the significant wave height in part of the calculation mesh for Ciudad
del Carmen.
Figure 8. Significant wave height for the scenario simulated in Ciudad del Carmen.
The inundation depth values (obtained from XBeach numerical model and the terrain elevation data) are provided as ASCII-datasets. These values are transferred into grid cells of 50 m, according to the Cell-based Risk Assessment (CRA) approach proposed by Burzel et al. 2012. Fig. 9a shows the flood depth in ASCII Data and Fig. 9b the result of the assignment of the values into a 50 m grid cell.
(a)
(b) Figure 9. Flood depth for Ciudad del Carmen: (a) ASCII Data; (b) Converted data into a 50 m grid cell.
Consequences on the receptor The analysis of the consequences in Ciudad del Carmen presented here is focused on the
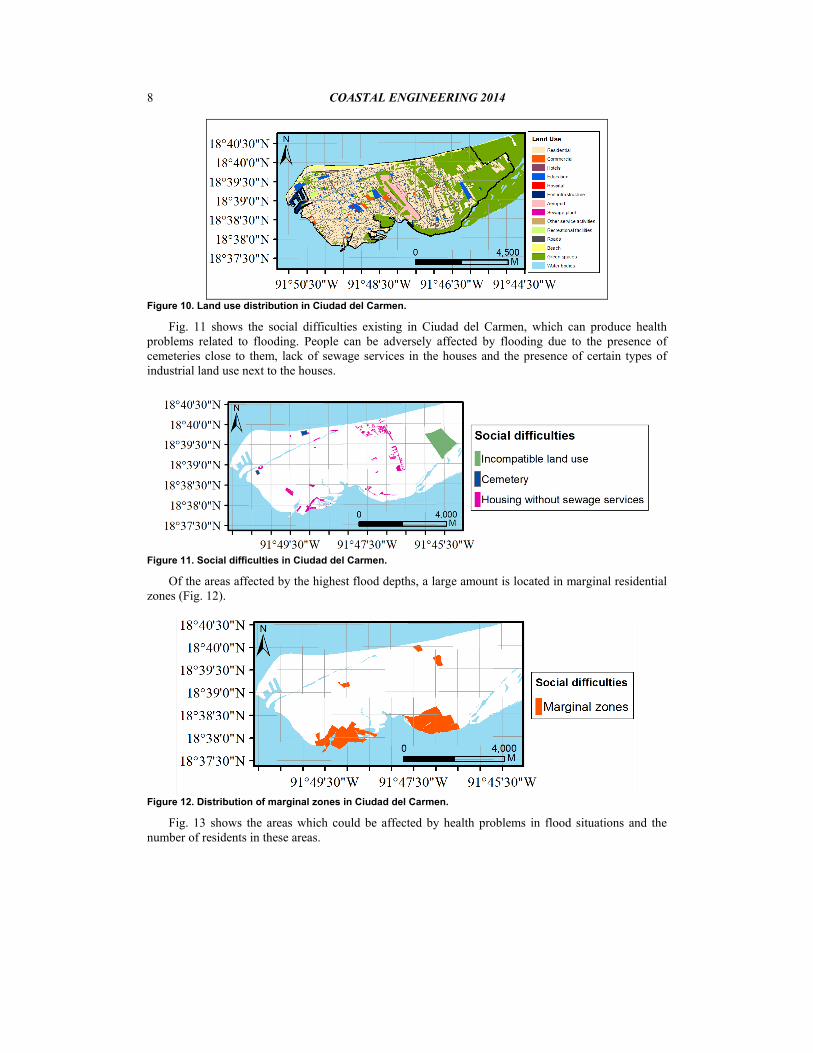
evaluation of possible health problems related to a flood event. Fig. 10 shows the land use distribution, where the predominance of residential, commercial and
public service land uses are seen to be concentrated in the western sector.
COASTAL ENGINEERING 2014 8
Figure 10. Land use distribution in Ciudad del Carmen.
Fig. 11 shows the social difficulties existing in Ciudad del Carmen, which can produce health problems related to flooding. People can be adversely affected by flooding due to the presence of cemeteries close to them, lack of sewage services in the houses and the presence of certain types of industrial land use next to the houses.
Figure 11. Social difficulties in Ciudad del Carmen.
Of the areas affected by the highest flood depths, a large amount is located in marginal residential zones (Fig. 12).
Figure 12. Distribution of marginal zones in Ciudad del Carmen.
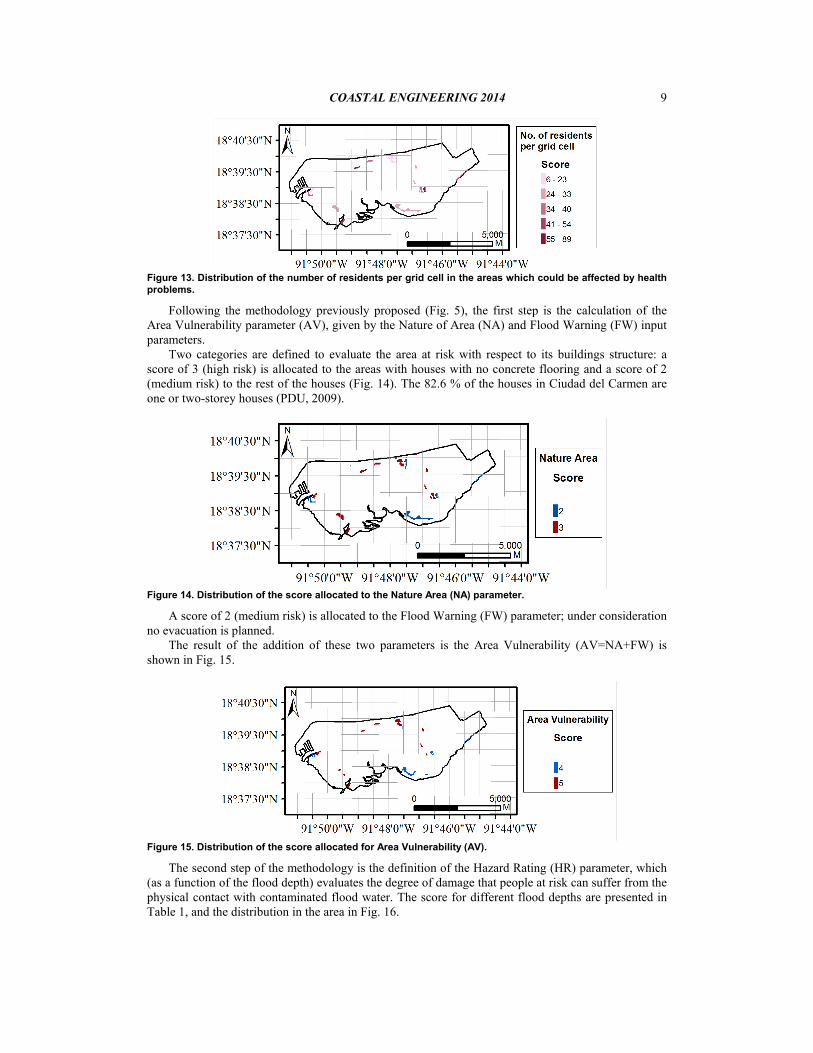
Fig. 13 shows the areas which could be affected by health problems in flood situations and the number of residents in these areas.
COASTAL ENGINEERING 2014
9
Figure 13. Distribution of the number of residents per grid cell in the areas which could be affected by health problems.
Following the methodology previously proposed (Fig. 5), the first step is the calculation of the Area Vulnerability parameter (AV), given by the Nature of Area (NA) and Flood Warning (FW) input parameters.
Two categories are defined to evaluate the area at risk with respect to its buildings structure: a score of 3 (high risk) is allocated to the areas with houses with no concrete flooring and a score of 2 (medium risk) to the rest of the houses (Fig. 14). The 82.6 % of the houses in Ciudad del Carmen are one or two-storey houses (PDU, 2009).
Figure 14. Distribution of the score allocated to the Nature Area (NA) parameter.
A score of 2 (medium risk) is allocated to the Flood Warning (FW) parameter; under consideration no evacuation is planned.
The result of the addition of these two parameters is the Area Vulnerability (AV=NA+FW) is shown in Fig. 15.
Figure 15. Distribution of the score allocated for Area Vulnerability (AV).
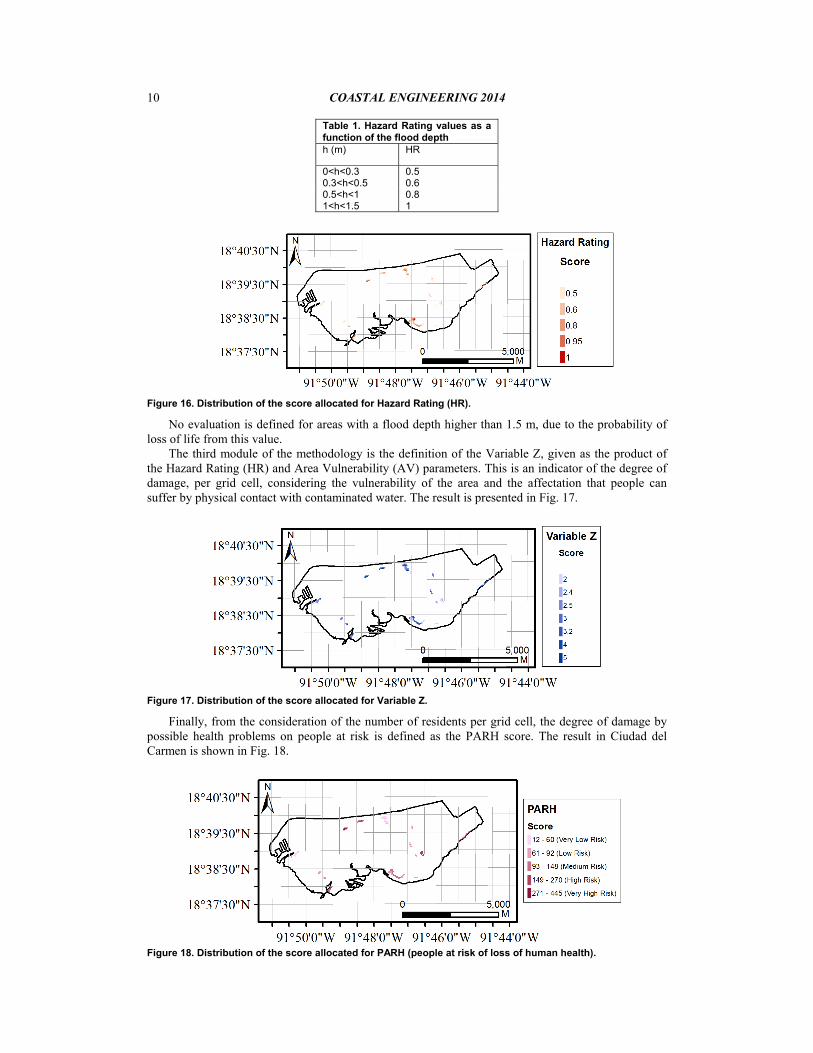
The second step of the methodology is the definition of the Hazard Rating (HR) parameter, which (as a function of the flood depth) evaluates the degree of damage that people at risk can suffer from the physical contact with contaminated flood water. The score for different flood depths are presented in Table 1, and the distribution in the area in Fig. 16.
COASTAL ENGINEERING 2014 10
Table 1. Hazard Rating values as a function of the flood depth h (m) HR
0<h<0.3 0.5 0.3<h<0.5 0.6 0.5<h<1 0.8 1<h<1.5 1
Figure 16. Distribution of the score allocated for Hazard Rating (HR).
No evaluation is defined for areas with a flood depth higher than 1.5 m, due to the probability of loss of life from this value.
The third module of the methodology is the definition of the Variable Z, given as the product of the Hazard Rating (HR) and Area Vulnerability (AV) parameters. This is an indicator of the degree of damage, per grid cell, considering the vulnerability of the area and the affectation that people can suffer by physical contact with contaminated water. The result is presented in Fig. 17.
Figure 17. Distribution of the score allocated for Variable Z.
Finally, from the consideration of the number of residents per grid cell, the degree of damage by possible health problems on people at risk is defined as the PARH score. The result in Ciudad del Carmen is shown in Fig. 18.
Figure 18. Distribution of the score allocated for PARH (people at risk of loss of human health).
COASTAL ENGINEERING 2014
11
RISK ASSESSMENT IN CANCUN
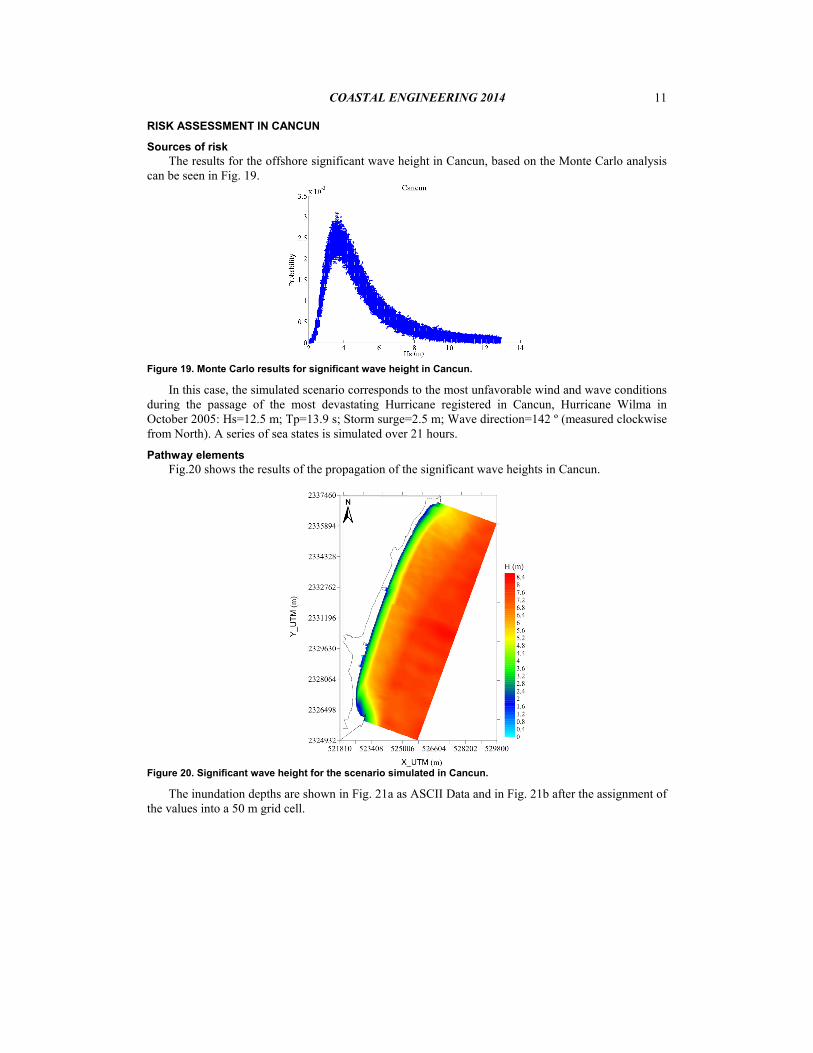
Sources of risk The results for the offshore significant wave height in Cancun, based on the Monte Carlo analysis
can be seen in Fig. 19.
Figure 19. Monte Carlo results for significant wave height in Cancun.
In this case, the simulated scenario corresponds to the most unfavorable wind and wave conditions during the passage of the most devastating Hurricane registered in Cancun, Hurricane Wilma in October 2005: Hs=12.5 m; Tp=13.9 s; Storm surge=2.5 m; Wave direction=142 º (measured clockwise from North). A series of sea states is simulated over 21 hours.
Pathway elements Fig.20 shows the results of the propagation of the significant wave heights in Cancun.
Figure 20. Significant wave height for the scenario simulated in Cancun.
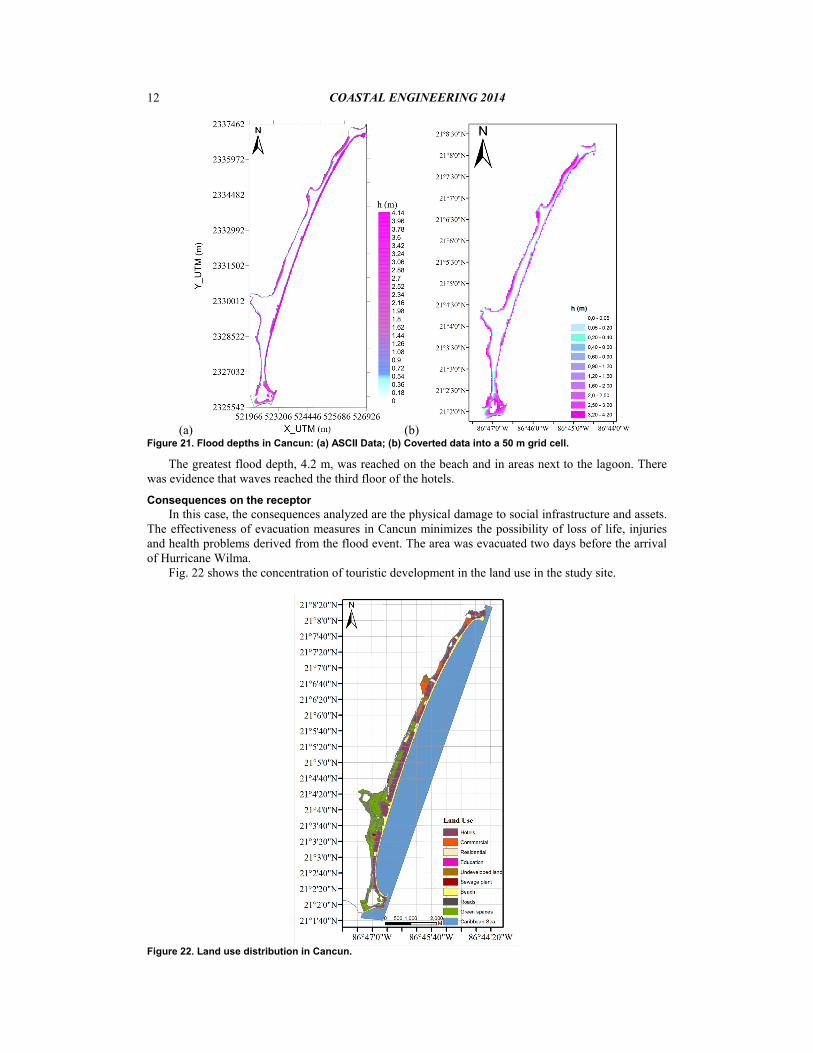
The inundation depths are shown in Fig. 21a as ASCII Data and in Fig. 21b after the assignment of the values into a 50 m grid cell.
COASTAL ENGINEERING 2014 12
(a) (b) Figure 21. Flood depths in Cancun: (a) ASCII Data; (b) Coverted data into a 50 m grid cell.
The greatest flood depth, 4.2 m, was reached on the beach and in areas next to the lagoon. There was evidence that waves reached the third floor of the hotels.
Consequences on the receptor In this case, the consequences analyzed are the physical damage to social infrastructure and assets.
The effectiveness of evacuation measures in Cancun minimizes the possibility of loss of life, injuries and health problems derived from the flood event. The area was evacuated two days before the arrival of Hurricane Wilma.
Fig. 22 shows the concentration of touristic development in the land use in the study site.
Figure 22. Land use distribution in Cancun.
COASTAL ENGINEERING 2014
13
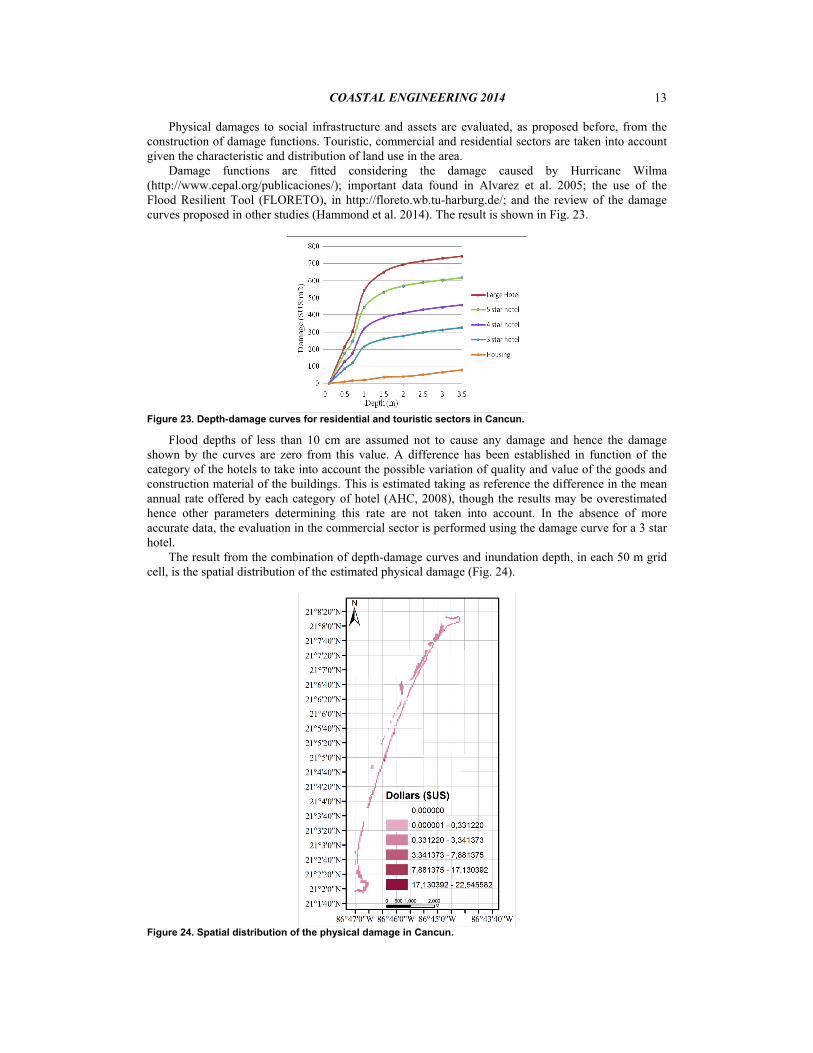
Physical damages to social infrastructure and assets are evaluated, as proposed before, from the construction of damage functions. Touristic, commercial and residential sectors are taken into account given the characteristic and distribution of land use in the area.
Damage functions are fitted considering the damage caused by Hurricane Wilma (http://www.cepal.org/publicaciones/); important data found in Alvarez et al. 2005; the use of the Flood Resilient Tool (FLORETO), in http://floreto.wb.tu-harburg.de/; and the review of the damage curves proposed in other studies (Hammond et al. 2014). The result is shown in Fig. 23.
Figure 23. Depth-damage curves for residential and touristic sectors in Cancun.
Flood depths of less than 10 cm are assumed not to cause any damage and hence the damage shown by the curves are zero from this value. A difference has been established in function of the category of the hotels to take into account the possible variation of quality and value of the goods and construction material of the buildings. This is estimated taking as reference the difference in the mean annual rate offered by each category of hotel (AHC, 2008), though the results may be overestimated hence other parameters determining this rate are not taken into account. In the absence of more accurate data, the evaluation in the commercial sector is performed using the damage curve for a 3 star hotel.
The result from the combination of depth-damage curves and inundation depth, in each 50 m grid cell, is the spatial distribution of the estimated physical damage (Fig. 24).
Figure 24. Spatial distribution of the physical damage in Cancun.
COASTAL ENGINEERING 2014 14
CONCLUSIONS Risk assessment has been a theme widely studied over the years, although a common methodology
for application in all coastal areas of the world has not yet been established. In this paper, the selection of two socio-economically different areas in Mexico has helped to
identify important variables for the evaluation of possible consequences of coastal flood inundation on the receptors.
A risk assessment approach is proposed which evaluates the socioeconomic vulnerability in term of damage (or losses) and integrates the most recent approaches. The contribution of new aspects related to the resilience of the receptors and analysis of intangible indirect losses is also included.
The results are a first approximation and application of the methodology proposed. Regarding the methodology proposed to evaluate possible health problems, further sensitivity analysis is required in order to define the suitability of the values allocated to the different parameters.
A model to integrate the variables proposed in the evaluation of difficulties in post-flood recovery is been developed, and the definition of the corresponding value functions to be integrated with the rest of losses.
It is very important to highlight the quality of a risk study greatly depends on the data and tools available for the assessment.
REFERENCES AHC, 2008. Boletín Turístico de Cancún, Cancun, Quintana Roo, Mexico, Vol. 1 (3). Alvarez, R.A., 2005. El Impacto del Huracán Wilma en Cancún. Informe preliminar de la visita del 30
de Noviembre al 6 de Diciembre de 2005 por equipo de investigadores de Arq. Ricardo A. Alvarez, Ing. Timothy Reinhold y Dr- Hugh Gladwin.
Burzel, A., D. Dassanayake, M. Naulin, A. Kortenhaus, H. Oumerachi, T. Wahl et al. 2010. Integrated flood risk analysis for extreme storm surges (XTREMRISK), Proceedings of 32th International Conference on Coastal Engineering (ICCE), Shanghai, China.
Burzel, A., Dassanayake, D.R., Oumeraci, H., 2012. Spatial modelling of tangible and intangible losses in an integrated risk analysis, Proceedings of 34th International Conference on Coastal Engineering (ICCE), Santander, España.
Burzel., A, Dassanayake, D.R , Oumeraci, H., 2012. Development of a spatial loss-of-life model for Hamburg-Wilhelmsburg. XtremRisK Progress Report. Leichtweiß-Institute for Hydraulic Engineering and Water Resources, Technische Universität Braunschweig, 67 p.
Dassanayake, D.R., Burzel, A., Kortenhaus, A., Oumeraci, H., 2010. Framework and Methods for the Evaluation of Intangible Losses and their Integration in Coastal Flood Risk Analysis. XtremRisK Progress Report. Leichtweiß-Institute for Hydraulic Engineering and Water Resources, Technische Universität Braunschweig, 84 p.
Dassanayake, D.R., Burzel, A., Oumeraci, H., 2012. Coastal flood risk: the importance of intangible losses and their integration, Proceedings of 34th International Conference on Coastal Engineering (ICCE), Santander, España.
FLOODsite, Integrated Flood Risk Analysis and Management Methodologies, FLOODsite EU Integrated Project, Sixth Framework Programme, European Community, Brussels 2004–2009.
Gouldby, B., and P. Samuels. 2005. Language of risk- Project definitions, FLOODsite EU Integrated Project, Research Report T32-04-01.
Hammond, M., Chen, A., Djordjevic, S., 2014. Flood Damage Model Case Study Results. CORFU Report,University of Exeter, 117 p.
Kowalewski, J., Ujeyl, G., 2012. Estimating the direct and indirect damages from storm surges: The case of Wilhelmsburg/Hamburg, in Frans Klijn & Timo Schweckendiek (ed), Comprehensive Flood Risk Management: Research for policy and practice. London: Taylor & Francis Group.
PDU, 2009. Actualización Programa Director Urbano del centro de población Ciudad del Carmen, Campeche (2009): Por una Ciudad bella, competitiva, sustentable e incluyente, tomo 1, Antecedentes y diagnóstico, 158 pp (in Spanish).
Roelvink D., A. Reniers, A. van Dongeren, J. van Thiel, J. Lescinski, and R. McCall. 2010. XBeach model description and manual, Unesco-IHE Institute for Water Education, Deltares and Delf University of Technology.