comparative proteome and transcriptome analyses of embryonic stem cells during embryoid body-based...
TRANSCRIPT
RESEARCH ARTICLE
Comparative proteome and transcriptome analyses
of embryonic stem cells during embryoid body-based
differentiation
Ali Fathi1, Mohammad Pakzad2, Adele Taei2, Thore C. Brink3, Leila Pirhaji1, Guifre Ruiz3,Mohammad Sharif Tabe Bordbar1, Hamid Gourabi4, James Adjaye3, Hossein Baharvand 2,5�
and Ghasem Hosseini Salekdeh1,6
1 Department of Molecular Systems Biology, Royan Institute for Stem Cell Biology and Technology,ACECR, Tehran, Iran
2 Department of Stem Cells and Developmental Biology, Royan Institute for Stem Cell Biology and Technology,ACECR, Tehran, Iran
3 Department of Vertebrate Genomics, Max-Planck Institute for Molecular Genetics, Berlin, Germany4 Department of Genetics, Royan Institute for Reproductive Biomedicine, ACECR, Tehran, Iran5 Department of Developmental Biology, University of Science and Culture, ACECR, Tehran, Iran6 Department of Systems Biology, Agricultural Biotechnology Research Institute of Iran, Karaj, Iran
Received: January 5, 2009
Revised: July 12, 2009
Accepted: July 22, 2009
Gene expression analyses of embryonic stem cells (ESCs) will help to uncover or further
define signaling pathways and molecular mechanisms involved in the maintenance of self-
renewal and pluripotency. We employed a 2-DE-based proteomics approach to analyze
human ESC line, Royan H5, in undifferentiated cells and different stages of spontaneous
differentiation (days 3, 6, 12, and 20) by embryoid body formation. Out of 945 proteins
reproducibly detected on gels, the expression of 96 spots changed during differentiation.
Using MS, 87 ESC-associated proteins were identified including several proteins involved in
cell proliferation, cell apoptosis, transcription, translation, mRNA processing, and protein
folding. Transcriptional changes accompanying differentiation of Royan H5 were also
analyzed using microarrays. We developed a comprehensive data set that shows the use of
human ESC lines in vitro to mimic gastrulation and organogenesis. Our results showed that
proteomics and transcriptomics data are complementary rather than duplicative. Although
regulation of many genes during differentiation were observed only at transcript level,
modulation of several proteins was revealed only by proteome analysis.
Keywords:
Cell biology / Differentiation / Embryonic stem cells / Human / Microarray
1 Introduction
Human embryonic stem cells (hESCs) are undifferentiated
cells generally characterized by their functional capacity to
both self-renew and to form all embryonic germ layer deri-
vatives, except extracellular tissues (e.g. placenta) [1].
Because of their exceptional properties, they have enormous
potential to be used for developmental biology studies, drug
screening, tissue engineering, and transplantation therapy.
However, a detailed understanding of signaling pathways
and molecular mechanisms involved in the maintenance of
the undifferentiated state and initial loss of pluripotency will
be essential before embryonic stem cell (ESC)-based thera-
pies can safely be applied in the clinics.
Abbreviations: CPP, component plane presentation; dif-ESC,
differentiated embryonic stem cell; EB, embryoid body; ESC,
embryonic stem cell; GO, gene ontology; hESC, human embryo-
nic stem cell; SOM, self-organizing map
�Additional corresponding author: Dr. Hossein Baharvand
E-mail: [email protected]
Correspondence: Dr. Ghasem Hosseini Salekdeh, Department of
Molecular Systems Biology, Royan Institute for Stem Cell Biol-
ogy and Technology, P. O. Box 19395-4644, Tehran, Iran
E-mail: [email protected]
Fax: 198-21-22414532
& 2009 WILEY-VCH Verlag GmbH & Co. KGaA, Weinheim www.proteomics-journal.com
Proteomics 2009, 9, 4859–4870 4859DOI 10.1002/pmic.200900003
Over the past few years, there has been a growing interest
in applying transcriptomics and proteomics to study differ-
ential expression of SC genes in different developmental
stages, thereby specifically aiming at unraveling the regu-
latory networks active during differentiation of ESCs.
Microarray analysis is a powerful transcriptomics tool to
study the differential expression of a large number of genes
and the whole genome under any given condition. Several
groups have applied wide-scale transcriptome profiling
approaches to identify molecular signatures in hESCs (e.g.[2–4]). These studies have generated a wealth of data and
several mechanisms and genes emerged as key participants
in ESC proliferation and differentiation. Although tran-
scriptomics analyses can provide wide coverage of RNA, it
has been concluded that the notion was expressed that
mRNA levels are only a partial reflection of the functional
state of an organism [5]. However, the amount of protein is
often not predictable from mRNA abundance [6].
Expression of many proteins may be regulated at the level
of translation and the rates of degradation of mRNAs and
proteins differ markedly between genes. Post-translational
modifications are often extremely important for the function
of many proteins, but most of these modifications cannot
yet be predicted from genomic or mRNA sequences. It is
becoming increasingly important to know how proteins in a
cell interact with each other and how these interactions
respond to internal and external signals. These important
issues should be addressed at the proteome level. Proteo-
mics has proven to be a powerful approach to address these
issues [7]. Changes in ESCs proteome during differentiation
to embryoid body (EB) have been studied in mouse [8, 9],
monkey [10], and human [11]. To identify human and
mouse ESC-specific proteins, Van Hoof et al. [11] used a
wide-scale proteomics approach to compare the proteomes
of undifferentiated ESCs and their early spontaneous
differentiated derivatives using FT-ICR-MS/MS. They
distinguished 191 proteins were exclusively identified in
both human and mouse ESCs but not in their differentiated
derivatives. Many of the ESC-specific proteins were known
to be involved in cell proliferation.
Although most studies used either transcriptomics or
proteomics approaches to study ESCs, combined proteome
and transcriptome analyses enables us to unveil important
transcriptional and post-transcriptional regulatory mechan-
isms during both ESC proliferation and differentiation that
would not be evident by examining either mRNA or protein
[12, 13]. It has been suggested that an integrated analysis of
both mRNAs and proteins is very important to gain further
insights into complex biological systems [13].
In the current study, we employed 2-DE-based proteo-
mics approach to analyze an hESC line, Royan H5, in
undifferentiated and different uncommitted differentiation
stages represented as EBs. We further analyzed transcrip-
tional changes accompanying differentiation of Royan H5
using microarrays. The comparative analysis the tran-
scriptomes and proteomes has revealed several genes and
the encoded proteins as key players than can serve as
potential markers of stem cell self-renewal and differentia-
tion.
2 Materials and methods
2.1 hESC culture and sample preparation
The hESC line, Royan H5, at passages 40–50 used in these
experiments was first cultured on mouse embryonic fibro-
blasts, inactivated by mitomycin C (Sigma; M0503) [14]. The
cells were then passaged and maintained under feeder-free
conditions for 25–30 passages as described previously [15].
Briefly, ideal colonies were mechanically dissected into
small pieces and re-plated on matrigel-coated dishes and the
medium changed every day. The cells were cultured in
hESC medium: DMEM/F12 medium (Gibco; 21331-020)
supplemented with 20% knock-out serum replacement
(Gibco; 10828-028), 2 mM L-glutamine (Gibco; 25030-024),
0.1 mM b-mercaptoethanol (Sigma; M7522), 1% nones-
sential amino acid (Gibco; 11140-035), 100 U/mL penicillin
and 100 mg/mL streptomycin (Gibco; 15070-063), 100 ng/mL
basic-fibroblast growth factor (Sigma; F0291). Cells were
grown in 5% CO2 and 95% humidity, and they were further
passaged as small clumps (100–500 cells) every 6–7 days
mechanical and enzymatic with 2 mg/mL of dispase and
using a cell scraper by gently pipetting.
To promote differentiation, hESCs were first cultured in
suspension in ESC medium without knock-out serum
replacement and containing FBS (ES-qualified; Gibco
16141-079), where they developed into multicellular aggre-
gates called EBs. The EBs were cultured in suspension for a
further 12 days and then plated on gelatin-coated dishes for
8 days in the same medium to form a pool of spontaneously
differentiated cells. We used the term nonlineage-differ-
entiated cells to highlight the fact that these spontaneously
differentiated cells represent a mixture of various cell types
in the outgrowths of the EBs. For microarray and proteo-
mics analysis, we collected cells from three independent
replications from hESCs and differentiating embryonic
stem cells (dif-ESCs) at day 3 (EB3), day 6 (EB6), day 12
(EB12), and day 1218 (EB20). The cell pellet was washed
with 10 mL of PBS and centrifuged and then washed with
NaCl 0.9 mg/mL. After discarding, the cell pellet was frozen
in liquid nitrogen, and the samples were stored at �801C for
sample preparation and proteomic analysis.
2.2 Karyotype analysis
For karyotype analysis, cells were treated with thymidin
(0.01 g/mL, Sigma) for 16 h at 371C in 5% CO2. After
washing, the cells were left for 5 h and then treated with
Colcemid (Gibco, 0.15 mg/mL, 30 min) and then ESCs were
isolated from mouse embryonic fibroblasts as described
4860 A. Fathi et al. Proteomics 2009, 9, 4859–4870
& 2009 WILEY-VCH Verlag GmbH & Co. KGaA, Weinheim www.proteomics-journal.com
above. Isolated ESCs were exposed to 0.075 M KCl at room
temperature for 16 min. The cells were then fixed with ice-
cold 3:1 methanol:glacial acetic acid (repeated three times)
and dropped onto pre-cleaned chilled slides. Chromosome
spreads were Giemsa banded and analyzed for chromoso-
mal status. At least 20 metaphase spreads were screened
and five banded karyotypes were evaluated for chromosomal
rearrangements.
2.3 Flow cytometric analysis of ESCs
All staining was performed in staining buffer consisting of
PBS supplemented with 1% heat-inactivated FBS, 0.1%
sodium azide, and 2 mM EDTA. After determination of the
viability of the cells by trypan blue exclusion, cells were
washed two times in staining buffer and fixed in 4%
paraformaldehyde 15 min at room temperature. For
permeabilization Triton X-100 0.5% were used for 5 min.
Non-specific antibody binding was blocked for 15 min at 41C
with a combination of 10% heat-inactivated rat and goat
serum (prepared in our laboratory) in staining buffer, and
3–5� 105 cells were used per sample. Cells were incubated
with appropriate primary antibodies or appropriate isotype
matched controls (eBioscience or Dako Cytomation) for
45 min at 41C. Primary antibodies used were anti-SSEA-4
(1:50, ChemiconMAB4304) hOct-4 (1:50, R&D MAB1759),
Tra-1-60 (1:20, Chemicon MAB4360), Tra-1-81 (1:20,
Chemicon MAB4381) and Nanog (1:100, R&D MAB1994).
The cells were washed two times in staining buffer and
incubated for 30 min at 41C with FITC-conjugated goat
F(ab0)2 anti-rat Ig G2 (1:100, Sigma Immunochemical,
F6252), FITC-conjugated goat F(ab0)2 anti-mouse immu-
noglobulin (1:200, Chemicon, AP308F), and PE-conjugated
rat F(ab0)2 anti-mouse IgM (0.06 mg per million cells in a
100 mL total staining volume, eBioscience, 12–5790) as
appropriate. Cells were washed as before and fixed with 2%
paraformaldehyde. Flow cytometric analysis was performed
with a BD-FACS Caliber Flow Cytometer (Becton
Dickinson). The experiments were replicated at least three
times. Acquired data were analyzed by using WinMDI
software.
2.4 2-DE analyses
Triplicate cell line samples (at least 106 cells per replicate)
from hESCs and differentiated derivatives at 3, 6, 12, and 20
days after the initiation of differentiation were homogenized
in Trizol reagent (Invitrogen) and protein extraction
performed according to the manufacturer’s instruction.
Proteins were then solubilized in lysis buffer (9.5 M urea,
2% w/v CHAPS, 0.8% w/v Pharmalyte, pH 3–10, 1% w/v
DTT).
The total protein concentration was quantified by the
Bradford assay (Bio-Rad, Hercules, CA, USA) with BSA as
the standard and 2-DE was carried out as previously
described [9]. For the first dimension, 24 cm IPG strips
(GE healthcare) with a linear gradient (pH 4–7) and for the
second dimension 11.5% SDS-polyacrylamide gel were
applied. For analytical and preparative gels, 125 mg and
1.5 mg protein were loaded, respectively. The analytical 2-D
gels were stained with silver nitrate as described by Blum
et al. [16]. Preparative gels were stained with colloidal CBB G
250 [17].
The silver stained gels were scanned at a resolution of
600 dots per inch on a GS-800 densitometer (Bio-Rad). The
scanned gels saved as TIF images for subsequent analysis.
Spot quantization was carried out using the Melanie 3
software (GeneBio, Geneva, Switzerland). After image
treatment, spot detection, protein quantification, and spot
pairing were carried out based on Melanie 3 default settings.
Then, spot pairs were investigated visually and the scatter
plots between gels of each data point were displayed to
estimate gel similarity and experimental errors. The mole-
cular masses of proteins resolved in the gels were deter-
mined by co-electrophoresis of standard protein markers
(GE healthcare) and the pI of the proteins were determined
by migration of the protein spots on 24 cm IPG (pH 4–7
linear) strips.
Three of 2-D gels per cell line were run and the percen-
tage volume of each spot was estimated and analyzed by
one-way ANOVA. Only those statistically significant spots
(pr0.05) that had to be consistently present in all replicates
were scored for further analysis.
2.5 Protein identification and database search
Protein spots were excised from CBB and silver stained gels,
and analyzed using Applied Biosystems 4700 Proteomics
Analyzer (Protein and Proteomics Centre, Department of
Biological sciences, National University of Singapore).
Protein digestion, desalting, and concentration of samples
were carried out using Montages In-Gel Digestion Kits
(Millipore and Applied Biosystems, Foster City, CA, USA).
The samples were dissolved in solvent consisting of 0.1%
trifluroacetate and 50% ACN in MilliQ Water. An aliquot of
0.5 mL of peptide mixtures were spotted on a 192-well target
plate and crystallized with 0.5 mL of CHCA matrix solution
(5 mg/mL). Peptides were analyzed with MALDI-TOF/TOF
Mass Spectrometer (S/N 34 700 098, production year 2004,
Applied Biosystems, Framingham, MA, USA). MS data
were automatically acquired using Exclusion List containing
trypsin auto-digestion peaks and selecting the ten most
intense ions for MS/MS. The collision gas used was
Nitrogen with the collision energy setting of 1 kV. GPS
ExplorerTM software version 3.5 (Applied Biosystems) was
used to create and search files with MASCOT search engine
(version 2.0; Matrix Science) for peptide and protein iden-
tification. S/N ratio in MS/MS mode for peak identification
was greater than 40.
Proteomics 2009, 9, 4859–4870 4861
& 2009 WILEY-VCH Verlag GmbH & Co. KGaA, Weinheim www.proteomics-journal.com
Combined MS-MS/MS searches were conducted with the
selection of the following criteria: NCBInr database 060427
(3 525 863 sequences; 1 211 011 241 residues), all entries,
parent ion mass tolerance at 50 ppm, MS/MS mass toler-
ance of 0.2 Da, carbamidomethylation of cysteine (fixed
modification), and methionine oxidation (variable modifi-
cation).
The threshold for positive identification was a MOWSE
score of 478 (po0.05). Each candidate ID derived from the
above search was then manually examined in the Swiss-Prot
database to eliminate redundancy of synonymous proteins.
A protein’s name and accession number were reported
based on Swiss-Prot except for proteins that are only
deposited in the NCBI database. The single-protein member
of a multi-protein family were singled out by comparing
experimental pI and MW with theoretical pI and MW of
different members of gene family, the sequenced covered by
PMF and MS/MS, and ion-score of MS/MS data.
2.6 Western blot analysis
Fifty micrograms of proteins separated by 12% SDS-PAGE
electrophoresis (120 V for 1 h) using a Mini-PROTEAN 3
electrophoresis cell (Bio-Rad) and proteins were transferred
to PVDF membrane (Amersham) by semi-dry blotting (Bio-
Rad) using Dunn carbonate transfer buffer (10 mM
NaCHO3, 3 mM Na2CO3, 20% methanol). Membranes
were blocked for 1.5 h using Western blocker solution
(Sigma, W0138) and incubated overnight at 41C with the
respective primary monoclonal antibodies, anti-ERP29
(abcam 1:4000), anti-NPM1 (sigma 1:1000), anti-Hsc70
(stressgen 1:10 000), anti-EBP1 (Santa Cruz 1:4000), anti-
SGT1 (abcam 1:2000). At the end of the incubation time,
membranes incubated with the peroxidase-conjugated
secondary antibodies, anti-mouse (1:180 000, Sigma,
A9044), anti-rat (1:160 000, Sigma, A5795) and anti-Rabbit
(1:160 000, Sigma, A2074) as appropriate for 2 h at room
temperature. Finally, the blots were visualized using ECL
detection reagent (Sigma, CPS-1-120). Subsequently, the
films were scanned with densitometer (GS-800, Bio-Rad)
and quantitative analysis was performed using UVI band-
map software (UVItec, Cambridge, UK). To investigate the
uniformity of proteins amount loaded on gels, the
membranes were stained by Fast Green (FCF, Sigma,
F7252).
2.7 Illumina bead chip hybridizations and analysis of
expression data
EBs representative of the following time points, days 3, 6, 12,
and 20 (EB3, EB6, EB12, and EB20) were generated in
triplicate from Royan H5. Total RNA was then isolated using
Trizol reagent (Invitrogen). Approximately 400 ng of total
RNA from three biological replicates per time point served as
input to generate biotin-labeled cRNA employing a linear
amplification kit (Ambion, Austin, TX, USA). An aliquot of
750 ng of cRNA was used for the hybridization reaction.
Washing, Cy3-streptavidin staining, and scanning were
performed on the Illumina BeadStation 500 (Illumina, San
Diego, CA, USA) platform using reagents and following
protocols supplied by the manufacturer. cRNA samples were
hybridized onto Illumina human-8 BeadChips. All basic
expression data analysis was carried out using the manu-
facturer’s software BeadStudio 1.0. Raw data were back-
ground-subtracted and normalized using the ‘‘rank invariant’’
algorithm. Normalized data were then filtered for significant
expression on the basis of negative control beads. Selection
for differentially expressed genes was performed on the basis
of arbitrary thresholds for fold changes plus statistical
significance according to the Illumina t-test error model.
2.8 Statistical analysis
The Pearson correlation coefficient (r) of each gene’s mRNA
and protein expression profile was calculated using the
following equations:
rXY ¼sXY
sXsY
and
rXY ¼
PN
i¼1
½Xi � mx�½Yi � my�
N
where X is the mRNA expression level and Y is the protein
expression level for each gene, sX is the standard deviation
of X,sY is the standard deviation of Y, N is the total number
of genes, mX is the mean of X, and mY is the mean of Y.
Genes were excluded if mRNA or protein expression level of
first stage was zero. p-Values were calculated to infer
significant correlation between mRNA and protein expres-
sion level, in which p-values less than 0.05 indicate that the
correlation was significantly different from zero.
2.9 Data mining
Total significant proteins were clustered by k-means cluster-
ing method. Determination of the Correct Number of Clus-
ters is based on measuring of how similar the gene was to
genes in its own cluster compared with genes in other clus-
ters, which were measured by the average of intra-cluster and
inter-cluster distance [18, 19]. MATLAB software, 7.3 version,
was used for both k-means clustering and k-means clustering
profile figures. Heatmaps of k-means clustering are repre-
sented using MeV (MultiExperiment Viewer) software.
A software package of the self-organizing map (SOM)
algorithm, implemented with the MATLAB 7.3
environment (www.cis.hut.fi/projects/somtoolbox/) was
4862 A. Fathi et al. Proteomics 2009, 9, 4859–4870
& 2009 WILEY-VCH Verlag GmbH & Co. KGaA, Weinheim www.proteomics-journal.com

used for SOM training. Illustration of SOM outputs was
eventually formed in the format that inputs with similar
features are mapped to the same map unit or nearby
neighboring units, creating a smooth transition of related
individuals over the entire map. Component plane presen-
tation (CPP) was performed in MATLAB environment.
2.10 Enrichment analysis of gene categories
We used BiNGO [20] with the Cytoscape plugin to find
statistically over- or under-represented gene ontology (GO)
categories in biologic data as the tool for enrichment
analysis of our proteome and transcriptome data sets.
Enrichment was determined in reference to all human
Entrez GeneIDs annotated in the Biological Process branch
(14 394 genes total). p-Values are derived from a hypergeo-
metric test followed by Benjamini and Hochberg false
discovery rate correction. A p-value cutoff of 0.01 was used to
identify significantly enriched categories.
2.11 Real-time PCR
Reverse transcription of the isolated RNA was carried out
using the MMLV reverse transcriptase (USB) and oligo-dT
priming following the manufacturer’s instructions. Real
time was carried out on an Applied Biosystems 7900
instrument in 10 mL reactions containing 5mL of SYBR
Green PCR mix (Applied Biosystems) and 0.375 mM of each
primer. All primers used for these assays were tested for
specificity and amplification efficiency. The sequence of the
primers used is listed in Supporting Information Table 1.
Relative mRNA levels were calculated using the comparative
CT method (ABI handbook) with beta actin as internal
control for normalization.
3 Results
3.1 Characterization of hESCs
The hESCs were propagated feeder-free on matrigel in the
presence of noggin and basic-fibroblast growth factor
(Fig. 1A) and grow as compact colonies with a high nuclear
to cytoplasmic ratio and prominent nucleoli (Fig. 1B).
Moreover, the hESC line had a normal karyotype (46 XX)
(Fig. 1C). To evaluate the percentage of undifferentiated
hESCs, we analyzed the expression of key hESC markers
including Nanog (Fig. 1D), Oct-4 (Fig. 1E), SSEA-4 (Fig. 1F),
Tra-1-60 (Fig. 1G), Tra-1-81 (Fig. 1H), and SSEA-4 and Tra-
1-60 or Tra-1-81 using two-color flow cytometry (Figs. 1I and
J). Under these conditions, the cells expressed Oct-4
(93.8178.08%), Nanog (91.9276.71%), SSEA-4
(98.3972.30%), Tra-1-60 (94.478.32%), and Tra-1-81
(92.52712.09%) (Fig. 1K). The cells were also double posi-
tive for SSEA4/Tra-1-60 (97.2974.53%) and SSEA4/Tra-1-
81 (96.0776.50%) (Fig. 1K). To induce differentiation,
hESCs were cultured as EBs. The EBs were cultured in
suspension for 12 days (Fig. 1L 5 day3, 1M 5 day6, and
1N 5 day12) and then plated onto gelatin-coated dishes for 8
days in the same medium to form a pool of spontaneously
differentiated cells (Fig. 1O).
3.2 Proteome pattern
Proteomics analysis has been shown to be a powerful
approach to discover the regulatory networks driving
differentiation of ESCs (for review see [7]). In the present
study, we applied a 2-DE-based proteomics approach to
discover ESC-associated proteins by comparing ESCs and
dif-ESCs (Fig. 2). Using the Melanie 4 software, we could
reproducibly detect 979 protein spots in three replications of
ESC and four time courses of differentiation (787 in ESC,
936 in EB3, 925 in EB6, 915 in EB12, and 912 in EB20). In
total, 96 proteins showed significant changes during differ-
entiation of which 58 spots were down-regulated and 38
spots were up-regulated in at least one EB compared with
ESCs. Proteins with fluctuated expression levels along the
differentiation were excluded from further analysis.
These 96 protein spots were categorized in six expression
groups (Fig. 3). The largest group was composed of proteins
down-regulated during differentiation. Functional analysis of
expression clusters using BiNGO revealed that proteins
involved in metabolisms were enriched in both down-regulated
(D, E, and F groups) and up-regulated (A, B, and C groups)
protein clusters. In addition, clusters D, E, and F were enri-
ched in proteins involved in cell-cycle, proteolysis, regulation of
developmental process, and apoptosis. Ninety-two proteins
(up- or down-regulated during differentiation) out of 96
proteins, which could be detected on the CBB-stained gels,
were excised and subsequently subjected to MS analysis. The
protein spots were analyzed by MALDI TOF-TOF MS/MS on
the basis of a combined peptide mass fingerprinting and MS/
MS analysis, leading to the identification of 87 proteins (Fig. 3
and Supporting Information Tables 2 and 3).
The identified proteins belonged to different biological
processes including development (13.9%), RNA processing
(13.6%), regulation of cell cycle (12.5%), neurogenesis
(10.1%), amino acid phosphorylation (8.5%), protein folding
(4.8%), cell cycle (4.5%), transporter activity (4%), and
translation regulator activity (3.9%).
3.3 Verification of differentially expressed proteins
by Western blot analysis
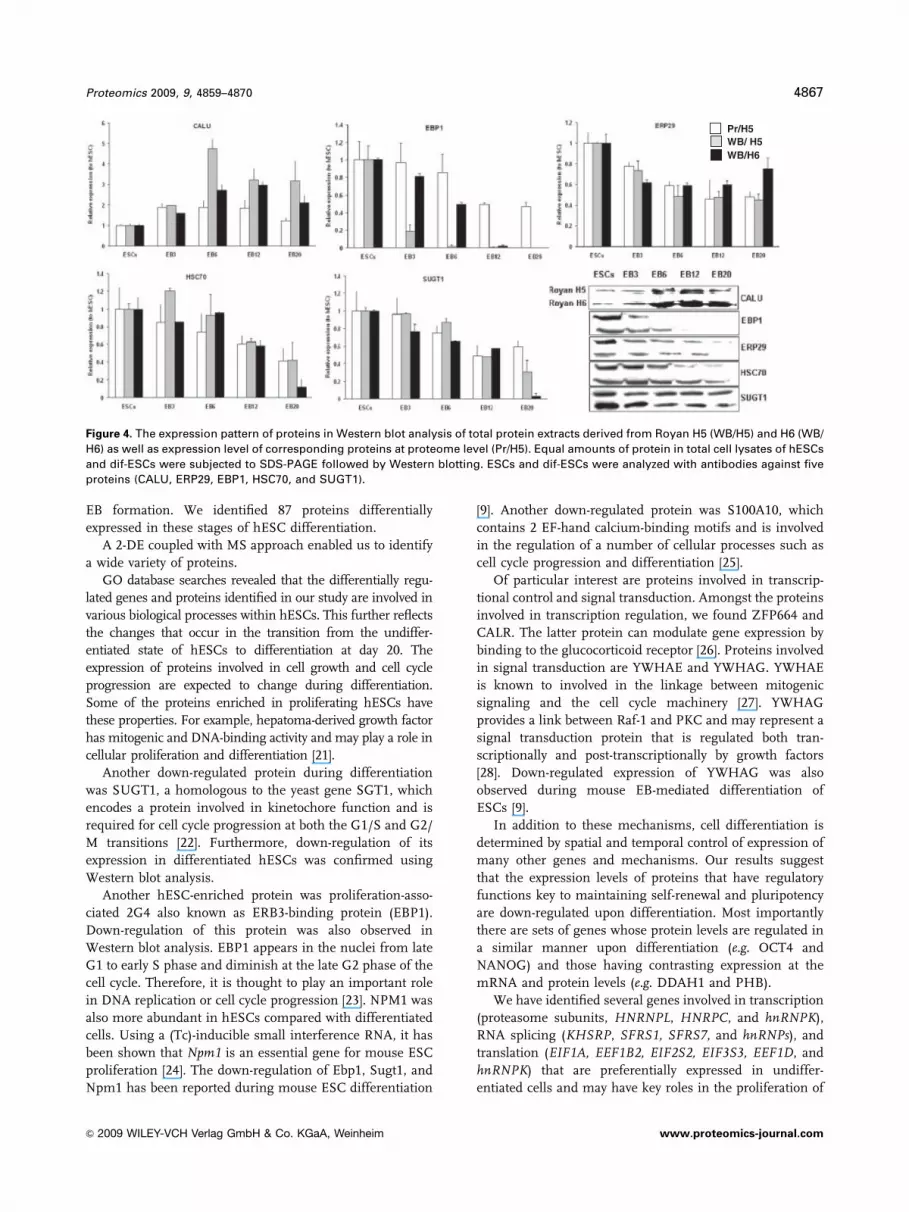
To further verify the proteome data, we examined the expres-
sion levels of five proteins, CALU, ERP29, EBP1, HSC70,
SUGT1, by Western blotting, using protein extracts derived
from the Royan H5 cell line. The results are shown in Fig. 4
Proteomics 2009, 9, 4859–4870 4863
& 2009 WILEY-VCH Verlag GmbH & Co. KGaA, Weinheim www.proteomics-journal.com

and Supporting Information Fig. 1. The level of expression of
EBP1, HSC70, and SUGT1 was very similar in Western blot
and 2-DE results. Although, the expression level of CALU and
ERP29 was slightly different in Western blot analysis
compared with proteome result, the down-regulation of
proteins was observed in both methods. This difference could
be attributed to possible presence of different forms of proteins
on 2-DE gels. The expression levels of these proteins were
further analyzed in another hESC line, Royan H6, which
showed similar results to Royan H5.
3.4 Transcriptional dynamics of differentiation EB
formation
As a first level of quality control of the hybridized RNA
samples, the transcriptional profiles of all the replicate samples
were assessed for their correlation with respect to biological
reproducibility (Supporting Information Fig. 2). All triplicate
mRNA samples cluster together with the exception of one of
the EB3 samples, which shares a correlation coefficient of 0.94
with EB6 samples. In general, all replicates of a single stage
A
F
G IH
J
D E
K
0
20
40
60
80
100
120
0 d 3 d 6 d 12 d 12+8 d
% P
ositi
ve C
ells
Nanog Oct4SSEA-4 Tra 1-60SSEA-4/Tra 1-60 Tra 1-81SSEA-4/Tra 1-81
B
L
M N O
C Figure 1. Morphological and
flow cytometry analyses of
undifferentiated and differ-
entiated hESCs. (A) Phase
contrast photomicrographs of
a colony of hESC grown under
feeder-free conditions. The
cells possess a typical undif-
ferentiated morphology with a
clear border. (B) High magni-
fication of hESC cells. Each cell
displays a compact morphol-
ogy and a high nucleus to
cytoplasmic ratio, containing
prominent nucleoli typical of
undifferentiated hESC. (C) The
hESC line had a normal
karyotype (46 XX). Repre-
sentative flow cytometric
analysis of key hESC markers
including NANOG (D), OCT-4
(E), SSEA-4 (F), Tra-1-60 (G),
Tra-1-81 (H), expression on
hESCs. The cells expressing
markers compared with
isotype control (white peaks)
were termed marker-positive
population. Percentages of
double positive for SSEA-4/
TRA-1-60 (I) and SSEA-4/TRA-
1-81 (J) were indicated in the
dot plots. The percentages of
undifferentiated and differ-
entiated hESCs were presen-
ted in (K). We analyzed the
expression of key hESC
markers including NANOG
(D), OCT-4 (E), SSEA-4 (F), Tra-
1-60 (G), Tra-1-81 (H), and
SSEA-4 and Tra-1-60 or Tra-1-
81 using two-color flow cyto-
metry (I and J). The differ-
entiating EBs were cultured in
suspension for 12 days (L 5
day3, M 5 day6, and N 5
day12) and then plated onto
gelatin-coated dishes for a
further 8 days in the same
medium to form a pool of
spontaneously differentiated
cells (O).
4864 A. Fathi et al. Proteomics 2009, 9, 4859–4870
& 2009 WILEY-VCH Verlag GmbH & Co. KGaA, Weinheim www.proteomics-journal.com
have a correlation coefficient between 0.98 and 1.0. A total of
6187 transcripts were found modulated during differentiation
(Supporting Information Table 4).
A comparison between ESCs and dif-ESCs revealed that
the changes in expression pattern were more pronounced in
EBs compared with ESCs and the number of differentiation
regulated protein increased during differentiation
(Supporting Information Fig. 3). Unlike proteome response,
the number of up-regulated transcripts during differentia-
tion was higher than down-regulated ones. The expression
pattern of ectodermal, mesodermal, and endodermal
markers in EBs showed that spontaneously differentiated
cells represented a mixture of various cell types in the
outgrowths of the EBs (Supporting Information Table 5).
3.5 Verification of differentially expressed mRNA
Real-time PCR confirmations were carried out for genes
selected from four different groups: (i) pluripotency markers
OCT4 and NANOG, (ii) genes where the expression of the
mRNA is up-regulated but the protein down-regulated
(e.g. S100A10, HSPA5, ZNF664), (iii) genes where the
expression of the mRNA is down-regulated but the protein
up-regulated (e.g. PHB, DDAH1, ATIC), and (iv) both
mRNA and protein are up-regulated upon differentiation
(e.g. CAPNS1, CALU).
The RNA samples considered for confirmation were
undifferentiated ES cells and EB20. In nine out of ten
reactions the microarray-derived differential expression
could be confirmed at a confidence level of 90%. In just one
case, namely HSPA5, the up-regulation of the mRNA at day
20 detected by microarray could not be confirmed by real-
time PCR (Supporting Information Fig. 4).
3.6 GO of transcriptome and proteome data
Enrichment analysis of GO categories was performed
using BiNGO. Supporting Information Fig. 5 represents
significantly over- and under-represented GO cellular
component, molecular function, and biological process
terms for the set of differentially expressed transcripts and
proteins.
177
54
395
400
638
840
10
68
8691
186
471
485
755
795
872
889
216222
290 134
325
582
643
314
797
875
808
817
931
932
573
pI=4-7
Mr(KD)
97
67
43
30
20
14
53
131
141
167
194
221
223
267
542723730
313
393461
46446
562 639641
727757
821
828
854
920
912291
320 327425
426
445 528
551
623
848
876 877878
882
944
945
611
ESC
ESC EB3 EB6 EB12 EB20 ESC EB3 EB6 EB12 EB20
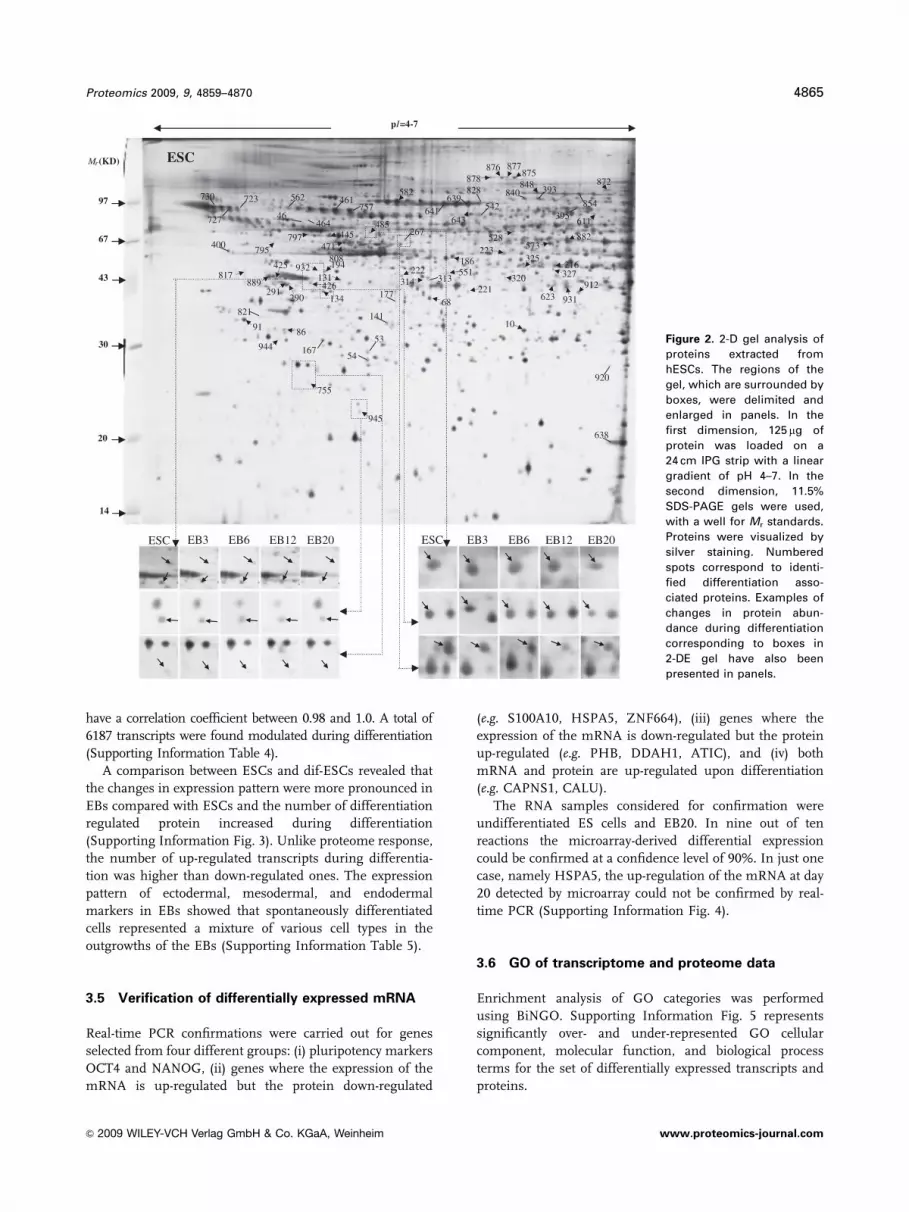
Figure 2. 2-D gel analysis of
proteins extracted from
hESCs. The regions of the
gel, which are surrounded by
boxes, were delimited and
enlarged in panels. In the
first dimension, 125 mg of
protein was loaded on a
24 cm IPG strip with a linear
gradient of pH 4–7. In the
second dimension, 11.5%
SDS-PAGE gels were used,
with a well for Mr standards.
Proteins were visualized by
silver staining. Numbered
spots correspond to identi-
fied differentiation asso-
ciated proteins. Examples of
changes in protein abun-
dance during differentiation
corresponding to boxes in
2-DE gel have also been
presented in panels.
Proteomics 2009, 9, 4859–4870 4865
& 2009 WILEY-VCH Verlag GmbH & Co. KGaA, Weinheim www.proteomics-journal.com
In the biological process category, a comparison between
transcriptome and proteome data sets revealed that the
primary metabolisms and protein metabolisms were over-
represented in transcriptome and proteome data sets,
respectively. However, regulatory genes categories such as
regulation of biological and cellular processes, regulation of
signal transduction, and cell differentiation were specifically
over-represented in transcriptome data sets (Supporting
Information Figs. 5A and D). In the molecular function
category, protein binding and RNA binding proteins were
over-represented in the proteome data set (Supporting
Information Fig. 5B). At the transcript level (Supporting
Information Fig. 5D), in addition to protein binding and
catalytic activities, genes involved in transcription regulation
were over-represented as expected.
As shown in Supporting Information Fig. 5C, in the
cellular component category for proteome data set, GO
terms related to intracellular and cytoplasm were over-
represented whereas membrane proteins were under-
represented. However, in the cellular component category
for the transcriptome data set (Supporting Information
Fig. 5F), cytoplasm, nucleus, and membrane proteins were
over-represented and ribosomal and ribonucleoprotein
complexes, and cystoskeleton were under-represented. Out
of 6187 transcripts differentially expressed during differ-
entiation, 75 and 177 plasma membrane transcripts were
hESCs and EBs enriched, respectively (Supporting Infor-
mation Table 6). These findings suggested that tran-
scriptome analysis may provide valuable information about
the expression profile of plasma membrane genes during
differentiation, which hypothetically might be investigated
in future studies as surface markers of differentiation.
4 Discussion
4.1 Proteome analysis
In this study, we report an extensive comparative analysis of
the transcriptome and proteome of hESCs during prolif-
eration and at different stages of differentiation defined by
821 YWHAE
EB3 EB6 EB12 EB20Spotno
AB
CD
FE
Genesymbol
AccessionnoC
lust
er
920 PSMB2825 KRT19461 CASP3716 KRT1787 N.I 528 ALB 828 ALB 757 HNRPK 221 KRT1 744 N.I 799 N.I 739 N.I 727 N.I 167 CAPNS154 CBX5 53 SERPINB1324 VDAC1 755 C6ORF108541 N.I 908 TATDN1730 CALR 877 KRT1 466 TUBA1B 177 SFRS1 854 TRAF1 393 ATIC 945 EIF1A 425 HDGF 267 TXNDC5 464 TUBA1C 542 N.I 638 PPIA 887 HSPA8 400 CALU 795 RNH1 395 STIP1 872 KHSRP 633 S100A10 729 PSMG2 912 CNN2 944 UCHL3 314 EIF2S2 611 HNRNPL 134 EEF1D 68 PPA1 216 EIF3S3 91 EEF1B2 131 SUGT1 141 PHB 723 KRT1 222 CAPZA1 31 ECHS1 10 ERP29 485 GRSF1 641 METAP2 327 MRPS22 588 NDUFS1 808 NSFL1C 738 PPAPDC1A 471 PSMC4 817 TRB 797 TUBB 840 UBE2C 562 UBQLN1 86 YWHAG 737 ZNF664 150 HSPA5 582 HSPA8 194 HNRPC 889 NPM1 573 PA2G4 426 NPM1 223 AHCY 325 GALKL1 643 N.I 639 ALB 878 VCL 931 ALDH1B1 445 ATP5B 882 ENO1 717 NAP1L4 320 PPP1CA 186 PSMD13 623 SFRS7 886 VCP 848 VIL2 551 NPM1 878 VCL 875 VCL 64 KRT1 313 DDAH
291 NPM1 932 HNRPC 290 NPM1
P62258
P49721P08727 Q5HYI3 P04264
P02769 P02769 P61978 P04264
P04632 P45973 Q9UIV8 P21796 O43598
Q9BY40 P27797 P04264 P68363 Q07955 Q13077 P31939 P41567 P51858 Q8NBS9 Q9BQE3
P62937 P11142.2 O43852 Q96FD7 Q5TZU9 Q92945 Q6FGE5 Q9P1R6 Q99439 P15374 Q5TDH5 P14866 P29692 Q5SQT7 Q5BKY2 P24534 Q9Y2Z0 P35232 P04264 P52907 P30084 P30040 Q12849 P50579 P82650 P28331 Q9UNZ2 Q5VZY2 P43686 P04435 P07437 O00762 Q9UMX0 P61981 Q8N3J9 P11021 P11142.2 P07910 P06748 Q9UQ80 P06748 P23526 P51570
P02769 P18206 Q9BV45 P06576 Q53HR3 Q99733 P62136 Q53XU2 Q16629 Q96IF9 P15311 P06748 P18206 P18206 P04264 O94760
P06748 P07910 P06748
719 N.I
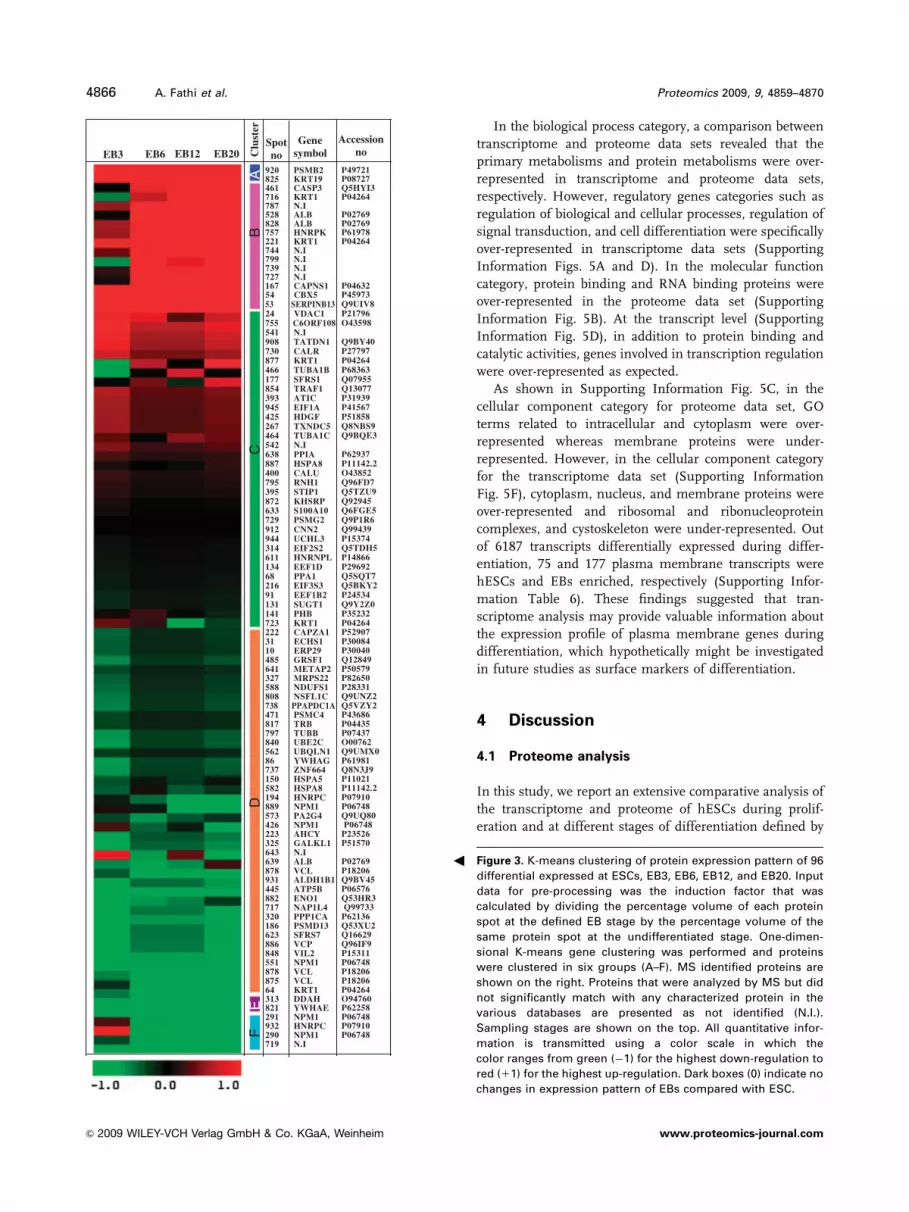
Figure 3. K-means clustering of protein expression pattern of 96
differential expressed at ESCs, EB3, EB6, EB12, and EB20. Input
data for pre-processing was the induction factor that was
calculated by dividing the percentage volume of each protein
spot at the defined EB stage by the percentage volume of the
same protein spot at the undifferentiated stage. One-dimen-
sional K-means gene clustering was performed and proteins
were clustered in six groups (A–F). MS identified proteins are
shown on the right. Proteins that were analyzed by MS but did
not significantly match with any characterized protein in the
various databases are presented as not identified (N.I.).
Sampling stages are shown on the top. All quantitative infor-
mation is transmitted using a color scale in which the
color ranges from green (�1) for the highest down-regulation to
red (11) for the highest up-regulation. Dark boxes (0) indicate no
changes in expression pattern of EBs compared with ESC.
3
4866 A. Fathi et al. Proteomics 2009, 9, 4859–4870
& 2009 WILEY-VCH Verlag GmbH & Co. KGaA, Weinheim www.proteomics-journal.com
EB formation. We identified 87 proteins differentially
expressed in these stages of hESC differentiation.
A 2-DE coupled with MS approach enabled us to identify
a wide variety of proteins.
GO database searches revealed that the differentially regu-
lated genes and proteins identified in our study are involved in
various biological processes within hESCs. This further reflects
the changes that occur in the transition from the undiffer-
entiated state of hESCs to differentiation at day 20. The
expression of proteins involved in cell growth and cell cycle
progression are expected to change during differentiation.
Some of the proteins enriched in proliferating hESCs have
these properties. For example, hepatoma-derived growth factor
has mitogenic and DNA-binding activity and may play a role in
cellular proliferation and differentiation [21].
Another down-regulated protein during differentiation
was SUGT1, a homologous to the yeast gene SGT1, which
encodes a protein involved in kinetochore function and is
required for cell cycle progression at both the G1/S and G2/
M transitions [22]. Furthermore, down-regulation of its
expression in differentiated hESCs was confirmed using
Western blot analysis.
Another hESC-enriched protein was proliferation-asso-
ciated 2G4 also known as ERB3-binding protein (EBP1).
Down-regulation of this protein was also observed in
Western blot analysis. EBP1 appears in the nuclei from late
G1 to early S phase and diminish at the late G2 phase of the
cell cycle. Therefore, it is thought to play an important role
in DNA replication or cell cycle progression [23]. NPM1 was
also more abundant in hESCs compared with differentiated
cells. Using a (Tc)-inducible small interference RNA, it has
been shown that Npm1 is an essential gene for mouse ESC
proliferation [24]. The down-regulation of Ebp1, Sugt1, and
Npm1 has been reported during mouse ESC differentiation
[9]. Another down-regulated protein was S100A10, which
contains 2 EF-hand calcium-binding motifs and is involved
in the regulation of a number of cellular processes such as
cell cycle progression and differentiation [25].
Of particular interest are proteins involved in transcrip-
tional control and signal transduction. Amongst the proteins
involved in transcription regulation, we found ZFP664 and
CALR. The latter protein can modulate gene expression by
binding to the glucocorticoid receptor [26]. Proteins involved
in signal transduction are YWHAE and YWHAG. YWHAE
is known to involved in the linkage between mitogenic
signaling and the cell cycle machinery [27]. YWHAG
provides a link between Raf-1 and PKC and may represent a
signal transduction protein that is regulated both tran-
scriptionally and post-transcriptionally by growth factors
[28]. Down-regulated expression of YWHAG was also
observed during mouse EB-mediated differentiation of
ESCs [9].
In addition to these mechanisms, cell differentiation is
determined by spatial and temporal control of expression of
many other genes and mechanisms. Our results suggest
that the expression levels of proteins that have regulatory
functions key to maintaining self-renewal and pluripotency
are down-regulated upon differentiation. Most importantly
there are sets of genes whose protein levels are regulated in
a similar manner upon differentiation (e.g. OCT4 and
NANOG) and those having contrasting expression at the
mRNA and protein levels (e.g. DDAH1 and PHB).
We have identified several genes involved in transcription
(proteasome subunits, HNRNPL, HNRPC, and hnRNPK),
RNA splicing (KHSRP, SFRS1, SFRS7, and hnRNPs), and
translation (EIF1A, EEF1B2, EIF2S2, EIF3S3, EEF1D, and
hnRNPK) that are preferentially expressed in undiffer-
entiated cells and may have key roles in the proliferation of
WB/H6 WB/ H5 Pr/H5
Figure 4. The expression pattern of proteins in Western blot analysis of total protein extracts derived from Royan H5 (WB/H5) and H6 (WB/
H6) as well as expression level of corresponding proteins at proteome level (Pr/H5). Equal amounts of protein in total cell lysates of hESCs
and dif-ESCs were subjected to SDS-PAGE followed by Western blotting. ESCs and dif-ESCs were analyzed with antibodies against five
proteins (CALU, ERP29, EBP1, HSC70, and SUGT1).
Proteomics 2009, 9, 4859–4870 4867
& 2009 WILEY-VCH Verlag GmbH & Co. KGaA, Weinheim www.proteomics-journal.com
ESCs. Further studies are needed to elucidate the detailed
and specific roles of these proteins in maintaining self-
renewal of hESCs. Changes in expression of several of these
genes including hnRNPK, EEF1B2, and EEF1D during
differentiation have been reported in mouse ESCs [9, 29].
We observed higher expression of HSPA5 and HSPA8 in
undifferentiated ESCs. The heat shock proteins serve as
chaperones, being involved in protein folding, assembly,
and transportation [30]. Although the biological role of these
HSPs in hESC differentiation is not yet known, there is a
growing body of evidence linking chaperone-like molecules
to the regulation of cell proliferation and differentiation [31,
32]. Interestingly, HSPA8 protein has been suggested as a
novel cell-surface marker for undifferentiated hESCs [33].
Although its biological role is currently unknown, it has
been speculated that it might be associated with immune
responses [33]. The mouse ortholog of HSPA5 has also been
shown to be down-regulated upon differentiation of mouse
ES cells [29].
Changes in expression of several proteins related to
cytoskeleton and cell shape including Keratin 1, Keratin 19,
Tubulin, and Calponin 2, and Vinculin were observed.
While differentiation may cause changes in cell shape,
several studies have noted that changes in cell shape
themselves can regulate biological processes such as
proliferation [34] and differentiation [35].
4.2 Transcriptomics
A unique feature of our study is the comparative analysis of
the proteome and transcriptome of the same batch of
cultured cells. The analysis revealed that the complete loss
of expression of the self-renewal factors OCT4 and NANOGoccurred on day 6 and beyond (EB6 till EB20). This is
further manifested by the gradual reduction in the correla-
tion coefficients between the undifferentiated cells and the
derived EBs. For example, the correlation between undif-
ferentiated H5A and EB3 is 0.98 and as low as 0.80 when
compared with EB20.
4.3 Integration of transcriptomics and proteomics
data
In the present study, we have shown both global and indi-
vidual (single genes and proteins) regulation during differ-
entiation of hESCs by transcriptome and proteome analyses.
A total of 6187 transcripts and 97 proteins were found
modulated during differentiation. This clearly points to the
technical challenges one faces with proteomic analysis. In
the future more sensitive proteomic platforms such as
SILAC will have to be employed for studies such as we have
presented here. There is emerging evidence that suggests
that combining proteomics and transcriptomics analysis of
the same samples can provide further insights into complex
mechanisms.
We analyzed the correlations between mRNA and protein
levels at different stages.
The protein spots for correlation analysis were selected
from proteome map generated by Baharvand et al. [36] and
the current study. The expression levels of a large number of
proteins that migrated to more than one spot (presumably
due to differential protein processing or modifications) were
calculated by integrating the intensities of the different
spots. The 262 proteins on 2-DE were correlated to corre-
1 2 3 4 5 6 7
8 9 10 11 12 13 14
15 16 17 18 19 20 21
22 23 24 25 26 27 28
29 30 31 32 33 34 35
36 37 38 39 40 41 42
43 44 45 46 47 48 49
50 51 52 53 54 55 56
1
0
-1
Pro
tein
mR
NA
EB3/ESC EB6/ESC EB12/ESC EB20/ESCA
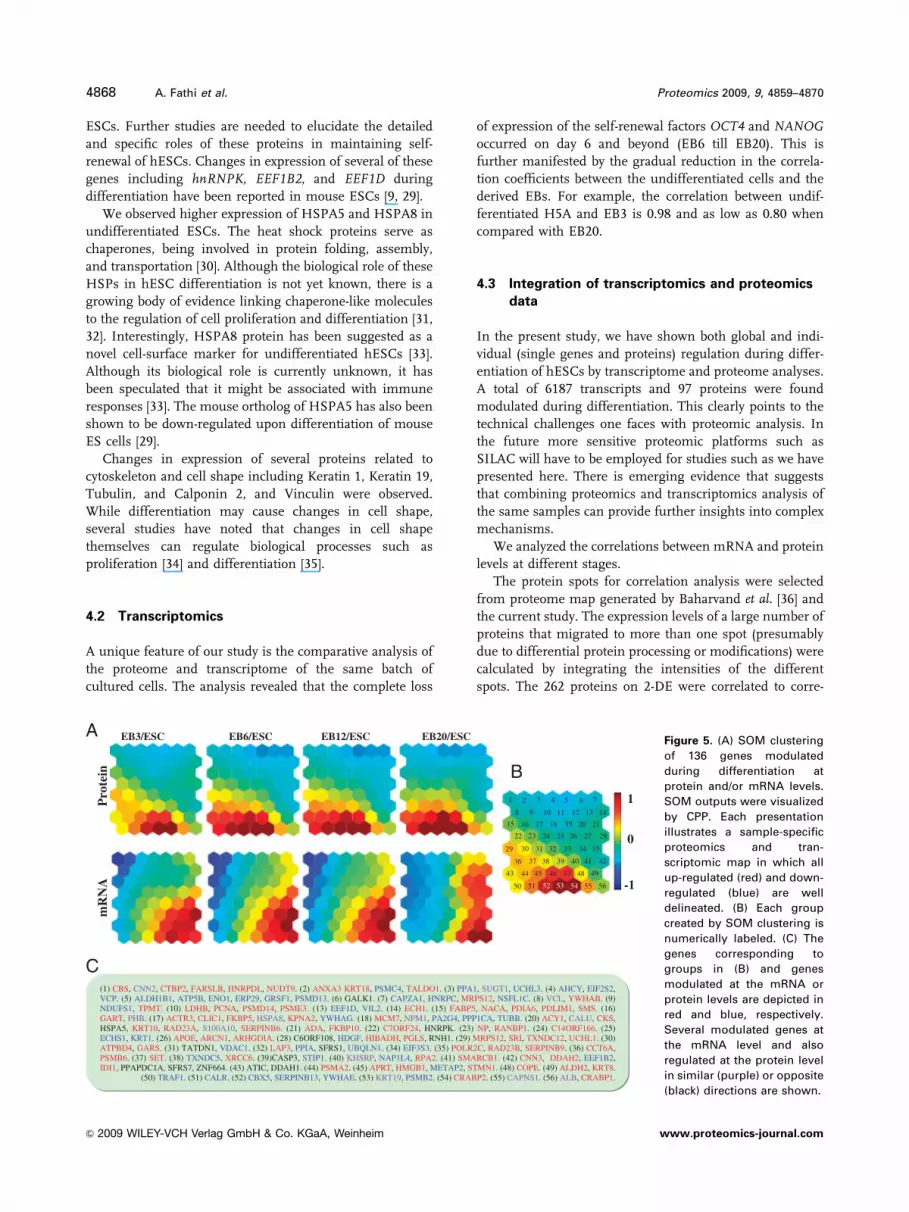
C(1) CBS, CNN2, CTBP2, FARSLB, HNRPDL, NUDT9. (2) ANXA3 KRT18, PSMC4, TALDO1. (3) PPA1, SUGT1, UCHL3. (4) AHCY, EIF2S2,VCP. (5) ALDH1B1, ATP5B, ENO1, ERP29, GRSF1, PSMD13. (6) GALK1. (7) CAPZA1, HNRPC, MRPS12, NSFL1C. (8) VCL, YWHAB. (9) NDUFS1, TPMT. (10) LDHB, PCNA, PSMD14, PSME3. (13) EEF1D, VIL2. (14) ECH1. (15) FABP5, NACA, PDIA6, PDLIM1, SMS. (16) GART, PHB. (17) ACTR3, CLIC1, FKBP5, HSPA8, KPNA2, YWHAG. (18) MCM7, NPM1, PA2G4, PPP1CA, TUBB. (20) ACY1, CALU, CKS,HSPA5, KRT10, RAD23A, S100A10, SERPINB6. (21) ADA, FKBP10. (22) C7ORF24, HNRPK. (23) NP, RANBP1. (24) C14ORF166. (25)ECHS1, KRT1. (26) APOE, ARCN1, ARHGDIA. (28) C6ORF108, HDGF, HIBADH, PGLS, RNH1. (29) MRPS12, SRI, TXNDC12, UCHL1. (30) ATPBD4, GARS. (31) TATDN1, VDAC1. (32) LAP3, PPIA, SFRS1, UBQLN1. (34) EIF3S3. (35) POLR2C, RAD23B, SERPINB9. (36) CCT6A,PSMB6. (37) SET. (38) TXNDC5, XRCC6. (39)CASP3, STIP1. (40) KHSRP, NAP1L4, RPA2. (41) SMARCB1. (42) CNN3, DDAH2, EEF1B2,IDI1, PPAPDC1A, SFRS7, ZNF664. (43) ATIC, DDAH1. (44) PSMA2. (45) APRT, HMGB1, METAP2, STMN1. (48) COPE. (49) ALDH2, KRT8.
(50) TRAF1. (51) CALR. (52) CBX5, SERPINB13, YWHAE. (53) KRT19, PSMB2. (54) CRABP2. (55) CAPNS1. (56) ALB, CRABP1.
B
Figure 5. (A) SOM clustering
of 136 genes modulated
during differentiation at
protein and/or mRNA levels.
SOM outputs were visualized
by CPP. Each presentation
illustrates a sample-specific
proteomics and tran-
scriptomic map in which all
up-regulated (red) and down-
regulated (blue) are well
delineated. (B) Each group
created by SOM clustering is
numerically labeled. (C) The
genes corresponding to
groups in (B) and genes
modulated at the mRNA or
protein levels are depicted in
red and blue, respectively.
Several modulated genes at
the mRNA level and also
regulated at the protein level
in similar (purple) or opposite
(black) directions are shown.
4868 A. Fathi et al. Proteomics 2009, 9, 4859–4870
& 2009 WILEY-VCH Verlag GmbH & Co. KGaA, Weinheim www.proteomics-journal.com

sponding mRNA in microarray analysis. Of them, 136
changed significantly during differentiation at mRNA and/
or protein levels. Genes were excluded from the correlation
analysis if no mRNA expression data were available for the
protein or more than a single mRNA was presented in
microarray analysis for a single gene. The correlations were
measured by Pearson’s method between 262 paired protein
and transcript as well as 136 differentiation expressed
mRNA and/or proteins. As shown in Supporting Informa-
tion Fig. 6, there was a low correlation between RNA and
protein abundance levels.
To find out links between transcriptome and proteome, the
expression of 136 differentially expressed genes at the level of
proteins and/or mRNAs were simplified and visualized by
CPP-SOM analyses (Fig. 5 and Supporting Information Table
7). As shown in Fig. 5A, the CPP-SOM outputs offered a
global view of mRNA and protein clustering, particularly with
respect to the expression patterns of clustered genes. This
approach allowed the illustration of SOM outputs in multiple,
vector component specific presentations. Each of these
presentations illustrated values of a single vector component
in all map units. For instance, the first presentation (EB3/
ESC protein expression) in Fig. 5A shows the SOM values of
clustered proteins of all map units (136 transcript or protein)
at the EB3 and last one (EB20/ESC mRNA expression) shows
the SOM values of clustered mRNA of all map units at the
EB20. Each of these presentations also presented sample
specific expression, in which all up-regulated units (hexagons
in red), down-regulated units (hexagons in blue), and
moderately transcribed units (hexagons in green and yellow)
were well delineated. Therefore, it was straightforward to
determine functional significances of genes regulated at
protein and/or transcript level at each sampling point during
differentiation. By comparing these presentations, we could
correlate the expression pattern of protein with mRNA. The
expression pattern of mRNA and protein of genes mapped at
two upper corners suggested that the genes on the left were
down-regulated mainly at mRNA level whereas the genes on
the right were mainly down-regulated at protein level. The
expression of genes mapped to the two bottom corners
demonstrated that protein levels of corresponding genes in
the bottom left corner were particularly increased at the end
of differentiation (EB20), whereas the progressively increased
expression level of mRNAs in the right corner showed that
these genes were modulated mainly at mRNA. Overall, the
comparative analysis revealed that proteomic and tran-
scriptomic data are complementary rather than duplicative.
Overall, the differentially expressed genes could be clus-
tered in four different groups (Figs. 5B and C): (i) Both
mRNA and protein were modulated upon differentiation in
the same direction. This group was composed of only 12
genes mainly involved in cytoskeleton organization and
biogenesis. (ii) Thirteen mRNAs and their corresponding
proteins were modulated upon differentiation but in oppo-
site directions. This category was enriched in genes involved
in primary metabolisms and RNA processing. (iii) The
expression levels of 40 proteins changed during differ-
entiation but the level of corresponding mRNAs did not
change significantly. Proteins involved in metabolic process
and protein metabolism and processing were over-repre-
sented in this category. (vi) The expression levels of 71
mRNAs were modulated but the level of the corresponding
proteins did not change significantly. Genes involved in
metabolisms and regulations of cellular processes were over-
represented in this analysis.
However, application of current technologies to establish
a direct correlation between transcriptomics and proteomics
data is challenging due to multiple layers of discrepancies
such as the distinct sensitivities of microarray and 2-DE,
differences in mRNA stability and the translational effi-
ciency of different genes, posttranslational modifications of
proteins, and timing discordance of modulation at mRNA
and protein levels. Our results showed that proteomics and
transcriptomics data are complementary rather than dupli-
cative. For example, modulation of several proteins involved
in cell growth and cell cycle (e.g. hepatoma-derived growth
factor, proliferation-associated 2G4, STIP1), transcription
regulation (CALR), signal transduction (YWHAE and
YWHAG), transcription (PSMD13 and HNRP), and trans-
lation (EEF1B2, EIF2S2, EIF3S3, EEF1D) was revealed only
by proteome analysis.
This project was partially funded by grants from RoyanInstitute, Iran to B.H. and G.H.S. and from the Max PlanckSociety to J.A.
The authors have declared no conflict of interest.
5 References
[1] Blaumueller, C. M., Artavanis-Tsakonas, S., Comparative
aspects of Notch signaling in lower and higher eukaryotes.
Perspect. Dev. Neurobiol. 1997, 4, 325–343.
[2] Bhattacharya, B., Cai, J., Luo,Y., Miura, T. et al., Comparison
of the gene expression profile of undifferentiated human
embryonic stem cell lines and differentiating embryoid
bodies. BMC Dev. Biol. 2005, 5, 22.
[3] Ivanova, N. B., Dimos, J. T., Schaniel, C., Hackney, J. A.
et al., A stem cell molecular signature. Science 2002, 298,
601–604.
[4] Ramalho-Santos, M., Yoon, S., Matsuzaki, Y., Mulligan,
R. C., Melton, D. A., "Stemness": transcriptional profiling of
embryonic and adult stem cells. Science 2002, 298, 597–600.
[5] Greenbaum, D., Colangelo, C., Williams, K., Gerstein, M.,
Comparing protein abundance and mRNA expression levels
on a genomic scale. Genome Biol. 2003, 4, 117.
[6] Gygi, S. P., Rochon, Y., Franza, B. R., Aebersold, R., Corre-
lation between Protein and mRNA Abundance in Yeast.
Mol. Cell. Biol. 1999, 19, 1720.
Proteomics 2009, 9, 4859–4870 4869
& 2009 WILEY-VCH Verlag GmbH & Co. KGaA, Weinheim www.proteomics-journal.com

[7] Baharvand, H., Fathi, A., van Hoof, D., Salekdeh, G. H.,
Concise review: trends in stem cell proteomics. Stem Cells
2007, 25, 1888.
[8] Kurisaki, A., Hamazaki, T. S., Okabayashi, K., Iida, T. et al.,
Chromatin-related proteins in pluripotent mouse embryonic
stem cells are downregulated after removal of leukemia
inhibitory factor. Biochem. Biophys. Res Commun. 2005,
335, 667–675.
[9] Baharvand, H., Fathi, A., Gourabi, H., Mollamohammadi, S.,
Salekdeh, G. H., Identification of mouse embryonic stem
cell-associated proteins. J. Proteome Res. 2008, 7, 412–423.
[10] Nasrabadi, D., Rezaei Larijani, M., Pirhaji, L., Gourabi, H.
et al., Proteomic analysis of monkey embryonic stem
cell during differentiation. J. Proteome Res. 2009, 8,
1527–1539.
[11] Van Hoof, D., Passier, R., Ward-Van Oostwaard, D., Pinkse,
M. W. et al., A quest for human and mouse embryonic stem
cell-specific proteins. Mol. Cell. Proteomics 2006, 5,
1261–1273.
[12] Ideker, T., Thorsson, V., Ranish, J. A., Christmas, R. et al.,
Integrated genomic and proteomic analyses of a system-
atically perturbed metabolic network. Science 2001, 292,
929.
[13] Tian, Q., Stepaniants, S. B., Mao, M., Weng, L. et al., Inte-
grated genomic and proteomic analyses of gene expression
in mammalian cells� S. Mol. Cell. Proteomics 2004, 3,
960–969.
[14] Baharvand, H., Ashtiani, S. K., Taee, A., Massumi, M. et al.,
Generation of new human embryonic stem cell lines with
diploid and triploid karyotypes. Dev. Growth Differ. 2006,
48, 117–128.
[15] Levenstein, M. E., Ludwig, T. E., Xu, R. H., Llanas, R. A. et al.,
Basic fibroblast growth factor support of human embryonic
stem cell self-renewal. Stem Cells 2006, 24, 568.
[16] Blum, H., Beier, H., Gross, H. J., Improved silver staining of
plant proteins, RNA and DNA in polyacrylamide gels. Elec-
trophoresis 1987, 8, 93–99.
[17] Neuhoff, V., Arold, N., Taube, D., Ehrhardt, W., Improved
staining of proteins in polyacrylamide gels including
isoelectric focusing gels with clear background at nano-
gram sensitivity using Coomassie Brilliant Blue G-250 and
R-250. Electrophoresis 1988, 9, 255–262.
[18] Kaufman, L., Rousseeuw, P. J., Finding groups in data. An
introduction to cluster analysis, Wiley Series in Probability
and Mathematical Statistics. Applied Probability and
Statistics, New York, Wiley 1990.
[19] Ray, S., Turi, R. H., Determination of number of clusters in k-
means clustering and application in colour image
segmentation. Proceedings of the 4th International Confer-
ence on Advances in Pattern Recognition and Digital
Techniques (ICAPRDT’99), Calcutta, India 1999, 137–143.
[20] Maere, S., Heymans, K., Kuiper, M., BiNGO: a Cytoscape
plugin to assess overrepresentation of gene ontology
categories in biological networks. Bioinformatics 2005, 21,
3448–3449.
[21] Nakamura, H., Izumoto, Y., Kambe, H., Kuroda, T. et al.,
Molecular cloning of complementary DNA for a novel
human hepatoma-derived growth factor. Its homology with
high mobility group-1 protein. J. Biol. Chem. 1994, 269,
25143–25149.
[22] Kitagawa, K., Skowyra, D., Elledge, S. J., Harper, J. W.,
Hieter, P., SGT1 Encodes an essential component of
the yeast kinetochore assembly pathway and a novel
subunit of the SCF ubiquitin ligase complex. Mol. Cell 1999,
4, 21–33.
[23] Squatrito, M., Mancino, M., Sala, L., Draetta, G. F., Ebp1 is a
dsRNA-binding protein associated with ribosomes that
modulates eIF2alpha phosphorylation. Biochem. Biophys.
Res. Commun. 2006, 344, 859–868.
[24] Wang, B. B., Lu, R., Wang, W. C., Jin, Y., Inducible and
reversible suppression of Npm1 gene expression using
stably integrated small interfering RNA vector in mouse
embryonic stem cells. Biochem. Biophys. Res. Commun.
2006, 347, 1129–1137.
[25] Kube, E., Weber, K., Gerke, V., Primary structure of
human, chicken, and Xenopus laevis p11, a cellular ligand
of the Src-kinase substrate, annexin II. Gene 1991, 102,
255–259.
[26] Burns, K., Duggan, B., Atkinson, E. A., Famulski, K. S. et al.,
Modulation of gene expression by calreticulin binding to
the glucocorticoid receptor. Nature 1994, 367, 476–480.
[27] Conklin, D. S., Galaktionov, K., Beach, D., 14-3-3 proteins
associate with cdc25 phosphatases. Proc. Natl. Acad. Sci.
USA 1995, 92, 7892–7896.
[28] Garcia, A., Prabhakar, S., Hughan, S., Anderson, T. W. et al.,
Differential proteome analysis of TRAP-activated platelets:
Involvement of DOK-2 and phosphorylation of RGS
proteins. Blood 2004, 103, 2088–2095.
[29] Kurisaki, A., Hamazaki, T. S., Okabayashi, K., Iida, T. et al.,
Chromatin-related proteins in pluripotent mouse embryo-
nic stem cells are downregulated after removal of leukemia
inhibitory factor. Biochem. Biophys. Res. Commun. 2005,
335, 667–675.
[30] Young, J. C., Agashe, V. R., Siegers, K., Hartl, F. U., Path-
ways of chaperone-mediated protein folding in the cytosol.
Nat. Rev. Mol. Cell Biol. 2004, 5, 781–791.
[31] Wadhwa, R., Takano, S., Kaur, K., Aida, S. et al., Identifica-
tion and characterization of molecular interactions between
mortalin/mtHsp70 and HSP60. Biochem. J. 2005, 391, 185.
[32] Yamada, T., Hashiguchi, A., Fukushima, S., Kakita, Y. et al.,
Function of 90-kDa heat shock protein in cellular differ-
entiation of human embryonal carcinoma cells. In Vitro Cell.
Dev. Biol. Anim. 2000, 36, 139–146.
[33] Son, Y. S., Park, J. H., Kang, Y. K., Park, J. S. et al., Heat
shock 70-kDa protein 8 isoform 1 is expressed on the
surface of human embryonic stem cells and downregulated
upon differentiation. Stem Cells 2005, 23, 1502.
[34] Chen, C. S., Mrksich, M., Huang, S., Whitesides, G. M.,
Ingber, D. E., Geometric control of cell life and death.
Science 1997, 276, 1425–1428.
[35] Novak, A., Hsu, S. C., Leung-Hagesteijn, C., Radeva, G. et al.,
Cell adhesion and the integrin-linked kinase regulate the
LEF-1 and beta-catenin signaling pathways. Proc. Natl.
Acad. Sci. USA 1998, 95, 4374–4379.
4870 A. Fathi et al. Proteomics 2009, 9, 4859–4870
& 2009 WILEY-VCH Verlag GmbH & Co. KGaA, Weinheim www.proteomics-journal.com