transcriptome profiling of longissimus thoracis muscles
TRANSCRIPT
RESEARCH ARTICLE
Transcriptome profiling of longissimus thoracis
muscles identifies highly connected
differentially expressed genes in meat type
sheep of India
Reena AroraID1*, Naveen Kumar S.2, Sudarshan S.2, Mohamed Nadeem Fairoze2,
Mandeep Kaur1, Anju Sharma1, Yashila Girdhar1, Sreesujatha R. M.2, Suresh K. Devatkal3,
Sonika Ahlawat1, Ramesh Kumar Vijh1, Manjunatha S. S.2
1 ICAR-National Bureau of Animal Genetic Resources, Karnal, Haryana, India, 2 Karnataka Veterinary
Animal and Fisheries Sciences University, Bangalore, Karnataka, India, 3 ICAR-National Research Centre
on Meat, Hyderabad, Telangana, India
Abstract
This study describes the muscle transcriptome profile of Bandur breed, a consumer
favoured, meat type sheep of India. The transcriptome was compared to the less desirable,
unregistered local sheep population, in order to understand the molecular factors related to
muscle traits in Indian sheep breeds. Bandur sheep have tender muscles and higher backfat
thickness than local sheep. The longissimus thoracis transcriptome profiles of Bandur and
local sheep were obtained using RNA sequencing (RNA Seq). The animals were male, non-
castrated, with uniform age and reared under similar environment, as well as management
conditions. We could identify 568 significantly up-regulated and 538 significantly down-regu-
lated genes in Bandur sheep (p�0.05). Among these, 181 up-regulated and 142 down-regu-
lated genes in Bandur sheep, with a fold change�1.5, were considered for further analysis.
Significant Gene Ontology terms for the up-regulated dataset in Bandur sheep included
transporter activity, substrate specific transmembrane, lipid and fatty acid binding. The
down-regulated activities in Bandur sheep were mainly related to RNA degradation, regula-
tion of ERK1 and ERK2 cascades and innate immune response. The MAPK signaling path-
way, Adipocytokine signaling pathway and PPAR signaling pathway were enriched for
Bandur sheep. The highly connected genes identified by network analysis were CNOT2,
CNOT6, HSPB1, HSPA6, MAP3K14 and PPARD, which may be important regulators of
energy metabolism, cellular stress and fatty acid metabolism in the skeletal muscles. These
key genes affect the CCR4-NOT complex, PPAR and MAPK signaling pathways. The highly
connected genes identified in this study, form interesting candidates for further research on
muscle traits in Bandur sheep.
PLOS ONE | https://doi.org/10.1371/journal.pone.0217461 June 6, 2019 1 / 15
a1111111111
a1111111111
a1111111111
a1111111111
a1111111111
OPEN ACCESS
Citation: Arora R, S. NK, S. S, Fairoze MN, Kaur M,
Sharma A, et al. (2019) Transcriptome profiling of
longissimus thoracis muscles identifies highly
connected differentially expressed genes in meat
type sheep of India. PLoS ONE 14(6): e0217461.
https://doi.org/10.1371/journal.pone.0217461
Editor: Juan J. Loor, University of Illinois, UNITED
STATES
Received: August 14, 2018
Accepted: May 13, 2019
Published: June 6, 2019
Copyright: © 2019 Arora et al. This is an open
access article distributed under the terms of the
Creative Commons Attribution License, which
permits unrestricted use, distribution, and
reproduction in any medium, provided the original
author and source are credited.
Data Availability Statement: All raw sequence
data files are available from the NCBI Short Read
Archive database (accession number(s)
SRR6260350- SRR6260357).
Funding: This work was supported by the Institute
funds of Indian Council of Agricultural Research-
National Bureau of Animal Genetic Resources
(ICAR-NBAGR), Karnal, India, and not by any
external funding.
Competing interests: The authors have declared
that no competing interests exist.
Introduction
India possesses 6% of the world’s sheep population [1], with 42 registered breeds & several
lesser known ones [2]. The economic potential of this ovine biodiversity remains underutilized
due to lack of knowledge of their genetic characteristics. Sheep contribute to 7.6% of the total
meat production in India [1]. Bandur is a famous mutton type sheep breed of India which is
preferred by consumers for its palatability. It fetches a higher price than mutton from other
breeds in the same area [3]. It is a registered breed, also known as Mandya or Bannur, mainly
distributed in Mandya district of Karnataka. The Bandur animals have a compact body, white
coat and a typical reversed U-shaped conformation from the rear [4]. Another population of
sheep found in the same area, which is not registered is referred as the local sheep.The local
sheep are medium built, heavier than Bandur, with a light brown coat colour. The geographical
and management conditions as well as available feed and fodder are similar for both popula-
tions. Mutton from Bandur sheep is favoured over local sheep by consumers. The specific
organoleptic quality of Bandur meat are attributed to the intramuscular fat content, climate
and feed, however, such claims have not been substantiated with scientific studies. The Bandur
breed is used for genetic improvement of local sheep population [3]. Despite the local popular-
ity and market potential, no scientific information is available on the uniqueness of its meat
quality or muscle traits. Some information is available on the carcass traits for Bandur sheep
[5,6,7], but genetic analysis is still lacking.
Since RNA sequencing provides comprehensive data for gene expression studies, it has
been widely used to compare transcriptomes across different tissues. RNA sequencing has led
to the discovery of differentially expressed (DE) genes for muscle growth, development as well
as meat quality of various species including cattle [8], pig [9], goat [10] and sheep [11]. The
present study is therefore, an attempt to get an overview of the skeletal muscle transcriptome
of Bandur and local sheep. The aim of the study was to compare the gene expression differ-
ences in longissimus thoracis muscles of Bandur and local sheep. Our findings will provide an
insight into the molecular factors related to muscle traits in Indian sheep breeds.
Materials and methods
Ethical statement
The samples were collected from animals that had been selected for slaughter for commercial
purpose, with prior consultation from slaughter house. The muscle samples from sheep were
purchased from local butchers. All ethical norms and guidelines were followed, with approval
from Institutional Animal Ethics Committee, ICAR-National Bureau of Animal Genetic
Resources, Karnal, Haryana, India (F.No. NBAGR/IAEC/2017, dated 21.01.2017).
Samples
Four rams of Bandur and four local sheep were identified and selected for analysis. None of
the rams were castrated. The selected animals (Bandur and local) were reared under same
management conditions. The animals were grazed on uncultivated land and no specific feed
was provided to them. All the selected animals were in the two-tooth stage (12–19 months).
Body biometry and weight of all the animals were recorded before slaughter. The animals were
slaughtered according to standard commercial ‘halal’ procedures with 12 hours fasting period
before slaughter. All the animals were slaughtered on the same day. Immediately after slaugh-
ter, about 600–700 gm of skeletal muscle sample was collected for meat quality analysis.
Approximately 5–10 gm of longissimus thoracis was immediately stored in RNAlater (Sigma-
Aldrich) for further use.
Muscle transcriptome profile of Indian sheep
PLOS ONE | https://doi.org/10.1371/journal.pone.0217461 June 6, 2019 2 / 15
Carcass and meat quality analysis
Carcass measurements like hot carcass weight, back fat thickness, fore saddle, hind saddle,
foreleg, hind leg, rib eye area, pH, temperature of carcass, water holding capacity (WHC) [12],
etc were recorded. Sensory evaluation of fresh and cooked meat was done separately by follow-
ing 9 point hedonic scale for sensory attributes viz., appearance, flavour, juiciness, texture,
mouth coating and overall acceptability [13]. Six semi trained panelists were involved in sen-
sory evaluation of fresh meat. The samples were cooked with 10 per cent water, 1.5 per cent
salt (NaCl) and 0.1 per cent turmeric powder in a pressure cooker at 15 lbs psi for 10 minutes.
Longissimus thoracis muscle was used for physico-chemical analysis. Tenderness of muscles
was measured by taking average of shear force for a sample in triplicate according to De Hui-
dobro [14]. Statistical analyses were performed using the SAS software [15]. A t-test for inde-
pendent samples was employed to compare the means. Differences between the means at the
95% (P<0.05) confidence level were considered statistically significant.
Amino acid and fatty acid analysis
For amino acid analysis the sample was acid hydrolyzed followed by derivatization [16] and
analysis in HPLC DAD (Agilent Technologies, Model: 1200 Series). The fat was extracted
from the sample, esterified with trans-methylene mixture and methyl esters were separated by
liquid-liquid partitioning with petroleum ether and distilled water [17]. Collected organic
layer was rotary evaporated and reconstituted in Petroleum ether and injected in GC_FID
(Thermo Scientific, Model: Trace GC Ultra), for fatty acid profiling.
RNA isolation and sequencing
Total RNA was extracted using Trizol method and purified using RNeasy kit (Qiagen). Four
biological replicates from Bandur as well as local sheep, with RIN value ranging from 7.0–8.3
(Agilent Bioanalyzer) were used for library preparation by TruSeq RNA Library Prep Kit v2
(Illumina). 100 bp paired end sequencing of the 8 samples was performed on Illumina HiSeq-
2000 Platform.
Data analysis
Quality of the samples was assessed using FastQC (v 0.11.5) [18]. Trimming or filtering on raw
reads was done using FastxToolkit (http://hannonlab.cshl.edu/fastx_toolkit/index.html),according to the results of FastQC. The reads were mapped against the ovine genome assembly
v4.0 (Oar_v4.0),available in NCBI (https://www.ncbi.nlm.nih.gov/assembly/GCF_000298735.2),
using TopHat v2.1.1 [19]. The abundance of the transcripts was estimated using Cufflinks v
2.2.1 [20]. All transcripts were assembled using the Cuffmerge and final transcriptome assem-
bly was received as an output. For differential expression estimation Cuffdiff was used. The dif-
ferential expression results obtained from differential expression estimation were visualized
using the R language CummeRbund package [21] and expression plots were placed. The
FPKM (Fragments per Kilobase of transcript per Million mapped reads) values were used for
quantification of gene expression. The functional annotation and enrichment in pathways of
the DE genes was carried out using DAVID [22, 23]. Genemania [24] was used to construct
the co-expression network. The network weights reflected the relevance of each gene in the
input list. The interaction network was constructed using Consensus Pathway Data Base
[25,26] and visualized using Cytoscape ver 3.6.1 [27] along with cytoHubba app [28].
Muscle transcriptome profile of Indian sheep
PLOS ONE | https://doi.org/10.1371/journal.pone.0217461 June 6, 2019 3 / 15
Validation by quantitative real time PCR (qRT-PCR)
The cDNA was synthesized with 2μg of purified total RNA, using SuperScript III Reverse
Transcriptase (Thermo Fisher Scientific), as per manufacturer’s protocol. Primer pairs for five
randomly selected DE genes were designed using Primer 3 software [29] or taken from pub-
lished sequences (S1 Table). Standard PCRs on cDNA were carried out to verify amplicon
sizes. The qRT-PCR reaction was performed in triplicate in a final volume of 10μl containing
2μl of cDNA, 8μl of qRT-PCR master mix (5μl of SYBR Green Real-Time master mix, 0.3μl
(0.3μM) of each primer, 2.4μl of DNA/RNA-free water) on Roche Light cycler 480 system. A
stock solution of 100 μM was prepared for all primers. Each primer was diluted to a concentra-
tion of 1 μM/μl, of this, 0.3 μl was used for each reaction. PCR efficiency was estimated by stan-
dard curve calculation using four points of a 5-fold dilution series of cDNA. R2 (Pearson
Correlation Coefficient) was used to determine the linearity of the curve. An R2 value >0.985
implied consistent efficiency of the reaction. The mean cycle threshold (Ct) values of the genes
were normalized to geometric mean of B2M and GAPDH which were used as reference genes
[30]. The data was analyzed by the 2-ΔΔCT method [31].
Results
Preliminary analysis of body biometry and phenotypic traits of muscle
The body biometry and some carcass traits of the animals that were used for transcriptome
analysis by RNA sequencing were recorded. Details of the body measurements are given in S2
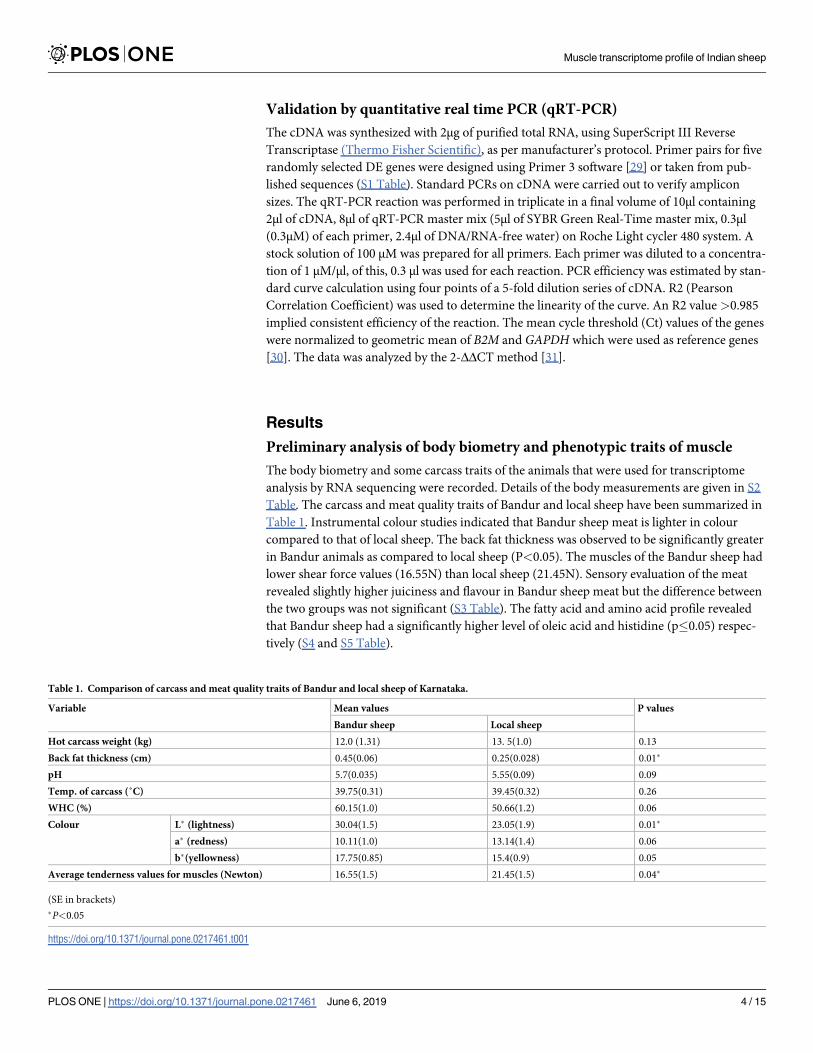
Table. The carcass and meat quality traits of Bandur and local sheep have been summarized in
Table 1. Instrumental colour studies indicated that Bandur sheep meat is lighter in colour
compared to that of local sheep. The back fat thickness was observed to be significantly greater
in Bandur animals as compared to local sheep (P<0.05). The muscles of the Bandur sheep had
lower shear force values (16.55N) than local sheep (21.45N). Sensory evaluation of the meat
revealed slightly higher juiciness and flavour in Bandur sheep meat but the difference between
the two groups was not significant (S3 Table). The fatty acid and amino acid profile revealed
that Bandur sheep had a significantly higher level of oleic acid and histidine (p�0.05) respec-
tively (S4 and S5 Table).
Table 1. Comparison of carcass and meat quality traits of Bandur and local sheep of Karnataka.
Variable Mean values P values
Bandur sheep Local sheep
Hot carcass weight (kg) 12.0 (1.31) 13. 5(1.0) 0.13
Back fat thickness (cm) 0.45(0.06) 0.25(0.028) 0.01�
pH 5.7(0.035) 5.55(0.09) 0.09
Temp. of carcass (˚C) 39.75(0.31) 39.45(0.32) 0.26
WHC (%) 60.15(1.0) 50.66(1.2) 0.06
Colour L� (lightness) 30.04(1.5) 23.05(1.9) 0.01�
a� (redness) 10.11(1.0) 13.14(1.4) 0.06
b�(yellowness) 17.75(0.85) 15.4(0.9) 0.05
Average tenderness values for muscles (Newton) 16.55(1.5) 21.45(1.5) 0.04�
(SE in brackets)
�P<0.05
https://doi.org/10.1371/journal.pone.0217461.t001
Muscle transcriptome profile of Indian sheep
PLOS ONE | https://doi.org/10.1371/journal.pone.0217461 June 6, 2019 4 / 15
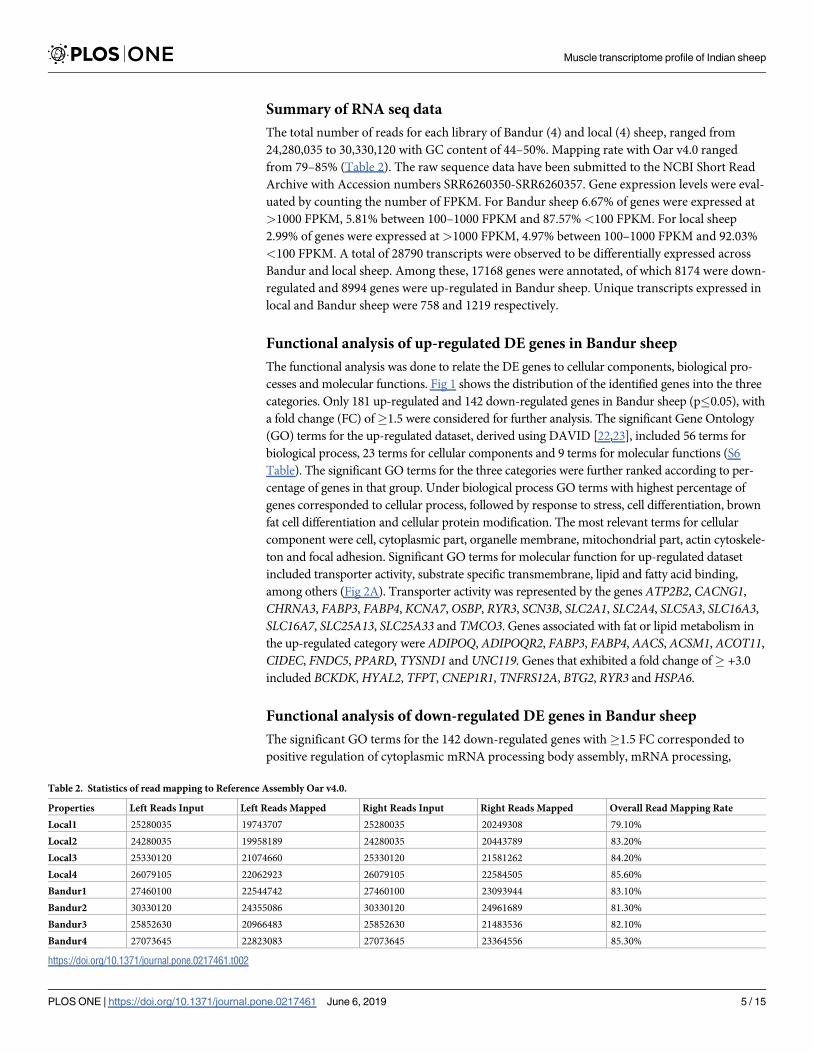
Summary of RNA seq data
The total number of reads for each library of Bandur (4) and local (4) sheep, ranged from
24,280,035 to 30,330,120 with GC content of 44–50%. Mapping rate with Oar v4.0 ranged
from 79–85% (Table 2). The raw sequence data have been submitted to the NCBI Short Read
Archive with Accession numbers SRR6260350-SRR6260357. Gene expression levels were eval-
uated by counting the number of FPKM. For Bandur sheep 6.67% of genes were expressed at
>1000 FPKM, 5.81% between 100–1000 FPKM and 87.57% <100 FPKM. For local sheep
2.99% of genes were expressed at>1000 FPKM, 4.97% between 100–1000 FPKM and 92.03%
<100 FPKM. A total of 28790 transcripts were observed to be differentially expressed across
Bandur and local sheep. Among these, 17168 genes were annotated, of which 8174 were down-
regulated and 8994 genes were up-regulated in Bandur sheep. Unique transcripts expressed in
local and Bandur sheep were 758 and 1219 respectively.
Functional analysis of up-regulated DE genes in Bandur sheep
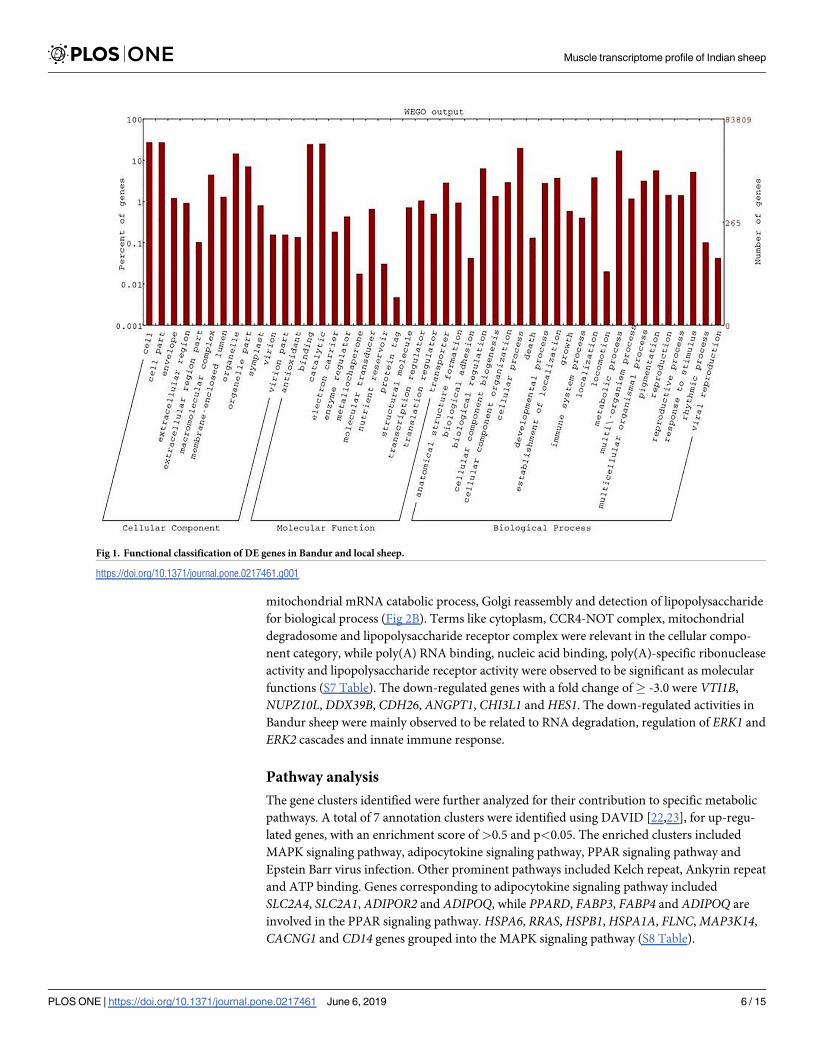
The functional analysis was done to relate the DE genes to cellular components, biological pro-
cesses and molecular functions. Fig 1 shows the distribution of the identified genes into the three
categories. Only 181 up-regulated and 142 down-regulated genes in Bandur sheep (p�0.05), with
a fold change (FC) of�1.5 were considered for further analysis. The significant Gene Ontology
(GO) terms for the up-regulated dataset, derived using DAVID [22,23], included 56 terms for
biological process, 23 terms for cellular components and 9 terms for molecular functions (S6
Table). The significant GO terms for the three categories were further ranked according to per-
centage of genes in that group. Under biological process GO terms with highest percentage of
genes corresponded to cellular process, followed by response to stress, cell differentiation, brown
fat cell differentiation and cellular protein modification. The most relevant terms for cellular
component were cell, cytoplasmic part, organelle membrane, mitochondrial part, actin cytoskele-
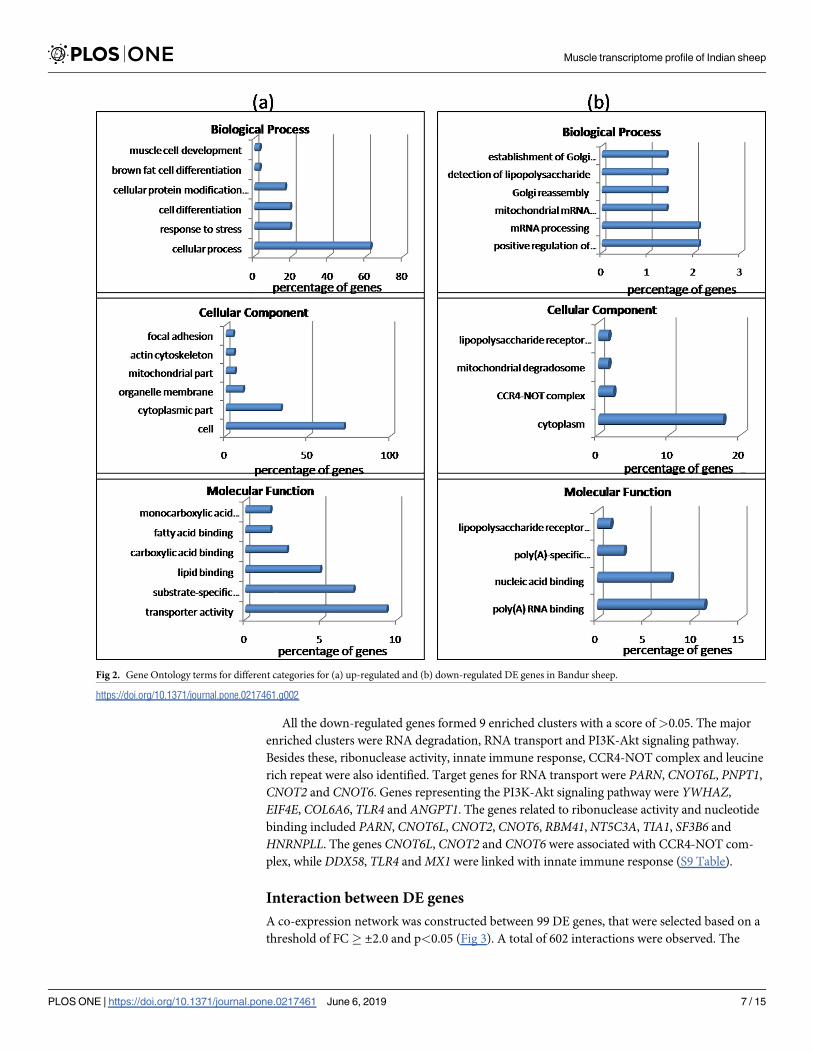
ton and focal adhesion. Significant GO terms for molecular function for up-regulated dataset
included transporter activity, substrate specific transmembrane, lipid and fatty acid binding,
among others (Fig 2A). Transporter activity was represented by the genes ATP2B2, CACNG1,
CHRNA3, FABP3, FABP4, KCNA7, OSBP, RYR3, SCN3B, SLC2A1, SLC2A4, SLC5A3, SLC16A3,
SLC16A7, SLC25A13, SLC25A33 and TMCO3. Genes associated with fat or lipid metabolism in
the up-regulated category were ADIPOQ, ADIPOQR2, FABP3, FABP4, AACS, ACSM1, ACOT11,
CIDEC, FNDC5, PPARD, TYSND1 and UNC119. Genes that exhibited a fold change of� +3.0
included BCKDK, HYAL2, TFPT, CNEP1R1, TNFRS12A, BTG2, RYR3 and HSPA6.
Functional analysis of down-regulated DE genes in Bandur sheep
The significant GO terms for the 142 down-regulated genes with�1.5 FC corresponded to
positive regulation of cytoplasmic mRNA processing body assembly, mRNA processing,
Table 2. Statistics of read mapping to Reference Assembly Oar v4.0.
Properties Left Reads Input Left Reads Mapped Right Reads Input Right Reads Mapped Overall Read Mapping Rate
Local1 25280035 19743707 25280035 20249308 79.10%
Local2 24280035 19958189 24280035 20443789 83.20%
Local3 25330120 21074660 25330120 21581262 84.20%
Local4 26079105 22062923 26079105 22584505 85.60%
Bandur1 27460100 22544742 27460100 23093944 83.10%
Bandur2 30330120 24355086 30330120 24961689 81.30%
Bandur3 25852630 20966483 25852630 21483536 82.10%
Bandur4 27073645 22823083 27073645 23364556 85.30%
https://doi.org/10.1371/journal.pone.0217461.t002
Muscle transcriptome profile of Indian sheep
PLOS ONE | https://doi.org/10.1371/journal.pone.0217461 June 6, 2019 5 / 15
mitochondrial mRNA catabolic process, Golgi reassembly and detection of lipopolysaccharide
for biological process (Fig 2B). Terms like cytoplasm, CCR4-NOT complex, mitochondrial
degradosome and lipopolysaccharide receptor complex were relevant in the cellular compo-
nent category, while poly(A) RNA binding, nucleic acid binding, poly(A)-specific ribonuclease
activity and lipopolysaccharide receptor activity were observed to be significant as molecular
functions (S7 Table). The down-regulated genes with a fold change of� -3.0 were VTI1B,
NUPZ10L, DDX39B, CDH26, ANGPT1, CHI3L1 and HES1. The down-regulated activities in
Bandur sheep were mainly observed to be related to RNA degradation, regulation of ERK1 and
ERK2 cascades and innate immune response.
Pathway analysis
The gene clusters identified were further analyzed for their contribution to specific metabolic
pathways. A total of 7 annotation clusters were identified using DAVID [22,23], for up-regu-
lated genes, with an enrichment score of>0.5 and p<0.05. The enriched clusters included
MAPK signaling pathway, adipocytokine signaling pathway, PPAR signaling pathway and
Epstein Barr virus infection. Other prominent pathways included Kelch repeat, Ankyrin repeat
and ATP binding. Genes corresponding to adipocytokine signaling pathway included
SLC2A4, SLC2A1, ADIPOR2 and ADIPOQ, while PPARD, FABP3, FABP4 and ADIPOQ are
involved in the PPAR signaling pathway. HSPA6, RRAS, HSPB1, HSPA1A, FLNC, MAP3K14,
CACNG1 and CD14 genes grouped into the MAPK signaling pathway (S8 Table).
Fig 1. Functional classification of DE genes in Bandur and local sheep.
https://doi.org/10.1371/journal.pone.0217461.g001
Muscle transcriptome profile of Indian sheep
PLOS ONE | https://doi.org/10.1371/journal.pone.0217461 June 6, 2019 6 / 15
All the down-regulated genes formed 9 enriched clusters with a score of>0.05. The major
enriched clusters were RNA degradation, RNA transport and PI3K-Akt signaling pathway.
Besides these, ribonuclease activity, innate immune response, CCR4-NOT complex and leucine
rich repeat were also identified. Target genes for RNA transport were PARN, CNOT6L, PNPT1,
CNOT2 and CNOT6. Genes representing the PI3K-Akt signaling pathway were YWHAZ,
EIF4E, COL6A6, TLR4 and ANGPT1. The genes related to ribonuclease activity and nucleotide
binding included PARN, CNOT6L, CNOT2, CNOT6, RBM41, NT5C3A, TIA1, SF3B6 and
HNRNPLL. The genes CNOT6L, CNOT2 and CNOT6 were associated with CCR4-NOT com-
plex, while DDX58, TLR4 and MX1 were linked with innate immune response (S9 Table).
Interaction between DE genes
A co-expression network was constructed between 99 DE genes, that were selected based on a
threshold of FC� ±2.0 and p<0.05 (Fig 3). A total of 602 interactions were observed. The
Fig 2. Gene Ontology terms for different categories for (a) up-regulated and (b) down-regulated DE genes in Bandur sheep.
https://doi.org/10.1371/journal.pone.0217461.g002
Muscle transcriptome profile of Indian sheep
PLOS ONE | https://doi.org/10.1371/journal.pone.0217461 June 6, 2019 7 / 15
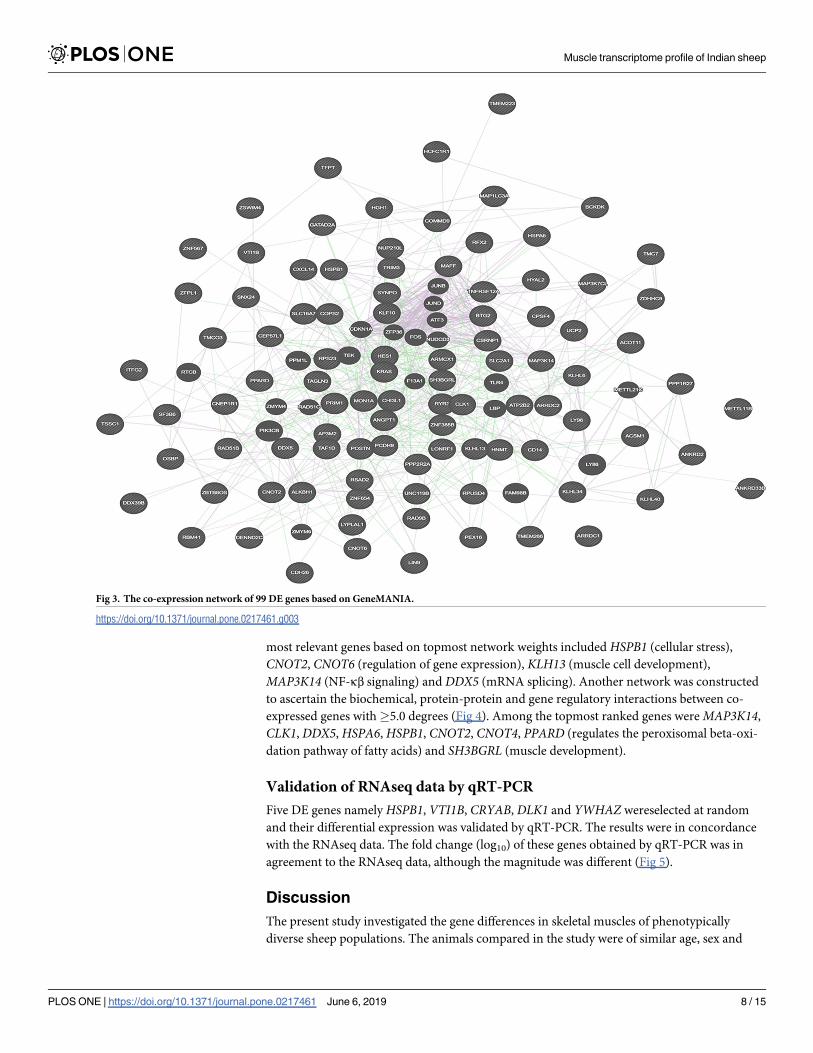
most relevant genes based on topmost network weights included HSPB1 (cellular stress),
CNOT2, CNOT6 (regulation of gene expression), KLH13 (muscle cell development),
MAP3K14 (NF-κβ signaling) and DDX5 (mRNA splicing). Another network was constructed
to ascertain the biochemical, protein-protein and gene regulatory interactions between co-
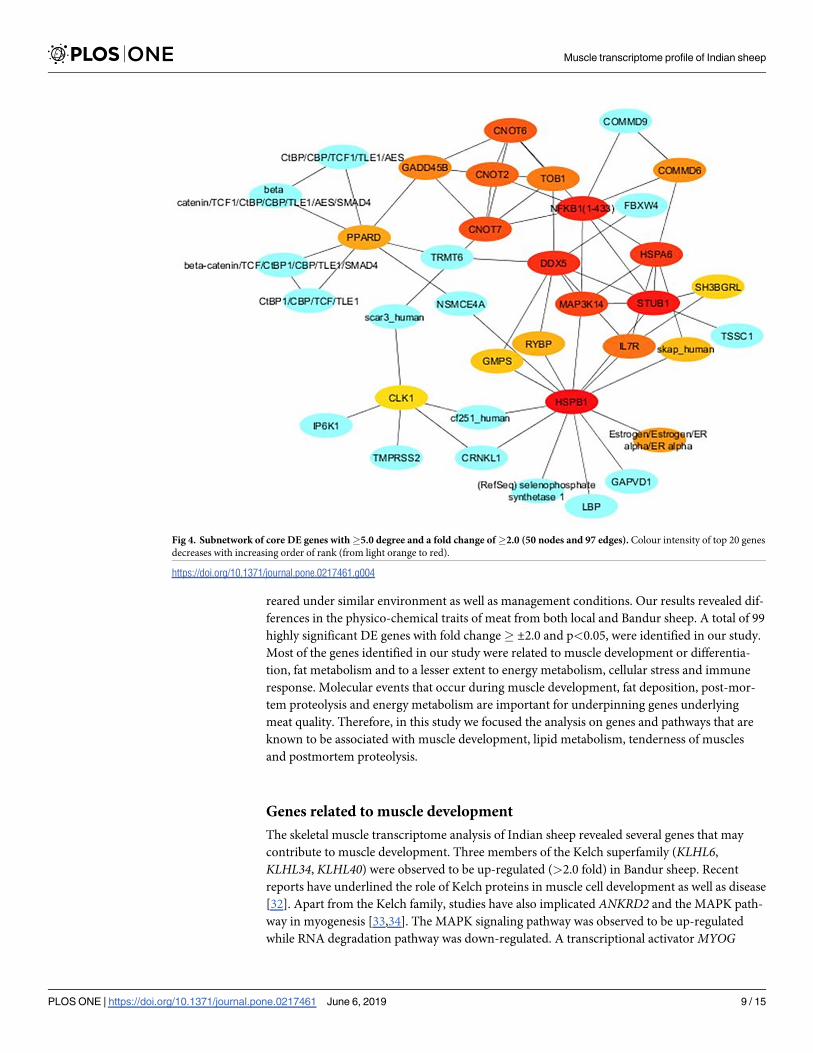
expressed genes with�5.0 degrees (Fig 4). Among the topmost ranked genes were MAP3K14,
CLK1, DDX5, HSPA6, HSPB1, CNOT2, CNOT4, PPARD (regulates the peroxisomal beta-oxi-
dation pathway of fatty acids) and SH3BGRL (muscle development).
Validation of RNAseq data by qRT-PCR
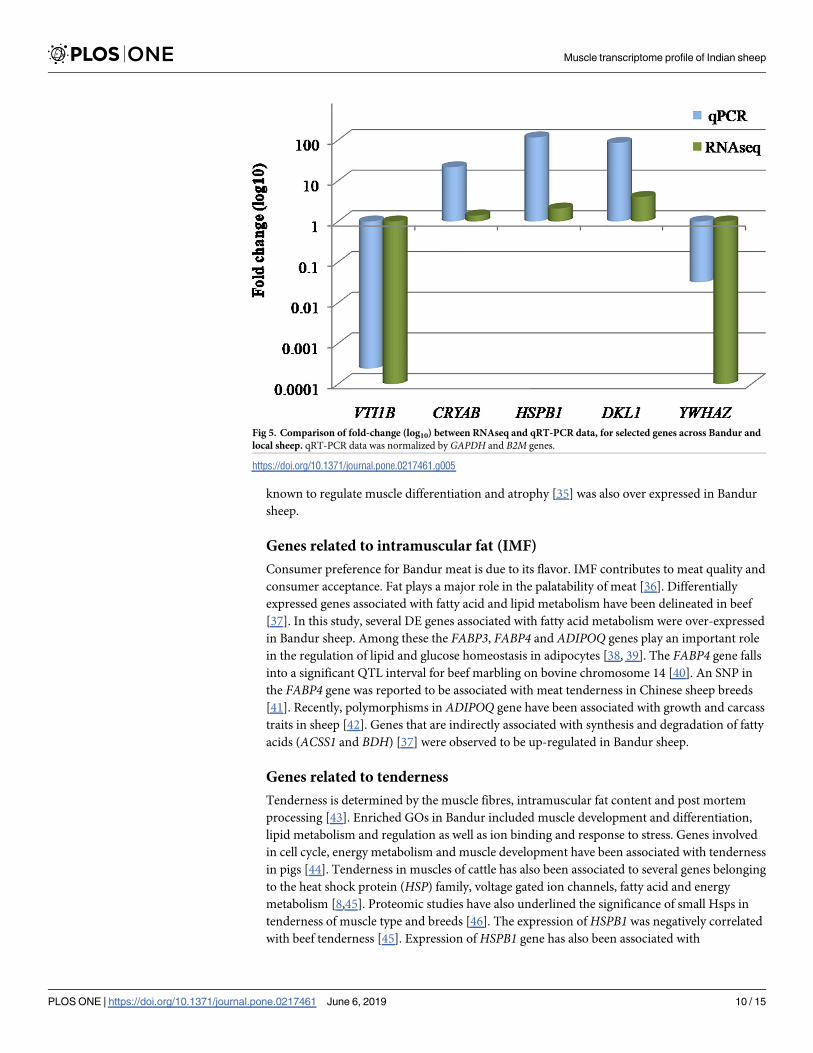
Five DE genes namely HSPB1, VTI1B, CRYAB, DLK1 and YWHAZ wereselected at random
and their differential expression was validated by qRT-PCR. The results were in concordance
with the RNAseq data. The fold change (log10) of these genes obtained by qRT-PCR was in
agreement to the RNAseq data, although the magnitude was different (Fig 5).
Discussion
The present study investigated the gene differences in skeletal muscles of phenotypically
diverse sheep populations. The animals compared in the study were of similar age, sex and
Fig 3. The co-expression network of 99 DE genes based on GeneMANIA.
https://doi.org/10.1371/journal.pone.0217461.g003
Muscle transcriptome profile of Indian sheep
PLOS ONE | https://doi.org/10.1371/journal.pone.0217461 June 6, 2019 8 / 15
reared under similar environment as well as management conditions. Our results revealed dif-
ferences in the physico-chemical traits of meat from both local and Bandur sheep. A total of 99
highly significant DE genes with fold change� ±2.0 and p<0.05, were identified in our study.
Most of the genes identified in our study were related to muscle development or differentia-
tion, fat metabolism and to a lesser extent to energy metabolism, cellular stress and immune
response. Molecular events that occur during muscle development, fat deposition, post-mor-
tem proteolysis and energy metabolism are important for underpinning genes underlying
meat quality. Therefore, in this study we focused the analysis on genes and pathways that are
known to be associated with muscle development, lipid metabolism, tenderness of muscles
and postmortem proteolysis.
Genes related to muscle development
The skeletal muscle transcriptome analysis of Indian sheep revealed several genes that may
contribute to muscle development. Three members of the Kelch superfamily (KLHL6,
KLHL34, KLHL40) were observed to be up-regulated (>2.0 fold) in Bandur sheep. Recent
reports have underlined the role of Kelch proteins in muscle cell development as well as disease
[32]. Apart from the Kelch family, studies have also implicated ANKRD2 and the MAPK path-
way in myogenesis [33,34]. The MAPK signaling pathway was observed to be up-regulated
while RNA degradation pathway was down-regulated. A transcriptional activator MYOG
Fig 4. Subnetwork of core DE genes with�5.0 degree and a fold change of�2.0 (50 nodes and 97 edges). Colour intensity of top 20 genes
decreases with increasing order of rank (from light orange to red).
https://doi.org/10.1371/journal.pone.0217461.g004
Muscle transcriptome profile of Indian sheep
PLOS ONE | https://doi.org/10.1371/journal.pone.0217461 June 6, 2019 9 / 15
known to regulate muscle differentiation and atrophy [35] was also over expressed in Bandur
sheep.
Genes related to intramuscular fat (IMF)
Consumer preference for Bandur meat is due to its flavor. IMF contributes to meat quality and
consumer acceptance. Fat plays a major role in the palatability of meat [36]. Differentially
expressed genes associated with fatty acid and lipid metabolism have been delineated in beef
[37]. In this study, several DE genes associated with fatty acid metabolism were over-expressed
in Bandur sheep. Among these the FABP3, FABP4 and ADIPOQ genes play an important role
in the regulation of lipid and glucose homeostasis in adipocytes [38, 39]. The FABP4 gene falls
into a significant QTL interval for beef marbling on bovine chromosome 14 [40]. An SNP in
the FABP4 gene was reported to be associated with meat tenderness in Chinese sheep breeds
[41]. Recently, polymorphisms in ADIPOQ gene have been associated with growth and carcass
traits in sheep [42]. Genes that are indirectly associated with synthesis and degradation of fatty
acids (ACSS1 and BDH) [37] were observed to be up-regulated in Bandur sheep.
Genes related to tenderness
Tenderness is determined by the muscle fibres, intramuscular fat content and post mortem
processing [43]. Enriched GOs in Bandur included muscle development and differentiation,
lipid metabolism and regulation as well as ion binding and response to stress. Genes involved
in cell cycle, energy metabolism and muscle development have been associated with tenderness
in pigs [44]. Tenderness in muscles of cattle has also been associated to several genes belonging
to the heat shock protein (HSP) family, voltage gated ion channels, fatty acid and energy
metabolism [8,45]. Proteomic studies have also underlined the significance of small Hsps in
tenderness of muscle type and breeds [46]. The expression of HSPB1 was negatively correlated
with beef tenderness [45]. Expression of HSPB1 gene has also been associated with
Fig 5. Comparison of fold-change (log10) between RNAseq and qRT-PCR data, for selected genes across Bandur and
local sheep. qRT-PCR data was normalized by GAPDH and B2M genes.
https://doi.org/10.1371/journal.pone.0217461.g005
Muscle transcriptome profile of Indian sheep
PLOS ONE | https://doi.org/10.1371/journal.pone.0217461 June 6, 2019 10 / 15

intramuscular fat content in cattle [47]. Some of these genes like HSPB1, DNAJB5, HSPA6were over expressed in Bandur sheep consistent with other studies on beef [48,49]. Although
several studies have investigated the role of small heat shock proteins in meat tenderness, the
mechanism of their regulation is still not well understood [50].
Genes related to postmortem proteolysis
Meat tenderness is a complex trait which involves the interplay of muscle characteristics as
well post mortem ageing of meat. The expression of these genes has mostly been investigated
in cattle but their involvement in sheep muscles is less explored. Cellular stress and ion chan-
nels influence the post mortem mechanisms affecting muscle phenotype [51]. Four genes con-
trolling these ion channels were observed to be up-regulated in Bandur sheep. These include
CACNG1 (calcium voltage gated channel auxiliary subunit gamma1), KCNMA1 (potassium
calcium activated channel subfamily M), RYR3 (ryanodine receptor family) and SCN3B(sodium voltage gated channel beta subunit 3). A mutation in the RYR1 gene results in pale,
soft, and exudative (PSE) meat in pigs, which is undesirable [52]. Not much information is
available about RYR3 gene although it is believed to be involved in release of intracellular cal-
cium ions [53].
It is intriguing that some genes that have not been reported earlier were over-expressed in
Bandur sheep. These are mainly involved in calcium ion channels, myogenesis and lipid
metabolism. Notable among them are RYR3 which belongs to the family of ryanodine recep-
tors which modulates release of calcium ions from intracellular storage for use in many cellular
processes [54,55]. HES1 modulates myoblast differentiation [56], CNEP1R1 [57], UCP2 [58]
and ACOT11 [59] are involved in lipid metabolism.
Highly connected DE genes
Differential expression alone does not provide information of the functional interactions of a
gene. To understand the relation between the DE genes and their regulatory factors, it is
important to analyze their connectivity to other molecules or regulators [60]. The network
analysis identified highly connected genes like CNOT2, CNOT6, HSPB1, HSPA6, KLH13,
MAP3K14 and PPARD. These may be important regulators of energy metabolism, cellular
stress and fatty acid metabolism in skeletal muscles. These genes would be expected to have
maximum impact on the relevant pathways. Except for CNOT2 and CNOT6, the other key
genes were up-regulated in Bandur sheep. Recent studies have elucidated the role of the
CCR4-NOT complex (CNOT2, CNOT6) in regulation of RNA expression and lipogenesis as
well as its deficiency in regulating apoptosis [61]. The up-regulated key genes are constituents
of the PPAR and MAPK signaling pathways. Although it is too early to pinpoint the interplay
of these genes or pathways in longissimus thoracis muscles of sheep, functional homology to
other livestock species, implicates them in myogenesis, lipid metabolism and cellular stress.
Conclusions
The study reports the muscle transcriptome profile of Bandur sheep in comparison to local
sheep of similar age, sex and management conditions. Several DE genes related to energy
metabolism, lipid metabolism, muscle development, cellular stress and voltage gated ion trans-
port were identified in this study. The highly connected DE genes identified in our study, form
interesting candidates for further research on muscle characteristics in Indian sheep.
Muscle transcriptome profile of Indian sheep
PLOS ONE | https://doi.org/10.1371/journal.pone.0217461 June 6, 2019 11 / 15
Supporting information
S1 Table. Details of primers used for quantitative PCR.
(DOCX)
S2 Table. Average body measurements and carcass traits of Bandur and local sheep.
(DOCX)
S3 Table. Sensory evaluation of fresh meat and cooked meat by following 9 point hedonic
scale.
(DOCX)
S4 Table. Fatty acid profile of Bandur and local sheep on 100% Fat basis.
(DOCX)
S5 Table. Amino acid profile of Bandur and local sheep.
(DOCX)
S6 Table. Gene ontology terms identified for biological process, cellular components and
molecular functions for up-regulated genes in Bandur sheep.
(DOCX)
S7 Table. Gene ontology terms identified for biological process, cellular components and
molecular functions for down-regulated genes in Bandur sheep.
(DOCX)
S8 Table. Pathway terms for up-regulated genes in Bandur sheep.
(DOCX)
S9 Table. Pathway terms for down-regulated genes in Bandur sheep.
(DOCX)
Acknowledgments
The authors are grateful to Director, ICAR-National Bureau of Animal Genetic Resources
(NBAGR, Karnal) for providing necessary facilities. We acknowledge the help rendered by the
sheep rearers and butchers for their help in collection of samples. We thank Mr. Rakesh
Kumar, Technical Officer for laboratory assistance.
Author Contributions
Conceptualization: Reena Arora, Mohamed Nadeem Fairoze.
Data curation: Reena Arora, Naveen Kumar S., Mohamed Nadeem Fairoze, Ramesh Kumar
Vijh.
Formal analysis: Reena Arora, Naveen Kumar S., Sudarshan S., Mandeep Kaur, Anju Sharma,
Yashila Girdhar, Sreesujatha R. M., Suresh K. Devatkal, Sonika Ahlawat, Ramesh Kumar
Vijh, Manjunatha S. S.
Investigation: Reena Arora, Naveen Kumar S., Sudarshan S.
Methodology: Reena Arora, Mohamed Nadeem Fairoze.
Project administration: Reena Arora.
Resources: Reena Arora, Sreesujatha R. M., Ramesh Kumar Vijh.
Supervision: Reena Arora.
Muscle transcriptome profile of Indian sheep
PLOS ONE | https://doi.org/10.1371/journal.pone.0217461 June 6, 2019 12 / 15

Validation: Reena Arora.
Writing – original draft: Reena Arora.
Writing – review & editing: Reena Arora.
References1. BAHS-Basic Animal Husbandry and Fisheries Statistics (AHS series-18). Government of India, Ministry
of Agriculture, Department of Animal Husbandry, dairying & Fisheries, Krishi Bhavan, New Delhi.pp1–
188. http://dahd.nic.in/Division/statistics/animal-husbandry-statistics-division. 2017.
2. Bhatia S, Arora R. Biodiversity and Conservation of Indian Sheep Genetic Resources-An Overview.
Asian Australasian Journal of Animal Science. 2005; 18 (10):1387–1402.
3. Soam SK, Ilyas SM. Participatory Socioeconomic Analysis of Geographical Indications in India: Case
studies of Palakkadanmatta rice, Kurnool rice, Basmati rice, Pahari aloo, Bannur sheep. Soam S K,
Ilyas S M, editor. 1–278. National Academy of Agricultural Research Management (NAARM), Rajen-
dranagar, Hyderabad; 2008. http://eprints.naarm.org.in/108/13/Participatory%20Socioeconomic%
20Analysis%20of%20Geographical%20Indications%20in%20India.pdf.
4. Acharya RM. Sheep and goat breeds of India. FAO Animal production and Health Paper.30, ( FAO of
United Nations, Rome, Italy); 1982.
5. Reddy KS, Reddy PM, Krishnamacharyulu E, Reddy KK. Certain carcass traits of ram lambs of Nellore,
Mandya and their crosses with Suffolk and Dorset Horn under feed lots. Indian Vet. J. 1982; 59:217–
222.
6. Dani NP, Rajalakshmi D, Indira CB, Dhanraj S, Rao DN, Mahendrakar NS. Meat quality of Bannurrams
lambs. Indian J Anim Sci. 1985; 55:1094–99.
7. Kumar NS, Jayashankar MR, Nagaraja R, Ruban W, Sreesujatha RM. Carcass and meat quality char-
acteristics of Bandur ram lambs. Indian J Anim Res. 2017; B3261, 1–6.
8. Bongiorni S, Gruber CEM, Bueno S, Chillemi G, Ferrè F, Failla S et al. Transcriptomic investigation of
meat tenderness in two Italian cattle breeds. Anim Genet. 2016; 47:273–287. https://doi.org/10.1111/
age.12418 PMID: 26857751
9. Jing L, Hou Y, Wu H, Miao Y, Li X, Cao J et al. Transcriptome analysis of mRNA and miRNA in skeletal
muscle indicates an important network for differential Residual Feed Intake in pigs. Sci Rep. 2015; 5,
11953. https://doi.org/10.1038/srep11953 PMID: 26150313
10. Wang YH, Zhang CL, Plath M, Fang XT, Lan XY, Zhou Y et al. Global transcriptional profiling of longissi-
mus thoracis muscle tissue in fetal and juvenile domestic goat using RNA sequencing. Anim Genet.
2015; 46:655–665. https://doi.org/10.1111/age.12338 PMID: 26364974
11. Sun L, Bai M, Xiang L, Zhang G, Ma W, Jiang H. Comparative transcriptome profiling of longissimus
muscle tissues from Qianhua Meat Merino and Small Tail Han sheep. Sci Rep. 2016; 6, 33586.| https://
doi.org/10.1038/srep33586 PMID: 27645777
12. Kauffman RG, Eikelemboom G, Vander Wal PG, Zaar MA. Comparison of methods to estimate water-
holding capacity in post-rigor porcine muscle. Meat Sci. 1986; 18:307–322. https://doi.org/10.1016/
0309-1740(86)90020-3 PMID: 22055735
13. Keeton JT. Effects of fat and NaCl/phosphate levels on the chemical and sensory properties of pork pat-
ties. J Food Sci. 1983; 48:878–881.
14. De Huidobro FR, Miguel E, Blazquez B, Onega E. A comparison between two methods (Warner–Brat-
zler and texture profile analysis) for testing either raw meat or cooked meat. Meat Science. 2005; 69
(3):527–536. https://doi.org/10.1016/j.meatsci.2004.09.008 PMID: 22062992
15. SAS—Statistical Analysis System. 2012; Version 9.3. (SAS Institute Inc., Cary, NC, USA).
16. Sarwar G, Botting HG. Evaluation of liquid chromatographic analysis of nutritionally important amino
acids in food and physiological samples.J Chromatogr. 1993; 615 (1):1–22. PMID: 8340448
17. Rodrıguez-Ruiz J, Belarbi E, Sanchez JLG, Alonso DL. Rapid simultaneous lipid extraction and transes-
terification for fatty acid analyses. Biotechnology Techniques. 1998; 12:689–691.
18. Andrews S. FastQC: a quality control tool for high throughput sequence data. 2010. Available online at:
http://www.bioinformatics.babraham.ac.uk/projects/fastqc.
19. Trapnell C, Pachter L, Salzberg SL. TOPHAT: discovering splice junctions with RNA-Seq. Bioinformat-
ics. 2009; 25:1105–11. https://doi.org/10.1093/bioinformatics/btp120 PMID: 19289445
Muscle transcriptome profile of Indian sheep
PLOS ONE | https://doi.org/10.1371/journal.pone.0217461 June 6, 2019 13 / 15
20. Trapnell C, Hendrickson D,Sauvageau S, Goff L, Rinn JL, Pachter L. Differential analysis of gene regu-
lation at transcript resolution with RNA-seq. Nature Biotechnology. 2013; 31:46–53. https://doi.org/10.
1038/nbt.2450 PMID: 23222703
21. Goff L, Trapnell C, Kelley D. cummeRbund: Analysis, exploration, manipulation, and visualization of
Cufflinks high-throughput sequencing data. R package version 2.24.0. 2018.
22. Huang DW, Sherman BT, Lempicki RA. Bioinformatics enrichment tools: paths toward the comprehen-
sive functional analysis of large gene lists. Nucleic Acids Res. 2009; 37(1):1–13. https://doi.org/10.
1093/nar/gkn923 PMID: 19033363
23. Huang DW, Sherman BT, Lempicki RA. Systematic and integrative analysis of large gene lists using
DAVID Bioinformatics Resources. Nat Protoc. 2009; 4:44–57. https://doi.org/10.1038/nprot.2008.211
PMID: 19131956
24. Warde-Farley D, Donaldson SL, Comes O, Zuberi K, Badrawi R, Chao P et al. The GeneMANIA predic-
tion server: biological network integration for gene prioritization and predicting gene function. Nucleic
Acids Res. 2010; 38 Suppl:W214–20. https://doi.org/10.1093/nar/gkq537 PMID: 20576703
25. Kamburov A, Wierling C, Lehrach H, Herwig R. ConsensusPathDB-a database for integrating human
functional interaction networks. Nucleic Acids Res. 2009; 37(Database issue), D623–D628. https://doi.
org/10.1093/nar/gkn698 PMID: 18940869
26. Kamburov A, Pentchev K, Galicka H, Wierling C, Lehrach H, Herwig R. ConsensusPathDB: toward a
more complete picture of cell biology. NucleicAcids Res. 2011; 39(Database issue), D712–7.
27. Shannon P, Markiel A, Ozier O, Baliga NS, Wang JT, Ramage D et al. Cytoscape: a software environ-
ment for integrated models of biomolecular interaction networks. Genome Res. 2003; 13:2498–504.
https://doi.org/10.1101/gr.1239303 PMID: 14597658
28. Chin CH, Chen SH, Wu HH, Ho CW, Ko MT, Lin CY. cytoHubba: identifying hub objects and sub-net-
works from complex interactome. BMC Syst Biol. 2014; 8, S11. https://doi.org/10.1186/1752-0509-8-
S4-S11 PMID: 25521941
29. Untergasser A, Cutcutache I, Koressaar T, Ye J, Faircloth BC, Remm M et al. Primer3—new capabili-
ties and interfaces. Nucleic Acids Res.2012; 40, e115. https://doi.org/10.1093/nar/gks596 PMID:
22730293
30. Vandesompele J, De Preter K, Pattyn F, Poppe B, Van Roy N, De Paepe A et al. Accurate normalization
of real-time quantitative RT-PCR data by geometric averaging of multiple internal control genes.
Genome Biol. 2002; 3, RESEARCH0034.1.
31. Livak KJ, Schmittgen TD. Analysis of relative gene expression data using real-time quantitative PCR
and the 2(-Delta DeltaC(T)) Method. Methods. 2001; 25:402–408, https://doi.org/10.1006/meth.2001.
1262 PMID: 11846609
32. Gupta VA, Beggs AH. Kelch proteins: emerging roles in skeletal muscle development and diseases.
Skeletal Muscle. 2014; 4:11. https://doi.org/10.1186/2044-5040-4-11 PMID: 24959344
33. Roux PP, Blenis J. Erk and p38 mapk-activated protein kinases:A family of protein kinases with diverse
biological functions. Microbiol. Mol Biol Rev.2004; 68:320–344. https://doi.org/10.1128/MMBR.68.2.
320-344.2004 PMID: 15187187
34. Kojic S, Radojkovic D, Faulkner G. Muscle ankyrin repeat proteins: their role in striated muscle function
in health and disease. Crit Rev Clin Lab Sci. 2011; 48(5–6):269–294. https://doi.org/10.3109/
10408363.2011.643857 PMID: 22185618
35. Moresi V, Williams AH, Meadows E, Flynn JM, Potthoff MJ, McAnally J et al. Myogenin and Class II
HDACs Control Neurogenic Muscle Atrophy by Inducing E3 Ubiquitin Ligases. Cell. 2010; 143:35–45.
https://doi.org/10.1016/j.cell.2010.09.004 PMID: 20887891
36. Warner RD, Greenwood PL, Pethick DW, Ferguson DM. Genetic and environmental effects on meat
Quality. Meat Sci.2010; 86:171–183. https://doi.org/10.1016/j.meatsci.2010.04.042 PMID: 20561754
37. Berton MP, Fonseca LFS, Gimenez DFJ, Utembergue BL, Cesar ASM, Coutinho LL et al. Gene expres-
sion profile of intra muscular muscle in Nellore cattle with extreme values of fatty acid. BMC Genomics.
2016; 17, 972. https://doi.org/10.1186/s12864-016-3232-y PMID: 27884102
38. Fischer H, Gustafsson T, Sundberg CJ, Norrbom J, Ekman M, Johansson O et al. Fatty acid binding
protein 4 in human skeletal muscle. BiochemBiophys Res Commun. 2006; 346 (1):125–30.
39. Stern JH, Rutkowski JM, Scherer PE. Adiponectin, leptin, and fatty acids in the maintenance of meta-
bolic homeostasis through adipose tissue crosstalk. Cell metabolism. 2016; 23(5):770–784. https://doi.
org/10.1016/j.cmet.2016.04.011 PMID: 27166942
40. Michal JJ, Zhang ZW, Gaskins CT, Jiang Z. The bovine fatty acid binding protein 4 gene is significantly
associated with marbling and subcutaneous fat depth in Wagyu x Limousin F2 crosses. Anim Genet.
2006; 37:400–402. https://doi.org/10.1111/j.1365-2052.2006.01464.x PMID: 16879357
Muscle transcriptome profile of Indian sheep
PLOS ONE | https://doi.org/10.1371/journal.pone.0217461 June 6, 2019 14 / 15
41. Xu QL, Tang GW, Zhang QL, Huang YK, Liu YX, Quan K et al. The FABP4 gene polymorphism is asso-
ciated with meat tenderness in three Chinese native sheep breeds. Czech. J Anim Sci. 2011; 56:1–6.
42. An Q, Zhou H, Hu J, Luo Y, Hickford JGH. Haplotypes of the ovine Adiponectin gene and their associa-
tion with growth and carcass traits in New Zealand Romney lambs. Genes. 2017; 8(6):160.
43. Renand G, Picard B, Touraille C, Berge P, Lepetit J. Relationships between muscle characteristics and
meat quality traits of young Charolais bulls. Meat Sci. 2001; 59:49–60. PMID: 22062505
44. Lobjois V, Liaubet L, SanCristobal M, Glenisson J, Fève K, Rallières J et al. A muscle transcriptome
analysis identifies positional candidate genes for a complex trait in pig. Anim Genet. 2008; 39:147–162.
https://doi.org/10.1111/j.1365-2052.2007.01695.x PMID: 18366476
45. Hocquette JF, Bernard-Capel C, Vidal V, Jesson B, Leveziel H, Renand G et al. The GENOTEND chip:
a new tool to analyse gene expression in muscles of beef cattle for beef quality prediction. BMC Vet
Res. 2012; 8, 135. https://doi.org/10.1186/1746-6148-8-135 PMID: 22894653
46. Picard B, Gagaoua M, Micol D, Cassar-Malek I, Hocquette JF, Terlouw CEM. Inverse relationships
between biomarkers and beef tenderness according to contractile and metabolic properties of the mus-
cle. J Agric Food Chem. 2014; 62:9808–9818. https://doi.org/10.1021/jf501528s PMID: 25175407
47. Kim NK, Lim D, Lee SH, Cho YM, Park EW, Lee CS et al. Heat Shock Protein B1 and Its Regulator
Genes Are Negatively Correlated with Intramuscular Fat Content in the Longissimus Thoracis Muscle
of Hanwoo (Korean Cattle) Steers. J Agric Food Chem. 2011; 59:5657–5664. https://doi.org/10.1021/
jf200217j PMID: 21524092
48. Guillemin N, Jurie C, Cassar-Malek I, Hocquette JF, Renand G, Picard B. Variations in the abundance
of 24 protein biomarkers of beef tenderness according to muscle and animal type. Animal. 2011;
5:885–894. https://doi.org/10.1017/S1751731110002612 PMID: 22440028
49. Cassar-Malek I, Picard B. Expression Marker-Based Strategy to Improve Beef Quality. Sci World J.
2016; 2185323. https://doi.org/10.1155/2016/2185323 PMID: 27066527
50. Lomiwes D, Farouk M M, Wiklund E, Young OA. Small heat shock proteins and their role in meat tender-
ness: A review. Meat Sci. 2013; 96:26–40. https://doi.org/10.1016/j.meatsci.2013.06.008 PMID:
23896134
51. Ferguson DM, Gerrard DE. Regulation of post-mortem glycolysis in ruminant muscle. AnimProd Sci.
2014; 54:464–481.
52. Paião FG, Ferracin LM, Pedrão M, Kato T, Shimokomaki M. Skeletal muscle calcium channel ryanodine
and the development of pale, soft, and exudative meat in poultry. Genet Mol Res. 2013; 12:3017–3027.
https://doi.org/10.4238/2013.August.20.3 PMID: 24065657
53. Lanner JT, Georgiou DK, Joshi AD, Hamilton SL. Ryanodine receptors: structure, expression, molecu-
lar details, and function in calcium release. Cold Spring HarbPerspect Biol. 2010; 2, a003996. https://
doi.org/10.1101/cshperspect.a003996 http://cshperspectives.cshlp.org/. PMID: 20961976
54. Conti A, Gorza L, Sorrentino V. Differential distribution of ryanodine receptor type 3 (RyR3) gene prod-
uct in mammalian skeletal muscles. Biochem J. 1996; 316:19–23. https://doi.org/10.1042/bj3160019
PMID: 8645204
55. Ogawa Y, Kurebayashi N, Murayama T. Putative Roles of Type 3 Ryanodine Receptor Isoforms
(RyR3). Trends Cardiovasc Med.2000; 10:65–70. PMID: 11150732
56. Kitamura T, Kitamura YI, Funahashi Y, Shawber CJ, Castrillon DH, Kollipara R et al. A Foxo/Notch path-
way controls myogenic differentiation and fiber type specification. J Clin Invest. 2007; 117:2477–2485.
https://doi.org/10.1172/JCI32054 PMID: 17717603
57. Han S, Bahmanyar S, Zhang P, Grishin N, Oegema K, Crooke R et al. Nuclear Envelope Phosphatase
1-Regulatory Subunit 1 (Formerly TMEM188) Is the Metazoan Spo7p Ortholog and Functions in the
Lipin Activation Pathway. JBC. 2012; 287:3123–3137.
58. Brand MD, Esteves TC. Physiological functions of the mitochondrial uncoupling proteins UCP2 and
UCP3. Cell Metab. 2005; 2:85–93. https://doi.org/10.1016/j.cmet.2005.06.002 PMID: 16098826
59. Brocker C, Carpenter C, Nebert, Vasiliou V. Evolutionary divergence and functions of the human acyl-
CoA thioesterase gene (ACOT) family. Human Genomics. 2010; 4:411–20. https://doi.org/10.1186/
1479-7364-4-6-411 PMID: 20846931
60. Hudson NJ, Dalrymple BP, Reverter A. Beyond differential expression: the quest for causal mutations
and effector molecules. BMC Genomics. 2012; 13:356. https://doi.org/10.1186/1471-2164-13-356
PMID: 22849396
61. Sohn EJ, Jung DB, Lee J, Yoon SW, Won GH, Ko HS et al. CCR4-NOT2 Promotes the Differentiation
and Lipogenesis of 3T3-L1 Adipocytes via Upregulation of PPARγ, CEBPα and Inhibition of P-GSK3α/βand β-Catenin. Cell PhysiolBiochem. 2015; 37:1881–1889.
Muscle transcriptome profile of Indian sheep
PLOS ONE | https://doi.org/10.1371/journal.pone.0217461 June 6, 2019 15 / 15