towards complete analysis of the platelet proteome
TRANSCRIPT
Eric E. O’Neill1
Chris J. Brock1
Alexander F. von Kriegsheim1
Andrew C. Pearce2
Raymond A. Dwek1
Steve P. Watson2
Holger F. Hebestreit1
1Oxford Glycobiology Institute,Department of Biochemistry,University of OxfordOxford, UK
2Department of Pharmacology,University of Oxford,Oxford, UK
Towards complete analysis of the platelet proteome
Platelets exert a crucial function in haemostasis, wound repair, and the formation ofvascular plugs, underlying thrombotic diseases such as stroke and myocardial infarc-tion. Analysis of platelet biochemistry is largely dependent on protein analysis as plate-lets are anucleated cells providing little analytical target for DNA or RNA based strat-egies. Here we present data from our analysis of the human platelet proteome, the entireset of proteins building a platelet at a given point in time. Proteins were separated bytwo-dimensional electrophoresis (2-DE) using broad and narrow range pH gradients inthe isoelectric focusing step. Consequently, a high-resolution 2-DE proteome map hasbeen generated that comprises approximately 2300 different protein features. Fromthe 536 protein features detected in the 4–5 pI range 284 features were identified byelectrospray ionisation time of flight tandem mass spectrometry. These 284 proteinsoriginate from 123 different open reading frames. This includes the five human proteinsKIAA0193, KIAA0573, KIAA0830, WUGSC:H_DJ0777O23 protein, and cytokine recep-tor related protein 4, all isolated for the first time. The data are discussed with regardto proteome characteristics, protein function, and the high prevalence of signallingmolecules. This study contributes to a more thorough and holistic understanding ofplatelet biology, helping to build the basis for future identification of new drug targetsand therapeutic strategies.
Keywords: Platelet / Two-dimensional gel electrophoresis / Electrospray ionisation tandem massspectrometry PRO 0170
1 Introduction
Platelets circulate the body playing a critical role inhaemostasis and contributing to essential processes inwound repair. Exposure to the subendothelial matrixinduces rapid platelet activation giving rise to formationof a vascular plug and release of stimulatory moleculesthat initiate the repair process. Pathologically, plateletactivation underlies thrombotic diseases such as strokeand myocardial infarction [1]. Genetic defects of plateletsresult in bleeding syndromes of varying severity, withGlanzmann thrombasthenia and the Bernard-Soulier syn-drome being the best characterised platelet-based dis-eases [2]. Platelets arise through membrane budding ofterminally differentiated megakaryocytes, located mainlyin bone marrow, and therefore are anucleate [1]. In con-sequence of this absence of genetic information, genomeand transcriptome analysis are largely unsuccessful whenaddressing the biology of platelets. Meaningful analysisis preferably carried out on the protein level.
Modern, large-scale proteome analysis offers a hugepotential for the provision of comprehensive proteinexpression data for basal and activated platelets. Thekey technologies of such proteome analysis are proteinseparation by 2-DE, differential image analysis, andmass spectrometric protein identification, resulting in theefficient analysis of hundreds to thousands of proteinsexpressed in body fluids, cells, or tissues at a time. Inaddition, the proteomics technology has the potential toidentify isoforms of proteins that underlie platelet-baseddiseases, including thrombosis [3, 4].
Platelet biology has been investigated using the 2-DEtechnology for more than two decades, investigating var-ious aspects of, for example, membrane protein expres-sion [5], association of proteins with the cytoskeletonfollowing cell activation [6, 7], or the frequency of poly-morphisms in platelet proteins [8]. Consequently, a rangeof 2-DE protein maps has been published using differentprotein detection methods and addressing different cel-lular compartments. As much insight into platelet biologyhas been gained by these studies the number of proteinsidentified which are expressed in platelets and annotatedon 2-DE protein maps is still very small [9–11]. The mostcomprehensive maps are those from the interactiveSWISS-PROT 2DPAGE, which gives information on lessthan 50 protein spots (http://www.expasy.ch/ch2d/), andfrom a 3–10 2-DE map recently published by Marcus et al.
Correspondence: Dr. Holger F. Hebestreit, Oxford GlycobiologyInstitute, Department of Biochemistry, University of Oxford,South Parks Road, Oxford, OX1 3QU, UKE-mail: [email protected]: +44-1865-275216
Abbreviation: NDSB-256, nondetergent sulfobetain-256
288 Proteomics 2002, 2, 288–305
ª WILEY-VCH Verlag GmbH, 69451 Weinheim, 2002 1615-9853/02/0303–288 $17.50+.50/0
with 186 identified protein features [12]. In order to pro-vide more insight into platelet biology, we have extendedplatelet proteome analysis using broad and narrow pIrange 2-DE gel electrophoresis and high-throughputtandem mass spectrometry (MS/MS) for protein identifi-cation. Screening systematically the proteome, in thispublication a particular emphasis is placed on the pro-teins falling into the acidic (4–5) pI region. We reportidentification of 284 acidic proteins, and the annotationof 53% of the 4–5 pI range 2-DE proteome map. Thedata are interpreted with regard to the representation ofproteins of different functional classes, and their rele-vance to the platelet proteome.
2 Materials and methods
2.1 Materials
Leukocyte removal filters were purchased from Pall(Portsmouth, Hampshire, UK). Immobilised pH gradient(IPG) strips (3–10, 4–7, 4–5, 5–6, 6–11 nonlinear), 1,2-dithiothreitol, and the electrophoresis instruments for run-ning the IPG gels (DryStrip kit, Multiphor II, EPS 3500 XLpower supply) were from Amersham Pharmacia Biotech(Uppsala, Sweden). Carrier ampholytes (Servalytes 3–10,2–4, 9–11, 4–5, 4–7, 5–6, 6–11) were purchased from Bio-whitaker (Wokingham, UK), and NDSB-256 (nondetergentsulfobetain-256) from Calbiochem-Novabiochem (Not-tingham, UK). Thiourea was purchased from Fluka (Stein-heim, Switzerland), CHAPS, acetonitrile, tributyl phos-phine, TFA, iodoacetamide, and protease inhibitor cock-tail from Sigma (St. Louis, MO, USA). Urea was suppliedby Fischer Scientific (Leicester, UK), Tris by Boehringer(Mannheim, Germany), and trypsin (sequencing grade)by Roche Diagnostics (Lewes, E. Sussex, UK). OGT [16]MP17 stain, Apollo II linear fluorescence scanner and asoftware-driven robotic cutter were from Oxford Glyco-Sciences (Abingdon, UK). In gel digestion was carriedout by a DigestPro workstation from Abimed Analysen-Technik (Langenfeld, Germany).
2.2 Platelet preparation
Fresh blood was collected from normal healthy volunteerswho were not on medication for the previous ten days.Each blood sample was processed individually and wasmixed with a sodium citrate stock solution to final con-centration of 10% v/v of the anticoagulant. Platelet iso-lation was carried out as previously described [13]. Briefly,upon addition of warmed (30�C) acid citrate dextrose(ACD) solution (117 mM sodium citrate, 282 mM glucose,78 mM citric acid) to a concentration of 7% v/v, the blood
was centrifuged for 20 min at 200�g at room temperatureto obtain platelet rich plasma (PRP). The upper third ofthe PRP was recentrifuged in a fresh tube removing anycontaminating leukocytes. Addition of prostacyclin (finalconcentration 2.5 mM) allowed pelleting of platelets at1000�g with minimal activation. Following removal ofplasma, the platelets were washed in Tyrodes-HEPES(134 mM NaCl, 0.34 mM Na2HPO4, 2.9 mM KCl, 12 mM
NaHCO3, 20 mM HEPES, 5 mM glucose, 1 mM MgCl2,pH 7.3, EGTA (1 mM) and indomethacin (10 �M) containingACD (7%, v/v). The platelet pellet was then resuspendedin Tyrodes-HEPES, to a concentration of 2�108/mL or1�109/mL, and incubated at room temperature for30 min. Platelets were spun down at 15 000�g in theabsence of prostacyclin and, following addition of 20 �Lof a protease inhibitor cocktail, immediately frozen inliquid nitrogen prior to storage at –80�C. Purity of the iso-lated cells was controlled by microscopic inspectionguaranteeing only cell preparations of at least 99.9% tobe subjected to further analysis. The effect of residualcontaminating cells was investigated by further purifi-cation of platelets by centrifugation through leukocyteremoval filters.
2.3 Two-dimensional gel electrophoresis
Pellets of frozen platelets were resuspended in 375 �Lsample buffer (5 M urea, 2 M thiourea, 2 mM tributyl-phos-phine, 65 mM DTT, 65 mM CHAPS, 0.15 M NDSB-256,1 mM sodium vanadate, 1 mM sodium fluoride, 1 mM benz-amidine, 50 nM okadaic acid) and subjected to 2-DE.Carrier ampholytes were added to the sample at 0.9% v/vServalyte 3–10, 0.45% (v/v) Servalyte 2–4 and 9–11 forIEF on 3–10 nonlinear pH gradient gels, and at 1.5% v/vServalyte 4–5, 4–7, 5–6, and 6–11 for the respective linearnarrow range pH gradients. IPG strips were rehydrated inthe sample and IEF was carried out for 70 kVh at 17�Caccording to Sanchez et al. [14]. Following focussing, theIPG strips were immediately equilibrated for 10 min in6 M urea, 130 mM DTT, 50 mM Tris pH 6.8, 2% w/v SDS,30% v/v glycerol. The IPG strips were placed on top of thesecond dimension gels and embedded with 0.5% meltedagarose. Proteins were separated in the second dimen-sion on SDS-PAGE gradient gels (9–16%T, 2.67%C) atrun conditions of 10�C, 20 mA per gel for 1 h, followed by40 mA per gel for 4 h using an electrophoresis tank similarto that described by Amess and Tolkovsky [15]. Followingelectrophoresis, the gels were fixed in 40% v/v ethanol :10% v/v acetic acid and stained with the fluorescent dyeOGT MP17 molecule on the basis of reference [16]. 16-bitmonochrome fluorescence images were obtained at200 �m resolution by scanning gels with an Apollo II linearfluorescence scanner.
Proteomics 2002, 2, 288–305 Platelet proteome 289
2.4 Image analysis
Scanned images were processed with a custom versionof MELANIE II (Bio-Rad, Hemel Hempstead, UK). Internalcalibration of the 2-DE gel images with regard to pI andmolecular weight was carried out on the basis of 2-DEgels separately prepared from platelet – Escherichia colimix samples using known E. coli proteins as calibrationmarkers. The E. coli sample used for calibration hasbeen obtained from SWISS-2DSERVICE (http://www.expasy.ch/ch2D/service/2dservice-home.html; courtesyof Jean-Charles Sanchez). Details on cell culture con-ditions can be retrieved under http://www.expasy.org/ch2d/protocols/protocols.fm1.html.
2.5 In-gel digestion and peptide extraction
Protein features assigned to mass spectrometric analysiswere excised from the gel by a software-driven roboticcutter. The recovered gel pieces were dried in a Speed-vac and in-gel digestion was carried out at 37�C by theautomated DigestPro workstation (Abimed) according tothe protocol of Shevchenko et al., [17]. Gel pieces werewashed with acetonitrile, gel immobilised proteins werereduced with 20 mM DTT and subsequently alkylatedwith 50 mM iodoacetamide. Following washing with aque-ous 50 mM ammonium hydrogen carbonate and aceto-nitrile, the gel pieces were incubated with 12.5 ng/�L tryp-sin (Roche Diagnostics) for 4 h. The generated peptideswere eluted with 50 mM ammonium hydrogen carbonatefollowed by 10% v/v formic acid and acetonitrile. Thecombined fractions were lyophilised and dissolved in0.1% v/v formic acid.
2.6 Mass spectrometric analysis
Mass spectrometric analysis was carried out using LC-MS/MS according to [18, 19]. The HPLC (CapLC, Waters,Milford, MA, USA) was coupled via a Nano-LC inlet to theQ-TOF mass spectrometer (Micromass, Manchester, UK)equipped with a nanoelectrospray Z-spray source. Thetryptic peptides were concentrated and desalted on a300 mm id/5 mm length C18 PepMap column (LC Pack-ings, San Francisco, CA, USA). Elution of peptides wascarried out with 80% acetonitrile over 13 min at a flowrate of 200 nL/min. The eluted peptide mixture was ana-lysed by tandem mass spectrometric sequencing with anautomated MS-to-MS/MS switching protocol. Onlinedetermination of precursor-ion masses was performedover the m/z range from 300 to 1200 atomic mass unitsin the positive charge detection mode with a cone voltageof 30 V. The collision-induced dissociation (CID) for pep-tide sequencing by MS/MS was performed with argon
gas at 20–40 eV and a 3 Da quadrupole resolution. Massspectra were analysed with the ProteinLynx software(Micromass). The complex CID MS/MS spectra contain-ing fragment ions in multiple charge states were replottedinto a simple spectrum of monoisotopic ions using Max-Ent-3 software. The database search was performed withthe MASCOT search tool (Matrix Science, London, UK)screening SWISS-PROT (39.22 of 20-Jun-2001) andTrEMBL (release 17.0 of 15-Jun-2001). Search para-meters were as follows: fixed modifications – carbamido-methyl, variable modifications – oxidation (M), missedcleavages: up to 1, monoisotopic, peptide tolerance50 ppm, MS/MS tolerance +/–0.5 Da.
3 Results
3.1 Analysis of the platelet proteome by 2-DE
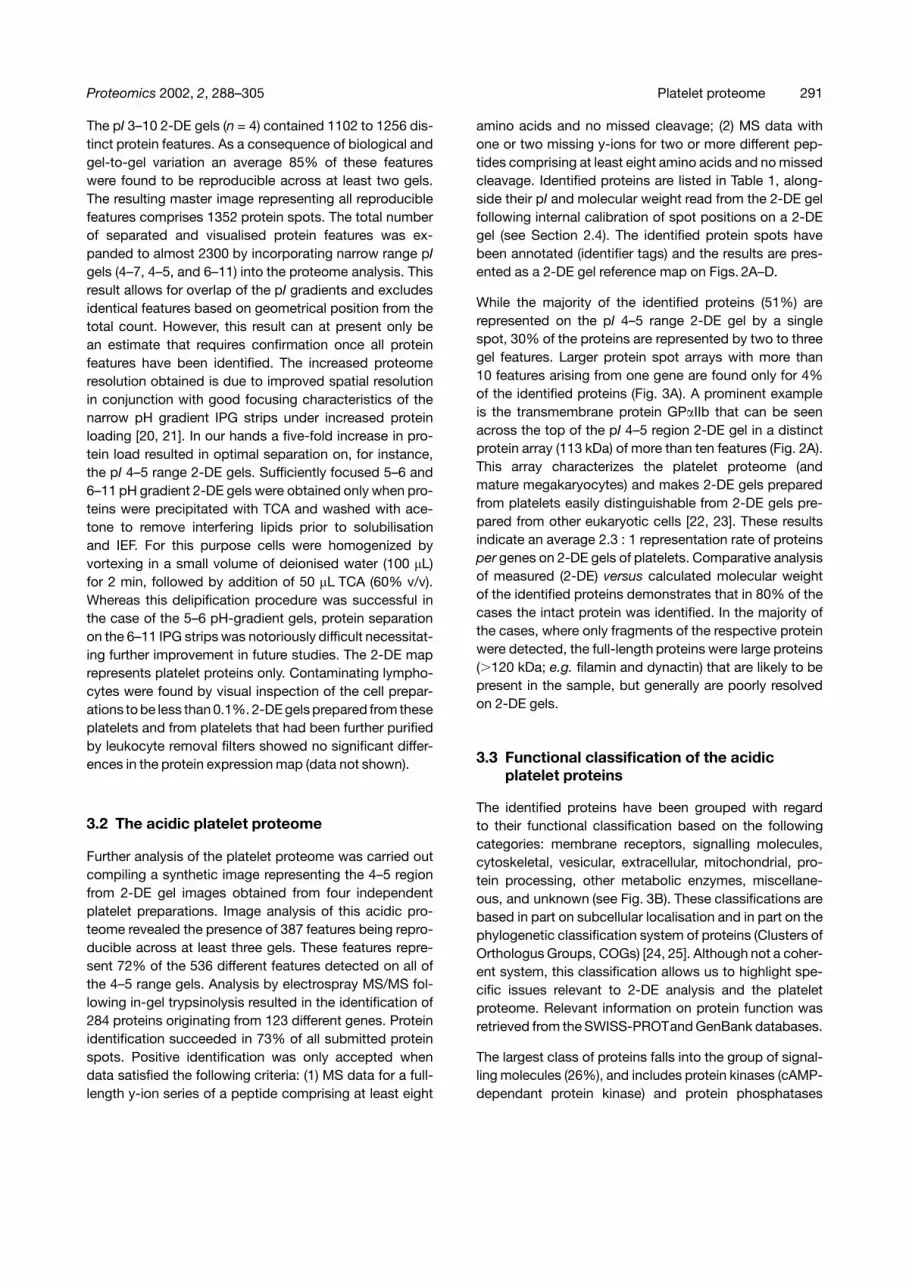
In order to analyse the platelet proteome, proteins weresolubilized from freshly prepared cells under reducing con-ditions and in the presence of CHAPS, urea, and thiourea(see Section 2.3). These experimental conditions allowedeffective protein separation by 2-DE applying broad range3–10 nonlinear and narrow range linear pH gradients forthe IEF step. The analysis of the obtained platelet proteinhomogenate resulted in detailed separation and detailedrepresentation of platelet proteins by 2-DE gels (Fig. 1).
Figure 1. Image of the proteome coverage 2-DE map ofthe human platelet. Shown are the narrow range pH rangegels, 4–7, 4–5, 5–6, 6–11 and their corresponding regionson the 3–10 map. Delipification via TCA/acetone precip-itation of the protein sample was performed for pI 5–6 and6–11, allowing optimal protein separation.
290 E. E. O’Neill et al. Proteomics 2002, 2, 288–305
The pI 3–10 2-DE gels (n = 4) contained 1102 to 1256 dis-tinct protein features. As a consequence of biological andgel-to-gel variation an average 85% of these featureswere found to be reproducible across at least two gels.The resulting master image representing all reproduciblefeatures comprises 1352 protein spots. The total numberof separated and visualised protein features was ex-panded to almost 2300 by incorporating narrow range pIgels (4–7, 4–5, and 6–11) into the proteome analysis. Thisresult allows for overlap of the pI gradients and excludesidentical features based on geometrical position from thetotal count. However, this result can at present only bean estimate that requires confirmation once all proteinfeatures have been identified. The increased proteomeresolution obtained is due to improved spatial resolutionin conjunction with good focusing characteristics of thenarrow pH gradient IPG strips under increased proteinloading [20, 21]. In our hands a five-fold increase in pro-tein load resulted in optimal separation on, for instance,the pI 4–5 range 2-DE gels. Sufficiently focused 5–6 and6–11 pH gradient 2-DE gels were obtained only when pro-teins were precipitated with TCA and washed with ace-tone to remove interfering lipids prior to solubilisationand IEF. For this purpose cells were homogenized byvortexing in a small volume of deionised water (100 �L)for 2 min, followed by addition of 50 �L TCA (60% v/v).Whereas this delipification procedure was successful inthe case of the 5–6 pH-gradient gels, protein separationon the 6–11 IPG strips was notoriously difficult necessitat-ing further improvement in future studies. The 2-DE maprepresents platelet proteins only. Contaminating lympho-cytes were found by visual inspection of the cell prepar-ations to be less than 0.1%. 2-DE gels prepared from theseplatelets and from platelets that had been further purifiedby leukocyte removal filters showed no significant differ-ences in the protein expression map (data not shown).
3.2 The acidic platelet proteome
Further analysis of the platelet proteome was carried outcompiling a synthetic image representing the 4–5 regionfrom 2-DE gel images obtained from four independentplatelet preparations. Image analysis of this acidic pro-teome revealed the presence of 387 features being repro-ducible across at least three gels. These features repre-sent 72% of the 536 different features detected on all ofthe 4–5 range gels. Analysis by electrospray MS/MS fol-lowing in-gel trypsinolysis resulted in the identification of284 proteins originating from 123 different genes. Proteinidentification succeeded in 73% of all submitted proteinspots. Positive identification was only accepted whendata satisfied the following criteria: (1) MS data for a full-length y-ion series of a peptide comprising at least eight
amino acids and no missed cleavage; (2) MS data withone or two missing y-ions for two or more different pep-tides comprising at least eight amino acids and no missedcleavage. Identified proteins are listed in Table 1, along-side their pI and molecular weight read from the 2-DE gelfollowing internal calibration of spot positions on a 2-DEgel (see Section 2.4). The identified protein spots havebeen annotated (identifier tags) and the results are pres-ented as a 2-DE gel reference map on Figs. 2A–D.
While the majority of the identified proteins (51%) arerepresented on the pI 4–5 range 2-DE gel by a singlespot, 30% of the proteins are represented by two to threegel features. Larger protein spot arrays with more than10 features arising from one gene are found only for 4%of the identified proteins (Fig. 3A). A prominent exampleis the transmembrane protein GP�IIb that can be seenacross the top of the pI 4–5 region 2-DE gel in a distinctprotein array (113 kDa) of more than ten features (Fig. 2A).This array characterizes the platelet proteome (andmature megakaryocytes) and makes 2-DE gels preparedfrom platelets easily distinguishable from 2-DE gels pre-pared from other eukaryotic cells [22, 23]. These resultsindicate an average 2.3 : 1 representation rate of proteinsper genes on 2-DE gels of platelets. Comparative analysisof measured (2-DE) versus calculated molecular weightof the identified proteins demonstrates that in 80% of thecases the intact protein was identified. In the majority ofthe cases, where only fragments of the respective proteinwere detected, the full-length proteins were large proteins(�120 kDa; e.g. filamin and dynactin) that are likely to bepresent in the sample, but generally are poorly resolvedon 2-DE gels.
3.3 Functional classification of the acidicplatelet proteins
The identified proteins have been grouped with regardto their functional classification based on the followingcategories: membrane receptors, signalling molecules,cytoskeletal, vesicular, extracellular, mitochondrial, pro-tein processing, other metabolic enzymes, miscellane-ous, and unknown (see Fig. 3B). These classifications arebased in part on subcellular localisation and in part on thephylogenetic classification system of proteins (Clusters ofOrthologus Groups, COGs) [24, 25]. Although not a coher-ent system, this classification allows us to highlight spe-cific issues relevant to 2-DE analysis and the plateletproteome. Relevant information on protein function wasretrieved from the SWISS-PROTand GenBank databases.
The largest class of proteins falls into the group of signal-ling molecules (26%), and includes protein kinases (cAMP-dependant protein kinase) and protein phosphatases
Proteomics 2002, 2, 288–305 Platelet proteome 291
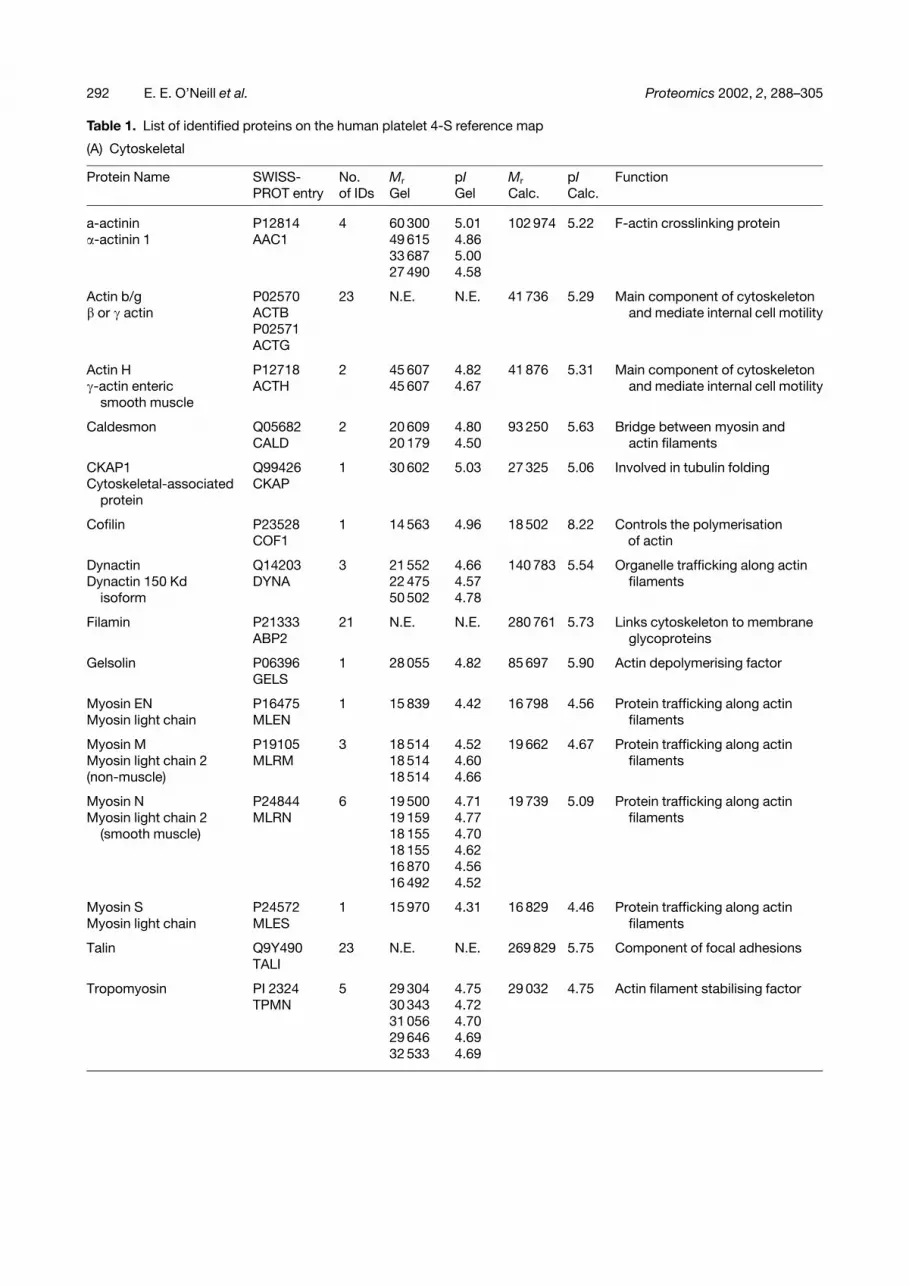
Table 1. List of identified proteins on the human platelet 4-S reference map
(A) Cytoskeletal
Protein Name SWISS-PROT entry
No.of IDs
Mr
GelpIGel
Mr
Calc.pICalc.
Function
a-actinin P12814 4 60 300 5.01 102 974 5.22 F-actin crosslinking protein�-actinin 1 AAC1 49 615 4.86
33 687 5.0027 490 4.58
Actin b/g P02570 23 N.E. N.E. 41 736 5.29 Main component of cytoskeleton� or � actin ACTB and mediate internal cell motility
P02571ACTG
Actin H P12718 2 45 607 4.82 41 876 5.31 Main component of cytoskeleton�-actin enteric ACTH 45 607 4.67 and mediate internal cell motility
smooth muscle
Caldesmon Q05682 2 20 609 4.80 93 250 5.63 Bridge between myosin andCALD 20 179 4.50 actin filaments
CKAP1 Q99426 1 30 602 5.03 27 325 5.06 Involved in tubulin foldingCytoskeletal-associated CKAP
protein
Cofilin P23528COF1
1 14 563 4.96 18 502 8.22 Controls the polymerisationof actin
Dynactin Q14203 3 21 552 4.66 140 783 5.54 Organelle trafficking along actinDynactin 150 Kd DYNA 22 475 4.57 filaments
isoform 50 502 4.78
Filamin P21333 21 N.E. N.E. 280 761 5.73 Links cytoskeleton to membraneABP2 glycoproteins
Gelsolin P06396 1 28 055 4.82 85 697 5.90 Actin depolymerising factorGELS
Myosin EN P16475 1 15 839 4.42 16 798 4.56 Protein trafficking along actinMyosin light chain MLEN filaments
Myosin M P19105 3 18 514 4.52 19 662 4.67 Protein trafficking along actinMyosin light chain 2 MLRM 18 514 4.60 filaments(non-muscle) 18 514 4.66
Myosin N P24844 6 19 500 4.71 19 739 5.09 Protein trafficking along actinMyosin light chain 2 MLRN 19 159 4.77 filaments
(smooth muscle) 18 155 4.7018 155 4.6216 870 4.5616 492 4.52
Myosin S P24572 1 15 970 4.31 16 829 4.46 Protein trafficking along actinMyosin light chain MLES filaments
Talin Q9Y490 23 N.E. N.E. 269 829 5.75 Component of focal adhesionsTALI
Tropomyosin PI 2324 5 29 304 4.75 29 032 4.75 Actin filament stabilising factorTPMN 30 343 4.72
31 056 4.7029 646 4.6932 533 4.69
292 E. E. O’Neill et al. Proteomics 2002, 2, 288–305
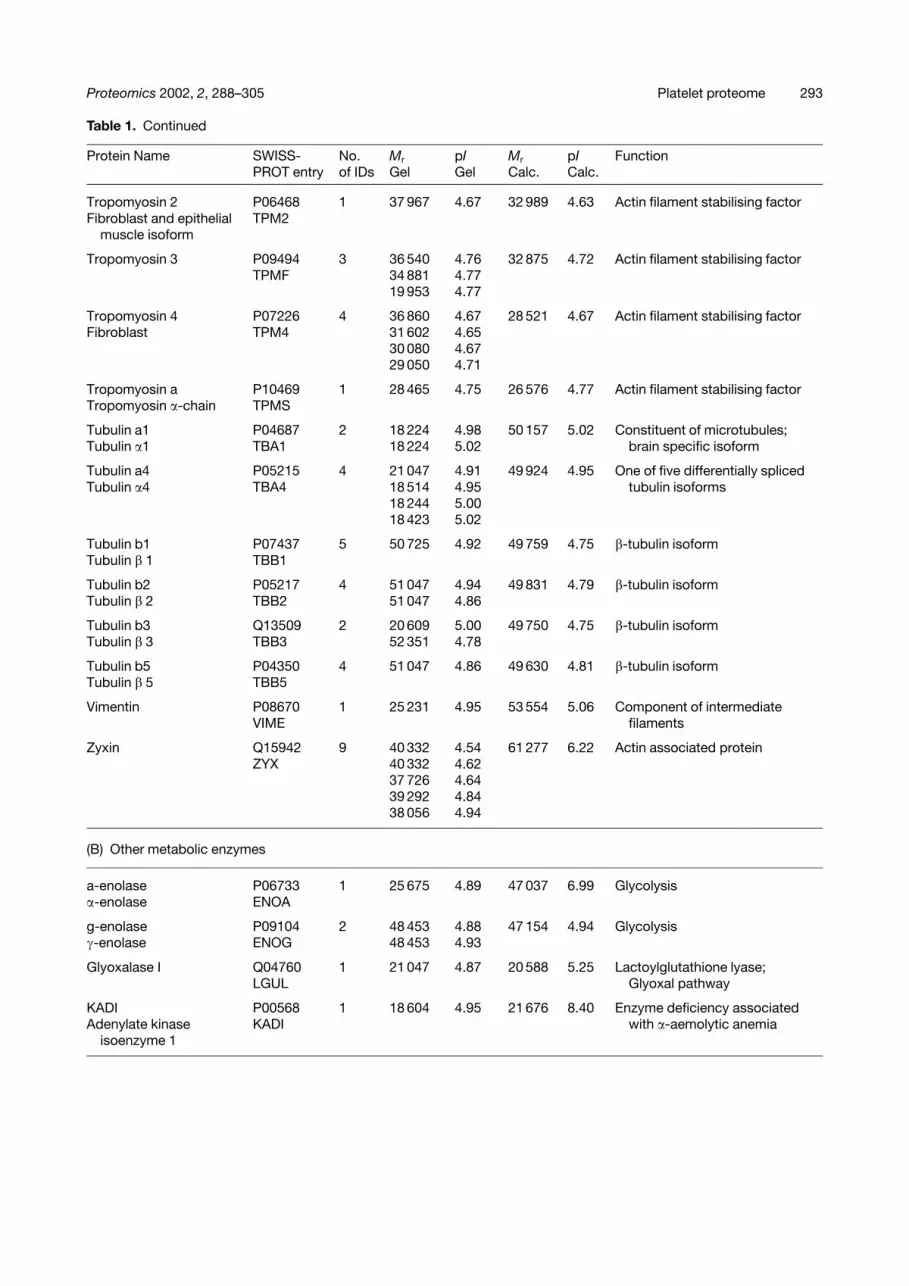
Table 1. Continued
Protein Name SWISS-PROT entry
No.of IDs
Mr
GelpIGel
Mr
Calc.pICalc.
Function
Tropomyosin 2 P06468 1 37 967 4.67 32 989 4.63 Actin filament stabilising factorFibroblast and epithelial TPM2
muscle isoform
Tropomyosin 3 P09494 3 36 540 4.76 32 875 4.72 Actin filament stabilising factorTPMF 34 881 4.77
19 953 4.77
Tropomyosin 4 P07226 4 36 860 4.67 28 521 4.67 Actin filament stabilising factorFibroblast TPM4 31 602 4.65
30 080 4.6729 050 4.71
Tropomyosin a P10469 1 28 465 4.75 26 576 4.77 Actin filament stabilising factorTropomyosin �-chain TPMS
Tubulin a1 P04687 2 18 224 4.98 50 157 5.02 Constituent of microtubules;Tubulin �1 TBA1 18 224 5.02 brain specific isoform
Tubulin a4 P05215 4 21 047 4.91 49 924 4.95 One of five differentially splicedTubulin �4 TBA4 18 514 4.95 tubulin isoforms
18 244 5.0018 423 5.02
Tubulin b1 P07437 5 50 725 4.92 49 759 4.75 �-tubulin isoformTubulin � 1 TBB1
Tubulin b2 P05217 4 51 047 4.94 49 831 4.79 �-tubulin isoformTubulin � 2 TBB2 51 047 4.86
Tubulin b3 Q13509 2 20 609 5.00 49 750 4.75 �-tubulin isoformTubulin � 3 TBB3 52 351 4.78
Tubulin b5 P04350 4 51 047 4.86 49 630 4.81 �-tubulin isoformTubulin � 5 TBB5
Vimentin P08670 1 25 231 4.95 53 554 5.06 Component of intermediateVIME filaments
Zyxin Q15942 9 40 332 4.54 61 277 6.22 Actin associated proteinZYX 40 332 4.62
37 726 4.6439 292 4.8438 056 4.94
(B) Other metabolic enzymes
a-enolase P06733 1 25 675 4.89 47 037 6.99 Glycolysis�-enolase ENOA
g-enolase P09104 2 48 453 4.88 47 154 4.94 Glycolysis�-enolase ENOG 48 453 4.93
Glyoxalase I Q04760 1 21 047 4.87 20 588 5.25 Lactoylglutathione lyase;LGUL Glyoxal pathway
KADI P00568 1 18 604 4.95 21 676 8.40 Enzyme deficiency associatedAdenylate kinase KADI with �-aemolytic anemia
isoenzyme 1
Proteomics 2002, 2, 288–305 Platelet proteome 293
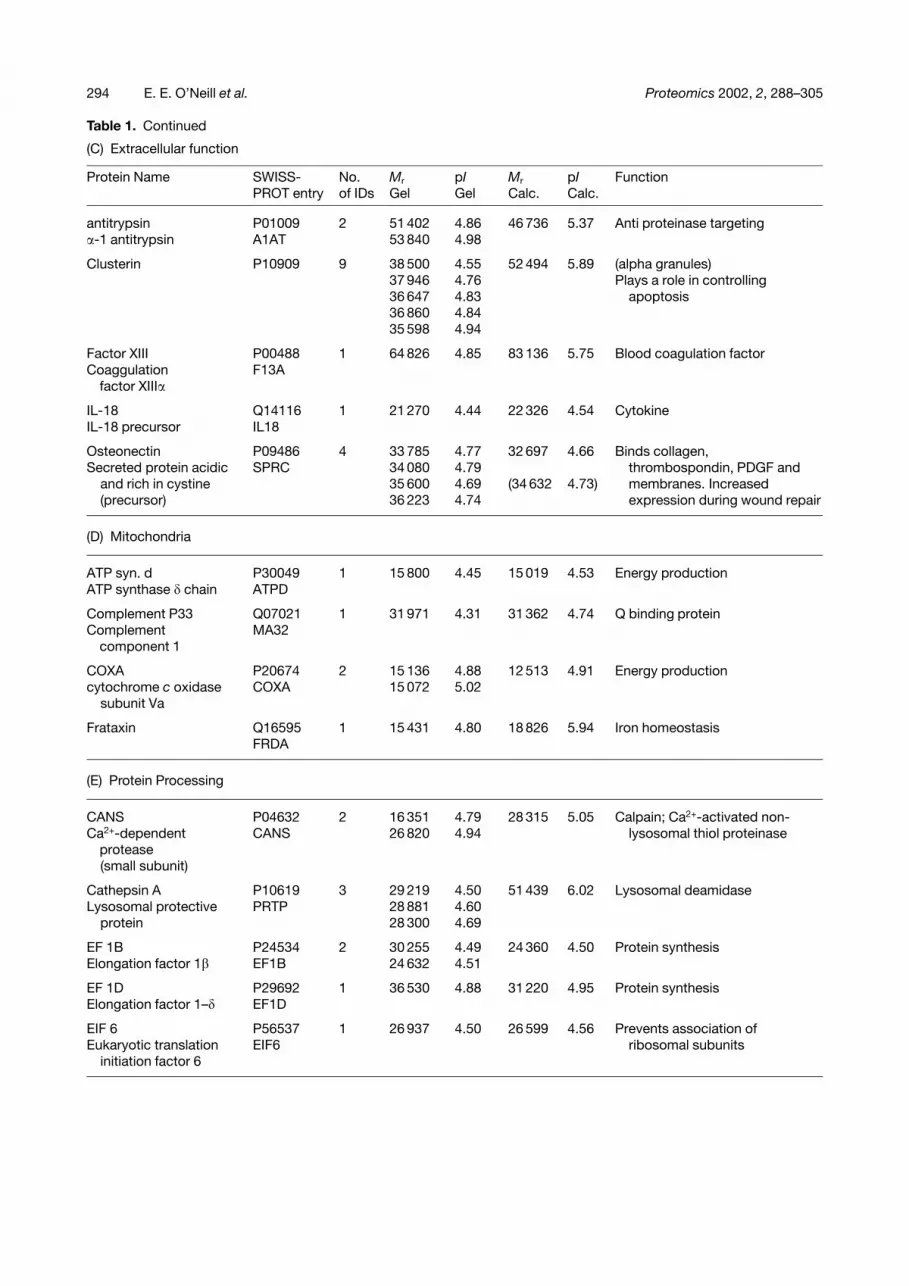
Table 1. Continued
(C) Extracellular function
Protein Name SWISS-PROT entry
No.of IDs
Mr
GelpIGel
Mr
Calc.pICalc.
Function
antitrypsin P01009 2 51 402 4.86 46 736 5.37 Anti proteinase targeting�-1 antitrypsin A1AT 53 840 4.98
Clusterin P10909 9 38 500 4.55 52 494 5.89 (alpha granules)37 946 4.76 Plays a role in controlling36 647 4.83 apoptosis36 860 4.8435 598 4.94
Factor XIII P00488 1 64 826 4.85 83 136 5.75 Blood coagulation factorCoaggulation
factor XIII�F13A
IL-18 Q14116 1 21 270 4.44 22 326 4.54 CytokineIL-18 precursor IL18
Osteonectin P09486 4 33 785 4.77 32 697 4.66 Binds collagen,Secreted protein acidic SPRC 34 080 4.79 thrombospondin, PDGF and
and rich in cystine 35 600 4.69 (34 632 4.73) membranes. Increased(precursor) 36 223 4.74 expression during wound repair
(D) Mitochondria
ATP syn. d P30049 1 15 800 4.45 15 019 4.53 Energy productionATP synthase � chain ATPD
Complement P33 Q07021 1 31 971 4.31 31 362 4.74 Q binding proteinComplement
component 1MA32
COXA P20674 2 15 136 4.88 12 513 4.91 Energy productioncytochrome c oxidase COXA 15 072 5.02
subunit Va
Frataxin Q16595 1 15 431 4.80 18 826 5.94 Iron homeostasisFRDA
(E) Protein Processing
CANS P04632 2 16 351 4.79 28 315 5.05 Calpain; Ca2+-activated non-Ca2+-dependent
proteaseCANS 26 820 4.94 lysosomal thiol proteinase
(small subunit)
Cathepsin A P10619 3 29 219 4.50 51 439 6.02 Lysosomal deamidaseLysosomal protective PRTP 28 881 4.60
protein 28 300 4.69
EF 1B P24534 2 30 255 4.49 24 360 4.50 Protein synthesisElongation factor 1� EF1B 24 632 4.51
EF 1D P29692 1 36 530 4.88 31 220 4.95 Protein synthesisElongation factor 1–� EF1D
EIF 6 P56537 1 26 937 4.50 26 599 4.56 Prevents association ofEukaryotic translation EIF6 ribosomal subunits
initiation factor 6
294 E. E. O’Neill et al. Proteomics 2002, 2, 288–305
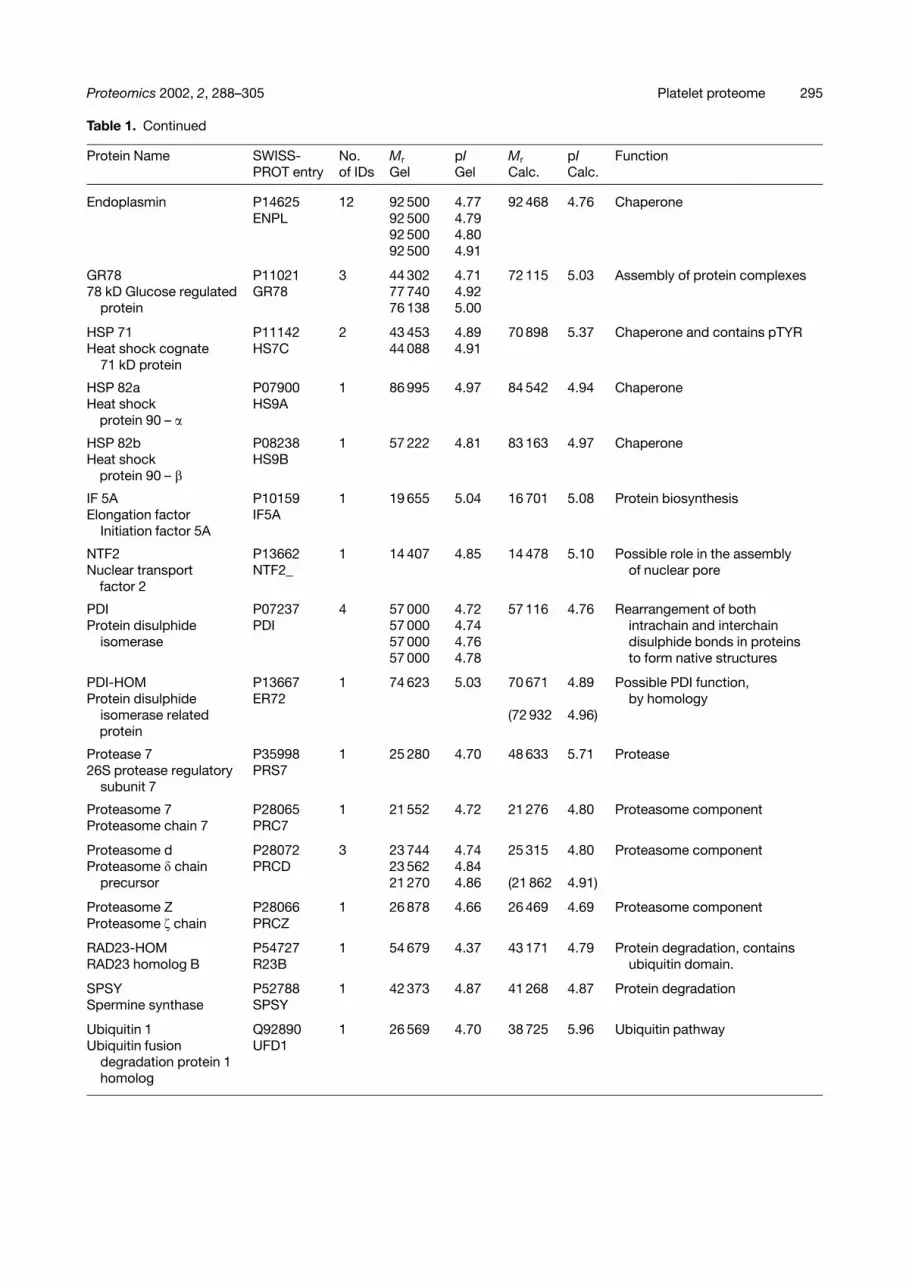
Table 1. Continued
Protein Name SWISS-PROT entry
No.of IDs
Mr
GelpIGel
Mr
Calc.pICalc.
Function
Endoplasmin P14625 12 92 500 4.77 92 468 4.76 ChaperoneENPL 92 500 4.79
92 500 4.8092 500 4.91
GR78 P11021 3 44 302 4.71 72 115 5.03 Assembly of protein complexes78 kD Glucose regulated GR78 77 740 4.92
protein 76 138 5.00
HSP 71 P11142 2 43 453 4.89 70 898 5.37 Chaperone and contains pTYRHeat shock cognate HS7C 44 088 4.91
71 kD protein
HSP 82a P07900 1 86 995 4.97 84 542 4.94 ChaperoneHeat shock
protein 90 – �HS9A
HSP 82b P08238 1 57 222 4.81 83 163 4.97 ChaperoneHeat shock
protein 90 – �HS9B
IF 5A P10159 1 19 655 5.04 16 701 5.08 Protein biosynthesisElongation factor IF5A
Initiation factor 5A
NTF2 P13662 1 14 407 4.85 14 478 5.10 Possible role in the assemblyNuclear transport
factor 2NTF2_ of nuclear pore
PDI P07237 4 57 000 4.72 57 116 4.76 Rearrangement of bothProtein disulphide PDI 57 000 4.74 intrachain and interchain
isomerase 57 000 4.76 disulphide bonds in proteins57 000 4.78 to form native structures
PDI-HOM P13667 1 74 623 5.03 70 671 4.89 Possible PDI function,Protein disulphide ER72 by homology
isomerase relatedprotein
(72 932 4.96)
Protease 7 P35998 1 25 280 4.70 48 633 5.71 Protease26S protease regulatory PRS7
subunit 7
Proteasome 7 P28065 1 21 552 4.72 21 276 4.80 Proteasome componentProteasome chain 7 PRC7
Proteasome d P28072 3 23 744 4.74 25 315 4.80 Proteasome componentProteasome � chain PRCD 23 562 4.84
precursor 21 270 4.86 (21 862 4.91)
Proteasome Z P28066 1 26 878 4.66 26 469 4.69 Proteasome componentProteasome � chain PRCZ
RAD23-HOM P54727 1 54 679 4.37 43 171 4.79 Protein degradation, containsRAD23 homolog B R23B ubiquitin domain.
SPSY P52788 1 42 373 4.87 41 268 4.87 Protein degradationSpermine synthase SPSY
Ubiquitin 1 Q92890 1 26 569 4.70 38 725 5.96 Ubiquitin pathwayUbiquitin fusion UFD1
degradation protein 1homolog
Proteomics 2002, 2, 288–305 Platelet proteome 295
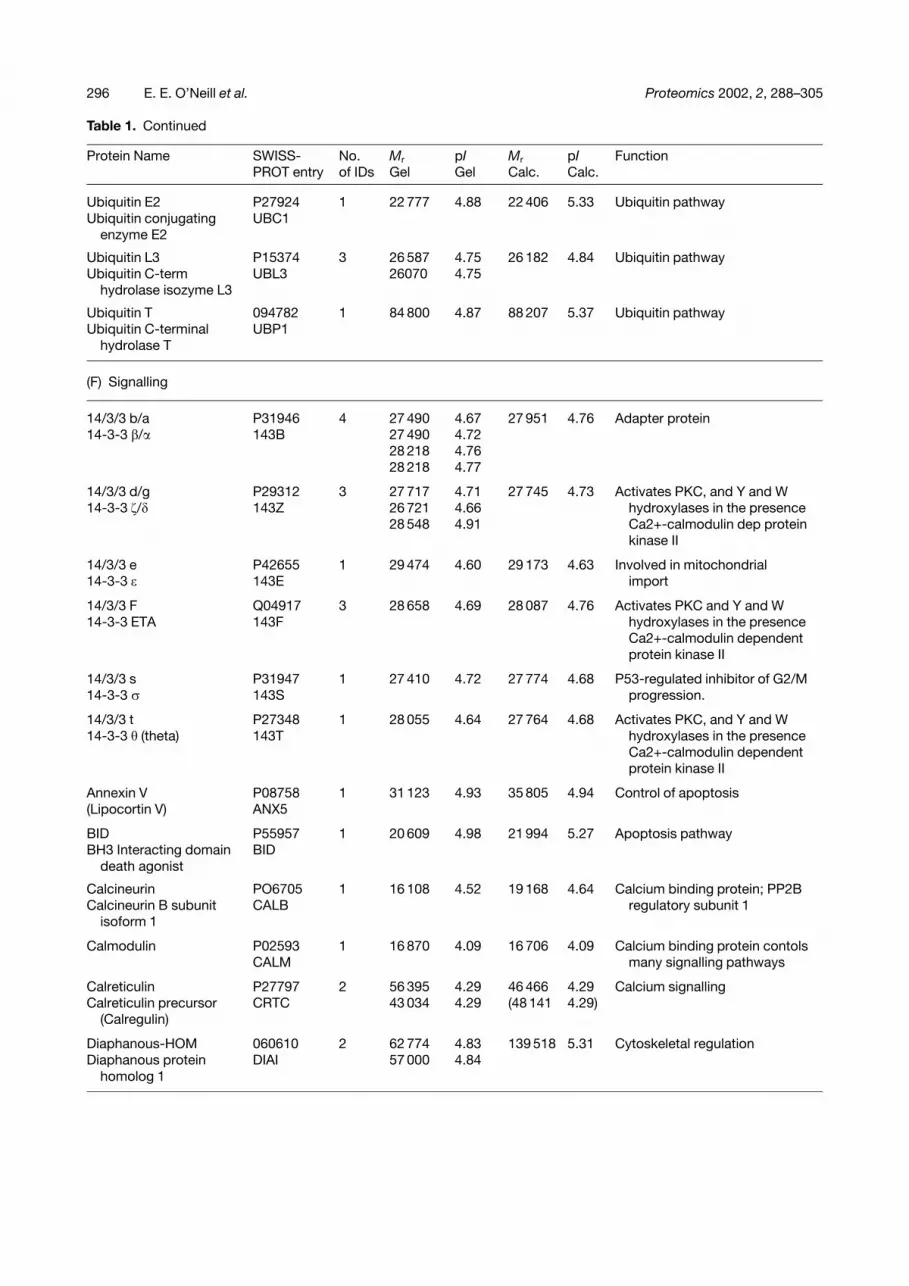
Table 1. Continued
Protein Name SWISS-PROT entry
No.of IDs
Mr
GelpIGel
Mr
Calc.pICalc.
Function
Ubiquitin E2 P27924 1 22 777 4.88 22 406 5.33 Ubiquitin pathwayUbiquitin conjugating UBC1
enzyme E2
Ubiquitin L3 P15374 3 26 587 4.75 26 182 4.84 Ubiquitin pathwayUbiquitin C-term UBL3 26070 4.75
hydrolase isozyme L3
Ubiquitin T 094782 1 84 800 4.87 88 207 5.37 Ubiquitin pathwayUbiquitin C-terminal UBP1
hydrolase T
(F) Signalling
14/3/3 b/a P31946 4 27 490 4.67 27 951 4.76 Adapter protein14-3-3 �/� 143B 27 490 4.72
28 218 4.7628 218 4.77
14/3/3 d/g P29312 3 27 717 4.71 27 745 4.73 Activates PKC, and Y and W14-3-3 �/� 143Z 26 721 4.66 hydroxylases in the presence
28 548 4.91 Ca2+-calmodulin dep proteinkinase II
14/3/3 e P42655 1 29 474 4.60 29 173 4.63 Involved in mitochondrial14-3-3 � 143E import
14/3/3 F Q04917 3 28 658 4.69 28 087 4.76 Activates PKC and Y and W14-3-3 ETA 143F hydroxylases in the presence
Ca2+-calmodulin dependentprotein kinase II
14/3/3 s P31947 1 27 410 4.72 27 774 4.68 P53-regulated inhibitor of G2/M14-3-3 143S progression.
14/3/3 t P27348 1 28 055 4.64 27 764 4.68 Activates PKC, and Y and W14-3-3 (theta) 143T hydroxylases in the presence
Ca2+-calmodulin dependentprotein kinase II
Annexin V P08758 1 31 123 4.93 35 805 4.94 Control of apoptosis(Lipocortin V) ANX5
BID P55957 1 20 609 4.98 21 994 5.27 Apoptosis pathwayBH3 Interacting domain BID
death agonist
Calcineurin PO6705 1 16 108 4.52 19 168 4.64 Calcium binding protein; PP2BCalcineurin B subunit CALB regulatory subunit 1
isoform 1
Calmodulin P02593 1 16 870 4.09 16 706 4.09 Calcium binding protein contolsCALM many signalling pathways
Calreticulin P27797 2 56 395 4.29 46 466 4.29 Calcium signallingCalreticulin precursor CRTC 43 034 4.29 (48 141 4.29)
(Calregulin)
Diaphanous-HOM 060610 2 62 774 4.83 139 518 5.31 Cytoskeletal regulationDiaphanous protein DIAI 57 000 4.84
homolog 1
296 E. E. O’Neill et al. Proteomics 2002, 2, 288–305
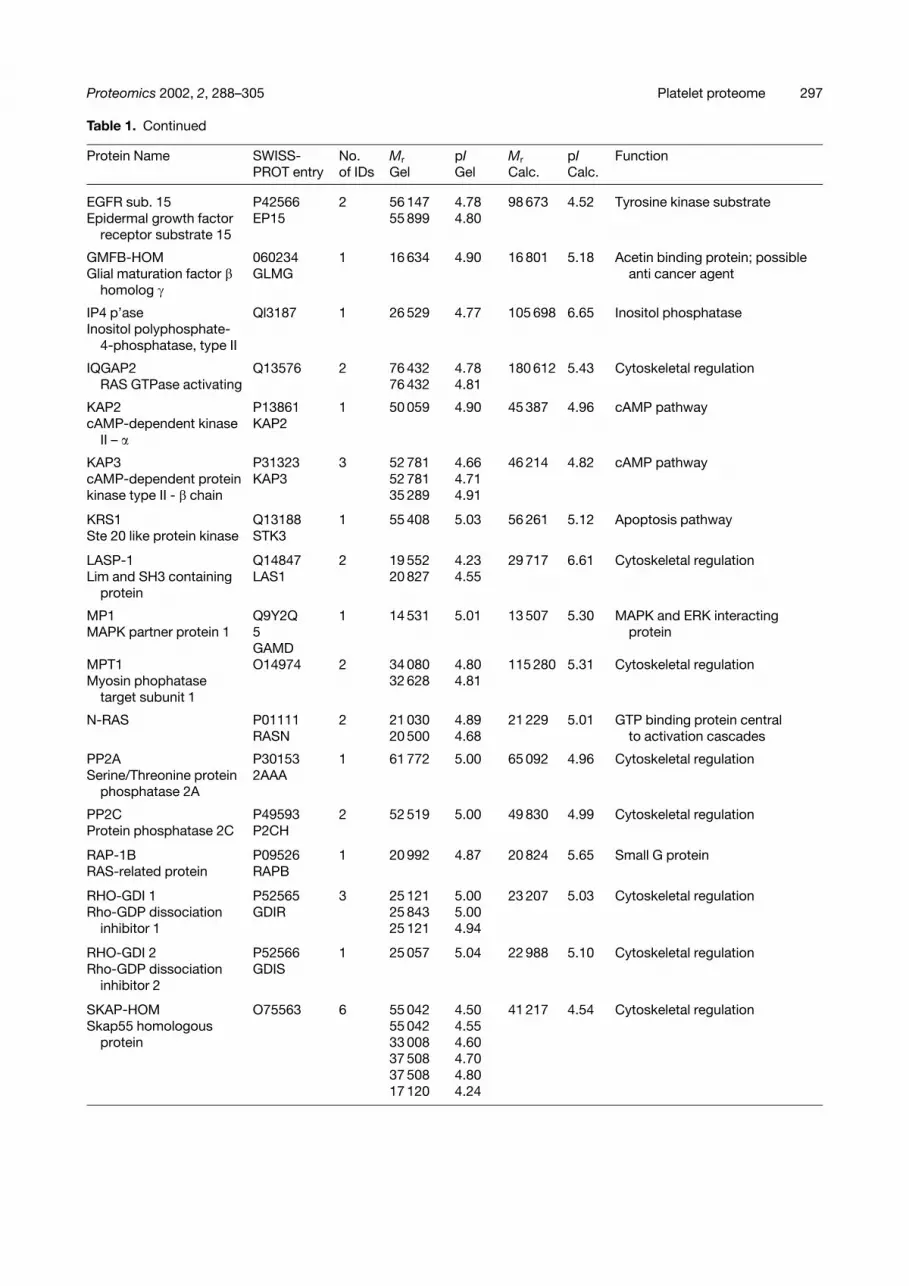
Table 1. Continued
Protein Name SWISS-PROT entry
No.of IDs
Mr
GelpIGel
Mr
Calc.pICalc.
Function
EGFR sub. 15 P42566 2 56 147 4.78 98 673 4.52 Tyrosine kinase substrateEpidermal growth factor EP15 55 899 4.80
receptor substrate 15
GMFB-HOM 060234 1 16 634 4.90 16 801 5.18 Acetin binding protein; possibleGlial maturation factor � GLMG anti cancer agent
homolog �
IP4 p’ase Ql3187 1 26 529 4.77 105 698 6.65 Inositol phosphataseInositol polyphosphate-
4-phosphatase, type II
IQGAP2 Q13576 2 76 432 4.78 180 612 5.43 Cytoskeletal regulationRAS GTPase activating 76 432 4.81
KAP2 P13861 1 50 059 4.90 45 387 4.96 cAMP pathwaycAMP-dependent kinase KAP2
II – �
KAP3 P31323 3 52 781 4.66 46 214 4.82 cAMP pathwaycAMP-dependent protein KAP3 52 781 4.71kinase type II - � chain 35 289 4.91
KRS1 Q13188 1 55 408 5.03 56 261 5.12 Apoptosis pathwaySte 20 like protein kinase STK3
LASP-1 Q14847 2 19 552 4.23 29 717 6.61 Cytoskeletal regulationLim and SH3 containing LAS1 20 827 4.55
protein
MP1 Q9Y2Q 1 14 531 5.01 13 507 5.30 MAPK and ERK interactingMAPK partner protein 1 5 protein
GAMDMPT1 O14974 2 34 080 4.80 115 280 5.31 Cytoskeletal regulationMyosin phophatase 32 628 4.81
target subunit 1
N-RAS P01111 2 21 030 4.89 21 229 5.01 GTP binding protein centralRASN 20 500 4.68 to activation cascades
PP2A P30153 1 61 772 5.00 65 092 4.96 Cytoskeletal regulationSerine/Threonine protein 2AAA
phosphatase 2A
PP2C P49593 2 52 519 5.00 49 830 4.99 Cytoskeletal regulationProtein phosphatase 2C P2CH
RAP-1B P09526 1 20 992 4.87 20 824 5.65 Small G proteinRAS-related protein RAPB
RHO-GDI 1 P52565 3 25 121 5.00 23 207 5.03 Cytoskeletal regulationRho-GDP dissociation GDIR 25 843 5.00
inhibitor 1 25 121 4.94
RHO-GDI 2 P52566 1 25 057 5.04 22 988 5.10 Cytoskeletal regulationRho-GDP dissociation GDIS
inhibitor 2
SKAP-HOM O75563 6 55 042 4.50 41 217 4.54 Cytoskeletal regulationSkap55 homologous 55 042 4.55
protein 33 008 4.6037 508 4.7037 508 4.8017 120 4.24
Proteomics 2002, 2, 288–305 Platelet proteome 297
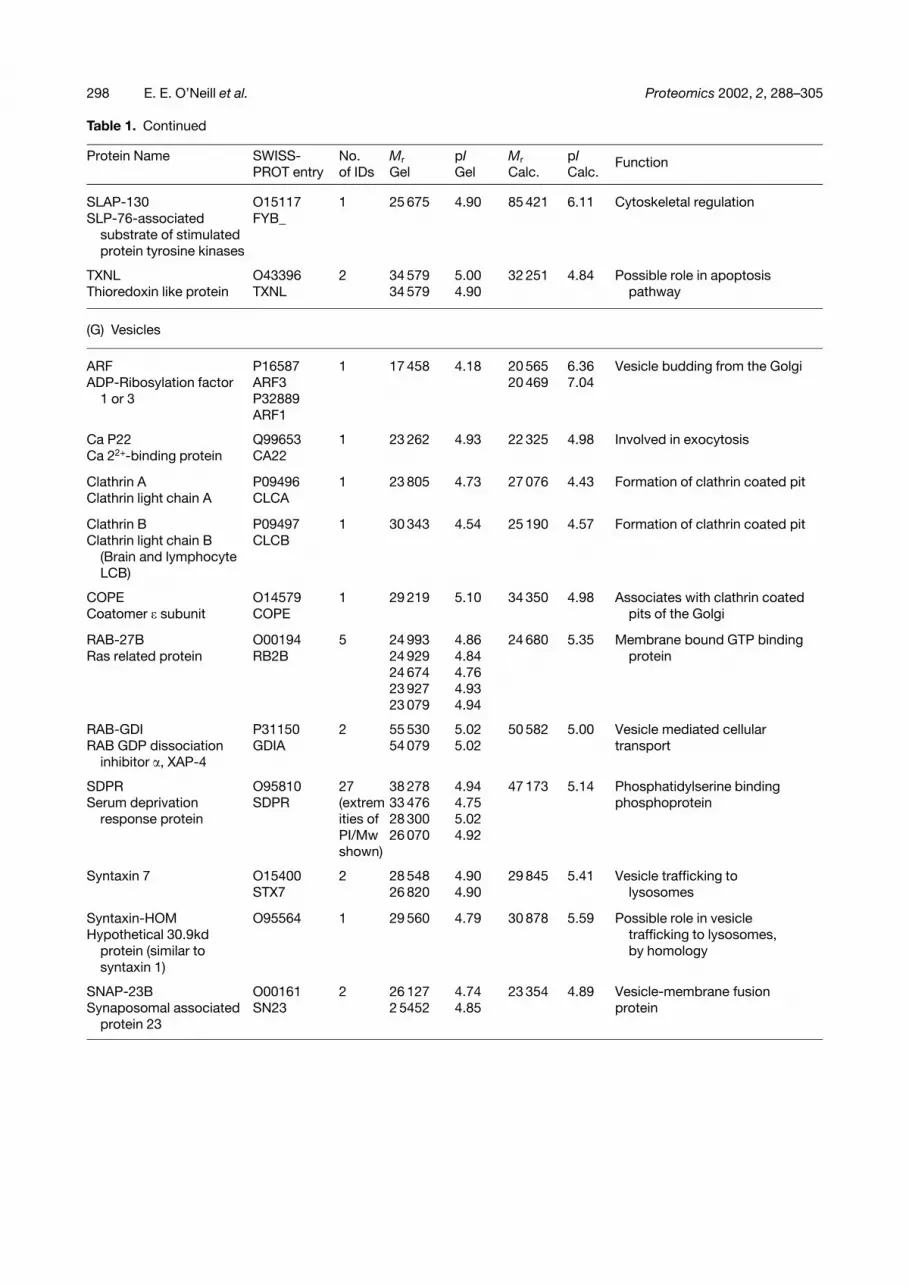
Table 1. Continued
Protein Name SWISS-PROT entry
No.of IDs
Mr
GelpIGel
Mr
Calc.pICalc.
Function
SLAP-130 O15117 1 25 675 4.90 85 421 6.11 Cytoskeletal regulationSLP-76-associated FYB_
substrate of stimulatedprotein tyrosine kinases
TXNL O43396 2 34 579 5.00 32 251 4.84 Possible role in apoptosisThioredoxin like protein TXNL 34 579 4.90 pathway
(G) Vesicles
ARF P16587 1 17 458 4.18 20 565 6.36 Vesicle budding from the GolgiADP-Ribosylation factor ARF3 20 469 7.04
1 or 3 P32889ARF1
Ca P22 Q99653 1 23 262 4.93 22 325 4.98 Involved in exocytosisCa 22+-binding protein CA22
Clathrin A P09496 1 23 805 4.73 27 076 4.43 Formation of clathrin coated pitClathrin light chain A CLCA
Clathrin B P09497 1 30 343 4.54 25 190 4.57 Formation of clathrin coated pitClathrin light chain B CLCB
(Brain and lymphocyteLCB)
COPE O14579 1 29 219 5.10 34 350 4.98 Associates with clathrin coatedCoatomer � subunit COPE pits of the Golgi
RAB-27B O00194 5 24 993 4.86 24 680 5.35 Membrane bound GTP bindingRas related protein RB2B 24 929 4.84 protein
24 674 4.7623 927 4.9323 079 4.94
RAB-GDI P31150 2 55 530 5.02 50 582 5.00 Vesicle mediated cellularRAB GDP dissociation GDIA 54 079 5.02 transport
inhibitor �, XAP-4
SDPR O95810 27 38 278 4.94 47 173 5.14 Phosphatidylserine bindingSerum deprivation SDPR (extrem 33 476 4.75 phosphoprotein
response protein ities of 28 300 5.02PI/Mw 26 070 4.92shown)
Syntaxin 7 O15400 2 28 548 4.90 29 845 5.41 Vesicle trafficking toSTX7 26 820 4.90 lysosomes
Syntaxin-HOM O95564 1 29 560 4.79 30 878 5.59 Possible role in vesicleHypothetical 30.9kd trafficking to lysosomes,
protein (similar to by homologysyntaxin 1)
SNAP-23B O00161 2 26 127 4.74 23 354 4.89 Vesicle-membrane fusionSynaposomal associated SN23 2 5452 4.85 protein
protein 23
298 E. E. O’Neill et al. Proteomics 2002, 2, 288–305
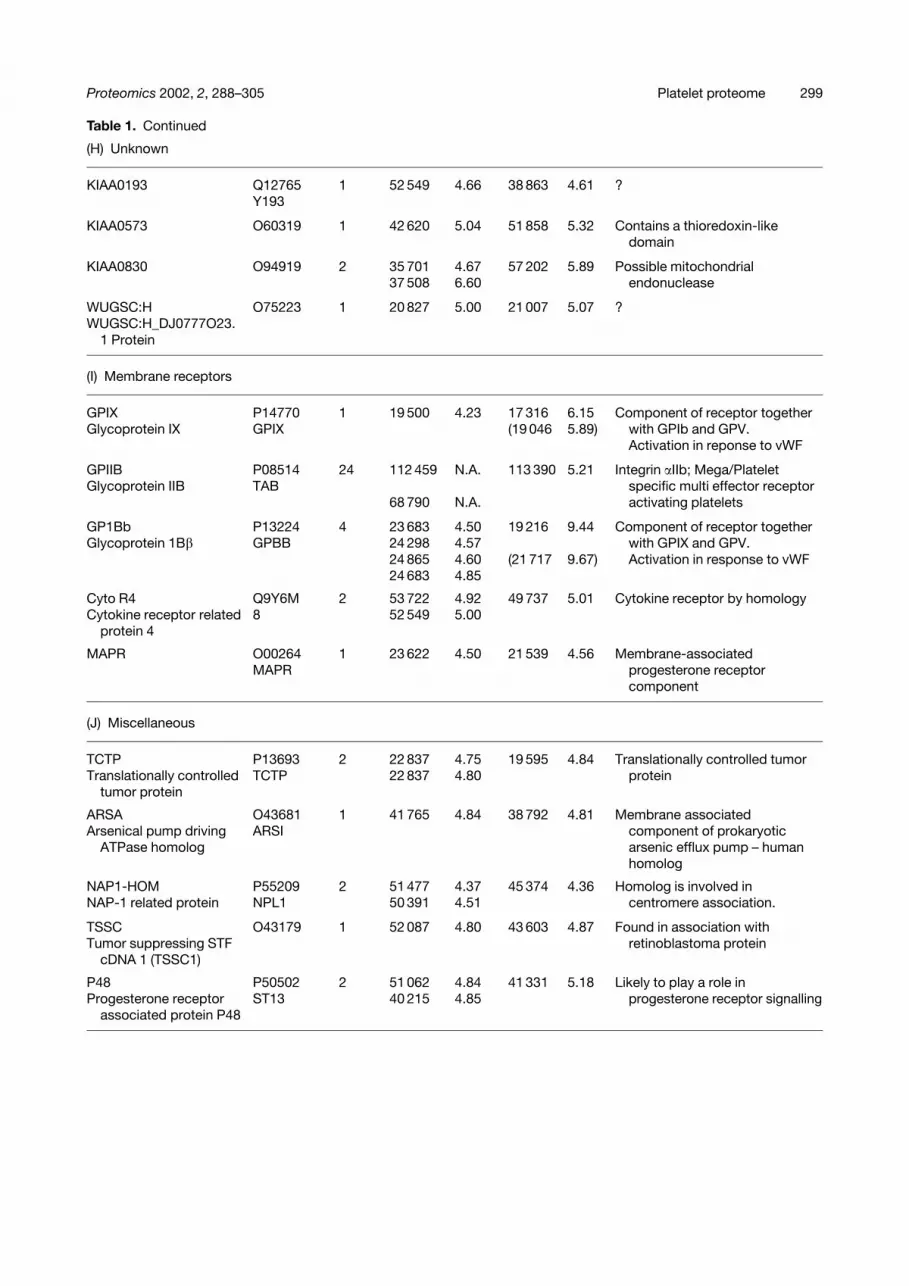
Table 1. Continued
(H) Unknown
KIAA0193 Q12765 1 52 549 4.66 38 863 4.61 ?Y193
KIAA0573 O60319 1 42 620 5.04 51 858 5.32 Contains a thioredoxin-likedomain
KIAA0830 O94919 2 35 701 4.67 57 202 5.89 Possible mitochondrial37 508 6.60 endonuclease
WUGSC:H O75223 1 20 827 5.00 21 007 5.07 ?WUGSC:H_DJ0777O23.
1 Protein
(I) Membrane receptors
GPIX P14770 1 19 500 4.23 17 316 6.15 Component of receptor togetherGlycoprotein IX GPIX (19 046 5.89) with GPIb and GPV.
Activation in reponse to vWF
GPIIB P08514 24 112 459 N.A. 113 390 5.21 Integrin �IIb; Mega/PlateletGlycoprotein IIB TAB specific multi effector receptor
68 790 N.A. activating platelets
GP1Bb P13224 4 23 683 4.50 19 216 9.44 Component of receptor togetherGlycoprotein 1B� GPBB 24 298 4.57 with GPIX and GPV.
24 865 4.60 (21 717 9.67) Activation in response to vWF24 683 4.85
Cyto R4 Q9Y6M 2 53 722 4.92 49 737 5.01 Cytokine receptor by homologyCytokine receptor related 8 52 549 5.00
protein 4
MAPR O00264 1 23 622 4.50 21 539 4.56 Membrane-associatedMAPR progesterone receptor
component
(J) Miscellaneous
TCTP P13693 2 22 837 4.75 19 595 4.84 Translationally controlled tumorTranslationally controlled TCTP 22 837 4.80 protein
tumor protein
ARSA O43681 1 41 765 4.84 38 792 4.81 Membrane associatedArsenical pump driving ARSI component of prokaryotic
ATPase homolog arsenic efflux pump – humanhomolog
NAP1-HOM P55209 2 51 477 4.37 45 374 4.36 Homolog is involved inNAP-1 related protein NPL1 50 391 4.51 centromere association.
TSSC O43179 1 52 087 4.80 43 603 4.87 Found in association withTumor suppressing STF retinoblastoma protein
cDNA 1 (TSSC1)
P48 P50502 2 51 062 4.84 41 331 5.18 Likely to play a role inProgesterone receptor ST13 40 215 4.85 progesterone receptor signalling
associated protein P48
Proteomics 2002, 2, 288–305 Platelet proteome 299
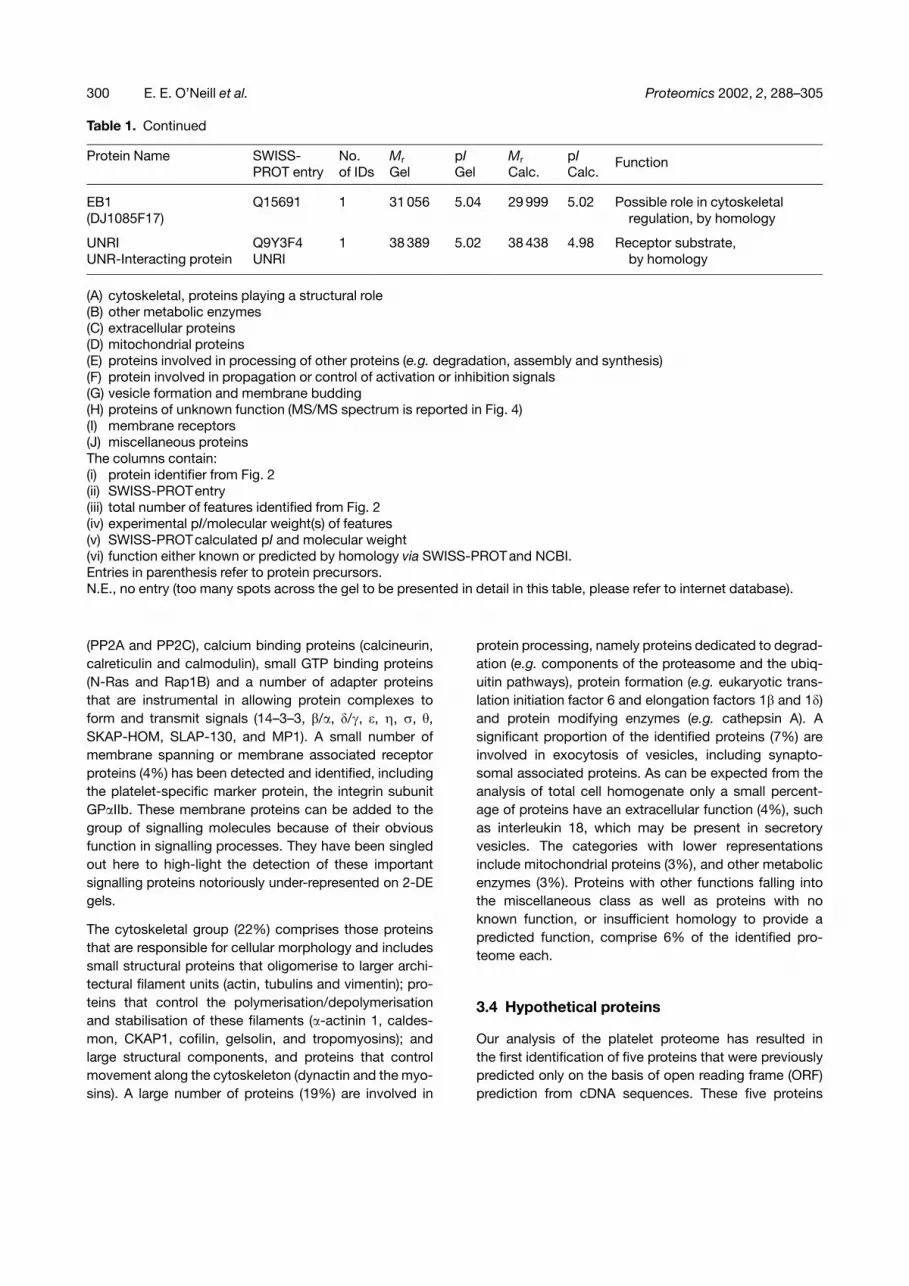
Table 1. Continued
Protein Name SWISS-PROT entry
No.of IDs
Mr
GelpIGel
Mr
Calc.pICalc.
Function
EB1 Q15691 1 31 056 5.04 29 999 5.02 Possible role in cytoskeletal(DJ1085F17) regulation, by homology
UNRI Q9Y3F4 1 38 389 5.02 38 438 4.98 Receptor substrate,UNR-Interacting protein UNRI by homology
(A) cytoskeletal, proteins playing a structural role(B) other metabolic enzymes(C) extracellular proteins(D) mitochondrial proteins(E) proteins involved in processing of other proteins (e.g. degradation, assembly and synthesis)(F) protein involved in propagation or control of activation or inhibition signals(G) vesicle formation and membrane budding(H) proteins of unknown function (MS/MS spectrum is reported in Fig. 4)(I) membrane receptors(J) miscellaneous proteinsThe columns contain:(i) protein identifier from Fig. 2(ii) SWISS-PROTentry(iii) total number of features identified from Fig. 2(iv) experimental pI/molecular weight(s) of features(v) SWISS-PROTcalculated pI and molecular weight(vi) function either known or predicted by homology via SWISS-PROTand NCBI.Entries in parenthesis refer to protein precursors.N.E., no entry (too many spots across the gel to be presented in detail in this table, please refer to internet database).
(PP2A and PP2C), calcium binding proteins (calcineurin,calreticulin and calmodulin), small GTP binding proteins(N-Ras and Rap1B) and a number of adapter proteinsthat are instrumental in allowing protein complexes toform and transmit signals (14–3–3, �/�, �/�, �, �, , ,SKAP-HOM, SLAP-130, and MP1). A small number ofmembrane spanning or membrane associated receptorproteins (4%) has been detected and identified, includingthe platelet-specific marker protein, the integrin subunitGP�IIb. These membrane proteins can be added to thegroup of signalling molecules because of their obviousfunction in signalling processes. They have been singledout here to high-light the detection of these importantsignalling proteins notoriously under-represented on 2-DEgels.
The cytoskeletal group (22%) comprises those proteinsthat are responsible for cellular morphology and includessmall structural proteins that oligomerise to larger archi-tectural filament units (actin, tubulins and vimentin); pro-teins that control the polymerisation/depolymerisationand stabilisation of these filaments (�-actinin 1, caldes-mon, CKAP1, cofilin, gelsolin, and tropomyosins); andlarge structural components, and proteins that controlmovement along the cytoskeleton (dynactin and the myo-sins). A large number of proteins (19%) are involved in
protein processing, namely proteins dedicated to degrad-ation (e.g. components of the proteasome and the ubiq-uitin pathways), protein formation (e.g. eukaryotic trans-lation initiation factor 6 and elongation factors 1� and 1�)and protein modifying enzymes (e.g. cathepsin A). Asignificant proportion of the identified proteins (7%) areinvolved in exocytosis of vesicles, including synapto-somal associated proteins. As can be expected from theanalysis of total cell homogenate only a small percent-age of proteins have an extracellular function (4%), suchas interleukin 18, which may be present in secretoryvesicles. The categories with lower representationsinclude mitochondrial proteins (3%), and other metabolicenzymes (3%). Proteins with other functions falling intothe miscellaneous class as well as proteins with noknown function, or insufficient homology to provide apredicted function, comprise 6% of the identified pro-teome each.
3.4 Hypothetical proteins
Our analysis of the platelet proteome has resulted inthe first identification of five proteins that were previouslypredicted only on the basis of open reading frame (ORF)prediction from cDNA sequences. These five proteins
300 E. E. O’Neill et al. Proteomics 2002, 2, 288–305
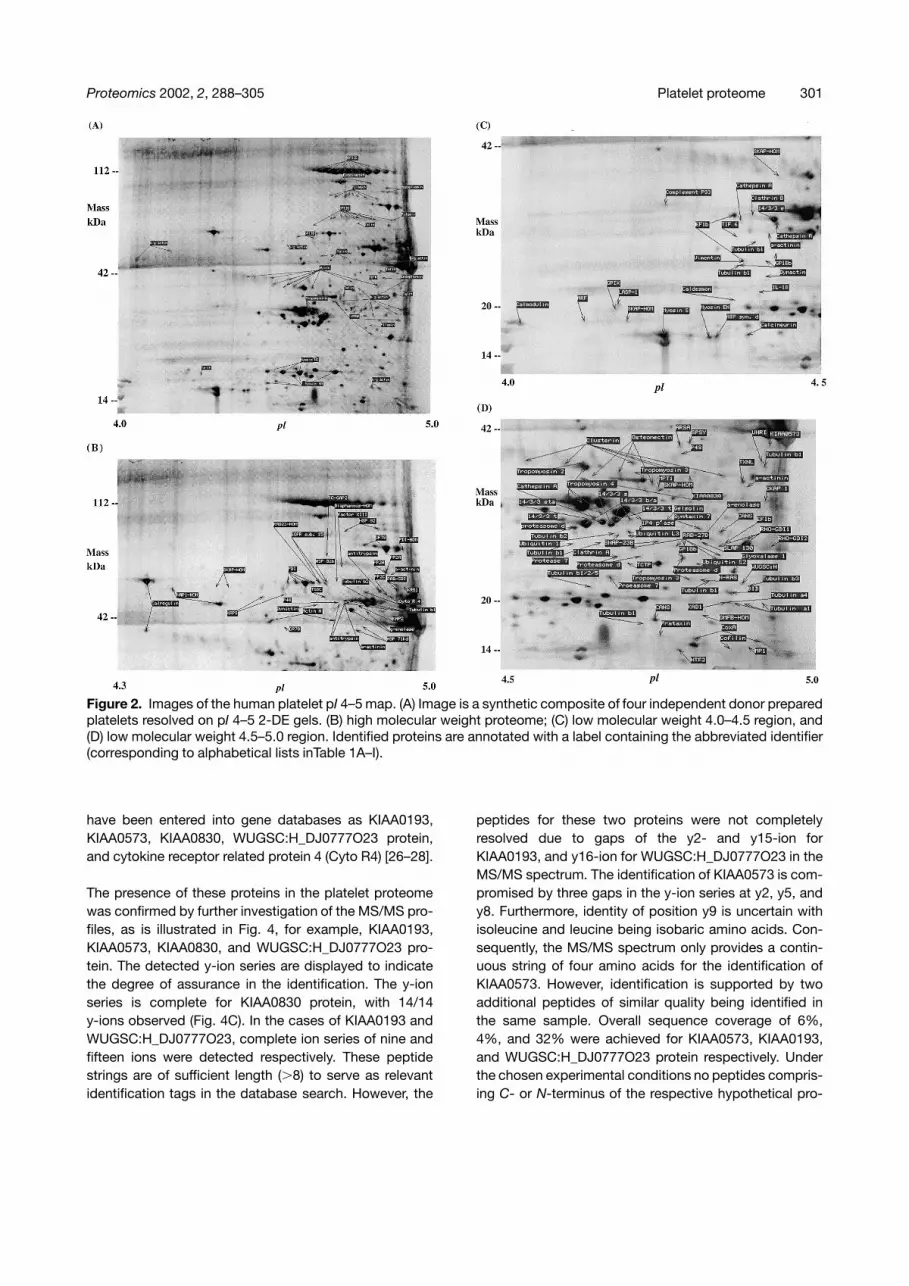
Figure 2. Images of the human platelet pI 4–5 map. (A) Image is a synthetic composite of four independent donor preparedplatelets resolved on pI 4–5 2-DE gels. (B) high molecular weight proteome; (C) low molecular weight 4.0–4.5 region, and(D) low molecular weight 4.5–5.0 region. Identified proteins are annotated with a label containing the abbreviated identifier(corresponding to alphabetical lists inTable 1A–I).
have been entered into gene databases as KIAA0193,KIAA0573, KIAA0830, WUGSC:H_DJ0777O23 protein,and cytokine receptor related protein 4 (Cyto R4) [26–28].
The presence of these proteins in the platelet proteomewas confirmed by further investigation of the MS/MS pro-files, as is illustrated in Fig. 4, for example, KIAA0193,KIAA0573, KIAA0830, and WUGSC:H_DJ0777O23 pro-tein. The detected y-ion series are displayed to indicatethe degree of assurance in the identification. The y-ionseries is complete for KIAA0830 protein, with 14/14y-ions observed (Fig. 4C). In the cases of KIAA0193 andWUGSC:H_DJ0777O23, complete ion series of nine andfifteen ions were detected respectively. These peptidestrings are of sufficient length (�8) to serve as relevantidentification tags in the database search. However, the
peptides for these two proteins were not completelyresolved due to gaps of the y2- and y15-ion forKIAA0193, and y16-ion for WUGSC:H_DJ0777O23 in theMS/MS spectrum. The identification of KIAA0573 is com-promised by three gaps in the y-ion series at y2, y5, andy8. Furthermore, identity of position y9 is uncertain withisoleucine and leucine being isobaric amino acids. Con-sequently, the MS/MS spectrum only provides a contin-uous string of four amino acids for the identification ofKIAA0573. However, identification is supported by twoadditional peptides of similar quality being identified inthe same sample. Overall sequence coverage of 6%,4%, and 32% were achieved for KIAA0573, KIAA0193,and WUGSC:H_DJ0777O23 protein respectively. Underthe chosen experimental conditions no peptides compris-ing C- or N-terminus of the respective hypothetical pro-
Proteomics 2002, 2, 288–305 Platelet proteome 301
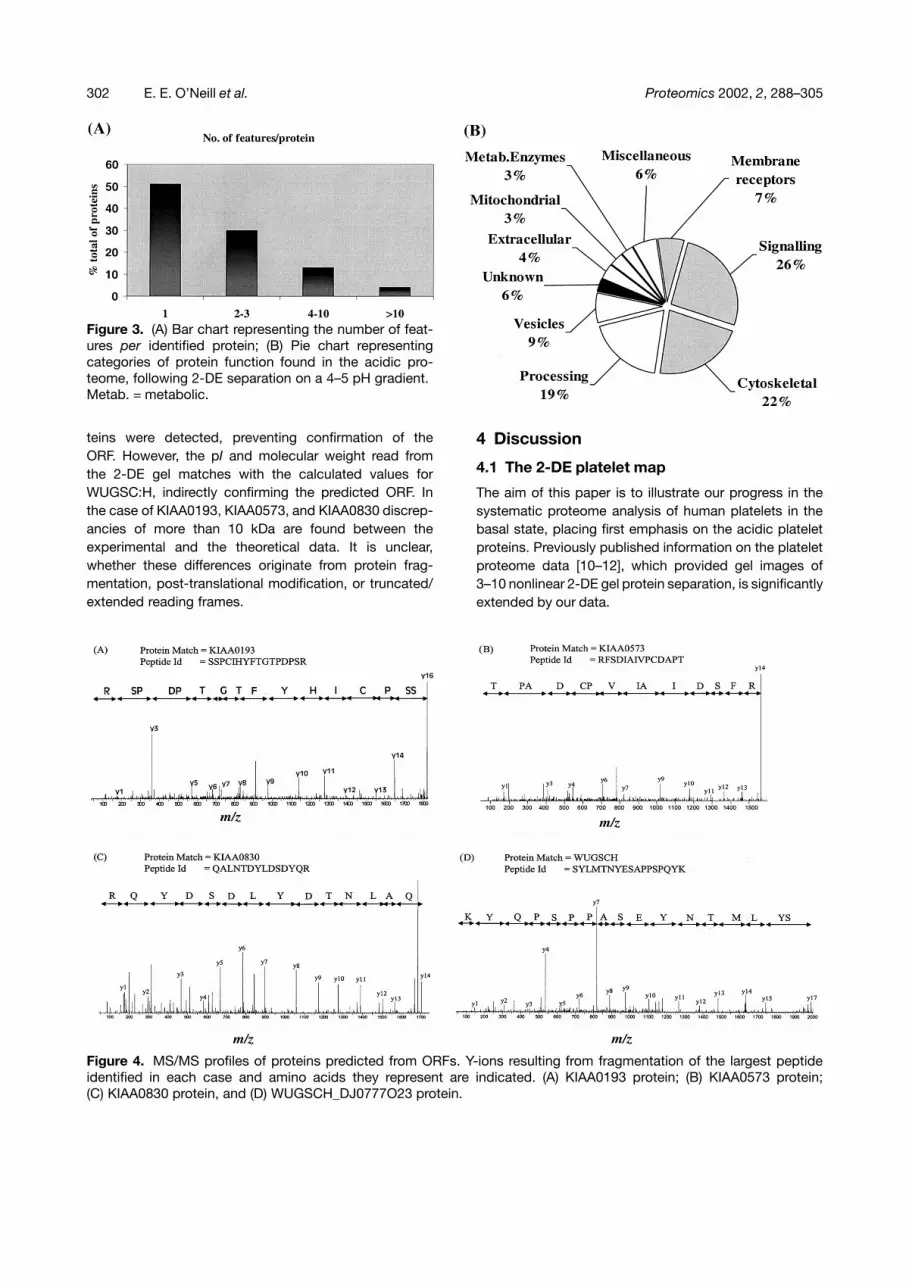
Figure 3. (A) Bar chart representing the number of feat-ures per identified protein; (B) Pie chart representingcategories of protein function found in the acidic pro-teome, following 2-DE separation on a 4–5 pH gradient.Metab. = metabolic.
teins were detected, preventing confirmation of theORF. However, the pI and molecular weight read fromthe 2-DE gel matches with the calculated values forWUGSC:H, indirectly confirming the predicted ORF. Inthe case of KIAA0193, KIAA0573, and KIAA0830 discrep-ancies of more than 10 kDa are found between theexperimental and the theoretical data. It is unclear,whether these differences originate from protein frag-mentation, post-translational modification, or truncated/extended reading frames.
4 Discussion
4.1 The 2-DE platelet map
The aim of this paper is to illustrate our progress in thesystematic proteome analysis of human platelets in thebasal state, placing first emphasis on the acidic plateletproteins. Previously published information on the plateletproteome data [10–12], which provided gel images of3–10 nonlinear 2-DE gel protein separation, is significantlyextended by our data.
Figure 4. MS/MS profiles of proteins predicted from ORFs. Y-ions resulting from fragmentation of the largest peptideidentified in each case and amino acids they represent are indicated. (A) KIAA0193 protein; (B) KIAA0573 protein;(C) KIAA0830 protein, and (D) WUGSCH_DJ0777O23 protein.
302 E. E. O’Neill et al. Proteomics 2002, 2, 288–305
The presented data comprise 2-DE gels separating plate-let proteins in the pH gradients of 3–10, 4–7, 4–5, 5–6, and6–11. The 3–10 2-DE gel is visually comparable to thepublished 2-DE gels. However, we were able to detect1352 protein features compared to a couple of hundredfeatures published previously [12]. This difference is likelyto arise from the application of a higher sensitive fluores-cent dye, compared to Coomassie and silver stain, anddifferences in protein load and gel running conditions.The number of addressable platelet proteins has beendoubled to approximately 2300 by using the narrow rangepH gradient 2-DE gels. Delipification of protein samplesprior to 2-DE turned out to be essential in our hands foroptimal protein separation on 5–6, and 6–11 pH gradient2-DE gels. This is in line with results presented in a studyby Görg addressing protein separation on 6–11 IPG strips[21]. As has been found for the 4–5 and 3–10 region 2-DEgel, 72–85% of all features are reproducible, suggestingthat activation and degradation events have been largelycontrolled during the analytical process. This idea is sup-ported by 80% of the features identified relating to full-length proteins, judged on the basis of detected molec-ular weight and isoelectric point. However, differentiationof the contributions made to spot variations by the 2-DEgel running process, sample preparation, and biologicalvariation will require further analysis of a larger, statisti-cally relevant number of gels.
As part of an ongoing project to investigate the plateletproteome we provide here comprehensive protein anno-tations for the narrow range 2-DE gel of the 4–5 pI range.These and future protein identifications will be madeavailable alongside this publication at our web-baseddatabase (http://www.bioch.ox.ac.uk/glycob/ogp). Theprotein identification data described here are based onpeptide sequence tags identified by MS/MS providinghigher identification accuracy than peptide fingerprintingstrategies. The stringent criteria on peptide length andnumber of missed cleavages that had to be met for pro-tein identification to be accepted for database entry andgel annotation result in a database of high accuracy.Acquiring on average 50 tandem MS spectra per sampleresulted in sufficient data to identify at least one protein in73% of the protein spots subjected to analysis. Identifiedspots covered a broad range of spot volumes (integrationof optical density over the feature’s area) from 0.097–10.This is in line with recent suggestions that if the protein isvisible on 2-DE gels it can be characterized via MS [29].The unidentified features failed to give results in at leasttwo independent experiments. Possible explanations forthis are that (1) protein digestion, peptide recovery andpeptide mass spectrometric analysis is impaired, be-cause of low protein quantity in conjunction with exten-sive post-translational modifications, or peptide hydro-
phobicity; (2) tryptic cleavage does not result in peptidesof the appropriate size to be detected in the experimentalmass range of 900 to 3000 m/z; (3) corresponding genesequences are not yet entered into the human genomedatabases, and that these features consequently rep-resent novel proteins. Further experiments of, for instance,digesting these proteins with different proteases like V8protease, are under way to identify these proteins.
Analysis of the number of identified proteins reveals thatgenes are on average represented by 2.3 protein features.This result differs clearly, and not unexpectedly, from the1.5 fold representation rate found for prokaryotic proteinsseparated on 2-DE gels [30]. Eukaryotic cells express ahigher complexity in post-translational modifications andsplice variants, which is highly likely to account for thisresult. Closer analysis reveals that up to 49% of the iden-tified proteins are represented on the 2-DE gel by multiplespots. As in the cases of some larger proteins, like talinand filamin, additional spots per protein arise from frag-mentation that is likely to have occurred in vivo, as proteo-lysis is largely controlled (see above), and in vivo fragmen-tation has been reported [31, 32]. In line with this, theexpected 47 kDa fragment of talin and the correspondingprotease, calpain (small subunit), are visible on our gel. Inaddition, the limited life span (6 d) of platelets makes acertain percentage of degradation products from in vivocell death likely. Prominent multiple isoform arrays areonly displayed by eight proteins (GP�IIb, endoplasmin,filamin, PDI, GR78, tubulin, myosin, and tropomyosin) inthe 4–5 pH gradient region. Using the narrow range pHgradient, 11 isoforms of the prominent glycosylatedintegrin GP�IIb (CD41) have been resolved. This chargeheterogeneity may be due to differences in carbohydratespresent in the glycoprotein [33], the altered positions ofamide groups, or due to differences in phosphorylation inotherwise identical proteins.
4.2 Functional groups represented
Although it is still at an early stage with just 53% the 4–5 pIregion of the platelet proteome being analysed, our analy-sis of the functional groups represented by the identifiedproteins reveals interesting insights into the platelet pro-teome. The largest proportions of the identified proteinsare signalling and cytoskeletal proteins. This is in linewith results we obtained analysing the functional classi-fication of the platelet proteins recently identified by Mar-cus et al. [12] and those available from platelet SWISS-2DPAGE map using our criteria. These data for proteinsidentified from 3–10 range 2-DE gels show 24% cyto-skeletal and 18% signalling molecules. This high repre-sentation of signalling molecules is encouraging in 2-DE,being potent enough to provide valuable information on
Proteomics 2002, 2, 288–305 Platelet proteome 303
this important class of eukaryotic proteins, which has notbeen always predicted in the past extrapolating from pro-teome analysis of yeast and prokaryotic organisms. How-ever, it has to be acknowledged that the platelet, as ananucleated, highly reactive cell, might well represent aspecial case, with the lack of nuclear proteins and thetranscription machinery resulting in an enrichment ofsignalling molecules. Comprehensive analysis of othereukaryotic cells will provide further insights into the rep-resentation of signalling molecules on 2-DE gels.
4.3 Representation of membrane proteins
Another class of proteins notoriously under-representedon 2-DE gels are membrane proteins [29]. Here, in ouranalysis, five different membrane proteins were detected,with membrane proteins accounting for only 4% of theidentified proteins. Interestingly the hypothetical protein“cytokine receptor related protein 4” (Cyto R4) has beenidentified here for the first time. Consequently, plateletsare at present the first and only expression system identi-fied for this protein. By homology this protein should func-tion as a cytokine receptor, but the exact function mightbe revealed by our future studies of the platelet proteome.The other proteins GP�IIB, GPIB, and GPIX are well-known platelet membrane proteins. However, withoutadditional extracellular labelling of the membrane pro-teins, it is unclear whether the subcellular localisation ofthese proteins identified in this study is the plasma mem-brane or intracellular membranes. For instance, it isknown that the identified protein GP�IIb is expressed onthe platelet plasma membrane, as well as on internalmembranes of platelet granules [34]. Data from differen-tial protein expression analysis, investigating surface andintracellular membrane fractions, indicate that GP�IIbmight appear only as a trace component in the intracel-lular membrane [35], which would not relate to the strongrelative representation of this protein on our gels. Concernwith regard to the efficiency of plasma membrane proteinsolubilisation under the chosen experimental conditionsis justified in that membrane proteins, like GPIII, GPIVand GPVI, are missing on our 4–5 gradient 2-DE gel. Theseproteins have been previously identified in the 4–5 pIregion of 2-DE gels of enriched platelet membrane frac-tions [5]. An alternative explanation for the lack of theseproteins on our proteome map could be explained byinefficient staining of these proteins due to their highcontent of sialic acids in comparison to GP�IIb. Sterichindrance by the carbohydrate and by the negativecharge of the sialic acid is known to affect staining ofthese proteins by Coomassie Blue [5], and similar effectsmight apply here to our fluorescent dye. Further evalu-ation using different staining methods and using mem-
brane preparations are under way to complement thedata presented here with more information about plateletmembrane proteins.
To a large extent the proteins and protein classes identi-fied so far fall within the expectations arising from pre-vious knowledge of platelet biology. High levels of cyto-skeletal proteins, membrane proteins, mitochondrial pro-teins, cytosolic enzymes, and signalling molecules arefundamental for platelet function. This holds true as wellfor vesicular proteins, with vesicular release being knownto be important in providing positive feedback effects forplatelet activation and in supporting other processessuch as wound repair. Similarly, components of the pro-tein processing pathway (proteasome and ubiquitins)were predictable to be present in light of the limited lifespan of platelets. The presence of BID (BH3 interactingdomain death agonist), TXNL (thioredoxin like protein),KRS1 (Ste 20 like protein kinase), and annexin V demon-strate the presence of an apoptosis pathway controllingsystem, as has been reviewed by Tzima and Walker [36].However, annexin V serves as a good example to demon-strate the limitations of the present analysis of rep-resented functional groups of proteins and their subcel-lular localisation. Many proteins have multiple functionsand relocate to different compartments upon differingsignalling events. Annexin V, for example, can be found inmultiple compartments (cytosol, cytoskeleton, attachedto membrane, extracellular), and can serve multiple func-tions (ion channel, inhibitor of cytosolic phospholipase A2,and protein kinase C, apoptosis signalling by binding tophosphatidylserine, etc) [36].
4.4 Protein translation and transcription
Somewhat unexpected is the presence of a significantnumber of transcription factors, elongation factors, andcentromere factors (e.g. NTF2, IF5A, EF1�, EF1�, EIF6,NAP-1 HOM). Their relevance in the anucleated plateletcan only be a matter of speculation at this stage. How-ever, a very recent study demonstrates the presence ofnumerous mRNAs in resting platelets and the activesynthesis of IL-1� in platelets following stimulation withthrombin in the presence of fibrinogen [37]. Such proteinsynthesis in platelets would explain the requirement forfactors like EIF6 (eukaryotic translation initiation factor6). It appears likely that the group of proteins listedabove are incorporated into the platelet during the bud-ding process from the megakaryocyte. In line with this,we find significant levels of IL-18 in platelets. This cyto-kine is known to be present in megakaryocytes, and sofar there is no evidence for IL-18 synthesis in platelets[38]. To our knowledge this is the first time that IL-18
304 E. E. O’Neill et al. Proteomics 2002, 2, 288–305
has been identified in platelets, and the first human inter-leukin identified in the public domain on 2-DE gels fromcell extracts.
5 Concluding remarks
This study demonstrates the representation of a broadrange of functional classes of proteins from several sub-cellular compartments in the platelet on 2-DE gels. Datacomprising almost 300 protein annotations on 2-DE gelscomprising about 2300 proteins are made publicly avail-able on a web-based database. The dynamic range ofmolecules detected across their expression levels (copynumbers) and thus, the analytical sensitivity achieved willbe explored in future. Further analysis, identifying the pro-teins on the remaining 2-DE gels and enriching subcel-lular compartments, will reveal more about plateletbiology, the number of proteins in platelets, signallingcascades, and protein expression levels.
This work was supported by the BBSRC. SPW is a BritishHeart Foundation Senior Research Fellow. ACP is a Well-come Prize Student. Ethical approval for this study wasgranted by the Central Oxford Research Ethics Commit-tee (No: 00.231). We gratefully acknowledge the constantsupport by Dr. Mark Wormald, Oxford Glycobiology Insti-tute, Department of Biochemistry, University of Oxford.
Received September 4, 2001
6 References
[1] Brown, A. S., Erusalimsky, J. D., Martin, J. F., in: von Bruch-hausen, F., Walter, U. (Eds.), Platelets and their Factors,Springer-Verlag, Berlin, Germany 1997, pp. 3–19.
[2] Nurden, A. T., Thromb. Haemost. 1999, 82, 468–480.[3] Blackstock, W. P., Weir, M. P., Trends Biotechnol. 1999, 17,
121–127.[4] Hebestreit, H. F., Dwek, R. A., Eur. Pharm. Rev. 2001, 6,
23–33.[5] Clemetson, K. J., in: George, J., Nurden, A. T., Phillips, D. R.
(Eds.), Platelet Membrane Glycoproteins, Plenum Press, NewYork, USA 1985, pp. 51–85.
[6] Giometti, C. S., Anderson, N. G., Clin. Chem. 1984, 30, 2078–2083.
[7] Gevaert, K., Eggermont, L., Demol, H., Vanderkerckhove, J.,J. Biotechnol. 2000, 78, 259–269.
[8] Hanash, S. M., Neel, J. V., Baier, L. J., Rosenblum, B. B., et al.,Am. J. Hum. Genet. 1986, 38, 352–360.
[9] Asakawa, J. I., Electrophoresis 1988, 9, 562–568.[10] Gravel, P., Sanchez, J. C., Walzer, C., Golaz, O., et al., Elec-
trophoresis 1995, 16, 1152–1159.[11] Immler, D., Gremm, D., Kirsch, D., Spengler, et al., Electro-
phoresis 1998, 19, 1015–1023.[12] Marcus K., Immler D., Sternberger J., Meyer H. E., Electro-
phoresis 2000, 21, 2622–2636.[13] Gibbins, J., Asselin, J., Farndale, R., Barnes, M., et al.,
J. Biol. Chem. 1996, 271, 18095–18099.[14] Sanchez, J. C., Rouge, V., Pisteur, M., Ravier, F., et al., Elec-
trophoresis 1997, 18, 324–327.[15] Amess, B., Tolkovsky, A. M., Electrophoresis 1995, 16,
1255–1267.[16] Hassner, A., Birnbaum, D., Loew, L. M., J. Org. Chem. 1984,
49, 2546–2551.[17] Shevchenko, A., Jensen, O. N., Podtelejnikov, A. V.,
Sagliocco, F., et al., Proc. Natl. Acad. Sci. USA 1996, 93,14440–14445.
[18] Mann, M., Trends Biochem. Sci. 1966, 21, 494–495.[19] Yates, J. R., III, Eng, J. K., McCormack, A. L., Anal. Chem.
1995, 67, 3202–3210.[20] Ek, K., Bjellqvist, B., Righetti, P. G., J. Biochem. Biophys.
Methods 1983, 8, 135–155.[21] Görg, A., Obermaier, C., Boguth, G., Harder, et al., Electro-
phoresis 2000, 21, 1037–1053.[22] Bray, P. F., Leung, C. S.-I., Shuman, M. A., J. Biol. Chem.
1990, 265, 9587–9590.[23] Block, K. L., Poncz, M., Stem Cells 1995, 13, 135–145.[24] Tatusov, R. L., Natale, D. A., Garkavtsev, I. V., Tatusova, T. A.,
et al., Nucleic Acids Res. 2001, 29, 22–28.[25] Tatusov, R. L., Koonin, E. V., Lipman D. J., Science 1997,
278, 631–637.[26] Nagase, T., Seki, N., Ishikawa, K.-I., Tanaka, A., Nomura, N.,
DNA Res. 1996, 3, 17–24.[27] Nagase, T., Ishikawa, K., Miyajima, N., Tanaka, A., et al.,
DNA Res. 1998, 5, 31–39.[28] Bauer C., Langston Y., Harrison M., submitted (JUN-1998) to
the EMBL/GenBank/DDBJ databases, http://www.ebi.ac.uk[29] Cordwell, S. J., Nouwens, A. S., Walsh, B. J., Proteomics
2001, 1, 461–472.[30] Regula, J. T., Überle, B., Boguth, G., Görg, A., et al., Electro-
phoresis 2000, 21, 3765–3780.[31] Fujitani, K., Kambayashi, J., Sakon, M., Ohmi, S. I., et al.,
J. Cell. Biochem. 1997, 66, 197–209.[32] Hayashi, M., Suzuki, H., Kawashima, S., Saido, T. C., Ino-
mata, M., Arch. Biochem. Biophys. 1999, 371, 133–141.[33] Troesch, A., Duperray, A., Pollack, B., Marguerie, G., Bio-
chem. J. 1990, 268, 129–134.[34] Feagler, J. R., Tillack, T. W., Chaplin, D. D., Majerus, P. W.,
J. Cell. Biol. 1974, 60, 541–553.[35] Hack, N., Crawford, N., Biochem. J. 1984, 222, 235–246.[36] Tzima, E., Walker, J. H., Platelets 2000, 11, 245–251.[37] Lindemann, S., Tolley, N. D., Dixon, D. A., McIntyrem, T. M.,
et al., J. Cell Biol. 2001, 154, 485–490.[38] Nakamura, S., Otani, T., Okura, R., Ijiri, Y., et al., Leukemia
2000, 14, 1052–1059.
Proteomics 2002, 2, 288–305 Platelet proteome 305