coastal dynamic and shoreline mapping: multi-sources spatial data analysis in semarang indonesia
TRANSCRIPT
Coastal dynamic and shoreline mapping: multi-sourcesspatial data analysis in Semarang Indonesia
Muh Aris Marfai & Hussein Almohammad &
Sudip Dey & Budi Susanto & Lorenz King
Abstract Semarang coastal area has geomorpholog-ically complex processes, such as erosion-sedimenta-tion, land subsidence, and tidal inundation hazard.Multi-years shoreline mapping is considered a valu-able task for coastal monitoring and assessment. Thispaper presents maps illustrating the shoreline dynamicin a coastal area of Semarang-Indonesia using multi-sources spatial data. The segment data has beenobtained by visual delineation of the topographicmaps Year 1908, 1937, 1992 and Ikonos image Year2003 as well as digital number (DN) value analysisand masking operation of Landsat MSS Year 1972
and Landsat ETM Year 2001. For the long period ofalmost 100 year, the shoreline dynamic in Semarangcoastal area is dominated by sedimentation process.Shoreline extended to the sea as a result of man-madeinfrastructure and natural processes. The research’sresult was satisfactory and the method has proven tobe effective considering lack of homogeneous data-series. However, some further improvement regardinggeo-processing can be made and the accuracy can betested in future version.
Keywords Shoreline dynamic .Multi-sources spatialdata . Visual interpretation . Digital number valueanalysis . Semarang-Indonesia
Introduction
The coastal area consists of the interface between landand sea. It is a highly dynamic environment withmany physical processes, such as tidal inundation, sealevel rise, land subsidence, and erosion-sedimenta-tion. Those processes play an important role for theshoreline change and coastal landscape development.In addition, urban development on the coastal areaand resource use conflicts spawn environmentaldegradation and increasing hazard vulnerability (Deyet al. 2002; Mills et al. 2005). According to Bird andOngkosongo (1980) the building of sea walls andbreakwaters, the advancement of the shoreline artifi-
M. A. Marfai (*) :H. Almohammad : L. KingInstitute of Geography, Justus-Liebig-University,35390 Giessen, Germanye-mail: [email protected]
M. A. MarfaiGeography Faculty, Gadjah Mada University,55281 Yogyakarta, Indonesia
S. DeyDepartment of Geography and Disaster Management,Tripura University,Suryamoninagar,799130 Tripura (West), India
B. SusantoGIS Officer The Nature Conservancy,Palu Field Office,94112 Palu, Indonesia
cially by land reclamation, and the removal of beachmaterial from the coastline brought effects directly onthe coastal change. The changes in water andsediment yield from river systems following themodification of land use within the catchmentsbrought indirect impacts to the coastal changes.
Shoreline change is considered one of the mostdynamic processes in coastal area (Bagli and Soille2003; Sunarto 2004; Mills et al. 2005). In manycoastal areas in the developing countries, densepopulation being placed next to the shoreline createsthe more vulnerable areas. It has become important tomap the shoreline change as an input data for coastalhazard assessment. There are many change detectiontechniques currently in use including visual interpre-tation, spectral-value-based technique (differencing,image regression, DN value analysis), multi-datacomposites, and change vector analysis.
Visual interpretation of multi-temporal images forcoastal monitoring was presented by Mazian et al.(1989); and Elkoushy and Tolba (2004). Meanwhile,Mills et al. (2005) introduced the integration of thegeomatics techniques to form accurate representationsof the coastline. A highly accurate DEM, createdusing kinematics GPS, was used as control toorientate surfaces derived from the relative orientationstage of photogrammetry processing. Mostafa andSoussa (2006) have applied GIS and remote sensingtechnique to monitor the lake of Nasser including theshoreline dynamic. Three satellite Landsat images forNasser Lake was available in a time series (1984,1996, and 2001). Topography map of scale 1:50,000that is suitable to the resolution of Landsat images,was used for developing DEM. The research reportedthat the satellite image in a good data-series helped indetecting the changes in the lake shape. Wang et al.(2003) investigated a novel approach for automaticextraction of shoreline from Ikonos images using amean shift segmentation algorithm. Furthermore, Diet al. (2003) presented a similar method using semi-automatic shoreline extraction from high-resolutionIkonos satellite imagery. Bagli and Soille (2003)analyzed DN value using slicing operation for changemonitoring. In addition, Whithe and El Asmar (1999)introduced an algorithm function and DN analysis todeviate the water from the land. The DN valueanalysis has also been applied on Landsat images,e.g. by Frazier and Page (2000); Yanli (2002), andMarfai (2003a). Meanwhile Chalabi et al. (2006)
applied DN threshold on Ikonos image for shorelinemonitoring.
Monitoring a process over a specific time or a longperiod needs a homogenous long series data such asfrequent images with an optimal spatial resolution.However, in reality it is very difficult to have a gooddata-series with optimal resolution, especially in thedeveloping countries such as Indonesia. Integrationmulti-scale data analysis may be considered to over-come the problem related data-series availability. Theintegration of the different spatial and temporal resolu-tion have been conducted by various researches invarious cases, such as those by Armenakis et al. (2003);Zimmermann and Bijker (2004); Shrestha (2005);Chalabi et al. (2006); Ozdarici and Turker (2006),and Xiaodong et al. (2006). Armenakis et al. (2003)introduced automation in the assessment of scannedtopographic maps and landsat ETM+imagery forfeature separation and extraction in Northern Canada.The analysis of two dataset, namely scanned map andLandsat 7 etm+imagery enables the detection offeatures to be compared at the “information level”. Itmeans that the comparison of the features has beenmade after individual processing data is finished.Chalabi et al. (2006) assessed multi-data sources formonitoring shoreline in Kuala Terengganu, Malaysiausing Ikonos and aerial photographs. The methodolo-gy proposed for the extraction of the shoreline is apixel-based segmentation using DN threshold. Resultsof time series data were combined each other showingspatial change of shoreline. The research undertakenby Armenakis et al. (2003) and Chalabi et al. (2006)revealed the possibility and the capability of the multi-data sources for the change analysis.
Ozdarici and Turker (2006) performed a polygon-based classification on multi-scale images of Spot4XS, Spot5 XS, Ikonos XS, Quickbird XS, andQuickbird Pansharpened (PS) covering an agriculturalarea located in Karacabey, Turkey. Meanwhile,Zimmermann and Bijker (2004) assessed a combina-tion of low spatial and high spatial resolution imageryin term of accuracy and more thematic detail.Shrestha (2005) compared the data available fromdifferent satellites having different spatial resolutionsfor forest mapping and estimations. There were foursets of data, which have been used for the Shrestha’sstudy i.e. Ikonos, IRS 1D, LISS III, and LandsatETM+. Even though the last three cases by Ozdariciand Turker (2006); Zimmermann and Bijker (2004),
and Shrestha (2005) did not deal with the coastalmonitoring, the researches have proven that the multi-scale data provide the ability for comparison mappingand detection. Furthermore, Xiaodong et al. (2006)had combined remote sensing (Quickbird) images and
GIS data in change detection. The research introducedan iteratively holistic change detection using imageryand GIS data. The results of some related processes,such as features extraction of the detected objects in theremote sensing imagery and geometric co-registration
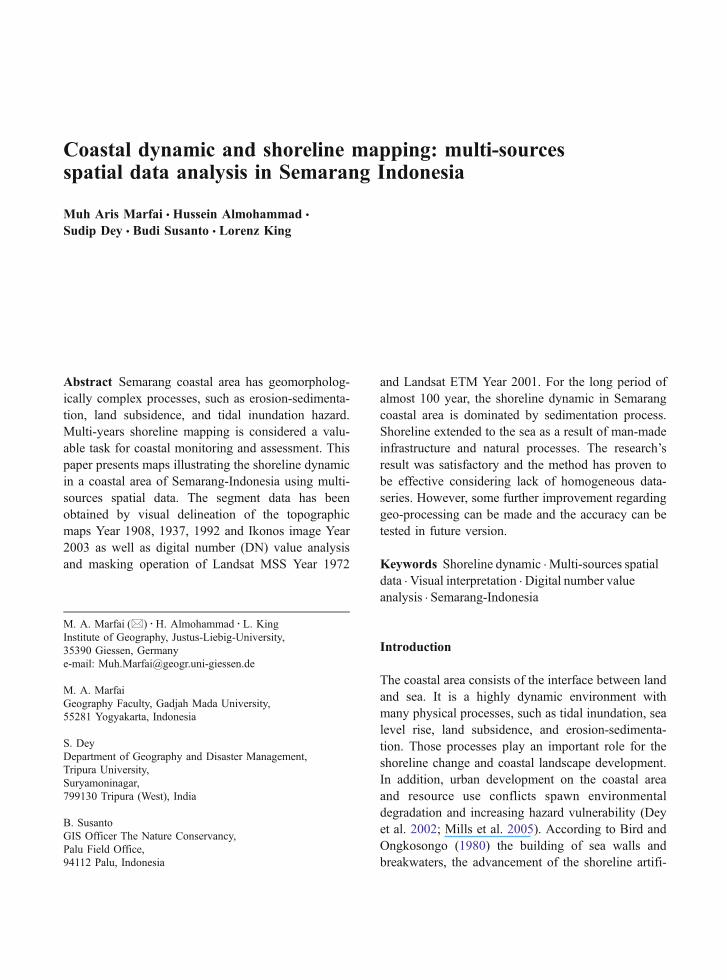
Fig. 1 The location ofSemarang City
Table 1 Attributes of the dataset
Dataset Year Scale Resolution Note
Topographic map 1908 1:50,000 Scan resolution5 m
Scanned as digital format
Topographic map 1937 1:50,000 Scan resolution5 m
Scanned as digital format
Landsat MSS 1972 – 80 m Band 4Topographic map 1992 1:50,000 Scan resolution
5 mScanned as digital format
Landsat ETM 2001 – 30 meter Band 5Ikonos 2003 – 1 meter Panchromatic
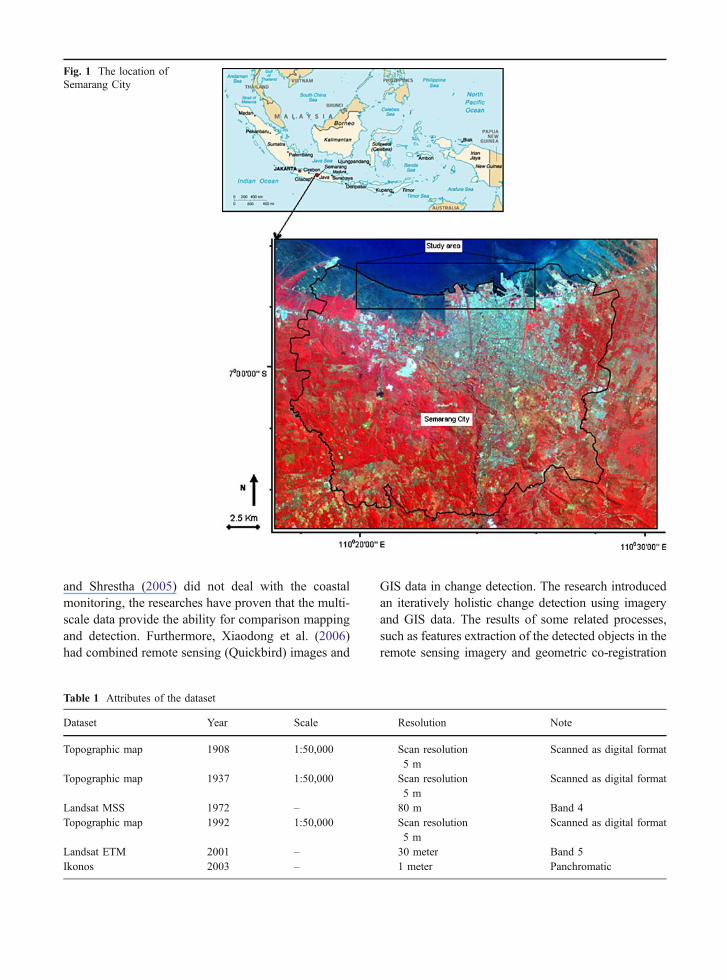
Fig. 3 Shoreline in year 1908, 1937, 1992, and 2003 from Topographic maps and Ikonos image
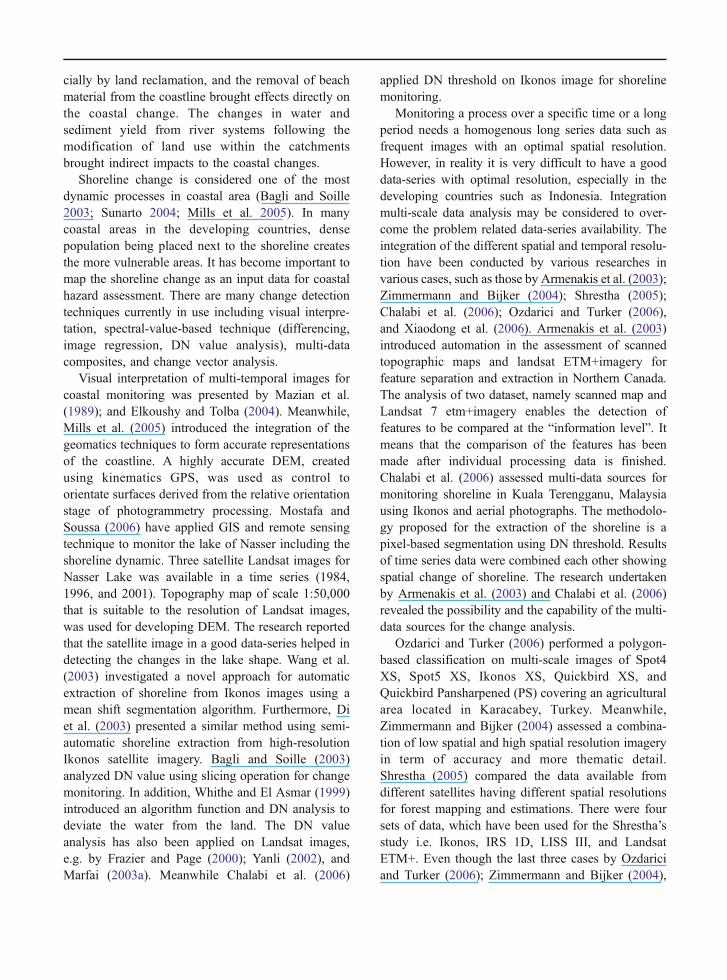
Fig. 2 Flowchart ofmethodology
between GIS data and remote sensing imagery, haveobvious influences on the results of change detection.
The present research aims to analysis shorelinechange and coastal dynamic in Semarang, Central Java,Indonesia. Due to lack of the homogeneous data-series,the method using fine-resolution dataset as applied byDi et al. (2003); Wang et al. (2003), and Mills et al.(2005), could not be implemented in the research.Integrated multi-resource dataset was considered theappropriate method for the shoreline analysis inSemarang coastal area. The dataset for Semarang wereTopography maps, Ikonos, and Landsat images. It wasnoted by Armenakis et al. (2003); Zimmermann andBijker (2004); Shrestha (2005); Chalabi et al. (2006);Ozdarici and Turker (2006), and Xiaodong et al.(2006) that multi-scale data can be used for changeanalysis and mapping. The present research appliedpost-classification comparison method using informa-tion level domain, where the input data have beenindependently interpreted and then the results arecompared. According to Armenakis et al. (2003) whencomparing heterogeneous dataset, the change detec-tion is performed after the data are individuallyprocessed (post-classification comparison). Visual in-terpretation method as also used by Mazian et al.(1989) and Elkoushy and Tolba (2004) was applied fortopographic maps and Ikonos data. Meanwhile, pixel-based segmentation using DN threshold, as alsomentioned by Whithe and El Asmar (1999); Frazierand Page (2000); Yanli (2002); Bagli and Soile(2003); Marfai (2003a), and Chalabi et al. (2006),was employed on the Landsat ETM and MSS data.
Study area
Semarang is a coastal urban area situated on JavaIsland Indonesia. Geographically, it lies between twomajor cities Jakarta and Surabaya. It is located at theNorthern coast of Java and about 500 km East ofJakarta. Semarang is positioned at the coordinate ofabout at 6°58′S and 110°25′E. Figure 1 shows thelocation of Semarang City. The city covers an area ofapproximately 373.7 km2 and is primarily used foragriculture and fishery (46.2%), residential, industrial,public and commercial (40.5%), forest (4.63%), bareland (0.78%) and others landuse (7.92%; Anonymous2000). The Northern part of the city is a coastal plainwhile the Southern part is a higher ground. Theelevation level of this city varies from about 0–453 m.
Semarang coastal areas faced land subsidence andtidal inundation (Marfai 2003b, 2004; Marfai and King2007a, b). The high tide caused the inundation ofcoastal settlement and productive agriculture (Marfai etal. 2005, 2006; Marfai and King 2007b). The effect of
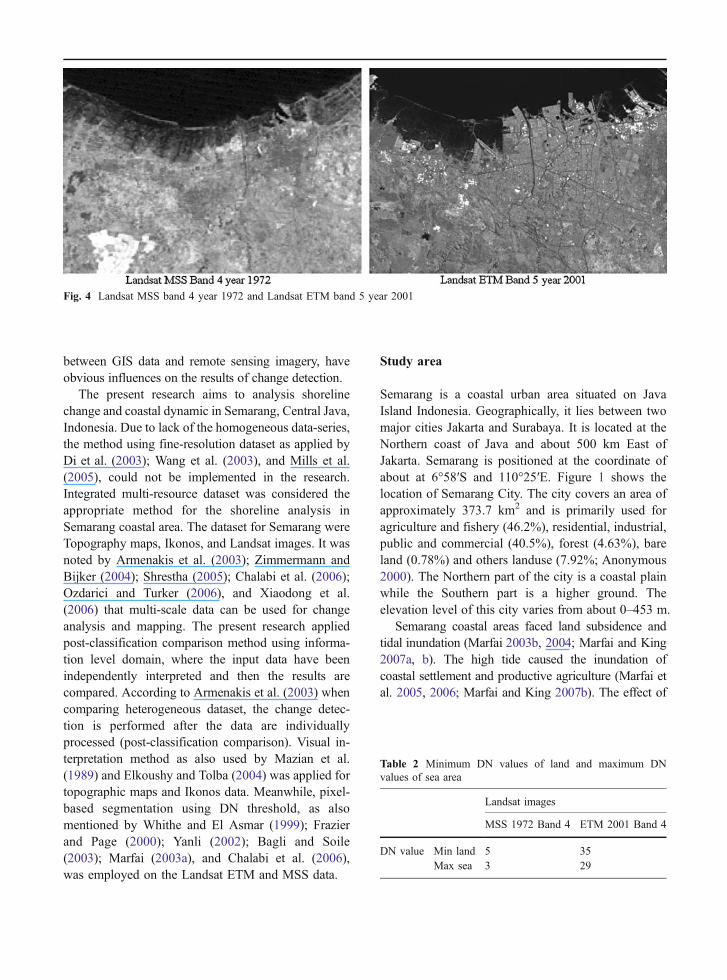
Fig. 4 Landsat MSS band 4 year 1972 and Landsat ETM band 5 year 2001
Table 2 Minimum DN values of land and maximum DNvalues of sea area
Landsat images
MSS 1972 Band 4 ETM 2001 Band 4
DN value Min land 5 35Max sea 3 29
the coastal inundation is predicted even worse with theprediction of sea level rise (Marfai and King 2007c).
Methodology overview
Following the growing availability of satellite imagesand GIS technique, numerous researches have beencarried out to delineate water from the land. A scheme
to detect coastline change using digitization of multi-temporal images was presented by Mazian et al. (1989)and Eloushy and Tolba (2004). Aerial photograph andtopographic map can provide an overview in a shortertime than the possible used methods of field survey-ing and ground control point using GPS tool.
Beyond manual detection and visual interpretation,several techniques using digital number (DN) value
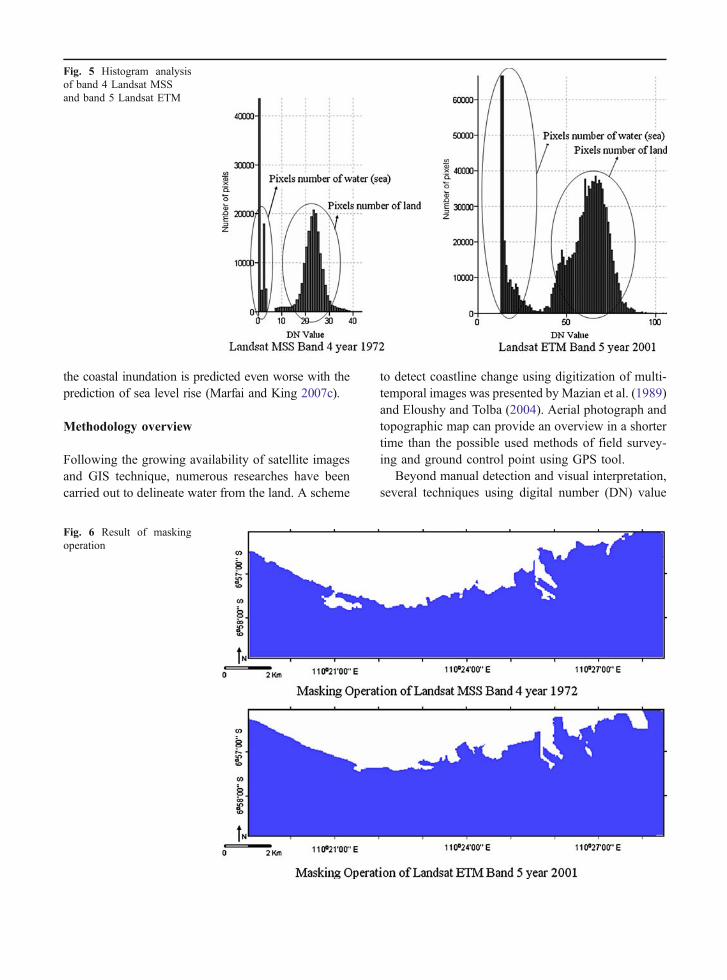
Fig. 5 Histogram analysisof band 4 Landsat MSSand band 5 Landsat ETM
Fig. 6 Result of maskingoperation
analysis have been reported. The most common aredensity slicing of images (Bagli and Soille 2003).Whithe and El Asmar (1999) introduced an algorithmto deviate the water from the land based on solelyon spectral analysis on individual pixels withouttaking into account of the texture, shape, morphology,and context of regions in the images. Furthermore,delineation of the water bodies from landsat have alsobeen applied by various researchers, e.g., by Frazierand Page (2000); Yanli (2002), and Marfai (2003a).They found that simple density slicing of the Landsat,especially TM band 5 successfully detected wetlandand water bodies. The DN threshold method is alsooften used for change detection. Liu and Jezek (2004)automated extraction of coastline from satelliteimagery by canny edge detection using DN threshold.Chalabi et al. (2006) had used pixel-based segmenta-tion on Ikonos image using DN threshold. Thepartition of the land and sea boundary was doneusing pseudo color which exhibits a strong contrastbetween land and water features.
In spite of the technique and approach to shorelinemonitoring and delineation, no single method hasbeen implemented that is free from major disadvantages(Mills et al. 2005). Using high resolution provides auseful solution, but is more costly and takes alongprocess for the image enhancement. Using a topograph-ic map proves easy for recognizing areas and delinea-tion, but it is not always available on high scales.
Combining heterogeneous remote sensing images andGIS data in change detection has great applicationpotential, especially for the long term monitoringconsidering the availability of the dataset such as thosein our case. An integration of technique, namely semi-manual delineation, DN value analysis, and maskingoperation has been made on the present research.
Dataset
Due to the lack of the homogeneous fine-resolutiondataset, shoreline changes mapping of Semarangcoastal area has been done using various multi-sources spatial data. Limited time series data areavailable in digital topographic maps for the year1908, 1937, and 1992; digital Landsat MSS image forthe year 1972; and Landsat ETM the year 2001; aswell as Ikonos imagery for the year 2003. Scannedand geo-referenced digital topographic maps with thescale 1:50,000 are available in 5 m of pixel resolution.Meanwhile Landsat images are available for band 4MSS and band 5 ETM. Ikonos image is available onpanchromatic with 1 m of pixel resolution. Table 1shows the attributes of the dataset.
Data processing and analysis
In the present research, change detection has beendetermined at the information-level domain instead of
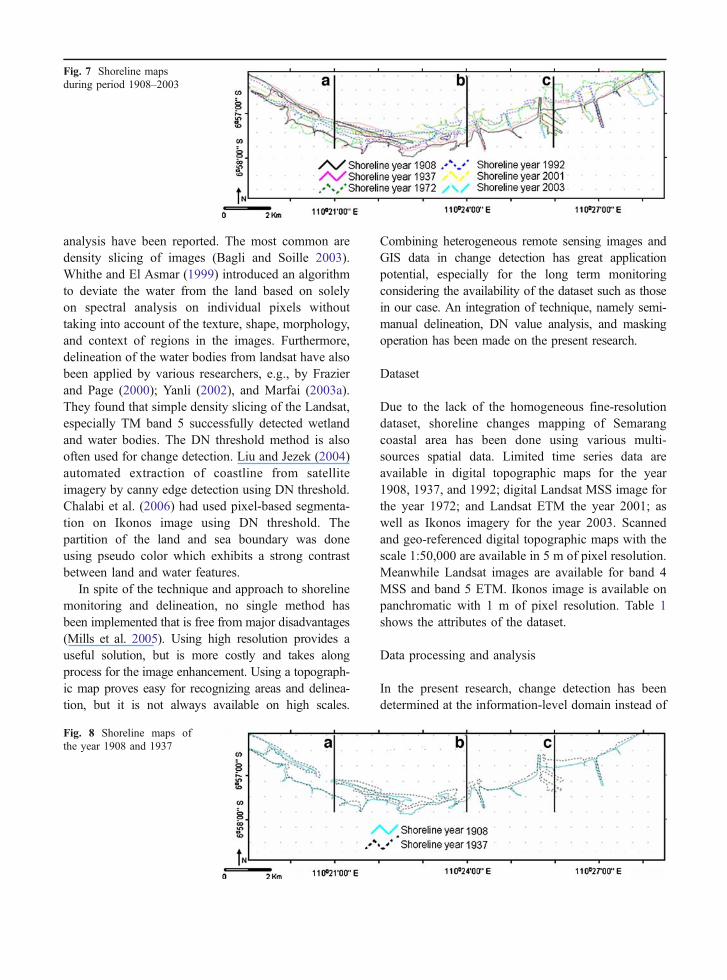
Fig. 7 Shoreline mapsduring period 1908–2003
Fig. 8 Shoreline maps ofthe year 1908 and 1937
data-level domain. According to Armenakis et al.(2003) if we compared data of the same nature, i.e.,data-series of homogeneous satellite images, thechange detection can be determined at the data leveldomain while, when comparing heterogeneous dataset(e.g., Landsat ETM, Landsat MSS, Topographic mapand Ikonos image), the change detection is performedat the information level domain. The data-leveldomain refers to comparison of pre-processed dataand the information-level domain refers to compari-son of analyzed data. For the latter, some dataprocessing needs to be done prior to change detection.However problem related scale variability, such asaccuracy remains. Xiaodong et al. (2006) noted thatthe problem might be limited by improving the geo-registration accuracy. In addition, Chalabi et al.(2006) demonstrated the monitoring shoreline usingvarious scale of images. He improved the resolutionof the aerial photography by scanning with 2 mresolution of pixel. It provided the detailed feature foranalysis.
Detail pre-processing steps including the geo-referencing process were beyond the scope of thisresearch. The geo-reference and ancillary data gath-ering has been done by previous research (Sutanta etal. 2003). Ancillary data sets for the processing wereGPS points collected from the field and Topographicmaps. A Garmin Map handheld GPS was used to
collect GPS point in the field. The accuracy obtained,as shown by the receiver, is between 3 and 6 m. Thisaccuracy is still far below the pixel size of the image.
Visual interpretation and delineation has beenapplied to Topography maps and Ikonos using vectoroperation. Topographic map has appropriate scannedresolution with 5-m resolution and therefore is conve-nient for using zoom in tool for the screen digitizing.The topographic maps with scale 1:50,000 have featuregeneralization compared to other sources. To obtainmore detail results, topographic maps have beenregistered in a good accuracy by Sutanta et al. (2003)and scanned with pixel resolution of 5 m. As it isnoted by Xiaodong et al. (2006) and Chalabi et al.(2006) problem related scale might be limited byimproving the geometric co-registration accuracy andby scanning data with high pixel resolution. Eventhough this step was not solved the entire problemrelated scale, it provide detail feature for visualanalysis and avoid an unnecessary mis-delineation.
Digital number value analysis for the Landsatimages comprise three stages, namely (1) imageenhancement, (2) image processing by masking usingmap calculation, and (3) shoreline delineation basedon the masking maps (Marfai 2003a). Image enhance-ment has been done using linear stretching in order toobtain better visualizations. A linear stretching is astretch method by which all values in an input map
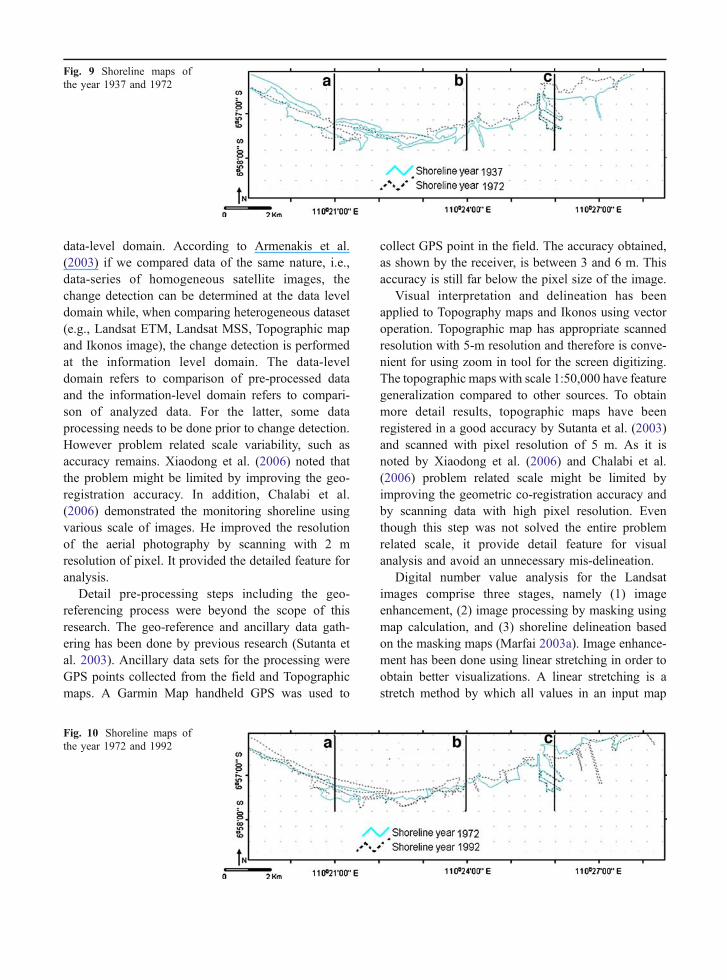
Fig. 9 Shoreline maps ofthe year 1937 and 1972
Fig. 10 Shoreline maps ofthe year 1972 and 1992
are converted into new values in an output map byusing one formula. Masking operation has beenapplied in order to distinguish between land andwater (sea) area. Digital number value has beenobserved using image histogram for Landsat images.Masking operation has been done using “iff” functionin ILWIS Software. The formula to distinguishbetween land and water is shown as follows:
Outputmap : iff band n < maximum pixel value
of the sea; then sea; else land
ð1Þ
Where Outputmap: map result of calculation, Iff:statement iff function, Band n: band of Landsat whichis used for operation, Maximum pixel value of thesea: maximum pixel value of the sea from histogramanalysis, Then sea: the number which is to replace thepixel value of the sea, and Else land: the numberwhich is to replace the pixel value of the land.
Once the masking operation is finished, theshoreline delineation can be created based on themasking map. GIS superimpose method has beenused to identify the shoreline dynamic as well asdetection of the sedimentation and erosion processesof the surface area. For this purpose, the datasetshould be in vector format and have the same geo-referenced. Map overlay has been applied in order toidentify land-sea changes on the area during period
1908–2003. Detail flowchart of the methodology isshown in Fig. 2.
Result and discussion
Visual interpretation and shoreline delineation hasbeen conducted for topographic maps Year 1908,1937, 1992 and Ikonos image Year 2003. Shoreline inYear 1908, 1937, 1992, and 2003 are shown in Fig. 3.Digital number value analysis of the spectral value ofthe Landsat images has been done in order to identifythe boundary of the DN value of water and land.Some factors may cause inaccuracies when analyzingland water boundary, among others, are (1) due to thesuspended sediment along the coast, hence DN valuebetween land and water is quite close, and (2) a lot ofplant and vegetation on surrounding coastal area bringimpacts on the DN value of the images. To minimizethe inaccuracies, image enhancement and filteringhave been applied for band 4 of Landsat MSS andband 5 of the Landsat ETM (Fig. 4). Histogramanalysis has been applied to dividing sea and landareas by recognizing maximum value of water andminimum value of land (Table 2). Histogram analysisof band 4 of Landsat MSS and band 5 of LandsatETM are shown on Fig. 5. Furthermore, maskingoperation has been used by “iff” function in ILWIS
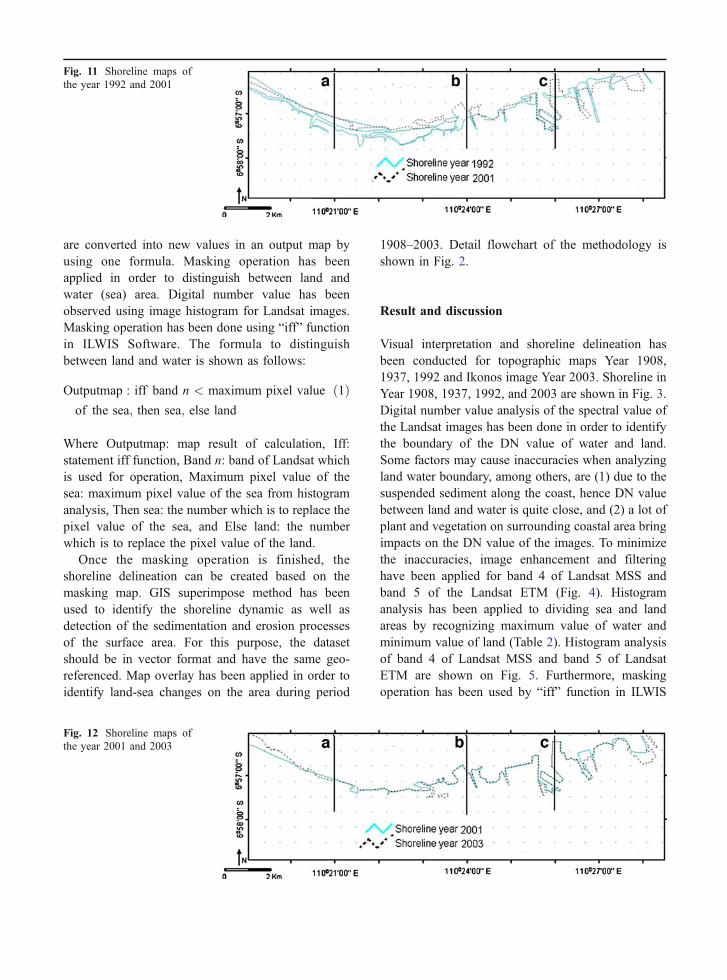
Fig. 11 Shoreline maps ofthe year 1992 and 2001
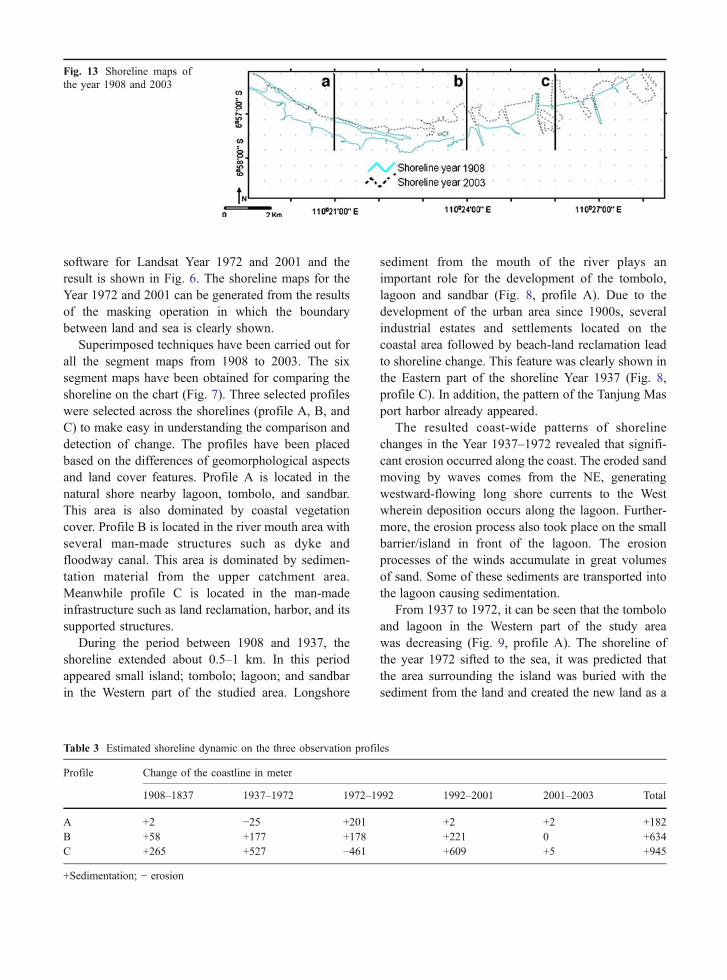
Fig. 12 Shoreline maps ofthe year 2001 and 2003
software for Landsat Year 1972 and 2001 and theresult is shown in Fig. 6. The shoreline maps for theYear 1972 and 2001 can be generated from the resultsof the masking operation in which the boundarybetween land and sea is clearly shown.
Superimposed techniques have been carried out forall the segment maps from 1908 to 2003. The sixsegment maps have been obtained for comparing theshoreline on the chart (Fig. 7). Three selected profileswere selected across the shorelines (profile A, B, andC) to make easy in understanding the comparison anddetection of change. The profiles have been placedbased on the differences of geomorphological aspectsand land cover features. Profile A is located in thenatural shore nearby lagoon, tombolo, and sandbar.This area is also dominated by coastal vegetationcover. Profile B is located in the river mouth area withseveral man-made structures such as dyke andfloodway canal. This area is dominated by sedimen-tation material from the upper catchment area.Meanwhile profile C is located in the man-madeinfrastructure such as land reclamation, harbor, and itssupported structures.
During the period between 1908 and 1937, theshoreline extended about 0.5–1 km. In this periodappeared small island; tombolo; lagoon; and sandbarin the Western part of the studied area. Longshore
sediment from the mouth of the river plays animportant role for the development of the tombolo,lagoon and sandbar (Fig. 8, profile A). Due to thedevelopment of the urban area since 1900s, severalindustrial estates and settlements located on thecoastal area followed by beach-land reclamation leadto shoreline change. This feature was clearly shown inthe Eastern part of the shoreline Year 1937 (Fig. 8,profile C). In addition, the pattern of the Tanjung Masport harbor already appeared.
The resulted coast-wide patterns of shorelinechanges in the Year 1937–1972 revealed that signifi-cant erosion occurred along the coast. The eroded sandmoving by waves comes from the NE, generatingwestward-flowing long shore currents to the Westwherein deposition occurs along the lagoon. Further-more, the erosion process also took place on the smallbarrier/island in front of the lagoon. The erosionprocesses of the winds accumulate in great volumesof sand. Some of these sediments are transported intothe lagoon causing sedimentation.
From 1937 to 1972, it can be seen that the tomboloand lagoon in the Western part of the study areawas decreasing (Fig. 9, profile A). The shoreline ofthe year 1972 sifted to the sea, it was predicted thatthe area surrounding the island was buried with thesediment from the land and created the new land as a
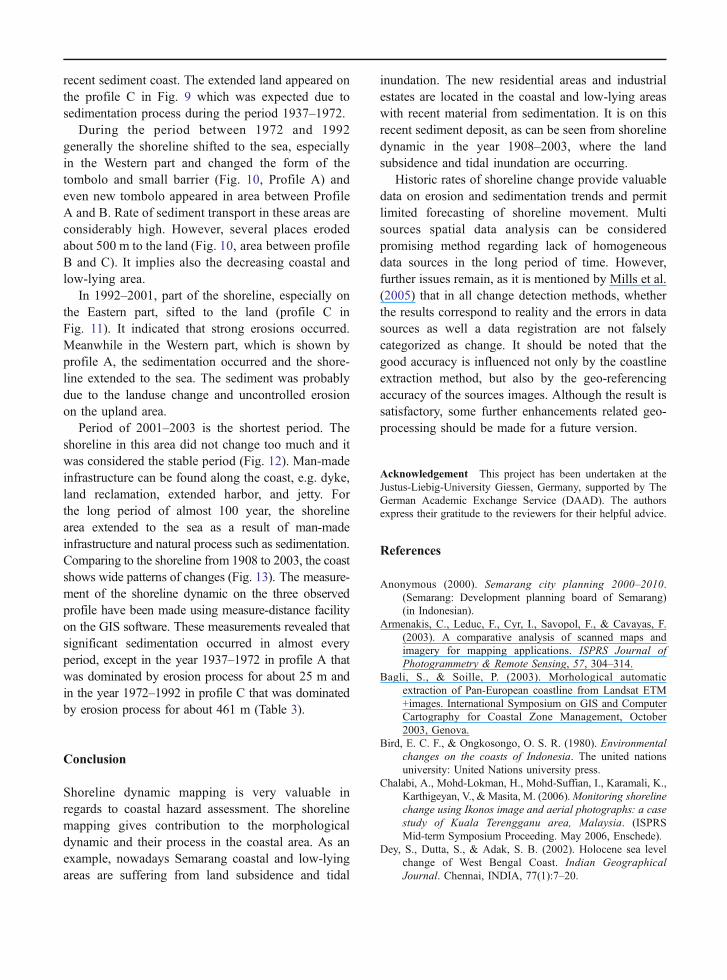
Fig. 13 Shoreline maps ofthe year 1908 and 2003
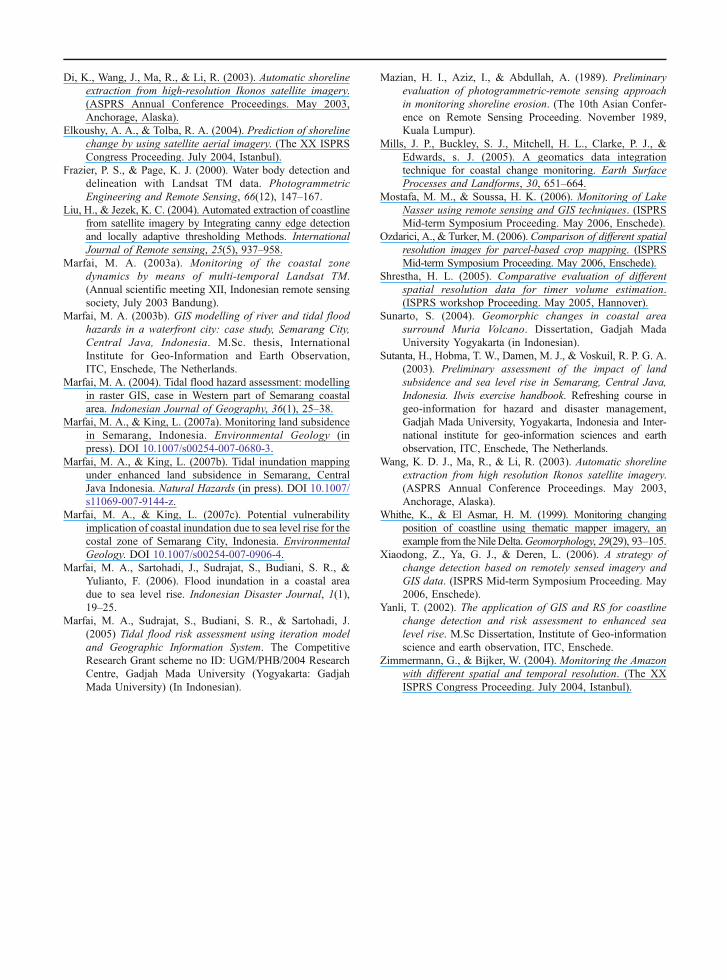
Table 3 Estimated shoreline dynamic on the three observation profiles
Profile Change of the coastline in meter
1908–1837 1937–1972 1972–1992 1992–2001 2001–2003 Total
A +2 −25 +201 +2 +2 +182B +58 +177 +178 +221 0 +634C +265 +527 −461 +609 +5 +945
+Sedimentation; − erosion
recent sediment coast. The extended land appeared onthe profile C in Fig. 9 which was expected due tosedimentation process during the period 1937–1972.
During the period between 1972 and 1992generally the shoreline shifted to the sea, especiallyin the Western part and changed the form of thetombolo and small barrier (Fig. 10, Profile A) andeven new tombolo appeared in area between ProfileA and B. Rate of sediment transport in these areas areconsiderably high. However, several places erodedabout 500 m to the land (Fig. 10, area between profileB and C). It implies also the decreasing coastal andlow-lying area.
In 1992–2001, part of the shoreline, especially onthe Eastern part, sifted to the land (profile C inFig. 11). It indicated that strong erosions occurred.Meanwhile in the Western part, which is shown byprofile A, the sedimentation occurred and the shore-line extended to the sea. The sediment was probablydue to the landuse change and uncontrolled erosionon the upland area.
Period of 2001–2003 is the shortest period. Theshoreline in this area did not change too much and itwas considered the stable period (Fig. 12). Man-madeinfrastructure can be found along the coast, e.g. dyke,land reclamation, extended harbor, and jetty. Forthe long period of almost 100 year, the shorelinearea extended to the sea as a result of man-madeinfrastructure and natural process such as sedimentation.Comparing to the shoreline from 1908 to 2003, the coastshows wide patterns of changes (Fig. 13). The measure-ment of the shoreline dynamic on the three observedprofile have been made using measure-distance facilityon the GIS software. These measurements revealed thatsignificant sedimentation occurred in almost everyperiod, except in the year 1937–1972 in profile A thatwas dominated by erosion process for about 25 m andin the year 1972–1992 in profile C that was dominatedby erosion process for about 461 m (Table 3).
Conclusion
Shoreline dynamic mapping is very valuable inregards to coastal hazard assessment. The shorelinemapping gives contribution to the morphologicaldynamic and their process in the coastal area. As anexample, nowadays Semarang coastal and low-lyingareas are suffering from land subsidence and tidal
inundation. The new residential areas and industrialestates are located in the coastal and low-lying areaswith recent material from sedimentation. It is on thisrecent sediment deposit, as can be seen from shorelinedynamic in the year 1908–2003, where the landsubsidence and tidal inundation are occurring.
Historic rates of shoreline change provide valuabledata on erosion and sedimentation trends and permitlimited forecasting of shoreline movement. Multisources spatial data analysis can be consideredpromising method regarding lack of homogeneousdata sources in the long period of time. However,further issues remain, as it is mentioned by Mills et al.(2005) that in all change detection methods, whetherthe results correspond to reality and the errors in datasources as well a data registration are not falselycategorized as change. It should be noted that thegood accuracy is influenced not only by the coastlineextraction method, but also by the geo-referencingaccuracy of the sources images. Although the result issatisfactory, some further enhancements related geo-processing should be made for a future version.
Acknowledgement This project has been undertaken at theJustus-Liebig-University Giessen, Germany, supported by TheGerman Academic Exchange Service (DAAD). The authorsexpress their gratitude to the reviewers for their helpful advice.
References
Anonymous (2000). Semarang city planning 2000–2010.(Semarang: Development planning board of Semarang)(in Indonesian).
Armenakis, C., Leduc, F., Cyr, I., Savopol, F., & Cavayas, F.(2003). A comparative analysis of scanned maps andimagery for mapping applications. ISPRS Journal ofPhotogrammetry & Remote Sensing, 57, 304–314.
Bagli, S., & Soille, P. (2003). Morhological automaticextraction of Pan-European coastline from Landsat ETM+images. International Symposium on GIS and ComputerCartography for Coastal Zone Management, October2003, Genova.
Bird, E. C. F., & Ongkosongo, O. S. R. (1980). Environmentalchanges on the coasts of Indonesia. The united nationsuniversity: United Nations university press.
Chalabi, A., Mohd-Lokman, H., Mohd-Suffian, I., Karamali, K.,Karthigeyan, V., & Masita, M. (2006).Monitoring shorelinechange using Ikonos image and aerial photographs: a casestudy of Kuala Terengganu area, Malaysia. (ISPRSMid-term Symposium Proceeding. May 2006, Enschede).
Dey, S., Dutta, S., & Adak, S. B. (2002). Holocene sea levelchange of West Bengal Coast. Indian GeographicalJournal. Chennai, INDIA, 77(1):7–20.
Di, K., Wang, J., Ma, R., & Li, R. (2003). Automatic shorelineextraction from high-resolution Ikonos satellite imagery.(ASPRS Annual Conference Proceedings. May 2003,Anchorage, Alaska).
Elkoushy, A. A., & Tolba, R. A. (2004). Prediction of shorelinechange by using satellite aerial imagery. (The XX ISPRSCongress Proceeding. July 2004, Istanbul).
Frazier, P. S., & Page, K. J. (2000). Water body detection anddelineation with Landsat TM data. PhotogrammetricEngineering and Remote Sensing, 66(12), 147–167.
Liu, H., & Jezek, K. C. (2004). Automated extraction of coastlinefrom satellite imagery by Integrating canny edge detectionand locally adaptive thresholding Methods. InternationalJournal of Remote sensing, 25(5), 937–958.
Marfai, M. A. (2003a). Monitoring of the coastal zonedynamics by means of multi-temporal Landsat TM.(Annual scientific meeting XII, Indonesian remote sensingsociety, July 2003 Bandung).
Marfai, M. A. (2003b). GIS modelling of river and tidal floodhazards in a waterfront city: case study, Semarang City,Central Java, Indonesia. M.Sc. thesis, InternationalInstitute for Geo-Information and Earth Observation,ITC, Enschede, The Netherlands.
Marfai, M. A. (2004). Tidal flood hazard assessment: modellingin raster GIS, case in Western part of Semarang coastalarea. Indonesian Journal of Geography, 36(1), 25–38.
Marfai, M. A., & King, L. (2007a). Monitoring land subsidencein Semarang, Indonesia. Environmental Geology (inpress). DOI 10.1007/s00254-007-0680-3.
Marfai, M. A., & King, L. (2007b). Tidal inundation mappingunder enhanced land subsidence in Semarang, CentralJava Indonesia. Natural Hazards (in press). DOI 10.1007/s11069-007-9144-z.
Marfai, M. A., & King, L. (2007c). Potential vulnerabilityimplication of coastal inundation due to sea level rise for thecostal zone of Semarang City, Indonesia. EnvironmentalGeology. DOI 10.1007/s00254-007-0906-4.
Marfai, M. A., Sartohadi, J., Sudrajat, S., Budiani, S. R., &Yulianto, F. (2006). Flood inundation in a coastal areadue to sea level rise. Indonesian Disaster Journal, 1(1),19–25.
Marfai, M. A., Sudrajat, S., Budiani, S. R., & Sartohadi, J.(2005) Tidal flood risk assessment using iteration modeland Geographic Information System. The CompetitiveResearch Grant scheme no ID: UGM/PHB/2004 ResearchCentre, Gadjah Mada University (Yogyakarta: GadjahMada University) (In Indonesian).
Mazian, H. I., Aziz, I., & Abdullah, A. (1989). Preliminaryevaluation of photogrammetric-remote sensing approachin monitoring shoreline erosion. (The 10th Asian Confer-ence on Remote Sensing Proceeding. November 1989,Kuala Lumpur).
Mills, J. P., Buckley, S. J., Mitchell, H. L., Clarke, P. J., &Edwards, s. J. (2005). A geomatics data integrationtechnique for coastal change monitoring. Earth SurfaceProcesses and Landforms, 30, 651–664.
Mostafa, M. M., & Soussa, H. K. (2006). Monitoring of LakeNasser using remote sensing and GIS techniques. (ISPRSMid-term Symposium Proceeding. May 2006, Enschede).
Ozdarici, A., & Turker, M. (2006). Comparison of different spatialresolution images for parcel-based crop mapping. (ISPRSMid-term Symposium Proceeding. May 2006, Enschede).
Shrestha, H. L. (2005). Comparative evaluation of differentspatial resolution data for timer volume estimation.(ISPRS workshop Proceeding. May 2005, Hannover).
Sunarto, S. (2004). Geomorphic changes in coastal areasurround Muria Volcano. Dissertation, Gadjah MadaUniversity Yogyakarta (in Indonesian).
Sutanta, H., Hobma, T. W., Damen, M. J., & Voskuil, R. P. G. A.(2003). Preliminary assessment of the impact of landsubsidence and sea level rise in Semarang, Central Java,Indonesia. Ilwis exercise handbook. Refreshing course ingeo-information for hazard and disaster management,Gadjah Mada University, Yogyakarta, Indonesia and Inter-national institute for geo-information sciences and earthobservation, ITC, Enschede, The Netherlands.
Wang, K. D. J., Ma, R., & Li, R. (2003). Automatic shorelineextraction from high resolution Ikonos satellite imagery.(ASPRS Annual Conference Proceedings. May 2003,Anchorage, Alaska).
Whithe, K., & El Asmar, H. M. (1999). Monitoring changingposition of coastline using thematic mapper imagery, anexample from theNileDelta.Geomorphology, 29(29), 93–105.
Xiaodong, Z., Ya, G. J., & Deren, L. (2006). A strategy ofchange detection based on remotely sensed imagery andGIS data. (ISPRS Mid-term Symposium Proceeding. May2006, Enschede).
Yanli, T. (2002). The application of GIS and RS for coastlinechange detection and risk assessment to enhanced sealevel rise. M.Sc Dissertation, Institute of Geo-informationscience and earth observation, ITC, Enschede.
Zimmermann, G., & Bijker, W. (2004). Monitoring the Amazonwith different spatial and temporal resolution. (The XXISPRS Congress Proceeding. July 2004, Istanbul).