closed-loop plasma active control technology (clopact)
TRANSCRIPT

American Institute of Aeronautics and Astronautics
1
Closed-Loop Plasma Active Control Technology (CLOPACT)
Brandon L. Snyder*, Joshua A. Lewis†, Kelly Cohen‡, Christopher A. Seaver§, and Thomas McLaughlin** United States Air Force Academy, USAF Academy, CO, 80840
Feedback flow control is regarded as a technology having immense potential for the
future of the fluid dynamics industry. This field is in its infancy with many questions unanswered concerning the type and quality of information required for feedback. Previous studies at much lower Reynolds numbers have shown that velocity measurements gathered from the wake can be used to realize desired closed-loop performance. Additionally, the USAF Academy has demonstrated the effectiveness of Dielectric Barrier Discharge plasma actuators at inducing the lock-in phenomena at Reynolds numbers of up to 300,000. The main aim of this experimental investigation is to demonstrate that surface mounted sensors can provide information for effective feedback flow control of a circular cylinder at Reynolds numbers of 20,000-30,000. This study tests the practicality of feedback control by using body mounted pressure sensors and plasma actuators. Flow visualization was used to assess the integration of the plasma actuators and obtain necessary physical insight into the von Kármán vortex street. Data was collected from both hot film velocity wake sensors and surface mounted pressure sensors. These measurements were analyzed to examine frequency and phase relationships between the surface and wake activity. The results showed a very distinct frequency match between the body and wake mounted sensors with respect to the fundamental von Kármán shedding frequency. Also, both chord-wise and span-wise coherence were significantly improved when the plasma was introduced into the system. The results conclusively show that surface mounted sensors are promising candidates for effective feedback for flow control of a circular cylinder.
Nomenclature a = cross sectional area of tubing c = speed of sound Cdu = wind tunnel width D = cylinder diameter f = natural shedding frequency h = uncorrected drag coefficient L = length of tubing Q = transducer cavity volume Re = Reynolds number s = arc length along cylinder originating at aft most edge of exposed electrode St = Strouhal number Uc = corrected free-stream velocity U∞ = free-stream velocity x = axis originating at bottom center of cylinder, extending to the right when looking downstream y = axis originating at bottom center of cylinder, extending downstream z = axis originating at bottom center of cylinder, extending up through center of cylinder εwb = wake blockage correction factor εsb = solid blockage correction factor
This work is declared a work of the U.S. Government and is not subject to copyright protection in the United States. * Cadet, Department of Aeronautics, Member AIAA † Cadet, Department of Aeronautics, Member AIAA ‡ Contracted Research Engineer, Department of Aeronautics, Associate Fellow AIAA § Instructor, Department of Aeronautics, Member AIAA ** Director, Aeronautics Research Center, Department of Aeronautics, Associate Fellow AIAA
45th AIAA Aerospace Sciences Meeting and Exhibit8 - 11 January 2007, Reno, Nevada
AIAA 2007-108
This material is declared a work of the U.S. Government and is not subject to copyright protection in the United States.
Dow
nloa
ded
by U
NIV
ER
SIT
Y O
F C
INC
INN
AT
I on
Dec
embe
r 7,
201
4 | h
ttp://
arc.
aiaa
.org
| D
OI:
10.
2514
/6.2
007-
108
American Institute of Aeronautics and Astronautics
2
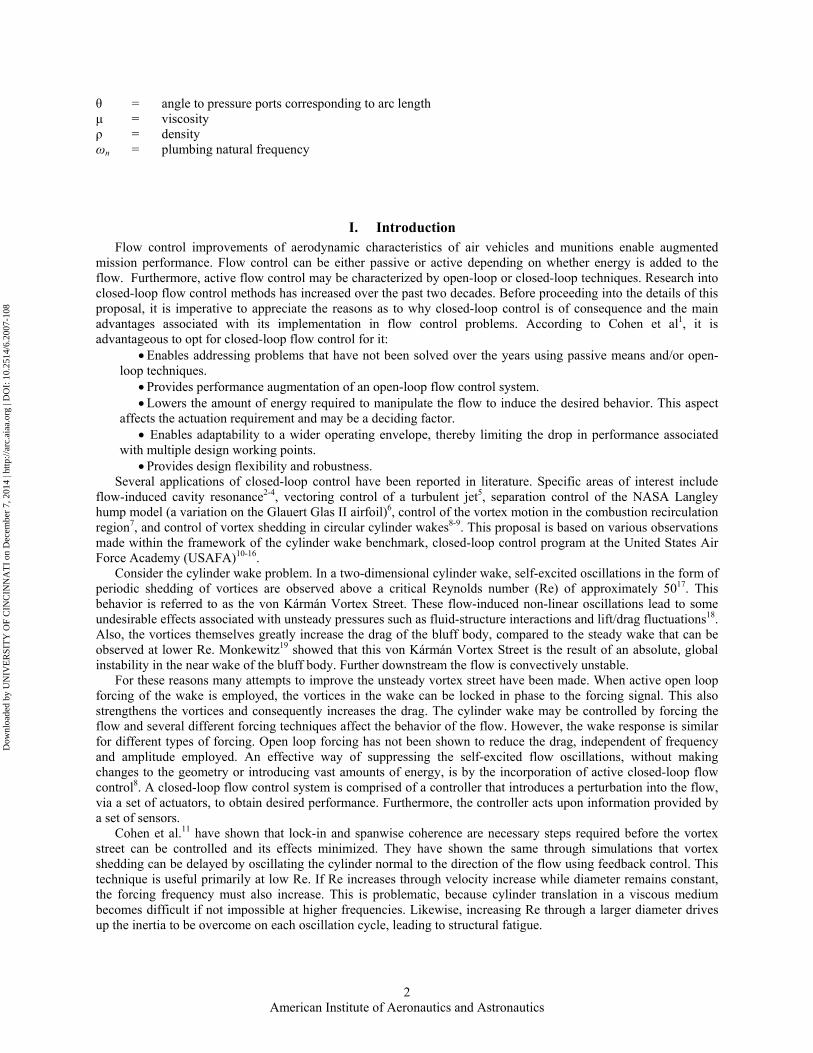
θ = angle to pressure ports corresponding to arc length µ = viscosity ρ = density ωn = plumbing natural frequency
I. Introduction Flow control improvements of aerodynamic characteristics of air vehicles and munitions enable augmented mission performance. Flow control can be either passive or active depending on whether energy is added to the flow. Furthermore, active flow control may be characterized by open-loop or closed-loop techniques. Research into closed-loop flow control methods has increased over the past two decades. Before proceeding into the details of this proposal, it is imperative to appreciate the reasons as to why closed-loop control is of consequence and the main advantages associated with its implementation in flow control problems. According to Cohen et al1, it is advantageous to opt for closed-loop flow control for it:
• Enables addressing problems that have not been solved over the years using passive means and/or open-loop techniques.
• Provides performance augmentation of an open-loop flow control system. • Lowers the amount of energy required to manipulate the flow to induce the desired behavior. This aspect
affects the actuation requirement and may be a deciding factor. • Enables adaptability to a wider operating envelope, thereby limiting the drop in performance associated
with multiple design working points. • Provides design flexibility and robustness.
Several applications of closed-loop control have been reported in literature. Specific areas of interest include flow-induced cavity resonance2-4, vectoring control of a turbulent jet5, separation control of the NASA Langley hump model (a variation on the Glauert Glas II airfoil)6, control of the vortex motion in the combustion recirculation region7, and control of vortex shedding in circular cylinder wakes8-9. This proposal is based on various observations made within the framework of the cylinder wake benchmark, closed-loop control program at the United States Air Force Academy (USAFA)10-16.
Consider the cylinder wake problem. In a two-dimensional cylinder wake, self-excited oscillations in the form of periodic shedding of vortices are observed above a critical Reynolds number (Re) of approximately 5017. This behavior is referred to as the von Kármán Vortex Street. These flow-induced non-linear oscillations lead to some undesirable effects associated with unsteady pressures such as fluid-structure interactions and lift/drag fluctuations18. Also, the vortices themselves greatly increase the drag of the bluff body, compared to the steady wake that can be observed at lower Re. Monkewitz19 showed that this von Kármán Vortex Street is the result of an absolute, global instability in the near wake of the bluff body. Further downstream the flow is convectively unstable.
For these reasons many attempts to improve the unsteady vortex street have been made. When active open loop forcing of the wake is employed, the vortices in the wake can be locked in phase to the forcing signal. This also strengthens the vortices and consequently increases the drag. The cylinder wake may be controlled by forcing the flow and several different forcing techniques affect the behavior of the flow. However, the wake response is similar for different types of forcing. Open loop forcing has not been shown to reduce the drag, independent of frequency and amplitude employed. An effective way of suppressing the self-excited flow oscillations, without making changes to the geometry or introducing vast amounts of energy, is by the incorporation of active closed-loop flow control8. A closed-loop flow control system is comprised of a controller that introduces a perturbation into the flow, via a set of actuators, to obtain desired performance. Furthermore, the controller acts upon information provided by a set of sensors.
Cohen et al.11 have shown that lock-in and spanwise coherence are necessary steps required before the vortex street can be controlled and its effects minimized. They have shown the same through simulations that vortex shedding can be delayed by oscillating the cylinder normal to the direction of the flow using feedback control. This technique is useful primarily at low Re. If Re increases through velocity increase while diameter remains constant, the forcing frequency must also increase. This is problematic, because cylinder translation in a viscous medium becomes difficult if not impossible at higher frequencies. Likewise, increasing Re through a larger diameter drives up the inertia to be overcome on each oscillation cycle, leading to structural fatigue.
Dow
nloa
ded
by U
NIV
ER
SIT
Y O
F C
INC
INN
AT
I on
Dec
embe
r 7,
201
4 | h
ttp://
arc.
aiaa
.org
| D
OI:
10.
2514
/6.2
007-
108

American Institute of Aeronautics and Astronautics
3
Recent work at USAFA has shown that a Dielectric Barrier Discharge (DBD) plasma actuator20 is an effective means of forcing the flow at higher frequencies without mechanical movement. This relatively simple actuation device is composed of two thin electrodes separated by a dielectric barrier. When an AC voltage is applied to the electrodes, a plasma discharge propagates from the edge of the exposed electrode over the insulated electrode. The emergence of this plasma is accompanied by a coupling of directed momentum into the surrounding air as the plasma propagates over the buried electrode during each oscillation forcing cycle21. This momentum can effectively alter a moving flow or generate flow in the direction of plasma propagation, as several application-based papers have shown22-24. The non-mechanical nature of the plasma actuator makes it ideal for high Re flow control applications. Its high fundamental operating frequency suggests it can be effective over a very wide bandwidth (by fluid time scale standards). This enables operation over a much broader range of frequencies than mechanical actuators. It has no moving parts, and has no resonant frequency. Munska and McLaughlin20 established the concept that plasma actuators can substantially alter cylinder wake lock-in and span-wise coherence over a range of forcing conditions. They employed a cylinder arrangement similar to that of Asghar and Jumper23, with electrodes at ±90º and Re up to 88x103, and used a similar amplitude-modulated forcing scheme.
II. Main Research Objective This effort builds on the above progress made by the USAFA team in employing plasma actuators to flow
control of the cylinder wake. With the ultimate goal being closed-loop flow control of the cylinder wake using DBD plasma actuators, research is required to rectify the issues concerning the implementation of body mounted sensors, low-dimensional modeling, real-time estimation of low-dimensional states and design of control laws. Previous studies at USAFA15 have shown that velocity measurements gathered from the wake can be used to realize desired closed-loop performance. The current research focuses on examining the practicality of feedback control using body mounted sensors and actuators. The main aim of this experimental investigation is to demonstrate that surface mounted sensors can provide information for effective feedback flow control of a circular cylinder at Re of 20,000-30,000.
III. Experimental Setup All tests were conducted in the USAFA Low Speed Wind Tunnel (LSWT). This tunnel has a 3 ft x 3 ft test
section with a usable velocity range from 5 m/s to 35 m/s. A 3.5 in diameter, D, PVC cylinder spanned the entire height of the test section. Plasma actuators were placed along the span at the ±90° marks based on previous work done by McLaughlin25. The actuators consisted of two strips of copper tape, one buried beneath the dielectric barrier and one on top. (see Figure 1)
Fig. 1 Plasma structure in the aerodynamic plasma actuator. (Based on C. L. Enloe, et al.21)
Computer controlled voltage was amplified and transformers were used to significantly increase the magnitude to 11kV. The plasma formed atop the Teflon tape over the area of the buried electrode. Five layers of Teflon dielectric tape were used, as shown effective through McLaughlin’s25 work. In this case however, the Teflon tape was only used on the front side of the cylinder to make room for the sensors on the back half (see Figure 2). A panel was cut from the downstream side of the cylinder for sensor placement. Sixteen pressure ports consisting of four rows of
Dow
nloa
ded
by U
NIV
ER
SIT
Y O
F C
INC
INN
AT
I on
Dec
embe
r 7,
201
4 | h
ttp://
arc.
aiaa
.org
| D
OI:
10.
2514
/6.2
007-
108

American Institute of Aeronautics and Astronautics
4
four ports were placed into this panel and a Scanivalve pressure multiplexer was fixed inside the cylinder with tubing connected to each of the sixteen ports (see Figures 3 and 4). The pressure multiplexer schematic is shown in Figure 5.
Fig. 2 Top view of cylinder set-up.
Fig. 3 Pressure port locations.
Dow
nloa
ded
by U
NIV
ER
SIT
Y O
F C
INC
INN
AT
I on
Dec
embe
r 7,
201
4 | h
ttp://
arc.
aiaa
.org
| D
OI:
10.
2514
/6.2
007-
108

American Institute of Aeronautics and Astronautics
5
Fig. 4 Scanivalve pressure multiplexer and pressure ports in cylinder.
Fig. 5 Pressure sensor and Scanivalve pressure multiplexer schematic.
The chordwise position of the ports around the back half of the cylinder in each row is shown in Figure 2. The location of these ports was determined by doing hot film anemometer testing across the back side cylinder 1/8” behind the cylinder wall. The plasma actuators were driven at the Strouhal shedding frequency to ensure lock-in and provide adequate flow control. Before data was collected, flow visualization was conducted to see the flow characteristics and ensure the plasma was effective in forcing the flow. Hot film anemometers were also used to validate the theoretical values for frequency downstream of the cylinder. The hot film anemometers were used to gather preliminary data very near the surface of the cylinder. Figure 6 shows the tunnel set-up of the cylinder with pressure ports and the hot film anemometers positioned in the wake.
Dow
nloa
ded
by U
NIV
ER
SIT
Y O
F C
INC
INN
AT
I on
Dec
embe
r 7,
201
4 | h
ttp://
arc.
aiaa
.org
| D
OI:
10.
2514
/6.2
007-
108

American Institute of Aeronautics and Astronautics
6
Fig. 6 Hot film anemometers and pressure ports.
A. Flow Visualization To ensure that the plasma actuators were working properly and to see the effects of the plasma, a flow visualization test was conducted at the onset. A nickel chromium wire was suspended across two metal support stands placed approximately 2 ft in front of the cylinder. SAE 80W90 gear oil was then applied to the wire with a cotton swab and it beaded up along the length of the wire. A high speed digital video camera was positioned on top of the test section. One light stand was positioned on each side of test section and the tunnel room lights were dimmed. As the tunnel was running, a current was sent through the wire, causing the oil to burn off while the tunnel air carried the smoke downstream. This enabled the camera to capture the flow characteristics. The results of the flow visualization demonstrated a significant difference in flow pattern directly behind cylinder for both the 20k and 30k Re flows. During DBD plasma actuation, the stream lines appeared to be more attracted to the cylinder wall before developing vortices (see Figure 7). A basic slow motion study of the high speed flow-visualization video showed that the vibrating stream lines had the same frequency as that of the plasma actuation thereby indicating the lock-in behavior. When the plasma was off, the vortices developed further downstream and further from centerline compared with the plasma induced flow. The flow visualization verified that the plasma actuators were working correctly and helped provide important physical insight into the forced flow behavior at lock-in.
(a) (b)
Fig. 7 Flow visualization screen shots: a) plasma off b) plasma on.
B. Hot Film Apparatus
Dow
nloa
ded
by U
NIV
ER
SIT
Y O
F C
INC
INN
AT
I on
Dec
embe
r 7,
201
4 | h
ttp://
arc.
aiaa
.org
| D
OI:
10.
2514
/6.2
007-
108

American Institute of Aeronautics and Astronautics
7
Hot film anemometers were placed vertically in the wind tunnel, parallel with the cylinder (see Figure 6). These anemometers, 1-6, were calibrated using the established procedures at the USAF Academy LSWT. Four of the six anemometers were mounted 2⅜ inches apart vertically, centered vertically in the wind tunnel and in relation to the cylinder. The vertical placement of the hot film anemometers can be seen in Figure 8.
Fig. 8 Vertical placement of hot film anemometers.
The hot films were positioned in line with the side of the cylinder, where the von Kármán Vortex Street vortices appear13. They were initially placed 1.5D downstream from the cylinder to measure the velocity and frequency of the flow to validate McLaughlin’s25 work. Subsequently, the anemometers were moved in closer to the cylinder’s surface to identify ideal locations for the surface mounted pressure sensors. The anemometers were placed at a distance of approximately 1/8 inches away from the cylinder as this was as close as they could be safely placed. Initially, the anemometers were positioned at 1⅞ inches, measured along the circumference of the cylinder, from the trailing edge of the plasma. When the anemometers were in close proximity to the plasma layer, the data obtained appeared to be contaminated. The most likely cause of the contamination was electro-magnetic interference (EMI). The probe was moved counterclockwise at varying intervals along the rear of the cylinder to capture the extent of the useful information and ensure the data was not affected by EMI from the plasma.
During testing with the Validyne pressure sensor, four hot film anemometers were again placed on a vertical rake spaced evenly, this time spacing was directed by the spacing of the pressure ports on the cylinder. The rake was again in line with the edge of the cylinder to pick up desired details, namely frequency, concerning the Kármán vortex street. The rake was positioned 1.5D, 2.0D, and 2.5D downstream. Data was taken at each pressure port and all four hot film anemometers for 10 seconds at a time, synchronized by the data acquisition system.
C. Validyne Pressure Sensor System This pressure sensor was used in conjunction with a Scanivalve pressure multiplexer unit to cycle through the 16 different pressure ports. These ports were drilled into the removable rear section of the cylinder. The vertical distances to each row from the bottom of the cylinder were the same as the hot film locations shown in Figure 8. The locations of the ports can be found in Table 1 and seen in Figure 3.
Dow
nloa
ded
by U
NIV
ER
SIT
Y O
F C
INC
INN
AT
I on
Dec
embe
r 7,
201
4 | h
ttp://
arc.
aiaa
.org
| D
OI:
10.
2514
/6.2
007-
108

American Institute of Aeronautics and Astronautics
8
Table 1 Pressure port locations
Port 1 2 3 4 5 6 7 8 s
(inches) 2.125 2.875 3.125 3.875 2.125 2.875 3.125 3.875
θ (degrees)
69.6 94.1 102.3 126.9 69.6 94.1 102.3 126.9
z (inches)
14.5 14.5 14.5 14.5 16.875 16.875 16.875 16.875
Port 9 10 11 12 13 14 15 16
s (inches)
2.125 2.875 3.125 3.875 2.125 2.875 3.125 3.875
θ (degrees)
69.6 94.1 102.3 126.9 69.6 94.1 102.3 126.9
z (inches)
19.25 19.25 19.25 19.25 21.625 21.625 21.625 21.625
The Validyne pressure sensor has a pressure range of ±0.03 psid, an analog output of ±10VDC, and accuracy of 0.25%, as documented by the manufacturer. The Validyne pressure sensor was also calibrated in house to verify the manufacturer’s data and ensure nothing had been damaged during handling or installation. The calibration performed at USAFA showed an excellent linear relationship between the pressure and the voltage where ±0.03psi ≡ ±10V, which is exactly what the manufacturer stated.
To use both the Scanivalve pressure multiplexer and Validyne sensor together, the central transducer of the
Scanivalve pressure multiplexer was removed and replaced with a “dummy” plug which simply made the Scanivalve pressure multiplexer a switching mechanism for the separate sensor. A period of 60 seconds was required between each pressure reading to ensure that the flow had “settled” after each Scanivalve pressure multiplexer switch. Figure 5 shows the set-up of the pressure transducer and Scanivalve pressure multiplexer. The remote placement of the sensor excluded it from EMI issues because it was not within reasonable proximity to the plasma to pick up any interference. Care was taken to not “pinch” any of the pressure tubing when closing the cylinder for mounting and testing.
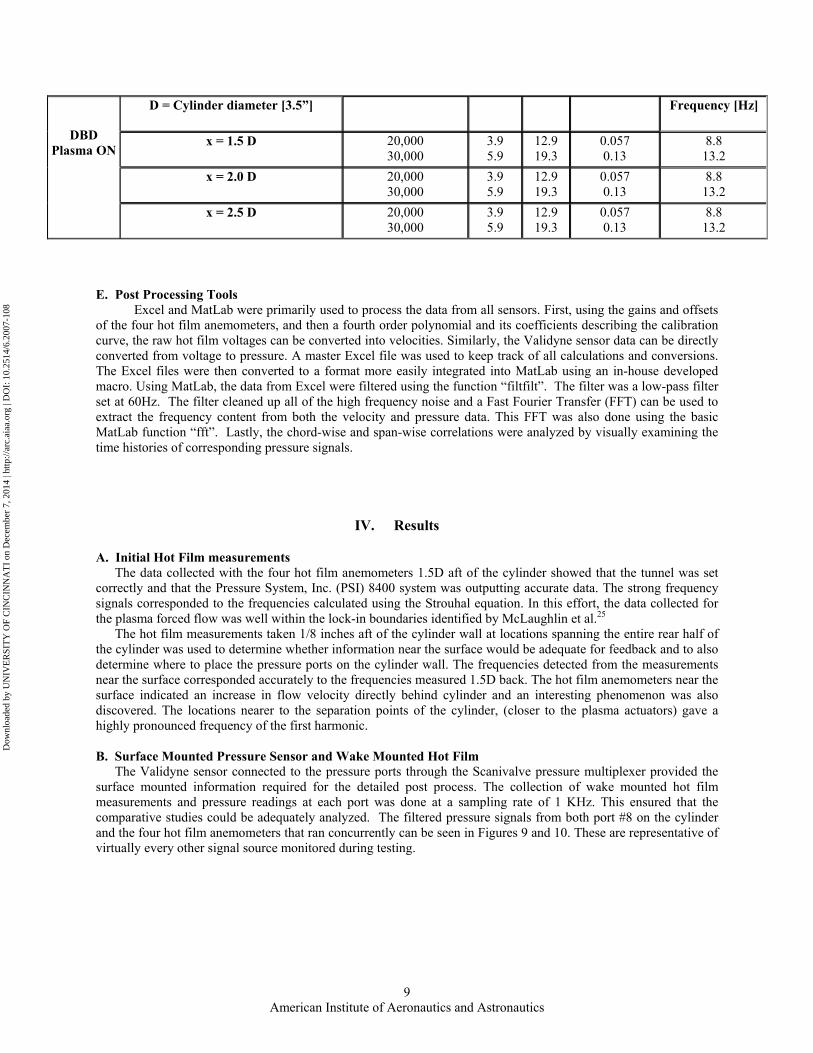
D. Test Matrix The test matrix, shown in Table 2, was based on calculations of the Re number using both the Strouhal equation
and the dynamic pressure equation. Each case was run with both DBD plasma off and DBD plasma on, yielding 12 cases. The calculated shedding frequency was used as the plasma actuation frequency, as previously discussed. The dynamic pressure, q∞, was used to set the wind tunnel to the correct speed for testing.
Table 2 Test Matrix
Position of hot-film sensor in wake [z = 0; y = -D/2]
D = Cylinder diameter [3.5”]
Reynolds Number U∞ [m/s]
U∞ [ft/s]
Desired q∞ [Torr]
Calculated Natural Shedding Frequency [Hz]
x = 1.5 D 20,000 30,000
3.9 5.9
12.9 19.3
0.057 0.13
8.8 13.2
x = 2.0 D 20,000 30,000
3.9 5.9
12.9 19.3
0.057 0.13
8.8 13.2
DBD Plasma OFF
x = 2.5 D 20,000 30,000
3.9 5.9
12.9 19.3
0.057 0.13
8.8 13.2
Position of hot-film sensor in wake [z = 0; y = -D/2]
Reynolds Number U∞ [m/s]
U∞ [ft/s]
Desired q∞ [Torr]
Calculated Natural Shedding
Dow
nloa
ded
by U
NIV
ER
SIT
Y O
F C
INC
INN
AT
I on
Dec
embe
r 7,
201
4 | h
ttp://
arc.
aiaa
.org
| D
OI:
10.
2514
/6.2
007-
108
American Institute of Aeronautics and Astronautics
9
D = Cylinder diameter [3.5”] Frequency [Hz]
x = 1.5 D 20,000 30,000
3.9 5.9
12.9 19.3
0.057 0.13
8.8 13.2
x = 2.0 D 20,000 30,000
3.9 5.9
12.9 19.3
0.057 0.13
8.8 13.2
DBD Plasma ON
x = 2.5 D 20,000 30,000
3.9 5.9
12.9 19.3
0.057 0.13
8.8 13.2
E. Post Processing Tools Excel and MatLab were primarily used to process the data from all sensors. First, using the gains and offsets
of the four hot film anemometers, and then a fourth order polynomial and its coefficients describing the calibration curve, the raw hot film voltages can be converted into velocities. Similarly, the Validyne sensor data can be directly converted from voltage to pressure. A master Excel file was used to keep track of all calculations and conversions. The Excel files were then converted to a format more easily integrated into MatLab using an in-house developed macro. Using MatLab, the data from Excel were filtered using the function “filtfilt”. The filter was a low-pass filter set at 60Hz. The filter cleaned up all of the high frequency noise and a Fast Fourier Transfer (FFT) can be used to extract the frequency content from both the velocity and pressure data. This FFT was also done using the basic MatLab function “fft”. Lastly, the chord-wise and span-wise correlations were analyzed by visually examining the time histories of corresponding pressure signals.
IV. Results
A. Initial Hot Film measurements The data collected with the four hot film anemometers 1.5D aft of the cylinder showed that the tunnel was set correctly and that the Pressure System, Inc. (PSI) 8400 system was outputting accurate data. The strong frequency signals corresponded to the frequencies calculated using the Strouhal equation. In this effort, the data collected for the plasma forced flow was well within the lock-in boundaries identified by McLaughlin et al.25 The hot film measurements taken 1/8 inches aft of the cylinder wall at locations spanning the entire rear half of the cylinder was used to determine whether information near the surface would be adequate for feedback and to also determine where to place the pressure ports on the cylinder wall. The frequencies detected from the measurements near the surface corresponded accurately to the frequencies measured 1.5D back. The hot film anemometers near the surface indicated an increase in flow velocity directly behind cylinder and an interesting phenomenon was also discovered. The locations nearer to the separation points of the cylinder, (closer to the plasma actuators) gave a highly pronounced frequency of the first harmonic. B. Surface Mounted Pressure Sensor and Wake Mounted Hot Film The Validyne sensor connected to the pressure ports through the Scanivalve pressure multiplexer provided the surface mounted information required for the detailed post process. The collection of wake mounted hot film measurements and pressure readings at each port was done at a sampling rate of 1 KHz. This ensured that the comparative studies could be adequately analyzed. The filtered pressure signals from both port #8 on the cylinder and the four hot film anemometers that ran concurrently can be seen in Figures 9 and 10. These are representative of virtually every other signal source monitored during testing.
Dow
nloa
ded
by U
NIV
ER
SIT
Y O
F C
INC
INN
AT
I on
Dec
embe
r 7,
201
4 | h
ttp://
arc.
aiaa
.org
| D
OI:
10.
2514
/6.2
007-
108

American Institute of Aeronautics and Astronautics
10
Fig. 9 Filtered pressure signal #8, Re=20k, plasma off. The figure on the right zooms onto the first 1.4 s.
Fig. 10 Filtered hot film signals,1.5D downstream, Re=20k, plasma off.
The figure on the right zooms onto the first 0.65 s. Using these signals, the appropriate frequency data is retrieved and graphed. The first harmonic, associated with
the von Kármán vortex shedding frequency is very distinctly identified. The frequency content of the data, pertaining to the von Kármán vortex shedding frequency, from the surface mounted pressure sensor perfectly correlates with that of the hot film anemometers. The frequency plots of the 16 pressure signals along with the 64 hot film signals while running at Re=20k with no plasma can be seen below in Figure 11. For the unforced flow, it can be seen that both sensors are picking up the exact same shedding frequency of 9.1 Hz.
Dow
nloa
ded
by U
NIV
ER
SIT
Y O
F C
INC
INN
AT
I on
Dec
embe
r 7,
201
4 | h
ttp://
arc.
aiaa
.org
| D
OI:
10.
2514
/6.2
007-
108

American Institute of Aeronautics and Astronautics
11
Fig. 11 FFT of pressure vs. hot film signals, 1.5D downstream, Re=20k, plasma off.
Again, with plasma forcing within the lock-in regime, the same data are taken and through post-processing, the first harmonic is shown to be very distinct. Also, the plasma forced flow has a considerable increase in frequency magnitude from the non-plasma forced flow. In this case, the surface mounted pressure sensor’s frequency amplitude is increased by about 13%. On the other hand, for the data taken from the hot film anemometers, an increase in the frequency magnitude of about 38% is noticed. During the DBD plasma forcing, the flow’s shedding frequency gets locked into the plasma actuation, which was set to a frequency of 8.8 Hz. All the plasma-on test results reflect the trends that are apparent in Figure 11. The only discrepancy is when the hot film anemometers are moved to 2.5D downstream of the cylinder. The vortices decompose enough by that point that the frequency magnitudes no longer increase a significant amount. They do, however, still have very distinct peaks orders of magnitude greater than the others contained in the frequency plot. The frequency plots of the surface mounted pressure sensor and hot film anemometers at Re=20k and plasma on can be seen below in Figure 12.
16 Pressure Signals Natural Shedding
Frequency = 9.1 Hz
64 H.F. Signals Natural Shedding
Frequency = 9.1 Hz
Dow
nloa
ded
by U
NIV
ER
SIT
Y O
F C
INC
INN
AT
I on
Dec
embe
r 7,
201
4 | h
ttp://
arc.
aiaa
.org
| D
OI:
10.
2514
/6.2
007-
108

American Institute of Aeronautics and Astronautics
12
Fig. 12 FFT of pressure vs. hot film signals, 1.5D downstream, Re=20k, plasma on.
Other flow characteristics observed are that of chord-wise and span-wise coherence. When the flow is unforced, there is no definite, fixed phase difference along either the chord or span of the cylinder. By definition, this means there is no coherence in either direction. Once the plasma is actuated, however, the phase difference steadies and both the span-wise and chord-wise coherence are greatly improved. Also, the span-wise correlation is greatly increased in the wake, as sensed by the hot film anemometers. This can be seen in Figures 13 and 14. Note that since a scani-valve is used for the pressure measurements, the signals are non-synchronous and therefore it is important to note the relatively fixed phase difference when the plasma is on. Notice the peaks between the two signals are much more consistently spaced when the plasma is turned on. Two other arbitrary cases were tested to ensure chord-wise coherence was consistently gained from the plasma actuation.
Fig. 13 Span-wise coherence, Re=20k, pressure ports #4 & #8.
Plasma Off Plasma On
16 Pressure Signals Natural Shedding
Frequency = 8.7 Hz
64 H.F. Signals Natural Shedding
Frequency = 8.7 Hz
Dow
nloa
ded
by U
NIV
ER
SIT
Y O
F C
INC
INN
AT
I on
Dec
embe
r 7,
201
4 | h
ttp://
arc.
aiaa
.org
| D
OI:
10.
2514
/6.2
007-
108

American Institute of Aeronautics and Astronautics
13
Fig. 14 Span-wise coherence, Re=20k, hot film anemometers.
The results for all cases are shown in Tables 3 and 4. For each configuration, the pressure sensor frequencies were exactly the same as the frequencies found in the wake. As seen in Table 4, the plasma induced frequencies for the Re = 30k are 13.4 Hz and 13.8 Hz, as opposed to 13.3 Hz, which is what the plasma was actuated at. Although the flow was forced at a frequency of 13.3 Hz, the normal frequency of the flow came out to be 13.8 Hz for these cases. The 13.4 Hz case should have been the same as the other cases at 13.8 Hz. This could be from the larger speed in the wind tunnel and the fact the plasma was run for 16 straight minutes during those tests. The case where the 13.4 frequency was picked up also had an anomaly contained within it. There was a 10 second window during only one pressure sensor reading and 4 hot film anemometer readings contained a low frequency disturbance, most likely caused by an interference with the open loop wind tunnel system.
Table 3 Results summary for Re=20k
Hot Film Location Frequency of Hot Films Plasma Off
[Hz]
Frequency of Pressure Sensors Plasma Off [Hz]
Frequency of Hot Film
Plasma On [Hz]
Frequency of Pressure Sensors @
Plasma On [Hz] 1.5D 9.1 9.1 8.7 8.7 2.0D 9.1 9.1 8.7 8.7 2.5D 9.1 9.1 8.7 8.7
Table 4 Results summary for Re=30k Hot Film Location Frequency of Hot
Films Plasma Off [Hz]
Frequency of Pressure Sensors Plasma Off [Hz]
Frequency of Hot Film
Plasma On [Hz]
Frequency of Pressure Sensors @
Plasma On [Hz] 1.5D 14.1 14.1 13.4* 13.4* 2.0D 14.1 14.1 13.8 13.8 2.5D 14.1 14.1 13.8 13.8
V. Discussion During this research, there were two main sources of error throughout. They consisted of wind tunnel blockage
and the pressure sensor plumbing. Both sources of error were anticipated. While the rule of thumb to avoid wind tunnel blockage issues is to ensure that the cross sectional area of the test model is less than 5 percent of the cross sectional area of the tunnel test section, a larger cylinder diameter was required. Subsequently, based on the cylinder diameter of 3.5 inches, the blockage ratio for this test was determined to be 9.72% and the equations based on Barlow, Rae and Pope27 are as follows:
Plasma Off Plasma On
Dow
nloa
ded
by U
NIV
ER
SIT
Y O
F C
INC
INN
AT
I on
Dec
embe
r 7,
201
4 | h
ttp://
arc.
aiaa
.org
| D
OI:
10.
2514
/6.2
007-
108

American Institute of Aeronautics and Astronautics
14
0608.02
=⋅=h
CD duwbε , (1)
0078.012 2
22
=⋅=hD
sbπε , and (2)
)1( sbwbc UU εε ++= ∞ = )0686.01( +∞U (3)
were used to account for the blockage effects. Based on the parameters of this testing the corrected velocity was determined to be up to 7% greater than the
freestream. The velocity measured was 3-5% greater than the velocity set for the tunnel which was expected and within the range of the calculated blockage error. Since the area of the test section is reduced by the relatively large model, the flow’s velocity was increased while the resulting natural shedding frequency was also increased. For example, the shedding frequency of the Re=20k flow was increased from 8.7 Hz to 9.1 Hz while the Re=30k flow was increased from 13.8 Hz to 14.1 Hz. This was the largest contributor of error into the data at around 2%-5% error.
The pressure sensor plumbing was also an issue. To ensure the data acquired was not contaminated by the remote set-up, the characteristics of the plumbing were examined. For the sensor to output reliable data, the natural frequency of the plumbing system must be at least five times that of the largest frequency to be measured according to the documentation included with the sensor. The natural frequency of the system was found using the equation
aLQL
cn
+=
21
ω , (4)
where ωn is the natural frequency, c is the speed of sound (1089.2 ft/s), L is the length of tubing (2.5 ft), Q is the transducer cavity volume (2.03E-5 ft3), and a is the cross sectional area of the tubing (2.13053E-5 ft2). This yielded ωn=73.87 Hz, which was well within the specified range since the maximum frequency measured was 14.1 Hz. This gave around 2-3% amplification of pressure waveform.
VI. Conclusion and Recommendations The fundamental frequency, which is paramount for feedback, is distinctly and accurately picked up by the
surface mounted pressure sensor. It can easily be picked out after using an FFT and has great potential for feedback applications. For three arbitrary cases tested at Re=20k, based on surface mounted pressure sensors, lock-in brings about an increase in chord-wise and span-wise correlation of the wake as described by Blevins26. This shows the flow is much more uniform when the plasma is applied. Also, surface mounted pressure sensors seem to be effective for feedback of plasma forced cylinder wakes at Re of 20k-30k. This is very important because it is both revolutionary and counter-intuitive to the way many have thought about this. This research lays the foundation for much future research. The next step is to develop a computational fluid dynamics (CFD) model of an unforced cylinder wake at Re=20k and validate this model using the data collected here. Other future research includes applying Proper Orthogonal Decomposition (POD) on surface pressures of the CFD simulation data, designing an estimator that maps surface pressure readings to POD modes, and implementing an estimator in a real-time feedback control system using a proportional-integral-derivative (PID) controller for LSWT tests at Re=20K.
Acknowledgments
The authors would like to thank AFOSR/Dynamics and Controls Directorate for their support of CLOPACT. The contributions of SSgt Mary Church in set-up, tear-down, and everything in between, Ken Ostasiewski and his help with flow-visualization, the Scanivalve pressure multiplexer, and many other facets of the wind tunnel testing, and Jeff Falkenstine with the manufacturing of the model were vital to the success of the project. Mr. Tim Hayden’s integration of the Scanivalve pressure multiplexer and support throughout the semester were also critical to the completion of CLOPACT. LtCol Tim Scully’s unwavering support and encouragement were needed many times during both conceptualization and testing. Mr. Fred Porter’s advice on plasma and EMI could not have been more
Dow
nloa
ded
by U
NIV
ER
SIT
Y O
F C
INC
INN
AT
I on
Dec
embe
r 7,
201
4 | h
ttp://
arc.
aiaa
.org
| D
OI:
10.
2514
/6.2
007-
108

American Institute of Aeronautics and Astronautics
15
influential in the final model design. Dr. Stefan Siegel’s concern for wind tunnel blockage helped explain a few observations and his MATLAB program for phase correlation helped very much during post-processing. Dr. Young-Sug Shin helped ensure the model’s structure would not interfere with testing. Last, but not least, the authors would like to thank Dr. Martiqua Post for support and constructive comments.
References
1Cohen, K., Siegel, S., and McLaughlin, T.E., "Control Issues in reduced-Order Feedback Flow Control", Invited Lecture at session titled "Closed-Loop Flow Control: Algorithms and Applications", AIAA Paper 2004-0575, 42nd AIAA Aerospace Sciences Meeting, Reno, Nevada, January 5-8 2004.
2Gad-el-Hak, M., "Modern Developments in Flow Control", Applied Mechanics Reviews, vol. 49, 1996, pp. 365–379. 3Cattafesta III, L.N., Williams, D.R., Rowley, C.W., and Alvi, F.S., "Review of Active Control of Flow-Induced Cavity
Resonance", AIAA Paper 2003-3567, June 2003. 4Samimy, M., Debiasi, M., Caraballo, E., E.C., Ozbay, H., Efe, M.O., Yuan, X., DeBonis, J., and Myatt, J.H., "Development
of Closed-loop Control for Cavity Flows", AIAA Paper 2003-4258, June 2003. 5Rapoport, D., Fono, I., Cohen, K., and Seifert, A., "Closed-loop Vectoring Control of a Turbulent Jet Using Periodic
Excitation", Journal of Propulsion and Power, Vol. 19, No. 4, 2003, pp. 646-654. 6Allan, B.G., Juang, Jer-Nan, Raney, D.L., Seifert, A., Pack, L., and Brown, D.E., "Closed-loop Separation Control Using
Oscillatory Flow Excitation", NASA/CR-2000-210324, ICASE Report No. 2000-32, August 2000. 7Tadmor, G., and Banaszuk, A., "Observation Feedback Control of Vortex Motion in a Recirculation Region”, IEEE
TransControl Sys. Tech., Vol. 10, pp. 749 – 755. 8Gillies, E. A., “Low-dimensional Control of the Circular Cylinder Wake”, Journal of Fluid Mechanics, Vol. 371, 1998, pp.
157-178. 9Gerhard, J., Pastoor, M., King, R., Noack, B.R., Dillmann, A., Morzynski, M., Tadmor, G., "Model-based Control of
Vortex Shedding using Low-dimensional Galerkin Models", AIAA Paper 2003-4262, June 2003. 10Cohen, K., Siegel, S., McLaughlin, T.E., and Myatt, J.H., "Proper Orthogonal Decomposition Modeling Of A Controlled
Ginzburg-Landau Cylinder Wake Model", AIAA Paper 2003-1292, January 2003. 11Cohen, K., Siegel, S., McLaughlin, T.E., and Myatt, J.H., 2003, "Fuzzy Logic Control of a Circular Cylinder Vortex
Shedding Model", AIAA Paper 2003-1290, January 2003. 12Siegel, S., Cohen, K., McLaughlin, T.E., and Myatt J.H., 2003, "Real-Time Particle Image Velocimetry for Closed-Loop
Flow Control Studies", AIAA Paper 2003-0920, January 2003. 13Cohen, K., Siegel, S., and McLaughlin, T.E., 2003, "Sensor Placement Based on Proper Orthogonal Decomposition
Modeling of a Cylinder Wake", AIAA Paper 2003-4259, June 2003. 14Siegel, S., Cohen, K. and McLaughlin, T.E., 2003, "Feedback Control of a Circular Cylinder Wake in Experiment and
Simulation", AIAA Paper 2003-3569, June 2003. 15Siegel, S., Cohen, K., and McLaughlin, T.E., “ Low-Dimensional Feedback Control of the von Kàrmàn Vortex Street at a
Reynolds Number of 100”, IUTAM Symposium: Fluid-Structure Interactions, Piscataway, USA, 2-6 June 2003. 16Cohen, K., Siegel, S., McLaughlin, T.E., and Gillies, E., 2003, “Feedback Control of a Cylinder Wake Low-Dimensional
Model”, AIAA Journal, Vol. 41, No. 8, August 2003. 17Albarede, P., and Provansal, M., “Quasi-periodic cylinder wakes and the Ginzburg-Landau model”, Journal of Fluid
Mechanics, Vol. 291, pp. 191-222, 1995. 18Roussopoulos, K., “Feedback Control of Vortex Shedding at Low Reynolds Numbers”, Journal of Fluid Mechanics, Vol.
248, 1993, pp. 267-296. 19Monkewitz, P.A,, “Modeling of self-excited wake oscillations by amplitude equations”, Experimental Thermal and Fluid
Science, Vol. 12, pp. 175-183, 1996. 20Munska, M. and McLaughlin, T.E., “Circular Cylinder Flow Control using Plasma Actuators” 43rd Aerospace Sciences
Meeting & Exhibit, Reno NV, AIAA Paper 2005-0141. 21Enloe, C.L., McLaughlin, T.E., VanDyken, R.D., Kachner, K.D., Jumper, E.J., and Corke, T.C., “Mechanisms and
Responses of a Single Dielectric Barrier Plasma Actuator: Plasma Morphology”, AIAA Journal, Vol. 42, No. 3, March 2004 22List, J., McLaughlin, T.E., Byerley, A.R., and Van Dyken, R.D., “Using Plasma to Control Separation on a Linear
Cascade Turbine Blade,” 41st Aerospace Sciences Meeting & Exhibit, Reno NV, AIAA Paper 2003-1026. 23Asghar, A., and Jumper, E.J., “Phase Synchronization of Vortex Shedding from Multiple Cylinders using Plasma
Actuators,” AIAA Paper 2003-1028. 24Bevan, B., Locke, E., Siegel, S., McLaughlin, T.E., and Cohen, K., “Flow Visualization of Three Dimensional Effects in
a Cylinder Wake Flow,” APS / DFD Meeting East Rutherford, NJ, 2003 25McLaughlin, T.E., Felker, B., Avery, J.C., and Enloe, C.L., “Further Experiments in Cylinder Wake Modification With
Dielectric Barrier Discharge Forcing”, AIAA-2006-1409, 44th AIAA Aerospace Sciences Meeting and Exhibit, Reno, Nevada, Jan. 9-12, 2006.
26Blevins, R.D., Flow Induced Vibration, 2nd ed., Von Nostrand Reinhold, New York, 1990, pp.54 27Barlow, J.B., Rae, W.H., and Pope, A., “Low Speed Wind Tunnel Testing”, 3d Ed., Wiley Interscience, New York, 1999.
Dow
nloa
ded
by U
NIV
ER
SIT
Y O
F C
INC
INN
AT
I on
Dec
embe
r 7,
201
4 | h
ttp://
arc.
aiaa
.org
| D
OI:
10.
2514
/6.2
007-
108