climate analysis daylighting uses solar angles, cloud cover
TRANSCRIPT
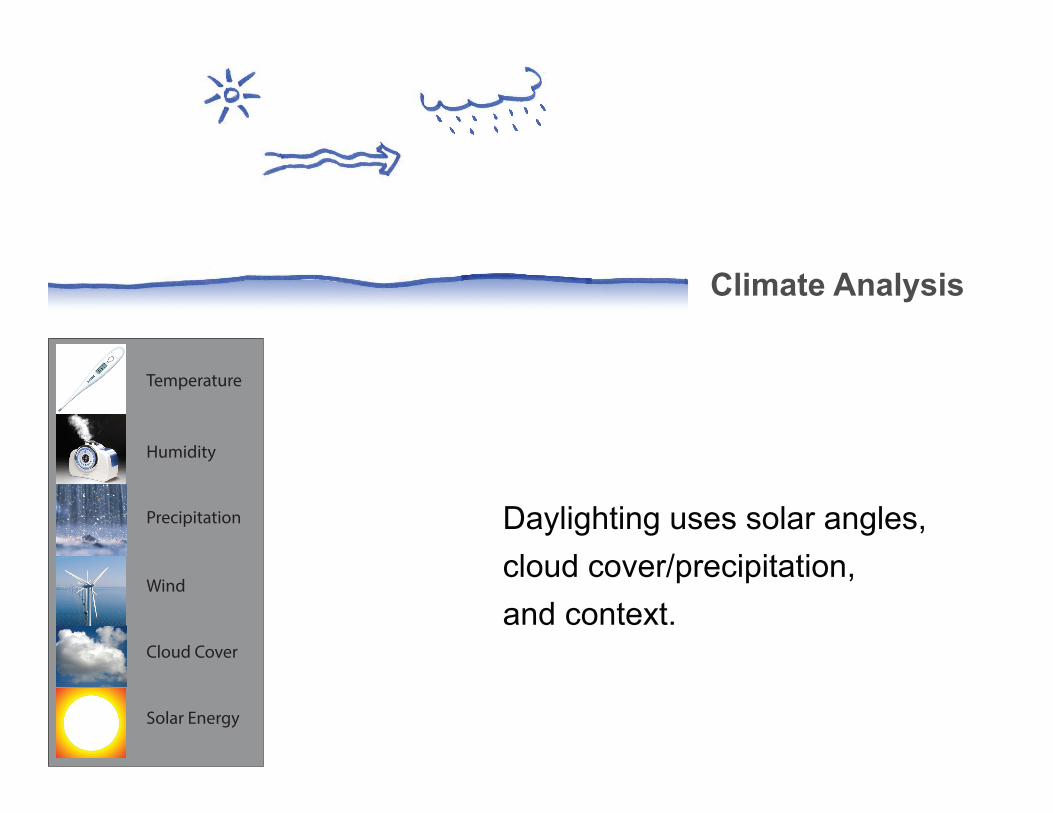
Climate Analysis
Daylighting uses solar angles, cloud cover/precipitation,and context.
Temperature
Humidity
Precipitation
Wind
Cloud Cover
Solar Energy
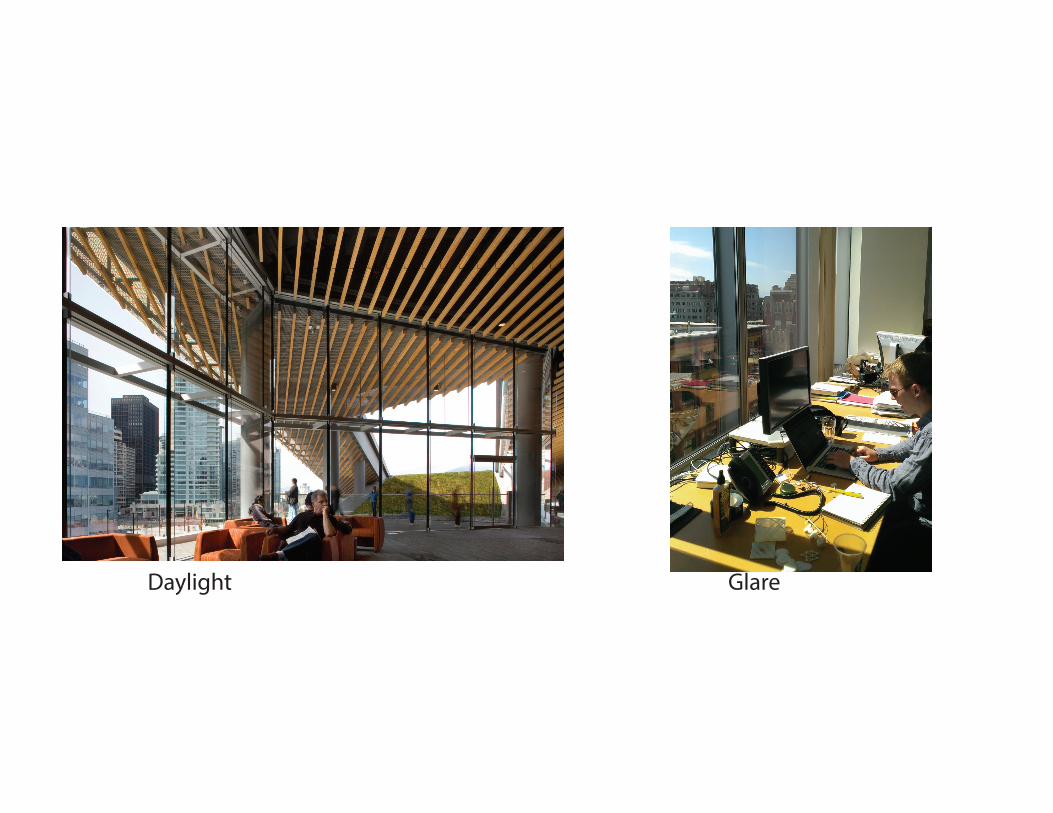
Daylight Glare
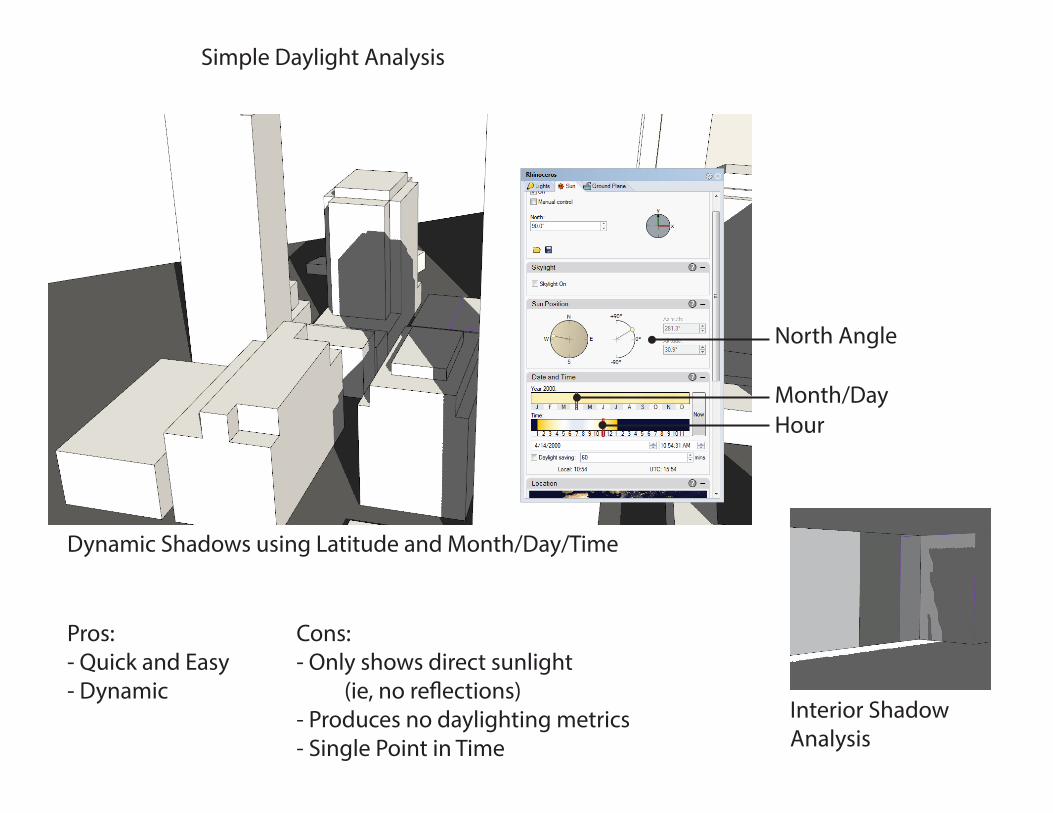
Month/DayHour
North Angle
Simple Daylight Analysis
Interior Shadow Analysis
Dynamic Shadows using Latitude and Month/Day/Time
Pros:- Quick and Easy- Dynamic
Cons:- Only shows direct sunlight (ie, no reflections)- Produces no daylighting metrics- Single Point in Time
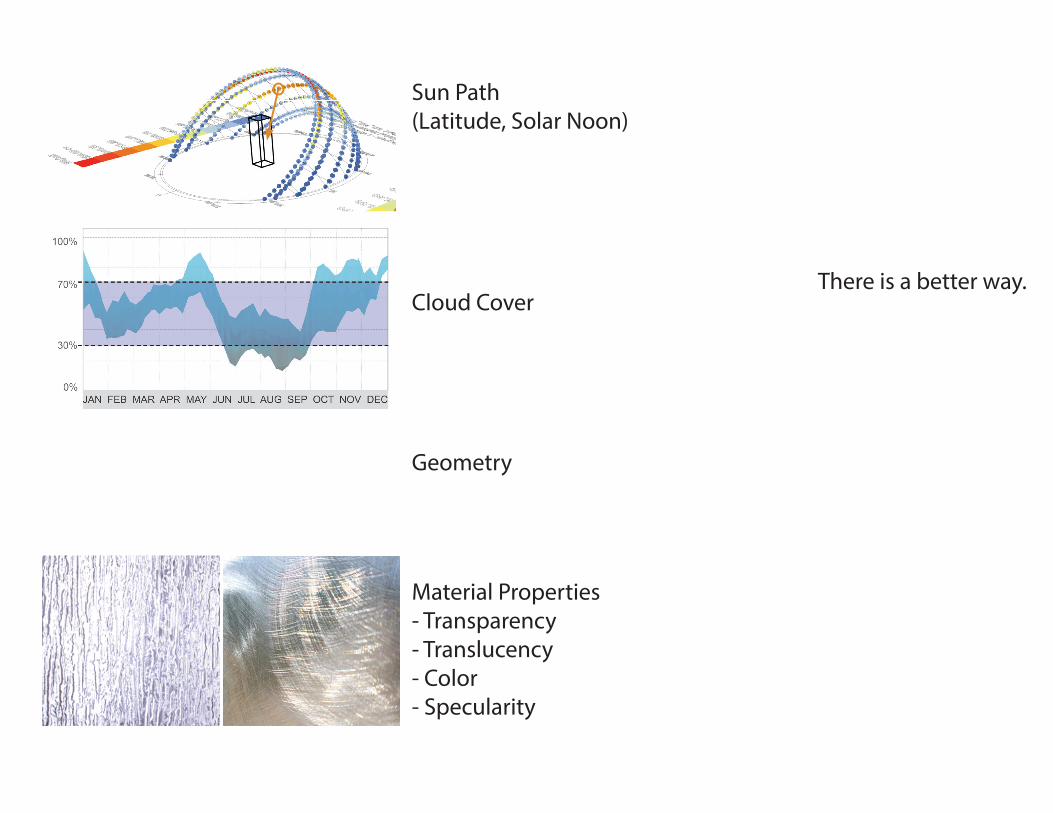
There is a better way.
Sun Path(Latitude, Solar Noon)
Cloud Cover
Geometry
Material Properties- Transparency- Translucency- Color- Specularity
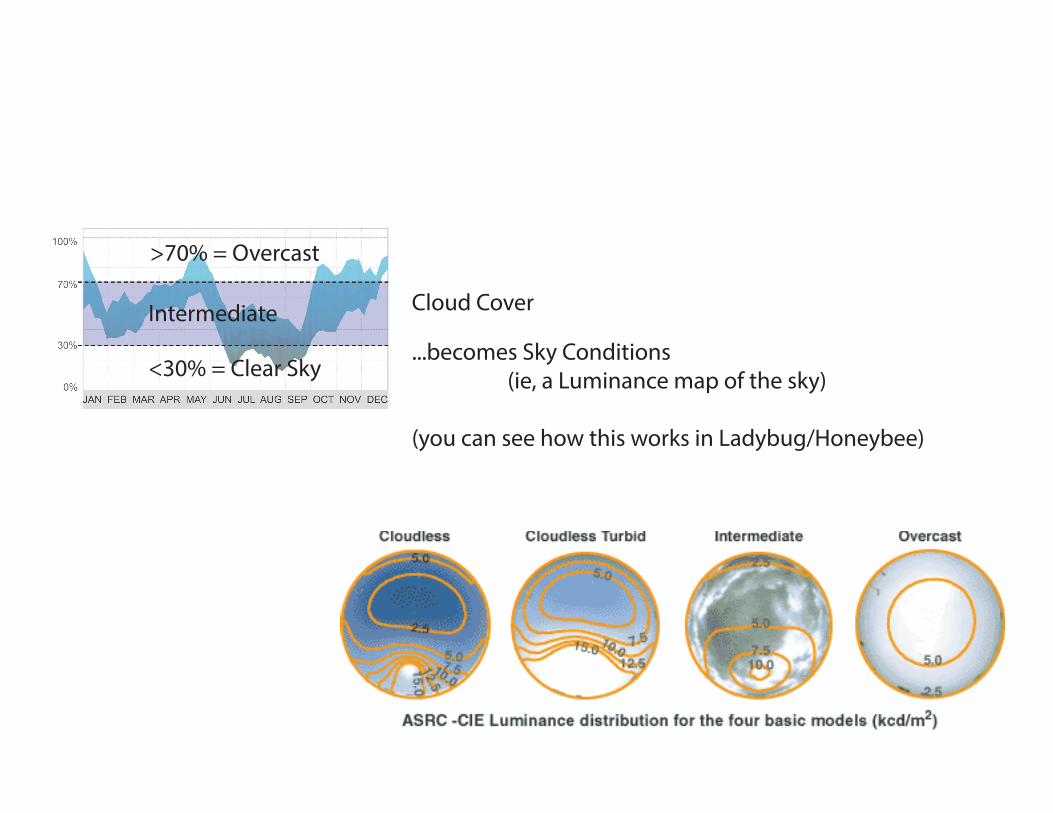
Cloud Cover
...becomes Sky Conditions (ie, a Luminance map of the sky)
(you can see how this works in Ladybug/Honeybee)
>70% = Overcast
Intermediate
<30% = Clear Sky
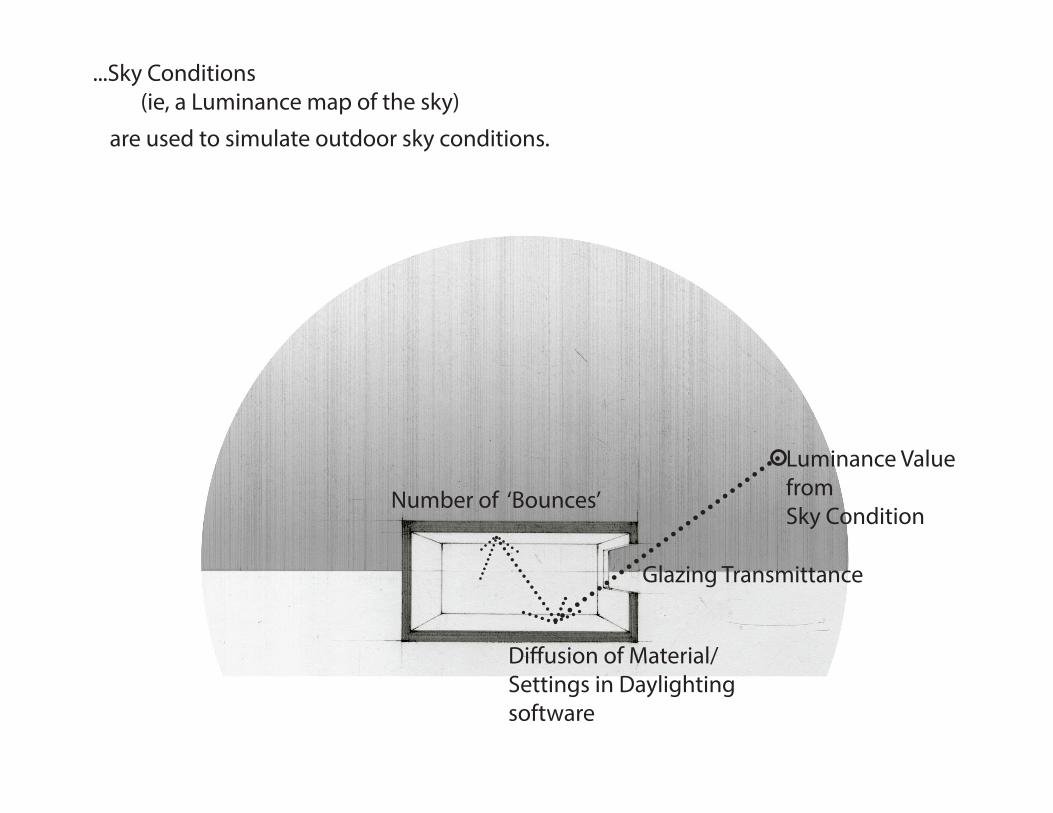
Luminance Value from Sky Condition
Diffusion of Material/ Settings in Daylighting software
Glazing Transmittance
Number of ‘Bounces’
...Sky Conditions (ie, a Luminance map of the sky)
are used to simulate outdoor sky conditions.
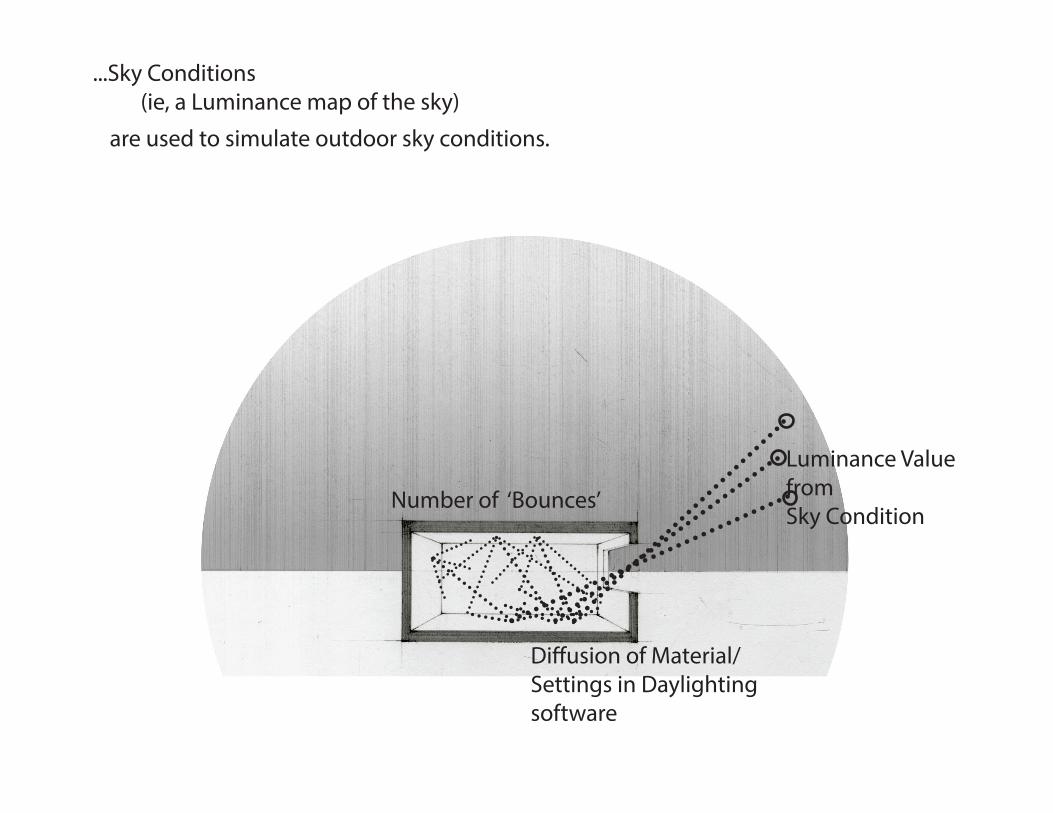
Luminance Value from Sky Condition
Diffusion of Material/ Settings in Daylighting software
Number of ‘Bounces’
...Sky Conditions (ie, a Luminance map of the sky)
are used to simulate outdoor sky conditions.
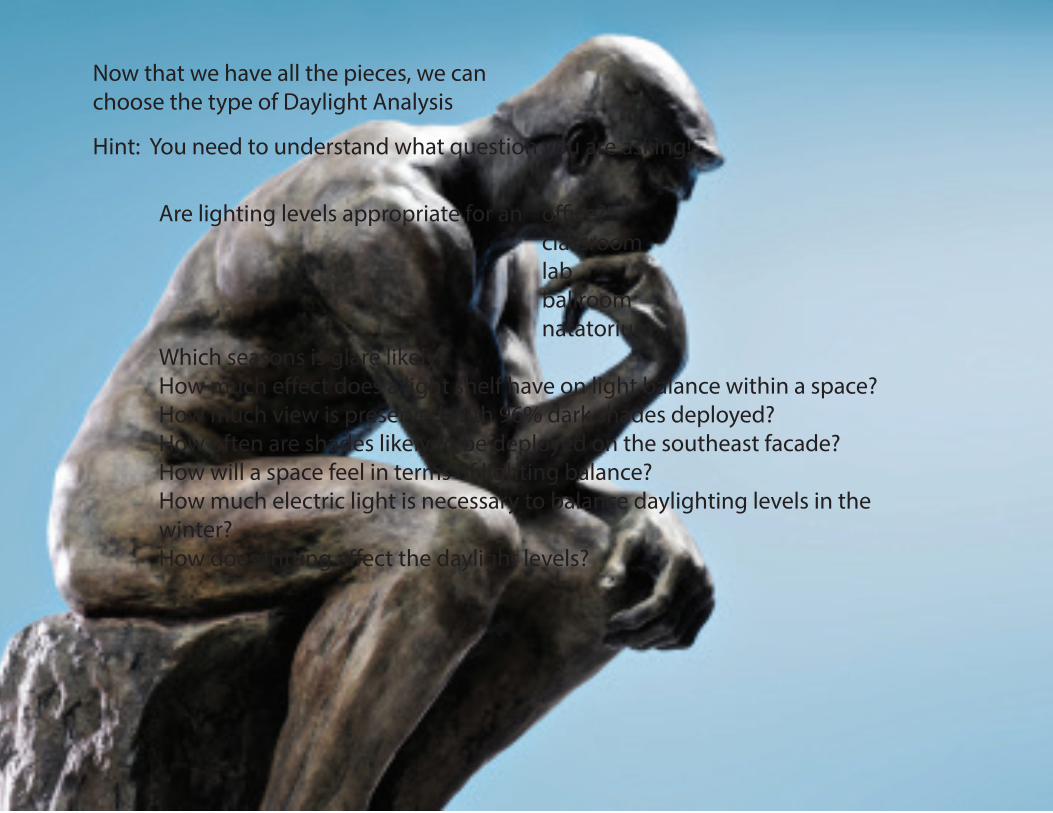
Now that we have all the pieces, we can choose the type of Daylight Analysis
Hint: You need to understand what question you are asking!
Are lighting levels appropriate for an office? classroom lab ballroom natatoriumWhich seasons is glare likely?How much effect does a light shelf have on light balance within a space?How much view is preserved with 96% dark shades deployed?How often are shades likely to be deployed on the southeast facade?How will a space feel in terms of lighting balance?How much electric light is necessary to balance daylighting levels in the winter?How does fritting affect the daylight levels?
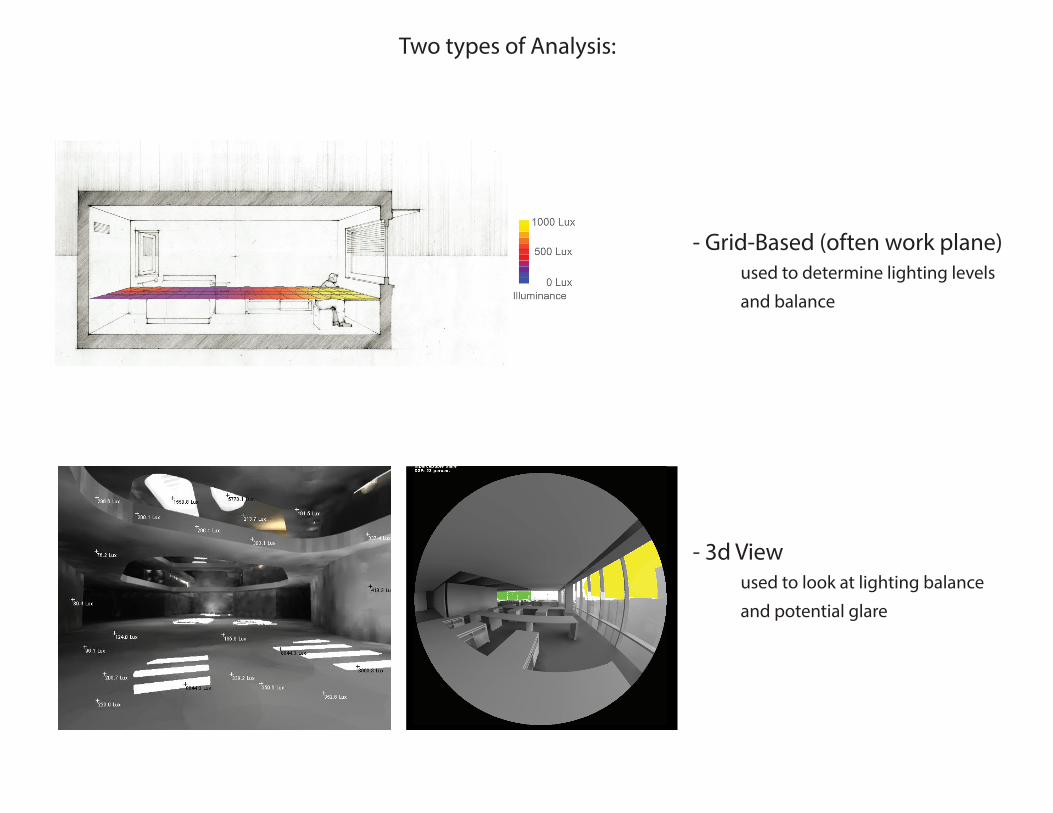
Two types of Analysis:
- Grid-Based (often work plane) used to determine lighting levels
and balance
- 3d View used to look at lighting balance
and potential glare
SUMMER SOLSTICE, 4PM
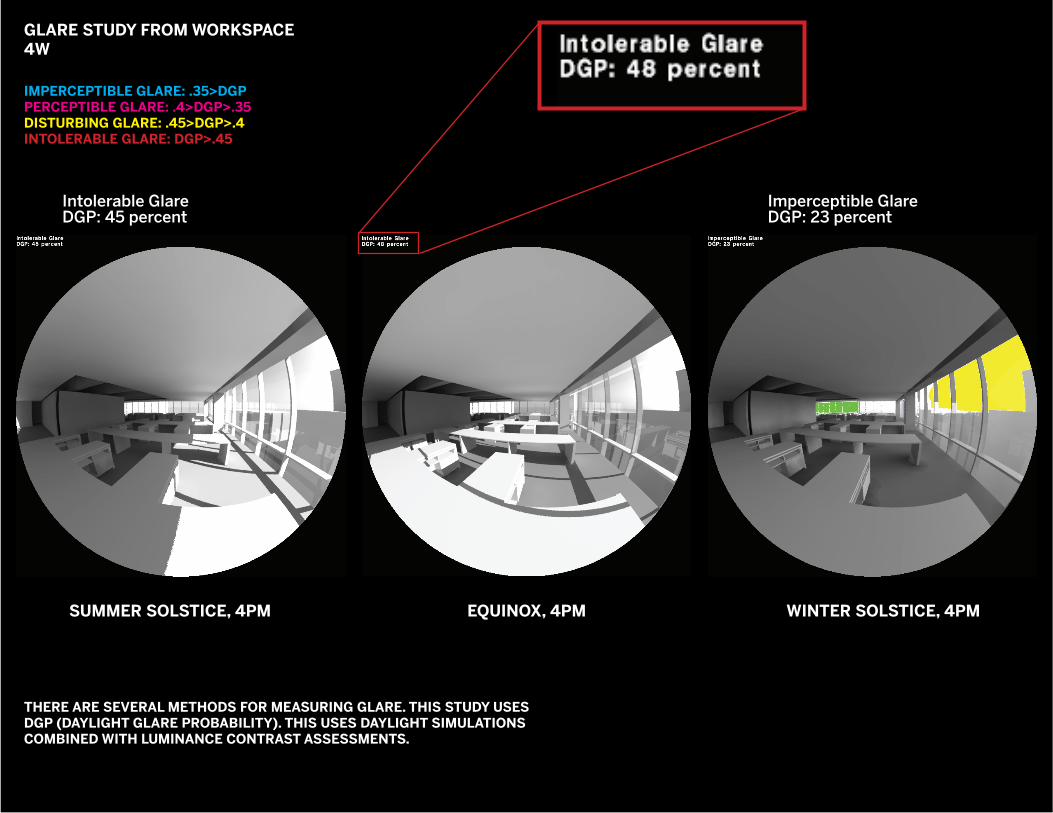
GLARE STUDY FROM WORKSPACE4W
EQUINOX, 4PM WINTER SOLSTICE, 4PM
THERE ARE SEVERAL METHODS FOR MEASURING GLARE. THIS STUDY USESDGP (DAYLIGHT GLARE PROBABILITY). THIS USES DAYLIGHT SIMULATIONSCOMBINED WITH LUMINANCE CONTRAST ASSESSMENTS.
IMPERCEPTIBLE GLARE: .35>DGPPERCEPTIBLE GLARE: .4>DGP>.35DISTURBING GLARE: .45>DGP>.4INTOLERABLE GLARE: DGP>.45
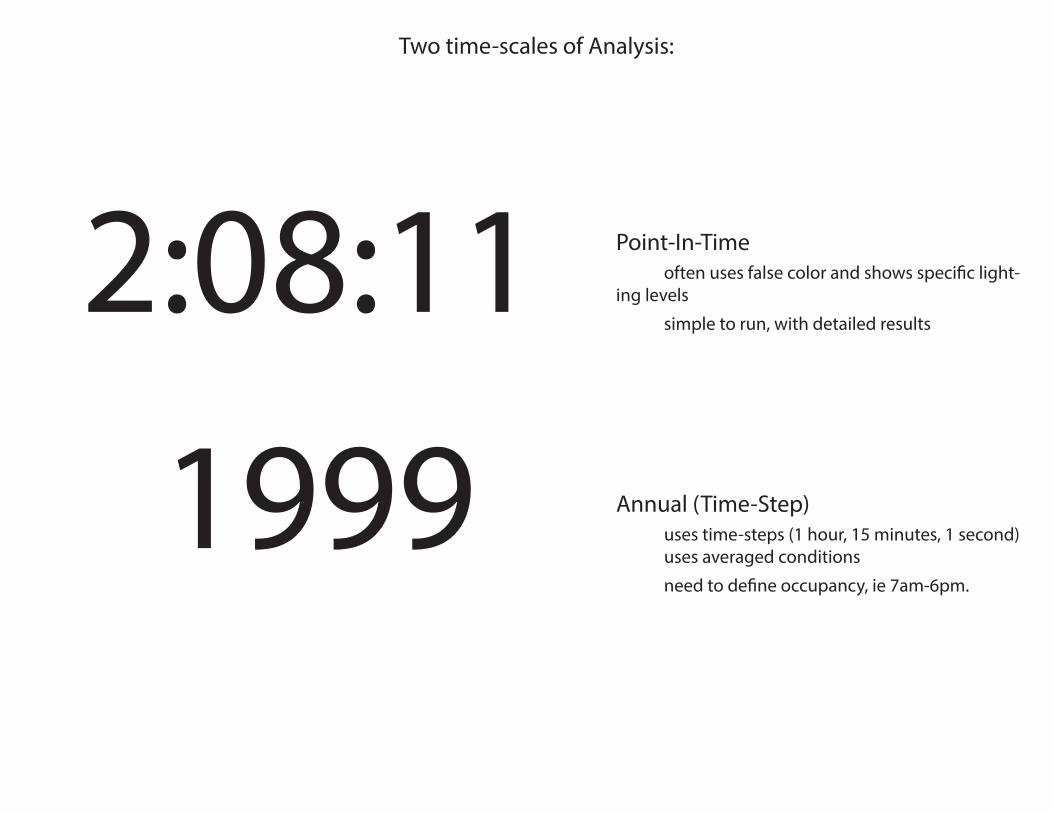
Two time-scales of Analysis:
Point-In-Time often uses false color and shows specific light-ing levels
simple to run, with detailed results2:08:11
1999 Annual (Time-Step) uses time-steps (1 hour, 15 minutes, 1 second) uses averaged conditions
need to define occupancy, ie 7am-6pm.
4th Floor
5th Floorlower height improves light shelf performance but reduces visibility
larger depth improves light shelf performance but reduces visibility
6’-8”
2’-6”
LIGHT SHELF MOCKUP
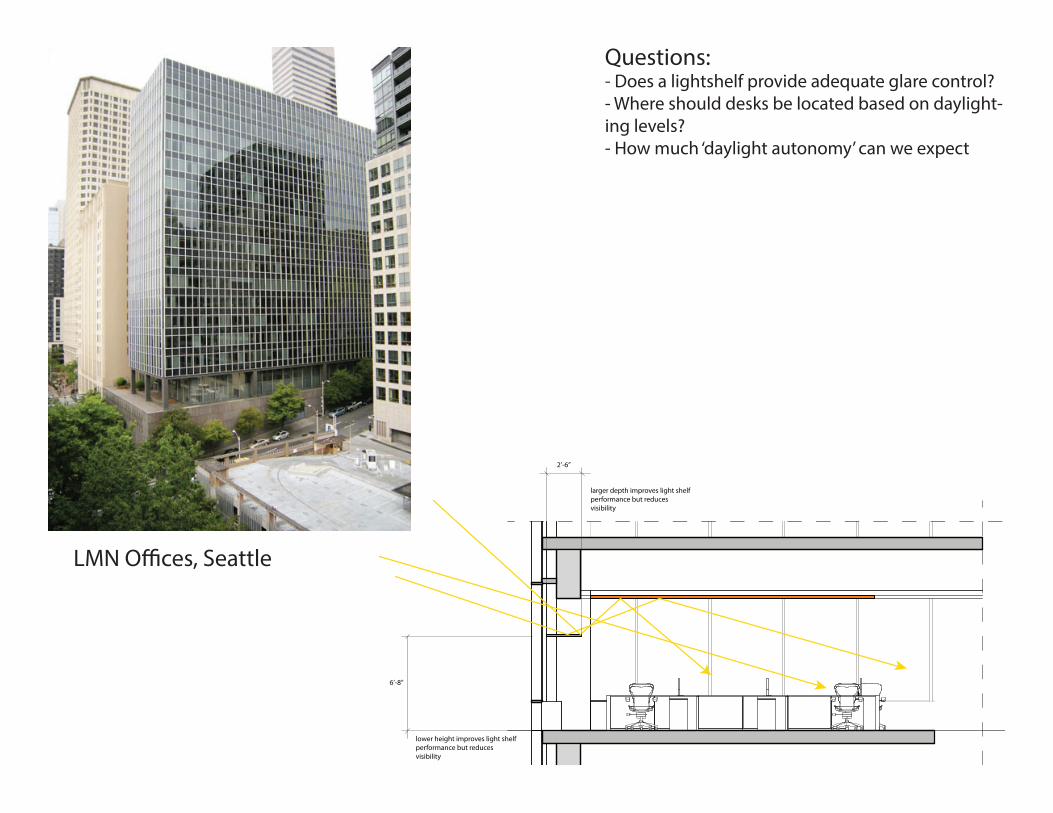
LMN Offices, Seattle
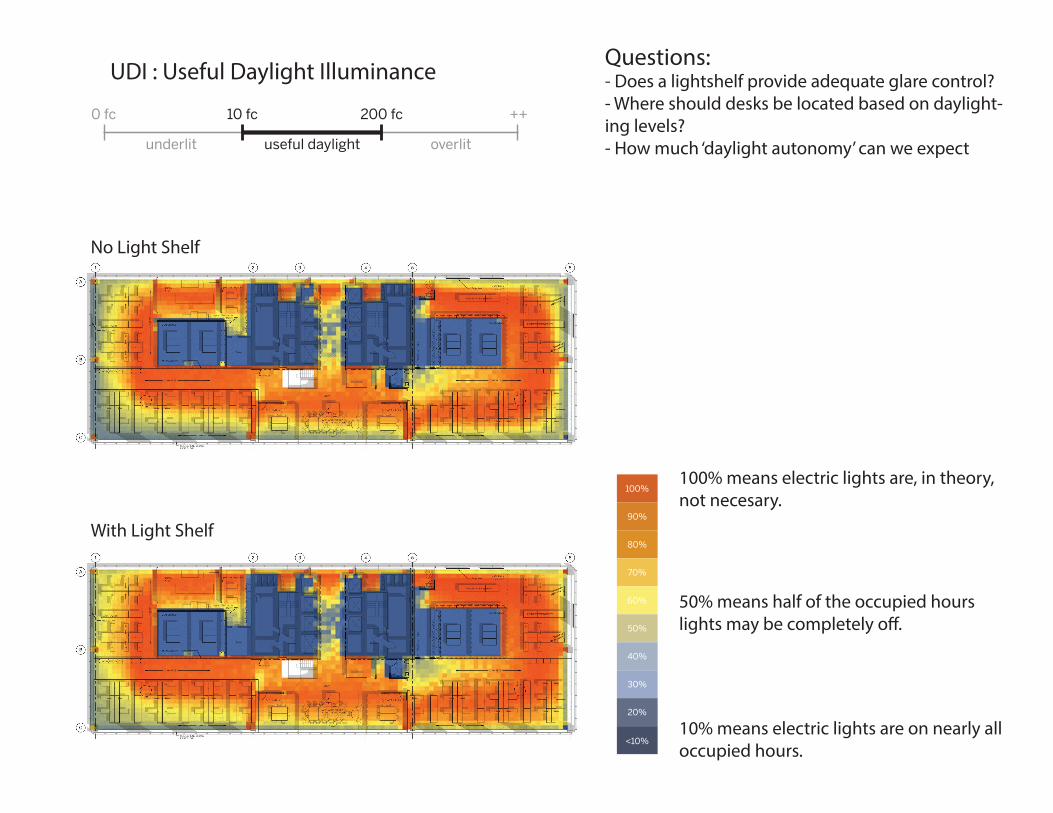
Questions:- Does a lightshelf provide adequate glare control?- Where should desks be located based on daylight-ing levels?- How much ‘daylight autonomy’ can we expect
USEFUL DAYLIGHT ILLUMINATION (UDI): DAYLIGHTING ILLUMINANCE >10fc and <200fc% OF OCCUPIED HOURS FOR THE YEAR
100%
60%
90%
50%
80%
40%
70%
30%
20%
<10%
FULL FLOOR PLANUSEFUL DAYLIGHT INDEXWITHOUT LIGHT SHELF
underlit useful daylight
10 fc0 fc 200 fc ++
overlit
USEFUL DAYLIGHT ILLUMINATION (UDI): DAYLIGHTING ILLUMINANCE >10fc and <200fc% OF OCCUPIED HOURS FOR THE YEAR
100%
60%
90%
50%
80%
40%
70%
30%
20%
<10%
FULL FLOOR PLANUSEFUL DAYLIGHT INDEXWITHOUT LIGHT SHELF
underlit useful daylight
10 fc0 fc 200 fc ++
overlit
USEFUL DAYLIGHT ILLUMINATION (UDI): DAYLIGHTING ILLUMINANCE >10fc and <200fc% OF OCCUPIED HOURS FOR THE YEAR
100%
60%
90%
50%
80%
40%
70%
30%
20%
<10%
WITH LIGHT SHELF (30” DEEP, 6’-8” FROM FLOOR)
FULL FLOOR PLANUSEFUL DAYLIGHT INDEX
underlit useful daylight
10 fc0 fc 200 fc ++
overlit
USEFUL DAYLIGHT ILLUMINATION (UDI): DAYLIGHTING ILLUMINANCE >10fc and <200fc% OF OCCUPIED HOURS FOR THE YEAR
100%
60%
90%
50%
80%
40%
70%
30%
20%
<10%
WITH LIGHT SHELF (30” DEEP, 6’-8” FROM FLOOR)
FULL FLOOR PLANUSEFUL DAYLIGHT INDEX
underlit useful daylight
10 fc0 fc 200 fc ++
overlit
100% means electric lights are, in theory, not necesary.
No Light Shelf
With Light Shelf
50% means half of the occupied hours lights may be completely off.
10% means electric lights are on nearly all occupied hours.
Questions:- Does a lightshelf provide adequate glare control?- Where should desks be located based on daylight-ing levels?- How much ‘daylight autonomy’ can we expect
UDI : Useful Daylight Illuminance
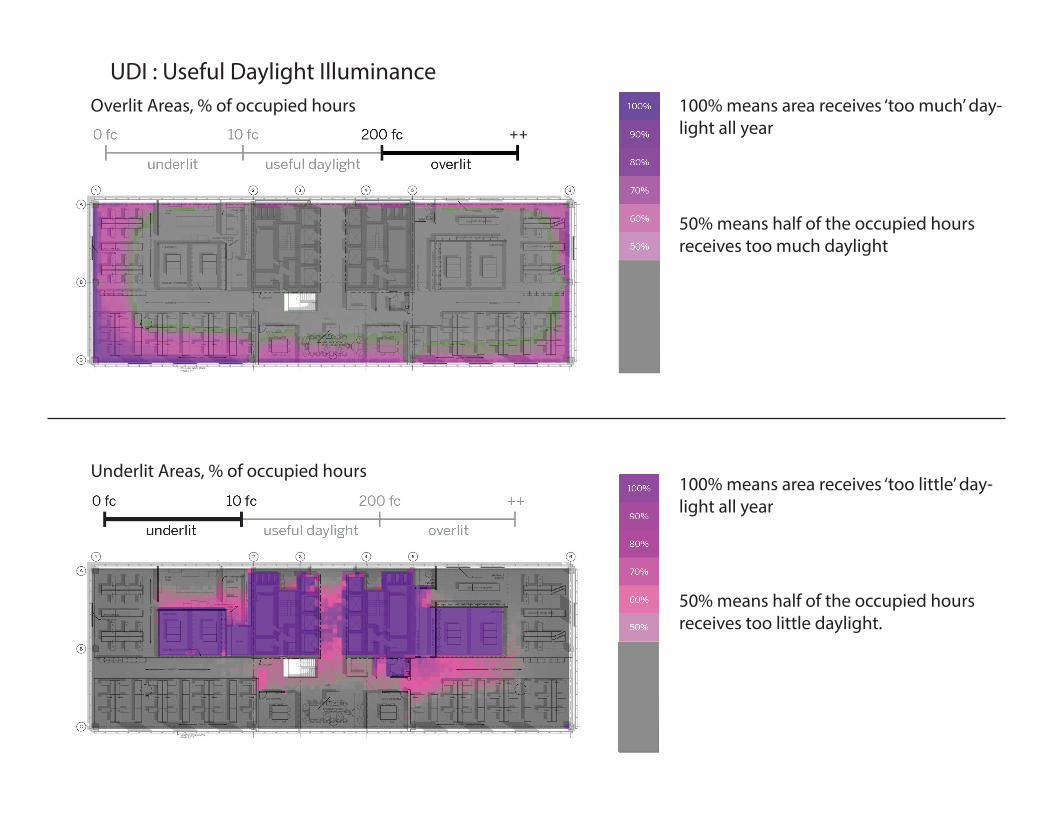
100% means area receives ‘too much’ day-light all year
100% means area receives ‘too little’ day-light all year
50% means half of the occupied hours receives too much daylight
50% means half of the occupied hours receives too little daylight.
UDI : Useful Daylight Illuminance
Underlit Areas, % of occupied hours
Overlit Areas, % of occupied hours
USEFUL DAYLIGHT ILLUMINATION (UDI): DAYLIGHTING ILLUMINANCE >10fc and <200fc% OF OCCUPIED HOURS FOR THE YEAR
100%
60%
90%
50%
80%
40%
70%
30%
20%
<10%
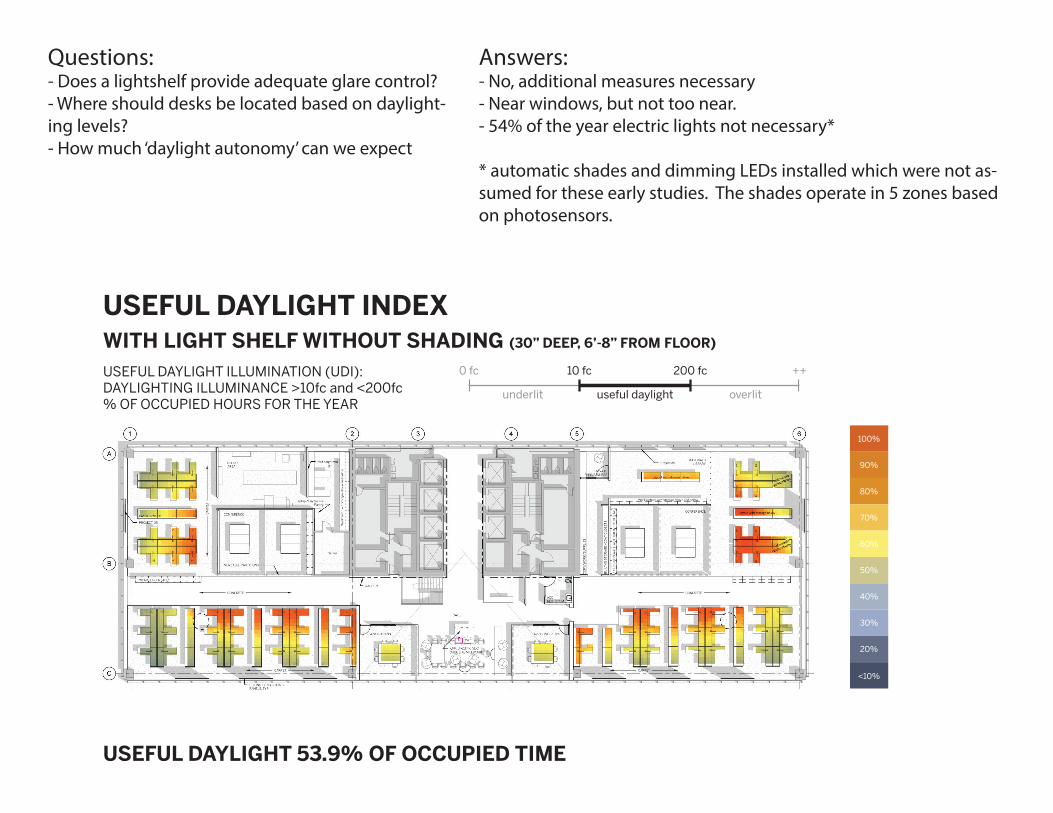
WITH LIGHT SHELF WITHOUT SHADING (30” DEEP, 6’-8” FROM FLOOR)
WORKSPACE AREASUSEFUL DAYLIGHT INDEX
underlit useful daylight
10 fc0 fc 200 fc ++
overlit
USEFUL DAYLIGHT 53.9% OF OCCUPIED TIME12.5% IMPROVEMENT. THE COMBINATION OF A LIGHT SHELF WITH DYNAMIC SHADING WILL INCREASE THESE SAVINGS SIGNIFICANTLY.
Questions:- Does a lightshelf provide adequate glare control?- Where should desks be located based on daylight-ing levels?- How much ‘daylight autonomy’ can we expect
Answers:- No, additional measures necessary- Near windows, but not too near.- 54% of the year electric lights not necessary*
* automatic shades and dimming LEDs installed which were not as-sumed for these early studies. The shades operate in 5 zones based on photosensors.
SUMMER SOLSTICE, 4PM
GLARE STUDY FROM WORKSPACE4W
EQUINOX, 4PM WINTER SOLSTICE, 4PM
THERE ARE SEVERAL METHODS FOR MEASURING GLARE. THIS STUDY USESDGP (DAYLIGHT GLARE PROBABILITY). THIS USES DAYLIGHT SIMULATIONSCOMBINED WITH LUMINANCE CONTRAST ASSESSMENTS.
IMPERCEPTIBLE GLARE: .35>DGPPERCEPTIBLE GLARE: .4>DGP>.35DISTURBING GLARE: .45>DGP>.4INTOLERABLE GLARE: DGP>.45
Intolerable GlareDGP: 45 percent
Imperceptible GlareDGP: 23 percent
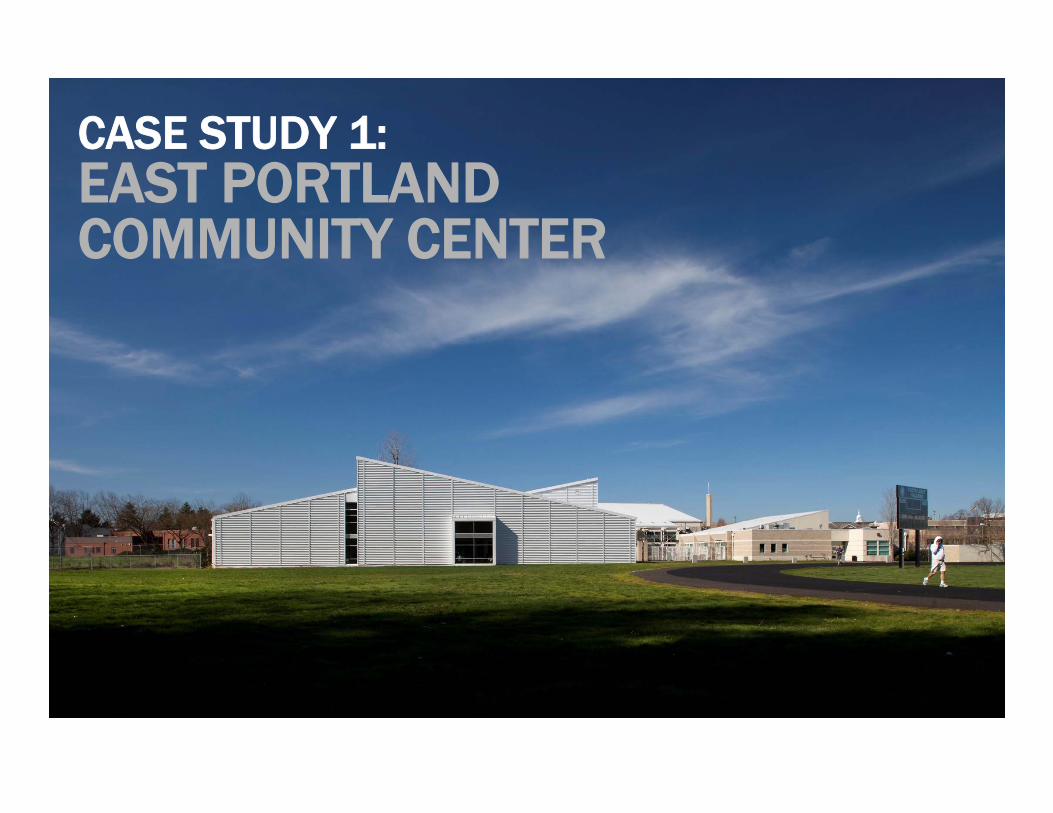
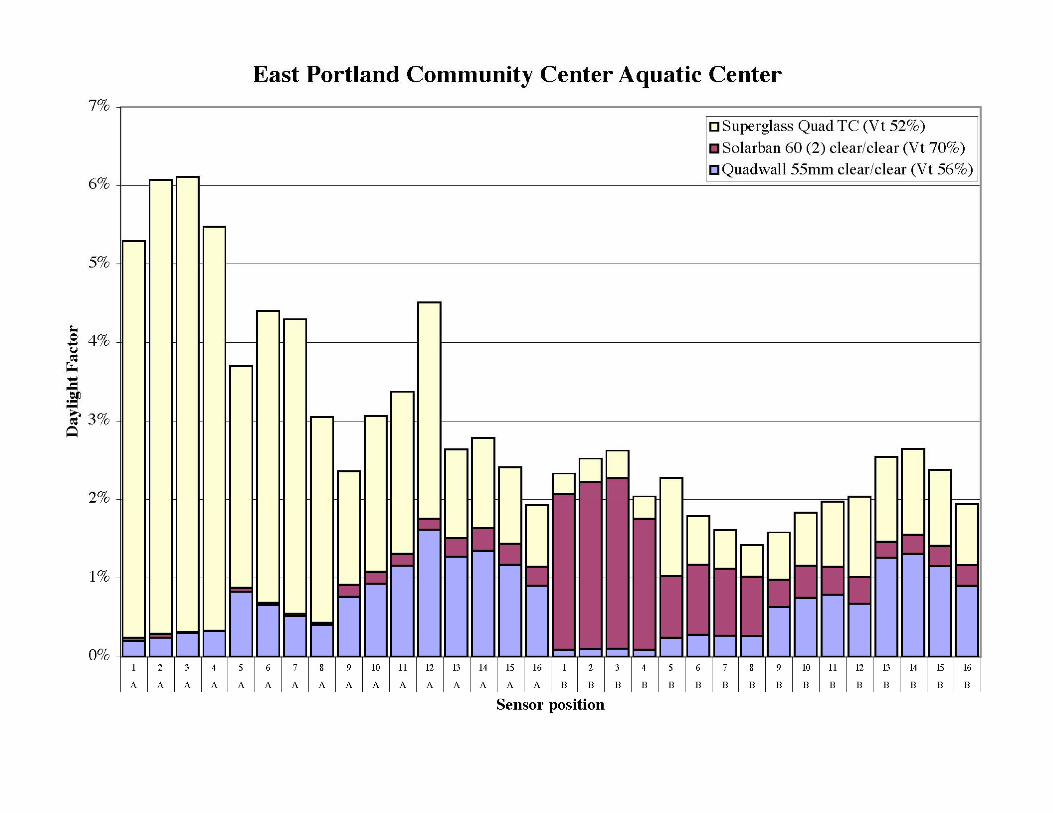
CASE STUDY 1:EAST PORTLANDCOMMUNITY CENTER
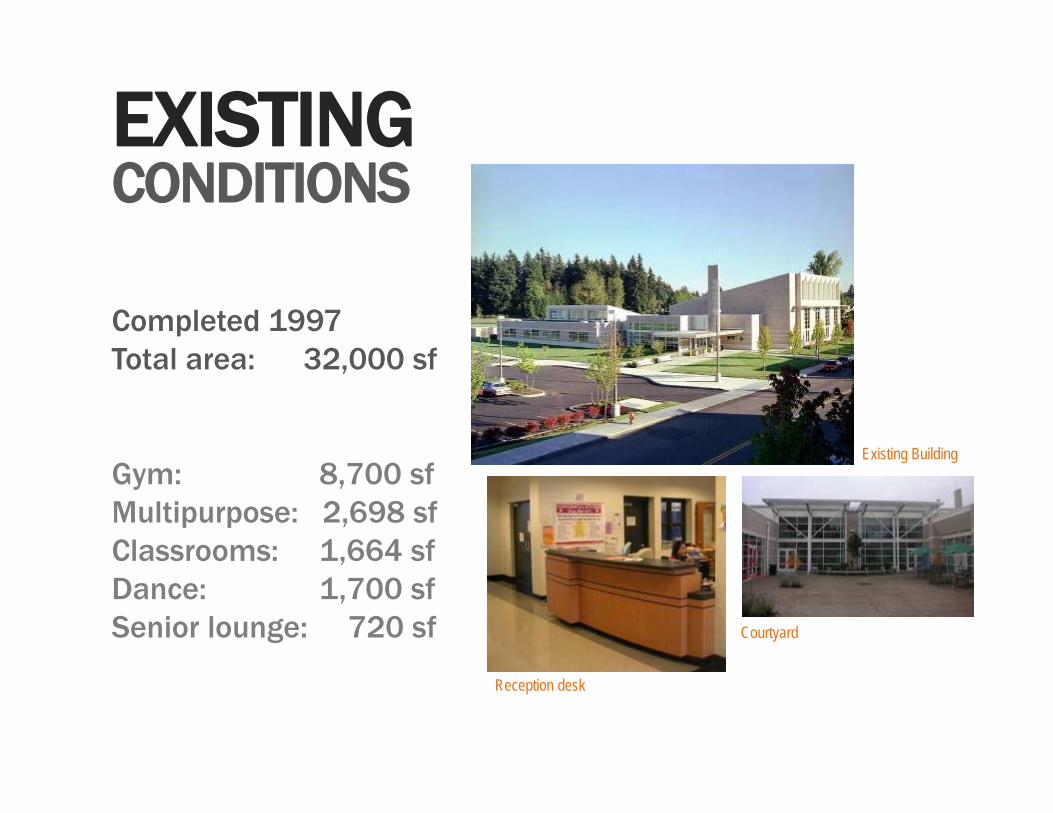
Completed 1997Total area: 32,000 sf
Gym: 8,700 sfMultipurpose: 2,698 sfClassrooms: 1,664 sfDance: 1,700 sfSenior lounge: 720 sf
Existing Building
Reception desk
Courtyard
EXISTINGCONDITIONS
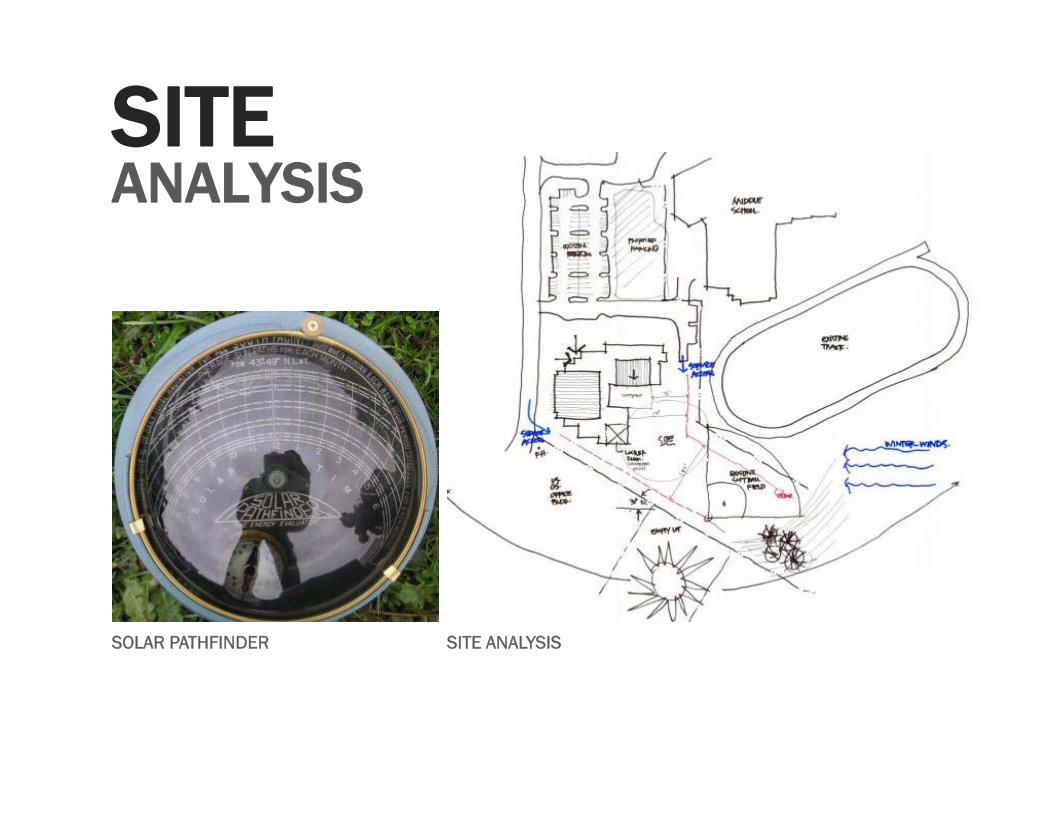
SOLAR PATHFINDER SITE ANALYSIS
SITEANALYSIS
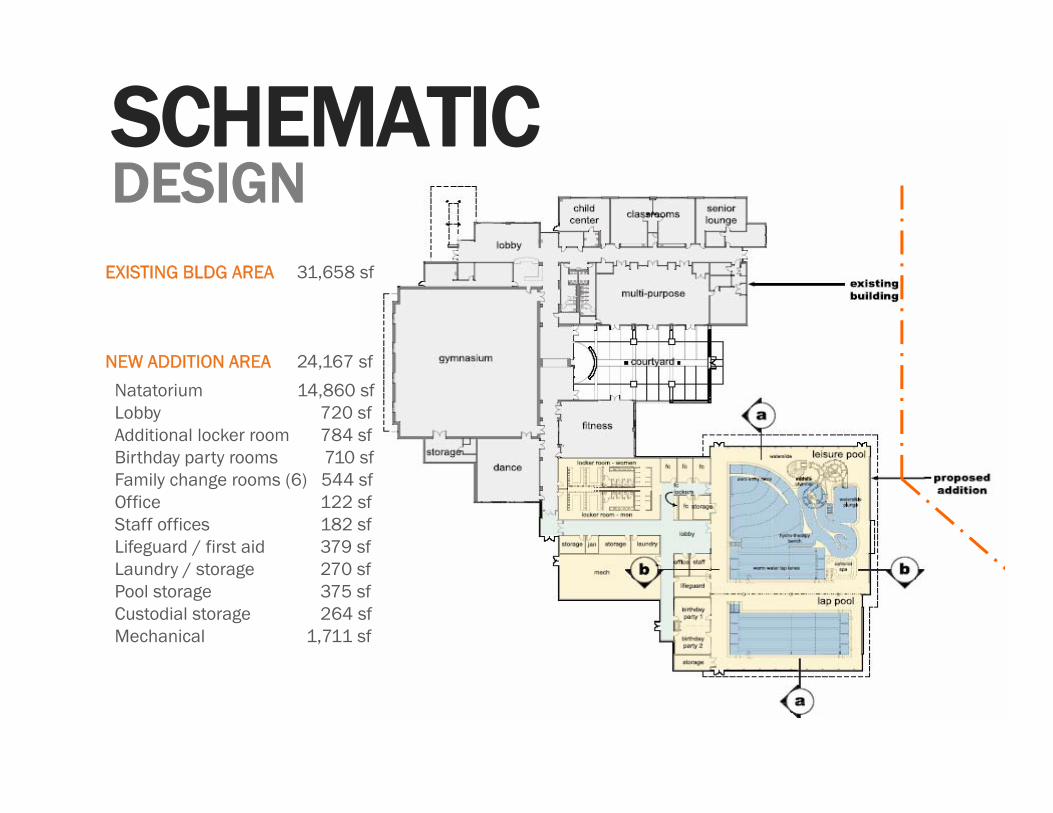
EXISTING BLDG AREA 31,658 sf
NEW ADDITION AREA 24,167 sf
Natatorium 14,860 sfLobby 720 sfAdditional locker room 784 sfBirthday party rooms 710 sfFamily change rooms (6) 544 sfOffice 122 sfStaff offices 182 sfLifeguard / first aid 379 sfLaundry / storage 270 sfPool storage 375 sfCustodial storage 264 sfMechanical 1,711 sf
SCHEMATICDESIGN
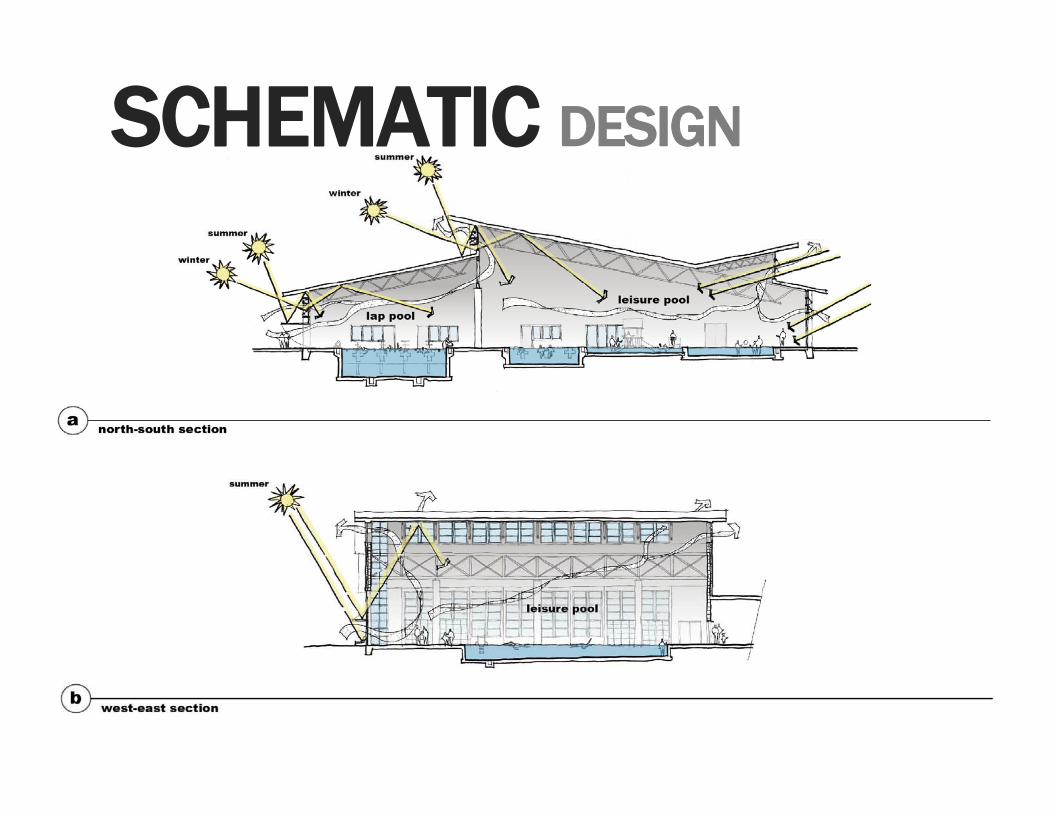
SCHEMATIC DESIGN
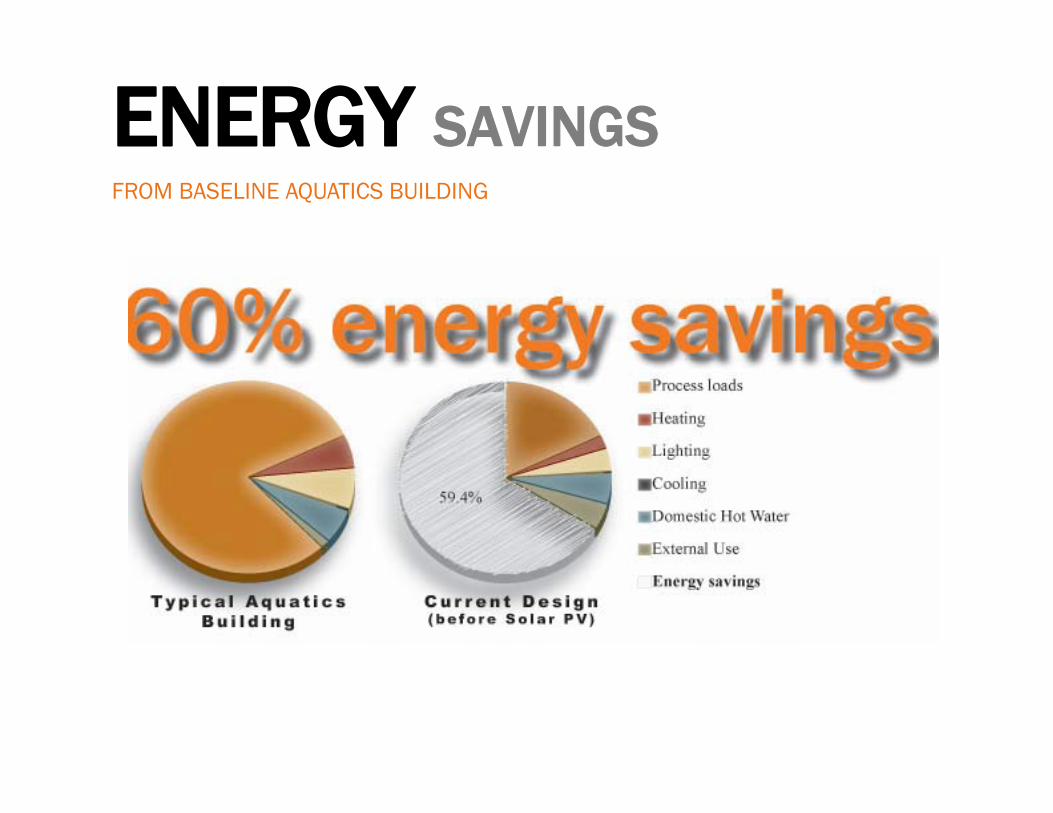
ENERGY SAVINGS
59.4%
FROM BASELINE AQUATICS BUILDING
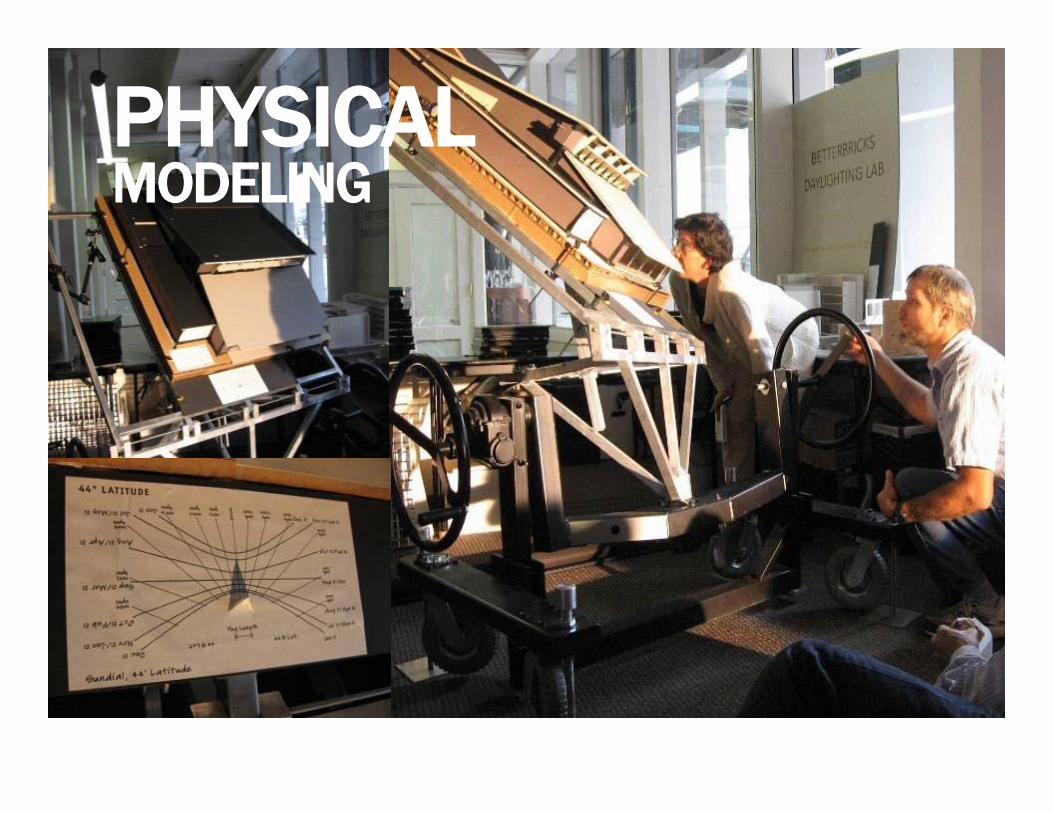
PHYSICALMODELING
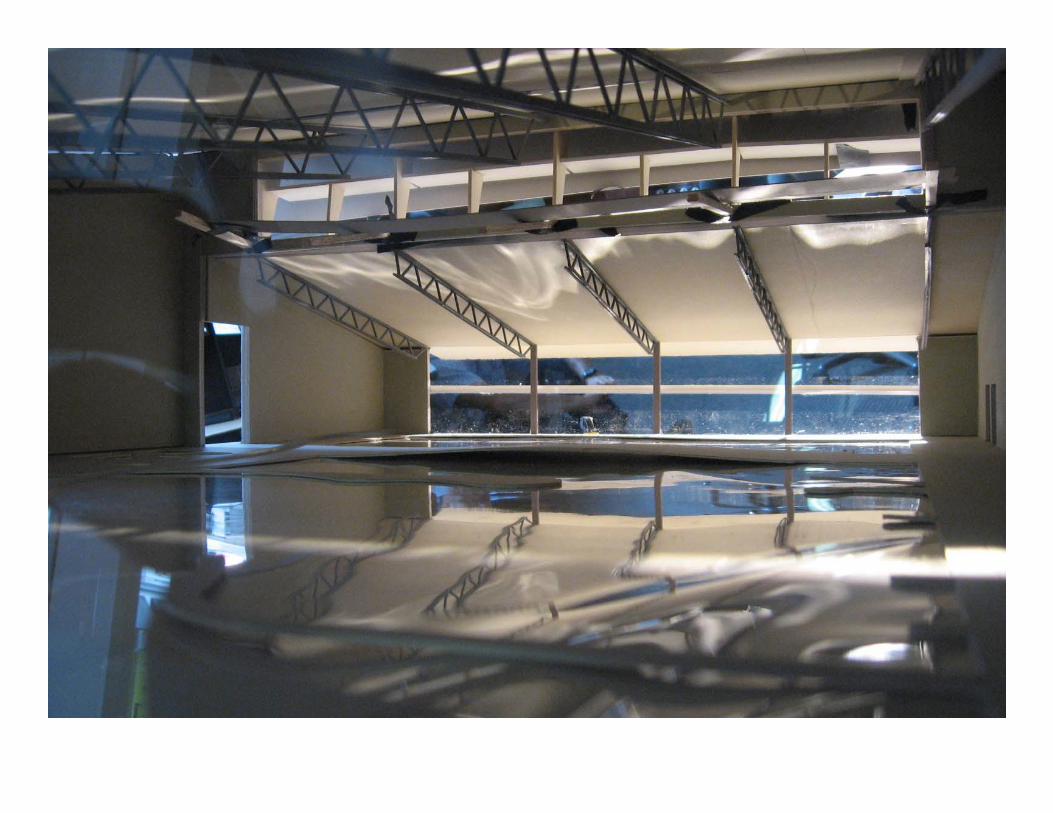
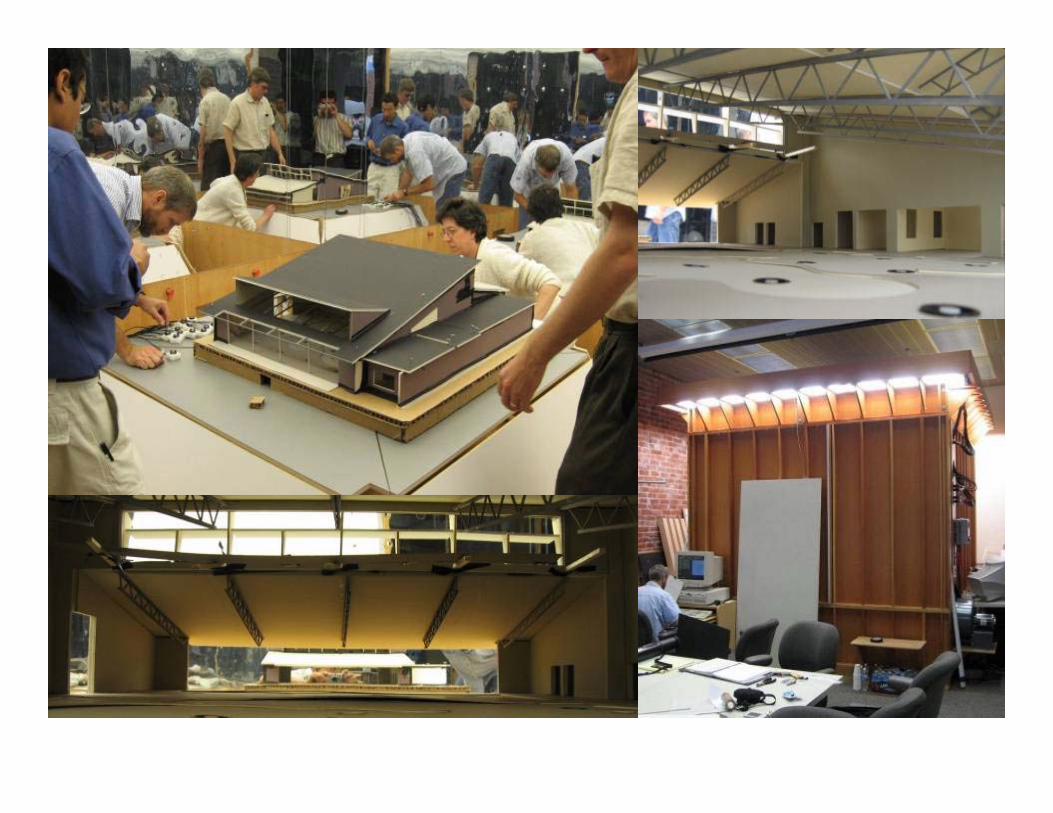
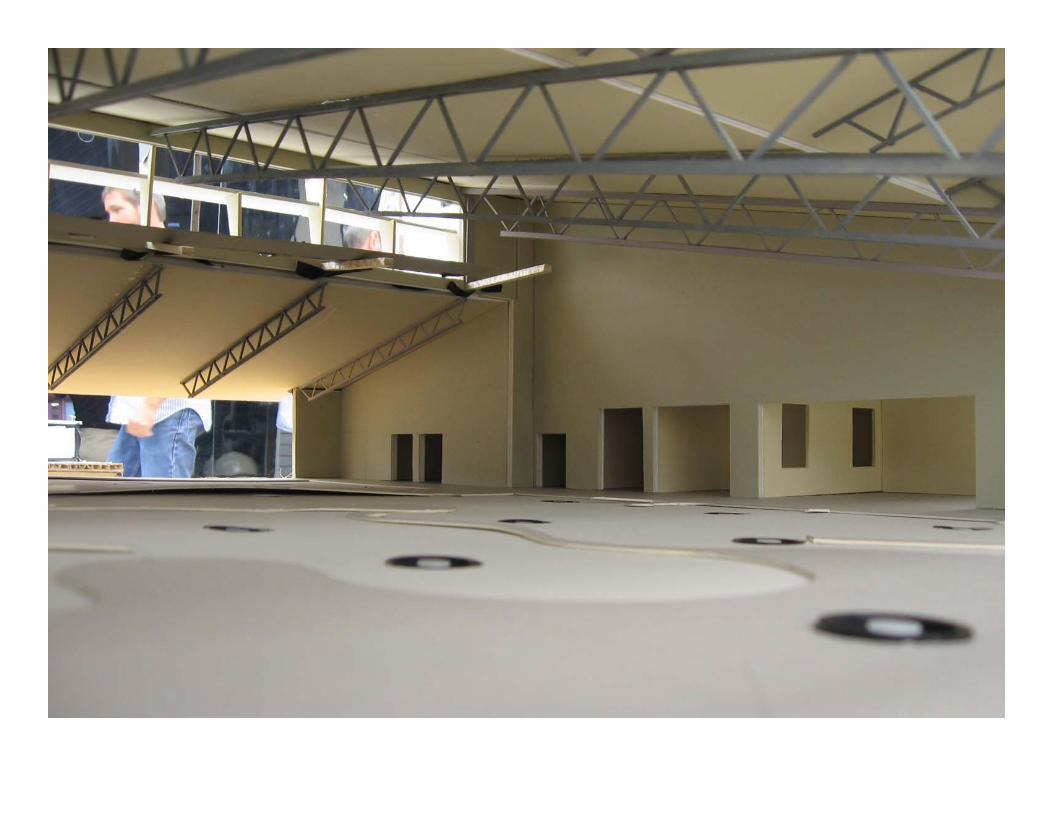
DESIGNDEVELOPMENT
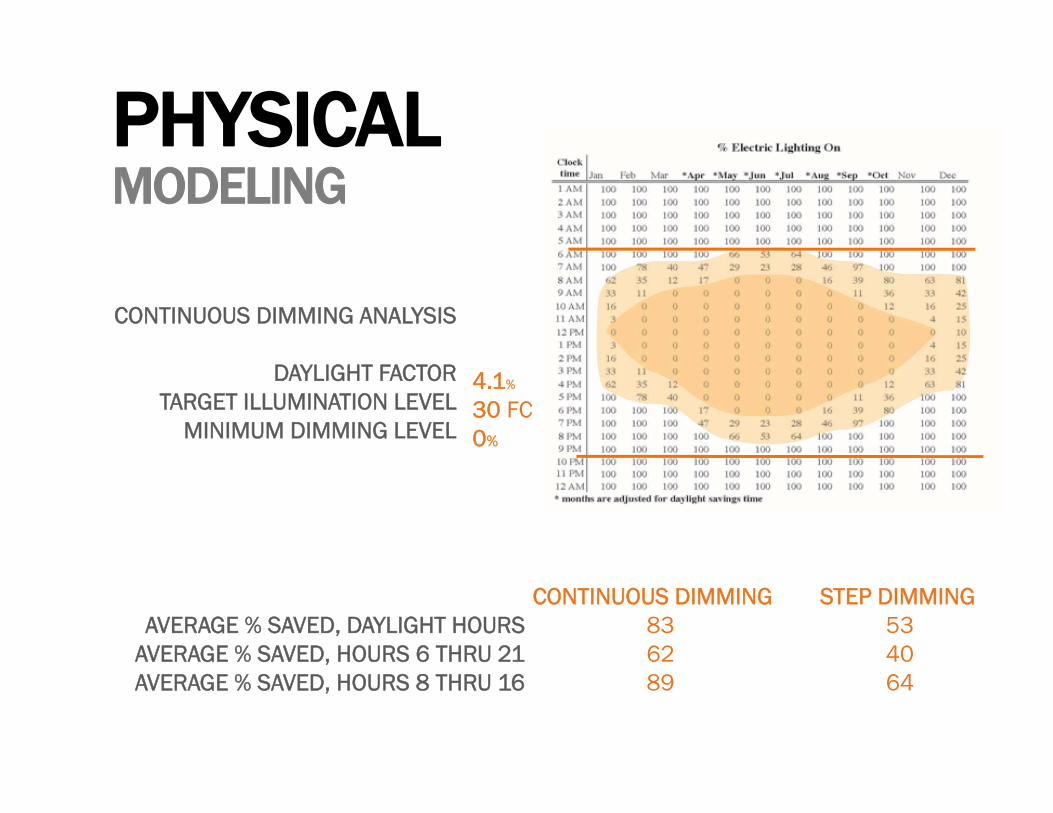
PHYSICALMODELING
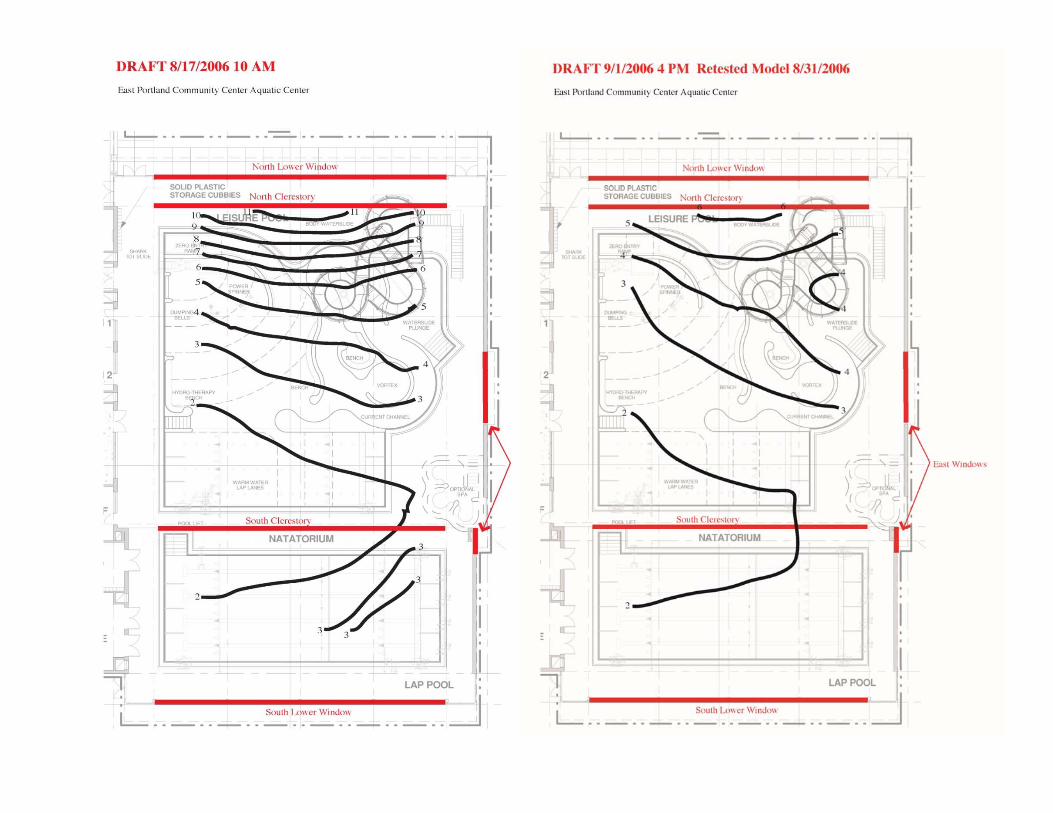
CONTINUOUS DIMMING ANALYSIS
DAYLIGHT FACTORTARGET ILLUMINATION LEVEL
MINIMUM DIMMING LEVEL
4.1%
30 FC0%
AVERAGE % SAVED, DAYLIGHT HOURSAVERAGE % SAVED, HOURS 6 THRU 21AVERAGE % SAVED, HOURS 8 THRU 16
CONTINUOUS DIMMING STEP DIMMING83 5362 4089 64
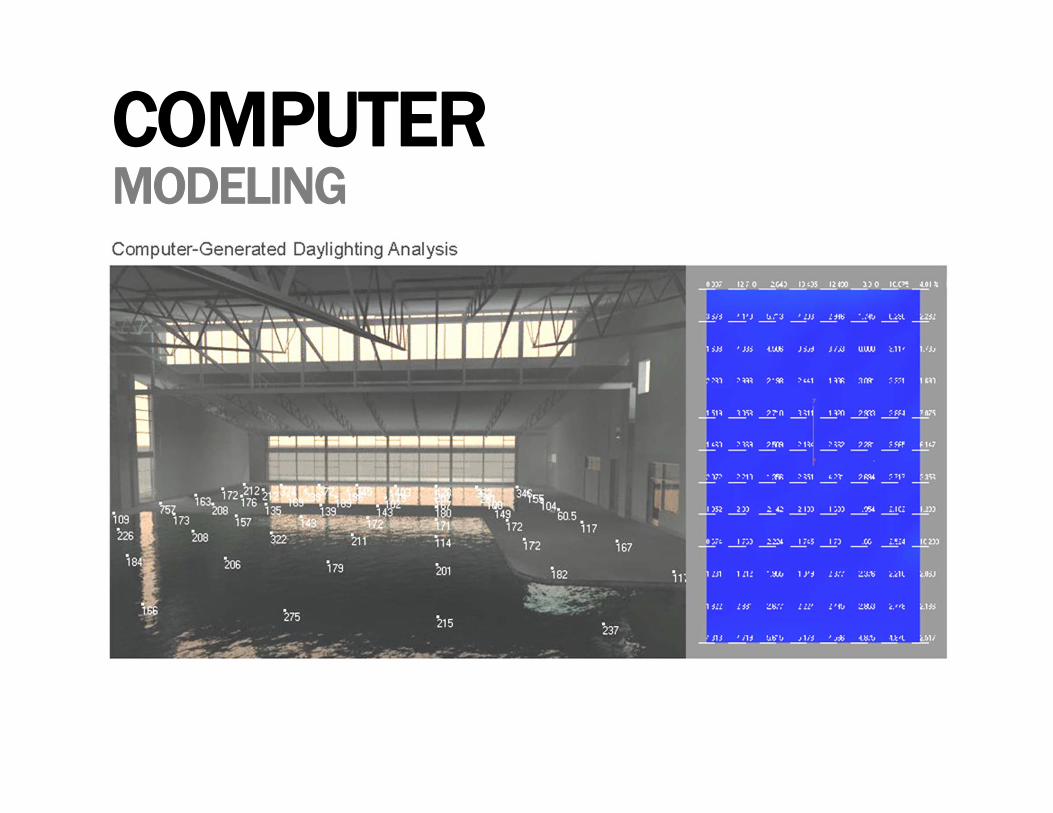
COMPUTERMODELING
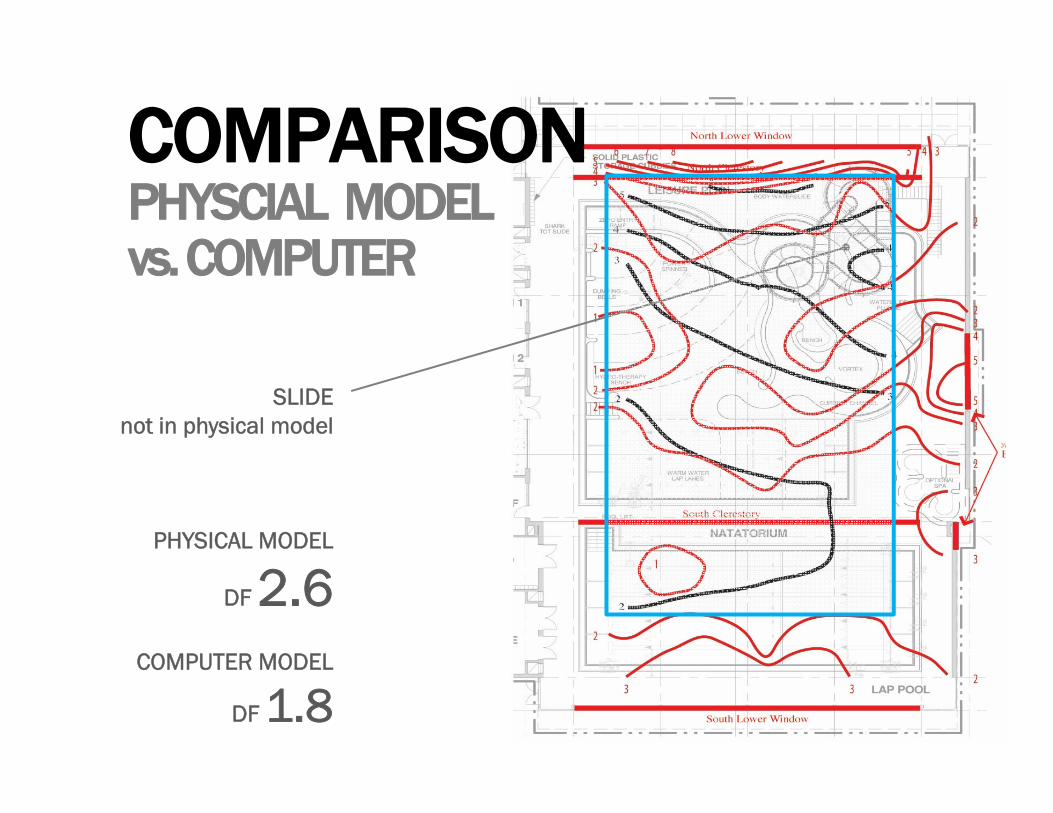
SLIDEnot in physical model
PHYSICAL MODEL
DF 2.6COMPUTER MODEL
DF 1.8
COMPARISONPHYSCIAL MODEL vs. COMPUTER
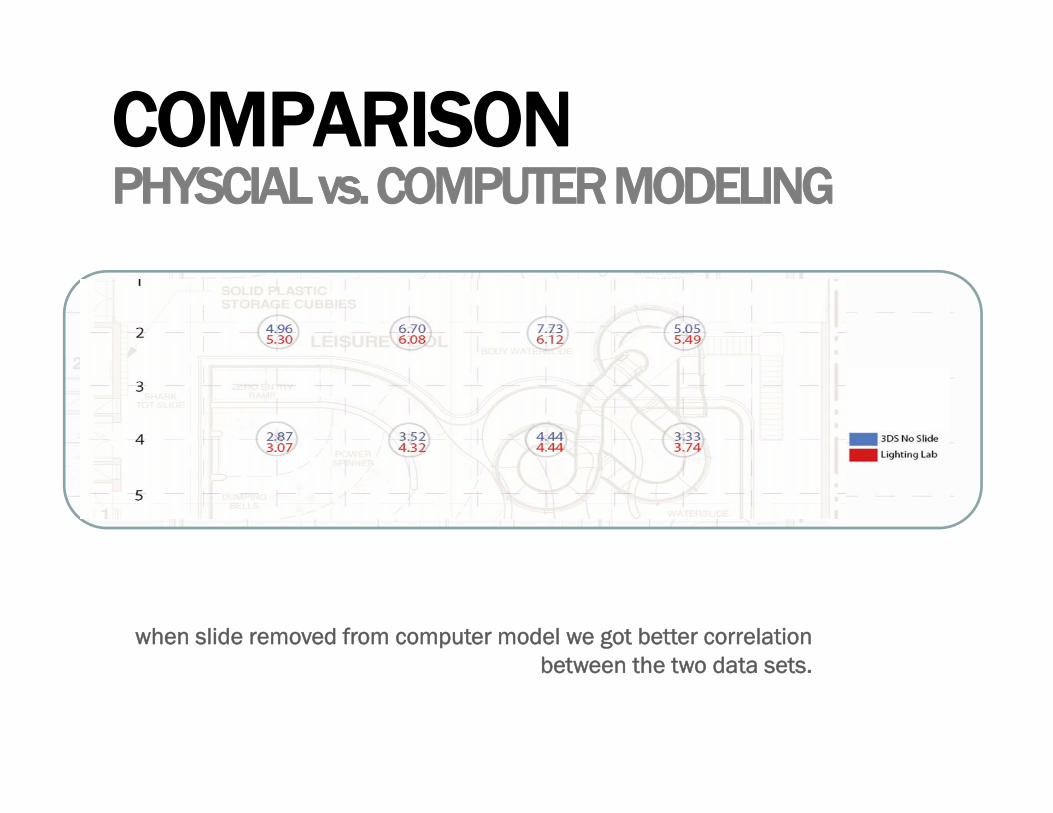
COMPARISONPHYSCIAL vs. COMPUTER MODELING
when slide removed from computer model we got better correlation between the two data sets.
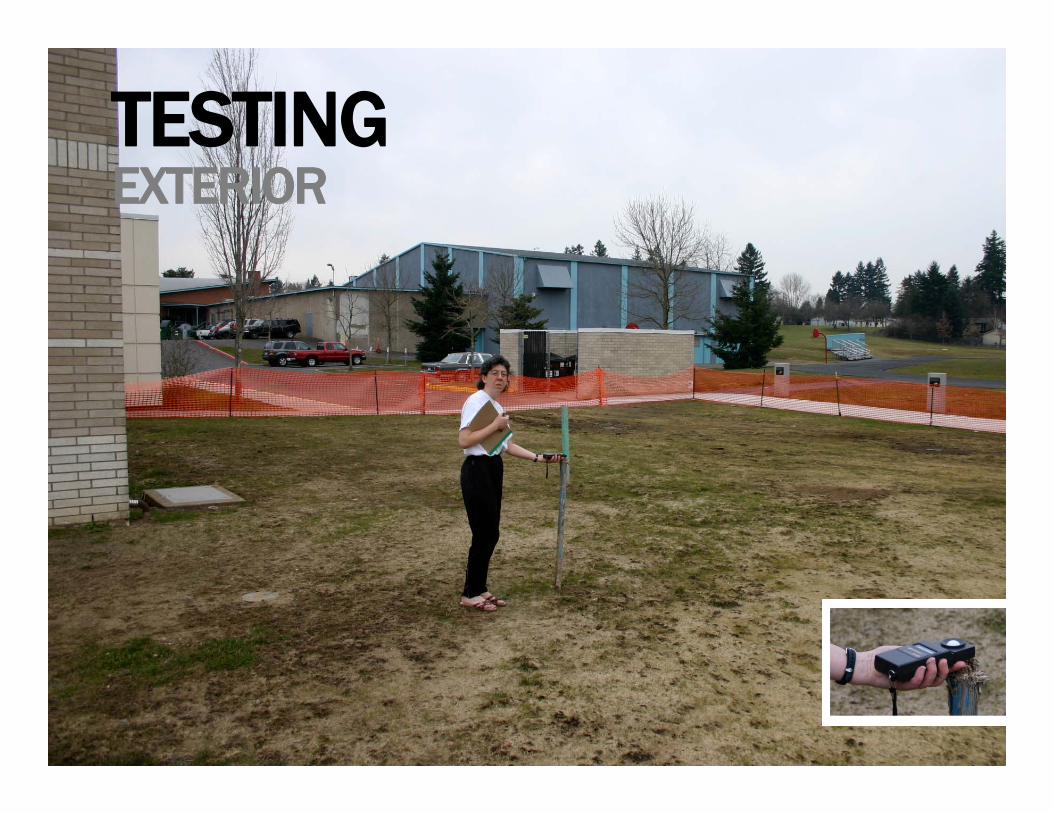
TESTINGEXTERIOR
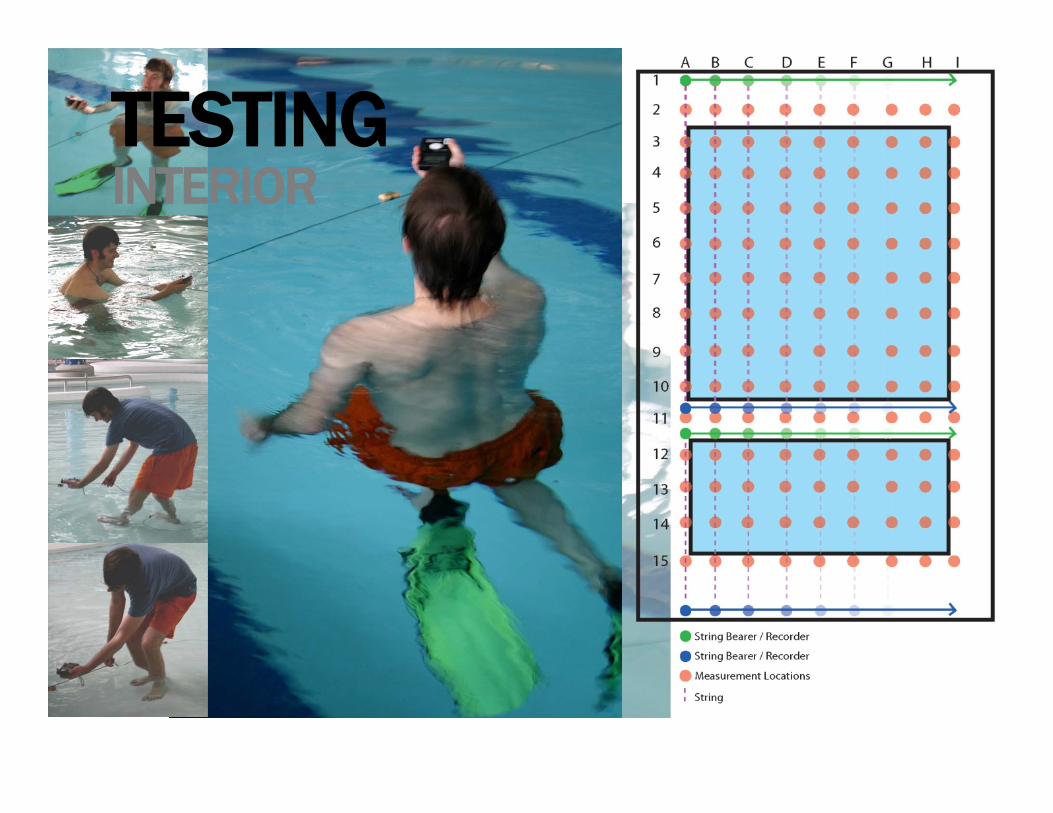
TESTINGINTERIOR
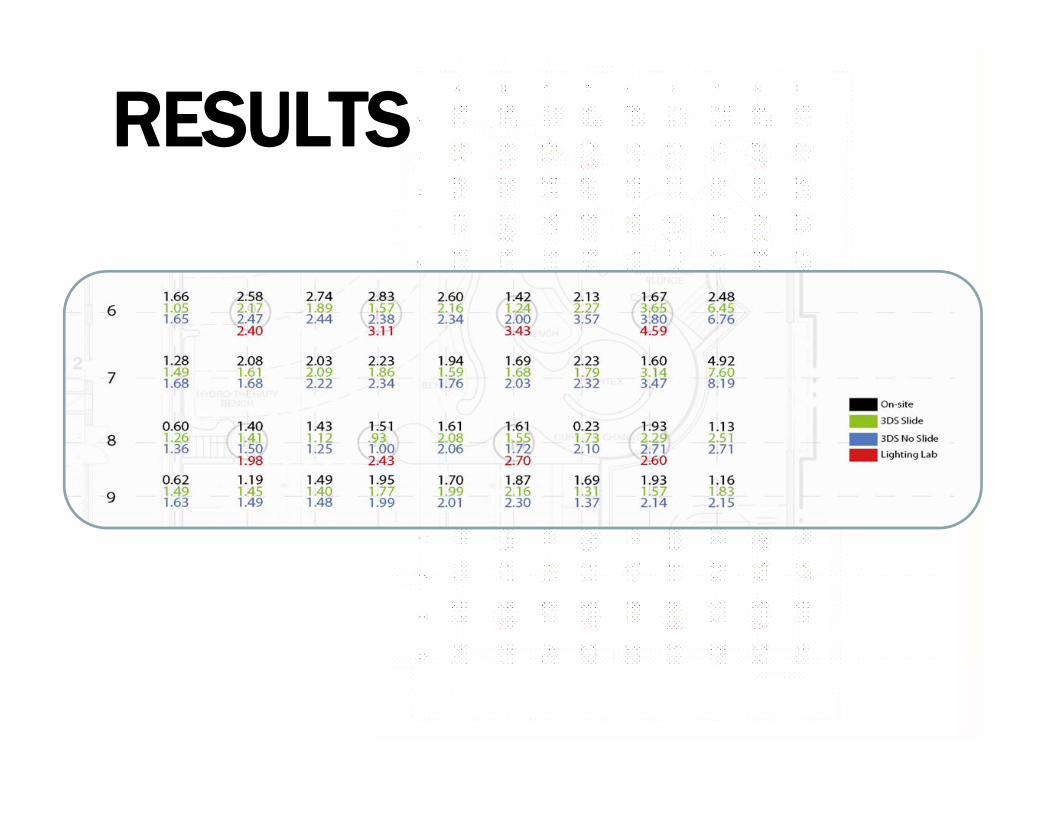
RESULTS
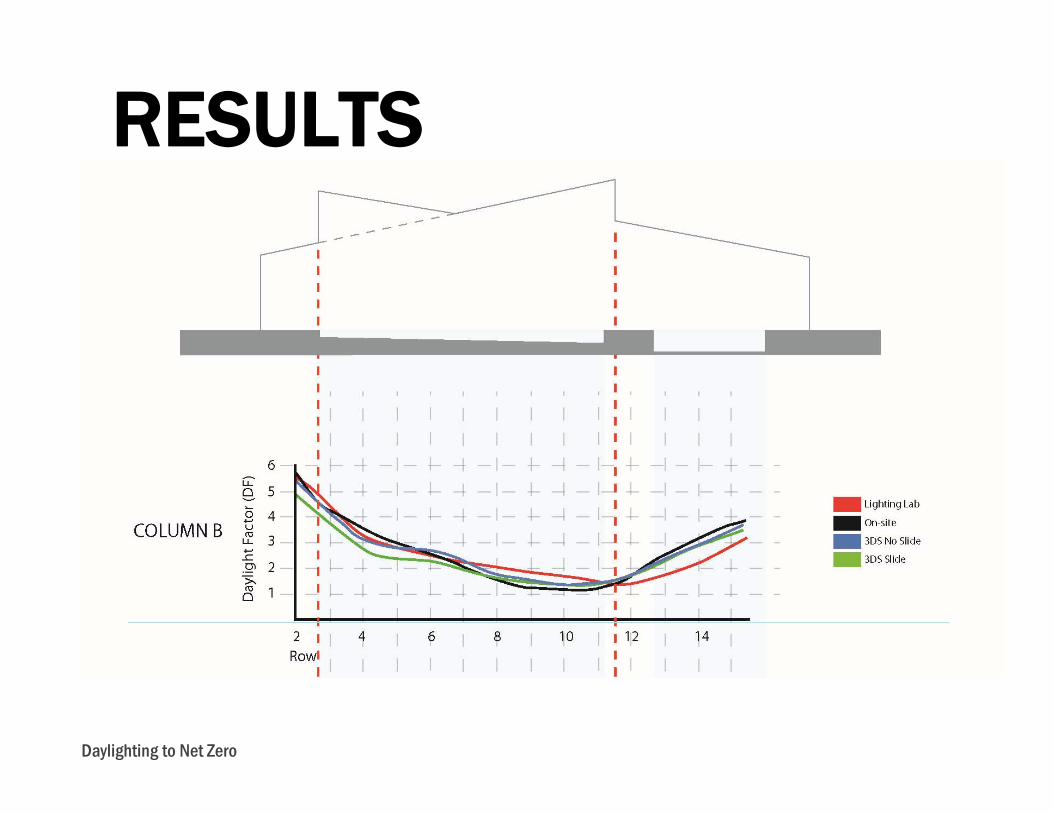
Daylighting to Net Zero
RESULTS
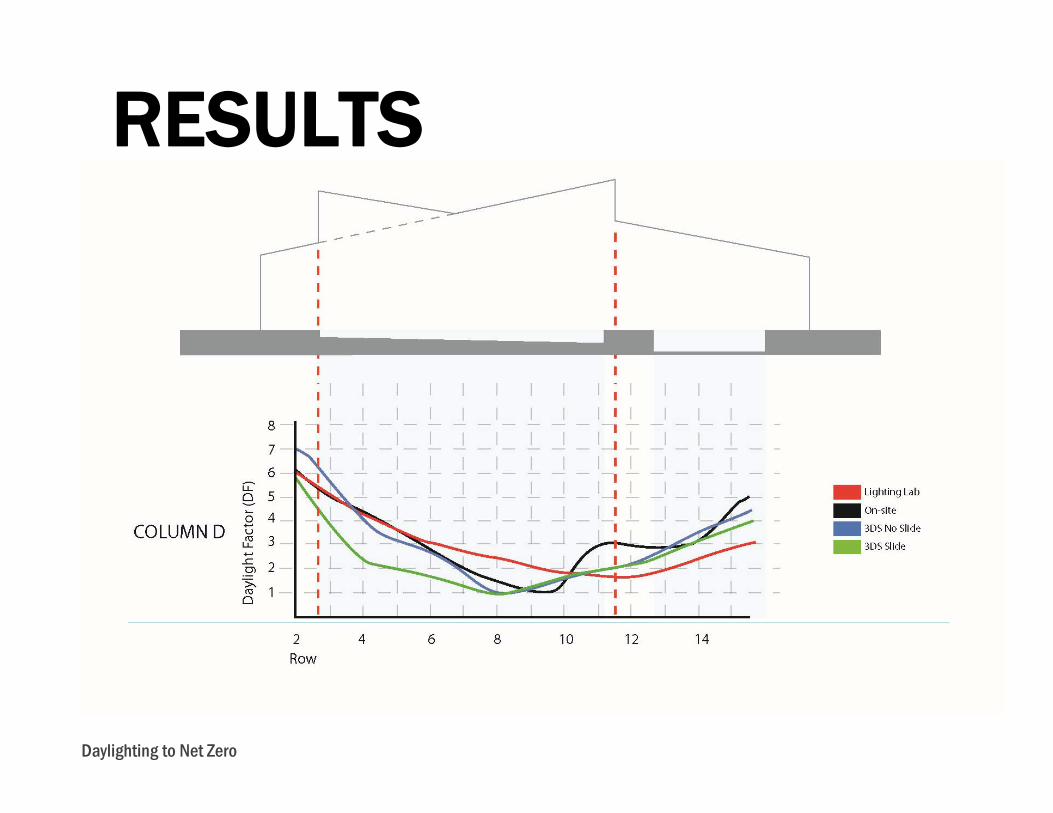
Daylighting to Net Zero
RESULTS
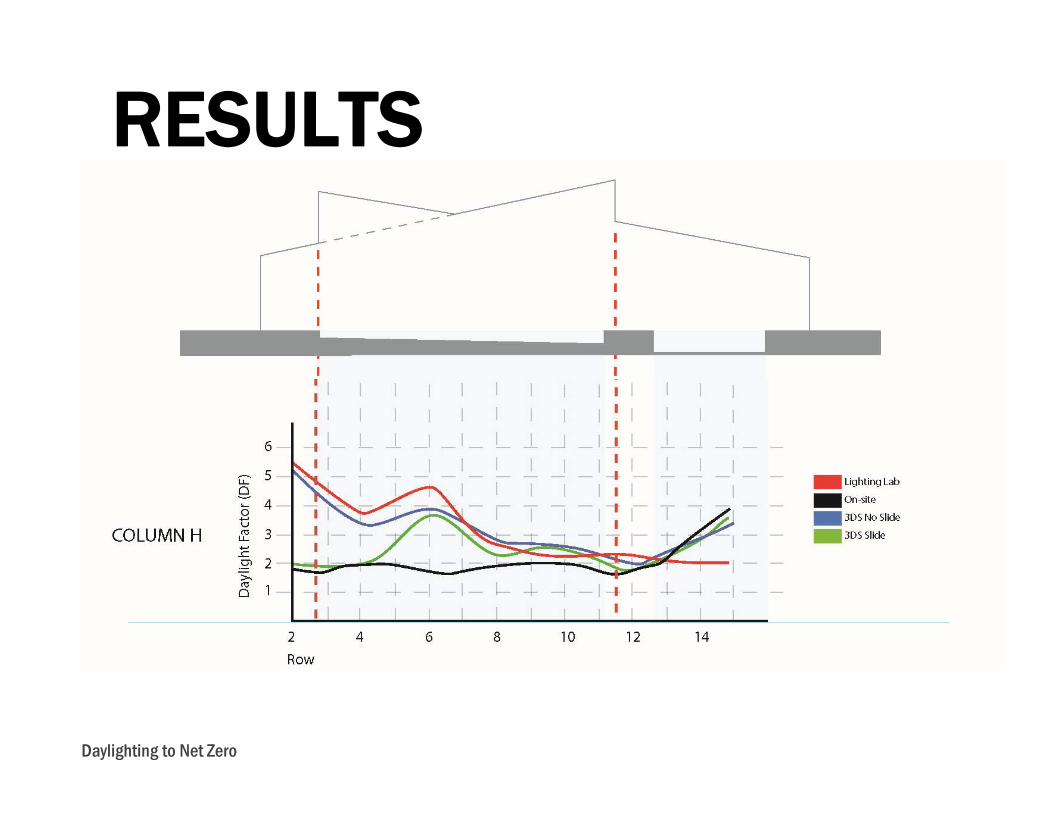
Daylighting to Net Zero
RESULTS
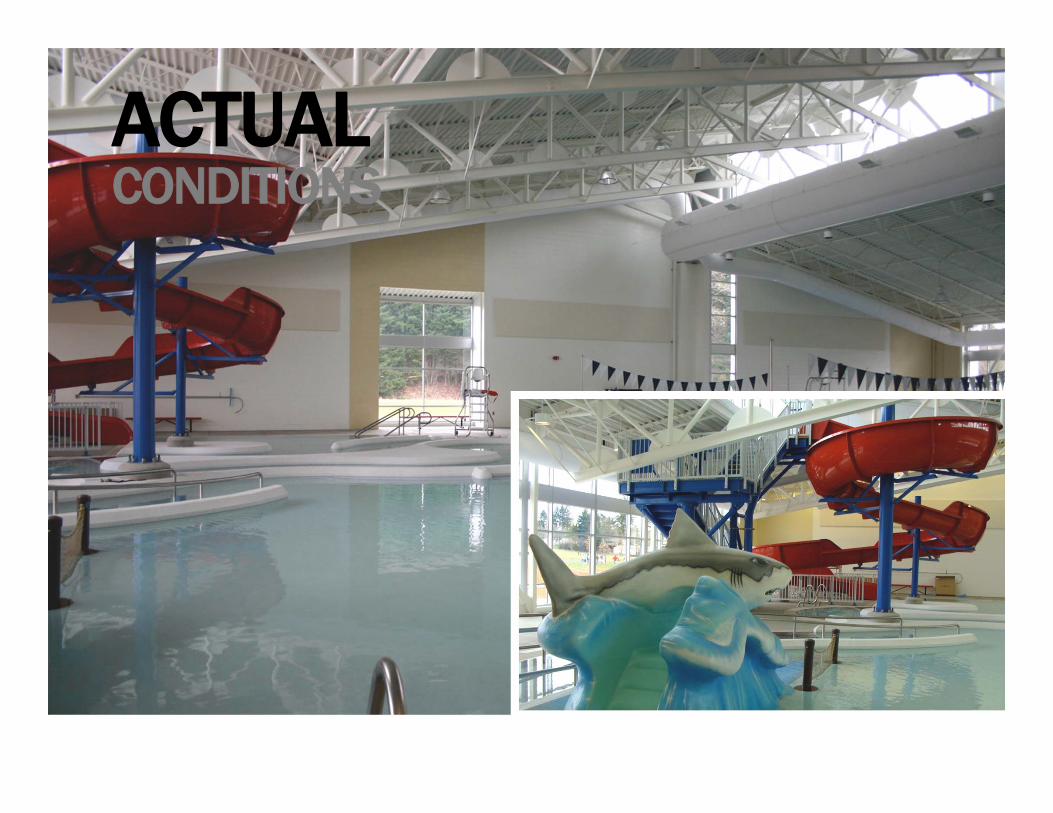
ACTUALCONDITIONS
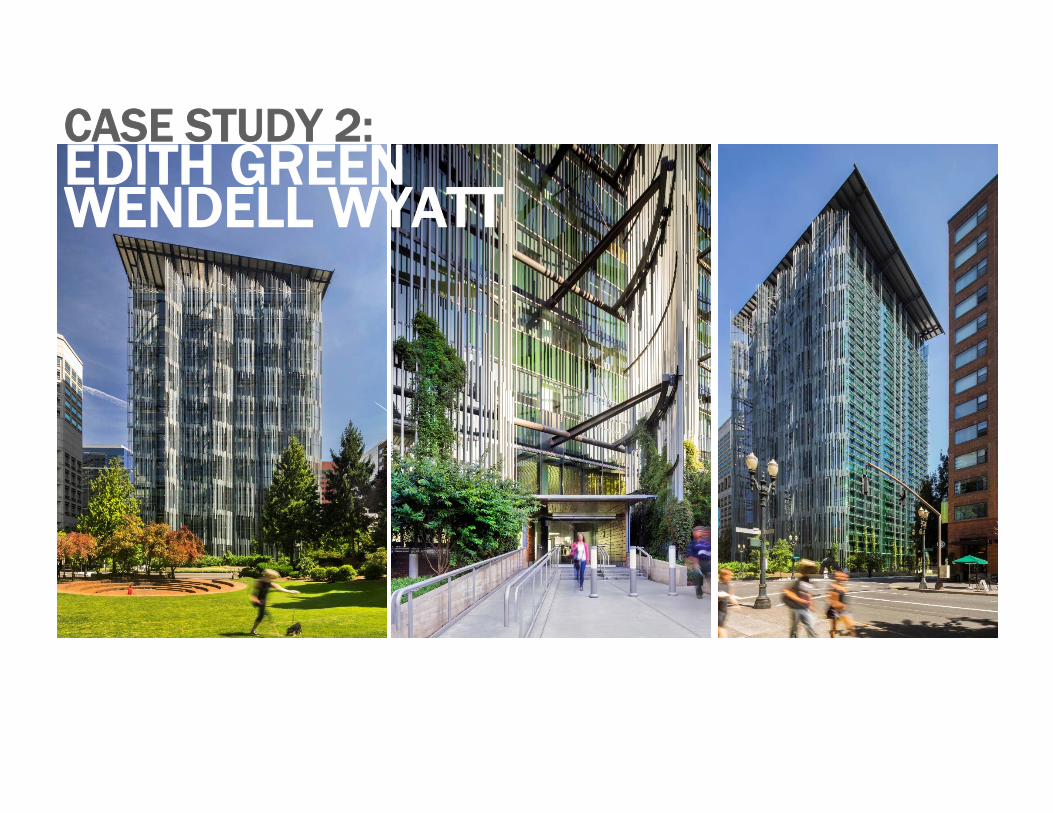
CASE STUDY 2:EDITH GREEN WENDELL WYATT
o20
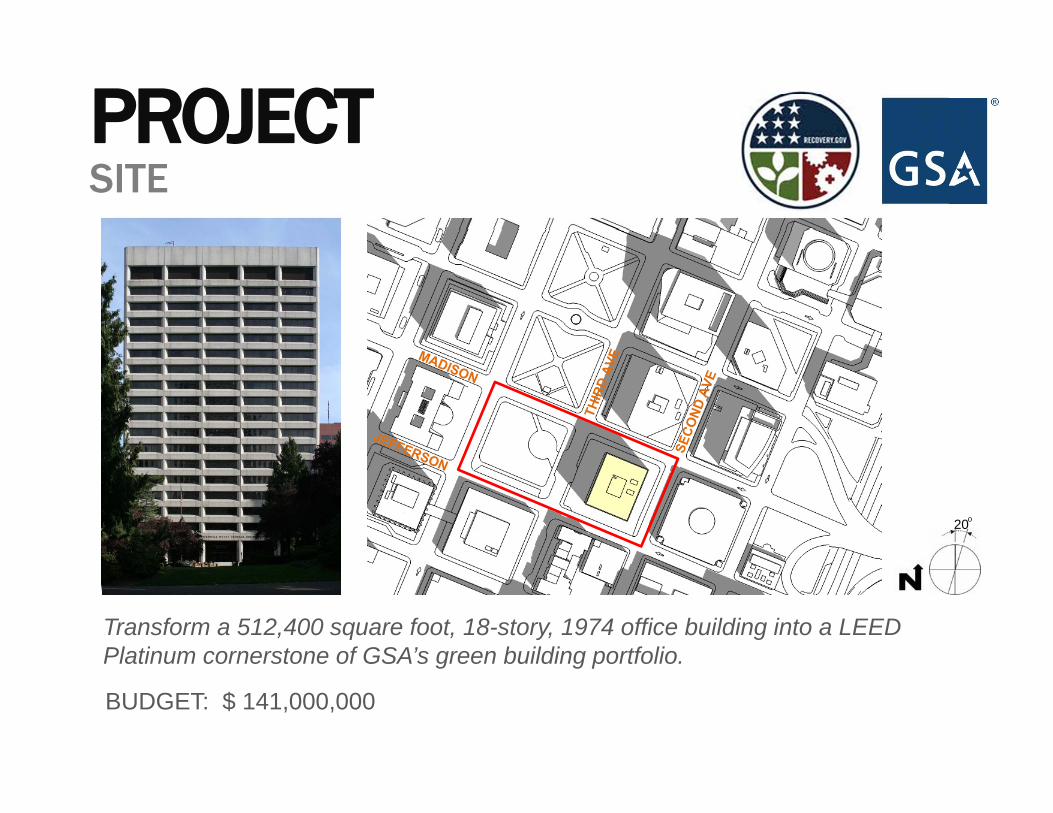
Transform a 512,400 square foot, 18-story, 1974 office building into a LEED Platinum cornerstone of GSA’s green building portfolio.
BUDGET: $ 141,000,000
PROJECTSITE
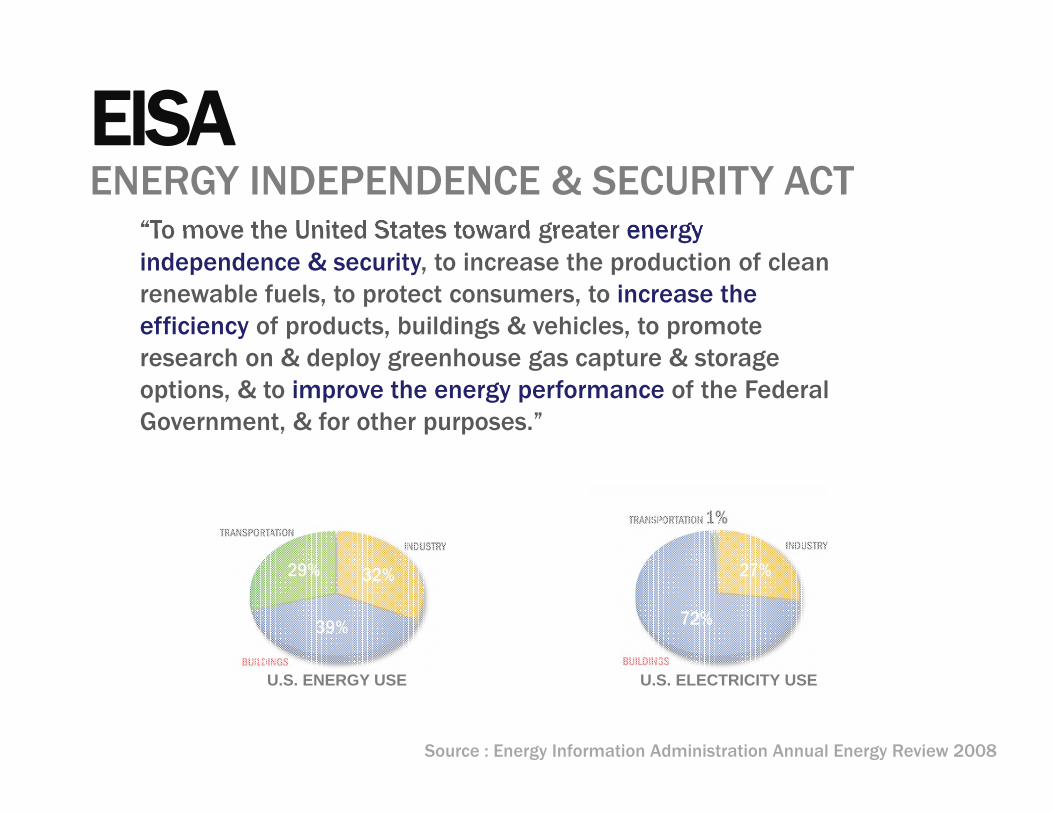
“To move the United States toward greater energy independence & security, to increase the production of clean renewable fuels, to protect consumers, to increase the efficiency of products, buildings & vehicles, to promote research on & deploy greenhouse gas capture & storage options, & to improve the energy performance of the Federal Government, & for other purposes.”
U.S. ENERGY USE U.S. ELECTRICITY USE
Source : Energy Information Administration Annual Energy Review 2008
EISA ENERGY INDEPENDENCE & SECURITY ACT
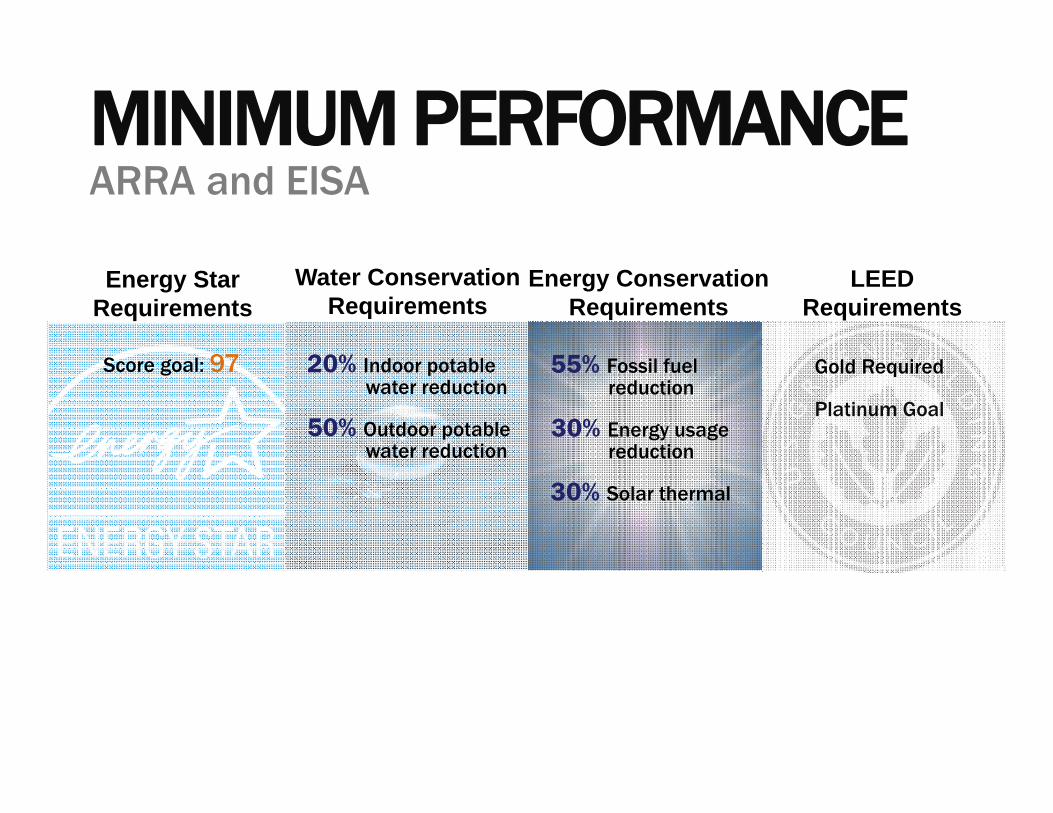
Energy Conservation Requirements
LEEDRequirements
Gold Required
Platinum Goal
20% Indoor potable water reduction
50% Outdoor potable water reduction
Water Conservation Requirements
Energy StarRequirements
55% Fossil fuel reduction
30% Energy usage reduction
30% Solar thermal
Score goal: 97
MINIMUM PERFORMANCEARRA and EISA
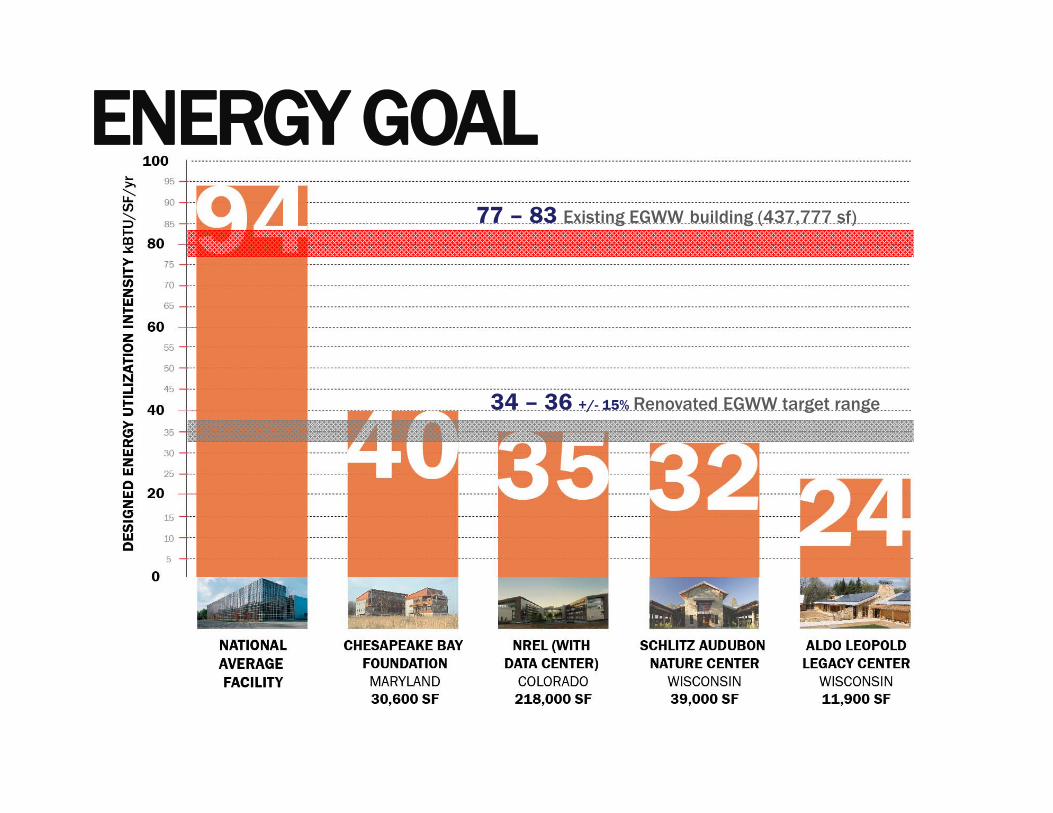
ENERGY GOAL77 – 83 Existing EGWW building (437,777 sf)
34 – 36 +/- 15% Renovated EGWW target range
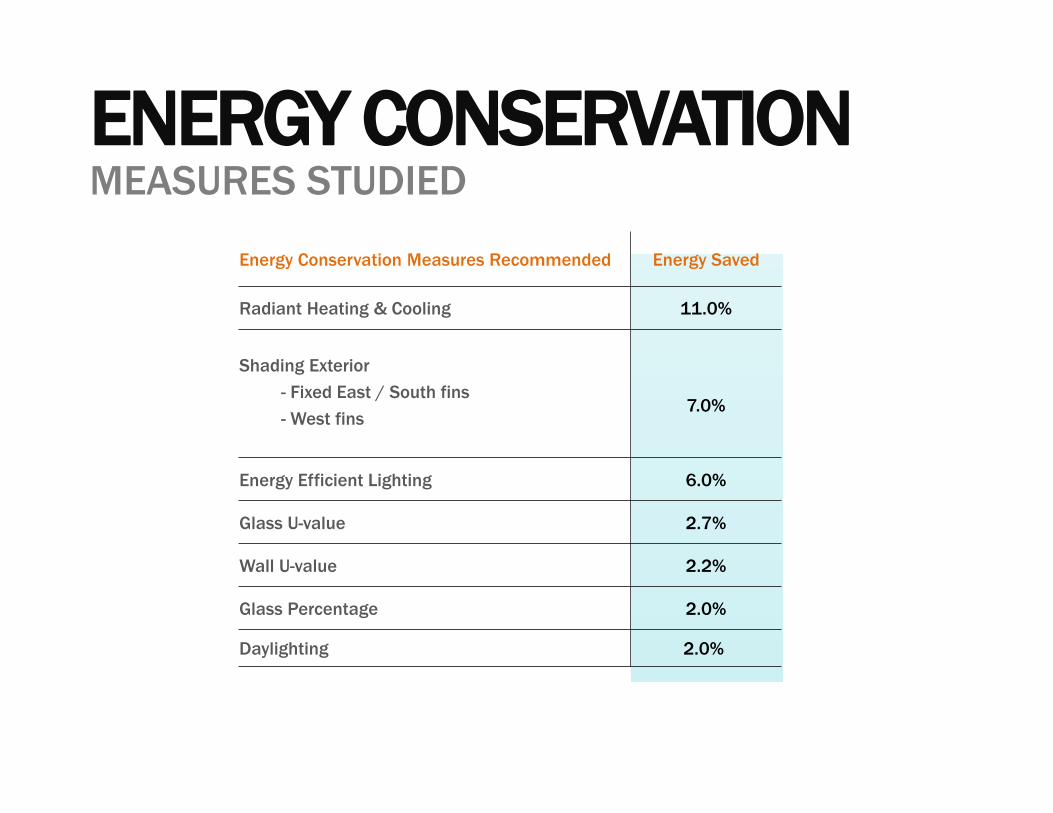
Energy Conservation Measures Recommended Energy Saved
Radiant Heating & Cooling 11.0%
Shading Exterior
- Fixed East / South fins
- West fins7.0%
Energy Efficient Lighting 6.0%
Glass U-value 2.7%
Wall U-value 2.2%
Glass Percentage 2.0%
Daylighting 2.0%
ENERGY CONSERVATIONMEASURES STUDIED
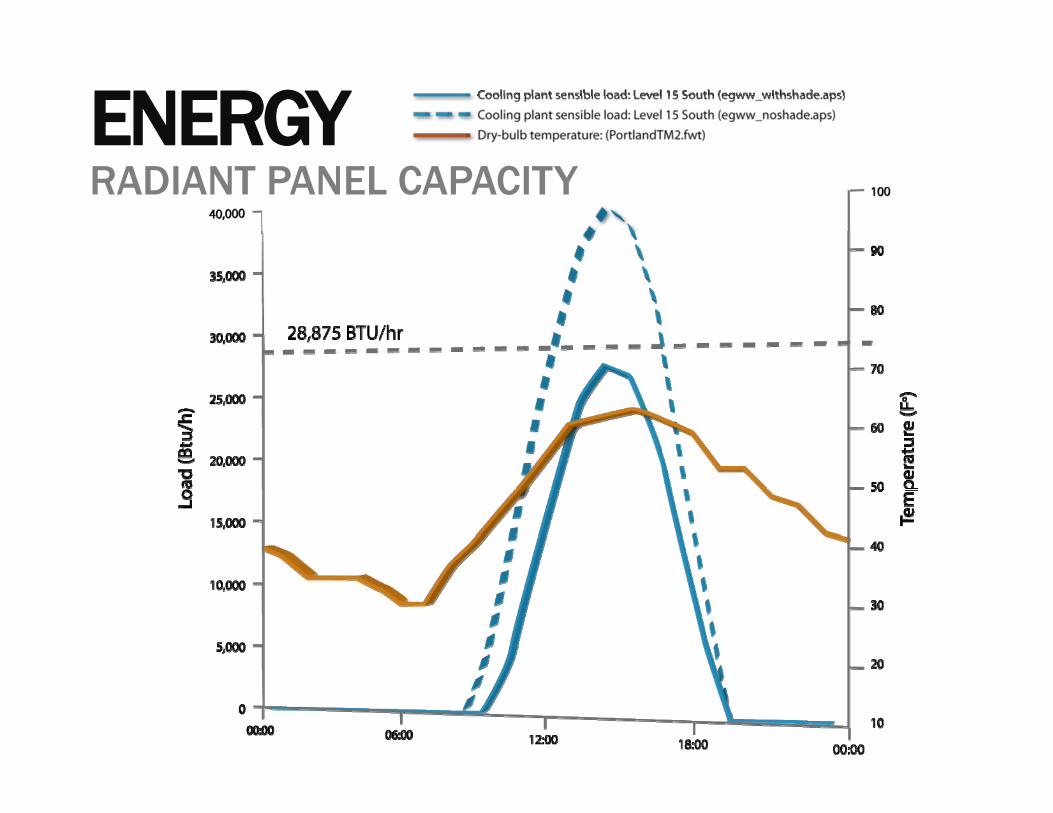
ENERGYRADIANT PANEL CAPACITY
June 215 pmJune 214 pmJune 213 pmJune 212 pmJune 211 pmJune 2112 pmJune 2111 amJune 2110 amJune 219 amJune 218 am
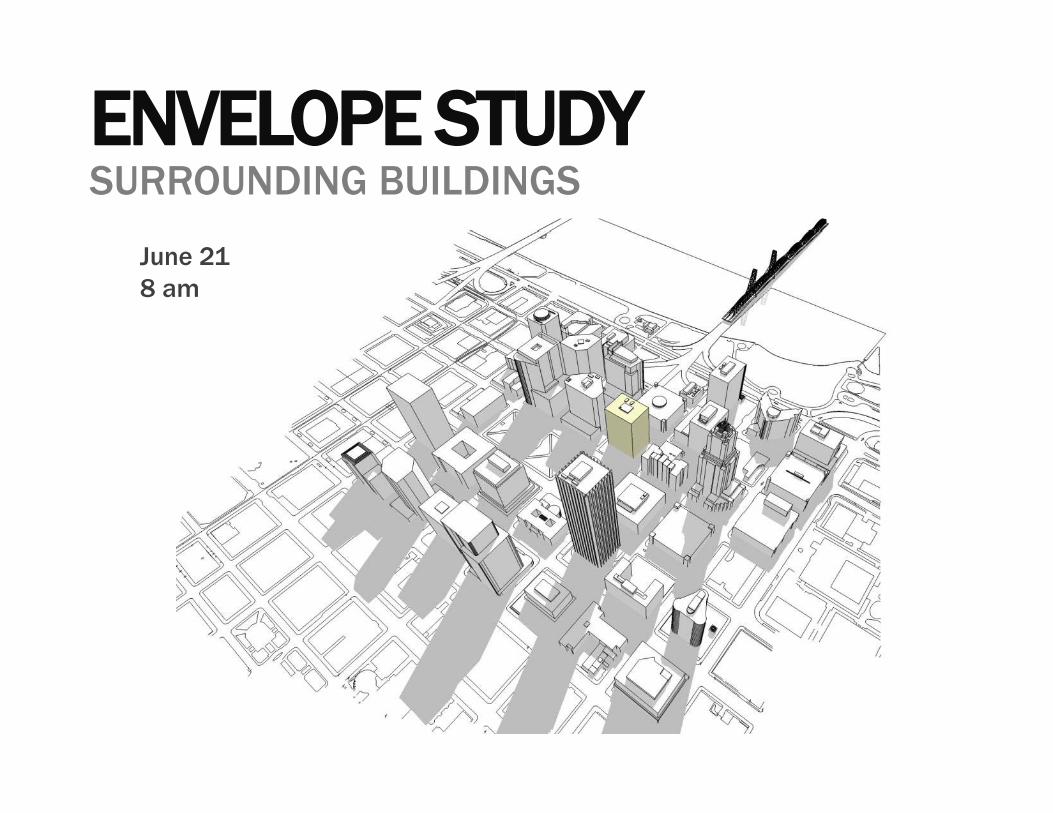
ENVELOPE STUDY SURROUNDING BUILDINGS
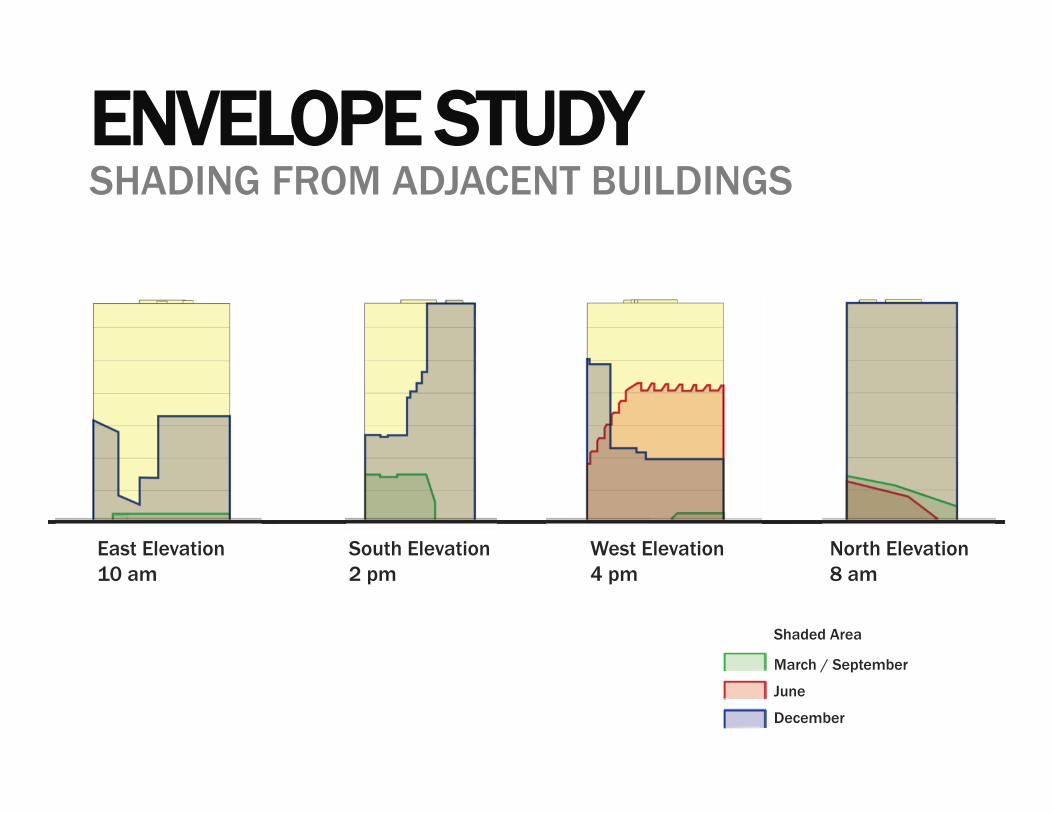
East Elevation10 am
South Elevation2 pm
West Elevation4 pm
North Elevation8 am
March / September
June
December
Shaded Area
ENVELOPE STUDY SHADING FROM ADJACENT BUILDINGS
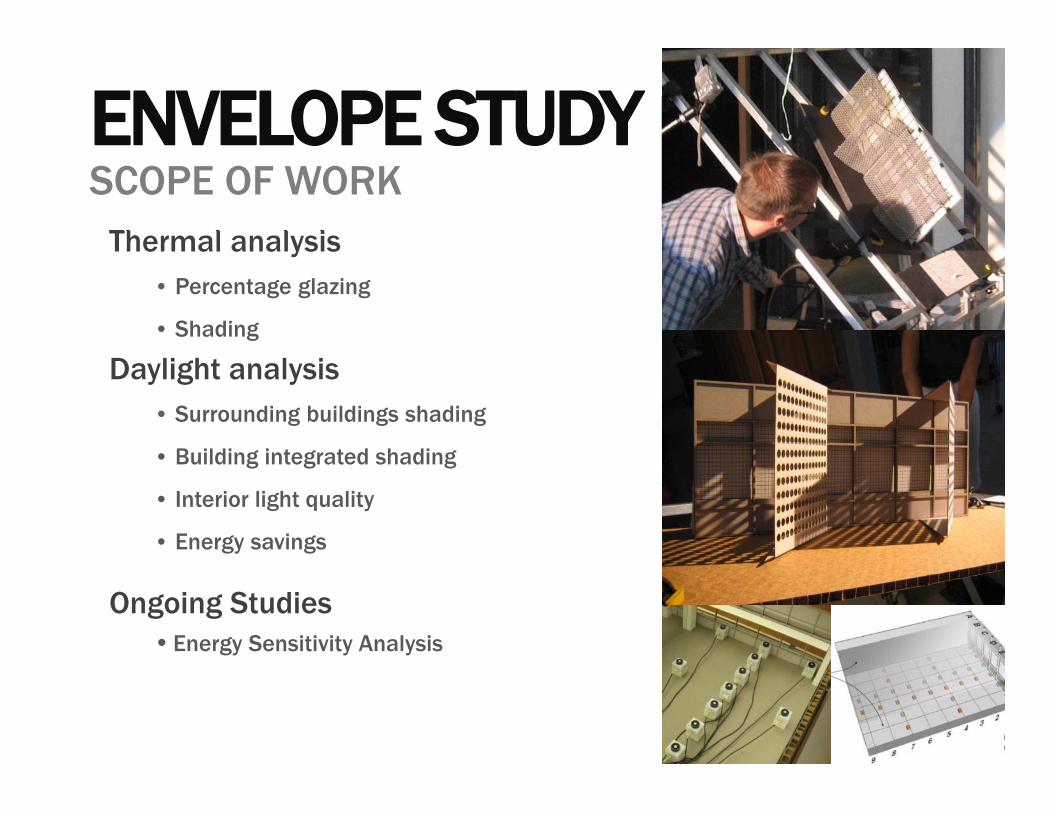
Thermal analysis• Percentage glazing
• Shading
Daylight analysis• Surrounding buildings shading
• Building integrated shading
• Interior light quality
• Energy savings
Ongoing Studies• Energy Sensitivity Analysis
ENVELOPE STUDY SCOPE OF WORK
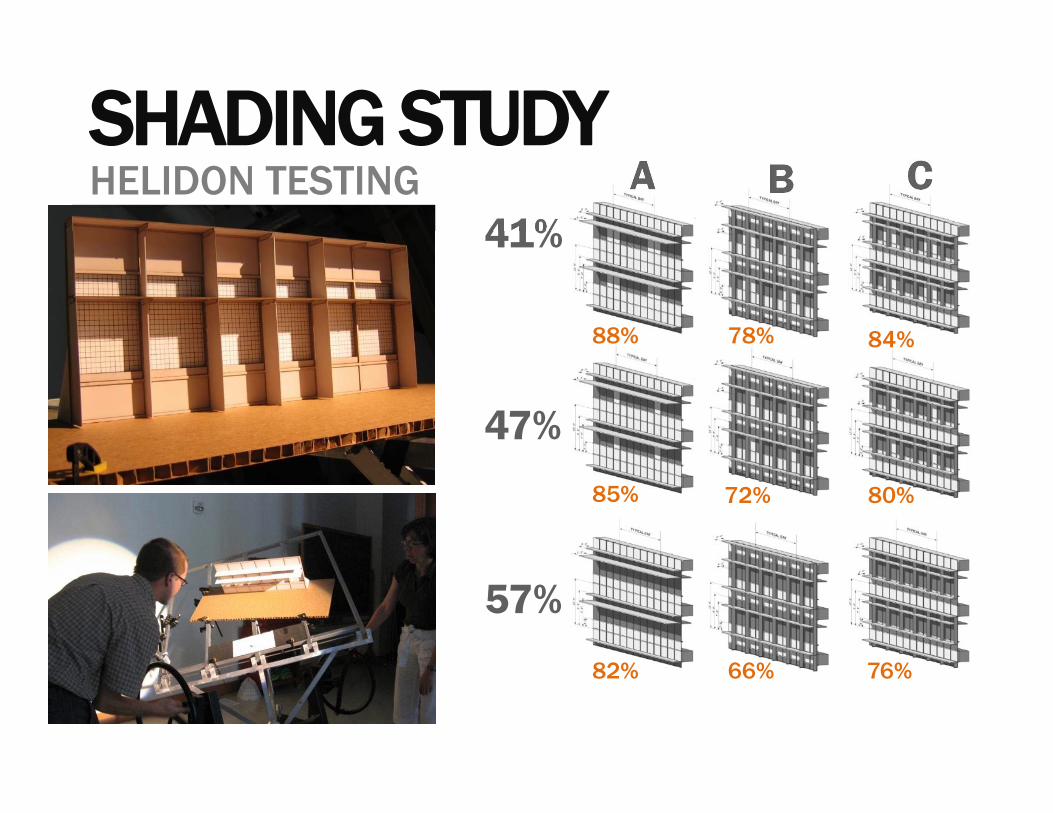
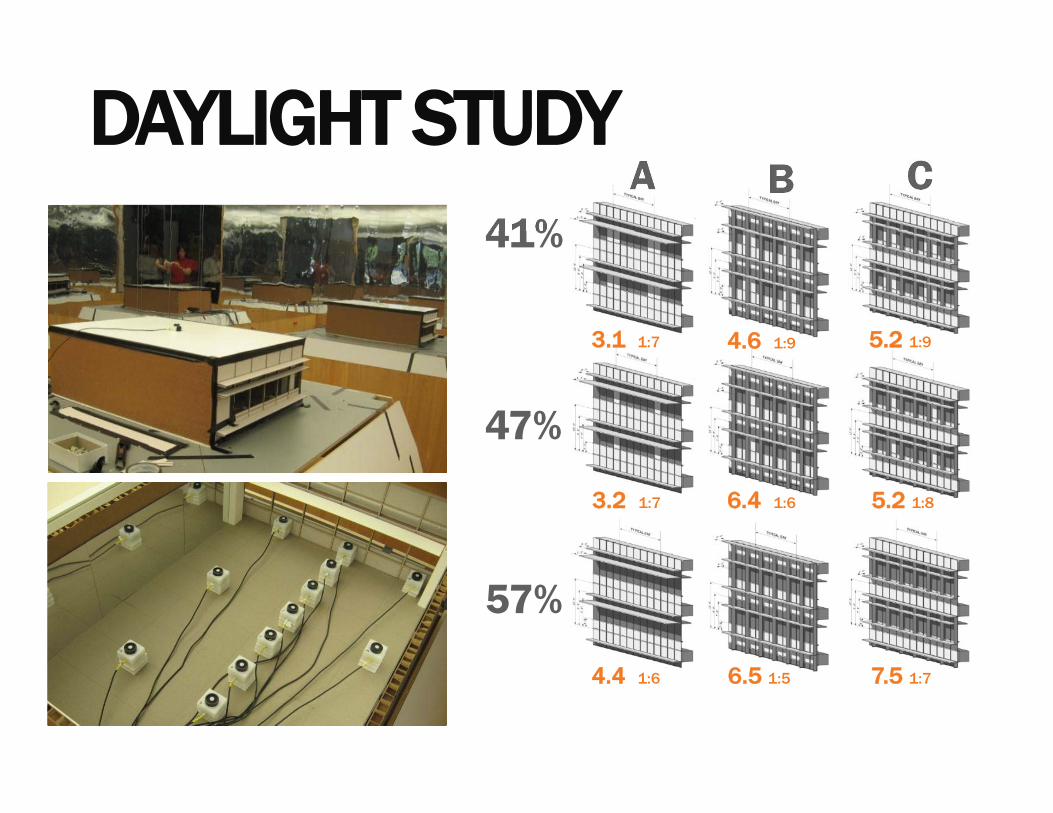
41%
47%
57%
A B C
88% 78% 84%
85% 72% 80%
82% 66% 76%
SHADING STUDY HELIDON TESTING
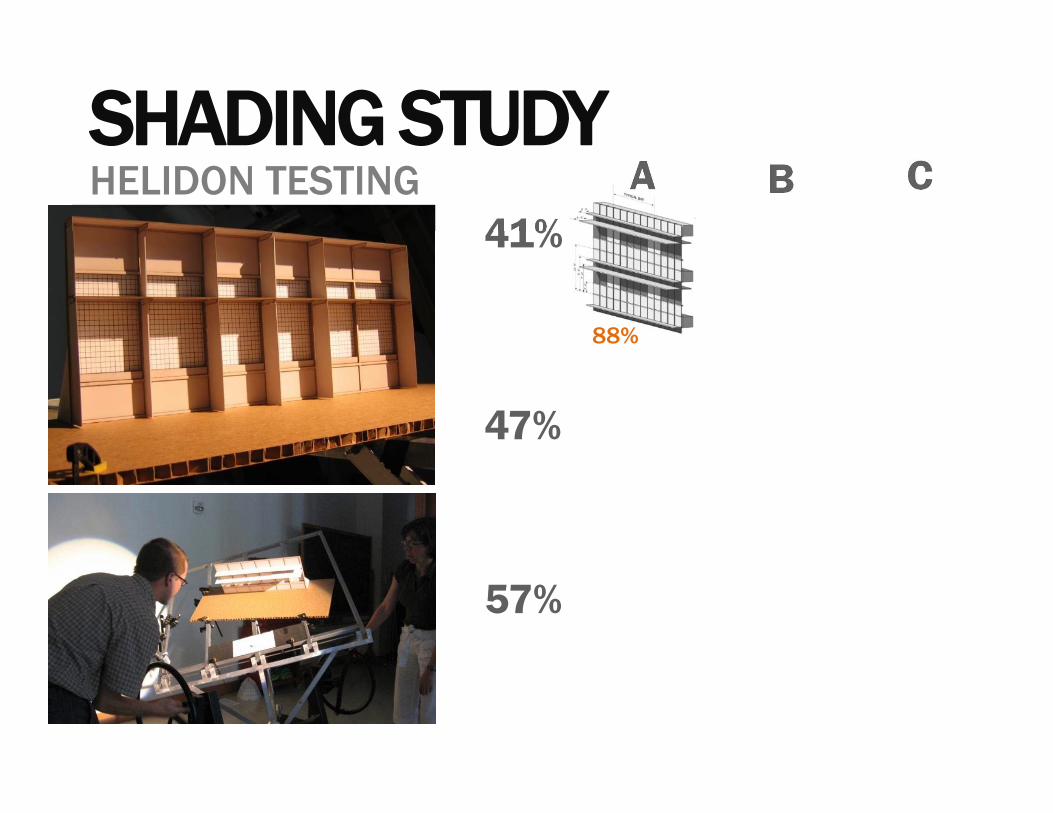
41%
47%
57%
A B C
88%
SHADING STUDY HELIDON TESTING
41%
47%
57%
A B C
3.1 1:7
3.2 1:7
4.4 1:6
4.6 1:9
6.4 1:6
6.5 1:5
5.2 1:9
5.2 1:8
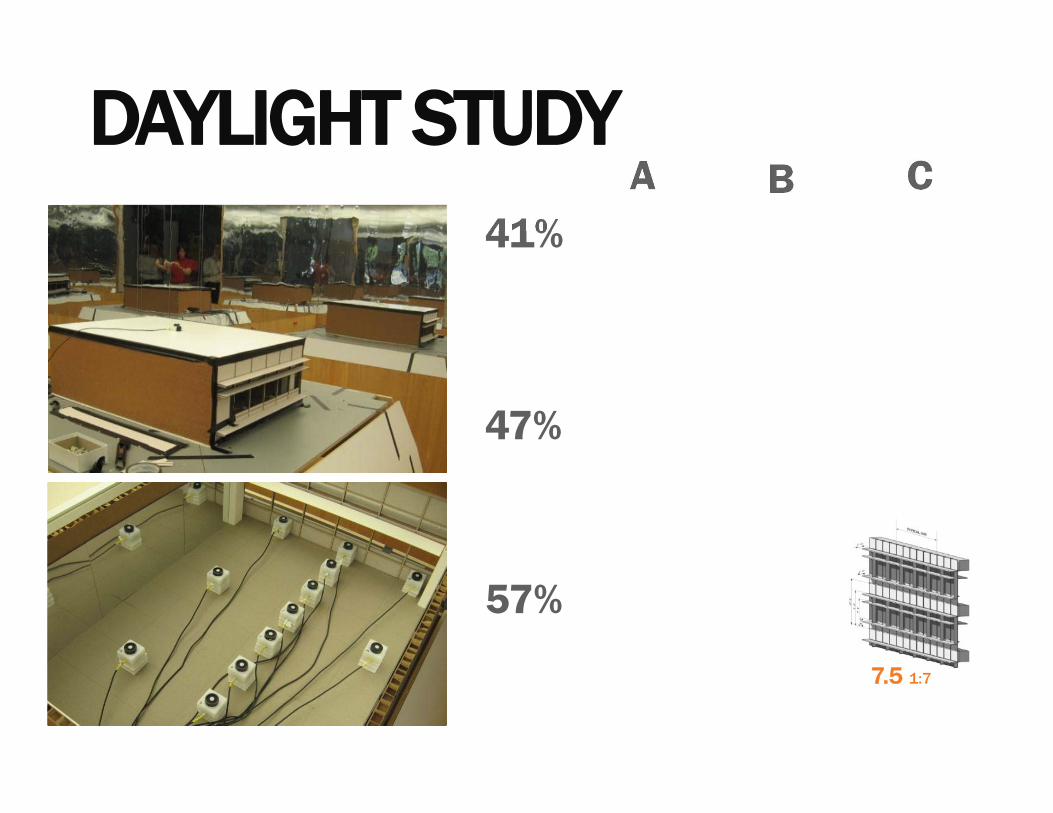
7.5 1:7
DAYLIGHT STUDY ARTIFICAL SKY
41%
47%
57%
A B C
7.5 1:7
DAYLIGHT STUDY ARTIFICAL SKY
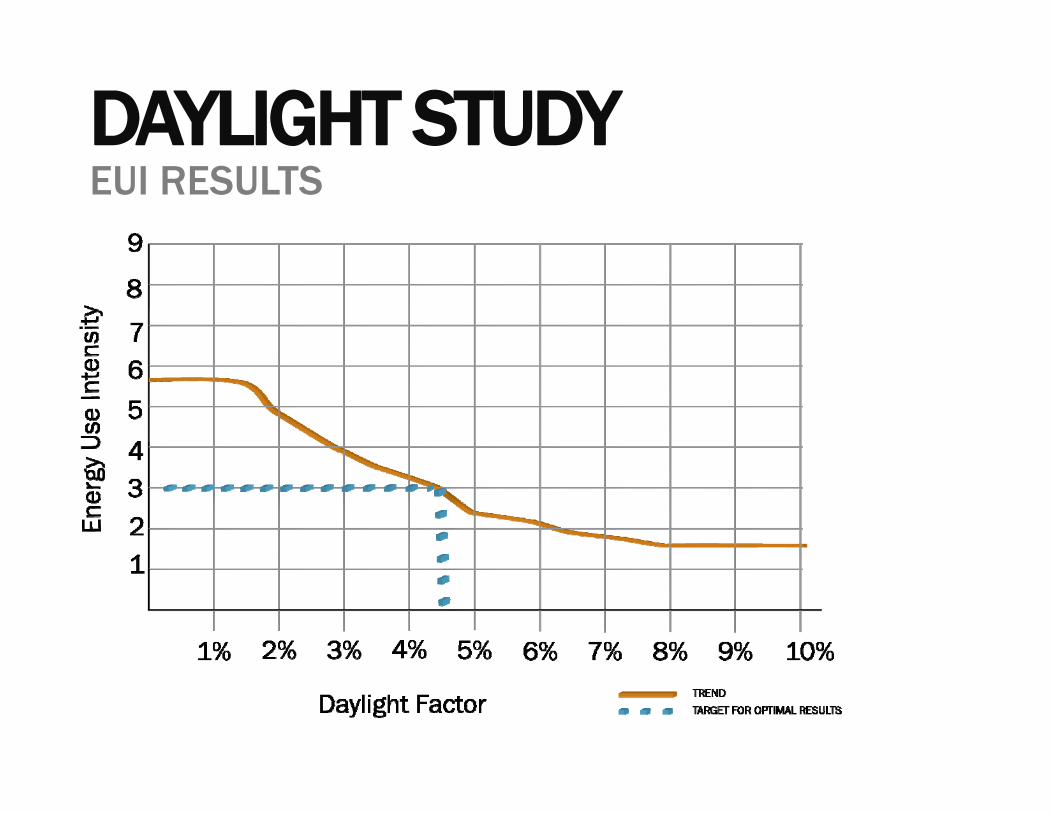
DAYLIGHT STUDY EUI RESULTS
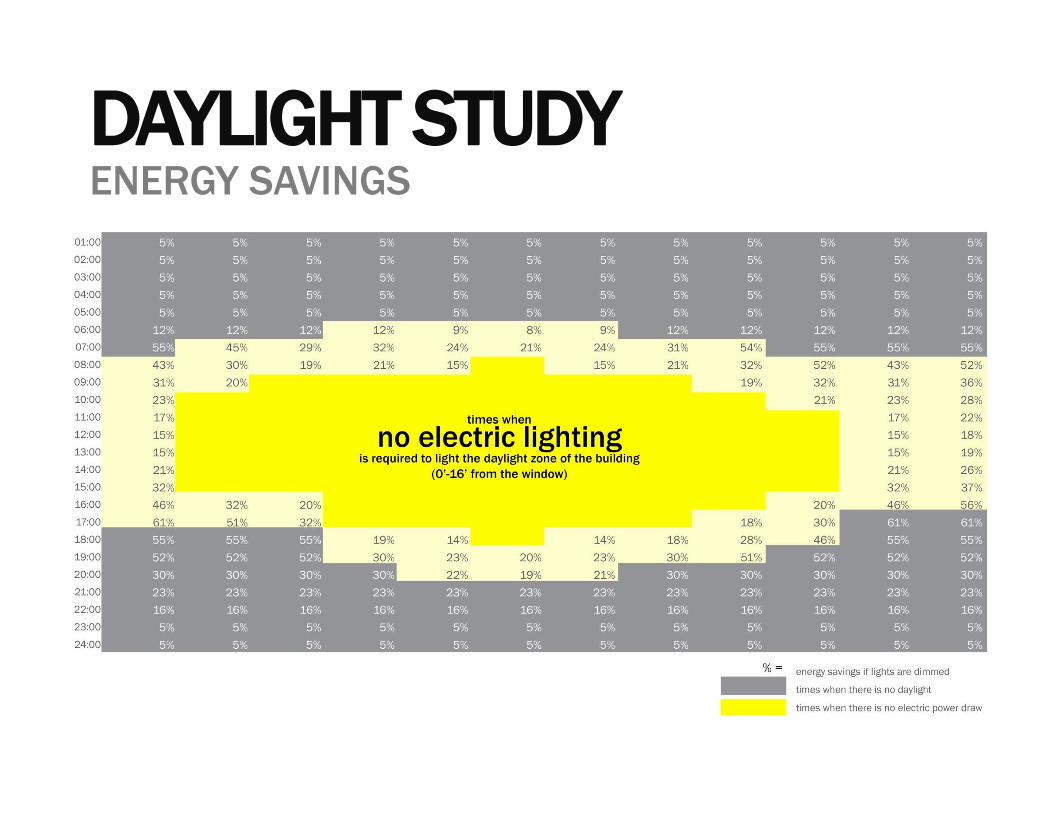
DAYLIGHT STUDY ENERGY SAVINGS
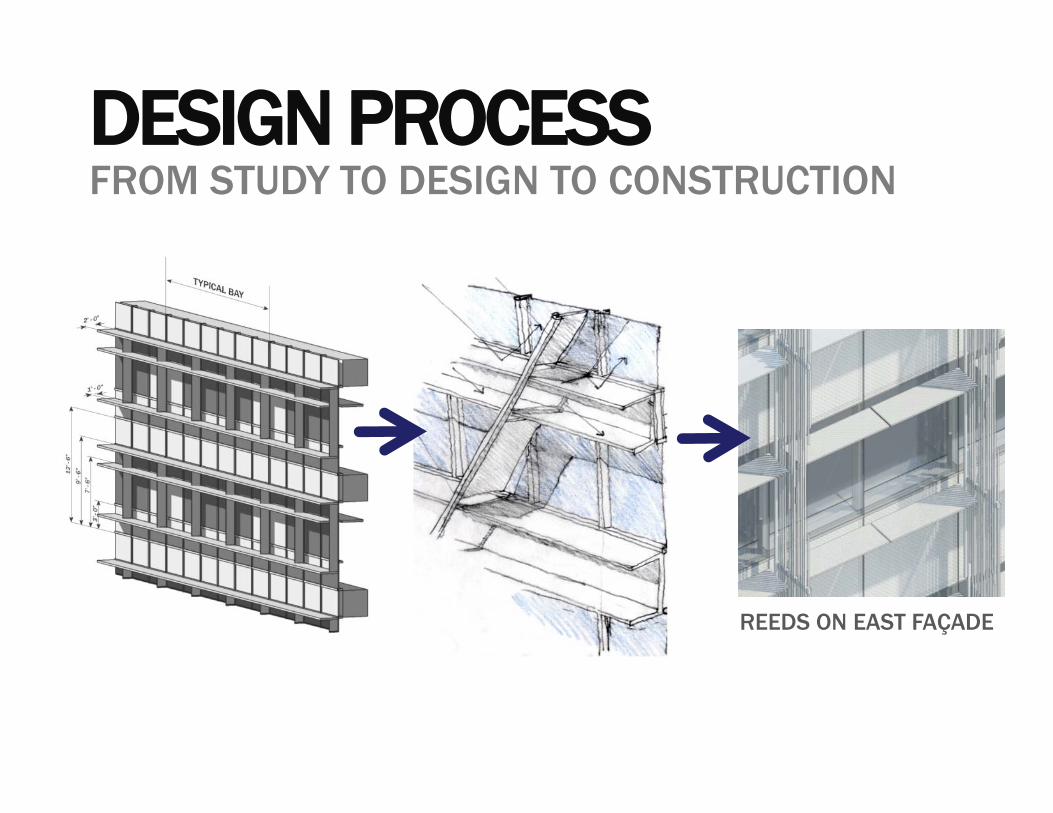
REEDS ON EAST FAÇADE
DESIGN PROCESSFROM STUDY TO DESIGN TO CONSTRUCTION
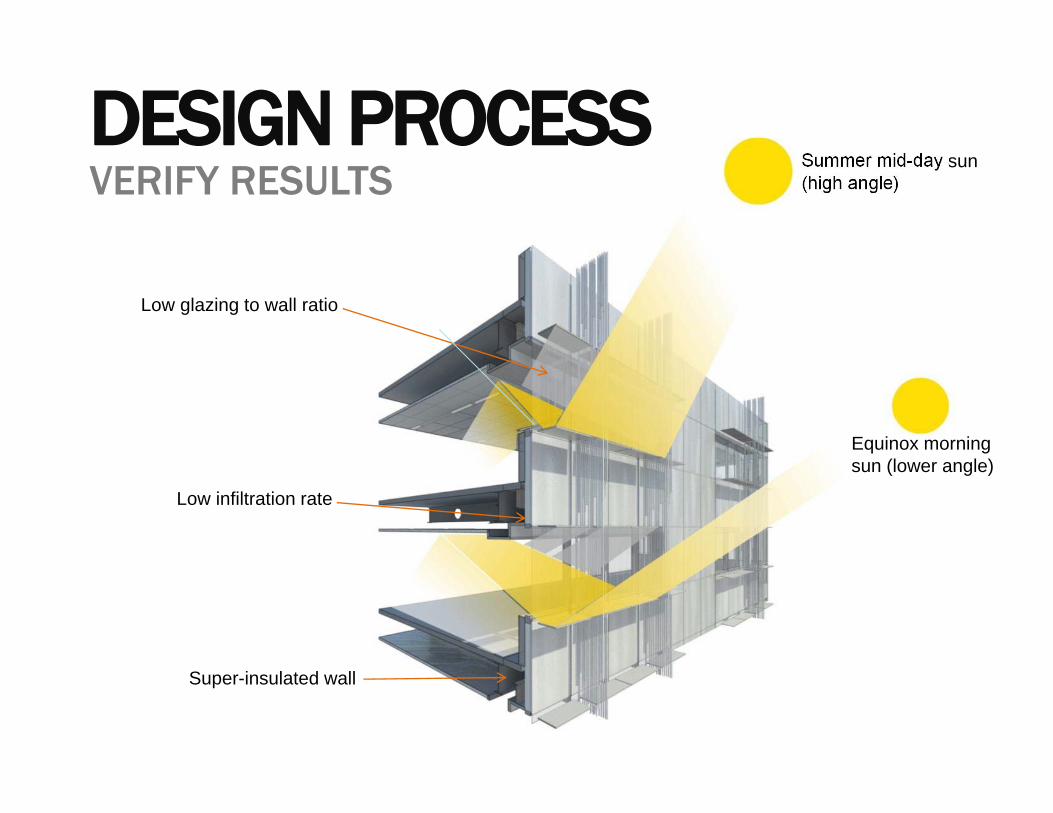
Low infiltration rate
Super-insulated wall
Low glazing to wall ratio
Summer mid-day sun(high angle)
Equinox morningsun (lower angle)
DESIGN PROCESSVERIFY RESULTS
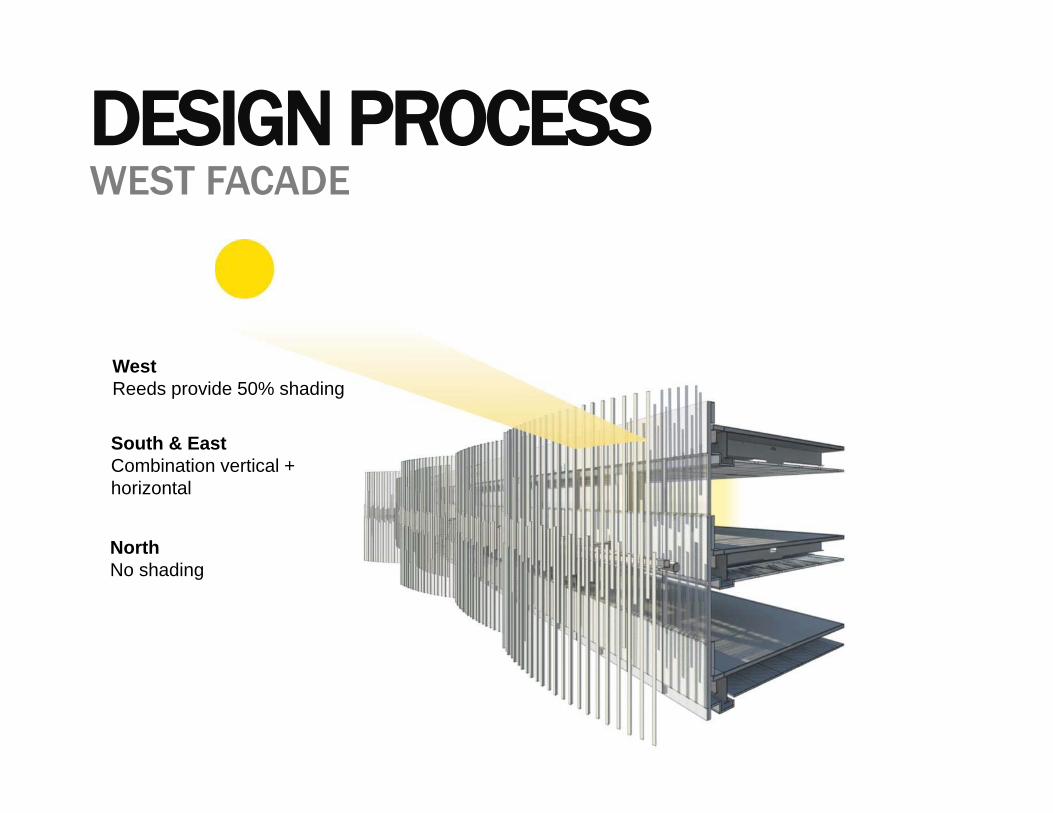
South & EastCombination vertical + horizontal
North No shading
WestReeds provide 50% shading
DESIGN PROCESSWEST FACADE
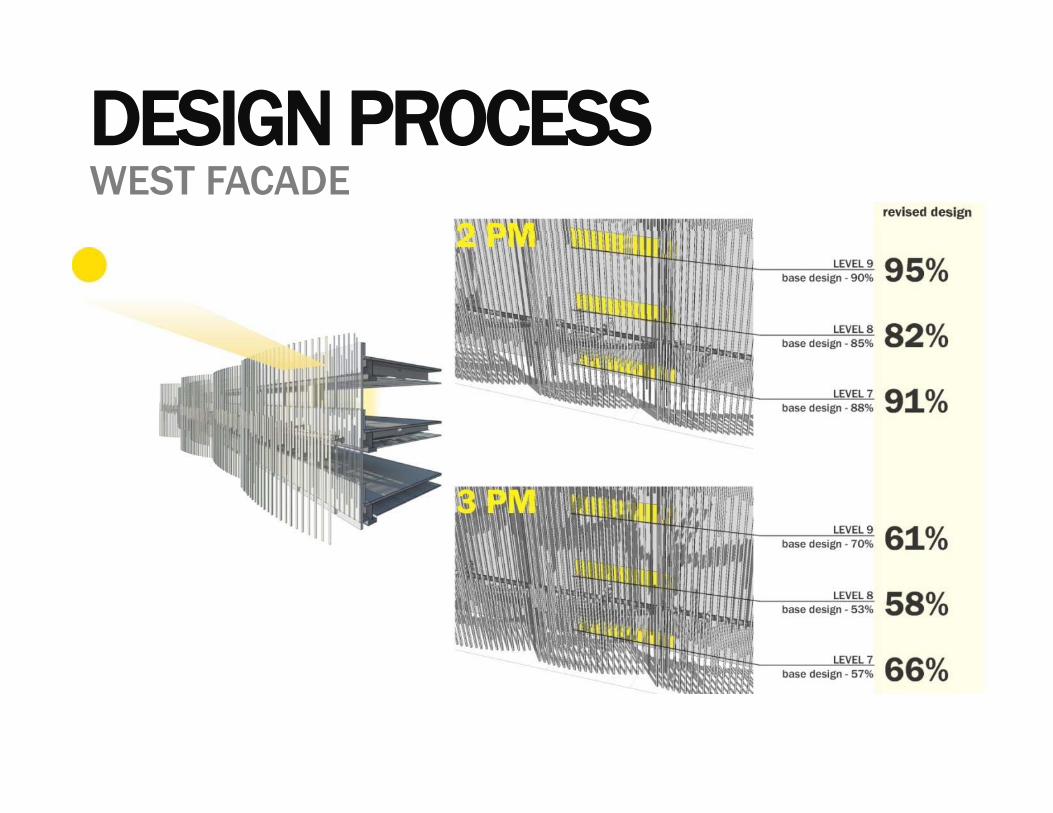
DESIGN PROCESSWEST FACADE
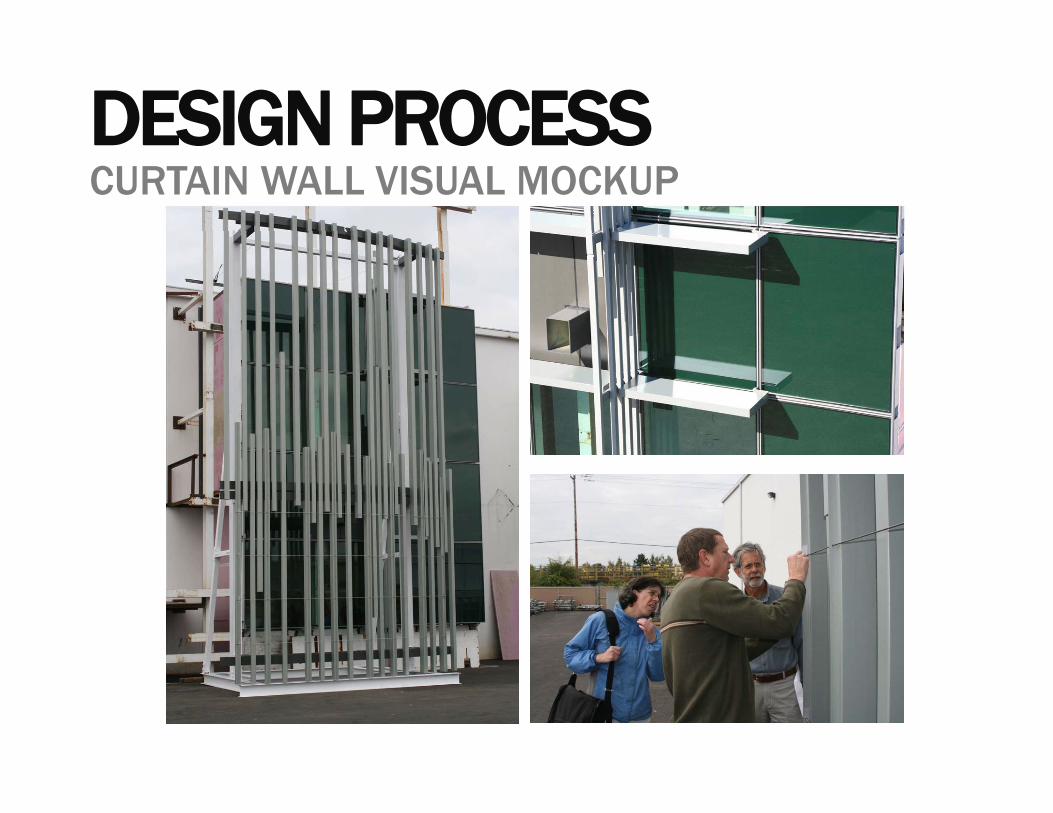
DESIGN PROCESSCURTAIN WALL VISUAL MOCKUP
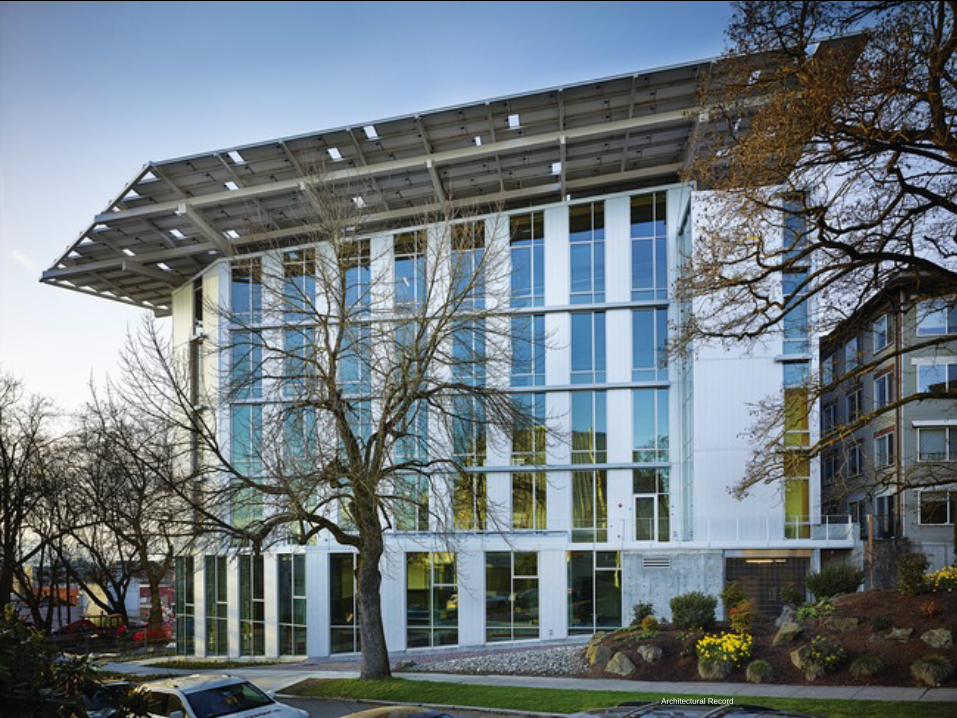
@ the Bullitt Center The Integrated Design Lab The Discovery Commonshttp://www.bullittcenter.org http:/www.joelrogers.photoshelter.com http:/www.djc.om
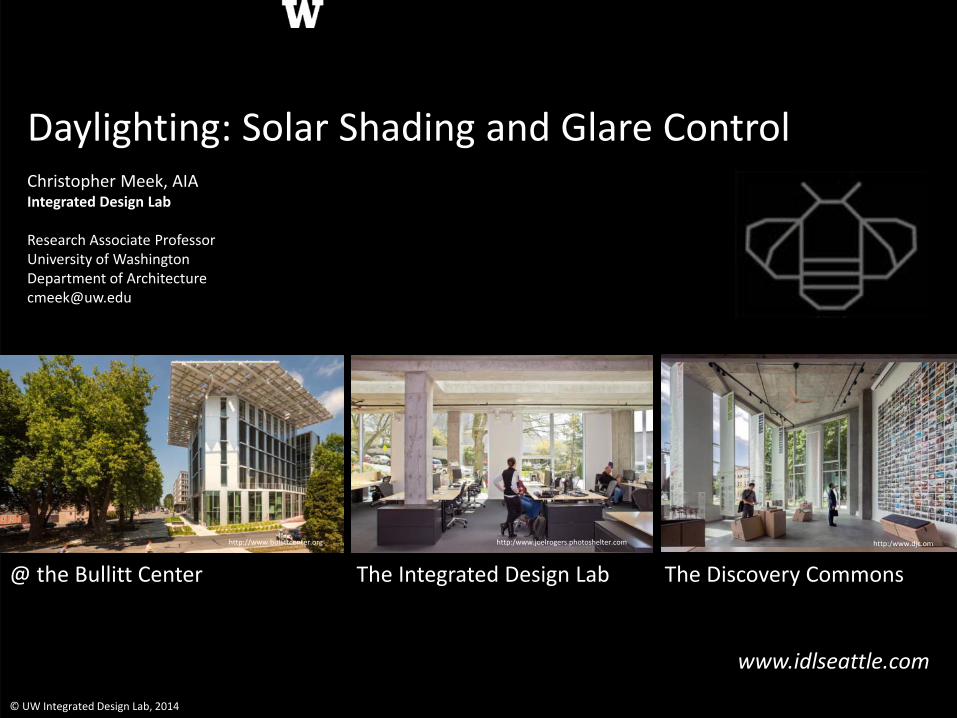
Daylighting: Solar Shading and Glare ControlChristopher Meek, AIA Integrated Design Lab
Research Associate Professor University of Washington Department of Architecture [email protected]
www.idlseattle.com
© UW Integrated Design Lab, 2014
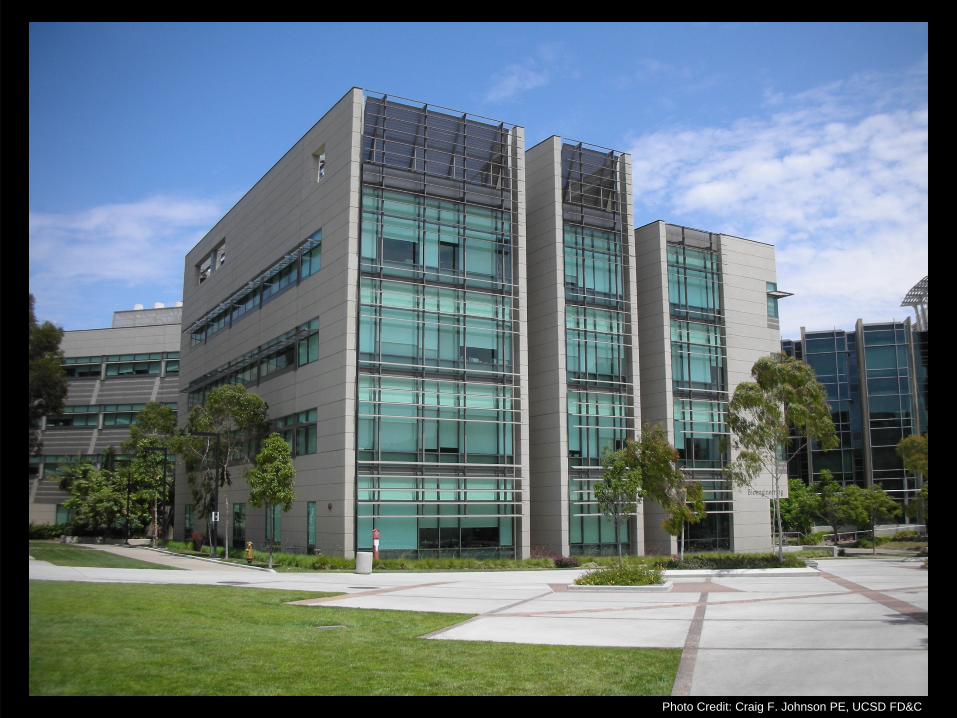
Photo Credit: Craig F. Johnson PE, UCSD FD&C
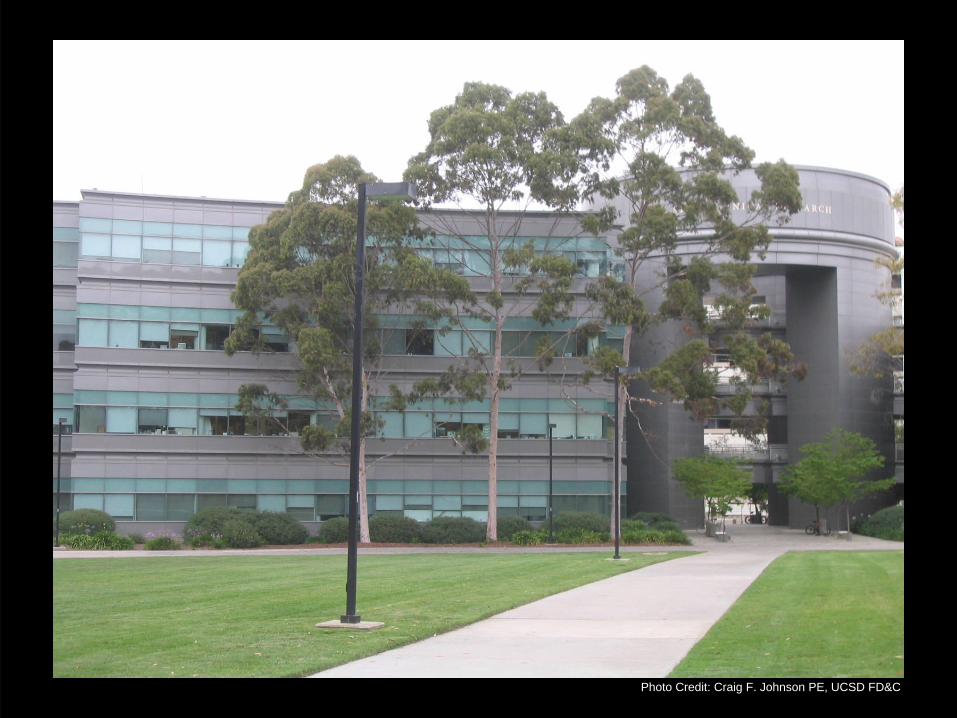
Photo Credit: Craig F. Johnson PE, UCSD FD&C
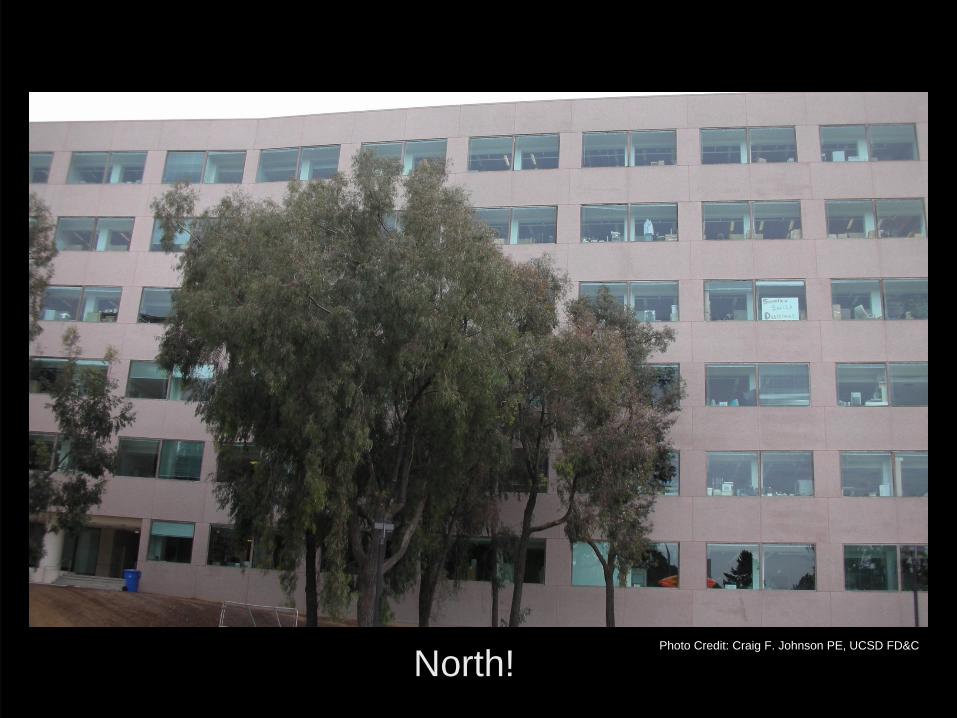
North!Photo Credit: Craig F. Johnson PE, UCSD FD&C
DecJuneJan SeptMar
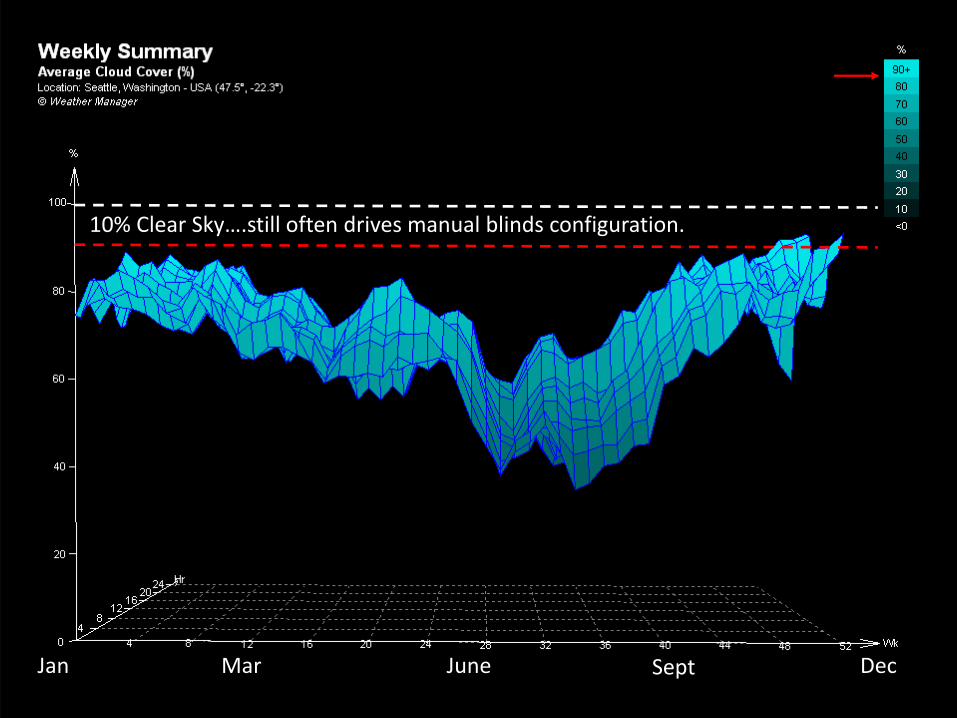
10% Clear Sky….still often drives manual blinds configuration.
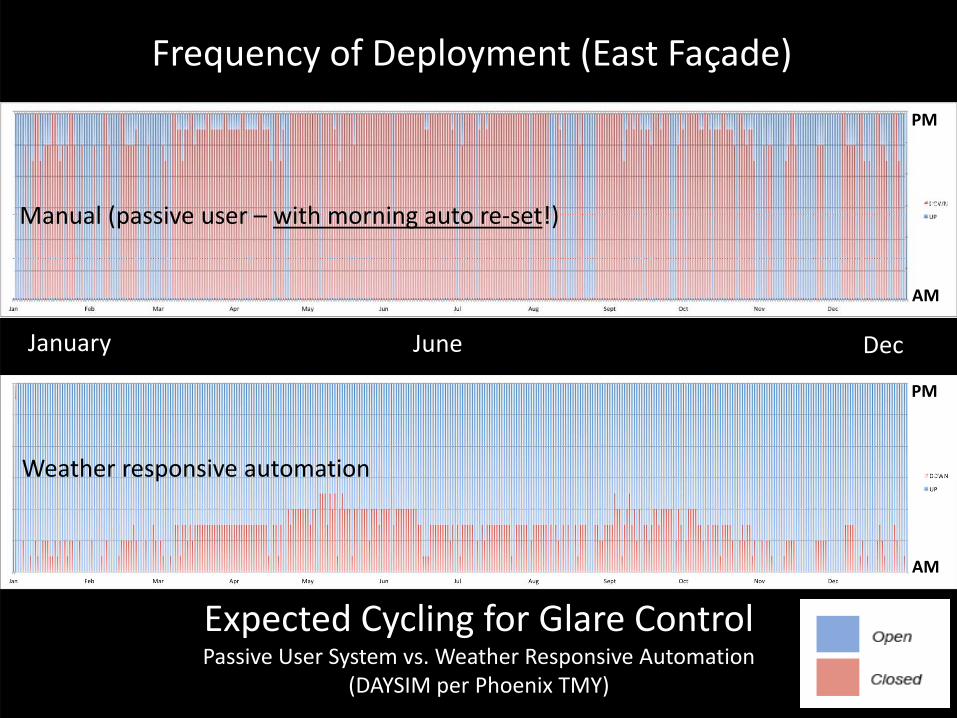
Expected Cycling for Glare ControlPassive User System vs. Weather Responsive Automation
(DAYSIM per Phoenix TMY)
January DecJune
Frequency of Deployment (East Façade)8am
12pm
6pm
8am
12pm
6pm
AM
PM
AM
PM
Weather responsive automation
Manual (passive user – with morning auto re‐set!)
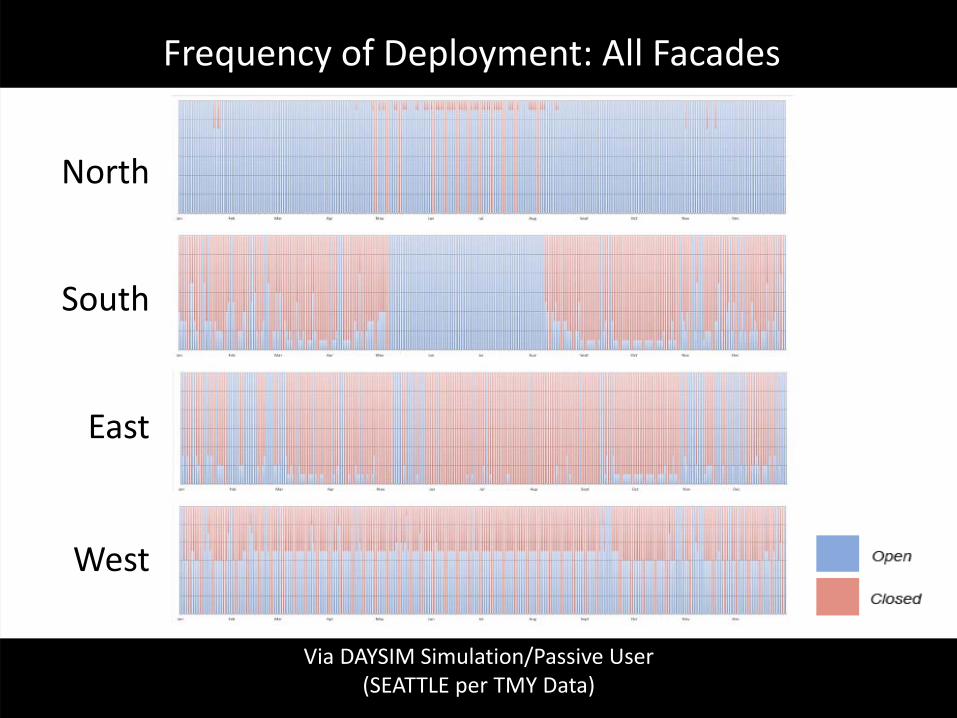
Frequency of Deployment: All Facades
North
South
East
West
Via DAYSIM Simulation/Passive User(SEATTLE per TMY Data)
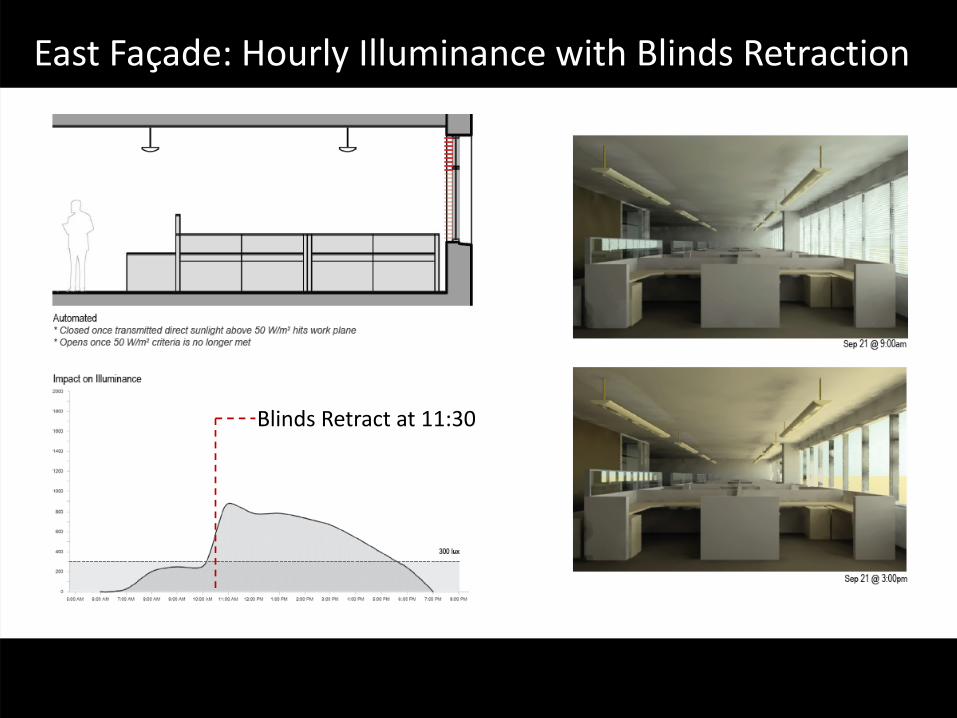
Blinds Retract at 11:30
East Façade: Hourly Illuminance with Blinds Retraction
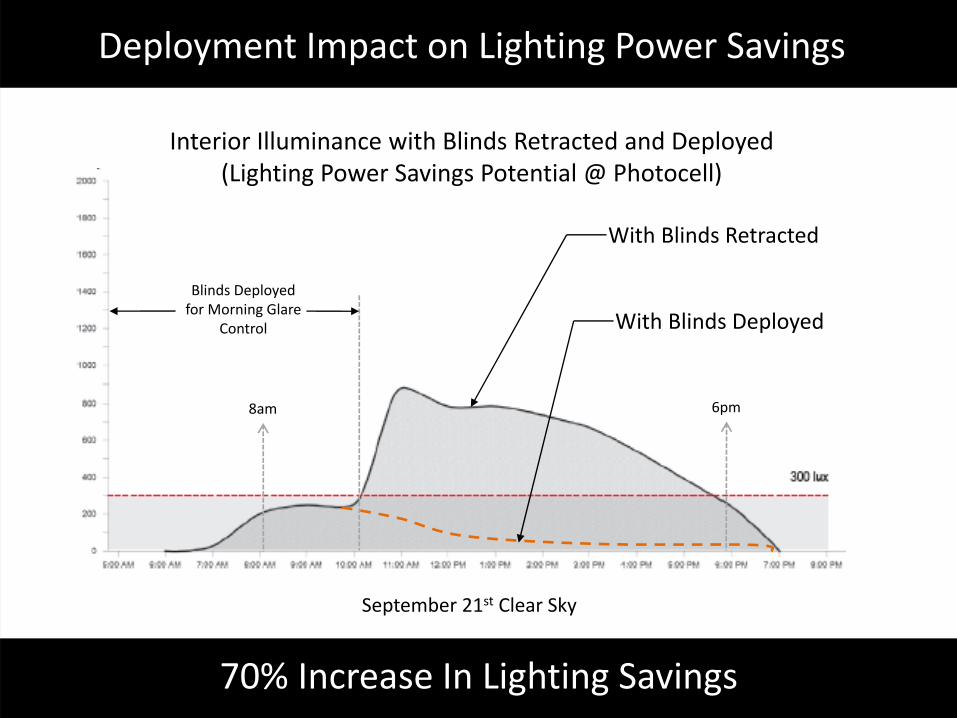
Deployment Impact on Lighting Power Savings
Interior Illuminance with Blinds Retracted and Deployed(Lighting Power Savings Potential @ Photocell)
With Blinds Retracted
With Blinds Deployed
8am 6pm
70% Increase In Lighting Savings
September 21st Clear Sky
Blinds Deployedfor Morning Glare
Control

Architectural Record
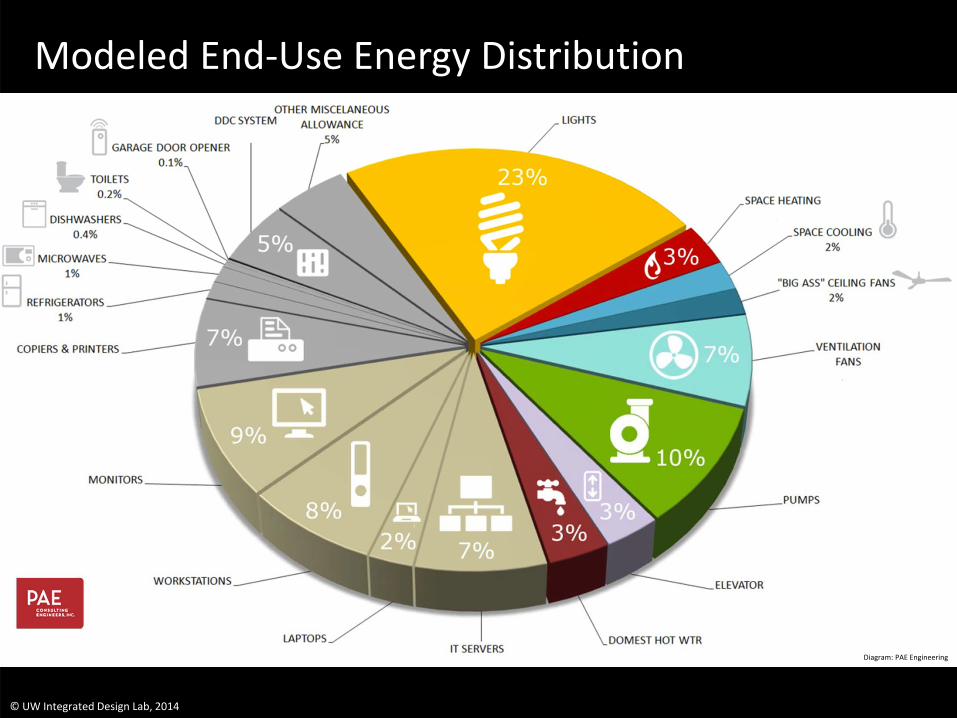
Modeled End‐Use Energy Distribution
© UW Integrated Design Lab, 2014
Diagram: PAE Engineering
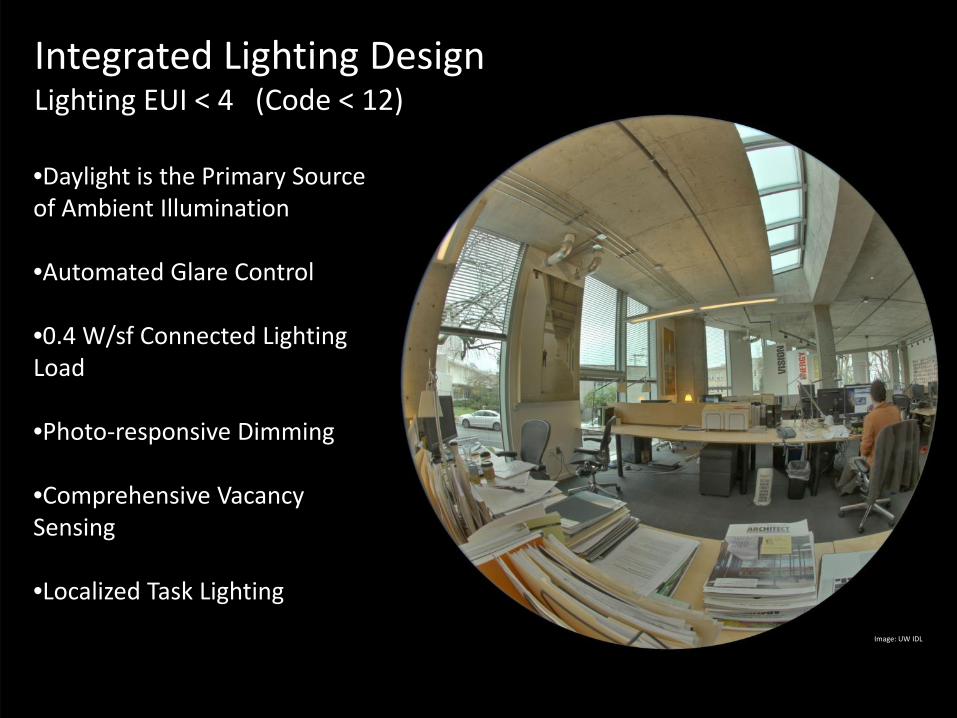
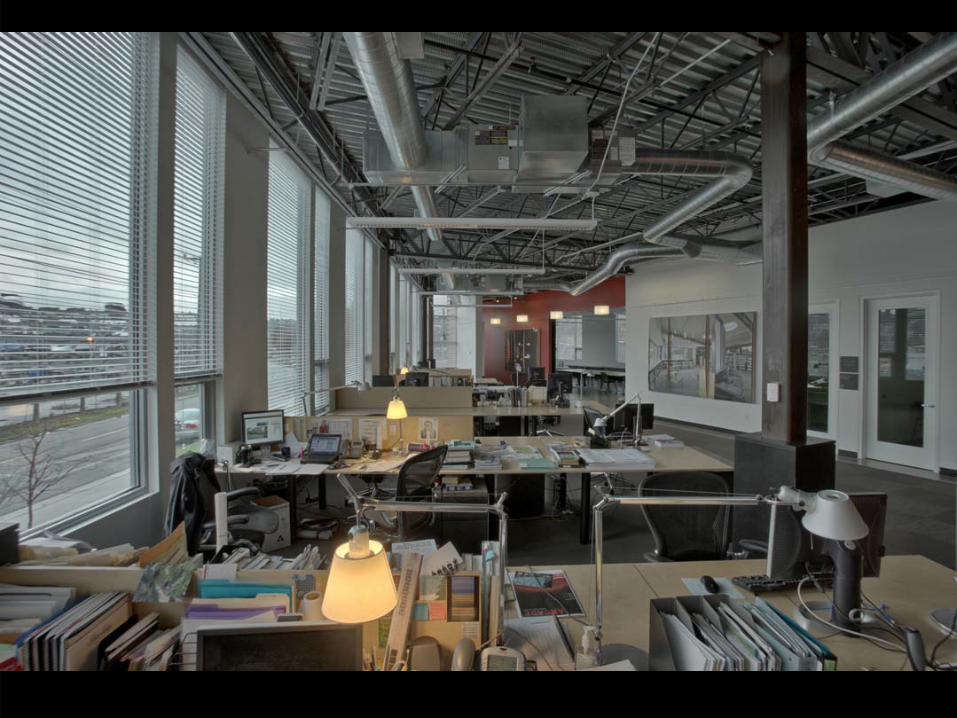
Integrated Lighting DesignLighting EUI < 4 (Code < 12)
•Daylight is the Primary Source of Ambient Illumination
•Automated Glare Control
•0.4 W/sf Connected Lighting Load
•Photo‐responsive Dimming
•Comprehensive Vacancy Sensing
•Localized Task LightingImage: UW IDL
Architectural Record
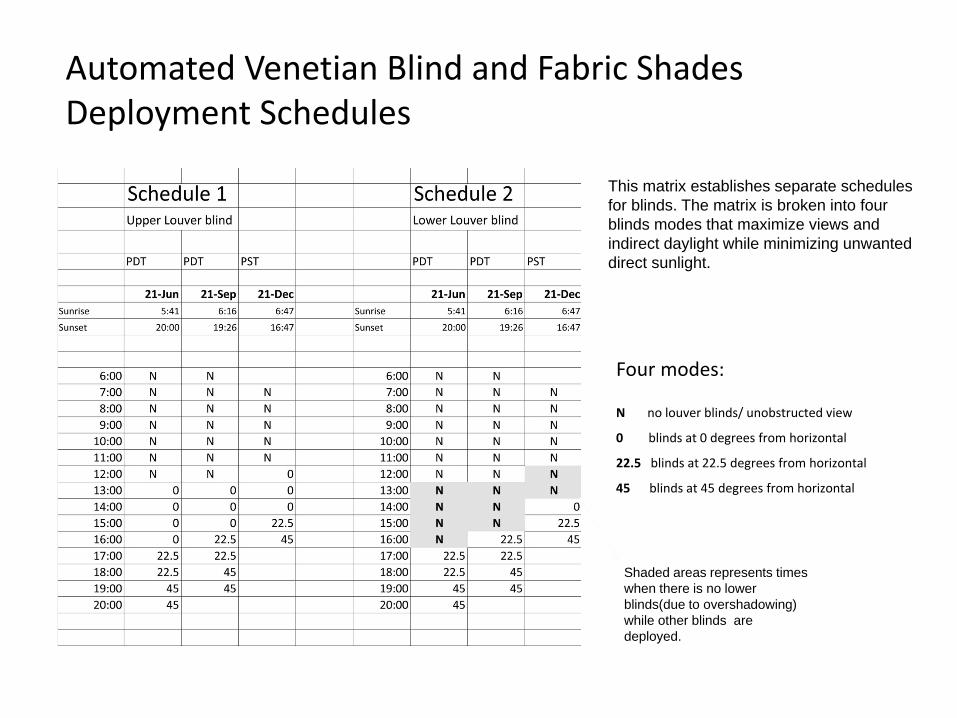
Automated Venetian Blind and Fabric Shades Deployment Schedules
Four modes:
N no louver blinds/ unobstructed view
0 blinds at 0 degrees from horizontal
22.5 blinds at 22.5 degrees from horizontal
45 blinds at 45 degrees from horizontal
This matrix establishes separate schedules for blinds. The matrix is broken into four blinds modes that maximize views and indirect daylight while minimizing unwanted direct sunlight.
Shaded areas represents times when there is no lower blinds(due to overshadowing) while other blinds are deployed.
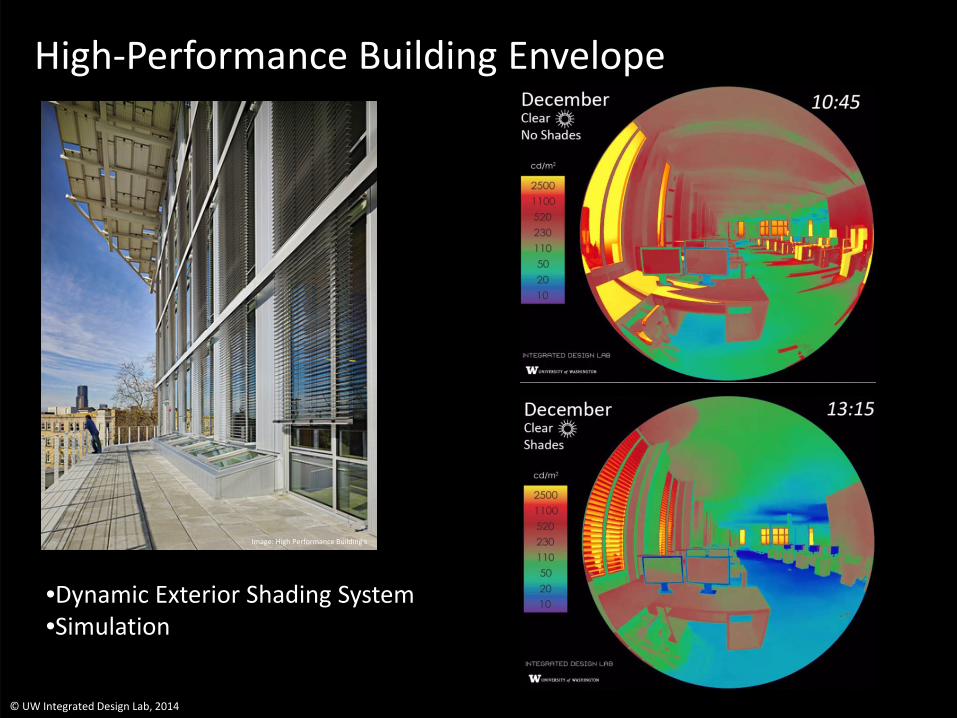
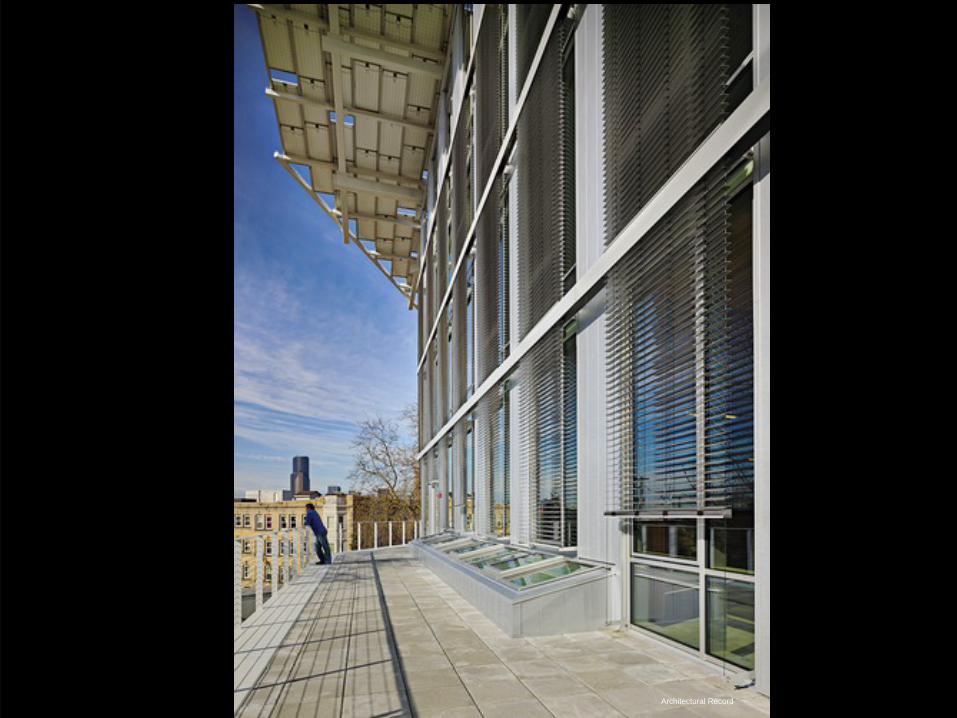
•Dynamic Exterior Shading System•Simulation
High‐Performance Building Envelope
© UW Integrated Design Lab, 2014
Image: High Performance Building s
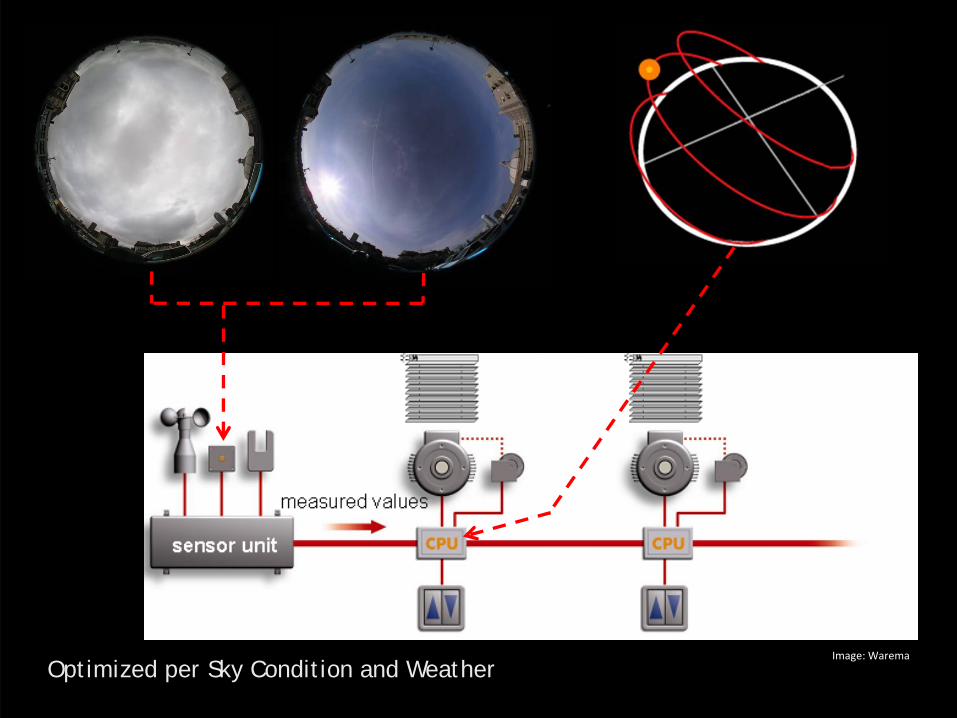
Optimized per Sky Condition and WeatherImage: Warema
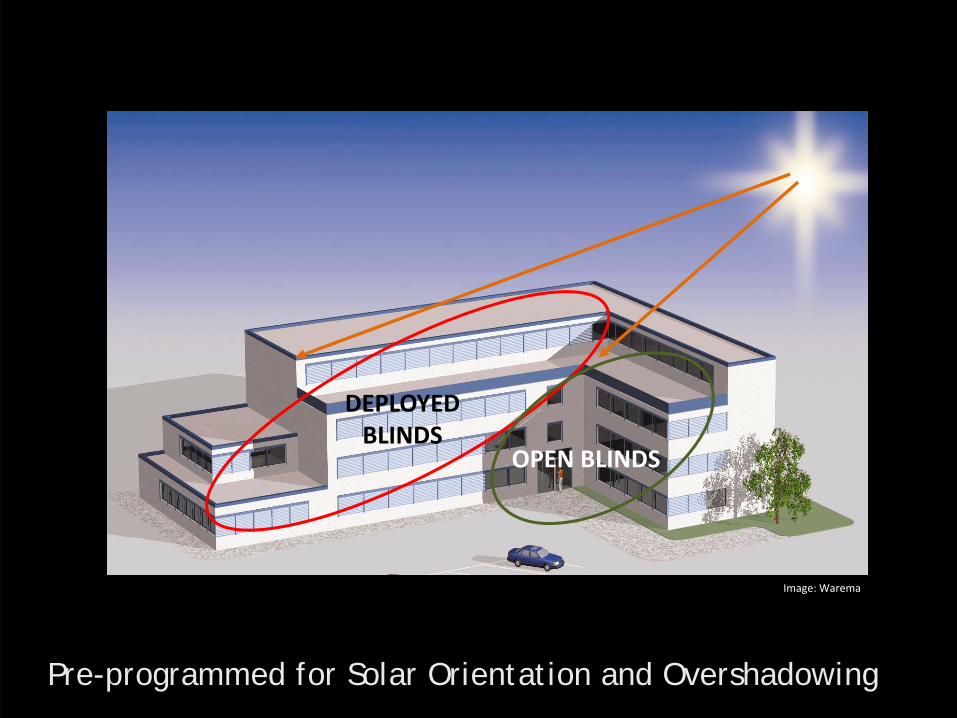
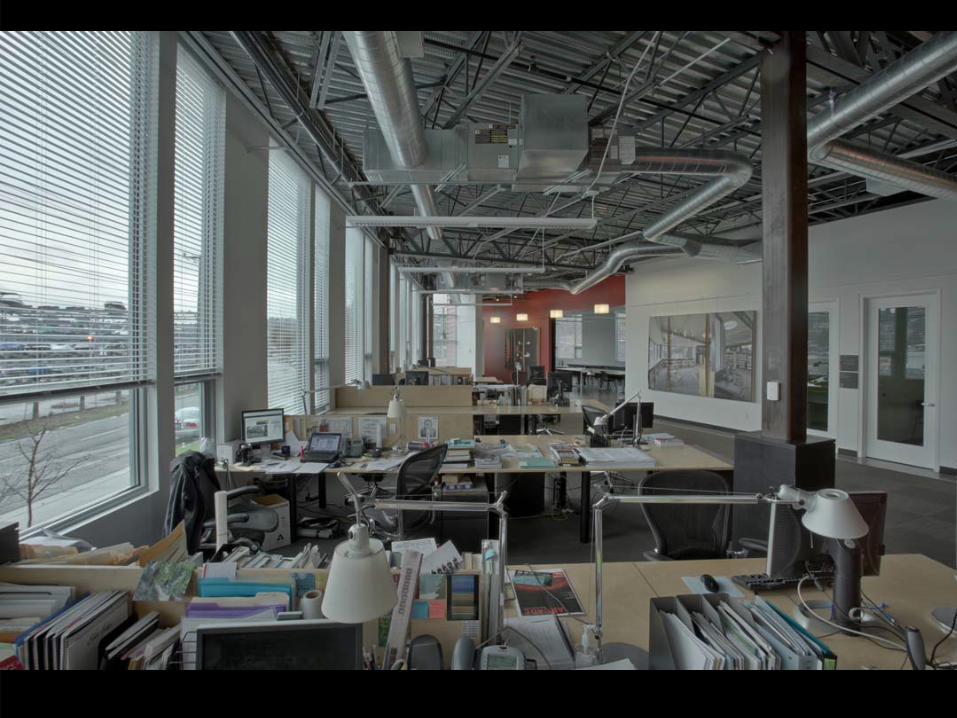
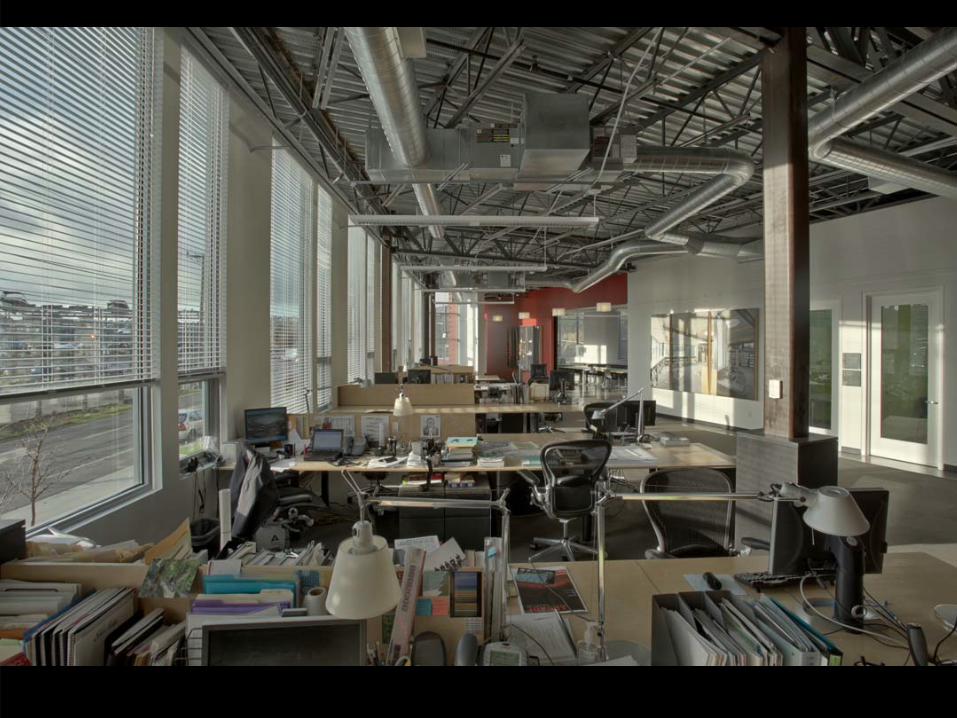
DEPLOYED BLINDS
OPEN BLINDS
Pre-programmed for Solar Orientation and Overshadowing
Image: Warema
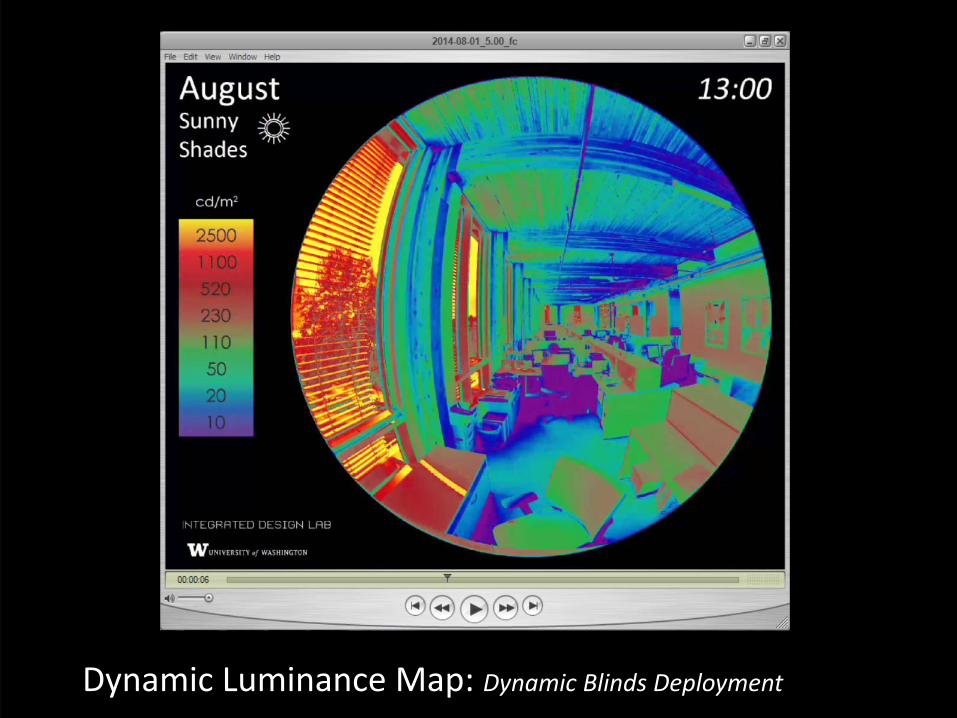
Dynamic Luminance Map: Dynamic Blinds Deployment
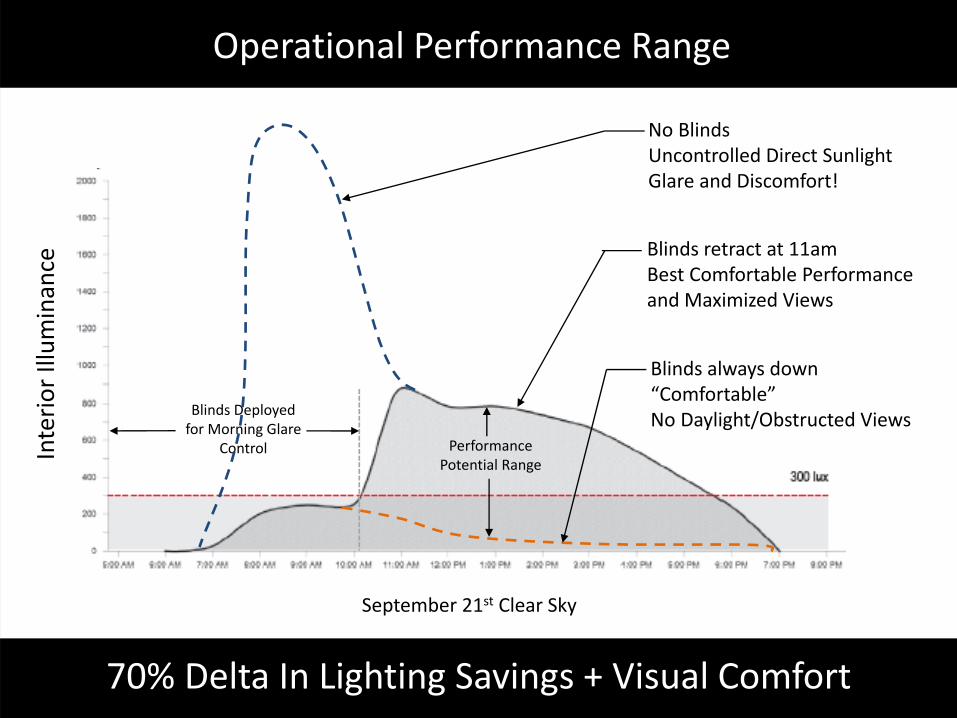
Operational Performance RangeInterio
r Illuminance
Blinds retract at 11amBest Comfortable Performanceand Maximized Views
Blinds always down“Comfortable”No Daylight/Obstructed Views
70% Delta In Lighting Savings + Visual Comfort
September 21st Clear Sky
Blinds Deployedfor Morning Glare
Control
No BlindsUncontrolled Direct SunlightGlare and Discomfort!
Performance Potential Range
Thank you!
Christopher Meek, AIA Integrated Design Lab
Research Associate Professor University of Washington Department of Architecture [email protected] www.idlseattle.com