rethinking daylighting and compliance
TRANSCRIPT

SDAR* Journal of Sustainable Design & AppliedResearch
Volume 1 | Issue 3 Article 1
2013-10-28
Rethinking daylighting and complianceJohn Mardaljevic MrLoughborough University, [email protected]
Follow this and additional works at: http://arrow.dit.ie/sdar
Creative Commons LicenseThis work is licensed under a Creative Commons Attribution-Noncommercial-Share Alike 3.0 License
Recommended CitationMardaljevic, John Mr (2013) "Rethinking daylighting and compliance," SDAR* Journal of Sustainable Design & Applied Research: Vol.1: Iss. 3, Article 1.Available at: http://arrow.dit.ie/sdar/vol1/iss3/1

Rethinking daylighting and compliance
Cover Page FootnoteThe author owes a debt of gratitude to colleagues who serve on WG11, and also to Paula Esquivias Fernández(University of Seville), for many thought-provoking discussions on the nature of daylight metrics.
This article is available in SDAR* Journal of Sustainable Design & Applied Research: http://arrow.dit.ie/sdar/vol1/iss3/1

Rethinking daylighting andcompliance
John Mardaljevic School of Civil and Building Engineering,
Loughborough University, Loughborough,
Leicestershire, LE11 3TU, UK
BuildingBuildingServicesServicesnews
1
Mardaljevic: Rethinking daylighting and compliance
Published by ARROW@DIT, 2013

Abstract
Daylight in buildings is the natural illumination
experienced by the occupants of any man-made
construction with openings to the outside. Our
attempts to formulate some measure of daylight
provision in buildings can be traced back over a
century, and the daylight factor as we know it
today is over 50 years old. Still the most common
measure found in guidelines and recommendations
worldwide, the daylight factor is used routinely
and, it is fair to say, often rather uncritically.
The consideration of daylight in buildings has
received a new impetus from the accumulation of
evidence on the wider benefits of daylight exposure.
But it is continuing to prove difficult to advance
beyond daylight factors towards a more realistic
quantification of daylighting performance that would
allow us to accommodate these new considerations
in an evaluative schema.
This paper examines the basis of current practice with
respect to daylight evaluation, and suggests a few
ways in which it can be improved with relatively-
modest additional effort. The paper also critiques
some of the recent attempts to advance daylight
evaluation by incremental means using so-called
“clear sky options”.
Key Words:
Daylight standards, daylight modelling, CIE overcast
sky, daylight factor.
1. BackgroundTowards the end of the 1990s the daylighting of buildings beganto achieve greater attention than had previously been the case.There were a number of reasons for this, but the two mostimportant “drivers” were:
1. the widespread belief that the potential to save energy througheffective daylighting was greatly under-exploited; and,
2. the emergence of data suggesting that daylight exposure hasmany positive productivity, health and well-being outcomes forbuilding occupants.
The first originated with the widely-accepted need to reducecarbon emissions from buildings in order to minimise the anticipatedmagnitude of anthropogenic climate change. This in turn led to theformulation of guides and recommendations to encourage thedesign and construction of “low energy” buildings and also for the retrofit of existing buildings. All these guides containrecommendations on daylighting, invariably founded on the daylightfactor or an equally-simplistic schema such as glazing factors [1].
The second driver was the gradual accumulation of data fromdisparate sources on the non-visual effects of daylight exposure.These effects are believed to be wide-ranging and includeproductivity and health/well-being, e.g., academic achievement,retail sales, recovery in hospitals, entrainment of circadian rhythm,etc. The mechanisms for these effects are not yet fully understood,and it is not yet known what the preferred exposure levels should be, nor if existing guidelines would be effective for these quantities [2].
Nonetheless, given the still relatively-low cost of electric lighting –and the potential for it to be further reduced with solid-statelighting – there is evidence to suggest that the cost-benefit fromincreased productivity due to good daylighting could be far greaterthan the cost-saving from reduced-energy expenditure [3]. Thus thesecond of these drivers has been promoted on both economic andenvironmental quality grounds.
Almost concurrent with the emergence of the two key driversnoted above were a major advance in the way daylight in buildingscould be modelled, and the development of numerous new glazingsystems and materials to better exploit daylighting in buildings.These developments are expected to lead to significant changes inthe way that daylight in buildings is both evaluated, i.e., usingclimate-based daylight modelling (CBDM), and exploited, e.g., bynew glazing systems and materials.
It should be noted that the performance of these new glazingsystems often depends on their ability to shade and/or redirectsunlight. Thus they can only be reliably assessed using CBDM – thestandard approaches (e.g., daylight factor) are unsuited to the task.
Notwithstanding that it is over a decade since CBDM was firstdemonstrated and its effectiveness subsequently proven on a range
CIBSE Sustainable Awards 2013
2
2
SDAR* Journal of Sustainable Design & Applied Research, Vol. 1, Iss. 3 [2013], Art. 1
http://arrow.dit.ie/sdar/vol1/iss3/1

Rethinking daylighting and compliance
3
of “real world” projects, daylight criteria in most guidelines andrecommendations are still founded on the daylight factor. Morerecently there have been attempts to advance the DF methodincrementally using so-called “clear sky” evaluations, though theseappear unsatisfactory for the following reasons.
There are a number of reasons why it has proven difficult to advancetowards metrics founded on climate-based daylight modelling.Perhaps part of the difficulty in effecting this “journey” is that weare not entirely certain regarding the point of departure – whatexactly is the basis and rationale for the ubiquitous daylight factormethod? This paper dissects both the basis of the method (i.e.,relative values predicted using the CIE standard overcast sky) andhow it is often applied to characterise a space, e.g., by giving anaverage daylight factor value.
The three sections that follow the note below are “vignettes” ofhow I imagine the much-needed deeper discussions on thesematters might progress. The logic presented is mainly by way ofargument illustrated with a handful of examples. The tests requiredto definitively confirm or disprove the various hypotheses framedhere are beyond the scope of a relatively brief paper. However, Ihope that the reader will find the propositions sufficiently intriguingto engender further debate on these matters.
1.1 A note on the origin and formulation of the
daylight factor
It appears that the daylight factor, or at least its precursor, was firstproposed in 1895 by Alexander Pelham Trotter (1857-1947) [4]. Theorigins of the daylight factor are actually somewhat hazy sincethere appears not to have been a seminal paper introducing theapproach. The reference to its introduction in 1895 appears to beanecdotal and recalled a number of years later.
The daylight factor was conceived as a means of rating day-lighting performance independently of the actually-occurring,instantaneous sky conditions. Hence it was defined as the ratio ofthe internal horizontal illuminance Ein to the unobstructed(external) horizontal illuminance Eout, usually expressed as apercentage, Figure 1. However, the external conditions still need
to be defined since the luminance distribution of the sky willinfluence the value of the ratio.
At the time that the daylight factor was first proposed it wasassumed that heavily-overcast skies exhibited only moderatevariation in brightness across the sky dome, and so they could be considered to be of constant (i.e., uniform) luminance.Measurements revealed however that a densely-overcast skyexhibits a relative gradation from darker horizon to brighter zenith; this was recorded in 1901.
With improved, more sensitive measuring apparatus, it was shownthat the zenith luminance is often three times greater than thehorizon luminance for some of the most heavily-overcast skies [5].A new formulation for the luminance pattern of overcast skies waspresented by Moon and Spencer in 1942, and it was adopted as astandard by the CIE in 1955. Normalised to the zenith luminanceLz , the luminance distribution of the CIE standard overcast sky hasthe form:
Lθ = Lz (1 + 2 sin θ)
3
where Lθ is the luminance at an angle θ from the horizon and Lzis the zenith luminance (Figure 1).
2. Being mean to the averageIt is proposed here that the average should no longer be used as ameans to summarise measures such as the daylight factordistribution. The average is typically used to give a “bottom line”number which is intended to be the sole daylight performanceindicator for the space. Instead, the median (or a quartile) shouldbe employed whenever a single quantity is required to characterisea space.
The average tells us nothing about the distribution of DF in thespace, whereas the median does. The average can be a quitemisleading quantity when applied to daylight distributions,especially for spaces illuminated from vertical glazing on one wallwhere the very high DFs close to the windows can significantlyinfluence the average DF value. Because of this, the average is very
Figure 1: Definition of the daylight factor and the CIE standard overcast sky
3
Mardaljevic: Rethinking daylighting and compliance
Published by ARROW@DIT, 2013

sensitive to the proximity of the sensor plane to the glazing. Thecloser the sensor points are to the glazing, the higher the averagefor the daylight factor distribution in the space.
As far as I am aware, it was not until the appearance of the 2011revision of Lighting Guide 5 (LG5) that a recommendation for aperimeter zone between sensor points and glazing/walls has beengiven in a UK guideline for simulation. LG5 recommends a 0.5mgap (perimeter zone) – which seems reasonable, though it shouldbe noted that the rationale given in LG5 (i.e. to avoid the low valuesat the back of the space) is incorrect.
The upper section of the plot shown in Figure 2 gives the DFdistribution across (half) of a 6m wide by 9m deep side-lit space(2.7m floor to ceiling height). Here the sensor plane covers the entire6m by 9m internal plan, though the glazing is located on the outerside of a 0.2m reveal (so it is not quite a worst-case regarding closeproximity of the sensor plane to the glazing). The average DF forthis scenario was 2.8%, however the median value was only 1.1%.
With the latter we know that only half the area of the space hasachieved a DF of 1.1%, whereas with the average we have no suchcertainty. More worryingly, the average can in some people’s mindsbe conflated with the median, thereby giving a completely falseimpression of the DF distribution for the space. Having a reasonableperimeter (e.g., 0.5m) reduces the size of the false impression givenby the average, but it does not eliminate it.
In contrast, the median value is largely insensitive to the size of theperimeter, and so it is not only a more informative measure, it isalso more robust since it is largely unaffected by any “gameplaying” with respect to the placement and size of the perimeter.
.
3. A gloomy view of the CIE overcast skyAt first glance, the CIE overcast sky seems a reasonable basis for theevaluation of daylight in buildings. This “feeling” is perhapsformed, or at least bolstered, from seeing phrases such as thesecommonly found in documents pertaining to daylight evaluation:“the overcast sky represents worst case conditions”; “the daylightfactor is defined as the worst case”; and, “the daylight factor wasinvented in northern Europe where the fully overcast sky iscommon”.
The implication being that, if we provide a certain measure ofdaylight for the “worst case”, then surely it can only be better thanthat for the rest of the time. However, while such notions aresuggestive, the rationale for the daylight factor has rarely, if ever,been rigorously expounded. For example, what exactly is meant by“worst case”? Is it that the absolute values provided by the sky(i.e., the diffuse horizontal illuminance) is (are?) “worst case”, or isit perhaps that the luminance distribution on the sky vault is a“worst case”? Or maybe a combination of the two?
Moreover, if the daylight factor is suitable for “northern Europe”,what is the extent of its zone of applicability? The daylightevaluation in the first edition of the Estidama Pearls Design Systemfor Abu Dhabi was founded on daylight factors, i.e., the CIEstandard overcast sky [6]. A quick examination of the standard
climate for Abu Dhabi reveals that it is almost never overcast in thatregion of the United Arab Emirates. This, not unexpectedobservation, suggests that at least in some instances the daylightfactor has indeed been applied well outside of its “zone ofapplicability”, notwithstanding the uncertainty regarding its preciseboundaries.
The link between (relative) daylight factors (i.e. percentage values)and absolute levels of illuminance (i.e. lux) has always beentenuous. DFs are of course derived from absolute values, but thelatter are often ignored thereafter. Design guides often giverecommendations in terms of daylight factors, but then alsosuggest that daylight should provide illuminances of say 300 lux ormore for much of the year. Building Bulletin 90 (Lighting Designfor Schools) does describe how to relate DFs to estimates ofachieved absolute illuminance [7], but these “conversions” are rarelycarried out.
In Australia and New Zealand a uniform sky is used for what are ineffect “daylight factor” calculations, though the sensor plane is setat floor level rather than at desk height, introducing anotherdissimilarity when comparing methods. The differences in predicteddistributions between “classic” daylight factor (i.e., overcast skyand sensor plane at desk height) and the option recommended inAustralia/NZ (i.e., uniform sky with sensor plane on the floor) isrevealed by comparing the plots shown in Figure 2. The metricsderived from each of the four distributions are given in Table 1.
CIBSE Sustainable Awards 2013
4
Figure 2: Daylight factor distribution for CIE standard overcast and uniformskies
10% 5% 2% 1% 0.5%
CIE overcast sky
Uniform sky
10% 5% 2% 1%
9m
6m
5% 2% 1%
CIE overcast sky
Uniform sky
5% 2% 1%
6m
Sensor plane at desk height
Sensor plane at floor level
4
SDAR* Journal of Sustainable Design & Applied Research, Vol. 1, Iss. 3 [2013], Art. 1
http://arrow.dit.ie/sdar/vol1/iss3/1
5
Rethinking daylighting and compliance
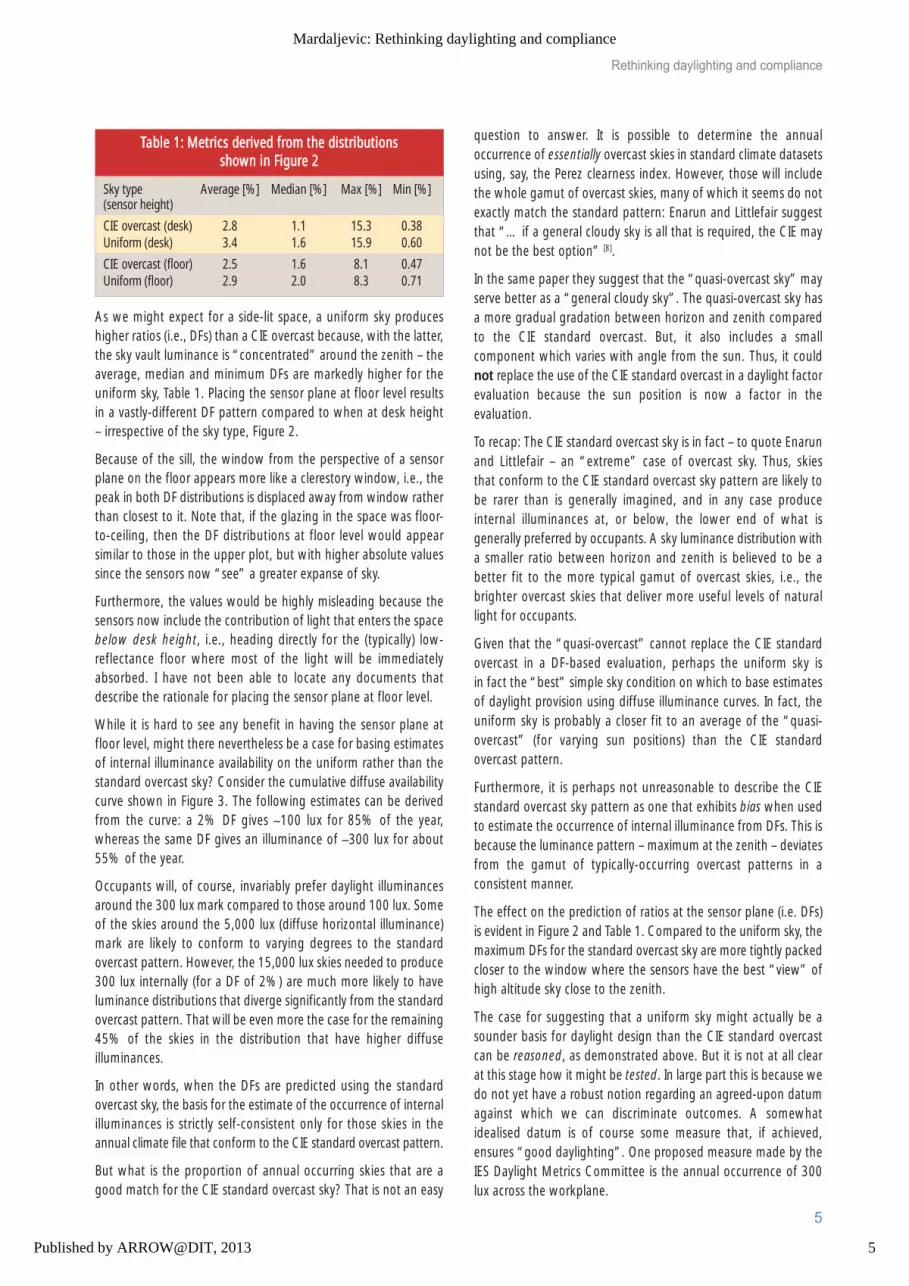
As we might expect for a side-lit space, a uniform sky produceshigher ratios (i.e., DFs) than a CIE overcast because, with the latter,the sky vault luminance is “concentrated” around the zenith – theaverage, median and minimum DFs are markedly higher for theuniform sky, Table 1. Placing the sensor plane at floor level resultsin a vastly-different DF pattern compared to when at desk height– irrespective of the sky type, Figure 2.
Because of the sill, the window from the perspective of a sensorplane on the floor appears more like a clerestory window, i.e., thepeak in both DF distributions is displaced away from window ratherthan closest to it. Note that, if the glazing in the space was floor-to-ceiling, then the DF distributions at floor level would appearsimilar to those in the upper plot, but with higher absolute valuessince the sensors now “see” a greater expanse of sky.
Furthermore, the values would be highly misleading because thesensors now include the contribution of light that enters the spacebelow desk height, i.e., heading directly for the (typically) low-reflectance floor where most of the light will be immediatelyabsorbed. I have not been able to locate any documents thatdescribe the rationale for placing the sensor plane at floor level.
While it is hard to see any benefit in having the sensor plane atfloor level, might there nevertheless be a case for basing estimatesof internal illuminance availability on the uniform rather than thestandard overcast sky? Consider the cumulative diffuse availabilitycurve shown in Figure 3. The following estimates can be derivedfrom the curve: a 2% DF gives ∼100 lux for 85% of the year,whereas the same DF gives an illuminance of ∼300 lux for about55% of the year.
Occupants will, of course, invariably prefer daylight illuminancesaround the 300 lux mark compared to those around 100 lux. Someof the skies around the 5,000 lux (diffuse horizontal illuminance)mark are likely to conform to varying degrees to the standardovercast pattern. However, the 15,000 lux skies needed to produce300 lux internally (for a DF of 2%) are much more likely to haveluminance distributions that diverge significantly from the standardovercast pattern. That will be even more the case for the remaining45% of the skies in the distribution that have higher diffuseilluminances.
In other words, when the DFs are predicted using the standardovercast sky, the basis for the estimate of the occurrence of internalilluminances is strictly self-consistent only for those skies in theannual climate file that conform to the CIE standard overcast pattern.
But what is the proportion of annual occurring skies that are agood match for the CIE standard overcast sky? That is not an easy
question to answer. It is possible to determine the annualoccurrence of essentially overcast skies in standard climate datasetsusing, say, the Perez clearness index. However, those will includethe whole gamut of overcast skies, many of which it seems do notexactly match the standard pattern: Enarun and Littlefair suggestthat “… if a general cloudy sky is all that is required, the CIE maynot be the best option” [8].
In the same paper they suggest that the “quasi-overcast sky” mayserve better as a “general cloudy sky”. The quasi-overcast sky hasa more gradual gradation between horizon and zenith comparedto the CIE standard overcast. But, it also includes a smallcomponent which varies with angle from the sun. Thus, it couldnot replace the use of the CIE standard overcast in a daylight factorevaluation because the sun position is now a factor in theevaluation.
To recap: The CIE standard overcast sky is in fact – to quote Enarunand Littlefair – an “extreme” case of overcast sky. Thus, skies that conform to the CIE standard overcast sky pattern are likely tobe rarer than is generally imagined, and in any case produceinternal illuminances at, or below, the lower end of what isgenerally preferred by occupants. A sky luminance distribution witha smaller ratio between horizon and zenith is believed to be abetter fit to the more typical gamut of overcast skies, i.e., thebrighter overcast skies that deliver more useful levels of natural light for occupants.
Given that the “quasi-overcast” cannot replace the CIE standardovercast in a DF-based evaluation, perhaps the uniform sky is in fact the “best” simple sky condition on which to base estimatesof daylight provision using diffuse illuminance curves. In fact, theuniform sky is probably a closer fit to an average of the “quasi-overcast” (for varying sun positions) than the CIE standard overcast pattern.
Furthermore, it is perhaps not unreasonable to describe the CIEstandard overcast sky pattern as one that exhibits bias when usedto estimate the occurrence of internal illuminance from DFs. This isbecause the luminance pattern – maximum at the zenith – deviatesfrom the gamut of typically-occurring overcast patterns in aconsistent manner.
The effect on the prediction of ratios at the sensor plane (i.e. DFs)is evident in Figure 2 and Table 1. Compared to the uniform sky, themaximum DFs for the standard overcast sky are more tightly packedcloser to the window where the sensors have the best “view” ofhigh altitude sky close to the zenith.
The case for suggesting that a uniform sky might actually be asounder basis for daylight design than the CIE standard overcastcan be reasoned, as demonstrated above. But it is not at all clearat this stage how it might be tested. In large part this is because wedo not yet have a robust notion regarding an agreed-upon datumagainst which we can discriminate outcomes. A somewhatidealised datum is of course some measure that, if achieved,ensures “good daylighting”. One proposed measure made by theIES Daylight Metrics Committee is the annual occurrence of 300lux across the workplane.
Sky type Average [%] Median [%] Max [%] Min [%](sensor height)
CIE overcast (desk) 2.8 1.1 15.3 0.38Uniform (desk) 3.4 1.6 15.9 0.60
CIE overcast (floor) 2.5 1.6 8.1 0.47Uniform (floor) 2.9 2.0 8.3 0.71
Table 1: Metrics derived from the distributions shown in Figure 2
5
Mardaljevic: Rethinking daylighting and compliance
Published by ARROW@DIT, 2013

4. New approaches: Do ‘halfway’ methods work?
The “clear sky option” appears to have been introduced in LEEDversion 2.2 as a means to overcome the limitations of theclimate/orientation insensitive glazing factor and daylight factormethods. To achieve credit 8.1, the requirement can be:
Demonstrate, through computer simulation, that a minimumdaylight illumination level of 25 footcandles has been achievedin a minimum of 75% of all regularly occupied areas. Modellingmust demonstrate 25 horizontal footcandles under clear skyconditions, at noon, on the equinox, at 30 inches above the floor.
While this may appear reasonable at first, the LEED v2.2documentation gives no supplementary data for the evaluation.This omission all but renders the evaluation meaningless since thereis no statement regarding the diffuse horizontal illuminance thatthe sky should be normalised against. The user, it seems, is to trustthe default value that is provided by the sky generator program.The default value is an extremely coarse approximation with somelatitude dependance (and of course time of day/year), but no basiswhatsoever in local, prevailing climatic conditions.
Many users are unaware that the key input parameter for theirsimulation is of dubious provenance and has been automatically
selected on their behalf. It gets worse, as there is no mention ofwhat the sun luminance (usually derived from direct normalilluminance) should be. This too is surprising, since the suncontribution will greatly add to the illuminances resulting from the diffuse sky (which will depend on the unspecified diffusehorizontal illuminance anyway).
Given the relatively modest target illuminance (around 250 lux) itseems likely that the evaluation is meant to be carried out using aclear sky distribution without a sun. This, of course, is a physicalimpossibility in reality. Anecdotal evidence has confirmed that usersof LEED have indeed “demonstrated compliance” with therecommendations and obtained Daylight Credit 8.1 by using aphysically-impossible luminous environment (i.e., clear sky withoutsun) that is normalised to an unknown diffuse horizontalilluminance.
ASHRAE Standard 189.1 (2009) has a similar clear sky option to LEED. As with LEED, there is no mention of normalising the skyto a specified diffuse horizontal illuminance, so the sameshortcomings (outlined above) apply. As with the LEED Clear Skyoption, the ASHRAE draft guidelines suggest (but do not clearlystate) that the clear sky modelling is to be done without a sun –which is, as noted above, a physically impossible illuminationcondition in nature.
CIBSE Sustainable Awards 2013
6
0 10 20 30 40 50 600Diffuse illuminance (klux)
0
20
40
60
80
100%
of w
orkin
g ye
ar d
iffuse
illum
inanc
e ex
ceed
ed
2% DF gives ~100lux for ~85% time
2% DF gives ~300lux for ~55% time
Skies increasingly lesslikely to be overcast
Limitednumberstandardovercast
80
100m
inanc
e ex
ceed
ed
20
40
60
f wor
king
year
diffu
se ill
um
00 100%
of
FD%2
0 20 30Diffuse illumin
%5~8rofxul00~1sveig
ul00~3s veigFD%2
40 50nance (klux)
meit%
meit%5~5rofx
60
Figure 3: Cumulative curve showing diffuse illuminance availability
6
SDAR* Journal of Sustainable Design & Applied Research, Vol. 1, Iss. 3 [2013], Art. 1
http://arrow.dit.ie/sdar/vol1/iss3/1

The ASHRAE draft states that either the CIE Overcast or the CIEClear sky model may be used. This offers intriguing possibilities tothe artful compliance chaser, since the outcome it turns outdepends to a large degree on what default values “drop out” ofthe sky generator program. Since many practitioners use theRadiance lighting system, either in its raw (UNIX) form or in one ofthe many bundled packages, it’s instructive to see how differentthe outcomes can be depending on the choice of sky.
The Radiance (UNIX) command “gensky 3 20 12 –c” generates adescription of the brightness distribution of the CIE standardovercast sky for noon, 20 March (i.e., month 3). A similar commandgenerates the description for the CIE clear sky pattern. Theguidance gives no recommendation regarding normalisation of theskies to a known diffuse horizontal illuminance (Edh).
So, the diffuse horizontal illuminance of the resulting sky dependsentirely on how the sky model generator program gensky wasdevised to produce skies of either type, i.e., its default behaviour. Thediffuse horizontal illuminance for the two sky types turns out to bevery different – almost by a factor of two, Table 2. It may even seemcounterintuitive that, without any user intervention by way ofsupplying normalisation values, the diffuse horizontal illuminancefor the overcast sky should be nearly twice that of the clear sky.
However, the reason is quite straightforward. The sky modelgenerator program does not have any knowledge of localmeteorological conditions. What it does know are: latitude/longitude i.e., location (the default of Berkeley, USA is used in theexample), time of day/year and therefore sun position, and also theincident extraterrestrial solar radiation. This last part is apportionedbetween sky and sun (if present) depending on the selected sky type.
For an overcast sky the incident extraterrestrial solar radiation isreprocessed into diffuse sky radiation (using default values forturbidity etc). But, for a clear sky distribution, the extraterrestrialsolar radiation is apportioned between the sky radiation and the(now expected but not included) sun. Thus, the diffuse horizontalilluminance for the clear sky is lower (typically just over half usingthe gensky defaults) than the diffuse horizontal illuminance for theovercast sky.
Notwithstanding the differences in the sky luminance patterns, thedesigner “chasing” the attainment of an absolute level of interiorilluminance would be advised to opt for the overcast sky becauseof its much higher diffuse horizontal illuminance.
In recognition of what must be viewed as a less-than-ideal state ofaffairs regarding the lack of normalisation in the “clear sky option” ofVersion 2.2, the 2nd Public Comment Draft on LEED (July 2011)contains the following:
Demonstrate through computer simulations that the applicablespaces achieve illuminance levels between 300 lux and 3000lux for both of the following sky conditions:
– 9:00 am equinox on a clear-sky day (solar time)
– 3:00 pm equinox on a clear-sky day
Illuminance intensity for sun (direct component) and sky(diffuse component) for clear sky and overcast conditions forthose time periods shall be derived from the local weatherdata, or TMY weather tapes for the nearest city, first byselecting the two days within 15 days of September 21st andMarch 21st that represent the clearest sky and most overcastsky condition, and then averaging the hourly value for theappropriate spring and fall hour.
While this revision might, at first, be seen as “heading in the rightdirection”, it too has potential problems and confounding issues. Thepatterns of hourly values in the illuminance datasets are unique and,because of the random nature of weather, they will never be repeatedin precisely that way, Figure 4 (see next page).
Climate datasets are, however, representative of the prevailingconditions measured at the site, and they do exhibit much of the fullrange in variation that typically occurs, i.e., they provide definitiveyardstick quantities for modelling purposes – provided that the entireyear is used in the evaluation.
The solid lines on the plots in Figure 4 mark the times of the equinoxes,and the dashed lines mark the date 15 days either side of eachequinox. As is evident from the pattern, while it might be likely that asunny (i.e., clear sky) period occurs within 15 days either side of theequinox, it is by no means certain because of the random nature ofweather. Also, how “clear” is clear? That is not specified.
Thus, it is highly problematic to attempt to extract and define supposed“representative” illuminance data from climate files. Furthermore,“averaging” of any climatic illuminance data is risky since the user mustensure that the conditions to be averaged are indeed similar.
Based on the attempts made thus far, it does not seem possible toadvance the DF approach by incremental means, i.e., evaluations basedon “clear sky options”, “snap-shots” or “salami-slicing” of climatedata. Efforts in this direction have resulted in methods that are one ormore of the following: confusing, inconsistent, prone to the vagariesof patterns in climate data, and/or without a proven rationale. Thereseems to be no half-way house between a DF-based evaluation (e.g.,in conjunction with cumulative diffuse illuminance curves) and a full-blown annual evaluation using climate-based daylight modelling.
5. DiscussionNotwithstanding the more than occasional tone of a jeremiad, thisarticle is in fact intended to accentuate the positive – we do havethe means now with climate-based modelling to greatly advancethe basis of daylight evaluation for buildings. However, CBDM tools are still largely the preserve of lighting simulationexperts/researchers. For CBDM to become mainstream, thesoftware to do it needs to be taken up and supported by one ormore major software houses.
Rethinking daylighting and compliance
7
CIE sky type Radiance command Edh [lux]
Standard overcast gensky 3 20 12 –c 14,679
Standard clear gensky 3 20 12 –c 8,454
Table 2: Diffuse horizontal illuminance (Edh) for standard overcast and standard clear skies generated
without normalisation
7
Mardaljevic: Rethinking daylighting and compliance
Published by ARROW@DIT, 2013

Herein lies a classic “chicken and egg” conundrum. On one hand,those who draft guidelines are reluctant to recommend metricsfounded on CBDM because tools to predict the metrics aregenerally not available, at least not as supported software. On theother hand, the software vendors are understandably loathe todedicate the resources to develop and maintain CBDM toolsbecause – inasmuch as climate-based metrics are not in theguidelines – there will be no real market for these new tools. Thispresents something of an impasse to all those who strive toadvance daylighting standards beyond the current guidelines.
A suggested way around this impasse follows. In order to obtain“buy-in” from all stakeholders (e.g., standards bodies, designers,end-users, tool developers, etc) it is important that first theyrecognise the benefit of the changes proposed. These benefitsshould include the following:
• a more robust approach to evaluating daylight in buildingsusing existing tools with only modest enhancements;
• a methodology that allows for later progression to more reality-based evaluations;
• and, a transition roadmap with clear market horizons to ensurethat software vendors invest the necessary resources to developthe next generation of modelling tools (i.e., CBDM for ‘end-users’).
To this end, it is proposed that current standards based on daylightfactors should be upgraded as soon as possible to evaluationsfounded on the annual occurrence of an absolute value forilluminance (e.g., 300 lux) estimated from the cumulativeavailability of diffuse illuminance as determined from standardisedclimate files.
For example, a daylighting “target” could be that half of the sensorpoints in a side-lit space should achieve 300 lux for half of the timewhen the sun is above the horizon. This is an application of anestablished but largely-neglected approach [9]. Such an upgraderequires only a modest extension to existing DF software and,importantly, it provides some “connectivity” between the daylightavailability and the prevailing climate.
Note also that there may be good cause to use a uniform ratherthan a standard overcast sky for this evaluation.
Of course, this is not a full-blown climate-based solution sincedirect/indirect sun is not accounted for. However, unlike the“halfway” measures described in this article, the cumulativeilluminance approach has a defensible rationale. Furthermore, byshifting the analysis to measures of absolute illuminance, itprepares the ground for a relatively smooth transition to eventual,full-blown CBDM evaluations. One could envisage, say, a three year“overlap” period in standards/guidelines during which either the
CIBSE Sustainable Awards 2013
8
Direct Normal Illuminance
12
16
20
24
Hou
r
Diffuse Horizontal Illuminance
1 2 3 4 5 6 7 8 9 10 11 12Month
0
4
8
12
16
20
24
Hou
r
lux
0
10000
20000
30000
40000
50000
6000070000
Figure 4: Illuminance data from the standardised climate file for London
8
SDAR* Journal of Sustainable Design & Applied Research, Vol. 1, Iss. 3 [2013], Art. 1
http://arrow.dit.ie/sdar/vol1/iss3/1

Rethinking daylighting and compliance
9
cumulative illuminance approach or CBDM could be used todemonstrate compliance.
Then, at the end of that period, only evaluations founded on CBDMwould be permitted. Such a provision would encourage softwarehouses to invest the time and resources to develop end-user CBDMtools in the certainty of a guaranteed market for the product by adue date – thus solving the “chicken and egg” conundrum notedabove. Note that, although similar, or even identical, targets wouldbe used with either approach, with CBDM it would be necessary tomodel user deployment of blinds etc since direct (and indirect)sunlight now figures in the evaluation.
I hope that the issues raised here will be progressed in widerdiscussions within the daylighting community and relevantstakeholders. This article is the first of a series in support of theactivities of CEN TC 169/WG11. The second article “A Roadmap forUpgrading National/EU Standards for Daylight in Buildings” waspresented at the 2013 CIE Midterm conference in Paris, France [10].The proposal made to the CEN Technical Committee WG11 isdescribed in detail in the third paper of the series [11]. The fourthexamines the practicalities and pitfalls in eventually upgrading tofull climate-based metrics [12].
It should be noted that the views expressed in this paper are thoseof the author alone.
Acknowledgements
The author owes a debt of gratitude to colleagues who serve onWG11, and also to Paula Esquivias Fernández (University of Seville), formany thought-provoking discussions on the nature of daylight metrics.
References[1] J. Mardaljevic, L. Heschong, and E. Lee. Daylight metrics and energy
savings. Lighting Research and Technology, 41(3):261–283, 2009.
[2] M. Andersen, J. Mardaljevic, and S. W. Lockley. A framework forpredicting the non-visual effects of daylight – Part I: photobiology-based model. Lighting Research and Technology, 44(1):37–53, 03 2012.
[3] L. Heschong. Daylighting and human performance. ASHRAE Journal,44(6):65–67, 2002.
[4] J. A. Love. The evolution of performance indicators for the evaluation ofdaylighting systems. Industry Applications Society Annual Meeting,1992., Conference Record of the 1992 IEEE, pages 1830–1836 vol.2,1992.
[5] P. Moon and D. E. Spencer. Illuminations from a non-uniform sky. Illum.Eng., 37:707–726, 1942.
[6] Estidama. Pearls Design System - New Buildings Method. Abu DhabiUrban Planning Council, 2009.
[7] BB90. Lighting design for schools. Building Bulletin 90 (2008 revision),Department of Education and Skills, School Building and Design,London 2008.
[8] D. Enarun and P. Littlefair. Luminance models for overcast skies:Assessment using measured data. Lighting Research and Technology,27(1):53–58, 1995.
[9] D. R. G. Hunt. Improved daylight data for predicting energy savings fromphotoelectric controls. Lighting Research and Technology, 11(1):9–23,1979.
[10] J. Mardaljevic and J. Christoffersen. A Roadmap for UpgradingNational/EU Standards for Daylight in Buildings. CIE Midtermconference – Towards a new century of Light, Paris, France 12-19 April,2013.
[11 J. Mardaljevic, J. Christoffersen, and P. Raynham. A Proposal for aEuropean Standard for Daylight in Buildings. Lux Europa, Krakow,Poland, 17–19 September, 2013 (Abstract accepted, draft underreview).
[12] J. Mardaljevic. Daylight design, simulation and compliance for solarbuilding envelopes. Energy Forum – Advanced Building Skins,Bressanone, Italy, 5–6 November, 2013.
9
Mardaljevic: Rethinking daylighting and compliance
Published by ARROW@DIT, 2013