chemically modified carbon paste electrodes for ascorbic acid determination in soft drinks by flow...
TRANSCRIPT

Portugaliae Electrochimica Acta 26 (2008) 147-157 PORTUGALIAE ELECTROCHIMICA
ACTA
Chemically Modified Carbon Paste Electrodes for Ascorbic
Acid Determination in Soft Drinks by Flow Injection
Amperometric Analysis
M. Goreti F. Sales,
* M.S.A. Castanheira, Rosa M.S. Ferreira,
M. Carmo V.F. Vaz, and Cristina Delerue-Matos
Requimte/Instituto Superior de Engenharia do Porto
Rua Dr. António Bernardino de Almeida nº 431, 4200-072 Porto, Portugal
Received 1st August 2007; accepted 30
th January 2008
Abstract Simple, rapid and precise amperometric methods for quantification of ascorbic acid
(AA) are presented. Glassy carbon (GC), carbon paste (CP) and modified carbon paste
(MCP) electrodes are used for this purpose. MCP electrodes are of CP with 10 %
vanadate (V). All electrodes are inserted in a wall-jet device with an Ag/AgCl reference
electrode and a platinum auxiliary electrode. This device is coupled to a flow injection
analysis (FIA) set-up. Hydrodynamic and amperometric parameters are optimized
unvaryingly.
GC electrodes present slopes of 4.75 × 10⁵ nA L mol
-1 (± 6.4 %) under optimum
conditions. CP and MCP electrodes show higher sensitivity, with slopes of 6.37 × 10⁵
nA L mol-1 (± 6.6 %) and 7.32 × 10
5 nA L mol
-1 (± 4.4 %). Linear responses range (1.0-
2.0) × 10-6 to (0.8-1.0) × 10
-5 mol L
-1. Correlation coefficients were > 0.994 and about
48 samples are analysed per hour. Application of the proposed method to the analysis of
soft drinks is presented.
Keywords: ascorbic acid, chemically modified electrodes, flow-injection analysis,
amperometry.
Introduction
Antioxidant defences are extremely important for biological sites when under
oxidative stress [1], a process in which the dynamic redox balance between
oxidants and antioxidants is intensely shifted towards oxidative potentials.
Antioxidants play here an important role because of their ability to scavenge
* Corresponding author. E-mail address: [email protected]

M. Goreti F. Sales et al. / Portugaliae Electrochimica Acta 26 (2008) 147-157
148
radicals, neutralizing the highly instable free radical molecules by supplying
them with electrons and preventing, or at least limiting, the drain reactions that
cause tissue damage [2]. The intake of dietary antioxidants such as vitamin C
may provide higher antioxidant protection. The small stability of this antioxidant
when in aqueous media advises the rigorous control of its levels in commercial
beverages.
For this purpose, a wide variety of methods are presented in literature. Methods
based on spectrophotometric readings of UV [3-5] and Vis [6-13] radiations,
fluorimetric [14-21] and HPLC [22-32] are frequently reported. They regard
optical and separative techniques, and may require more or less sophisticated
equipment and extensive sample preparation procedures.
Electroanalytical based methods are currently widely used in many fields
because they meet the need of the analytical chemist for rapid, low-cost and
accurate analysis. Several voltammetric [33-36] and amperometric [37-46]
methods are also reported for AA determination. These are concerned with the
interplay between electricity and chemistry, namely the measurements of
electrical quantities, such as current, potential and charge, and their relationship
to chemical parameters. Several modifications have been tried out to enhance the
analytical features of current devices. Mediators of osmium [39], phthalocyanine
cobalt (II) [40], platinum [41], dichlorophenolindophenol [42], ferrocene and β-
cyclodextrin [43], ruthenium oxide [44], dihidroxibenzaldehyde [45], and
tetracyano-p-quinodimet [46] are described to enhance the analytical features of
the devices.
The present work describes the electrochemical determination of vitamin C by
means of several carbon based electrodes. Electrodes are made of GC, CP or
MCP, and are inserted in a wall-jet device coupled to a FIA. Operating
conditions of the flow system are optimized unvaryingly and operational features
evaluated.
Experimental
Apparatus
The flow injection assembly had a Gilson Minipuls 3 peristaltic pump equipped
with pumping tube of the same brand. Samples and standards were introduced
into the carrier stream through a six-port Rheodyne® 5020 injection valve of
exchangeable injection volumes. Omnifit PTFE tubes (0.8 mm i.d.) connected by
Gilson® end-fittings and joints were used in the construction of the manifold.
Confluence points were made in Perspex® as described elsewhere [47].
Amperometric detection was carried out in a Metrohm 656 wall-jet cell.
Commercial working, reference and auxiliary electrodes were of glassy carbon
(Metrohm 6.0805.01), Ag/AgCl (KCl 3.00 mol L-1, Metrohm 6.0727.000), and of
gold (Metrohm 6.530.320), respectively. A Metrohm 641 VA-detector was used
as amperometric detector and its output signals were recorded in a Kipp &
Zonnen BD 111 strip chart recorder.
When required, the glassy carbon electrode was cleaned mechanically by
polishing its surface in a special kit (Metrohm 6.2802.010) with α-Al2O3 (0.3
µm). Before use, the electrode was washed with water and dried on tissue paper.

M. Goreti F. Sales et al. / Portugaliae Electrochimica Acta 26 (2008) 147-157
149
Reagents and solutions
All reagents used were of analytical grade and water was purified with a Milli-Q
Millipore system. L-(+)-ascorbic acid (AA) was purchased from Riedel-de-Häen.
Ionic strength and pH adjustments required sodium hydroxide (Merck), sodium
hydrogen phosphate (Merck), potassium dihydrogen phosphate (Riedel-de-
Häen), acetic acid (Merck), phosphoric acid (Merck), boric acid (Riedel-de-
Häen) and potassium nitrate (Vaz Pereira). Epoxy resin (from local stores),
graphite (Sigma), mineral oil (Fluka), and ammonium vanadate (V) (AMV,
Riedel-de-Häen) were used to prepare the electrodes.
Stock solutions of AA (1.00 × 10⁻³ mol L
-1) were prepared daily by dissolving in
water an accurate amount of solid. The resulting solution was kept in the dark
and in a refrigerator at +4 ºC. Working standards were prepared by accurate
dilution of the previous ones in deionised water. Soft drinks were purchased in
local stores.
Procedures
MCP electrodes were prepared by dispersing in a mortar 0.1 g of ammonium
vanadate (V) in about 1.0 g of graphite powder. This mixture was added of 300
µL of mineral oil and 0.4 g of epoxy resin. The final paste was packed before
hardening into an electrode body, consisting of plastic tube with a copper wire
serving as an external electric contact. CP electrodes were prepared similarly by
removing the redox mediator from the graphite paste.
Figure 1. Schematic view of flow set-up. S: sample; C: carrier stream of deionised
water; B: buffer solution; X: confluence point; R: coiled reactor; P: peristaltic pump; I:
injection unit; W: waste; AMP: amperometric detector; Rec: recorder.
The diagram of the flow assembly is depicted in Fig. 1. Standard or sample
solutions (S) were injected into a deionised water carrier stream (C) that merged
in confluence X with a buffer solution (B). A coiled reactor (R) ensured
convenient mixture between solutions of confluent channels. The detection
device combined the working electrode (of GC, CP or MCP), an Ag/AgCl
reference electrode, and an auxiliary electrode made of gold. The signal output
was recorded in a strip-chart recorder. FI signals were evaluated in terms of peak
P
S
C
I
R
X
B
W
W
Rec
AMP

M. Goreti F. Sales et al. / Portugaliae Electrochimica Acta 26 (2008) 147-157
150
height, and after transformed in current (µA). Samples were analysed after
suitable dilution with water (to fit the linear range), and results were compared
with the FAO procedure [48].
Results and discussion
To provide AA determinations of enhanced sensitivity, several electrodes were
investigated. One detector was a commercial device made of GC. The other
electrodes were home-made, presenting a conventional configuration filled with
CP or MCP having vanadate as redox mediator.
All electrodes were evaluated in flow media, having as carrier a phosphate buffer
of pH 6.5. This buffer was selected in agreement with previous trial experiments
conducted with all units. Main hydrodynamic variables of the flow set-up were
optimized to enable sensitive and reproducible measurements with high sampling
throughputs. Selection of optimum conditions followed univariant procedures.
Figure 2. Values of ip for 5.0 × 10⁻⁶ mol L
-1 AA solutions measured with GC electrodes
at several potentials, injection volumes and flow-rates.
Glassy carbon electrode
Selection of electrode potential was made after recording the peak heights of 5.0
× 10-6 mol L
-1 AA solutions for different potential values (E), varying within 0.2
and 1.5 V. Plot of E (in V) against ip (Fig. 2) showed that an increase in potential
corresponded to a proportional increase in current. Considering that the higher
potentials would induce interfering effects of coexisting compounds, and the
lower ones would provide reduced sensitivity, the detection potential was set to
+0.8 V versus an Ag/AgCl (3 mol L-1 KCl).

M. Goreti F. Sales et al. / Portugaliae Electrochimica Acta 26 (2008) 147-157
151
Injection volume was varied between 130 and 510 µL (table 1). Amperometric
signals increased with sampling volumes (Fig. 2), until 370 µL was injected. The
higher sampling volumes produced a slight decrease in ip, thus suggesting that
long residence time of the sample plug would lead to a memory effect at the
detection unit. In addition, the cell washout process took longer, and conducted
to decreased sampling rates. Results pointed out the selection of 300 µL at
further experiments.
Table 1. Operating variables under study for the flow injection amperometric system.
Parameter Condition Studied range GC CP MCP
Flow rate (mL min-1) 1.8 – 5.2 2.3 2.3 2.3
Hydrodynamic
variables Injection volume (µL) 130 – 510 300 250 250
Electrode potentiala) (V) 0.4 – 1.6 + 0.8 V + 0.8 V + 0.8 V
Sensitivity (µA V-1) 10 10 10 Amperometric
analyser
Measurement mode (peak height, time based)
a) versus Ag/AgCl, 3 mol L
-1 KCl.
Total flow-rate was varied from 1.8 to 3.2 mL min-1 (table 1). This interval
considered limitations of flow pressure exerted upon the wall-jet cell [49], with a
dead volume of about 1 µL. No significant ip variations were observed within this
range (Fig. 2). Flow rates higher than 2.3 mL min-1 were not satisfactory since
they produced irreproducible signals in result of the high pressure exerted by
flowing solutions. Lower flow rates gave reproducible signals but provided
reduced sampling rates. As a compromise, results pointed out the selection of a
2.3 mL min-1 flow rate (table 1).
Carbon paste electrode
Effect of amperometric and hydrodynamic variables at the CP electrode response
was evaluated for 5.0 × 10⁻⁶ mol L
-1 AA solutions. This study was carried out
similarly to that previously described for GC electrodes.
Potential increase from 0.2 up to 1.5 V provided higher output signals. This
behavior is similar to the one presented by the GC electrode. Thus, and due to the
previously mentioned reasons, the detection potential was set to +0.8 V.
Injection volume was changed from 130 to 510 µL (table 1). Amperometric
signals were increased for increasing sampling volumes, as can be seen in Fig. 3.
Higher injection volumes required more sample volume and provided longer
residence times at the detection unit, conducting to longer cell washout periods,
and to decreased sampling rates. Small injection volumes were also responsible
for decreased analytical signals, conducting to decreased sensitivities. As a

M. Goreti F. Sales et al. / Portugaliae Electrochimica Acta 26 (2008) 147-157
152
compromise, an injection volume of 250 µL was selected in subsequent
experiments.
Figure 3. Values of ip for 5.0 × 10⁻⁶ mol L
-1 AA solutions measured with CP electrodes
at several potentials, injection volumes and flow-rates.
Flow-rates > 2.8 mL min-1 conducted to a slight decrease in ip (Fig. 4). This result
was coupled to an increase of sampling rate, as solution reached and left the
detector more quickly. As a compromise between sensitivity and sampling rates,
the flow-rate was set to 2.3 mL min-1 (table 1), the same value as the one selected
previously for the GC electrode.
Modified carbon past electrode
Selection of amperometric and hydrodynamic conditions followed similar
optimization steps to those of previous studies. Optimum potential was selected
after injection of 250 µL of 1.0 × 10⁻⁵ mol L
-1 AA solution. A similar behaviour
to that recorded for previously studied electrodes was observed, conducting to
the selection of +0.8 V.
M. Goreti F. Sales et al. / Portugaliae Electrochimica Acta 26 (2008) 147-157
153
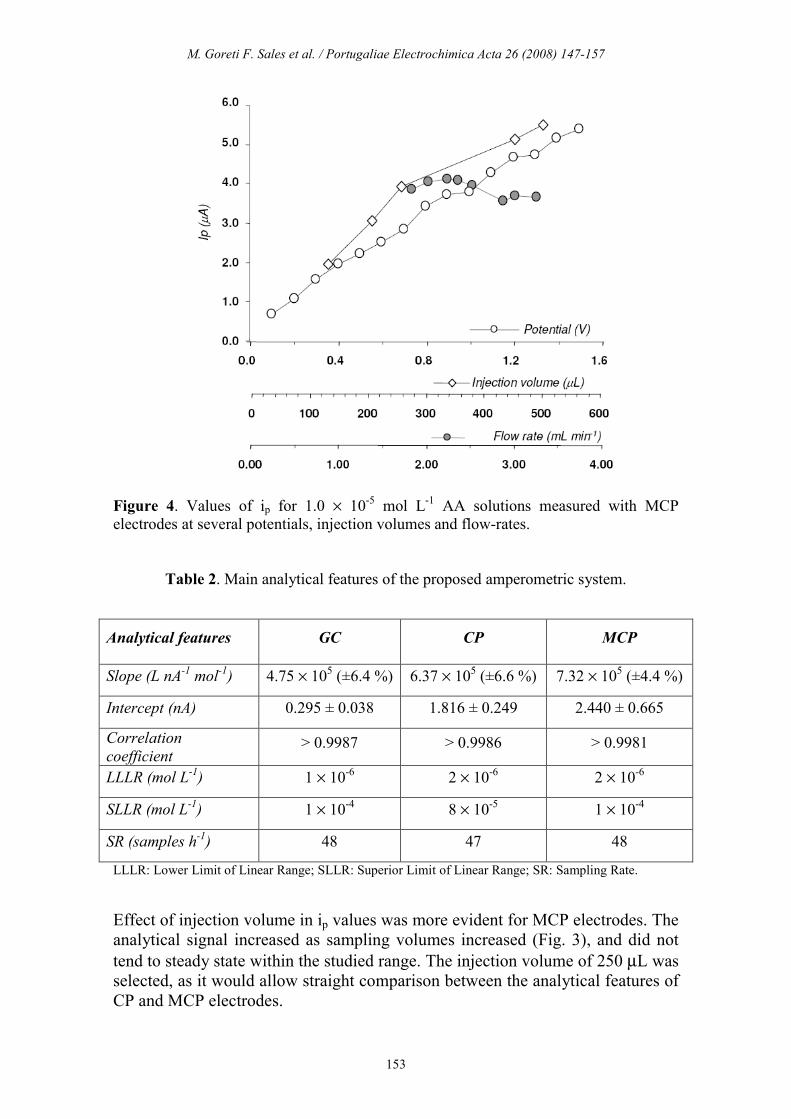
Figure 4. Values of ip for 1.0 × 10⁻⁵ mol L
-1 AA solutions measured with MCP
electrodes at several potentials, injection volumes and flow-rates.
Table 2. Main analytical features of the proposed amperometric system.
Analytical features GC CP MCP
Slope (L nA-1 mol
-1) 4.75 × 10
5 (±6.4 %) 6.37 × 10
5 (±6.6 %) 7.32 × 10
5 (±4.4 %)
Intercept (nA) 0.295 ± 0.038 1.816 ± 0.249 2.440 ± 0.665
Correlation
coefficient > 0.9987 > 0.9986 > 0.9981
LLLR (mol L-1) 1 × 10
-6 2 × 10
-6 2 × 10
-6
SLLR (mol L-1) 1 × 10
-4 8 × 10
-5 1 × 10
-4
SR (samples h-1) 48 47 48
LLLR: Lower Limit of Linear Range; SLLR: Superior Limit of Linear Range; SR: Sampling Rate.
Effect of injection volume in ip values was more evident for MCP electrodes. The
analytical signal increased as sampling volumes increased (Fig. 3), and did not
tend to steady state within the studied range. The injection volume of 250 µL was
selected, as it would allow straight comparison between the analytical features of
CP and MCP electrodes.

M. Goreti F. Sales et al. / Portugaliae Electrochimica Acta 26 (2008) 147-157
154
The effect of flow-rate within 1.8 to 3.2 mL min-1 was similar to that recorded for
CP electrodes (Fig. 2 and 3). Only a slight decrease was recorded for solutions
flowing above 2.8 mL min-1. Following a compromise between sampling rate and
sensitivity, and in search of comparable conditions within all electrodes, 2.3 mL
min-1 was selected for flow rate. Average sampling rates were 48 samples per
hour by using this condition.
0
10
20
30
40
50
60
70
80
0.0 20.0 40.0 60.0 80.0 100.0 120.0
Concentration (µµµµM)
Ip (
µµ µµA
)
GC CP MCP
Figure 5. Calibration curves of GC, CP and MCP electrodes recorder under optimum
conditions.
Main analytical features
Table 2 shows the main features from calibration plots obtained with the selected
experimental conditions. Amperometric responses showed a linear behaviour for
a series of AA standard solutions ranging (1.0-2.0) × 10-6 to (0.8-1.0) × 10
-5 mol
L-1, with correlation coefficients > 0.994. GC electrodes were those of smaller
sensitivity (Fig. 5), with average slopes of 4.75 × 10⁵ nA L mol
-1 (± 6.4 %). A 34
% increase was attained by using the CP electrodes (table 2). This increase is
most probably correlated to the higher carbon surface of the home-made CP
electrodes. Addition of vanadate (V) to the carbon matrix provided a 54 %
increase in sensitivity when compared to GC and a 15 % increase when
compared to the CP. Thus, the chemical modification of vanadate (V) improved
the analytical response of the electrode. The number of readings per hour was
about 48 when standard solutions were injected (Fig. 6).

M. Goreti F. Sales et al. / Portugaliae Electrochimica Acta 26 (2008) 147-157
155
Figure 6. Diagram of CP electrodes after the injection of a set of a standards of a AA
samples. Injection volume: 250 µL; flow rate: 2.3 mL min-1; and pH 6.5.
Table 3. AA content in commercial soft drinks determined by the proposed
amperometric method (AMP) and the comparison method (COMP).
AA (mg L-1)
Sample AMP COMP
Relative error (%)
I 214 (± 9 %) 210 (± 6 %) +1.9
II 206 (± 8 %) 215 (± 6 %) -4.2
III 209 (± 8 %) 221 (± 4 %) -5.4
Analysis of samples
To evaluate the suitability of the amperometric method for the analysis of
beverages, several commercial soft drinks were analysed by the proposed
method. The MCP electrode was used as detection unit. Amperometric analysis
was carried out after injecting samples that were previous diluted with water.
Concentrations of AA were calculated from preceding calibration procedures.
Mean results of three determinations are given in table 3. Comparison to an
independent method confirms the accuracy of the results provided by the
5,78x10⁻⁶
1,16x10⁻⁵
1,73x10⁻⁵
2,31x10⁻⁵
2,89x10⁻⁵
3,47x10⁻⁵
4,05x10⁻⁵
20 nA
10 min

M. Goreti F. Sales et al. / Portugaliae Electrochimica Acta 26 (2008) 147-157
156
amperometric method, with relative errors below 6%. Precision of the results is
also confirmed after the small relative standard deviations.
Conclusions
All electrodes are suitable devices to monitor the electrochemical oxidation of
AA. They present wide linear response ranges, with lower limits around 1 × 10⁻⁶
mol L-1, and MCP electrodes offer the higher sensitivity. Overall, the analytical
procedure is fast and simple, of low cost and of small environmental impact. All
these are suitable features when routine measurements are meant. The method
seems precise and accurate, and is inexpensive regarding reagent consumption
and equipment involved. Several soft drinks are analyzed by the proposed system
and results compare well to an independent method.
References
1. R. Kohen, A. Nyska, Toxicol. Pathol. 30 (2002) 620–650.
2. T. Ueki, Y. Noda, Y. Teramoto, R. Ohba, S. Ueda, J. Ferment. Bioeng. 78
(1994) 262–264.
3. M. Surmeian, Drug Develop. Ind. Pharm. 24 (1998) 691–696.
4. M.I. Toral, N. Lara, P. Richtu, A. Tassara, A.E. Tapia, C. Rodriguez, J.
AOAC Int. 84 (2001) 37–42.
5. A.R. Medina, M.L.F. Cordora, A.M. Diaz, J. Pharm. Biomed. Anal. 20
(1999) 247–254.
6. M. Karatepe, LC GC North America Suppl. S (2004) 104–106.
7. J.H. Khorasani, M.K. Amini, H. Ghanei, S. Tangestaninejad, Iranian J.
Chem. & Chem. Eng. Int. 20 (2001) 66-74.
8. M. Noroozifar, M. Khorasani-Motlagh, Turkish J. Chem. 26 (2003) 717–
722.
9. M. Noroozifar, M. Khorasani-Motlagh, Talanta 61 (2003) 173–179.
10. N. Lenghor, J. Jakmunee, M. Vilen, R. Sara, G.D. Christian, K. Grupdon,
Talanta 58 (2002) 1139–1144.
11. A.A. Ensafi, B. Rezaei, M. Beglari, Anal. Lett. 35 (2002) 909–920.
12. T. Lenarezuk, S. Glab, R. Koncki, J. Pharm. Biomed. Anal. 26 (2001) 163–
169.
13. M. Du, F.Z. Liang, B. Tang, Y.J. Luo, H.X. Shen, B. Teng, Y. Liu, Chin.
Chem. Lett. 11 (2000) 23–26.
14. X. Wu, Y.X. Diao, C.X. Sun, J.H. Yang, Y.B. Wang, Talanta 59 (2003)
95–99.
15. R.Y. Wang, Z.H. Lin, R.X. Cai, X.Y. Li, Anal. Sci. 18 (2002) 977–980.
16. T.P. Ruiz, C.M. Lozano, V. Tomas, J. Fenol, Analyst 126 (2001) 1436–
1439.
17. J.H. Yang, C.X. Sun, X. Wu, Y.X. Diao, Anal. Lett. 34 (2001) 1331–1339.
18. Z.H. Lin, Q.Wang, L.Y. Mao, R.X. Cai, Anal. Chim. Acta 413 (2000) 167–
173.
19. J.H. Yang, Q.L. Ma, F. Huang, L.M. Sun, J.A. Dong, Anal. Lett. 31 (1998)
2757–2766 .

M. Goreti F. Sales et al. / Portugaliae Electrochimica Acta 26 (2008) 147-157
157
20. A.A. Enfasi, B. Rezaei, Anal. Lett. 31 (1998) 333–342.
21. T.P. Ruiz, C.M. Lozano, V. Tomas, C. Sidrach, Analyst 122 (1997) 115–
118.
22. M. Karatepe, LCGC North America Suppl. S (2004) 104–106.
23. H. Iwase, Talanta 60 (2003) 1011– 1021.
24. A.R.B. Quiros, J.L. Hernandez, J.S. Lozano, Chromatogr. 53 (2001) S246–
S249.
25. L.D. Muller, J. Pharm. Biomed. Anal. 25 (2001) 985–994.
26. R.N. Castro, L.C. Azevedo, M.A.A. Azevedo, C.S.T. Sampaio, J. Liq.
Chromatogr. & Rel. Techn. 27 (2001) 1015–1020.
27. N. Kaid, J. Potus, J. Nicolas, Sciences Des Aliments 20 (2000) 237–251.
28. H. Iwase, J. Chromatogr. A 881 (2000) 317–326.
29. A. Rumelin, U. Fauth, M. Halmagyi, Clin. Chem. Lab. Med. 37 (1999)
533–536.
30. M.A. Kall, C. Andersen, J. Chromatogr. B 730 (1999) 101–111.
31. M.A. Moser, H.H. Dorfner, B. Kniel, Deutsche Lebensmittel – Rundschau,
95 (1999) 180–185.
32. H. Iwase, I. Ono, J. Chromatogr. A 806 (1998) 361–364.
33. Y.S. Fung, S.Y. Mo, Anal. Chim. Acta 261 (1992) 375–380.
34. G.R. Zhang, X.L. Wang, X.W. Shi, T.L. Sun, Talanta 51 (2000) 1019–
1025.
35. J. Wu, J. Suls, W. Sansen, Electrochem. Commun. 2 (2000) 90–93.
36. Z.Q. Gao, K.S. Siow, A. Ng, Y.M. Zhang, Anal. Chim. Acta 343 (1997) 49–
57.
37. Y.S. Fung, S.Y. Mo, Anal. Chim. Acta 261 (1992) 375–380.
38. A.M. Almubeil, A. Townshend, Talanta 39 (1992) 1459–1462.
39. J.J. Fei, L.M. Luo, S.S. Hu, Z.Q. Gao, Electroanalysis 16 (2004) 319–323.
40. J.H. Khorasani, M.K. Amini, H. Ghanei, S. Tangestaninejad, Iranian J.
Chem. & Chem. Eng. 20 (2001) 66–74.
41. R.A.A. Munoz, R.C. Matos, L. Angnes, Talanta, 55 (2001) 855–860.
42. A.B. Florou, M.I. Prodromidis, S.M.T. Karayanni, M.I. Karayanis, Anal.
Chim. Acta 423 (2000) 107–114.
43. G.R. Zhang, X.L. Wang, X.W. Shi, T.L. Sun, Talanta 51 (2000) 1019–
1025.
44. J. Wu, J. Suls, W. Sansen, Electrochem. Commun. 2 (2000) 90–93.
45. Z.Q. Gao, K.S. Siow, A. Ng, Y.M. Zhang, Anal. Chim. Acta 343 (1997) 49–
57.
46. J. Kulys, E.J. Dcosta, Anal. Chim. Acta 243 (1991) 173–178.
47. S. Alegret, J. Alonso, J. Bartroli, A.A.S.C. Machado, J.L.F.C. Lima, J.M.
Paulis, Quim. Anal. 6 (1987) 278.
48. http://www.fao.org/ag/agn/jecfa-additives/specs/Monograph1/Additive-043.pdf,
accessed on the 30th of August of 2007.
49. Metrohm, Electrochemical detection in HPLC, Metrohm AG CH-9100,
Herisau, (1984).