chapter one - webgarden
TRANSCRIPT
1
CHAPTER ONE
INTRODUCTION
1.0 DEFINITION
Function generator is a signal source that has the capability of producing
different types of waveforms as its output signal. The most common output
waveforms are sine waves, triangular waves and square waves. The frequencies
of such waveforms may be adjusted from a fraction of a hertz to several
hundred kHz. Function Generators are one of the most important and versatile
pieces of test equipment that a Technician or Engineer can use. In both design
and troubleshooting, the circuit in question often requires a signal to simulate its
normal operation. The specific type of signal can vary widely from one circuit
to another.
Modern function generators are able to provide a very wide variety of signals,
which will meet a vast majority of these requirements. There are varieties of
function generators on the market spanning the cost range from a few tens of
dollars to tens of thousands of dollars. Some are dedicated instruments, some
are black boxes with USB interfaces and an output terminal, some are plugged
into computer or instrumentation buses, and some are software programs
(PROTUS) that run on a PC to generate waveforms on parallel port or via sound
card. There are also inexpensive kits.
In today’s electronic systems, various forms of signals are necessary, such as
sinusoidal, square, triangular, pulse, waves. Computer and control systems need
2
clock pulses. In communication systems, there are a variety of waveforms
needed for modulation waveforms. Triangular waves are used for scanning an
electron beam on a CRT screen, in precise time measurements, and in time
modulation. The sine wave is the most fundamental waveform. In mathematical
sense, any other waveform can be expressed as the Fourier combination of basic
sine waves. Sine waves are used extensively in test, reference and carrier
signals. Despite its simplicity, the generation of a pure sine wave is challenging.
Sinusoidal, triangular and rectangular waveforms are generated using current
feedback operational amplifiers.
.
The software only function generators tend to be the least expensive and can be
attractive for students and hobbyists on a budget. They are also most limited in
frequency capabilities often in the audio range.
1.1 BACKGROUND OF THE PROBLEM
Educational institutions and colleges as well as test engineers need a function
generator that generates certain shapes of waveforms at a wide range of
frequency. The potential and versatility of function generation techniques have
not yet been fully realized, and in the past have been limited by the
conventional hardwired an analogue and digital circuits which were available.
3
This complicates the circuit and increases the cost of the instrument. I designed
the circuit using PROTEUS (software) because it could be used for simulation.
The software used to write the program is microcode studio. The control
program that is fitted into the on-chip ROM of the microcontroller- based
system deals with interrupts to generate the required function. Since the
important feature of microcontrollers is the built-in interrupt system.
A microcontroller-based system is numerically attractive since it offers
increased flexibility, particularly in choosing the required frequency among a
wide range of frequencies. These advantages inevitably result from a reduction
in the complex control circuitry, which may be progressively replaced by
microcontroller software. Then it is possible to generate any frequency
waveform is previously assigned without altering the hardware. To reduce the
components and instrument cost a software-based system is to be designed and
built. Reducing the components and adopting software increase the reliability of
the system and flexibility of the system operation based technique.
1.2 OBJECTIVE AND OVERVIEW
The principal objective of this project is to design a low cost microcontroller
based function generator which can generate sine wave and square waveforms
and the frequency of the wave will be calculated and then displayed through
LCD.

4
Function generator is a electronic equipment used to generate different types of
electrical waveforms through sine wave, square wave and triangular wave over
a wide range of frequencies. It is used in development, testing and repair of
electronic equipment.
In my project, I used 8038 IC to design the function generator circuit and PIC
16F877A as the microcontroller for the function generator. The calculated
frequency will be displayed through LCD. Here we are generating only the sine,
triangular and square waveforms.
We are well aware of the fact that a function generator is not a new concept. It
is widely used in the industry and is available in the market. But our innovation
lies in the fact that we are designing the circuit at an extreme low cost with the
output being as accurate as the costlier ones. Our project will be very useful for
lab experiments.
The project is an endeavour towards an effective design and development of
microcontroller based Function Generator. The following are the main
objectives:
1. To design hardware for the system using PIC16F877A microcontroller
2. Design and implementation of a square wave generator with minimum
distortion.
5
3. Design and implementation of a triangle wave generator with minimum
distortion.
4. Design and implementation of a sine wave generator with minimum
distortion.
5. Performance and cost analysis.
1.3 SCOPE AND LIMITATION
The project-function generator is expected to have the following circuit
specification:
1. Power supply
2. Led
3. PIC16F877A 8 bit microcontroller
4. Liquid Crystal Display (LCD)
5. Sine, Square, Triangular wave generator
The major limitation of the project is the maximum frequency in which it can
execute. The maximum frequency is 300 kHz.
1.4 RELEVANCE AND SIGNIFICANCE
This project design useful in the following ways;
1. In School Laboratory, the function generator can be used to provide clock
frequency that can be used to test for modulation used in communication.
6
2. The function generator can be used in ultrasonic application to generate
the frequency needed for it to operate effectively.
1.5 MOTIVATION
Though this project was the initiative of my supervisor, I embraced it with great
seriousness. However, the idea behind this project is to enhance my exposure to
the field of instrumentation as an Instrumentation Engineer. More so, the project
is meant to bridge the gap between theory and practical aspects of studies.
1.6 ORGANIZATION OF THE WORK
This project is arranged in chapters. Chapter one is on the introduction,
objective and scope of work. Chapter two is on literature review, including the
brief mention of some major components used for the design. Chapter three is
on the specific method applied in achieving the project work. Chapter four
focuses on the design analysis, calculation of components value,
implementation and testing. Conclusion and recommendations takes up chapter
five.
7
CHAPTER TWO
LITERATURE REVIEW
This chapter presents and highlights the design in terms of flexibility of usage
as against previous and existing designs. It also discusses the various theories
employed in realizing the design and operational principles of the
components used in the design.
2.1 LCD
LCDs are used in digital clocks, cellular phones, desktop and laptop computers,
and some televisions and other electronic systems. They offer a decided
advantage over former display technologies, such as cathode ray tubes, in that
they are much lighter and thinner and consume a lot less power to operate. LCD
technology relies on special electrical and optical properties of a class of
materials known as liquid crystals.
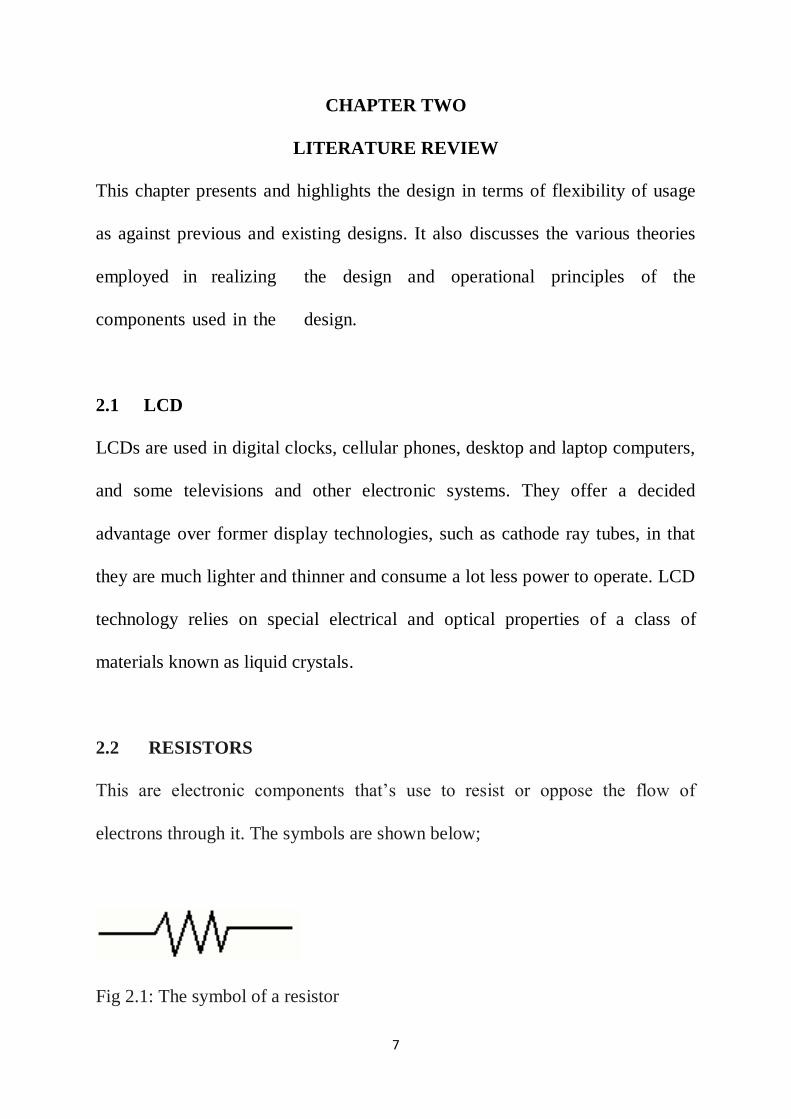
2.2 RESISTORS
This are electronic components that’s use to resist or oppose the flow of
electrons through it. The symbols are shown below;
Fig 2.1: The symbol of a resistor
8
Resistance are measured in ohms. 1000ohms is shown as 1Kohm, and 1000000
ohm is shown as 1M ohm.
2.2.1 Composition Type Resistors
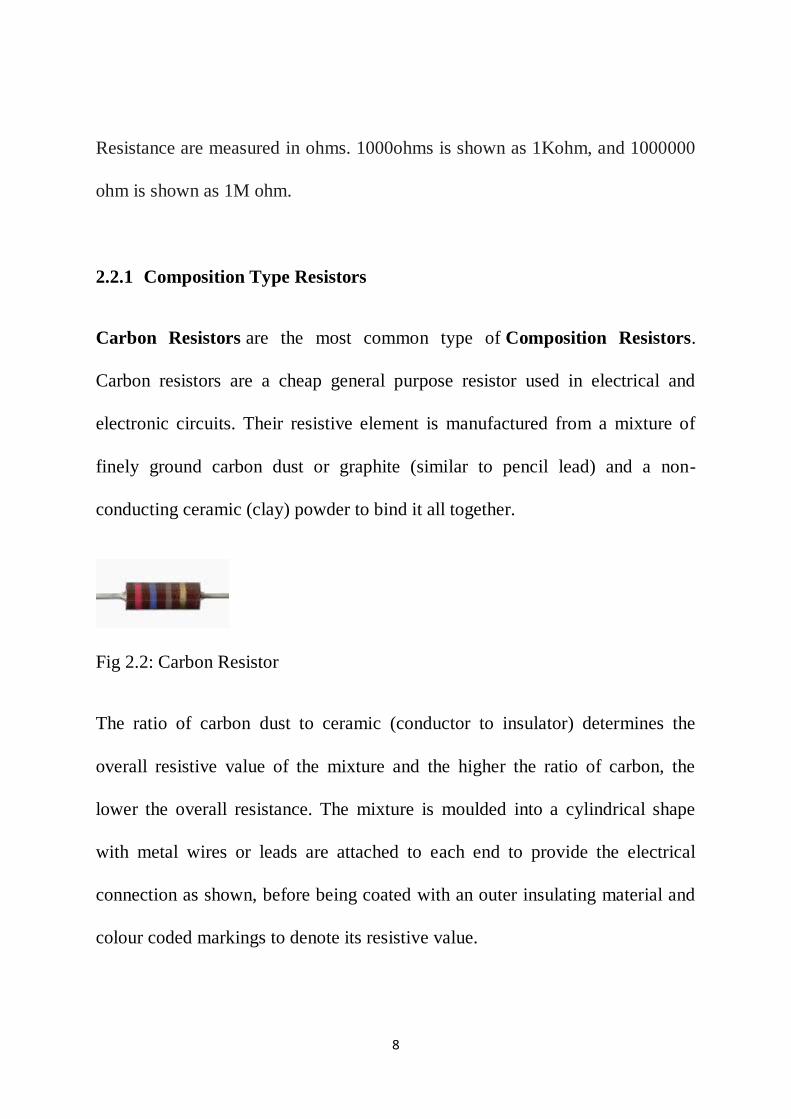
Carbon Resistors are the most common type of Composition Resistors.
Carbon resistors are a cheap general purpose resistor used in electrical and
electronic circuits. Their resistive element is manufactured from a mixture of
finely ground carbon dust or graphite (similar to pencil lead) and a non-
conducting ceramic (clay) powder to bind it all together.
Fig 2.2: Carbon Resistor
The ratio of carbon dust to ceramic (conductor to insulator) determines the
overall resistive value of the mixture and the higher the ratio of carbon, the
lower the overall resistance. The mixture is moulded into a cylindrical shape
with metal wires or leads are attached to each end to provide the electrical
connection as shown, before being coated with an outer insulating material and
colour coded markings to denote its resistive value.
9
The Carbon Composite Resistor is a low to medium type power resistor which
has a low inductance making them ideal for high frequency applications but
they can also suffer from noise and stability when hot. Carbon composite
resistors are generally prefixed with a "CR" notation (eg, CR10kΩ ).
Carbon composite resistors are very cheap to make and are therefore commonly
used in electrical circuits. However, due to their manufacturing process carbon
type resistors have very large tolerances so for more precision and high value
resistances, film type resistors are used instead.
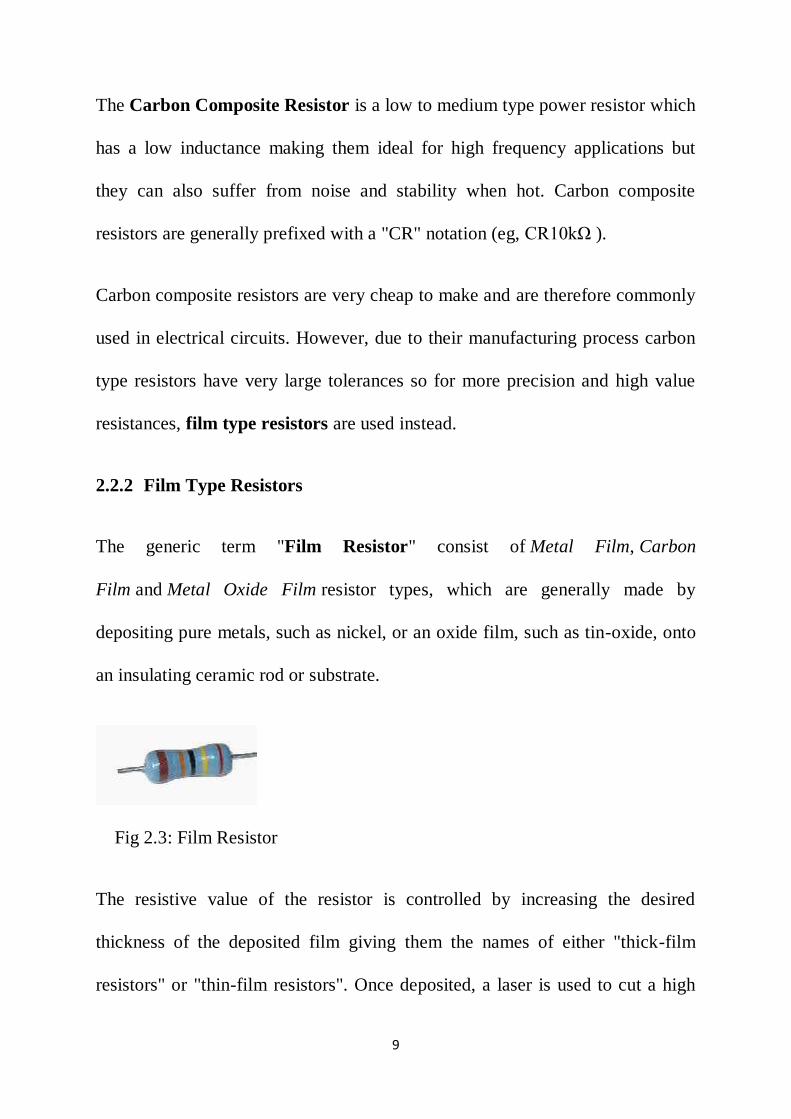
2.2.2 Film Type Resistors
The generic term "Film Resistor" consist of Metal Film, Carbon
Film and Metal Oxide Film resistor types, which are generally made by
depositing pure metals, such as nickel, or an oxide film, such as tin-oxide, onto
an insulating ceramic rod or substrate.
Fig 2.3: Film Resistor
The resistive value of the resistor is controlled by increasing the desired
thickness of the deposited film giving them the names of either "thick-film
resistors" or "thin-film resistors". Once deposited, a laser is used to cut a high

10
precision spiral helix groove type pattern into this film. The cutting of the film
has the effect of increasing the conductive or resistive path, a bit like taking a
long length of straight wire and forming it into a coil.
This method of manufacture allows for much closer tolerance resistors (1% or
less) as compared to the simpler carbon composition types. The tolerance of a
resistor is the difference between the preferred value (i.e., 100 ohms) and its
actual manufactured value i.e., 103.6 ohms, and is expressed as a percentage,
for example 5%, 10% etc, and in our example the actual tolerance is 3.6%. Film
type resistors also achieve a much higher maximum ohmic value compared to
other types and values in excess of 10MΩ (10 Million Ω´s) are available.
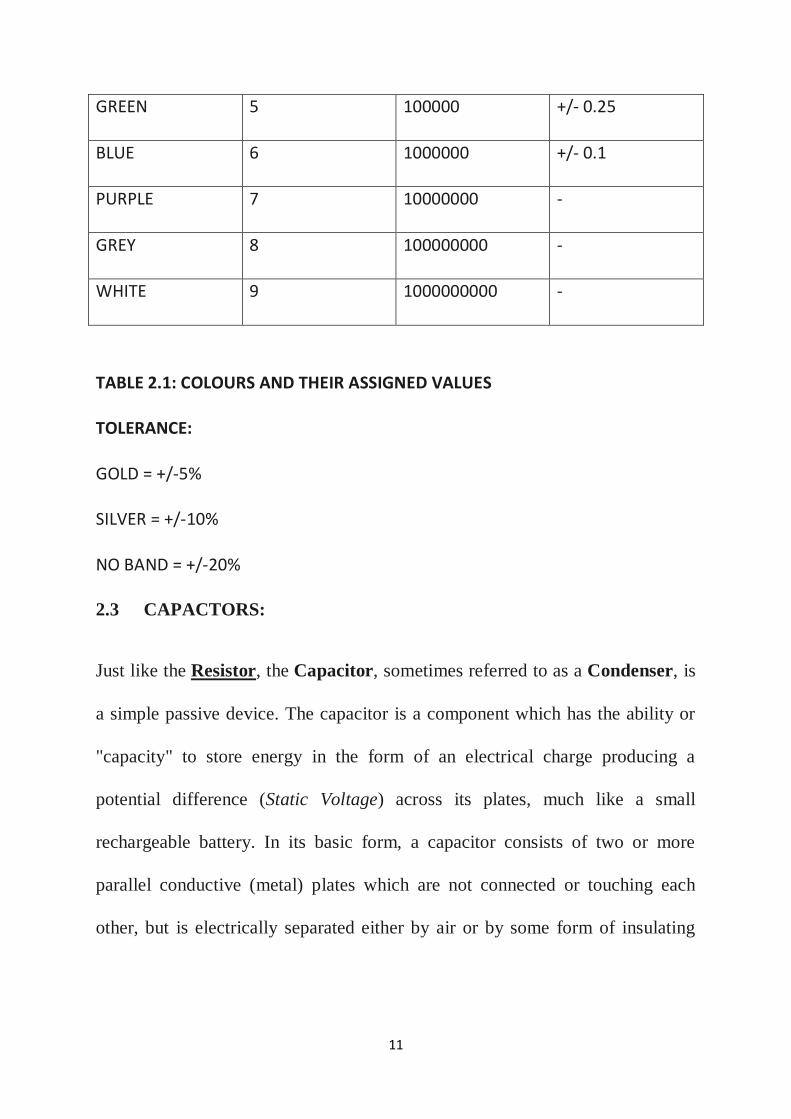
2.2.3 Calculating the resistance value
Fixed resistors resistances are calculated using colour codes assigned to a
numerical value. The below table shows the colours and their assigned values;
COLOUR BAND VALUE MULTIPLIER TOLERANCE
BLACK 0 1 -
BROWN 1 10 +/- 1
RED 2 100 +/- 2
ORANGE 3 1000 +/- 0.05
YELLOW 4 10000 -
11
GREEN 5 100000 +/- 0.25
BLUE 6 1000000 +/- 0.1
PURPLE 7 10000000 -
GREY 8 100000000 -
WHITE 9 1000000000 -
TABLE 2.1: COLOURS AND THEIR ASSIGNED VALUES
TOLERANCE:
GOLD = +/-5%
SILVER = +/-10%
NO BAND = +/-20%
2.3 CAPACTORS:
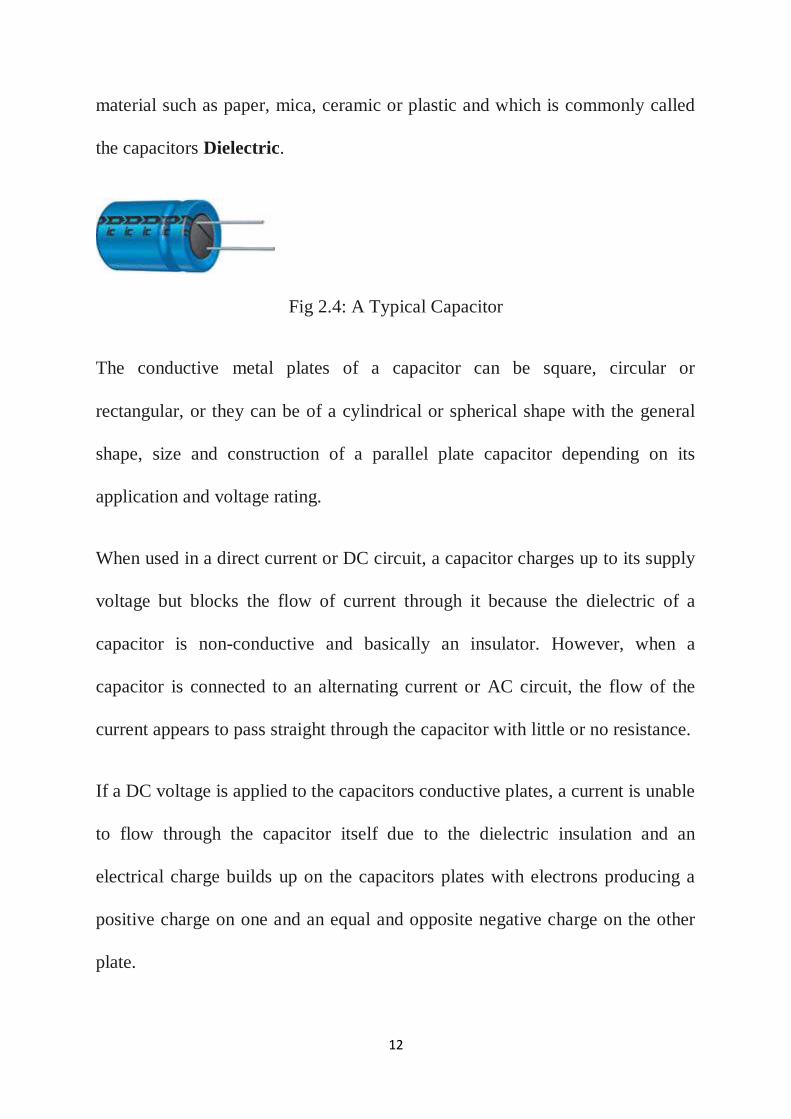
Just like the Resistor, the Capacitor, sometimes referred to as a Condenser, is
a simple passive device. The capacitor is a component which has the ability or
"capacity" to store energy in the form of an electrical charge producing a
potential difference (Static Voltage) across its plates, much like a small
rechargeable battery. In its basic form, a capacitor consists of two or more
parallel conductive (metal) plates which are not connected or touching each
other, but is electrically separated either by air or by some form of insulating
12
material such as paper, mica, ceramic or plastic and which is commonly called
the capacitors Dielectric.
Fig 2.4: A Typical Capacitor
The conductive metal plates of a capacitor can be square, circular or
rectangular, or they can be of a cylindrical or spherical shape with the general
shape, size and construction of a parallel plate capacitor depending on its
application and voltage rating.
When used in a direct current or DC circuit, a capacitor charges up to its supply
voltage but blocks the flow of current through it because the dielectric of a
capacitor is non-conductive and basically an insulator. However, when a
capacitor is connected to an alternating current or AC circuit, the flow of the
current appears to pass straight through the capacitor with little or no resistance.
If a DC voltage is applied to the capacitors conductive plates, a current is unable
to flow through the capacitor itself due to the dielectric insulation and an
electrical charge builds up on the capacitors plates with electrons producing a
positive charge on one and an equal and opposite negative charge on the other
plate.
13
This flow of electrons to the plates is known as the capacitors Charging
Current which continues to flow until the voltage across both plates (and hence
the capacitor) is equal to the applied voltage Vc. At this point the capacitor is
said to be "fully charged" with electrons. The strength or rate of this charging
current is at its maximum value when the plates are fully discharged (initial
condition) and slowly reduces in value to zero as the plates charge up to a
potential difference across the capacitors plates equal to the applied supply
voltage and this is illustrated below.
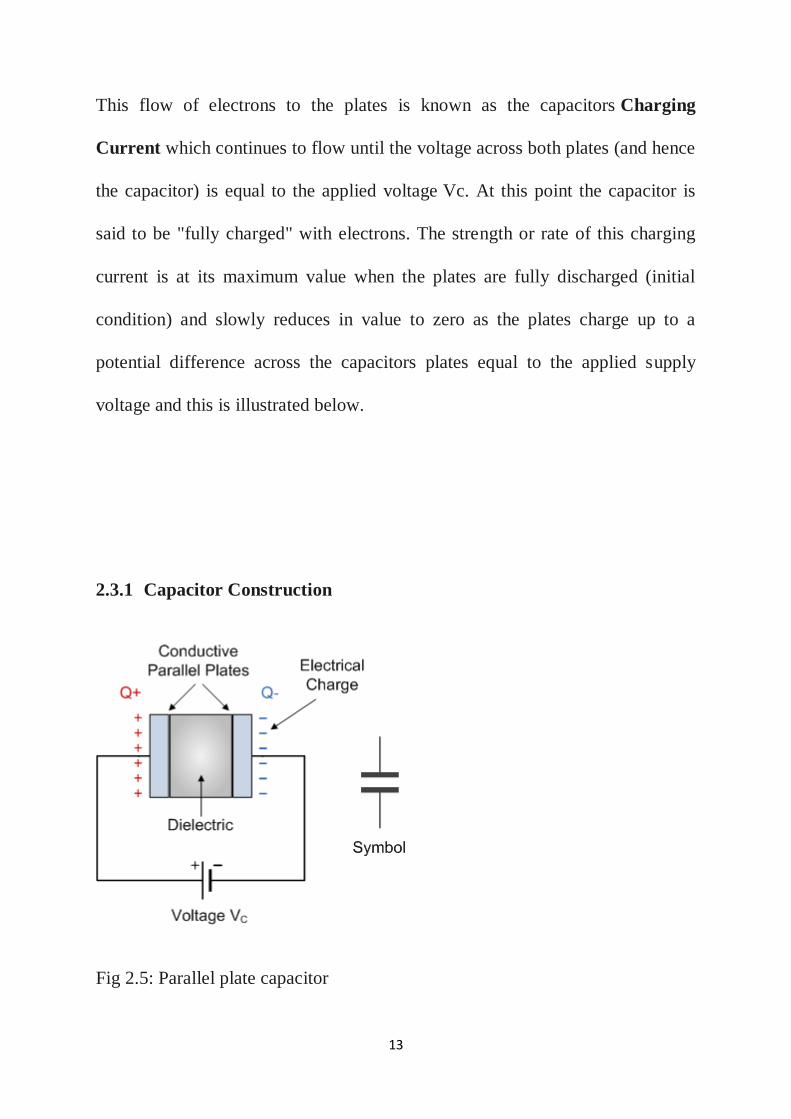
2.3.1 Capacitor Construction
Fig 2.5: Parallel plate capacitor

14
The parallel plate capacitor is the simplest form of capacitor. It can be
constructed using two metal or metallised foil plates at a distance parallel to
each other, with its capacitance value in Farads, being fixed by the surface area
of the conductive plates and the distance of separation between them. Altering
any two of these values alters the value of its capacitance and this forms the
basis of operation of the variable capacitors.
Also, because capacitors store the energy of the electrons in the form of an
electrical charge on the plates the larger the plates and/or smaller their
separation the greater will be the charge that the capacitor holds for any given
voltage across its plates.
By applying a voltage to a capacitor and measuring the charge on the plates, the
ratio of the charge Q to the voltage V will give the capacitance value of the
capacitor and is therefore given as: C = Q/V this equation can also be re-
arranged to give the more familiar formula for the quantity of charge on the
plates as: Q = C x V
Although we have said that the charge is stored on the plates of a capacitor, it is
more correct to say that the energy within the charge is stored in an
"electrostatic field" between the two plates. When an electric current flows into
the capacitor, charging it up, the electrostatic field becomes stronger as it stores
more energy. Likewise, as the current flows out of the capacitor, discharging it,

15
the potential difference between the two plate’s decreases and the electrostatic
field decreases as the energy moves out of the plates.
The property of a capacitor to store charge on its plates in the form of an
electrostatic field is called the Capacitance of the capacitor. Not only that, but
capacitance is also the property of a capacitor which resists the change of
voltage across it.
2.3.2 The Capacitance of a Capacitor
The unit of capacitance is the Farad (abbreviated to F) named after the British
physicist Michael Faraday and is defined as a capacitor has the capacitance
of One Farad when a charge of One Coulomb is stored on the plates by a
voltage of One volt. Capacitance, C is always positive and has no negative
units. However, the Farad is a very large unit of measurement to use on its own
so sub-multiples of the Farad are generally used such as micro-farads, nano-
farads and pico-farads, for example.
2.3.3 Units of Capacitance
Microfarad (μF) 1μF = 1/1,000,000 = 0.000001 = 10-6
F
Nano-farad (nF) 1nF = 1/1,000,000,000 = 0.000000001 = 10-9
F
Pico-farad (pF) 1pF = 1/1,000,000,000,000 = 0.000000000001 = 10-12
F

16
The capacitance of a parallel plate capacitor is proportional to the area, A of the
plates and inversely proportional to their distance or separation, d (i.e. the
dielectric thickness) giving us a value for capacitance of C = k (A/d) where in a
vacuum the value of the constant k is 8.84 x 10⁻¹²
F/m or 1/4.π.9 x 109, which is
the permittivity of free space. Generally, the conductive plates of a capacitor are
separated by air or some kind of insulating material or gel rather than the
vacuum of free space.
2.4 LED
Light Emitting Diodes (LEDS) is a type of Diode which emits light ray in the
form of photons when electric current is applied to it.
The die is an itty bitty cube of semiconductor, the composition of which
determines the colour of the light given off. It sits in the bottom of the die cup,
which has reflective sides to reflect the light emitted by the die toward the dome
end of the LED. The epoxy body is shaped to act as an inclusion lens and focus
the light into a beam. The distance from the die cup to the domed end of the lens
determines how tightly focused is the resulting beam of light. Some LEDs have
flat or even concave ends to disperse the light into a wide beam.

17
Fig 2.6: Light Emitting Diode.
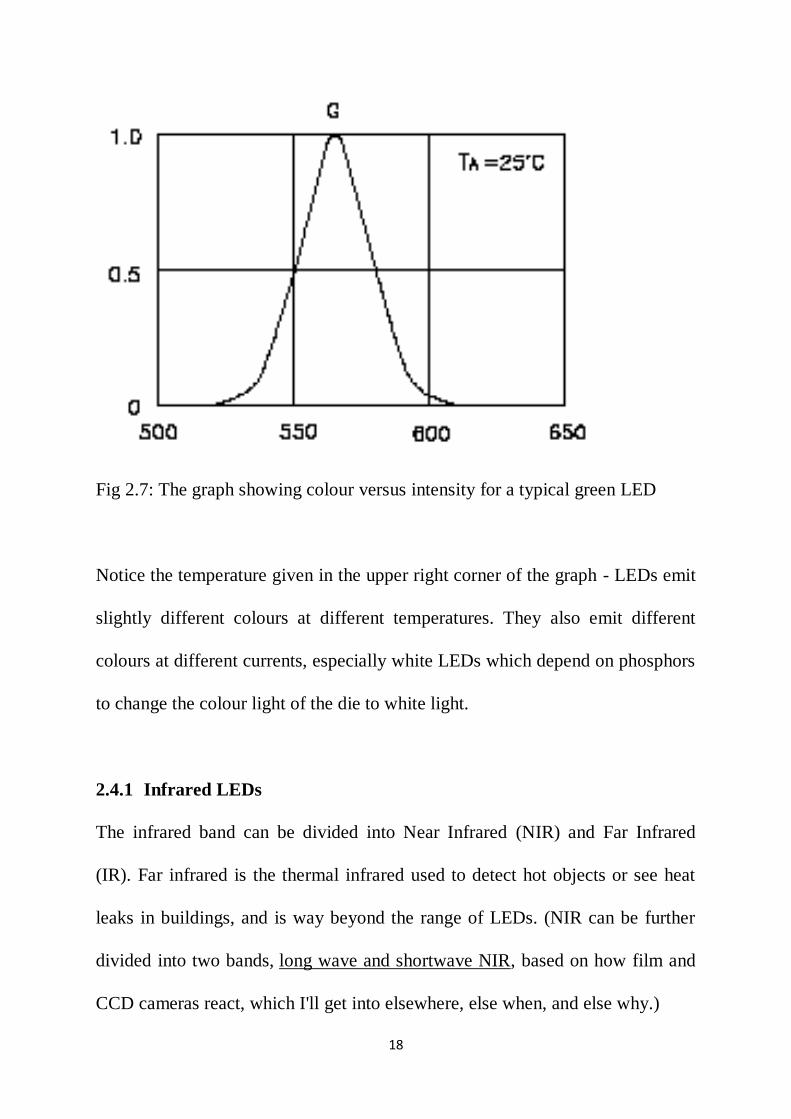
LED colours are often given in "nm", or nanometres, which is the wavelength of
the light. The wavelength given is the wavelength of the peak output - LEDs are
not perfectly monochromatic, but rather produce wavelengths over a small
region of the spectrum. The graph on the left shows colour vs. intensity for a
typical green LED - the peak is at about 565 nm, but it is emitting light over a
range of about 520 nm to 610 nm. Spectral line half-width is the width of this
curve at 50% intensity (0.5 on the Y-axis) - for this LED, it is about 30 nm - and
is a measure of the "purity" (monochromaticity) of the colour.
18
Fig 2.7: The graph showing colour versus intensity for a typical green LED
Notice the temperature given in the upper right corner of the graph - LEDs emit
slightly different colours at different temperatures. They also emit different
colours at different currents, especially white LEDs which depend on phosphors
to change the colour light of the die to white light.
2.4.1 Infrared LEDs
The infrared band can be divided into Near Infrared (NIR) and Far Infrared
(IR). Far infrared is the thermal infrared used to detect hot objects or see heat
leaks in buildings, and is way beyond the range of LEDs. (NIR can be further
divided into two bands, long wave and shortwave NIR, based on how film and
CCD cameras react, which I'll get into elsewhere, else when, and else why.)

19
Infrared LEDs are sometimes called IREDs (Infra-Red Emitting Diodes).
2.4.2 Ultraviolet LEDs
Ultraviolet light is divided into three bands: UV-A, which is fairly innocuous;
UV-B, which causes sunburns; and UV-C, which kills things. Most UV-B and
all UV-C from the sun is filtered out by the ozone layer, so we get very little of
it naturally. LEDs emit UV-A.
400 nm is a pretty common wavelength for UV LEDs. This is right on the
border between the violet and ultraviolet, so a significant portion of the light
emitted is visible. For this reason 400 nm UV LEDs are sometimes rated in mill
candela, even though as much as half of their energy is invisible. LEDs with
lower wavelengths, such as 380nm, are usually not rated in mill candela, but in
mill watts.
DO NOT STARE INTO AN ULTRAVIOLET LED.
2.4.3 White LEDs
White light is a mixture of all the colours. Colour Temperature is a measure of
the relative amounts of red or blue - higher colour temperatures have more blue.
20
Remember that this is a measure of colour, not brightness, so don't freak out
because moonlight is "hotter" than a carbon arc! It just means that the colour is
bluer, that's all.
White LEDs have a colour temperature, but monochromatic LEDs do not.
2.4.4 LED Brightness
The total power radiated as light is radiant power or radiant flux, and is
measured in watts. How bright the object appears, however, will depend on two
additional factors:
how much radiant flux is emitted toward the observer; and
How sensitive the observer is to the wavelength(s) of the light.
Luminous flux and luminous intensity are measurements like radiant power and
radiant intensity, only adjusted for the sensitivity of the human eye. Radiant
power of a wavelength of 555 nm is multiplied by a factor of 1, but light of
higher and lower wavelengths are multiplied by lower factors, until infrared and
ultraviolet wavelengths are reached, when the radiant power is multiplied by
zero.
Luminous flux is measured in lumen, while luminous intensity is measured
in lumen per Ste radian, also called a candela
The relationship between luminous flux, luminous intensity, and beam angle
means is that focussing a given LED into a tighter beam (decreasing the beam
angle) will increase its luminous intensity (brightness) without actually
21
increasing the luminous flux (amount of light) it puts out. Keep this in mind
when buying LEDs for illuminating purposes - a 2000 mcd 30° LED puts out
just as much light as am 8000 mcd LED with a 15° viewing angle. (The angle is
half in both width and height, so the beam is four times as bright.) This is one of
the reasons that ultra-bright LEDs are often "water clear", to keep the light
going in one direction and not diffuse it all over the place
The brightness of LEDs is measured in mill candela (mcd), or thousandths of a
candela. Indicator LEDs are typically in the 50 mcd range; "ultra-bright" LEDs
can reach 15,000 mcd, or higher (the 617 nm Lux on Star (part number LXHL-
NH94) can reach 825,000 mcd).
By way of comparison, a typical 100 watt incandescent bulb puts out around
1700 lumen - if that light is radiated equally in all directions, it will have a
brightness of around 135,000 mcd. Focused into a 20° beam, it will have a
brightness of around 18,000,000 mcd
2.5 PIC16F877A MICROCONTROLLER
The nominal output is taken from the potentiometer at no load condition. The
analog to digital conversion module of PIC16F877A is used to measure voltage
from potentiometer. The pulse width modulation duty cycle is calculated as per
the voltage from the potentiometer. The engine rpm is measured in capture
compare module of PIC16F877A microcontroller. The updated values of engine
rpm and the pulse width modulation duty cycle are displayed on LCD. The
22
engine rpm is continuously compared with the set point and when error signal
generates it directly processed into the PID algorithm. The pulse width
modulation duty cycle is calculated from the PID algorithm and from which
PIC16F877A microcontroller moves the throttle actuator lever in such a
position where engine gets stable at the required set point.
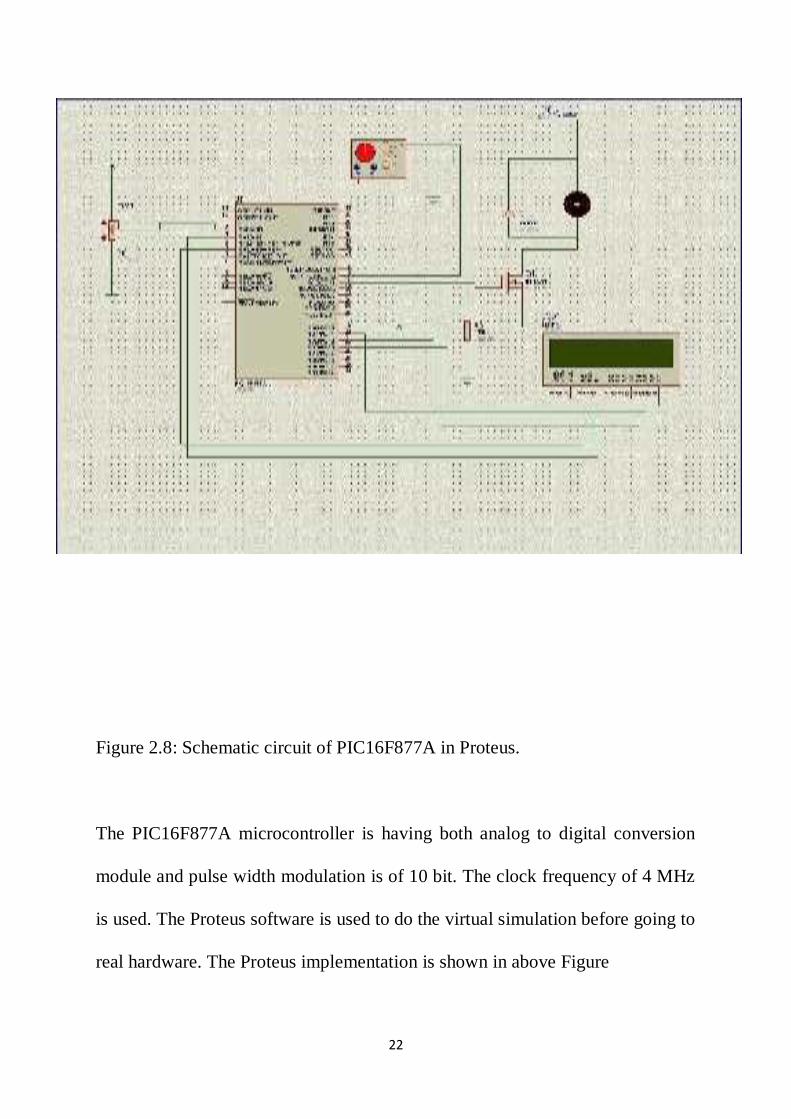
Figure 2.8: Schematic circuit of PIC16F877A in Proteus.
The PIC16F877A microcontroller is having both analog to digital conversion
module and pulse width modulation is of 10 bit. The clock frequency of 4 MHz
is used. The Proteus software is used to do the virtual simulation before going to
real hardware. The Proteus implementation is shown in above Figure

23
CHAPTER THREE
METHODOLOGY
The overall method and steps involved during the design of this project are
briefly explained here. These can be best explained using the block diagram
below.
Fig 3.1: BLOCK DAIGRAM OF THE FUNCTION GENERATOR
However, there are various methods in which function generators can be design:
i. Microcontroller based function generator.
MICROCONTROLLER FREQUENCY CLOCK
GENERATOR
DIGITAL BUTTON CONTROLS
16 X 2 LCD DISPLAY UNITS
SINE, TRIANGULAR, SQUARE WAVE
GENERATOR
5V POWER SUPPLY UNIT
LED INDICATORS
24
ii. Using Operational Amplifier.
iii. Using the popular Function generator Integrated Circuit (8038).
3.1 USING OPERATIONAL AMPLIFIER
Operational amplifiers with positive feedback can be used to build oscillators.
We will explain briefly the various op-amp circuits and their respective signal
waveforms they create.
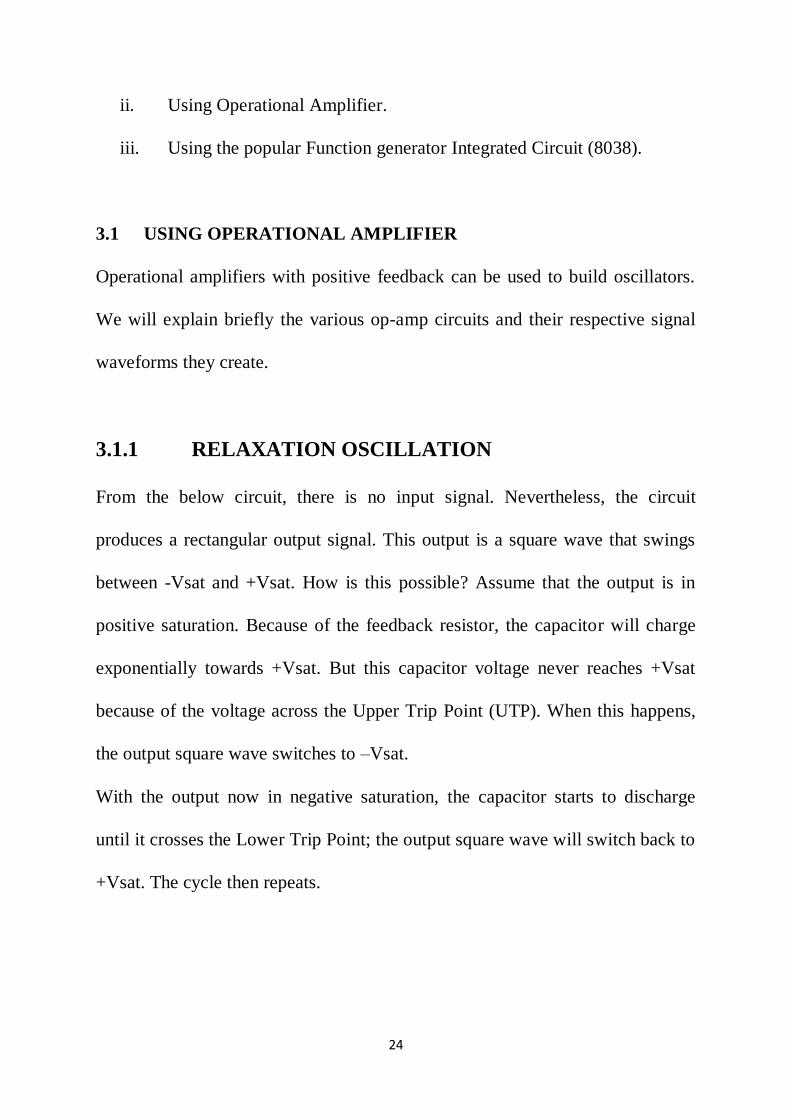
3.1.1 RELAXATION OSCILLATION
From the below circuit, there is no input signal. Nevertheless, the circuit
produces a rectangular output signal. This output is a square wave that swings
between -Vsat and +Vsat. How is this possible? Assume that the output is in
positive saturation. Because of the feedback resistor, the capacitor will charge
exponentially towards +Vsat. But this capacitor voltage never reaches +Vsat
because of the voltage across the Upper Trip Point (UTP). When this happens,
the output square wave switches to –Vsat.
With the output now in negative saturation, the capacitor starts to discharge
until it crosses the Lower Trip Point; the output square wave will switch back to
+Vsat. The cycle then repeats.
25
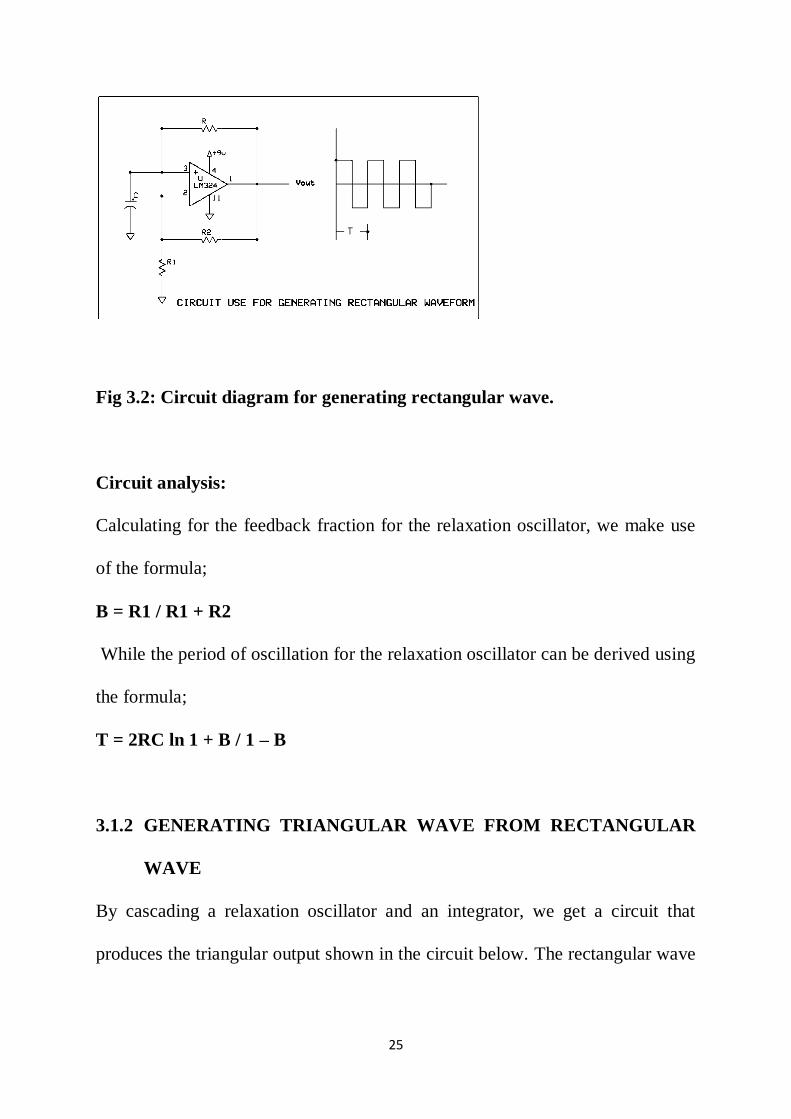
Fig 3.2: Circuit diagram for generating rectangular wave.
Circuit analysis:
Calculating for the feedback fraction for the relaxation oscillator, we make use
of the formula;
B = R1 / R1 + R2
While the period of oscillation for the relaxation oscillator can be derived using
the formula;
T = 2RC ln 1 + B / 1 – B
3.1.2 GENERATING TRIANGULAR WAVE FROM RECTANGULAR
WAVE
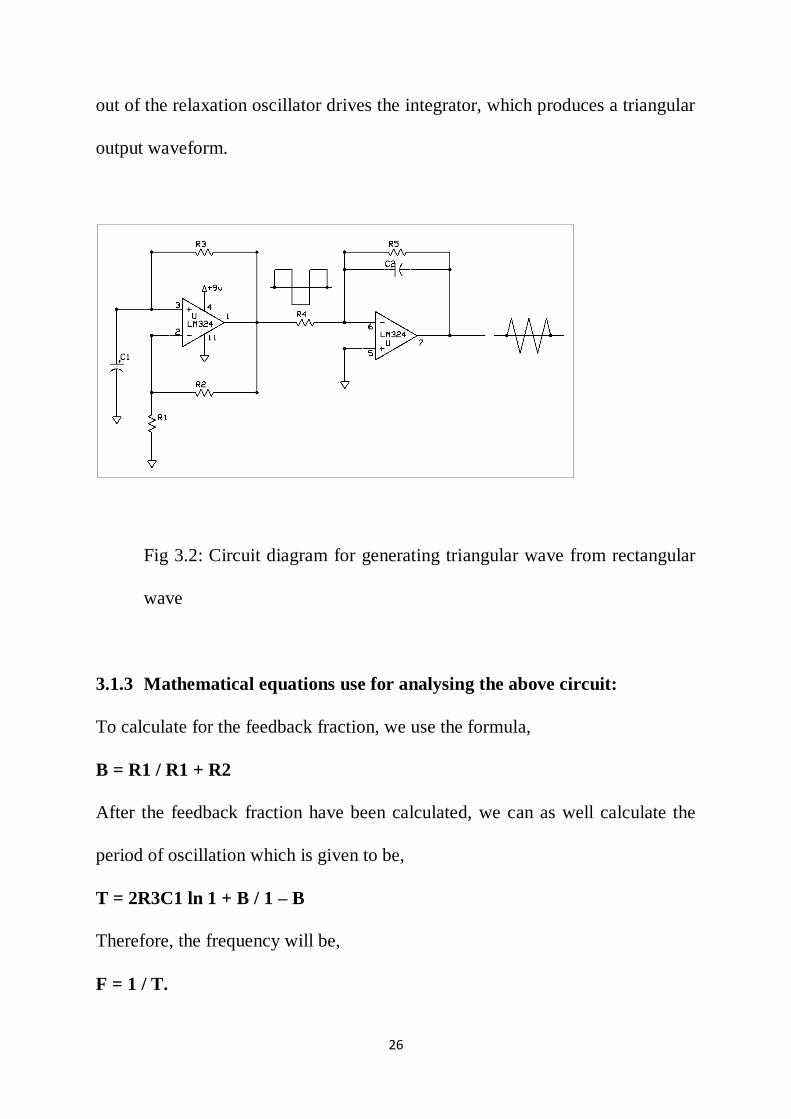
By cascading a relaxation oscillator and an integrator, we get a circuit that
produces the triangular output shown in the circuit below. The rectangular wave
26
out of the relaxation oscillator drives the integrator, which produces a triangular
output waveform.
Fig 3.2: Circuit diagram for generating triangular wave from rectangular
wave
3.1.3 Mathematical equations use for analysing the above circuit:
To calculate for the feedback fraction, we use the formula,
B = R1 / R1 + R2
After the feedback fraction have been calculated, we can as well calculate the
period of oscillation which is given to be,
T = 2R3C1 ln 1 + B / 1 – B
Therefore, the frequency will be,
F = 1 / T.
27
3.2 USING ICL8038 INTEGRATED CIRCUIT
The ICL8038 waveform generator is a monolithic integrated circuit capable of
producing high accuracy sine, square, triangular, saw tooth and pulse
waveforms with a minimum of external components. The frequency (or
repetition rate) can be selected externally from 0.001Hz to more than 300 kHz
using either resistors or capacitors, and frequency modulation and sweeping can
be accomplished with an external voltage. The ICL8038 is fabricated with
advanced monolithic technology, using Schottky barrier diodes and thin film
resistors, and the output is stable over a wide range of temperature and supply
variations. These devices may be interfaced with phase locked loop circuitry to
reduce temperature drift to less than 250ppm/oC.
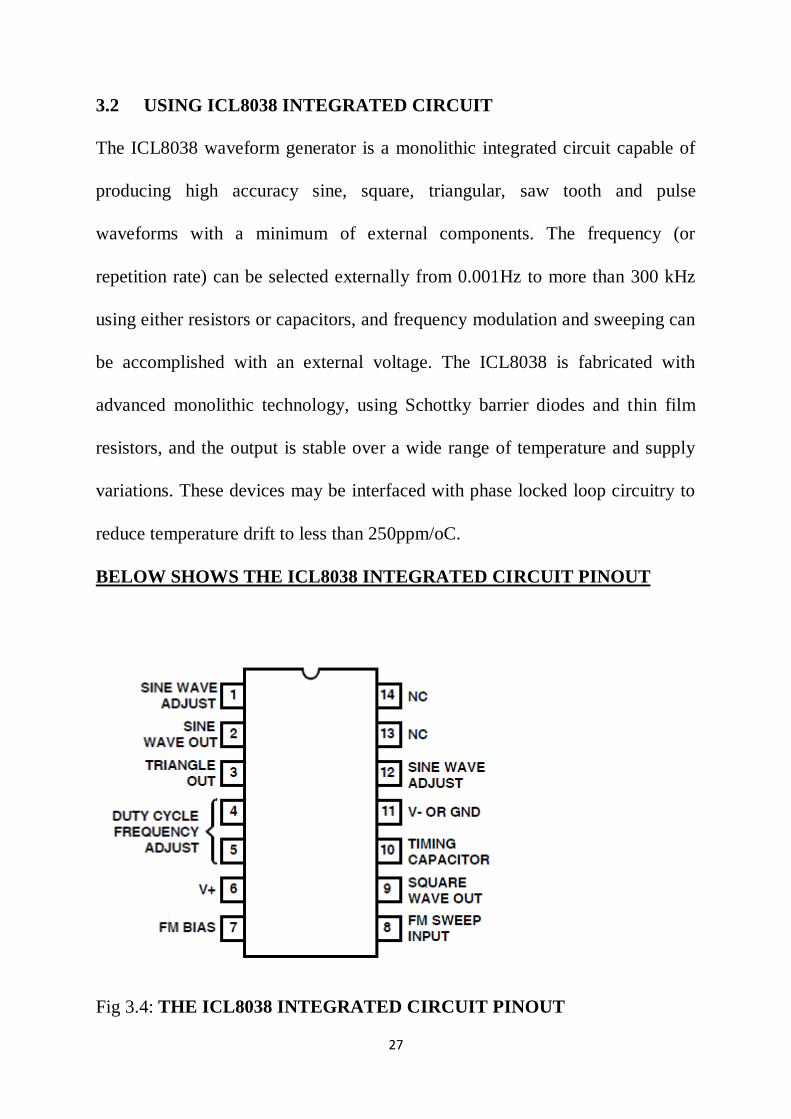
BELOW SHOWS THE ICL8038 INTEGRATED CIRCUIT PINOUT
Fig 3.4: THE ICL8038 INTEGRATED CIRCUIT PINOUT
28
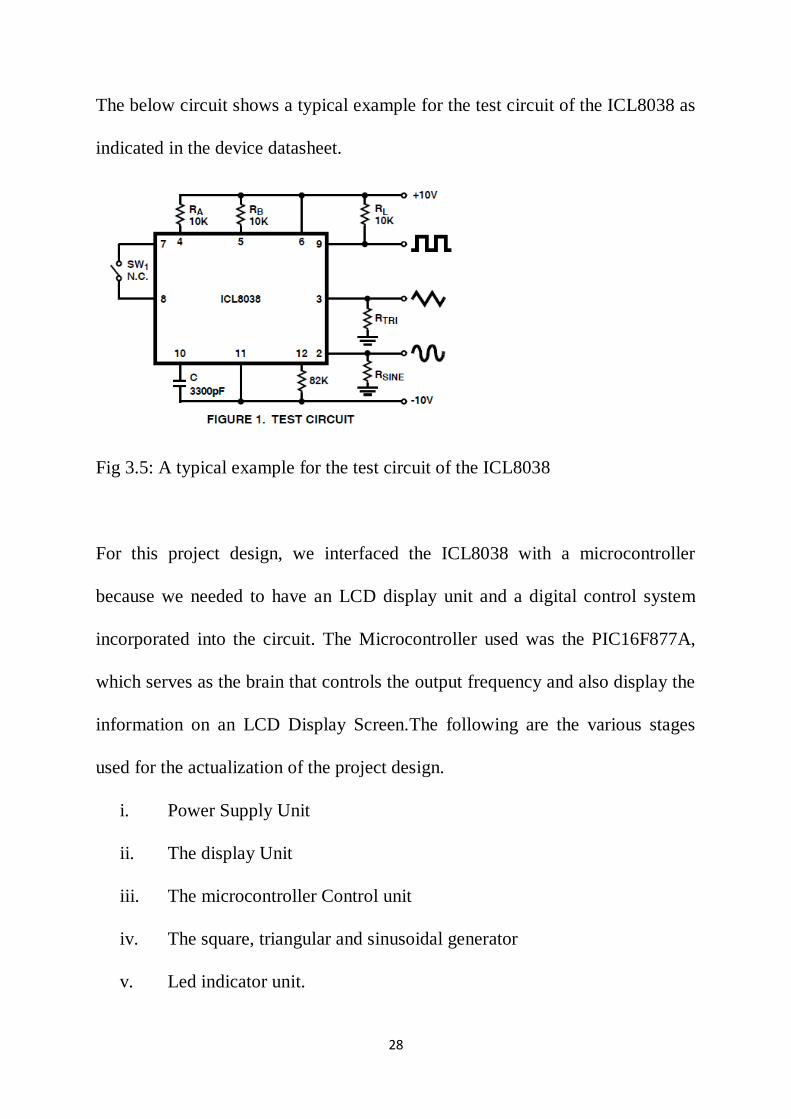
The below circuit shows a typical example for the test circuit of the ICL8038 as
indicated in the device datasheet.
Fig 3.5: A typical example for the test circuit of the ICL8038
For this project design, we interfaced the ICL8038 with a microcontroller
because we needed to have an LCD display unit and a digital control system
incorporated into the circuit. The Microcontroller used was the PIC16F877A,
which serves as the brain that controls the output frequency and also display the
information on an LCD Display Screen.The following are the various stages
used for the actualization of the project design.
i. Power Supply Unit
ii. The display Unit
iii. The microcontroller Control unit
iv. The square, triangular and sinusoidal generator
v. Led indicator unit.
29
CHAPTER FOUR
DESIGN AND IMPLEMENTATION OF THE MODULE
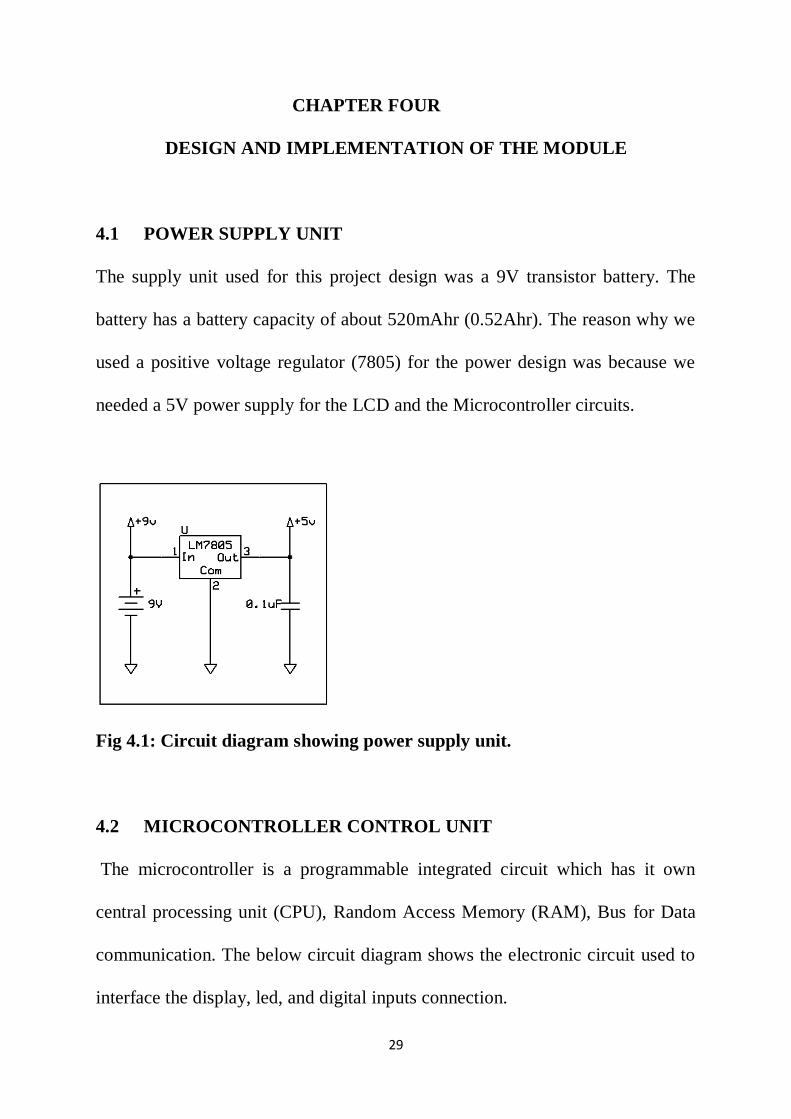
4.1 POWER SUPPLY UNIT
The supply unit used for this project design was a 9V transistor battery. The
battery has a battery capacity of about 520mAhr (0.52Ahr). The reason why we
used a positive voltage regulator (7805) for the power design was because we
needed a 5V power supply for the LCD and the Microcontroller circuits.
Fig 4.1: Circuit diagram showing power supply unit.
4.2 MICROCONTROLLER CONTROL UNIT
The microcontroller is a programmable integrated circuit which has it own
central processing unit (CPU), Random Access Memory (RAM), Bus for Data
communication. The below circuit diagram shows the electronic circuit used to
interface the display, led, and digital inputs connection.
30
For the program control function, we made use of C language using the
microcode studio designed by the Microchip manufactures for the purpose of
programming the Microchip Integrated Circuits.
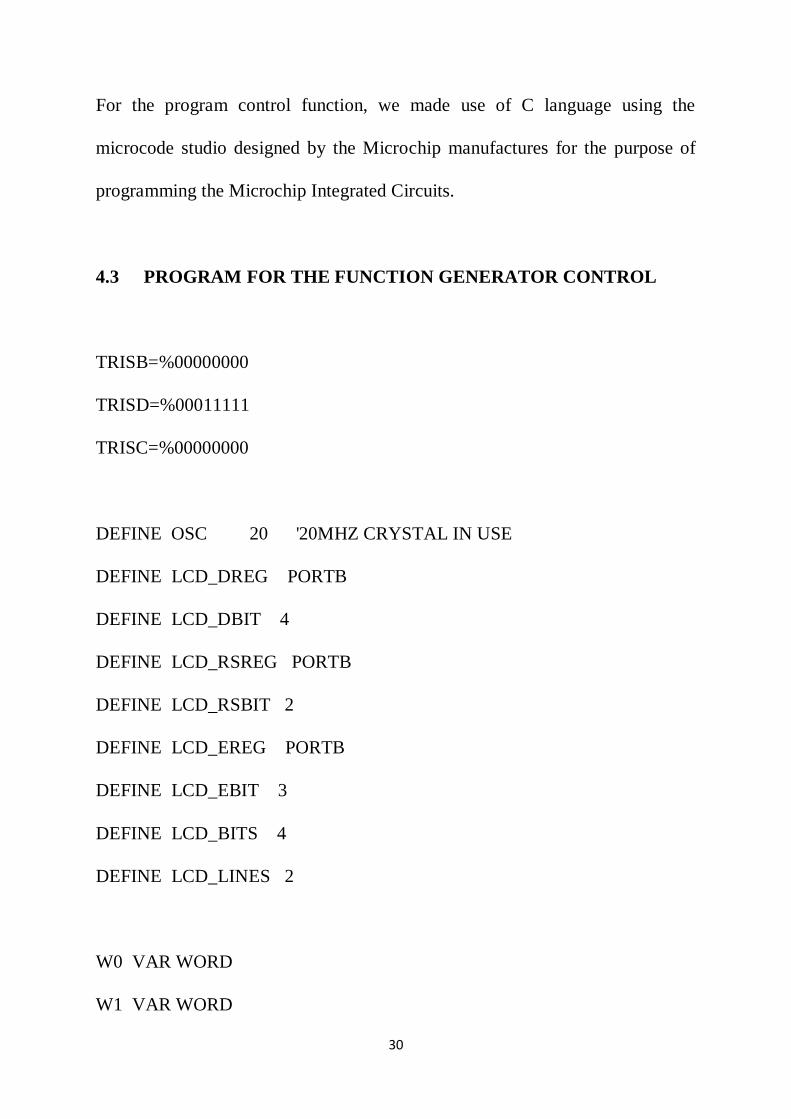
4.3 PROGRAM FOR THE FUNCTION GENERATOR CONTROL
TRISB=%00000000
TRISD=%00011111
TRISC=%00000000
DEFINE OSC 20 '20MHZ CRYSTAL IN USE
DEFINE LCD_DREG PORTB
DEFINE LCD_DBIT 4
DEFINE LCD_RSREG PORTB
DEFINE LCD_RSBIT 2
DEFINE LCD_EREG PORTB
DEFINE LCD_EBIT 3
DEFINE LCD_BITS 4
DEFINE LCD_LINES 2
W0 VAR WORD
W1 VAR WORD
31
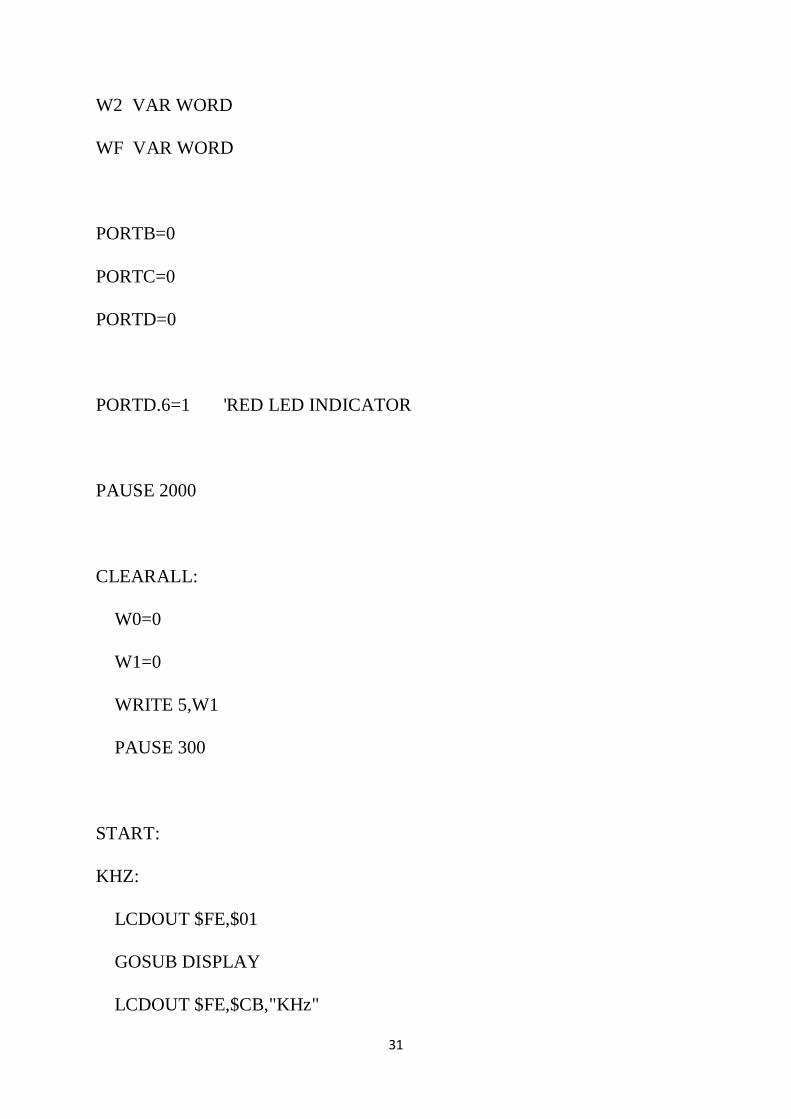
W2 VAR WORD
WF VAR WORD
PORTB=0
PORTC=0
PORTD=0
PORTD.6=1 'RED LED INDICATOR
PAUSE 2000
CLEARALL:
W0=0
W1=0
WRITE 5,W1
PAUSE 300
START:
KHZ:
LCDOUT $FE,$01
GOSUB DISPLAY
LCDOUT $FE,$CB,"KHz"
32
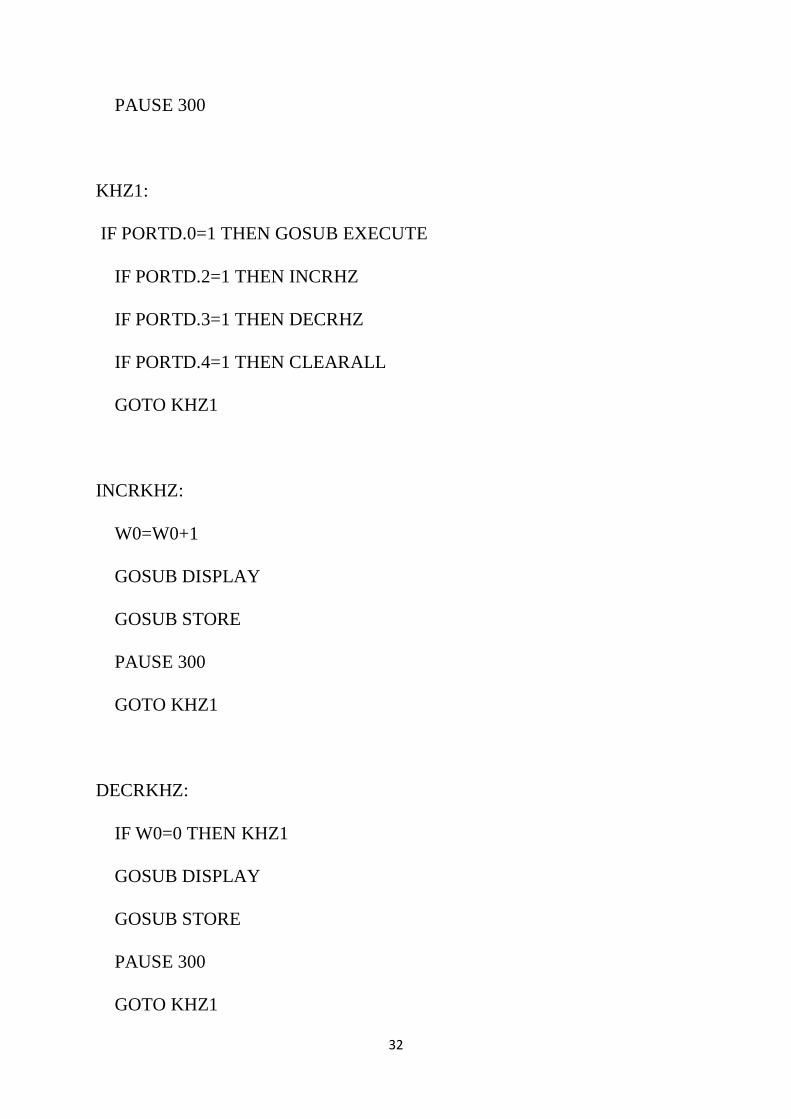
PAUSE 300
KHZ1:
IF PORTD.0=1 THEN GOSUB EXECUTE
IF PORTD.2=1 THEN INCRHZ
IF PORTD.3=1 THEN DECRHZ
IF PORTD.4=1 THEN CLEARALL
GOTO KHZ1
INCRKHZ:
W0=W0+1
GOSUB DISPLAY
GOSUB STORE
PAUSE 300
GOTO KHZ1
DECRKHZ:
IF W0=0 THEN KHZ1
GOSUB DISPLAY
GOSUB STORE
PAUSE 300
GOTO KHZ1
33
HZ:
LCDOUT $FE,$01
GOSUB DISPLAY
LCDOUT $FE,$CC,"Hz"
PAUSE 300
HZ1:
IF PORTD.0=1 THEN GOSUB EXECUTE
IF PORTD.2=1 THEN INCRHZ
IF PORTD.3=1 THEN DECRHZ
IF PORTD.4=1 THEN CLEARALL
GOTO HZ1
INCRHZ:
GOSUB DISPLAY
GOSUB STORE
PAUSE 300
GOTO HZ1
DECRHZ:
IF W0=0 THEN HZ1

34
GOSUB DISPLAY
GOSUB STORE
PAUSE 300
GOTO HZ1
DISPLAY:
LCDOUT $FE,$80,"OUTPUT FREQUENCY"
LCDOUT $FE,$C2,DEC W0," "
RETURN
STORE:
WRITE 5,W1
PAUSE 300
RETURN
EXECUTE:
IF W0=0 THEN WARNING
PORTD.5=1 'GREEN LED INDICATOR
PORTD.6=0 'RED LED INDICATOR
READ 5,W2
PAUSE 300
FREQOUT PORTD.7,60000,W2
35
PAUSE 300
PORTD.5=0 'GREEN LED INDICATOR
PORTD.6=1 'RED LED INDICATOR
RETURN
WARNING:
LCDOUT $FE,$80," NO FREQUENCY "
LCDOUT $FE,$C0," VALUE SELECTED "
PAUSE 2000
GOTO START
END
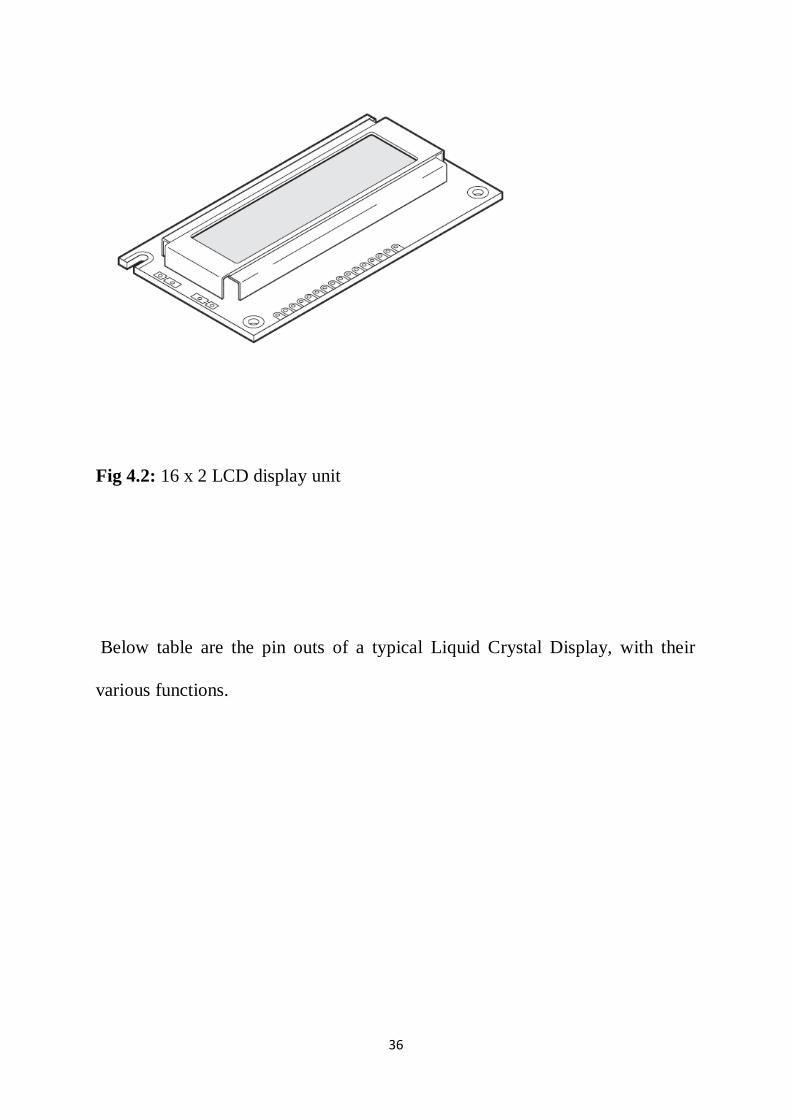
4.4 LCD DISPLAY UNIT
The Display unit for this project design was designed using the Liquid Crystal
Display (LCD). We used the 16 x 2 LCD display unit for the display of
information during the operation of t.
Below picture shows a typical appearance of a Liquid Crystal Display (LCD)
module.
36
Fig 4.2: 16 x 2 LCD display unit
Below table are the pin outs of a typical Liquid Crystal Display, with their
various functions.

37
TABLE 4.1: PINOUTS OF AN LCD AND ITS FUNCTIONS
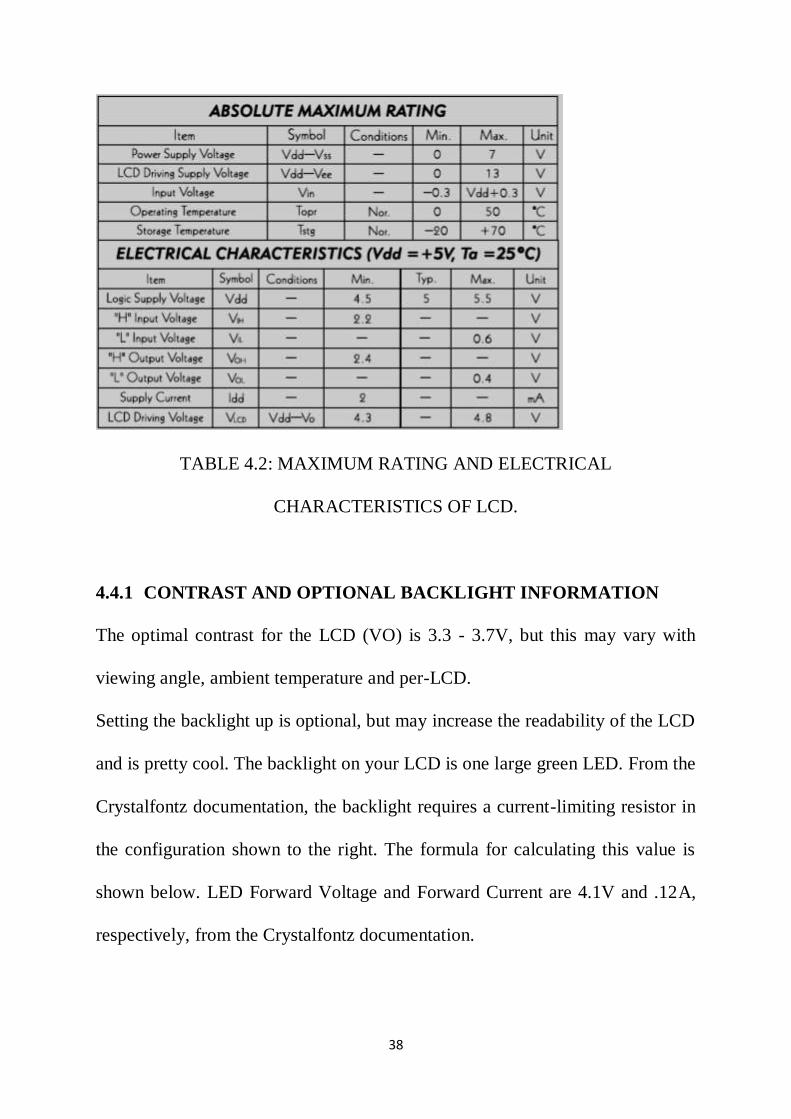
For any electronic device, there are always maximum ratings information that
usually accompany this devices documented by the manufacturers of this
devices. The maximum rating of any electronic device is that value in which
when exceeded causes damage to that device.
Below table information, gives the maximum rating and the electrical
characteristics when operating on safe values of the Liquid Crystal Display
Module.
38
TABLE 4.2: MAXIMUM RATING AND ELECTRICAL
CHARACTERISTICS OF LCD.
4.4.1 CONTRAST AND OPTIONAL BACKLIGHT INFORMATION
The optimal contrast for the LCD (VO) is 3.3 - 3.7V, but this may vary with
viewing angle, ambient temperature and per-LCD.
Setting the backlight up is optional, but may increase the readability of the LCD
and is pretty cool. The backlight on your LCD is one large green LED. From the
Crystalfontz documentation, the backlight requires a current-limiting resistor in
the configuration shown to the right. The formula for calculating this value is
shown below. LED Forward Voltage and Forward Current are 4.1V and .12A,
respectively, from the Crystalfontz documentation.
39
Calculating for the current limiting value of the backlight LED:
Given that, VDD = 5V, VLED = 4.1V, and the Forward Current = 0.12A,
therefore,
RLED = 5 – 4.1 / 0.12
RLED = 0.9 / 0.12
RLED = 7.5Ω
To calculate for the power dissipation of the resistor, we use the equation:
PD = I x V
PD = 0.12 x 7.5
PD = 0.9W
Choosing a closer value, we have 1W. Therefore the current limiting resistor
used for the Backlight LED was 7.5Ω/1W.
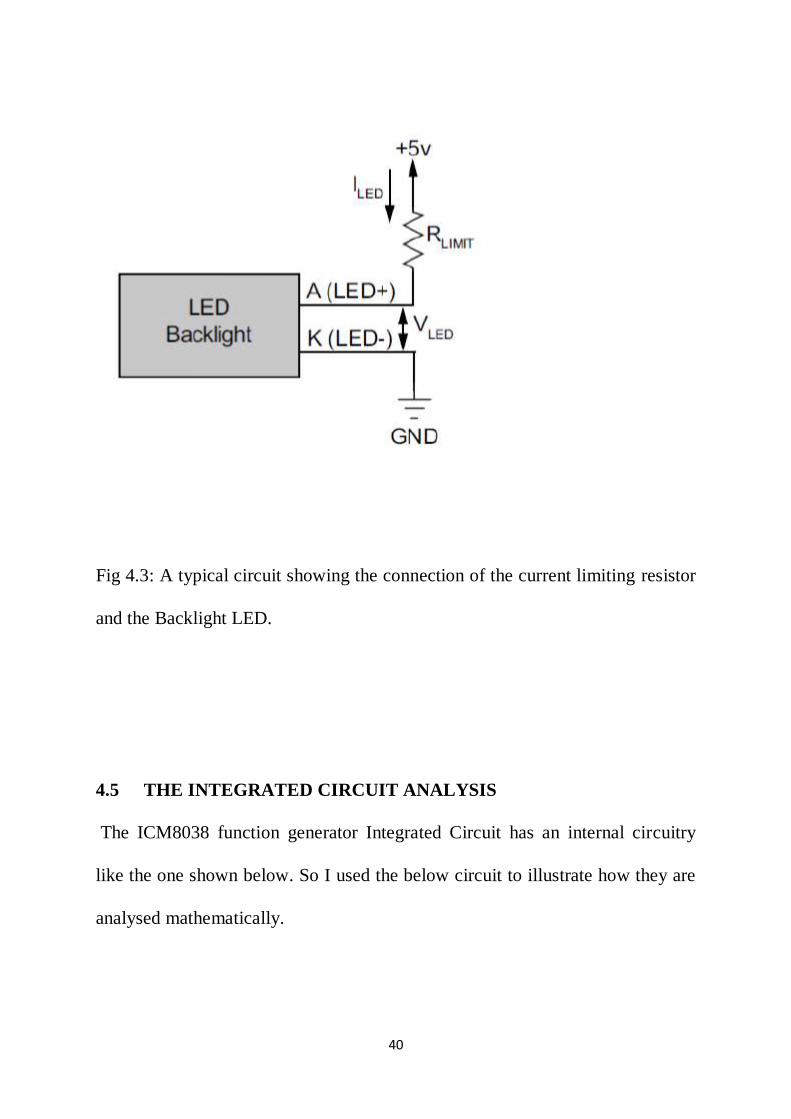
The below diagram, shows a typical circuit showing the connection of the
current limiting resistor and the Backlight LED;
40
Fig 4.3: A typical circuit showing the connection of the current limiting resistor
and the Backlight LED.
4.5 THE INTEGRATED CIRCUIT ANALYSIS
The ICM8038 function generator Integrated Circuit has an internal circuitry
like the one shown below. So I used the below circuit to illustrate how they are
analysed mathematically.

41
Fig 4.4: The circuit showing the mathematical analysis of the generation of the
various signal waveforms required for this project
The above circuit has about four basic stages which were used to achieve the
generation of the various signal waveforms required for this project.
Circuit Analysis for Stage 1:
The first stage had a non-inverting voltage gain given by,
AV = 1 + R2 / R1

42
Where R2 = 100,000. R1 = 27,000. Therefore,
AV = 1 + 100,000 / 27,000
AV = 27,000 + 100,000 / 27,000
AV = 127,000 / 27,000
AV = 4.70
Circuit Analysis for Stage 2:
The second stage had an inverting input and its voltage gain was calculated to
be,
AV = -RF / R
Where RF = 100,000Ω. R = 10,000Ω. Therefore,
AV = 100,000 / 10,000
AV = 10
The cut-off frequency for the RC circuit will be:
Using the frequency formula,
F = 1 / 2πRC
Where C = 0.1µF, R = 100,000Ω, therefore
F = 1/ 2 x 3.142 x 100,000 x 0.1 x 0.000001
F = 15.91 Hz
The non-inverting bias resistor was calculated using the formula,
Rn = RF x R / RF + R
By substitution,
Rn = 100,000 x 10,000 / 100,000 + 10,000

43
Rn = 1000,000,000 / 110,000
Rn = 9090
Rn = 9.1kΩ
The value calculated is impracticable, so we choose the nearest resistance value
of 10kΩ.
Note: The third and fourth stages, appears to similar to the first and second
stages, so the same formulas are applicable.
4.6 BILL OF ENGINEERING MEASUREMENT
S/N ITEM SPECIFICATION QUANTITY UNIT
COST
TOTAL
COST
1 PIC16F877A MICROCONTROLLER 1 ₦1000 ₦1000
2 RESISTORS(fixed wire wound)
220kΩ,4.7kΩ,10kΩ,10kΩ,100Ω,1kΩ
6
₦5
₦30
3 POTENTIOMETER
10kΩ
1
₦20
₦20
4 CAPACITORS
4.7 F( Electrolytic)
1nF,1nF,3.3pF(Ceramics)
2-15pF(Variable Capacitor)
2
3
1
₦20
₦20
₦300
₦40
₦60
₦300

44
5 16 x 2 LCD DISPLAY 1 ₦1500 ₦1500
6 4 MHz CRYSTAL OSCILLATORS 1 ₦50 ₦50
7 VERO BOARD(DOTTED) 2 ₦50 ₦100
8 9 VOLTS DC BATTERY 2 ₦50 ₦100
9 FUNCTIONGENERATOR
INTEGRATED CIRCUIT
1 ₦2500 ₦2500
10 PLASTIC CASING 1 ₦1000 ₦1000
11 BATTERY CONNECTOR 1 ₦50 ₦50
12 LED INDICATOR 2 ₦5 ₦10
13 CONNECTING WIRE 2 ₦20 ₦40
14 MONOMENTARY SWITCH 5 ₦50 ₦250
15 MISCELLANEOUS - - ₦3000
TOTAL COST
₦10,005
TABLE 4.3: BILL OF ENGINEERING MEASUREMENT
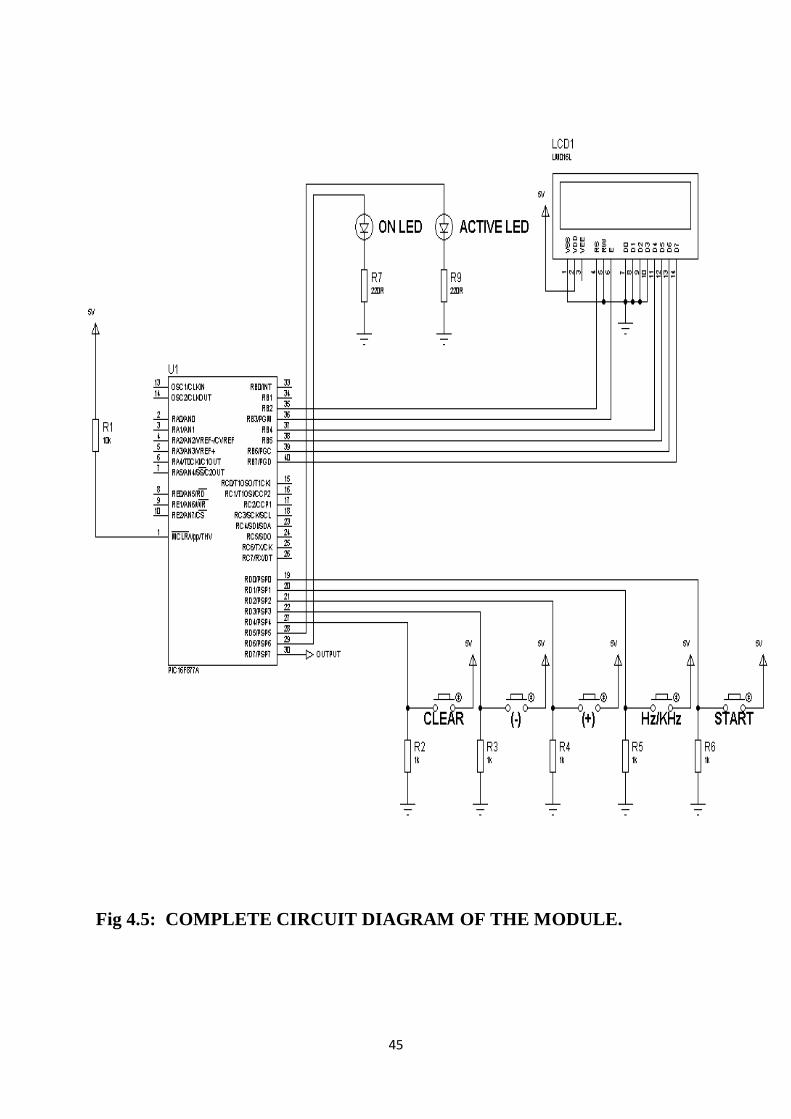
45
Fig 4.5: COMPLETE CIRCUIT DIAGRAM OF THE MODULE.

46
CHAPTER FIVE
CONCLUSION
The design and construction of the function generator was sucessful carried out.
The system is effective due to its wide application in electrical/ electronics
circuits such as in communication circuits for providing signal during
modulation test, for timming circuits for providing the required time delay
(period) used for controlling events, for ultrasonic application use to provide the
required frequency for the ultrasonic transmitterswhich is about 33kHz for some
modules. This has brought about a more modernized, digitally controlled design
where every operations has been programmed using the microcontroller
integrated circuit. The system has been designed using locally available
electronic materials and the cost have been relatively minized using cost
effective circuits.
47
RECOMMENDATION
The Design and implementation of the function generator was developed using
a programmable microcontroller which was the main brain for the project.
Engineers should improve in programming so that there will be a greater range
of its operation and application.
The design used for this project is essentially quite a simple one and it is this
simplicity which partly brings it down when it comes to the overall reliable
performance. The project has succeeded to a great extent, in exposing the very
basic principles involved in the generation of different wave forms. The
following recommendation was made based on the experience in doing the
project and the problem encountered in the course of the work.
Modular design should be used for analysis of each module and it should be
done cautiously.
Accurate programs should be written in order to give the required output clock
frequency.
48
REFERENCES
1. A Textbook of Electrical Technology by B.L Theraja, A.K Theraja,
S.Chand publishers India (24th
Edition)
2. Gibson, G. and Liu, Y., Microcomputers for Engineers and Scientists,
Prentice-Hall,Englewood Cliffs, NJ, 1980.
3. Herschede, R., “Microcontroller Foundations for Mechatronics Students,”
masters thesis,Colorado State University, summer 1999.