chapter one - etda
TRANSCRIPT

The Pennsylvania State University
The Graduate School
Department of Materials Science and Engineering
SYNTHESIS AND COLLOIDAL PROPERTIES OF ANISOTROPIC
HYDROTHERMAL BARIUM TITANATE
A Thesis in Materials Science and Engineering
by
Timothy James Yosenick
© 2005 Timothy James Yosenick
Submitted in Partial Fulfillment of the Requirements
for the Degree of
Doctor of Philosophy
December 2005

This thesis of Timothy James Yosenick was reviewed and approved* by the following:
James H. Adair Professor of Materials Science and Engineering Thesis Co-Advisor Co-Chair of Committee Clive A. Randall Professor of Materials Science and Engineering Thesis Co-Advisor Co-Chair of Committee Susan Trolier-McKinstry Professor of Ceramic Science and Engineering Thomas Shrout Professor of Materials Darrell Velegol Associate Professor of Chemical Engineering James Runt Professor of Materials Science and Engineering Associate Head for Graduate Studies
*Signatures are on file in the Graduate School

iii
ABSTRACT Nanoparticles of high dielectric constant materials, especially BaTiO3, are
required to achieve decreased layer thickness in multilayer ceramic capacitors (MLCCs).
Tabular metal nanoparticles can produce thin metal layers with low surface roughness via
electrophoretic deposition (EPD). To achieve similar results with dielectric layers
requires the synthesis and dispersion of tabular BaTiO3 nanoparticles. The goal of this
study was to investigate the deposition of thin BaTiO3 layers using a colloidal process.
The synthesis, interfacial chemistry and colloidal properties of hydrothermal BaTiO3, a
model particle system, was investigated. After characterization of the material system
particulates were deposited to form thin layers using EPD.
In the current study, the synthesis of BaTiO3 has been investigated using a
hydrothermal route. TEM and AFM analyses show that the synthesized particles are
single crystal with a majority of the particle having a <111> zone axis and {111} large
face. The particles have a median thickness of 5.8 ± 3.1 nm and face diameter of 27.1 ±
12.3 nm. Particle growth was likely controlled by the formation of {111} twins and the
synthesis pH which stabilizes the {111} face during growth. With limited growth in the
<111> direction, the particles developed a plate-like morphology. Physical property
characterization shows the powder was suitable for further processing with high purity,
low hydrothermal defect concentration, and controlled stoichiometry. TEM observations
of thermally treated powders indicate that the particles begin to loose the plate-like
morphology by 900 °C.

iv
The aqueous surface chemistry of BaTiO3 is complex and difficult to model using
current models due to the pH dependent dissolution/readsorption of Ba2+ at the surface.
In addition the precipitation of BaCO3 at high pH influences the surface chemistry. In the
current study a model was developed to account for the effect of dissolved Ba2+ as a
function of pH. Three distinct regions in the surface chemistry are observed as a function
of pH. At low pH, the dissolution of Ba2+ results in a TiO2 surface which can be
described using the MUSIC model. As pH increases the affect of dissolved Ba2+
becomes more prominent. The adsorption of Ba2+ onto the TiO2 is observed and can be
modeled using a modified Stern isotherm. In basic environments (>pH 9.5) the
precipitation of BaCO3 on the surface of the BaTiO3 particles requires the use of a
Nernst-Gouy-Stern charging model to described the surface.
The aqueous passivation, dispersion, and doping of nanoscale BaTiO3 powders
was investigated. Passivation BaTiO3 was achieved through the addition of oxalic acid.
The oxalic acid selectively adsorbs onto the particle surface and forms a chemically
stable 2-3 nm layer of barium oxalate. The negative surface charge of the oxalate
effectively passivated the BaTiO3 providing a surface suitable for the use of a cationic
dispersant, polyethylenimine (PEI). Rheological properties indicate the presence of an
oxalate-PEI interaction which can be detrimental to dispersion. With a better
understanding of the aqueous surface chemistry of BaTiO3 the surface chemistry was
manipulated to control the adsorption of aqueous soluble complexes of Co, Nb, and Bi,
three common dopants in the processing of BaTiO3. Surface charge, TEM, and EDS
analysis showed that while in suspension the dopants selectively absorbed onto the
particle surface forming an engineered coating.

v
The electrophoretic deposition of two different BaTiO3 nanoparticle suspensions
was investigated. The effect of solution chemistry on dispersion, deposition kinetics, and
film microstructure is addressed. The conditions necessary for optimum dispersion
results in low deposition rates and poor film adhesion. High dispersant concentration
leads to electrochemical inhibition at the electrode and reduced field drop in the bulk of
solution. Low effective fields in the bulk of the suspension results in low electrophoretic
velocities and reduced deposition kinetics. Strong repulsive interactions between the
particles and electrode lead to poor adhesion for the particles that do deposit. The
addition of an indifferent electrolyte reduces the repulsion and improves adhesion.
However, the indifferent electrolyte reduces the zeta potential of the particles in
suspension, leading to aggregation prior to deposition. Deposited films comprised of
aggregates exhibit inhomogeneous microstructures.

vi
TABLE OF CONTENTS
LIST OF FIGURES . . . . . . . . . . . . . . . . . . . . . . . . . . . . . . . . . . . . . . . . . . . . x
LIST OF TABLES . . . . . . . . . . . . . . . . . . . . . . . . . . . . . . . . . . . . . . . . . . . xvii
ACKNOWLEDGEMENTS . . . . . . . . . . . . . . . . . . . . . . . . . . . . . . . . . . . . . .xix
Chapter One: Research Objectives . . . . . . . . . . . . . . . . . . . . . . . . . . . . . . . . . 1
Chapter Two: A Literature Review of the Synthesis, Dispersion, Doping
and Electrical Properties of Barium Titanate Materials . . . . . . . . . . . . . . . . . . . 4
2.1: Introduction . . . . . . . . . . . . . . . . . . . . . . . . . . . . . . . . . . . . . . . . . . 4
2.2: Synthesis of Nanoscale BaTiO3 Powder . . . . . . . . . . . . . . . . . . . . . . . . 6
2.3: Surface Chemistry and Dispersion of BaTiO3 . . . . . . . . . . . . . . . . . . . 16
2.4: Doping and Microstructure of Sintered BaTiO3 … . . . . . . . . . . . . . . . . 21
2.4.1: Core-shell structure . . . . . . . . . . . . . . . . . . . . . . . . . . . . . . 21
2.4.2: Doping for Base Metal Electrodes . . . . . . . . . . . . . . . . . . . . 25
2.4.3: Doping Methodology . . . . . . . . . . . . . . . . . . . . . . . . . . . . 29
2.5: Size Effects and Electrical Properties of Nanoscale BaTiO3 Materials . . . 31
2.5.1: BaTiO3 Particles . . . . . . . . . . . . . . . . . . . . . . . . . . . . . . . 31
2.5.2: Bulk BaTiO3 . . . . . . . . . . . . . . . . . . . . . . . . . . . . . . . . . . 34
2.5.3: BaTiO3 Thin Films . . . . . . . . . . . . . . . . . . . . . . . . . . . . . . 35
2.5.4: Electrode-Dielectric Interactions . . . . . . . . . . . . . . . . . . . . . 37
2.6: Conclusions . . . . . . . . . . . . . . . . . . . . . . . . . . . . . . . . . . . . . . . . . 39
References . . . . . . . . . . . . . . . . . . . . . . . . . . . . . . . . . . . . . . . . . . . . . . . . . 40

vii
Chapter Three: Synthesis of Nanotabular Barium Titanate via a Hydrothermal
Route . . . . . . . . . . . . . . . . . . . . . . . . . . . . . . . . . . . . . . . . . . . . . . . . . . . . . 53
3.1: Introduction . . . . . . . . . . . . . . . . . . . . . . . . . . . . . . . . . . . . . . . . . 53
3.2: Materials and Methods . . . . . . . . . . . . . . . . . . . . . . . . . . . . . . . . . . 55
3.3: Results and Discussion . . . . . . . . . . . . . . . . . . . . . . . . . . . . . . . . . . 58
3.3.1: BaTiO3 Particle Morphology and Growth . . . . . . . . . . . . . . . 58
3.3.2: Characterization of Physical Properties . . . . . . . . . . . . . . . . . 69
3.3.3: Morphological Evolution as a Function of Temperature . . . . . . 72
3.4: Conclusions . . . . . . . . . . . . . . . . . . . . . . . . . . . . . . . . . . . . . . . . . 76
References . . . . . . . . . . . . . . . . . . . . . . . . . . . . . . . . . . . . . . . . . . . . . 78
Chapter Four: Aqueous Surface Chemistry of Hydrothermally Derived BaTiO3
Nanoparticles . . . . . . . . . . . . . . . . . . . . . . . . . . . . . . . . . . . . . . . . . . . . . . . . 81
4.1: Introduction . . . . . . . . . . . . . . . . . . . . . . . . . . . . . . . . . . . . . . . . . 81
4.2: Experimental Observations of BaTiO3 Surface Charging in an Aqueous
Environment . . . . . . . . . . . . . . . . . . . . . . . . . . . . . . . . . . . . . . . . . 84
4.2.1: Acidic pH – Amorphous TiO2 Surface . . . . . . . . . . . . . . . . . 84
4.2.2: Neutral pH – Ba2+ Adsorption . . . . . . . . . . . . . . . . . . . . . . . 86
4.2.3: Basic pH – BaCO3 Formation . . . . . . . . . . . . . . . . . . . . . . . 87
4.3: Materials and Methods . . . . . . . . . . . . . . . . . . . . . . . . . . . . . . . . . . 88
4.4: Results and Discussion . . . . . . . . . . . . . . . . . . . . . . . . . . . . . . . . . . 90
4.4.1: Low pH – Amorphous TiO2 Surface . . . . . . . . . . . . . . . . . . . 90
4.4.1.1: Determination of BaTiO3 Surface Groups . . . . . . . . . 90

viii
4.4.1.2: Combination of MUSIC model and Gouy-Chapman
Model . . . . . . . . . . . . . . . . . . . . . . . . . . . . . . . . 93
4.4.2: Neutral pH – Ba2+ Adsorption . . . . . . . . . . . . . . . . . . . . . . . 99
4.4.3: High pH – BaCO3 Formation . . . . . . . . . . . . . . . . . . . . . . .101
4.4.4: Comparison of Experimental and Theoretical Calculations . . . .102
4.5: Conclusions . . . . . . . . . . . . . . . . . . . . . . . . . . . . . . . . . . . . . . . . .113
References . . . . . . . . . . . . . . . . . . . . . . . . . . . . . . . . . . . . . . . . . . . . .116
Chapter Five: Passivation, Dispersion, and Aqueous Solution Doping of
Platelet BaTiO3 Powder . . . . . . . . . . . . . . . . . . . . . . . . . . . . . . . . . . . . . . . .120
5.1: Introduction . . . . . . . . . . . . . . . . . . . . . . . . . . . . . . . . . . . . . . . . .120
5.2: Materials and Methods . . . . . . . . . . . . . . . . . . . . . . . . . . . . . . . . . .125
5.3: Results and Discussion . . . . . . . . . . . . . . . . . . . . . . . . . . . . . . . . . .128
5.3.1: Passivation . . . . . . . . . . . . . . . . . . . . . . . . . . . . . . . . . . .128
5.3.2: Dispersion . . . . . . . . . . . . . . . . . . . . . . . . . . . . . . . . . . . .134
5.3.3: Doping of Nanotabular BaTiO3 . . . . . . . . . . . . . . . . . . . . . .143
5.4: Conclusions . . . . . . . . . . . . . . . . . . . . . . . . . . . . . . . . . . . . . . . . .152
References . . . . . . . . . . . . . . . . . . . . . . . . . . . . . . . . . . . . . . . . . . . . .154
Chapter Six: Electrophoretic Deposition of Hydrothermally Derived Barium
Titanate Tabular Nanoparticles with a Cationic Dispersant . . . . . . . . . . . . . . . .159
6.1: Introduction . . . . . . . . . . . . . . . . . . . . . . . . . . . . . . . . . . . . . . . . .159
6.2: Theoretical Background – Mechanisms of EPD . . . . . . . . . . . . . . . . .161
6.3: Materials and Methods . . . . . . . . . . . . . . . . . . . . . . . . . . . . . . . . . .163
6.4: Results and Discussion . . . . . . . . . . . . . . . . . . . . . . . . . . . . . . . . . .167

ix
6.4.1: Dispersion . . . . . . . . . . . . . . . . . . . . . . . . . . . . . . . . . . . .167
6.4.2: EPD . . . . . . . . . . . . . . . . . . . . . . . . . . . . . . . . . . . . . . . .173
6.4.2.1: Kinetics . . . . . . . . . . . . . . . . . . . . . . . . . . . . . . .173
6.4.2.2: Adhesion . . . . . . . . . . . . . . . . . . . . . . . . . . . . . .186
6.4.3: Film Microstructure . . . . . . . . . . . . . . . . . . . . . . . . . . . . .193
6.5: Conclusions . . . . . . . . . . . . . . . . . . . . . . . . . . . . . . . . . . . . . . . . .199
References . . . . . . . . . . . . . . . . . . . . . . . . . . . . . . . . . . . . . . . . . . . . .200
Chapter Seven: Conclusions and Suggest Work
7.1: Summary and Conclusions . . . . . . . . . . . . . . . . . . . . . . . . . . . . . . .205
7.2: Suggested Work . . . . . . . . . . . . . . . . . . . . . . . . . . . . . . . . . . . . . .207
References . . . . . . . . . . . . . . . . . . . . . . . . . . . . . . . . . . . . . . . . . . . . .210
Appendix A: Algorithm for the Determination of Surface Potential Using the
MUSIC Model . . . . . . . . . . . . . . . . . . . . . . . . . . . . . . . . . . . . . . . . . . . . . . .211
References . . . . . . . . . . . . . . . . . . . . . . . . . . . . . . . . . . . . . . . . . . . . .214
Appendix B: Dispersion of Solution Based Doped BaTiO3 Platelets for
Electrophoretic Deposition . . . . . . . . . . . . . . . . . . . . . . . . . . . . . . . . . . . . . .215
References . . . . . . . . . . . . . . . . . . . . . . . . . . . . . . . . . . . . . . . . . . . . .222
Appendix C: Stabil Calculation for Heterogeneous Coagulation . . . . . . . . . . . .223
References . . . . . . . . . . . . . . . . . . . . . . . . . . . . . . . . . . . . . . . . . . . . .229

x
LIST OF FIGURES 2.1 Schematic of a typical MLCC showing the three materials systems used in the
fabrication of a MLCC: (1) the dielectric, (2) internal electrode, and (3) termination . . . . . . . . . . . . . . . . . . . . . . . . . . . . . . . . . . . . . . . . . . . . . . 5
2.2 Ideal solubility diagram for BaTiO3 in an aqueous environment with CO2 showing that BaTiO3 is not the thermodynamically stable form of barium in
water, from Bendale et al . . . . . . . . . . . . . . . . . . . . . . . . . . . . . . . . . . . . 17 2.3 Plot of the dielectric constant of BaTiO3 versus temperature for single crystal
BaTiO3 taken from Merz. Three distinct peaks in the dielectric constant are observed. The three peaks coincide with the three phase transitions in BaTiO3: rhombohedral to orthorhombic (-90 °C), orthorhombic to tetragonal (0 °C),
and tetragonal to cubic (130 °C) . . . . . . . . . . . . . . . . . . . . . . . . . . . . . . . 22 2.4 The superposition of individual transitions results in a broad diffuse transition,
which is more stable with change in temperature . . . . . . . . . . . . . . . . . . . . 26 2.5 Plot showing the dependence of the dielectric constant of BaTiO3 with grain size in both bulk ceramics (●) and thin films (Δ) . . . . . . . . . . . . . . . . . . . . 32 3.1 Flow diagram for the hydrothermal synthesis of platelet BaTiO3. The starting
solution is 500 mL total of a 1M solution, and has an approximate yield of 120g of powder . . . . . . . . . . . . . . . . . . . . . . . . . . . . . . . . . . . . . . . . . . 56 3.2 X-ray diffraction pattern for as-synthesized powder and powder heat treated to
1000 °C. The as-synthesized powder is pseudo-cubic due to the presence of hydrothermal defects in the lattice. After heat treatment at 1000 °C peak
splitting is observable in the (200)/(002) peak (see insert graph) and indicates the material has converted to the tetragonal form of BaTiO3. Note: * Cubic
BaTiO3 peaks JCPDS Card: 31-0174 and + Tetragonal BaTiO3 peaks JCPDS Card: 79-2264 . . . . . . . . . . . . . . . . . . . . . . . . . . . . . . . . . . . . . . . . . . . 59
3.3 TEM micrograph (a) and associated selected area electron diffraction pattern (b). The single crystal diffraction pattern shows that the particles are single
crystals with <111> zone axis. The absence of diffraction from (111) in the partial ring diffraction pattern (c) from a cluster of particle shows a majority
of the particles in the cluster show texture . . . . . . . . . . . . . . . . . . . . . . . . . 60 3.4 AFM cross-sectional image of the BaTiO3 particle on an atomically flat cleaved mica substrate. The particles have a plate-like morphology with a thickness of 7.9 nm and face diameter of 46.9 nm . . . . . . . . . . . . . . . 62

xi
3.5 Thickness and face diameter size distributions for the hydrothermal BaTiO3 platelets. The distributions were calculated using the AFM offline software
and image analysis software. Both of the distributions are based on a total of 214 particles . . . . . . . . . . . . . . . . . . . . . . . . . . . . . . . . . . . . . . . . . . . . 63 3.6 Schematic of BaTiO3 platelets formed via multiple {111} twin formation. After Schmelz and Thomann . . . . . . . . . . . . . . . . . . . . . . . . . . . . . . . . . 65 3.7 Schematic representations of (a) (100) plane, (b) (110) plane and (c) (111) plane rendered using Atoms for Windows. Each figure shows the oxygen coordination of titanium in each plane. The geometry of each plane was used to calculate the Ti planar density and surface OH density . . . . . . . . 66 3.8 Weight loss curve for platelet, commercial powder A, and commercial powder B. The weight loss from 300 to 500 °C is due to the removal of hydroxyl defects, whereas the weight loss at higher temperatures is the removal of BaCO3 . . . . . . . . . . . . . . . . . . . . . . . . . . . . . . . . . . . . . . . . . . . . . . 71 3.9 TGA and dTGA platelet powder shows the presence of four reactions occurring at 350, 425, 660, and 760 °C . . . . . . . . . . . . . . . . . . . . . . . . . . . 73 3.10 Series of TEM images showing the morphological evolution of the platelet particles as a function of temperature: (a) 25 °C – as-synthesized, (b) 375°C, (c) 450 °C, (d) 700 °C, (e) 800 °C, (f) 900 °C, (g) 1000 °C, and (h) 1100 °C. Neck formation is observable at 800 °C with morphological changes
occurring by 900 °C. At 375 °C hydrothermal defects have begun to coalesce and are not removed until 1000 °C . . . . . . . . . . . . . . . . . . . . . . . . . . . . . 74 4.1 Ideal solubility diagram for BaTiO3-H2O-CO2 system from Bendale et al. Ba2+ dissolution is favored at low pH. As pH increases, Ba2+ solubility decreases until the precipitation of BaCO3 is favored. The TEM image of a
BaTiO3 particle treated in water at pH 6.5 show the presence of an amorphous TiO2 surface layer . . . . . . . . . . . . . . . . . . . . . . . . . . . . . . . . 82 4.2 α values for four different surface groups on BaTiO3 as a function of suspension pH. α represents the degree of protonation of all of the specific
surface sites present on the surface. For example, below pH 13 all of the …O-1 groups have an associated proton, but above pH 14 all of the groups are deprotonated. Over the entire pH range one of the four reactions is controlling the surface charging of BaTiO3 . . . . . . . . . . . . . . . . . . . . . . . . 97 4.3 Dissolution data for aqueous BaTiO3 suspensions with increasing solid loadings. As expected Ba2+ dissolution is minimized at high pH and increases with increasing amount of surface area present in suspension. Data from Chodelka . . . . . . . . . . . . . . . . . . . . . . . . . . . . . . . . . . . . . . .104

4.4 Dissolution data for BaTiO3 as function of solution pH normalized for surface area present in solution. A good linear fit of observed and the empirical equation was used to determine the concentration of dissolved Ba2+ in the modeling of surface chemistry of BaTiO3. r2 = 0.937 . . . . . . . . .105 4.5 Zeta potential of aqueous BaTiO3 suspension (40 m2/L) showing the three
different regions of surface charge in BaTiO3. Region I controlled by a native TiO2 surface. The increase in Region II is due to the adsorption of Ba2+
(aq) onto the TiO2 surface. The decrease in Region III is due to precipitation of
BaCO3 on the BaTiO3 surface. r2 = 0.884 . . . . . . . . . . . . . . . . . . . . . . . . .106 4.6 Schematic showing the evolution of the surface charging mechanism as a function of solution pH for BaTiO3 in an aqueous environment. At low pH Ba2+ dissolution leads to a TiO2 surface. As the pH increases Ba2+
(aq) adsorption results in a deviation from an ideal TiO2 surface. In a basic
environment the precipitation of BaCO3 on the surface controls the surface charge . . . . . . . . . . . . . . . . . . . . . . . . . . . . . . . . . . . . . . . . . . . . . . . .107 4.7 TEM images of the commercial BaTiO3: (a) image showing that the particles are equiaxed, and (b) high resolution image showing lattice fringes a selected
particle with a <011> zone axis and that the surface of the particle is -
terminated by the (100) (0.40 nm) and (011) (0.28 nm) planes . . . . . . . . . . .111 4.8 Plot of zeta potential versus pH for 1wt% suspensions of platelet and equiaxed particles in a 95/5 ethanol/water solvent mixture. Suspensions were
prepared in the solvent mixture to limit Ba2+ dissolution. However, a small amount of dissolved Ba2+ is present at pH greater than pH 8 necessitating the inclusion of Ba2+ adsorption at high pH to account for low negative zeta
potential values and pH greater than pH 10 . . . . . . . . . . . . . . . . . . . . . . . .112 5.1 TEM image of an oxalate passivated BaTiO3 particle. Treatment with oxalic acid results in a 2 nm thickness surface layer of barium oxalate which inhibits the surface from degradation . . . . . . . . . . . . . . . . . . . . . . . . . . . . . . . . .129 5.2 Zeta potential of 1wt% suspension of nanoplatelet BaTiO3 in water with
increasing amounts of oxalic acid as a function of pH. Full surface passivation is achieved by an oxalic acid concentration of 3x10⁻³ M (3.75w/w). A further increase in the oxalic acid concentration results in an increase in the
magnitude of the zeta potential . . . . . . . . . . . . . . . . . . . . . . . . . . . . . . . .130 5.3 Plot of soluble Ba2+
(aq) concentration as a function of suspension pH and oxalic acid concentration for the platelet BaTiO3. An oxalic acid concentration of 5x10⁻² M yields the best surface passivation yet lower
concentrations are acceptable as long as the solution pH remains greater
xii
than pH 5 . . . . . . . . . . . . . . . . . . . . . . . . . . . . . . . . . . . . . . . . . . . . . .132

xiii
5.4 At acidic pH values Ti forms a soluble complex with oxalic acid. At high oxalic acid concentration Ti dissolution from the BaTO3 surface is unacceptable. However, at an oxalic acid concentration of 3x10⁻³ M at pH values greater than pH 5 the Ti4+ concentration in solution is negligible. (--) at 10-7 M indicates limit of detection for Ti4+with ICP-ES. Lines are trend lines only . . . . . . . . . . . . . . . . . . . . . . . . . . . . . . . . . . . . . . . . . . . . . .133 5.5 The addition of PEI to oxalic acid passivated BaTiO3 suspensions results in a
positive zeta potential due to the adsorption of PEI on the barium oxalate surface. In addition to large positive zeta potential values PEI adds a steric
hindrance to aids in particle dispersion . . . . . . . . . . . . . . . . . . . . . . . . . . .136 5.6 The shear stress and viscosity of 10vol% suspensions with 2.5w/w PEI shows that increasing the oxalic acid concentration results in a deviation from
Newtonian behavior due to the interaction of PEI and oxalic acid to form a gel network of amine oxalate. The linear regions of (a) were fit with Bingham’s law and the y-intercept was reported as τB, the yield point. All
suspensions measured were at pH 7 to maintain an approximate zeta potential of approximately +25mV . . . . . . . . . . . . . . . . . . . . . . . . . . . . . . . . . . . .137 5.7 Apparent viscosity (a) and yield point (b) values as a function of oxalate concentration for 10vol% suspensions with varying concentration of PEI. The suspensions containing excess oxalic acid exhibit increased viscosity and yield point due to the formation of amine oxalate gel network. All suspensions were measured at pH 7 to maintain a constant zeta potential of +25 mV . . . . . . . . . . . . . . . . . . . . . . . . . . . . . . . . . . . . . . . . . . . . . . .141 5.8 Zeta potential of doped platelet particle as a function of dopant concentration. As Co is added to the suspension a reaction with excess oxalic acid occurs to form a cobalt oxalate surface. When PEI is added, the surface becomes positive and is suitable for the adsorption of the negatively charge Nb and Bi
complexes . . . . . . . . . . . . . . . . . . . . . . . . . . . . . . . . . . . . . . . . . . . . .144 5.9 Schematic representation of the doping processing. First oxalic acid and cobalt are added forming an oxalate surface layer which passivates the surface. PEI is added to disperse the particles and provide a positive surface
charge for the adsorption of the Nb and Bi which are added in the final step . .146 5.10 TEM images showing the morphological evolution of the particle surface at each step of the doping process: (a) as synthesized particle, (b) oxalic acid
passivated particle, the insert shows a 2-3 nm surface layer of barium oxalate, (c) Co doped particle, (d) Co, Nb doped particle, and (e) fully doped particle
which shows the addition of Bi results in 1-2 nm deposits on the surface of the particle. . . . . . . . . . . . . . . . . . . . . . . . . . . . . . . . . . . . . . . . . . . . . . . .147

xiv
5.11 EDS spectrum of a cluster of doped platelet particles. The spectrum shows the presence of the three dopants Co, Nb, and Bi. The C, Cu, and Fe present are due to contamination from either the TEM sample grid or TEM instrument. The insert detail is added to show the presence of Nb and Bi because the signal to noise ratio at lower energies is too small to indicate the
presence of the dopants . . . . . . . . . . . . . . . . . . . . . . . . . . . . . . . . . . . . .148 5.12 XRF data for doped platelet powder samples showing that the actual concentrations of the CoO, Nb2O5, and Bi2O3 deviate from the prepared concentrations expect Sample 1, which is only doped with 5wt% Bi2O3 . . . . .151 6.1 Zeta potential of equiaxed BaTiO3 powder shows that the zeta potential decreases as the HCl concentration increases due to increased ionic strength in solution. Although high zeta potential values are observed, suspensions
prepared by electrostatic dispersion were not stable and therefore not suitable for deposition . . . . . . . . . . . . . . . . . . . . . . . . . . . . . . . . . . . . . . . . . . .170 6.2 Zeta potential of equiaxed BaTiO3 as a function of PEI concentration for differing concentrations of oxalic acid with increasingly negative surface charge. The negative surface charge is suitable for the adsorption of a cationic dispersant, PEI. As the PEI concentration increases the sign of the
surface charge reverses. A PEI concentration of 2w/w results in zeta potential values of approximately 80 mV. All suspensions prepared had an HCl concentration of 10-3 M . . . . . . . . . . . . . . . . . . . . . . . . . . . . . . . . . .172
6.3 Particle size distribution for the HOx/PEI dispersed platelet particles shows that a PEI concentration of only 0.25w/w results in the best dispersion with a
median particle size, D(50), of 16.6 nm. Low PEI concentrations do not provide enough surface charge for good dispersion while high PEI concentrations can result in bridging flocculation which degrades dispersion. All suspensions prepared had 2w/w HOx and 10-3 M HCl . . . . . . . . . . . . . .174 6.4 (a) Ideal equivalent circuit for the EPD cell. Rexp and Ccell are the experimental setup resistance and capacitance of the EPD cell, respectively. Both are dependent on the experimental setup and remain constant. Rsol is the solution resistance, Cdl is the capacitance of the electrode double layer, and Rtran is the electron transfer resistance of electrochemical reactions. (b)
Schematic representing the ideal Cole-Cole plot for the equivalent circuit . . . .176 6.5 Cyclic voltamagramm for three ethanol solutions containing HCl and PEI. The addition of 1mM HCl shows the evidence of two electrochemical reactions that occur at the cathode both of which have a profound effect on the pH of the solution near the cathode. The presence of PEI inhibits the
electrochemical reactions by adsorbing onto the electrode and increasing the electron transfer resistance at the cathode . . . . . . . . . . . . . . . . . . . . . . . . .178

xv
6.6 Cole-Cole plot for a 10-3 M HCl solution in ethanol. The center of the second
semi-circle is depressed below the x-axis indicating the Cdl is not an ideal capacitor but a constant phase element, which is due the roughness of the electrode surface . . . . . . . . . . . . . . . . . . . . . . . . . . . . . . . . . . . . . . . . .179
6.7 Schematic showing the effect of excess PEI on the electrochemistry of deposition. When excess PEI is present it contaminates the electrode and inhibits electrochemical reactions and particle deposition. At areas of the electrode unaffected by PEI electrochemical reactions occurs and particle deposition occurs. If the PEI concentration is too large the entire electrode can be contaminated and deposition is completely inhibited . . . . . . . . . . . . .183 6.8 Deposition current and rate as a function of PEI concentration used for dispersion. As the PEI concentration increases the current and deposition rate
decreases due to the presence of unabsorbed PEI on solution. During deposition the excess PEI absorbs onto the cathode and inhibits electrochemical reactions decreasing the current . . . . . . . . . . . . . . . . . . . .185 6.9 Schematic showing the process of charge neutralization. Water is reduced at the cathode and the pH increases due to production of hydroxyl groups. The
increased pH results in the PEI losing charge and desorbing from the BaTiO3 particle surface . . . . . . . . . . . . . . . . . . . . . . . . . . . . . . . . . . . . . . . . . .188
6.10 Zeta potential of platelet BaTiO3 and Pt electrode in pure ethanol as a function of LiCl concentration. The addition of an indifferent electrolyte lowers the zeta potential and therefore the repulsive interactions between the
depositing particles and the electrode. Without the addition of the LiCl the large repulsive interactions between the particles and electrode lead to a lack of adhesion of the particles on the electrode . . . . . . . . . . . . . . . . . . . . . . .190 6.11 Interaction energy curves for the platelet BaTiO3 and Pt electrode. The curves
were calculated using Stabil and the physical constants in Table 6.3. The addition of LiCl, as expected, lowers the repulsive interaction between the particles and electrodes. However, the addition of ≥ 1mM LiCl results in a small repulsive interaction which is not suitable for good dispersion . . . . . . .191 6.12 The conductivity and deposition rate of suspensions with LiCl added are highly dependent on the concentration of LiCl. Although adding LiCl improves film adhesion it results in decreased deposition kinetics . . . . . . . . .194 6.13 (a) TEM image of a film cross-section and (b) AFM deflection image of top
surface of an EPD film of equiaxed BaTiO3 particles. The film has a thickness of 613 nm with a surface roughness of 106 nm . . . . . . . . . . . . . . .195

xvi
6.14 AFM deflection image of EPD film deposited from a platelet BaTiO3 suspension. Electrode surface coverage is incomplete and the film appears to be comprised of aggregates . . . . . . . . . . . . . . . . . . . . . . . . . . . . . . . . . .197 6.15 XRD analysis of deposited platelet powders showing that crystallographic texture did not develop during deposition. The lines represent the peak positions and relative intensity for tetragonal BaTiO3 powder (JCPDS 79-2264). Increasing the voltage is expected to: (1) increase the layer thickness, and (2) provide a higher driving force for the flat laydown on
platelet particles, but no improvement in texture is observed as the deposition voltage increases. The presence of particle aggregates as seen in AFM images
the reason for the lack of texture. Note: * The diminishing peak at 26º 2θ is due the underlying Pt/Mylar substrate used as the electrode . . . . . . . . . . . . .198 A.1 Simple flow diagram showing the steps necessary to calculate the surface potential as a function of solution pH using the MUSIC model . . . . . . . . . . .212 B.1 The zeta potential of doped and undoped BaTiO3 suspensions as a function of PEI concentration. The PEI provides surface charge as well as adsorption sites for the ionic dopants. When the dopants adsorb, surface sites are neutralized and the surface charge decreases lowering the zeta potential.
Decreasing the pH increases the zeta potential, but it is not sufficient to create stable dispersions . . . . . . . . . . . . . . . . . . . . . . . . . . . . . . . . . . . .217 B.2 Interaction energy curves for doped and undoped BaTiO3 showing that a repulsive energy barrier does not exist for the doped suspensions. This is due to the reduction of the zeta potential and increase in the ionic strength as the
dopants are added to the suspension. The interaction energy curves were generated using Stabil . . . . . . . . . . . . . . . . . . . . . . . . . . . . . . . . . . . . . .219
B.3 Particle size distribution for doped and undoped BaTiO3 suspensions at pH 7. As expected from the zeta potential and interaction results the doped suspension is highly aggregated . . . . . . . . . . . . . . . . . . . . . . . . . . . . . . .220 C.1 Interaction energy curves for platelet BaTiO3 and Pt electrode. The curves were calculated using Stabil and the physical constants in Table C.1 . . . . . . .228

xvii
LIST OF TABLES
2.1 List of common techniques and their characteristics used in the synthesis of
nanoscale BaTiO3. Taken from Adair and Suvaci . . . . . . . . . . . . . . . . . . . 7 2.2 Electronic Industry Alliance (EIA) of United States codes for allowable
capacitance change and temperature ranges for capacitors . . . . . . . . . . . . . . 23 2.3 List of common dopants added to BaTiO3 in the processing of MLCCs (compiled from Jaffe et al., Tsur et al., Hennings et al., and Lee et al.) . . . . . . 24 3.1 Planar density of Ti and surface hydroxide for low index planes in cubic BaTiO3 (a = 4 Å) . . . . . . . . . . . . . . . . . . . . . . . . . . . . . . . . . . . . . . . . . 68 3.2 Physical properties of platelet, commercial powder A, and commercial powder B hydrothermally derived BaTiO3 powders . . . . . . . . . . . . . . . . . . 70 4.1 Possible surface groups of Ba2+ depleted BaTiO3 with the associated protonation reactions and calculated log K values. The reactions in bold are the only reactions that occur in the normal pH range (1-14) and those used in the calculation of the surface charge . . . . . . . . . . . . . . . . . . . . . 94 4.2 ICP-ES results for the dissolution of Ba2+ in 95/5 ethanol/water mixtures. The data shows that dissolution is limited until pH 8 when a maximum concentration of 10-3 M is observed. Because of the dissolution it is necessary to account for the adsorption of Ba2+
(aq) in model the surface charge in the solvent mixture . . . . . . . . . . . . . . . . . . . . . . . . . . . . . . . . . . . . . . . . . .109 4.3 Site densities of Ti for the three low index planes of BaTiO3 based on the
structure of BaTiO3 and the values used in the modeling of the surface in a ethanol/water solvent mixture. The difference between the actual and model values is due the model not accounting for the potential drop in the IHP. The normalized values show that the model is in good agreement with the actual surface with respect to the relative density for each plane . . . . . . . . . . . . . . .114
5.1 Rheological properties for 10vol% BaTiO3 suspensions prepared with varying
amounts of oxalic acid and PEI. The addition of excess oxalic acid results in increased viscosity and yield points due to the formation of a gel network of amine oxalate that increases interparticle interactions. All suspensions were measured at pH 7 in order to maintain an approximate zeta potential of +25
mV . . . . . . . . . . . . . . . . . . . . . . . . . . . . . . . . . . . . . . . . . . . . . . . . . .140

xviii
5.2 XRF data for doped platelet powder samples. The data shows that as the CoO and Nb2O5 concentration increases the actual concentration deviates more from the prepared concentration due to competitive adsorption of the dopants on the surface . . . . . . . . . . . . . . . . . . . . . . . . . . . . . . . . . . . . . . . . . . .149 6.1 Concentration of Ba2+ in pure ethanol as determined by direct couple plasma
emission spectroscopy. Results show the dissolution of Ba2+ in pure ethanol is not prevalent and therefore surface passivation is not necessary prior to
dispersion . . . . . . . . . . . . . . . . . . . . . . . . . . . . . . . . . . . . . . . . . . . . . .168 6.2 List of EPD cell variables with increasing PEI concentration. The solution
resistance decreases as PEI increases because the proton mobility is increased. The transfer resistance increases in the presence of small concentration of PEI.
In a solution of 0.01wt% PEI 98.6% of the voltage drop occurs at the electrode -solution interface . . . . . . . . . . . . . . . . . . . . . . . . . . . . . . . . . . . . . . . .181 6.3 List of physical constants used in the calculation of the interaction between
BaTiO3 and Pt in pure ethanol . . . . . . . . . . . . . . . . . . . . . . . . . . . . . . . .192
C.1 List of physical constants used in the calculation of the interaction between
BaTiO3 and Pt in pure ethanol . . . . . . . . . . . . . . . . . . . . . . . . . . . . . . . .224

xix
ACKNOWLEDGEMENTS I must first thank my thesis advisor Dr. James Adair for his guidance and patience
over the past five and half years while at Penn State. I would also like to acknowledge
Dr. Clive Randall who graciously served as my co-advisor and provided an additional
point of view in my scientific education. I thank the three other members of my thesis
committee: Dr. Tom Shrout, Dr. Susan Trolier-McKinstry, and Dr. Darrell Velegol for
their guidance and helpful suggestions.
All members of the Adair Research Group through the years have been extremely
helpful and made coming to work everyday worth it. I must specifically thank Dr.
Jennifer Nelson, Dr. Rajneesh Kumar, and Ms. Ying Yuan for their help running the
TEM. Any TEM images that appear in this thesis are due to their help. It would not have
been possible to finish this thesis without the help of the staff of the MRL in performing
many task and experiments. I would like to thank TDK Corp. for the opportunity to visit
Japan for four and half months, and allowing me to work in the materials research center
in Narita.
My friends, both at Penn State and home, have been supportive and provided the
necessary diversions through the years. I hope their support continues, and I will
continue to rely on them for temporary diversions from time to time. The support of my
family is indescribable and immense as it has always been, and I know it always will be.

CHAPTER ONE
Research Objectives The objective of this research is to understand the role of particle morphology in
the processing of hydrothermal BaTiO3 for capacitive applications. To accomplish this
goal, tabular nanoparticles were synthesized via a hydrothermal route and processed in
parallel with commercially available nominally 90 nm equiaxed hydrothermal BaTiO3
powder. Further objectives of this thesis included an investigation of nanoparticle
synthesis, modeling of the aqueous surface chemistry of BaTiO3, characterization of the
aqueous stability of the synthesized nanoparticles, aqueous solution based doping of
nanoparticles, and a brief investigation of the electrophoretic deposition (EPD) of thin
BaTiO3 films.
In the literature review (Chapter Two) an understanding of the problems and
challenges in achieving the outlined goals were developed. The thesis chapters are
arranged in such a way as to investigate the processing of the material system using a
bottom-up approach, beginning with the synthesis of nanotabular BaTiO3 ceramics. The
following is a summary of the research objective of each experimental chapter:
The synthesis of nanotabular BaTiO3 via a hydrothermal route is addressed in
Chapter Three. Emphasis is place on the synthesis of nanotabular BaTiO3 particles with
a high yield using a hydrothermal method. An examination and discussion of the
development of particle morphology during synthesis based on solution pH and crystal
chemistry is presented. The physical properties of nanotabular powder are compared to
1

those of commercially available hydrothermal BaTiO3 powders. Finally, the
morphological evolution of the platelet particles upon heating is discussed.
A model for the complex aqueous surface chemistry of BaTiO3 was developed in
Chapter Four. The model is based on current surface charging models, but includes
aspects which account for the dissolution/adsorption of Ba2+ from the particle surface and
the precipitation of BaCO3 on the particle surface at high pH. The model illustrates the
complex nature of the BaTiO3 surface in an aqueous environment at different solution pH
values. This underlines the importance of addressing the stability of BaTiO3 during
aqueous processing, which is discussed in Chapter Five.
Chapter Five focuses on the aqueous dispersion and doping of the hydrothermally
synthesized nanoscale BaTiO3 powders. The passivation of the BaTiO3 surface was
investigated using oxalic acid at room temperature as a function of solution pH. A
dispersion scheme based on electrosteric stabilization is presented and characterized
using zeta potential, quasi-elastic light scattering and viscosity measurements. Control of
the surface chemistry was used to dope the BaTiO3 while in suspension. Co, Nb and Bi
were selectively adsorbed to the particle surface to create engineered coatings on the
particle eliminating the need for a solid-state doping technique.
The electrophoretic deposition of BaTiO3 nanoparticles is presented in Chapter
Six. A preliminary understanding of the effect of solution chemistry (i.e. dispersant
concentration, conductivity, ionic strength, etc…) on the kinetics of deposition was
investigated. Electrochemical reactions that occur during electrophoretic deposition were
characterized and the effect of solution chemistry on the inhibition of electrochemical
reactions is discussed. Finally the physical properties of deposited films using AFM,
2

TEM, and XRD were characterized, and the effect of solution chemistry on the
microstructure is discussed.
3

CHAPTER TWO
A Literature Review of the Synthesis, Dispersion, Doping and Electrical Properties
of Barium Titanate Materials
2.1 Introduction
The synthesis and processing of bulk BaTiO3 powders is of interest because of the
great significance that BaTiO3 has in the electronics industry. For over 60 years BaTiO3
has been the primary material in the development of multilayer ceramic capacitors
(MLCC).1 MLCCs currently play an important role in cellular and computer electronics.
Not only are demands placed on the physical properties of the material, but also the limits
to which current processing techniques can produce thinner layers.
Figure 2.1 is a schematic of a typical MLCC. There are three material systems
that make up an MLCC: (1) the dielectric, (2) internal electrodes, and (3) end
termination. Each material system plays an important role in the processing, physical
properties, and end use of the MLCC. The current work focuses on the synthesis and
processing of BaTiO3, the dielectric material. An important aspect of the processing of
BaTiO3 is the interaction of the BaTiO3 with the internal electrode, which in recent years
has switched from Ag/Pd alloys to Ni. The use of a base-metal electrode system
introduces unique processing issues that will be discussed later.
The volumetric capacitance of a MLCC is dictated by the thickness of the active
dielectric layer in the capacitor.1 The ability to produce thinner layers makes it possible
to replace a capacitor with a new capacitor of equivalent capacitance with a smaller
4

Figu
re 2
.1.
Sche
mat
ic o
f a ty
pica
l MLC
C sh
owin
g th
e th
ree
mat
eria
l sys
tem
suse
d in
the
fabr
icat
ion
of a
MLC
C:
(1) t
he
diel
ectri
c, (2
) int
erna
l ele
ctro
de, a
nd (3
) ter
min
atio
n.
Die
lect
ric(B
aTiO
3)In
tern
al E
lect
rode
(Ag/
Pd, N
i)
Term
inat
ion
5

footprint. Thinner layers also lead to a savings in weight and cost, and ultimately the
replacement of other capacitor technologies such as polymer films and low capacitance
electrolytics. The current standard for ceramic layer thickness by tape casting is 1 μm
and is partially limited by particle size. Nanoparticles are an important material
component required to achieve thinner layers.
2.2 Synthesis of Nanoscale BaTiO3 Powder
Later in this work the hydrothermal synthesis of anisotropic nanoscale BaTiO3
particles is presented. There are several different synthesis routes for nanoscale BaTiO3
in the literature ranging from solid-state to wet chemical methods.2-17 To understand the
advantages and disadvantages of each route, a review of the common methods is
presented. Recent reviews by Adair and Suvaci17 and Pithan et al.18 provide good
overviews of the different synthesis routes. One of the main disadvantages of several of
the routes is the necessary high-temperature calcination step which leads to the formation
of hard agglomerates. Table 2.1 is a list of the most common synthesis routes used to
produce nanoscale BaTiO3 powders and their characteristics.
Solid-state synthesis is one of the traditional methods for the synthesis of BaTiO3
powder.2, 19-22 The solid-state route is well studied and relatively inexpensive which
makes it an ideal choice for commercialization. In solid-state synthesis BaCO3 and TiO2
are calcined at high temperature. The high temperature calcination is necessary for the
decomposition of BaCO3 and the diffusion of Ba into the lattice of the TiO2 particles.
Hennings synthesized 400 nm BaTiO3 using a conventional solid-state method where
BaCO3 reacted with TiO2 at temperatures ranging from 780 to 900 °C.2 To achieve the
6

Met
hod
Par
ticle
Siz
eIm
purit
ies
Adva
ntag
esD
isad
vant
ages
Mix
ed O
xide
400n
m to
100
’s μ
mLa
rge
quan
titie
s of
im
purit
ies
due
to s
tarti
ng
mat
eria
ls a
nd m
illing
m
etho
d.
•Eas
y pr
oces
s to
per
form
on
a la
rge
scal
e.•R
elat
ivel
y ch
eap
star
ting
mat
eria
ls
•Hig
h im
purit
y le
vels
•Hig
h ca
lcin
atio
n te
mpe
ratu
res
•Lar
ge a
mou
nts
of a
ggre
gatio
n le
adin
g to
la
rge
parti
cle
size
s.•M
illing
usu
ally
requ
ired.
•Poo
r sto
ichi
omet
ric c
ontro
l fro
m p
artic
le
to p
artic
le.
Cop
reci
pita
tion
10 n
m –
10’s
μm
Chl
orid
e an
d ot
her
impu
ritie
s pr
esen
t fro
m
star
ting
mat
eria
ls.
Con
tam
inat
ion
if m
illing
is
requ
ired.
•Low
impu
rity
leve
ls.
•Low
reac
tion
tem
pera
ture
s.•S
toic
hiom
etric
mix
ing
appr
oach
es
atom
ic le
vel.
•Usu
ally
requ
ires
a m
illing
trea
tmen
t to
obta
in d
esire
d pa
rticl
e si
ze.
•Mor
e tim
e co
nsum
ing
than
mix
ed o
xide
m
etho
d.•T
edio
us w
ashi
ng re
quire
d to
rem
ove
chlo
ride
ions
.
Sol
-Gel
5-10
0 nm
Min
imal
con
tam
inan
ts
from
org
anic
pre
curs
ors.
Sm
all a
mou
nts
of S
i co
ntam
inat
ion
from
gl
assw
are.
•Ver
y lo
w im
purit
y le
vels
.•S
toic
hiom
etric
on
the
atom
ic le
vel.
•Low
pro
cess
ing
tem
pera
ture
s (2
0-65
0°C
).
•Rel
ativ
ely
expe
nsiv
e st
artin
g m
ater
ials
.•L
ow te
mpe
ratu
re m
etho
ds a
re g
ener
ally
tim
e co
nsum
ing
with
low
pro
duct
yie
ld.
Vap
or P
hase
20 n
m -
mic
ron
leve
lS
mal
l lev
els
of
cont
amin
atio
n fro
m
star
ting
mat
eria
ls.
•Low
pro
cess
ing
tem
pera
ture
s (1
00-
~800
°C).
•Eas
y to
pro
duce
nan
osiz
ed p
artic
les.
•Som
e pr
ecur
sor m
ater
ials
are
cos
tly.
•Col
lect
ion
with
out a
ggre
gatio
n is
diff
icul
t.•S
toic
hiom
etry
con
trol
can
be d
iffic
ult.
Hyd
roth
erm
al3
nm –
mic
ron
leve
lS
mal
l lev
els
of
cont
amin
atio
n fro
m
star
ting
mat
eria
ls a
nd
reac
tion
vess
el.
Hyd
roth
erm
al (O
H)
defe
cts
due
to a
queo
us
synt
hesi
s
•Low
pro
cess
ing
tem
pera
ture
s (6
0-50
0°C
).•P
artic
les
are
form
ed in
sol
utio
n gi
ving
pot
entia
l con
trol o
ver
aggl
omer
atio
n.•H
igh
purit
y an
d at
omic
sca
le
stoi
chio
met
ry.
•Par
ticle
mor
phol
ogy
easi
ly
cont
rolle
d.
•Som
e pr
ecur
sor m
ater
ials
are
cos
tly.
•Rec
over
y fro
m s
uspe
nsio
ns w
ithou
t ag
glom
erat
ion.
•Red
ispe
rsio
n of
agg
lom
erat
es.
Tab
le 2
.1.
List
of c
omm
on te
chni
ques
and
thei
r cha
ract
eris
tics u
sed
in th
e sy
nthe
sis o
f nan
osca
le B
aTiO
3. Ta
ken
from
Ada
ir an
d Su
vaci
17
7

small particle size, Hennings used a TiO2 powder with a starting size of 200 nm. With
solid-state synthesis the high calcination temperature leads to agglomeration and requires
milling the powder to realize the primary particle size. A second disadvantage of the
solid-state technique is that the size and morphology of the synthesized particles are
limited by the size of the starting TiO2 particles.
Synthesis routes based on the coprecipitation of complex metal salts remain one
of the most widely used commercial routes for the synthesis of BaTiO3. The Clabaugh
process is a wet chemical technique where solutions of BaCl2, TiCl4 and oxalic acid are
mixed and particles of barium titanyl oxalate (BTO) precipitate.23 After synthesis the
particles are calcined to drive off the oxalate and form BaTiO3. An advantage of BTO is
that there is little change in particle size during the conversion from BTO to BaTiO3 if the
calcination step is properly controlled. In addition, because the Clabaugh process is
primarily a solution-based synthesis route, good mixing and near atomic scale
homogeneity are possible. However, there are two critical issues associated with the
Clabaugh process: (1) Oswald ripening during synthesis and (2) agglomeration and
crystallite growth during calcination. To overcome the two issues different researchers
have used different approaches to correct the problems at each step in the process.
A modified Clabaugh process has been studied by Kimel et al.5 and Szepesi.5, 24
In the modified process, a small-volume high-shear mixing chamber is used to create
turbulent fluid flow which permits particle nucleation while limiting particle growth.
After precipitation the particles are directly injected into a quenching solution which
coats the particle surface to inhibit Oswald ripening. This method has produced BTO
particles as small as 10 nm.
8

Yamaura et al.25 and Park et al.26 used alcohol based oxalic acid solution in the
synthesis of BTO. The BTO exhibits a lower solubility in alcoholic solution compared to
aqueous solution and therefore growth by Oswald ripening is limited. No notable growth
was observed for BTO particles prepared in alcoholic environments. However, since the
solubility of Ba and Ti in alcohol solution is incongruent it was difficult to precipitate
homogenous BTO powders.
To understand particle evolution during calcination it is important to understand
the decomposition reactions of BTO. Under isothermal conditions during calcination
BTO is believed to decompose by the following reactions27, 28,
)(3342222242 2.)(2)(4 gCOCOOCOTiBaOCBaTiO + [2.1]
)()(23233342222 33.)(2 gg COCOBaTiOTiOBaCOCOOCOTiBa ++++ [2.2]
but the following reaction is also possible,
)(2)(23)(2242 221)( ggg COCOTiOBaCOOOCBaTiO ++++ [2.3]
Independent of the decomposition reaction, BaCO3 and TiO2 must react to form BaTiO3,
)(2323 gCOBaTiOTiOBaCO ++ [2.4]
The reaction in Equation 2.4 is believed to lead to agglomeration and crystallite growth
during calcination. Wada et al. developed a 2-step calcination of BTO with one step
being performed under vacuum.29, 30 Powders with particle size ranging from 17 to 100
nm were reported. Another group of researchers found that precise control of the heating
rate is necessary to control the final particle size of the BaTiO3.27, 28, 31 Using an
intermediate heating rate yields the proper control of nucleation rate with limited growth.
At low heating rates the nucleation rate is low and the duration of the reaction in
9

Equation 2.4 is long enough for substantial growth to occur, whereas at high heating rates
completion of the reaction does not occur until higher temperatures, which promotes
growth.32 Under optimum conditions BaTiO3 powder with a particle size ranging from
20-40 nm can be synthesized
Other synthesis methods based on the thermal decomposition of double metal
salts have been presented, but the most common is the Pechini method, or the citrate
method.33, 34 The method is similar to the Clabaugh process except that citric acid is used
instead of oxalic acid to form a complex double metal salt. The decomposition reactions
involved in the Pechini method are more complex than that of the Clabaugh process.
Since both the Clabaugh process and Pechini method are based on carboxylic acids, the
formation of BaCO3 during thermal decomposition is unavoidable.18
Several research groups have used a sol-gel method for the preparation of
nanoscale BaTiO3 powders.6-8, 10, 12, 35, 36 Most sol-gel routes begin with the formation of
non-aqueous sols using high purity Ba and Ti reagents, commonly organo-metallics. The
sols are then converted to gels with the addition of water which forms a hydrolyzed gel
structure. After gelation, the gels are dried and calcined at high temperatures to remove
the chemically bound water and crystallize the amorphous gel. The calcination
temperature is lower than that of solid-state routes, and therefore agglomerates formed
are weaker and easier to reduce during milling. The main disadvantage of sol-gel routes
is that the processes are costly with low yields. To further reduce the particle size and
tailor the particle size distribution, Hempelmann and co-workers performed sol-gel
synthesis in a microemulsion system.37, 38 By using such a system the nucleation and
growth of the particles was confined to the aqueous phase of a water-in-oil
10

microemulsion, which limit the particle size. Using different surfactant systems and
varying the experimental conditions, narrow particle size distributions with mean sizes
ranging from 3 to 16 nm were synthesized.
Recently, a limited research effort has focused on vapor phase synthesis routes for
nanocrystalline BaTiO3.39-41 The synthesis uses vapor phase Ba and Ti sources such as
liquid precursors that are either boiled or have inert gas bubble through them, then the
vapors are then mixed at elevated temperatures and quenched. Because of the high
quenching rates growth of the particle after nucleation is severely limited. It is also
possible to use electron beam evaporation or sputtering of solid precursors to generate the
vapor.39 Particle sizes less then 20 nm have been reported. One of the major issues
during synthesis is controlling the mixing of the vapors and the chemical stoichiometry
(i.e. Ba:Ti ratio) of the particles. The formation of BaCO3 is also a problem if the
atmosphere is not properly controlled.40
Direct wet-chemical synthesis routes based on precipitation have been presented
in the literature. Whether the technique is called low temperature aqueous synthesis
(LTAS), low temperature direct synthesis (LTDS), solvent refluxing, or hydrothermal
synthesis, the basic synthesis steps are similar. Aqueous solutions of Ba and Ti sources
are injected into a high pH solution, and then aged as needed. The Ba and Ti sources,
solution pH, and temperature vary from technique to technique leading to powders with a
variety of physical properties. Work by Nanni and co-workers42-44, Wada et al.10, 45, and
Wang et al.13 focused on routes to directly precipitate BaTiO3 in an aqueous environment
at or near room temperature under ambient pressure. Because the solutions contain large
amounts of Na and Cl it is necessary to thoroughly wash the particles after synthesis.
11

The high solution pH during synthesis also leads to the incorporation of large amounts of
hydroxide defects into the lattice, and since the reaction is open to the ambient
atmosphere the presence of BaCO3 is difficult to eliminate. By adjusting the synthesis
variables (i.e. solution concentration, temperature, etc.) particle size can be varied from
20-900 nm.
Hydrothermal synthesis of BaTiO3 has been the most widely studied of the wet-
chemical routes.11, 14-16, 46-52 Under the optimized synthesis conditions, powders with low
defect concentrations and controlled stoichiometry that require no further processing can
be synthesized, making hydrothermal synthesis an excellent choice for the commercial
synthesis of BaTiO3.17 In hydrothermal synthesis, aqueous solutions of barium and
titanium sources are mixed and sealed in a high temperature-pressure reaction vessel and
heated. Osseo-Asare et al.53 and Lencka and Riman54 studied the thermodynamics of the
hydrothermal formation of BaTiO3 and found that a basic environment is necessary for
BaTiO3 to precipitate, and that pH was dependent on the Ba concentration in the starting
solution.
The hydrothermal synthesis of BaTiO3 is extensively commercialized and
protected by a variety of patents.55-60 The methods invented by Abe et al.55 and Menashi
et al.58 are two of the primary methods used for the commercial synthesis of
hydrothermal BaTiO3. The synthesis steps in each method are similar with differences
arising in the post-synthesis treatments. Abe et al. uses hydroxides of both Ba and Ti as
the source material, which are mixed in an aqueous solution and heat treated. After
synthesis the powder is washed with an acetic acid solution to remove BaCO3. However,
the acid wash leads to Ba dissolution from the particle and a Ba deficient surface.
12

Stoichiometry is controlled by a post-washing treatment with an insoluble Ba metal salt
to adjust to the desired Ba:Ti stoichiometry.
Menashi et al. used an amorphous hydrous Ti-gel, Tiy(OH)x, as the Ti source with
Ba(OH)2 as the Ba source. After synthesis, the particles are washed with a 0.005 to 0.02
M Ba(OH)2 solutions. The use of a Ba-rich wash solution limits Ba dissolution and
eliminates the need to adjust the stoichiometry with a second treatment. Regardless of
the method used to the synthesis, the general reaction for the formation of BaTiO3 during
hydrothermal treatment is,
OHBaTiOOHTiOBa ss 2)(3)(22 2 +++ −+ [2.5]
Two rate-limiting mechanisms have been observed for the hydrothermal synthesis
of BaTiO3: (1) phase boundary and diffusion limited49-51, 61 or (2) nucleation and
growth.11, 15, 47, 48, 52, 62 The difference in formation mechanism is generally dependent on
the phase of the TiO2 source. If the TiO2 is crystalline or of large size, then the TiO2
particles have a low solubility and growth occurs by the reaction of Ba2+ at the surface of
the TiO2 followed by diffusion of Ba2+ into the lattice, eventually leading to the
conversion of the TiO2 to BaTiO3. A secondary effect of this growth mechanism is that
size and morphology are limited by the size and morphology of the starting TiO2
particles.63 Hertl studied the kinetics of hydrothermal synthesis using a crystalline TiO2
source. At low Ba concentrations diffusion of Ba into the lattice of the TiO2 is the rate
limiting step. In contrast, at higher Ba concentrations, the reaction of the Ba with the
surface of TiO2 particles is the rate limiting step in BaTiO3 growth.51
When a highly soluble TiO2 source is used, for example, a Ti-organometallic or
sol-gel derived Ti-hydrous-oxide gel, both the Ba and Ti exhibit high solubility at
13

elevated temperatures and synthesis proceeds by nucleation and growth. To fully
investigate hydrothermal growth under such conditions Kershner et al.52 used TEM to
image particles synthesized using a TiCl4-based gel as the TiO2 source. At all stages of
growth homogenous single crystal BaTiO3 particles were observed. If a surface
reaction/diffusion mechanism was responsible for growth, then at the early stages of
growth, inhomogeneous particles with a TiO2 core and a shell of BaTiO3 are expected;
however, this was not observed. This lack of evidence for a surface reaction/diffusion
mechanism was later confirmed with kinetic studies from Moon et al.11, which led to the
conclusion that a nucleation and growth mechanism controls the growth of hydrothermal
BaTiO3 when a high solubility TiO2 source is used.
The low temperature hydrothermal synthesis of BaTiO3 is of interest because of
the savings of time and energy. At low temperature the interface-diffusion growth
mechanism is kinetically limited. However, the mixing of the Ti and Ba is a problem
when using a Ti-gel precursor. For example, when titanium isopropoxide is mixed with
water at high pH, a TiOy(OH)x gel readily forms. The local structure of the gel is
comprised of Ti-O-Ti bonds. It is necessary to break the Ti-O bonds for complete mixing
of the Ti and Ba.64 Moon et al. modified titanium isopropoxide with acetylacetone which
inhibits the hydrolysis of Ti and the formation of TiOy(OH)x network.65, 66 This results in
the Ti precursor having greater water solubility and permits better mixing of the Ti and
Ba. Using a modified Ti precursor, Moon et al. synthesized BaTiO3 at temperatures as
low as 50 °C with particle sizes ranging from 50 to 350 nm.
Although high pH is necessary for synthesis it also leads to the greatest issue with
hydrothermal powders: hydroxide defects. During synthesis hydroxyl groups are
14

incorporated into the lattice of the particles.67 After synthesis, heat treatment of the
powders is needed to remove the hydroxyl groups from the lattice. Hennings showed that
the removal of the hydroxyl groups is compensated by the generation of oxygen
vacancies in the lattice.67 If a large concentration of hydroxide defects is present, during
heat treatment the oxygen vacancies coalesce to form large pores, which degrade
electrical permittivity and physical properties, crystallinity and density, of the bulk
materials.
In the synthesis of BaTiO3 the quality and physical properties of the powder must
meet high standards. Defects, contamination, and incorrect stoichiometry are all
problems which will affect the densification and sintering of bulk materials. Large
intragranular pores, exaggerated grain growth and secondary phase are all possible if the
physical properties of the powder are not well-controlled.68
An advantage of hydrothermal synthesis is the ability to control particle
morphology. A variety of shapes have been reported, including tubes69, hexapods16, and
platelets70 all in the nanoscale and all by hydrothermal synthesis. By limiting growth in a
specific direction an anisotropic morphology is achieved. Crystal chemistry and the
presence of specific adsorbates affect which crystal habit is favored for growth. Bagwell
found the stable crystal habit in hydrothermally-derived BaTiO3 changed from the {111}
plane to the {100},{110}, and {211} planes with the addition of polymeric additives.71
Since the ferroelectric properties of BaTiO3 are strongly dependent on the
crystallographic orientation of the materials, these developments in morphology control
could possibly lead to an enhancement in the electrical properties of bulk samples
prepared from these powders.
15

2.3 Surface Chemistry and Dispersion of BaTiO3
Colloidal forming techniques, mainly tape casting, are the preferable forming
methods for the dielectric layers in most MLCCs. Currently most tape cast slurries are
based on non-aqueous dispersion of BaTiO3 powder with binders and other organic
additives.1 For financial and environment reasons, aqueous tape casting is of growing
interest. However, many problems with aqueous based tape casting still exist. In
general, foaming, cracking during drying, and inadequate binder systems lead to low
quality tapes with poor mechanical problems. If these issues can be overcome, it will be
necessary to better understand the dispersion and interactions of BaTiO3 in aqueous-
based suspensions. The issues of the colloidal instability and incongruent solubility of
BaTiO3 in an aqueous environment makes the dispersion of BaTiO3 nanoparticles
difficult. A complicated surface chemistry and the resultant interactions in an aqueous
environment lead to a myriad of problems. The aqueous surface chemistry will be
discussed and the inherent problems presented in concert with the relevant studies that
have attempted to address the problems.
The instability of BaTiO3 in water is well-documented.72-78 In acidic
environments the dissolution of BaTiO3 is thermodynamically favorable,
OHTiOBaHBaTiO ss 2)(22
)(3 2 +++ ++ [2.6]
and leaves a TiO2-rich surface.72, 77 Figure 2.2 is a plot of the stability of BaTiO3 as a
function of solution pH generated using OPAL™79, 80 with the thermodynamic data from
Venigalla and Adair74 and Bendale et al.81 accounting for the presence of CO2. Ba2+
solubility is minimized under extremely alkaline conditions, but as the pH decreases an
16

Figu
re 2
.2Id
eal s
olub
ility
dia
gram
for B
aTiO
3in
an
aque
ous e
nviro
nmen
t with
CO
2sh
owin
g th
at B
aTiO
3is
not
the
ther
mod
ynam
ical
ly st
able
form
of b
ariu
m in
wat
er, f
rom
Ben
dale
et a
l.81
17
increase in the solubility occurs. Dissolution experiments show that barium dissolution is
almost instantaneous and reaches steady-state rapidly.78 A difference in observed
concentrations and thermodynamically calculated concentration led to the hypothesis that
at extended times barium diffusion from the lattice to the surface becomes the rate
limiting step in dissolution.
The amount of barium in solution is also dependent on a wide variety of factors.
The stoichiometry of the powder, as expected, affects the dissolved barium
concentrations.78 Chiang and Jean performed a series of experiments on samples with
Ba/Ti ratios ranging from 0.992 to 1.004 and found that Ba-rich powders yield higher
dissolved barium concentrations. The amount of surface area exposed to suspension also
affects barium dissolution.75 Both higher surface areas and higher BaTiO3 solid loading
lead to an increase in barium concentration. If the barium concentration become too high
then specific readsorption of the barium occurs on the BaTiO3 surface.77, 82 This leads to
the commonly observed effect of the suspension isoelectric point (IEP) being dependent
on solids loading.75, 78
Not only must the reaction of BaTiO3 with water be considered, but reactions with
dissolved species, for example CO2, must also be addressed. Water absorbs CO2 from
the atmosphere and forms carbonic acid, H2CO3. Dissolved Ba2+ reacts with CO32- to
form BaCO374. BaCO3 has been noted to be a problem during sintering. During sintering
BaCO3 evolves from the sample at temperatures where closed porosity is present. At
elevated temperatures CO2 gas forms in the closed pores and leads to localized de-
sintering and retrograde densification.83
18

The degradation of BaTiO3 not only affects the suspension properties but also the
microstructure of bulk materials processed in aqueous based suspensions. Anderson
found that milling aqueous suspensions at different pH values affected the amount of
exaggerated grain growth, but was unable to determine if the TiO2-rich surface or
readsorption of barium was the cause of exaggerated grain growth.82 Crampo et al.
found in a series of experiments with pellets prepared from leached powder, that the
presence of BaCO3 is necessary for exaggerated grain growth.84 Two powders samples
were leached, one in a CO2-free environment, and another prepared in ambient
atmosphere. Only the pellets exposed to CO2, with BaCO3 present, exhibited
exaggerated grain growth.
To avoid the problem of aggregation and barium dissolution, Kamiya synthesized
BaTiO3 powder in the presence of a surfactant to limit particle aggregation and
dissolution during nucleation and growth.85 However, this synthesis route has low yields
and is cost prohibitive for the commercial synthesis of BaTiO3. Finding other suitable
dispersants and binder systems for the aqueous processing of BaTiO3 has also been of
recent interest.86-91 Kirby et al. used a comb polymer based on poly(acrylic acid) (PAA)
and poly(ethylene oxide) (PEO) to stabilize aqueous suspension of BaTiO3.92, 93 The
carboxylic acid groups of the PAA absorbed at the Ba sites on the BaTiO3 surface while
the PEO extended into the solution to provide a steric repulsion. Kirby et al., like almost
all other researchers, noted the instability of BaTiO3 in water, but took little or no
precautions to limit barium dissolution. In contrast, those who addressed barium
dissolution only performed analysis at ≥ pH 9, where barium dissolution is
thermodynamically minimized.
19

Paik et al. studied the effect of PAA and poly(vinyl alcohol) (PVA) on the
dissolution of Ba2+ from BaTiO3 in the pH range from 3 to 11.94 Below pH 6 where only
a small fraction of the carboxylic acid groups are deprotonated the PAA strongly
absorbed to the surface and provides a small degree of degradation resistance. As pH
increased the PAA acted as a sink and actively increased the concentration of Ba2+ in
solution. The change in behavior with pH was attributed to the affinity of the PAA for
the BaTiO3 surface as a function of the degree of dissociation of the carboxylic acid
group. When a low degree of dissociation is observed, the PAA is sparingly soluble in
solution and prefers to adsorb to the particle surface. PVA showed little to no effect on
the dissolution of Ba2+ from the BaTiO3 particles.
Surface passivation is a possible route for enhancing the stability of BaTiO3 in an
aqueous environment.80, 95 A passivation agent reacts with the surface of the powder to
form a barrier to dissolution. Vasques et al. discussed the required parameters of a
passivation agent for a similar material, YBa2Cu3O7-x superconductor which are, (1) low
solubility in the solvent, and (2) a good diffusion barrier.96 Although low solubility is
necessary, it is not the only concern. For example, BaCO3 has low solubility in water at
pH 9 to pH 11 but does not prevent the aqueous degradation of YBa2Cu3O7-x
superconductors because the CO32-
(aq) does not passivate all components. However,
solubility can be used as an initial criterion to limit the search for a passivation agent.
20

2.4 Doping and Microstructure of Sintered BaTiO3
2.4.1 Core-shell structure
BaTiO3 exhibits three phase transitions: rhombohedral to orthorhombic,
orthorhombic to tetragonal, and tetragonal to cubic at -90, 0 and 130 °C, respectively.97
Figure 2.3 shows the increased dielectric response of BaTiO3 at the phase transition
temperatures. Unfortunately changes in dielectric constant over a narrow temperature
range are undesirable for electronic components where the temperature is not precisely
regulated. With increasing use of mobile and cellular technologies, capacitors are
expected to work in temperature extremes from the dead of winter (-20 °C) to the height
of summer (40 °C). Table 2.2 is a list of capacitor classifications specified by the
Electronic Industries Alliance (EIA) of the United States for allowable capacitance
variability in specified temperature ranges.98 One of the most temperature stable
specifications is designated as X7R and it is primarily used in mobile and cellular devices
that will be used both indoors and outside. X7R capacitors must maintain capacitance
within ±15% of the room temperature value over a temperature range from -55 to 125 °C.
To achieve the temperature stability of an X7R capacitor, the BaTiO3 must be
doped to flatten out the temperature response of the dielectric constant.99-106 A series of
materials called Curie shifters shift the Curie temperature of BaTiO3. Sr2+, Zr4+, Hf4+,
Sn4+, Nb5+, Ta5+, W6+, Ni2+, Co2+, Fe3+, Ag+, Zn2+ all decrease the Curie temperature (Tc)
of BaTiO3.107 Table 2.3 is a list of common dopants used in the processing of BaTiO3
MLCCs.107-110 The dopants are divided into two categories: (1) those used to tailor the
dielectric temperature response of the material such as Curie shifters, and (2) those added
to improve oxidation resistance of the BaTiO3 for use with base metal electrode systems.
21

Figu
re 2
.3.
Plot
of t
he d
iele
ctric
con
stan
t of B
aTiO
3ve
rsus
tem
pera
ture
for s
ingl
e cr
ysta
l BaT
iO3
take
n fr
om M
erz.
97Th
ree
dist
inct
pea
ks in
die
lect
ric c
onst
ant a
re o
bser
ved.
The
thre
e pe
aks c
oinc
ide
with
the
thre
e ph
ase
trans
ition
s in
BaT
iO3:
rhom
bohe
dral
to o
rthor
hom
bic
(-90
°C),
orth
orho
mbi
c to
tetra
gona
l (0
°C),
and
tetra
gona
l to
cubi
c (1
30 °C
).
22

Tab
le 2
.2El
ectro
nic
Indu
stry
Alli
ance
(EIA
) of t
he U
nite
d St
ate
code
s for
allo
wab
le
capa
cita
nce
chan
ge a
nd te
mpe
ratu
re ra
nges
for c
apac
itors
98
* Cap
acita
nce
chan
ges a
re m
easu
red
as th
e pe
rcen
t cha
nge
from
the
room
tem
pera
ture
cap
acita
nce.
EIA
Cod
eTe
mpe
ratu
re R
ange
(ºC
)E
IA C
ode
Cap
acita
nce
Cha
nge*
(%)
X7
-55
to +
125
D±3
.3X
5-5
5 to
+85
E±4
.7Y5
-30
to +
85F
±7.5
Z5+1
0 to
+85
P±1
0R
±15
S±2
2T
-33/
+22
U-5
6/+2
2V
-82/
+22
23

Table 2.3 List of common dopants added to BaTiO3 in the processing of MLCC’s(compiled from Jaffe et al.107, Tsur et al.108, Hennings109, and Lee et al.110)
Dopant Valence Site TypeCa +2 A NeutralSr +2 A NeutralPb +2 A NeutralTb +3/4 B NeutralZr +4 B NeutralSn +4 B NeutralHf +4 B NeutralMg +2 B AcceptorNi +2 B AcceptorMn +2/3 B AcceptorCo +2/3 B AcceptorYb +2/3 B AcceptorFe +2/3 B AcceptorLu +3 B AcceptorSm +2/3 A DonorEu +2/3 A DonorLa +3 A DonorNd +3 A DonorBi +3 A DonorCd +3 A DonorNb +5 B DonorTa +5 B DonorW +6 B DonorEr +2/3 Amphoteric Acceptor/DonorHo +3 Amphoteric Acceptor/DonorY +3 Amphoteric Acceptor/DonorDy +3 Amphoteric Acceptor/DonorCe +3/4 Amphoteric Acceptor/DonorPr +3/4 Amphoteric Acceptor/DonorGd +3 Amphoteric-Mainly A Acceptor/DonorTm +2/3 Amphoteric-Mainly B Acceptor/Donor
24

Simply doping BaTiO3 with any of the aforementioned dopants is insufficient to achieve
a flat dielectric response; it is also necessary to have a chemically inhomogeneous
microstructure, referred to as a core-shell microstructure, to achieve the nearly
temperature independent dielectric properties.
In a core-shell microstructure, individual grains have a chemical gradient ranging
from undoped BaTiO3 at the center, or core, of the grain, to fully doped BaTiO3 at the
edge of the grain. The chemical gradient leads to a gradient in the Curie temperature
from pure BaTiO3 at the core, to the Tc of doped BaTiO3 in the shell. The effect on the
overall dielectric response of the material can be envisioned as the superposition of the
dielectric response of several different doped BaTiO3 compositions. Figure 2.4 is a
schematic showing the additive effect of several different compositions with sharp
individual transitions on the temperature response. The superposition of the individual
transitions yields a flat, temperature independent response. Although the doping
formulation presented in this thesis is for precious metal electrode systems, a discussion
of the development of base metal systems is presented to provide a perspective on the
current and future direction in the processing of MLCCs.
2.4.2 Doping for Based Metal Electrodes
Traditionally, precious metal electrodes (PME) have been used as the internal
electrode material in MLCCs. The oxidation resistance of the precious metals permits the
sintering of PME-MLCCs in ambient atmosphere. But recently, the rising cost of
precious metals, most notably Pd, has forced the use of base metal electrodes (BME) in
MLCCs to lower manufacturing costs. Ni is the mostly commonly used material in
BME, but recent interest has also focused on Cu.111 For either material, BME-MLCCs
25

Figu
re 2
.4.
The
supe
rpos
ition
of i
ndiv
idua
l tra
nsiti
on re
sults
in a
bro
ad d
iffus
e tra
nsiti
on, w
hich
is m
ore
stab
le w
ith c
hang
es in
te
mpe
ratu
re.
26

must be fired in a reducing atmosphere to prevent the oxidation of the internal electrodes.
The primary disadvantage of BME-MLCCs has been limited lifetime compared to PME-
MLCCs. The use period of the early commercial BME-MLCCs was as little as several
hours.109 The lifetime of current capacitor technology is limited by the degradation rate
of insulation resistance.112 Over time as the resistance decreases, the leakage current
increase leads to enhanced thermal breakdown as resistive heating occurs. In a study on
degradation of polycrystalline perovskite titanate materials, Waser et al. found oxygen
vacancy migration to be one of the primary factors in electrical degradation.112 However,
the work by Waser et al. only focused on degradation mechanisms in the ceramic and did
not address the electrode/ceramic interactions which will be discussed later.
Initial work on sintering in a reducing atmosphere achieved a dramatic decrease in
the insulation resistance of pure BaTiO3 because of the generation of oxygen
vacancies109,
OxHVoBaTiOxHBaTiO xx 2323 ][ +→+ − [2.7]
which are compensated by electrons,
eVoVo ′+→ •• 2 [2.8]
To overcome the problem of decreased resistance, acceptor doping was
attempted.113-115 Acceptors present on the Ti site were noted to be excellent electron
traps. However, the acceptor defects in the lattice are also compensated by the generation
of oxygen vacancies. For example, a Mn2+ substitution on the Ti-site109,
••++′′→ OOTi VOnMMnO [2.9]
27

generates one oxygen vacancy for each Mn2+ substituted. At room temperature oxygen
vacancies are highly mobile under an applied electric field, and the high ionic
conductivity leads to reduced lifetime.112, 116
A post sintering anneal in oxygen has been used to oxidize the acceptors to
eliminate oxygen vacancies115,
•••• +′→++′′ OTiOTi VnMOVnM 22122 2 [2.10]
Re-oxidation improved lifetime, but a large concentration of oxygen vacancies still
existed and BME capacitors still exhibited limited lifetime compared to air fired precious
metal electrode capacitors.114
Lifetime was further improved by doping with donor-acceptor complexes.109, 117-
119 An example of this is the co-doping of Mn2+ with W6+, both dopants are B-site
substitutions and when the defects are closely associated they form a neutral donor-
acceptor complex,
0}{ •••• ′′→+′′ TiTiTiTi WnMWnM [2.11]
The donor dopants compensate the acceptor dopants and oxygen vacancies are eliminated
to improve lifetime. The close association of the donor-acceptor complexes reduces the
mobility of the ionic defects under an applied field further improving lifetime.109, 117
Doping with rare earth (RE) elements, specifically, Dy and Ho, also resulted in
improved degradation characteristics.109, 110, 118, 120, 121 Initial experiments suggested that
RE occupy the A- and B-site simultaneously and acts as self-compensating acceptor-
donor complexes similar to the co-doping process. Tsur et al. performed a analysis of
rare earth doping in BaTiO3 and found that the stable valence and amphoteric nature of
28

specific RE dopants, were the reason for the improved lifetime.108 Ho was noted to be
most stable amphoteric dopant.
2.4.3 Doping Methodology
Whether it is a PME or BME system current, dopant methods are based on solid-
state methods where dopant oxide particles are added to a large volume of matrix
particles.122-124 The mixture is typically ball milled to try to blend dopants and to
homogenize the mixture as much as possible. A liquid sintering aid is typically added to
help distribute the dopants and aid in the formation of the core-shell structure. Many
authors have stated that the presence of the liquid is necessary for the development of a
core-shell microstructure.99, 100, 125-127 The observed microstructure is attributed to a
dissolution-precipitation mechanism during sintering. However, Chazono and Kishi
observed the development of a core-shell structure at temperatures well-below the
melting point of the liquid.128 Chazono and Kishi proposed that when the dopants exhibit
a low solubility in the liquid or if no liquid is present, diffusion can develop the core-shell
structure, but the high temperatures and long times needed for diffusion make the use of a
liquid advantageous.
The process of solid-state doping has been studied by Wiseman in the doping of
ZnO for the fabrication of varistors. It showed that if dopants are present as particulates
that chemically homogeneity is difficult or nearly impossible.129 Although a liquid-phase
sintering aid is present, high temperatures and long sintering times are still necessary for
the solubility, distribution, and diffusion of the dopants to remove the chemical
inhomogenieties that exist due to doping with particulates.
29
A chemical approach is an alternative method of doping in which the dopant is
added in an ionic or molecular form. Doping then occurs by the adsorption or
precipitation of the dopants on the particle surface which then creates a homogeneous
dopant layer on the particle. Due to the increase in chemical homogeneity in the bulk
samples, sintering times and temperatures can be reduced. Both approaches, ionic and
molecular, have been shown to be successful in the processing of highly engineered
materials such as ZnO-based varistors130 and BaTiO3-based dielectrics.122-124, 131-133
Although an aqueous approach for BaTiO3 has been previously outlined, no attempt has
been made to passivate to protect the surface from degradation. For solution based
doping in aqueous suspension the chemical stability of BaTiO3 must first be addressed.
Fernandez et al. studied the effect of the doping technique on the electrical
properties of BaTiO3 doped with Co and Nb.133 Three different techniques were used: (1)
doping during powder synthesis, (2) conventional solid-state doping, and (3) a chemical
approach. The first technique resulted in a homogenous composition which exhibited a
single sharp peak in the dielectric response. The other two techniques yielded materials
which meet X7R standards and have core-shell microstructures. Fernandez et al. found a
significant microstructural difference between solid-state and chemical doping. Solid-
state doping led to local Co- and Nb-rich regions whereas chemical doping resulted in a
homogenous intergranular structure with chemically inhomogeneous grains. However,
both methods result in an inhomogeneous chemical composition with significant
dispersion in transition temperatures that produces an overall diffuse dielectric response.
30

2.5 Size Effects and Electrical Properties of Nanoscale BaTiO3 Materials
Reducing the layer thickness of a MLCC has many advantages, but the primary
disadvantage of reduced layer thickness is reduced dielectric constant. The effect of size
on the dielectric constant of BaTiO3 dielectrics is well known and documented.134-139
Figure 2.5 is a plot of the room temperature dielectric constant as a function of grain size
for undoped BaTiO3 from Shaw et al.140 where there is a maximum in the dielectric
constant at a grain size of approximately 1 μm. The use of nanoparticles in the current
work is expected to increase the importance of size effect phenomena. Therefore, a
review of current theories on size effects is presented.
2.5.1 BaTiO3 Particles
A wide variety of research has been done to understand the size effect in bulk
BaTiO3.30, 138, 141-143 Over the past 10 years it has been shown that the size effect in
BaTiO3 is highly dependent on the state of the materials. There exists a difference in the
properties of particles and bulk materials due to a difference in the boundary conditions at
either the particle surface or grain boundary. It has been theorized that the stress-state,
presence of secondary phases, and electrical boundary conditions all affect the intrinsic
ferroelectric properties as the size of BaTiO3 grains are reduced.
Theoretical calculations based on free energy arguments of the intrinsic size limit
of BaTiO3 have been presented in the literature. 144 Using Landau-Devonshire theory
Wang et al. calculated the critical limit of ferroelectric behavior in BaTiO3.
Assumptions for the calculation include that the ferroelectric-paraelectric transition was a
first order transition regardless of the size and boundary conditions. A critical size of 44
nm was calculated. Using Landau theory, but accounting for depolarization fields and
31

Figu
re 2
.5.
Plot
show
ing
the
depe
nden
ce o
f the
die
lect
ric c
onst
ant o
f BaT
iO3
with
gra
in si
ze in
bot
h bu
lk c
eram
ics (●)
and
thin
fil
ms (Δ)
take
n fr
om S
haw
et a
l.137
32

the presence of a Schottky barrier at the particle edges due to space charge Shih et al.
calculated an intrinsic limit for BaTiO3 of various sizes.145 The intrinsic limit of
ferroelectric behavior was shown to be dependent on the thickness of the Schottky layer;
with thinner Schottky barrier resulting in a lower critical size limit. Recently, Junquera
and Ghosez used a model system of epitaxial BaTiO3 on SrRuO3 electrode for first
principle calculation of the intrinsic loss of ferroelectric behavior.146 A limit of 24 Å or
six unit cells was calculated.
Begg et al. used X-ray diffraction (XRD) and differential scanning calorimetery
(DSC) to investigate the phase and phase transition for hydrothermal and Clabaugh-
derived BaTiO3 particles.147 A size limit of 190 nm was the limit of the tetragonal phase
of BaTiO3 to temperatures as low as 80 K. However, little to no shift was observed in the
TC of the particles as a function of c/a ratio for tetragonal materials. The intrinsic limit
was theorized to be due to surface energy constraints on the system. Li et al. used a
similar approach, but accounted for the degree of agglomeration in the synthesized
powders.148 Li et al. found 20 - 30 nm to be the limit of the tetragonal phase in BaTiO3
particles. However, it was noted that only agglomerated particles were able to maintain
the tetragonal phase to such small sizes. Li et al. concluded that the depolarization
energy in particles with the tetragonal phase was minimized when the particles
agglomerated, and if the particle remained unagglomerated the cubic-tetragonal phase
transition occurred to minimize the depolarization energy. Wada et al. recently
developed a technique to measure the dielectric constant of particles in a slurry.30, 149 The
dielectric constant of a highly loaded suspension was measured. Using mixing rules the
dielectric constant of the particles was calculated. Particles with sizes ranging from 17 to
33

1000 nm were synthesized and measured. A size of 140 nm yielded the maximum
dielectric response with the loss of ferroelectricity taking place from 17 to 40 nm. Wada
et al. did not characterize the state of dispersion of the particle suspension and therefore
the effect of agglomeration on the intrinsic loss of ferrolectricity was not discussed.
McCauley et al.141and Randall et al.150used a glass ceramic system to precipitate
out and control the size of BaTiO3 particles dispersed in a glass matrix. BaTiO3
crystallite size of 20 – 80 nm was observed. Through extrapolation of the experimental
data a critical size for ferroelectric behavior of 17 nm was determined. A substantial
decrease of the TC and broadening of the curve as crystallite size decreases was observed.
In addition, it was believed that the phase transition had become a second order phase
transition. The electrical boundary conditions imposed on the BaTiO3 crystallites by the
surrounding glass matrix influenced the distribution of the spontaneous polarization
within the crystallites. This distribution results in a quasi-paraelectric shell which
exhibits temperature independent dielectric response leading to shifts in Tc and
broadening of the dielectric temperature response.
2.5.2 Bulk BaTiO3
All of the previously described work focused on understanding the critical limit
and size effects in discreet particle systems. However, most BaTiO3 based materials are
used in a bulk state where the boundary conditions change significantly. In work by Frey
et al. sol-gel derived bulk BaTiO3 samples showed no shift in the TC for samples with
grain sizes as small as 35 nm.142, 151 However, a substantial decrease in the maximum
dielectric constant was noted. TEM analysis showed the presence of an 8 Å thick grain
boundary region, which was believed to have a low dielectric constant. It was theorized
34
that the low dielectric constant grain boundary region acted in series or parallel with the
grain decreasing the effective dielectric constant of the bulk samples. Using a diphasic
brick-wall model proposed by Payne and Cross152 and assuming a dielectric constant of
130 for the grain boundary region, good agreement between the model and experimental
results were obtained.
Ragulya et al. also used the brick-wall approach to model the dielectric constant
of BaTiO3 samples sintered under different conditions.153, 154 Ragulya and co-workers
used rate controlled sintering (RCS) and hot-pressing to yield dense BaTiO3 samples with
grains sizes from 100 to 450 nm. Samples sintered under different conditions which had
similar grain sizes (130 nm) exhibited different maximum dielectric constants. Samples
sintered using RCS exhibited an increase of 2500 in the maximum dielectric constant
over the hot-pressed sample. TEM microstructural analysis showed that samples sintered
with RCS had low angle grain boundaries and an overall thinner grain boundary region
compared to the hot-pressed samples. When the brick-wall model was applied the two
different samples the difference in the thickness of the grain boundary regions explained
the decrease in the dielectric constant for the hot-pressed samples.
2.5.3 BaTiO3 Thin Films
The dielectric properties of ferroelectric thin films show size effects similar to
bulk ferroelectric samples. However, the underlying substrate can lead to effects that are
only an issue for thin films. Shaw et al. noted that intrinsic size and thickness effects in
ferroelectric thin film can be difficult to separate because factors, such as grain size, can
be dependent on the film thickness.140 Thin layers in MLCCs are different than those
deposited on rigid, single crystal substrates. For example, when BaTiO3 is deposited on a
35

single crystal Si wafer, there is a mismatch between the lattice constant of the BaTiO3
and the wafer. In non-epitaxial films this lattice mismatch leads to a strain, α, which has
been shown to shift the Tc of ferroelectric thin films.
Due to differences in processing approaches, the thin layers in MLCCs do not
exhibit similar stress states as those of other thin films. However, the inherent
differences in the shrinkage, thermal expansion, and lattice mismatch between the
dielectric and electrode materials led to residual stresses in MLCCs. Shin et al. and Park
used Vicker’s microhardness to measure the residual stress in BaTiO3 MLCCs.155, 156
Both researchers found that the stress was complex and was dependent on the geometry
of the MLCC. However, two general stress states were found: (1) stresses parallel to the
electrodes were compressive whereas, (2) stresses perpendicular to the electrode were
tensile. No comprehensive study has been performed on the effect of residual stress in
MLCCs on the dielectric properties, but the work by Shin et al. and Park show that the
stress state is complex and non-trivial and it is therefore assumed that the dielectric
properties of the BaTiO3 are affected.
In addition to the presence of residual stress, pure geometric constraints also
affect the electrical properties of thin films. When the grain size is on the order of the
film thickness, a brick wall model no longer accurately represents the connectivity of
secondary phases in the microstructure. Depending on the microstructure either series or
parallel conductivity of secondary phases is possible. Waser has shown how the
differences in connectivity can have a profound effect on the dielectric properties of thin
films.157 Using simple series and parallel mixing rules the effect of secondary phases on
the dielectric properties of thin film is easily demonstrated. When secondary phase are
36

present at grain boundaries which are perpendicular to the electrode the capacitance of
grains and secondary phase have an additive effect. In contrast, secondary phases which
are parallel to the electrode have a diluting effect on the overall dielectric constant of the
film.
2.5.4 Electrode-Dielectric Interactions
The previous discussion focused on the degradation mechanism in the ceramic
material due to doping and presence of oxygen vacancies. In the current section
degradation and diminished dielectric properties will be addressed in the context of
electrode/dielectric interactions. Ag/Pd alloys and Ni are the most commonly used
electrode materials in MLCCs, but recently Cu has begun to be used more frequently.158
The reaction of BaTiO3 with electrode materials has been investigated to better
understand the ceramic/metal interface. Each electrode material presents unique issues in
the degradation of BaTiO3 based MLCCs.
In PME-MLCCs Ag and Pd exhibit a low solubility in BaTiO3 and do not oxidize
to form a secondary phase,159 but Ag has a high mobility at elevated temperature and can
precipitate out in the matrix.160, 161 Electromigration of Ag in MLCCs is a common
problem; under an electric field Ag migrates, typically via the grain boundaries, in
dendritic patterns resulting it conductive pathways in the dielectric layers.162 The growth
of the dendrite reduces the effective interelectrode distance, and at the end of the dendrite
the electric field is concentrated because of the sharp tip. Breakdown then occurs
between the dendrite and the opposite electrode because the local electric field or current
is large enough to induce intrinsic or thermal breakdown. As the dielectric layer
37

thickness is reduced in MLCCs the degradation rate is expected to increase because the
high mobility of Ag will lead to rapid dendrite formation.
While Ni is not as mobile as Ag with respect to migration, problems persist that
must be overcome. Studies on the interduffision of Ni and the dielectric layer during the
sintering in reducing atmosphere show that Ni readily diffuses into the dielectric layer.163,
164 Samples sintered at 1250 °C in a pO2 of 10-10 to 10-13 atm showed Ni diffusion up to
500 nm into the dielectric layer. No intermediate or secondary phases were noted at the
electrode-dielectric interface. The substitution of Ni into BaTiO3 is a problem because it
lowers the Curie point of BaTiO3 and increases the oxygen vacancy concentration. If
sintering temperatures were higher and time were longer, the solubility limit of Ni in
BaTiO3 would be reached, and when Ni is above the solubility limit NiO will form.165 If
present, NiO can act as a low K secondary phase which would decrease the dielectric
constant.
Ni diffusion is due to a high chemical potential gradient at the interface, and the
stability of NiO at elevated temperatures. Even in samples fired in low pO2 the driving
force for Ni oxidation is still large. Therefore, the Ni will change its oxidation state. To
overcome the problems of Ni diffusion lower sintering temperatures, shorter dwell times,
and low pO2 values have been suggested.
A complete analysis of BaTiO3-Cu system has not yet been performed. However,
Song and Randall exhibited the feasibility of a Cu-electrode of co-fired BaTiO3 X7R
MLCC.158 To lower the sintering temperature a ZnO-B2O3 flux was added. An 80 nF
prototype MLCC with Cu electrode and 16 active dielectric layers was fabricated.
SEM/EDS analysis showed there is no interaction between the Cu electrode and BaTiO3
38

dielectric during sintering. But work by Langhammer et al. has shown that Cu can
modify the BaTiO3 crystal structure and stabilize the high temperature hexagonal phase at
room temperature if the sintering temperature is too high.166 Even though most of these
effects can be managed, the combined effects will become more pronounced as layer
thickness is further reduced. At reduced grain size and layer thickness the volume
fraction of secondary phases will be greatly increased. Thinner layers will results in
shorter grain boundary paths between electrode and the problem of Ag migration will
result in diminished lifetimes.
2.6 Conclusions
BaTiO3 is the most important dielectric material in the fabrication of MLCCs.
For over 60 years research has been conducted on BaTiO3 over a variety of topics from
synthesis to processing to electrical properties. With the current drive in reduction of
layer thickness it is necessary to understand the impact of all steps in the process on the
final derived properties.
The goal of this research is to understand the impact of tabular BaTiO3
nanoparticles on the properties and deposition of thin BaTiO3 layers. With insight gained
from the literature, the hydrothermal synthesis of anisotropic BaTiO3 nanoparticles is
investigated (Chapter Three). After synthesis, a systematic study of the surface chemistry
was conducted (Chapter Four). From the literature it was determined that a passivation
technique is needed to limit Ba2+ dissolution and the aqueous degradation of BaTiO3
(Chapter Five). Finally, the deposition of BaTiO3 for the buildup of thin dielectric layers
was investigated (Chapter Six).
39

References
1. A.J. Moulson and J.M. Herbert, Electroceramics: Materials, properties, applications, 1st ed. (Chapman & Hall, London, 1990). 2. D.F.K. Hennings, B.S. Schreinemacher, and H. Schreinemacher: Solid-state preparation of BaTiO3-based dielectrics, using ultrafine raw materials. J. Am. Ceram. Soc. 84, (12), 2777 (2001). 3. L. Gao: Preparation of spherical, solid barium titanate particles with uniform composition at high precursor concentration by spray pyrolysis. J. Am. Ceram. Soc. 87, (5), 830 (2004). 4. B.K. Kim, D.Y. Lim, R.E. Riman, J.S. Nho, and S.B. Cho: A new glycothermal process for barium titanate nanoparticle synthesis. J. Am. Ceram. Soc. 86, (10), 1793 (2003). 5. R.A. Kimel, V. Ganine, and J.H. Adair: Double injection synthesis and dispersion of submicrometer barium titanyl oxalate tetrahydrate. J. Am. Ceram. Soc. 84, (5), 1172 (2001). 6. B. Jiang, J.L. Peng, L.A. Bursill, T.L. Ren, P.L. Zhang, and W.L. Zhong: Defect structure and physical properties of barium titanate ultra-fine particles. Phys. B. 291, (1-2), 203 (2000). 7. K.M. Hung, W.D. Yang, and C.C. Huang: Preparation of nanometer-sized barium titanate powders by a sol-precipitation process with surfactants. J. Euro. Ceram. Soc. 23, 1901 (2003). 8. Y. Kobayashi, A. Nishikata, T. Tanase, and M. Konno: Size effect on crystal structures of barium titanate nanoparticles prepared by a sol-gel method. J. Sol-gel Sci.Tech. 29, (1), 49 (2004). 9. Z. Novak, Z. Knez, M. Drofenik, and I. Ban: Preparation of BaTiO3 powders using supercritical CO2 drying of gels. J. Non-Cryst. Solid 285, (1-3), 44 (2001). 10. S. Wada, T. Tsurumi, H. Chikamori, T. Noma, and T. Suzuki: Preparation of nm-sized BaTiO3 crystallites by a LTDS method using a highly concentrated aqueous solution. J. Cryst. Grow. 229, (1), 433 (2001). 11. J. Moon, E. Suvaci, A. Morrone, S.A. Constantino, and J.H. Adair: Formation mechanisms and morphological changes during the hydrothermal synthesis of BaTiO3 particles from a chemically modified, amorphous titanium (hydrous) oxide precursor. J. Euro. Ceram. Soc. 23, (12), 2153 (2003).
40

12. D. Hennings, G. Rosenstein, and H. Schreinemacher: Hydrothermal preparation of barium titanate from barium-titanium acetate gel precursors. J. Euro. Ceram. Soc. 8, 107 (1991). 13. X. Wang, B.I. Lee, M. Hu, E.A. Payzant, and D.A. Blom: Synthesis of nanocrystalline BaTiO3 by solvent refluxing method. J. Mater. Sci. Lett. 22, (7), 557 (2003). 14. P. Gherardi and E. Matijevic: Homogenous precipitation of spherical colloidal barium titanate particles. Colloid Surface 32, (3-4), 257 (1988). 15. P. Pinceloup, C. Courtois, A. Leriche, and B. Thierry: Hydrothermal synthesis of nanometer-sized barium titanate powders: Control of barium/titanium ratio, sintering, and dielectric properties. J. Am. Ceram. Soc. 82, (11), 3049 (1999). 16. Q. Huang and L. Gao: Synthesis and characterization of hexapod-shaped tetragonal-phase barium titanate single crystals. J. Am. Ceram. Soc. 87, (7), 1350 (2004). 17. J.H. Adair and E. Suvaci: Submicron electroceramic powder by hydrothermal synthesis. In Encyclopedia of Materials: Science and Technology, edited by K.H.J. Buschow, R.W. Cahn, M.C. Flemings, B. Ilschner, E.J. Kramer, and S. Mahajan, (Elsevier Science Ltd., 2001) pp 8933. 18. C. Pithan, D.F.K. Hennings, and R. Waser: Progress in the synthesis of nanocrystalline BaTiO3 powders for MLCC. Int. J. Appl. Ceram. Technol. 2, (1), 1 (2005). 19. L.K. Templeton and J.A. Pask: Formation of BaTiO3 from BaCO3 and TiO2, in air and CO2. J. Am. Ceram. Soc. 42, 212 (1959). 20. A. Amin, M.A. Spears, and B.M. Kulwicki: Reaction of anatase and rutile with barium carbonate. J. Am. Ceram. Soc. 66, (10), 733 (1983). 21. A. Beauger, J.C. Mutin, and J.C. Niepce: Synthesis reaction of metatitanate BaTiO3, Part 1: Effect of the gaseous atmosphere upon the thermal evolution of the system BaCO3-TiO2. J. Mater. Sci. 18, 3041 (1983). 22. A. Beauger, J.C. Mutin, and J.C. Niepce: Synthesis reaction of metatitanate BaTiO3, Part 2: Study of solid-state reaction interfaces. J. Mater. Sci. 18, 3543 (1983). 23. W. Clabaugh, E. Swiggard, and R. Gilchrist: Preparation of barium titanyl oxalate tetrahydrate for conversion to barium titanate of high purity. J. Res. Nat. Bur. Stand. 56, (5), 289 (1956).
41

24. C. Szepesi: Synthesis and processing of sub-micron barium titanyl oxalate tetrahydrate. M.S. Thesis, The Pennsylvania State University, University Park, PA, (2004). 25. H. Yamamura, A. Watanabe, S. Shirasaki, Y. Moriyoshi, and M. Tanada: Preparation of barium titanate by oxalate method in ethanol solution. Ceram. Int. 11, 17 (1985). 26. Z.H. Park, H.S. Shin, B.K. Lee, and S.H. Cho: Particle size control of barium titanate prepared from barium titanyl oxalate. J. Am. Ceram. Soc. 80, 1599 (1997). 27. O.O. Vasyl'kiv, A.V. Ragulya, and V.V. Skorokhod: Synthesis and sintering of nanocrystalline barium titanate powder under nonisothermal conditions. II. Phase analysis of the decomposition products of barium titanyl-oxalate and the synthesis of barium titanate. Powder Metallurgy and Metal Ceramics 36, (5-6), 277 (1997). 28. O.O. Vasyl'kiv, A.V. Ragulya, V.P. Klimenko, and V.V. Skorokhod: Synthesis and sintering of nanocrystalline barium titanate powder under nonisothermal conditions. III. Chromatographic analysis of barium titanyl-oxalate gaseous decomposition products. Powder Metallurgy and Metal Ceramics 36, (11-12), 575 (1997). 29. S. Wada, M. Narahara, T. Hoshina, H. Kakemoto, and T. Tsurumi: Preparation of nm-sized BaTiO3 particles using a new 2-step thermal decomposition of barium titanyl oxalate. J. Mater. Sci. 38, 2655 (2003). 30. S. Wada, H. Yasuno, T. Hoshina, S. Nam, H. Kakemoto, and T. Tsurumi: Preparation of nm-sized barium titanate fine particles and their powder dielectric properties. Jpn. J. Appl. Phys. 42, 6188 (2003). 31. A.V. Ragulya, O.O. Vasyl'kiv, and V.V. Skorokhod: Synthesis and sintering of nanocrystalline barium titanate powder under nonisothermal conditions. I. Control of dispersity of barium titanate during its synthesis from barium titanyl oxalate. Powder Metallurgy and Metal Ceramics 36, (3-4), 170 (1997). 32. A.V. Polotai, A.V. Ragulya, T.V. Tomila, and C.A. Randall: The XRD and IR study of the barium titanate nano-powder obtained via oxalate route. Ferroelectrics 298, 243 (2004). 33. M.P. Pechini: Method of preparing lead and alkaline earth titanates and niobates and coating methods using the same to form a capacitor. US Patent # 3,330,697, (1967). 34. B.J. Mulder: Preparation of BaTiO3 and other ceramic powders by co-precipitation of citrates in an alcohol. Amer. Ceram. Soc. Bull. 49, 990 (1970).
42

35. H. Matsuda, M. Kuwabara, K. Yamada, H. Shimooka, and S. Takahashi: Optical adsorption in sol-gel derived crystalline barium titanate fine particles. J. Am. Ceram. Soc. 81, (11), 3010 (1998). 36. H. Shimooka and M. Kuwabara: Preparation of dense BaTiO3 ceramics from sol-gel derived monolithic gels. J. Am. Ceram. Soc. 78, (10), 2849 (1995). 37. H. Herrig and R. Hempelmann: A colloidal approach to nanometre-sized mixed oxide ceramic powders. Mater. Lett. 27, 287 (1996). 38. C. Beck, W. Hartl, and R. Hempelmann: Size-controlled synthesis of nanocrystalline BaTiO3 by a sol-gel type hydrolysis in microemulsion-provided nanoreactors. J. Mater. Res. 13, (11), 3174 (1998). 39. S. Li, J.A. Eastman, and L.J. Thompson: Gas-condensation synthesis of nanocrystalline BaTiO3. Appl. Phys. Lett. 70, (17), 2244 (1997). 40. K. Suzuki and K. Kijima: Well-crystallized barium titanate nanoparticles prepared by plasma chemical vapor deposition. Mater. Lett. 58, 1650 (2004). 41. Y. Itoh, T.O. Kim, M. Shimada, K. Okuyama, and I. Matsui: One-step preparation of BaTiO3 nanoparticles by liquid source chemical vapor deposition. J. Chem. Eng. Jap. 37, (3), 454 (2004). 42. M. Viviani, J. Lemaitre, M.T. Buscagalia, and P. Nanni: Low-temperature aqueous synthesis (LTAS) of BaTiO3: A statistical design of experiment approach. J. Euro. Ceram. Soc. 20, 315 (2000). 43. M. Viviani, M.T. Buscagalia, A. Testino, V. Buscagalia, P. Bowen, and P. Nanni: The influence of concentration on the formation of BaTiO3 by direct reaction of TiCl4 with Ba(OH)2 in aqueous solution. J. Euro. Ceram. Soc. 23, 1383 (2003). 44. A. Testino, M.T. Buscagalia, M. Viviani, V. Buscagalia, and P. Nanni: Synthesis of BaTiO3 particles with tailored sized by precipitation from aqueous solution. J. Am. Ceram. Soc. 87, (1), 79 (2004). 45. S. Wada, H. Chikamori, T. Noma, and T. Suzuki: Synthesis of nm-sized barium titanate crystallites using a new LTDS method and their characterization. J. Mater. Sci. 35, (19), 4857 (2000). 46. S.S. Flaschen: An aqueous synthesis of barium titanate. J. Am. Chem. Soc. 77, 6194 (1955). 47. K. Kiss, J. Magder, M.S. UVukasovich, and R.J. Lockhard: Ferroelectrics of ultrafine particle size: I, Synthesis of titanate powders of ultrafine particle size. J. Am. Ceram. Soc. 49, (6), 291 (1966).
43

48. K.S. Mazdiyasni, R.T. Dolloff, and J.S. Smith: Preparation of high-purity submicron barium titanate powders. J. Am. Ceram. Soc. 52, (10), 523 (1969). 49. W. Ovramenko, L. Shvets, F. Ovcharenko, and B. Kornilovich: Kinetics of hydrothermal synthesis of barium metatitanate. Inorg. Mat. 15, (11), 1560 (1979). 50. T.R.N. Kutty, R. Vivekanandan, and P. Murugaraj: Precipitation of rutile and anatase (TiO2) and their conversion to MTiO3 (M= Ba, Sr, Ca). Mater. Chem. Phys. 19, (6), 533 (1988). 51. W. Hertl: Kinetics of barium-titanate synthesis. J. Am. Ceram. Soc. 71, (10), 879 (1988). 52. J.A. Kerchner, J. Moon, R. Chodelka, A. Morrone, and J.H. Adair: Nucleation and formation mechanisms of hydrothermal derived barium titanate. In Synthesis and Characterization of Advanced Materials. ACS Symposium Series, Vol 681, edited by M.A. Serio, D.M. Gruen, and R. Malhotra, (American Chemical Society, 1998) pp 106. 53. K. Osseo-Asare, F.J. Arriagada, and J.H. Adair: Solubility relationships in the coprecipitation synthesis of barium titanate: Heterogeneous equilibria in the Ba-Ti-C2O4-H2O system. In Ceramic Transactions, Ceramic Powder Science, edited by G.L. Messing, E.R. Fuller, Jr., and H. Hausner, (The American Ceramic Society, 1988) pp 47. 54. M.M. Lencka and R.E. Riman: Thermodynamic modeling of hydrothermal synthesis of ceramic powders. Chem. Mater. 5, (1), 61 (1993). 55. K. Abe, M. Aoki, H. Rikimaru, T. Ito, K. Hidaka, and K. Segawa: Process for producing a composition which includes perovskite compounds. US Patent # 4,643,984, (1987). 56. E. Lilley and R.R. Wusirika: Method for the production of mono-sized barium titanate. US Patent # 4,764,493, (1988). 57. J. Menashi, R.C. Reid, and L. Wagner: Barium titanate powders. US Patent # 4,829,033, (1989). 58. J. Menashi, R.C. Reid, and L. Wagner: Barium titanate based dielectric compositions. US Patent # 4,832,939, (1989). 59. J. Menashi, R.C. Reid, and L. Wagner: Doped barium titanate based compositions. US Patent # 4,863,883, (1989). 60. M.K. Klee and H.W. Brand: Method of manufacturing powdered barium titanate. US Patent # 4,859,448, (1989).
44

61. M. Hu, V. Kurian, E.A. Payzant, C.J. Rawn, and R.D. Hunt: Wet-chemical synthesis of monodisperse barium titanate particles - hydrothermal conversion of TiO2 microspheres to nanocrystalline BaTiO3. Powder Tech. 110, 2 (2000). 62. R.I. Walton, D. Millange, R.A. Smith, T.C. Hansen, and D. O'Hare: Real time observation of the hydrothermal crystallization of barium titanate using in-situ neutron powder diffraction. J. Amer. Chem. Soc. 123, (50), 12547 (2001). 63. D.V. Miller: Synthesis and properties of barium titanate nanocomposites. Ph.D. Thesis, The Pennsylvania State University, University Park, PA, (1991). 64. R. Vivekanandan, S. Philip, and T.R.N. Kutty: Hydrothermal preparation of Ba(Ti,Zr)O3 fine powders. Mater. Res. Bull. 22, (1), 99 (1986). 65. J. Moon, J.A. Kerchner, H.G. Krarup, and J.H. Adair: Hydrothermal synthesis of ferroelectric perovskites from chemically modified titanium isopropoxide and acetate salts. J. Mater. Res. 14, (2), 425 (1999). 66. J. Moon, E. Suvaci, T. Li, S.A. Costantino, and J.H. Adair: Phase development of barium titanate from chemically modified-amorphous titanium (hydrous) oxide precursor. J. Euro. Ceram. Soc. 22, (6), 809 (2002). 67. D.F.K. Hennings, C. Metzmacher, and B.S. Schreinemacher: Defect chemistry and microstructure of hydrothermal barium titanate. J. Am. Ceram. Soc. 84, (1), 179 (2001). 68. J.K. Lee, K.S. Hong, and J.W. Jang: Roles of Ba/Ti ratios in the dielectric properties of BaTiO3 ceramics. J. Am. Ceram. Soc. 84, (9), 2001 (2001). 69. Y.B. Moa, S. Banerjee, and S.B. Wong: Hydrothermal synthesis of perovskite nanotubes. Chem. Comm. 3, 408 (2003). 70. T.J. Yosenick, D.V. Miller, R. Kumar, J.A. Nelson, C.A. Randall, and J.H. Adair: Synthesis of nanotabular barium titanate via a hydrothermal route. J. Mater. Res. 20, (4), 837 (2005). 71. R.B. Bagwell, J. Sindel, and W. Sigmund: Morphological evolution of barium titanate synthesized in water in the presence of polymeric species. J. Mater. Res. 14, (5), 1844 (1999). 72. M.C. Blanco-Lopez, B. Rand, and F.L. Riley: The properties of aqueous phase suspensions of barium titanate. J. Euro. Ceram. Soc. 17, 281 (1997). 73. M.C. Blanco-Lopez, G. Fourlaris, and F.L. Riley: Interactions of barium titanate powders with an aqueous suspending medium. J. Euro. Ceram. Soc. 18, 2183 (1998).
45
74. S. Venigalla and J.H. Adair: Theoretical modeling and experimental verification of electrochemical equilibria in the Ba-Ti-C-H2O system. Chem. Mater. 11, (3), 589 (1999). 75. U. Paik and V.A. Hackley: Influence of solids concentration on the isoelectric point of aqueous barium titanate. J. Am. Ceram. Soc. 83, (10), 2381 (2000). 76. A. Neubrand, R. Linder, and P. Hoffman: Room-temperature solubility behavior of barium titanate in aqueous media. J. Am. Ceram. Soc. 83, (4), 860 (2000). 77. U. Paik, S. Lee, and V.A. Hackley: Influence of barium dissolution on the electrokinetic properties of colloidal BaTiO3 in an aqueous medium. J. Am. Ceram. Soc. 86, (10), 1662 (2003). 78. C.W. Chiang and J.H. Jean: Effects of barium dissolution on dispersing aqueous barium titanate suspensions. Mater. Chem. Phys. 80, (3), 647 (2003). 79. H. Krurap, R. Linhart, and J.H. Adair, Opal, 1.93x; Gainsville, FL, (1997). 80. J.H. Adair and H.G. Krurup: The role of solution chemistry in understanding colloidal stability of ceramic suspensions. In Advances in process measurements for the ceramic industry, edited by A. Jillavenkatesa, and G.Y. Onoda, (The American Ceramic Society: Westerville, OH, 1999) pp 205. 81. P. Bendale, S. Venigalla, J.R. Ambrose, E.D. Verink, and J.H. Adair: Preparation of barium-titanate films at 55-degrees-C by an electrochemical method. J. Am. Ceram. Soc. 76, (10), 2619 (1993). 82. D.A. Anderson, J.H. Adair, D.V. Miller, J.V. Biggers, and T.R. Shrout: Surface chemistry effect on ceramic processing of BaTiO3 powder. In Ceramic Transactions, Ceramic Powder Science, edited by G.L. Messing, E.R. Fuller, Jr., and H. Hausner, (The American Ceramic Society: Westerville, OH, 1988) pp 485. 83. P. Duran, J. Tartaj, and C. Moure: Sintering behavior and microstructural evolution of agglomerated spherical particles of high-purity barium titanate. Ceram. Int. 29, 419 (2003). 84. J.L. Crampo: The role of passivation/dispersion on grain growth in barium titanate ceramics. B.S. Thesis, The Pennsylvania State University, University Park, PA, (2001). 85. H. Kamiya, K. Gomi, Y. Iida, K. Tanaka, T. Yoshiyasu, and T. Kakiuchi: Preparation of highly dispersed ultrafine barium titanate powder by using mircobial-derived surfactant. J. Am. Ceram. Soc. 86, (12), 2011 (2003). 86. A.W.M. de Laat and W.P.T. Derks: Colloidal stabilization of BaTiO3 with poly(vinyl alcohol) in water. Colloid Surface A 71, (2), 147 (1993).
46

87. X. Wang, B. Lee, and L. Mann: Dispersion of barium titanate with polyaspartic acid in aqueous media. Colloid Surface A 202, (1), 71 (2002). 88. Z. Shen, J. Chen, H. Zou, and J. Yun: Dispersion of nanosized aqueous suspensions of barium titanate with ammonium polyacrylate. J. Colloid Interface Sci. 275, (1), 158 (2004). 89. J. Zhao, X. Wang, Z. Gui, and L. Li: Dispersion of barium titanate with poly(acrylic acid-co-maleic acid) in aqueous media. Ceram. Int. 30, (7), 1985 (2004). 90. Y. Song, X. Liu, and J. Chen: The maximum solid loading and viscosity estimation of ultra-fine BaTiO3 aqueous suspensions. Colloid Surface A 247, 27 (2004). 91. K. Hsu, K. Ying, L. Chen, B. Yu, and W. Wei: Dispersion properties of BaTiO3 colloids with amphoteric polyelectrolytes. J. Am. Ceram. Soc. 88, (3), 524 (2005). 92. G.H. Kirby, D.A. Harris, Q. Li, and J.A. Lewis: Poly(acrylic acid)-poly(ethylene oxide) comb polymer effects on BaTiO3 nanoparticle suspension stability. J. Am. Ceram. Soc. 87, (4), 181 (2004). 93. G.H. Kirby, D.A. Harris, Q. Li, and J.A. Lewis: PAA-POE comb polymer dispersants for colloidal processing. Key Eng. Mater. 264-268, 161 (2004). 94. U. Paik, V.A. Hackley, J. Lee, and S. Lee: Effect of poly(acrylic acid) and poly(vinyl alcohol) on the solubility of colloidal BaTiO3 in an aqueous medium. J. Mater. Res. 18, (5), 1266 (2003). 95. J.H. Adair and S.A. Constantino: Ceramic slip composition and method for preparing the same. US Patent # 6,214,756, (2001). 96. R.P. Vasquez, B.D. Hunt, and M.C. Foote: Wet chemical passivation of YBa2Cu3O7-
x. J. Electrochem. Soc. 137, (7), 2344 (1990). 97. W.J. Merz: The electrical and optical behavior of BaTiO3 single-domain crystals. Phys. Rev. 76, (8), 1221 (1949). 98. EIA-198-1-F - Ceramic dielectric capacitors classes I, II, III and IV - Part I: Characteristics and requirements 99. D.F.K. Hennings and G. Rosenstein: Temperature-stable dielectrics based on chemically inhomogeneous BaTiO3. J. Am. Ceram. Soc. 67, (4), 249 (1984). 100. D.F.K. Hennings and B.S. Schreinemacher: Temperature-stable dielectric materials in the system BaTiO3-Nb2O5-Co3O4. J. Euro. Ceram. Soc. 15, (4), 463 (1994).
47

101. M. Kahn: Influence of grain growth on dielectric properties of Nb-doped BaTiO3. J. Am. Ceram. Soc. 54, (9), 455 (1971). 102. B.S. Rawal, M. Kahn, and W.R. Buessem: Grain core-shell structure in barium titanate-based dielectrics. In Advances in Ceramics, Vol. 1, Grain Boundary Phenomena in Electronic Ceramics, edited by L.M. Levinson, (American Ceramic Society, 1981) pp 172. 103. T.R. Armstrong and R.C. Buchanan: Influence of core-shell grains on the internal stress state and permittivity response of zirconia-modified barium titanate. J. Am. Ceram. Soc. 73, (5), 1268 (1990). 104. T.R. Armstrong, K.A. Young, and R.C. Buchanan: Dielectric properties of fluxed barium titanate ceramics with zirconia additives. J. Am. Ceram. Soc. 73, (3), 700 (1990). 105. F. Azough, R. Al-Saffar, and R. Freer: A transmission electron microscope study of commercial X7R-type multilayer ceramic capacitors. J. Euro. Ceram. Soc. 18, 751 (1998). 106. Y. Park and Y.H. Kim: The dielectric temperature characteristics of additives modified barium titanate having core-shell structured ceramics. J. Mater. Res. 10, (11), 2770 (1995). 107. B. Jaffe, W.R. Cook, and H. Jaffe, Piezoelectric Ceramics, 1st ed. (Academic Press, London, 1971). 108. Y. Tsur, T.D. Dunbar, and C.A. Randall: Crystal and defect chemistry of rare earth cations in BaTiO3. J. Electroceram. 7, 25 (2001). 109. D.F.K. Hennings: Dielectric materials for sintering in reducing atmospheres. J. Euro. Ceram. Soc. 21, 1637 (2001). 110. W. Lee, W.A. Groen, H. Schreinemacher, and D.F.K. Hennings: Dsyprosium doped dielectric materials for sintering in reducing atmospheres. J. Electroceram. 5, (1), 31 (2000). 111. Y. Tsur, J.H. Adair, and C.A. Randall: Improving the oxidation resistance of base metal powders. Jpn. J. Appl. Phys. 39, (10), 6004 (2000). 112. R. Waser, T. Baiatu, and K.H. Hardtl: dc electrical degradation of perovskite-type titanates: I, Ceramics. J. Am. Ceram. Soc. 73, (4), 1645 (1990). 113. J.M. Herbert: High permittivity ceramics sintered in hydrogen. Trans. Br. Ceram. Soc. 62, (8), 645 (1963).
48

114. I. Burn and G.H. Maher: High resistivity BaTiO3 ceramics sintered in CO-CO2 atmosphere. J. Mater. Sci. 10, 633 (1975). 115. H.J. Hagemann and D.F.K. Hennings: Reversible weight change of acceptor-doped BaTiO3. J. Am. Ceram. Soc. 64, (10), 590 (1981). 116. R. Waser, T. Baiatu, and K.H. Hardtl: dc electrical degradation of perovskite-type titanates: II, Single crystals. J. Am. Ceram. Soc. 73, (6), 1654 (1990). 117. K. Albertsen, D.F.K. Hennings, and O. Steigelemann: Donor-acceptor charge complex formation in barium titanate ceramics: Role of firing atmosphere. J. Electroceram. 2, (3), 193 (1998). 118. H. Kishi, Y. Mizuno, and H. Chazono: Base-metal electrode-multilayer ceramic capacitors: Past, present and future perspectives. Jpn. J. Appl. Phys. 42, (1), 1 (2003). 119. C. Lee, S. Kang, D. Sinn, and H. Yoo: Co-doping effect of Mn and Y on charge and mass transport properties of BaTiO3. J. Electroceram. 13, 785 (2004). 120. Y. Okino, H. Shizuno, S. Kusumi, and H. Kishi: Dielectric properties of rare-earth-oxide-doped BaTiO3 ceramics fired in reducing atmosphere. Jpn. J. Appl. Phys. 33, (9B), 5393 (1994). 121. Y. Tsur and C.A. Randall: Point defect concentrations in barium titanate revisited. J. Am. Ceram. Soc. 84, (9), 2147 (2001). 122. J.F. Fernandez, A.C. Caballero, P. Duran, and C. Moure: Improving sintering behavior of BaTiO3 by small doping additions. J. Mater. Sci. 31, (4), 975 (1996). 123. A.C. Caballero, J.F. Fernandez, C. Moure, P. Duran, and Y.M. Chiang: Grain growth control and dopant distribution in Zno-doped BaTiO3. J. Am. Ceram. Soc. 81, (4), 939 (1998). 124. A.C. Caballero, M. Villega, J.F. Fernandez, C. Moure, P. Duran, P. Florian, and J.P. Coutures: Reactive sintering of phosphorous coated BaTiO3. J. Euro. Ceram. Soc. 19, (6-7), 979 (1999). 125. H. Lu, J. Bow, and W. Deng: Core-shell structures in ZrO2-modified BaTiO3 ceramic. J. Am. Ceram. Soc. 73, (12), 3562 (1990). 126. C.A. Randall, S.F. Wang, D. Laubscher, J.P. Dougherty, and W. Huenber: Structure property relationships in core-shell BaTiO3-LiF ceramics. J. Mater. Res. 8, (4), 871 (1993). 127. Y. Kuromitsu, S.F. Wang, S. Yoshikawa, and R.E. Newnham: Interactions between barium titanate and binary glasses. J. Am. Ceram. Soc. 77, (2), 493 (1994).
49

128. H. Chazono and H. Kishi: Sintering characteristics in the BaTiO3-Nb2O5-Co3O4 ternary system: II, Stability of the so-called "core-shell" structure. J. Am. Ceram. Soc. 83, (11), 101 (2000). 129. G.H. Wiseman: Advanced manufacturing process for zinc oxide surge arrester disks. Key Eng. Mater. 150, 209 (1998). 130. S. Ural: Aggregate breakdown and aqueous processing of zinc oxide varistors. M.S. Thesis, The Pennsylvania State University, University Park, PA, (2003). 131. X. Liu: Structure-property relationships in submicron X7R dielectric materials. M.S. Thesis, The Pennsylvania State University, University Park, PA, (1999). 132. S.A. Bruno: Ceramic dielectric compositions and method for enhancing dielectric properties. US Patent # 5,082,811, (1992). 133. J.F. Fernandez, P. Duran, and C. Moure: Influence of the doping method on X7R based-dielectric capacitors. Ferroelectrics 127, 47 (1992). 134. R.J. Brandmayr, A.E. Brown, and A.M. Dunlap:Annealing effects on microstructure and dielecrtric properties of hot-pressed, ultrafine grained BaTiO3; ECOM-2614; (1965). 135. W.R. Buessem, L.E. Cross, and A.K. Goswami: Phenomenological theory of high permittivity in fine-grain barium titanate. J. Am. Ceram. Soc. 49, (1), 33 (1966). 136. W.R. Buessem, L.E. Cross, and A.K. Goswami: Effect of two-dimensional pressure on the permittivity of fine- and coarse-grained barium titanate. J. Am. Ceram. Soc. 49, (1), 36 (1966). 137. H.T. Martirena and J.C. Burfoot: Grain-size effects on properties of some ferroelectric ceramics. J. Phys. C 7, 3182 (1974). 138. G. Artl, D.F.K. Hennings, and G. de With: Dielectric properties of fine-grained barium titanate ceramics. J. Appl. Phys. 58, (4), 1619 (1985). 139. L. Mitoseriu, V. Tura, C. Papusoi, T. Osaka, and M. Okuyama: A comparative study of the grain size effects on ferro-para phase transition in barium titanate ceramics. Ferroelectrics 223, 99 (1999). 140. T.M. Shaw, S. Trolier-McKinstry, and P.C. McIntyre: The properties of ferreolectric films at small dimensions. Annu. Rev. Mater. Sci. 30, 263 (2000). 141. D. McCauley, R.E. Newnham, and C.A. Randall: Intrinsic size effects in a barium titanate glass-ceramic. J. Am. Ceram. Soc. 81, (4), 979 (1998).
50

142. M.H. Frey and D.A. Payne: Grain-size effect on structure and phase transformations for barium titanate. Phys. Rev. B. 54, (5), 3158 (1996). 143. Z. Zhao, V. Buscagalia, M. Viviani, M.T. Buscagalia, L. Mitoseriu, A. Testino, M. Nygren, M. Johnsson, and P. Nanni: Grain-size effects on the ferroelectric behavior of dense nanocrystalline BaTiO3 ceramics. Phys. Rev. B. 70, (2), (2004). 144. Y.G. Wang, W.L. Zhong, and P.L. Zhang: Size driven phase transitions in ferroelectric particles. Solid State Comm. 90, (5), 329 (1994). 145. W.Y. Shih, W.H. Shih, and I.A. Aksay: Size dependence of the ferroelectric transition of small BaTiO3 particles: Effect of depolarization. Phys. Rev. B. 50, (21), 15575 (1994). 146. J. Junquera and P. Ghosez: Critical thickness for ferroelectricity in perovskite ultrathin films. Nature 422, 506 (2003). 147. B.D. Begg, E.R. Vance, and J. Nowotny: Effect of particle size on the room-temperature crystal structure of barium titanate. J. Am. Ceram. Soc. 77, (12), 3186 (1994). 148. X. Li and W. Shin: Size effect in barium titanate particles and clusters. J. Am. Ceram. Soc. 80, (11), 2844 (1997). 149. S. Wada, T. Hoshina, S. Nam, H. Kakemoto, T. Tsurumi, and M. Yashima: Size dependence of dielectric properties for nm-sized barium titanate crystallites and its origins. J. Kor. Phys. Soc. 46, (1), 303 (2005). 150. C.A. Randall, D. McCauley, and D.P. Cann: Finite size effects in BaTiO3 ferroelectric glass ceramic. Ferroelectrics 206-207, 325 (1998). 151. M.H. Frey, Z. Xu, P. Han, and D. Payne: The role of interfaces on an apparent grain size effect on the dielectric properties for ferroelectric barium titanate ceramics. Ferroelectrics 206-207, 337 (1998). 152. D.A. Payne and L.E. Cross: Microstructure-property relations for dielectric ceramics. II. The brick-wall model of the polycrystalline microstructure. In Microstructure and properties of ceramic materials, edited by T.S. Yen, and J.A. Pask, (Beining Science Press, 1984) pp. 153. A.V. Ragulya, V.V. Skorokhod, and A.V. Polotai: Synthesis and sintering of nanocrystalline barium titanate powder under nonisothermal conditions. VI. Structure, grain boundaries, and dielectric properties of barium titanate obtained by various sintering methods. Powder Metallurgy and Metal Ceramics 40, (1-2), 25 (2001).
51

154. A.V. Ragulya and A.V. Polotai: Non-isothermal sintering of barium titanate nano-powders of different origination. Ferroelectrics 254, 41 (2001). 155. D. Park, Y. Jung, and U. Paik: Evaluation of residual stress in BaTiO3-based Ni-MLCC with X7R characteristics. J. Mater. Sci. 15, 253 (2004). 156. Y. Shin, K. Kang, Y. Jung, J. Yeo, S. Lee, and U. Paik: Internal stresses in BaTiO3/Ni MLCCs. J. Euro. Ceram. Soc. 23, 1427 (2003). 157. R. Waser and O. Lohse: Electrical characterization of ferroelectric, paraelectric, and superparaelectric thin films. Inter. Ferro. 21, (1-4), 27 (1998). 158. T.H. Song and C.A. Randall: Copper cofire X7R dielectrics and multilayer capacitors based on zinc borate fluxed barium titanate ceramic. J. Electroceram. 10, 39 (2003). 159. S. Shin and W.H. Tuan: Solubility of silver and palladium in BaTiO3. J. Am. Ceram. Soc. 87, (3), 401 (2004). 160. C.Y. Chen and W.H. Tuan: Evaporation of Ag during co-firing with BaTiO3. J. Am. Ceram. Soc. 83, (7), 1693 (2000). 161. C.Y. Chen and W.H. Tuan: Effect of silver on the sintering and grain growth behavior of barium titanate. J. Am. Ceram. Soc. 83, (12), 2988 (2000). 162. S.J. Krubien: Tutorial: Electrolytic models for metallic electromigration failure mechanisms. IEEE Trans. Reliab. 44, (4), 539 (1995). 163. Y. Wang, L. Li, J. Qi, Z. Ma, J. Cao, and Z. Gui: Nickel diffusion in base-metal-electrode MLCCs. Mater. Sci. and Eng. B99, 378 (2003). 164. Z. Gui, Y.L. Wang, and L.T. Li: Study on the interduffision in base-metal-electrode MLCC's. Ceram. Int. 30, 1275 (2004). 165. W.H. Tzing and W.H. Tuan: Effect of NiO additions on the sintering and grain growth behavior of BaTiO3. Ceram. Int. 25, 69 (1999). 166. H.L. Langhammer, T. Muller, R. Bottcher, and H.P. Abicht: Crystal structure and related properties of copper-doped barium titanate ceramics. Solid State Sci. 5, 965 (2003).
52

CHAPTER THREE
Synthesis of Nanotabular Barium Titanate via a Hydrothermal Route 3.1 Introduction
With the recent demands placed on cellular and mobile technologies the need for
nanoparticles of highly engineered materials has increased. The high volume, low cost,
and superior properties of passive electronic components requires that precision powders
for electronic component are inexpensive, of high quality, and can be produced at high
yields. Control of chemical and hydrothermal defects in the powders is of great
importance in controlling the properties of multilayer ceramic capacitors (MLCC’s) made
from the powder. Therefore, the synthesis of high quality powders of high dielectric
properties, especially perovskite structured materials, has been of specific interest. The
dependence of volumetric capacitance of a MLCC on the thickness of the active layer is
well-documented.1 Nanoparticles and their assembly provide potential to reduce layer
thickness below the current standard of 1 μm.
Much work on a variety of synthesis routes for the synthesis of BaTiO3
nanoparticle has occurred recently. Solid-state carbonate reactions2, a modified Clabaugh
process3, and low temperature direct synthesis (LTDS)4 and several other routes5-7 have
all been investigated. The first two routes are common commercial methods used to
produce powders, however each require further processing, either milling or calcination,
to produce nanoscale BaTiO3, while powders produced by LTDS have a high hydroxyl
defect concentration and a low Ba/Ti ratio. Hydrothermal synthesis is a common method
53

that produces nanosized powders. Under the correct synthesis conditions powders with
low defect concentrations and controlled stoichiometry that requires no further processing
can be produced, making hydrothermal synthesis an excellent choice for the commercial
synthesis of BaTiO3.8
Little to no work on the synthesis of BaTiO3 nanoparticles has focused on
morphology control during synthesis. Instead focus has been on the synthesis of
spherical nanoparticles. Tabular nanoparticles are particles that have a plate-like
morphology with a thickness in the nanoscale and an aspect ratio as high as 100:1.
Nanotabular particles have many advantages over spherical nanoparticles for the laydown
of thin films. For example work by Yener et al. on the electrophoretic deposition of
Ag/Pd nanoparticles has shown improved thickness control and surface roughness of thin
metal layers when the layers are comprised of tabular nanoparticles instead of spherical
nanoparticles.9 The thickness in the nanoscale allows for the laydown of thin layers
with low surface roughness. In addition, the large face area allows for adsorption of a
polyelectrolyte dispersants in high concentrations yielding high surface charge enabling
the creation of stable suspensions.10
A few researchers have shown that morphology control of perovskite materials
during hydrothermal synthesis is possible, but that work yielded micron sized particles.
Work by Moon et al.11 and Cho et al.12 have focused on the synthesis of PbTiO3 and PZT
with varying morphologies. Bagwell controlled the morphology of BaTiO3 by the
addition of polymeric species during synthesis.13 The polymer adsorption varied among
different crystallographic planes leading to different growth rate for each plane. Under
highly alkaline conditions (pH 14) Zhao et al.14 synthesized BaTiO3 octahedra in which
54

the {111} face is the stable habit. At elevated temperatures, 225 °C, Miller synthesized
BaTiO3 particles that resemble hexagonal platelets with the {111} face as the basal
plane.15 Thus, the synthesis scheme of Miller is of interest because of the reported plate-
like nature of the materials. However, there was no report of particle thickness or other
physical properties in the Miller work. Therefore, the current study has verified the
Miller synthesis and provides a more complete characterization.
3.2 Materials and Methods
All chemicals were reagent grade and used without further purification. Titanium
isopropoxide (TI) (97%, Aldrich Chemical Company, Milwaukee, WI) and barium
hydroxide octahydrate (BHO) (98+%, Aldrich Chemical Company, Milwaukee, WI)
were used as the titanium and barium sources, respectively. Figure 3.1 is a flow diagram
of the procedure used in the synthesis. A 500 ml solution of a 1M TI and BHO was
prepared by adding the appropriate amount of BHO to CO2-free DI water and stirring for
10 minutes. CO2-free DI water had been previously prepared by boiling with flowing
argon to remove adsorbed CO2. The removal of CO2 is necessary to limit the formation
of BaCO3 during synthesis. Next, TI was added and the solution was stirred for an
additional 30 minutes. The BHO and TI were mixed in equimolar quantities to obtain
stoichiometric BaTiO3.
The solution was placed in a 1 L reaction vessel (Parr Instrument Company,
Moline, IL) with the stirring speed set at 60 rpm. The thermal treatment consisted of a 2
hour ramp to 225 °C with a 5 hour hold followed by cooling to room temperature. The
pH of the solution measured before and after synthesis and was pH 13.1 and pH 12.7,
55

Barium Hydroxide Octahydrate
Ba(OH)2●8H2O (157.74g)
Titanium IsopropoxideTi[OCH(CH3)2]4
(142.13g)
Add CO2 Free DI H2O(278.8mL)
Combine Equimolar Amountsof Precursors (500 of 1M
BaTiO3 solution) & Stir for 30min
Hydrothermal Treatment
225 ºC for 5hrs
Figure 3.1. Flow diagram for the hydrothermal synthesis of platelet BaTiO3. The starting solution is 500 mL total of a 1M solution, and has an approximate yield of 120g of powder
56

respectively. To investigate the morphological evolution of the particles as a function of
temperature after synthesis powder samples were heat treated at 10 °C/min on Pt foil
placed in an alumina crucible. Samples were heated to 375, 450, 700, 800, 900, 1000,
and 1100 °C removed at temperature and quenched in air.
Particle morphology and size were determined using atomic force microscopy
(AFM) (Multimode IIIa, Digital Instruments, Santa Barbara, CA) and transmission
electron microscopy (TEM) (2010F, JEOL, Japan). For AFM analysis dilute suspensions
were prepared and a drop was placed on atomically cleaved mica substrate. TEM
analysis was performed using holey-carbon film on Cu grids (Electron Microscopy
Sciences, Fort Washington, PA) as the sample holder. A single drop of dilute suspension
was placed on each TEM grid. Size distributions of both the thickness and face diameter
were calculated on a number basis using the offline AFM software (Nanoscope III
Version 5.12r3, Digital Instruments, Santa Barbara, CA) and image analysis software
(Scion Image Beta 4.0.2, Scion Corporation, Fredrick, MD).
Phases present and other physical properties were determined using a variety of
characterization techniques. X-ray diffraction (XRD) (Scintag Pad V, Thermo-ARL,
Dearborn, MI) was used to determine the solid phases present. X-ray fluorescence (XRF)
(1600/10, Phillips, Netherlands) was used to determine the major and minor constituents
of the as-synthesized powder. Density measurements were performed using helium
pycnometery (Multivolume Pycnometer 1305, Micromeritics, Norcross, GA). The
weight loss of the powder up to 1000 °C was analyzed using thermogravimetric analysis
(TGA) (TGA 2050 Thermogravimetric Analyzer, TA Instruments Inc., New Castle, DE).
57

Particle surface area was measured using BET gas adsorption (Gemini, Micromeritics,
Norcross, GA).
Schematic representations of the (100), (110), and (111) planes of BaTiO3 were
calculated and rendered using Atoms for Windows (Version 3.2, Atoms Software,
Kingsport, TN). A cubic crystal structure with m3m space group with a lattice parameter
of 4 Å was assumed. The planar density of both Ti and surface OH were then calculated
using the model planar surfaces. In the current study calculations based on a tetragonal
crystal structure (space group P4mm) were omitted because of the small difference in the
a and c lattice parameters in the tetragonal structure.
3.3 Results and Discussion
3.3.1 BaTiO3 Particle Morphology and Growth
Figure 3.2 is the X-ray diffraction pattern for the as-synthesized powder and
powder heat-treated to 1000 °C. The as-synthesized powder is the pseudo-cubic phase of
the perovskite crystal structure, due to the stain on the lattice introduced by the presence
of hydroxide defects in the lattice.16 Upon heat treatment to 1000 °C, where the
hydroxide defects are no longer present, the phase is the tetragonal perovskite crystal
structure. Figure 3.3a is a TEM image of the as-synthesized BaTiO3 particles. The
associated selected area electron diffraction (SAED) pattern, Figure 3.3b, indicates that
the particles are single crystal with a <111> zone axis parallel to the surface normal.
Figure 3.3c is a partial ring diffraction pattern from a cluster of approximately 100
particles. The pattern shows the presence of rings for diffraction from {100}, {110}, and
{200} planes. Absent from the pattern, between the {110} and {200} rings, is the
58

Figu
re 3
.2.
X-r
ay d
iffra
ctio
n pa
ttern
for a
s-sy
nthe
size
d po
wde
r and
pow
der h
eat t
reat
ed to
100
0 °C
. Th
e as
-syn
thes
ized
pow
der i
s ps
eudo
-cub
ic d
ue to
the
pres
ence
of h
ydro
ther
mal
def
ects
in th
e la
ttice
. A
fter h
eat t
reat
men
t at 1
000
°C p
eak
split
ting
is
obse
rvab
le in
the
(200
)/(00
2) p
eak
(see
inse
rt gr
aph)
and
indi
cate
s the
mat
eria
l has
con
verte
d to
the
tetra
gona
l for
m o
f BaT
iO3.
Not
e: *
Cub
ic B
aTiO
3pe
aks J
CPD
S C
ard:
31-
0174
and
+Te
trago
nal B
aTiO
3pe
aks J
CPD
S C
ard:
79-
2264
59

Figu
re 3
.3a,
b, a
nd c
.TE
M m
icro
grap
h (a
) and
ass
ocia
ted
sele
cted
are
a el
ectro
n di
ffra
ctio
n pa
ttern
(b).
The
sing
le c
ryst
al
diff
ract
ion
patte
rn sh
ows t
hat t
he p
artic
le is
sing
le c
ryst
als w
ith <
111>
zon
e ax
is.
The
abse
nce
of d
iffra
ctio
n fr
om (1
11) i
n th
e pa
rtial
ring
diff
ract
ion
patte
rn (c
) fro
m a
clu
ster
of p
artic
less
how
s a m
ajor
ity o
f the
par
ticle
s in
the
clus
ter s
how
text
ure.
0.35
Å-1
0.25
Å-1
60

expected ring from {111} diffraction. The absence of {111} diffraction indicates that a
majority of that particles in the cluster show texture and have a <111> zone axis
alignment. A few spots from {111} diffraction are present but this is probably due to
particles overlap and misalignment with the electron beam which occurred during the
drying process in the TEM grid.
Figure 3.4 is an AFM cross-section image of the BaTiO3 particles showing that
the particles have plate-like morphology. The thickness and face diameter distribution of
the synthesized particles was calculated used a procedure developed by Yuan and co-
workers.17 The AFM offline software is used to create uniform bins of constant height
which are represented by a distinct color in the AFM image. Any particle with a
thickness which lies within the bin is easily recognized by its color and counted
accordingly. For face diameter measurements the AFM image is converted into a black
and white image, with the area of each particle calculated using image analysis software.
After the area is calculated the face is assumed to be circular and the diameter is
calculated. Figure 3.5 is the log-normal distribution calculated on a number basis for a
total of 214 particles. The cumulative distribution was calculated and the median value
for both the thickness and face diameter was determined to be 5.8 ± 3.1 nm and 27.1 ±
12.3 nm, respectively.
At high pH when titanium isopropoxide is added to water it decomposes to form a
hydrous titania-gel and isopropyl alcohol (IPA) based on the reaction:
Ti[OCH(CH3)2]4 + 4H2O Ti(OH)4 + 4(CH3)2CHOH [3.1]
In the concentrations used to create the 1M solution for the hydrothermal synthesis the
amount of IPA created is considerable, 28vol% of the solution. It was possible during
61

Figu
re 3
.4.
AFM
cro
ss-s
ectio
nal i
mag
e of
BaT
iO3
parti
cles
on
an a
tom
ical
ly fl
at c
leav
ed m
ica
subs
trate
. Th
e pa
rticl
es h
ave
a pl
ate-
like
mor
phol
ogy
with
a th
ickn
ess o
f 7.9
nm
and
face
dia
met
er o
f 46.
9 nm
.
62

Figu
re 3
.5.
Thic
knes
s and
face
dia
met
er si
ze d
istri
butio
ns fo
r the
hyd
roth
erm
al B
aTiO
3pl
atel
ets.
The
dis
tribu
tions
wer
e ca
lcul
ated
usi
ng th
e A
FM o
fflin
e so
ftwar
e an
d im
age
anal
ysis
softw
are.
Bot
h of
the
dist
ribut
ions
are
bas
ed o
n a
tota
l of 2
14
parti
cles
.
63

synthesis that IPA adsorption on the particle surface controls morphology, in a manner
similar to that of polymeric adsorption observed by Bagwell and others.13, 18 A fractional
distillation of the titania gel/IPA solution was carried out to remove the IPA produced by
the hydrolysis of the titanium isopropoxide. The volume of IPA removed by distillation
was measured and CO2-free DI water added in the same volume to ensure the
concentration of the starting solution was identical to all previous experiments. The new
starting solution contained only Ba(OH)2, Ti(OH)4, and CO2-free DI water. The powder
produced was analyzed using TEM and AFM and shows a morphology and dimensions
similar to the other powder synthesized. This critical experiment confirms that IPA
during synthesis does not affect the growth of the particles. Only the high pH, feedstock
concentration, and high packing density of the (111) plane are the primary variables
controlling the morphological evolution of the particles.
With a cubic symmetry during growth the plate-like morphology of the BaTiO3 is
best modeled after (111) double twins proposed by Schmelz and Thomann.19 Schmelz
and Thomann observed the formation of (111) twins in bulk BaTiO3 samples with excess
TiO2 heat treated under sub-eutectic conditions. The high atomic packing density, high
barrier to nucleation, and slow growth of the (111) plane lead to (111) twin formation in
the bulk BaTiO3. The morphology of (111) double twins, shown schematically in Figure
3.6, is a hexagonal shaped platelet similar to the hydrothermal BaTiO3 platelets.
Based on the periodic bond chain (PBC) model by Hartman and Perdok20, Tani et.
al. states the Ti-O bond array is the PBC for the perovskite structure.21 Therefore Ti and
not Ba will be the growth limiting species for the hydrothermal synthesis of BaTiO3.
Figure 3.7 is a schematic representations of the (100), (110), and (111) planes for cubic
64

Figu
re 3
.6.
Sche
mat
ic o
f BaT
iO3
plat
elet
s for
med
via
mul
tiple
{11
1} tw
in fo
rmat
ion.
Afte
r Sch
mel
z an
d Th
oman
n.20
65

Figu
re 3
.7.
Sche
mat
ic re
pres
enta
tions
of (
a) (1
00) p
lane
, (b)
(110
) pla
ne a
nd (c
) (11
1) p
lane
rend
ered
usi
ng A
tom
s for
Win
dow
s.
Each
figu
re sh
ows t
he o
xyge
n co
ordi
natio
n of
tita
nium
in e
ach
plan
e. T
he g
eom
etry
of e
ach
plan
e w
as u
sed
to c
alcu
late
the
Ti
plan
ar d
ensi
ty a
nd su
rfac
e O
H d
ensi
ty.
66

BaTiO3 generated using Atoms for Windows©. Each figure shows the position and
coordination of the Ti in each of the three planes. Table 3.1 is a tabulation of the Ti site
density for each plane and more important the surface hydroxide concentration for each
plane. The Ti surface sites are energetically unstable and at the high pH during synthesis
will be terminated by hydroxyl groups. Surface Ti on the (100) plane are coordinated by
five oxygen while Ti on the (111) surface are only coordinated by three oxygen.
Therefore each surface Ti on the (100) plane will only be able to react with one hydroxyl
group while Ti on the (111) surface can react with three hydroxyl groups resulting in a
increase hydroxide concentration for the (111) plane. Lencka and Riman22 showed that,
at greater than pH 4, Ti(OH)4(aq) is the stable Ti species during the hydrothermal synthesis
of BaTiO3 and that synthesis is a competition between BaTiO3 and Ti(OH)4(aq) formation.
During hydrothermal synthesis, it is speculated that the growth of any new layer a
competition between BaTiO3 and Ti(OH)x(surf) growth. Under these assumptions, the
crystal plane with the highest hydroxide concentration should be the stable facet, which is
the (111) plane. Observations in the hydrothermal synthesis of BaTiO3 by Zhao at pH 14
support these conclusions.14
(111) twin formation during BaTiO3 synthesis is well-known with an example
being “butterfly’ twins observed in BaTiO3 synthesized by the Remeika method.23
“Butterfly” twins are specific twins where the twin plane is the (111) plane with the (100)
plane being the stable crystal habit. In BaTiO3 (which posses a high-temperature
hexagonal phase) (111) twin can be envisioned as a stack fault of hexagonal phase.
Nielsen et al. theorized that the ease of stacking fault formation is the cause of (111)
twinning in BaTiO3.24 With the high likelihood of (111) twin formation and the limited
67

Pla
neTi
/nm
2S
urfa
ce O
H/n
m2
(100
)6.
256.
25(1
10)
4.40
8.80
(111
)3.
6010
.80
Tab
le 3
.1.
Plan
ar d
ensi
ty o
f Ti a
nd su
rfac
e hy
drox
ide
for l
ow in
dex
plan
es in
cub
ic B
aTiO
3(a
= 4
Å).
68

growth in the [111] direction during hydrothermal synthesis crystals with (111) twins and
(111) specific habit are expected. A TEM investigation should be conducted to look for
the presence of (111) twins.
3.3.2 Characterization of Physical Properties
The physical properties of the platelet BaTiO3 was characterized in addition to
two commercial hydrothermal powders to provide standards. Table 3.2 is a comparison
of the physical properties of the uncalcined platelet BaTiO3 and the two commercial as-
received powders. All of the powders have BET surface areas greater than 10 m2/g
which yield equivalent spherical diameters of less than 100 nm. The presence of the
pseudo-cubic perovskite phase in all of the powders indicates that hydrothermal defects
are present in the particles. Figure 3.8 is a TGA curve for the three powders heated to
1000 °C. The platelet BaTiO3 powder experiences two weight losses, in the ranges of
300 to 500 °C and 600 to 800 °C. The first weight loss is only 0.5 wt% and is due to
hydrothermal defects25, whereas, the higher temperature weight loss is due to BaCO3.26
Both commercial powders exhibit similar weight loss characteristics however each has a
higher concentration of hydroxide in the lattice; commercial powder A has 1.62wt% loss
and the commercial powder B has 0.75wt% loss. Hydrothermal defects should be
minimized because of intragranular pore formation during sintering.25 Hennings et al.
developed a defect chemistry model for undoped BaTiO3 based on pycnometery and X-
ray density calculations.25 Charge irregularities due to hydroxide defects in the lattice are
compensated by Ba and Ti vacancies. Upon heating, defects coalesce to form
intragranular pores. The presence of pores in the final fired microstructure degrades the
69

Pow
der
Sur
face
Are
a (m
2 /g)
OH
Def
ect C
once
ntra
tion
(wt%
)D
ensi
ty (g
/cm
3 )B
a/Ti
by
XRF
Pha
se b
y XR
DS
hape
Asp
ect R
atio
Pla
tele
t10
.5 ±
0.3
90.
505.
87 ±
0.0
21.
006 ±
0.00
05P
seud
o-cu
bic
Pla
tele
t4.
7P
owde
r A11
.9 ±
0.6
61.
625.
66 ±
0.0
41.
003 ±
0.00
03P
seud
o-cu
bic
Sph
eric
al
1P
owde
r B15
.6 ±
0.0
90.
755.
81 ±
0.03
0.98
9 ±
0.00
07P
seud
o-cu
bic
Sph
eric
al1
Tab
le 3
.2.P
hysi
cal p
rope
rties
of p
late
let,
com
mer
cial
pow
der A
, and
com
mer
cial
pow
der B
hyd
roth
erm
ally
der
ived
BaT
iO3
pow
ders
.
Not
e: T
he e
rror
bar
s pre
sent
repr
esen
t 95%
con
fiden
ce in
terv
al fo
r an
aver
age
of 3
or m
ore
mea
sure
men
tsX
RF
used
to d
eter
min
e B
a/Ti
ratio
(mea
sure
men
t cou
rtesy
of F
erro
Cor
p.)
70

Figu
re 3
.8.
Wei
ght l
oss c
urve
for p
late
let,
com
mer
cial
pow
der A
, and
com
mer
cial
pow
der B
. Th
e w
eigh
t los
s fro
m 3
00 to
500
°C
is d
ue to
the
rem
oval
of h
ydro
xyl d
efec
ts, w
here
as t
he w
eigh
t los
s at h
ighe
r tem
pera
ture
s is t
he re
mov
al o
f BaC
O3.
71

electrical properties. The density measurements correlate well with the TGA results and
suggest that the plate-like particles will develop homogenous dense microstructures.
XRF analysis of the BaTiO3 shows that the platelet BaTiO3 has a Ba/Ti ratio of
1.006 ± 0.0005. Excess barium is potentially problematic for further processing.
Stoichiometric BaTiO3 has limited solubility for excess barium. At the current Ba/Ti
ratio, a moderate amount of Ba2TiO4 is possible upon heat treatment. Ba2TiO4 has been
shown to form as inclusions in BaTiO3 grains and is detrimental to the density and
dielectric properties.27
3.3.3 Morphological Evolution as a Function of Temperature
To investigate the stability of the plate-like morphology of the particles the
material was thermally treated and the particles were characterized. Figure 3.9 shows the
TGA and derivative curve for the platelet powder samples. There are four observed
reactions occurring at 350, 425, 660, and 760 °C. Based on the four reactions, the
powder samples were thermally treated at 375, 450, 700, and 800 °C to investigate the
effect of the weight loss reactions on the structure and morphology of the particles.
Samples were also thermally treated at 900, 1000, and 1100 °C to determine the onset of
sintering and morphological change. Figure 3.10a-h is a series of TEM images of the
thermally treated powder samples.
By 375 °C (Figure 3.10a) the hydrothermal defects in the powder have coalesced
and appear as 10 nm equiaxed defects in the interior of the particles. This is similar to
the observations of Hennings et al. in which point defects in the lattice coalesce to form
defects which were observable up to temperatures of 800 °C.25 The defects are removed
by 1000 °C (Figure 3.10g). The increased temperature compared to Hennings et al.
72

Figu
re 3
.9.
Wei
ght l
oss a
nd d
eriv
ativ
e cu
rve
for p
late
let p
owde
r sho
ws t
he p
rese
nce
of fo
ur re
actio
ns o
ccur
ring
at 3
50, 4
25, 6
60,
and
760
ºC.
73

Figu
re 3
.10a
-h.
Serie
s of T
EM im
ages
show
ing
the
mor
phol
ogic
al e
volu
tion
of th
e pl
atel
et p
artic
les a
s a fu
nctio
n of
tem
pera
ture
: (a
) 25
ºC –
as-s
ynth
esiz
ed, (
b) 3
75 ºC
, (c)
450
ºC, (
d) 7
00 ºC
, (e)
800
ºC, (
f) 9
00 ºC
, (g)
100
0 ºC
, and
(h) 1
100
ºC.
Nec
k fo
rmat
ion
is o
bser
vabl
e at
800
ºC w
ith m
orph
olog
ical
cha
nges
occ
urrin
g by
900
ºC.
At 3
75 ºC
hyd
roth
erm
al d
efec
ts h
ave
begu
n to
coa
lesc
e an
d ar
e no
t rem
oved
unt
il 10
00 ºC
.
74

75

observations is explained by the high heating rate (10°C/min) and the lack of any dwell in
the thermally treated samples.
Solid bridging and the onset of sintering is seen in samples heated to 800 °C
(Figure 3.10e). Changes in the morphology beings by 900 °C (Figure 3.10f) observed by
the loss of well-faceted particles and the rounding of the particles to a more equiaxed
morphology. Complete loss of morphology occurs by 1000 °C (Figure 3.10g). The loss
of morphology at low temperatures (900-1000 °C) suggests that the development of a
texture microstructure would be difficult using conventional sintering. The present
results are for loose powder samples. However, if a consolidation technique which
results in a textured green microstructure was used in combination with a novel multi-
step sintering approach, similar to those proposed by Polotai et al.28 and Chen and
Wang29, a textured fired microstructure could possibly be obtained. The multi-step
sintering approaches use a low temperature isothermal final step to eliminate pores
without grain growth. If the final step were below 1000 °C it is possible that sintering
with limited morphological change could be obtained.
3.4 Conclusions
Nanotabular BaTiO3 particles were synthesized using a hydrothermal route. The
particles are single crystal with a majority having a [111] zone axis, and have a median
thickness of 5.8 ± 3.1 nm and a face diameter of 27.1 ± 12.3 nm, as determine by atomic
force microscopy. Morphology of the particles was shown to be controlled solely by pH
of the solution during synthesis. It is speculated that the high solution pH stabilizes the
{111} face limiting growth in the <111> direction and leading to multiple {111} twin
76
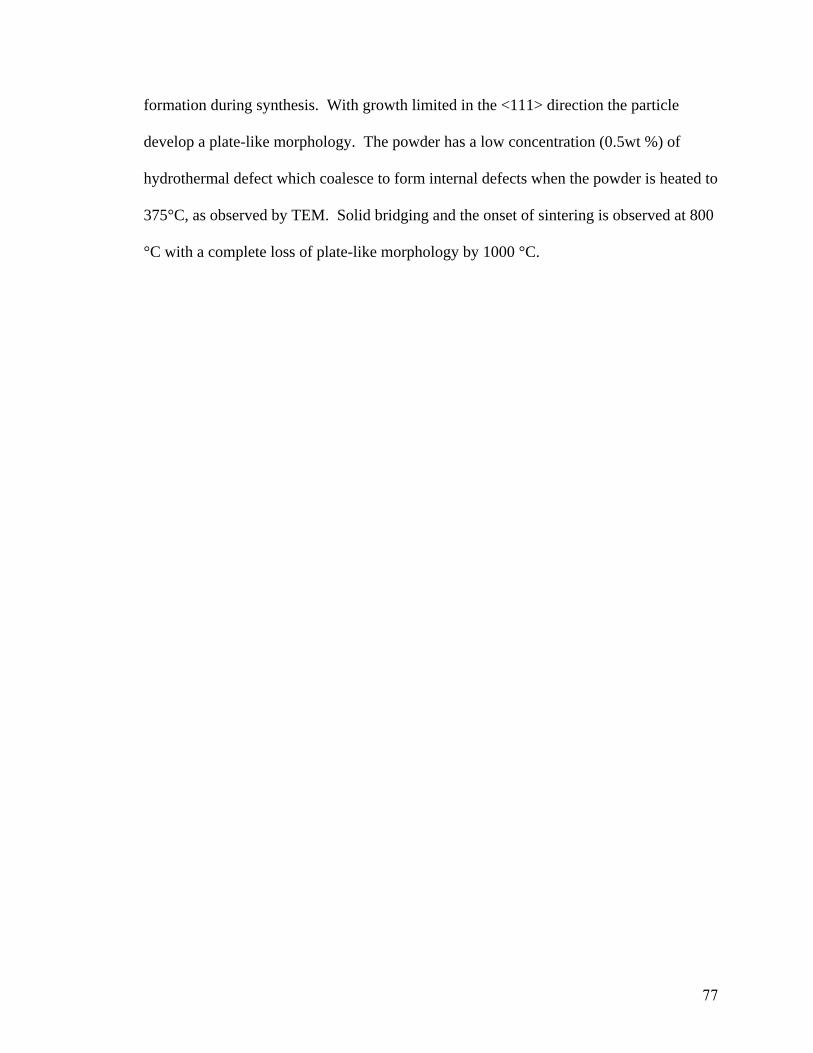
formation during synthesis. With growth limited in the <111> direction the particle
develop a plate-like morphology. The powder has a low concentration (0.5wt %) of
hydrothermal defect which coalesce to form internal defects when the powder is heated to
375°C, as observed by TEM. Solid bridging and the onset of sintering is observed at 800
°C with a complete loss of plate-like morphology by 1000 °C.
77

References
1. A.J. Moulson and J.M. Herbert, Electroceramics: Materials, properties, applications, 1st ed. (Chapman & Hall, London, 1990). 2. D.F.K. Hennings, B.S. Schreinemacher, and H. Schreinemacher: Solid-state preparation of BaTiO3-based dielectrics, using ultrafine raw materials. J. Am. Ceram. Soc. 84, (12), 2777 (2001). 3. R.A. Kimel, V. Ganine, and J.H. Adair: Double injection synthesis and dispersion of submicrometer barium titanyl oxalate tetrahydrate. J. Am. Ceram. Soc. 84, (5), 1172 (2001). 4. S. Wada, T. Tsurumi, H. Chikamori, T. Noma, and T. Suzuki: Preparation of nm-sized BaTiO3 crystallites by a LTDS method using a highly concentrated aqueous solution. J. Cryst. Grow. 229, (1), 433 (2001). 5. B.K. Kim, D.Y. Lim, R.E. Riman, J.S. Nho, and S.B. Cho: A new glycothermal process for barium titanate nanoparticle synthesis. J. Am. Ceram. Soc. 86, (10), 1793 (2003). 6. H. Kamiya, K. Gomi, Y. Iida, K. Tanaka, T. Yoshiyasu, and T. Kakiuchi: Preparation of highly dispersed ultrafine barium titanate powder by using mircobial-derived surfactant. J. Am. Ceram. Soc. 86, (12), 2011 (2003). 7. P. Gherardi and E. Matijevic: Homogenous precipitation of spherical colloidal barium titanate particles. Colloid Surface 32, (3-4), 257 (1988). 8. J.H. Adair and E. Suvaci: Submicron electroceramic powder by hydrothermal synthesis. In Encyclopedia of Materials: Science and Technology, edited by K.H.J. Buschow, R.W. Cahn, M.C. Flemings, B. Ilschner, E.J. Kramer, and S. Mahajan, (Elsevier Science Ltd., 2001) pp 8933. 9. D.O. Yener, T.J. Yosenick, C.A. Randall, and J.H. Adair: Synthesis of nanosized Ag/Pd platelets in self-assembled bilayers, and thin film metallization by electrophoretic depositions. To be submitted, (2005). 10. D.O. Yener, A.H. Carim, and J.H. Adair: submitted to J. Phys. Chem., (2004). 11. J. Moon, M.L. Carasso, H.G. Krurup, J.A. Kerchner, and J.H. Adair: Particle-shape control and formation mechanisms of hydrothermally derived lead titanate. J. Mater. Res. 14, (3), 866 (1999). 12. S.B. Cho, M. Oledzka, and R.E. Riman: Hydrothermal synthesis of acicular lead zirconate titanate (PZT). J. Cryst. Grow. 226, (2-3), 313 (2001).
78

13. R.B. Bagwell, J. Sindel, and W. Sigmund: Morphological evolution of barium titanate synthesized in water in the presence of polymeric species. J. Mater. Res. 14, (5), 1844 (1999). 14. L. Zhao, A.T. Chen, F.F. Lange, and J.S. Speck: Microstructural development of BaTiO3 powders synthesized by aqueous methods. J. Mater. Res. 11, (6), 1325 (1996). 15. D.V. Miller: Synthesis and properties of barium titanate nanocomposites. Ph.D. Thesis, The Pennsylvania State University, University Park, PA, (1991). 16. D.F.K. Hennings and S. Schreinemacher: Characterization of hydrothermal barium titanate. J. Euro. Ceram. Soc. 9, 41 (1992). 17. Y. Yuan, T.J. Yosenick, and J.H. Adair: Unpublished results. (2004). 18. K.M. Hung, W.D. Yang, and C.C. Huang: Preparation of nanometer-sized barium titanate powders by a sol-precipitation process with surfactants. J. Euro. Ceram. Soc. 23, 1901 (2003). 19. H. Schmelz and H. Thomann: Twinning in BaTiO3 ceramics. Ceram. For. Intern. 61, 199 (1984). 20. P. Hartman and W.G. Perdok: On the relations between structure and morphology of crystals. Acta. Cryst. 8, 49 (1955). 21. T. Tani, Z. Xu, and D. Payne, Thin Ferroelectric Films III, edited by E. Meyers, B.A. Tuttle, S.B. Desu, and P.K. Lauser (in Mater. Res. Soc. Symp. Proc., 310,Pittsburgh, PA, 1993), pp 269. 22. M.M. Lencka and R.E. Riman: Thermodynamic modeling of hydrothermal synthesis of ceramic powders. Chem. Mater. 5, (1), 61 (1993). 23. J.P. Remeika: Method of growth barium titanate single crystals. J. Am. Ceram. Soc. 76, 940 (1954). 24. J.W. Nielsen, R.C. Linares, and S.E. Koonce: Genesis of the barium titanate butterfly twin. J. Am. Ceram. Soc. 45, (1), 12 (1962). 25. D.F.K. Hennings, C. Metzmacher, and B.S. Schreinemacher: Defect chemistry and microstructure of hydrothermal barium titanate. J. Am. Ceram. Soc. 84, (1), 179 (2001). 26. S.W.L. Lu, B.I. Lee, and L.A. Mann: Carbonation of barium titanate powders studied by FT-IR technique. Mater. Lett. 43, 102 (2000). 27. J.K. Lee, K.S. Hong, and J.W. Jang: Roles of Ba/Ti ratios in the dielectric properties of BaTiO3 ceramics. J. Am. Ceram. Soc. 84, (9), 2001 (2001).
79

28. A.V. Polotai, K. Breece, E. Dickey, C.A. Randall, and A.V. Ragulya: A novel approach to sintering nanocrystalline barium titanate ceramics. J. Am. Ceram. Soc. 88, (11), 3008 (2005). 29. I.W. Chen and X.H. Wang: Sintering dense nanocrystalline ceramics without final-stage grain growth. Nature 404, 168 (2000).
80

CHAPTER FOUR
Aqueous Surface Chemistry of Hydrothermally Derived BaTiO3 Nanoparticles
4.1 Introduction
Barium titanate is a complex metal oxide consisting of two chemically differing
end members; a relatively insoluble acidic TiO2 and a highly soluble basic BaO. The
nature of BaTiO3 complicates the interfacial chemistry. Figure 4.1 gives the ideal
stability fields for the BaTiO3-H2O-CO2 system in an aqueous environment,1, 2 and a
TEM image of a BaTiO3 particle allowed to equilibrate in aqueous suspension at pH 6.5.
The stability of BaTiO3 is highly pH dependent. As pH decreases, the solubility of the
Ba2+ is dramatically increased. This large change in solubility is not observed in the
dissolution of Ti from the BaTiO3 surface.3 Thus, the BaTiO3 surface dissolves
incongruently, yielding a Ti-rich surface layer.4, 5 The TEM image shows the amorphous
TiO2 surface of the Ba2+ depleted BaTiO3 surface. The presence of the Ti-rich surface is
an issue because during sintering, local Ti-rich regions act to form low temperature
melting phases and promote exaggerated grain growth.6
Figure 4.1 shows that in addition to Ba2+ dissolution, the formation of BaCO3 is
also a concern. CO2 in the atmosphere readily dissolves into water, and at neutral pH
where Ba2+ dissolves from the surface, BaCO3 can form.7, 8 During sintering the high
temperature (>1200°C) decomposition of BaCO3 can lead to decreased density because
of CO2 gas evolution in closed pores.9 The gas exerts a negative sintering pressure which
inhibits and eventually reverses the sintering process. Because of the deleterious effects
81

Figu
re 4
.1.
Idea
l sol
ubili
ty d
iagr
am fo
r BaT
iO3-
H2O
-CO
2sy
stem
from
Ben
dale
et a
l.2B
a2+di
ssol
utio
n is
favo
red
at lo
w p
H.
As
pH in
crea
ses,
Ba2+
solu
bilit
y de
crea
ses u
ntil
the
prec
ipita
tion
of B
aCO
3is
favo
red.
The
TEM
imag
e of
a B
aTiO
3pa
rticl
e tre
ated
in
wat
er a
t pH
6.5
show
s the
pre
senc
e of
an
amor
phou
s TiO
2su
rfac
e la
yer.
Ba2+
depl
eted
am
orph
ous
TiO
2S
urfa
ce
82

of Ba2+ dissolution and BaCO3 formation it is important to understand the changes in the
interfacial chemistry of BaTiO3 as function of solution pH, such that processing methods
can be developed to overcome aforementioned issues.
Current developments in the synthesis of BaTiO3 have resulted in better
morphological control during synthesis; BaTiO3 wires10, tubes11, hexapods12 and
platelets13 have all been recently reported. Each particle morphology exhibits a specific
crystallographic surface habit. The effect of surface crystal habit on zeta potential and
point of zero charge (PZC) has been extensively studied in TiO2 materials.14-19 These
studies verify that particle morphology contributes to the surface chemistry and
electrokinetic properties of these new BaTiO3 particles. In addition to instability of the
BaTiO3 surface in aqueous environments, an understanding of the surface chemistry of
anisotropic BaTiO3 materials and its affects on the dispersion, and downstream
processing is needed because of the advantages that these new BaTiO3 particles are
expected to exhibit toward the manufacturing of electronic components.
There are four objectives in the current study: (1) to describe the surface
chemistry of BaTiO3 using the MUSIC model as a function of the crystal structure and
morphology, (2) use dissolution data to determine the concentration of Ba2+ in solution as
a function of pH and surface area (3) to account for the adsorption of Ba2+ using a
modified Stern isotherm, and (4) the precipitation of BaCO3 on the BaTiO3 surface.
83

4.2 Experimental Observations of BaTiO3 Surface Charging in an Aqueous
Environment
Extensive studies have shown that the interfacial chemistry of BaTiO3 is highly
dependent on the solution pH and the suspension solid loading.4, 5, 20, 21 Theories have
been presented to explain the experimental observations which have been limited to
descriptions of the surface in specific pH ranges.
4.2.1 Acidic pH – Amorphous TiO2 Surface
The instability of the BaTiO3 in an aqueous environment is well-documented. 4, 5,
20, 21 Several studies have shown that in acidic environments that Ba2+ dissolves from the
surface and resides in the solution phase of aqueous suspensions. The TEM image in
Figure 4.1 shows the presence of an amorphous surface layer on a Ba2+ depleted BaTiO3
particle. Blanco-Lopez et al.4 theorized that since rutile is the thermodynamically stable
form of TiO2 under the acidic conditions that the BaTiO3 surface should act “TiO2-like”.
Paik et al.5 experimentally observed that below pH 5 suspensions of BaTiO3 behave
similar to rutile suspensions.
Since the BaTiO3 particle surface is similar to TiO2 in acidic environments it is
possible to use models present in the literature to describe the surface charge of BaTiO3
in acidic environments. The multisite complexation (MUSIC) model is the most
developed of the models and accounts for the crystal chemistry of the material in the
determination of the surface sites that provide surface charging in solution.14, 15 The
MUSIC approach provides a good starting point to investigate the surface chemistry of
BaTiO3 because of the approach has been widely use to describe one of end member of
the BaTiO3 solid solution, TiO2.
84

The MUSIC model was developed and refined by Hiemstra et al.14, 15 and
Machesky et al.22 and is based on the assumption that the oxygen coordination at the
surface is different from that of the lattice. The difference in coordination affects the
valence of the oxygen at the surface and the resulting reaction with protons that produce
surface charge. Each broken surface oxygen-cation bond has a valence defined by
Pauling, who stated that the charge of the centrally coordinated oxygen is distributed
equally over all of the neighboring cations.23 The bond valence is calculated using the
following equation,
CNzv = [4.1]
where z is the charge of oxygen and CN is the oxygen’s coordination number. For
example, in TiO2, O has a valence of 2- and is coordinated by 3 Ti leading to an average
bond valence of 2/3- for each O-Ti bond.
Pauling’s bond valence23 model assumes that the oxygen valence is equally
shared among all of the coordinated bonds. Actually, the bond valences are dependent on
the bond length. For materials with anisotropic crystal structures the difference in bond
valence is important. Several approaches have been used to calculate the difference in
bond valence due to the crystal structure.18, 22 Once the surface site valence is known the
reaction of the surface groups with the solvent are determined. One common approach,
used by Fedkin18, is to use a periodic density method to generate an ideal surface which is
allowed to relax. After the relaxation, the new bond lengths are measured and the new
bond valence is calculated.
The primary limitation of the MUSIC model to describe the behavior of a multi-
component metal oxide is the inability to account for the presence of specific adsorbates
85

or other phases that may be present. In fact, the surface chemistry of BaTiO3 in an
aqueous environment is controlled by the dissolution and specific adsorption of Ba2+ at
low to moderate solution pH (pH < 9).21, 24 The dissolution of Ba2+ would not be a
problem in the modeling of the surface chemistry if the dissolved barium remained in
solution. Resulting in the surface behaving similar to a TiO2 surface.21 However, the
barium does not remain in solution, but in fact specifically absorbs onto the surface.5, 25
Therefore the use of MUSIC model is limited to acidic environments in the description of
the BaTiO3 surface.
4.2.2 Neutral pH – Ba2+ Adsorption
Several researchers have noted the zeta potential and isoelectric point (IEP) of
aqueous BaTiO3 suspensions are dependent on the solid loading and surface area of the
powder.5, 20 The changes in the magnitude of the zeta potential and shift in the IEP were
attributed to the dissolution/adsorption of Ba2+(aq) at the particle surface. This led to the
hypothesis that at intermediate suspension pH the BaTiO3 surface behaves as a TiO2
surface that specifically adsorbs Ba2+(aq).
Malati and Smith26 and Fuerstenau and co-workers27, 28 studied the adsorption of
alkaline earth cations, including Ba2+(aq), on TiO2. Malati and Smith26 studied the
adsorption of Ba2+(aq) on both rutile and anatase at pH 7 and found that adsorption
followed a Langmuir-type isotherm at solution pH values greater than the PZC of the
surface. Jang and Fuerstenau28 performed a more detailed study of the adsorption onto
the surface of rutile. The adsorption of Ba2+(aq) was consistent with a modified Stern
adsorption isotherm. Jang and Fuerstenau confirmed that Ba2+(aq) adsorption was
negligible below the PZC of the surface.
86

Jang and Fuerstenau used electrokinetic and potentiometric titrations to perform a
detailed study of the adsorption of Ba2+ on the surfaces of rutile. Two models were
proposed for the adsorption of Ba2+ at the TiO2 surface: (1) a monodentate complex
where a Ba2+ reacts with a single TiOH(surf) group according to the following reaction,
TiOH(surf) + Ba2+ TiOBa+(surf) + H+ [4.2]
Or, (2) a bidentate complex where a Ba2+ reacts with two TiOH surface groups,
2TiOH + Ba2+ (TiO)2Ba + 2H+ [4.3]
By measuring the ratio of protons released from the surface for each Ba2+ and modeling
the adsorption density as a function of pH it was shown that the bidentate complex is the
predominant adsorption mechanism.
In describing Ba2+ adsorption, Jang and Fuerstenau found that the Stern isotherm
was not valid. A Stern isotherm is a modified Langmuir isotherm that assumes each
adsorption site has a charge equal to the valence of the adsorption ion. One assumption
of the Langmuir isotherm is that the probability of site occupancy is equivalent for all
sites regardless of adsorption density (i.e. that nearest neighbor interactions do not affect
the adsorption of subsequent adsorbates). For adsorption due to electrostatic attraction
this assumption is not valid.29 Levine et al. modified the Stern isotherm to permit for
increased electrostatic repulsion as adsorption density increases.29 In describing Ba2+
adsorption on a rutile surface Jang and Fuerstenau used the Levine modification of the
Stern isotherm.
4.2.3 Basic pH – BaCO3 Formation
In alkaline environments the dissolution of Ba2+ from BaTiO3 is minimal, but the
precipitation of BaCO3 becomes an issue, as shown in Figure 4.1. Above pH 13, BaCO3
87

is the stable phase of Ba with the onset of precipitation depending on the concentration of
total CO2 species in solution. Several studies have shown that BaCO3 readily forms on
the surface of BaTiO3 at high solution pH in aqueous environments.30-34 Thus, the
electrokinetic properties of BaTiO3 in water also dependent on the presence of BaCO3.35
Describing the aqueous surface chemistry of BaTiO3 it is necessary to accommodate for
the dissolution and subsequent adsorption of barium as well as the formation of BaCO3
on the particle surface at elevated pH conditions
The surface chemistry of BaCO3 is controlled by a Nernst-Gouy-Stern mechanism
with the potential determining ions (PDIs) for the system being Ba2+(aq) and CO3
2-(aq).35, 36
In an aqueous solution, if no atmospheric control is maintained, the total dissolved
carbonate concentration is fixed by the ambient pCO2 of the surrounding environment,
and unlike the concentration of Ba2+, is independent of solution pH. With a fixed
carbonate concentration, the charging of the surface primarily depends on the change in
barium concentration as a function of solution pH.
4.3 Materials and Methods Suspensions of a commercially available hydrothermally derived powder (BT-08,
Cabot Performance Materials, Boyertown, PA) were prepared in DI water at four solid
loadings, 0.5, 2, 6, and 20 weight percent (wt%) (40, 160, 480, 1600 m2/L). Solution pH
was adjusted using 0.1 or 0.01 M solutions of nitric acid (70wt%, Fisher Scientific, Fair
Lawn, NJ) or tetraethylammonium hydroxide (TEAOH) (35wt% in water, Aldrich
Chemical Company, Milwaukee, WI) prior to adding the powder. The suspensions were
allowed to equilibrate for 24 hours. Electrophoretic mobility of the suspension was
measured using electrophoretic light scattering (ZetaPALS, Brookhaven Instrument Corp,
88

Holtsville, NY). The suspensions were centrifuged and the supernatant passed through a
0.22 μm filter. The filtered supernatants were analyzed for dissolved Ba and Ti using
indirectly coupled plasma atomic emission spectroscopy (ICP-AES) (PS3000UV,
Leeman Labs, Los Angles, CA) Standards were prepared by serial dilution from 1000
ppm stock solutions (Hi Purity Standard, Charleston, SC).
The zeta potential of 1wt% suspensions of two different BaTiO3 powders, an
anisotropic, hydrothermal platelet powder synthesized using a procedure previously
described13, and a commercial hydrothermal equiaxed powder (BT-01, Sakai Chemical
Company, Osaka, Japan) were measured in a co-solvent of 95wt% ethanol and 5wt% DI
water (95/5 EW) using electrophoretic light scattering. The platelet powder has a median
face diameter of 27.1 ± 12.3 nm and a median thickness of 5.8 ± 3.1 nm with the (111)
plane as the large face. The spherical powder has a BET surface area of 11.9 m2/g and a
pycnometery density of 5.67g/cm3, yielding an equivalent spherical diameter of 88.9 nm.
The pH was measured using an ion-selective field effect transistor (IS-FET) pH probe
(Sentron Hotline Probe, RL Instruments, Manchoung, MA). The probe was calibrated
using aqueous-based NIST-traceable pH standard with nominal values of pH 4, 7, and 10.
The pH was adjusted to pH 3, 5, 7, 9, and 11 using 0.1 M and 1 M solutions of
hydrochloric acid (37%, J.T. Baker, Phillipsburg, NJ) and tetramethylammonium
hydroxide (TMAOH) (Aldrich Chemical Company, Milwaukee, WI) in 95/5 EW. The
pH values of the suspensions prepared in the 95/5 EW were corrected by subtracting the
residual junction potential present due to aqueous based calibration process. The value
for the residual junction potential (1.05 pH units) was obtained from Table 5.7 in
89

Popovych and Tomkins.37 The concentration of Ba and Ti in solution was analyzed using
ICP-ES.
Transmission electron microscopy (TEM) (2010F, JEOL, Japan) was used to
collect image of the Sakai BT-01 powder. TEM analysis was performed using holey
carbon film on Cu grids as sample holders with a single drop of dilute suspension on a
grid.
4.4 Results and Discussion
4.4.1 Acidic pH – Amorphous TiO2 Surface
4.4.1.1 Determination of BaTiO3 Surface Groups
When a metal oxide is present in aqueous suspension the surface of the material is
fully hydrated.38 In the MUSIC model the chemical reactions that provide surface charge
are based on the reactivity of the surface hydroxides, which are anchored at the oxygen
surface sites on the material. The valence and number of orbitals available for proton
uptake therefore are determined by the change of cation coordination of the surface
oxygen compared to oxygen in the lattice. To apply the MUSIC model to any surface it
is first necessary to determine the structure and cation coordination of the lattice and
surface oxygen.
Because TiO2 has been extensively modeled and is a component of the BaTiO3
solid solution TiO2 is a first approximation to use in the modeling of the BaTiO3 surface.
The two polymorphic forms of TiO2, rutile and anatase, are based on building blocks of
TiO6 octahedra that share edges and faces. This results in lattice oxygen being
coordinated by three Ti. In the analysis of the rutile and anatase surfaces Hiemstra et al.
90

identified three surface oxygen sites that are singly (OI(a)), doubly (OII
(a)), or triply (OIII(a))
coordinated with Ti, which have the ability to react with two, one, or zero protons,
respectively.15 In the notation the superscript numerals denote the Ti coordination of the
surface oxygen while the subscript character is included to differentiate between oxygen
surface sites based on the crystal structure of TiO2 and BaTiO3, which will be discussed
later. The ability to react with protons is related to the difference in Ti coordination of
the oxygen on the surface compared to oxygen in the lattice. Missing Ti on the surface
are compensated by the adsorption of protons from solution. Oxygen in the lattice of
rutile and anatase are coordinated by three Ti. Because of this, the three possible surface
groups on rutile and anatase can be viewed as two, one, or zero Ti deficient, where the Ti
deficiency is equal to the number of protons available for uptake by the surface group.
BaTiO3 is also based on TiO6 octahedra which share corners. This difference in
the crystal structure leads to a decrease in Ti coordination from three to two for lattice
oxygen in BaTiO3. The change in Ti coordination leads to singly (OI(b)) and doubly
(OII(b)) coordinated oxygen surface sites. The primary difference between TiO2 and
BaTiO3 is the presence of the basic BaO end member. However, as noted the dissolution
of Ba2+ at low pH leads to a TiO2 surface and therefore it is not necessary to consider the
Ba coordination of the oxygen in the analysis.
To aid in the analysis of the platelet and equiaxed BaTiO3 the powders, it was
assumed that the local crystal structure is cubic and not tetragonal. Therefore it is not
necessary to calculate the difference in bond length of the different surface sites on
tetragonal BaTiO3 because of the simplifying assumption that all of the sites have equal
bond length. For materials in an aqueous solution the surfaces are fully hydrated and
91

surface relaxation occurs. The relaxation produces bond length changes that according to
the MUSIC model, changes the valence on the oxygen sites, and shift the pK value of the
specific site type. With the dissolution of Ba2+, the surface structure of BaTiO3 becomes
amorphous as shown in Figure 4.1. Without full characterization of the amorphous TiO2
surface it is not possible to fully determine the bond length changes. However, as an
approximation is was assumed that the bond length did not change due to the dissolution
of Ba2+. Only OI(b) and OII
(b) sites are expected from the BaTiO3 crystal structure, but to
account for possible relaxations due to Ba2+ dissolution the presence of OI(a), OII
(a), and
OIII(a) sites are included in the analysis.
Due to the presence of multiple surface sites on particle surfaces it is nearly
impossible to experimentally determine the pK value of any particular surface site. In
developing the MUSIC model Hiemstra derived an empirical equation to calculate the log
Kc,m of an arbitrary surface group15,
log K = -A(ΣSMe-O + mSH + n(1 - SH) + V) [4.4]
where A is a constant with a value 21.7, and is based on the linear regression of various
log K values of unconstrained (i.e. free in solution) protonation reactions22, ΣSMe-O is the
sum of bond valence (SMe-O) of the metal-oxygen bonds, SH is the bond valence for an
associated surface proton, m is equal to the number of orbitals available to coordinate to a
proton, and n is equal to the number of filled orbitals, and V is the valence of oxygen, 2-.
Due to hydrogen bonding of water molecules with the ionized surface group, the bond
valence of the hydrogen-oxygen bond is not equal to the charge on the proton. Hiemstra
et al. determined SH to be equal to 0.80.
92

Table 4.1 is a list of all possible surface groups, reactions, and theoretical log K
values, calculated using Equation 4.4, for a TiO2 surface on BaTiO3 predicted by the
MUSIC model. The chemical structure and protonation reactions of the surface groups
are included to illustrate the chemical change to the surface site as a function of solution
pH. Table 4.1 includes surface groups based on oxygen coordinated by 2 and 3 Ti for a
total of 19 possible surface reactions. However, the six reactions shown in bold typeface
are the only reactions that have pK vales in the normal pH range of pH 1-14, and are the
only reactions that were used in the modeling of surface charge development.
Of interest is the differences in the log K values for identical surface sites, for
example, OII(a) in Table 4.1 The difference arises from the number of possible adsorbed
protons for each site. For OII(a) if it is assumed only one proton can be adsorbed, log K
equals 10.2. However, if the adsorption of two protons is assumed, log K decreases to
5.9. Machesky et al. noted in the refinement of the MUSIC model that depending on
surface relaxations and nearest neighbor interactions that the number of possible proton
per site can change.22
4.4.1.2 Combination of MUSIC and Gouy-Chapman Models
The power of the MUSIC model lies in the ability to calculate the pK values for
several different surface reactions based solely on the crystallography of the material.
From the pK values it is possible to predict the PZC of the material. However, to
calculate the surface potential of the particle as a function of solution pH, it is necessary
to describe the diffuse part of the double layer using a Gouy39-Chapman40 model.
Healy and White developed the ionizable surface group model41 to describe
surface chemical reactions in the development of surface charge. The model assumes a
93

Tab
le 4
.1.
Poss
ible
surf
ace
grou
ps o
f Ba2+
depl
eted
BaT
iO3
in a
n ac
idic
env
ironm
ent w
ith th
e as
soci
ated
pro
tona
tion
reac
tions
an
d ca
lcul
ated
log
K v
alue
s. T
he r
eact
ions
in b
old
are
the
only
rea
ctio
ns th
at o
ccur
in th
e no
rmal
pH
ran
ge (1
-14)
and
thos
e us
ed in
the
calc
ulat
ion
of th
e su
rfac
e ch
arge
. P
rimar
y S
urfa
ce G
roup
Che
mic
al S
truct
ure
Pro
tona
tion
Rea
ctio
nΣ
SM
e-O
mn
log
K
OII
I (a)
...O
0...
O0 +
H+ →
...O
H+1
20
1-4
.3O
II (a)
...O
-2/3
...O
-2/3
+ H
+ → ..
.OH+1
/31.
330
110
.2O
II (a)
...O
H+1
/3...
OH
+1/3
+ H
+ →...
OH
2+4/3
1.33
10
-2.8
OII (a
)...
O-2
/3...
O-2
/3 +
H+ →
...O
H+1/3
1.33
02
5.9
OII (a
)...
OH
+1/3
...O
H+1
/3 +
H+ →
...O
H2+4
/31.
331
1-7
.2O
II (a)
...O
H2+4
/3...
OH
2+4/3
+ H
+ → ..
.OH
3+7/3
1.33
20
-20.
2O
I (a)
...O
-4/3
...O
-4/3
+ H
+ → ..
.OH
-1/3
0.66
02
20.4
OI (a
)...
OH
-1/3
...O
H-1
/3 +
H+ →
...O
H+2
/30.
661
17.
4O
I (a)
...O
H2+2
/3...
OH
2+2/3
+ H
+ → ..
.OH
+4/3
0.66
20
-5.6
OI (a
)...
O-4
/3...
O-4
/3 +
H+ →
...O
H-1
/30.
660
316
.1O
I (a)
...O
H-1
/3...
OH
-1/3
+ H
+ → ..
.OH
2+2/3
0.66
12
3.0
OI (a
)...
OH
2+2/3
...O
H2+2
/3 +
H+ →
...O
H3+5
/30.
662
1-1
0.0
OI (a
)...
OH
3+5/3
...O
H3+5
/3 +
H+ →
...O
H4+8
/30.
663
0-2
3.0
OII (b
)...
O0
...O
0 + H
+ → ..
.OH
+12
01
-4.3
OI (b
)...
O-1
...O
-1 +
H+ →
...O
H0
10
117
.4O
I (b)
...O
H0...
OH
0 + H
+ → ..
.OH
2+11
10
4.3
OI (b
)...
O-1
...O
-1 +
H+ →
...O
H01
02
13.0
OI (b
)...
OH
0...
OH
0 + H
+ →...
OH
2+11
11
0.0
OI (b
)...
OH
2+1...
OH
+1 +
H+ →
...O
H3+2
12
0-1
3.0
(a) a
nd (b
) den
ote
diffe
renc
e in
the
Ti c
oord
inat
ion
of th
e nu
etra
l sur
face
site
bas
ed o
n th
e cr
ysta
l stru
ctur
eS
hade
d re
gion
s de
note
a c
hang
e in
num
ber o
f ava
ilabl
e pr
oton
for u
ptak
e id
entic
al p
rimar
y su
rface
gro
upΣ
SM
e-O =
Bon
d va
lenc
e su
m o
f the
cat
ion-
oxyg
en b
onds
(SM
E-O
)m
= #
of o
rbita
ls a
vaila
ble
to u
ptak
e a
prot
onn
= #
of o
rbita
ls fi
ll w
ith a
pro
ton
3 Ti
Coo
rdin
ated
Oxy
gen
- TiO
2
2 Ti
Coo
rdin
ated
Oxy
gen
- B
aTiO
3
94

mass-action equation between surface sites with protons at the surface provided from the
solution. The dissociation constant of a surface site can be calculated using the law of
mass action for the general surface reaction,
AH(s) A-(s) + H+
(surf) [4.5]
][
][)(
AH
AaK surfH
eq
−+
= [4.6]
where aH+(surf) is the activity of a proton at the surface which is related to the activity of
the proton in the bulk solution via,41
)exp()( kTe
aa sHsurfH
ψ−= ++ [4.7]
where aH+ is the proton activity in the bulk solution, e is the charge on the electron, ψs the
surface charge, k is Boltzmann’s constant, and T is absolute temperature. Knowing the K
values and surface proton concentration it is possible to calculate the fraction (α) of
protonated and unprotonated surface sites by the following equations,
1][1
,, +
= +smc
mc HKα [4.8]
1][][
,
,1, += +
+
+smc
smcmc HK
HKα [4.9]
The value of α ranges from zero to one depending on solution pH.
The charge at the surface due to chemical reactions is counter balanced in the
solution by a Gouy-Chapman diffuse layer to maintain electroneutrality. This approach
has been used in the current work. The advantage of the ionizable surface group model is
that by relating the chemical reaction of the surface site with the solution chemistry,
mainly solution pH and related equilibrium, the surface potential can be calculated over a
95

pH range. A simplified algorithm and flow diagram for using the MUSIC model to
determine the surface potential as a function of solution pH is present in Appendix A.
From the log K values in Table 4.1 it is possible to calculate the α values for the
surface site of BaTiO3 using Equation 4.8. Figure 4.2 shows the α for the four different
TiO2 sites on the BaTiO3 surface. The plot shows the pH dependence of each site and
throughout the pH range from pH 0 to 14 what surface reaction controls the surface
chemistry of the material.
The presence of several surface sites necessitates a determination of the effect of
each site for a given surface. The surface charge density of any surface can be
represented by the superposition of the effect of all separate sites on the surface,
∑=n
imicisis zNe ,ασ [4.10]
where Nsi is the surface density of site type i, and zi is the valence of the site i.
Given the surface charge density the Gouy-Chapman model can be used. To
maintain electroneutrality, the surface charge density in the solution is equal and opposite
that of the surface change density,
σs = -σdl [4.11]
Because the solution is treated as a continuous dielectric with ions as point charges,
Poisson’s equation is the fundamental electrostatic equation governing the system,
r
dl
OS ε
πσπε
ψ4
412 ⋅⎟⎟
⎠
⎞⎜⎜⎝
⎛−=∇ [4.12]
Using the Debye-Hückel approximation42 that ψS ≤ 25 mV then Equation 4.18 simplifies
to a linear differential equation with σdl given by,
96
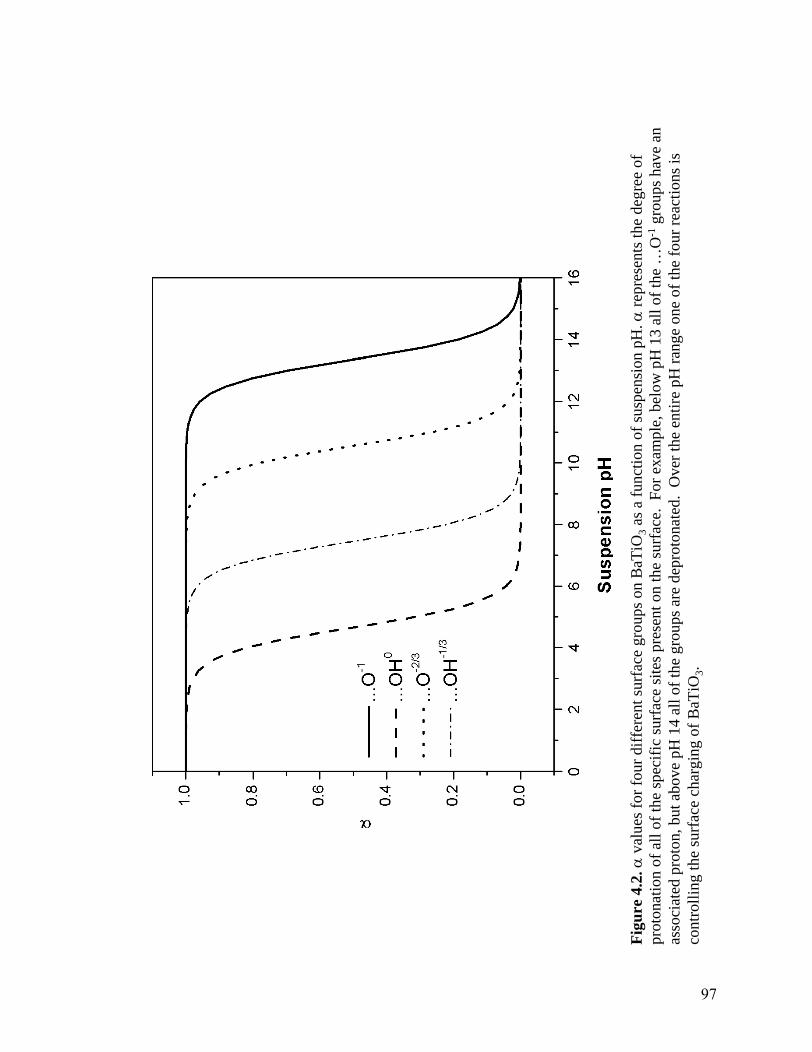
Figu
re 4
.2.α
valu
es fo
r fou
r diff
eren
t sur
face
gro
ups o
n B
aTiO
3as
a fu
nctio
n of
susp
ensi
on p
H. α
repr
esen
ts th
e de
gree
of
prot
onat
ion
of a
ll of
the
spec
ific
surf
ace
site
s pre
sent
on
the
surf
ace.
For
exa
mpl
e, b
elow
pH
13
all o
f the
…O
-1gr
oups
hav
e an
as
soci
ated
pro
ton,
but
abo
ve p
H 1
4 al
l of t
he g
roup
s are
dep
roto
nate
d. O
ver t
he e
ntire
pH
rang
e on
e of
the
four
reac
tions
is
cont
rolli
ng th
e su
rfac
e ch
argi
ng o
f BaT
iO3.
97

⎟⎠⎞
⎜⎝⎛−=
kTe
ekT sor
dl 2sinh
2ψ
πκεεσ [4.13]
with,
32
108 xkTIeN
or
A
εεπ
κ −= [4.14]
where εr is the dielectric permittivity of the solvent, εo is the permittivity of free space, k
is Boltzmann’s constant, T is absolute temperature, e is the charge on the electron, ψs is
the surface charge, NA is Avagadro’s number, and I is the ionic strength. 1/κ known as
the Debye length of the electrical double layer and is the distance from the Stern plane to
where the potential drops by a factor of 1/e.
Since both the surface and solution charge density are known the surface charge,
ψs, can be solved for. Combining Equations 4.10, 4.11, and 4.13 yields the following
expression,
⎟⎠⎞
⎜⎝⎛=∑ kT
eekTSNe so
n
imicisi 2
sinh2,
ψπκεεα [4.15]
The surface charge of the particle at a specific pH can be calculated by solving 4.15 using
the log K values derived from the MUSIC model to calculate the α values for each type
of surface group to create a self-consistent array of values for a given ψs value.
For uniquely shaped particles, the surface charge as a function of habit is required
to calculate the overall ψs value. Each crystallographic plane has a different combination
of site type and site density at the solid-solution interface and therefore will have a
unique surface charge. To account for the morphology of the particle the calculation of
the total particle surface charge is based on the fractional area of each plane present in
98

solution. Equation 4.15 can be solved for each specific plane present in solution. Then
the surface charge of the overall particle (ψtot) is a weighted sum of the surface charge of
the ith specific habit (ψh,i) and the area fraction (fh,i) of each plane present to solution:
∑=n
iihihtot f ,,ψψ [4.16]
4.4.2 Neutral pH – Ba2+ Adsorption
By combining an ionizable surface group model with a Gouy-Chapman diffuse
layer the intrinsic contribution from the native surface groups to surface charge and
potential can be described. However, previous research shows that the
dissolution/adsorption of Ba2+ influences the surface chemistry at moderate solution pH.
At low pH and solid loading it has been observed that the Ba2+ depleted surface of
BaTiO3 has electrokinetic properties similar to TiO2.21 As the pH increases the zeta
potential deviates from that of a TiO2 surface due to Ba2+ adsorption.5, 25 The similarities
of the specific absorption of Ba2+ on TiO2 therefore make it an ideal system to model the
depleted surface of BaTiO3 with reabsorbed Ba2+.
Malati and Smith found that near the PZC of rutile and anatase the adsorption of
Ba2+ followed a Langmuir isotherm26,
⎥⎦⎤
⎢⎣⎡ Δ−
=RTG
xnN abssii exp [4.17]
where Ni is the number of filled sites per area, ni is the number of possible surface sites
per area, xs is the mole fraction of adsorbate in solution, ΔGabs is the free energy of
absorption, R is the universal gas constant, and T is absolute temperature. The Stern
99

absorption isotherm is a modification to the Langmuir isotherm that is used to calculate
the surface charge density, σo,
io zeN=σ [4.18]
where z is the valence of the absorbate, and e is the charge on the electron.
The problem with the fundamental Stern isotherm is that as the adsorption density
(Ni) increases the energy required to fill the next site increases due to electrostatic
repulsion as surface sites are filled. Levin et al. modified the Stern isotherm to account
for electrostatic repulsion between a ion in the bulk and the surface29,
( )( ) ⎥⎦
⎤⎢⎣⎡ −Φ−
= − RTze
nzeNnfpzeN oo
op
i
poi
oψσ
σ exp1 [4.19]
where,
( )[ ]RTpHHpa PZCoB −′+−=Φ φ [4.20]
where ΦB is the adsorption potential, p is the number of surface sites occupied by one
adsorbed ion, n is the number of ions per volume in the bulk of solution, n
B
o is the number
of water molecules per volume, and f is the activity coefficient of the ions in the bulk
solution. ΦBB is a factor which accounts for the change in chemical potential between an
ion in the bulk and at the surface as the pH varies from the PZC. pH’PZC refers to the
PZC of the surface in the presence of the adsorbed ion, φo and a are constants dependent
on the ion adsorbing, and ψo is the surface potential, and equal to -15.3 and 1.6,
respectively. If p = 1 and f = 1, Equation 4.19 become the Stern isotherm.
Jang and Fuerstenau used Levin’s modified isotherm to model the adsorption of
Ba2+ onto a rutile surface. Because it was found that a bidentate complex is the mode of
100

adsorption for an alkaline-earth cation on rutile, p =2. Since the Ba2+ concentration is
low it was assumed that f = 1 and Equation 4.19 reduced to,
( ) ⎥⎦⎤
⎢⎣⎡ −Φ
=− RT
eaeN
eN ooM
oi
oi ψ
σ
σ 2exp
5.552 2 [4.21]
where aM is the activity of a cation in the bulk.
Fuerstenau and co-workers found the adsorption density (Γδ) of Ba2+ to be
dependent on solution pH, and follows the Stern-Grahame equation,27
⎥⎦⎤
⎢⎣⎡ Δ−
=ΓRTG
rc absexp2δ [4.22]
where r is the radius of the adsorbed hydrated ion, 1.35 x 10⁻⁸ cm, and c is the
concentration of adsorbate in solution. When the solution pH is less than the IEP of the
TiO2 surface adsorption was negligible. From the adsorption density (Figure 5 in Ref 28)
the free energy of adsorption, ΔGabs, was calculated using Equation 4.22. It is then
possible to calculate the surface charge density, σo, as a function of Ba2+ concentration
based on the dissolution of BaTiO3 and ΔGabs both of which are dependent on the
solution pH. Using Equation 4.19 ψo can then be calculated as a function of pH.
4.4.3 Basic pH – BaCO3 Formation
Thermodynamic calculations2, 3 and the literature30, 32, 34 shows that as solution pH
increases BaCO3 precipitation occurs. Several researchers have noted that BaCO3
precipitation occurs preferentially on the BaTiO3 particle surface. 30, 32, 34 This results in
the electrokinetic properties of BaTiO3 being similar to BaCO3 in alkaline environments.
The surface chemistry of BaCO3 is regulated by a Nernst-Gouy-Stern charging
101

mechanism where Ba2+ and CO32- are the PDIs.35, 36 The general surface reaction of
barium carbonate is,
BaCO3(s) CO32-
(s) + Ba2+(surf) [4.23]
with an equilibrium constant of,35
9
3
23
101.5][
][2−
−
==+
xBaCO
COaK surfBa
eq [4.24]
the activity of the surface Ba2+ is related to the bulk activity through,
]exp[][ 22
kTe
Baa sBasurf
ψ−= +
+ [4.25]
Similar to the TiO2 surface site reactions, the α values of the barium carbonate surface
can be calculated using Equation 4.18. The α value is a function of Ba2+, which is in turn
a function of pH due to the changing solubility of the BaTiO3. The α value can then be
input into Equation 4.21 and the surface charge of BaCO3 as a function of solution pH
calculated.
4.4.4 Comparison of Experimental Results and Theoretical Calculations
The surface potential and zeta potential of a surface are not equal due to strongly
adsorbed species inside the shear plane at the particle surface. The experimental results
are based on electrophoretic mobility experiments which measure the charge at the shear
plane and not the particle surface. The current theoretical calculations are based only on
the surface reactions and do not account for the presence of strongly adsorbed species
inside the shear plane. In the current model, there is a region, between the Stern plane
and solid surface, which is assumed not to affect the diffuse outer layer, which is known
be incorrect. In spite of this reservation the model can be used to predict the dependence
of the zeta potential on pH.
102

Prior to modeling the surface charge of BaTiO3 an empirical formula for the
dissolution of Ba2+ from the surface of BaTiO3 as a function of solution pH is required to
generally describe Ba2+(aq) concentration as a function of solution pH and solid loading.
Figure 4.3 shows the Ba2+(aq) concentration as a function of solution pH and solid loading
from Chodelka.43 An increase in Ba2+(aq) concentration with decreasing solution pH and
increasing surface area present in solution is observed. The data was normalized to the
surface area present in solution and plotted as a function of solution pH shown in Figure
4.4. Normalization to surface area collapses the soluble Ba2+(aq) as a function of solution
pH and solid loading over a common line. A good linear fit was obtained and used to
calculate the Ba2+(aq) concentration in solution as a function of solution pH in the
modeling of the surface chemistry of BaTiO3.
Figure 4.5 shows the experimental zeta potential values and theoretical
calculation of the surface charge for a suspension with a solid loading of 40 m2/L. There
are three distinct regions as a function of solution pH: Region I, pH <IEP of TiO2, Region
II, IEP TiO2 < pH < onset of BaCO3 precipitation, and Region III, pH > BaCO3
precipitation. Figure 4.6 is a schematic representation of the interactions at the solid-
solution interface at each region.
In Region I, below the IEP of TiO2, Ba2+ dissolution is thermodynamically
favored, but adsorption is limited due to the electrostatic repulsion between the positively
charged Ba2+(aq) and the TiO2 surface. Therefore the surface behaves as TiO2 and
analysis using the MUSIC model is applicable because only the intrinsic surface sites
based on the crystal chemistry control the surface charge of the material. In applying the
MUSIC model only the presence of OIII(a) and OII
(b) groups in a 1:1 ratio are required to
103

Figu
re 4
.3.D
isso
lutio
n da
ta fo
r aqu
eous
BaT
iO3
susp
ensi
ons w
ith in
crea
sing
solid
load
ings
. A
s exp
ecte
d, B
a2+di
ssol
utio
n is
m
inim
ized
at h
igh
pH a
nd in
crea
ses w
ith in
crea
sing
surf
ace
area
pre
sent
in su
spen
sion
. D
ata
from
Cho
delk
a.43
104

Figu
re 4
.4.
Dis
solu
tion
data
for B
aTiO
3as
func
tion
of so
lutio
n pH
nor
mal
ized
for s
urfa
ce a
rea
pres
ent i
n so
lutio
n. A
goo
d lin
ear
fit o
f the
obs
erve
d an
d th
e em
piric
al e
quat
ion
was
use
d to
det
erm
ine
the
conc
entra
tion
of d
isso
lved
Ba2+
in th
e m
odel
ing
of su
rfac
e ch
emis
try o
f BaT
iO3.
r2=
0.93
7
105

Figu
re 4
.5.
Zeta
pot
entia
l of a
queo
us B
aTiO
3su
spen
sion
(40
m2 /L
) sho
win
g th
e th
ree
diff
eren
t reg
ions
of s
urfa
ce c
harg
e in
B
aTiO
3. R
egio
n I c
ontro
lled
by a
nat
ive
TiO
2su
rfac
e. T
he in
crea
se in
Reg
ion
II is
due
to th
e ad
sorp
tion
ofB
a2+(a
q)on
to th
e su
rfac
e Ti
O2
surf
ace.
The
dec
reas
e in
Reg
ion
III i
s due
to p
reci
pita
tion
ofB
aCO
3on
the
BaT
iO3
surf
ace.
r2
= 0.
884
106

BaT
iO3
TiO
2
O
OH
O
Ba2+
Ba2+
BaT
iO3
TiO
2
OH2+
OH2+
OHB
a2+B
a2+
BaT
iO3
TiO
2
BaCO3
CO32-
BaCO3
Ba2+
CO
32-
Figu
re 4
.6.
Sche
mat
ic sh
owin
g th
e ev
olut
ion
of th
e su
rfac
e ch
argi
ng m
echa
nism
as a
func
tion
of so
lutio
n pH
for B
aTiO
3in
an
aque
ous e
nviro
nmen
t. A
t low
pH
Ba2+
diss
olut
ion
lead
s to
a Ti
O2
surf
ace.
As t
he p
H in
crea
ses B
a2+(a
q)re
adso
rptio
n re
sults
in a
de
viat
ion
from
an
idea
l TiO
2su
rfac
e. I
n a
basi
c en
viro
nmen
t the
pre
cipi
tatio
n of
BaC
O3
on th
e su
rfac
e co
ntro
ls th
e su
rfac
e ch
arge
.
pH 3
pH 1
1
Reg
ion
IR
egio
n II
Reg
ion
III
107

describe the surface potential in Region I. The OII(b) groups are expected from the crystal
chemistry of BaTiO3, however, the OIII(a) groups are only possible if a relaxation occurs
in which the TiO6 octahedra share edges or faces. This relaxation supports the concept
that the dissolution of Ba2+ results in a surface similar to rutile or anatase.
In Region II, the solution pH is above the IEP of TiO2 with electrostatic attraction
between the Ba2+(aq) and TiO2 resulting in adsorption of the Ba2+
(aq) onto the TiO2 surface.
The adsorption of Ba2+(aq) on the TiO2 can be described using the modified Stern isotherm
proposed by Levine et al.29 As solution pH continues to increase the Ba2+(aq)
concentration decreases yet the surface potential continues to increase. The free energy
of adsorption increases due to increase electrostatic attraction between the Ba2+(aq) and
TiO2 surface and overcomes the decrease Ba2+(aq) concentration. The surface potential in
Region II is a balance between the negative TiO2 surface and the influence of adsorbed
Ba2+(aq).
As solution pH increases to Region III, BaCO3 precipitation occurs and the
charging becomes dependent on the surface charging mechanism of BaCO3. BaCO3
develops surface charge via a Nernst-Gouy-Stern mechanism with Ba2+(aq) and CO3
2-(aq)
being the PDI. Therefore, as the Ba2+(aq) concentration continues to decease and the
surface charge becomes more negative.
To address the expected difference in surface chemistry due to differences in
morphology the zeta potential of an equiaxed and platelet powder was measured in a
solvent mixture, 95wt% ethanol/5wt% water (95/5 E/W). The solvent mixture was
chosen to limit Ba2+ dissolution and measure the intrinsic BaTiO3 surface reactions.
Table 4.2 is list of the ICP data for the dissolution of BaTiO3 in 95/5 E/W. Ba2+
108

Sol
utio
n pH
Pla
tele
t (p
pm)
Equ
iaxe
d (p
pm)
27
<.5
4<.
5<.
56
<.5
<.5
8<.
515
810
6566
123
N/A
Tab
le 4
.2.
ICP-
ES re
sults
for t
he d
isso
lutio
n of
Ba2+
in 9
5/5
etha
nol/w
ater
mix
ture
s. T
he d
ata
show
s tha
t dis
solu
tion
is li
mite
d un
til p
H 8
whe
n a
max
imum
con
cent
ratio
n of
10-3
M is
obs
erve
d. B
ecau
se o
f the
dis
solu
tion
it is
nec
essa
ry to
acc
ount
for t
he
adso
rptio
n of
Ba2+
(aq)
in m
odel
ing
the
surf
ace
char
ge in
the
solv
ent m
ixtu
re.
109

dissolution is limited except in alkaline environments, with concentrations limited to less
than 10-3 M. Prior to calculating the surface charge of either the platelet or equiaxed
particle, a determination the area fraction of each specific plane that bounds the particle is
required. For the platelet particles a right hand cylinder geometry was assumed with a
thickness of 5.8 nm and a face diameter of 27.1 nm. The thickness and diameter
dimensions are the medium values reported previously.13 The calculation yielded an area
fraction of 0.7 for the {111} plane. The remaining area fraction was equally distributed
between the {100} and {110} planes. For the determination of the surface structure of
the commercial particles, TEM images were collected. Figure 4.7a is a TEM image
showing that the particles are approximately equiaxed. Figure 4.7b is a high resolution
TEM image showing the lattice fringes of one of the BaTiO3 particles. By measuring the
distances among the planes it was verified that the particles are bounded by the {100}
and {110} planes. This observation is consistent with those of Jiang et al.44 in the
analysis of equiaxed BaTiO3 particles. For the analysis the area of the equiaxed particles
was equally divided between the {100} and {110} planes.
Figure 4.8 shows the zeta potential as a function of solution pH for the platelet
and equiaxed powders in 95/5 E/W. The lines represent the best fit theoretical
calculations based on the surface reactions and log K values (Table 4.1) from the MUSIC
model and the site densities of the surface groups. The points on the plot are
experimentally measured zeta potential values. To compare the model to the
experimental data Ba2+ adsorption at high pH was described using the modified Stern
isotherm. The ICP results in Table 4.2 show that significant dissolved Ba2+ is present in
solution pH greater than pH 8.
110

Figu
re 4
.7a
and
b.TE
M im
ages
of t
he c
omm
erci
al B
aTiO
3: (a
) im
age
show
ing
that
the
parti
cles
are
equ
iaxe
d, a
nd (b
) hig
h re
solu
tion
imag
e sh
owin
g la
ttice
frin
ges o
f a se
lect
ed p
artic
le w
ith a
<01
1> z
one
axes
and
that
the
surf
ace
of th
e pa
rticl
e is
te
rmin
ated
by
the
(100
) (0.
40 n
m) a
nd (0
11) (
0.28
nm
) pla
nes.
100
nm
-
111

Figu
re 4
.8.
Plot
of z
eta
pote
ntia
l ver
sus p
H fo
r 1w
t% su
spen
sion
s of p
late
let a
nd e
quia
xed
parti
cles
in a
95/
5 et
hano
l/wat
er
solv
ent m
ixtu
re. S
uspe
nsio
ns w
ere
prep
ared
in th
e so
lven
t mix
ture
to li
mit
Ba2+
diss
olut
ion.
How
ever
, a sm
all a
mou
nt o
f dis
solv
ed
Ba2+
is p
rese
nt a
t pH
gre
ater
than
pH
8 n
eces
sita
ting
the
incl
usio
n of
Ba2+
adso
rptio
n at
hig
h pH
to a
ccou
nt fo
r low
neg
ativ
e ze
ta
pote
ntia
l val
ues a
t pH
gre
ater
than
pH
10.
112

There is a difference of approximately 1 pH unit in the IEP of the two powders,
but this difference is not significant due to the observed error in the measurements near
the IEP. However, there is a significant difference between the magnitudes of the zeta
potential of the two powders at pH values remote from the IEP. Table 4.3 is a list of the
surface site densities for the Ti terminated surface of the three low index planes of
BaTiO3 based on the crystallography of BaTiO3 and those values used in the theoretical
calculation of the surface charge. The densities used in the calculation are four orders of
magnitude lower than the actual site densities. This is due to the theoretical model not
accounting for the presence of the IHP where there is a substantial potential drop between
the surface where the surface potential is calculated and the shear plane where the zeta
potential is measured. The site densities were normalized to the highest density plane to
compare the relative change of the three low index planes. The normalized site densities
show there is good agreement between the real and model surface. The lower zeta
potential of the platelet particles can be explained by the large area fraction of {111}
plane on the particles. The normalized values show that the {111} plane has a density of
approximately one half of the highest density plane. With the platelet particles having a
large {111} face the zeta potential is expected to be lower than that of the equiaxed
particles.
4.5 Conclusions
The complex nature of the aqueous surface chemistry of BaTiO3 was investigated
using dissolution studies and electrophoretic mobility measurements. A surface charging
model based on current charging theories was modified with an adsorption isotherm to
113

Tab
le 4
.3.
Site
den
sitie
s of T
i for
the
thre
e lo
w in
dex
plan
es o
f BaT
iO3
base
d on
the
stru
ctur
e of
BaT
iO3
and
the
valu
es u
sed
in
the
mod
elin
g of
the
surf
ace
in a
eth
anol
/wat
er so
lven
t mix
ture
. Th
e di
ffer
ence
bet
wee
n th
e ac
tual
and
mod
el v
alue
s is d
ue th
e m
odel
not
acc
ount
ing
for t
he p
oten
tial d
rop
in th
e IH
P. T
he n
orm
aliz
ed v
alue
s sho
w th
at th
e m
odel
is in
goo
d ag
reem
ent w
ith th
eac
tual
surf
ace
with
resp
ects
to th
e re
lativ
e de
nsity
for e
ach
plan
e.
Pla
necm
-2N
orm
aliz
edcm
-2N
orm
aliz
ed(1
00)
6.25
x 1
0151.
005.
60 x
1011
1.00
(110
)4.
40 x
1015
0.70
4.20
x 1
0110.
75(1
11)
3.60
x 1
0150.
582.
50 x
1011
0.45
Act
ual
Mod
el
114

account for the adsorption of Ba2+(aq). The precipitation of BaCO3 on the surface in a
alkaline environment was also included in the model using a Nernst-Gouy-Stern charging
model. The surface charge showed three distinct regions dependent on the solution pH.
The first region is at low pH where the dissolution of Ba2+ results in the surface behaving
similar to TiO2. In this region where only intrinsic surface reactions control the surface
charge the MUSIC model was applied. At intermediate solution pH values the adsorption
of Ba2+ results in a deviation from the ideal TiO2 surface observed at low pH. The
modified Stern isotherm was used to determine the surface charge due to Ba2+(aq)
adsorption. As the pH continues to increase the precipitation of BaCO3 on the surface
results in the BaTiO3 behaving similar to BaCO3. At pH value greater than the isoelectric
point of a TiO2 surface the charging is highly dependent on the concentration of dissolved
Ba2+(aq). Therefore an empirical formula for the concentration of dissolved Ba2+ was
derived as a function of pH and solid loading and used to calculate the concentration of
Ba2+(aq) present in solution.
115

References 1. K. Osseo-Asare, F.J. Arriagada, and J.H. Adair: Solubility relationships in the coprecipitation synthesis of barium titanate: Heterogeneous equilibria in the Ba-Ti-C2O4-H2O system. In Ceramic Transactions, Ceramic Powder Science, edited by G.L. Messing, E.R. Fuller, Jr., and H. Hausner, (The American Ceramic Society, 1988) pp 47. 2. P. Bendale, S. Venigalla, J.R. Ambrose, E.D. Verink, and J.H. Adair: Preparation of barium-titanate films at 55-degrees-C by an electrochemical method. J. Am. Ceram. Soc. 76, (10), 2619 (1993). 3. S. Venigalla and J.H. Adair: Theoretical modeling and experimental verification of electrochemical equilibria in the Ba-Ti-C-H2O system. Chem. Mater. 11, (3), 589 (1999). 4. M.C. Blanco-Lopez, B. Rand, and F.L. Riley: The properties of aqueous phase suspensions of barium titanate. J. Euro. Ceram. Soc. 17, 281 (1997). 5. U. Paik and V.A. Hackley: Influence of solids concentration on the isoelectric point of aqueous barium titanate. J. Am. Ceram. Soc. 83, (10), 2381 (2000). 6. B. Lee, S. Chung, and S.L. Kang: Necessary conditions for the formation of {111} twins in barium titanate. J. Am. Ceram. Soc. 83, (11), 2858 (2000). 7. M.C.B. Lopez, G. Fourlaris, and F.L. Riley: Interaction of barium titanate powders with an aqueous suspending medium. J. Euro. Ceram. Soc. 18, (14), 2183 (1998). 8. J.H. Adair, B.L. Utech, K. Osseo-Asare, and J.P. Dougherty, Solubility and phase stability of barium titanate in aqueous suspension, edited by J.P. Dougherty, and K. Wakino (in Proceedings of the Fifth US-Japan Seminar on Dielectric and Piezoelectric Ceramics, Kyoto, Japan, 1991), pp. 9. P. Duran, J. Tartaj, and C. Moure: Sintering behavior and microstructural evolution of agglomerated spherical particles of high-purity barium titanate. Ceram. Int. 29, 419 (2003). 10. J.J. Urban, W.S. Yun, Q. Gu, and H. Park: Synthesis of single-crystalline perovskite nanorods composed of barium titanate and strontium titanate. J. Am. Chem. Soc. 124, (7), 1186 (2002). 11. Y.B. Moa, S. Banerjee, and S.B. Wong: Hydrothermal synthesis of perovskite nanotubes. Chem. Comm. 3, 408 (2003). 12. Q. Huang and L. Gao: Synthesis and characterization of hexapod-shaped tetragonal-phase barium titanate single crystals. J. Am. Ceram. Soc. 87, (7), 1350 (2004).
116

13. T.J. Yosenick, D.V. Miller, R. Kumar, J.A. Nelson, C.A. Randall, and J.H. Adair: Synthesis of nanotabular barium titanate via a hydrothermal route. J. Mater. Res. 20, (4), 837 (2005). 14. T. Hiemstra, W.H. van Riemsdijk, and G.H. Bolt: Multisite proton adsorption modeling at the solid-solution interface of (hydr)oxides - A new approach. 1. Model description and evaluation of intrinsic reaction constants. J. Colloid Interface Sci. 133, (1), 91 (1989). 15. T. Hiemstra, P. Venema, and W.H. van Riemsdijk: Intrinsic proton affinity of reactive surface groups of metal (hydr)oxides: The bond valence principle. J. Colloid Interface Sci. 184, (2), 680 (1996). 16. P. Fenter, L. Cheng, M.L. Machesky, M.J. Bedzyk, and N.C. Struchio: Electrical double-layer structure at the rutile-water interface as observed in situ small-period x-ray standing waves. J. Colloid Interface Sci. 225, 154 (2000). 17. W. Piasecki: 1pK and 2pK protonation models in the theoretical description of simple ion adsorption at the oxide/electrolyte interface: The analysis of temperature dependence of potentiometric titration curves. J. Colloid Interface Sci. 254, (1), 56 (2002). 18. M. Fedkin, X.Y. Zhou, J.D. Kubicki, A.V. Bandura, S.N. Lvov, M.L. Machesky, and D. Wesolowski: High temperature microelectrophoresis studies of the rutile/aqueous solution interface. Langmuir 19, (9), 3797 (2003). 19. J.P. Fitts, M.L. Machesky, D. Wesolowski, X. Shang, J.D. Kubicki, G.W. Flynn, T.F. Heinz, and K.B. Eisenthal: Second-harmonic generation and theoretical studies of protonation at the water/α-TiO2 (110) interface. Chem. Phys. Lett. 411, 399 (2005). 20. C.W. Chiang and J.H. Jean: Effects of barium dissolution on dispersing aqueous barium titanate suspensions. Mater. Chem. Phys. 80, (3), 647 (2003). 21. U. Paik, S. Lee, and V.A. Hackley: Influence of barium dissolution on the electrokinetic properties of colloidal BaTiO3 in an aqueous medium. J. Am. Ceram. Soc. 86, (10), 1662 (2003). 22. M.L. Machesky, D. Wesolowski, D.A. Palmer, and M.K. Ridley: On the temperature dependence of intrinsic surface protonation equilibrium constants: An extension of the revised MUSIC model. J. Colloid Interface Sci. 239, 314 (2001). 23. L. Pauling: The principles determining the structure of complex ionic crystals. J. Am. Chem. Soc. 51, 1010 (1929). 24. D.A. Anderson, J.H. Adair, D.V. Miller, J.V. Biggers, and T.R. Shrout: Surface chemistry effect on ceramic processing of BaTiO3 powder. In Ceramic Transactions,
117

Ceramic Powder Science, edited by G.L. Messing, E.R. Fuller, Jr., and H. Hausner, (The American Ceramic Society: Westerville, OH, 1988) pp 485. 25. M.C. Blanco-Lopez, B. Rand, and F.L. Riley: The isoelectric point of BaTiO3. J. Euro. Ceram. Soc. 20, 107 (2000). 26. M.A. Malati and A.E. Smith: The adsorption of the alkine earth cations on titanium dioxide. Powder Tech. 22, 279 (1979). 27. D.W. Fuerstenau, D. Manmohan, and S. Raghavan: The adsorption of alkaline-earth metal ions at the rutile/aqueous interface. In Adsorption from aqueous solutions, edited by P.H. Tewari, (Plenum Press, 1981) pp 93. 28. H.M. Jang and D.W. Fuerstenau: The specific adsorption of alkaline-earth cations at the rutile/water interface. Coll. Surf. 21, 235 (1986). 29. S. Levine, G.M. Bell, and D. Calvert: The discreteness-of-charge effect in electrical double layer theory. Cand. J. Chem. 518, 518 (1962). 30. C.C. Hung and R.E. Riman: X-ray photoelectron spectroscopy investigation of hydrothermal and commercial barium titanate powders. In Chemical processing of advanced materials, edited by L.L. Hench, and J.K. West, (Wiley, 1992) pp 603. 31. C. Herard, A. Faivre, and J. Lemaitre: Surface decontamination treatments of undoped BaTiO3 - Part I. Powder and green body properties. J. Euro. Ceram. Soc. 15, (2), 135 (1995). 32. M.C. Blanco-Lopez, G. Fourlaris, B. Rand, and F.L. Riley: Characterization of barium titanate powders: Barium carbonate identification. J. Am. Ceram. Soc. 82, (7), 1777 (1999). 33. M.M. Lencka and R.E. Riman: Thermodynamic modeling of hydrothermal synthesis of ceramic powders. Chem. Mater. 5, (1), 61 (1993). 34. S.W.L. Lu, B.I. Lee, and L.A. Mann: Carbonation of barium titanate powders studied by FT-IR technique. Mater. Lett. 43, 102 (2000). 35. C.C. Li and J.H. Jean: Dissolution and dispersion behavior of barium carbonate in aqueous suspensions. J. Am. Ceram. Soc. 85, (12), 2977 (2002). 36. D.W. Fuerstenau, Pradip, and R. Herrera-Urbina: The surface chemistry of bastnaesite, barite, and calcite in aqueous carbonate solutions. Coll. Surf. 68, 95 (1992). 37. O. Popovych and R.T. Tomkins, Nonaqueous Solution Chemistry, 1st ed. (John Wiley & Sons, New York, 1981).
118

38. G.A. Parks: The isoelectric points of solid oxides, solid hydroxides, and aqueous hydroxo complex systems. Chem. Rev. 65, (2), 177 (1965). 39. G. Gouy: Constitution of the electric charge at the surface of an electrolyte. J. Physique 9, (4), 457 (1910). 40. D.L. Chapman: Theory of electrocapillarity. Phil. Mag. 25, 475 (1913). 41. W. Healy and W.L. White: Ionizable surface group model of aqueous interface. Adv. Coll. Int. Sci. 9, 303 (1978). 42. R.J. Hunter, Zeta potential in colloid science: Principles and applications, 1st ed. (Academic Press, San Diego, CA, 1981). 43. R. Chodelka: The aqueous processing of barium titanate: passivation, dispersion, and binder formulations for multilayer capacitors. PhD Thesis, University of Florida, Gainsville, FL, (1996). 44. B. Jiang, J.L. Peng, and L.A. Bursill: Surface structures and dielectric response of ultrafine BaTiO3 particles. Ferroelectrics 207, (3-4), 445 (1998).
119

CHAPTER FIVE
Passivation, Dispersion, and Aqueous Solution Doping of Platelet BaTiO3 Powder
5.1 Introduction
The high dielectric constant is the primary reason BaTiO3 is the main material
used in the fabrication of multilayer ceramic capacitors (MLCCs). To achieve the
reduction in dielectric thickness, the colloidal processing of BaTiO3 must be addressed.
To achieve the reduction in layer thickness the use of nanoparticles has readily been
implemented. Because of the reduction of the particle size issues related to the surface
chemistry, doping, and particulate mixing will be of greater importance in the processing
of MLCCs.
The surface chemistry of BaTiO3 is complex due to chemical instability and
surface reactions.1-3 Currently, most BaTiO3 materials are used in the fabrication of
MLCCs where tape casting is the main forming method. Non-aqueous particulate
slurries are the basis for most industrial tape casting.4 For financial and environment
reasons aqueous tape casting is of interest. However, many problems with aqueous based
tape casting exist. In general, foaming, cracking during drying, and inadequate binder
systems lead to low quality tapes with poor mechanical properties. To overcome the
problems it is necessary to better understand the dispersion and interactions of BaTiO3 in
aqueous based suspensions.
Many materials, especially BaTiO3, are not thermodynamically stable in water
and undergo chemical reactions with water present.5 The thermodynamically stable form
120

of most metal oxide ceramics in water is not the pure oxide but the metal hydroxide,
hydroxy carbonate, or carbonate.5, 6 For complex oxide materials composed of a solid
solution of two or more metal oxides, such as BaTiO3, the thermodynamics can be
complicated because of heterogeneous reactions.1, 7, 8
Figure 4.1 shows the ideal stability field for the Ba-Ti-O-C system from Bendale
et al.9 The solubility of Ba2+ is dependent on solution pH with solubility decreasing in an
alkaline environment. The dissolution of Ba2+ during the aqueous processing of BaTiO3
is a problem because it results in a Ti-rich surface layer.10, 11 This is an issue because
during sintering, local Ti-rich regions act to form low temperature melting phases and
promote exaggerated grain growth.12
Figure 4.1 shows that in addition to Ba2+ dissolution, the formation of BaCO3 is
also a concern. CO2 in the atmosphere readily dissolves into water, and at neutral pH
where Ba2+ dissolves from the surface, BaCO3 can form.13, 14 During sintering the high
temperature (>1200°C) decomposition of BaCO3 can lead to decreased density because
of CO2 gas evolution in closed pores.15 The gas exerts a negative sintering pressure
which inhibits and eventually reverses the sintering process. Because of the deleterious
effects of BaCO3 on BaTiO3 processing it is essential to limit Ba2+ dissolution and the
subsequent BaCO3 formation.
Chemical surface passivation can be applied to a variety of materials including
structural ceramics16, semiconductors17, superconducting oxides18, and metals.19-21 In all
cases the material is not stable in the intended use environment and the surface has been
chemically modified to provide a barrier against degradation. Degradation can occur by
two mechanisms; the material can degrade by the diffusion of a species into the lattice,
121

typically oxygen or the surface can be chemically unstable and begin to dissolve. The
primary issue with BaTiO3 is the latter and it is necessary to passivate the surface to
inhibit the dissolution of Ba2+ from the surface. Vasques et al.18 discussed the parameters
required for a passivation agent of a similar material, YBa2Cu3O7-x : (1) it must exhibit
low solubility in the solvent, and (2) act as a good diffusion barrier. Although low
solubility is necessary, it is not the only concern. For example, BaCO3 has low solubility
in water but does not prevent the aqueous degradation of YBa2Cu3O7-x superconductors.
However, the solubility can be used as a starting point to limit the search for a passivation
agent.
Once the chemical stability of BaTiO3 has been addressed, it is necessary to focus
on other processing issues, including doping. Doping is necessary because BaTiO3
exhibits three phase transitions: rhombohedral to orthorhombic, orthorhombic to
tetragonal, and tetragonal to cubic at -90, 0 and 130 °C, respectively.22 At each phase
transition there is an associated spike in the dielectric properties of the materials making
it unsuitable for use over a wide temperature range. There is a need to tailor the electric
properties and to flatten the dielectric response of BaTiO3. The Electronic Industries
Alliance (EIA) of the United States has established guidelines for acceptable changes in
capacitance for defined temperature ranges. One of the criteria in selecting a capacitor
for a specific application is the expected range of temperature use.
The X7R class has an allowable ±15% change in capacitance with respect to the
room temperature capacitance over a temperature range from -55 to 125 °C. X7R
capacitors are typically used in applications which require a broad temperature range,
including mobile electronics. To tailor the electrical properties of BaTiO3 and achieve
122

X7R specifications doping the material is required. A series of materials known as Curie
shifters have been identified which shift the Curie temperature (TC) of BaTiO3 and result
in a flat temperature response.23
To achieve the low temperature coefficient of capacitance of an X7R dielectric a
chemically inhomogeneous microstructure is required. One possible route is the
development of a core-shell microstructure. In a core-shell microstructure, individual
grains have a chemical gradient ranging from undoped BaTiO3 in the center of the grain
to fully doped BaTiO3 the edge of the grain. The chemical gradient results in a gradient
of the TC from pure BaTiO3 in the core to the TC of doped BaTiO3 in the shell.
Current solid-state doping methods require the addition of dopant particles to the
matrix particles. The mixture is typically ball milled to incorporate dopants and
homogenize the mixture. The process has been studied by Wiseman in the doping of
ZnO for the fabrication of varistors. If dopants are present as particulates, chemical
homogeneity is nearly impossible to achieve.24 As the dopant particle size meets or
exceeds that of the matrix particle high sintering temperatures and long sintering times
are required for diffusion in the development of a core-shell microstructure. With the
growing use of nanoscale matrix particles an alternate doping method not limited by
particulate mixing is required.
A chemical approach is an alternative method of doping in which the dopant is
added in ionic or molecular form. In the ionic approach, soluble salts are added to
aqueous suspensions, whereas the molecular approach is used typically in non-aqueous
suspensions where the dopants are added as organo-metallics precursor molecules. In
either approach little care has been taken to ensure that dopants selectively adsorb onto
123

particle surfaces. In addition to adsorption or precipitation of the dopants onto the
particle surface, segregation or homogenous precipitation of the unabsorbed dopants can
occur upon drying of the suspension. Irrespective of the location of the dopants, the
resulting powder mixture has a more homogenous composition compared to powders
doped by a solid state approach. Both approaches, ionic and molecular, have been shown
to be successful in the processing of highly engineered materials such as, ZnO-based
varistors25 and BaTiO3-based capacitors.26, 27 Although an aqueous approach for BaTiO3
has been previously outlined27, no attempt was made to passivate the surface and protect
the surface from degradation. It is necessary to protect or passivate the surface from
degradation to limit the processing problems that have been observed due to Ba2+
dissolution.15, 28
Fernandez et al. studied the doping of BaTiO3 using three different methods:
power synthesis doping, solid-state, and chemical.29 Doping during synthesis was not
effective due to a homogenous chemical composition obtained in the final microstructure.
Both the solid-state and chemical approaches were effective in achieving X7R dielectrics,
but yielded differences in the electrical loss due to differences in the distribution of the
dopants.
The goal of the current study are to: (1) investigate the use of oxalic acid as a
passivation agent for the aqueous processing of BaTiO3, (2) address the dispersion of
passivated BaTiO3 with a cationic polyelectrolyte, and (3) use an aqueous solution based
method for the doping of BaTiO3.
124

5.2 Materials and Methods
Dissolution experiments were conducted to determine the chemical stability of
BaTiO3 in an aqueous environment in the presence of a passivating agent and dispersant.
The experiments were conducted using two different BaTiO3 powders; a commercial
equiaxed powder (BT-01, Sakai Chemical Company, Osaka, Japan) and a hydrothermally
derived anisotropic platelet powder. The details of the synthesis and physical properties
of the platelet powder are outlined elsewhere.30 Oxalic acid dihydrate (HOx) (Fisher
Scientific, Fair Lawn, NJ) was used as the passivating agent and polyethylenimine (PEI)
(25,000 Mw, Aldrich Chemical Company, Milwaukee, WI) was used as the dispersant.
PEI was used because it is a cationic polyelectrolyte which develops positive charge at
pH values less than pH 9.31 Solutions of 0.1 M and 1 M tetraethylammonium hydroxide
(TEAOH) (35wt% in water, Aldrich Chemical Company, Milwaukee, WI) and nitric acid
(70w%, J.T. Baker, Phillipsburg, NJ) were used to adjust suspension pH. All suspensions
prepared for dissolution experiments contained 1wt% BaTiO3 powder and varying
amounts of HOx and PEI in CO2-free DI water that had been previously prepared by
boiling with flowing argon to remove adsorbed CO2.
Suspensions were prepared by adding the HOx and/or PEI to DI water and
adjusting the pH to 3, 5, 7, 9 or 11. Suspension pH was measured using ion-selective
field effect transitor (IS-FET) pH probe (Senton Hotline Probe, RL Instruments
Manchoung, MA) calibrated using NIST-traceable standards with nominal pH values of
4, 7, and 10. After pH adjustment the BaTiO3 powder was added and the suspensions
were allowed to equilibrate for 18 to 24 hours. The zeta potentials of the suspensions
were measured using electrophoretic light scattering (ZetaPALS, Brookhaven Instrument
125

Corp, Holtsville, NY). Suspensions were centrifuged at 10,000 rpm for 7 min, and the
supernatant of each suspension was then filtered using a 0.22 μm syringe filter. Ba and
Ti concentrations for each suspension were measured using indirectly coupled plasma
atomic emission spectroscopy (ICP-AES) (PS3000UV, Leeman Labs, Los Angeles, CA).
Standards for ICP-ES were prepared by serial dilution from 1000 ppm standard stock
solutions (Hi Purity Standards, Charleston, SC).
Rheological properties were measured to investigate the particle-particle
interactions in moderately concentrated, 10 volume percent, suspensions. Suspensions
for analysis were chosen from suspensions which exhibited both low Ba2+ and Ti4+
solubility and high zeta potential. Rheological properties were measured using a cone-
plate type rheometer (CSL 100K Auto Gap, Carri-Med, Surrey, England) with shear rates
ranging from 1 to 1000 sec-1. The apparent viscosity was then calculated from the
rheological data by extrapolating the viscosity as a function of shear rate at shear rate
values greater than 700 sec-1 back to zero shear and reporting the y-intercept of the
asymptote as the apparent viscosity. The Bingham yield point was reported to be the
shear stress linearly extrapolated to zero shear rate.
Three different elements, Co, Nb, and Bi were added to dope the powder. Co and
Nb were chosen because X7R dielectrics have previously been reported using Co and
Nb.32, 33 Bi was added as a flux to lower the sintering temperature and promote liquid
phase sintering.34, 35 A solution of 0.5 M cobalt nitrate hexahydrate (98+%, Aldrich
Chemical Company, Milwaukee, WI) served as the cobalt source. A solution of 0.5 M
bismuth ammonium citrate was the bismuth source and was prepared by dissolving
bismuth citrate (94%, Alfa Aesar, Ward Hill, MA) with ammonium hydroxide (30%,
126

Aldrich Chemical Company, Milwaukee, WI) in a molar ratio of 1:3. An aqueous citrate-
peroxide-niobium complex was prepared using niobium ammonium oxalate (H.C. Starck,
Newton, MA) as the niobium source following the method outline by Narendar and
Messing.36 After preparation the solution was concentrated using a rotoevaporator (RE
51, Yamato Scientific Company, Tokyo, Japan), and the niobium concentration in
solution was determined using indirectly couple plasma atomic emission spectroscopy
(ICP-AES)
The dopants were added in a step-wise manner to ensure adsorption onto the
particle surface. First, the BaTiO3 powder was passivated with oxalic acid dihydrate.
The cobalt nitrate was then added followed by the addition of PEI. Finally, the bismuth
and niobium were added and to the suspension while pH maintained at pH 7 using 0.1M
solutions of either nitric acid (69-70%, JT Baker, Phillipsburg, NJ) or
tetraethylammonium hydroxide (35wt% in water, Aldrich Chemical Company,
Milwaukee, WI).
Zeta potential measurements were performed at each step to determine if the
dopants were specifically absorbing on the particle surfaces. Suspensions were prepared
with 0, 1, 2, 5, and 10 wt% of the individual dopant and then the zeta potential was
measured. TEM analysis was performed using holey carbon film on Cu grids as sample
holders with a single drop of dilute suspension placed on each grid. Dopant layer
thickness was imaged and measured using transmission electron microscopy (TEM)
(2010 LaB6, JEOL. Japan). The presence of the dopant was confirmed with the use of
energy dispersion spectroscopy (EDS) (Gatan Inc., Pleasanton, CA).
127

To quantitatively determine the amount of dopant absorbed during doping three
powder samples were prepared with 5wt% Bi2O3 and 0, 2, and 5wt% CoNb2O6. After
doping the suspensions were centrifuged to separate the doped powder for the supernatant
and then dried. The powder was heated to 600 °C in flowing oxygen for 2 hrs. to remove
any organic present. The powder was then analyzed using X-ray fluorescence (XRF)
(1600/10, Phillips, Netherlands) for both the dopant concentration and the Ba to Ti ratio.
5.3 Results and Discussion
5.3.1 Passivation
Previous attempts at passivation haven been made with limited success.37-39
Much of the work has focused on the use of poly(acrylic acid) (PAA) because the
carboxylic acid groups on the PAA complex well with Ba2+.37-39 Oxalic acid was chosen
as a possible passivation agent because it readily forms an insoluble metal salt with
barium.40 Ba2+ attempting to leach from the surface reacts with the oxalate ion to form
barium oxalate which heterogeneously nucleates on the particle surface creating a
passivation layer.5 This is similar to observations by Mandanas et al. in the passivation
of doped ferrite powders41 and yttria-doped zirconia by Kimel and Adair.42 Figure 5.1 is
TEM image showing the presence of a 2-3 nm surface layer on a BaTiO3 platelet particle
treated with oxalic acid.
In addition to TEM observations, zeta potential determination was used to
investigate the effect of oxalic acid on the surface of BaTiO3. Figure 5.2 give the zeta
potential for suspensions with varying amounts of oxalic acid as a function of pH. As the
concentration of oxalic acid increases two important effects are observed: (1) the
128

Figu
re 5
.1.
TEM
imag
e of
an
oxal
ate
pass
ivat
ed B
aTiO
3pa
rticl
e. T
reat
men
t with
oxa
lic a
cid
resu
lts in
a 2
nm
thic
knes
s sur
face
la
yer o
f bar
ium
oxa
late
whi
ch in
hibi
ts th
e su
rfac
e fr
om d
egra
datio
n.
129

Figu
re 5
.2.
Zeta
pot
entia
l of 1
wt%
susp
ensi
on o
f nan
opla
tele
t BaT
iO3
in w
ater
with
incr
easi
ng a
mou
nts o
f oxa
lic a
cid
as a
fu
nctio
n of
pH
. Fu
ll su
rfac
e pa
ssiv
atio
n is
ach
ieve
d by
an
oxal
ic a
cid
conc
entra
tion
of 3
x10-3
M (3
.75w
/w).
A fu
rther
incr
ease
in
the
oxal
ic a
cid
conc
entra
tion
resu
lts in
an
incr
ease
in th
e m
agni
tude
of t
he z
eta
pote
ntia
l.
130

isoelectric point (IEP) shifts or is suppressed, and (2) the zeta potential becomes
independent of pH. A shift in the IEP is conformation of specific adsorption of the oxalic
acid onto the surface of the particle. The pH independent zeta potential is similar to that
of barium oxalate, implying that as the BaTiO3 particle is treated with oxalate a Nernstian
surface of barium oxalate is formed. The zeta potential data along with the TEM
observations show that in the presence of oxalate a barium oxalate surface layer forms on
BaTiO3.
For full passivation it is necessary to have complete surface coverage. When full
surface passivation with barium oxalate is achieved the zeta potential behaves similar to
that of barium oxalate. At an oxalic acid concentration of 10-3 M an isoelectric point
(IEP) still exists around pH 9, indicating that Ba2+ dissolution still occurs. With an
oxalate concentration of 3x10⁻³ M the IEP has been suppressed and the zeta potential
curve appears similar to the zeta potential curve for that of barium oxalate, verifying full
passivation is achieved.
In the pH range where barium oxalate is sparingly soluble in water, the surface
charging of barium oxalate is regulated by a Nernst-Gouy-Stern surface reaction that is
independent of pH.40 Only the concentration of barium and oxalate ions control the
magnitude of the zeta potential. Only an excess of either barium or oxalate ions present
in solution should further increase the magnitude of the zeta potential. Increasing the
oxalic acid concentration produces an increase in the magnitude of the zeta potential but
also in an increase in the concentration of free oxalate ions in solution. An oxalic acid
concentration of 5x10⁻² M provides the largest magnitude zeta potential.
131

Figu
re 5
.3.
Plot
of s
olub
le B
a2+(a
q)co
ncen
tratio
n as
a fu
nctio
n of
susp
ensi
on p
H a
nd o
xalic
aci
d co
ncen
tratio
n fo
r the
pla
tele
t B
aTiO
3. A
n ox
alic
aci
d co
ncen
tratio
n of
5x1
0-2M
yie
lds t
he b
est s
urfa
ce p
assi
vatio
n ye
t low
er c
once
ntra
tions
are
acc
epta
ble
as
long
as t
he so
lutio
n pH
rem
ains
gra
ter t
han
pH 5
.
132

Figu
re 5
.4.
At a
cidi
c pH
val
ues T
i for
ms a
solu
ble
com
plex
with
oxa
lic a
cid.
At h
igh
oxal
ic a
cid
conc
entra
tion
Ti d
isso
lutio
n fr
om th
e B
aTO
3su
rfac
e is
una
ccep
tabl
e. H
owev
er, a
t an
oxal
ic a
cid
conc
entra
tion
of 3
x10-3
M a
t pH
val
ues g
reat
er th
an p
H 5
the
Ti4+
conc
entra
tion
in so
lutio
n is
neg
ligib
le. (
--) a
t 10-7
M in
dica
tes t
he li
mit
of d
etec
tion
for T
i4+w
ith IC
P-ES
. Li
nes a
re tr
end
lines
on
ly.
133

Although it has been shown the oxalic acid treatment results in a barium oxalate
surface layer it is not known if the layer provides passivation. To investigate the
passivation with oxalic acid, ICP-AES analysis of the suspension supernatants was
performed. Analyzes for both Ba and Ti were conducted. Figures 5.3 and 5.4 show the
Ba and Ti concentrations in solution, respectively, as a function of oxalic acid
concentration and suspension pH for the platelet powder. The Ba2+ dissolution data
shows that as oxalic acid concentration increases, passivation is observed and that 5x10⁻²
M oxalic acid provides the best passivation over the entire pH range studied. However,
the Ti ICP-AES data shows that increasing the oxalic acid concentration results in
increased Ti solubility with Ti solution concentrations as high as 10-2 M. Oxalic acid
forms a readily soluble complex with Ti43, 44 and the reaction of oxalate with Ti degrades
the surface of the BaTiO3 in a manner similar to Ba2+ dissolution.
To use oxalic acid as a passivation agent in the aqueous processing of BaTiO3 it is
necessary to balance the Ba2+ dissolution and increased Ti solubility. An oxalic acid
concentration of 3x10⁻³ M, which is equivalent to 3.75 w/w oxalic acid for the 1wt%
suspensions prepared, limits both Ba and Ti solubility as long as solution pH is greater
than pH 5. This constraint sets the lower limit for aqueous processing with oxalic acid at
pH 5.
5.3.2 Dispersion
If the magnitude of the zeta potential were large enough to provide stable
dispersion then dispersion could be achieved through the use of oxalic acid alone.
However, because Ti4+ solubility limits the use of high concentrations of oxalic acid the
zeta potential after passivation is only -15mV. Although dependent on many factors, at
134

room temperature a zeta potential of magnitude greater than ±25 to 30 mV is generally
necessary to produce a stable dispersion in a moderate to low ionic strength suspension.45
Therefore a dispersant is required to promote dispersion in BaTiO3 suspensions. An
added advantage of a polyelectrolyte dispersant is that in addition to electrostatic
repulsion a steric component is provided for dispersion. Polyethylenimine was chosen
because it is a cationic polyelectrolyte which develops positive charge at pH values less
than pH 10.31 The positively charged PEI readily absorbs to the negatively charged
oxalate surface, and as the pH is lowered to neutral pH values, the degree of protonation
of the PEI increases, yielding large zeta potentials.41
Zeta potential measurements and ICP-AES were used to analyze the effect of PEI
on the surface chemistry of an oxalate passivated BaTiO3 and determine the optimum
dosage for dispersion. Figure 5.5 shows the zeta potential of platelet BaTiO3 with
varying amounts of PEI as a function of pH. As the PEI concentration increases, the sign
of the zeta potential reverses verifying PEI absorption on particle surfaces. In the pH
range of interest, pH 5-10, PEI concentrations greater than 1 w/w provide zeta potentials
suitable for dispersion (≥ ±25mV). ICP-AES results, not shown, show negligible
variations in either the Ba2+ or Ti4+ concentration as a function of PEI concentration.
Zeta potential measurements provide insight into the stability of particulate
suspensions and the potential for good dispersion. However, rheological properties are
highly dependent on the state-of-dispersion and are controlled by particle-particle
interactions in the suspensions.46 To evaluate the effect of oxalic acid and PEI on the
interparticle interactions the rheological properties of moderately concentrated, 10 vol%,
suspensions of the equiaxed commercial particles were measured. All suspension
135

Figu
re 5
.5.
The
addi
tion
of P
EI to
oxa
lic a
cid
pass
ivat
ed B
aTiO
3su
spen
sion
s res
ults
in a
pos
itive
zet
a po
tent
ial d
ue to
the
adso
rptio
n of
PEI
on
the
bariu
m o
xala
te su
rfac
e. I
n ad
ditio
n to
larg
e po
sitiv
e ze
ta p
oten
tial v
alue
s PEI
add
s a st
eric
hin
dran
ce to
ai
ds in
par
ticle
dis
pers
ion.
136

Figu
re 5
.6a
and
b.Th
e sh
ear s
tress
and
vis
cosi
ty o
f 10v
ol%
susp
ensi
ons w
ith 2
.5w
/w P
EI sh
ows t
hat i
ncre
asin
g th
e ox
alic
aci
d co
ncen
tratio
n re
sults
in a
dev
iatio
n fr
om N
ewto
nian
beh
avio
r due
to th
e in
tera
ctio
n of
PEI
and
oxa
lic a
cid
to fo
rm a
gel
net
wor
kof
am
ine
oxal
ate.
The
line
ar re
gion
s of (
a) w
ere
fit w
ith B
ingh
am’s
law
and
the
y-in
terc
ept w
as re
porte
d as
τB, t
he y
ield
poi
nt. A
ll su
spen
sion
s mea
sure
d w
ere
at p
H 7
to m
aint
ain
an a
ppro
xim
ate
zeta
pot
entia
l of a
ppro
xim
atel
y +2
5mV
.
137

rheology was measured at pH 7 to maintain a zeta potential of approximately +25mV,
and avoid any possible changes in the particle-particle interactions due to changes in the
degree of protonation of the PEI. Figures 5.6a and b show the shear stress and viscosity
as a function of shear rate for suspension with 2.5w/w PEI and increasing dosages of
oxalic acid. The linear regions of the curves on Figure 5.6a were fit using Bingham’s
law,
[5.1] •
+= γηττ B
where τ is the shear stress, τB is the yield point, η is viscosity, and γ is the shear rate. As
the oxalic acid concentration increases the apparent viscosity increases. The increasing
apparent viscosity and non-Newtonian behavior is an indication of stronger particle-
particle interactions. It is likely that the increased interaction is due to the interaction of
amine groups on PEI with the oxalate. An amine-carboxylic acid complex is formed by
the carboxylic acid group transferring a proton to the nitrogen on an amine group.47
Vaidhyanathan et al. were able to make crystalline amine oxalates using oxalic acid and
organic amines with a limited number of amine groups. However, in the current work the
high concentration of amine groups on the PEI allow for the formation of a gel network
of amine oxalate. The formation of a gel network was confirmed by evaluating the
behavior of PEI oxalate mixtures in solution. For the formation of amine oxalate, free
oxalates in solution react with the PEI. Thus, if concentrations of PEI and oxalate are
higher than required for passivation/dispersion an undesirable gel network forms with
loss of rheological control.
Firth and Hunter developed a physical model for the rheological properties of
colloidal suspensions.48 In the elastic-floc model flocs are envisioned as elastic clusters
138

of hard aggregates that deform under shear conditions. The Bingham yield point is
related to the energy required to rupture a floc, which is comprised of two parts: (1)
Estretch, the energy that is dissipated by elastic deformation of the floc, and (2) Ebreak,
energy required to break the flocs due to interaction potential. Table 5.1 summarizes the
apparent viscosity and Bingham yield points for suspensions with various concentrations
of PEI and oxalic acid. Figures 5.7a and b show the apparent viscosity and yield point as
a function of oxalate concentration for 10 vol% suspensions with varying concentrations
of PEI. Increasing the oxalic acid concentration increases the apparent viscosity and
Bingham yield point. Since the zeta potential and local chemistry (i.e. the amine-oxalate
linkage) were maintained at constant values in the current experiments, it can be reliable
assumed that Ebreak is constant. Therefore, the changes in Bingham yield point with
increasing oxalic acid concentration are due to an increased elastic component, Estretch.
The increasing Bingham yield point supports the notion that the oxalic acid and PEI are
forming a gel-like amine-oxalate network, which under applied shear is easily
deformable.
Although zeta potential measurements and ICP-AES indicate that an oxalic acid
concentration of 3.75w/w provides complete surface coverage, the viscosity data suggests
that an oxalic acid concentration of 2.25w/w provides adequate surface coverage. At an
oxalic acid concentration as low as 3w/w, increased viscosities and yield points indicate
the formation of amine oxalates due to the presence of excess oxalic and PEI. With the
reduced oxalic acid concentration (2.25w/w) a loss of oxalate passivation is a concern.
For the experiment conditions 2.25w/w HOx equals approximately 2x10⁻³ M HOx.
Based on the zeta potential and Ba2+ ICP-AES results, Figures 5.3 and 5.4, 2x10⁻³ M
139
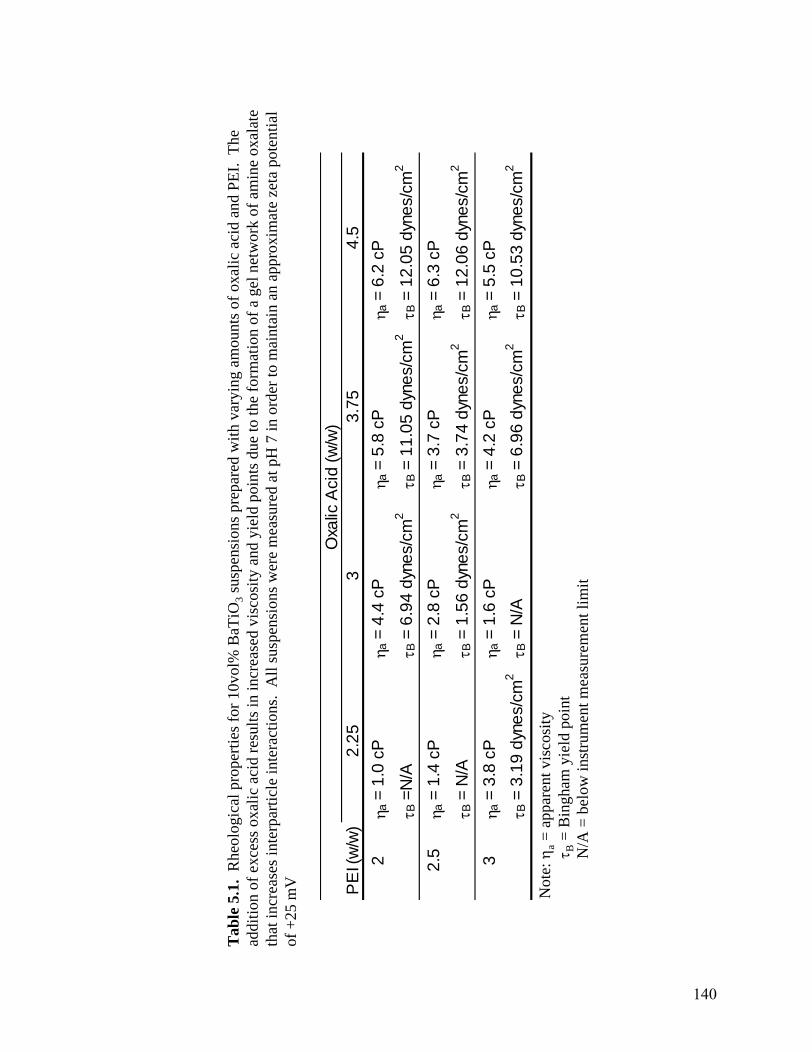
Tab
le 5
.1.
Rhe
olog
ical
pro
perti
es fo
r 10v
ol%
BaT
iO3
susp
ensi
ons p
repa
red
with
var
ying
am
ount
s of o
xalic
aci
d an
d PE
I. T
he
addi
tion
of e
xces
s oxa
lic a
cid
resu
lts in
incr
ease
d vi
scos
ity a
nd y
ield
poi
nts d
ue to
the
form
atio
n of
a g
el n
etw
ork
of a
min
e ox
alat
e th
at in
crea
ses i
nter
parti
cle
inte
ract
ions
. A
ll su
spen
sion
s wer
e m
easu
red
at p
H 7
in o
rder
to m
aint
ain
an a
ppro
xim
ate
zeta
pot
entia
l of
+25
mV PE
I (w
/w)
2.25
33.
754.
52
η a =
1.0
cP
η a =
4.4
cP
η a =
5.8
cP
η a =
6.2
cP
τ B =
N/A
τ B =
6.9
4 dy
nes/
cm2
τ B =
11.
05 d
ynes
/cm
2τ B
= 1
2.05
dyn
es/c
m2
2.5
η a =
1.4
cP
η a =
2.8
cP
η a =
3.7
cP
η a =
6.3
cP
τ B =
N/A
τ B =
1.5
6 dy
nes/
cm2
τ B =
3.7
4 dy
nes/
cm2
τ B =
12.
06 d
ynes
/cm
2
3η a
= 3
.8 c
Pη a
= 1
.6 c
Pη a
= 4
.2 c
Pη a
= 5
.5 c
P
τ B =
3.1
9 dy
nes/
cm2
τ B =
N/A
τ B =
6.9
6 dy
nes/
cm2
τ B =
10.
53 d
ynes
/cm
2
Oxa
lic A
cid
(w/w
)
Not
e: η
a=
appa
rent
vis
cosi
tyτ B
= B
ingh
am y
ield
poi
ntN
/A =
bel
ow in
stru
men
t mea
sure
men
t lim
it
140

Figu
re 5
.7.
App
aren
t vis
cosi
ty (a
) and
yie
ld p
oint
(b) v
alue
s as a
func
tion
of o
xala
te c
once
ntra
tion
for 1
0vol
% su
spen
sion
with
va
ryin
g co
ncen
tratio
n of
PEI
. Th
e su
spen
sion
con
tain
ing
exce
ss o
xalic
aci
d ex
hibi
t inc
reas
ed v
isco
sity
and
yie
ld p
oint
due
to th
e fo
rmat
ion
of a
min
e ox
alat
e ge
l net
wor
k. A
ll su
spen
sion
s wer
e m
easu
red
at p
H 7
to m
aint
ain
a co
nsta
nt z
eta
pote
ntia
l of +
25 m
V.
141

HOx should provide a minimum of passivation. Any further reduction in the oxalic acid
concentration should be avoided to limit Ba2+ dissolution.
Suspension rheological properties are dependent on the adsorption of dispersants
onto the particle surface.49 The data in Table 5.1 shows that as the oxalic acid
concentration increase, changes in the rheological behavior as a function of PEI are
observed. Not until the PEI concentration is high enough to react with the free oxalate
will surface coverage be complete enough to promote dispersion. This issue is not a
problem in suspensions with 2.25w/w oxalic acid because low concentrations lead to
oxalate present only on particle surfaces.
In the suspensions with 2.25w/w oxalic acid the increasing PEI concentration
should result in an increased viscosity. As the dispersant concentration increases the
surface coverage should increase and yield higher zeta potentials. High zeta potentials
lead to larger inter-particle repulsion accompanied by decreased viscosity and yield point.
The increased viscosity with increasing concentration indicates that there is a possible
change in the mechanism of PEI adsorption as a function of concentration. PEI is a
commonly used dispersant and its adsorption to SiO2, an ideal negatively charged
surface, has been previously studied.50 The conformation of PEI changes depending on
PEI concentration. At low concentrations, PEI assumes a flat unfolded morphology on
the particle surface. As the PEI concentration increases, a folded morphology with an
increased density of loops and tails is observed.51 In its folded conformation, PEI forms a
patchy absorbed layer leaving regions of uncoated surface. At high PEI concentrations,
because of high loop and tail densities and uncoated surface regions, bridging
flocculation has been observed.50 Thus, as PEI concentration increases, the PEI assumes
142

a more folded conformation and bridging flocculation occurs leading to increased
viscosities.
5.3.3 Doping of Nanotabular BaTiO3
With an understanding of the aqueous passivation/dispersion of BaTiO3 it is
possible to manipulate the surface charge to control the adsorption of ionic species onto
the particle surface. Normal doping routes need to be scaled to the nanometer regime for
BaTiO3 nanoparticles. It is believed that the controlled adsorption of dopant ions is a
possible route for the doping of nanoscale BaTiO3. The advantage of a solution based
technique is a much more homogeneous dopant distribution via the ability to create a
coated particle prior to sintering.
Like Ba, Co forms a sparingly soluble oxalate at neutral pH. The surface charge
of cobalt oxalate is also insensitive to pH and only dependent on the concentration of Co
and oxalate in solution.40 The addition of cobalt nitrate to a suspension of oxalate
passivated BaTiO3 powder results in the deposition of cobalt forming a cobalt oxalate
surface on the BaTiO3 particles. Figure 5.8 gives the zeta potential versus dopant
concentration for the three dopants studied: Co, Nb, and Bi. The figure shows that as
cobalt is added the sign of the zeta potential reverses, going from positive to negative
confirming that cobalt oxalate is forming on particle surfaces. At low cobalt
concentrations the particle still maintains a negative surface charge suitable for the
absorption of PEI for dispersion.
The lack of suitable Nb and Bi metal salts that are soluble at neutral pH, make the
precipitation of niobium oxalate or bismuth oxalate on the particle surface difficult.
However, Nb and Bi form soluble complexes with citric acid that are negatively charged
143

Figu
re 5
.8.
Zeta
pot
entia
l of d
oped
pla
tele
t par
ticle
as a
func
tion
of d
opan
t con
cent
ratio
n. A
s Co
is a
dded
to th
e su
spen
sion
a
reac
tion
with
exc
ess o
xalic
aci
d oc
curs
to fo
rm a
cob
alt o
xala
tesu
rfac
e. W
hen
PEI i
s add
ed, t
he su
rfac
e be
com
es p
ositi
ve a
nd is
su
itabl
e fo
r the
ads
orpt
ion
of th
e ne
gativ
ely
char
ged
Nb
and
Bi c
ompl
exes
.
144

at neutral pH.36, 52 Thus, a positive PEI surface is ideal for the adsorption of these
negative complexes. After the addition of the cobalt nitrate forming a negatively charged
cobalt oxalate surface, PEI was added to provide a positive surface charge suitable for the
absorption of the negatively charged Nb and Bi complexes. Zeta potential measurements
(Figure 5.8) confirm that the negative complexes absorb onto the positive PEI surface.
Similar to the addition of Co, increasing the concentration of Nb and Bi reverses the sign
of the surface charge confirming the adsorption of the Nb and Bi complexes onto the PEI
coated particle surfaces.
Figure 5.9 is a schematic showing the doping process. First, Ba2+ dissolves from
the surface and along with Co2+ reacts with the oxalic acid to form a negatively charged
oxalate surface layer. PEI is added to disperse the particles and reverse the sign of the
surface charge. Finally, NbO(O2)Cit3- and Bi(NH3)3Cit- are added and electrostatically
adsorb onto the particle surface. Figures 5.10a-e are TEM micrographs of platelet
BaTiO3 particles at each step of the doping process beginning with an undoped sample.
The difference between the undoped and fully doped particles is obvious. The surface of
the undoped particle shows few features, whereas the fully doped particle has small (1-2
nm) structures on the surface. Figure 5.11 is an EDS spectrum for the fully doped
particle. The minor peaks of Co, Nb, and Bi confirm the dopants are present on particle
surfaces. The other peaks in the spectrum are artifacts from the experimental setup and
instrumentation. C and Cu are from the sample grid used for the sample preparation and
Fe is contamination from the TEM used for EDS analysis.
Table 5.2 summarizes the XRF analysis of three doped powder samples. The
three samples were doped with 5wt% Bi2O3 and 0, 2, or 5 wt% CoNb2O6. To measure
145

Figu
re 5
.9.
Sche
mat
ic re
pres
enta
tion
of th
e do
ping
pro
cess
ing.
Firs
t oxa
lic a
cid
and
coba
lt ar
e ad
ded
to fo
rm a
n ox
alat
e su
rfac
e la
yer w
hich
pas
siva
tes t
he su
rfac
e. P
EI is
add
ed to
dis
pers
e th
e pa
rticl
es a
nd p
rovi
de a
pos
itive
surf
ace
char
ge fo
r the
ads
orpt
ion
of th
e N
b an
d B
i whi
ch a
re a
dded
in th
e fin
al st
ep.
BaT
iO3
Ba2
+ (aq)
+ C
2O42-
(aq)
BaT
iO3
BaC
2O4
(s)
Co2
+ (aq)
+ C
2O42-
(aq)
CoC
2O4
(s)
PE
I
BaT
iO3
+
+ ++
++
+
+
+
++
NbO
(O2)
Cit3
- (aq)
Bi(N
H3)
3Cit- (a
q)
BaT
iO3
+
+ ++
++
+
+
+
+
Bi(N
H3)
3Cit-
++
Bi(N
H3)
3Cit-
- -
-
--
-
--
Dis
solu
tion N
bO(O
2)C
it3-
NbO
(O2)
Cit3
-
146
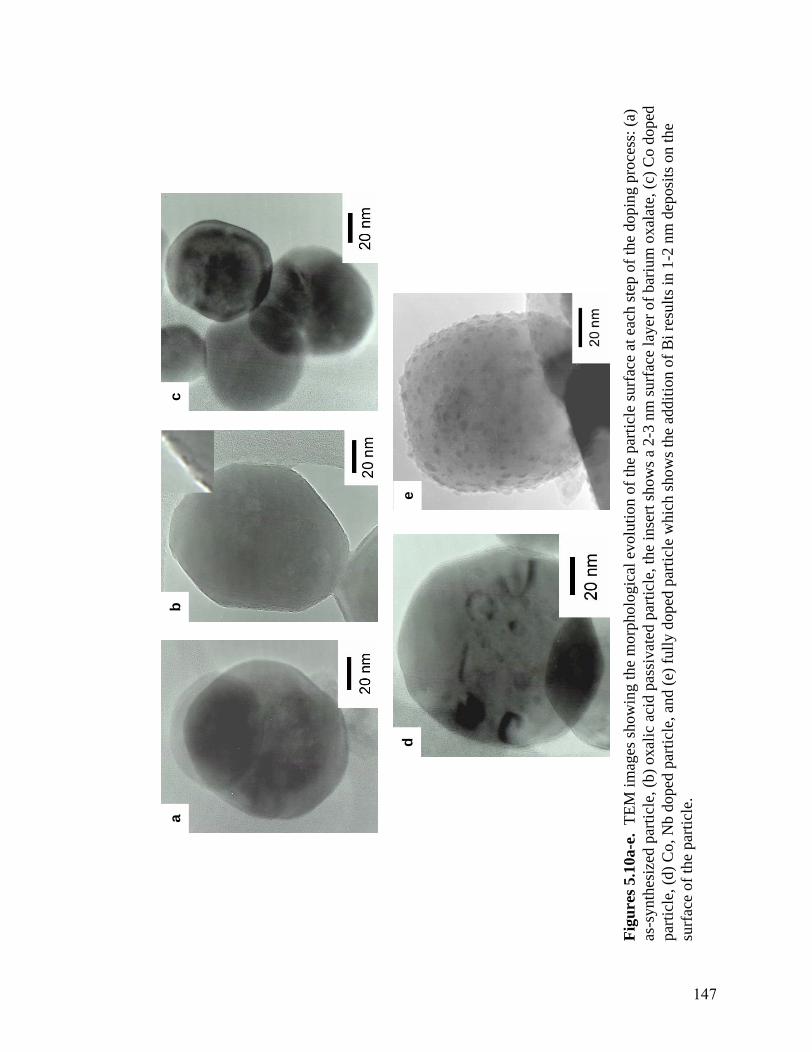
ab
c
ed
Figu
res 5
.10a
-e.
TEM
imag
es sh
owin
g th
e m
orph
olog
ical
evo
lutio
n of
the
parti
cle
surf
ace
at e
ach
step
of t
he d
opin
g pr
oces
s: (a
) as
-syn
thes
ized
par
ticle
, (b)
oxa
lic a
cid
pass
ivat
ed p
artic
le, t
he in
sert
show
s a 2
-3 n
m su
rfac
e la
yer o
f bar
ium
oxa
late
, (c)
Co
dope
d pa
rticl
e, (d
) Co,
Nb
dope
d pa
rticl
e, a
nd (e
) ful
ly d
oped
par
ticle
whi
ch sh
ows t
he a
dditi
on o
f Bi r
esul
ts in
1-2
nm
dep
osits
on
the
surf
ace
of th
e pa
rticl
e.
147

Figu
re 5
.11.
EDS
spec
trum
of a
clu
ster
of d
oped
pla
tele
t par
ticle
s. T
he sp
ectru
m sh
ows t
he p
rese
nce
of th
e th
ree
dopa
nts C
o, N
b,
and
Bi.
The
C, C
u, a
nd F
e pr
esen
t are
due
to c
onta
min
atio
n fr
omei
ther
the
TEM
sam
ple
grid
or T
EM in
stru
men
t. Th
e in
sert
deta
ilis
add
ed to
show
the
pres
ence
of N
b an
d B
i bec
ause
the
sign
al to
nois
e ra
tio a
t low
er e
nerg
ies i
s too
smal
l ind
icat
e th
e pr
esen
ce o
f th
e do
pant
s.
148

Sam
ple
CoO
Nb 2
O5
Bi 2O
3C
oO:N
b 2O
5C
oON
b 2O
5B
i 2O3
CoO
:Nb 2
O5
10.
000.
005.
00N
/A<0
.01
<0.0
14.
46N
/A2
0.44
1.56
5.00
1:1
0.25
0.72
2.23
1:2.
93
1.10
3.90
5.00
1:1
0.25
1.29
2.23
1:5.
2
Pre
pare
d (w
t%)
Act
ual (
wt%
)
Tab
le 5
.2.
XR
F da
ta fo
r dop
ed p
late
let p
owde
r sam
ples
. Th
e da
ta sh
ows t
hat a
s the
CoO
and
Nb 2
O5
conc
entra
tions
incr
ease
the
actu
al c
once
ntra
tions
dev
iate
s mor
e fr
om th
e pr
epar
ed c
once
ntra
tion
due
to c
ompe
titiv
e ad
sorp
tion
of th
e do
pant
s on
the
surf
ace.
149

only the dopants specifically absorbed onto the powder surface, the doped powder was
centrifuged to separate the powder from the solution containing unadsorbed dopants.
Figures 5.12a, b, and c illustrate the difference in the CoO, Nb2O5, and Bi2O3
concentrations of the prepared and actual samples. A decrease in the actual dopant
concentration compared to the prepared concentration is present. For the sample with
only Bi2O3 (Sample 1) the drop is minimal compared to the other samples. For the other
samples, the measured dopant concentration is lower than the concentration of added
dopant.
The sample doped with only 5wt% Bi2O3 shows only a slight reduction in the
actual concentration to 4.46wt%. However, for samples with up to 10wt% dopant, the
results show that only 37% of the total dopant concentration is achieved. As the
CoNb2O6 concentration increases the concentration of CoO and Bi2O3 stabilize while the
Nb2O5 concentration continues to increase. This result suggests that the interaction
between the particle surface and the Nb complex is stronger than the other dopants. Not
only is the total dopant concentration lower than expected, but the Co:Nb ration is no
longer that of the desired formulation of 1:3.5, but varies from 1:2.9 to 1:5.2
The specific adsorption of the Nb and Bi complexes on the PEI coated surfaces
occurs by electrostatic attraction. Due to the electrostatic attraction the adsorption is
limited to monolayer coverage and therefore the adsorption typically behaves as a
Langmuir isotherm,
)exp(RTG
nxN abss Δ−= [5.2]
where N is the number of filled sited per area, n is the total number of sites per area, xs is
the mole fraction of dopant in solution, ΔGabs is the free energy of adsorption, R is the
150
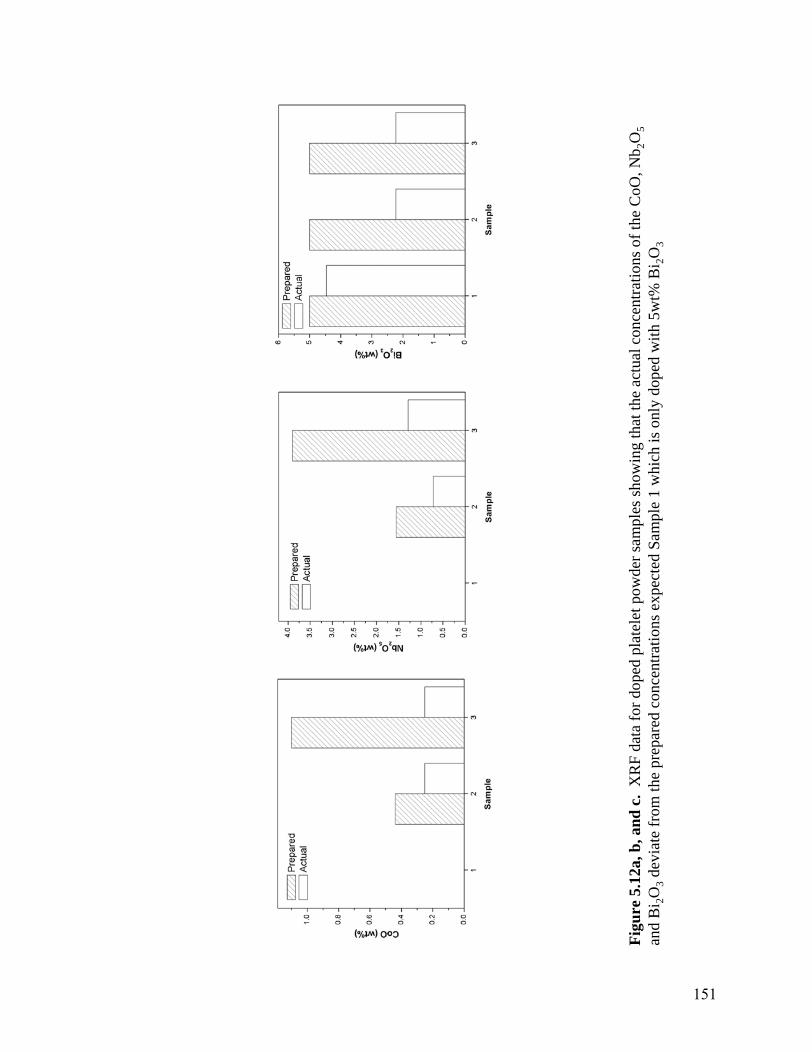
Figu
re 5
.12a
, b, a
nd c
.X
RF
data
for d
oped
pla
tele
t pow
der s
ampl
es sh
owin
g th
at th
e ac
tual
con
cent
ratio
ns o
f the
CoO
, Nb 2
O5
and
Bi 2O
3de
viat
e fr
om th
e pr
epar
ed c
once
ntra
tions
exp
ecte
d Sa
mpl
e 1
whi
ch is
onl
y do
ped
with
5w
t% B
i 2O3
151

universal gas constant, and T is absolute temperature. With a Langmuir isotherm there
are fixed number of possible absorption sites on the powder surface (i.e. n is constant).
When multiple dopants are introduced to the suspension competitive absorption becomes
a problem. When the total dopant concentration is low (≤ 5wt%, Sample 1) this problem
does not exist because there are sufficient sites for adsorption of all of the dopants, but as
the dopant concentration increases the number of empty sites decreases and dopants must
compete for the available sites.
Increasing the number of possible adsorption sites would help overcome the low
adsorption densities. This is possible through the use of a higher surface area powder or
a highly branched polyelectrolyte with more ionizable side groups. A discussion of the
dispersion of the doped BaTiO3 is presented in Appendix B.
5.4 Conclusions
Oxalic acid was is a suitable passivation agent for the aqueous processing of
BaTiO3. Passivation occurs by the formation of a 2 to 3 nm layer of insoluble barium
oxalate on particle surfaces. Because of the low zeta potential provided with oxalate
passivation, a cationic polyelectrolyte, PEI is used to disperse the BaTiO3. Viscosity
measurements show the ability for excess oxalic acid and PEI to react and form a gel
network of amine oxalate, which is detrimental to rheological properties. When excess
oxalic acid is not present, the concentration of PEI affects the conformation of PEI on the
surface leading to bridging flocculation. The rheological properties show that
passivation/dispersion is achieved with oxalic acid and PEI, but there is a limited
concentration range for both reagents in which good dispersion is possible.
152

Using an aqueous solution-based approach platelet particles were doped with Co,
Nb, and Bi. The surface chemistry of the BaTiO3 particles was manipulated, resulting in
the selective deposition of the dopants on the particle surfaces. The development of a
engineered coating during doping was confirmed by surface charge, TEM, and EDS
analysis. Possible uses of these doped particles include the tape casting or electrophoretic
deposition of thin formulated BaTiO3 layers for capacitive applications.
153

References
1. S. Venigalla and J.H. Adair: Theoretical modeling and experimental verification of electrochemical equilibria in the Ba-Ti-C-H2O system. Chem. Mater. 11, (3), 589 (1999). 2. A. Neubrand, R. Linder, and P. Hoffman: Room-temperature solubility behavior of barium titanate in aqueous media. J. Am. Ceram. Soc. 83, (4), 860 (2000). 3. U. Paik and V.A. Hackley: Influence of solids concentration on the isoelectric point of aqueous barium titanate. J. Am. Ceram. Soc. 83, (10), 2381 (2000). 4. A.J. Moulson and J.M. Herbert, Electroceramics: Materials, properties, applications, 1st ed. (Chapman & Hall, London, 1990). 5. J.H. Adair and H.G. Krarup: The role of solution chemistry in understanding colloidal stability of ceramic suspensions. In Advances in Process Measurements for the Ceramics Industry, edited by A. Jillavenkatesa, and G.Y. Onoda, (American Ceramic Society, 1999) pp 205. 6. C.R. Baes and R.E. Mesmer, The Hydrolysis of Cations, 1st ed. (Wiley, New York, NY, 1976). 7. M.M. Lencka and R.E. Riman: Thermodynamic modeling of hydrothermal synthesis of ceramic powders. Chem. Mater. 5, (1), 61 (1993). 8. K. Osseo-Asare, F.J. Arriagada, and J.H. Adair: Solubility relationships in the coprecipitation synthesis of barium titanate: Heterogeneous equilibria in the Ba-Ti-C2O4-H2O system. In Ceramic Transactions, Ceramic Powder Science, edited by G.L. Messing, E.R. Fuller, Jr., and H. Hausner, (The American Ceramic Society, 1988) pp 47. 9. P. Bendale, S. Venigalla, J.R. Ambrose, E.D. Verink, and J.H. Adair: Preparation of barium-titanate films at 55-degrees-C by an electrochemical method. J. Am. Ceram. Soc. 76, (10), 2619 (1993). 10. M.C. Blanco-Lopez, B. Rand, and F.L. Riley: The properties of aqueous phase suspensions of barium titanate. J. Euro. Ceram. Soc. 17, 281 (1997). 11. U. Paik, S. Lee, and V.A. Hackley: Influence of barium dissolution on the electrokinetic properties of colloidal BaTiO3 in an aqueous medium. J. Am. Ceram. Soc. 86, (10), 1662 (2003). 12. B. Lee, S. Chung, and S.L. Kang: Necessary conditions for the formation of {111} twins in barium titanate. J. Am. Ceram. Soc. 83, (11), 2858 (2000). 13. M.C.B. Lopez, G. Fourlaris, and F.L. Riley: Interaction of barium titanate powders with an aqueous suspending medium. J. Euro. Ceram. Soc. 18, (14), 2183 (1998).
154

14. J.H. Adair, B.L. Utech, K. Osseo-Asare, and J.P. Dougherty, Solubility and phase stability of barium titanate in aqueous suspension, edited by J.P. Dougherty, and K. Wakino (in Proceedings of the Fifth US-Japan Seminar on Dielectric and Piezoelectric Ceramics, Kyoto, Japan, 1991), pp. 15. P. Duran, J. Tartaj, and C. Moure: Sintering behavior and microstructural evolution of agglomerated spherical particles of high-purity barium titanate. Ceram. Int. 29, 419 (2003). 16. Y. Koh, Y. Kong, S. Kim, and H. Kim: Improved low-temperature environmental degradation of yttria-stabilized tetragonal zirconia polycrystals by surface encapsulation. J. Am. Ceram. Soc. 82, (6), 1456 (1999). 17. T. Hanrath and B.A. Korgel: Chemical surface passivation of Ge nanowires. J. Am. Chem. Soc. 126, 15466 (2004). 18. R.P. Vasquez, B.D. Hunt, and M.C. Foote: Wet chemical passivation of YBa2Cu3O7-
x. J. Electrochem. Soc. 137, (7), 2344 (1990). 19. M. Nayak, M. Ando, and N. Murase, Passivation of CdTe nanoparticles by silane coupling agent assisted silica encapsulation, edited by H. Lin, and M. Singh (in 26th Annual Conference on Composites, Advanced Ceramics, Materials, and Structures: B, 23(4),Cocoa Beach, FL, 2002), pp 695. 20. C. Shih, C. Shih, Y. Su, L.H.J. Su, M. Chang, and S. Lin: Effect of surface oxide properties on corrosion resistance of 316L stainless steel for biomedical applications. Corr. Sci. 46, 427 (2004). 21. R.J. Jouet, A.D. Warren, D.M. Rosenberg, and V.J. Bellitto, Surface passivation of bare aluminum nanoparticles using perfluoroalkyl carboxylic acids, edited by R. Armstrong, N. Thadhani, W. Wilson, J. Gilman, and R. Simpson (in Synthesis, Characterization and Properties of Energetic/Reactive Nanomaterials, 800,Boston, MA, 2003), pp 67. 22. W.J. Merz: The electrical and optical behavior of BaTiO3 single-domain crystals. Phys. Rev. 76, (8), 1221 (1949). 23. B. Jaffe, W.R. Cook, and H. Jaffe, Piezoelectric Ceramics, 1st ed. (Academic Press, London, 1971). 24. G.H. Wiseman: Advanced manufacturing process for zinc oxide surge arrester disks. Key Eng. Mater. 150, 209 (1998). 25. S. Ural: Aggregate breakdown and aqueous processing of zinc oxide varistors. M.S. Thesis, The Pennsylvania State University, University Park, PA, (2003).
155

26. X. Liu: Structure-property relationships in submicron X7R dielectric materials. M.S. Thesis, The Pennsylvania State University, University Park, PA, (1999). 27. S.A. Bruno: Ceramic dielectric compositions and method for enhancing dielectric properties. US Patent # 5,082,811, (1992). 28. D.A. Anderson, J.H. Adair, D.V. Miller, J.V. Biggers, and T.R. Shrout: Surface chemistry effect on ceramic processing of BaTiO3 powder. In Ceramic Transactions, Ceramic Powder Science, edited by G.L. Messing, E.R. Fuller, Jr., and H. Hausner, (The American Ceramic Society: Westerville, OH, 1988) pp 485. 29. J.F. Fernandez, P. Duran, and C. Moure: Influence of the doping method on X7R based-dielectric capacitors. Ferroelectrics 127, 47 (1992). 30. T.J. Yosenick, D.V. Miller, R. Kumar, J.A. Nelson, C.A. Randall, and J.H. Adair: Synthesis of nanotabular barium titanate via a hydrothermal route. J. Mater. Res. 20, (4), 837 (2005). 31. D. Horn: Polyethylenimine - Physiochemical properties and applications. In Polymeric Amines and Ammonium Salts, edited by E.J. Goethals, (Pergamon Press, 1979) pp 333. 32. D.F.K. Hennings and B.S. Schreinemacher: Temperature-stable dielectric materials in the system BaTiO3-Nb2O5-Co3O4. J. Euro. Ceram. Soc. 15, (4), 463 (1994). 33. H. Chazono and H. Kishi: Sintering characteristics in BaTiO3-Nb2O5-Co3O4 ternary system: I, Electrical properties and microstructure. J. Am. Ceram. Soc. 82, (10), 2689 (1999). 34. Y. Kuromitsu, S.F. Wang, S. Yoshikawa, and R.E. Newnham: Interactions between barium titanate and binary glasses. J. Am. Ceram. Soc. 77, (2), 493 (1994). 35. I. Burn: Flux-sintered BaTiO3 dielectrics. J. Mater. Sci. 17, 1398 (1982). 36. Y. Narendar and G.L. Messing: Synthesis, decomposition and crystallization characteristics of peroxo-citrato-niobium: An aqueous niobium precursor. Chem. Mater. 9, 580 (1997). 37. G.H. Kirby, D.A. Harris, Q. Li, and J.A. Lewis: PAA-POE comb polymer dispersants for colloidal processing. Key Eng. Mater. 264-268, 161 (2004). 38. G.H. Kirby, D.A. Harris, Q. Li, and J.A. Lewis: Poly(acrylic acid)-poly(ethylene oxide) comb polymer effects on BaTiO3 nanoparticle suspension stability. J. Am. Ceram. Soc. 87, (4), 181 (2004).
156

39. U. Paik, V.A. Hackley, J. Lee, and S. Lee: Effect of poly(acrylic acid) and poly(vinyl alcohol) on the solubility of colloidal BaTiO3 in an aqueous medium. J. Mater. Res. 18, (5), 1266 (2003). 40. A. Hodgkinson, Oxalic acid in biology and medicine, 1st ed. (Academic Press, London, England, 1977). 41. M.M. Mandanas, W. Shaffer, and J.H. Adair: Aqueous processing and stabilization of manganese zinc ferrite powders via a passivation-dispersion approach. J. Am. Ceram. Soc. 85, (9), 2156 (2002). 42. R.A. Kimel and J.H. Adair: Aqueous degradation and chemical passivation of yttria-tetragonally-stabilized zirconia at 25 degrees C. J. Am. Ceram. Soc. 85, (6), 1403 (2002). 43. E.A. Mazurenko and B.I. Nabivants: Oxalto complexes of titanyl. Soviet Progress in Chemistry 33, (1), 86 (1967). 44. C. Boudaren, T. Bataille, J.P. Auffredic, and D. Louer: Synthesis, structure determination from powder diffraction data and thermal behavior of titanium(IV) [Ti2O3(H2O)2](C2O4).H2O. Solid State Sci. 5, 175 (2003). 45. J.H. Adair, E. Suvaci, and J. Sindel: Surface and colloid chemistry of advanced ceramics. In Encyclopedia of Materials: Science and Technology, edited by K.H.J. Buschow, R.W. Cahn, M.C. Flemings, B. Ilschner, E.J. Kramer, and S. Mahajan, (Elsevier Elsvier Science, Ltd., 2001) pp 8996. 46. R.J. Hunter, Zeta potential in colloid science: Principles and applications, 1st ed. (Academic Press, San Diego, CA, 1981). 47. R. Vaidhyanathan, S. Natarajan, and C.N.R. Roa: Synthesis of a hierarchy of zinc oxalate structures from amine oxalates. J. Chem. Soc., Dalton Trans. 5, 699 (2001). 48. B.A. Firth and R.J. Hunter: Flow properties of coagulated colloidal suspensions. III. The elastic flow model. J. Colloid Interface Sci. 57, (2), 266 (1976). 49. R.J. Hunter, R. Matarese, and D.H. Napper: Rheological behavior of polymer flocculated latex suspensions. Coll. Surf. 7, 1 (1983). 50. E. Poptoshev and P.M. Claesson: Forces between glass surfaces in aqueous polyethylenimine solutions. Langmuir 18, 2590 (2002). 51. T. Radeva and I. Petkanchinh: Electric properties and conformation of polyethylenimine at the hematite-aqueous solution interface. J. Colloid Interface Sci. 196, (1), 87 (1997).
157

52. J.P. Sadler and Z. Guo: Metal complexes in medicine: Design and mechanisms of action. Pure Appl. Chem. 70, (4), 863 (1998).
158

CHAPTER SIX
Electrophoretic Deposition of Hydrothermally Derived Barium Titanate Tabular
Nanoparticles with a Cationic Dispersant
6.1 Introduction
Demands on cellular and mobile technologies have motivated the miniaturization
of passive electronic components. Currently, tape casting is used in the fabrication of
passive electronic components with layer thicknesses of 1 μm.1 The increase in
volumetric efficiency of multilayer device with decreasing layer thickness is well
known.2 Therefore, an enhanced thin film processing technique for the lay down of thin
dielectric layers would be an effective way to increase device performance.
Electrophoretic deposition (EPD) is an ideal technique for the deposition of thin metal
and dielectric layers in passive electronic components.3
EPD is a colloidal processing technique in which the driving force for deposition
is an applied electric field. Electrodes are immersed in a particle suspension and an
electric field is applied. The charged particles in suspension migrate towards the
oppositely charged electrode. Once the particles reach the electrode they rearrange and
deposit, forming a uniform coating on the electrode. Films prepared using EPD exhibit
high green density and homogenous microstructures.4 The first observation of EPD was
by Harsanyi in 1927.5 Since then, many researchers have investigated EPD as a
processing route for a variety of complex structures and engineered materials.6-11
159

EPD offers several distinct advantages over other thin film processing and coating
techniques. For example, EPD can be used to deposit films with controlled thickness
ranging from millimeters to nanometers. Recently, it has been shown that EPD can be
used to deposit films as thin as 400 nm from well-dispersed Ag particle suspensions.3 In
addition to excellent thickness control, EPD can be used to deposit a wide variety of
materials. Any metal, ceramic, semiconductor, and organic particle that is chemically
stable and develop a surface charge in a suitable solvent can be deposited using EPD.
EPD films conform to the underlying electrode when depositing, therefore combining
EPD with other materials fabrication techniques (i.e. photolithography) allows for the
deposition of complex structures. Recently, von Both and Hausselt showed the feasibility
of complex three dimensional coatings by using EPD to deposit alumina on three
dimensional electrodes patterned using photolithography.6
The EPD process is relatively simple when compared to other thin film processing
techniques, some of which may require vacuum chambers or atmospheric control.
Because of this fact, EPD is generally less expensive than other techniques. In EPD, film
chemistry is defined during particle synthesis and dispersion. In other techniques, such
as sol-gel, chemical-vapor-deposition, metal oxide chemical-vapor-deposition, and
physical-vapor-deposition, the chemistry is controlled during the process. Therefore,
there are no processing variables during EPD which affect the film chemistry.
With the increased interest in nanoparticles and the drive towards reduced layer
thickness in MLCCs, EPD has become an ideal processing technique for the deposition of
thin BaTiO3 layers. The kinetics and mechanisms of EPD along with the surface
chemistry of the depositing particles are dependent on the chemistry of the solution phase
160

of the suspensions. It is therefore important to investigate the interdependence of
deposition and suspension stability. The current study focuses on the effect of solution
chemistry (i.e. dispersant concentration, ionic strength, conductivity, etc…) on the
kinetics of EPD and evolution of the resultant films.
6.2 Theoretical Background – Mechanisms of EPD
EPD can be dissected into a three step process: (1) dispersion, (2) migration, and
(3) deposition. In colloidal processing the green microstructure of materials is highly
dependent on the state of dispersion prior to consolidation.12-14 Therefore, for EPD to
produce dense homogenous layers a well-dispersed particulate suspension must be
available. Significant research effort has focused on understanding the dispersion of a
variety of materials systems.15 Migration of particles from the bulk solution to the
electrode surface occurs via electrophoresis, which has been well-studied.16-18 During
deposition the particle suspension is destabilized in a controlled manner at the electrode.
Unlike dispersion and electrophoresis, the mechanisms of deposition have not been
thoroughly studied and remain in some doubt. Recently, van Tassel completed an
overview of the mechanisms of electrophoretic deposition and identified 11 different
deposition mechanisms.19 Each mechanism is defined by the process used to destabilize
the suspension and consolidate the particle into a film at the electrode. Each mechanism
is highly dependent on the solution chemistry of the particulate suspension.
The first attempt to model the deposition process was that of Hamaker and
Verwey.20 Hamaker and Verwey observed that suspensions used for EPD produced
sediment layers if allowed to settle. They reasoned that since the EPD process was
161

similar to sedimentation, that an external force causes the particles to overcome the
repulsive interaction and agglomerate. It was also believed that particles at the solution-
film interface exert an extra force on the particles in the film close to the electrode
leading to an increase in density.
Koelmans and Overbeek theorized that increased ionic strength at the electrode,
due to electrochemical reactions, decreased particle zeta potentials, which lead to
agglomeration of the particles, forming a deposit.21 Brown and Salt calculated the
electric field necessary to overcome the repulsive interaction of the particles and their
predictions agreed well with oxide materials.22 They also deposited metal particles via
the addition of aluminum chloride. The aluminum chloride was believed to form
aluminum hydroxide as a polymeric network that percolated throughout the deposit.
Sarkar and Nicholson observed the deposition of particles on a dialysis membrane
located away from the electrode.23 From this observation they claimed that
electrochemical reactions at the electrode have no role in the deposition process. They
theorized that an electrophoretic force similar to that proposed by Hamaker and Verwey,
aids in overcoming the repulsive interactions between particles. The electrophoretic
force, in combination with double layer polarization, due to electrophoresis, permit the
particles to agglomerate. Recently Kershner et al.24 stated electrochemical reactions that
occur at the deposition electrode change the local pH and drive the suspension pH to the
isoelectric point (IEP) of the suspension.
As van Tassel has explained (see Table 2.4 of Ref 19) most or combinations of
these mechanisms are responsible for deposition, but with such a wide range of
mechanisms it is difficult to fully elucidate the deposition process. Added to the
162

complexity is that each mechanism has an underlying effect on the solution chemistry in
a region located near the electrode. Those properties that control the dispersion and
electrophoresis of the particle in bulk of suspension change greatly near the electrode and
without a priori knowledge of the changes, a basic understanding of the deposition
mechanisms is difficult.
6.3 Materials and Methods
Suspensions for EPD were prepared from two different BaTiO3 powders: a
commercially available equiaxed BaTiO3 (BT-01, Sakai Chemical Company, Osaka,
Japan) with a particle size of 88.2 nm, as determined by BET, and a hydrothermally
derived platelet BaTiO3. The platelet powder has a median thickness of 5.8 ± 3.1 nm
with a median diameter of 27.1 ± 12.3 nm and a surface area of 10.5 m2/g. The details of
synthesis and physical properties of the platelet powder have been described previously.25
Electrostatic, electro-steric, and passivation/dispersion schemes were all used in
the preparation of 0.1vol% suspensions of equiaxed powder. Ethanol (200 proof,
Pharmco, Brookfield, CT) was used as the solvent in all dispersion experiments.
Solutions of 0.1 M hydrochloric acid (HCl) (35-37% JT Baker, Phillipsburg, NJ) and
tetraethylammonium hydroxide (TMAOH) (35 wt% solution in methanol, Aldrich
Chemical Company, Milwaukee, WI) were used to adjust pH and to provide surface
charge in the electrostatic dispersion experiments. The pH of the suspensions was
measured using ion-selective field effect transistor (IS-FET) probes (Sentron Hotline
Probe, RL Instruments, Manchoung, MA) which were calibrated using NIST traceable
aqueous pH standards with nominal values of 4, 7, and 10. The electrophoretic mobility
163

of the suspensions was measured using electrophoretic light scattering (ZetaPALS,
Brookhaven Instrument Corp., Holtsville, NY).
The use of ethanol for dispersion results in the Debye length (κ-1) of the electrical
double layer and particle radius (a) having similar length scales. Resulting is
intermediate κa values, which were outside the limits of both the Smoluchowski and
Hückel approximations for the calculation of zeta potential from electrophoretic mobility
data. The zeta potential was calculated from the measured motilities using the approach
outlined by O’Brien and White.26 For the electrosteric dispersion experiments, anionic
ammonium acrylate dispersants (Darvan C and 821A, R.T. Vanderbilt, Norwalk, CT) and
a cationic polyelectrolyte polyethylenimine (PEI) (25,000 MW, Aldrich Chemical
Company, Milwaukee, WI) were used as dispersants.
For the passivation/dispersion experiments oxalic acid dihydrate (HOx) (Fisher
Scientific, Fair Lawn, NJ) was used as a passivation agent. HOx was added in
concentrations of 1, 3, 4 and 5 wt% with respect to solids present (w/w). Prior to the
addition of the powder, the pH of the oxalic acid solution was adjusted to greater than pH
13 with TMAOH. This was done to ensure complete dissociation of the acid so that it
can allow for the reaction of the oxalate ion with the BaTiO3 surface. After passivation,
the HOx/BaTiO3 suspensions were washed twice with 200 proof ethanol using
centrifugation (7500 rpm, 10min) to remove unreacted HOx and TMAOH. After
washing, the particles were redispersed using an acidified (1mM HCl) PEI/ethanol
solution with PEI concentrations ranging from 0.1 to 2 w/w. Suspensions of the
hydrothermally synthesized BaTiO3 were dispersed using the passivation/dispersion
technique approach described above for comparison to the equiaxed BaTiO3 dispersions.
164

Suspensions of 0.1vol% hydrothermal BaTiO3 with 5w/w HOx and 0.1w/w PEI
were prepared using lithium chloride (LiCl) (99%, Aldrich Chemical Company,
Milwaukee, WI), an indifferent electrolyte. Suspensions were prepared with 0, 0.5, 1, 2,
and 5 mM LiCl. Suspensions of 0.1wt% Pt (0.15-.045 micron, Alfa Aesar, Ward Hill,
Ma) were prepared from the filter supernatant of the hydrothermal BaTiO3 suspensions to
ensure that the platelet and Pt suspensions had identical solution chemistries. The zeta
potential of the BaTiO3 and Pt suspensions were measured as described above.
Cyclic voltammetry (CV) was performed on solutions of ethanol with HCl, LiCl,
and PEI, to determine the effect of ionic strength and dispersant concentration on the
electrochemistry of EPD. Experiments were conducted using a computer controlled
potentiostat (SI 1287 Electrochemical Interface, Solartron, UK) with CorrWare software,
a circular Pt working electrode (1.6 mm diameter, MF-2031, Bioanalytical Systems, West
Lafayette, IN), a Pt mesh (25 mm x 25mm, 52 woven mesh, Alfa Aesar, Ward Hill, MA)
counter electrode and a saturated calomel electrode (SCE) reference. Scans were
performed at a rate of 100 mV/sec from +3 to -3 V versus SCE. Impedance spectroscopy
was also performed on solutions of pure ethanol with 10-3 M HCl with varying amounts
of PEI. The electrode system was changed to a parallel plate conductivity probe with Pt
electrodes for impedance spectroscopy. Scans were run from 106 to 10-3 Hz with an
applied voltage 100 mV. Data was analyzed and fit to a user designed equivalent circuit
using commercially available software (ZView, Ver 2.2, Scribner Associate, Inc.,
Southern Pines, NC).
A series of Ba2+ dissolution studies were conducted on the equiaxed powder to
determine the chemical stability of the powder in ethanol. Suspensions of 1wt% BaTiO3
165
in ethanol were prepared by pre-adjusting the pH of the ethanol with 0.1 M HCl solutions
to pH 2.4, 4.5, 6.5, and 8.3 followed by the addition of the powder. Stirred suspensions
were equilibrated for 24 hrs. The suspensions were centrifuged and the supernatant was
filtered through a 0.22 micron syringe filter. Directly coupled plasma – emission
spectroscopy (DCP-ES) (Spectraspan III, Spectrametrics Inc., Andover, MA) was used to
determine the Ba2+ concentration in solution at 455.4 nm. Barium standards were
prepared by serial dilution from NIST traceable stock solutions.
MylarTM sputtered with Pt was used as a substrate for most deposition
experiments. Samples for TEM cross-section were deposited on single crystal Si wafers
sputtered with Ag/Pd. EPD of the nanoplatelet suspensions was performed under
constant voltage conditions in a TeflonTM cell with vertical electrodes spaced 2.5 cm
apart. Voltage was applied with current monitored using a source meter (Model 2410,
Keithley Instruments, Cleveland, OH) with deposition times ranging from 2 to 10 min.
After deposition, samples were dried in air at room temperature for at least 2 hrs. then
samples of known area were cut from the dried films and the mass was measured to
determine the deposition rate. Cross-sectioned samples for TEM analysis were prepared
by the small angle cleavage technique27 (SACT). X-ray diffraction (XRD) (Scintag Pad
V, Thermo-ARL, Dearborn, MI) was performed on films deposited from platelet powder
suspensions. Continuous scans were run from 15-75° 2θ at a rate of 0.2°/sec.
166

6.4 Results and Discussion
6.4.1 Dispersion
Since EPD is a colloidal processing technique the green density and
microstructure of deposited films is dependent on the state of dispersion of the particles
prior to deposition. In addition to affecting the microstructure the agglomerate size in
suspension limits the minimum layer thickness that can be deposited. Therefore a study
of the dispersion of BaTiO3 in a suitable solvent system prior to deposition was required.
Because electrophoresis is necessary for the migration of the particles to the electrode, an
electrostatic component to the dispersion must be present. Electrostatic and electrosteric
dispersion require a protic solvent that can support charge and promote solution-solid
reactions to develop surface charge.
While water is an ideal solvent choice based on dispersion, electrochemical
reactions between the water and the electrodes prevent the selection of water. Water is
readily reduced at the cathode during deposition, leading to the generation of hydrogen
gas bubbles in the deposit.23 Therefore, non-aqueous solvents are typically used for EPD
because of their low water content, but a relatively polar solvent is necessary for good
dispersion. Ethanol is an excellent choice because it has relatively low water content, yet
supports charge well and allows for electrostatic dispersion.
The chemical instability of BaTiO3 in aqueous environments is well-
documented.28-30 It is also known that surface passivation is necessary to limit Ba2+
dissolution during the aqueous processing BaTiO3.31, 32 Because ethanol it still relatively
polar and can contain significant amounts of water it was necessary to determine the
chemical stability of BaTiO3 in ethanol. Table 6.1 is DCP-ES data from dissolution
167

pHB
a2+ C
once
ntra
tion
(ppb
)2.
315
84.
539
56.
515
88.
3<7
9
Tab
le 6
.1.
Con
cent
ratio
n of
Ba2+
in p
ure
etha
nol a
s det
erm
ined
by
dire
ct c
oupl
e pl
asm
a em
issi
on sp
ectro
scop
y. R
esul
ts sh
ow th
e di
ssol
utio
n of
Ba2+
in p
ure
etha
nol i
s not
pre
vale
nt a
nd th
eref
ore
surf
ace
pass
ivat
ion
is n
ot n
eces
sary
prio
r to
disp
ersi
on.
168

experiments of the equiaxed powder in ethanol. The results indicate that Ba2+ dissolution
is not prevalent in ethanol, and that surface passivation of BaTiO3 with oxalic acid is not
required in ethanol. Therefore, an electrostatic approach to dispersion was first
attempted. Figure 6.1 gives the zeta potential as a function of HCl concentration for the
equiaxed powder. Small additions of HCl result in a high positive zeta potential, but as
the HCl concentration increases, the zeta potential decreases. The decrease is due to the
collapse of the electrical double layer as the ionic strength of the solution increases.15
Suspensions prepared using an electrostatic dispersion approach in ethanol were not
stable and therefore not suitable for EPD.
Since an electrostatic approach was not successful in creating stable dispersion, an
electrosteric approach was used. Electrosteric dispersion uses a charged polymer that
absorbs onto the particle surface and provides both surface charge and a steric
repulsion.15 The steric component limits the distance of closest approach of particles
reducing particle to particle responsible for aggregation. Convnetional anionic
polyacrylate-based dispersants were initially used because of the positive surface charge
of BaTiO3, but were insoluble in ethanol, and therefore not suitable for dispersion.
Suspensions were next prepared with a cationic polyelectrolyte (PEI), but PEI did not
adsorb due to the positive surface charge of the native BaTiO3 surface. Again the
suspensions prepared were not stable or suitable for EPD.
With both previous attempts at dispersion unsuccessful, a third approach was
attempted. PEI is still a good choice as a dispersant because it provides a high degree of
surface charge and it is soluble in ethanol; however PEI requires a negative surface
charge for absorption. Therefore, to use PEI it is necessary to condition the BaTiO3 and
169

Figu
re 6
.1.
Zeta
pot
entia
l of e
quia
xed
BaT
iO3
pow
der s
how
s tha
t the
zet
a po
tent
ial d
ecre
ases
as t
he H
Cl c
once
ntra
tion
incr
ease
s du
e to
incr
ease
d io
nic
stre
ngth
in so
lutio
n. A
lthou
gh h
igh
zeta
pote
ntia
l val
ues a
re o
bser
ved,
susp
ensi
ons p
repa
red
by e
lect
rost
atic
di
sper
sion
wer
e no
t sta
ble
and
ther
efor
e no
t sui
tabl
e fo
r dep
ositi
on.
170

create a negative surface. The passivation/dispersion is an approach used previously in
the aqueous dispersions of BaTiO3 that limits Ba2+ dissolution through the use of a
passivation agent.32 Passivation of the BaTiO3 surface is achieved by the addition of
oxalic acid (HOx) to form a thin layer of barium oxalate (BaC2O4) on the surface.
Barium oxalate has a stable negative surface charge suitable for dispersion by the
addition of PEI. In the current work HOx is not used to passivate the surface, because
ICP results show that Ba2+ dissolution is negligible, but to create a stable negative surface
charge for the adsorption of PEI. The zeta potentials as a function of PEI concentration
are shown in Figure 6.2. As the HOx concentration increases, the surface charge
becomes negative and with the addition of the PEI the surface charge becomes positively
charged.
To quantitatively measure the state of dispersion of particulate suspensions, a
figure of merit called the average agglomeration number, AAN(50), can be calculated
using the following equation33,
3
3)50()50(ESD
DVolume
VolumeANN
BET
eringLightScatt == [6.1]
where D(50) is the medium particle of the particle suspension measured by light
scattering, and ESD is the equivalent equiaxed diameter calculated from the BET surface
area. The ANN(50) represents the average number of primary particles in an
agglomerate in suspension and is based on the assumption of ideal equiaxed particles. In
general, ANN(50) ≤ 10 is considered a well-dispersed system.33 For the equiaxed
powder suspensions an ANN(50) of 7.7 was the best value and was achieved with 5 w/w
HOx and 2 w/w PEI. Because of its high degree of dispersion this suspension was used
in the preliminary deposition experiments.
171

Figu
re 6
.2.Z
eta
pote
ntia
l of e
quia
xed
BaT
iO3
as a
func
tion
of P
EI c
once
ntra
tion
for d
iffer
ing
conc
entra
tions
of o
xalic
aci
d w
ith
incr
easi
ngly
neg
ativ
e su
rfac
e ch
arge
. Th
e ne
gativ
e su
rfac
e ch
arge
is su
itabl
e fo
r the
ads
orpt
ion
of a
cat
ioni
c di
sper
sant
, PEI
.A
s th
e PE
I con
cent
ratio
n in
crea
ses t
he si
gn o
f the
surf
ace
char
ge re
vers
es.
A P
EI c
once
ntra
tion
of 2
w/w
resu
lts in
zet
a po
tent
ial
valu
es o
f app
roxi
mat
ely
80 m
V.
All
susp
ensi
ons p
repa
red
had
an H
Cl c
once
ntra
tion
of 1
0-3M
.
172

The same passivation/dispersion approach was used for the dispersion of the
hydrothermal BaTiO3, and yielded similar results, well-dispersed suspension suitable for
EPD. Figure 6.3 summarizes the particle size distributions for the hydrothermal powder
with 5w/w HOx and varying PEI. Improved dispersion is observed in suspensions with
less PEI; the optimum dispersion being in the presence of 0.25 w/w PEI, yielding a D(50)
= 16.6 nm. With an ESD of 97.3 nm, an ANN(50) of 0.005 is calculated. Due to the
anisotropic nature of the particles an analysis of dispersion based on ANN(50) is not
valid.
6.4.2 EPD
6.4.2.1 Kinetics
The kinetics of deposition is rate-limited by the electrophoretic mobility, and
therefore the variables that affect electrophoresis affect the kinetics of deposition.
Electrophoresis is a balance of the forces on a particle due to the applied electric field and
the viscous drag on the particle as it travels through the fluid. The velocity of a particle
during electrophoresis was calculated by Smoluchowski16, Hückel17, and Henry18 and is
equal to:
ηεζECv = [6.2]
where η is the viscosity of the solvent, ζ is the zeta potential of the particle, ε is the
dielectric constant of the solvent, E is the applied field, and C is a constant ranging from
2/3 to 1; with the velocity independent of particle size. The effective electric field is that
of the bulk of the solution and not the net field as determined by the applied voltage
divided by the interelectrode spacing. The effective field is dependent on a variety of
factors including the solution chemistry, specifically the solution conductivity, and the
173

Figu
re 6
.3.
Parti
cle
size
dis
tribu
tion
for t
he H
Ox/
PEI d
ispe
rsed
pla
tele
t par
ticle
s sho
ws t
hat a
PEI
con
cent
ratio
n of
onl
y 0.
25w
/w
resu
lts in
the
best
dis
pers
ion
with
a m
edia
n pa
rticl
e si
ze, D
(50)
, of 1
6.6
nm.
Low
PEI
con
cent
ratio
ns d
o no
t pro
vide
eno
ugh
surf
ace
char
ge fo
r goo
d di
sper
sion
whi
le h
igh
PEI c
once
ntra
tions
can
resu
lt in
brid
ging
floc
cula
tion
whi
ch d
egra
des d
ispe
rsio
n.
All
susp
ensi
ons p
repa
red
had
2w/w
HO
x an
d 10
-3M
HC
l.
174

structure of the electrode-solution interface. To fully investigate the kinetics of EPD, the
electrochemistry and structure of the electrode-solution interface must be understood.
Figures 6.4a and b are a simple circuit diagram for the EPD cell and a schematic
of the corresponding ideal Cole-Cole plot for the circuit. Rexp and Ccell are the resistance
of the experimental setup and the capacitance of the EPD cell, respectively. Rsol is the
solution resistance and is due to the mobile charged species in solution. Cdl is the double
layer capacitance associated with the electrode-solution interface. Rtran is the charge
transfer resistance and is due to the passage of charge from the electrode to the solution.
Under DC conditions the impedances of Ccell and Cdl are infinite and the circuit diagram
reduces to three resistors in series, Rexp, Rsol, and Rtran. Since Rexp is constant and solely
dependent on the experiment setup, Rsol and Rtran are the two variables that affect the
effective electric field in the bulk of suspension. Changes in either solution resistance or
transfer resistance should affect the kinetics of deposition.
In the initial deposition experiments on equiaxed powders, no deposition was
observed for applied voltages as high as 500V. Low current densities (<10 nA/cm2) were
observed during deposition at lower applied voltages (20 V), indicating there was a high
resistance element present in the EPD cell. The solution resistance is easily measured
with a conductivity probe, whereas it is necessary to use a different electrochemical
technique to measure the electron transfer resistance and model the solution-electrode
interface.
To determine the reason for the reduced kinetics, cyclic voltammetry (CV) and
impedance spectroscopy were used to investigate the solution-electrode interface. Since
it is possible for any or all constituents of the solution to interact with the electrode
175

Figu
re 6
.4a
and
b.(a
) Ide
al e
quiv
alen
t circ
uit f
or th
e EP
D c
ell.
Rex
pan
d C
cell
are
the
expe
rimen
tal s
etup
resi
stan
ce a
nd
capa
cita
nce
of th
e EP
D c
ell,
resp
ectiv
ely.
Bot
h ar
e de
pend
ent o
n th
e ex
perim
enta
l set
up a
nd re
mai
n co
nsta
nt.
Rso
lis t
he so
lutio
n re
sist
ance
, Cdl
is th
e ca
paci
tanc
e of
the
elec
trode
dou
ble
laye
r, an
d R
tran
is th
e el
ectro
n tra
nsfe
r res
ista
nce
of e
lect
roch
emic
al
reac
tions
. (b)
Sch
emat
ic re
pres
entin
g th
e id
eal C
ole-
Col
e pl
ot fo
r the
equ
ival
ent c
ircui
t.
176

surface34 it is necessary to analyze samples with individual constituents and combinations
of constituents in solution to deconvolute the intrinsic contributions of each. CV was
performed on solutions of ethanol, ethanol with 10-3 M HCl, and ethanol with 10-3 M HCl
and 1wt% PEI to check for the presence of electrochemical reactions. Figure 6.5 is the
cyclic voltammogram for the three solutions. The solution of pure ethanol shows no
observable reactions. When HCl is added two reactions are observed:
)(222 gHeH −+ + [6.3]
−− ++ OHHeOH g 222 )(22 [6.4]
On the addition of PEI to the solution the two electrochemical reactions in Equations 6.3
and 6.4 are no longer observed. Electrochemical reactions are necessary for charge
transfer between the electrode and solution. Without electrochemical reactions the
transfer resistance increases.35 CV shows that PEI prevents electrochemical reactions,
but since CV cannot quantify the change in the transfer resistance; it is necessary to use
impedance spectroscopy to measure the transfer resistance. Figure 6.6 is a Cole-Cole
plot for a solution of 10-3 M HCl in ethanol. In a circuit diagram, a capacitor and resistor
in parallel give an ideal Debye relaxor that appears as a semi-circle on a Cole-Cole plot.36
However, in Figure 6.6 the center of the second semi-circle is depressed below the x-axis.
On a Cole-Cole plot a depressed semi-circle is due to the replacement of the ideal
capacitor in a Debye relaxor with a constant phase element (CPE).37 The impedance of a
CPE is,
nCPE iCZ
)(1ω
= [6.5]
where C is the capacitance, ω is the angular frequency, and n is the CPE exponent.
177

Figu
re 6
.5.
Cyc
lic v
olta
mag
ram
mfo
r thr
ee e
than
ol so
lutio
ns c
onta
inin
g H
Cl a
nd P
EI.
The
addi
tion
of 1
mM
HC
l sho
ws t
he
evid
ence
of t
wo
elec
troch
emic
al re
actio
ns th
at o
ccur
at t
he c
atho
de b
oth
of w
hich
hav
e a
prof
ound
eff
ect o
n th
e pH
of t
he so
lutio
n ne
ar th
e ca
thod
e. T
he p
rese
nce
of P
EI in
hibi
ts th
e el
ectro
chem
ical
reac
tions
by
adso
rbin
g on
to th
e el
ectro
de a
nd in
crea
sing
the
elec
tron
trans
fer r
esis
tanc
e at
the
cath
ode.
178

Figu
re 6
.6.
Col
e-C
ole
plot
for a
10-3
M H
Cl s
olut
ion
in e
than
ol. T
he c
ente
r of t
he se
cond
sem
i-circ
le is
dep
ress
ed b
elow
the
x-ax
is in
dica
ting
the
Cdl
is n
ot a
n id
eal c
apac
itor b
ut a
con
stan
t pha
se e
lem
ent,
whi
ch is
due
the
roug
hnes
s of t
he e
lect
rode
surf
ace.
179

A CPE is representative of inhomogenieties or non-ideal systems and is due to a variety
of aspects such as a rough electrode surface38, the inhomogeneous adsorption of organics
on the electrode39, or a distribution of reaction rates.40
Table 6.2 is a list of solution and transfer resistances for ethanol solutions with
increasing PEI concentrations. For pure ethanol both the solution resistance and transfer
resistance are large due to a few carriers and electrochemically active species. As
expected, HCl results in a decrease in the values of both. Adding PEI reduces the
solution resistance and results in an initial rise in the transfer resistance follow by a
decrease. The n value is fairly constant between 0.8 and 0.9 indicating a rough electrode
surface.38 A decrease in solution resistance must be due to an increase in carrier density,
valence or mobility. Prior to adding it to solution, PEI is charge neutral. It is believed
that when PEI is added to solution protons in solution associated with the amine groups
of the PEI. Since the concentration and valence of the protons is constant whether in
solution or associated with PEI, the drop in resistance must be due to an increase in
mobility.
When HCl is added to solution the protons associate (i.e. there are no free proton
in solution) with water to form hydronium ions. When HCl is added to ethanol, the
protons react with ethanol to form ethoxonium ions.41 Without water present, proton
mobility occurs by a hopping mechanism where the proton hops from ethanol to ethanol
molecule. However, when water is present in ethanol the formation of hydronium ions is
favored and the proton mobility becomes limited by the electrophoresis of the hydronium
ion. When PEI is added to the solution there is apparent increase in the proton mobility.
The mechanism responsible is not known and further investigation is beyond the scope of
180
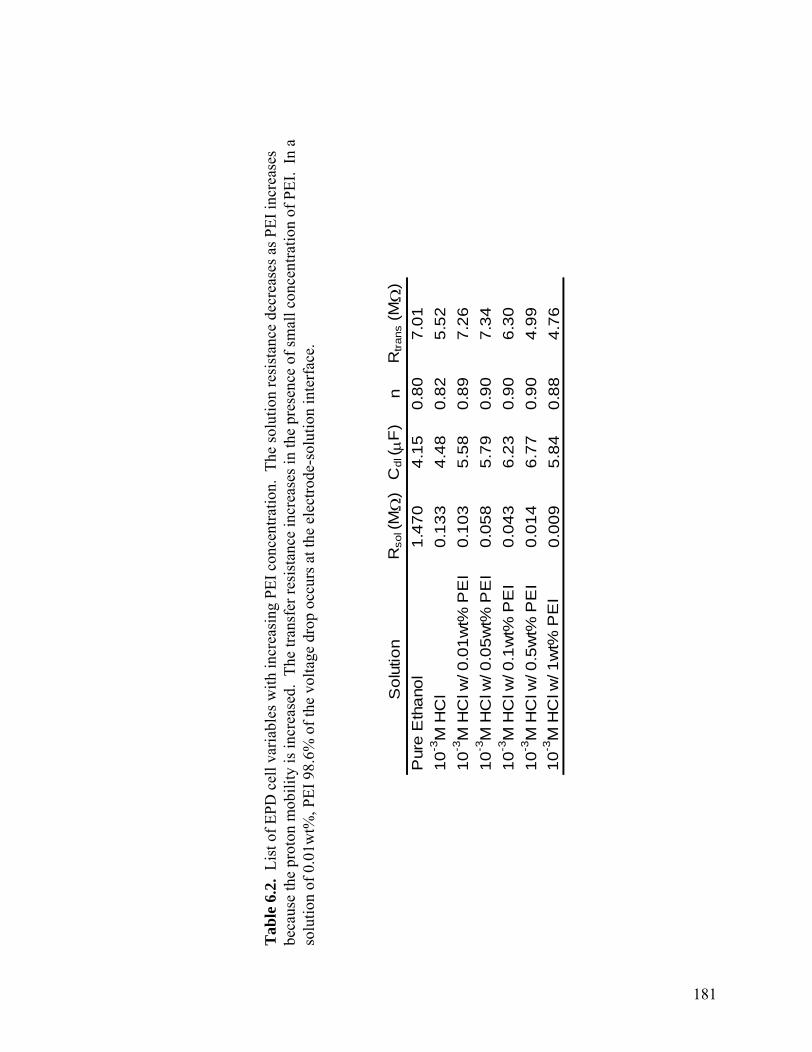
Sol
utio
nR
sol (
MΩ
)C
dl ( μ
F)
nR
tran
s (M
Ω)
Pur
e E
than
ol1.
470
4.15
0.80
7.01
10-3
M H
Cl
0.13
34.
480.
825.
5210
-3M
HC
l w/ 0
.01w
t% P
EI
0.10
35.
580.
897.
2610
-3M
HC
l w/ 0
.05w
t% P
EI
0.05
85.
790.
907.
3410
-3M
HC
l w/ 0
.1w
t% P
EI
0.04
36.
230.
906.
3010
-3M
HC
l w/ 0
.5w
t% P
EI
0.01
46.
770.
904.
9910
-3M
HC
l w/ 1
wt%
PE
I0.
009
5.84
0.88
4.76
Tab
le 6
.2.
List
of E
PD c
ell v
aria
bles
with
incr
easi
ng P
EI c
once
ntra
tion.
The
solu
tion
resi
stan
ce d
ecre
ases
as P
EI in
crea
ses
beca
use
the
prot
on m
obili
ty is
incr
ease
d. T
he tr
ansf
er re
sist
ance
incr
ease
s in
the
pres
ence
of s
mal
l con
cent
ratio
n of
PEI
. In
a
solu
tion
of 0
.01w
t%, P
EI 9
8.6%
of t
he v
olta
ge d
rop
occu
rs a
t the
elec
trode
-sol
utio
n in
terf
ace.
181

the current work. The transfer resistance of the 10-3 M HCl appears large because only
100 mV was applied during the measurement. When a voltage large enough to initiate
electrochemical reactions is applied the transfer resistance will decrease. This is not true
for the samples with PEI because CV shows that PEI inhibits the electrochemical
reactions.
The actual concentration of unabsorbed PEI in solution was not measured.
However, the PEI concentration of the as prepared suspension was 0.01w/o, but from zeta
potential measurement it known that PEI is adsorbed to the surface so the actual
concentration of free PEI must be less. From the data in Table 6.2 the solution resistance
would be approximately 0.1 MΩ with a transfer resistance of 7.3 MΩ, which results in
98.6% of the voltage drop in the cell occurring at the electrode-solution interface.
It is apparent that PEI interacts with the electrode and stops electrochemical
reactions. When any of the solution constituents adsorbs onto the electrode and hinders
or stops electrochemical reactions, it is referred to as inhibition.42, 43 Organic substances
with amine groups have been noted to be effective cathodic inhibitors.44-46 Adsorbed
molecules which inhibit electrochemical reactions create a layer on the electrode surface
that limits the distance of closest approach of the electrochemically active species in
solution.42 Figure 6.7 is a schematic showing the effect of excess PEI on deposition and
how PEI inhibits electrochemical reactions and deposition. For an electrochemical
reaction to occur it is necessary for the electrons at the surface of the electrode to be
transported through the adsorbed layer to reduce the electrochemical species.
In the current case it is believed that excess PEI remaining in the solution phase
after dispersion has a two fold effect on the kinetics of deposition. The PEI migrates
182

Figu
re 6
.7.
Sche
mat
ic sh
owin
g th
e ef
fect
of e
xces
s PEI
on
the
elec
troch
emis
try o
f dep
ositi
on. W
hen
exce
ss P
EI is
pre
sent
it
cont
amin
ates
the
elec
trode
and
inhi
bits
ele
ctro
chem
ical
reac
tions
and
par
ticle
dep
ositi
on.
At a
reas
of t
he e
lect
rode
una
ffec
ted
by
PEI e
lect
roch
emic
al re
actio
ns o
ccur
s and
par
ticle
dep
ositi
on o
ccur
s. If
the
PEI c
once
ntra
tion
is to
o la
rge
the
entir
e el
ectro
deca
n be
con
tam
inat
ed a
nd d
epos
ition
is c
ompl
etel
y in
hibi
ted.
++++
+
+ +
++
++
++++
+
+ +
++
++
++++
+
+ +
++
++
++++
+
+ +
++
++
Pt Electrode
H+
e- e-H
+
H2(
g)
++++
+
+ +
++
++
++++
+
+ +
++
++
++
++
++ +
++
++
++
++
+
++
++
++
++++
+
+ +
++
++
++++
+
+ +
++
++
BaT
iO3
w/P
EI
PEI
e- e-
H+
H+
++++
+
+ +
++
++
Dep
osite
d Pa
rtic
le
++++
+
+ +
++
++
183

towards the cathode, along with the particles, during deposition, and adsorbs to the
electrode inhibiting electrochemical reactions raising the transfer resistance. The
unabsorbed PEI also decreases the solution resistance, and under constant voltage
conditions decreasing the solution resistance and increasing the transfer resistance results
in a drop in the effective field in the bulk of the suspension lowering the electrophoretic
velocity.
To avoid the problem of PEI inhibition, suspensions were prepared with less PEI
and deposited. Deposition was observed in suspensions with 0.5 and 1 w/w PEI. Similar
deposition experiments were conducted with suspension prepared from the platelet
BaTiO3. Suspensions were prepared with 0.1 to 2 w/w PEI and current was monitored
during deposition. Figure 6.8 is a plot of current and deposition rate as a function of PEI
for depositions at a constant applied voltage of 20 V. It is apparent that there is a direct
correlation between current and deposition rate. Again at high PEI concentrations
inhibition is observed, but at lower PEI concentrations the current density increases as
does the deposition rate. Partial inhibition is possible and even small quantities of
unabsorbed PEI will lower the current density.
Adsorption of a charged species from solution typically behaves as a Langmuir
isotherm which is limited to monolayer coverage with a fixed number of adsorption
sites.15 As PEI concentration increases surface coverage increases and PEI remains in
solution due to a lack of suitable adsorption sites. This is based on the fact that the zeta
potential of the suspensions does not continue to increase as the PEI concentration is
increased beyond 1w/w, as seen in Figure 6.2. As the overall PEI concentration is
increased the concentration of unabsorbed PEI increases and leads to enhanced inhibition
184

Figu
re 6
.8.
Dep
ositi
on c
urre
nt a
nd ra
te a
s a fu
nctio
n of
PEI
con
cent
ratio
nus
ed fo
r dis
pers
ion.
As t
he P
EI c
once
ntra
tion
incr
ease
s th
e cu
rren
t and
dep
ositi
on ra
te d
ecre
ases
due
to th
e pr
esen
ce o
funa
bsor
bed
PEI o
n so
lutio
n. D
urin
g de
posi
tion
the
exce
ss P
EI
abso
rbs o
nto
the
cath
ode
and
inhi
bits
ele
ctro
chem
ical
reac
tions
dec
reas
ing
the
curr
ent.
185
of deposition. The problem of inhibition leads to a trade-off in the dispersion and
deposition of the particles. If the PEI concentration is too large then deposition is
inhibited whereas, if the PEI concentration is lowered then dispersion is no longer
optimized and agglomeration will occur. It is therefore necessary to find a balance
between dispersion and inhibition.
6.4.2.2 Adhesion
In the equiaxed powder samples with reduced PEI concentration where deposition
was observed a lack of adhesion was noted. This was seen by the rearrangement of the
particles upon drying. As the drying front moved from the edges of the deposit towards
the center, the particles move with the front. Uneven thickness and density gradients
were visually observed in all the samples. A lack of adhesion was also observed in all of
the samples deposited from the hydrothermal BaTiO3 suspensions. Even suspensions
with as little 0.1 w/w PEI, where there is little to no unabsorbed PEI in solution to
contaminate the electrode, a lack of adhesion was observed.
Several researchers have observed that during EPD particles can approach but not
deposit at the electrode.47-51 The particles amass in a potential well near the electrode,
and a surge of applied field is needed to overcome the potential barrier and cause
deposition.48 The lack of adhesion indicates that the deposition process is not fully
occurring in the samples. Depending on the mechanism of deposition, the lack of
adhesion can be dependent on several factors. But in general there are two reasons why
the particles do not deposit: (1) the electric field gradient near the electrode is not
sufficient for the particle to overcome the repulsive interactions between the particles and
186

electrode, or (2) the zeta potential of the particles has not be reduced enough to lower the
repulsive interaction at the electrode.19
One mechanism, referred to as neutralization, occurs when the electrochemical
reactions at the electrode generate or consume ionic species near the electrode which
substantially change the solution chemistry near the electrode leading to a reduction and
eventual neutralization of the surface charge.19, 52, 53 Neutralization is believed to be a
common mechanism of deposition for electrosterically dispersed system. Figure 6.9 is a
schematic showing the process on charge neutralization for the current BaTiO3/PEI
system. In the current deposition experiments, two electrochemical reactions, Equations
6.2 and 6.3 are proceeding, and each reaction has a profound effect on the solution
chemistry near the cathode, where deposition is occurring. In the first reaction protons
are consumed to generate hydrogen gas, while in the second reaction water is reduced to
produce hydroxyl ions and hydrogen gas. With the reduction in proton concentration and
increase in the hydroxyl ion concentration the solution pH near the cathode is increasing
greatly. PEI has an isoelectric point (IEP) of approximately 9.5-10 and as the pH is
increases near the cathode the charge on the PEI is reduced as the suspension pH
approaches the IEP of PEI. This is a problem because if the PEI is neutralized then the
electrostatic interactions which bind the PEI to the surface will not longer be present and
the PEI will desorb from the surface. This then leaves the desorbed PEI free in solution
to react with the electrode and inhibit electrochemical reactions. In addition, the particle
surface charge in minimized and the electrophoretic force on the particle is reduced.
Another effective means of lowering the zeta potential without complete charge
neutralization is through the addition of an indifferent electrolyte.15 To lower the zeta
187

Figu
re 6
.9.
Sche
mat
ic sh
owin
g th
e pr
oces
s of c
harg
e ne
utra
lizat
ion.
Wat
er is
redu
ced
at th
e ca
thod
e an
d th
e pH
incr
ease
s due
to
prod
uctio
n of
hyd
roxy
l gro
ups.
The
incr
ease
d pH
resu
lts in
the
PEI l
osin
g ch
arge
and
des
orbi
ng fr
om th
e B
aTiO
3pa
rticl
e su
rfac
ePt Electrode
e- e-
H2(
g)
++++
+
+ +
++
++
BaT
iO3
w/ C
harg
ed P
EIH
2OH
2OH
2O
H2O
H2O
OH
-
OH
-
++++
+
+ +
++
++
++++
+
+ +
++
++
OH
-
OH
-
OH
-+++
++
+ +
++
++
OH
-
OH
-
OH
-
H+
+OH
- →H
2O
H2O
H2O
Neu
tral
PEI
188

potential of the suspensions and the electrode surface an indifferent electrolyte, LiCl was
added up to concentrations of 5x10⁻³ M. The addition of an indifferent electrolyte will
lower the zeta potential of both particles and electrode. To fully investigate the repulsive
interactions between the particles and electrode the zeta potential of both BaTiO3
particles and Pt electrode was measured. To measure the zeta potential of a low surface
area flat sample, it is necessary to use a streaming potential technique.15 For ease of
measurement the zeta potential of Pt particle suspensions were measured and assumed to
behave similarly to a flat Pt surface. Figure 6.10 is a plot of zeta potential for
suspensions of the platelet BaTiO3 and Pt suspensions and as expected, the zeta potential
of both materials decreases as the LiCl concentration increases.
Using DLVO theory it is possible to calculate the interaction energy curves for
the BaTiO3-Pt system.54, 55 The curves will show the presence and magnitude of a
repulsive energy barrier. It is expected that as the LiCl concentration increases and the
zeta potential decreases the repulsive barrier should decrease. A decreased repulsion
reduces the energy needed to bring the particle and electrode in contact, thus improving
adhesion. The interaction energy curves for the interaction between BaTiO3 and Pt are
shown in Figure 6.11. The interaction energy curves were calculated using Stabil56 and
the physical constants57-59 listed in Table 6.3. Appendix C shows the calculation used by
Stabil to calculate the interaction energy curves. For the suspension without LiCl a
maximum repulsion of 50 kT is observed, however the addition of 0.5 mM LiCl lowers
the maximum to 23.6 kT. Van Tassel noted that a potential barrier of 15kT can
reasonably be overcome with the typical voltage gradients that are present during EPD.19
Excellent adhesion was visually observed in all samples containing LiCl, except for the
189

Figu
re 6
.10.
Zeta
pot
entia
l of p
late
let B
aTiO
3an
d Pt
ele
ctro
de in
pur
e et
hano
l as f
unct
ion
of L
iCl c
once
ntra
tion.
The
add
ition
of
an in
diff
eren
t ele
ctro
lyte
low
er th
e ze
ta p
oten
tial a
nd th
eref
ore
the
repu
lsiv
e in
tera
ctio
ns b
etw
een
the
depo
sitin
g pa
rticl
es a
nd th
e el
ectro
de.
With
out t
he a
dditi
on o
f the
LiC
l the
larg
e re
puls
ive
inte
ract
ions
bet
wee
n th
e pa
rticl
es a
nd e
lect
rode
lead
to a
lack
of
adhe
sion
of t
he p
artic
les o
n th
e el
ectro
de.
190

Figu
re 6
.11.
Inte
ract
ion
ener
gy c
urve
s for
the
plat
elet
BaT
iO3
and
Pt e
lect
rode
. Th
e cu
rves
wer
e ca
lcul
ated
usi
ng S
tabi
l55an
d th
e ph
ysic
al c
onst
ants
in T
able
6.3
. Th
e ad
ditio
n of
LiC
l, as
exp
ecte
d, lo
wer
s the
repu
lsiv
e in
tera
ctio
n be
twee
n th
e pa
rticl
es a
nd
elec
trode
s. H
owev
er, t
he a
dditi
on o
f ≥ 1
mM
LiC
l res
ults
in a
smal
l rep
ulsi
ve in
tera
ctio
n w
hich
is n
ot su
itabl
e fo
r goo
d di
sper
sion
.
191

Ham
aker
Con
stan
t of B
aTiO
31,2
A11
= 2
2.9
x 10
-20 J
Ham
aker
Con
stan
t of P
t3,2
A22
= 6
2.7
x10-2
0 JH
amak
er C
onst
ant o
f Eth
anol
4A
33 =
4.2
x 1
0-20 J
Latti
ce C
onst
ant o
f BaT
iO3
a 1 =
3.9
98 Å
Latti
ce C
onst
ant o
f Pt
a 2 =
4.0
28 Å
BaT
iO3 P
artic
le R
adiu
sr 1
= 5
0 nm
Pt P
artic
le R
adiu
sr 2
= 1
000
mm
Pol
ymer
Thi
ckne
ss o
n B
aTiO
3p 1
= 1
.3 n
mP
olym
er T
hick
ness
on
Pt
p 2 =
0 n
m1 A
131 v
alue
for B
aTiO
3 fro
m T
able
4 o
f Ref
57
2 Equ
atio
n 11
.27
from
Ref
58
used
to c
alcu
late
A11
from
A13
1 dat
a3 A
vera
ge v
alue
of A
131 f
or P
t fro
m T
able
4 o
f Ref
59
4 A33
val
ue o
f eth
anol
from
Ref
58
Tab
le 6
.3.
List
of p
hysi
cal c
onst
ants
use
d in
the
calc
ulat
ion
of th
e in
tera
ctio
n be
twee
n B
aTiO
3an
d Pt
in p
ure
etha
nol.
192

sample with 5 mM LiCl because the sample was not stable and not suitable for
deposition.
Adding an indifferent electrolyte decreases the solution resistance and it is
expected that the deposition rate should decrease. The effect of LiCl on the deposition
rate and suspension conductivity is shown in Figure 6.12. A sharp decrease is observed
in the deposition rate, this is due to two effects: (1) the reduction in zeta potential of the
suspension, and (2) the observed increase in the suspension conductivity. The decrease
in zeta potential is directly related to the electrophoretic velocity through Equation 6.2.
Referring to the circuit diagram, Figure 6.4a, an increase in the suspension conductivity
will results in a lower effective field at a constant applied voltage. CV was used to
determine the effect of LiCl on the electrochemistry. The results (not shown) show no
influence of LiCl on electrochemical reactions.
6.4.3 Film microstructure
With the ability to deposit films, it is important to evaluate the microstructure of
the deposited films. With the changes in solution chemistry needed to improve kinetics
and adhesion it is expected the microstructure of the films will be affected. Figures 6.13
a and b are a TEM image of a film cross-section and an AFM image of the top surface of
the film deposited from the equiaxed powder suspensions exhibiting the best adhesion
(5w/w HOx and 0.5w/w PEI). The film has a thickness of 613± 32 nm and a roughness
of 106 nm. With a primary particle size of 88.2 nm the film is comprised of
approximately 7 particle layers. However, with a D(50) = 175 nm in suspension prior to
deposition the film is comprised of 3.5 aggregate particle layers. If the layer thickness
193

Figu
re 6
.12.
The
cond
uctiv
ity a
nd d
epos
ition
rate
of s
uspe
nsio
ns w
ith L
iCl a
dded
are
hig
hly
depe
nden
t on
the
conc
entra
tion
of
LiC
l. A
lthou
gh a
ddin
g Li
Cl i
mpr
oves
film
adh
esio
n it
resu
lts in
decr
ease
d de
posi
tion
kine
tics
194

Figu
re 6
.13a
and
b.
(a) T
EM im
age
of a
film
cro
ss-s
ectio
n an
d (b
) AFM
def
lect
ion
imag
e of
top
surf
ace
of a
n EP
D fi
lm o
f eq
uiax
ed B
aTiO
3pa
rticl
es.
The
film
has
a th
ickn
ess o
f 613
nm
with
a su
rfac
e ro
ughn
ess o
f 106
nm
.
195

was reduced the presence of defects and pinholes would increase. This underscores the
importance of having well-dispersed particle systems for EPD.
The platelet particles provide a unique advantage in EPD because of their shape
anisotropy. Previous work by Yener et al. showed that with well-dispersed suspension of
2 nm metal platelets 15 nm layer by EPD are possible because upon deposition the
platelets assume an orientation where the large face of the particle lays parallel to the
electrode surface.60 The ability to produce thin layers with a large number of particle
layers is one of the attractive aspects of the EPD of platelet particles. For comparison a
613 nm layer of platelet particles (thickness = 5.8 nm) would have 106 particle layers.
Figures 6.14 is an AFM image of a film deposition from a platelet powder suspension
with 5x10⁻⁴ M LiCl, the minimum concentration needed to observe film adhesion. It is
apparent that the film is inhomogeneous and that particle aggregates have deposited on
the electrode. The inhomogeneous nature of the film is also assumed to be due to partial
inhibition by PEI similar to the schematic in Figure 6.7.
Since the platelet particles all have the same crystallographic texture, a (111)
large face, a layer comprised of oriented platelet particles should exhibit crystallographic
texture. Figure 6.15 is the XRD patterns for three films deposited at different voltages.
The patterns show no evidence of texture and the relative ratios of the peak intensities are
similar to that of a powder diffraction pattern for BaTiO3 (JCPDS Card: 31-0174).
Combined with the AFM images the XRD results show that the films deposited are
comprised of large particle agglomerates. In addition to improving film adhesion and
reducing deposition kinetics the addition of LiCl affects the particle-particle interactions
leading to aggregation. Similar to the affects of changing PEI concentration there is a
196

Figu
re 6
.14.
AFM
def
lect
ion
imag
e of
EPD
film
dep
osite
d fr
om a
pla
tele
t BaT
iO3
susp
ensi
on.
Elec
trode
surf
ace
cove
rage
is
inco
mpl
ete
and
the
film
app
ears
to b
e co
mpr
ised
of a
ggre
gate
s.
197
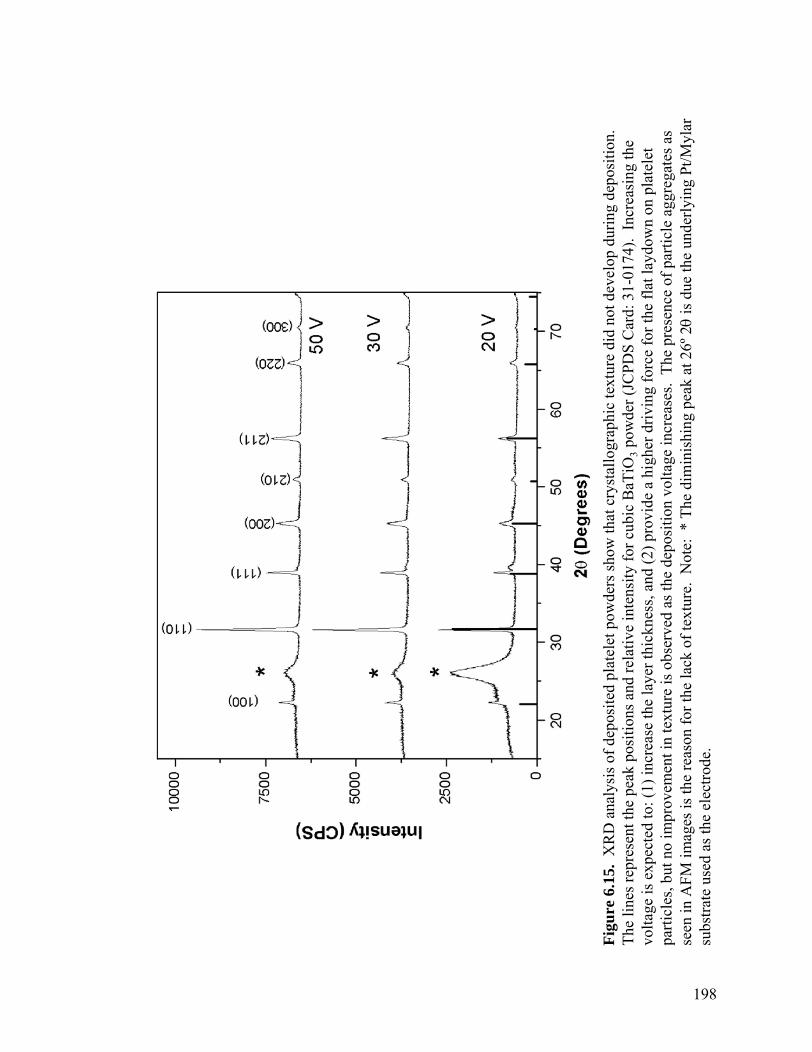
Figu
re 6
.15.
XR
D a
naly
sis o
f dep
osite
d pl
atel
et p
owde
rs sh
ow th
at c
ryst
allo
grap
hic
text
ure
did
not d
evel
op d
urin
g de
posi
tion.
Th
e lin
es re
pres
ent t
he p
eak
posi
tions
and
rela
tive
inte
nsity
for c
ubic
BaT
iO3
pow
der (
JCPD
S C
ard:
31-
0174
). In
crea
sing
the
volta
ge is
exp
ecte
d to
: (1)
incr
ease
the
laye
r thi
ckne
ss, a
nd (2
) pro
vide
a h
ighe
r driv
ing
forc
e fo
r the
flat
layd
own
on p
late
let
parti
cles
, but
no
impr
ovem
ent i
n te
xtur
e is
obs
erve
d as
the
depo
sitio
n vo
ltage
incr
ease
s. T
he p
rese
nce
of p
artic
le a
ggre
gate
s as
seen
in A
FM im
ages
is th
e re
ason
for t
he la
ck o
f tex
ture
. N
ote:
* Th
e di
min
ishi
ng p
eak
at 2
6º2θ
is d
ue th
e un
derly
ing
Pt/M
ylar
su
bstra
te u
sed
as th
e el
ectro
de.
198

trade-off in adding an indifferent electrolyte to the solution, while improving adhesion it
reduces kinetics and destabilize the suspension prior to deposition.
6.5 Conclusions
The electrophoretic deposition of BaTiO3 nanoparticle suspensions was
investigated with an emphasis on understanding the interdependence of solution
chemistry on the kinetics of deposition and microstructure of the deposition films. The
solution chemistry is a controlling variable in the development of well-dispersed
suspensions for EPD. The optimum dispersion conditions are inadequate for deposition.
High concentrations of PEI inhibit electrochemical reactions and increase the resistance
of the electrode-solution interface. This results in a significant reduction in the
electrophoretic velocity of the particles, effectively stopping deposition. When the
deposition kinetics are enhanced the repulsive particle-electrode interactions lead to poor
adhesion of the deposited films. The addition of an indifferent electrolyte mitigates the
repulsive interactions and improved adhesion, but lead to particle aggregation prior to
deposition. Films deposited from aggregated suspensions were of low quality and
unstable for further processing.
199
References
1. Taiyo Yuden: Mass Production of World's First 100μF Multilayer Ceramic Capacitor in EIA1206 Size. http://www.yuden.co.jp/e/release/pdf/2005/20050630e.pdf, (2005). 2. A.J. Moulson and J.M. Herbert, Electroceramics: Materials, properties, applications, 1st ed. (Chapman & Hall, London, 1990). 3. N. Ogata, J. van Tassel, and C.A. Randall: Electrode formation by electrophoretic deposition of nanoparticles. Mater. Lett. 48, (1), 7 (2001). 4. J. Tabellion and R. Clasen, Electrophoretic deposition of SiC from aqueous suspensions, edited by A.R. Boccaccini, O. Van der Biest, and J.B. Talbot (in Electrophoretic deposition: Fundamentals and applications, Banaff, Canada, 2002). 5. E. Harsanyi: Method of coating radiant bodies. US Patent # 1,897,902, (1933). 6. H. von Both and J. Hasselt, Ceramic microstructures by electrophoretic deposition of colloidal suspension, edited by A.R. Boccaccini, O. Van der Diest, and J.B. Talbot (in Electrophoretic deposition: Fundamental and applications, Banff, Canada, 2002), pp 78. 7. C. Kaya, A.R. Boccaccini, and K.K. Chawla: Electrophoretic deposition forming of nickel-coated-carbon-fiber-reinforced borosilicate-glass-matrix composites. J. Am. Ceram. Soc. 83, (8), 1885 (2000). 8. E.M. Wong and P.C. Searson: ZnO quantum particle thin films fabricated by electrophoretic deposition. Appl. Phys. Lett. 74, (20), 2939 (1999). 9. P. Sarkar, X. Haung, and P.S. Nicholson: Structural ceramic microlaminates by electrophoretic deposition. J. Am. Ceram. Soc. 75, (10), 2907 (1993). 10. P. Sarkar, X. Haung, and P.S. Nicholson: Zirconia/alumina functionally gradiented composites by electrophoretic deposition technique. J. Am. Ceram. Soc. 76, (4), 1055 (1992). 11. H.S. Maiti, S. Datta, and R.N. Basu: High-Tc superconducting coating on metal substrates by an electrophoretic technique. J. Am. Ceram. Soc. 72, (9), 1733 (1989). 12. M.D. Sacks and G.W. Scheiffele: Properties of silicon suspensions and slip-cast bodies. Ceram. Eng. Sci. Proc. 6, (7-8), 1109 (1985). 13. T. Kimura, Y. Matsuda, M. Oda, and T. Yamaguchi: Effects of agglomerates on the sintering of alpha-Al2O3. Ceram. Int. 13, (1), 27 (1987).
200

14. A.A. Parker, J. Sun, A.M. Ahern, S. T, D. Wilhelmy, G.H. Armstrong, and J.J. Marcinko: Effect of dispersion state on ceramic green body morphology. Poly. Pre. 33, (1), 1210 (1992). 15. R.J. Hunter, Zeta potential in colloid science: Principles and applications, 1st ed. (Academic Press, San Diego, CA, 1981). 16. M. von Smoluchowski: Contribution a la theorie de l'endosmose electrique et de quelques phenomenes correlatifs. Bull. Acad. Sci. Cracovie 8, 182 (1903). 17. E. Huckel: Die kataphorese der kugel. Phys. Z. 25, 204 (1924). 18. D.C. Henry: The cataphoresis of suspended particles. Part I - The equation of cataphoresis. Proc. Roy. Soc. A 133, 106 (1931). 19. J. van Tassel: Electrophoretic deposition: Fundamentals, mechanisms and examples with an in depth examination of the ion depletion effect. Ph.D. Thesis, The Pennsylvania State University, (2004). 20. H.C. Hamaker and E.J.W. Verwey: The role of forces between the particles in electrodeposition and other phenomena. Trans. Faraday Soc. 36, 180 (1940). 21. H. Koelmans and J.T.G. Overbeek: Stability and electrophoretic deposition of suspensions in non-aqueous media. Discuss. Faraday Soc. 18, (52-63), (1954). 22. D.R. Brown and F.W. Salt: The mechanism of electrophoretic deposition. J. Appl. Chem. 15, 40 (1963). 23. P. Sarkar and P.S. Nicholson: Electrophoretic deposition (EPD): Mechanisms, kinetics, and applications to ceramics. J. Am. Ceram. Soc. 79, (8), 1987 (1996). 24. R.J. Kershner, J.W. Bullard, and M.J. Cima: The role of electrochemical reactions during electrophoretic particle deposition. J. Colloid Interface Sci. 278, 146 (2004). 25. T.J. Yosenick, D.V. Miller, R. Kumar, J.A. Nelson, C.A. Randall, and J.H. Adair: Synthesis of nanotabular barium titanate via a hydrothermal route. J. Mater. Res. 20, (4), 837 (2005). 26. R.W. O'Brien and L.R. White: Electrophoretic mobility of a spherical colloidal particle. J. Chem. Soc. Faraday II 74, 1607 (1978). 27. J. McCaffrey: Small-angle cleavage of semiconductors for transmission electron-microscopy. Ultramicroscopy 38, (2), 149 (1991). 28. S. Venigalla and J.H. Adair: Theoretical modeling and experimental verification of electrochemical equilibria in the Ba-Ti-C-H2O system. Chem. Mater. 11, (3), 589 (1999).
201

29. U. Paik and V.A. Hackley: Influence of solids concentration on the isoelectric point of aqueous barium titanate. J. Am. Ceram. Soc. 83, (10), 2381 (2000). 30. A. Neubrand, R. Linder, and P. Hoffman: Room-temperature solubility behavior of barium titanate in aqueous media. J. Am. Ceram. Soc. 83, (4), 860 (2000). 31. U. Paik, S. Lee, and V.A. Hackley: Influence of barium dissolution on the electrokinetic properties of colloidal BaTiO3 in an aqueous medium. J. Am. Ceram. Soc. 86, (10), 1662 (2003). 32. T.J. Yosenick, Y. Yuan, C.A. Randall, and J.H. Adair: Passivation, dispersion, and aqueous solution doping of platelet BaTiO3 powder. To be submitted, (2005). 33. J.H. Adair, A.J. Rose, and L.G. McCoy: Particle size analysis of ceramic powders. In Advances in ceramics, Volume 11, Processing for improved productivity, edited by (The American Ceramic Society, 1984) pp 142. 34. H. Natter and R. Hempelmann: Nanocrystalline copper by pulsed electrodeposition: The effect of organic additives, bath temperature, and pH. J. Phys. Chem. 100, 19525 (1996). 35. R.A. Marcus: Electron transfer at electrodes and in solution: Comparison of theory and experiment. Electrochim. Acta 13, (5), 955 (1968). 36. J.R. Macdonald, Impedance spectroscopy: Emphasizing solid materials and systems, 1st ed. (John Wiley, New York, New York, 1987). 37. F. Berthier, J.P. Diard, and R. Michel: Distinguishability of equivalent circuits containing CPEs. Part I. Theoretical part. J. Electroanal. Chem. 510, 1 (2001). 38. W.H. Mulder, J.H. Sluyters, T. Pajkossy, and I. Nyikos: Tafel current at fractal electrodes. Connection with admittance spectra. J. Electroanal. Chem. 285, 103 (1990). 39. C.A. Schiller and W. Strunz: The evaluation of experimental dielectric data of barrier coating by means of different models. Electrochim. Acta 46, 3619 (2001). 40. C.H. Kim, S.I. Pyun, and J.H. Kim: An investigation of the capacitance dispersion on the fractal carbon electrode with edge and basal orientations. Electrochim. Acta 48, 3455 (2003). 41. R. De Lise, M. Goffredi, and V.T. Liveri: Effect of water on proton migration in alcoholic solvents. Part 4 - Conductance of hydrogen chloride in butan-2-ol and in ethanol at 25 C. J. C. S. Faraday I 72, 436 (1976).
202

42. G. Trabanelli: Corrosion inhibitors. In Corrosion mechanisms, edited by F. Mansfeld, (Marcel Dekker, Inc., 1987) pp 119. 43. M. Stratmann, W. Furbeth, G. Grundmeier, R. Losch, and C.R. Reinartz: Corrosion inhibition by adsorbed organic monolayers. In Corrosion mechanisms in theory and practice, edited by P. Marcus, and J. Oudar, (Marcel Dekker, Inc., 1995) pp 373. 44. M.J. Incorvia and S. Contarini: X-ray photoelectron spectroscopic studies of metal/inhibitor systems: Structure and bonding at the iron/amine interface. J. Electrochem. Soc. 136, (9), 2493 (1989). 45. P. Li, J.Y. Lin, K.L. Tan, and J.Y. Lee: Electrochemical impedance and x-ray photoelectron spectroscopic studies of the inhibition of mild steel corrosion in acids by cyclohexylamine. Electrochim. Acta 42, (4), 605 (1997). 46. H. Ashassi-Sorkhabi and S.A. Nabavi-Amri: Polarization and impedance methods in corrosion inhibition study of carbon steel by amines in petroleum-water mixtures. Electrochim. Acta 47, 2239 (2002). 47. M. Giersig and P. Mulvaney: Formation of two-dimensional gold colloid lattice by electrophoretic deposition. J. Phys. Chem. 97, (24), 6334 (1993). 48. M. Bohmer: In situ observation of 2-dimensional clustering during electrophoretic deposition. Lang. 12, (24), 5747 (1996). 49. Y. Solomentsev, M. Bohmer, and J.L. Anderson: Particle clustering and pattern formation during electrophoretic deposition: A hydrodynamic model. Lang. 13, (23), 6058 (1997). 50. S.A. Guelcher, Y. Solomentsev, and J.L. Anderson: Aggregation of pair particles on electrodes during electrophoretic deposition. Powder Tech. 110, 90 (2000). 51. Y. Solomentsev, S.A. Guelcher, M. Bevan, and J.L. Anderson: Aggregation dynamics for two particles during electrophoretic deposition under steady fields. Lang. 16, (24), 9208 (2000). 52. F. Grillon, D. Fayeulle, and M. Jeandin: Quantitative image analysis of electrophoretic coatings. J. Mater. Sci. Lett. 11, 272 (1992). 53. J. Mizuguchi, K. Sumi, and T. Muchi: A highly stable nonaqueous suspension for electrophoretic deposition of powdered substances. J. Electrochem. Soc. 136, 2724 (1983). 54. B. Darjaguin and L. Landau: Theory of the stability of strongly charged lyophic sol and of the adhesion of strongly charged particles in solution of electrolytes. Acta Physiochim. URSS 14, 633 (1941).
203

55. E.J.W. Verwey, J.T.G. Overbeek, and K. Nes, Theory of the stability of lyophobic collloids. The interaction of sol particles having an electric double layer, 1st ed. (Elsevier Publishing Company, Inc., New York, New York, 1948). 56. Stabil for Windows, 4.5. 57. L. Bergstrom: Hamaker constants of inorganic materials. Adv. Coll. Int. Sci. 70, 125 (1997). 58. I. Israelachvili, Intermolecular & Surface Forces, 2nd ed. (Harcourt Brace & Company, London, 1992). 59. J. Visser: On Hamaker constants: A comparison between Hamaker constants and Lifshitz - van Der Waals constants. Adv. Coll. Int. Sci. 3, 331 (1972). 60. D.O. Yener, T.J. Yosenick, C.A. Randall, and J.H. Adair: Synthesis of nanosized Ag/Pd platelets in self-assembled bilayers, and thin film metallization by electrophoretic depositions. To be submitted, (2005).
204

CHAPTER SEVEN
Conclusions and Suggested Work 7.1 Summary and Conclusions
With the current in size reduction in dielectric layers in MLCCs the use of
nanoparticles is seen as a necessary requirement to achieve the desired layer thickness.
Combined with controlled particle morphology during synthesis nanoparticles provide
unique advantages including enhanced reactivity and textured microstructures. The
current study investigated the individual steps in the processing of hydrothermal
anisotropic BaTiO3 from the synthesis of nanoparticles to the dispersion, doping,
sintering, and electrical properties of the bulk materials. Nanotabular BaTiO3 particles
were synthesized using a hydrothermal route. The particles are single crystal with a
majority of the particles having a [111] zone axis, and a median thickness of 5.8 ± 3.1 nm
and a face diameter of 27.1 ± 12.3 nm, as determined by atomic force microscopy.
Morphology of the particles was shown to be controlled solely by pH of the solution
during synthesis. It was speculated that the high solution pH stabilizes the {111} face
limiting growth in the <111> direction and leading to multiple {111} twin formation
during synthesis. With growth limited in the <111> direction the particle develop a plate-
like morphology. The powder has a low concentration (0.5 wt%) of hydrothermal defects
which coalesce during heating to form defects in the particles. TEM observations of
thermally treated particles show that the particle lose their plate-like morphology by 1000
°C. The Ba/Ti ratio shows that the powder is slightly Ba rich.
205

After synthesis, a model was which described the complex nature of the BaTiO3
surface in an aqueous environment. Three different regions of surface charging were
observed and modeled using different approaches. The Ba2+ depleted surface at low pH
was treated as a TiO2 surface and the MUSIC model was applied. As pH increases the
influence of adsorbed Ba2+(aq) was accounted by using a modified Stern isotherm. At
high pH the precipitation of BaCO3 on the particle surface was modeled with a Nernst-
Gouy-Stern charging mechanism. The inherent complexity of the surface necessitates an
appropriate aqueous processing technique for BaTiO3.
Oxalic acid was shown to have a passivation effect on the BaTiO3 surface. Oxalic
acid forms a barium oxalate layer on the particle, which limits Ba2+ leaching and BaCO3
formation. PEI can be used as an effective dispersant but the state of dispersion is highly
dependent on the ratios and concentrations of oxalic acid and PEI. Viscosity
measurements show the ability for excess oxalic acid and PEI to react and form an
amine-oxalate gel, which can be detrimental to dispersion.
Using an aqueous solution based approach, both the platelet and spherical BaTiO3
particles were doped with a X7R-type formulation based on Co, Nb and Bi. The surface
chemistry of the BaTiO3 particles was manipulated which resulted in the selective
adsorption of the dopants on the particle surface from solution. The development of an
engineered particle coating during doping was confirmed by surface charge, TEM, and
EDS analysis.
The electrophoretic deposition of spherical and platelet powders was studied. The
effect of solution chemistry on the kinetics, electrochemistry and microstructure of
deposited film was studied. The concentration of dispersant (PEI) and indifferent
206

electrolyte (LiCl) were shown the have a profound on the kinetics of deposition and the
microstructure of the films. Unabsorbed PEI in solution contaminates the electrode
during deposition inhibiting electrochemical reactions and slowing deposition. LiCl was
added to reduce the repulsive interactions between the particle and electrode and improve
film adhesion, but it decreased the deposition rate and led to particle aggregation.
Because of aggregation the platelet particle film did not exhibit any microstructural or
crystallographic texture. Films deposited from platelet powder suspensions were
inhomogeneous and the films as appeared to be isolated islands of aggregation, whereas
films deposited from spherical powder suspensions where confluent layers with a
thickness of approximately 600 nm.
7.2 Suggested Work
Since the platelet particle exhibit crystallographic texture it was expected that film
deposited by EPD should be textured. However, XRD and AFM confirms that particle
aggregates lead to untextured inhomogeneous films. The dispersion of the particle
system must be addressed of textured films are to be deposited. One disadvantage of the
suspensions used in the current work is that ethanol was used instead of water. Ethanol
was used to limit the formation of hydrogen bubbles at the cathode during deposition
which can be detrimental to film microstructure. When EPD is carried out in water most
depositions are done at low voltage1 or using a porous membrane2 located in the center of
the EPD cell to eliminate the effect of the electrochemical reaction at the electrode.
While successful deposition is possible each technique has its limitations. Recently,
Uchikoshi et al. have demonstrated the ability to deposit aqueous alumina and titania
207
suspensions using an applied voltage of 30 V with Pd electrodes.3-5 Pd readily forms
PdHx when it reacts with hydrogen.6, 7 By using Pd electrodes Uchikoshi et al. were able
to adsorb any hydrogen generated at the cathode and stop hydrogen bubble formation.
Uchikoshi et al. in the same research was able to develop crystallographic texture
through the use of an applied magnetic field. Many diamagnetic materials with non-
cubic crystal structure exhibit anisotropy in their magnetic susceptibilities.5 To align
these materials it is necessary to apply a magnetic field such that the magnetic force on
the particle is greater than the force due to thermal energy. However, the difference in
susceptibilities between different orientations is so small that a large (10 T) magnetic
field is required to align the materials. Unfortunately, the magnetic susceptibility
anisotropy of BaTiO3 has not been measured, but work by Uyeda8 suggests that
anisotropy exists. Uyeda found that materials with MO6 metal cation octahedra exhibit
anisotropy in the magnetic susceptibility if the octahedra are slightly elongated with
structurally anisotropy. This suggest that the anisotropy of the TiO6 in tetragonal BaTiO3
should result in an anisotropic magnetic susceptibility the can be used to manipulate the
crystallographic orientation of BaTiO3 particles while in suspension during deposition.
TEM observations show that the platelet particles lose the platelet morphology by
1000 °C. Thus, an advantage obtained by using a platelet material would be lost during
high temperature sintering. However, the observations were made on loose powder
samples where the constraints of particle-particle contacts and pore distribution are not a
factor. With the possible development of a textured microstructure using EPD and
applied magnetic fields a complete analysis of the morphology evolution particles in a
208

powder compact is necessary. In addition to the changes in particle morphology, the
evolution of the pore distribution is also of interest.
The use of conventional sintering approach with a high temperature isothermal
hold is expected to result in significant changes in the microstructure. However, a novel
multi-step sintering approach, similar to those proposed by Polotai et al.9 and Chen and
Wang10, would provide an advantage in that the last sintering step is a low temperature
isothermal hold. In the multi-step approach, the initial steps are designed to result a
uniform distribution of sub-critical pores which can be eliminated without substantial
grain growth during the last step. This suggests that if the green structure were of high
density with a uniform pore distribution that sintering could be achieved with a minimal
or no initial step and a long low temperature isothermal hold. If the isothermal hold were
below 1000 °C, then the sintering of the platelet particle without morphology can is a
possibility.
209

Reference
1. A.L. Rogach, N.A. Kotov, D.S. Koktysh, J.W. Ostrander, and G.A. Ragoisha: Electrophoretic deposition of latex-based 3D colloidal photonic crystals: A technique for rapid production of high-quality opals. Chem. Mater. 12, 2721 (2000). 2. J. Tabellion and R. Clasen, Electrophoretic deposition of SiC from aqueous suspensions, edited by A.R. Boccaccini, O. Van der Biest, and J.B. Talbot (in Electrophoretic deposition: Fundamentals and applications, Banaff, Canada, 2002), pp. 3. T. Uchikoshi, T.S. Suzuki, H. Okayuma, and Y. Sakka: Control of crystalline texture in polycrystalline alumina ceramics by electrophoretic deposition in a strong magnetic field. J. Mater. Res. 19, (5), 1487 (2004). 4. T. Uchikoshi, T.S. Suzuki, K. Okuyama, Y. Sakka, and P.S. Nicholson: Electrophoretic deposition of alumina suspension in a strong magnetic field. J. Euro. Ceram. Soc. 24, 225 (2004). 5. T. Uchikoshi, T.S. Suzuki, F. Tang, K. Okuyama, and Y. Sakka: Crystalline-oriented TiO2 fabricated by electrophoretic deposition in a strong magnetic field. Ceram. Int. 30, 1975 (2004). 6. T. Kuji, Y. Matsumura, H. Uchida, and T. Aizawa: Hydrogen adsorption of nanocrystalline palladium. J. Alloys Compd. 330-332, 718 (2002). 7. S. Kishore, J.A. Nelson, J.H. Adair, and P.C. Eklund: Hydrogen storage in spherical and platelet palladium nanoparticles. J. Alloys Compd. 389, 234 (2005). 8. C. Uyeda: Diamagnetic anistropies of oxide materials. Phys. Chem. Minerals 20, 77 (1993). 9. A.V. Polotai, K. Breece, E. Dickey, C.A. Randall, and A.V. Ragulya: A novel approach to sintering nanocrystalline barium titanate ceramics. J. Am. Ceram. Soc. 88, (11), 3008 (2005). 10. I.W. Chen and X.H. Wang: Sintering dense nanocrystalline ceramics without final-stage grain growth. Nature 404, 168 (2000).
210

APPENDIX A
Algorithm for the Determination of Surface Potential Using the MUSIC Model
To calculate the surface potential of a material system using the MUSIC model1-
3it is first necessary to determine the type and characteristics of surface sites present
based on the crystal structure of the material. Figure A.1 is a flow diagram explaining the
process of using the MUSIC model to predict the surface potential as a function of
solution pH. The crystal structure dictates the cation coordination of the lattice oxygen
and the change in coordination when an ideal surface is cleaved. From the cation
coordination it is possible to calculate the cation-oxygen bond valence4 using Equation
4.7 which is used in calculating the valence, Equation 4.10, and log K values, Equation
4.9, for the surface site. Included in a calculation of the site valence is the number of
orbitals available for proton uptake. For example, in rutile, the main lattice group is
Ti3O, if at the surface the Ti coordination is reduced to two the group becomes Ti2O.
This reduction in Ti coordination results in the oxygen being cation deficient and able to
react with a single proton from solution to compensate for the reduction in coordination.
The calculated log K value represents the equilibrium solution pH at which the proton
will either adsorb or desorb. This is the current limit of the MUSIC model. In order to
calculate the surface charge as a function of solution pH is it necessary to employ a
model for the solution side of the interface, typically a Gouy-Chapman model for the
diffuse double layer.
211

Crystal Structure
Surface Sites
Site Valencelog K Values
Surface Charge Density = f(pH)
Surface Potential = f(pH)
Gouy Chapman Model
MUSIC Model
Solution pH
Figure A.1. Simple flow diagram showing the steps necessary to calculate the surface potential as a function of solution pH using the MUSIC model
212

The Gouy-Chapman model is based on electronuetrality between the solid and
solution sides of the interface, and assumes that charge density on the surface is equal and
opposite to the charge density in solution.5, 6 The information provided by the MUSIC
model is used to calculate the surface charge density,
∑=n
iiisis SNe ασ [A.1]
where e is the charge on the electron, Nsi is the site density of any specific site, Si is the
valence of the site, and αi is the degree of protonation of a specific site. Nsi is based on
the crystal structure of the materials, and Si used a value calculated from the MUSIC
model. αi represents the percentage of specific sites are protonated and is calculated
using Equation 4.15, and is dependent on both the log K value of the specific site and the
solution pH. This results in the surface charge density being dependent on the solution
pH. At each pH value it is possible to calculate the surface potential by setting the
surface charge density equal to the solution charge density, Equation 4.22. The result of
this is a series of surface potential values as a function of pH that can be plotted to yield
the familiar surface charge versus pH curves.
An advantage of this technique is that morphology of the particle can be
accounted for if the structure and area fraction (fi) of each specific habit present to
solution is known. Equation A.1 can be calculated for each specific habit and in turn the
surface potential (ψi) for each habit can be calculated. The total surface potential of the
particle can be calculated by using a weighted average to include the contributions of
each specific habit,
∑=n
iiitot fψψ [A.2]
213

References
1. T. Hiemstra, W.H. van Riemsdijk, and G.H. Bolt: Multisite proton adsorption modeling at the solid-solution interface of (hydr)oxides - A new approach. 1. Model desciption and evaluation of intrinsic reaction constants. J. Colloid Interface Sci. 133, (1), 91 (1989). 2. T. Hiemstra, P. Venema, and W.H. van Riemsdijk: Intrinsic proton affinity of reactive surface groups of metal (hydr)oxides: The bond valence principle. J. Colloid Interface Sci. 184, (2), 680 (1996). 3. M.L. Machesky, D. Wesolowski, D.A. Palmer, and M.K. Ridley: On the temperature dependence of intrinsic surface protonation equilibrium constants: An enxtension of the revised MUSIC model. J. Colloid Interface Sci. 239, 314 (2001). 4. L. Pauling: The principles determining the structure of complex ionic crystals. J. Amer. Chem. Soc. 51, 1010 (1929). 5. G. Gouy: Consititution of the electric charge at the surface of an electrolyte. J. Physique 9, (4), 457 (1910). 6. D.L. Chapman: Theory of electrocapillarity. Phil. Mag. 25, 475 (1913).
214

APPENDIX B
Dispersion of Solution Based Doped BaTiO3 Platelets for Electrophoretic Deposition
Chapter Five addresses the solution based doping of BaTiO3 while in suspension.
In colloidal processing the green microstructure is highly dependent on the state of
dispersion prior to consolidation.1-3 Therefore, it is necessary to have well-dispersed
particle suspensions for the electrophoretic deposition (EPD) of thin particulates layers.
In the case of layers deposited from doped BaTiO3 platelets the lack of dispersion made it
difficult to deposit homogenous dense BaTiO3 layer suitable for further processing or
fabrication of a multilayer ceramic capacitor. The dispersion of particulates in
suspension is dependent on a variety of factors, but the most dominant factors is the
particle surface charge which is affected by the physical chemistry of the surface and the
solution chemistry of the solvent phase. The procedure use to dope the BaTiO3 platelets
while in suspension had a profound effect on both the surface chemistry of the particle
and the solution chemistry of the solvent.
A passivation/dispersion approach was used prior to doping. In
passivation/dispersion the degradation of the BaTiO3 is control by the addition of oxalic
acid, and then the BaTiO3 surface is coated with polyethylenimine (PEI) to provide a
large positive surface suitable for electrosteric dispersion. In addition to dispersion the
positive surface charge was use for the electrostatic attraction of the negatively charged
dopant complexes with the surface. See Chapter Five for further discussion of the
passivation, dispersion and doping of the BaTiO3 particles.
215

Figure B.1 shows the zeta potential of undoped and fully doped BaTiO3 platelet
suspensions as a function of PEI concentration. In all cases the plot shows an initial
increase in the zeta potential with increasing PEI concentration, but the zeta potential
values begin to plateau at PEI concentrations of 3 w/w. This is due the particle surface
being fully coated with PEI and the excess PEI remaining in the solution phase. It is
most important to note the substantial decrease in the zeta potential of the surface in the
presence of the dopants. A zeta potential of 11 mV is observed for a fully doped samples
at pH, which is not large enough to provide adequate dispersion. The doping process was
performed at pH 5 in order to increase the positive surface charge and improve
dispersion. Although an increase in the zeta potential was observed it was minimal and
good dispersion was not observed.
The electrostatic adsorption of species on a surface typically follows a Langmuir
isotherm,
⎥⎦⎤
⎢⎣⎡ Δ−
=RTG
nxN abssi exp [B.1]
where Ni is the number of filled adsorption sites per area, n is the number of possible
adsorption sites per area, xs is the mole fraction of absorbate in solution, ΔGabs is the free
energy of adsorption, R is the universal gas constant, and T is absolute temperature. In a
Langmuir it is assumed that all surface sites are equivalent and there is a fixed
concentration (i.e. n is constant). In the dispersion of the BaTiO3 with PEI it is the amine
groups that simultaneously provide surface charge and adsorption sites for the dopants.
As the dopants are added to the suspension they selectively adsorb and complex with the
amine groups with the PEI,
M(Cit)- + NH4+… M(Cit)NH4… [B.2]
216

Figu
re B
.1.
The
zeta
pot
entia
l of d
oped
and
und
oped
BaT
iO3
susp
ensi
ons a
s a fu
nctio
n of
PEI
con
cent
ratio
n. T
he P
EI p
rovi
des
surf
ace
char
ge a
s wel
l as a
dsor
ptio
n si
tes f
or th
e io
nic
dopa
nts.
Whe
n th
e do
pant
s ads
orb
surf
ace
site
s are
neu
traliz
ed a
nd th
esu
rfac
e ch
arge
dec
reas
es lo
wer
ing
the
zeta
pot
entia
l. D
ecre
asin
g th
e pH
incr
ease
s the
zet
a po
tent
ial,
but i
t is n
ot su
ffic
ient
to
crea
te st
able
dis
pers
ions
.
217

This reaction results in charge neutralization of the surface site. With a fixed number of
surface sites the adsorption of the dopants results in a decreased surface charge.
Decreasing the pH will increase the number of protonated amine groups on the PEI
providing more adsorption site and increasing the surface charge. Figure B.1 shows this
to be true but the increase is insufficient to disperse the particles.
In addition to charge neutralization by specific absorption the addition of the
dopant complexes results in an increase in the ionic strength of the suspension. Since the
complexes are ionic each dopant solution contains a large concentration of indifferent
counter-ions, for example NO3-, which increases the ionic strength and shields the
repulsive particle interactions. Figure B.2 is a plot of the interaction energy curves
generated using Stabil.4 For the undoped samples a repulsive maximum of
approximately 6 kT is observed, whereas for the doped samples no energy barrier is
observed. The lack of repulsion explains the lack of dispersion for the doped samples.
However, a maximum of 6 kT is inadequate to provide long term dispersion in the
undoped samples and in a little as an hour after preparation the suspension began to
destabilize. Figure B.3 is a plot of the particle size distribution for the doped and
undoped powder at pH 7. The figure shows the large increase in the particle size as the
powder is doped, which is expected from the zeta potential results and the interaction
energy curves.
Solution based doping was effective in the doping of powder prepared for
traditional powder processing (i.e. granulation and dry pressing) however the problems
with dispersion make the technique less than ideal for colloidal based processing
techniques, especially electrophoretic deposition. It is believed that the problem present
218

Figu
re B
.2.
Inte
ract
ion
ener
gy c
urve
s for
dop
ed a
nd u
ndop
ed B
aTiO
3sh
ow th
at a
repu
lsiv
e en
ergy
bar
rier d
oes n
ot e
xist
for t
he
dope
d su
spen
sion
s. Th
is is
due
to th
e re
duct
ion
of th
e ze
ta p
oten
tial a
nd in
crea
se in
the
ioni
c st
reng
th a
s the
dop
ants
are
add
ed to
th
e su
spen
sion
. Th
e in
tera
ctio
n en
ergy
cur
ves w
ere
gene
rate
d us
ing
Stab
il.4
219
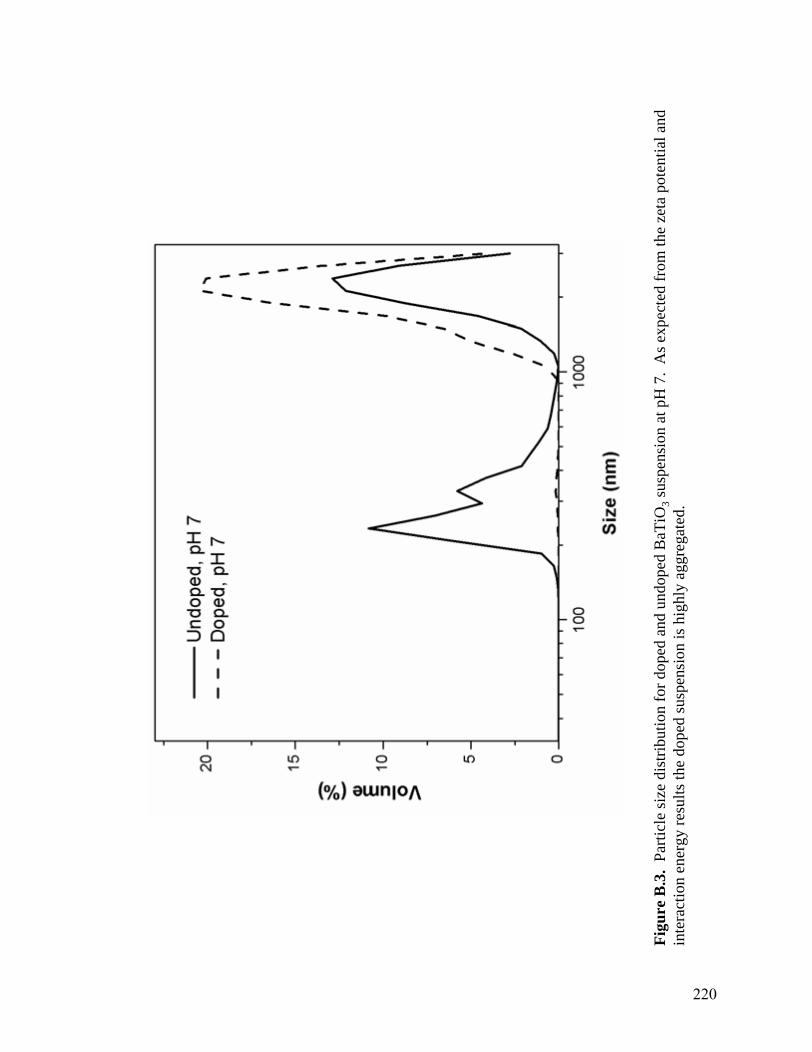
Figu
re B
.3.
Parti
cle
size
dis
tribu
tion
for d
oped
and
und
oped
BaT
iO3
susp
ensi
on a
t pH
7.
As e
xpec
ted
from
the
zeta
pot
entia
l and
in
tera
ctio
n en
ergy
resu
lts th
e do
ped
susp
ensi
on is
hig
hly
aggr
egat
ed.
220

by the technique can be overcome with the use of a rigorous thermal treatment and
deaggregation step. The disadvantage of this approach is the addition of two processing
step which increase processing time, cost, and complexity.
221
References
1. M.D. Sacks, and G.W. Scheiffele: Properties of silicon suspensions and slip-cast bodies. Ceram. Eng. Sci. Proc. 6, (7-8), 1109 (1985). 2. T. Kimura, Y. Matsuda, M. Oda, and T. Yamaguchi: Effects of agglomerates on the sintering of alpha-Al2O3. Ceram. Int. 13, (1), 27 (1987). 3. A.A. Parker, J. Sun, A.M. Ahern, S. T, D. Wilhelmy, G.H. Armstrong, and J.J. Marcinko: Effect of dispersion state on ceramic green body morphology. Poly. Pre. 33, (1), 1210 (1992). 4. Stabil for Windows, 4.5.
222

APPENDIX C
Stabil Calculation for Heterogeneous Coagulation
Stabil1 is a program designed to calculate the total interaction energy curve for
two particles interacting across a known liquid medium based on DLVO theory.2, 3 The
total energy is the superposition of the attraction van der Waals forces and the repulsive
double layer energy. The calculation of both energies requires a complete knowledge of
the particle-solvent system including the surface and physical chemistry of the particles,
and the solution chemistry of solvent.
First a series of user defined values are input which include the zeta potential,
particle size, particle and solvent Hamaker constants, and others. Table C.1 is a list of the
physical constants4-6 used in the calculation of the interaction of BaTiO3 and Pt in
Chapter 7. Next, the ionic strength of the solvent (I) and the Debye-Hückel parameter7
(κ) are calculated from t physical constants and user defined values,
21
2∑==
n
iii zc
I [C.1]
where, n = number of ionic species ci = concentration of ith species in mol/L zi = valance of ith species
2/12
10008
⎟⎟⎠
⎞⎜⎜⎝
⎛=
TkNIe
BroA εεπκ [C.2]
where, e = charge on the electron (1.602 x 10⁻¹⁹ C)
223

Ham
aker
Con
stan
t of B
aTiO
31,2
A11
= 2
2.9
x 10
-20 J
Ham
aker
Con
stan
t of P
t3,2
A22
= 6
2.7
x10-2
0 JH
amak
er C
onst
ant o
f Eth
anol
4A
33 =
4.2
x 1
0-20 J
Latti
ce C
onst
ant o
f BaT
iO3
a 1 =
3.9
98 Å
Latti
ce C
onst
ant o
f Pt
a 2 =
4.0
28 Å
BaT
iO3 P
artic
le R
adiu
sr 1
= 5
0 nm
Pt P
artic
le R
adiu
sr 2
= 1
000
mm
Pol
ymer
Thi
ckne
ss o
n B
aTiO
3p 1
= 1
.3 n
mP
olym
er T
hick
ness
on
Pt
p 2 =
0 n
m1 A
131 v
alue
for B
aTiO
3 fro
m T
able
4 o
f Ref
42 E
quat
ion
11.2
7 fro
m R
ef 5
use
d to
cal
cula
te A
11fro
m3 A
vera
ge v
alue
of A
131 f
or P
t fro
m T
able
4 o
f Ref
64 A
33 v
alue
of e
than
ol fr
om R
ef 5
Tab
le C
.1.
List
of p
hysi
cal c
onst
ants
use
d in
the
calc
ulat
ion
of th
e in
tera
ctio
n be
twee
n B
aTiO
3an
d Pt
in p
ure
etha
nol.
224

NA = Avogadro’s number (6.02 x 10²³ ions/mol) εo = permittivity of free space (8.854 x 10⁻¹² F/m) εr = relative permittivity of the solvent kB = Boltzmann Constant (1.381 x 10⁻²³ J/K) T = absolute temperature in K
The separation distance (D) of two stern planes with two overlap double layer is
calculated by integrating the Poisson-Boltzmann equation twice,
∫∑ ⎟
⎟⎠
⎞⎜⎜⎝
⎛⎥⎦
⎤⎢⎣
⎡⎟⎟⎠
⎞⎜⎜⎝
⎛−⎟⎟
⎠
⎞⎜⎜⎝
⎛−⎟⎟
⎠
⎞⎜⎜⎝
⎛=
=
δψ
ψ ψψεε
π
ψ
2/1
2/1
1
2/1
2/1
exp)(exp8
)(n
i B
i
B
i
ro
B
Tkez
TkxezTk
xdD [C.3]
where, ψs = stern potential ψx = potential at a distance x from the stern plane ψ1/2 = potential at the “midpoint” of two interacting stern planes It is important to note that in the case of the overlap of symmetric double layers,
ψ1/2 is taken to be the midpoint between the two interacting particles. However, in the
case of asymmetric double layers, which is the case for the interaction of BaTiO3 and Pt,
the “midpoint” is actually the distant from the stern plane to the minimum in the
interaction potential of the double layers. Because of this is it necessary to solve for D
from the stern potential of each particle. Once the separation distance of the two stern
planes has been calculated the total separation distance can be calculated,
abstot DDDD ++= 21 [C.4]
where, D1 = distance from the stern plane of particle 1 D2 = distance from the stern plane of particle 2 Dabs = thickness of any absorbed polymer on the particle surfaces Dtot is the distance at which the particle double layers begin to interact and a rise in
potential in the double layers is observed due to the interaction. Then through a series of
225

iterations Stabil calculates the attractive and repulsive energies between the particles
beginning at Dtot and continuing to the distance of closest of approach of the particles
defined by Dabs.
Heterocogulation is the case where dissimilar particle systems are interacting,
which is the case for the present case. In heterocogulation calculations it is necessary to
calculate the contribution from each particle for both the attractive and repulsive
interactions. For heterocogulation Stabil uses a simplified relation to calculate the
repulsive interaction between electrical double layers,
( )( ) ( )( ⎥
⎦
⎤⎢⎣
⎡−−+⎟⎟
⎠
⎞⎜⎜⎝
⎛−−−+
= DDDaaDV ror κκκψψεε 2exp1ln
exp1exp1ln2)( 2121 ) [C.5]
where, a1 = radius of particle 1 a2 = radius of particle 2 ψ1 = stern potential of particle 1 ψ2 = stern potential of particle 2
The calculation used for non-retarded van der Waals attration is,
⎥⎦
⎤⎢⎣
⎡⎟⎟⎠
⎞⎜⎜⎝
⎛+++
+++
++++
++−=
yxxyxxxyx
yxxyxy
xxyxyA
DVa 2
2
22132 ln2
12)( [C.6]
where, x = D/(a1 + a2) y = a1/a2 (a1>a2) A132 = effective Hamaker constant
The effective Hamaker constant is calculated from the known Hamaker constant of the
two interaction materials and the solvent,
( )( )322311132 AAAAA −−= [C.7]
226

where, A11 = Hamaker constant of particle 1 A22 = Hamaker constant of particle 2 A3 = Hamaker constant of solvent
The total interaction energy of the particles is simply the addition of the attractive and
repulsive energies,
)()()( DVDVDV ratot += [C.8]
Finally, the interaction energies are plotted as a function of separation distance
and from the plot it is possible to determine the maximum repulsive energy and the
distance at which it occurs. Figure A.1 is a series of interaction energy curves calculated
using Stabil for the BaTiO3 and Pt system.
227

Figu
re C
.1.
Inte
ract
ion
ener
gy c
urve
s for
the
plat
elet
BaT
iO3
and
Pt e
lect
rode
. Th
e cu
rves
wer
e ca
lcul
ated
usi
ng S
tabi
land
the
phys
ical
con
stan
ts in
Tab
le C
.1.
228

References
1. Stabil for Windows, 4.5. 2. B. Derjaguin and L. Landau: Theory of the stability of strongly charged lyophobic sols and of the adhesion of strongly charged particles in solution of electrolytes. Acta Physiochim. URSS 14, 633 (1941). 3. E.J.W. Verwey, J.T.G. Overbeek, and K. Nes, Theory of the stability of lyophobic collloids. The interaction of sol particles having an electric double layer, 1st ed. (Elsevier Publishing Company, Inc., New York, New York, 1948). 4. L. Bergstrom: Hamaker constants of inorganic materials. Adv. Coll. Int. Sci. 70, 125 (1997). 5. I. Israelachvili, Intermolecular & Surface Forces, 2nd ed. (Harcourt Brace & Company, London, 1992). 6. J. Visser: On Hamaker constants: A comparison between Hamaker constants and Lifshitz - van Der Waals constants. Adv. Coll. Int. Sci. 3, 331 (1972). 7. R.J. Hunter, Zeta potential in colloid science: Principles and applications, 1st ed. (Academic Press, San Diego, CA, 1981).
229

VITA
Timothy James Yosenick
Timothy James Yosenick was born September 8th 1976 in Winfield, Illinois the
third child of Peter P. and Joan H. Yosenick. In August of 1994, Tim began attending the
University of Illinois where he earned a B.S. in Ceramic Engineering in May of 1998.
While attending the University of Illinois, he worked at the US Naval Research Lab in
Washington D.C. during a Co-op exchange program where he worked on sonar and
actuator applications for the US Navy. After graduation, he worked for a small research
company in Longmont, Colorado called Nanomaterials Research Corporation. Tim
began his graduate studies at the Pennsylvania State University in January of 2000. From
August to December of 2002 he worked as a visiting scientist for TDK Corporation in
their materials research center in Narita, Japan. Tim graduated from the Pennsylvania
State University in December 2005 with a Ph.D. in Materials Science and Engineering.
He took a position with General Electric’s Global Research Center located in Niskayuna,
New York.