chapter 3. section b. patterns of multi-dimensional heterogeneity
TRANSCRIPT
Preface 1
Preface
This book is like a three-layer cake. One layer is Russia. Why did the purported market reforms, arguablythe boldest in history, end up in one of the greatest peace-time economic contractions? Why, in addition,has Russia lived from one default to another—in fact, has lived off defaults? And, how can Russia beuplifted from contraction and defaults to economic growth and prosperity?
A second layer is socialism. In modern tradition, socialism is equated with big Government (witha capital G). But the Hobbesian jungle, in which predatory animals and predatory humans alike socializethe output of every person and every species by killing and stealing, is also socialism. On reflection,socialization, in the sense of predatory redistribution of output and income, with or without big Government,is socialism by definition. Predation, redistribution, and socialism are synonymous terms. Central planning,which took place under Communism (with a capital C), is only a special case of socialism with very bigGovernment. This fact brings us back to Russia and to the question of its so-called market reforms andsubsequent big contraction. Was Russia’s transformation the result of market reforms or, in markedcontrast, a mutation of socialism? This is a loaded question. It puts the economic philosophy of the last300 years under siege. If what transpired in Russia was market reforms that resulted in a market economy,then the market system is not a universal road to prosperity. Indeed, it is not even universally viable.
We submit the case of socialist mutation in Russia in the 1990s. Russia mutated from socialism withbig Government (with a capital G), or from Communism with a capital C, into a new, hitherto unknownspecies of socialism, without big Government. It mutated into communism with a lower-case ‘c.’Moreover, for perhaps the first time in history, a second, parallel government emerged, which has the fullpower to tax the public and make the Central Bank print money. This parallel government is a networkof enterprises. We will call this new economic species Enterprise Network Socialism, or ENS in short.This term helps to convey that the government lost its traditional dominance which defined socialist regimesunder central planning. What happened is that after the abolition of central planning, the inherited networkof enterprises took over fiscal and monetary power and has since been redistributing most of the nationalincome.
That the literature en masse has confused this new species of socialism with a market economy,and generally identified socialism with the government, leads us to the third layer of this book. This is themissing link in the evolution of the market economy, which is also the missing link in the attempts of variouspost-Communist countries to become market economies. We ask: What separates a market from a non-market economy? In the spirit of the earlier point on socialism, it is the absence of socialization of income,the presence of privacy of income, when income is internalized by its earners.
Private income is, admittedly, a contentious idea. It reduces the scope of the market economy to
Preface 2
only that type of voluntary exchange which internalizes income and excludes situations, like today’s Russia,wherein economic liberty intertwines with predatory redistribution. The concept of private income bringsback John Locke’s view that only the private fruits of production and exchange, not any private interestand free exchange, create social good.
Can this missing link, which slowly evolved and adapted in Western market economies, bereproduced nowadays through managed public policy? The recent experience of many formerly non-market economies and some post-Communist economies, such as China, suggests an affirmative answer.But what policy set would fit today’s Russia? This takes us back to the first layer, Russia.
The organization of the book contains all three layers in its three parts. Part One introduces theissues sketched above. It discusses private income and its socialist antipode, common income. The latteris the income that is socialized by the government or various predatory forces. Then it places EnterpriseNetwork Socialism among other types of common income. Part Two marshals the data on Russia’seconomic experience in the 1990s and explores the causes of serial defaults and protracted contraction.Part Three offers the mechanics of our proposed policy recommendations. We spell out how to break upEnterprise Network Socialism and reroute Russia from predation to prosperity.
A special word is due about the language that appears throughout this book. We found itnecessary to define the vocabulary, and sometimes redefine existing vocabulary, in order to understand thenew Russian economic species.
Our new concepts cluster around the principal dichotomy of “common and private.” Private meansinternalized, common means socialized. We apply this dichotomy broadly, employing such opposites asprivate income and common income, private expenses and common expenses, private finance and commonfinance, private bills and common bills, private payment and common payment, private prices and commonprices, and private balance sheet and common balance sheet. The dichotomy private versus commonsupplants the traditional dichotomy of market and government. The perspective of a new dichotomy isdifferent. While private income is a foundation of the market economy, individual market measures areambiguous from this perspective. For example, liberalization of transactions and privatization of assets arenot universal productive forces. In the presence of private income, they may create a market economy.In the absence of private income, they only mutate socialism. The role of the government is ambiguous,too. It may protect private income and it may socialize income and manage access to common income.Thus the new dichotomy represents a different observation platform. We drop from usage the familiarterms reform and transition, which have become meaningless cliches in the real world of a variety of post-Communist economies.
In addition, we prefer the term economic species to economic systems, although we may sometimesuse them interchangeably. The word species conveys uniqueness, a special station in an order of things,taxonomy, and the spirit of evolution instead of transition. This usage implies that some economic speciesare viable and others are not. The market economy is viable. Thanks to incentives created by private
Preface 3
income, it adapted human behavior from predation to production, expanded, and spread over the world.In contrast, central planning devolved to extinction. Enterprise Network Socialism in Russia is also notviable over the long run. It moves from one default to another and down the slope of perpetual contraction,causing incredible human misery. This is the point to start the first chapter of the book.
Free and Not So Free to Charge: Income Redistribution and Russia, 1992-2007 1
1The latest data are available on the web site of the Russian State Committee on Statistics athttp://www.gks.ru/bgd/free/B01_19/IswPrx.dll/Stg/d000/i000330r.htm andhttp://www.statrus.info/catalog/edition.jsp?id=1821&uid=22, and on the web site of the Central Bank of Russia athttp://www.cbr.ru/statistics/credit_statistics/.
Chapter 1Free and Not So Free to Charge: Income Redistribution and Russia’s GDP
Contraction, 1992-98, and Recovery, 1999-2007
Russia after the end of central planning represents a case study in income redistribution andeconomic growth. As an empirical rule, GDP growth is negatively related to redistribution ofincome in all transactions between all agents. All-transactional income redistribution degradesgeneral productive incentives and retards long-term economic growth. State-forced productionunder central planning, including forced investment and application of technology, partiallysubstituted for productive incentives. In conjunction with incentives for human capital andtechnology, this substitution enabled moderate long-term economic growth. Metaphorically, onecarrot, one stick. The dissipation of central planning in Russia in 1989-90 did not reduce incomeredistribution and did not create general productive incentives, unlike the end of central planningin China after 1977. Incentives for human capital and technology started to degrade along the way.This conjunction left the economy with neither incentives nor force. GDP started to slide in 1990-91. The great contraction of 1992-98 occurred when liberalization and privatization opened a newchannel of income redistribution through trade credit. The recovery of 1999-2007 took place afterthe partial policy reversal reimposed government controls which inadvertently narrowed this channelof income redistribution.
This chapter reconstructs the empirical regularities of Russia’s GDP contraction in 1992-98and recovery in 1999-2007 in relation to income redistribution. It also compares empiricalirregularities associated with spurious factors such as the dynamics of global oil and othercommodity prices.
Empirical Regularities and Irregularities, Russia, 1992-2007
Russia’s economic policies since the beginning of 1992 added a new channel of broad incomeredistribution which operates through trade credit. The reconstruction of its mechanism and itsevolution will occupy the remainder of this chapter.
Introducing a central empirical regularity
By a way of introduction, figure 1 renders the main empirical regularity of both the greatcontraction of 1992-98 and the recovery of 1999-2007. The data are reproduced in detail in tables1 and 2.1 The figure plots the index of real GDP in 1991-2007 holding the 1991 level as thebenchmark 100 percent. The figure compares it with the index which represents a measure of
Free and Not So Free to Charge: Income Redistribution and Russia, 1992-2007 2
inverted income redistribution. The benchmark year is also 1991. The index is truncated between1991 and 1992 to accommodate its sharp decline in early 1992 due to price decontrol, an inflationaryspike, and a multifold decline in the money demand. The composition of the index representsmechanically the ratio of the money stock M2 to the stock of enterprise receivables at each year-end(see the Glossary to this chapter ). Accumulation of receivables by the network of enterprises is thecentral redistributive instrument under Russia’s economic system in 1992-2007 using the trade creditchannel. This statement can be proven is the sum of various subsidies to the enterprise networkthrough various channels is equal to the amount of receivables, and this proof is forthcoming below.In this case, accumulation of receivables operates as fiscal claims on subsidies from the governmentand the public, and the stock of receivables does indeed represents the buildup of redistributiveclaims. The money stock constitutes loanable funds owned by households. Since the stock ofreceivables embodies income redistribution, the ratio of the money stock to receivables can standfor the inverted index of income redistribution.
The empirical regularity through both the contraction of 1992-98 and the recovery of 1999-2007 is the match of this index with the index of real GDP. This is true for every year for the periodof 17 years, for both the downward slope of the contraction and the upward slope of the recovery,and for minor ups and downs. Mechanically, this empirical regularity is possible if the annualgrowth index of nominal enterprise receivables operates as the deflator of the money stock and GDP.That is, if it carries a broad price index. It will be documented below that this possibility is real.In which case the index of the ratio of the money stock to receivables constitutes the index of thereal money stock which matches the index of the real GDP when the change in money velocity istruncated. The nominal mechanics of this empirical regularity are basic, it is the measure of(inverted) income redistribution that makes is interesting and specific to Russia’s economic system.
As a broad empirical rule, the greater is redistribution of income, the lower is economicgrowth and the smaller is income redistribution, the higher is economic growth. An abrupt increasein income redistribution, such as an opening of a major new channel, in conjunction with theabolition of forced production of central planning and with retardation of incentives for humancapital and technology, can lead to GDP contraction. Reduction of income redistribution, such asnarrowing of its major channel, leads to an economic recovery. This empirical regularity fits Russiain 1992-2007.
Empirical irregularities
Many observers attribute Russia’s GDP recovery in 1999-2007 to rising world oil prices.The same rationale can stand for all natural resource and commodity prices. The reasoning for thisexplanation is the improvement of the terms of trade. In one channel, the rising external demandstimulates domestic production, first in oil, and subsequently through the value-added chain. In anadditional channel, the fiscal position of the government improves through higher tax revenues,which reduces inflation, and supports a framework for economic growth. This explanation has anintuitive appeal for short-term economic fluctuations. But it does not constitute a long-termempirical regularity. Even if this explanation worked for the recovery in 1999-2007, it would bespecific for the recovery and would not account for the great contraction of 1992-98. But this
Free and Not So Free to Charge: Income Redistribution and Russia, 1992-2007 3
explanation cannot account for the recovery in 1999-2007, either.
Figure 2a indicates that the profile of global crude oil prices in constant terms and the indexof Russia’s GDP in 1991-2007 may resemble a correspondence. Taken by periods, prices fell from1991 to 1998 and increased in 1999-2007, and Russia’s GDP contracted and recovered during thesame periods. This correspondence is spurious. It disappears if the steep rise in crude oil prices in2004-2007 is truncated. Figure 2a shows that real oil prices in constant 2006 dollars fluctuatedwidely around $27 per barrel in 1991-2003. Figure 2b shows that real oil prices in constant termsalso fluctuated around $27 per barrel during 18 years in 1986-2003, including the last four years ofmoderate economic growth under central planning, 1986-1989, the mild contraction in 1990-91, thegreat contraction in 1992-98, and the first four years of the recovery, 1999-2003. Annualfluctuations of oil prices and GDP growth do not correspond during both periods of contraction in1990-98 or 1992-98 and the recovery in 1999-2007. Oil prices increased in 1995-1996 when GDPcontinued to slide. Oil prices declined in 2001 and 2002 when GDP continued to recover.
More important considerations point to the lack of empirical regularity or even acorrespondence between world oil prices and Russia’s economic growth even for one period, thatof GDP recovery in 1999-2007. Figures 2a and 2b demonstrate that neither the demand channelsnor the supply channels that should transmit the impact of world prices to economic growth wereoperating. Crude oil prices started to recover in 1999 after the Asian crisis. Russia’s GDP alsostarted to recover in 1999. But neither Russia’s export revenues from oil, natural gas, and in totalon the demand side (see figure 2a and table 3) nor oil and natural gas output on the supply side (seefigure 2b) recovered in 1999. Russia’s GDP recovery started in 1999 without oil output rise, withoutnatural gas output rise, and without export revenues increase from either of them and in total.
GDP recovery accelerated in 2000 which saw a 10 percent growth and continued rapidly in2001-2002 and oil output also increased, along with other products in the economy, but natural gasoutput declined and, most importantly, export revenues from each of these commodities and totalexport revenues increased only in 2000 and remained flat in 2001-2002 as global energy pricesdeclined. In all, the trigger of the economic recovery in 1999 and the entire rapid economic recoveryin the first five years, 1999-2003, have no indication for being attributed to the rise in global oil andother commodity prices. Finally, the rapid appreciation of world oil prices in 2004-2007 in constantterms and the corresponding more than twofold increase of Russia’s oil export revenues and totalexport revenues was not accompanied by an acceleration of GDP growth rates which fluctuated in2003-2007.
Absence of an empirical regularity on these scores corresponds to the cross-national data infigure 3 on the GDP dynamics both among major global oil exporting economies and among formerSoviet states, oil exporters and oil importers alike.
Figure 3a documents the heterogeneous economic performance of the six major petroleum-exporting countries around the world in 1992-2007. In Russia and across countries, it isuncorrelated with oil price fluctuations. Figure 3b illustrates how economic recovery synchronizedin Russia, Ukraine, Kazakstan, and other former Soviet states, both net oil exporters (Russia,
Free and Not So Free to Charge: Income Redistribution and Russia, 1992-2007 4
2Vernon L. Smith, “Trust the Customer!” The Wall Street Journal, March 8, 2006, p. A20.
Kazakstan, Azerbaijan) and importers (Ukraine, Belarus, Moldova). The oil factor was neithernecessary (viz., Ukraine) nor sufficient (viz., Venezuela) for economic recovery and growth in theearly 2000s. The oil connection abstracted from the economic system and policy is specious.
Russia’s economic recovery raises a more fundamental, flammable, and incendiary issue thanoil. Figure 4 illustrates it. In Russia and similar post-central plan economies, liberalization andprivatization coincided with the great economic contraction in 1992-98. Partial de-liberalization andde-privatization in Russia, starting with mandated repatriation of export revenues, coincided witheconomic recovery in 1999-2007. This chapter will address this theme at the end. It will discusshow the impact of economic freedom and of private property rights institutions is ambivalent withrespect to income redistribution, general productive incentives, and long-term economic growth.It depends on the economic system. If it entails freedom from income redistribution, it is thefreedom to create new wealth, and it is eminently productive. If it coincides with freedom toredistribute income from the government, firms, and households, it suppresses productive incentivesand economic growth. Government restriction of such freedom, e.g., in China or in Russia after1998, fosters economic performance.
Socialism from Below: Third Party Billing
To start with a quick frame of reference, one can view Russia’s economy as third partybilling. X sells products to Y and charges Z. This operation is familiar on the sectoral scale in U.S.health care services and higher education. Health care providers charge insurance companies or thegovernment. State colleges charge student tuition to the state government. Buyers receive productsfor free and don’t economize on quantity and prices. Sellers can overcharge for their products whenthe third party pays. This incentive structure is responsible for rapidly rising health care costs andtuition. Vernon L. Smith thus summarized this systemic market distortion:
Here is a bare-bones way to think about this situation: A is the customer, B is the serviceprovider. B informs A what A should buy from B, and a third entity, C, pays for it from acommon pool of funds. Stated this way, the problem has no known economic solutionbecause there is no equilibrium. There is no automatic balance between willingness to payby the consumer and willingness to accept by the producer that constrains and limits thechoices of each.2
After the abolition of central planning, a novel system of third party billing evolved in Russia. Itis national in scope and runs from below. Enterprises bill the government and the public.
Aggregate third party billing
Figure 5 and box 1 join forces on the next pages to explore step-by-step how this novel
Free and Not So Free to Charge: Income Redistribution and Russia, 1992-2007 5
system had adapted and how it operates. In essence, enterprise X sells goods and services toenterprises Y and Z, receives some payments, and implicitly charges the unpaid balances to thegovernment. Enterprise Y sells goods and services to enterprises Z and X, receives some payments,and implicitly charges the unpaid balances to the government. Enterprise Z sells goods and servicesto X and Y and to retailers, receives some payments, and implicitly charges the unpaid balances tothe government. Circularly, all enterprises except retailers, various services, and outliers charge thegovernment. In practice, enterprises X, Y, and Z issue invoices to buyers and receive payments overtime. As in the universal practice of trade credit, sales and their invoices precede payments. (Seethe Glossary for definitions). In accounting terms, the balances of the amounts invoiced net ofpayments constitute the outstanding balances of accounts receivables, or simply receivables. In mosteconomies, the outstanding balances of receivables are paid by buyers. In Russia and similarcountries, enterprises charge these balances to the government and the public at large, take thesubsidy, and then pay each other. Enterprises Z, Y, and X take the subsidy and pay X, Y, and Z withpublic funds. This unique subsidy is taken, not given, charged, not solicited.
The monthly data in figure 5 cover the period 1992-97 and truncate in 1998, for bothpresentation and substantive reasons. This was the period of the unfettered operation of aggregatethird party billing, before enterprise freedom to charge the government was restricted. Herewith abrief preview. When invoices outgrow payments, enterprises amass the balances of receivables.Enterprise income winds up to a great extent in receivables instead of cash. For many enterprises,receivables exceed net income. Enterprises increase payables—do not pay bills—lest their net cashflow turn negative. Tax arrears supplement payment arrears, especially for industries wherereceivables exceed payables. Enterprises appropriate taxes withheld from workers and collectedfrom consumers, which they do not remit to the government. The government cannot enforce fulltax remittance when enterprise bank accounts are drawn down. Tax non-remittance on a nationalscale rules out government crackdown, seizing assets, or bankruptcy for it will wipe out the tax base.The government is forced to monetize tax remittance and enterprise payments (even if thegovernment monetizes its budget deficit, itself due to tax non-remittance, the money is fungible).The banks transmit monetization through credit for payments, roll over and expand this credit.
Figure 5 highlights a regular empirical match between receivables and the subsidy theyenforce. It shows how over time the outstanding balances of enterprise receivables match the sumof (1) tax non-remittance and (2) monetization multiplied through the banking system (approximatedas the domestic money balances M2). These are the two principal channels of the subsidy wrungfrom the government. They sum up into a self-enforceable subsidy. The simple point of figure 5is that the government and, ultimately, the public are forced to pay the enterprise bill.
The difference of aggregate third party billing
The national scale, across industries and enterprises, shifts third party billing towards thegovernment and the public (households, consumers) as the ultimate payers. In the supply chain overthe stages of processing, every enterprise is both buyer and seller of products, and most enterprises,except retailers, various services, etc., issue invoices. The national scale aggregates third partybilling and enables the entire enterprise network to charge the government and the public at large
Free and Not So Free to Charge: Income Redistribution and Russia, 1992-2007 6
3Third party billing on the national scale is unique and extreme. It aggregates (1) various sectoral cases of thirdparty billing and (2) cross-sectoral subsidies between enterprises and industries through the mechanism of trade credit.The latter between individual sectors redistributes income from sellers to buyers without billing the government. SeeRobert A. Schwartz and David K. Whitcomb, “Implicit Transfers in the Extension of Trade Credit,” in Kenneth E.Boulding and Thomas F. Wilson, eds., Redistribution Through the Financial System: The Grant Economics of Moneyand Credit (New York: Praeger Publishers, 1978), pp. 191-208. Aggregate third party billing, wherein the governmentis the third party, extends cross-sectoral subsidies to total industry cross-sectoral operations. This creates the nationalscale of income redistribution from the government to the enterprise network.
4In the taxonomy borrowed by social sciences from biology, this represents parasitic symbiosis. Symbiosismeans cohabitation of different and dissimilar organisms. The taxonomy consists of three types of symbioses: 1)mutualist, that is, mutually beneficial for survival, e.g., bees and flowers, flowers provide nutrients to bees, bees pollinateflowers; 2)commensual, that is, one organism benefits and the other is neither helped nor harmed, e.g., birds and trees;and parasitic, in which one organism corrodes, consumes, and destroys the other. See Kim McQuaid, Uneasy Partners:Big Business in American Politics, 1945-1990 (Baltimore: Johns Hopkins University Press, 1994), p. XV and passim.In view of the fiscal default of August 1998, due to tax non-remittance by and subsidies to the enterprise network, thelatter’s relation with the government constitutes a parasitic symbiosis.
5All post-central plan economies northwest of China in the 1990s and even evolving central plan economies,such as Yugoslavia in the 1960s and the 1970s, exhibited this system. See Laura D. Tyson, “Liquidity Crises in theYugoslav Economy: An Alternative to Bankruptcy?” Soviet Studies 29, no. 2 (April 1977): 284-295; P.T. Knight,“Financial Discipline and Structural Adjustment in Yugoslavia: Rehabilitation and Bankruptcy of Loss-MakingEnterprises,” World Bank Staff Working Papers, no. 705 (Washington, D.C.: The World Bank, 1984); Guillermo A.Calvo and Fabrizio Coricelli, “Credit Market Imperfections and Output Response in Previously Centrally PlannedEconomies,” in Gerard Caprio, David Folkerts-Landau, and Timothy D. Lane, eds., Building Sound Finance in EmergingMarket Economies (Washington, D.C.: The International Monetary Fund and the World Bank, 1994), pp. 257-294;Guillermo A. Calvo and Fabrizio Coricelli. “Inter-Enterprise Arrears in Economies in Transition,” in Robert Holzmann,Janos Gacs, and George Winckler, eds., Output Decline in Eastern Europe: Unavoidable, External Influence orHomemade? (Dodrecht, Boston, and London: Kluwer Academic Publishers, 1995), pp. 193-212; Enrico C. Perotti. “ ATaxonomy of Post-Socialist Financial Systems: Decentralized Enforcement and the Creation of Inside Money,”Economics of Transition 2, no. 1 (January 1994): 71-81; Enrico C. Perotti, “Inertial Credit and Opportunistic Arrearsin Transition,” European Economic Review 42, no. 9 (November 1998): 1703-25; Fabrizio Coricelli, MacroeconomicPolicies and the Development of Markets in Transition Economies (Budapest: Central European University Press, 1998),pp. 52-85; Clifford G. Gaddy and Barry W. Ickes, “Russia’s Virtual Economy,” Foreign Affairs 77, no. 5 (September-October 1998): 53-67; World Bank, Europe and Central Asia Region, Energy Sector Unit, “Non-Payment in theElectricity Sector in Eastern Europe and the Former Soviet Union,” Technical Paper 423 (Washington, D.C.: The WorldBank, 1999); Brian Pinto et. al, “Dismantling Russia’s Nonpayments System: Creating Conditions for Growth,” TheWorld Bank, World Bank Technical Paper, No. 471 (Washington: The World Bank, 2000); and, Brian Pinto et. al., “GiveMacroeconomic Stability and Growth in Russia a Chance: Harden Budgets by Eliminating Non-Payments,” Economics
(households and consumers) for its outstanding receivables.3
This marks the basic difference between sectoral and aggregate third party billing. Theformer is voluntary and contractual. The latter forges a symbiotic bond in which enterprises takethe initiative and the government is forced to pay.4 This feature is unique and extreme. Aggregatethird party billing charges from enterprises to the government, that is from below to above (ineconomic terms, it is endogenous). The subsidy is taken by the enterprise network from below, notgiven by the government from above. Ironically, yet evolutionary, this system represents a totalsocialist economy in reverse, as if central planning flipped topsy turvy. Box 2 depicts thisevolution.5
Free and Not So Free to Charge: Income Redistribution and Russia, 1992-2007 7
of Transition 8, no. 2 (2000): 297-324; and, Michael S. Bernstam and Alvin Rabushka, Fixing Russia’s Banks (Stanford:Hoover Press, 1998), pp. 28-33, 69-71, 84.
6This treatment of the soft budget constraint under central planning is opposite to the standard literature whichviews the government as the benevolent and weak-willed dictator unable to commit himself to not subsidizingenterprises. See Janos Kornai, Eric Maskin, and Gerald Roland, “Understanding the Soft Budget Constraint,” Journalof Economic Literature 41, no. 4 (December 2003): 1095-1136. This view is inconsistent with the very fact that he isable to keep forced production. The standard view fits individual and sectoral bailouts in Western and developingeconomies, a species systemically different from central planning.
7A quick taxonomic distinction. Aggregate third party billing (1) is collective, all-encompassing, not of sectoralspecial interests; (2) entails a subsidy taken from below, not given from above; endogenous, not exogenous; (3) worksautomatically, not through the political process; and (4) subsidy extraction is cost-free to enterprises, does not involvespending resources of time, effort, and money. On each of these four counts aggregate third party billing is opposite to
Central planning integrated a uniform assembly line. Individual enterprises acted as the floorshops on the assembly line of forced production under government output quotas. This was averitable nation-enterprise. This system necessitated aggregate third party paying. Wheneverenterprise Y under-produced output or overspent inputs, lost income, run into a negative net cashflow problem, and missed the due date to pay its bills to enterprise X, the government financedenterprise Y to enable it to make payments to X. The government then punished enterprise Y forfailing central plan output and input quotas. This financing of payment arrears (dubbed in theliterature as the soft budget constraint) represented an automatic credit line. It served thegovernment to enforce an uninterrupted flow of output, forced exchange, and forced delivery on thevertical assembly line from X to Y and to enforce performance of Y. Third-party paying was fromabove, from the government to enterprises (in economic terms, exogenous). It was the governmentmeans to enforce forced production/exchange/delivery under central planning. It was thus a uniqueforced subsidy from the government. Like in making foie gras, it was the force-feeding ofimmediate production units in order to increase output quotas.6
Abolition of central planning could come in various ways. The government could phase-outthe inherited nation-enterprise by phasing-in the new-entrant market sector and thus shrinking theshare of the old state sector in GDP. China chose this strategy bypassing liberalization andprivatization of the preexisting state sector. Russia opted for liberalization of transactions andprivatization of preexisting enterprises. This strategy subsumed the abolition of central planning.Inadvertently, it enabled the inherited assembly line of enterprises to adapt into a subsidy-extractingnetwork. Individual enterprises (more exactly, owners and managers) were free to join within thesubsidy network or survive and perish without.
The enterprise network adapted aggregate third-party paying into aggregate third-partybilling. This amounted to socialist devolution of fiscal and monetary authority from the governmentto the enterprise network. Aggregate third party billing empowers the network to enforce its ownsubsidy from the government and the public. In effect, the enterprise network collects a tax fromthe public. This subsidy and this tax is one and the same, to wit, the tax subsidy. It represents theparallel taxation of the public by the enterprise network. One can dub this new economic systemEnterprise Network Socialism.7
Free and Not So Free to Charge: Income Redistribution and Russia, 1992-2007 8
what the literature calls rent-seeking. Also, the above point (2) indicates that aggregate third party billing charges frombelow, endogenously, and is thus opposite to what the literature calls the soft budget constraint, which is operationallythird party paying. The latter can be total under central planning or sectoral in many other economies (e.g., bailouts),but it streams from above, is exogenous in all cases. These are the taxonomic systemic differences between aggregatethird party billing under Enterprise Network Socialism and various other species of socialism (income redistribution).Ignoring these systemic differences leads to wrong diagnostics which begets wrong policies.
8The Consumer Price Index (CPI) is used as the deflator in figures 6 and 7. The choice of an appropriatedeflator is a complicated specialist issue beyond the scope of this work. The Producer Price Index (PPI) might have beenmore pertinent for deflating receivables but in Russia this index is available for industrial output only, which constitutesabout one-third of GDP. For completeness, the CPI is used and, for consistency, it is used for both Russia and the U.S.Another option is the GDP deflator. Unlike the CPI, it includes prices of exports, which makes it less appropriate forthis exercise, and excludes prices of imports, which makes it more appropriate. Further research may try alternativedeflators. The choice of the deflator does not affect empirical findings beyond figures 6 and 7.
9They are converted from annual rates of growth of real GDP.
How a mechanism operates often tells why it exists and how it came into existence. Theevolution from central planning to Enterprise Network Socialism transpires from that the inheritednational assembly line, not scattered sectors or enterprises, can enforce third party billing frombelow. This approach dissects what had evolved historically as an adaptive operation of learningby doing. The next pages follow box 1 and figure 5 in laying out this operation step-by-step.
Step 1. Surcharge
Step 1 is the easiest for enterprises to undertake and the hardest for observers to see and toexplicate. It reveals itself through a chain of empirical observations. They compare the operationof accounts receivable in the U.S. and Russia. The U.S. data merely exemplify the standard practiceof trade credit in market economies and serve as a benchmark to highlight Russia’s difference. Thestock of accounts receivable in figure 5 and in various subsequent figures and the flow of receivablesin the flows of funds in tables 4 and 5 list nominal values in current dollars or rubles. To eliminatethe influence of inflation, several diagrams of figure 6 deflate nominal receivables and plot realreceivables in inflation-adjusted values.8 This decomposition of various indices of nominalreceivables into the indices of real receivables and the price index in figures 6 and 7 opens aPandora’s Box—not for the U.S. data obviously, but for Russia’s.
! Observation 1. Separation
The first observation may seem to be blase and trivial. Figure 6 contrasts two patterns oftrade credit, in the U.S. and Russia. To define these patterns, figure 6 juxtaposes the annual indicesof nominal or real receivables in 1991-2007 and the annual indices of real GDP. The latter serveas reference points.9 Figures 6.1 and 6.2 compare the indices of nominal receivables in currentrubles or dollars in the U.S. and Russia against GDP growth. Figures 6.3 and 6.4 offer a sharperpicture with real receivables in inflation-adjusted dollars or rubles on the same backdrop of GDP
Free and Not So Free to Charge: Income Redistribution and Russia, 1992-2007 9
10Only figure 6 and the discussion around it alternate nominal and real receivables. The rest of the figures,tables, and discussion employ nominal receivables in current rubles or dollars. The qualifier ‘nominal’ is dropped forbrevity except in figure 6 and the surrounding discussion.
11The sophisticated literature on the cyclical pattern of trade credit in the U.S. covers many complexities omittedhere. See Mike Bukhart and Tore Ellingsen, “In-Kind Finance: A Theory of Trade Credit,” American Economic Review94, no. 3 (June 2004): 569-590; Robert A. Schwartz and David K. Whitcomb, “Implicit Transfers in the Extension ofTrade Credit,” pp. 191-208, especially pp. 197-199; Raymond Fishman and Inessa Love, “Trade Credit, FinancialIntermediary Development, and Industry Growth,” Journal of Finance 58, no. 1 (February 2003): 353-374; Mitchell A.Petersen and Raghuram G. Rajan, “Trade Credit: Theory and Evidence,” Review of Financial Studies 10, no. 3 (Fall1997): 661-691; Arthur Laffer, “Trade Credit and the Money Market,” Journal of Political Economy 78, no. 2 (April1970): 239-267; and a pioneering article by Allan H. Meltzer, “Mercantile Credit, Monetary Policy, and Size of Firms,”Review of Economics and Statistics 42, no. 4 (November 1960): 429-437. What this literature treats as counter-cyclicaladjustments of trade credit we view as lags of cyclical fluctuations. But this is a matter of interpretation of the samefacts. See footnote 14 below.
12The choice of the period 1971-1984 is both substantive and presentational. Substantively, it is the period ofthe highest U.S. inflation in the recent decades since the annual data on receivables are available. The choice of thespecific years, 1971-1984, is a matter of presentation. They start 20 years before the observation period 1991-2007.
growth.10
Receivables in the U.S. exhibit a cyclical pattern with short lags.11 Receivables increaseduring the years of economic growth and decline during recessions and their aftermath. Receivablesdeclined even during and after a short recession of 2001 which lasted two intermittent quarters, wasdwarfed by growth in other quarters, and thus did not show in the annual data. In 1991-2007, thesame pattern holds in both nominal (figure 6.1) and real, inflation-adjusted terms (figure 6.3).
Nominal receivables show the same cyclical pattern as real receivables when inflation is low,specifically, when the rate of inflation is lower than the annual indices of real receivables. Wheninflation is higher, its contribution to nominal receivables exceeds the decline of real receivablesduring recessions. This makes nominal receivables deviate from the cyclical pattern. Figures 6.5and 6.6 illustrate this condition. They juxtapose indices of nominal or real receivables with theindices of real GDP growth and also with the annual price index in the U.S. in 1971-1984.12 Realreceivables in figure 6.6 exhibit a pronounced cyclical pattern. It holds consistently through severalintervening intervals of economic expansion and contraction with rising and falling real receivables,respectively. The cyclical pattern of real receivables is the same in 1971-1984 and in 1991-2007.The indices of nominal receivables in figure 6.5 offer a mixed relationship with the growth of realGDP because nominal receivables are a composite variable subject to the inflation bias. At the sametime, the indices of nominal receivables exhibit the lack of any regular relationship with the annualprice index. This point will resurface during the next observation.
In Russia in 1991-2007, receivables display an idiosyncratic pattern. Both nominal and realreceivables in Russia in figures 6.2 and 6.4 show the absence of any regular relationship with realoutput, with productive economic activity. Nominal receivables increased massively during the
Free and Not So Free to Charge: Income Redistribution and Russia, 1992-2007 10
13There was an extraneous reduction of nominal receivables in August-September 1992 due to the clearing(settlement) conducted by the Central Bank. Consult the Glossary for definitions and description.
14The index of real receivables is a mechanical result. It derives from dividing the index of nominal receivablesby the price index. It is thus sensitive to the price index in a given year. In 1996, the Russian State Committee onStatistics changed its methodology of calculating the Consumer Price Index (CPI). It replaced the basket of goods andservices on which the CPI is based, replaced the so called “old basket” with the “new basket.” A series of empiricalstudies found that the value of the new basket which started to serve as the baseline for CPI estimates was lower by 1.5times than the value of the old basket (see Moscow Institute of Electronics and Mathematics, Laboratory of EconometricStudies, V. Zhikharev et. al., “How to Measure Living Standards,” at http://www.rau.su/observer/N05_99/5_15.HTM).If this estimate is correct, the price index in 1996 was understated by 1.5 times and the index of real receivables isoverstated in figure 6.4 by the same 1.5 times. Then the spike of 1996 in figure 6.4 is an error. Indirect evidence leadsto a similar conclusion. GDP deflator was 1.5, implying the inflation rate more than twice as high as 21.8 percent riseof the CPI (Russian State Committee on Statistics, Rossiiskii Statisticheskii Ezhegodnik 2004, Moscow, 2004, pp. 627,303). If one views the price index in Russia as inflationary expectations embodied in the growth of nominal receivables,in the consistent relationship illustrated in figure 7.1, the inflation rate of 21.8 percent in 1996 is low in comparison withthe growth of nominal receivables by 91 percent in that year. If one rather views the price index in Russia as a laggedresponse to money growth, the latter was higher in the reference period than 21.8 percent. The monetary aggregate M2increased by 70.4 percent from July 1995 to July 1996, if one looks for the six-month lag, by 53.6 percent from October1995 to October 1996 if one looks for the three-month lag, and by 30.6 percent from January 1996 to January 1997 ifone discounts any lag, at the time of GDP decline of 3.6 percent. (The data derive from the Central Bank of Russia,various releases). If one abstracts of the differences between the CPI and GDP deflator, to reconcile these numbers withthe CPI in 1996, the velocity of money circulation must have declined by 10 to 30 percent (the demand for moneybalances increased by 12 to 45 percent) in 1996. This might be plausible because disinflation was rapid or not plausiblebecause inflation was still high. This is a technical issue which remains unclear. The empirical impact of the 1996outlier is limited to decomposed relationships between real receivables and economic growth (figure 6.4) and betweennominal receivables and the price index (figure 7.1). This does not affect the composite relationships between nominal
great contraction of 1992-1998 and continued to increase moderately in 1999-2007.13 Theseincreases correspond closely to increases in the annual price indices in figure 7.1. This leaves realreceivables vis-a-vis real economic activity in figure 6.4. The indices of real receivables lack anyrelationship with the indices of real GDP. Real receivables saw increases during the years of the greatcontraction of 1992-98 except 1993 and 1998 and declined or held unchanged during the years ofthe recovery of 1999-2007 except 2006-2007. The pattern that arises here is detachment of realreceivables from economic activity. Output declines and recovers but real receivables exhibit noparticipation in or reaction to production and sales. Trade credit and productive activity walk theirown separate paths as if they operate on different planes of existence, detached from each other.Russia exhibits a unique pattern of separation of trade credit from production and sales.
! Observation 2. Alignments
The path of real receivables in Russia in figure 6.4 is not only detached from output but, withthe exception of the years 1991 and 1996, nearly stagnant. The year 1991, when real receivablesfell significantly during contraction, similarly to the cyclical pattern, ended the previous economicsystem. It was the last year of central planning passing away, before liberalization of transactionsand privatization of productive assets commenced in 1992, and its pattern is different. 1991 isincluded in figure 6 and other documentation for comparison only. The year 1996 when the indexof real receivables shows a spike is an evidential outlier. It may be a statistical error14 or a genuine
Free and Not So Free to Charge: Income Redistribution and Russia, 1992-2007 11
receivables and the combined subsidy (figure 5 and similar subsequent figures 13 and 14) and between economic growthand nominal receivables acting as a deflator of money balances (figure 1). That is, this does not affect central, principalrelationships.
15See sources in figure 6.3. These estimates are crude and serve as an illustration only. They rely on disparatedeflators because the real GDP data from National Income and Product Accounts apply the GDP deflator but realreceivables, to be consistent in the comparative context with Russia’s measures, are deflated by the CPI. This problemcan be avoided if one compares growth indices of nominal GDP and nominal receivables. Still, a rigorous test of thisregularity (the growth of output aligns with the growth of receivables) requires numerous multi-period combinations atvarious intervals. It is beyond the theme and the scope of this book.
exception, for reasons unknown, from an otherwise narrow stable range around unity. Clipping the1996 data from the path of real receivables charts a trend through 1992-2007 spanning the gap of1996. All fluctuations in 1992-1995 and 1997-2007 are minor, random, and cancel each other overtime. The index of real receivables actually hovered around unity and was stable within a narrowrange. The indices of real receivables are nearly invariant to GDP decline or growth. Real receivablesin Russia seem to align with the index equal to unity, which implies zero growth of real receivables overtime.
Figure 7.1 displays the complementary part of this relationship during the same period 1992-2007. It shows that the separation pattern in Russia closely relates, indeed matches on the annualbasis, the path of nominal receivables with the price index. Minor annual fluctuations which deviatefrom this match move randomly. A closer match of the two indices smooths over time and formsa continuous relationship. This continuous relationship is consistent with the indices of realreceivables hovering around unity and converging towards it. Tautologically, if the index of realreceivables hovers around unity, the index of nominal receivables must align with the price index.Figure 7.1 documents the latter alignment.
The outstanding stock of nominal receivables in the U.S. increased from $1,033.1 billion in1990 to $2,405.6 billion in 2005, that is, by the factor of 2.33. The Consumer Price Index increasedby the factor of 1.51 in 1990-2007. The real (inflation-adjusted) growth of receivables was 2.9percent per annum. GDP in chained 2000 dollars increased from $7,112.5 billion in 1990 to$10,841.9 billion in 2004, that is, by 2.9 percent per annum. Extending this exercise to the 25-yearperiod 1980-2004 yields the average growth rate of about 2.9 percent per annum for real receivablesand 3.0 percent for real GDP. Going back 50 years and covering the period 1955-2004, givesannual growth rates of GDP at 3.2 percent and real receivables at 3.3 percent.15
The cyclical pattern of trade credit in the U.S. in figure 7.2 bears no regular relationshipbetween nominal receivables and price indices. The lack of their relationship showed also in 1971-84 in figure 6.5. This dissociation is mechanically consistent with the alignment of growth of realreceivables with the growth of real GDP.
Box 3 in the top matrix summarizes the contrasting alignments over time. Under thecyclical pattern of trade credit in the U.S., growth of real receivables aligns with growth of realoutput. Tautologically, growth of nominal receivables aligns with growth of nominal output. Under
Free and Not So Free to Charge: Income Redistribution and Russia, 1992-2007 12
16This cyclical pattern of trade credit contains a paradoxical lag. When spending tightens, payments decelerate.This is cyclical. But decelerated payments mean that even if new invoices are smaller than past invoices, new invoicesmay exceed current payments, and receivables continue to increase in the beginning of recessions. When spendingexpands, payments accelerate. This is cyclical. But accelerated payments mean that even if new invoices are greaterthan past invoices, current payments may exceed new invoices, and receivables decline in the beginning of recoveries(e.g., in 2002; see figures 6.1 and 6.3). The paradox of this lag is that because payments are cyclical, receivables lookcounter-cyclical in the very short run. But there is no counter-cyclical pattern here because this relationship isintermittent and the lags are periodic, temporal, and discontinuous. They do not extend beyond the beginnings ofrecessions and recoveries and dissipate thereafter. The literature discovered the lags but mistook them for a counter-cyclical pattern in the very short term. See footnote 9 above.
17The constraints and incentives behind these cyclical mechanics in a market economy such as the U.S. willbe addressed shortly, in the next observation 4 on collection of payments and in step 2 on payment arrears.
the separation pattern in Russia, real receivables stagnate within a stable narrow range and growthof nominal receivables aligns with price increases. The next observation is mechanical. Receivablesare balances of invoices net of payments. It is price increases in invoices in excess of payments thatmake up these balances in Russia and make receivables grow in alignment with the price index.
! Observation 3. Invoicing
Box 3 and figure 8 explore this mechanical connection. It is depicted in the lower half ofBox 3 and its side bars.
Mechanically, trade credit is the same everywhere since its inception. Two mechanicalpoints of reference apply to both the cyclical and the separation patterns. They apply to each sellerand to the economy as a whole. They apply in both nominal and real terms held consistently.
1. Invoices precede payments in the overlapping flows of invoices and payments.
2. Receivables constitute the balances of invoices net of payments. Receivables increase wheninvoices exceed payments. Receivables decline when payments exceed invoices.
This decomposition shifts focus from receivables to invoices as the source of empiricalalignments. It is what is in in invoices when they exceed payments and make up an increase in theoutstanding balances of nominal receivables. It can be output growth in current prices under thecyclical pattern in the U.S. Or it can be price increases per se under the separation pattern in Russia.This decomposition makes both patterns mechanically consistent in the same mold.
Under the cyclical pattern in the U.S., the mechanics transpire in real terms. When theeconomy contracts and sales decrease, new invoices are smaller than past invoices. Payments onpast invoices exceed new invoices. The outstanding balances of receivables decline. When theeconomy expands and sales increase, new invoices are greater than past invoices. New invoicesexceed payments on past invoices. The outstanding balances of receivables increase.16 This is how,mechanically, in the long run real receivables grow at the rate of growth of real output.17
Free and Not So Free to Charge: Income Redistribution and Russia, 1992-2007 13
18Apart from a slight drop in December 1997, most of these minor declines in nominal receivables occurredafter the policy reversal of September 1998, in December 1998, December 1999, January 2000, December 2000, July2001, October 2001, December 2001, January 2002, December 2002, May, July, November, and December 2003,January 2004, and December 2004. The data come from various releases of the Russian State Committee on Statisticsand the Central Bank of Russia, e.g., http://www.cbr.ru/analytics/Rus0505r.pdf . These fluctuations can be observedin figure 13 which plots the entire history of nominal receivables during the 156 months of 1992-2004. The two monthsof mechanical reductions in August-September 1992 mentioned in footnote 11 are not included in the above count butare plotted in figures 5 and 13.
19The constraints and incentives behind these mechanics follow in the next observation and the next step.Earlier, the sections on aggregate third party billing on pages 2-4 introduced how this mechanical process started.
Under the separation pattern in Russia, the mechanics transpire in nominal terms. Newinvoices raise prices and exceed past invoices valued at the previous price level. Price increasesmake up the excess of new invoices over payments on past invoices. When spending grows (thegovernment never failed to print money) and payments increase, enterprises raise prices higher sothat new invoices exceed payments on past invoices almost continuously. Sometimes it takes amonth or two for price increases in invoices to catch up with spending growth and paymentacceleration. Of the 156 months during the period 1992-2004, here were 16 months when nominalreceivables declined slightly for one month or more, including twice for two months and once forthree months in a row, but their growth resumed at an accelerated pace afterwards.18 Over time, inthe overlapping flows of invoices and payments, invoices not only exceed but continuously outgrowpayments by price increases. This is the underlying mechanical meaning of the empiricalobservation in figure 7.1 that the outstanding balances of nominal receivables grow at the rate ofprice increases.19 In short, all price excesses are in invoices.
These mechanics and their interpretation in the next observation may seem to beoverwrought, obscure, picayune, and distant from real life. Three pages later they will return to reallife. They will connect figure 7.1 with the central theme in figure 1. They will connect priceexcesses in invoices over payments with the pendulum of the Russian economy in 1992-2007.
! Observation 4. Collection
Figures 8 and 5 hint, perhaps indicate, what strategies of U.S. firms and Russian enterprisesstand behind their invoicing mechanics. One strategy makes possible the growth alignment of realreceivables with real output in the U.S.. The other strategy, in Russia, makes possible the alignmentof the indices of nominal receivables with the price index (which holds real receivables nearlystable). These strategies are summarized in the left and right side bars in Box 3. They compare howand when (and hence why) invoices exceed payments by output growth in the U.S. and by priceincreases in Russia.
Figure 8 plots the ratio of nominal receivables to GDP in 1990-2007 in the U.S. (figure 8.1)and in Russia (figure 8.2). Annual growth rates of real GDP serve as reference points. Since thisratio normalizes nominal receivables by GDP, it eliminates the influence of inflation. By itself, thismeasure merely supplements the findings already observed. The U.S. data in figure 8.1 infer that
Free and Not So Free to Charge: Income Redistribution and Russia, 1992-2007 14
20The ratio of receivables to GDP in figure 8 is roughly proportional to this average collection period on thenational scale. The numerator, the outstanding balances of accounts receivable, is the same. The denominators, GDPvs. gross sales over the stages of processing of total industry output, usually exhibit a stable relationship (with minorrandom deviations and a slowly changing secular trend). The GDP series are readily available. Consistent series on grosssales on trade credit need to be estimated. For the U.S. one can calculate the data on gross receipts of taxpaying firmsminus retail sales plus receipts of non-profit health and educational organizations and unincorporated farms. See U.S.Department of Commerce, Bureau of the Census, Statistical Abstract of the United States 2004-2005 (Washington:USGPO, 2005), pp. 483 (incomplete aggregate receipts), 484 (retail receipts), 105 (receipts of the health sector), and 530(farms receipts). For Russia one can use the data on total gross receipts and subtract retail sales and add farms sales.See Russian State Committee on Statistics, Rossiiskii Statisticheskii Ezhegodnik 2003 (Moscow, 2004), pp. 578-579(aggregate sales and retail sales), p. 406 (agriculture), and previous statistical annuals for prior years. Figure 8 takes ashortcut and uses the ratio of receivables to GDP as a proxy variable for the average collection period. The data lendsonly crude conversion. Applying the adjustments mentioned above, the volume of trade credit sales can be estimatedas about 2.3 times higher than GDP in the U.S. and 1.6 times higher in Russia. The difference is due to much higherspecialization and the much greater number of firms (and hence transactions) per unit of GDP in the U.S. The ratio ofreceivables to GDP can be divided by these factors and multiplied by 365 days to approximate the average collectionperiod. These conversion factors for the U.S. and Russia are sufficiently stable. Hence the patterns of the averagecollection period by proxy in the U.S. and Russian data in figure 8 are unaffected by how accurate are these factors foreach country and relative to each other.
(1) the ratio of nominal receivables to nominal GDP fluctuates within a stable narrow range of 17to 23 percent in a cyclical pattern, hovering around 20 percent of GDP; and (2) therefore, smoothedover time, nominal receivables grow in alignment with nominal GDP. This implies again that realreceivables grow in alignment with real GDP. In contrast, the Russian data in figure 8.2 reconfirmthat receivables are detached from productive economic activity, the paths of receivables and GDPseparate, and nominal receivables fluctuate randomly and widely between 18 and 46 percent ofnominal GDP during contraction and recovery. But the ratio of receivables to GDP can be employedmore usefully. It can serve as a proxy variable to explore different invoicing strategies.
As a measure, the ratio of receivables to GDP in figure 8 can stand as a proxy for the averagecollection period. This is a key variable under all patterns of trade credit. As the Glossarydescribes, the average collection period, also called the collection ratio or days sales outstanding (ifone can pronounce that), is the ratio of nominal receivables to daily sales on trade credit. It usuallycalculates as the ratio of receivables to annual sales (or receipts) times 365 days. It reports howmany days of unpaid sales (the balances of receivables—of invoices net of payments) areoutstanding to collect the balances.20 The average collection period may be longer than what issustainable. It is lengthier than a business can survive in the cash flow sense, pay its bills tosuppliers and creditors, wages, and taxes, without going bankrupt. This is a vital (deadly) measure.
Figure 8.1 demonstrates the U.S. pattern. The ratio of receivables to GDP, the proxy for theaverage collection period, holds within a narrow stable range. The cyclical pattern of fluctuationsis also visible. If the average collection period is short and stable, fluctuating cyclically within anarrow range, firms optimize cash flow. This means that sellers would let invoices exceedpayments in alignment with output growth and not by sheer price increases.
One can apply the conversion procedure described in the footnote below to the data in figure8.1. This yields the average collection period decreasing from 29 days in 1990 to 27 days in 1992-
Free and Not So Free to Charge: Income Redistribution and Russia, 1992-2007 15
21Encyclopedia Britannica in the article “Business Finance,” section “Accounts Receivable,” summarizes thatthe ratio of receivables to sales in U.S. manufacturing ranges between 8 and 12 percent, yielding the average collectionperiod of approximately one month (around 36.5 days, to be exact).
22The next step (Step 2, two pages below) explicates these accounting, incentives, and constraints in detail.
1994, rising steadily with GDP growth to 37 days in 2000, and then gradually shortening to 31 daysin 2003 and going up to 32 days in 2004. This is consistent with the pattern which EncyclopediaBritannica cites to typify trade credit in market economies.21 This is indeed the strategy of cash flowoptimization: short collection periods, stability of payments collection, a narrow range, and acyclical pattern.
Firms in the market economy strive to optimize their cash flow. This operation includesmanaging accounts receivable, that is, collecting payments and gearing invoices to paymentscollection. The average collection period is one of the major signs of the viability of the firm anda key indicator of its market valuation and credit worthiness. It literally pays to optimize the averagecollection period. Simpler yet, the firm cannot survive on income on the accrual basis alone. It isnot sustainable. In brief, if its buyers do not pay their bills for a lengthy period (payments are inarrears), while the firm duly pays its bills within the due period, its net cash flow may run negative.When net cash flow is persistently negative, firms may face bankruptcy and no one would lend tothem, or no one would lend them and firms may face bankruptcy, whichever sequence unravels.22
Most firms issue invoices in a cyclical pattern in order to receive payments within the due periodand thus hold a manageable balance of receivables from the cash flow standpoint. Figure 8.1 impliesthat sellers make invoices exceed payments and increase the balance of receivables in alignmentwith output growth. They do not raise prices to make invoices exceed payments and expand thebalances of receivables. Figures 6.5 and 7.2 testify to that in the U.S.
Figure 8.2 demonstrates the Russian pattern. The same procedure as above yields that theaverage collection period more than doubled from 24 days in 1991 to 51 days in 1992, shortened to45-46 days in 1994-95 only to lengthen to 63 days in 1996, 66 days in 1997, and to a whopping 104days in 1998. Then a reversal, down to 69 days in 1999 and 54 days in 2000 and gradually to 44days in 2003 and 40 days in 2004. The last column of table 1 reproduces an incomplete series ofthe direct data derived by the Russian State Committee on Statistics from enterprise records. Itreveals an even higher length of the average collection period (Days of Sales Outstanding, or DSO).This indicator rises from 68 days in 1995 to 99 days in 1996 to 136 days in 1997, and 122.8 daysin 1998. The reversal comes between 1998 and 1999. The average collection period declines to93.7 days in 1999, 74.5 days in 2000, 67.8 days in 2001, 64.0 days in 2002, 59.2 days in 2003, 55days in 2004, and 61 days in 2005.
If the average collection period is lengthy and fluctuates separately from output, enterprisesmaximize nominal receivables subject to how much subsidy they expect to enforce in lieu ofpayments. They make invoices exceed payments to that end by price increases which amass thebalance of receivables. It is this practice that undergirds the alignment of receivables and priceindices in figure 7.1. It also indicates that the causation in figure 7.1 goes from growth of
Free and Not So Free to Charge: Income Redistribution and Russia, 1992-2007 16
23A burgeoning literature inaugurates a new wave, which its practitioners call “the fiscal theory of the pricelevel.” It is possible that the Russian experience may fit as a special case with its own systemic particulars (the subsidyfrom below) and mechanics (trade credit). Only specialists in this innovative, sophisticated, and extremely technical (notto say inscrutable) field can adjudicate if their approach is what explains the Russian case. The present authors believeso, but a true test would require substantial modeling and econometric analysis, beyond the scope of this book. Of alarge body of literature, one can list only a few references here. Thomas J. Sargent and Neil Wallace, “Some UnpleasantMonetarist Arithmetic,” Federal Reserve Bank of Minneapolis Quarterly Review 5, no. 3 (Fall 1981): 1-17; KiminoriMatsuyama, “Endogenous Price Fluctuations in an Optimizing Model of a Monetary Economy,” Econometrica 59, no.6 (November 1991): 1617-1631; Eric M. Leeper, “Equilibria Under Active and Passive Monetary and Fiscal Policies,”Journal of Monetary Economics 27, no. 1 (February 1991): 129-147; Michael Woodford, “Price Level DeterminacyWithout Control of a Monetary Aggregate,” Carnegie-Rochester Conference Series on Public Policy 43 (December
receivables (indeed from invoices) to price indices, not vice versa.
The mechanism of this subsidy extraction was introduced on pages 2-3 and in figure 5.Figure 5 demonstrates how during the period from 1992 to 1998 the outstanding balances ofreceivables matched over time the sum of various subsidy channels, such as tax non-remittance andmonetization multiplied through the banking system. This mechanism became more complicatedin 1999-2007, but the pattern remained within, of which later. The next steps through Box 1 andits accompanying figures 9 to 15 explore and document the mechanism of this subsidy extractionin detail.
! Observation 5. Indexation
The final observation of step 1 is straightforward, if unconventional. Box 3 summarizes itat the bottom. Optimization of cash flow in the U.S. implies that firms index invoices to paymentsand through them to spending in the economy (that is, to the combined changes in the money supplyand the velocity of its circulation). In the process, output and prices increase or decrease in one oranother combination between them in the cyclical pattern. This indexation to payments andultimately to spending does not let invoices exceed payments by separate price increases. Thatwould expand the balance of receivables and undermine cash flow optimization. This is notsustainable. Firms could not survive thus.
In Russia, enterprises maximize nominal receivables by making invoices outgrow paymentsvia price increases. This implies that, as they increase prices to make up the balances of nominalreceivables, enterprises index invoices not to payments and hence not to spending. They indexinvoices to fiscal targets—how much subsidy enterprises expect to enforce. They learn by doing,by trial and error, as described earlier (see pages 2-4 above), and learn continuously over time, whatthese fiscal targets are. Those who learn survive and socialize the experience on the national scale.This is the collective survival of the fittest.
Ultimately, enterprises index invoices to fiscal expectations. In this pattern, price increasesare detached from spending. Excess of invoices over payments, which is made up of price increases,is detached from spending. Fiscal expectations bypass current spending (money times velocity andtheir combined changes) and generate inflationary expectations directly23, through price increases
Free and Not So Free to Charge: Income Redistribution and Russia, 1992-2007 17
1995): 1-46; Joydeep Bhattacharya and Joseph H. Haslag, “Monetary Policy Arithmetic: Some Recent Contributions,”Federal Reserve Bank of Dallas, Economic and Financial Review (Third Quarter 1999): 26-36; Charles T. Carlstromand Timothy S. Fuerst, “The Fiscal Theory of the Price Level,” Federal Reserve Bank of Cleveland, Economic Review36, no. 1 (Quarter I, 2000): 22-32; Lawrence J. Christiano and Terry J. Fitzgerald, “Understanding the Fiscal Theory ofthe Price Level,” Federal Reserve Bank of Cleveland, Economic Review 36, no. 2 (Quarter II, 2000): 3-38; JohnCochrane, “Money as Stock: Price Level Determination with No Money Demand,” National Bureau of EconomicResearch, NBER Working Paper no. 7498 (January 2000).
24Surcharge and surcharged invoicing seem to be the best terms to express this unique, perhaps ineffableprocess. Other terms can include overcharge, overbill, overinvoice, overdraft invoicing, excess invoicing. The termsurcharge is mechanical, value-neutral, and contains marginal (additive) and fiscal connotations.
25The persistence and extent of the negative value-added, or value subtraction, in the Russian economy will bediscussed later in this chapter.
in invoices in outgrowth of payments. These are self-fulfilling inflationary expectations. Theymaterialize in the outstanding balances of receivables.
The simplest way to describe this procedure is to view price increases in invoices as a pricesurcharge added to the prior price listed in past invoices. This is a third party surcharge, to be billedto the government and the public at large (households, consumers) in pursuit of the subsidy.24 Onemore inference which may seem outlandish but, on reflection, fits. Since this subsidy is collected(see figure 5 again), the price surcharge in invoices constitutes a special tax levied by enterpriseson the government and, eventually, on consumers and households. It acts like a quasi-value-addedtax on sales over the stages of processing. It is quasi and not genuine value-added tax in the nationalincome accounting sense because this tax is additive on enterprise fiscal expectations, notmultiplicative at a preset rate. Hence it applies equally to output with the positive and the negativevalue-added.25 Which makes this unique tax from below (the endogenous tax) especiallydistortionary for, on top of income redistribution, it finances and perpetuates value subtraction.
The relevance of these tedious observations comes to the fore with a quick reality check.It is the confluence of figure 1 and figure 7.1. Figure 1 relates the pendulum of Russia’s GDP in1992-2007 to the index of the ratio of money balances to receivables. Figure 7.1 relates the indexof receivables and the price index. Since the index of receivables merely embodies price surchargesin the balances of invoices in excess of payments, which makes the two indices match, the index ofthe ratio of money balances to receivables in figure 1 acquires real-life meaning. It stands for thereal money balances deflated by the price increases in excess invoicing, in pursuit of the subsidy.Fiscal expectations of the subsidy generate self-fulfilling inflationary expectations, namelysurcharged invoices. They materialize in the outstanding balances of receivables in figure 7.1,whence they are transplanted as the denominator in the index of the money balances to receivablesin figure 1.
Figure 1 relays how these inflationary expectations embodied in receivables interact withnominal spending (the money supply times the velocity of money circulation). They outgrownominal spending and contract real money balances in 1992-98. When fiscal (and henceinflationary) expectations subside in 1999-2007 and the index of receivables decelerates, nominal

Free and Not So Free to Charge: Income Redistribution and Russia, 1992-2007 18
spending outgrows receivables. Real money balances recovered in 1999-2007.
When the real money balances contracted in 1992-98, real output (GDP) contracted inalignment. When the real money balances recovered in 1999-2007, real output (GDP) recoveredin alignment, given the idle supply capacity after the great contraction and improved incentives.Less subsidy extraction, less socialism, more production.
Free and Not So Free to Charge: Income Redistribution and Russia, 1992-2007 19
Step 2. The payment jam
What happens when receivables amass? One can internalize the problem by setting up andrunning a business on this page. Then tables 4 to 6 aggregate this case and apply it to Russia.
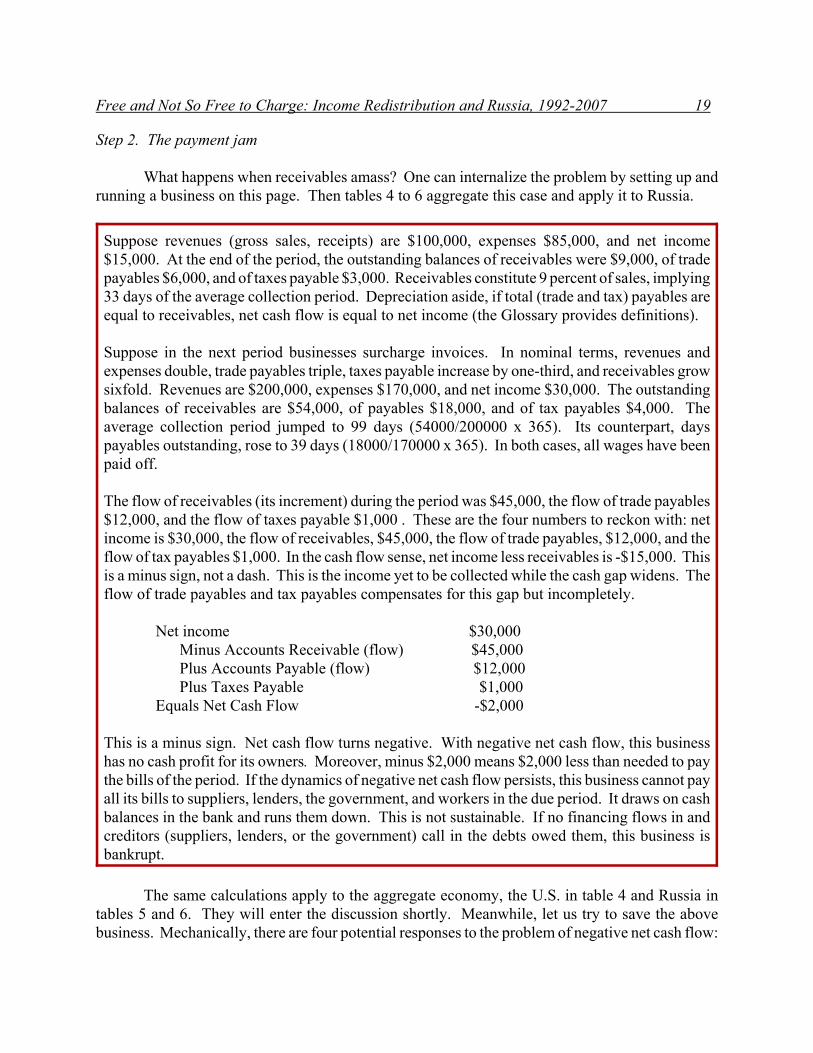
Suppose revenues (gross sales, receipts) are $100,000, expenses $85,000, and net income$15,000. At the end of the period, the outstanding balances of receivables were $9,000, of tradepayables $6,000, and of taxes payable $3,000. Receivables constitute 9 percent of sales, implying33 days of the average collection period. Depreciation aside, if total (trade and tax) payables areequal to receivables, net cash flow is equal to net income (the Glossary provides definitions).
Suppose in the next period businesses surcharge invoices. In nominal terms, revenues andexpenses double, trade payables triple, taxes payable increase by one-third, and receivables growsixfold. Revenues are $200,000, expenses $170,000, and net income $30,000. The outstandingbalances of receivables are $54,000, of payables $18,000, and of tax payables $4,000. Theaverage collection period jumped to 99 days (54000/200000 x 365). Its counterpart, dayspayables outstanding, rose to 39 days (18000/170000 x 365). In both cases, all wages have beenpaid off.
The flow of receivables (its increment) during the period was $45,000, the flow of trade payables$12,000, and the flow of taxes payable $1,000 . These are the four numbers to reckon with: netincome is $30,000, the flow of receivables, $45,000, the flow of trade payables, $12,000, and theflow of tax payables $1,000. In the cash flow sense, net income less receivables is -$15,000. Thisis a minus sign, not a dash. This is the income yet to be collected while the cash gap widens. Theflow of trade payables and tax payables compensates for this gap but incompletely.
Net income $30,000 Minus Accounts Receivable (flow) $45,000 Plus Accounts Payable (flow) $12,000 Plus Taxes Payable $1,000 Equals Net Cash Flow -$2,000
This is a minus sign. Net cash flow turns negative. With negative net cash flow, this businesshas no cash profit for its owners. Moreover, minus $2,000 means $2,000 less than needed to paythe bills of the period. If the dynamics of negative net cash flow persists, this business cannot payall its bills to suppliers, lenders, the government, and workers in the due period. It draws on cashbalances in the bank and runs them down. This is not sustainable. If no financing flows in andcreditors (suppliers, lenders, or the government) call in the debts owed them, this business isbankrupt.
The same calculations apply to the aggregate economy, the U.S. in table 4 and Russia intables 5 and 6. They will enter the discussion shortly. Meanwhile, let us try to save the abovebusiness. Mechanically, there are four potential responses to the problem of negative net cash flow:
Free and Not So Free to Charge: Income Redistribution and Russia, 1992-2007 20
reduce receivables, obtain outside financing, increase trade payables, and increase tax payables.
! Potential responses
(1) One can reduce receivables by factoring them (selling at a discount to factor agencies)or by altering the invoicing strategy towards cash flow optimization described above. Factoring canhelp occasionally, not continuously. It has no economic rationale continuously for it amounts todeflating invoices after inflating them. In the long run, it is efficient to alter the invoicing strategyand stop surcharging invoices. This solves the problem once and for all. But this is a secular matterof economic system, policy, incentives, and choices. It is beyond mechanics.
(2) One can obtain outside financing by borrowing and/or issuing equity. Both areproblematic when net cash flow is negative. The net discounted present value of a profitlessbusiness is zero. Financial markets measure earnings on the cash, not accrual, basis. Negativeearnings per publicly offered share on the cash basis do not sell shares. Borrowing increases futurepayables (interest and principal). It cannot be a sustainable solution to the negative net cash flowproblem. Bank lending in this situation on a national scale is risky beyond the banking system.Banks may rollover non-performing loans to business running negative cash flow but this isterminal. Potential non-performing loans expose banks themselves to insolvency and jeopardize thedeposit base. Furthermore, borrowers’ failure to make interest payments in due intervals may causeliquidity frictions and bank panics, with subsequent spillovers to the monetary system and theeconomy at large. Only a continuous government subsidy can induce continuous lending, creditrollover and extension under these conditions.
(3) One can increase trade payables. Initially, negative net cash flow does not halt operationsbecause the business can draw on the money balances in the bank and dispose of other assets. Aftercash balances and other assets are run down, bills cannot be paid in full within the due period.Payables fall into arrears. Thus this business does automatically increase trade payables when itsnet cash flow turns negative. This happens by default. Unpaid bills automatically increase theoutstanding balance of payables. Payment arrears (increased trade payables) turn net cash flow non-negative. Suppose in the example in the box on the previous page, payables quadrupled instead oftripled. Days payable outstanding rose to 52 days (24000/170000 x 365). Net cash flow fromoperations increased to $4,000 (30000 - 45000 + 18000 + 1000). Receivables became aged (88 daysin the example in the box above), payables are in arrears (52 days), and operations can continue andeven earn positive net income in cash. (Consult the Glossary for definitions of accounts receivableaging, aged receivables, and related terms). Increasing trade payables helps trade debtors in theshort run. This practice can last as long as trade creditors can and will sustain aging andaccumulation of their own receivables. Eventually, on a broader scale, trade creditors may findthemselves in the same box on the previous page. Their own flow of receivables may exceed netincome and net cash flow may turn negative. If and when trade creditors call in the debts owedthem, bankruptcy arrives.
(4) One can increase taxes payable. The business can stop or delay paying corporate incomeor profit tax. For quick cash, it can stop or delay remitting payroll and income taxes withheld from
Free and Not So Free to Charge: Income Redistribution and Russia, 1992-2007 21
26Russian sources contain two data series on receivables and payables. The broader series includes trade creditbetween the holding companies and their wholly owned subsidiaries. The narrow series excludes it. All our figures andtables 1 and 2 employ the narrow series. It is more suitable for analytical purposes because internal receivables betweenthe holding companies and their subsidiaries would not influence third party billing and subsidy extraction. Tables 4and 5 use the broad series because it is more suitable for the complete flows of funds.
27This is a mechanical result typical for most economies. Sales to the government and some sales to households(e.g., utilities and communications) are conducted on trade credit. They enter accounts receivable. There are no accountspayable to match because the government and households are not treated as firms in these tables. In Russia, for the samemechanical reasons, receivables exceeded payables in the 1990s. Since 1999, trade payables slightly exceededreceivables in the Russian accounts. This fact is of little consequence but it fits the overall reversal of accounts in late1998. One untested explanation points to government budget surpluses. They started after the Central Bank policy inSeptember-December 1998 mandated repatriation and sales of foreign exchange revenues by exporters. This versionof capital controls (of outflows, not inflows) liquified enterprise cash balances in the banks, which, in turn, empoweredthe government to enforce tax remittance by enterprises and run budget surpluses. The latter, in their own turn, enabledthe government to pay its bills to enterprises for various supplies within the due period. This reduced receivables acrossindustries without affecting payables. In a chain reaction, it then decelerated both payables and receivables, but thecombined result was that the outstanding balances of payables still exceeded those of receivables.
workers and value-added or sales taxes collected from consumers. This is illegal. If the governmentcan enforce tax remittance and tax payments, it will, and this business will be no more.
! Actual observations
The same considerations apply to national economies. Tables 4 and 5 compile the annualflows of funds of nonfinancial firms or enterprises in the U.S. and in Russia in 1992-2003.26 Table6 converts the Russian data into the statement of cash flows to sharpen the point.
The U.S. data in table 4 flatly rule out negative net cash flow arising from the amassment ofreceivables. In accordance with the cyclical pattern of trade credit, the flow of receivables wasnegative during the years of economic slowdown (the years with some quarters of recessions). Mostimportantly, net income of firms exceeded the annual flows of receivables by about an order ofmagnitude on the average during 1992-2003. The flows of receivables slightly exceeded the flowsof trade payables.27 There were no payroll arrears to register in the national statistics. The flowsof taxes payable were on the average less than one percent of net income and signified regular taxliabilities in the process of payment. The flows of receivables exceeded the sum of the flows oftrade and tax payables. This difference, to be subtracted from net income in calculating net cashflow, is minuscule in comparison with net income itself. In all, net cash flows were on par with netincome after minor adjustments for the flows of receivables and trade and tax payables.
When individual U.S. firms or industrial segments occasionally fell into a negative net cashflow position, like public utilities in California during the electricity crisis of 2001, it was due tounder-charged, not surcharged, output prices and to low, not massive, receivables. Negative netincome on the accrual basis caused negative net cash flow despite timely cash payments by buyers.Bankruptcies in the U.S. stem from negative net income, not from negative net cash flow. The latteris only a mechanical outcome of the former.
Free and Not So Free to Charge: Income Redistribution and Russia, 1992-2007 22
28For the distribution of the balances of receivables and payables by industrial sectors see, e.g., Russian StateCommittee on Statistics, Rossiiskii Statisticheskii Ezhegodnik 1997 (Moscow, 1997), p. 538; Russian State Committeeon Statistics, Rossiiskii Statisticheskii Ezhegodnik 2000 (Moscow, 2000), p. 536.
29Alternative dates are used for comparison because net income in 1998 was negative. The point holds withand without inclusion of 1998.
Russia’s data in tables 5 and 6 imply that net cash flow was bound to turn negative in 1992-1998 for all or at least some industries. This did not happen because of the amassment of payables,both trade payables and tax payables. To highlight this observation, figure 5 pulls the receivablesdata hidden in line item 10 of the flows of funds in table 5 and lists it directly under the data on netincome in the statement of cash flows in table 6. Ditto for the data on trade payables and tax andpayroll payables.
The flows of receivables exceeded net income in 1994, 1996, 1997, and 1998 for the entireeconomy. The flows of receivables were almost as high as net income in 1992, 1993, and 1995.Given disproportional distribution of receivables in relation to net income by industries, the flowsof receivables significantly exceeded net income for many enterprises and in a number of industries.Those were primarily the net trade creditor industries such as fuel energy, electric power,engineering (machine building), construction, and transportation.28
Recall from table 4 that in the U.S. the flows of receivables constitute about 10 percent ofnet income. In Russia during 1992-97, the flows of receivables exceeded net income by 25 percent;in 1992-98, by a factor of 2.7.29 Since 1999, net income steadily exceeded the flows of receivablesby a factor from 1.6 to 2.9. Thus over the period 1992-1998, net income of Russian enterpriseswound up in receivables, not cash. In terms of cash, net income of Russian enterprises was negative.They were able to operate entirely on cash from trade payables and taxes payables left not paid,which compensated for cash not received from receivables.
The flows of trade payables roughly corresponded to the flows of receivables. The flows oftax payables, that is, tax arrears and tax non-remittance, grew so fast that they caught up with netincome in 1996. The flows of tax non-remittance constituted a whopping 85 percent of net incomeover the period 1992-1998 (474.5 and 561.3 billion rubles, respectively). Recall that the flows oftaxes payable hover around one percent of net income of U.S. businesses. Tax non-remittancesupplemented trade payables in counter-balancing receivables. This applies especially to net tradecreditor industries referenced above (fuel energy, electric power, engineering, construction, andtransportation), whose receivables exceeded payables. Tax non-remittance was a major source ofpositive net cash flow which enabled enterprises to render net income (profits) in cash.
! The chain reaction
One man’s receivables are another man’s payables. Money is fungible. These two basicpropositions explicate that maximization of receivables (subject to the expected subsidy) was thesource of the amassment of trade payables and that tax arrears supplemented payment arrears. As
Free and Not So Free to Charge: Income Redistribution and Russia, 1992-2007 23
30This situation especially affects net creditor industries listed above but export revenues mitigate it for thecrude oil and natural gas industries.
noted earlier, the average collection period expanded from 24 days in 1991 to 51 days in 1992,shortened to 45-46 days in 1994-95 only to lengthen to 63 days in 1996, 66 days in 1997, and to a104 days in 1998. It reversed to 69 days in 1999 and 54 days in 2000 and gradually decreased to44 days in 2003 and 40 days in 2004. The direct official data in the last column of table 1 cite therise from 68 days in 1995 to 99 days in 1996, 136 days in 1997, 122.8 days in 1998, and a reversalto 93.7 days in 1999 with the subsequent decline to 74.5 days in 2000, 67.8 days in 2001, 64 daysin 2002, 59.2 days in 2003, 55 days in 2004, and 61 days in 2005.
Since 1992, accounts receivables became and remained past due, or aged. Their counterpartis payment arrears. Days payable outstanding measure the average payment period (or non-paymentperiod, as it were) the same way as the average collection period measures the unpaid length ofreceivables. Days payables outstanding doubled from 17 days in 1991 to 36 days in 1992, increasedgradually to 55 days in 1996 and 61 days in 1997, and leaped to 102 days in 1998. A downwardreversal started slowly afterwards, 72 days in 1999 and 56 days in 2000 and gradually shortened to45 days in 2003, and 40 days in 2004. Since 1992, payables were in arrears.
Receivables amassed due to surcharged invoices generate payables that fall into arrears. Itfollows from the above discussion that maximization of receivables increases payables on twointertwined counts.
1. First, when receivables amass among sellers, trade payables amass among buyers. Agedreceivables generate payment arrears.
2. Second, sellers themselves delay payments and thus increase payables and turn them intoarrears to compensate for cash shortfalls when receivables take up the bulk of their netincome.
A critical mass of payment arrears and aged receivables creates a payment jam. This is asituation on the brink of cessation of operating activities. A marginal increase in payment arrearsimproves the cash flow position of buyers but worsens the cash flow position of sellers to the pointwhere their net cash flow runs down to zero.30 They, in turn, have to increase their payment arrearsto stay afloat. But this worsens the net cash flow position of their respective sellers and runs it downto zero. One can extend this exercise in rounds through the flow of funds until operating activitiesof some clusters of enterprises cease. This is a chain reaction.
There is a recourse. Enterprises can maximize tax arrears, tax non-remittance.
Step 3. Third party payables
One can think of trade payables as second party payables. Most enterprises except retailers,various services, etc., are both sellers of output and buyers of inputs. In the flow of funds over the
Free and Not So Free to Charge: Income Redistribution and Russia, 1992-2007 24
31See Mark E. Schaffer, “Government Subsidies to Enterprises in Central and Eastern Europe: BudgetarySubsidies and Tax Arrears,” in David M.G. Newbery, ed., Tax and Benefit Reform in Central and Eastern Europe(London: Center for Economic Policy Research, 1995), pp. 115-144; Mark E. Schaffer, “Do Firms in TransitionEconomies Have Soft Budget Constraints? A Reconsideration of Concepts and Evidence,” Journal of ComparativeEconomics 26, no. 1 (March 1998): 80-103; Michael S. Bernstam and Alvin Rabushka, Fixing Russia’s Banks, pp. 29-34,69-71; Brian Pinto et. al, “Dismantling Russia’s Nonpayments System: Creating Conditions for Growth”; and, BrianPinto et. al., “Give Macroeconomic Stability and Growth in Russia a Chance: Harden Budgets by Eliminating Non-Payments,” pp. 297-324.
32We list managers on par with owners because, in Russia, state-owned enterprises did not remit profits ordividends to the government and, in terms of accrual of net income, qualified as private property of managers. One canalso add state managers such as ministers of nuclear energy, rail roads, etc. State enterprises also partially qualified asprivate property of managers in terms of exclusive control of the disposal value of net assets (equity). The existence ofassets stripping of state enterprises effectively disqualifies the government as the owner. From this perspective,privatization of productive assets in Russia in the 1990s was nearly universal.
stages of processing, sectoral increases in payment arrears unleash a chain reaction of cash flowshortfalls. Tax arrears, in contrast, can be viewed as third party payables. They harm the cash flowposition of the government, reduce revenues and increase the budget deficit, which, in turn, delaysgovernment procurement payments, ages receivables of government suppliers, and hurts their cashflow position. But the government can sell bonds and/or print money to finance its budget deficits.
Tax non-remittance and expected monetization not only offer enterprises a supplementalstrategy of improving their cash flow position. They also constitute a pure subsidy.31 This is whyenterprises which maximize profit in cash terms must maximize tax non-remittance.
Other third party payables include payroll arrears. Enterprise owners and managers treatthem similarly to tax arrears but accumulate them to a lesser extent, if they want to maintain theircore labor force. We include payroll arrears in tables 5 and 6 but omit them from diagrams becauseof their relatively small size. The operational word is relative. By the end of 1998, payroll arrearsconstituted 3 percent of GDP, a significant income transfer from workers to enterprise owners andmanagers.32 Unfortunately, their size is still insufficient to be visible in diagrams due to the muchlarger size of other variables such as the outstanding balances of receivables, tax non-remittance,and monetary aggregates.
Tax non-remittance is separate from tax evasion. It adds to tax evasion. Tax non-remittanceis explicit and recorded. Enterprises withhold payroll and income taxes from workers and collectvalue-added and sales taxes from consumers. After that, enterprises impound part of this taxcollection. In addition, they impound and do not remit their corporate income or profit tax whichis also collected from households—consumers, workers, and shareholders. In short, tax non-remittance is explicit confiscation of the tax base.
Table 7 documents that the outstanding balances of tax arrears in Russia rose from 0.6percent of GDP in 1992 to 18 percent of GDP in 1998 and then reversed and declined to 2.2 percentof GDP in 2004. The outstanding balances of taxes payable in the U.S. ranged between one and 1.5percent of GDP.
Free and Not So Free to Charge: Income Redistribution and Russia, 1992-2007 25
33Panels 1A to 3A in figures 9 and 15 replicate the same data as panels 1 to 3 in the linear functional form. Thecomparison checks if the polynomial regressions were used for a better fit, given the complex dynamics of the data underchanging policies, or were selected to manipulate the data for the benefit of the authors’ hypothesis. The linearregressions distinguish when they find the same relationship as the polynomials but a weaker fit and when they do notfit at all due to the reversal of policy followed by the reversal of relationships between key variables. This tediousbackground comparison of statistical tests serves the principal intention of this work to discover, not to advocate.
Figure 9, panel 1 plots the relationship between tax non-remittance (the balances of taxpayables, tax arrears) and the outstanding balances of receivables. This relationship is direct,strongly correlated, and consistently proportional.
The balances rather than flows are employed to smooth short-term lags between thesevariables without arbitrarily choosing a particular lag. The data are monthly from January 1992through July 1999. This choice of dates takes Russia from the beginning of liberalization oftransactions through the great default of August 1998 and twelve months of its aftermath. Thereversal of policies, of which shortly, occurred in September-December 1998, and economicrecovery started in 1999, but many empirical structural relationships of 1992-98 betweenreceivables, tax non-remittance, and monetization maintained their momentum. Later on, figure 15will extend the same bivariate regressions as in figure 9 through the end of 2007. It will cover theentire period 1992-2007 and show the actual reversal of some of the relationships since mid-1999.Meanwhile, to give a pointer, all panels of figure 9 contain an arrow which points to January 1999when the new policy (of which, again, shortly) was fully installed.
The bivariate ordinary least squares regression in panel 1 shows that most observationsexcept the last months of 1997 fit the regression line closely. The functional form is quadratic, tocheck for possible acceleration, deceleration, and non-monotonic concavity and also to be consistentwith other polynomial regressions in figure 9. But it is almost identical with the linear regressionplotted with the same data in panel 1A of figure 9.33 Both regressions account for 99 percent of thevariation between receivables and tax non-remittance.
These panels do not prove that amassment of receivables causes tax non-remittance.Correlation is not a causality. But no proof of a one-directional causality is necessary. On thecontrary, the relationship between the balances of aged receivables and tax arrears form a feedbackloop as depicted in arrow 2 and the sequence of arrows 8 and 1 in the flow chart in figure 5.Enterprises maximize receivables subject to expected subsidy (fiscal expectations), while tax non-remittance is part of this expected subsidy in the data plotted in figure 5. An increase in tax non-remittance raises subsidy expectations and stimulates surcharged invoices (arrow 8 in the flow chartin figure 5) which build up aged receivables (arrow 1 there). In turn, amassment and aging ofreceivables render net cash flow negative without an automatic increase in trade payables andsupplemental maximization of tax non-remittance (arrow 2 in the same flow chart). Figure 9, panel1 offers evidence for these relationships in both directions and for the entire feedback loop.
Under the payment jam, on the margin, the government cannot enforce tax remittance in full.All fiscal instruments are blunted. (It took the Central Bank of Russia to invent a sharp one in late
Free and Not So Free to Charge: Income Redistribution and Russia, 1992-2007 26
34The government whose claim to existence was liberalization and privatization, could not re-nationalizeenterprises and remain in power. Moreover, tax non-remittance was similar among enterprises which were de jure state-owned fully or partially (e.g., in oil, natural gas, electric power, and other industries) and also among profit-makinggovernment agencies (nuclear energy, rail roads, etc.). Re-nationalization of state-owned enterprises is absurd evenunder the Russian economic system. In sum, the government could not seize assets because it either already ownedthem, slated them for privatization, or just privatized them.
1998 and reverse the situation, but of this in due course). Of the possible menu of enforcements, onecan think of fines and penalties, sequestration of enterprise money balances in the bank, lien andseizure of assets, placing in receivership, forced bankruptcy, prosecution of owners and managers,and any other legal or fiscal recourse. During 1992-98, especially in 1996-98 when tax non-remittance exacerbated, the government tried, or at least tried to apply, all of these measures. Theytemporarily improved tax remittance by individually targeted enterprises, for a few months, but hadall failed over time.
On the national scale, the effect of enforcements was even smaller. Of the 156 months of1992-98, there were only six intermittent months (December 1994, June and September 1995,December 1997, and June and December 1998) when the balances of tax arrears slightly declined,never two months in a row, and their build up resumed thereafter. On the national scale, under thepayment jam, when enterprise X had to remit more taxes, it had to simultaneously reduce paymentsto enterprise Y, which then reduced its own remittance, netting little, if anything, for the governmentenforcement effort.
Not that the government did not try. Not that it was soft or weak-willed. Rather, it wasimpotent. Piling up fines and penalties could not induce payments when, as table 7 shows, taxarrears in 1992-98 were growing unabated anyway. The data in table 7 suggest why sequestrationof enterprise money balances in the banks was not workable. Tax arrears were outgrowingenterprise money balances rapidly in 1992-98. Already in 1994, the ratio of money balances to taxarrears fell to two. The government had to seize 50 percent of enterprise money balances todischarge tax arrears. But then the payment jam would have deteriorated, payments shifted to barter,and the tax base severely undermined. After 1994, even that sequestration was not possible. In1995, tax arrears were equal to enterprise money balances. The government could hypotheticallyseize bank accounts and thus close down operations throughout the economy, but it did not. Thegovernment could apply this measure to selected enterprises as a deterrent to all, but it was notcredible exactly because it could not have been applied to all or many, for reasons just stated. Since1996, the sequestration option evaporated altogether when tax arrears significantly exceededenterprise money balances.
Lien and assets seizure, placement in receivership, forced bankruptcy, change of ownership,changing the form of ownership, prosecution of owners and managers, etc., are overlappingmeasures. In practice these measures meant re-nationalization. Apart from political constraints,34
re-nationalization of enterprises and replacement of managers could not enforce tax remittancewithout changing incentives throughout the economic system. This implies no change withoutpreventing surcharged invoices and accumulation of receivables. Both privately owned enterprises
Free and Not So Free to Charge: Income Redistribution and Russia, 1992-2007 27
35A detailed analysis of the history and mechanics of Russia’s default of 1998 is in Federico Sturzenegger andJeromin Zettelmeyer, Debt Defaults and Lessons from a Decade of Crises (Cambridge: MIT Press, 2006), pp. 91-113.
and those owned de jure by the government acted in the identical mode within the same network.Different ownership, different owners, and different managers could not change the underlyingsystemic incentives. They indeed did not when the government made such changes from time totime in various industries.
Overall, under the payment jam, on the margin, any fiscal crackdown could improve taxremittance in specific sectors in the short run but jeopardize the flow of payments across theeconomy and the tax base in the long run. A major attempt to enforce tax remittance would havesubstituted additional payment arrears for tax arrears. A spillover effect through the flows of fundsacross industries would have brought down the net cash flow positions of net creditor enterprisesand industries. This would have halted economic activity and wiped out the tax base.
The government options were between partial tax remittance by enterprises and the loss ofthe tax base. The options of the enterprise network were between partial tax remittance to thegovernment (that is, maximization of receivables and the subsidy subject to fiscal constraints) andunpredictable consequences otherwise. Both the government and enterprises chose partial taxremittance. They were continuously engaged in the game of chicken over the extent of taxremittance, not over its completeness. As a rule, the government blinked.
This symbiotic arrangement worked for both until it engendered the great default of August1998, of which shortly. The situation reversed in late 1998 after the Central Bank mandatedrepatriation and domestic sales of foreign exchange revenues. This reduction of capital outflowrapidly increased enterprise money balances (see table 7). This, in turn, enabled the government toenforce more tax remittance in 1999-2000 in the flow sense, slow down the buildup of tax payables,and even reverse the trend and draw down the outstanding balances of tax arrears since 2001. Thistime, the enterprises blinked, first specific exporters, then the export sector at large, and, eventually,the entire enterprise network.
Step 4. Third party debt transfer
Figure 10.1 extends this exploration to one of the consequences of surcharged invoicing,maximization of receivables (subject to expected subsidies), and tax non-remittance. It links taxnon-remittance to government debt in terms of bonds. The monthly plot starts in January 1995 andends in August 1998 when the government repudiated its bonds and defaulted.35 The two curvesconverge in 1995-96, slightly diverge in 1997, when debt accelerated relative to tax arrears, andconverge again ruble for ruble in 1998. They reach the same amount of about 430 billion rubles atthe time of the default. One can conclude that in the absence of tax non-remittance, which is arevenue shortfall, and barring additional spending, there would have been no need to issue bonds.The default of August 1998 would not have happened.
A revenue shortfall due to tax non-remittance created additional budget deficit which needed
Free and Not So Free to Charge: Income Redistribution and Russia, 1992-2007 28
36They diverged on the eve of the default of August 1998 (figure 10.2 plots August 1998 as a separateobservation point on par with annual points in previous years). Accumulation of receivables accelerated at that point.If one believes in rational fiscal and monetary expectations with perfect foresight, one can infer that enterprises expectedthe default, currency devaluation, and subsequent monetization and thus expanded their subsidy claims in advance.
37For a brilliant theoretical discussion see Thomas J. Sargent and Neil Wallace, “Some Unpleasant MonetaristArithmetic,” Federal Reserve Bank of Minneapolis, Quarterly Review 5, no. 3 (Fall 1981): 1-17.
financing. All other sources of budget deficit being equal and another source of financing,monetization, being also equal, the government had to issue bonds to finance this additional budgetdeficit. That is, the government had to securitize tax non-remittance.
Tax non-remittance is a pure subsidy. It is a transfer of income from workers and consumersto enterprise owners and managers. In the flows of funds, it is also a transfer of income from thegovernment as the recipient of tax revenues, to the enterprise network. It is a subsidy because itwould have been the same amount if all taxes were remitted and the equivalent outlay given toenterprises.
The only difference with the latter case is that the subsidy via tax non-remittance is taken,not given. This subsidy is forced onto the government in the symbiotic arrangement discussedabove. The government was then forced to securitize the tax non-remittance subsidy. Figure 10.1merely illustrates this point.
Enterprise arrears were billed to the government via tax non-remittance and then charged tobond-holders when the government defaulted. This is a two-stage third party debt transfer.
Figure 10.2 broadens the theme of third party debt transfer. It shows that from 1994 untilearly 1998 the outstanding balances of receivables matched ruble for ruble the balances of totalgovernment debt such as bonds and money balances.36 The claims of the enterprise network on thegovernment subsidy, which is what receivables are, matched the aggregate government debt. canobserve in figure 10.2 that the growth of surcharged invoices, congealed in the stock of receivables,accelerated over time in 1994-98, except for the second half of 1997, and exploded in the first halfof 1998. The growth of government debt moved along the same trajectory, but slowed down in thefirst half of 1998. Thus came the time when the government could no longer place additional bondsto cover the growing tax subsidy and its commensurate true budget deficit. There is always an upperbound at which the public is willing to hold government bonds. After this upper bound has beenreached, a default occurs in one or another form, usually an implicit default, when the governmentprints money to monetize the debt.37
The government could print money and substitute one form of debt, bonds, with anotherform, money. That option was not feasible because the Russian government ran a pseudo-fixed(pegged) exchange rate, and printing more money would have crashed the currency even before thedevaluation of August 1998 (simultaneously with the default on domestic government debt). Anearly devaluation would have led foreign and domestic bondholders to dump bonds. This, in turn,
Free and Not So Free to Charge: Income Redistribution and Russia, 1992-2007 29
would have left the government no other option but more monetization. Replacing the bulk of thebond stock with freshly printed money would have led to more than a mere hyperinflation—to acomplete loss of currency, the tax base, and the ability to spend, when the population would haveshifted to dollars as the currency of choice and abandoned rubles. The real choice was betweenrepudiating government bonds before, or at the same time with, devaluation, and governmentabdication and chaos.
Empirically, figures 5, 10.1, and 10.2 are consistent. The balances of receivables correspondseparately to the sum of government subsidy and the sum of government debt. The former sumconsists of tax non-remittance and the monetary aggregate M2. The latter sum consists ofgovernment bonds and the monetary aggregate M2. Since the outstanding balances of tax arrearsand government bonds grew in alignment, the figures are consistent. Third party debt transfer is theother side of the coin of aggregate third party billing.
Step 5. Forced monetization
A striking feature of panel 2 of figure 9, which also shows in figures 5 and 10, is that taxnon-remittance and the money stock M2 were long-term complements and short-term substitutesin 1992-99. They grew in tandem at the same long-term rate and at different short-term rates. In1992-95, money grew faster than tax non-remittance. In 1996-98, at a time of rapid bond financingof budget deficits, tax non-remittance grew faster than money. Since late 1998, money growthaccelerated again relative to that of tax non-remittance. The semi-concave, semi-convex curve inpanel 2 of figure 9 fits the close correlation between the balances of tax arrears and money balanceson identical scales. The third degree polynomial formula accounts for 98 percent of the variationof monthly observations. Most observations are on or close to the regression line.
A linear regression in panel 2A of figure 9 accounts for 90 percent of the variation.Linearization of this relationship between tax non-remittance and the money balances makes vividtheir long-term convergence in 1992-99. To wit, they grew together ruble for ruble smoothedover time in the long run, substituting for each other ruble for ruble in the short run, as if theywere fungible in the fiscal pool. And they were indeed, via endogenous determination at the margin,in the continuous–daily and hourly–process by trial and error. At the margin, enterprises increasereceivables by $1 and increase tax non-remittance by $1 and they wait. If no additional $1 in creditfollows, they stop increasing receivables. If $1 in credit expansion follows to reduce $1 in tax non-remittance (to increase tax remittance by $1), enterprises increase receivables by the next $1 andincrease tax non-remittance by $1, and so on. This is why there was ruble-for-ruble substitution intax non-remittance and the money stock during this period. It is not because the government decidesex ante to split the subsidy 50-50 between the channels of tax non-remittance and credit, but becausethe endogenous enterprise behavior at the margin leads to this outcome. Enterprises do not split thesubsidy 50-50 by different channels on purpose. They are indifferent concerning the compositionof the subsidy, because a ruble is a ruble. But their behavior within the systemic mechanismachieves this split and the ruble-for-ruble substitution between channels of the total subsidy.
Arrows 4 and 5 in the flow chart in figure 5 capture this long-term and short-term feedback
Free and Not So Free to Charge: Income Redistribution and Russia, 1992-2007 30
38The official budget numbers are of little use until and unless Russian fiscal accounts, especially for 1992-98,are reconstructed. Due to revenue offsets, which were treated as cash on the revenue side but were not accounted foron the expenditure side, the budget deficit was understated by about 5 percent of GDP in various years. Quasi-fiscalsubsidies from the Central Bank to enterprises were not accounted for. Foreign and domestic borrowing was treated asrevenues, not financing. Sale of liabilities such as bonds was treated as sale of assets on the revenue side. The list cango on and on. In all, the debt accounts do not match the fiscal flow accounts by a wide margin. The government partof net domestic assets on the balance sheet of the Central Bank, the amounts of publicly held government bonds, andforeign debt raised in 1992-98 do not match cumulative budget deficits in 1992-98. The default of August 1998 buriedthese discrepancies for posterity.
loop. It is not surprising that the government monetized budget deficits created, among othersources, by tax non-remittance—hence the plus sign from non-remittance to money. It is also notsurprising that monetization dissipated the payment jam and reduced tax non-remittance in the shortrun—hence the minus sign from money to tax non-remittance. But figure 10.1 suggested that bondreceipts roughly matched tax non-remittance, which looked like their financed budget shortfalls fromtax non-remittance. Why this double coincidence between money growth and tax non-remittanceand between bonds and tax non-remittance?
There is no double indemnity. The government does not finance the fiscal cost of tax non-remittance twice, by issuing bonds and money. Recall the short-term trade-offs between moneygrowth and that of tax non-remittance in panel 2 of figure 9 and other figures. When the moneysupply increased more, tax non-remittance increased less, and vice versa. One suggestion reconcilesall the above observations. Under the payment jam, on the margin, a ruble of bonds financed a rubleof tax non-remittance and a ruble of money growth financed a ruble of tax remittance. There wasmore subsidy than even a reconstructed budget would tell,38 roughly a double amount.
Consider a hypothetical case of total tax revenues transmitted through enterprises (nopersonal income tax and other taxes paid directly by households, no non-tax revenues).
Option 1: Tax non-remittance is 50 percent of taxes withheld and collected. Budgetexpenditures are equal to the total tax levy. The budget deficit, equal to 50 percent of expendituresand 100 percent of revenues, is securitized and monetized. Suppose there is an even split infinancing budget deficits between bonds and seigniorage, 25 percent of expenditures each.Monetization of budget deficits requires direct seigniorage ruble for ruble.
Option 2: The government gives enterprises a subsidy in the amount of 25 percent of taxeswithheld and collected. This subsidy consists of 12.5 percent of this amount in currency printed bythe Central Bank and transmitted to banks for enterprise credit and 12.5 percent multiplied throughthe banking system by a factor of two and extended to enterprises as credit (for simplicity, we leaveaside the issue of reserve requirements). For this, enterprises must remit, and the government canenforce this remittance, 25 percent of taxes withheld and collected in addition to the 50 percent inthe first option. The official budget deficit, equal to 25 percent of expenditures and 33 percent ofrevenues, is securitized. The difference between the two options is that the combined fiscal cost is50 percent of expenditures in the first case and 37.5 percent of expenditures in the second case.
Free and Not So Free to Charge: Income Redistribution and Russia, 1992-2007 31
39The game of chicken is there because three extreme outcomes are not feasible. (1) It is not possible for thegovernment to enter into an implicit contract with enterprises to monetize total remittance. The government cannotenforce this contract, cannot enforce total remittance when enterprises could recreate the payment jam by simplysurcharging invoices greater. (2) It is not feasible for the government to monetize total aged receivables and paymentarrears and dissipate the payment jam, because enterprises will stop producing about 99 percent of output and still receivesubsidies for one percent output by surcharging invoices to high heaven. (3) It is not feasible for enterprises to raise non-remittance to 100 percent of withheld and collected tax revenues because the next government will end EnterpriseNetwork Socialism. After the policy reversal of late 1998, mandated repatriation and sale of foreign exchange revenuesincreased enterprise money balances and eased the payment jam. This enabled the government to enforce tax remittance,started to dissipate tax non-remittance, and made the government a much stronger actor in the game of chicken.
40Thomas J. Sargent and Neil Wallace, “Some Unpleasant Monetarist Arithmetic,” Federal Reserve Bank ofMinneapolis Quarterly Review 5, no. 3 (Fall 1981): 1-17 and the concomitant literature in footnote 21. A detailedapplication to Russia is in Nicola Melloni, Market Without Economy: The 1998 Russian Financial Crisis (Stuttgart/
The subsidy via tax non-remittance and the combined subsidy via tax non-remittance andfinancing additional tax remittance are the same. If one counts, as the practice of Westerneconomies suggests, the entire money stock as implicit government debt, the debt created by bothoptions is also the same. Still, the second option is preferable because (1) the government can printless money and because (2) it gives the government more flexibility and more instruments to enforcetax remittance on the margin under the payment jam. This prevents extra non-remittance and bondfinancing.
Factor (1) was especially important under the fixed exchange rate in 1995-98. It helpedpostpone devaluation. Factor (2) was especially important because it minimized or at least limitedthe bond issue at any point in time and stretched out over time. This helped postpone the default.
To recapitulate, tax non-remittance forces bond financing of the resulting budget deficits.It forces government debt and leads to a default. The government is interested to delay thiseventuality. It enforces tax remittance as much as it can under the payment jam. When this fails,the government monetizes tax remittance. That is, the government pays enterprises to remit taxesthey impounded. In other words, the government subsidizes the amounts that would have becometax non-remittance but has thus become tax remittance. There is a ruble for ruble trade-offevidenced in the data in figure 9, panel 2 and other figures.
This secondary subsidy via monetization is forced onto the government by the first subsidyvia tax non-remittance. Forced monetization of tax remittance is merely preferable to rapid defaultand devaluation. Greater tax non-remittance can push bonds to the upper bound beyond which theycannot be placed and can induce direct seigniorage, ruble for ruble, of budget deficits. As before,the government and the enterprise network were engaged in the game of chicken, this time overmonetization and tax remittance rather than over tax non-remittance.39
Figures 11 and 12 illustrate the fiscal mechanics of imminent monetization in any economywith unsustainable budget deficits and forced monetization under Enterprise Network Socialism inRussia. The readers familiar with the Sargent-Wallace framework will find these figures self-explanatory.40
Free and Not So Free to Charge: Income Redistribution and Russia, 1992-2007 32
Hannover: Ibidem-Verlag, 2006). In this application, the Russian government became entrapped into the doubleconstraint of (what it tried to be) a tight monetary policy and (what it turned out to be) a loose fiscal policy vis-a-visenterprises. These policies were inconsistent and led to inflationary outcomes that were postponed (or mitigated) throughissuance of a large amount of government bonds to finance the fiscal deficit. Although the timing was influenced bythe declining oil prices and the Asian financial crisis and its contagion, the main cause was domestic.
41http://www.russianeconomy.org/predation/pdf/ch4add.pdf
Step 6. Credit transmission, extension, and rollover
Banks transmit, extend, and roll over credit to enterprises on the basis of the monetary basecreated by the Central Bank during monetization of tax remittance. They multiply monetization oftax remittance through re-intermediation between enterprises. Credit is issued for payments, not forinvestment. This proposition was covered and documented at length in the addendum to Chapter4 of From Predation to Prosperity, “Fixing China’s Banks, not Russia’s.”41 When inflation is highand nominal interest rates are low, and hence real interest rates are highly negative, credit rolloverand extension represent a pure subsidy.
Credit transmission follows automatically from monetary expansion but goes nearlyexclusively to the enterprise network, not to other agents, because tax non-remittance is thecollateral for the rollover of credit. Thus the network is self-reinforcing and the tax subsidy to thenetwork is self-enforceable. New entrants cannot practice tax non-remittance and cannot competefor subsidized credit because of their position outside of the network. They are not part of thepreexisting supply chain and the payment flows. The government can enforce their tax remittancebecause it can shut them down without revenue loss spillovers.
Step 7. Aggregate third party billing pays. The self-enforceable tax subsidy
Various trade-offs between tax non-remittance and monetization of tax remittance, followedby credit rollover and extension, wind up in the self-enforceable subsidy. Tax non-remittance andmonetization multiplied through the banking system sum up to the outstanding balance ofreceivables. Figure 5 demonstrated a close match in 1992-98 between enterprise subsidy claimsthrough surcharged invoices, embodied in the balances of receivables, and the subsidy they forcefrom the government through tax non-remittance and monetization.
Continuous short-term trade-offs between tax non-remittance and the money balances in thegame of chicken between the government and enterprises (see again figure 9, panel 2) make thesubsidy self-enforceable. Fiscal expectations to which enterprises index invoices in pursuit of thesubsidy become self-fulfilling. At the same time, long-term complementarity between tax non-remittance and the monetary aggregate as subsidy components makes the subsidy self-reinforcingover time until the policy reversal downgrades it.
This self-enforceable subsidy can be called the tax subsidy not only because it finances tax
Free and Not So Free to Charge: Income Redistribution and Russia, 1992-2007 33
42Political connections do not matter in this exercise. Suppose the government targets the less politicallyconnected enterprises. They increase tax remittance and reduce payments to suppliers, getting more inputs withoutpaying. This does not worsen their financial position. Suppose better politically connected enterprises escape thegovernment wrath of tax enforcement. They receive smaller payments from their buyers and increase the self-taken taxsubsidy in the same amount. Their financial position does not improve. On the edge of the payment jam, politicalconnections turn out to be fungible and their benefits socialized.
remittance and the fiscal costs of tax non-remittance. Also, when enterprises surcharge invoicesthey levy a tax over the stages of processing. The price surcharge in invoices which ends up in thebalances of receivables is ultimately a tax on consumers and households. On top of that, it is thetaxpayers who bear the cost of the subsidy through inflation and fiscal defaults. By forcinggovernment subsidy, the enterprise network ultimately taxes the public at large.
The mechanism of the self-enforceable tax subsidy on the edge of a payment jam isautomatic. Let us consider various possible situations. We will observe the convergence of theirresults to the same initial position in a full circle:
1. Suppose the government undertakes a partial crackdown to enforce tax remittance. It forcesselected enterprises to remit full current tax liabilities or taxes past due. The governmentsucceeds at that. Affected enterprises automatically reduce payments to suppliers in thesame amount. The latter automatically reduce their tax remittance in the same amount.42
Losses are equivalent. The government gains nothing.
2. Suppose the government conducts a large or an across-the-board complete crackdown on taxnon-remitters. Payments between enterprises seize up and a chain reaction of shipmentstoppages and supply breakdowns begins. Large suppliers of energy, fuel, and otherresources halt supplies to non-paying customers. The tax base narrows quickly. Thegovernment may face greater incremental losses of revenues due to output contraction thanincremental gains from forced remittance of taxes.
3. Suppose the government starts selective bankruptcies. The government could readilyachieve this. All requisite bankruptcy laws had been on the books. The government couldenforce them. Selective bankruptcies reduce payments to suppliers who, in turn, reduce theirtax remittance and increase their tax subsidy in the same amount. The government gainsnothing in the short run and narrows the tax base for the future.
4. Suppose the government reduces Central Bank credit to enterprises for remitting taxrevenues. Enterprises increase tax non-remittance ruble-for-ruble of foregone monetization.They lose the modest multiplier that the banking system creates when it makes credits andopens deposits on the basis of newly printed money. For this reason, their tax subsidydeclines. But the government gains nothing even if enterprises lose part of the subsidy.
5. Suppose the government increases Central Bank credit to enterprises for remitting taxrevenues. This increases payment between enterprises and tax remittance to the government.
Free and Not So Free to Charge: Income Redistribution and Russia, 1992-2007 34
But this does not constitute a special gain for the government because it could just as wellissue bonds in the same amount and sell them to the Central Bank or simply arrange directCentral Bank credit to the government.
6. Suppose the government increases tax rates or levies new taxes. This reduces the free (after-tax) cash flow of enterprises and their mutual payments, either directly or indirectly, throughdeclining consumer demand. Then enterprises increase tax non-remittance. The governmentmay end up with little or no revenue gains.
7. Suppose the government reduces regular expenditures, outside of the tax subsidy, in orderto compensate itself for lost tax remittance and to reduce the budget deficit. This is possibleup to a point—until the point is reached when enterprises provide inputs for which they arenot paid to parties that have lost government payments. These may be the military, non-profit organizations (schools, hospitals, etc.), and households that use public utilities. Thenenterprises collect the tax subsidy from the government in the amount of unpaid supplies.
8. In addition to self-enforcement of the tax subsidy, an automatic is also at force. Self-enforcement of the tax subsidy limits what the government can do. An automatic regulationlimits what enterprises can do. Suppose enterprises increase tax non-remittance, and takea higher tax subsidy than they need for payments. In this case, they have more free cashflow and higher money balances to increase payments to suppliers and mitigate the paymentjam. After that, the government can enforce more tax remittance without jeopardizingproduction flows and future tax flows. An increase in the current tax subsidy reduces thefuture tax subsidy by the same amount.
It follows that fiscal policy and monetary policy are powerless under this fiscal system. Thisconclusion is simply another way of saying that the tax subsidy is self-enforceable and self-regulating in the payment jam, on the edge of halting production and tax revenue flows. If thegovernment deviates or enterprises deviate in the very short run from the level of the tax subsidyunder a given level of receivables, the above mechanism quickly enforces the equalization of thecumulative amounts of receivables and the tax subsidy.
Figures 13 and 14 break out of the 1992-98 time frame and extend the same relationshipthrough the entire period of 1992-2007. Figure 13 uses the linear scale and figure 14 the logarithmicscale. Panel 1 of each figure plots the monetary aggregate M2 as a proxy for the monetarycomponent of the subsidy. Panel 2 plots M1 for reference because it includes only demand depositsand excludes saving deposits, which may closer correspond to payments. The linear scale enablesus to show tax non-remittance and the monetary aggregate M2 as interacting components of thesubsidy. But because of high inflation in the early 1990s, the linear scale makes the data before1994 invisible. The logarithmic scale demonstrates that the postulated relationship held since thebeginning of 1992. It took only the first three months of 1992 for receivables to explode andoutgrow the inherited and rapidly inflating nominal money stock. But the logarithmic scale presentsonly the sum of the two principal channels of the subsidy without their itemization. It alsounderstates the divergence between the variables which started in 2002 and expanded during 2002-
Free and Not So Free to Charge: Income Redistribution and Russia, 1992-2007 35
43This point does not apply to the monetary base created in 1996-98 through purchases of foreign exchangefrom international investors who bought Russian bonds. This monetary base financed government debt, although inexchange not for domestic assets (bonds) but for international reserves, and thus monetized tax non-remittance.
2007.
Tax non-remittance slowed down in 2000-2001 and started to decline steadily in absoluteterms since October 2001. The new policy initiated by the Central Bank which we mentioned earlierand will attend to shortly started to take effect. Most importantly, due to this policy we lost themonetary component of the subsidy variable. The part of the monetary base created throughpurchases of repatriated foreign exchange revenues does not represent a subsidy, at least notcompletely.43 It is no longer possible to monitor the self-enforceable subsidy with simple empiricalvariables. The subsidy has declined substantially in 2002-2007. In the spirit of figures 5, 13, and14, one can estimate the claim on the subsidy as the ratio of the annual flows of receivables to GDP.This is not an actual subsidy which may be collected with a short lag but an annual claim on thissubsidy. Figures 5, 13, and 14 show that this subsidy had been always extracted, at least until 2002,after which simple empirical evidence becomes blurred.
Table 2 estimates that the subsidy claim (and hence the subsequent subsidy) constituted 21.8percent of GDP in 1992, gradually declined to 13.1 percent of GDP in 1996 and 5.3 percent in 1997,and then increased to 19.8 percent of GDP in 1998. Its gradual decline began from 5.5 percent ofGDP in 1999 to 2.1 percent in 2002 and 2003. The claim increased to 2.8 percent in 2004 but thisupturn may represent a short-term fluctuation. It is only possible since 2002 to estimate the subsidyindirectly, through the claim via the flow of balances of receivables. If the subsidy dissipatedcompletely, the relationship between nominal receivables and the price index in figure 7.1 and otherconsistent correlations in figures 6 to 8 would have ceased to hold.
Most importantly, the principal empirical regularity in figure 1 between the balances ofreceivables and money balances versus contraction and recovery of real GDP continues to holdthroughout 1992-2007.
Step 8. The circuit of aggregate third party billing
Step 8 is identical to step 1. Invoices outgrow payments and fall into the balances of agedreceivables when enterprises surcharge invoices. They add a third party surcharge to the price,subject to fiscal expectations, and bill the government. Surcharged invoices carry a network tax onconsumers and households. Now it is more evident why. The subsidy is self-enforceable under thepayment jam created by aged receivables and payment arrears.
Fiscal expectations are self-fulfilling. The feedback from the subsidy to enterprise invoicingactivity validates surcharged invoicing activity and stimulates more of it. It stimulates maximizationof receivables subject to fiscal expectations.
Arrows 7 and 8 in the flow chart in figure 5 depict the feedbacks from the subsidy
Free and Not So Free to Charge: Income Redistribution and Russia, 1992-2007 36
components, tax non-remittance and monetization, to surcharged invoices. Panels 1 and 3 of figure9 test empirical evidence for these feedbacks. Bivariate regressions can indicate causation runningeither and both ways. The flow of causation from receivables to tax non-remittance andmonetization (multiplied by credit transmission) was discussed above. Now, this is a test of fiscalexpectations stemming from the eventual subsidy to maximization of receivables.
A strong correlation between the balances of receivables and tax arrears in panel 1 wasdiscussed earlier. Panel 3 regresses the monthly balances of receivables in 1992-mid-1999 againstthe monetary aggregate M2, the second major component of the subsidy. The functional form isquadratic as it offers a better fit. A linear regression between the same variables makes a realitycheck in panel 3A of figure 9. The polynomial formula in panel 3 accounts for 96 percent of thevariation. The linear regression accounts for 92 percent of the variation. Both show a strongpositive relationship between the balances of receivables and the money balances. This implies thata mechanical short-term effect, that monetization and credit would dissipate payment arrears andaged receivables, is totally overwhelmed by subsidy expectations. Panels 3 and 3A demonstrate astrong incentive for the subsidy-extracting strategy of the enterprise network. Panels 1 and 1A offerthe same finding on the side of the tax non-remittance channel of the subsidy.
This discussion has come full circle. It is convenient to incorporate the fiscal circuit in theflow chart in figure 5 into a general mechanism of Enterprise Network Socialism. This mechanismin Box 4 connects the fiscal circuit of aggregate third party billing with its impact on real output(GDP) and with policy reversals in 1999-2007. The arrows numbered in blue, from 1 to 11,represent the fiscal circuit augmented by the policy forces of 1999-2007. The arrows numberedfrom 1 to 8 encompass the self-contained and circular system of aggregate third party billing. Theyretrace the eight steps summarized in Box 1. Arrows 9 to 11 add the policy reversal in 1999-2007,to which the discussion turns below. The arrows numbered in brown, from 1 to 7, incorporate asimplified transmission to real output. Plus and minus signs on the side of the arrows indicatepositive and negative relationships between variables.
In the beginning, enterprises maximize receivables subject to the expected subsidy. Theyindex invoices with price surcharges to fiscal expectations. Invoices outgrow payments and—arrow1, the plus sign—their balances end up in aged receivables. This creates the payment jam and mayrender net cash flow negative and halt operations across the economy. Under the paymentjam—arrow 2, the plus sign—enterprises endeavor non-remittance of taxes withheld from workersand collected from consumers. The government engages in the game of chicken to enforce taxremittance and—arrow 3, the plus sign—has to securitize tax non-remittance, issue bonds. Tominimize and limit tax non-remittance and delay the default of on the ever-growing debt thegovernment is forced to monetize additional tax remittance (arrow 4, the plus sign, from tax non-remittance to the money supply and arrow 5, the minus sign, from the money supply to tax non-remittance). Monetization multiplied and transmitted through the banking system toenterprises—arrow 6, the minus sign—dissipates payment arrears and aged receivables in the shortrun. In the long run, both monetization—arrow 7, the plus sign—and tax non-remittance—arrow8, the plus sign—as the complementary embodiment of fulfilled fiscal expectations, stimulatesurcharged invoices and maximization of receivables.
Free and Not So Free to Charge: Income Redistribution and Russia, 1992-2007 37
The entire system of aggregate third party billing sketched in Box 4 is circular, self-enforceable, and self-reinforcing. It had met its match in the policy introduced by the Central Bankof Russia in September-December 1998.
The Reversal of Powers and the Fall of the Freedom to Charge
This is a story of an accidental series of policy decisions with systemic consequences. It is a storyof how a peripheral policy of the Central Bank, control of capital outflows aimed at accumulationof foreign exchange reserves, hit the fiscal feedback loop at the core.
In September-December 1998, the Central Bank of Russia initiated a concerted effort toaccumulate foreign exchange reserves. The simplest and quickest policy instrument was compulsoryrepatriation of export revenues. The policy has succeeded over the years in its intended objective.Russia’s foreign exchange reserves increased from nearly zero in the late 1998 to nearly $600 billionby mid-2008.
Beyond this specific facet, two issues intertwine. First, this policy shift was flagrantlyilliberal. It was an act of de-liberalization in reversal of the policies of 1991-98, an act of impositionof government controls. Second, on the surface, this was a sectoral and peripheral policy. Itaffected one direction of the flows on the capital account. It imposed control of capital outflows inorder to build up reserves. It did not affect capital inflows. It did not touch the current account andinternational trade. Outside foreign trade, it was not a deliberate fiscal policy or economic growth-related policy. Beneath the surface, however, this illiberal policy shift inadvertently changed thevery mechanics of Russia’s fiscal system, restoring solvency to the-then bankrupt government.Unexpectedly, this policy launched a rapid economic recovery of 1999-2007 from the bottom of thegreat contraction of 1992-98.
A policy reversal
In the second half of 1998, the Russian government was, for all practical purposes, bankruptand dysfunctional. After the great default on domestic debt on August 17, 1998, there was forseveral weeks a sequence of acting cabinets, none permanent. The President of Russia, the head ofstate and the chief executive, was nowhere to be found, and the CBS and other Western mediareported that he either resigned or was dead. The Central Bank’s foreign exchange reserves werealmost depleted. In order to rebuild its stock of foreign reserves, in September 1998, the CentralBank started to enforce mandated repatriation and domestic sale of the foreign exchange revenuesof exporters. The timing was crucial.
By a sheer extraneous coincidence, interest and principal payments on the external debt ofthe Russian government, which had been rescheduled several times over the previous seven years,were due in September 1998 and thereafter. Less than a month before this day of reckoning,Russia’s domestic bond market was annihilated. On August 17, 1998, the government defaulted onits domestic, ruble-denominated bonds. Simultaneously, it shifted from a crawling peg to a flexible
Free and Not So Free to Charge: Income Redistribution and Russia, 1992-2007 38
44For the balance sheet and discussion, see our “How Big Are Russia’s Foreign Exchange Reserves?” athttp://www.russianeconomy.org/comments/091100.pdf .
45No. 328-U, The Circular of the Bank of Russia, no. 63 (318), September 2, 1998. All bylaws and regulationsof the Central Bank of Russia are published in its official circular, The Circular of the Bank of Russia (Vestnik BankaRossii), once to thrice a week except banking holidays. There are four types of regulations: instructions (I), ordinances(P), decrees (U), and telegrams (T). They have the same legal force of a bylaw and differ only in the genre and themethod of distribution, which both depend on the length and content of the document. The documents have the date ofissuance and the date of publication in The Circular of the Bank of Russia, which becomes the official date of being inforce. Various secondary sources often mix up these dates. For consistency, we cite the date of issuance in the text andthe date of publication in the footnotes.
46No. 55-P, The Circular of the Bank of Russia, no. 63 (318), September 2, 1998.
47Ibid.
exchange rate and devalued the ruble by one-third. The currency market responded with a further,rapid and sharp devaluation. When less than a month later the time came to make the foreigncurrency payment, a bankrupt and illiquid government found that it could not purchase the billionsof dollars of foreign currency with its tax receipts in devalued rubles. Whence followed severaltechnical defaults on external debt service.
The government appealed to the Central Bank as the lender of last resort of foreign exchange.The Central Bank extended the government a foreign currency loan of $6.7 billion in exchange fora dollar-denominated Russian bond, that is, a promise of the government to repay the bank $6.7billion in foreign currency. The loan nearly depleted the foreign exchange reserves of the CentralBank and rendered its net international reserves (net of IMF loans) negative.44 More payments onthe government’s external debt were coming due and the Central Bank could expect more requestsfrom the government for foreign exchange. Some measures had to be taken quickly lest the newsof the Central Bank’s foreign exchange void create a panic, further fall of the ruble, and defaults onthe government’s external debt.
Rapid accumulation of foreign exchange reserves became the Central Bank’s top priority,indeed a survival strategy. Its first moves were experimental, by trial and error. As a stopgapmeasure, on August 26, 1998, the Central Bank enacted a provisional decree “On Introduction ofTemporary Restrictions on Operations on the Capital Account by Residents.”45 In extension, onSeptember 1, 1998, the Central Bank enacted an ordinance “On the Rules of Making Payments inForeign Currencies in the Export and Import Operations by Residents of the Russian Federation.”46
This order was soon countermanded47 as it was superceded by the next, final decree which lockedin the new policy.
On September 11, 1998, the Central Bank issued a new decree which acquired the force oflaw on the day of its publication, September 16, 1998. The decree represented a seemingly minorand innocuous procedural adjustment to a long-standing regulation that required Russian enterprisesto sell 50 percent of their export revenues in foreign exchange for rubles. The new decree carrieda subtle (and perhaps a deliberately obscure) bureaucratic title: “On Introducing Amendments and
Free and Not So Free to Charge: Income Redistribution and Russia, 1992-2007 39
48No 347-U, The Circular of the Bank of Russia, no. 66 (321), September 16, 1998.
49The legal and institutional part of the story is reconstructed by bits and pieces from various Central Bankinstructions and explanations circulated by Russian financial organizations. For a succinct account by one of them seehttp://www.vergen.ru/archive/docs/full/1999/02/cb1102.html .
50Capital controls in developing and newly industrialized economies are usually associated with control ofcapital inflows. These are, specifically, short-term foreign portfolio investment, which may create currency risks uponquick withdrawal, and foreign bank lending, which may create excessive debt exposure and assets/liabilitiesmisalignments (dollar-denominated liabilities and domestic currency-denominated assets) and thus create domestic bankfailures. The type of capital control introduced by the Central Bank of Russia in late 1998 applies to capital outflowsonly.
Augmentations to the Decree of the Bank of Russia ‘On the Rules of Mandatory Sale of Part ofForeign Exchange Revenues by Enterprises, Offices, and Organizations via Authorized Banks andthe Conduct of Operations on the Domestic Currency Market of the Russian Federation’, No. 7 ofJune 26, 1992.”48 The operating words are “via authorized banks.”
Before September 16, 1998, Russian enterprises were obligated to sell 50 percent of theirforeign exchange revenues at the market exchange rate, but this foreign exchange could be soldthrough the Russian banking system. From September 16, 1998 on, mandated sale could only beconducted through designated currency exchanges, the Moscow Inter-Bank Currency Exchange andseven regional exchanges. The adjustment in the regulation halted sales through the banking systemand inter-bank sales of foreign exchange revenues.49
What’s the difference? To put it simply, from September 16, 1998, foreign exchange
revenues of Russian enterprises had to be sold inside Russia. Foreign exchange had to be broughtand wired to Russia to be sold. The new rule meant mandated repatriation of foreign exchangerevenues, indeed forced repatriation and forced exchange of export revenues. This amounted to animposition of capital controls on the outflow side of the capital account.50
Before September 16, 1998, foreign exchange revenues of Russian enterprises could be soldoutside of Russia through correspondent accounts of various Russian banks abroad. They could besold to subsidiaries of exporters themselves. Exporters could repurchase dollars at the cost of abanking transaction fee and deposit dollars abroad. They sold for rubles, but rubles did not entertheir bank accounts in Russia. The preexisting rule mandated 50 percent sale of foreign exchangerevenues, not 50 percent repatriation and deposit of ruble-denominated proceeds in enterpriseaccounts with Russian banks inside Russia. The preexisting rule could not address capital outflow.Most importantly, while foreign exchange revenues of Russian exporters, either sold to subsidiariesor repurchased, were deposited abroad, their money balances with Russian banks remained drawnto low levels. Enterprises could amass billions of dollars abroad while withholding tax remittancefrom the government in Russia. Due to the low money balances of enterprises and the payment jam,the government could not enforce tax remittance. The monetary authority was compelled both tomonetize tax remittance, in order to force enterprises to remit taxes withheld from workers andconsumers, and to monetize tax non-remittance, to enable the government to finance the budget
Free and Not So Free to Charge: Income Redistribution and Russia, 1992-2007 40
51In hindsight, it is interesting to recall that these issues were already discussed in August 1992, even if in apreliminary mode, due to lack of a lengthy experience and data, by the board of governors of the Central Bank of Russia,including its three concurrent and subsequent chairs, and one of the present authors. See Appendix.
52No. 57-P, The Circular of the Bank of Russia, no. 69 (324), October 1, 1998.
53No. 435-U, The Circular of the Bank of Russia, no. 85 (340), December 9, 1998; No. 437-U, The Circularof the Bank of Russia, no. 86 (341), December 7, 1998.
deficit. Both tax non-remittance and monetization of tax remittance, which was multiplied by thebanking system through credit transmission, summed up as a subsidy to the enterprise network.Figures 1 and 2 illustrate how these fiscal (tax non-remittance) and monetary (monetizationmultiplied by the banks) components of the subsidy added up in response to accumulation ofenterprise receivables.51
What was the true rate of foreign exchange sales before September 16, 1998, when themandated rate was 50 percent of export revenues? It could have been zero except when enterprisesthemselves needed rubles to reduce payroll arrears and pay wages. The decree of September 16,1998, raised it from nearly zero to 25 or 30 percent initially, when enforcement was incomplete, toclose to 50 percent when enforcement strengthened. The Central Bank enforced its rule strictlythrough its regional branches by matching foreign trade accounts of enterprises with physicalvolume and world prices against resulting repatriation and sale of foreign exchange. Commercialbanks, even the banks owned and controlled by exporting enterprises, had to cooperate in thisprocess and regularly furnish all the necessary information lest their license be revoked. FromSeptember 16, 1998, the new rule was in force. Dollars and other foreign exchange flowed intoRussia, were sold for rubles, and deposited in enterprise bank accounts. As the resulting rublereceipts entered enterprise bank accounts, enterprise money balances increased enabling thegovernment to enforce tax remittance. The government’s fiscal position started to quickly improve.
Restoring fiscal solvency was not an aim or intention of the Central Bank. The Central Bankdid not intend to run fiscal policy, to become the effectual fiscal authority in lieu of the FinanceMinistry. All that the Central Bank sought was to bring dollars to Russia so that the bank couldpurchase them to accumulate reserves. This focus of the Central Bank policy is clear from its nextmove. On September 28, 1998, the Central Bank issued an ordinance entitled “On the Rules andConditions for Conducting Trades of U.S. Dollars for Russia’s Rubles at the Special TradingSessions of the Inter-Bank Currency Exchanges.”52 Foreign exchange revenues first had to be soldat special trade sessions of the Moscow Inter-Bank Currency Exchange, with the Central Bankcommanding the right of first refusal at those sales. At the same time, this move tightenedenforcement of mandated repatriation.
Further tightening was enacted on December 2 and 7, 1998, when the Central Bank closedthe foreign exchange resale—and hence repurchase—window between domestic enterprises.53
Finally, on December 31, 1998, the Central Bank raised the rate of mandated repatriation of foreign
Free and Not So Free to Charge: Income Redistribution and Russia, 1992-2007 41
54No. 476-U, The Circular of the Bank of Russia, no. 1 (345), January 12, 1999. In addition, to reduce currencyrisks and to strengthen enforcement, the Central Bank on January 10, 1999 reduced the foreign exchange exposure ofRussian banks. It reduced open currency positions to 10 percent of each bank’s equity capital and established caps onforeign exchange contracts. No. 479-U, The Circular of the Bank of Russia, no. 2 (346), January 20, 1999.
55It follows that no level of and no increase in world oil prices would have mattered if effective repatriation offoreign exchange revenues was zero. At the same time, the effect of mandated repatriation of foreign exchange revenueswas strong already in 1999 even though an increase in world oil prices was modest. This effect strengthened in 2001and 2002—the balances of tax non-remittance started to decline, see figure 13.1—even though world oil prices declined(see figure2). These considerations indicate that the connection between world oil prices and Russian economic recoveryin 1999-2007 is specious if one abstracts from the economic system and policy.
exchange revenues to 75 percent of receipts and shortened the operation from two weeks to one.54
The latter detail was hardly necessary except for intimidation as a means of enforcement.
As the terms of trade for Russian exports improved, reinforced by the rise of world oil prices,the bank reduced the rate from 75 to 50 to 30 to 25 percent.55 Finally, it came down to zero as thedirect fiscal device of export duties could be enforced. It could not be enforced at a time of tax non-remittance because export duties and other tax payments, or rather non-payments, are fungible, andenforcement of export duties would have led to commensurate reductions of remittance of othertaxes. Once enterprise bank balances in domestic banks were restored due to a period of mandatedrepatriation, and complete tax remittance became enforceable, the real enforcement of export dutiesbecame possible without reducing remittance of other taxes. Over the course of 1999-2007, theCentral Bank fulfilled its objective, increasing its foreign exchange reserves from almost zero tonearly $600 billion by mid-2008. But the unintended fiscal consequences and real economic effectson output went much beyond that.
A reversal from contraction to recovery
The Central Bank printed rubles when it purchased foreign exchange reserves, that is, expanded themonetary base. These increases in the money supply in response to forced repatriation of exportrevenues produced an effect different from, indeed opposite to, monetization of the buildup inenterprise receivables in 1992-98. Three implications of this Central Bank monetary expansion in1999-2005 ensued in the following sequence. Let us first describe their transmission mechanismand then submit evidence available in their support.
(1) Enterprise money balances in bank accounts expanded. This reduced the balances ofpayables and receivables, thereby dissipating the payment jam. This process continued through theflow of funds across enterprises and industries, reversing the chain reaction of payment arrears andaging of receivables.
(2) Enterprise export earnings started to monetize tax remittance. The government couldenforce tax remittance. The balances of tax arrears slowed down in 1999-2001 and declinedsignificantly since October 2001. Figure 13.1 and table 7 document this trend in detail. This impliesthat the flow of tax non-remittance started to decline since 1999, that is, tax remittance increased,

Free and Not So Free to Charge: Income Redistribution and Russia, 1992-2007 42
56See the official policy and regulatory overview issued by the Central Bank of Russia on December 26, 2005,“Refinancing (Credit) of Credit Organizations as an Instrument of the Monetary Policy of the Bank of Russia,” athttp://www.cbr.ru/analytics/standart_system/print.asp?file=refinan.htm . It contains a detailed table on subsidized creditto the enterprise and banking network in 2004 and 2005.
and since October 2001 enterprises started to pay off past tax arrears. Government fiscal accountsreversed from deficits to surpluses.
(3) The link between monetization and the tax subsidy was weakened. Expansion of themonetary base, inasmuch as it was created by purchasing foreign exchange from enterprises, doesnot represent a subsidy. Only multiplication of money through financial re-intermediation betweenenterprises, through credit rollover and expansion continued to subsidize the enterprise network.56
Thus the overall money creation was, to a significant extent, no longer a subsidy. It did notstimulate a continuous major expansion of receivables. It only validated their moderateaccumulation.
These effects reduced the actual tax subsidy and fiscal expectations. Accumulation ofreceivables slowed down, surcharged invoicing slowed down, inflationary expectations subsided.Real money balances started to recover and real output followed suit.
The top row and blue arrows 9 to 11 in Box 4, “The Mechanism of Enterprise NetworkSocialism,” incorporate these effects into the prior framework. They show a new loop throughwhich the reversal of policy shifted the outcomes. Figure 15 presents the data to explore the newdevelopments and reversed relationships. It extends bivariate regressions in figure 9 from 1992-mid-1999 to the entire period 1992-2007. As before, panels 1 to 3 use the polynomial functionalforms and panels 1A to 3A test the same data in the linear form.
Panels 1 to 3 show that all principal bivariate relationships reversed from positive to negativesome time after 1999. Their curves are non-monotonic concave and decreasing. However, thereis an ambiguity concerning panel 3, the regression of the balances of receivables against the moneybalances.
In panel 1, the balances of tax non-remittance and receivables were positively related before1999 and some time thereafter, they slowed down together soon after 1999, and tax arrears startedto decline thereafter (in October 2001, says figure 13.1), their relationship with receivables turnednegative. The polynomial of the third degree accounts for 98 percent of the variation (the quadraticformula accounts for 96 percent of the variation, and the linear regression in panel 1A of figure 15,for 77 percent).
The relationship between tax non-remittance and monetization also turned from positive tonegative some time after 1999 in panel 2 of figure 15. The quadratic formula accounts for 74percent of the variation. Their linear bivariate relationship in panel 2A simply breaks down(adjusted R2 is 0.26). The quadratic regression in panel 2 implies that monetization started to workto dissipate tax non-remittance. This suggests that forced repatriation of foreign exchange earnings
Free and Not So Free to Charge: Income Redistribution and Russia, 1992-2007 43
indeed started to monetize tax remittance.
The relationship between the money balances and the balances of receivables in panel 3 offigure 15 became ambiguous. Notice in panel 3 of figure 15 as well as in figure 13.1 that both themoney balances (obviously) and the balances of receivables (not necessarily obviously) continuedto grow in 1999-2007. But the growth of receivables slowed down significantly relative to moneygrowth. A comparison between the quadratic equation in panel 3 and the linear regression in panel3A is suggestive. The quadratic formula accounts for 94 percent of the variation, the linear for 78percent. In Panel 3, the implied shape of the quadratic curve, which represents a better fit, is non-monotonic concave and decreasing. That is, the acceleration coefficient in the quadratic formulais negative and, after a slow down relative to the money supply, the balances of receivables arepredicted to decline. Monetization does not significantly stimulate amassment of receivables anymore and may even discourage it in the future. However, the polynomial of the third degree whichaccounts for 98 percent of the variation (not shown in figure 15) and makes the best fit, accordsmore with the linear regression. They suggest that the relationship between the money balances andreceivables remains positive and the subsidy component in monetization persists, just to a lesserdegree.
Judging from the data in figures 1, 7.1, and 15, a symbiotic relationship between theenterprise network and the government remains in place, but the positions of power have reversed.The Central Bank snatched fiscal power from the enterprise network. In effect, it started to runfiscal policy and delegated its execution, tax remittance, to the government. The latter started toreinforce its executive capacity to enforce tax remittance by additional crackdowns on the enterprisenetwork, including partial and exemplary de-privatization and re-nationalization. The Central Bankalso started to run independent monetary policy—independent, that is, from the enterprise network.This was a major reversal of powers. The enterprise network continues to maximize the tax subsidy,subject to fiscal expectations, but its power to do so significantly diminished. In was no longer asfree to charge the government and the public at large in 1999-2007 as it was in 1992-98.
Output Suppression and Recovery
The self-enforceable tax subsidy to the enterprise network enabled the great contraction in 1992-98after the dissipation of central planning in 1989-91. This contraction was an anomaly in view of thenegative value-added typical for central plan economies. A rapid GDP recovery in 1999-2007, aftera policy reversal, utilized the preexisting capacity and the embedded growth potential.
Value Subtraction and an Accounting Impossibility of Contraction
Under central planning, the system of forced production (output quotas) and forced deliverybetween enterprises and industries made prices embody cross-subsidies. Given governmentpriorities, many manufacturing, construction, and agricultural enterprises received subsidized inputsfrom natural resource enterprises and public utilities. In turn, enterprises in manufacturing,construction, and agriculture produced subsidized output whose market value in world prices would
Free and Not So Free to Charge: Income Redistribution and Russia, 1992-2007 44
57For a definitive treatment of negative value-added see Ronald I. McKinnon, The Order of EconomicLiberalization. Financial Control in the Transition to a Market Economy (Baltimore and London: The Johns HopkinsUniversity Press, 1993), pp. 162-186.
58A detailed study of input-output tables for Czechoslovakia in 1986 and Hungary in 1987 by Gordon Hughesand Paul Hare found, after adjusting for output quality, that value subtraction amounted to 34.8 percent and 34.6 percent,respectively. Poland exhibited a similar extent of value subtraction. See Gordon Hughes and Paul Hare,“Competitiveness and Industrial Restructuring in Czechoslovakia, Hungary, and Poland,” European Economy, SpecialEdition, no. 2 (1991): 83-110. See also Gordon Hughes and Paul Hare, “Industrial Policy and Restructuring in EasternEurope,” Oxford Review of Economic Policy 8, no. 1 (1992), pp. 82-104. Value subtraction of around 25 percent canbe discerned from the data on the former East Germany, without accounting for output quality. See “Micro andMacroeconomic Adjustment Processes in East Germany,” Deutsches Institut fur Wirtschaftsforschung, EconomicBulletin 28, no. 4 (Berlin, June 1991), no. 6 (August 1991), no. 10 (December 1991), 29, no. 2 (April 1992), no. 5 (July1992), no. 9 (November 1992), 30, no. 2 (April 1993), no. 4 (June 1993). If one adjusts for East German data for productquality, the extent of value subtraction should increase and converge with levels in Poland, Hungary, andCzechoslovakia, that is, around 33 percent of the value of inputs. A similar magnitude of value subtraction can bededuced from unpublished Russian input-output tables for 1991, on the eve of price decontrol.
have been lower than the market value of resource inputs. This means that value was subtractedacross industries beyond mining and utilities, that is, in a significant part of the economy. Thenegative value-added, or value subtraction, is widespread in many economies with cross-industry,cross-sectoral price distortions and cross-subsidies, in both central plan and less developedeconomies.57
Under network arrears and the self-enforceable tax subsidy, cross-subsidies from naturalresource enterprises and utilities to downstream industries retain and perpetuate value subtraction.However, the initial value subtraction inherited from central planning carried an invisible growthadvantage.
Elimination of value subtraction is in itself value addition, that is, one-time economicgrowth. Other vast inefficiencies of central planning contained inborn opportunities for efficiencyimprovements and thus for additional growth. Market prices and incentives automatically eliminatevalue subtraction and other inefficiencies and should—indeed cannot fail to—generate instantgrowth. This made the lack of substantial economic growth in Russia and elsewhere, let alone theGreat Contraction, impossible on accounting grounds.
Arithmetically, subtraction of subtraction is addition. This means that simply closing downthe value-subtracting enterprises and industries and reallocating (initially, simply selling on theworld market) resources wasted by them, automatically generates one-time economic growth. Itspotential extent was substantial. For example, if the negative value-added constituted 33 percentof the value of resource inputs, its elimination could produce an instant 50 percent growth of realGDP (in constant prices).58
From this perspective, even 28 percent growth achieved in Poland in the 1990s, after a big
contraction in 1990-92 and a subsequent recovery, can be viewed as a success only relative to Russia
Free and Not So Free to Charge: Income Redistribution and Russia, 1992-2007 45
59For a broad and detailed discussion of the causes of the great contraction across many post-central planeconomies see Robert A. Mundell, “The Great Contractions in Transition Economies,” in Mario I. Blejer and MarkoSkreb, eds., Macroeconomic Stabilization in Transition Economies (Cambridge and New York: Cambridge UniversityPress, 1997), pp. 73-99.
60Paradoxically, from this perspective, even the end of Russia’s subsidization of Eastern Europe and the formerSoviet Republics with underpriced energy must have helped economic growth in both Russia and its former beneficiaries.Input pricing at world levels should have eliminated value-subtracting, not value-adding, output, and thus contributedto growth, not contraction.
and other depressed economies.59 Relative to the inherent growth potential, even Poland andSlovenia, let alone other economies northwest of China, were less than successful. A partialexplanation of China’s success is the advantage of backwardness, the catch-up—the adoption ofaccumulated Western technological knowledge at low or no cost. An accounting perspectivesuggests that an even greater advantage is the advantage of wrongheaded industrialization—a one-time jump through eliminating value subtraction. The catch-up requires an effort of investment,training, and application of adopted technology. Even the fastest catch-up takes time. Theadvantage of wrongheaded industrialization provides effortless growth, with no additionalinvestment and training, at no time—an instant windfall. The more industrially developed a countrywas under central planning, the more one-time growth windfall it could achieve at no cost. Russia’sinitial conditions were among the most advantageous on this account.60
Elimination of value subtraction and automatic, instant growth were easy not only from anaccounting but also from a socio-political perspective. As a matter of fact and accounting, the totalsubsidy pays not only for value subtraction but also for 100 percent of wages of workers engagedin value subtraction. It is a matter of fact because waged workers, not robots, are working in thevalue-subtracting enterprises. It is a matter of accounting because value subtracting output issomehow produced. This means that the public pays for the difference between input and outputprices (value subtraction per se) and also for wages and profits of producers. These wages andprofits are subsidized on top of value subtraction. Therefore, if the market closes down all valuesubtracting enterprises, the government can tax the public and pay 100 percent of wages to displacedworkers for not working and for retraining, and the total subsidy will still be lower than beforebecause value subtraction will not be subsidized. Thus substantial, instant, one-time economicgrowth can be achieved without making workers financially worse-off, at about zero social cost,indeed with a social gain.
Not only was the great contraction not a necessary part of transformation, the opposite istrue: The great contraction was structurally impossible as a matter of accounting. Economicexpansion immediately after the end of central planning was a historical windfall and a missedopportunity.
A uniform view of contraction and recovery
Recall figures 1 and 7.1 to the witness stand. They reveal what happens to the supply sidein the world of aggregate third party billing. Incentives are mixed. They combine maximization of
Free and Not So Free to Charge: Income Redistribution and Russia, 1992-2007 46
61The monetary aggregate M2 stands for nominal money balances in domestic currency. Measures of broadmoney which include foreign exchange deposits are not relevant for this study. The real value of foreign exchange isnot affected by fiscal (subsidy) pursuits and inflationary expectations of Russian enterprises, although the amount offoreign exchange deposits with Russian banks may be so influenced to an unknown extent. Instead of M2 one couldemploy a narrower monetary aggregate M1 which includes demand deposits and excludes saving deposits. Both areclose in Russia because saving deposits are low. The latter constituted about 20 percent of M2 in the 1990s andincreased to about 35 percent in 2005 (as opposed to over 60 percent in China). For a detailed discussion see addendumto chapter 4 of From Predation to Prosperity, “Fixing China’s Banks, not Russia’s,” especially figure 4. Since savingsdeposits as a component of M2 (as opposed to large time deposits in M3) are of low maturity and money is fungible, itis more conventional to use M2 in simple, general-purpose studies. Milton Friedman summarized his multi-decade-longexperience with the choice of monetary variables: “I use M2 rather than either narrower aggregates, such as the base orM1, or broader aggregates, such as M3, because in prior research I have found M2 to have a more reliable relation toother economic magnitudes than the other monetary aggregates.” Milton Friedman, “A Natural Experiment in MonetaryPolicy Covering Three Episodes of Growth and Decline in the Economy and the Stock Market,” Journal of EconomicPerspectives 19, no 4 (Fall 2005), p. 146.
real profit from production and maximization of redistributed income, specifically maximization ofthe tax subsidy from surcharged invoicing.
Given technological possibility and existing capacity, production is bolstered by realspending, that is, mechanically, real money balances times their velocity of circulation. But realmoney balances are not independent (exogenous) under Enterprise Network Socialism.Maximization of the tax subsidy operates through maximization of nominal receivables, subject tofiscal expectations.
Figure 7.1 displays how growth of nominal receivables (the balances of invoices in excessof payments) aligns with price increases. Surcharged invoices automatically increase the price level.Fiscal expectations materialize as self-fulfilling inflationary expectations bypassing monetary policy.They contract real money balances. The converse is also true. When fiscal expectations are loweredby aggressive government policy of subsidy cutting (i.e., suppressing enterprise freedom to charge,enforcing tax remittance), real money balances can grow.
One can view the index of the ratio of money balances M2 to receivables in figure 1, as wellas later in figures 16 through 19, as a proxy for the index of real money balances.61 This proxy curveof the index of money balances to receivables in figure 1 shows the pendulum of real moneybalances on the downward path from 1991 through 1998 and on the upward path from 1998 through2007. This pendulum corresponds to contraction of real money balances in 1992-98 whenreceivables outgrew nominal money balances and to recovery of real money balances in 1999-2007when the course reversed and nominal money balances outgrew receivables.
The movement of this proxy curve of the index of real money balances in figure 1 matchesclosely the index of real output (GDP) in 1992-2007 starting in 1991 as the benchmark 100 for bothindices. Contraction of real money balances in 1992-98 matches the contraction path of real GDPduring that period. Recovery of real money balances in 1999-2007 matches closely partial economicrecovery since 1999. Minor annual fluctuations of real GDP upward and downward in 1996-98 alsomatch annual movements of real money balances.
Free and Not So Free to Charge: Income Redistribution and Russia, 1992-2007 47
A uniform empirical relationship holds consistently for both contraction and recovery. Whenthe outstanding balances of receivables outgrow nominal money balances, the economy contracts.When nominal money balances outgrow the balances of receivables, the economy recovers. It isimportant, in our view, that this is a uniform and unified empirical regularity, with a unifiedmechanical and systemic explanation behind it. Nothing is left to ad hoc reasoning. Notice, however,that nothing in the discussion above suggests that this relationship should hold for economic growthbeyond recovery from a great contraction under aggregate third party billing. Indeed, the abovemechanics and systemic dissection are idiosyncratic and specific to the unique system of EnterpriseNetwork Socialism.
Figure 1 and all prior discussion focused on the impact of subsidy maximization bysurcharged invoicing on the real money balances. For simplicity, we abstracted from theindependent impact of velocity of money circulation on overall spending in 1992-2007. There werealready too many complicated variables to consider and to plot, and velocity (the inverse of themoney demand) is one of the most difficult analytical issues which only specialists in that field canhandle. But it is, in fact, real spending (money times its velocity), not just real money balances, thatis approximated empirically in figure 1. In fact, another figure, figure 16, separates real moneybalances and shows in full their collapse from 1991 to 1992 from which they never recoveredthroughout the period 1992-2007.
Only figure 16 relays the meaning and the scope of the explosion of subsidy and inflationaryexpectations immediately after liberalization of January 1992 and shows how this brought down thereal money balances in 1992 to about one-fifth of their level in 1991. Figure 16 plots the same dataas figure 1 plus adds the year 1990 for reference. The difference is that figure 16 uses the same fullscale for both indices of real GDP and the ratio of money to receivables and does not truncate thescale for the latter index. Figure 1 truncated the index of the ratio of M2 to receivables between1991 and 1992 and truncated the latter’s scale accordingly. By doing so, figure 1 in effect imitateda nearly fourfold increase in the velocity of money circulation in 1992 which did not let real GDPcollapse by almost 80 percent on par with the real money balances. Such a rapid increase in moneyvelocity often accompanies episodes of high inflation when the real value of money balancesdepreciates and money holders reduce their money demand accordingly. Thus figure 1 implicitlyincorporates changes in velocity and compares the index of real GDP with a proxy for the index ofreal spending.
Figure 17 takes a closer look at annual fluctuations in 1992-2007. It uses different scales forthe indices of real GDP and the ratio of M2 to receivables to implicitly account for an increase inmoney velocity in 1992. It adds a flow chart which summarizes the above discussed relationshipsbetween surcharged invoices, the price index, nominal money balances, the velocity, nominalspending, real spending, and, ultimately, real output. The left side of Box 4 incorporates thistransmission mechanism with other mechanics of subsidy extraction under Enterprise NetworkSocialism.
Figures 18 and 19 apply the same comparison of the indices of real GDP and the ratio of M2to receivables to the quarterly data in 1995-2007. The quarterly GDP series before 1995 are not
Free and Not So Free to Charge: Income Redistribution and Russia, 1992-2007 48
62Friedrich A. Hayek, “The Use of Knowledge in Society,” American Economic Review 35, no. 4 (September1945): 519-530.
available. The quarterly comparisons are more sensitive to short-term fluctuations and various lags.Figure 18 plots crude, not seasonably adjusted index of GDP. Figure 19 uses seasonably adjusteddata. GDP in the first quarter of 1995, seasonably adjusted, is used as the benchmark 100 value.The quarterly indices of real output and the ratio of money balances to receivables in 1995-2007 donot always closely match. They broadly correspond to each other over time during both thecontraction years and the recovery years. The same empirical regularity applies on the quarterlybasis smoothed over time: When receivables outgrow money balances, GDP declines. When moneybalances outgrow receivables, GDP recovers. This persistent empirical rule supercedes short-termfluctuations.
The Ambivalence of Liberalization and Privatization
Aggregate third party billing in Russia in 1992-2007 generated a large degree of incomeredistribution. Table 2 documents that the self-enforceable tax subsidy alone claimed, on theaverage, 15 percent of the shrinking GDP in 1992-98. It was around 20 percent of GDP in 1992,1993, and 1998. This is a net transfer from households and consumers to enterprise owners andmanagers. In the process, this subsidy extraction involved a near-universal gross redistribution ofnational income in the flows of funds. This gross redistribution of income is more important than nettransfer because it is gross, not net redistribution that thwarts productive incentives and fosterscounter-productive and predatory behavior. Enterprise enforcement of the tax subsidy involved atleast two accompanying subsidies: (1) price cross-subsidies between industries and (2) subsidizationof value subtraction and retention of inefficient operations.
(1) Price increases in surcharged invoices are based on fiscal expectations, not on marketsignals. Prices always transmit information—a great insight of Friedrich A. Hayek.62 Butinformation about what? It can be information about market value or it can be information abouta valuable subsidy. As informational devices, prices are neutral between the two. They are abovethe fray. Enterprises and industries that can extract greater subsidy through tax non-remittance andmonetization of tax remittance, add higher price surcharges to their invoices. Hence, relative priceschange differently under fiscal-cum-inflationary expectations than under regular inflation. Whichmeans that decontrolled, free relative prices are not free market relative prices. Relative prices canbe free and redistributive at the same time. Recall that most enterprises, except retailers and variousservices, are both sellers and buyers of output. Therefore industrial cross-subsidies permeate tradecredit many times over in the overlapping flows of surcharged invoices and payments.
(2) Enterprises and industries with relatively high payables and low receivables have a bettercash flow position than others. They have to remit more taxes and they extract a lower tax subsidyas a result. But their further tax remittance and hence, in the fungible flows of funds, their tradepayables are monetized. Since their payables are greater than their receivables, their subsidy coversnot only price surcharges by sellers but also (after allowing for the difference between their
Free and Not So Free to Charge: Income Redistribution and Russia, 1992-2007 49
63Arthur C. Pigou, The Economics of Welfare (London: Macmillan and Co., 1929), pp. 135-145, 174-214, 223-227. A compendium of classic articles is Tyler Cowen, ed., Public Goods and Market Failures: A Critical Examination(New Brunwick: Transaction Publishers, 1992). See also, Richard Cornes and Todd Sandler, The Theory ofExternalities, Public Goods and Club Goods (New York: Cambridge University Press, 1996).
increased prices and those of their sellers) real resources. As a result, on the margin, they obtaineffectively additional inputs for free, at public expense. This especially involves inputs of naturalresources. As we discussed earlier, natural resource industries are net creditors, their receivablesexceed their payables, and hence they benefit from the tax subsidy primarily through the tax non-remittance channel. Users of natural resources are net debtors, their payables exceed theirreceivables, and hence they benefit from the tax subsidy primarily through the monetization(including bank credit) channel. Subsidization of their inputs in the world of free and distortedrelative prices enables them to continue to engage in negative value-added production, that is, retainvalue subtraction. In less egregious cases, this merely subsidizes inefficient enterprises andindustries.
Integrating (1) and (2) over the entire flows of funds leads to the conclusion that mosttransactions under Enterprise Network Socialism redistribute income. The self-enforceable taxsubsidy and the accompanying cross-subsidies redistribute income in favor of enterprise decision-makers, namely owners and managers. Otherwise, these subsidies would be of little value to them.These subsidies end up in a net transfer from workers to owners and managers (that is, de juremanagers and de facto owners).
Figure 20 compares factor income shares in non-redistributive economies such as Westernmarket economies, particularly the U.S. the U.K., and Germany, and Spain, and post-central planChina vs. redistributive economies such as the Soviet union (specifically Russia in 1989 as part ofthe USSR), post-central plan Russia in 1992 and 2005, Kazakhstan in 2005, and less developedeconomies, specifically Mexico, Argentina, and Egypt. The examples include free marketeconomies (the U.S., the U.K., and Spain), a non-free market economy in China, a central plansocialist economy (Russia as part of the USSR), a free non-market, socialist economy (Russia underEnterprise Network Socialism), and non-free non-market non-central plan socialist economies ofMexico, Argentina, and Egypt. In the spirit of Arthur C. Pigou, factor income shares approximateconvergence or divergence between agents’ productive contribution to the economy and theirremuneration from the economy. In the tradition of Arthur C. Pigou and in the language of theliterature he inspired, it is a comparison between social returns and private returns,63 or, to put itdifferently, between returns to the economy and returns to producer and non-producer agents. Undercentral planning, in Russia as part of the USSR, and in less developed economies wages andagricultural prices were suppressed. Suppressed wages and agricultural prices were the principalsource of income redistribution. The enterprise network in post-central plan Russia retained thismechanism in the absence of central planning. Accordingly, the shares of labor income in all thesecountries were low and the ratio of labor income to capital income was close to 1:1. In non-redistributive Western market economies and in post-central plan China, wages and agriculturalprices were commensurate to their market value and hence the ratio of labor income to capitalincome was about 2:1. This implies about 15 percentage point factor income redistribution. This
Free and Not So Free to Charge: Income Redistribution and Russia, 1992-2007 50
is a massive net transfer of income from workers to owners of privatized industries in post-centralplan Russia, similar to such transfer in less developed economies and also similar to such transferto the government as owner of capital in the central plan economies, e.g., the Soviet Union.
Socialism from below, Enterprise Network Socialism, is just as ubiquitous and near-universalas socialism from above, central planning. Decontrolled transactions and privatized assets are notnecessarily market prices and market assets. Freedom from government restriction is not necessarilyfreedom from income redistribution. Free socialism is still socialism, and free near-total socialismwhich redistributes the bulk of GDP is still near-total socialism. Socialism from below can be justas much socialism as from above. Freedom to charge is merely socialist devolution.
The Russian experience in 1992-2007 opens a new perspective on liberalization andprivatization. Their high time in the 1990s coincided with the great contraction of GDP and theirpartial rollback in 1999-2007 coincided with partial economic recovery. The uniform assembly lineinherited from central planning inverted the expected positive effects of liberalization andprivatization. This discussion suggests that liberalization and privatization are ambivalent. Theycan decrease and they can retain (or even increase) income redistribution. Government restrictionis also ambivalent. It can increase or decrease income redistribution. In Russia after September1998, government restriction reduced freedom to charge and hence decreased income redistribution.
The following tables summarize these ambivalent relationships.
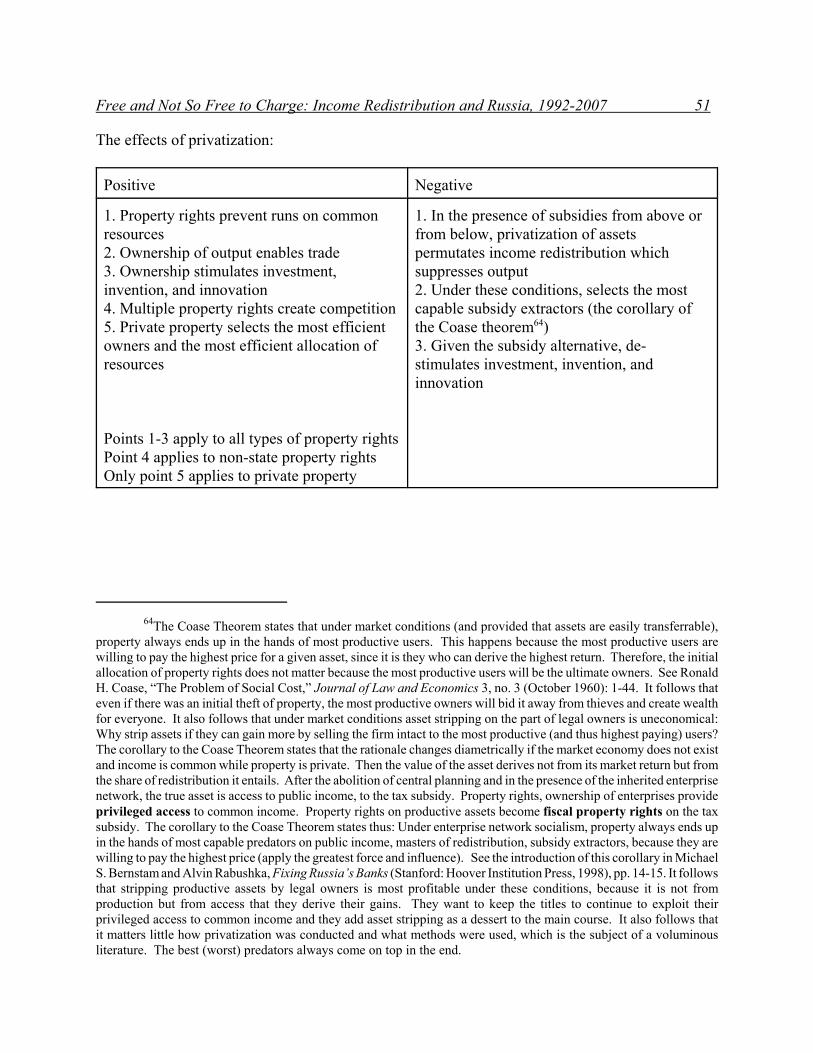
Free and Not So Free to Charge: Income Redistribution and Russia, 1992-2007 51
64The Coase Theorem states that under market conditions (and provided that assets are easily transferrable),property always ends up in the hands of most productive users. This happens because the most productive users arewilling to pay the highest price for a given asset, since it is they who can derive the highest return. Therefore, the initialallocation of property rights does not matter because the most productive users will be the ultimate owners. See RonaldH. Coase, “The Problem of Social Cost,” Journal of Law and Economics 3, no. 3 (October 1960): 1-44. It follows thateven if there was an initial theft of property, the most productive owners will bid it away from thieves and create wealthfor everyone. It also follows that under market conditions asset stripping on the part of legal owners is uneconomical:Why strip assets if they can gain more by selling the firm intact to the most productive (and thus highest paying) users?The corollary to the Coase Theorem states that the rationale changes diametrically if the market economy does not existand income is common while property is private. Then the value of the asset derives not from its market return but fromthe share of redistribution it entails. After the abolition of central planning and in the presence of the inherited enterprisenetwork, the true asset is access to public income, to the tax subsidy. Property rights, ownership of enterprises provideprivileged access to common income. Property rights on productive assets become fiscal property rights on the taxsubsidy. The corollary to the Coase Theorem states thus: Under enterprise network socialism, property always ends upin the hands of most capable predators on public income, masters of redistribution, subsidy extractors, because they arewilling to pay the highest price (apply the greatest force and influence). See the introduction of this corollary in MichaelS. Bernstam and Alvin Rabushka, Fixing Russia’s Banks (Stanford: Hoover Institution Press, 1998), pp. 14-15. It followsthat stripping productive assets by legal owners is most profitable under these conditions, because it is not fromproduction but from access that they derive their gains. They want to keep the titles to continue to exploit theirprivileged access to common income and they add asset stripping as a dessert to the main course. It also follows thatit matters little how privatization was conducted and what methods were used, which is the subject of a voluminousliterature. The best (worst) predators always come on top in the end.
The effects of privatization:
Positive Negative
1. Property rights prevent runs on commonresources2. Ownership of output enables trade3. Ownership stimulates investment,invention, and innovation4. Multiple property rights create competition5. Private property selects the most efficientowners and the most efficient allocation ofresources
Points 1-3 apply to all types of property rightsPoint 4 applies to non-state property rightsOnly point 5 applies to private property
1. In the presence of subsidies from above orfrom below, privatization of assetspermutates income redistribution whichsuppresses output2. Under these conditions, selects the mostcapable subsidy extractors (the corollary ofthe Coase theorem64)3. Given the subsidy alternative, de-stimulates investment, invention, andinnovation
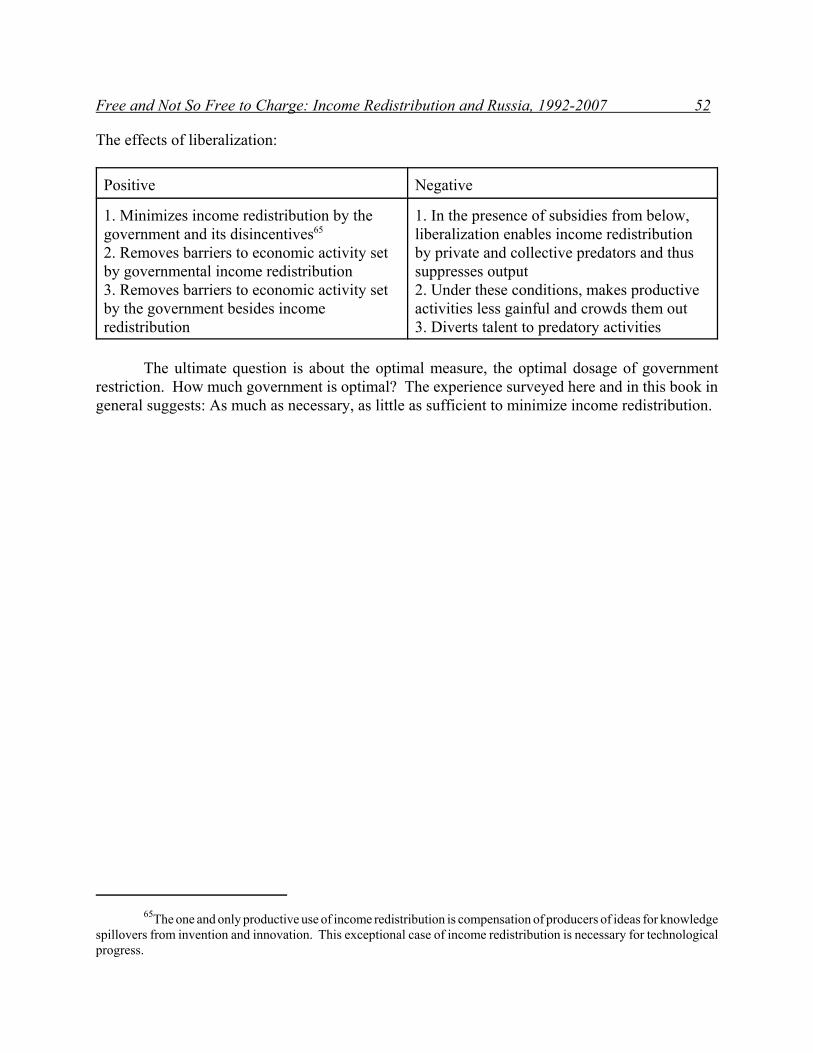
Free and Not So Free to Charge: Income Redistribution and Russia, 1992-2007 52
65The one and only productive use of income redistribution is compensation of producers of ideas for knowledgespillovers from invention and innovation. This exceptional case of income redistribution is necessary for technologicalprogress.
The effects of liberalization:
Positive Negative
1. Minimizes income redistribution by thegovernment and its disincentives65
2. Removes barriers to economic activity setby governmental income redistribution3. Removes barriers to economic activity setby the government besides incomeredistribution
1. In the presence of subsidies from below,liberalization enables income redistributionby private and collective predators and thussuppresses output2. Under these conditions, makes productiveactivities less gainful and crowds them out3. Diverts talent to predatory activities
The ultimate question is about the optimal measure, the optimal dosage of governmentrestriction. How much government is optimal? The experience surveyed here and in this book ingeneral suggests: As much as necessary, as little as sufficient to minimize income redistribution.
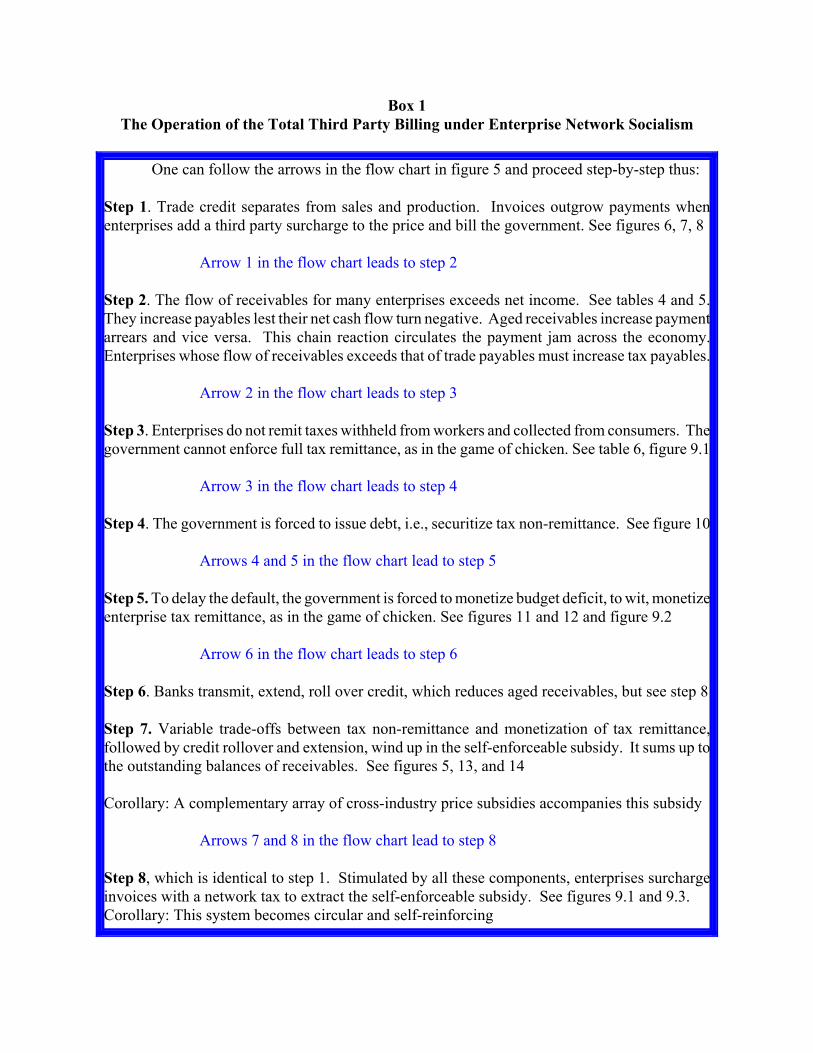
Box 1The Operation of the Total Third Party Billing under Enterprise Network Socialism
One can follow the arrows in the flow chart in figure 5 and proceed step-by-step thus:
Step 1. Trade credit separates from sales and production. Invoices outgrow payments whenenterprises add a third party surcharge to the price and bill the government. See figures 6, 7, 8
Arrow 1 in the flow chart leads to step 2
Step 2. The flow of receivables for many enterprises exceeds net income. See tables 4 and 5.They increase payables lest their net cash flow turn negative. Aged receivables increase paymentarrears and vice versa. This chain reaction circulates the payment jam across the economy.Enterprises whose flow of receivables exceeds that of trade payables must increase tax payables.
Arrow 2 in the flow chart leads to step 3
Step 3. Enterprises do not remit taxes withheld from workers and collected from consumers. Thegovernment cannot enforce full tax remittance, as in the game of chicken. See table 6, figure 9.1
Arrow 3 in the flow chart leads to step 4
Step 4. The government is forced to issue debt, i.e., securitize tax non-remittance. See figure 10
Arrows 4 and 5 in the flow chart lead to step 5
Step 5. To delay the default, the government is forced to monetize budget deficit, to wit, monetizeenterprise tax remittance, as in the game of chicken. See figures 11 and 12 and figure 9.2
Arrow 6 in the flow chart leads to step 6
Step 6. Banks transmit, extend, roll over credit, which reduces aged receivables, but see step 8
Step 7. Variable trade-offs between tax non-remittance and monetization of tax remittance,followed by credit rollover and extension, wind up in the self-enforceable subsidy. It sums up tothe outstanding balances of receivables. See figures 5, 13, and 14
Corollary: A complementary array of cross-industry price subsidies accompanies this subsidy
Arrows 7 and 8 in the flow chart lead to step 8
Step 8, which is identical to step 1. Stimulated by all these components, enterprises surchargeinvoices with a network tax to extract the self-enforceable subsidy. See figures 9.1 and 9.3.Corollary: This system becomes circular and self-reinforcing
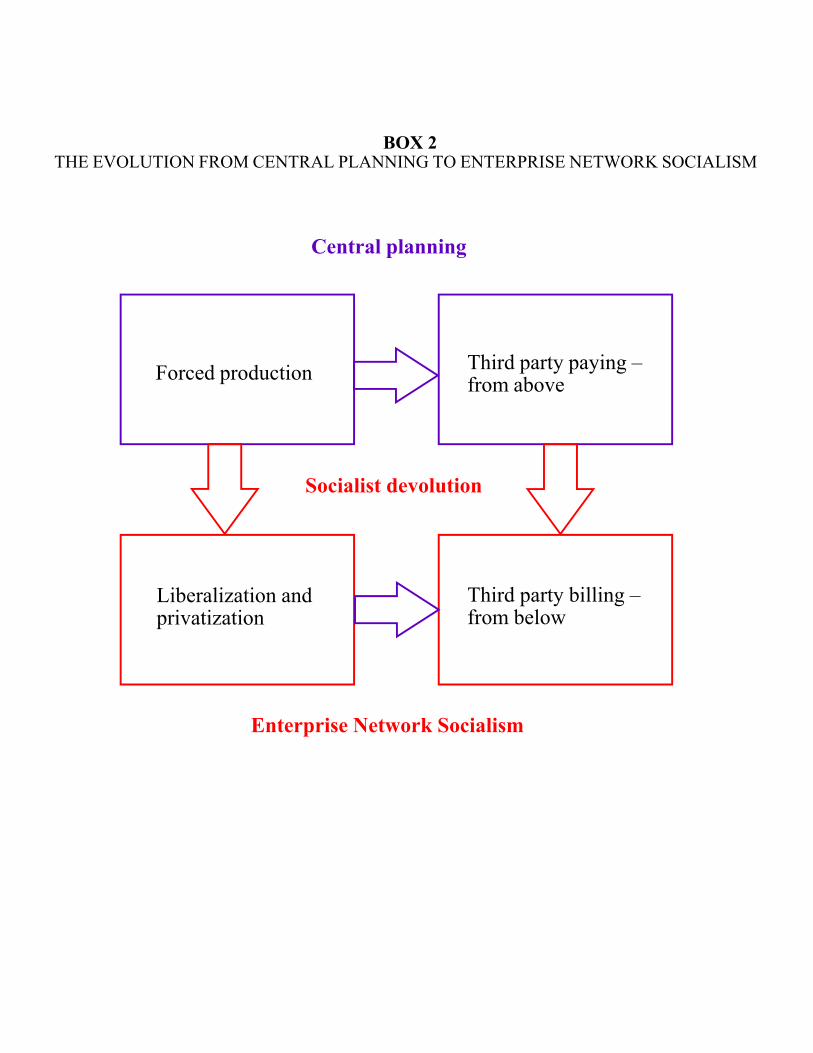
Third party paying –from above
Liberalization andprivatization
Forced production
Third party billing –from below
BOX 2THE EVOLUTION FROM CENTRAL PLANNING TO ENTERPRISE NETWORK SOCIALISM
Socialist devolution
Enterprise Network Socialism
Central planning
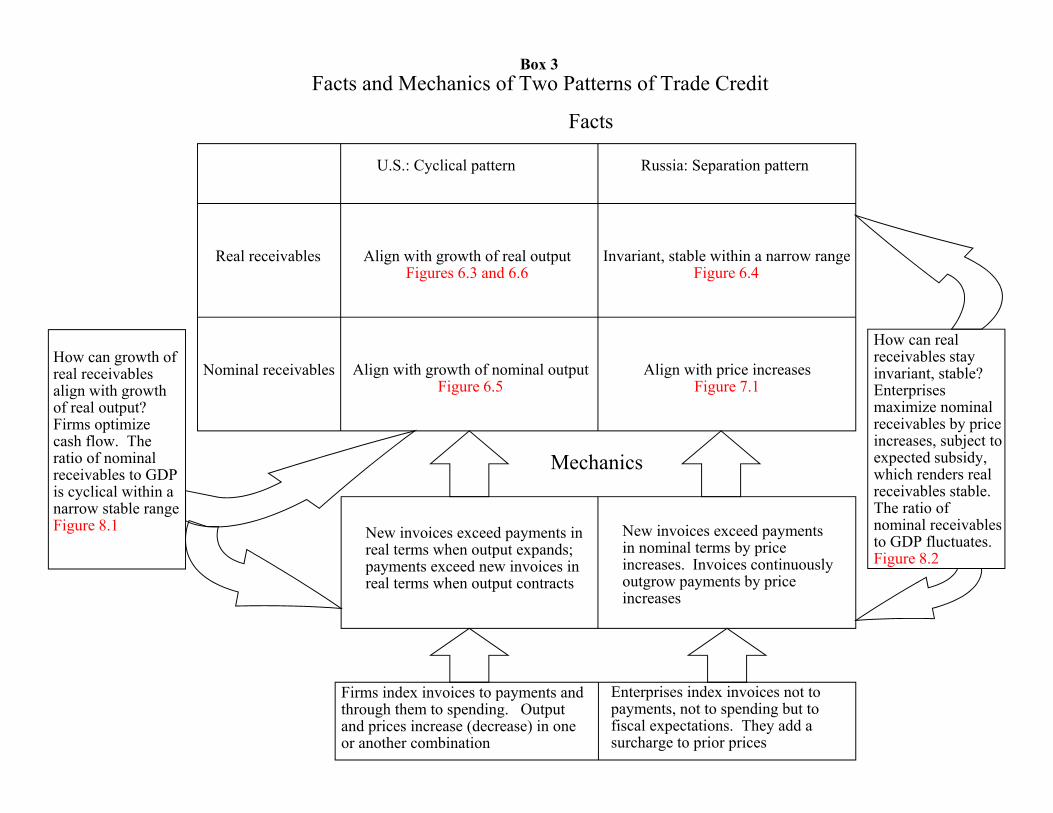
Box 3Facts and Mechanics of Two Patterns of Trade Credit
U.S.: Cyclical pattern Russia: Separation pattern
Real receivables
Nominal receivables
Align with growth of real outputFigures 6.3 and 6.6
Invariant, stable within a narrow rangeFigure 6.4
Align with growth of nominal outputFigure 6.5
Align with price increasesFigure 7.1
How can growth ofreal receivablesalign with growthof real output?Firms optimizecash flow. Theratio of nominalreceivables to GDPis cyclical within anarrow stable rangeFigure 8.1
How can realreceivables stayinvariant, stable?Enterprisesmaximize nominalreceivables by priceincreases, subject toexpected subsidy,which renders realreceivables stable. The ratio ofnominal receivablesto GDP fluctuates.Figure 8.2
New invoices exceed payments inreal terms when output expands;payments exceed new invoices inreal terms when output contracts
New invoices exceed paymentsin nominal terms by priceincreases. Invoices continuouslyoutgrow payments by priceincreases
Mechanics
Facts
Firms index invoices to payments andthrough them to spending. Outputand prices increase (decrease) in oneor another combination
Enterprises index invoices not topayments, not to spending but tofiscal expectations. They add asurcharge to prior prices
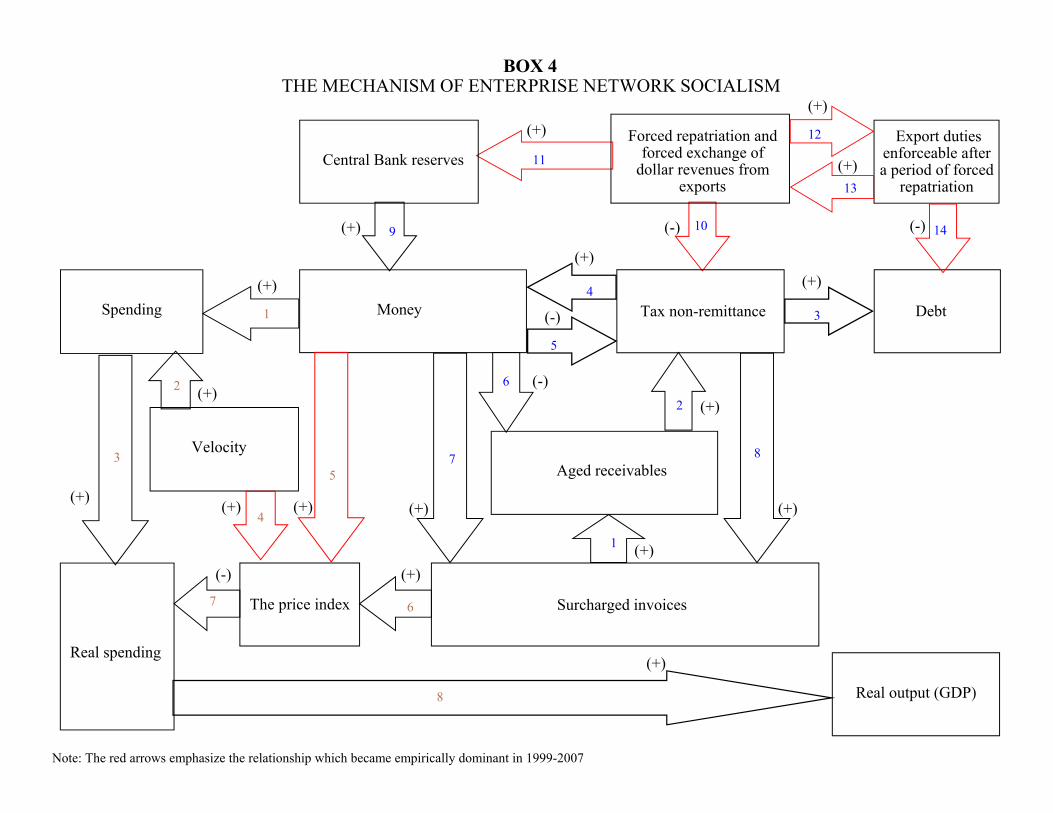
Central Bank reserves
Money Tax non-remittance Debt
Real output (GDP)
(-)
(+)
(+)
(+)
(+)
(-)
(+)
(+) (-)
(+)
Note: The red arrows emphasize the relationship which became empirically dominant in 1999-2007
BOX 4THE MECHANISM OF ENTERPRISE NETWORK SOCIALISM
Spending
Forced repatriation andforced exchange of
dollar revenues fromexports
(+)
Aged receivables(+)
The price index
(-)
(+)
(+)
(+)
Surcharged invoices
1
4
2
35
Real spending
7
1
3
2
5
4
7
6
8
9 10
12
(+)
Velocity
6
(+)
11
13
Export dutiesenforceable aftera period of forced
repatriation
(+)(+)
(-) 14
8
(+)
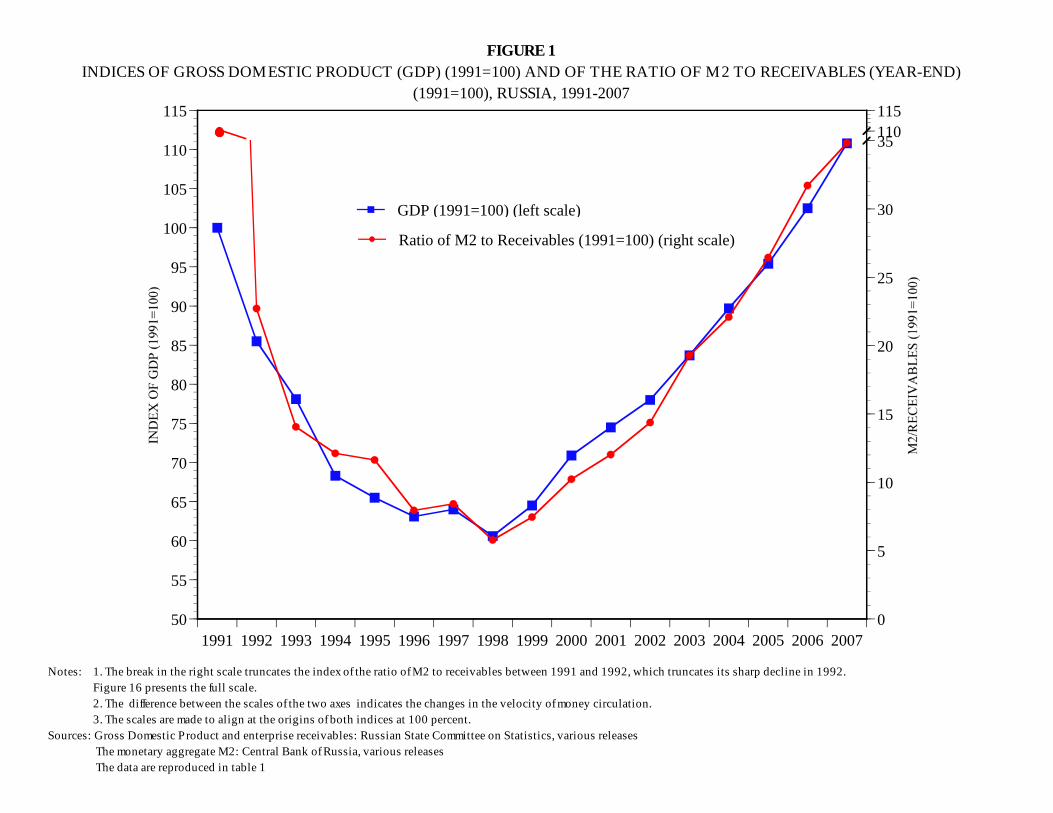
1991 1992 1993 1994 1995 1996 1997 1998 1999 2000 2001 2002 2003 2004 2005 2006 200750
55
60
65
70
75
80
85
90
95
100
105
110
115
0
5
10
15
20
25
30
35110115
GDP (1991=100) (left scale)
Ratio of M2 to Receivables (1991=100) (right scale)
FIGURE 1INDICES OF GROSS DOMESTIC PRODUCT (GDP) (1991=100) AND OF THE RATIO OF M2 TO RECEIVABLES (YEAR-END)
(1991=100), RUSSIA, 1991-2007
Notes: 1. The break in the right scale truncates the index of the ratio of M2 to receivables between 1991 and 1992, which truncates its sharp decline in 1992. Figure 16 presents the full scale. 2. The difference between the scales of the two axes indicates the changes in the velocity of money circulation. 3. The scales are made to align at the origins of both indices at 100 percent.Sources: Gross Domestic Product and enterprise receivables: Russian State Committee on Statistics, various releases The monetary aggregate M2: Central Bank of Russia, various releases The data are reproduced in table 1
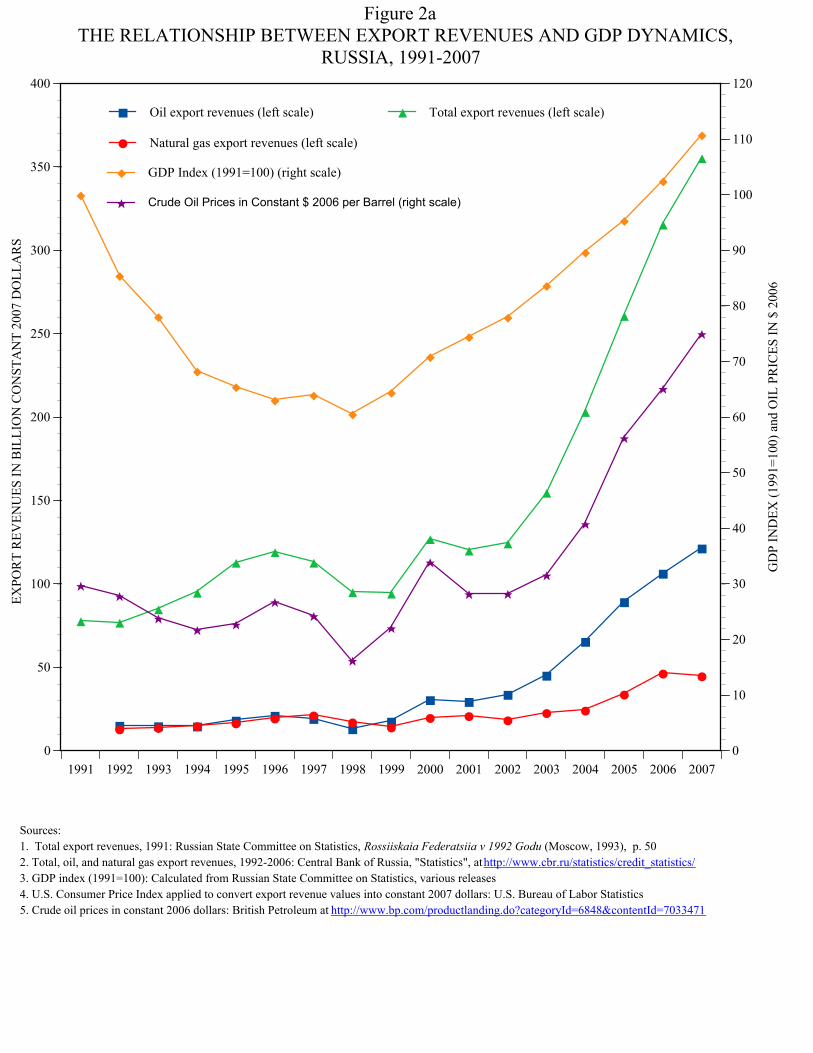
B B BB B B
BB
B BB
B
B
B
B
B
J J J J J JJ J
J J JJ J
J
J J
H HH
H
HH
H
H H
HH
H
H
H
H
H
H
F
F
F
F
FF F
F
F
F
F
F
F
F
F
F
F
33
33
3
3
3
3
3
3
3 3
3
3
3
3
3
1991 1992 1993 1994 1995 1996 1997 1998 1999 2000 2001 2002 2003 2004 2005 2006 20070
50
100
150
200
250
300
350
400
0
10
20
30
40
50
60
70
80
90
100
110
120
EXPO
RT
REV
ENU
ES IN
BIL
LIO
N C
ON
STA
NT
2007
DO
LLA
RS
GD
P IN
DEX
(199
1=10
0) a
nd O
IL P
RIC
ES IN
$ 2
006
B Oil export revenues (left scale)
J Natural gas export revenues (left scale)
H Total export revenues (left scale)
F GDP Index (1991=100) (right scale)
3 Crude Oil Prices in Constant $ 2006 per Barrel (right scale)
Figure 2aTHE RELATIONSHIP BETWEEN EXPORT REVENUES AND GDP DYNAMICS,
RUSSIA, 1991-2007
Sources:1. Total export revenues, 1991: Russian State Committee on Statistics, Rossiiskaia Federatsiia v 1992 Godu (Moscow, 1993), p. 502. Total, oil, and natural gas export revenues, 1992-2006: Central Bank of Russia, "Statistics", at http://www.cbr.ru/statistics/credit_statistics/3. GDP index (1991=100): Calculated from Russian State Committee on Statistics, various releases4. U.S. Consumer Price Index applied to convert export revenue values into constant 2007 dollars: U.S. Bureau of Labor Statistics5. Crude oil prices in constant 2006 dollars: British Petroleum at http://www.bp.com/productlanding.do?categoryId=6848&contentId=7033471
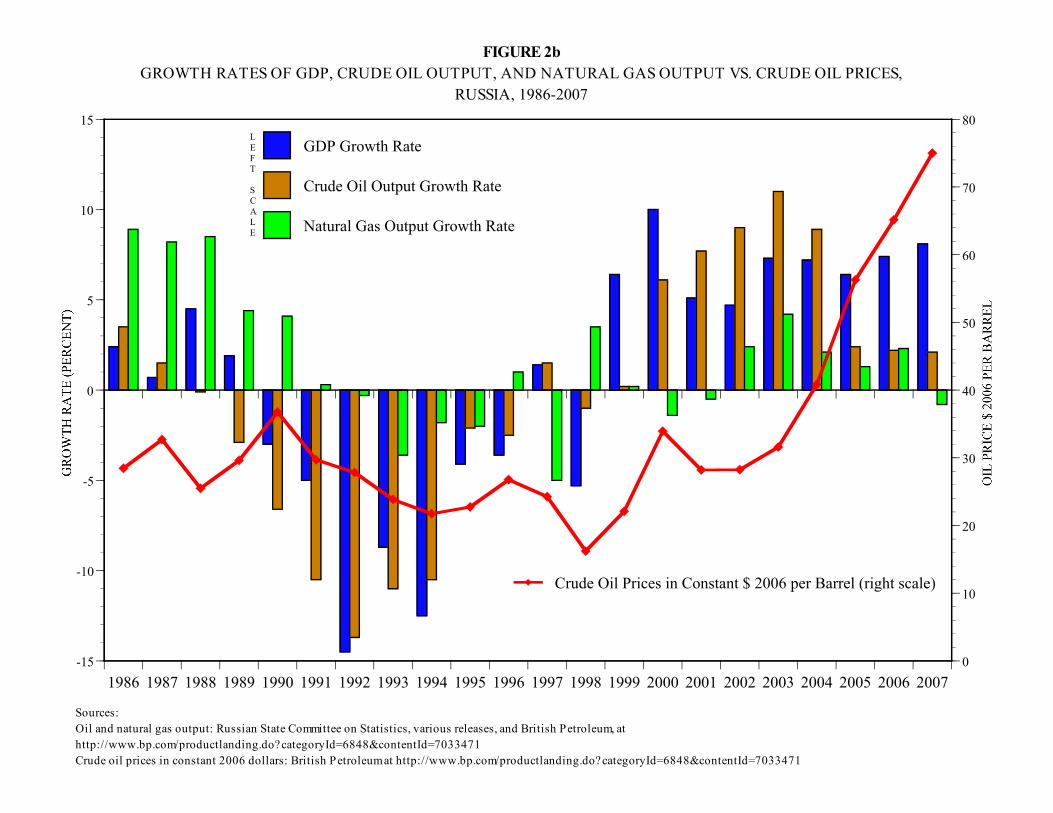
1986 1987 1988 1989 1990 1991 1992 1993 1994 1995 1996 1997 1998 1999 2000 2001 2002 2003 2004 2005 2006 2007
1986 1987 1988 1989 1990 1991 1992 1993 1994 1995 1996 1997 1998 1999 2000 2001 2002 2003 2004 2005 2006 2007
-15
-10
-5
0
5
10
15
0
10
20
30
40
50
60
70
80
GDP Growth Rate
Crude Oil Output Growth Rate
Natural Gas Output Growth Rate
Crude Oil Prices in Constant $ 2006 per Barrel (right scale)
Sources:Oil and natural gas output: Russian State Committee on Statistics, various releases, and British Petroleum, athttp://www.bp.com/productlanding.do?categoryId=6848&contentId=7033471Crude oil prices in constant 2006 dollars: British Petroleum at http://www.bp.com/productlanding.do?categoryId=6848&contentId=7033471
FIGURE 2bGROWTH RATES OF GDP, CRUDE OIL OUTPUT, AND NATURAL GAS OUTPUT VS. CRUDE OIL PRICES,
RUSSIA, 1986-2007
LEFT
SCALE
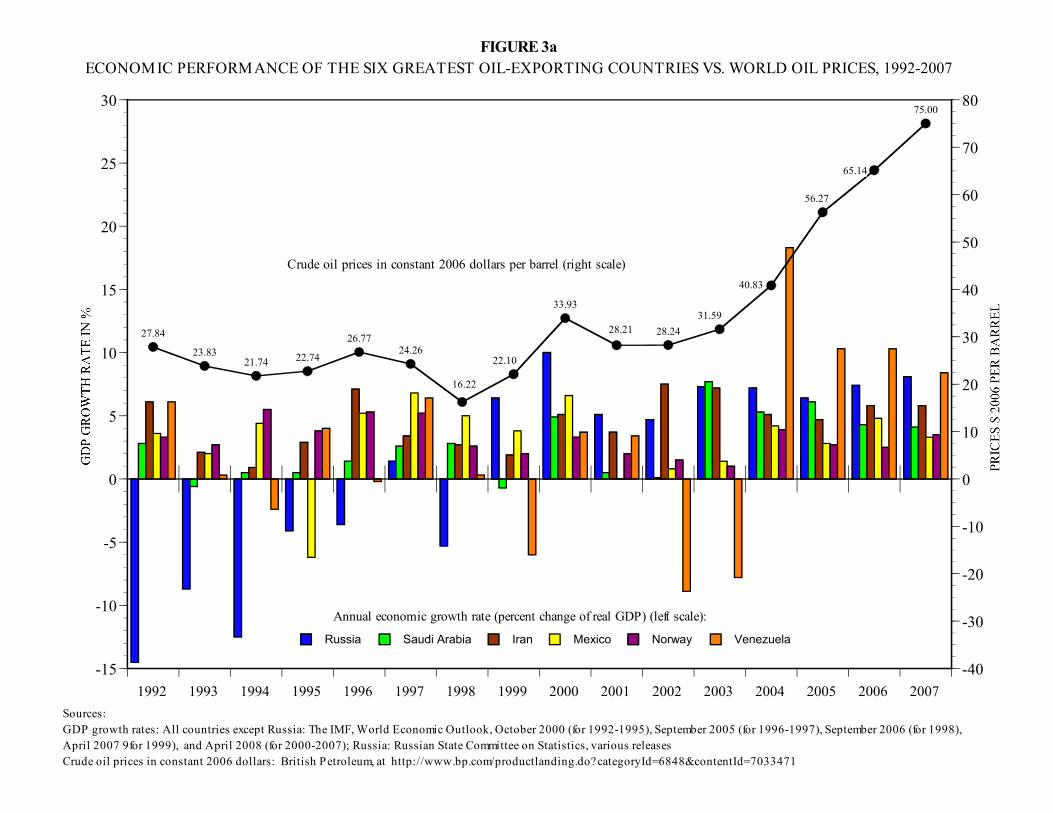
1992 1993 1994 1995 1996 1997 1998 1999 2000 2001 2002 2003 2004 2005 2006 2007
1992 1993 1994 1995 1996 1997 1998 1999 2000 2001 2002 2003 2004 2005 2006 2007
-15
-10
-5
0
5
10
15
20
25
30
-40
-30
-20
-10
0
10
20
30
40
50
60
70
80
27.84
23.8321.74 22.74
26.7724.26
16.22
22.10
33.93
28.21 28.2431.59
40.83
56.27
65.14
75.00
Russia Saudi Arabia Iran Mexico Norway Venezuela
Annual economic growth rate (percent change of real GDP) (left scale):
Crude oil prices in constant 2006 dollars per barrel (right scale)
Sources:GDP growth rates: All countries except Russia: The IMF, World Economic Outlook, October 2000 (for 1992-1995), September 2005 (for 1996-1997), September 2006 (for 1998),April 2007 9for 1999), and April 2008 (for 2000-2007); Russia: Russian State Committee on Statistics, various releasesCrude oil prices in constant 2006 dollars: British Petroleum, at http://www.bp.com/productlanding.do?categoryId=6848&contentId=7033471
FIGURE 3aECONOMIC PERFORMANCE OF THE SIX GREATEST OIL-EXPORTING COUNTRIES VS. WORLD OIL PRICES, 1992-2007
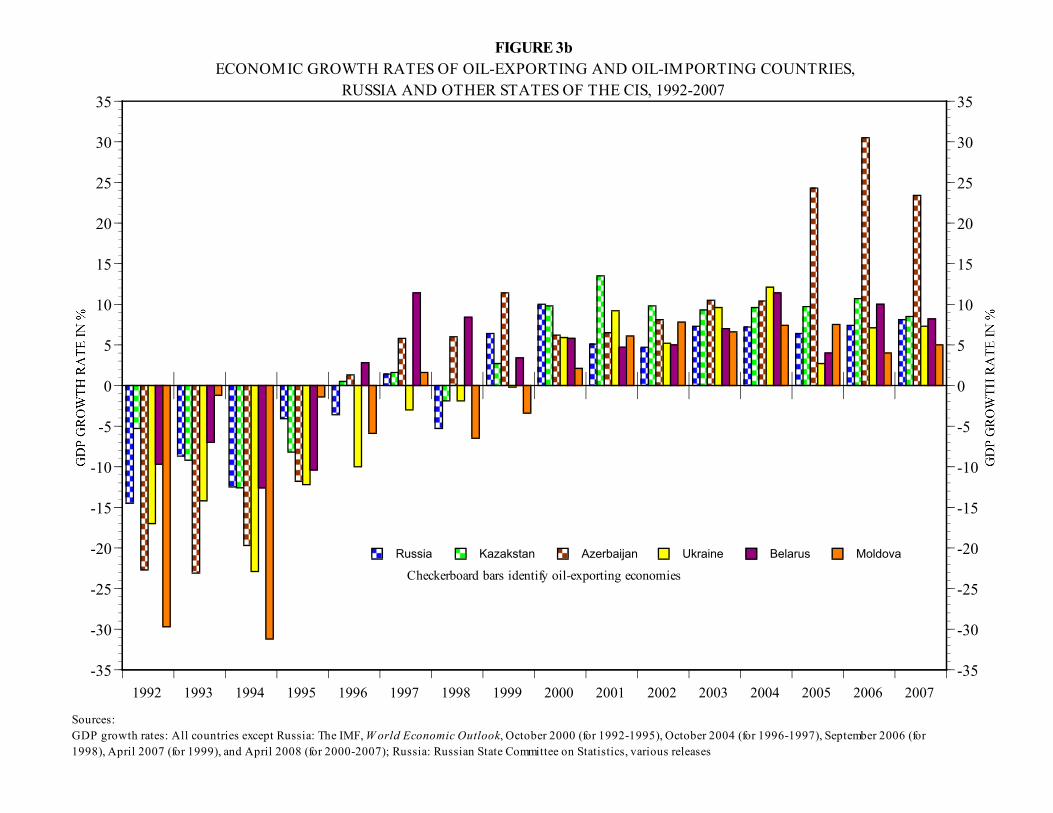
1992 1993 1994 1995 1996 1997 1998 1999 2000 2001 2002 2003 2004 2005 2006 20071992 1993 1994 1995 1996 1997 1998 1999 2000 2001 2002 2003 2004 2005 2006 2007
-35
-30
-25
-20
-15
-10
-5
0
5
10
15
20
25
30
35
-35
-30
-25
-20
-15
-10
-5
0
5
10
15
20
25
30
35
Russia Kazakstan Azerbaijan Ukraine Belarus Moldova
Sources:GDP growth rates: All countries except Russia: The IMF, W orld Economic Outlook, October 2000 (for 1992-1995), October 2004 (for 1996-1997), September 2006 (for1998), April 2007 (for 1999), and April 2008 (for 2000-2007); Russia: Russian State Committee on Statistics, various releases
FIGURE 3b ECONOMIC GROWTH RATES OF OIL-EXPORTING AND OIL-IMPORTING COUNTRIES,
RUSSIA AND OTHER STATES OF THE CIS, 1992-2007
Checkerboard bars identify oil-exporting economies
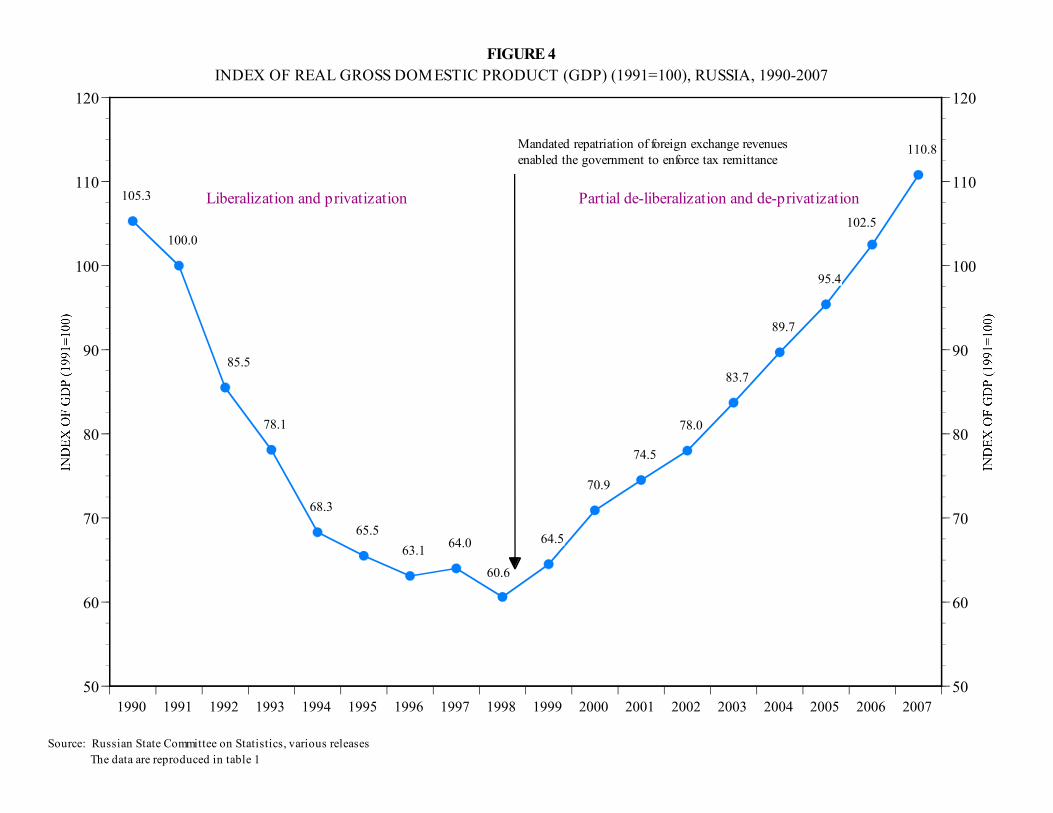
105.3
100.0
85.5
78.1
68.3
65.563.1 64.0
60.6
64.5
70.9
74.5
78.0
83.7
89.7
95.4
102.5
110.8
1990 1991 1992 1993 1994 1995 1996 1997 1998 1999 2000 2001 2002 2003 2004 2005 2006 200750
60
70
80
90
100
110
120
50
60
70
80
90
100
110
120
FIGURE 4INDEX OF REAL GROSS DOMESTIC PRODUCT (GDP) (1991=100), RUSSIA, 1990-2007
Source: Russian State Committee on Statistics, various releases The data are reproduced in table 1
Mandated repatriation of foreign exchange revenuesenabled the government to enforce tax remittance
Liberalization and privatization Partial de-liberalization and de-privatization
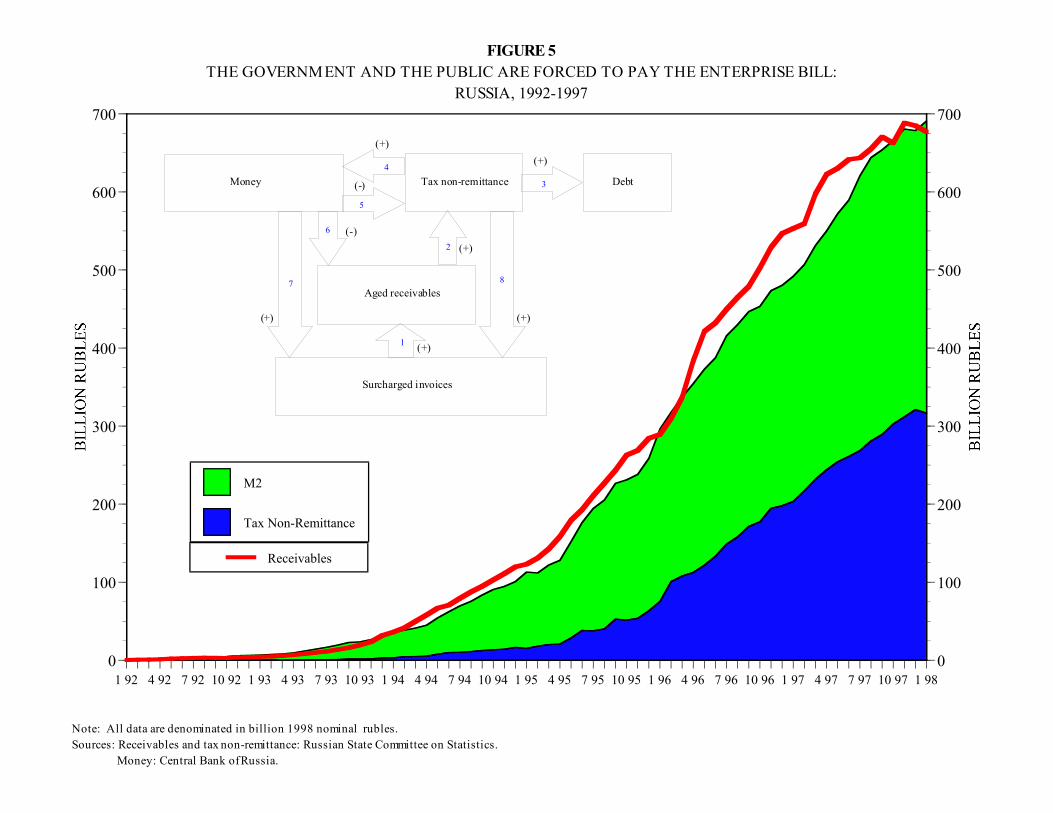
1 92 4 92 7 92 10 92 1 93 4 93 7 93 10 93 1 94 4 94 7 94 10 94 1 95 4 95 7 95 10 95 1 96 4 96 7 96 10 96 1 97 4 97 7 97 10 97 1 980
100
200
300
400
500
600
700
0
100
200
300
400
500
600
700
Tax Non-Remittance
M2
Receivables
Note: All data are denominated in billion 1998 nominal rubles.Sources: Receivables and tax non-remittance: Russian State Committee on Statistics. Money: Central Bank of Russia.
FIGURE 5THE GOVERNMENT AND THE PUBLIC ARE FORCED TO PAY THE ENTERPRISE BILL:
RUSSIA, 1992-1997
Money Tax non-remittance Debt(-)
(+)
(+) (-)
(+)
Aged receivables
(+)
(+)
(+)
Surcharged invoices
1
3
2
5
4
7
6
8
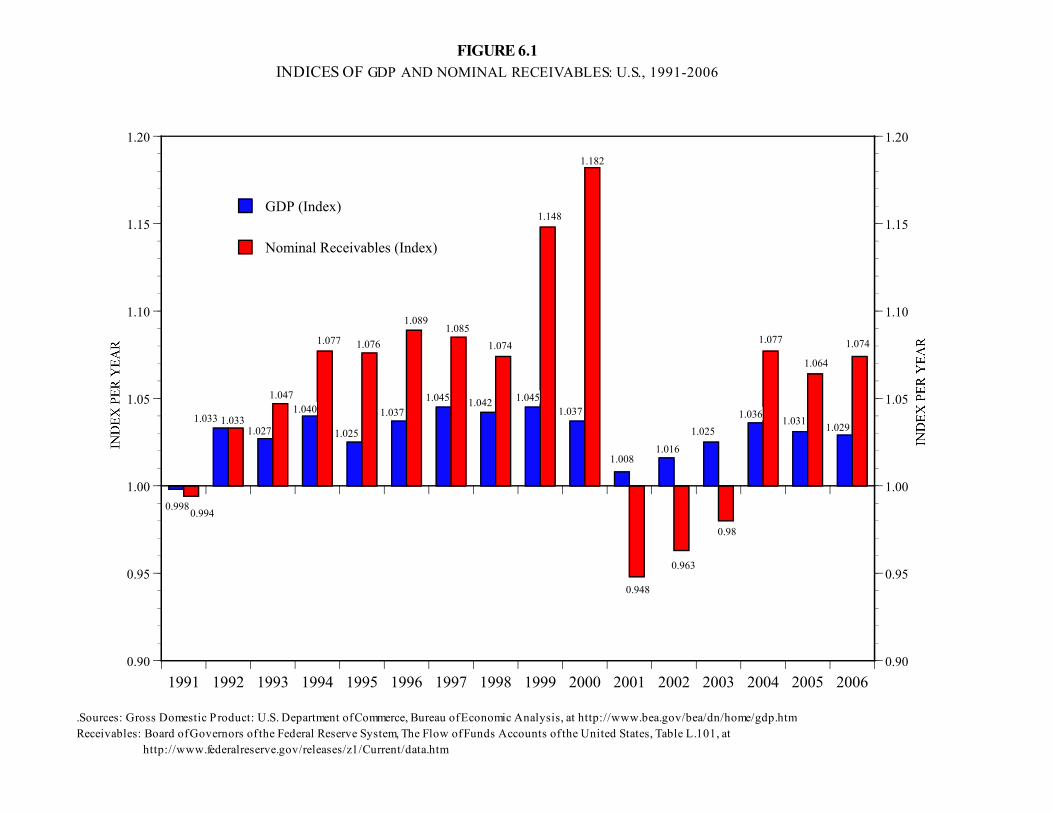
1991 1992 1993 1994 1995 1996 1997 1998 1999 2000 2001 2002 2003 2004 2005 20060.90
0.95
1.00
1.05
1.10
1.15
1.20
0.90
0.95
1.00
1.05
1.10
1.15
1.20
0.9980.994
1.033 1.0331.027
1.0471.040
1.077
1.025
1.076
1.037
1.089
1.045
1.085
1.042
1.074
1.045
1.148
1.037
1.182
1.008
0.948
1.016
0.963
1.025
0.98
1.036
1.077
1.031
1.064
1.029
1.074
GDP (Index)
Nominal Receivables (Index)
FIGURE 6.1INDICES OF GDP AND NOMINAL RECEIVABLES: U.S., 1991-2006
.Sources: Gross Domestic Product: U.S. Department of Commerce, Bureau of Economic Analysis, at http://www.bea.gov/bea/dn/home/gdp.htmReceivables: Board of Governors of the Federal Reserve System, The Flow of Funds Accounts of the United States, Table L.101, at http://www.federalreserve.gov/releases/z1/Current/data.htm
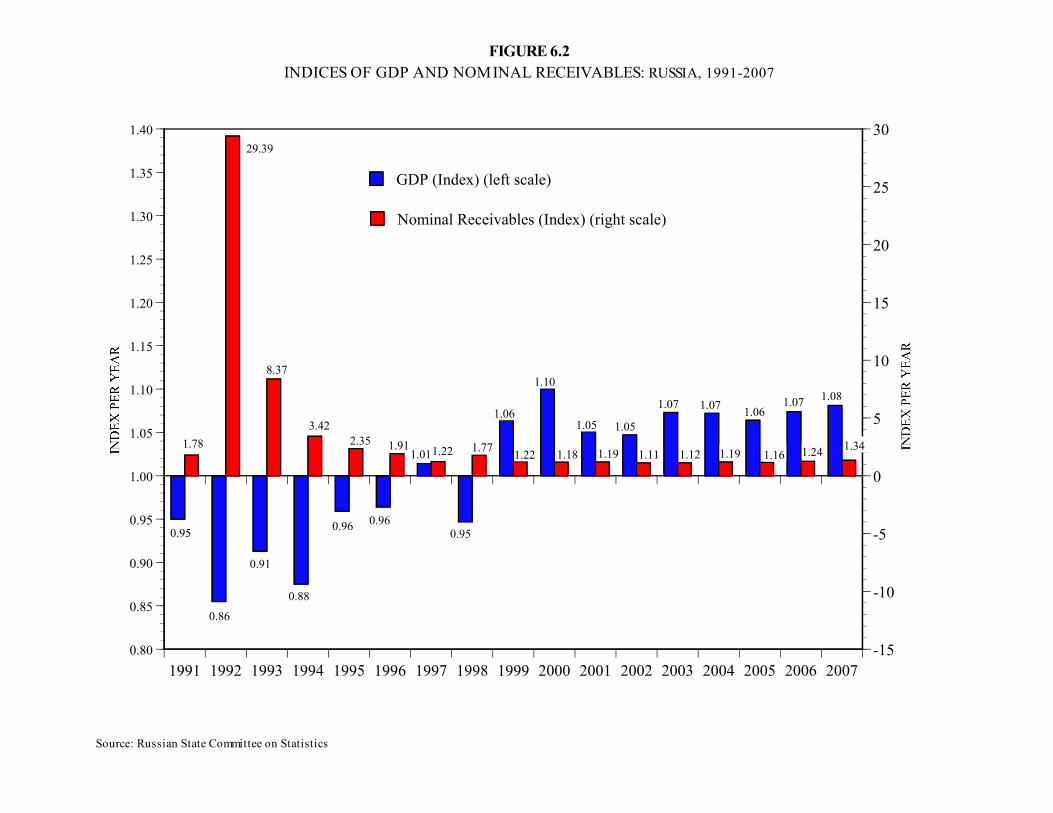
1991 1992 1993 1994 1995 1996 1997 1998 1999 2000 2001 2002 2003 2004 2005 2006 20070.80
0.85
0.90
0.95
1.00
1.05
1.10
1.15
1.20
1.25
1.30
1.35
1.40
-15
-10
-5
0
5
10
15
20
25
30
0.95
0.86
0.91
0.88
0.96 0.96
1.01
0.95
1.06
1.10
1.05 1.05
1.07 1.07 1.061.07 1.08
1.78
29.39
8.37
3.422.35 1.91 1.22 1.77 1.22 1.18 1.19 1.11 1.12 1.19 1.16 1.24 1.34
GDP (Index) (left scale)
Nominal Receivables (Index) (right scale)
Source: Russian State Committee on Statistics
FIGURE 6.2INDICES OF GDP AND NOMINAL RECEIVABLES: RUSSIA, 1991-2007
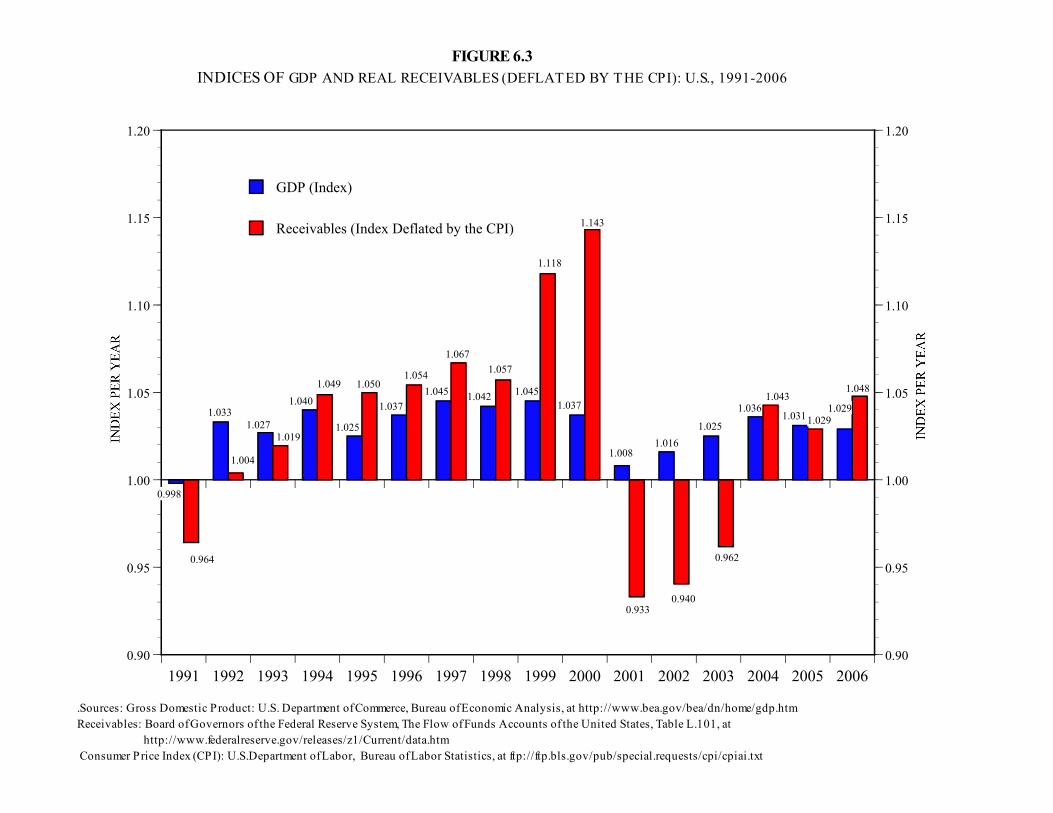
1991 1992 1993 1994 1995 1996 1997 1998 1999 2000 2001 2002 2003 2004 2005 20060.90
0.95
1.00
1.05
1.10
1.15
1.20
0.90
0.95
1.00
1.05
1.10
1.15
1.20
0.998
0.964
1.033
1.004
1.0271.019
1.0401.049
1.025
1.050
1.037
1.0541.045
1.067
1.042
1.057
1.045
1.118
1.037
1.143
1.008
0.933
1.016
0.940
1.025
0.962
1.0361.043
1.0311.0291.029
1.048
GDP (Index)
Receivables (Index Deflated by the CPI)
FIGURE 6.3INDICES OF GDP AND REAL RECEIVABLES (DEFLATED BY THE CPI): U.S., 1991-2006
.Sources: Gross Domestic Product: U.S. Department of Commerce, Bureau of Economic Analysis, at http://www.bea.gov/bea/dn/home/gdp.htmReceivables: Board of Governors of the Federal Reserve System, The Flow of Funds Accounts of the United States, Table L.101, at http://www.federalreserve.gov/releases/z1/Current/data.htm Consumer Price Index (CPI): U.S.Department of Labor, Bureau of Labor Statistics, at ftp://ftp.bls.gov/pub/special.requests/cpi/cpiai.txt
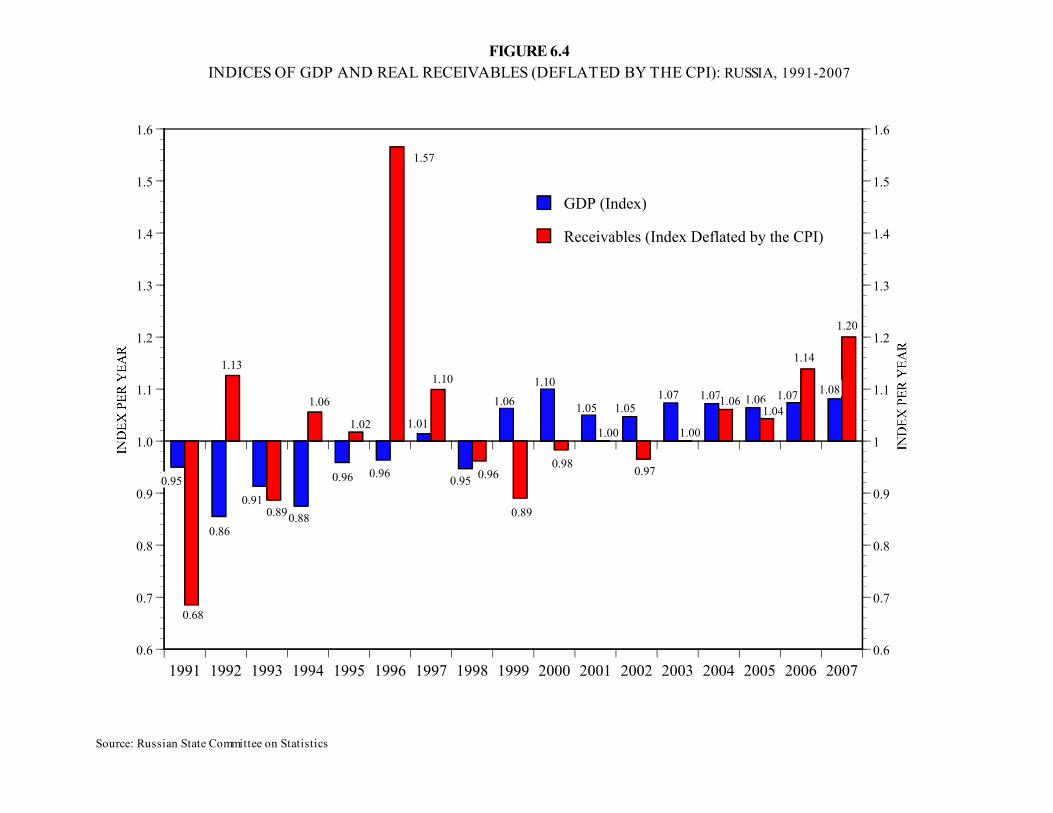
1991 1992 1993 1994 1995 1996 1997 1998 1999 2000 2001 2002 2003 2004 2005 2006 20070.6
0.7
0.8
0.9
1.0
1.1
1.2
1.3
1.4
1.5
1.6
0.6
0.7
0.8
0.9
1
1.1
1.2
1.3
1.4
1.5
1.6
0.95
0.68
0.86
1.13
0.910.890.88
1.06
0.96
1.02
0.96
1.57
1.01
1.10
0.95 0.96
1.06
0.89
1.10
0.98
1.05
1.00
1.05
0.97
1.07
1.00
1.071.06 1.061.04
1.07
1.14
1.08
1.20
GDP (Index)
Receivables (Index Deflated by the CPI)
Source: Russian State Committee on Statistics
FIGURE 6.4INDICES OF GDP AND REAL RECEIVABLES (DEFLATED BY THE CPI): RUSSIA, 1991-2007
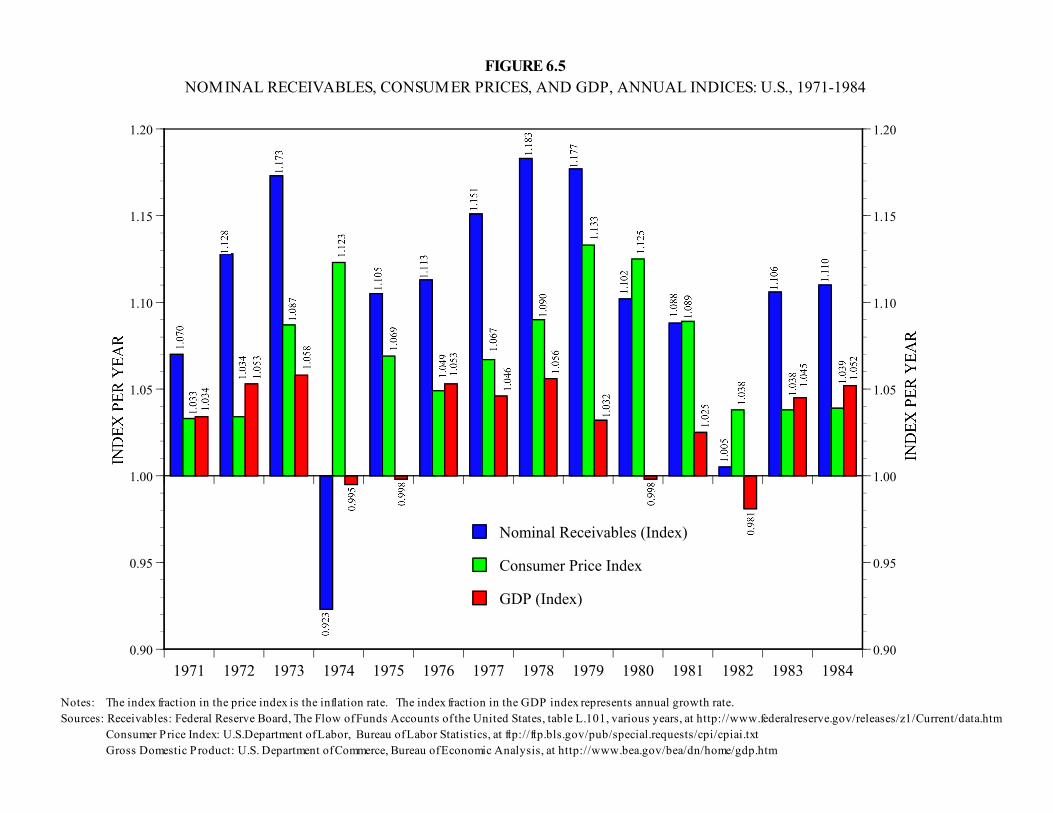
1971 1972 1973 1974 1975 1976 1977 1978 1979 1980 1981 1982 1983 19840.90
0.95
1.00
1.05
1.10
1.15
1.20
0.90
0.95
1.00
1.05
1.10
1.15
1.20
Nominal Receivables (Index)
Consumer Price Index
GDP (Index)
Notes: The index fraction in the price index is the inflation rate. The index fraction in the GDP index represents annual growth rate.Sources: Receivables: Federal Reserve Board, The Flow of Funds Accounts of the United States, table L.101, various years, at http://www.federalreserve.gov/releases/z1/Current/data.htm Consumer Price Index: U.S.Department of Labor, Bureau of Labor Statistics, at ftp://ftp.bls.gov/pub/special.requests/cpi/cpiai.txt Gross Domestic Product: U.S. Department of Commerce, Bureau of Economic Analysis, at http://www.bea.gov/bea/dn/home/gdp.htm
FIGURE 6.5NOMINAL RECEIVABLES, CONSUMER PRICES, AND GDP, ANNUAL INDICES: U.S., 1971-1984
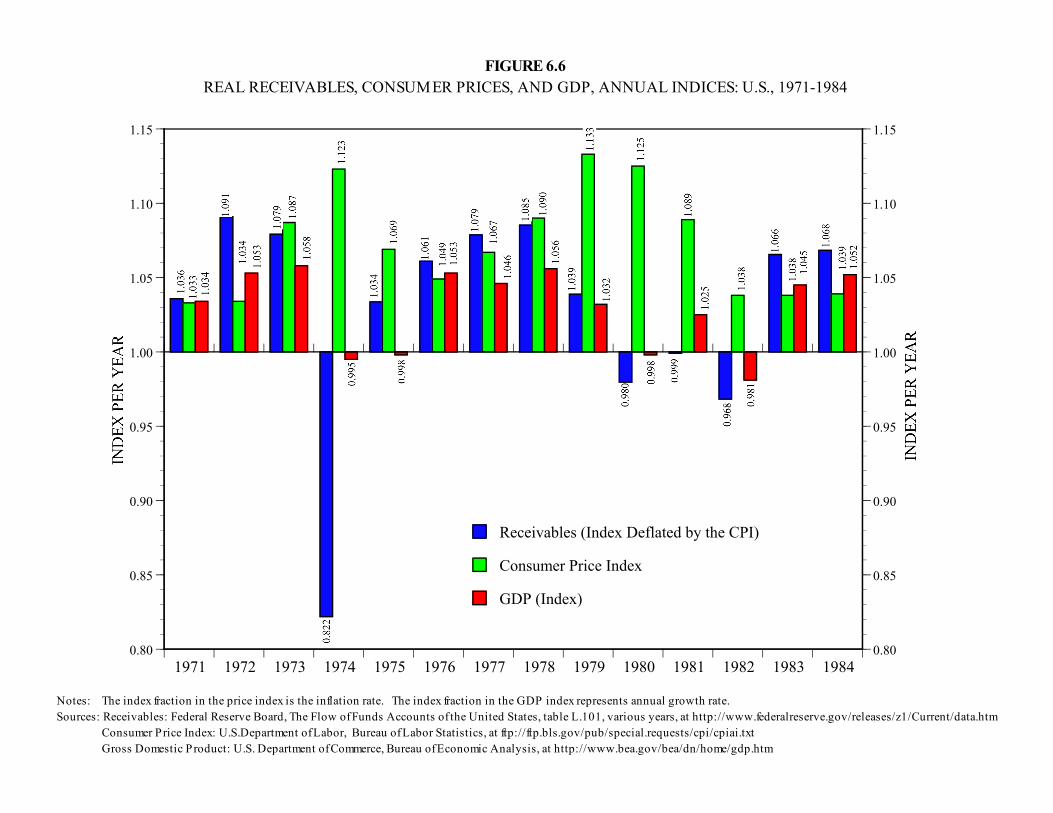
1971 1972 1973 1974 1975 1976 1977 1978 1979 1980 1981 1982 1983 19840.80
0.85
0.90
0.95
1.00
1.05
1.10
1.15
0.80
0.85
0.90
0.95
1.00
1.05
1.10
1.15
Receivables (Index Deflated by the CPI)
Consumer Price Index
GDP (Index)
Notes: The index fraction in the price index is the inflation rate. The index fraction in the GDP index represents annual growth rate.Sources: Receivables: Federal Reserve Board, The Flow of Funds Accounts of the United States, table L.101, various years, at http://www.federalreserve.gov/releases/z1/Current/data.htm Consumer Price Index: U.S.Department of Labor, Bureau of Labor Statistics, at ftp://ftp.bls.gov/pub/special.requests/cpi/cpiai.txt Gross Domestic Product: U.S. Department of Commerce, Bureau of Economic Analysis, at http://www.bea.gov/bea/dn/home/gdp.htm
FIGURE 6.6REAL RECEIVABLES, CONSUMER PRICES, AND GDP, ANNUAL INDICES: U.S., 1971-1984
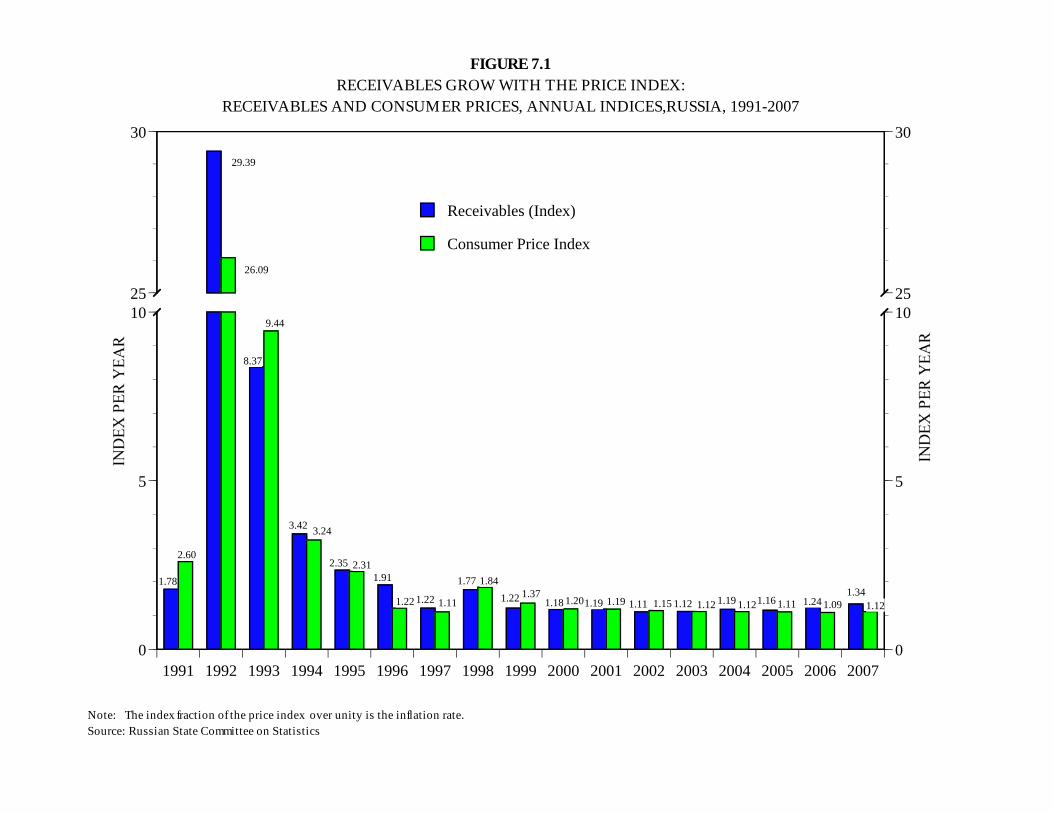
1991 1992 1993 1994 1995 1996 1997 1998 1999 2000 2001 2002 2003 2004 2005 2006 20070
5
1025
30
0
5
1025
30
1.78
2.60
8.37
9.44
3.42 3.24
2.35 2.311.91
1.22 1.22 1.11
1.77 1.841.22 1.37
1.18 1.201.19 1.19 1.11 1.15 1.12 1.12 1.19 1.121.16 1.11 1.24 1.091.34
1.12
29.39
26.09
Receivables (Index)
Consumer Price Index
Note: The index fraction of the price index over unity is the inflation rate.Source: Russian State Committee on Statistics
FIGURE 7.1RECEIVABLES GROW WITH THE PRICE INDEX:
RECEIVABLES AND CONSUMER PRICES, ANNUAL INDICES,RUSSIA, 1991-2007
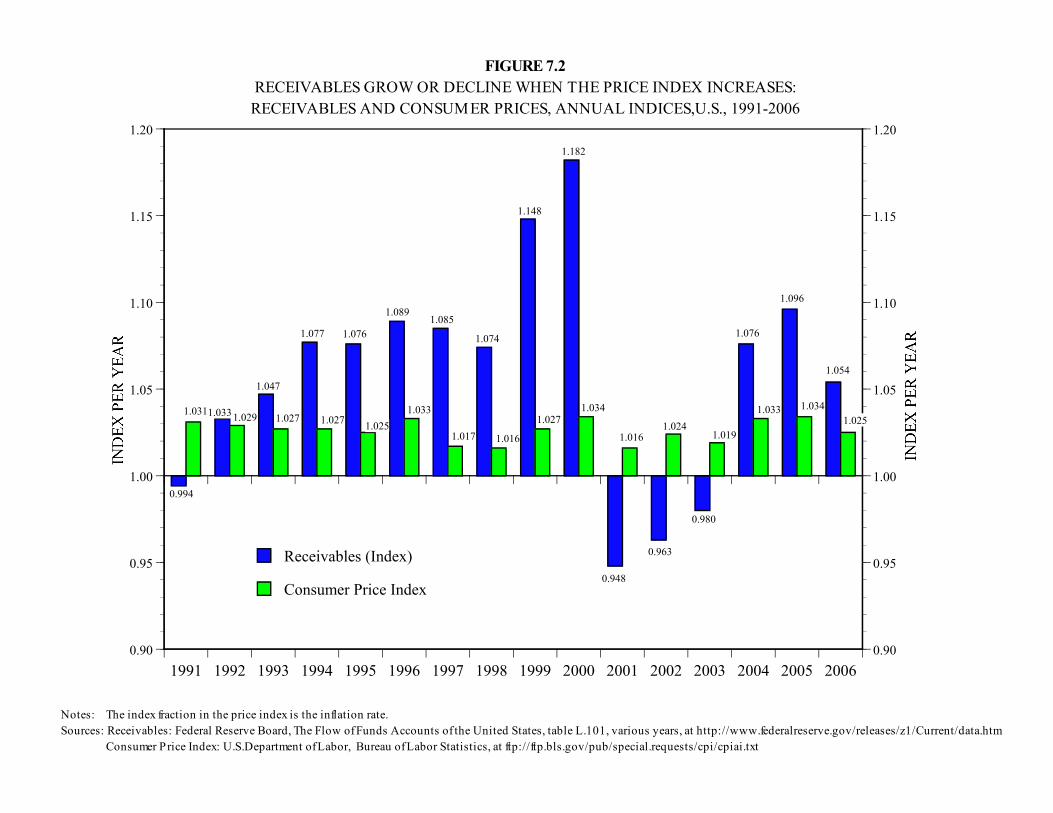
1991 1992 1993 1994 1995 1996 1997 1998 1999 2000 2001 2002 2003 2004 2005 20060.90
0.95
1.00
1.05
1.10
1.15
1.20
0.90
0.95
1.00
1.05
1.10
1.15
1.20
0.994
1.0311.0331.029
1.047
1.027
1.077
1.027
1.076
1.025
1.089
1.033
1.085
1.017
1.074
1.016
1.148
1.027
1.182
1.034
0.948
1.016
0.963
1.024
0.980
1.019
1.076
1.033
1.096
1.034
1.054
1.025
Receivables (Index)
Consumer Price Index
Notes: The index fraction in the price index is the inflation rate.Sources: Receivables: Federal Reserve Board, The Flow of Funds Accounts of the United States, table L.101, various years, at http://www.federalreserve.gov/releases/z1/Current/data.htm Consumer Price Index: U.S.Department of Labor, Bureau of Labor Statistics, at ftp://ftp.bls.gov/pub/special.requests/cpi/cpiai.txt
FIGURE 7.2RECEIVABLES GROW OR DECLINE WHEN THE PRICE INDEX INCREASES:RECEIVABLES AND CONSUMER PRICES, ANNUAL INDICES,U.S., 1991-2006
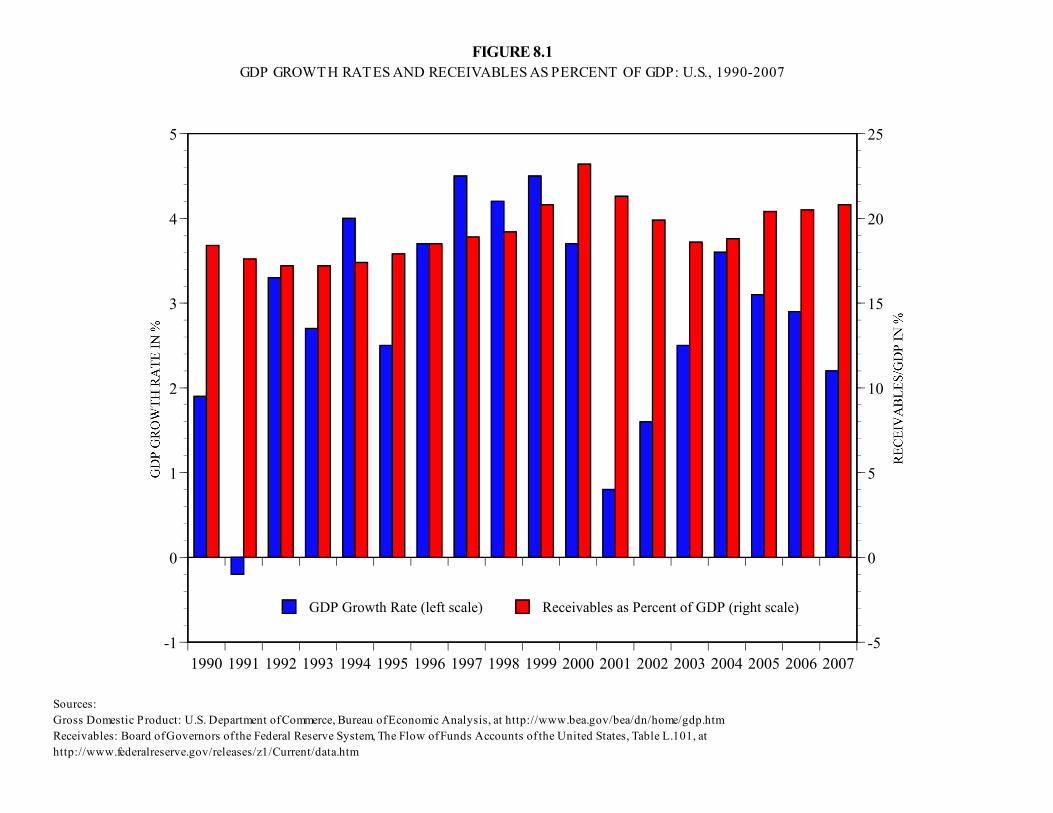
1990 1991 1992 1993 1994 1995 1996 1997 1998 1999 2000 2001 2002 2003 2004 2005 2006 2007-1
0
1
2
3
4
5
-5
0
5
10
15
20
25
GDP Growth Rate (left scale) Receivables as Percent of GDP (right scale)
FIGURE 8.1GDP GROWTH RATES AND RECEIVABLES AS PERCENT OF GDP: U.S., 1990-2007
Sources:Gross Domestic Product: U.S. Department of Commerce, Bureau of Economic Analysis, at http://www.bea.gov/bea/dn/home/gdp.htmReceivables: Board of Governors of the Federal Reserve System, The Flow of Funds Accounts of the United States, Table L.101, athttp://www.federalreserve.gov/releases/z1/Current/data.htm
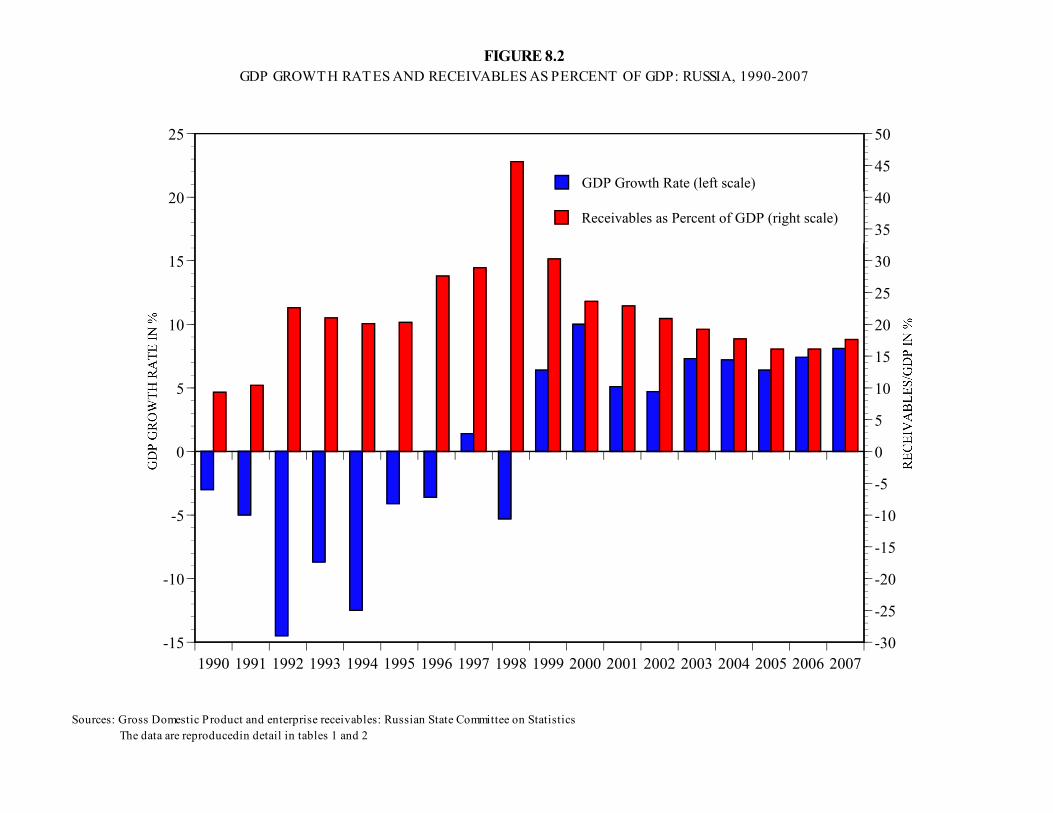
1990 1991 1992 1993 1994 1995 1996 1997 1998 1999 2000 2001 2002 2003 2004 2005 2006 2007-15
-10
-5
0
5
10
15
20
25
-30
-25
-20
-15
-10
-5
0
5
10
15
20
25
30
35
40
45
50
GDP Growth Rate (left scale)
Receivables as Percent of GDP (right scale)
FIGURE 8.2GDP GROWTH RATES AND RECEIVABLES AS PERCENT OF GDP: RUSSIA, 1990-2007
Sources: Gross Domestic Product and enterprise receivables: Russian State Committee on Statistics The data are reproducedin detail in tables 1 and 2

0
100
200
300
400
500
600
0 200 400 600 800 1000 1200 1400RECEIVABLES, BILLION RUBLES
0
200
400
600
800
1000
1200
1400
0 100 200 300 400 500 600MONETARY AGGREGATE M2, BILLION RUBLES
FIGURE 9PANELS 1-3. TAX NON-REMITTANCE, MONEY STOCK, AND RECEIVABLES,
IN BILLION RUBLES, MONTHLY DATA, RUSSIA, 1992--MID-1999
Panel 1. Tax Non-Remittance againstReceivables, 1992--mid-1999
Panel 3. Receivables against the MoneyStock, 1992--mid-1999
1999
1999
0
100
200
300
400
500
600
0 100 200 300 400 500 600TAX NON-REMITTANCE, BILLION RUBLES
Panel 2. Money Stock against Tax Non-Remittance, 1992--mid-1999
Sources: Receiv ables and tax non-remittance: Russian State Committee on Statistics Money : Central Bank of Russia
1999
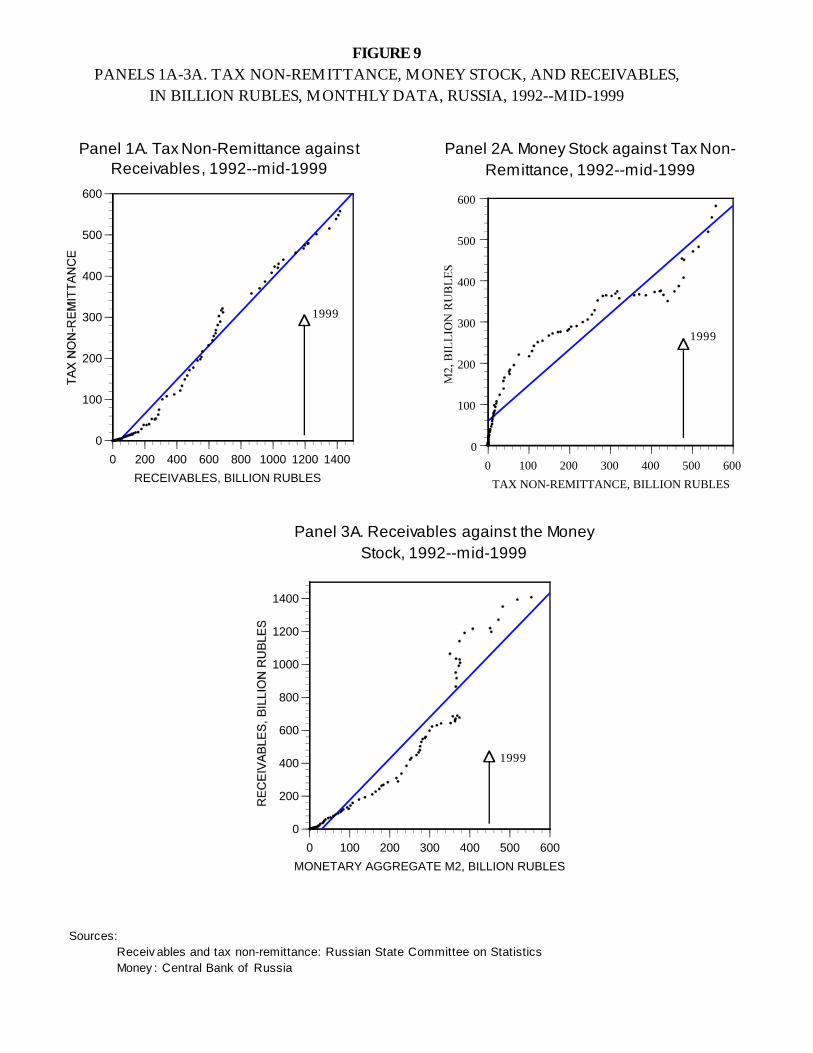
0
100
200
300
400
500
600
0 200 400 600 800 1000 1200 1400RECEIVABLES, BILLION RUBLES
0
200
400
600
800
1000
1200
1400
0 100 200 300 400 500 600MONETARY AGGREGATE M2, BILLION RUBLES
FIGURE 9PANELS 1A-3A. TAX NON-REMITTANCE, MONEY STOCK, AND RECEIVABLES,
IN BILLION RUBLES, MONTHLY DATA, RUSSIA, 1992--MID-1999
Panel 1A. Tax Non-Remittance againstReceivables, 1992--mid-1999
Panel 3A. Receivables against the MoneyStock, 1992--mid-1999
1999
1999
0
100
200
300
400
500
600
0 100 200 300 400 500 600TAX NON-REMITTANCE, BILLION RUBLES
Panel 2A. Money Stock against Tax Non-Remittance, 1992--mid-1999
Sources: Receiv ables and tax non-remittance: Russian State Committee on Statistics Money : Central Bank of Russia
1999
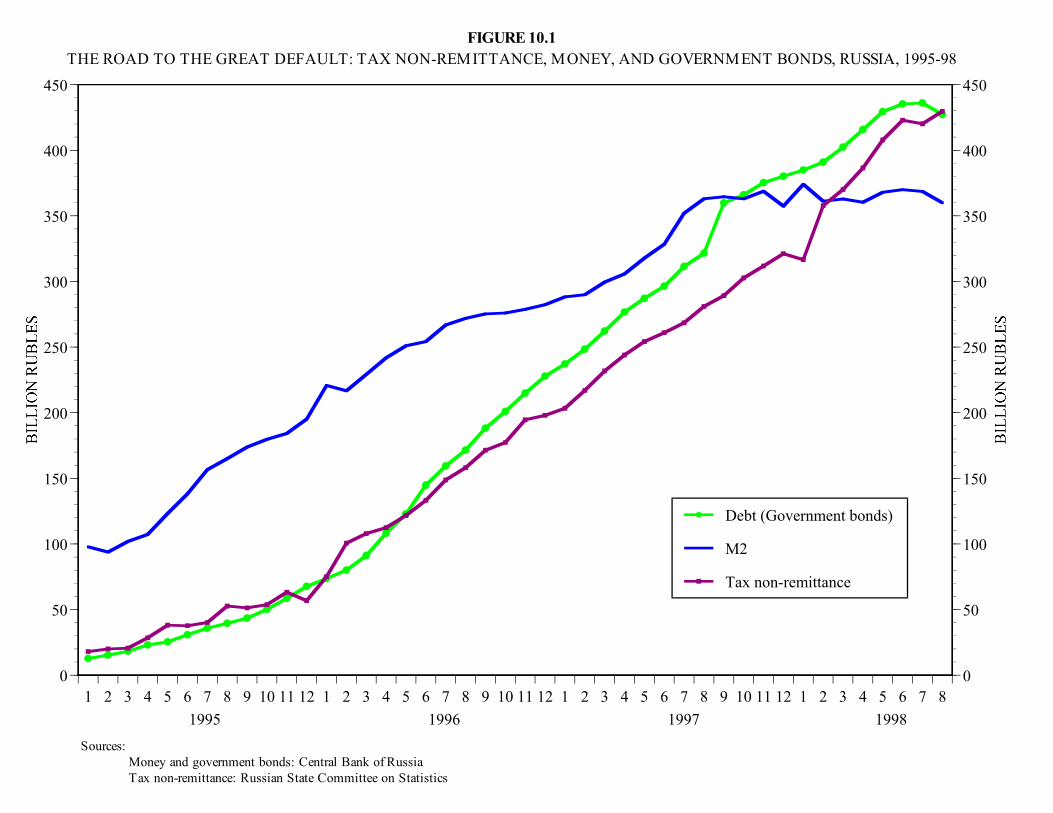
1 2 3 4 5 6 7 8 9 10 11 12 1 2 3 4 5 6 7 8 9 10 11 12 1 2 3 4 5 6 7 8 9 10 11 12 1 2 3 4 5 6 7 80
50
100
150
200
250
300
350
400
450
0
50
100
150
200
250
300
350
400
450
Debt (Government bonds)
M2
Tax non-remittance
1995 1996 1997 1998Sources: Money and government bonds: Central Bank of Russia Tax non-remittance: Russian State Committee on Statistics
FIGURE 10.1THE ROAD TO THE GREAT DEFAULT: TAX NON-REMITTANCE, MONEY, AND GOVERNMENT BONDS, RUSSIA, 1995-98
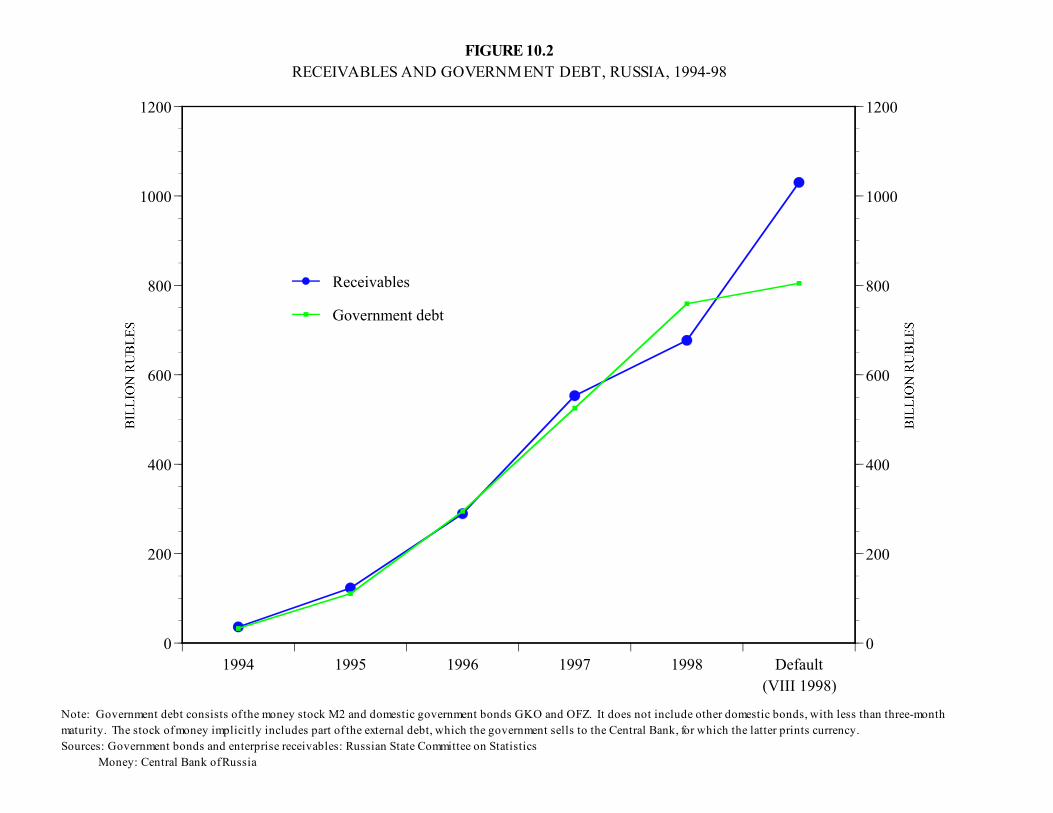
1994 1995 1996 1997 1998 Default(VIII 1998)
0
200
400
600
800
1000
1200
0
200
400
600
800
1000
1200
Receivables
Government debt
Note: Government debt consists of the money stock M2 and domestic government bonds GKO and OFZ. It does not include other domestic bonds, with less than three-monthmaturity. The stock of money implicitly includes part of the external debt, which the government sells to the Central Bank, for which the latter prints currency.Sources: Government bonds and enterprise receivables: Russian State Committee on Statistics Money: Central Bank of Russia
FIGURE 10.2RECEIVABLES AND GOVERNMENT DEBT, RUSSIA, 1994-98
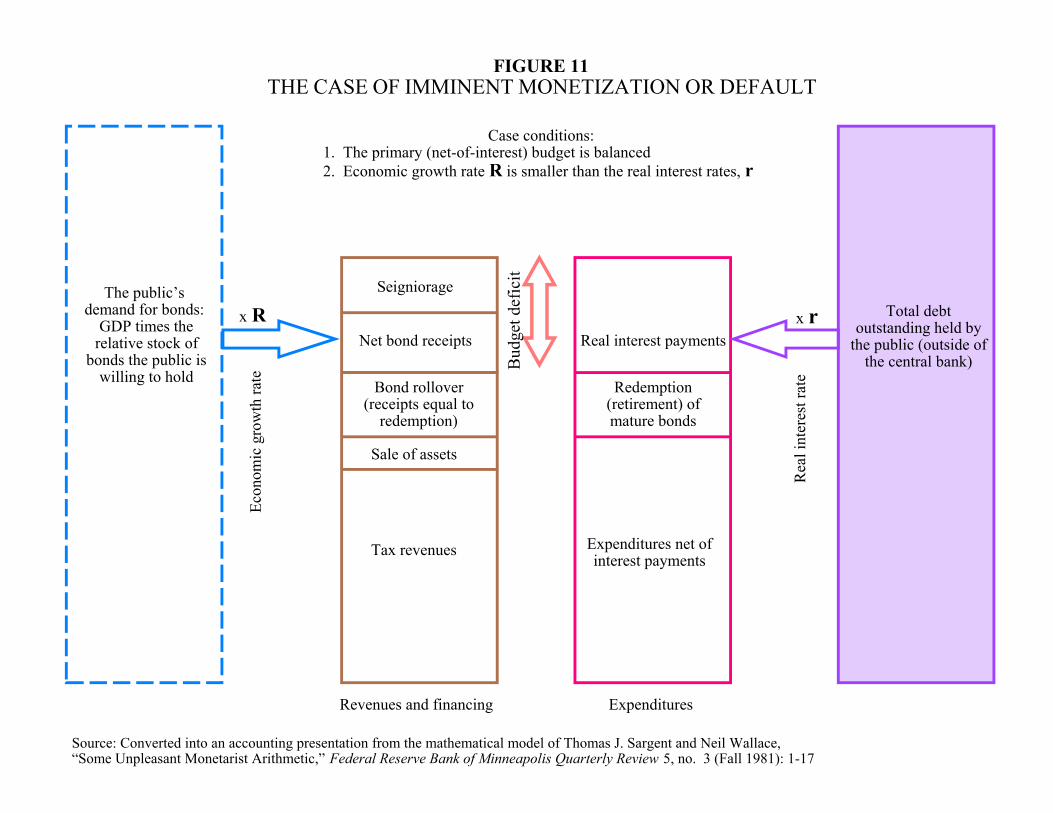
FIGURE 11THE CASE OF IMMINENT MONETIZATION OR DEFAULT
The public’s demand for bonds:
GDP times therelative stock of
bonds the public iswilling to hold
Total debtoutstanding held by
the public (outside ofthe central bank)
Tax revenues
Sale of assets
Bond rollover(receipts equal to
redemption)
Redemption(retirement) ofmature bonds
Net bond receipts Real interest payments
Seigniorage
Expenditures net ofinterest payments
x r
Case conditions:1. The primary (net-of-interest) budget is balanced2. Economic growth rate R is smaller than the real interest rates, r
Revenues and financing Expenditures
Source: Converted into an accounting presentation from the mathematical model of Thomas J. Sargent and Neil Wallace,“Some Unpleasant Monetarist Arithmetic,” Federal Reserve Bank of Minneapolis Quarterly Review 5, no. 3 (Fall 1981): 1-17
x R
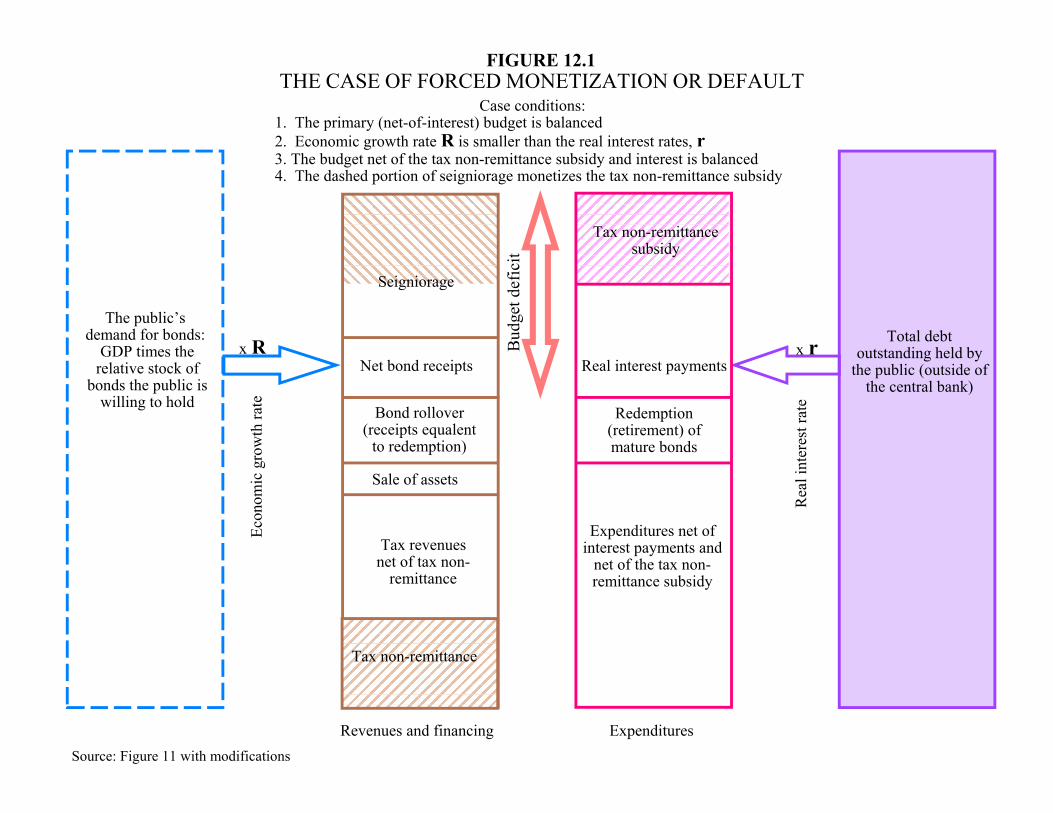
FIGURE 12.1THE CASE OF FORCED MONETIZATION OR DEFAULT
The public’s demand for bonds:
GDP times therelative stock of
bonds the public iswilling to hold
Total debtoutstanding held by
the public (outside ofthe central bank)
Tax revenuesnet of tax non-
remittance
Sale of assets
Bond rollover(receipts equalent
to redemption)
Redemption(retirement) ofmature bonds
Net bond receipts Real interest payments
Seigniorage
Expenditures net ofinterest payments and
net of the tax non-remittance subsidy
x R x r
Case conditions:1. The primary (net-of-interest) budget is balanced2. Economic growth rate R is smaller than the real interest rates, r3. The budget net of the tax non-remittance subsidy and interest is balanced4. The dashed portion of seigniorage monetizes the tax non-remittance subsidy
Revenues and financing ExpendituresSource: Figure 11 with modifications
Tax non-remittance
Tax non-remittancesubsidy
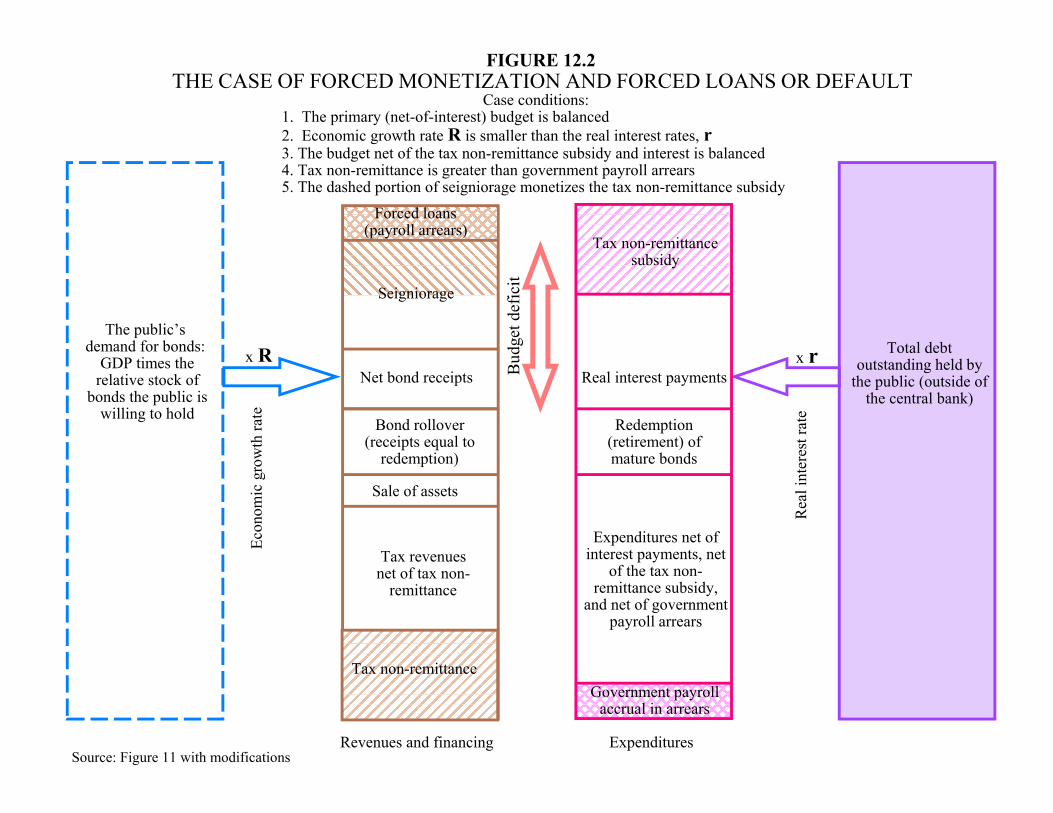
FIGURE 12.2THE CASE OF FORCED MONETIZATION AND FORCED LOANS OR DEFAULT
The public’s demand for bonds:
GDP times therelative stock of
bonds the public iswilling to hold
Total debtoutstanding held by
the public (outside ofthe central bank)
Tax revenuesnet of tax non-
remittance
Sale of assets
Bond rollover(receipts equal to
redemption)
Redemption(retirement) ofmature bonds
Net bond receipts Real interest payments
Seigniorage
Expenditures net ofinterest payments, net
of the tax non-remittance subsidy,
and net of governmentpayroll arrears
x R x r
Case conditions:1. The primary (net-of-interest) budget is balanced2. Economic growth rate R is smaller than the real interest rates, r3. The budget net of the tax non-remittance subsidy and interest is balanced4. Tax non-remittance is greater than government payroll arrears5. The dashed portion of seigniorage monetizes the tax non-remittance subsidy
Revenues and financing Expenditures
Tax non-remittance
Tax non-remittancesubsidy
Government payrollaccrual in arrears
Forced loans(payroll arrears)
Source: Figure 11 with modifications
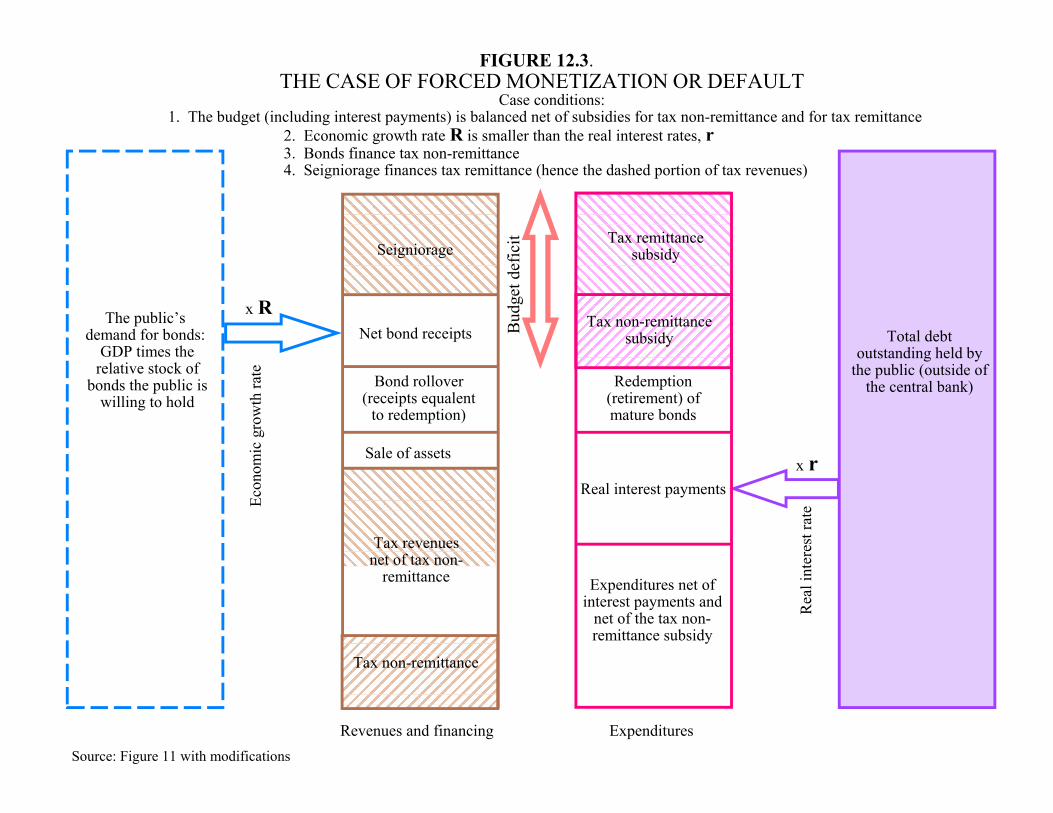
FIGURE 12.3. THE CASE OF FORCED MONETIZATION OR DEFAULT
The public’s demand for bonds:
GDP times therelative stock of
bonds the public iswilling to hold
Total debtoutstanding held by
the public (outside ofthe central bank)
Tax revenuesnet of tax non-
remittance
Sale of assets
Bond rollover(receipts equalent
to redemption)
Redemption(retirement) ofmature bonds
Net bond receipts
Real interest payments
Seigniorage
Expenditures net ofinterest payments and
net of the tax non-remittance subsidy
x R
x r
Case conditions:1. The budget (including interest payments) is balanced net of subsidies for tax non-remittance and for tax remittance 2. Economic growth rate R is smaller than the real interest rates, r 3. Bonds finance tax non-remittance 4. Seigniorage finances tax remittance (hence the dashed portion of tax revenues)
Revenues and financing ExpendituresSource: Figure 11 with modifications
Tax non-remittance
Tax non-remittancesubsidy
Tax remittancesubsidy
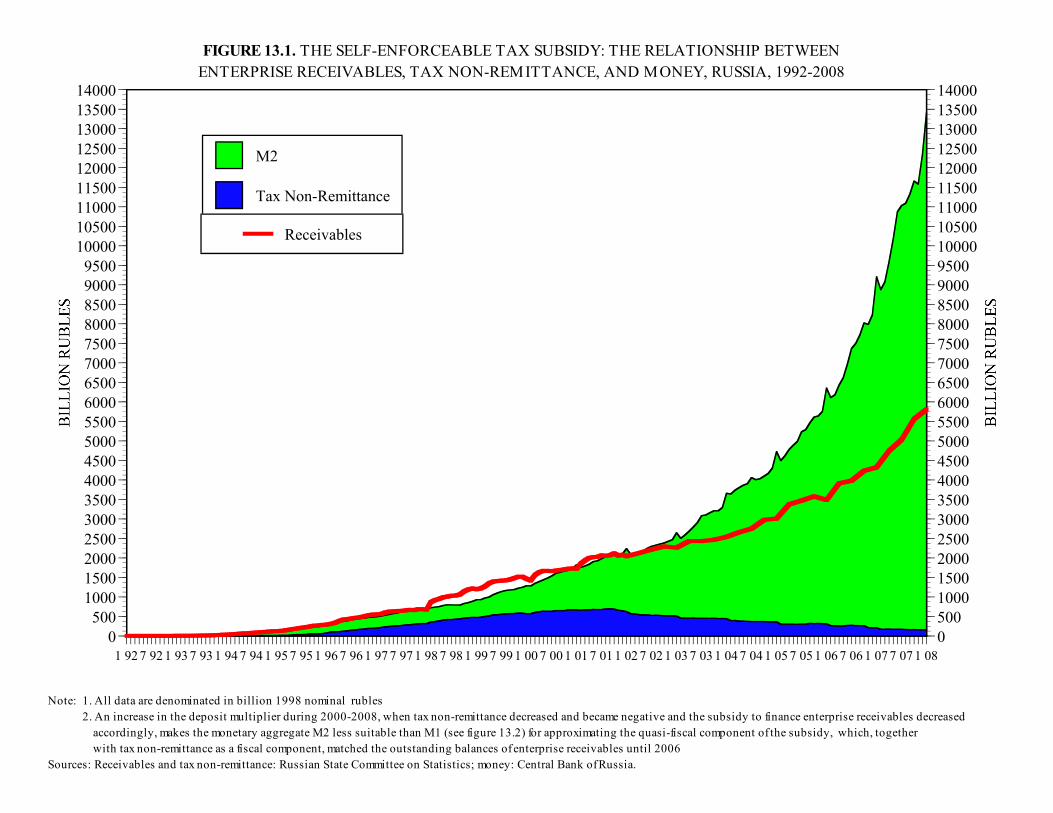
1 92 7 92 1 93 7 93 1 94 7 94 1 95 7 95 1 96 7 96 1 97 7 97 1 98 7 98 1 99 7 99 1 00 7 00 1 01 7 01 1 02 7 02 1 03 7 03 1 04 7 04 1 05 7 05 1 06 7 06 1 07 7 07 1 080
500100015002000250030003500400045005000550060006500700075008000850090009500
100001050011000115001200012500130001350014000
0500100015002000250030003500400045005000550060006500700075008000850090009500100001050011000115001200012500130001350014000
Tax Non-Remittance
M2
Receivables
Note: 1. All data are denominated in billion 1998 nominal rubles 2. An increase in the deposit multiplier during 2000-2008, when tax non-remittance decreased and became negative and the subsidy to finance enterprise receivables decreased accordingly, makes the monetary aggregate M2 less suitable than M1 (see figure 13.2) for approximating the quasi-fiscal component of the subsidy, which, together with tax non-remittance as a fiscal component, matched the outstanding balances of enterprise receivables until 2006Sources: Receivables and tax non-remittance: Russian State Committee on Statistics; money: Central Bank of Russia.
FIGURE 13.1. THE SELF-ENFORCEABLE TAX SUBSIDY: THE RELATIONSHIP BETWEENENTERPRISE RECEIVABLES, TAX NON-REMITTANCE, AND MONEY, RUSSIA, 1992-2008
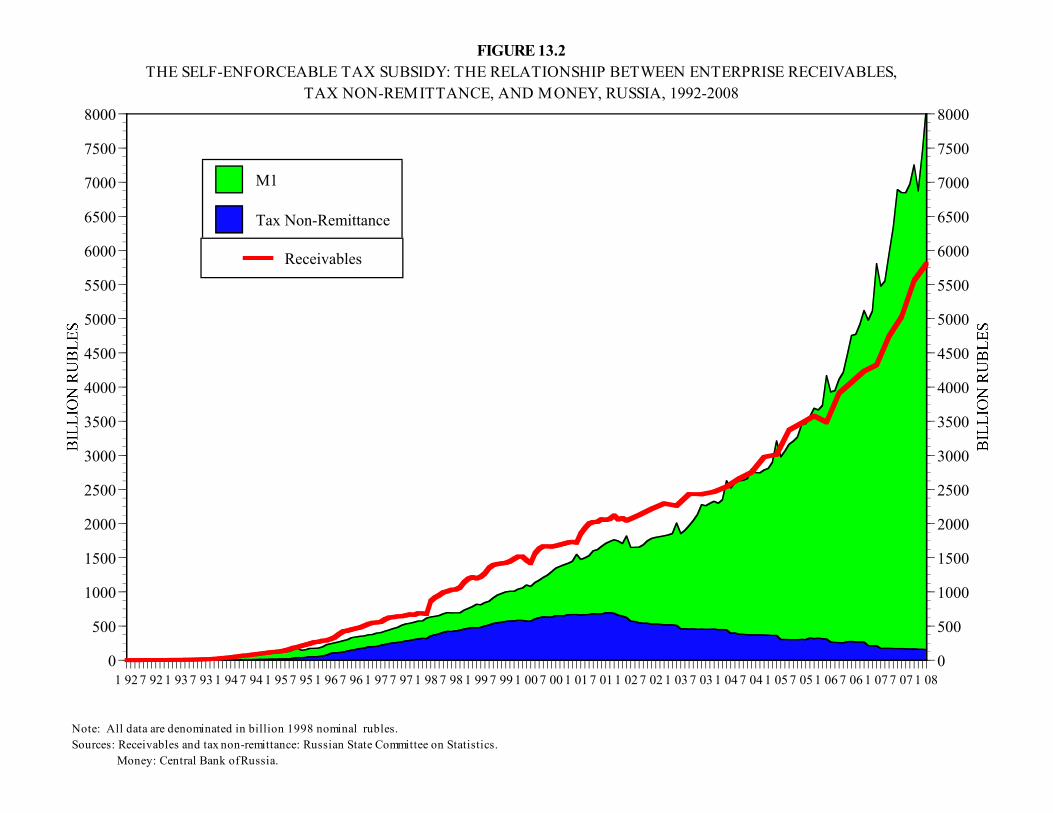
1 92 7 92 1 93 7 93 1 94 7 94 1 95 7 95 1 96 7 96 1 97 7 97 1 98 7 98 1 99 7 99 1 00 7 00 1 01 7 01 1 02 7 02 1 03 7 03 1 04 7 04 1 05 7 05 1 06 7 06 1 07 7 07 1 080
500
1000
1500
2000
2500
3000
3500
4000
4500
5000
5500
6000
6500
7000
7500
8000
0
500
1000
1500
2000
2500
3000
3500
4000
4500
5000
5500
6000
6500
7000
7500
8000
Tax Non-Remittance
M1
Receivables
Note: All data are denominated in billion 1998 nominal rubles.Sources: Receivables and tax non-remittance: Russian State Committee on Statistics. Money: Central Bank of Russia.
FIGURE 13.2THE SELF-ENFORCEABLE TAX SUBSIDY: THE RELATIONSHIP BETWEEN ENTERPRISE RECEIVABLES,
TAX NON-REMITTANCE, AND MONEY, RUSSIA, 1992-2008
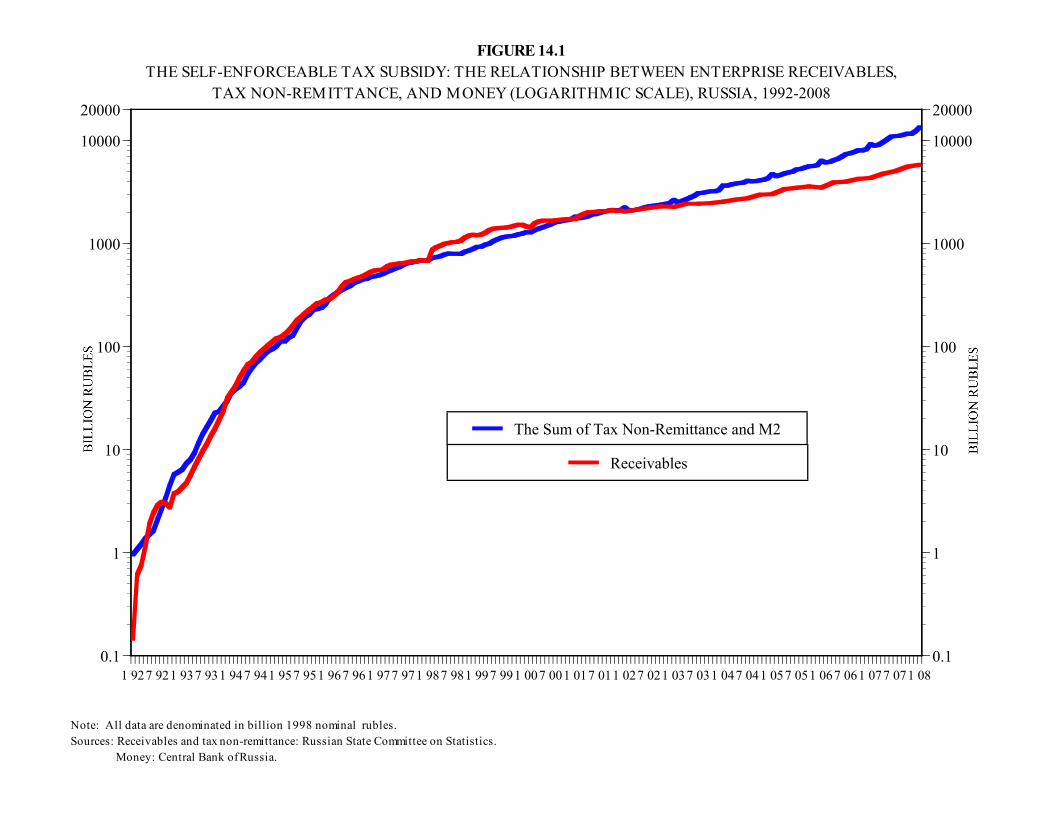
1 927 921 937 931 947 941 957 951 967 961 977 971 987 981 997 991 007 001 017 011 027 021 037 031 047 041 057 051 067 061 077 071 080.1
1
10
100
1000
10000
20000
0.1
1
10
100
1000
10000
20000
The Sum of Tax Non-Remittance and M2
Receivables
Note: All data are denominated in billion 1998 nominal rubles.Sources: Receivables and tax non-remittance: Russian State Committee on Statistics. Money: Central Bank of Russia.
FIGURE 14.1THE SELF-ENFORCEABLE TAX SUBSIDY: THE RELATIONSHIP BETWEEN ENTERPRISE RECEIVABLES,
TAX NON-REMITTANCE, AND MONEY (LOGARITHMIC SCALE), RUSSIA, 1992-2008
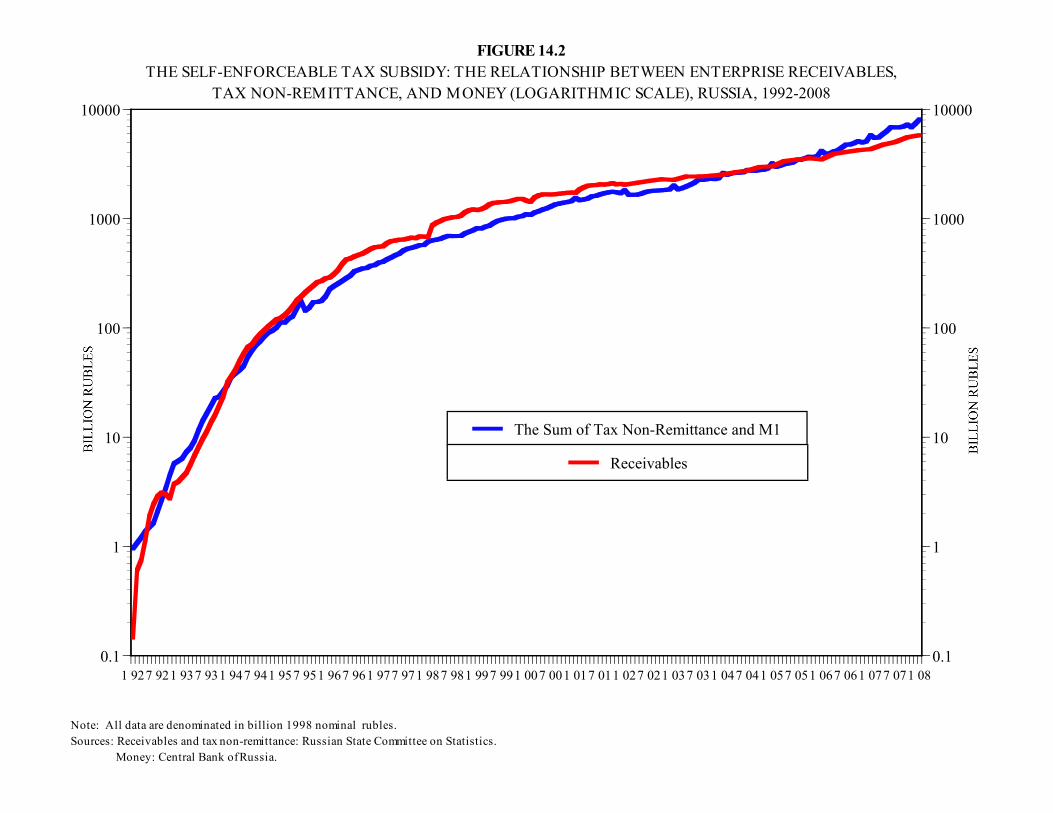
1 927 921 937 931 947 941 957 951 967 961 977 971 987 981 997 991 007 001 017 011 027 021 037 031 047 041 057 051 067 061 077 071 080.1
1
10
100
1000
10000
0.1
1
10
100
1000
10000
The Sum of Tax Non-Remittance and M1
Receivables
Note: All data are denominated in billion 1998 nominal rubles.Sources: Receivables and tax non-remittance: Russian State Committee on Statistics. Money: Central Bank of Russia.
FIGURE 14.2THE SELF-ENFORCEABLE TAX SUBSIDY: THE RELATIONSHIP BETWEEN ENTERPRISE RECEIVABLES,
TAX NON-REMITTANCE, AND MONEY (LOGARITHMIC SCALE), RUSSIA, 1992-2008
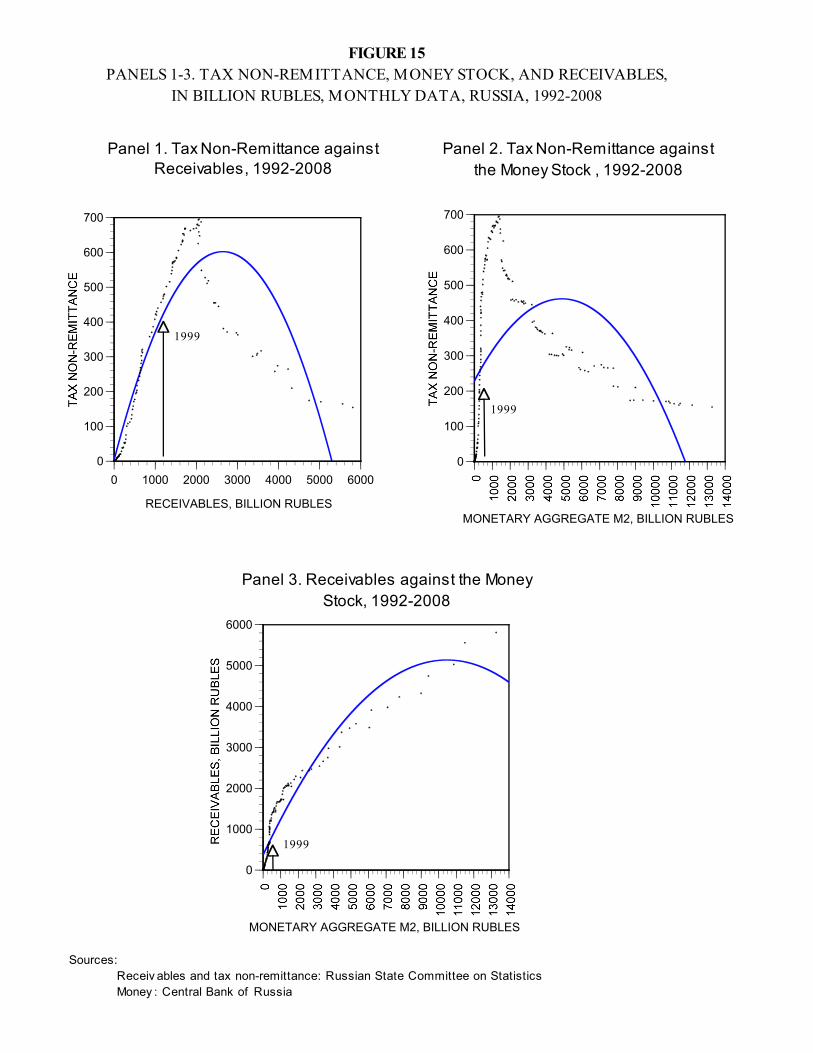
0
100
200
300
400
500
600
700
0 1000 2000 3000 4000 5000 6000
RECEIVABLES, BILLION RUBLES
0
100
200
300
400
500
600
700
MONETARY AGGREGATE M2, BILLION RUBLES
FIGURE 15PANELS 1-3. TAX NON-REMITTANCE, MONEY STOCK, AND RECEIVABLES,
IN BILLION RUBLES, MONTHLY DATA, RUSSIA, 1992-2008
Panel 1. Tax Non-Remittance againstReceivables, 1992-2008
Panel 2. Tax Non-Remittance againstthe Money Stock , 1992-2008
Sources: Receiv ables and tax non-remittance: Russian State Committee on Statistics Money : Central Bank of Russia
0
1000
2000
3000
4000
5000
6000
MONETARY AGGREGATE M2, BILLION RUBLES
Panel 3. Receivables against the MoneyStock, 1992-2008
1999
1999
1999
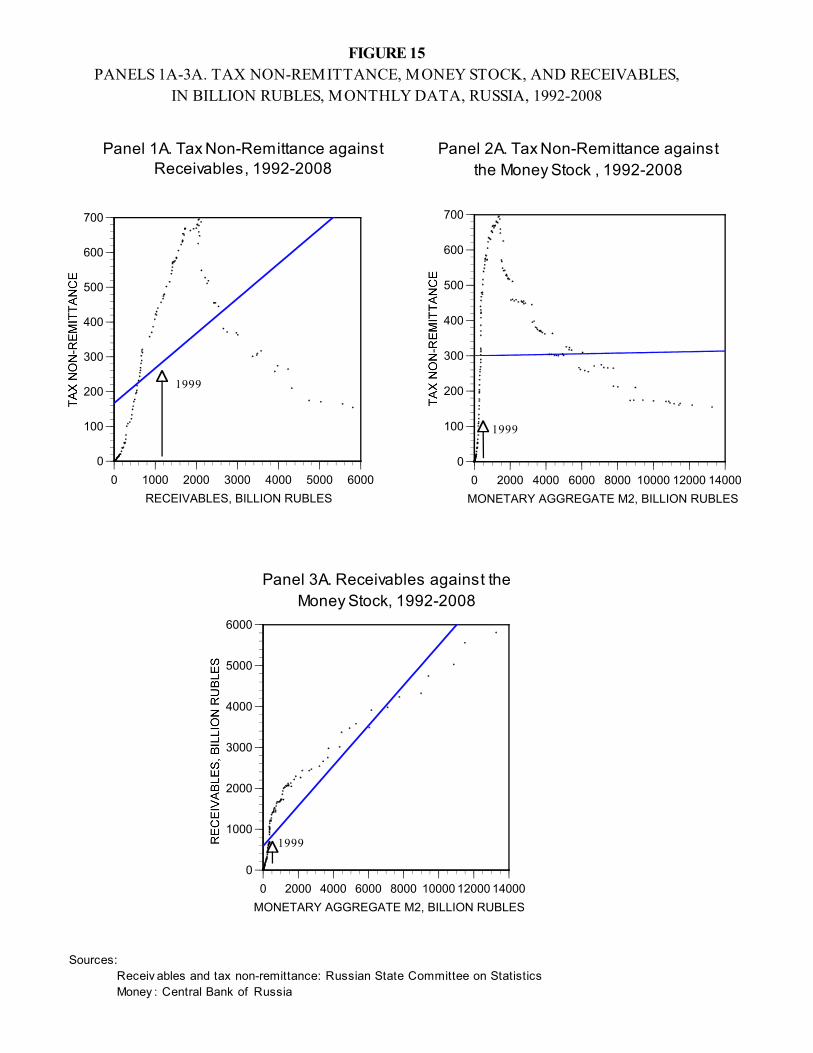
0
100
200
300
400
500
600
700
0 1000 2000 3000 4000 5000 6000RECEIVABLES, BILLION RUBLES
0
100
200
300
400
500
600
700
0 2000 4000 6000 8000 10000 12000 14000MONETARY AGGREGATE M2, BILLION RUBLES
FIGURE 15PANELS 1A-3A. TAX NON-REMITTANCE, MONEY STOCK, AND RECEIVABLES,
IN BILLION RUBLES, MONTHLY DATA, RUSSIA, 1992-2008
Panel 1A. Tax Non-Remittance againstReceivables, 1992-2008
Panel 2A. Tax Non-Remittance againstthe Money Stock , 1992-2008
Sources: Receiv ables and tax non-remittance: Russian State Committee on Statistics Money : Central Bank of Russia
0
1000
2000
3000
4000
5000
6000
0 2000 4000 6000 8000 10000 12000 14000MONETARY AGGREGATE M2, BILLION RUBLES
Panel 3A. Receivables against theMoney Stock, 1992-2008
1999
1999
1999
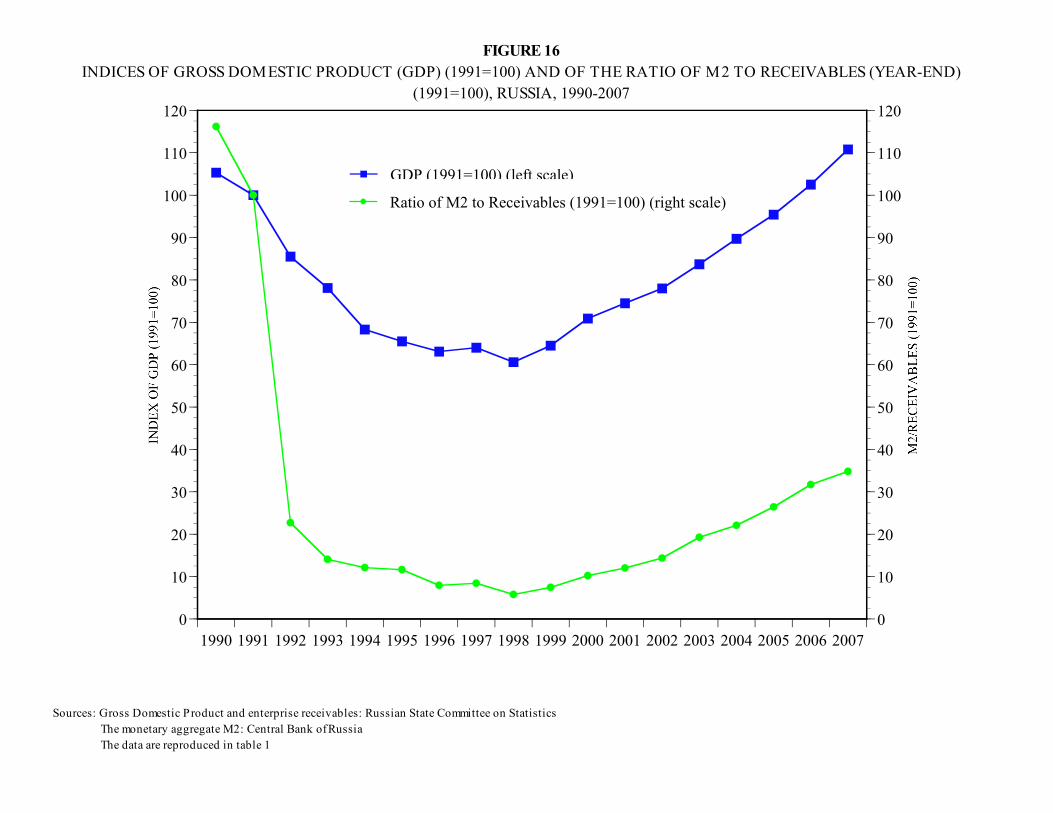
1990 1991 1992 1993 1994 1995 1996 1997 1998 1999 2000 2001 2002 2003 2004 2005 2006 20070
10
20
30
40
50
60
70
80
90
100
110
120
0
10
20
30
40
50
60
70
80
90
100
110
120
GDP (1991=100) (left scale)
Ratio of M2 to Receivables (1991=100) (right scale)
FIGURE 16INDICES OF GROSS DOMESTIC PRODUCT (GDP) (1991=100) AND OF THE RATIO OF M2 TO RECEIVABLES (YEAR-END)
(1991=100), RUSSIA, 1990-2007
Sources: Gross Domestic Product and enterprise receivables: Russian State Committee on Statistics The monetary aggregate M2: Central Bank of Russia The data are reproduced in table 1
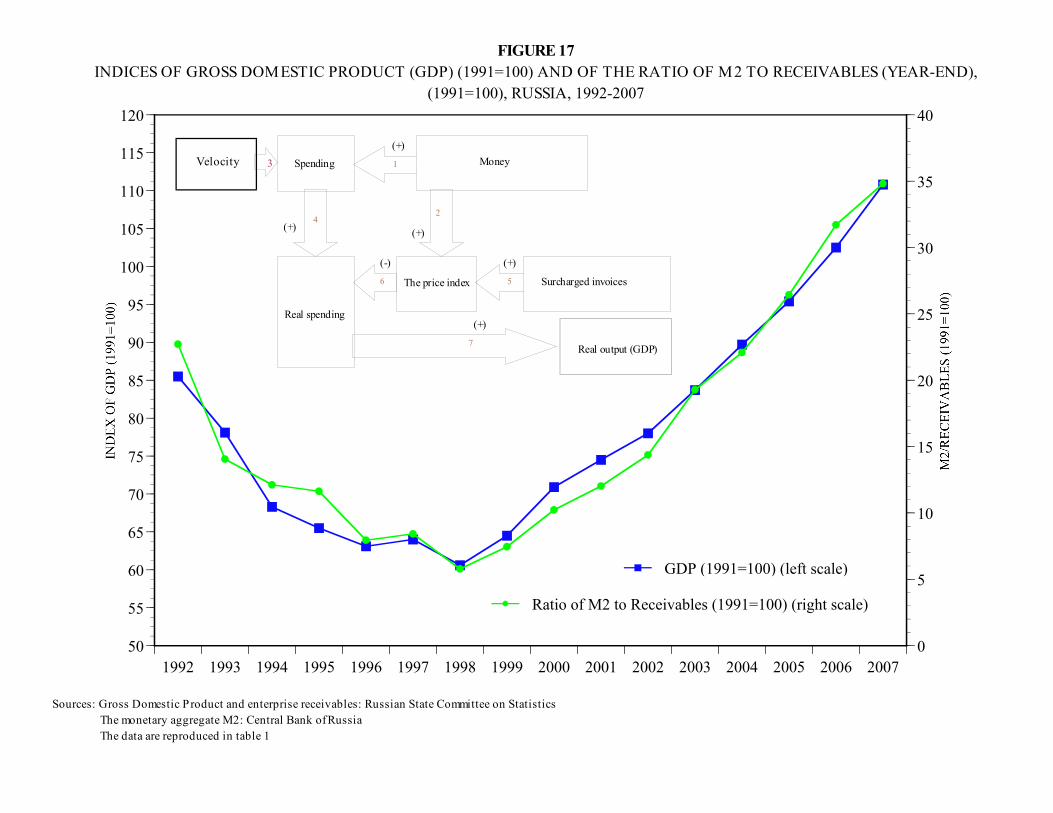
1992 1993 1994 1995 1996 1997 1998 1999 2000 2001 2002 2003 2004 2005 2006 200750
55
60
65
70
75
80
85
90
95
100
105
110
115
120
0
5
10
15
20
25
30
35
40
GDP (1991=100) (left scale)
Ratio of M2 to Receivables (1991=100) (right scale)
FIGURE 17INDICES OF GROSS DOMESTIC PRODUCT (GDP) (1991=100) AND OF THE RATIO OF M2 TO RECEIVABLES (YEAR-END),
(1991=100), RUSSIA, 1992-2007
Sources: Gross Domestic Product and enterprise receivables: Russian State Committee on Statistics The monetary aggregate M2: Central Bank of Russia The data are reproduced in table 1
Money
Real output (GDP)
(+)
(+)
Spending
(+)(+)
The price index
(-)
Surcharged invoices
1
5
24
6
Real spending
7
(+)Velocity 3
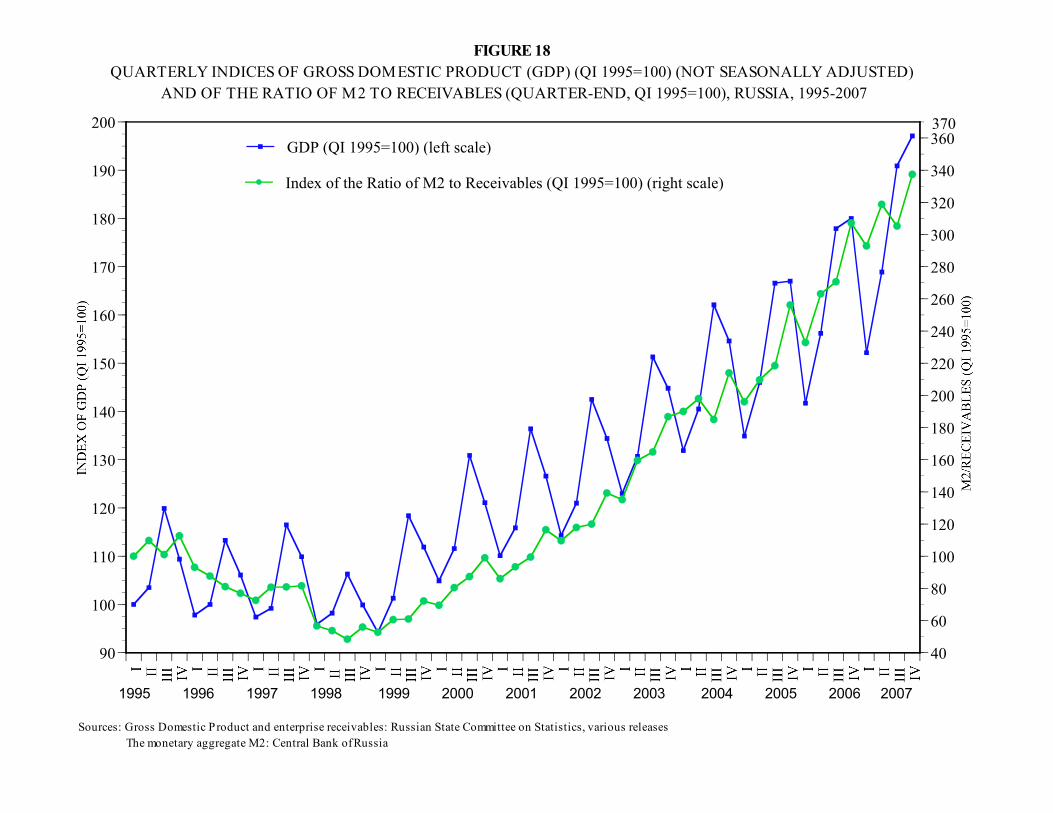
90
100
110
120
130
140
150
160
170
180
190
200
40
60
80
100
120
140
160
180
200
220
240
260
280
300
320
340
360GDP (QI 1995=100) (left scale)
Index of the Ratio of M2 to Receivables (QI 1995=100) (right scale)
FIGURE 18QUARTERLY INDICES OF GROSS DOMESTIC PRODUCT (GDP) (QI 1995=100) (NOT SEASONALLY ADJUSTED)
AND OF THE RATIO OF M2 TO RECEIVABLES (QUARTER-END, QI 1995=100), RUSSIA, 1995-2007
Sources: Gross Domestic Product and enterprise receivables: Russian State Committee on Statistics, various releases The monetary aggregate M2: Central Bank of Russia
1995 1996 1997 1998 1999 2000 2001 2002 2003 2004 2005 2006 2007
370
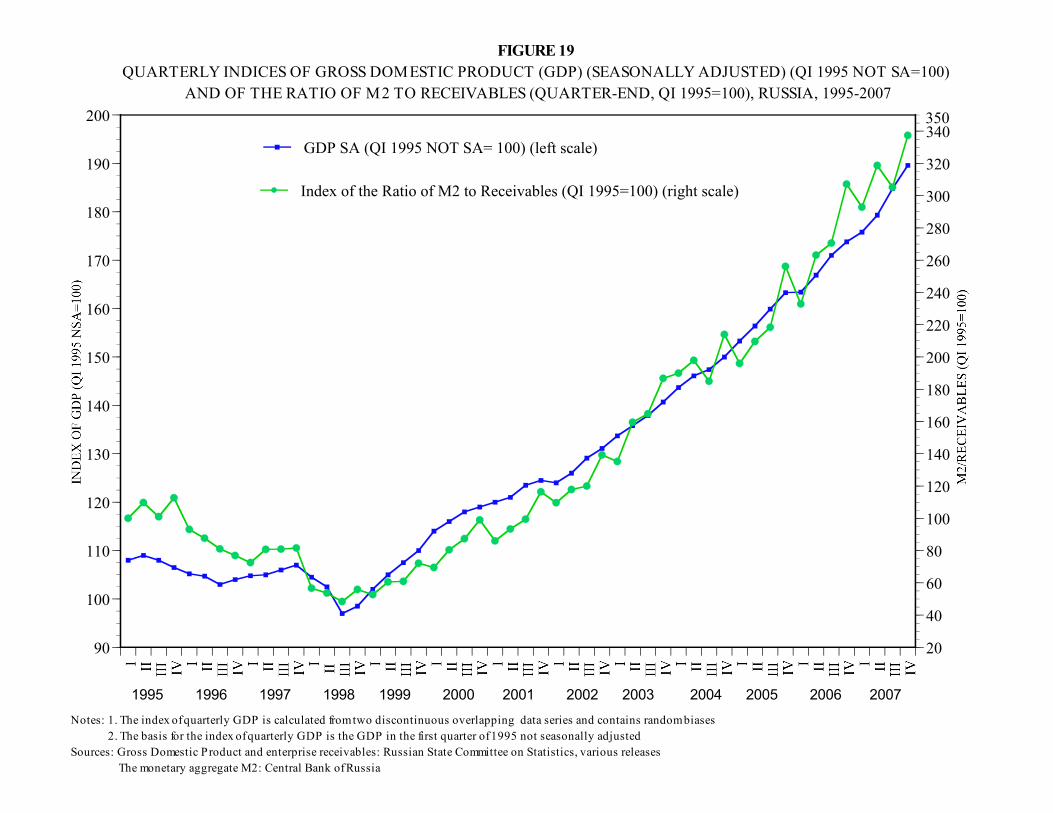
90
100
110
120
130
140
150
160
170
180
190
200
20
40
60
80
100
120
140
160
180
200
220
240
260
280
300
320
340GDP SA (QI 1995 NOT SA= 100) (left scale)
Index of the Ratio of M2 to Receivables (QI 1995=100) (right scale)
FIGURE 19QUARTERLY INDICES OF GROSS DOMESTIC PRODUCT (GDP) (SEASONALLY ADJUSTED) (QI 1995 NOT SA=100)
AND OF THE RATIO OF M2 TO RECEIVABLES (QUARTER-END, QI 1995=100), RUSSIA, 1995-2007
Notes: 1. The index of quarterly GDP is calculated from two discontinuous overlapping data series and contains random biases 2. The basis for the index of quarterly GDP is the GDP in the first quarter of 1995 not seasonally adjustedSources: Gross Domestic Product and enterprise receivables: Russian State Committee on Statistics, various releases The monetary aggregate M2: Central Bank of Russia
1995 1996 1997 1998 1999 2000 2001 2002 2003 2004 2005 2006 2007
350
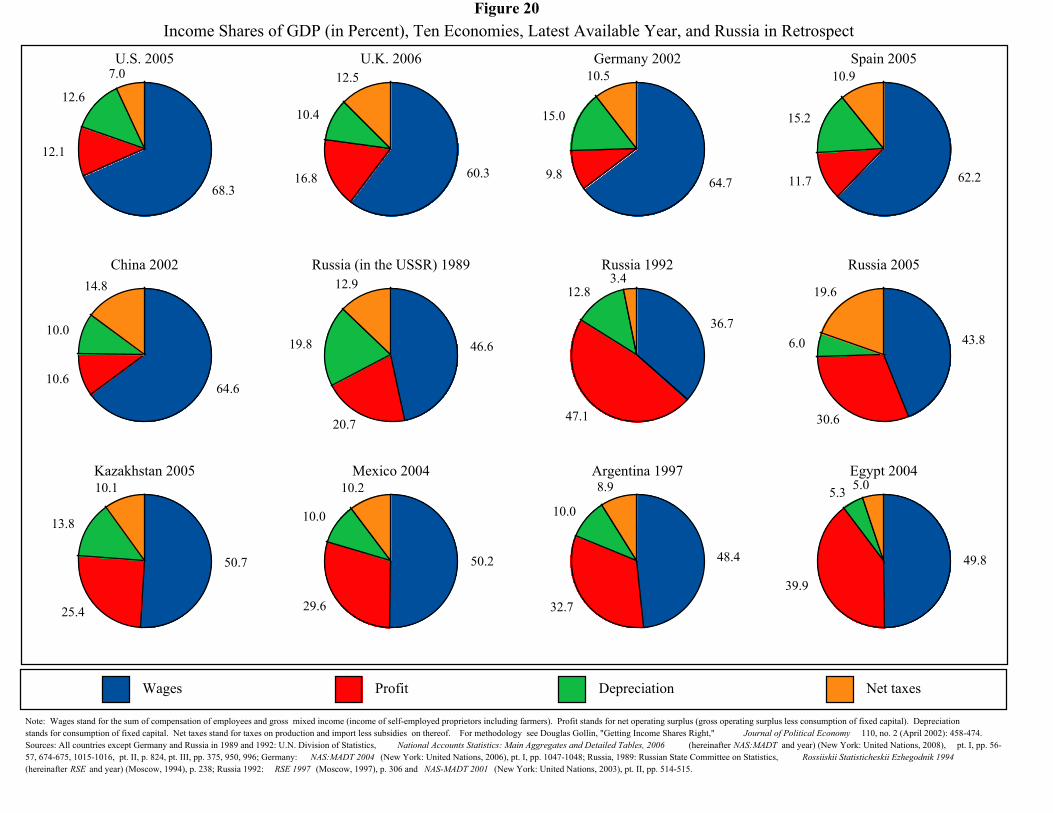
68.3
12.1
12.6
7.0
64.610.6
10.0
14.8
50.7
25.4
13.8
10.1
60.316.8
10.4
12.5
46.6
20.7
19.8
12.9
50.2
29.6
10.0
10.2
64.79.8
15.0
10.5
36.7
47.1
12.83.4
48.4
32.7
10.0
8.9
62.211.7
15.2
10.9
43.8
30.6
6.0
19.6
49.8
39.9
5.3 5.0
U.S. 2005
China 2002
Kazakhstan 2005
U.K. 2006
Russia (in the USSR) 1989
Mexico 2004
Germany 2002
Russia 1992
Argentina 1997
Spain 2005
Russia 2005
Egypt 2004
Wages Profit Depreciation Net taxes
Figure 20Income Shares of GDP (in Percent), Ten Economies, Latest Available Year, and Russia in Retrospect
Note: Wages stand for the sum of compensation of employees and gross mixed income (income of self-employed proprietors including farmers). Profit stands for net operating surplus (gross operating surplus less consumption of fixed capital). Depreciationstands for consumption of fixed capital. Net taxes stand for taxes on production and import less subsidies on thereof. For methodology see Douglas Gollin, "Getting Income Shares Right," Journal of Political Economy 110, no. 2 (April 2002): 458-474.Sources: All countries except Germany and Russia in 1989 and 1992: U.N. Division of Statistics, National Accounts Statistics: Main Aggregates and Detailed Tables, 2006 (hereinafter NAS:MADT and year) (New York: United Nations, 2008), pt. I, pp. 56-57, 674-675, 1015-1016, pt. II, p. 824, pt. III, pp. 375, 950, 996; Germany: NAS:MADT 2004 (New York: United Nations, 2006), pt. I, pp. 1047-1048; Russia, 1989: Russian State Committee on Statistics, Rossiiskii Statisticheskii Ezhegodnik 1994(hereinafter RSE and year) (Moscow, 1994), p. 238; Russia 1992: RSE 1997 (Moscow, 1997), p. 306 and NAS-MADT 2001 (New York: United Nations, 2003), pt. II, pp. 514-515.
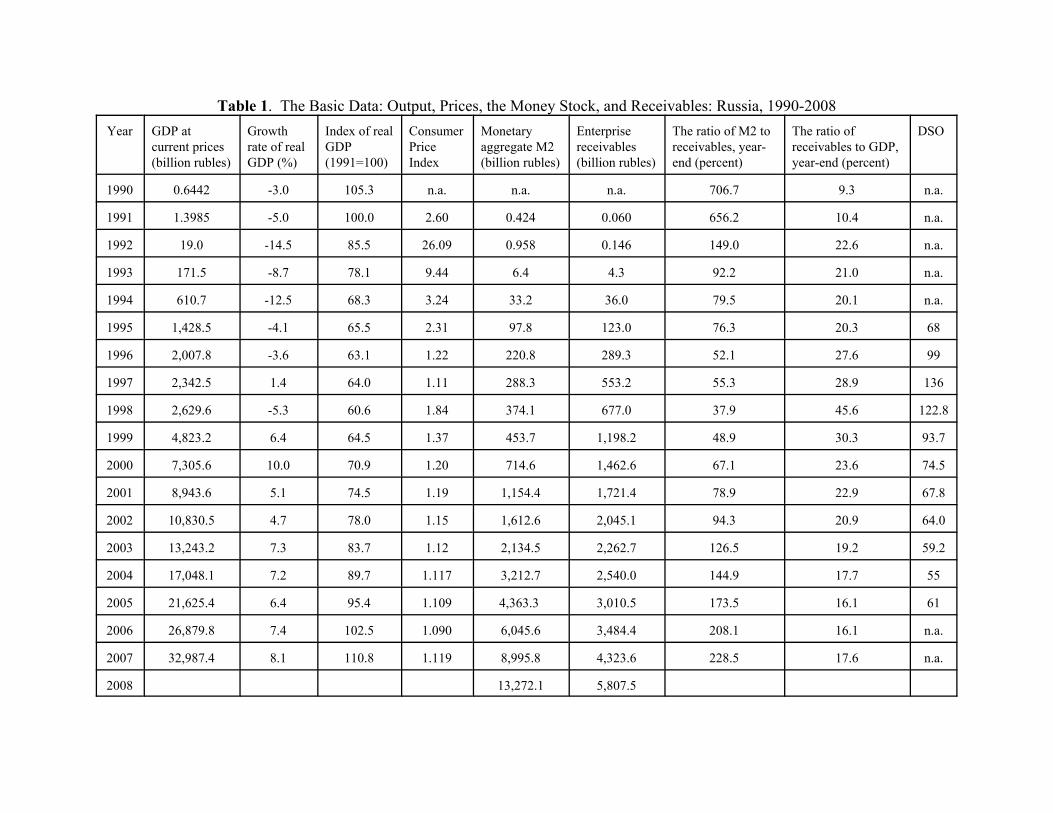
Table 1. The Basic Data: Output, Prices, the Money Stock, and Receivables: Russia, 1990-2008Year GDP at
current prices(billion rubles)
Growthrate of realGDP (%)
Index of realGDP(1991=100)
ConsumerPriceIndex
Monetaryaggregate M2(billion rubles)
Enterprisereceivables(billion rubles)
The ratio of M2 toreceivables, year-end (percent)
The ratio ofreceivables to GDP,year-end (percent)
DSO
1990 0.6442 -3.0 105.3 n.a. n.a. n.a. 706.7 9.3 n.a.
1991 1.3985 -5.0 100.0 2.60 0.424 0.060 656.2 10.4 n.a.
1992 19.0 -14.5 85.5 26.09 0.958 0.146 149.0 22.6 n.a.
1993 171.5 -8.7 78.1 9.44 6.4 4.3 92.2 21.0 n.a.
1994 610.7 -12.5 68.3 3.24 33.2 36.0 79.5 20.1 n.a.
1995 1,428.5 -4.1 65.5 2.31 97.8 123.0 76.3 20.3 68
1996 2,007.8 -3.6 63.1 1.22 220.8 289.3 52.1 27.6 99
1997 2,342.5 1.4 64.0 1.11 288.3 553.2 55.3 28.9 136
1998 2,629.6 -5.3 60.6 1.84 374.1 677.0 37.9 45.6 122.8
1999 4,823.2 6.4 64.5 1.37 453.7 1,198.2 48.9 30.3 93.7
2000 7,305.6 10.0 70.9 1.20 714.6 1,462.6 67.1 23.6 74.5
2001 8,943.6 5.1 74.5 1.19 1,154.4 1,721.4 78.9 22.9 67.8
2002 10,830.5 4.7 78.0 1.15 1,612.6 2,045.1 94.3 20.9 64.0
2003 13,243.2 7.3 83.7 1.12 2,134.5 2,262.7 126.5 19.2 59.2
2004 17,048.1 7.2 89.7 1.117 3,212.7 2,540.0 144.9 17.7 55
2005 21,625.4 6.4 95.4 1.109 4,363.3 3,010.5 173.5 16.1 61
2006 26,879.8 7.4 102.5 1.090 6,045.6 3,484.4 208.1 16.1 n.a.
2007 32,987.4 8.1 110.8 1.119 8,995.8 4,323.6 228.5 17.6 n.a.
2008 13,272.1 5,807.5
Notes: 1. All nominal values are denominated in billion 1998 rubles.2. The data on nominal GDP at current prices derive from three discontinuous series in which overlapping data points do not match exactly.The consolidated continuous series includes the latest published data for each year. The series can serve as an approximation for thedenominator in the ratios of various indicators to GDP but cannot serve as the basis for deriving the index of implicit GDP price deflator.3. DSO stands for days of sales outstanding, also called the average collection period and the collection ratio. It constitutes outstandingbalances of receivables divided by the average trade credit sales per day; or receivables divided by total sales on trade credit times 365days.Sources:Money: Central Bank of Russia, various releasesGDP, prices, and receivables: Russian State Committee on Statistics, various releases
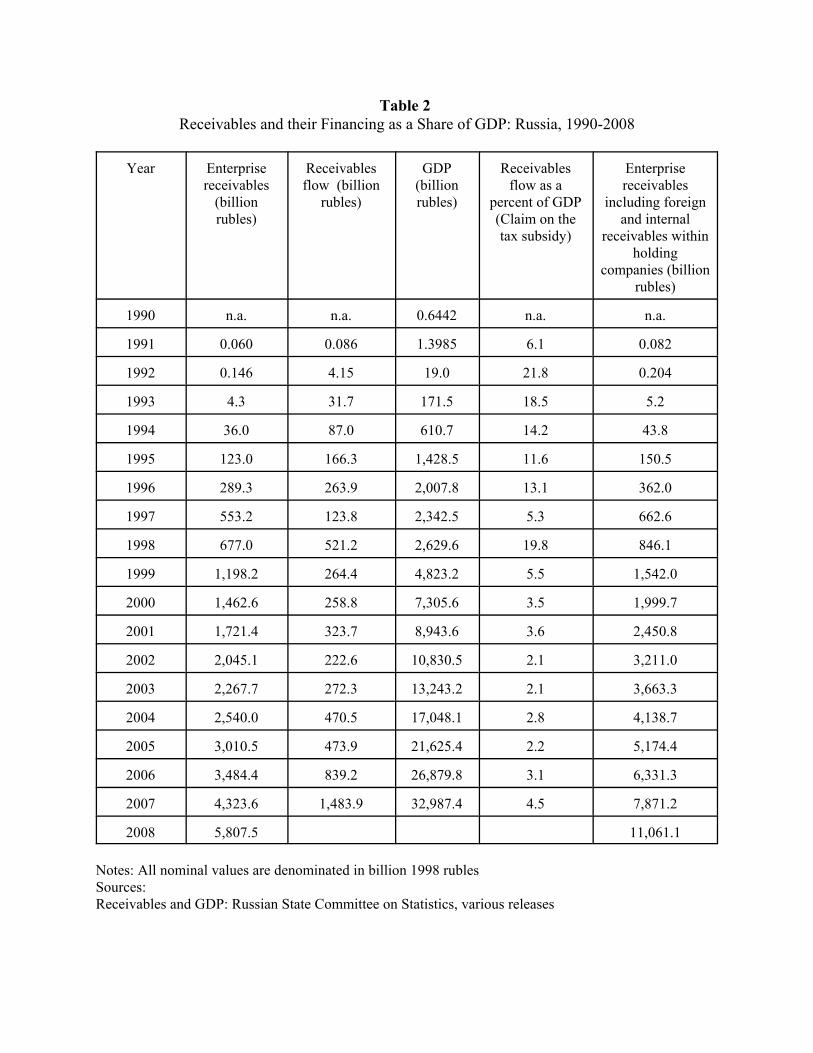
Table 2 Receivables and their Financing as a Share of GDP: Russia, 1990-2008
Year Enterprisereceivables
(billionrubles)
Receivablesflow (billion
rubles)
GDP(billionrubles)
Receivablesflow as a
percent of GDP(Claim on thetax subsidy)
Enterprisereceivables
including foreignand internal
receivables withinholding
companies (billionrubles)
1990 n.a. n.a. 0.6442 n.a. n.a.
1991 0.060 0.086 1.3985 6.1 0.082
1992 0.146 4.15 19.0 21.8 0.204
1993 4.3 31.7 171.5 18.5 5.2
1994 36.0 87.0 610.7 14.2 43.8
1995 123.0 166.3 1,428.5 11.6 150.5
1996 289.3 263.9 2,007.8 13.1 362.0
1997 553.2 123.8 2,342.5 5.3 662.6
1998 677.0 521.2 2,629.6 19.8 846.1
1999 1,198.2 264.4 4,823.2 5.5 1,542.0
2000 1,462.6 258.8 7,305.6 3.5 1,999.7
2001 1,721.4 323.7 8,943.6 3.6 2,450.8
2002 2,045.1 222.6 10,830.5 2.1 3,211.0
2003 2,267.7 272.3 13,243.2 2.1 3,663.3
2004 2,540.0 470.5 17,048.1 2.8 4,138.7
2005 3,010.5 473.9 21,625.4 2.2 5,174.4
2006 3,484.4 839.2 26,879.8 3.1 6,331.3
2007 4,323.6 1,483.9 32,987.4 4.5 7,871.2
2008 5,807.5 11,061.1
Notes: All nominal values are denominated in billion 1998 rublesSources:Receivables and GDP: Russian State Committee on Statistics, various releases

Table 3. The Index of Gross Domestic Product (GDP) and the Constant and Current Values of Export Revenues, Russia, 1991-2007
Export Revenues in Constant 2007 Billion $ Export Revenues in Current Billion $
GDP Index(1991=100)
Total Oil Natural Gas Total Oil Natural Gas
1991 100 77.894 n.a. n.a. 50.911 n.a. n.a.
1992 85.5 77.005 15.246 13.048 51.681 10.232 8.757
1993 78.1 84.982 14.889 13.907 58.608 10.268 9.591
1994 68.3 95.004 14.771 14.933 67.379 10.476 10.591
1995 65.5 112.914 18.253 16.607 82.419 13.323 12.122
1996 63.1 119.281 21.155 19.524 89.685 15.906 14.683
1997 64.0 112.964 19.250 21.338 86.895 14.808 16.414
1998 60.6 95.288 13.126 17.193 74.444 10.255 13.432
1999 64.5 94.439 17.698 14.190 75.551 14.158 11.352
2000 70.9 127.090 30.579 19.897 105.033 25.272 16.444
2001 74.5 120.223 29.488 20.969 101.884 24.990 17.770
2002 78.0 124.469 33.771 18.441 107.301 29.113 15.897
2003 83.7 154.959 45.234 22.778 135.929 39.679 19.981
2004 89.7 203.360 65.540 24.257 183.207 59.045 21.853
2005 95.4 260.864 89.279 33.888 243.798 83.438 31.671
2006 102.5 315.692 106.374 46.459 303.550 102.283 44.672
2007 110.8 355.465 121.503 44.837 355.465 121.503 44.837
Sources:1. GDP index (1991=100): calculated from Russian State Committee on Statistics, various releases2. Total export revenues, 1991: Russian State Committee on Statistics, Rossiiskaia Federatsiia v 1992 Godu (Moscow, 1993), p. 503. Total, oil, and natural gas export revenues, 1992-2007: Central Bank of Russia, “Statistics,” athttp://www.cbr.ru/statistics/credit_statistics/ 4. U.S. Consumer Price Index applied to convert export revenue values from current to constant 2007 dollars: U.S. Bureau of LaborStatistics
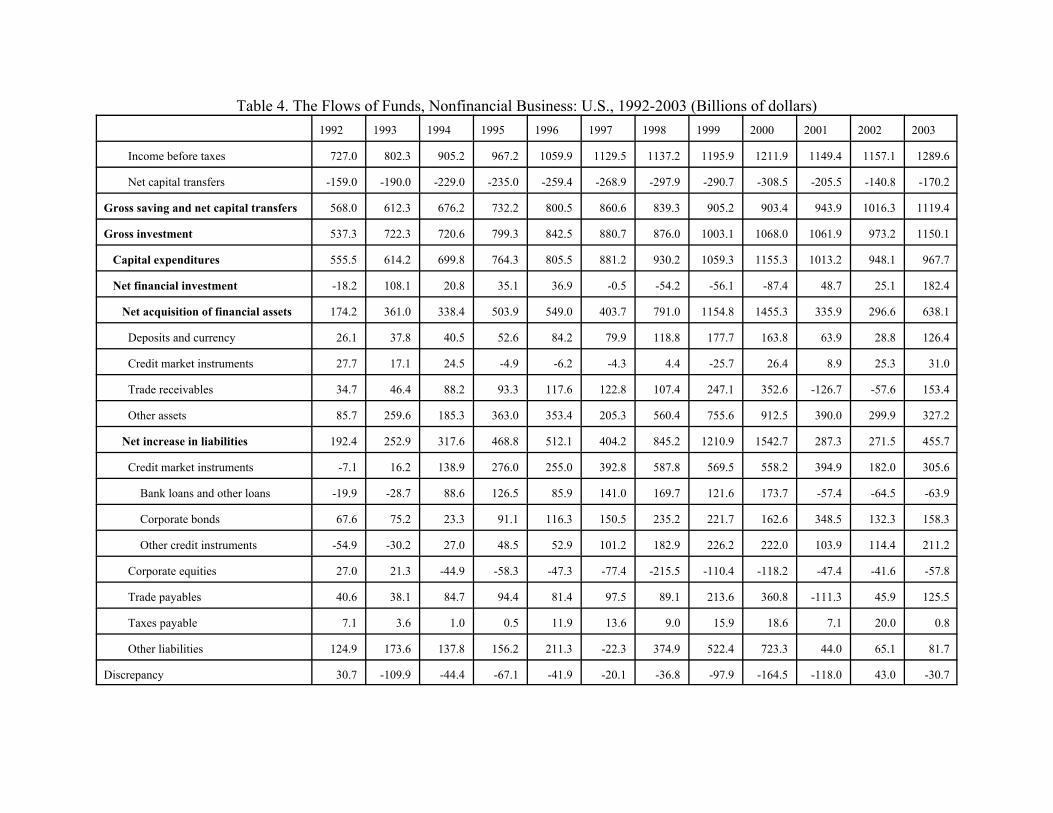
Table 4. The Flows of Funds, Nonfinancial Business: U.S., 1992-2003 (Billions of dollars)1992 1993 1994 1995 1996 1997 1998 1999 2000 2001 2002 2003
Income before taxes 727.0 802.3 905.2 967.2 1059.9 1129.5 1137.2 1195.9 1211.9 1149.4 1157.1 1289.6
Net capital transfers -159.0 -190.0 -229.0 -235.0 -259.4 -268.9 -297.9 -290.7 -308.5 -205.5 -140.8 -170.2
Gross saving and net capital transfers 568.0 612.3 676.2 732.2 800.5 860.6 839.3 905.2 903.4 943.9 1016.3 1119.4
Gross investment 537.3 722.3 720.6 799.3 842.5 880.7 876.0 1003.1 1068.0 1061.9 973.2 1150.1
Capital expenditures 555.5 614.2 699.8 764.3 805.5 881.2 930.2 1059.3 1155.3 1013.2 948.1 967.7
Net financial investment -18.2 108.1 20.8 35.1 36.9 -0.5 -54.2 -56.1 -87.4 48.7 25.1 182.4
Net acquisition of financial assets 174.2 361.0 338.4 503.9 549.0 403.7 791.0 1154.8 1455.3 335.9 296.6 638.1
Deposits and currency 26.1 37.8 40.5 52.6 84.2 79.9 118.8 177.7 163.8 63.9 28.8 126.4
Credit market instruments 27.7 17.1 24.5 -4.9 -6.2 -4.3 4.4 -25.7 26.4 8.9 25.3 31.0
Trade receivables 34.7 46.4 88.2 93.3 117.6 122.8 107.4 247.1 352.6 -126.7 -57.6 153.4
Other assets 85.7 259.6 185.3 363.0 353.4 205.3 560.4 755.6 912.5 390.0 299.9 327.2
Net increase in liabilities 192.4 252.9 317.6 468.8 512.1 404.2 845.2 1210.9 1542.7 287.3 271.5 455.7
Credit market instruments -7.1 16.2 138.9 276.0 255.0 392.8 587.8 569.5 558.2 394.9 182.0 305.6
Bank loans and other loans -19.9 -28.7 88.6 126.5 85.9 141.0 169.7 121.6 173.7 -57.4 -64.5 -63.9
Corporate bonds 67.6 75.2 23.3 91.1 116.3 150.5 235.2 221.7 162.6 348.5 132.3 158.3
Other credit instruments -54.9 -30.2 27.0 48.5 52.9 101.2 182.9 226.2 222.0 103.9 114.4 211.2
Corporate equities 27.0 21.3 -44.9 -58.3 -47.3 -77.4 -215.5 -110.4 -118.2 -47.4 -41.6 -57.8
Trade payables 40.6 38.1 84.7 94.4 81.4 97.5 89.1 213.6 360.8 -111.3 45.9 125.5
Taxes payable 7.1 3.6 1.0 0.5 11.9 13.6 9.0 15.9 18.6 7.1 20.0 0.8
Other liabilities 124.9 173.6 137.8 156.2 211.3 -22.3 374.9 522.4 723.3 44.0 65.1 81.7
Discrepancy 30.7 -109.9 -44.4 -67.1 -41.9 -20.1 -36.8 -97.9 -164.5 -118.0 43.0 -30.7
Note: The table is abridged from Tables F.101 and F.102 of the Flow of Funds Accounts of the United States, by the Federal Reserve BoardSource: http://www.federalreserve.gov/releases/z1/current/data.htm
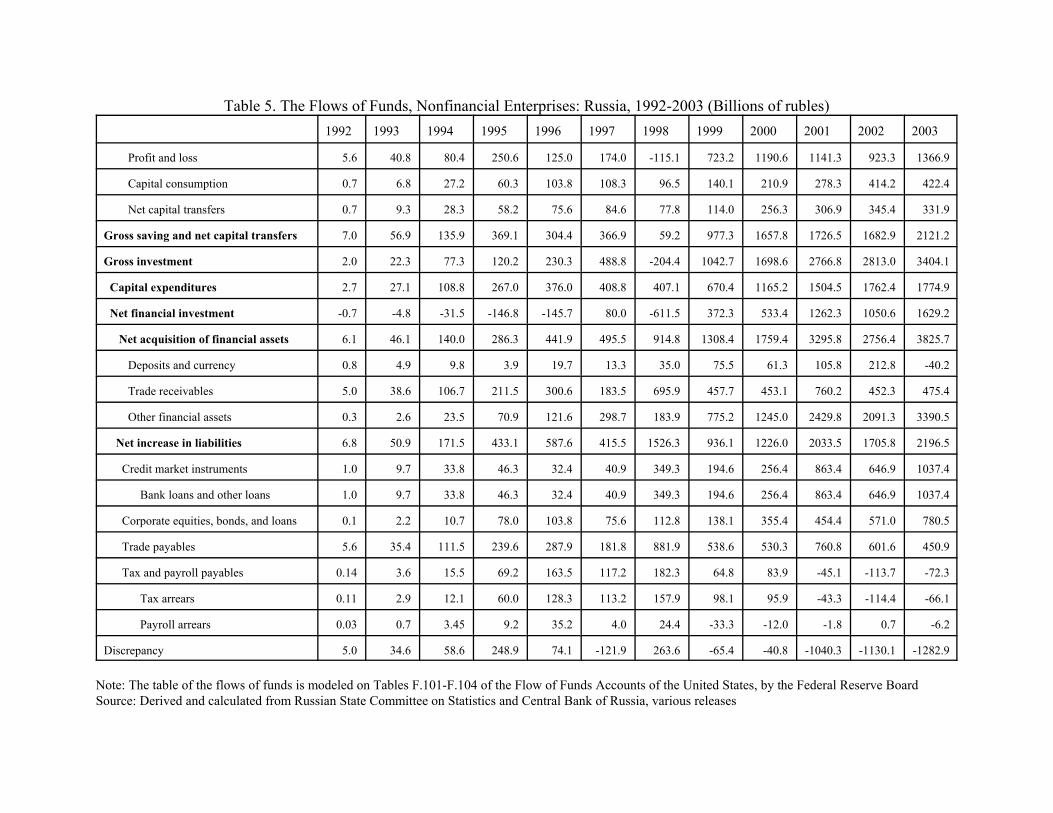
Table 5. The Flows of Funds, Nonfinancial Enterprises: Russia, 1992-2003 (Billions of rubles)1992 1993 1994 1995 1996 1997 1998 1999 2000 2001 2002 2003
Profit and loss 5.6 40.8 80.4 250.6 125.0 174.0 -115.1 723.2 1190.6 1141.3 923.3 1366.9
Capital consumption 0.7 6.8 27.2 60.3 103.8 108.3 96.5 140.1 210.9 278.3 414.2 422.4
Net capital transfers 0.7 9.3 28.3 58.2 75.6 84.6 77.8 114.0 256.3 306.9 345.4 331.9
Gross saving and net capital transfers 7.0 56.9 135.9 369.1 304.4 366.9 59.2 977.3 1657.8 1726.5 1682.9 2121.2
Gross investment 2.0 22.3 77.3 120.2 230.3 488.8 -204.4 1042.7 1698.6 2766.8 2813.0 3404.1
Capital expenditures 2.7 27.1 108.8 267.0 376.0 408.8 407.1 670.4 1165.2 1504.5 1762.4 1774.9
Net financial investment -0.7 -4.8 -31.5 -146.8 -145.7 80.0 -611.5 372.3 533.4 1262.3 1050.6 1629.2
Net acquisition of financial assets 6.1 46.1 140.0 286.3 441.9 495.5 914.8 1308.4 1759.4 3295.8 2756.4 3825.7
Deposits and currency 0.8 4.9 9.8 3.9 19.7 13.3 35.0 75.5 61.3 105.8 212.8 -40.2
Trade receivables 5.0 38.6 106.7 211.5 300.6 183.5 695.9 457.7 453.1 760.2 452.3 475.4
Other financial assets 0.3 2.6 23.5 70.9 121.6 298.7 183.9 775.2 1245.0 2429.8 2091.3 3390.5
Net increase in liabilities 6.8 50.9 171.5 433.1 587.6 415.5 1526.3 936.1 1226.0 2033.5 1705.8 2196.5
Credit market instruments 1.0 9.7 33.8 46.3 32.4 40.9 349.3 194.6 256.4 863.4 646.9 1037.4
Bank loans and other loans 1.0 9.7 33.8 46.3 32.4 40.9 349.3 194.6 256.4 863.4 646.9 1037.4
Corporate equities, bonds, and loans 0.1 2.2 10.7 78.0 103.8 75.6 112.8 138.1 355.4 454.4 571.0 780.5
Trade payables 5.6 35.4 111.5 239.6 287.9 181.8 881.9 538.6 530.3 760.8 601.6 450.9
Tax and payroll payables 0.14 3.6 15.5 69.2 163.5 117.2 182.3 64.8 83.9 -45.1 -113.7 -72.3
Tax arrears 0.11 2.9 12.1 60.0 128.3 113.2 157.9 98.1 95.9 -43.3 -114.4 -66.1
Payroll arrears 0.03 0.7 3.45 9.2 35.2 4.0 24.4 -33.3 -12.0 -1.8 0.7 -6.2
Discrepancy 5.0 34.6 58.6 248.9 74.1 -121.9 263.6 -65.4 -40.8 -1040.3 -1130.1 -1282.9
Note: The table of the flows of funds is modeled on Tables F.101-F.104 of the Flow of Funds Accounts of the United States, by the Federal Reserve BoardSource: Derived and calculated from Russian State Committee on Statistics and Central Bank of Russia, various releases
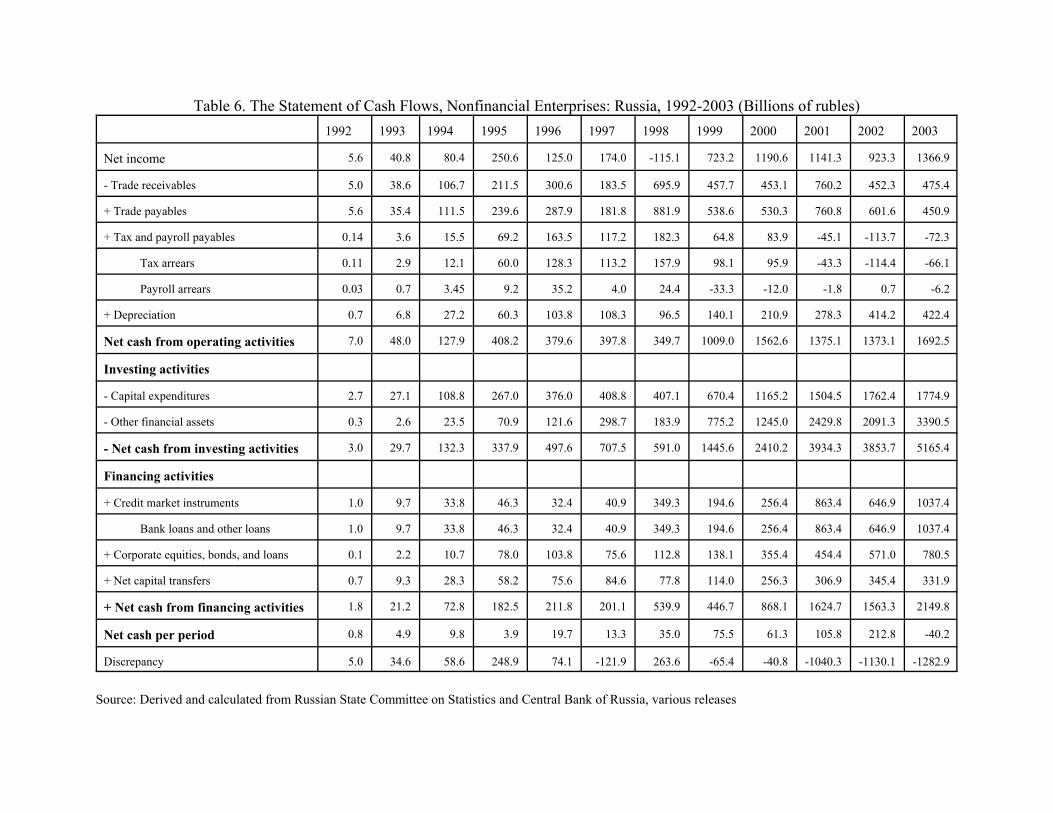
Table 6. The Statement of Cash Flows, Nonfinancial Enterprises: Russia, 1992-2003 (Billions of rubles)1992 1993 1994 1995 1996 1997 1998 1999 2000 2001 2002 2003
Net income 5.6 40.8 80.4 250.6 125.0 174.0 -115.1 723.2 1190.6 1141.3 923.3 1366.9
- Trade receivables 5.0 38.6 106.7 211.5 300.6 183.5 695.9 457.7 453.1 760.2 452.3 475.4
+ Trade payables 5.6 35.4 111.5 239.6 287.9 181.8 881.9 538.6 530.3 760.8 601.6 450.9
+ Tax and payroll payables 0.14 3.6 15.5 69.2 163.5 117.2 182.3 64.8 83.9 -45.1 -113.7 -72.3
Tax arrears 0.11 2.9 12.1 60.0 128.3 113.2 157.9 98.1 95.9 -43.3 -114.4 -66.1
Payroll arrears 0.03 0.7 3.45 9.2 35.2 4.0 24.4 -33.3 -12.0 -1.8 0.7 -6.2
+ Depreciation 0.7 6.8 27.2 60.3 103.8 108.3 96.5 140.1 210.9 278.3 414.2 422.4
Net cash from operating activities 7.0 48.0 127.9 408.2 379.6 397.8 349.7 1009.0 1562.6 1375.1 1373.1 1692.5
Investing activities
- Capital expenditures 2.7 27.1 108.8 267.0 376.0 408.8 407.1 670.4 1165.2 1504.5 1762.4 1774.9
- Other financial assets 0.3 2.6 23.5 70.9 121.6 298.7 183.9 775.2 1245.0 2429.8 2091.3 3390.5
- Net cash from investing activities 3.0 29.7 132.3 337.9 497.6 707.5 591.0 1445.6 2410.2 3934.3 3853.7 5165.4
Financing activities
+ Credit market instruments 1.0 9.7 33.8 46.3 32.4 40.9 349.3 194.6 256.4 863.4 646.9 1037.4
Bank loans and other loans 1.0 9.7 33.8 46.3 32.4 40.9 349.3 194.6 256.4 863.4 646.9 1037.4
+ Corporate equities, bonds, and loans 0.1 2.2 10.7 78.0 103.8 75.6 112.8 138.1 355.4 454.4 571.0 780.5
+ Net capital transfers 0.7 9.3 28.3 58.2 75.6 84.6 77.8 114.0 256.3 306.9 345.4 331.9
+ Net cash from financing activities 1.8 21.2 72.8 182.5 211.8 201.1 539.9 446.7 868.1 1624.7 1563.3 2149.8
Net cash per period 0.8 4.9 9.8 3.9 19.7 13.3 35.0 75.5 61.3 105.8 212.8 -40.2
Discrepancy 5.0 34.6 58.6 248.9 74.1 -121.9 263.6 -65.4 -40.8 -1040.3 -1130.1 -1282.9
Source: Derived and calculated from Russian State Committee on Statistics and Central Bank of Russia, various releases
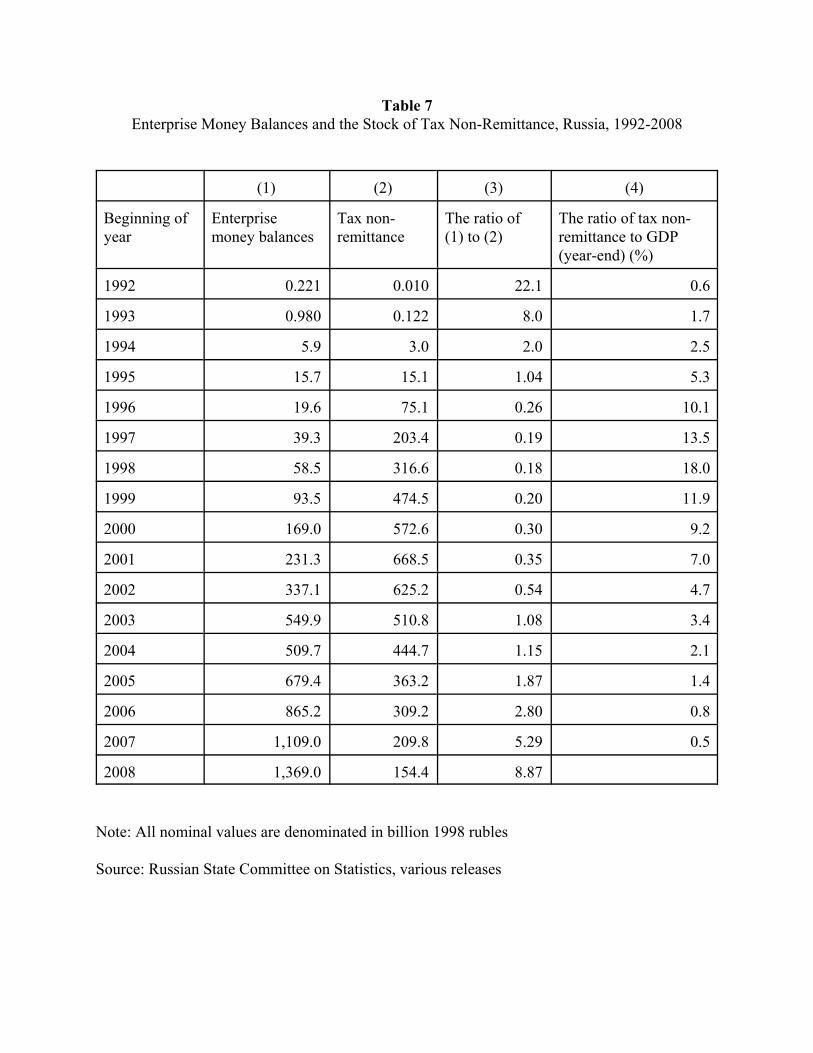
Table 7Enterprise Money Balances and the Stock of Tax Non-Remittance, Russia, 1992-2008
(1) (2) (3) (4)
Beginning ofyear
Enterprisemoney balances
Tax non-remittance
The ratio of(1) to (2)
The ratio of tax non-remittance to GDP(year-end) (%)
1992 0.221 0.010 22.1 0.6
1993 0.980 0.122 8.0 1.7
1994 5.9 3.0 2.0 2.5
1995 15.7 15.1 1.04 5.3
1996 19.6 75.1 0.26 10.1
1997 39.3 203.4 0.19 13.5
1998 58.5 316.6 0.18 18.0
1999 93.5 474.5 0.20 11.9
2000 169.0 572.6 0.30 9.2
2001 231.3 668.5 0.35 7.0
2002 337.1 625.2 0.54 4.7
2003 549.9 510.8 1.08 3.4
2004 509.7 444.7 1.15 2.1
2005 679.4 363.2 1.87 1.4
2006 865.2 309.2 2.80 0.8
2007 1,109.0 209.8 5.29 0.5
2008 1,369.0 154.4 8.87
Note: All nominal values are denominated in billion 1998 rubles
Source: Russian State Committee on Statistics, various releases
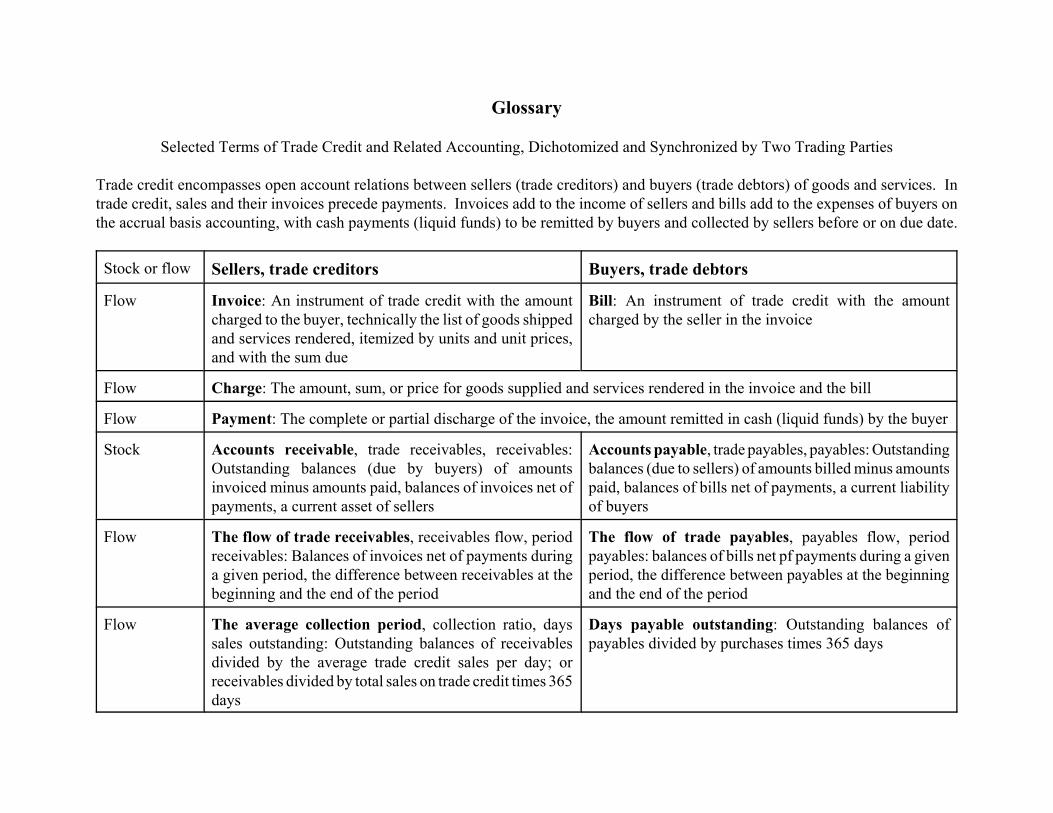
Glossary
Selected Terms of Trade Credit and Related Accounting, Dichotomized and Synchronized by Two Trading Parties
Trade credit encompasses open account relations between sellers (trade creditors) and buyers (trade debtors) of goods and services. Intrade credit, sales and their invoices precede payments. Invoices add to the income of sellers and bills add to the expenses of buyers onthe accrual basis accounting, with cash payments (liquid funds) to be remitted by buyers and collected by sellers before or on due date.
Stock or flow Sellers, trade creditors Buyers, trade debtors
Flow Invoice: An instrument of trade credit with the amountcharged to the buyer, technically the list of goods shippedand services rendered, itemized by units and unit prices,and with the sum due
Bill: An instrument of trade credit with the amountcharged by the seller in the invoice
Flow Charge: The amount, sum, or price for goods supplied and services rendered in the invoice and the bill
Flow Payment: The complete or partial discharge of the invoice, the amount remitted in cash (liquid funds) by the buyer
Stock Accounts receivable, trade receivables, receivables:Outstanding balances (due by buyers) of amountsinvoiced minus amounts paid, balances of invoices net ofpayments, a current asset of sellers
Accounts payable, trade payables, payables: Outstandingbalances (due to sellers) of amounts billed minus amountspaid, balances of bills net of payments, a current liabilityof buyers
Flow The flow of trade receivables, receivables flow, periodreceivables: Balances of invoices net of payments duringa given period, the difference between receivables at thebeginning and the end of the period
The flow of trade payables, payables flow, periodpayables: balances of bills net pf payments during a givenperiod, the difference between payables at the beginningand the end of the period
Flow The average collection period, collection ratio, dayssales outstanding: Outstanding balances of receivablesdivided by the average trade credit sales per day; orreceivables divided by total sales on trade credit times 365days
Days payable outstanding: Outstanding balances ofpayables divided by purchases times 365 days
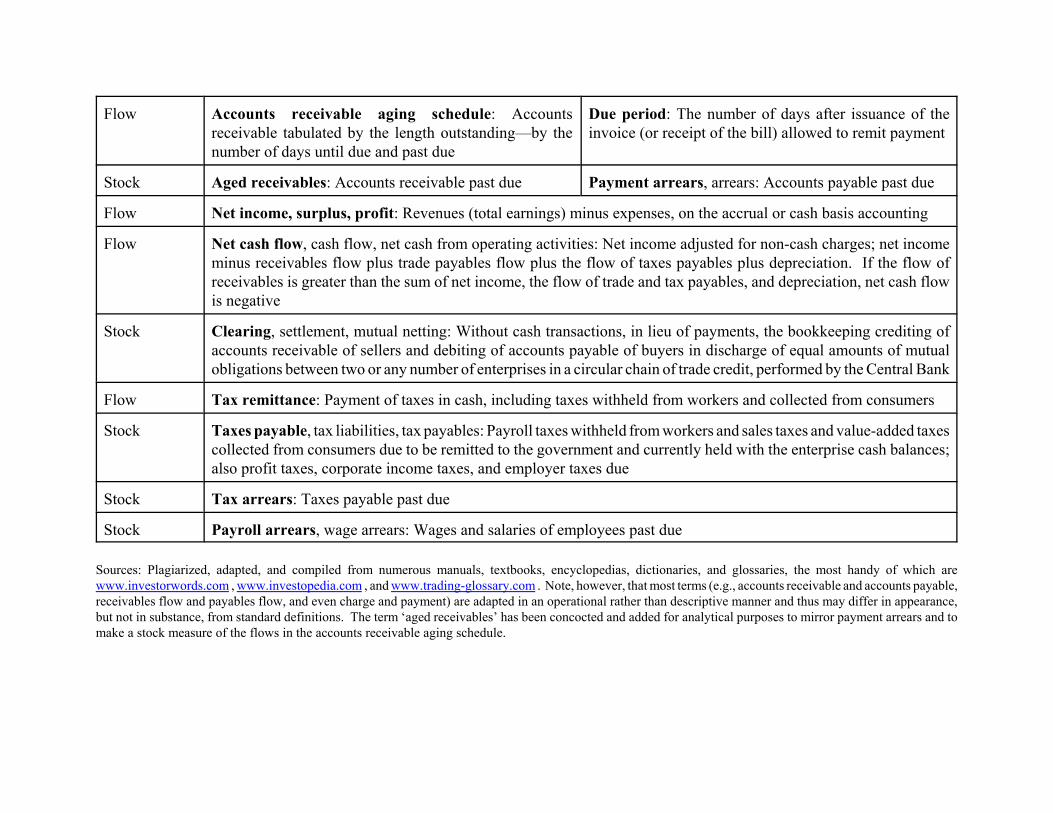
Flow Accounts receivable aging schedule: Accountsreceivable tabulated by the length outstanding—by thenumber of days until due and past due
Due period: The number of days after issuance of theinvoice (or receipt of the bill) allowed to remit payment
Stock Aged receivables: Accounts receivable past due Payment arrears, arrears: Accounts payable past due
Flow Net income, surplus, profit: Revenues (total earnings) minus expenses, on the accrual or cash basis accounting
Flow Net cash flow, cash flow, net cash from operating activities: Net income adjusted for non-cash charges; net incomeminus receivables flow plus trade payables flow plus the flow of taxes payables plus depreciation. If the flow ofreceivables is greater than the sum of net income, the flow of trade and tax payables, and depreciation, net cash flowis negative
Stock Clearing, settlement, mutual netting: Without cash transactions, in lieu of payments, the bookkeeping crediting ofaccounts receivable of sellers and debiting of accounts payable of buyers in discharge of equal amounts of mutualobligations between two or any number of enterprises in a circular chain of trade credit, performed by the Central Bank
Flow Tax remittance: Payment of taxes in cash, including taxes withheld from workers and collected from consumers
Stock Taxes payable, tax liabilities, tax payables: Payroll taxes withheld from workers and sales taxes and value-added taxescollected from consumers due to be remitted to the government and currently held with the enterprise cash balances;also profit taxes, corporate income taxes, and employer taxes due
Stock Tax arrears: Taxes payable past due
Stock Payroll arrears, wage arrears: Wages and salaries of employees past due
Sources: Plagiarized, adapted, and compiled from numerous manuals, textbooks, encyclopedias, dictionaries, and glossaries, the most handy of which arewww.investorwords.com , www.investopedia.com , and www.trading-glossary.com . Note, however, that most terms (e.g., accounts receivable and accounts payable,receivables flow and payables flow, and even charge and payment) are adapted in an operational rather than descriptive manner and thus may differ in appearance,but not in substance, from standard definitions. The term ‘aged receivables’ has been concocted and added for analytical purposes to mirror payment arrears and tomake a stock measure of the flows in the accounts receivable aging schedule.
Paradigm Lost, Paradigm Regained: Common Versus Private Income 1
1Gregory C. Chow, "Challenges of China's Economic System for Economic Theory," American EconomicReview 87, no. 2 (May 1997): 321-327.
Chapter 2
Paradigm Lost, Paradigm Regained: Common Versus Private Income
The time-honored dichotomy of market and government has framed the entire discussion on post-Communist economies. Less government is equated with more liberty, more private enterprise, andwith the development of the market economy. The rest is socialism, equated with big, restrictiveGovernment and state ownership. However, the new phenomenon of post-Communist economiesdoes not fit this unidimensional framework. On one extreme, as we saw in Chapter 1, the factsunearth total socialism in Russia without big, restrictive Government, in an economy that enjoys freetransactions and is dominated by private enterprises. On the other extreme, as Gregory C. Chowdissected in a pioneering and largely ignored article, the facts show that a highly successful marketeconomy emerged in China with little liberalization and privatization.1 These two big anomalies, andmany smaller in between, call for redefining socialism, the market economy, and government, andrethinking the relationships among them.
Economic Systems Matter
If socialism is not synonymous with government, then liberation from government does not automaticallyliquidate socialism and does not, by itself, create a market economy. Socialism runs at a deeper level andso does the market economy. Dismantling a statist socialist economic system, such as central planning,does not necessarily result in the birth of a market economy. Socialism can mutate and becometransformed, as we will show, into a new and different kind of socialism.
One big question has been looming in the background during the preceding discussion: Why didexcess invoicing and the tax subsidy emerge after central planning, but not elsewhere? What catapultedRussia and similar post-Communist countries in a direction far away from the real market economy? Whydon’t free, private firms in Western market and developing countries resort to counterfeit spending toenforce the tax subsidy?
The simple answer is that they would if they could. A tax subsidy to the tune of 15-25 percent ofGDP is too lucrative a proposition to miss, especially when it is self-enforceable. No lobbying or rent-seeking effort is necessary. It is the best of all possible worlds. However, it is impossible to launch sucha system except in the wake of central planning. Firms must be able to put the entire economy on the
Paradigm Lost, Paradigm Regained: Common Versus Private Income 2
2Enrico C. Perotti attributes arrears to the collusion of opportunistic enterprises for extracting governmentmonetary accommodation. See Enrico C. Perotti, “A Taxonomy of Post-Socialist Financial Systems: DecentralizedEnforcement and the Creation of Inside Money,”Economics of Transition 2, no. 1 (January 1994): 71-81 and “InertialCredit and Opportunistic Arrears in Transition,” European Economic Review 42, no. 9 (November 1998): 1703-25. Butopportunistic enterprises are free-riders and thus their collusion on a massive scale, which requires long sacrifice, isimpossible. They would rather jump than embark ship. Possible or not, collusion was unnecessary. The network ofenterprises was already in place. Had collusion been possible, arrears, counterfeit spending, and the tax subsidy wouldhave existed in Western market economies and developing countries.
3For a similar treatment of central planning in pre-1978 China and other Soviet-type economies, see Justin YifuLin, Fang Cai, and Zhou Li, “Competition, Policy Burdens, and State-Owned Enterprise Reform,” American EconomicReview 88, no. 2 (May 1998): 422-427.
4For an illuminating discussion on the role of networks and historical inheritance in Western market economies,see Paul A. David, “Clio and the Economics of QWERTY,” American Economic Review 75, no. 2 (May 1985): 332-337;Michael L. Katz and Carl Shapiro, “Network Externalities, Competition, and Compatibility,” American Economic Review75, no. 3 (June 1985): 424-440; Brian W. Arthur, “Competing Technologies, Increasing Returns, and Lock-in by HistoricalEvents,” Economic Journal 99, no. 1 (March 1989): 116-131; S.J. Liebowitz and Stephen E. Margolis, “NetworkExternality: An Uncommon Tragedy,” Journal of Economic Perspectives 8, no. 2 (Spring 1994): 113-150; and, Rachel E.Kranton and Deborah F. Minehart, “A Theory of Buyer-Seller Network,” American Economic Review 91, no. 3 (June2001): 485-508.
5Thomas Hobbes, De Cive or The Citizen (New York: Appleton-Century-Crofts, 1949), pp. 80, 134; ThomasHobbes, The Elements of Law Natural and Politic (Oxford: Oxford University Press, 1994), pp. 124-125, 137; and, ThomasHobbes, Leviathan (Cambridge: Cambridge University Press, 1996), pp. 90, 100-101, 224-225.
brink of total disruption and pose a self-enforceable threat to wipe out the tax base. To accomplishthis, they should constitute a vast, all-encompassing network which permeates the entire chain ofproduction. But such a network cannot be built from scratch; in fact, it cannot be built at all. Firmswould join in the network only when it already exists, not when they would have to wait withoutpayment, and risk survival while the network is being built and the tax subsidy installed.2
Such a network can only be inherited. It was inherited from central planning, which consisted,effectively, of a single enterprise, the nation-enterprise. Under central planning, individual enterprisesacted as the nation-enterprise’s branches, sub-divisions, shops, and crews.3 They had one, single,common income which the government redistributed among individual enterprises though hiddencross-subsidies. The abolition of central planning, liberalization, and privatization devolved the nation-enterprise into a ready-made enterprise network for income redistribution.4 All it took to convert thenation-enterprise into the enterprise network was to move the government from the top of the fiscalsystem to the bottom.
The mechanism of inheritance and devolution is not hard to reconstruct. This is an example of theevolution of economic species. Since Thomas Hobbes, we know that if property is not common and is ofsome value, some claimants and property rights necessarily emerge. After a series of abrogations andconfiscations, the government settles property rights one way or another for a time being.5 In moreadvanced economies, where capital stock is a factor of production and yields profits, there always are
Paradigm Lost, Paradigm Regained: Common Versus Private Income 3
6We owe this insight and many other ideas throughout this book to Thomas E. MaCurdy.
7Residual control separates intermediate claimants, such as the government, the community, and creditors, andultimate owners. Residual control of owners excludes non-owners. See Sanford J. Grossman and Oliver D. Hart, “TheCosts and Benefits of Ownership: A Theory of Vertical and Lateral Integration,” Journal of Political Economy 94, no.4 (August 1986): 691-719 and Oliver D. Hart and John Moore, “Property Rights and the Nature of the Firm,” Journal ofPolitical Economy 98, no. 6 (December 1990): 1119-1158.
8Oliver D. Hart and John Moore, “Property Rights and the Nature of the Firm,” p. 1121.
9Michael S. Bernstam and Alvin Rabushka, Fixing Russia’s Banks (Stanford: Hoover Institution Press, 1998),pp. 8-9, 23-24.
10Actually, in the case of former Soviet states, the USSR government already released enterprises in 1988 fromremitting profits and thus, in effect, partly privatized the entire Soviet enterprise sector.
residual income claimants, because profit ends up in some hands.6 Property rights are defined as residualcontrol of assets.7 Due to institutional complexity, residual control of assets (ownership) and appropriationof residual income (profits) can be split between different actors.8 The government under central planningappropriated the residual income of state-owned enterprises not so much directly as indirectly. Directly,enterprises remitted part of their profits to the government as the owner of capital and retained the rest ofresidual income for internal use. The state banking system existed to (among other functions) automaticallyremit the net cash flow surpluses to the state along with enterprise taxes.9
But book profits constituted only a small part of enterprise surpluses. The bulk of enterpriseresidual income accrued to the government indirectly, through suppressed wages, controlled relative prices,and cross-subsidies embedded in these prices and financed by suppressed wages. As the governmentdispensed controlled prices between industries and thus cross-subsidized industries, it effectively investedits indirect profits (especially economic rent on natural resources) in industrial development. There was nomechanism of direct accrual of these parts of residual income to the government as the owner. Not couldthere be, for the impossibility of accounting for all of the above indirect flows. But this was the fiscalfoundation of central planning.
Enter the abolition of central planning, liberalization of transactions and enterprise decisions, andlifting of price control. The banking system no longer had to automatically remit taxes and book profits.10
The government lost the mechanism of appropriating enterprise residual income through suppressed wages,controlled prices, and cross-subsidies. All profits of enterprises, including residual income from suppressedwages and economic rent on natural resources, and the bulk of tax revenues automatically ended up in thehands of enterprise managers, even before formal privatization of assets. Abolition of forced transactionsand forced transfers automatically devolved residual income and fiscal control to the enterprise networkand its managers.
The government suddenly found itself fiscally insolvent—not technically bankrupt (for it owned
Paradigm Lost, Paradigm Regained: Common Versus Private Income 4
11As we discussed in Chapter 1, financing overdue enterprise payables was another major function of thebanking system under central planning.
12John Milton wrote in 1673 about reformers of his time:
“License they mean when they cry liberty, But from that mark how far they rove we seeFor all this waste of wealth and loss of blood."
John Milton, Sonnet XII, "On the Detraction which Followed upon My Writing Certain Treatises" in John Milton, ThePoems of John Milton (New York: W.W. Norton, 1972), p. 295.
assets, pending privatization) but simply deprived of every principal source of revenues. Liberalizationdevolved the present value of government assets as the source of income. Legal privatization of assetssealed this fate. To keep control over the new system, the enterprise network had only to perpetuate fiscaldistress, which it did not have to learn how to do because the mechanism was also there, by evolution.There was no design, no conspiracy, no collusion, and no discovery.
The initial payment jam which congealed the new system came about by default when thegovernment, as part of abolition of central planning, stopped automatically paying off overdue enterprisepayables to suppliers.11 That is, the government hardened the budget constraints. Liberalization unleashedexcess invoices, counterfeit spending. Government refusal to automatically finance them unleashed thepayment jam. This step towards financial stabilization, the third leg of the triad of stabilization, liberalization,and privatization, generated the initial payment jam and tax non-remittance.
Ironically, hardening the budget constraints became the final step in the evolution of the new system.Stopping one automatic mechanism, the soft budget constraints, automatically engendered anothermechanism, the payment jam and the self-enforceable tax subsidy. Thus the new system of fungible incomeunder the enterprise network and symbiont government came into being as a result of abolition of centralplanning, liberalization, and then privatization. The new economic species has evolved.
Let us call this new economic species Enterprise Network Socialism, or ENS for short. Itautomatically replaced state socialism of forced production under central planning. It substitutedfungible common income of the enterprise network (the self-enforceable tax subsidy) for singlecommon income of the nation-enterprise (the soft budget constraints and cross-subsidies for enforcingproduction). What was meant to be market liberalization mutated into a fiscal free-for-all, asenterprises grabbed public income, and took over the fiscal and monetary authorities. To rephraseJohn Milton, license emerged under the guise of liberty.12
The standard view holds that the same, uniform policy kit applies everywhere, that central
Paradigm Lost, Paradigm Regained: Common Versus Private Income 5
13See an excellent overview in Dani Rodrik, “Understanding Economic Policy Reform,” Journal of EconomicLiterature 34, no. 1 (March 1996): 9-41. The encyclopedia of this approach is The World Bank, From Plan to Market.World Development Report 1996 (New York: Oxford University Press for the World Bank, 1996), and, next, The WorldBank, Transition. The First Ten Years: Analysis and Lessons for Eastern Europe and the Former Soviet Union(Washington: The World Bank, 2002). On a different plane, the literature employs the concept of the initial conditions.It is a-systemic by design. It includes geography (e.g., distance from Western Europe), war and peace, political system,and industrial structure (e.g., the share of producer goods manufacturing). These initial conditions are important as theyvary between countries. But this treatment of initial conditions dismisses in principle the difference between post-centralplan and developing economies and negates economic systems as such. See Jeffrey D. Sachs, “Reforms in EasternEurope and the Former Soviet Union in Light of the East Asian Experience.” The Journal of the Japanese andInternational Economies, 9, no. 4 (December 1995): 454-485, and, Nauro F. Campos and Fabrizio Coricelli, “Growth inTransition: What We Know, What We Don’t, and What We Should,” Journal of Economic Literature 40, no. 3(September 2002): 793-836, especially p. 828 and references there.
14Fabrizio Coricelli, Macroeconomic Policies and the Development of Markets in Transition Economies(Budapest: Central European University Press, 1998), pp. 52-85. See also Emilian Dobrescu, Macromodel of theRomanian Transition (Bucharest: The Expert Publishing House, 1996).
15 Stanislaw Gomulka, "The Causes of Recession Following Stabilization," Comparative Economic Studies 33,no. 2 (1991): 71-89.
planning and developing economies are all alike, and that economic systems do not matter.13 Thisview goes against economic evolution. Contrary to this view, it is crucial that these are post-Communist economies, or, more exactly, post-central plan economies. They are post-central plan,with the unified, country-wide assembly line, and they are post-central plan, with the abolition offorced production, price control, and overall government control of transactions. The result is theemergence of a predatory claimant network, with its excess invoices, the payment jam, and the self-enforceable tax subsidy.
Central planning bequests the single nation-enterprise, which becomes the network after itsabolition. Paradoxically, liberal reforms superimposed on central planning beget Enterprise NetworkSocialism. To restate this case, it is not the extent of economic liberty and private property thatseparates the market economy from ENS and socialism in general.
Enterprise Network Socialism and Its Breakup
A follow-up question is why ENS failed to emerge in Poland? The answer is that such a system didemerge. It swept all post-Communist economies.14 In Poland, the payment jam (seen at the time asthe crisis of enterprise arrears) shocked the economy in 1990-91, toppled the government,15 and ledto financial turmoil and an 18 percent contraction in GDP. But Poland, atypical among post-Communist countries, inherited a sizeable private enterprise sector of small businesses and privateagriculture. This private sector produced about 30 percent of GDP, which was not part of centralplanning. The network of socialist enterprises that emerged to enforce the tax subsidy was thusincomplete and incoherent. Subsequent new entrants into the private sector further undermined it.
Paradigm Lost, Paradigm Regained: Common Versus Private Income 6
16Janos Kornai, “The Road to a Free Economy—10 Years After,” The World Bank, Transition Newsletter 11,no. 2 (April 2000): 3-5. Hungary especially resembled Poland. It largely developed a new-entrant market sector. Hungarycreated hundreds of thousands of new firms. When it privatized, it privatized mostly small and medium-size enterprises.Kornai calls this “an organic growth of the private sector.” He concludes that privatization as a strategy in post-Communist economies proved inferior at best and harmful at worst and cites the Czech Republic and especially Russiaas proof. See also Laszlo Czaba, “A Decade of Transformation: Russia and Hungary Compared,” Acta Oeconomica 50,no. 3-4 (1999): 257-281, and Jan Svejnar, “Transition Economies: Performance and Challenges,” Journal of EconomicPerspectives 16, no. 1 (Winter 2002): 3-28. Svejnar usefully divides European post-Communist economies into threegroups: (1) Poland and Slovenia, the most successful in the region, did not privatize but rather relied on creation of newfirms and the so-called commercialization of state enterprises (in our language, assigning separable budgets and breakingup fungible income with the government); (2) Hungary and Estonia, a less successful group, avoided rapid and massprivatization (and were criticized for that) and conducted individual enterprise sales to foreigners and other outsiders(which also breaks up fungible income); and (3) Russia and similar countries championed rapid, mass privatization.
17Currency boards in Bulgaria and Estonia became powerful means of depriving the government of discretionarymonetary policy. Such monetary regimes preclude confiscation of public income by enterprises through the issue ofexcess invoices. But if enterprises can build up tax non-remittance and thus a large unserviceable fiscal debt, a currencyboard may not be able to withstand the rising fiscal pressure (like it did not withstand fiscal pressure from debt buildupby provincial governments in Argentina and collapsed in 2001 after ten years of struggle). Additionally, in Estonia anintroduction of the flat income tax helped reduce redistribution. A big role was played by an accidental factor: Majorindustrial enterprises employed primarily ethnic Russian labor. Ethnic Russians constituted about one-third of thepopulation of the new, tiny country and a perceived challenge to its hard-won independence. For reasons unrelated toeconomic policy and based on linguistic and residence length criteria, these workers could not acquire citizenship rights.To minimize their influence, the government let their employer enterprises halt or nearly halt operation, which—as becameapparent after the fact—helped the economy by reducing value subtraction. The immediate result was the unintendedbreakup of the enterprise network. This made the currency board sustainable. A virtuous circle thus developed forrecovery and growth, even if at the cost of segregation.
18See Socialist Republic of Vietnam, General Statistical Office, Nien Giam Thong Ke [Statistical Yearbook]1993 (Hanoi, 1994), pp. 16-18; David Dollar, "Macroeconomic Management and the Transition to the Market in Vietnam,"Journal of Comparative Economics 18, no. 3 (June 1994): 357-375; Markus Diehl. “Structural Change in the EconomicTransformation Process: Vietnam 1986-1993,” Economic Systems 19, no. 2 (June 1995): 147-182; David Dollar and BorjeLjunggren, “Vietnam,” in Padma Desai, ed., Going Global (Cambridge: MIT Press, 1997), pp. 439-471; and, Whing ThyeWoo, “China and Vietnam,” in Konosuke Odaka and Juro Taranishi, eds., Markets and Government: Its Search of BetterCoordination (Tokyo: Muruzen Co., 1998). For a broad discussion of Vietnam’s economy and policy since 1986, seeAdam Fforde and Stefan de Vylder, From Plan to Market: The Economic Transition in Vietnam (Boulder, CO: WestviewPress, 1996); John R. Dodsworth, Adjai Chopra, Chi D. Pham, and Hisanobu Shishido, "Macroeconomic Experiences ofthe Transition Economies in Indochina," The IMF, Working Paper 96/112 (October 1996); Christina Dawkins and JohnWhalley, “Economic Reform and Performance in Vietnam,” in John McMillan and Barry Naughton, eds., Reforming AsianSocialism: The Growth of Market Institutions (Ann Arbor: University of Michigan Press, 1996), pp. 297-316; KeithGriffin, ed., Economic Reform in Vietnam (New York: St. Martin’s Press, London: Macmillan, 1998); and, Melanie
To a lesser extent and with less success (a deeper contraction and a smaller recovery), the Polish storytypified Eastern and Central European countries,16 while countries in Southeastern Europe, especiallyRomania and, until 1998, Bulgaria, largely followed the Russian path.17
China and Vietnam, in contrast, centered their policies on breaking up the enterprise networkin agriculture and industry and spawning new independent firms. In 1989, Vietnam instantly closeddown a large segment of industrial enterprises and enforced restrictions on the rest.18 In 1978, China

Paradigm Lost, Paradigm Regained: Common Versus Private Income 7
Beresford and Dang Phong, Economic Transition in Vietnam: Trade and Aid in the Demise of a Centrally PlannedEconomy (Cheltenham, U.K., and Northampton, MA: Elgar, 2000).
19Laurence J. Lau, Yingui Qian, and Gerald Roland, “Reform Without Losers: An Interpretation of China’s Dual-Track Approach to Transition,” Journal of Political Economy 108, no. 1 (February 2000): 120-143; Gregory C. Chow,"Challenges of China's Economic System for Economic Theory;" John McMillan, “Markets in Transition,” in DavidKreps and Kenneth Wallis, eds., Advances in Economics and Econometrics: Theory and Applications (Cambridge:Cambridge University Press, 1997), pp. 210-239; Gary H. Jefferson and Thomas G. Rawski, “Enterprise Reform in ChineseIndustry,” Journal of Economic Perspectives 8, no. 2 (Spring 1994): 47-70; Pradumna B. Rana and Naved Hamid, eds.,From Centrally Planned to Market Economies: The Asian Approach, vols. 1-2 (Hong Kong and New York: OxfordUniversity Press, 1994); Scott Rozelle and Guo Li, “Village Leaders and Land-Rights Formation in China,” AmericanEconomic Review 88, no. 2 (May 1998): 433-438; Loren Brandt and Xiaodong Zhu, “ Redistribution in a DecentralizedEconomy: Growth and Inflation in China under Reform,” Journal of Political Economy 108, no. 2 (April 2000): 422-439;Wei-Wei Zhang, Transforming China: Economic Reform and its Political Implications (London: Macmillan Press,2000); and, Athar Hussein, Nicholas Stern, and Joseph E. Stiglitz, “Chinese Reforms from a Comparative Perspective,”in Peter J. Hammond and Gareth D. Myles, eds., Incentives, Organization, and Public Economics: Papers in Honor ofSir James Mirrlees (New York: Oxford University Press, 2000), pp. 243-277. The latter article points out importantsimilarities between China and Poland and Hungary.
20Eduardo Borensztein and Jonathan D. Ostry. "Accounting for China's Growth Performance," AmericanEconomic Review 86, no. 2 (May 1996): 224-228, and Chris Bramall, Sources of Chinese Economic Growth, 1978-1996(Oxford: Oxford University Press, 2000). No such reallocation of resources from lower-productive and value-subtractingsectors to more productive, high value-added sectors can be found in Russia and little in post-Communist Eastern andCentral European countries. See empirical and accounting analysis in Mark De Broeck and Vincent Koen, “The SoaringEagle: Anatomy of the Polish Take-Off in the 1990s,” The IMF, Working Paper 2000/6 (January 2000), and, Mark DeBroeck and Vincent Koen, “The Great Contractions in Russia, the Baltics and the Other Countries of the Former SovietUnion: A View from the Supply Side,” The IMF, Working Paper 2000/32 (March 2000).
21David Dollar, “Macroeconomic Management and the Transition to the Market in Vietnam,” and Markus Diehl,“Structural Change in the Economic Transformation Process: Vietnam 1986-1993,” and Melanie Beresford and DangPhong, Economic Transition in Vietnam: Trade and Aid in the Demise of a Centrally Planned Economy.
launched a comprehensive set of system changes, beginning with the dissolution of agriculturalcommunes and the transfer of land use rights to individual households on long-term leases. ThenChina effectively segregated its state-owned, heavy industrial enterprises from the rest of the rapidlygrowing new township and village enterprises (TVEs). By this two-track approach, the Chinesegovernment split the economy into two disjointed parts.19 In both China and Vietnam, as the new-entrant market sector crowded out the inherited enterprise network, excess invoices were confined toa shrinking network of old state enterprises. This released productive incentives in the bulk of theeconomy and reallocated resources to productive uses,20 resulting in spectacular growth.
This policy path lies beyond the dichotomy of government and market and has little relationto simple cuts in the size of government, the scope of government control, and market liberalization.Indeed, China and Vietnam, both of which enjoyed high growth, differ on the latter score. At the verytime that Vietnam broke up its enterprise network, it conducted a comprehensive liberalization ofprices, transactions, and foreign trade;21 China postponed its liberalization for many years. Marketliberalization in Vietnam did not become fiscal liberalization. It did not open access to public income
Paradigm Lost, Paradigm Regained: Common Versus Private Income 8
22A comparative analysis of post-Communist China, Poland, Vietnam, and Russia is in John McMillan andChristopher Woodruff, “The Central Role of Entrepreneurs in Transition Economies,” Journal of Economic Perspectives16, no. 3 (Summer 2002): 153-170. This article traces the success or failure of post-Communist economies to the new-entrant market sector or paucity of thereof.
23Historical inheritance in the case of post-Communist economies was not an ontological fate but an outcome,even if unintended, of a policy choice. One policy choice generated spectacular growth, another, great contraction.There is no preordained dependence of the past and the path. History is crucial but neutral. It is there, it is given. Somecountries can utilize historical advantages, such as instant growth opportunity due to inherited value subtraction andother inefficiencies. Other countries unleash historical disadvantages, such as the inherited enterprise network. Policywith no regard for history is itself a policy choice, which, in the case of post-Communist countries, led to socialistmutation.
24As figure 2.1 indicates, the growth data derive from the IMF supplemented by the official national statistics.There has been an extensive debate about the quality and reliability of growth data during the decade of system change.
for the enterprise network because the network itself was dismantled.
The difference between rapid growth, modest growth, moderate contraction, and greatcontraction lay in the extent of breaking up the enterprise network, in preventing the mutation ofsocialism from governmental to a non-governmental incarnation, and in expanding the pre-existingprivate sector (if countries were lucky to have one, as did Poland), and in the genesis of new firms thatcould not redistribute income.22 High growth had very little, if anything, to do with liberalization andprivatization; more often than not, lack of these measures (for example, no privatization and limitedliberalization in China and Poland) helped isolate and control old enterprises, thereby dis-empoweringthe network. New-entrant firms, like Chinese TVEs, were especially a key factor, irrespective of theirproperty type (TVEs happen to be local government and community owned).
New entrants as such are quantitatively, not qualitatively, beneficial to market economies inthat they are more innovative and spur growth. In marked contrast, new entrants are critical in post-Communist economies because they are distinct and separated from the inherited network. Thepreexisting private sector plays the same crucial role. The new-entrant sector, along with thepreexisting private sector, turned out to be crucial in post-Communist economies because its expansionautomatically reduced the output of the inherited network as a share of GDP, and the network’s powerover fiscal and monetary policy. The remnants of the network may remain in place, but the economyis no longer Enterprise Network Socialism. Thus Russia is today an example of Enterprise NetworkSocialism but China and even Poland are not. Their paths diverged.23
Private Income Versus Common Income in 42 Post-Communist Countries
Figure 2.1 examines the performance of 42 post-Communist economies from the perspective of thenetwork inheritance or its breakup. The vertical axis measures cumulative growth of GDP during thedecade of 1990-99.24 The horizontal axis plots the share of GDP produced by firms that do not collect
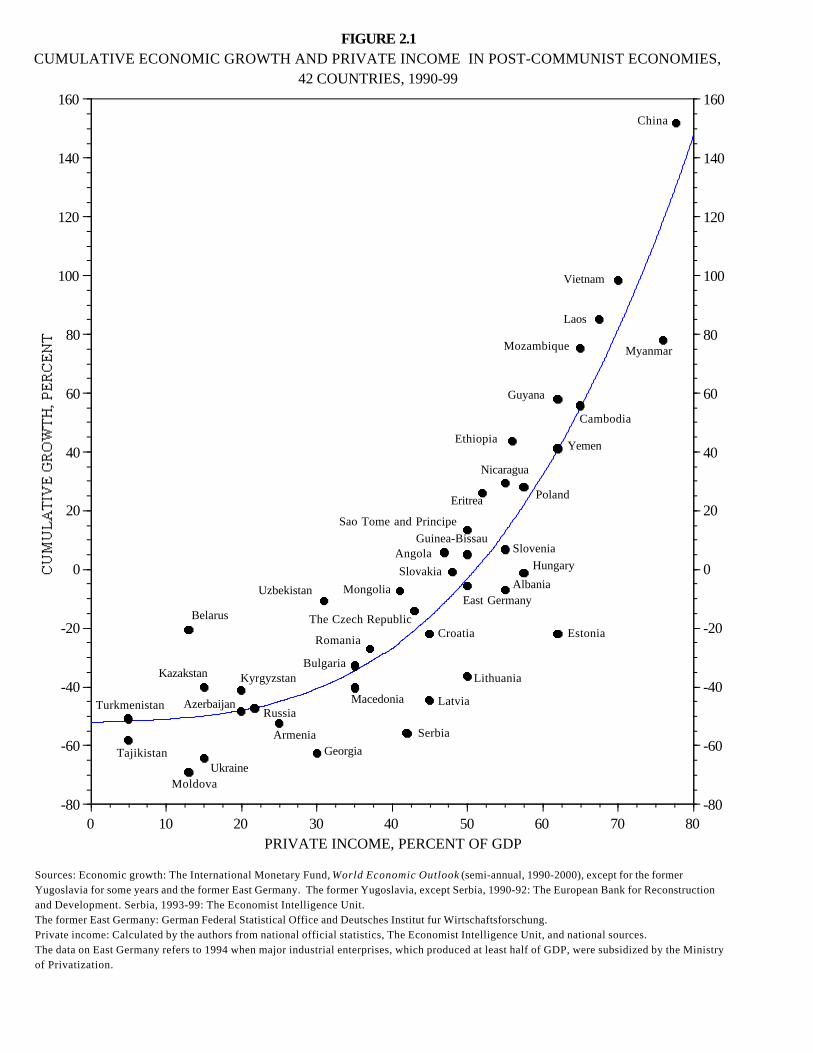
-80
-60
-40
-20
0
20
40
60
80
100
120
140
160
-80
-60
-40
-20
0
20
40
60
80
100
120
140
160
0 10 20 30 40 50 60 70 80PRIVATE INCOME, PERCENT OF GDP
FIGURE 2.1CUMULATIVE ECONOMIC GROWTH AND PRIVATE INCOME IN POST-COMMUNIST ECONOMIES,
42 COUNTRIES, 1990-99
China
Poland
Russia
Sources: Economic growth: The International Monetary Fund, World Economic Outlook (semi-annual, 1990-2000), except for the formerYugoslavia for some years and the former East Germany. The former Yugoslavia, except Serbia, 1990-92: The European Bank for Reconstructionand Development. Serbia, 1993-99: The Economist Intelligence Unit.The former East Germany: German Federal Statistical Office and Deutsches Institut fur Wirtschaftsforschung.Private income: Calculated by the authors from national official statistics, The Economist Intelligence Unit, and national sources.The data on East Germany refers to 1994 when major industrial enterprises, which produced at least half of GDP, were subsidized by the Ministryof Privatization.
Georgia
Romania
The Czech Republic
Moldova
Latvia
Croatia
Mongolia
Kyrgyzstan
Belarus
Albania
Azerbaijan
Kazakstan
Estonia
Macedonia
Uzbekistan
Armenia
Turkmenistan
Tajikistan
LithuaniaBulgaria
Serbia
Ukraine
HungarySlovenia
Slovakia
East Germany
Angola
Sao Tome and Principe
Nicaragua
Eritrea
YemenEthiopia
Guinea-Bissau
Mozambique
Cambodia
Myanmar
Guyana
Laos
Vietnam

Paradigm Lost, Paradigm Regained: Common Versus Private Income 9
The debate seems to have settled in a consensus to rely on the adjusted and updated IMF series. For a balanced andinformed discussion, see Nauro F. Campos and Fabrizio Coricelli, “Growth in Transition: What We Know, What WeDon’t, and What We Should,” pp. 795-818.
25Calculated from the weighted average of the shares of output of small private businesses and foreign venturesin industry (7.7 percent), construction (21.6 percent), transportation (10 percent), non-trade services (50 percent), andtrade (42 percent), and personal plots and private farms in agriculture (45.8 percent). The source is Russian StateCommittee on Statistics, Rossiiskii Statisticheskii Ezhegodnik 1996 (Moscow: RSCS, 1996), pp. 294, 550, 691-692.
26Central Statistical Office of Poland, Rocznik Statystyczny 1995 (Warsaw, 1996), pp. XXXV-XXXVI, 528. Dueto lack of privatization, Poland is split into the old enterprise network and the private sector of old and new-entrant firmsand farms outside the network. Thus in the Polish case, unlike Russia and many other post-Communist countries, privatesector data approximates the share of private income in GDP.
27Calculated from the weighted average of the shares of output produced by Township and Village Enterprises(TVEs) in industry (66 percent), TVEs and individual family farms in agriculture, forestry, and fishery (97.1 percent, thatis, all agriculture except state farms), TVEs in construction (33.7 percent), and the new private sector and foreign-fundedventures in disaggregated transportation, telecommunications, commerce, and various services. The source is People’sRepublic of China, State Statistical Bureau, China Statistical Yearbook 1996 (Beijing: China Statistical PublishingHouse, 1996), pp. 5, 23, 25, 42, 386, 390, 401, 403, 405, 472, 543, 727, 730.
the tax subsidy, do not generate excess invoices, do not have a stock of arrears, and are not in thepayment jam. The latter excludes any portion of GDP produced by the inherited network. We definethese firms as earners of private income , in the sense that they do not participate in income redistribution,do not socialize income across industries and enterprises, do not finance or receive cross-subsidies, anddo not confiscate tax collection and other public income. Private income in this sense is opposite tocommon income between enterprises and between enterprises and the government, both under centralplanning and Enterprise Network Socialism. Their shares in GDP are opposites.
It is possible to calculate with a reasonable degree of confidence the share of GDP produced bythese non-network firms in the three key countries of Russia, Poland, and China. In 1995, this shareconstituted 21.8 percent in Russia,25 57.5 percent in Poland,26 and 77.8 percent in China27 respectively.We also have direct data from national statistics on several other countries such as Belarus, Ukraine,Moldova, Kazakstan, Uzbekistan, Slovenia, Albania, Vietnam, and Myanmar. In addition, the dataindicate that in Turkmenistan and Tajikistan the share of output in GDP of firms that broke outside thenetwork does not exceed 5 percent. Thus we can make direct calculations for one-third of the sample.For all other countries we have to resort to crude estimates based on the following procedure: Wecompound the proportion of GDP produced by those industries with predominantly small firms and farmsoutside the enterprise network and the share of output of such firms in a given industry. For manycountries, this method yields only very crude and unreliable approximations, with the margin of error up to10 percentage points of GDP. Note that private income and our measurement of it may not necessarilyoverlap with private ownership of assets. In fact, it clearly does not at all in the crucial cases of Russia andChina. In Russia, most enterprises and banks are private and income is not; in China, most income isprivate while most enterprises and banks are not.
Paradigm Lost, Paradigm Regained: Common Versus Private Income 10
28The IMF, World Economic Outlook, May 2000, p. 109.
29The World Bank, Entering the 21st Century. World Development Report 1999/2000 (New York: OxfordUniversity Press for the World Bank, 1999), pp. 230-231.
30The IMF, World Economic Outlook, May 2000, p. 109.
Our choice of countries is straightforward but atypical. We include all post-central planeconomies for which data exist. It is more forthright to employ crude data and advise the readeraccordingly, than employ selective samples of countries, which makes any analysis suspect on groundsof data manipulation. Central planning, not Communism as a political system, is our criterion. Weinclude former central plan countries which did not call themselves Communist, such as Myanmar,and exclude countries which called themselves Communist and Marxist-Leninist but did not installcentral planning, such as Benin.
The empirical literature usually samples 25 to 28 countries of the former Soviet Union andEastern and Central Europe. The sample excludes China, Vietnam, and other post-Communistcountries outside of the narrowly-defined Eurasia. This exclusion is usually based on developmentor rather underdevelopment grounds.28 We do not find this reasoning compelling. Albania, Mongolia,and the countries of the former Soviet Central Asia are no less agricultural and no more developedthan China, Vietnam, or Nicaragua. As a matter of fact, not only Central Asian countries and Albania,but also Ukraine and Moldova, are poorer in terms of per capita income measured in world prices (atpurchasing power parity) than China.29 Moreover, as we discussed in Chapter 1, due to significantvalue subtraction, the overindustrialized Communist countries of Europe had a potential growthadvantage over the less industrialized central plan countries of Asia and other continents. Therefore,lower stages of development, even when they are present, should not preclude lumping all post-centralplan countries together in one sample. Needless to say, econometric techniques, such as multi-variateregression, are able to control for such differences. Furthermore, the larger the sample the less the dataerrors in individual cases affect the overall relationship.
We also find no justification for the exclusion of many non-European countries on the groundsthat they experienced only partial command economies unlike Eastern Europe and the former SovietUnion.30 In fact, the opposite is often true. Total government economic control was much moreubiquitous in China, Vietnam, Cambodia (turned into one commune), Laos, Ethiopia, andMozambique (where state agricultural plantations represented effectively slave labor) than in Hungary,Poland, the former Yugoslavia, and even the former Soviet Union. Finally, for completeness, we alsoinclude two former Communist countries which underwent unification, the former East Germany, forwhich separate data exist after unification until the late 1990s, and the former South Yemen, for whichwe use national Yemen data for the period after unification. The only serious factor that separates the 25or 28 economies, which are usually included in the empirical tests, from those excluded is that the formerexperienced great contractions while most of the latter embarked on instant growth. But this is exactly thereason to include both groups in the sample to test any scientific hypothesis. Otherwise, due to the selectionbias, the results of the empirical work are predetermined.
Paradigm Lost, Paradigm Regained: Common Versus Private Income 11
31In addition, this test has obvious technical weaknesses. First, correlation does not mean causality. Causalitycan move in the opposite direction, that is, economic growth due to other independent causes can spur the breakup ofthe inherited enterprise network and the expansion of the private income sector. However, this reverse causality cannotexplain contraction. Why would contraction, produced by other independent factors, create more enterprise networkin countries like Russia, when this network was already inherited in full from central planning? The flow of causality morelikely goes from private income to economic growth. Second, correlation may be spurious. Many other forces were atwork, from different inherited industrial structures to external and civil wars and blockades. These various influencesmay cancel each other and inadvertently make various countries fit a postulated relationship. The relationship must becontrolled for such important factors as the level of development before 1990 (represented by income per capita in worldprices, at purchasing power parity), industrial structure (e.g, the share of industry or agriculture in GDP), investmentpractice (investment share in GDP before 1990), human capital (literacy as a measure of human capital stock and percentof youth enrolled in secondary education as a measure of human capital flow), the share of private sector before theabolition of central planning or before 1990, years of central planning before 1990 (the strength of the enterprise networkand other inherited factors), years after central planning before 1990 (+12 in the case of China, -2 in the case of Russia),population size, years in wars and blockade in the 1990s, and other influences. In the absence of a model of growth afterthe abolition of central planning, all these variables are ad hoc, but they need be employed. We present in the appendixseveral multivariate regressions along these lines, with different specifications and instruments. In most of them thepositive relationship between private income and growth holds statistical significance, but in others it does not.
Figure 2.1 demonstrates a strong positive relationship between cumulative economic growth in the1990s and the growth of private income accompanying the breakup of the inherited enterprise network.This positive relationship accounts for (we prefer not to say “explains”) 84 percent of the variation (thelinear form of the same relationship accounts for 69 percent of the variation; a better fit by the polynomialsof the second and the third degree suggests an acceleration of this influence as the enterprise networkfurther breaks up and private income expands). The relationship holds across most of the 42 economies(Estonia and Belarus are among the unexplained outliers; Serbia is probably an outlier because of a longwar). Most importantly, it holds across the spectrum of growth rates. It holds equally for those countriesthat underwent endless contractions during 1990-99, those that experienced contraction and recovery, andthose that enjoyed instant growth, both modest and rapid.
However, this test is limited by its own structure. A stock variable, the share of private incomearound the middle of the period, is related in figure 2.1 to cumulative growth during the entire decade ofthe 1990s. The measure of cumulative growth in many countries combines both great contraction andrecovery; it does not show each of them separately. It is virtually impossible to find two years, one ofcontraction and the other, of recovery, in the same calendar year for most countries, which would haveenabled us to break the period into parts and examine contractions and recoveries separately. Therefore,at best, this test can account for instant growth and for endless contraction during the 1990s, as in the casesof China and Russia, and for overall performance in Eastern Europe. But it cannot tell us why contractionwas greater in some countries if they recovered fast; and why their recovery was especially strong if theirprior contraction was deep. It cannot distinguish between countries that had sluggish instant growth, likeNicaragua, and between those that underwent a great contraction followed by strong recovery, like Poland,Slovenia, Hungary, and Estonia. Moreover, for technical reasons, it is more an illustration than a test.31
What it does give is a sense of direction. The horizontal axis in figure 2.1 introduces a new variable,
Paradigm Lost, Paradigm Regained: Common Versus Private Income 12
the extent of a type of income , in this case the extent of private income as a share of GDP. This is a newdimension, separate and independent from the extent of government economic control and from the typeof property. One can simply call it the income dimension. It distinguishes the two types of income,private income vs. common income as shares of GDP. The income dimension ranges from totally privateincome to totally common income. Classical market economies are close to the former, central planningand Enterprise Network Socialism are close to the latter, and all other countries are in-between, withvarying (and opposite) degrees of private and common income.
Figure 2.1 illustrates this approach in the case of 42 post-Communist economies. It shows that theextent of private income as a share of GDP is an independent variable which can account for divergenteconomic trends after the abolition of central planning. Figure 2.1 also indicates that the expansion ofprivate income, embodied in the new-entrant market sector, is equivalent to the extinction of commonincome embedded in the inherited enterprise network. It summarizes in abridged form for many countriesthe same perspective that we used to examine Russia’s Great Contraction.
The horizontal axis in figure 2.1 constructs the income dimension as the increasing extent of privateincome, which implies the decreasing degree of common income. One can describe private income asexclusive and internal to its earners. Private income excludes non-earners/non-producers of a given outputwhich earns this income. Private income is free from redistribution by the government or the enterprisenetwork and other private predatory forces. Private income prevails in China and similar countries thatbroke up the socialist enterprise network and built the new market economies. To a greater extent, privateincome characterizes classical and contemporary Western market economies (the latter, in their productivemarket sector, that is, minus the modern Welfare State).
By analogy with common property, we call the second income type common income . Commonincome is not exclusive to its earners. It socializes income and output and redistributes income fromproducers/earners to non-producers/non-earners. Redistribution of income can be made by thegovernment (e.g., under central planning, rent-seeking in developing economies, the Welfare State, etc.)or by non-governmental forces, such as the enterprise network (under ENS) and other private predators(e.g., piracy and slavery). We use the terms single common income for central planning and fungiblecommon income for Enterprise Network Socialism. The first name emphasizes total governmental controlover the nation-enterprise. The second fits the enterprise network and the symbiont government.
Private income can define the market economy, common income defines socialism. The newdichotomy of private and common income is different from the old dichotomy of market and government.
Paradigm Lost
The dichotomy of market and government framed the thinking about the Great Contraction in Russiaand similar post-Communist countries. The dominant literature initially pinpointed insufficient
Paradigm Lost, Paradigm Regained: Common Versus Private Income 13
32The World Bank, From Plan to Market. World Development Report 1996; The IMF, World EconomicOutlook , May 1996; and, European Bank for Reconstruction and Development (EBRD), Transition Report 1997(London: Blackwell Publishers, 1997).
33The World Bank, The State in a Changing World. World Development Report 1997 (New York: OxfordUniversity Press for the World Bank, 1997); The IMF, World Economic Outlook , October 1999; EBRD, Transition Report1999 (London: Blackwell Publishers, 1999); and, The World Bank, Transition. The First Ten Years. For a comprehensiveoverview of the literature see William L. Megginson and Jeffry M. Netter, “From State to Market: A Survey of EmpiricalStudies on Privatization,” Journal of Economic Literature 39, no. 2 (June 2001): 321-389, and Nauro F. Campos andFabrizio Coricelli, “Growth in Transition: What We Know, What We Don’t, and What We Should.”
34Edward P. Lazear, “Economic Reform: Appropriate Steps and Actual Policies,” in Edward P. Lazear, ed.,Economic Transition in Eastern Europe and Russia: Realities of Reform (Stanford: Hoover Institution Press, 1995), pp.3-61; Martha de Melo and Alan Gelb, “Transition to Date: A Comparative Overview,” in Salvatore Zecchini, ed., Lessonsfrom the Economic Transition. Central and Eastern Europe in the 1990s (Dordrecht, Boston, London: OECD andKluwer Academic Publishers, 1997), pp. 59-78; “Symposium Transition Economies,” Journal of Economic Perspectives16, no. 1 (Winter 2002): 3-124; and, The World Bank, Transition. The First Ten Years.
35Ronald I. McKinnon, "Financial Growth and Macroeconomic Stability in China, 1978-1992: Implications forRussia and Other Transitional Economies," Journal of Comparative Economics 18, no. 3 (June 1994): 438-470; OliverJ. Blanchard, The Economics of Transition in Eastern Europe (Oxford: Oxford University Press, 1997); Oliver J. Blanchardand Michael Kremer, “Disorganization,” Quarterly Journal of Economics 112 (November 1997): 1091-1126; Gerard Rolandand Thierry Verdier, “Transition and the Output Fall,” Economics of Transition 7, no. 1 (January 1999): 1-28; Joseph E.Stiglitz, Whither Reform? (Washington, D.C.: The World Bank, 1999); and, Joseph E. Stiglitz and David Ellerman, “NewBridges Across the Chasm: Macro- and Micro-Strategies for Russia,” (Boston, 2000), available at http://www.ecaar-russia.org/stiglitz-ellerman.htm. For an extensive overview, see Nauro F. Campos and Fabrizio Coricelli, “Growth inTransition: What We Know, What We Don’t, and What We Should.”
36An interesting overview of the experiences of Japan, South Korea, Taiwan, Hong Kong, Singapore, and China,is Xiaoming Huang, ed., The Political and Economic Transition in East Asia: Strong Market, Weakening State(Washington: Georgetown University Press, 2001). For a detailed discussion of government and the economy inSingapore and Hong Kong, see Linda Seah, “Public Enterprise and Economic Development,” in Peter S.J. Chen,Singapore: Development Policies and Trends (Singapore: Oxford University Press, 1983), pp. 129-159; Alwyn Young,“A Tale of Two Cities: Factor Accumulation and Technical Change in Hong Kong and Singapore,” in Oliver J. Blanchard
liberalization and privatization—in short, too much government.32 It later added emphasis on theinability to collect taxes, develop the rule of law, protect shareholders, enforce contracts, and regulatebanking—in short, too little government.33 The literature also explored the dynamic application of thesame dichotomy. It presented equally compelling arguments on the speed of liberalization andprivatization. Moving too slow causes output and financial losses, thus delaying economic recovery.34
Moving too fast creates disorganization, disrupts the supply lines, increases financial losses, andcontracts output.35
These are all cogent considerations, true to fact, even if they contradict one another. But theyare too generic and can apply almost anywhere at various times, to economies with high, low, zero,or negative economic growth, which does not explain Russia’s unprecedented economic decline. Thegovernment played an important role in the economies of the rapidly advancing East Asian countries,aptly called the Asian Tigers, both in control and ownership.36 Large state-owned firms have operated
Paradigm Lost, Paradigm Regained: Common Versus Private Income 14
and Stanley Fischer, eds., NBER Macroeconomic Annual 1992 (Cambridge: MIT Press, 1992), pp. 13-54; and Chang-TaiHsieh, “What Explains the Industrial Revolution in East Asia? Evidence from Factor Markets,” American EconomicReview 92, no. 3 (June 2002): 502-526.
37See international comparisons in William L. Megginson and Jeffry M. Netter, “From State to Market: A Surveyof Empirical Studies on Privatization.”
38The IMF, World Economic Outlook , October 1999, p. 75, and, The IMF, World Economic Outlook , October2000, p. 129. Incidentally, Belarus had 11.4 percent economic growth in 1997, 8.3 percent in 1998, 3.4 percent in 1999, 5.8percent in 2000, and 4.1 percent in 2001 (The IMF, World Economic Outlook, April 2002, p. 167). The literaturerecognizes that the growth experience of the non-reforming Belarus and also Uzbekistan presents a challenge to theconventional wisdom. See Stanley Fischer and Ranta Sahay, “The Transition Economies After Ten Years,” IMF WorkingPaper WP/00/30 (March 2000).
39The World Bank, Entering the 21st Century. World Development Report 1999/2000, pp. 230-231. However,the IMF revised the estimate of Russia’s income per capita at purchasing power parity in 1999 as $6,800. The IMF. World
in Italy, France, and Great Britain for decades of the twentieth century, and are still prominent inNorway and Austria. Germany still has a large state-owned banking sector. Many countries inWestern Europe have rigid labor markets. Italy had been notorious for lawlessness, tax evasion, andcorruption. Poland and Slovenia, the fastest recovering Eastern European countries, and China, thefastest growing country in the world, did not privatize their old industries. Russia liberalized andprivatized more than most post-Communist economies and Latin American countries; in some areas,even more than some Western market economies on the above list.37
From the standpoint of the dichotomy of government and market, Russia converges withWestern market economies. For Western observers, policy makers, researchers, and investors Russiahas all the appearances and trappings of a market economy. The West has formally declared Russiaa market economy in 2002 and invited it to join the G-8; membership in the World Trade Organizationis pending. Russia receives a high mark on the basis of a comprehensive scale of reformindicators—combining liberalization, privatization, and legal and institutional frameworks—devisedby the European Bank for Reconstruction and Development and employed by the InternationalMonetary Fund. This scale is the most comprehensive practical application of the reigning paradigm.On this scale, in 1999, Russia ranks at 2.5-2.7 compared with Poland at 3.4-3.5 and Slovenia at 3.2-3.3, and is well above Belarus at 1.5-1.8.38 The scale is linear, not Richter (logarithmic). Thedifference of 0.7 to 1.0 percentage points in market quality between Russia and Poland cannot accountfor more than 70 percentage points difference in their respective cumulative growth during the 1990s:Poland, +28 percent, and Russia, -45 percent (see figure 2.1).
To sharpen the contrast, one can add a comparison with China. This comparison is oftendisqualified on the grounds that China is a poor, developing country. Yet, in terms of a universalmeasure of economic development, income per capita in world market prices (at purchasing powerparity, to use the technical term), China, with $3,700 per person in 1999, is more prosperous than mostparts of the former Soviet Union except the Baltic states, Belarus, and Russia. China is fast closingthe gap with Russia, at $3,950 per person.39 In terms of liberalization, privatization, commercial
Paradigm Lost, Paradigm Regained: Common Versus Private Income 15
Economic Outlook , October 2000, p. 129. If this were even remotely possible, Russian income per capita at purchasingpower parity in 1989, before the contraction, would have been $12,400, higher than Portugal, Greece, and South Korea,and close to Spain, Ireland, and Finland, which is too absurd to refute. The only reason for this revision is not to letChina close the income gap with Russia.
40The IMF, World Economic Outlook , October 2000, p. 129.
41Gregory C. Chow was the first to point this out. See Gregory C. Chow, "Challenges of China's EconomicSystem for Economic Theory." See also Jean C. Oi, Rural China Takes Off: Institutional Foundations of EconomicReform (Berkeley and London: University of California Press, 1999).
42The conclusion of the most recent and comprehensive overview of the theoretical and empirical literature onthe causes of divergent economic growth and contraction in post-Communist countries is that we know that we don’tknow. Nauro F. Campos and Fabrizio Coricelli, “Growth in Transition: What We Know, What We Don’t, and What WeShould,” pp. 819-831.
43Gregory C. Chow, “Challenges of China’s Economic System.”
44Andrew Berg, Eduardo Borensztein, Ratna Sahay, and Jeromin Zettelmeyer, “The Evolution of Output inTransition Economies: Explaining the Difference,” IMF Working Paper WP/99/73 (May 1999), p. 52.
banking, currency convertibility, and other conventional measures, China is well behind Russia. Interms of creation of new market firms, usually owned by local governments and communities (theTownship and Village Enterprises, or TVEs), and family farms, China is well ahead of Russia or anyother post-Communist country. On the above scale of reform indicators, China ranks at 2.1 (the sameas non-reforming Uzbekistan) and Vietnam at 1.9,40 both below Russia. But the score makes littledifference. China’s cumulative economic growth during 1990-99 was a whopping 150 percentcompared with Russia’s 45 percent contraction. No existing reform scale can account for this hugecontrast. China’s success goes completely against the prevailing dichotomy and remains largelyunexplained,41 as does Russia’s failure.42
Having thoroughly analyzed the Chinese experience in comparison with the dominantparadigm, Gregory C. Chow saw the paradigm lost.43 We arrive at the same finding after looking atthe Russian experience as well as that of 42 post-Communist countries. A most comprehensive, recentempirical study by Andrew Berg et al. of the usual sample of 26 post-Communist countries of Easternand Central Europe and the former Soviet Union tested the impact of conventional factors on theircontractions and recoveries. Performed without prejudice, it found the framework at loss:
“If we consider all four classes of models, no single policy variable considered wasalways robust (...) This is a somewhat discouraging result, as it shows that alone thedata offer very little guidance on the relative significance of specific policies. In otherwords, the same data set could be used to make contradictory claims about thesignificance or lack of significance of various policy variables.”44
In plain English, conventional factors, important in Western market and developing economies and
Paradigm Lost, Paradigm Regained: Common Versus Private Income 16
45Nauro F. Campos and Fabrizio Coricelli, “Growth in Transition: What We Know, What We Don’t, and WhatWe Should,” pp. 825-826.
46For a succinct nomenclature of the orthodoxy see, e.g., The IMF, World Economic Outlook, October 2000 ,p. 131.
centered around the relationship between market and government, do not explain economic successor failure in post-Communist countries.
A most recent, comprehensive survey of the literature on growth and contraction in post-Communist economies concludes in the carefully chosen language:
“An important implication of the two brands of literature reviewed (...) is that priceliberalization and tight macroeconomic policies do not necessarily foster growth.Institutions enabling the functioning of a market economy are a fundamentalprecondition (...) [but] The notion of institutions is too vague to lead to a simpletheoretical treatment.”45
In plain English: Paradigm lost.
Let us take a quick glance at the experience of the 1990s in the same 42 countries that weobserved before, but from the standpoint of the dominant literature. We will even use, for the shortduration, its own language. It is more appropriate for a church than for scientific discourse but thisin itself conveys the dominance and confidence of the prevailing wisdom. The triad of liberalizationand privatization, along with financial stabilization, is called in this language the Orthodox strategy.46
Russia first and foremost falls into this category; Moldova, Latvia, Kazakstan, Ukraine, and Romaniacome very close. Partial application of these policies, combined with government regulations suchas wage control, control of bank credit to enterprises, capital controls, etc., which were used in Poland,Hungary, Slovakia, the Czech Republic, and elsewhere, are called the Heterodox strategy. Otherunconventional measures, such as the currency board introduced in Estonia and, recently, in Bulgaria,belong to the same category. This taxonomy leaves no room for China, Vietnam, and other post-Communist economies. They did not apply the triad of liberalization, privatization, and stabilization(or, like Vietnam, applied only part of the triad). They did not liberalize the inherited enterprisenetwork but phased out and broke it up instead. How shall we call them? In the spirit of the languagewe temporarily adopted, it would be appropriate to call them Heretics.
Figure 2.2 plots cumulative economic growth in the decade of 1990-99 in the 42 post-centralplan countries for which the data is available (Bosnia and Herzegovina is missing). It marks theappropriate countries by the three categories: Orthodox, Heterodox, and Heretics. We add the fourthcategory of a different nature. It encompasses countries that endured external and civil wars andblockades during this decade. This fourth category is accidental. The three paradigmatic categoriesconstitute exactly the scale that we discussed above, the scale of liberalization and privatization ofenterprises from big Government on an expected move to the market and growth. If the paradigm
Paradigm Lost, Paradigm Regained: Common Versus Private Income 17
works, we must find the Orthodox performing better than the Heterodox, with the Heretics at the bottom.Figure 2.2 shows that the Orthodox, especially Russia, Moldova, and Ukraine, is indistinguishable in itseconomic performance from the countries that underwent long wars and blockades, such as Georgia,Tajikistan, Serbia, Azerbaijan, and Macedonia. The Heterodox is a variable mix, with the cumulative resultof the decade from moderate growth in Poland to still significant accumulated contractions in Estonia andthe Czech Republic (in the latter, contraction resumed in 1998-99 after an aborted recovery). The Hereticsexhibit growth from good to excellent. We did not choose this language. It was chosen by therepresentatives of the paradigm, to indicate its omniscience. Figure 2.2, based on evidence, reveals theswift, unambiguous, and resolute rejection of a dominant paradigm.
The Labors of Sisyphus
The triad of stabilization, liberalization, and privatization (SLiP, for short) developed as a major practicalpolicy application of the dichotomy market vs. government. It is a policy navigation from government tomarket. The strength of the triad lies in its record of success in a number of developing economies. It wasalso successfully applied in Western market economies, which were diverted in the twentieth centurytowards big government, but then reverted to somewhat more classical liberal roots.
The experience of post-Communist economies undermines the universal applicability of the triad.A simple comparison of Russia, Poland, and China, and many other countries in between, suggests a rathernegative relationship: the less nations apply the SliP reform, the better economies perform. SLiPinadvertently unleashes Enterprise Network Socialism after the abolition of central planning. We dissectedthe mechanism of this evolution earlier in this chapter. Not using the triad allows countries to phase out andbreak up the enterprise network, prevent socialist mutation, employ the windfall growth potential, and enterthe road to the market economy and economic growth.
The application of SLiP to post-Communist economies is counter-productive in more ways thanone. Not only does SLiP reroute countries from growth to contraction, it also perpetuates their slip down,or as the song says, slip-sliding away. This is because in post-Communist economies, with their inheritedenterprise network, the three components of the triad are mutually incompatible. To wit, liberalization andprivatization, as we have explained, invariably and inevitably result in financial destabilization—the exactopposite of the intended outcome. They are in internal conflict, they undermine one another, and theircontinual application further erodes the economy. Russia, with its Great Default, is the most salientexample.
Enterprises, liberated from government control and privatized, take over fiscal and monetaryauthority, enforce the tax subsidy, build up public debt and lead to serial defaults. This ruins governmentefforts towards financial stabilization. Before the default, instead of a default, or after the default, thegovernment, which cannot place more debt, accelerates money printing and resumes inflation. Financialstabilization can only go through transient episodes. In order to return to financial stabilization after the
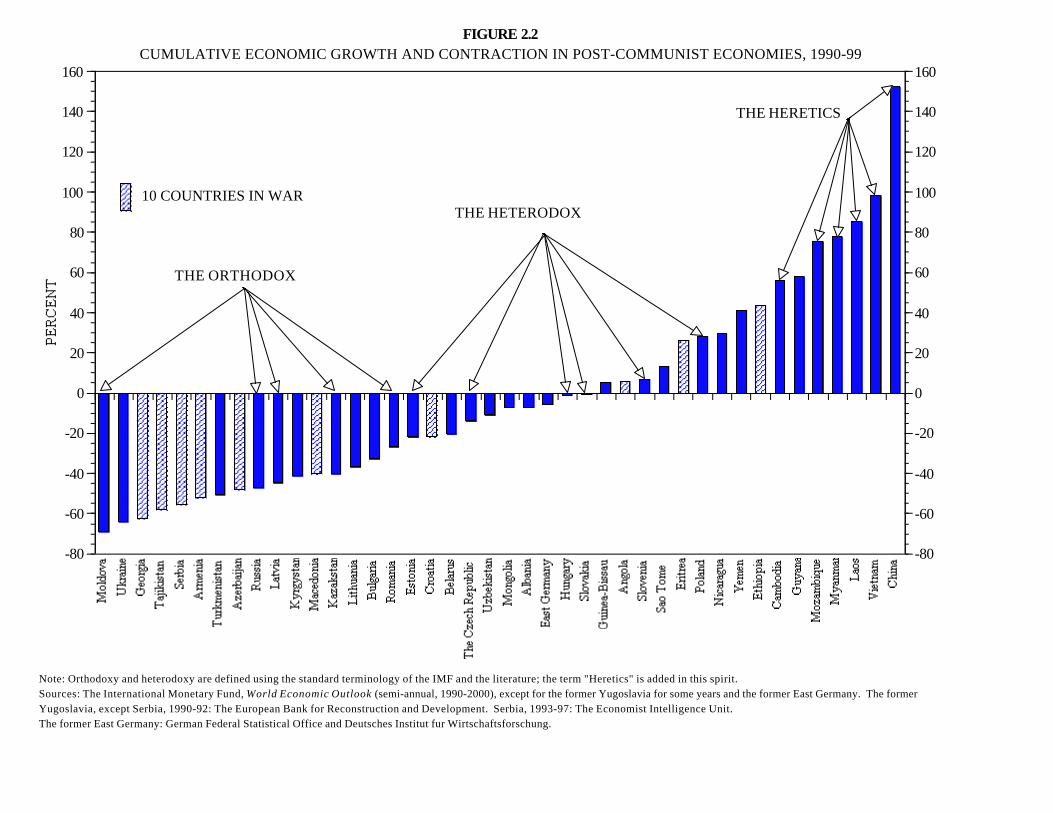
-80
-60
-40
-20
0
20
40
60
80
100
120
140
160
-80
-60
-40
-20
0
20
40
60
80
100
120
140
160
Note: Orthodoxy and heterodoxy are defined using the standard terminology of the IMF and the literature; the term "Heretics" is added in this spirit.Sources: The International Monetary Fund, World Economic Outlook (semi-annual, 1990-2000), except for the former Yugoslavia for some years and the former East Germany. The formerYugoslavia, except Serbia, 1990-92: The European Bank for Reconstruction and Development. Serbia, 1993-97: The Economist Intelligence Unit.The former East Germany: German Federal Statistical Office and Deutsches Institut fur Wirtschaftsforschung.
FIGURE 2.2CUMULATIVE ECONOMIC GROWTH AND CONTRACTION IN POST-COMMUNIST ECONOMIES, 1990-99
THE ORTHODOX
THE HETERODOX
THE HERETICS
10 COUNTRIES IN WAR
Paradigm Lost, Paradigm Regained: Common Versus Private Income 18
47In the Russian case, the Central Bank reintroduced capital controls after the Great Default of 1998, specifically,mandated repatriation of 75 percent (later, 50 percent) of export revenues. This contributed to fiscal stabilization, lowerinflation, partial dissipation of enterprise arrears, and economic recovery.
48The IMF always found in Russia that either financial stabilization or structural reform have not beenimplemented, but ignored their perpetual changing places.
49Jonathan Swift, Gulliver’s Travels . Edited by Peter Dixon and John Chalker (Baltimore and New York: PenguinBooks, 1967), pp. 221-222.
default and resumption of inflation, the government rolls back liberalization (especially takes capital flows,foreign trade, and energy prices under control) and halts privatization.47 It breaks the SLiP triad. Arenewed liberalization and privatization drive accelerates fiscal failure and again ruins financial stabilization.The process repeats itself as, in Greek mythology, the labors of Sisyphus.
As a result, the triad of stabilization, liberalization, and privatization is never implemented as awhole, regardless of whether the government tries to implement it, as in Russia, or eschews it, as in Chinaand Poland. This situation has a positional advantage in the policy argument and policy making. The policyof SLiP can never be proven wrong because it can always be said, true to fact, that one or anothercomponent of the triad has not been implemented. And these non-implemented components recycle backand forth.48 The dominant policy literature can never be refuted; the IMF can never be wrong; the liberalreformers in Russia and similar countries can never go wrong. The Sisyphean labor of reform is neverfinished (and since the reformers are never discredited, their claim on power is always valid). From thestandpoint of science, any hypothesis that cannot be disproved by evidence and is always right is thereforenot scientific. It has no value, much like the hypothesis that people can be immortal if they have the politicalwill not to die. As Jonathan Swift wrote,
“The professors contrive new methods of agriculture and building, and new instruments andtools for all trades and manufactures, whereby, as they undertake, one man shall do thework of ten; a place may be built in a week, of materials so durable as to last for everwithout repairing. All the fruits of the earth shall come to maturity at whatever season wethink fit to choose, and increase an hundredfold more than they do at present, withinnumerable other happy proposals. The only inconvenience is, that none of these projectsare yet brought to perfection, and in the meantime the whole country lies miserably waste,the houses in ruins, and the people without food or clothes.”49
Paradigm Regained
Why does the dichotomy of market and government fit Western market and developing economies andpromote growth policies but fail on both counts in post-Communist countries? This dichotomy serves asa shortcut, which reduces a multidimensional world to one—and, as it turns out, false—dimension. It
Paradigm Lost, Paradigm Regained: Common Versus Private Income 19
50An important literature, starting with Thomas Hobbes and with Henry James Sumner Maine’s classic Oxfordlectures, analyzes common property on land and other assets as it leads to runs, overuse, and depletion. See ThomasHobbes, De Cive or The Citizen, especially p. 94; Thomas Hobbes, Leviathan; Henry Sumner Maine, Village-Communities in the East and West (London: John Murray, 1872); H. Scott Gordon. “The Economic Theory of a Common-Property Resource: The Fishery,” Journal of Political Economy 62, no. 2 (April 1954): 124-142; Garrett Hardin, "TheTragedy of the Commons," Science 162 (December 1968): 1243-1248; Vernon L. Smith. “The Primitive Hunter Culture,Pleistocene Extinctions, and the Rise of Agriculture,” Journal of Political Economy 83, no. 4 (August 1975): 727-755;Garett Hardin and John Baden, eds., Managing the Commons (San Francisco: Freeman, 1977); Carlisle F. Runge,“Common Property Externalities: Isolation, Assurance, and Resource Depletion in a Traditional Grazing Context,”American Journal of Agricultural Economics 63, no. 4 (November 1981): 595-606; and, Garrett Hardin, “The Tragedyof the Unmanaged Commons: Population and the Disguises of Providence,” in Robert V. Andelson, ed., CommonsWithout Tragedy: Protecting the Environment from Overpopulation–A New Approach (London: Shepheard-Walwynand Savage, MD: Barnes & Noble, 1991), pp. 162-185. A major documented historic case of the disincentive, indeeddevastating, effect of common property is the story of the Plymouth colony in the early seventeenth century. WilliamBradford, the second governor of the Plymouth Colony, left its classic record and insightful analysis: William Bradford,Bradford’s History of Plymouth Plantation (Boston: Wright & Potter Printing Co., 1900).
equates limited government and private property with the market economy and it identifies a big, restrictiveGovernment and state ownership with socialism. Neither of these two equations holds universally.
They hold only in three major but special cases: (1) in Western market economies with limitedgovernment; (2) under central planning with near-total socialism and total government; and (3) in many (butnot all) developing and historical economies in-between. Yet, in Russia and similar post-Communisteconomies, limited government and private property coexist with near-total socialism of the enterprisenetwork, not with the market economy. At the same time, China and similar post-Communist economiesfoster the new-entrant market economy with little private ownership and under highly restrictivegovernment. These conjunctions break both equations: Socialism is not big, restrictive Government andstate ownership; the market economy is not limited government and private property.
But this new experience also breaks the unidimensional, reductionist paradigm and immediatelyopens several new dimensions. The government has its own dimension, ranging from highly restrictive tolimited to absent. Limited government embodies economic liberty. The type of property is anotherdimension, which extends from common property of all to property rights of private and public entities.The property rights literature elaborates this dichotomy, showing that common property implies commonaccess to assets and resources. Common access leads to predatory runs on resources and their depletion,as happens with land, water, and wild game in traditional societies.50 Private property, state ownership,and other types of property rights exclude common access and internalize the use of resources, whereascommon property socializes and redistributes resources.
The property dimension and the government dimension
To initiate a break from the one-dimensional paradigm, figure 2.3 introduces a two-dimensional
Paradigm Lost, Paradigm Regained: Common Versus Private Income 20
51We tried to select all distinct and important property episodes from the literature. Missing cases can bereadily added to figure 2.3 and overlapping cases dropped. Most designations are self-explanatory, but some historicalepisodes do not have conventions in the literature and we invented their names. Misidentified cases can be readilyrearranged by different property types. A short reference list from the voluminous literature includes Jacques Attali, AuPropre et au Figure: Une Histoire de la Propriete (Paris: Fayard, 1988); International Encyclopedia of ComparativeLaw , vol. 6, Frederick H. Lawson, ed., Property and Trust (The Hague: M. Nijhoff, 1983); Michael Hudson and BaruchA. Levine, eds., Privatization in the Ancient Near East and Classical World (Cambridge: Peabody Museum ofArchaeology and Ethnology, Harvard University, 1996); Moses I. Finley, Studies in Land and Credit in Ancient Athens,500-200 B.C.: The Horos Inscriptions (New Brunswick: Transaction Books, 1985); Charles Tilly, Coercion, Capital, andEuropean States, AD 990-1990 (Cambridge: Basil Blackwell, 1990); Baber Johansen, The Islamic Law on Land Tax andRent: The Peasant’s Loss of Property Rights as Interpreted in the Hanafite Legal Literature of the Mamluk andOttoman Periods; Irfan Habib, The Agrarian System of Mughal India, 1556-1707; Henry Sumner Maine, Village-Communities in the East and West; Charles P. Issawi, ed., The Economic History of the Middle East, 1800-1914: A Bookof Readings; Alfred W. B. Simpson, A History of the Land Law (Oxford: Clarendon Press, 1986); Wendy Davis and PaulFouracre, eds., Property and Power in the Early Middle Ages (Cambridge: Cambridge University Press, 1995);Athanassios N. Yiannopoulos, Personal Servitudes: Usufruct Habitation, Rights of Use (St. Paul, MN: West PublishingCo., 1989); Francois Chevalier, Land and Society in Colonial Mexico: The Great Hacienda (Berkeley: University ofCalifornia Press, 1963); George L. Beckford, Persistent Poverty: Underdevelopment in Plantation Economies of the ThirdWorld (New York: Oxford University Press, 1972); Richard Sheridan, Sugar and Slavery: An Economic History of theWest Indies, 1623-1775 (Aylesbury: Ginn & Co., 1974); Robert W. Fogel, Without Consent or Contract (New York:W.W. Norton, 1989); Robert W. Fogel and Stanley L. Engerman, Time on the Cross: The Economics of American NegroSlavery (New York: W.W. Norton, 1989); John H. Coastworth and Alan M. Taylor, eds., Latin America and the WorldEconomy since 1800 (Cambridge: Harvard University Press, 1998); Stuart B. Schwartz, Sugar Plantations in theFormation of Brazilian Society: Bahia, 1550-1835 (Cambridge: Cambridge University Press, 1985); Kenneth L. Sokoloffand Stanley L. Engerman, “Institutions, Factor Endowments, and Paths of Development in the New World,” Journal ofEconomic Perspectives 14, no. 3 (Summer 2000): 217-232; Richard H. Steckel and Joseph M. Prince, “Tallest in the World:Native Americans of the Great Plains in the Nineteenth Century,” American Economic Review 91, no. 1 (March 2001):287-204; and, William L. Megginson and Jeffry M. Netter, “From State to Market: A Survey of Empirical Studies onPrivatization.”
frame. It assembles 32 empirical property episodes around the world during the last 10,000 years andbeyond and arranges them on the property and government dimensions.51 The horizontal axis constitutesthe property dimension. It extends from zero socialization under private ownership to total socializationunder common property. Socialization increases and privatization declines throughout five selectedproperty types: (1) private property, (2) cooperative ownership, (3) local government ownership, (4)national state ownership, and (5) common property. The first four types embody property rights and forma dichotomous relationship against common property.
We treat confiscation and redistribution of property by the government (nationalization) or byprivate predators (e.g., conquest, brigandry, piracy, or periodic redistribution of assets) as a conversioninto common property, even if property rights of the new owners settle after confiscation and redistribution.Plainly, redistribution of assets automatically makes property common until a new settlement of propertyrights. Common property can be viewed as perpetual redistribution of assets and resources, whileconfiscations exemplify one-time, short-term commonization of property. The difference is merely induration, not in substance. Figure 2.3 marks common property in red, both permanent common propertyand transient confiscations and other redistributions. Empirically, confiscations and redistributions were
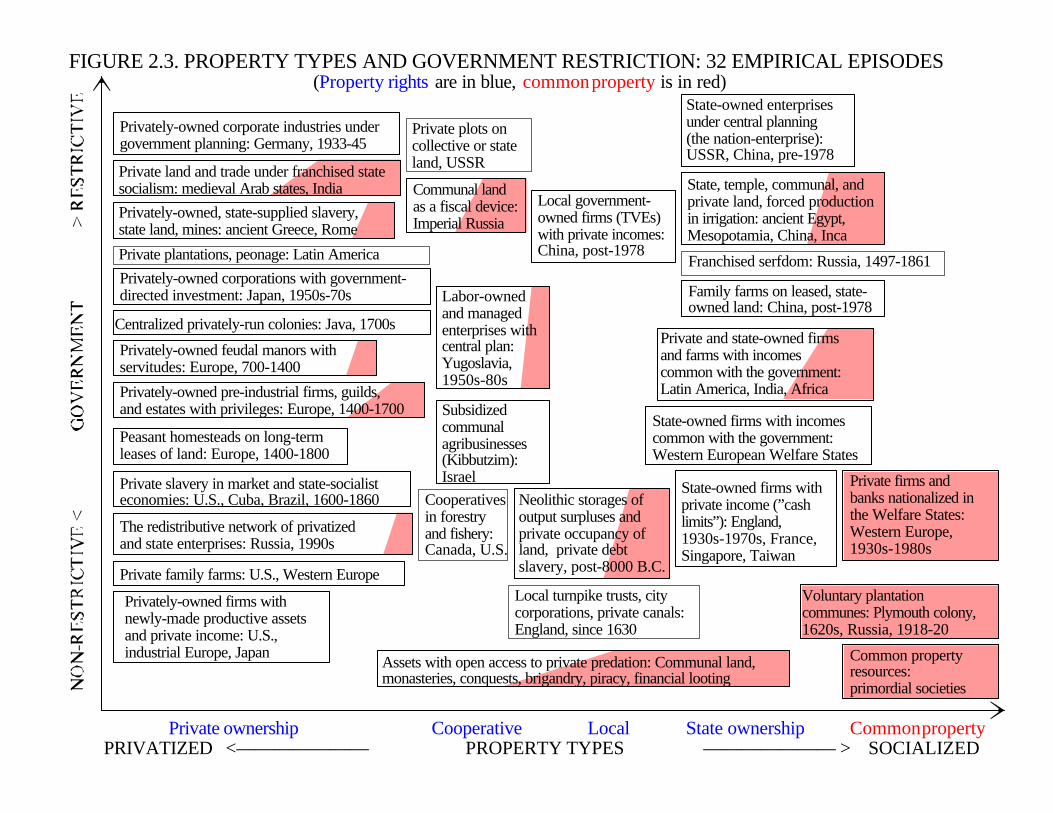
FIGURE 2.3. PROPERTY TYPES AND GOVERNMENT RESTRICTION: 32 EMPIRICAL EPISODES(Property rights are in blue, common property is in red)
Private ownership Cooperative Local State ownership Common propertyPRIVATIZED <——————— PROPERTY TYPES ——————— > SOCIALIZED
Privately-owned firms withnewly-made productive assetsand private income: U.S.,industrial Europe, Japan
State-owned firms withprivate income (”cash limits”): England,1930s-1970s, France,Singapore, Taiwan
Local government-owned firms (TVEs)with private incomes:China, post-1978
The redistributive network of privatizedand state enterprises: Russia, 1990s
Privately-owned feudal manors withservitudes: Europe, 700-1400
Centralized privately-run colonies: Java, 1700s
Privately-owned corporate industries undergovernment planning: Germany, 1933-45
Privately-owned corporations with government-directed investment: Japan, 1950s-70s
Subsidizedcommunalagribusinesses(Kibbutzim):Israel
Privately-owned, state-supplied slavery,state land, mines: ancient Greece, Rome
Privately-owned pre-industrial firms, guilds,and estates with privileges: Europe, 1400-1700
Peasant homesteads on long-termleases of land: Europe, 1400-1800
Private family farms: U.S., Western Europe
Private slavery in market and state-socialisteconomies: U.S., Cuba, Brazil, 1600-1860
Local turnpike trusts, citycorporations, private canals:England, since 1630
Private land and trade under franchised statesocialism: medieval Arab states, India
Neolithic storages ofoutput surpluses andprivate occupancy ofland, private debtslavery, post-8000 B.C.
Labor-ownedand managedenterprises withcentral plan:Yugoslavia,1950s-80s
State-owned firms with incomescommon with the government:Western European Welfare States
Private and state-owned firmsand farms with incomescommon with the government:Latin America, India, Africa
State, temple, communal, andprivate land, forced productionin irrigation: ancient Egypt,Mesopotamia, China, Inca
State-owned enterprisesunder central planning(the nation-enterprise):USSR, China, pre-1978
Private firms andbanks nationalized inthe Welfare States:Western Europe,1930s-1980s
Voluntary plantationcommunes: Plymouth colony,1620s, Russia, 1918-20
Common propertyresources: primordial societies
Cooperativesin forestryand fishery:Canada, U.S.
Assets with open access to private predation: Communal land,monasteries, conquests, brigandry, piracy, financial looting
Private plantations, peonage: Latin America Franchised serfdom: Russia, 1497-1861
Family farms on leased, state-owned land: China, post-1978
Private plots oncollective or stateland, USSR
Communal landas a fiscal device:Imperial Russia
Paradigm Lost, Paradigm Regained: Common Versus Private Income 21
frequent on a partial scale in many economies with the otherwise prevalent private, cooperative, localgovernment, or national state ownership. To reflect this history, we mark these cases partly in red to anestimated extent. These are partially mixed episodes of property types.
The vertical axis in figure 2.3 constitutes the government dimension. It extends from totally non-restrictive to totally restrictive government, approximated as the degree of government control overeconomic activity. It is the dimension from absent to limited to total government. Empirical cases of 32property episodes in figure 2.3 are organized accordingly.
Figure 2.3 illustrates how a simple two-dimensional frame can encompass and systematize empiricalinformation around the world and through history. And it does more. By organizing empirical cases, itshows that a frequently postulated complementarity between limited government and property rights orbetween limited government and private property just does not exist. Another frequently postulatedcomplementarity between restrictive government and state ownership, the converse of the aboverelationship, also does not exist. One can view figure 2.3 as a scatter bivariate diagram. Both variables,property types and government restriction, are scattered all over the map. There is no correlation betweenthem. The empirically observable long-term and world-wide relationship between government restrictionand property types is random. It is beyond the scope of our book to investigate why this is so and whatit means for policy. But it follows that liberalization and privatization are neither complementary norcontradictory to each other. The variable experience of post-Communist economies, from Hungary andPoland to China and Vietnam, reinforces this point. Property and government are independent andseparate dimensions.
The income dimension and the government dimension
Figure 2.1 introduced one more dimension, the income dimension, in the empirical case of 42 post-Communist economies. One can design the income dimension as the expansion of private income and theextinction of common income, as we did on the horizontal axis in figure 2.1. One can take a more somberapproach and view the income dimension in reverse, as the exception of market economies from the vastextant of socialist economies. Figure 2.4 takes this approach. It makes a stylized presentation of theincome dimension in the two-dimensional frame similar to figure 2.3. The vertical axis is the same extentof government restriction of the economy, from absent to limited to total government, as in figure 2.3. Thehorizontal axis in figure 2.4 is the new income dimension. It substitutes for the property dimension in figure2.3. By analogy with the property dimension from private to common property, the horizontal axis in figure2.4 constitutes the income dimension from totally private to totally common income. It represents the extentof income redistribution from producers/earners to non-producers/non-earners from zero to 100 percentof GDP.
Dimensionally, the two designs in figures 2.1 and 2.4 are identical as in the proverbial glass half-fulland half-empty. But figure 2.4 looks like the vast expanse of common income, numerous species ofsocialism through history and around the world, and a small island of private income—the market economy
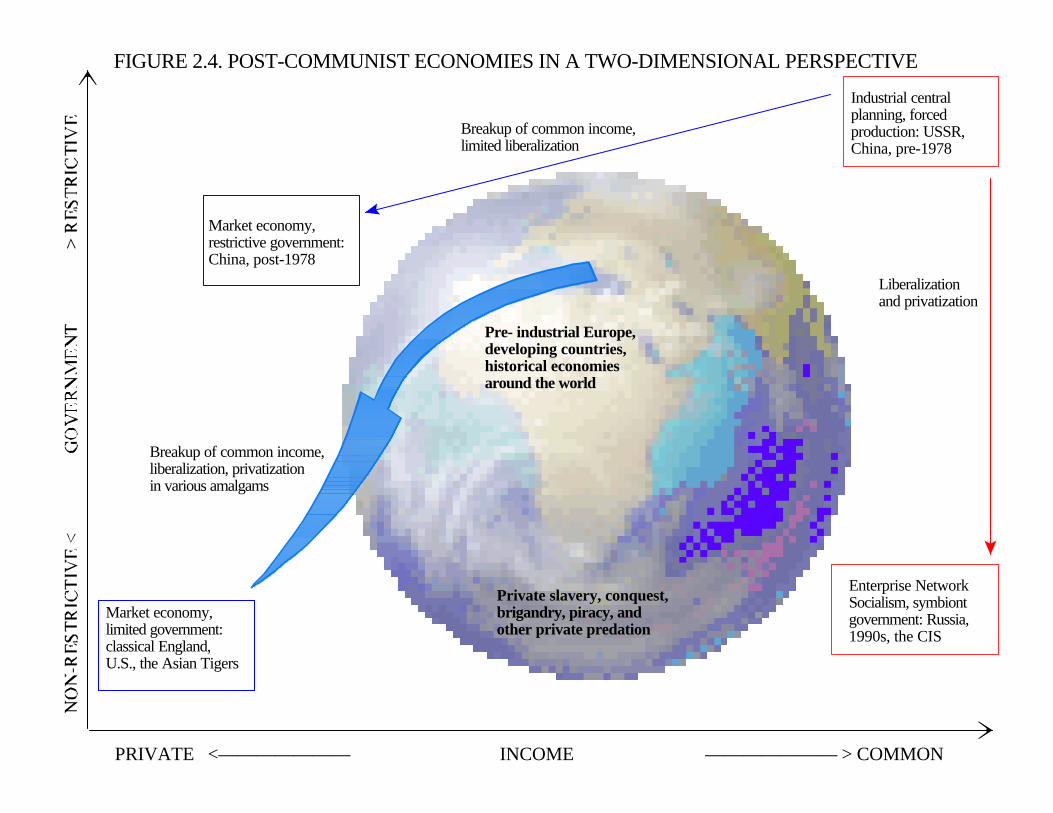
PRIVATE <——————— INCOME ——————— > COMMON
FIGURE 2.4. POST-COMMUNIST ECONOMIES IN A TWO-DIMENSIONAL PERSPECTIVE
Market economy,restrictive government:China, post-1978
Industrial centralplanning, forcedproduction: USSR,China, pre-1978
Enterprise NetworkSocialism, symbiontgovernment: Russia,1990s, the CIS
Market economy,limited government:classical England,U.S., the Asian Tigers
Private slavery, conquest,brigandry, piracy, andother private predation
Pre- industrial Europe,developing countries,historical economiesaround the world
Liberalizationand privatization
Breakup of common income,limited liberalization
Breakup of common income,liberalization, privatizationin various amalgams
Paradigm Lost, Paradigm Regained: Common Versus Private Income 22
at the world’s end and history’s crest. The blue arrows indicate the breakup of common income in thedirection of private income economies along the income dimension. The slopes of the blue arrowscorrespond to estimated reductions of government restriction—liberalization and privatization in variouscases. The red drop-down arrow from central planning to Enterprise Network Socialism depicts theinheritance of the enterprise network—liberalization and privatization with no breakup of common income.This red arrow charts the devolution from single common income to fungible common income.
By the measures of income redistribution and government restriction, figure 2.4 fits post-CommunistRussia and China on the same map with Western market economies, central planning in Communistcountries, and an array of historical and developing economies lumped together. Only the split of socialism(common income) from restrictive government, the split of the market economy (private income) fromlimited government, and the general split between income and government dimensions make it possible tofit post-Communist economies on the map of the world.
The income dimension, private income, and common income
The moment has come to formally introduce the dichotomy of private vs. common income and theincome dimension. The reader will see why this has not been done at the outset and why the priorinvocations of private and common income might have seemed sketchy if not obscure. The designations“internal,” “exclusive,” “socialized,” “redistributed” sounded, admittedly, more rhetorical than rigorous. Ittakes an excursion into the ontological nature of income. We make it brief now and will expand it and layout its foundations in the next chapter. The ontological problem of income is hard because it is twofold.
1. What makes income a dimension is that income constitutes returns on production, and returns maynot be exclusively appropriated by producers to the exclusion of non-producers. Thus returns canbe internalized or socialized.
2. What makes income a unique, self-contained dimension is that it can be redistributed—taken bynon-producers from producers. Other returns, such as benefits of inventions and costs of pollution,cannot be taken away and redistributed. They can only spill over from producers to non-producers and thus add returns to non-producers. Redistribution of income and addition of returns(benefits or costs) constitute two different types of socialization. One is spillovers (externalities),the other, takeovers (redistribution). One is benevolence or negligence, the other, predation andsuppression. The former may slow down technological progress, the latter suppresses output. Thisis a fateful, albeit ignored, difference.
To make a long story short, these two ontological sides of income can be sorted out as follows:
1. Income is returns on products and on factors of production, such as labor (wages), human capital(wages and prizes), financial and physical capital (interest, returns on financial assets, and profit), and land(rent). In the interactive flow of production, returns accrue simultaneously to the producer and form his
Paradigm Lost, Paradigm Regained: Common Versus Private Income 23
52Arthur C. Pigou, The Economics of Welfare (London: Macmillan and Co., 1929), pp. 135-145, 174-214, 223-227.The qualifier ‘net’ is important in order to take into account a possible value subtraction which we discussed in chapter1.
53A compendium of classic articles is Tyler Cowen, ed., Public Goods and Market Failures: A CriticalExamination (New Brunwick: Transaction Publishers, 1992). See also, Richard Cornes and Todd Sandler, The Theoryof Externalities, Public Goods and Club Goods (New York: Cambridge University Press, 1996).
54Arthur C. Pigou, The Economics of Welfare, pp. 135-145, 174-214, 223-227. We use the notion ‘returns to theproducer’ instead of ‘the marginal private product’ introduced by Pigou and instead of ‘private returns’ in thesubsequent literature. The reason is substance, not connivance. The word ‘private’ in the literature is meant in theorganizational sense, that is, everything that is not government: households and firms. This leaves a big hole in theaccounting arithmetic of ‘private returns’ against social returns. For only if returns to the government as the producerof public services coincide with social returns, can returns to firms and households coincide with social returns. Withouttaking government services and government receipts into account, one cannot infer from the national income statisticswhether or not ‘private returns’ coincide with social returns, and this defeats the very notion of ‘private returns’ in theorganizational sense. This leads us to redefine the word ‘private.’ We are more Pigouian than Pigou. We use the term‘private’ in his intrinsic sense, that is not the type of organization but the exclusion of non-earners. ‘Private’ in thissense means exactly the Pigouian coincidence of returns to the producer and social returns. In this sense, private incomeof the government or privateness of public income necessarily complement private incomes of firms and households.We expand this theme in chapters 3 and 4.
income, and to the economy and form national income, GDP. Returns to the economy are real products(goods), real output, measured as the value-added which sum up to GDP. Returns to the producer maybe real products or income, both in kind and in money. It is a simple accounting fact that each produceradds real income (output) to national income. Arthur C. Pigou called this addition the marginal social netproduct.52 Subsequent literature adopted the term social returns.53
Pigou invented a new accounting approach to the economic problem. He pointed out that, invarious economies and sectors of each economy, returns to the producer and social returns may or maynot coincide.54 If they coincide, producers internalize their returns. Internalization means the equivalenceof social returns and returns to the producer. Internalized returns are exclusive to their producers andearners. If social returns and returns to the producer differ, returns are socialized. Socialized returns arenon-exclusive because they accrue to non-producers and non-earners in addition to, or instead of,producers and earners.
Don’t be intimidated by the jargon. This part of the story is simpler than it sounds. Social returnsare products, goods. Returns to the producer are products kept for himself and income earned fromothers. The relationship between social returns and returns to the producer is that between production andcompensation, between contribution and remuneration. If they are equivalent, producers earn what theyhave produced and exclude non-producers/non-earners of a given real income (output). This isinternalization. If production and compensation differ, non-producers and non-earners are not excludedand they appropriate what they did not earn. This is socialization.
Paradigm Lost, Paradigm Regained: Common Versus Private Income 24
55A simple proof of social returns on ideas exceeding returns to the producers is that life is short and ideas arelong. No life-time income can recover long-term social benefits of ideas. For an additional discussion on the importanceof migration flows for proving this proposition, see Robert E. Lucas, “On the Mechanics of Economic Development,”Journal of Monetary Economics 22, no. 1 (July 1988): 3-42.
56On the negative side, pollution and other damages can be negotiated and compensated between propertyowners because more efficient producers can afford and will be willing to pay less productive ones to stay out of theway. Ronald H. Coase, “The Problem of Social Cost,” Journal of Law and Economics 3, no. 3 (October 1960): 1-44.
The next part of the story is hard. There are two types of socialization and internalization. Theyconcern: (a) ideas, science, invention, innovation, and technological discoveries when returns to theirauthors are smaller than returns to the economy, society, and humankind55; and (b) confiscations and otherredistributions of income and output from producers to non-producers by the government and privatepredators. The difference between these two types leads us to the second side of the ontological natureof income.
2. Ontologically, people produce two types of goods. Human products can be either additive orsubject to redistribution (redistributable, in short). Ideas, science, inventions, innovation, and technologicaldiscoveries on the positive list and accidents, fires, and pollution on the negative list typify additive products.They can be used by non-producers without taking them from producers. Indeed, ontologically, theycannot be subtracted from producers. Additive products are non-redistributable products by nature. Theyadd returns to non-producers and the economy at large without subtracting from producers. Thus returnson additive goods are additive themselves.
To employ a familiar metaphor, social returns on additive goods can spill over from producers tonon-producers. To use another expression from the literature, social returns on additive goods can createexternal economies—externalities, in short. This happens when returns on additive goods spill over,primarily when returns to the producers of ideas are smaller than their social returns. Non-producers andthe economy at large are not excluded. Social returns are not recovered, not appropriated by producers.This is socialization of additive goods. But some inventions can be kept as trade secrets and manytechnological ideas can be patented. One can also think of government salaries, grants, and prizes forscientists (direct and indirect, from tax-exempt organizations) and scholarships for students as compensationof producers of ideas. All these devices bring returns to the producers in line with social returns on additivegoods.56 Social returns are appropriated, recovered by producers in the form of income. This isinternalization of additive goods. In the heavy language of the literature, this is internalization of externalities.
Most other products are redistributable. Apart from ideas, pollution, and other additive goods, alloutput of goods and services is redistributable. All ordinary goods, from bread to computers and fromlaundry to surgery, are redistributable. Income, being returns on products and factors of production, isredistributable itself. No unit of redistributable products and no unit of income can be used by non-producers/non-earners without taking it from producers/earners. Income cannot be added to non-earners(if they don’t produce and earn more) without subtracting it from earners. Non-earners can add income,
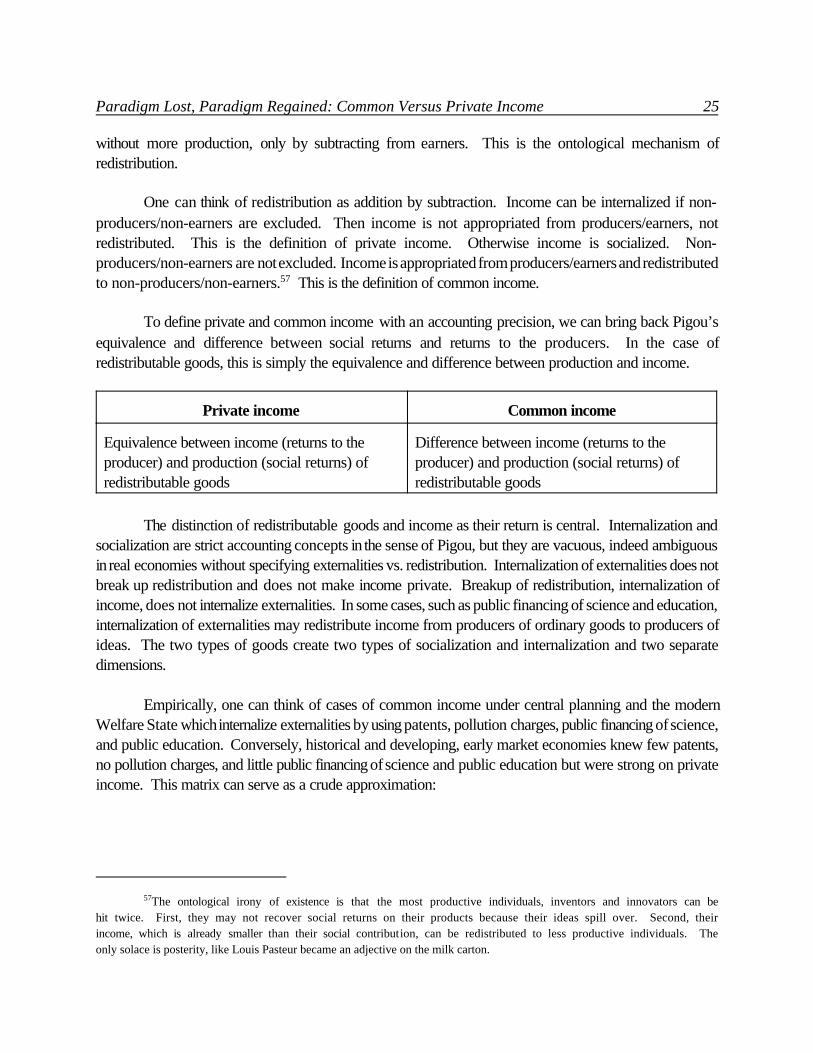
Paradigm Lost, Paradigm Regained: Common Versus Private Income 25
57The ontological irony of existence is that the most productive individuals, inventors and innovators can behit twice. First, they may not recover social returns on their products because their ideas spill over. Second, theirincome, which is already smaller than their social contribution, can be redistributed to less productive individuals. Theonly solace is posterity, like Louis Pasteur became an adjective on the milk carton.
without more production, only by subtracting from earners. This is the ontological mechanism ofredistribution.
One can think of redistribution as addition by subtraction. Income can be internalized if non-producers/non-earners are excluded. Then income is not appropriated from producers/earners, notredistributed. This is the definition of private income. Otherwise income is socialized. Non-producers/non-earners are not excluded. Income is appropriated from producers/earners and redistributedto non-producers/non-earners.57 This is the definition of common income.
To define private and common income with an accounting precision, we can bring back Pigou’sequivalence and difference between social returns and returns to the producers. In the case ofredistributable goods, this is simply the equivalence and difference between production and income.
Private income Common income
Equivalence between income (returns to theproducer) and production (social returns) ofredistributable goods
Difference between income (returns to theproducer) and production (social returns) ofredistributable goods
The distinction of redistributable goods and income as their return is central. Internalization andsocialization are strict accounting concepts in the sense of Pigou, but they are vacuous, indeed ambiguousin real economies without specifying externalities vs. redistribution. Internalization of externalities does notbreak up redistribution and does not make income private. Breakup of redistribution, internalization ofincome, does not internalize externalities. In some cases, such as public financing of science and education,internalization of externalities may redistribute income from producers of ordinary goods to producers ofideas. The two types of goods create two types of socialization and internalization and two separatedimensions.
Empirically, one can think of cases of common income under central planning and the modernWelfare State which internalize externalities by using patents, pollution charges, public financing of science,and public education. Conversely, historical and developing, early market economies knew few patents,no pollution charges, and little public financing of science and public education but were strong on privateincome. This matrix can serve as a crude approximation:
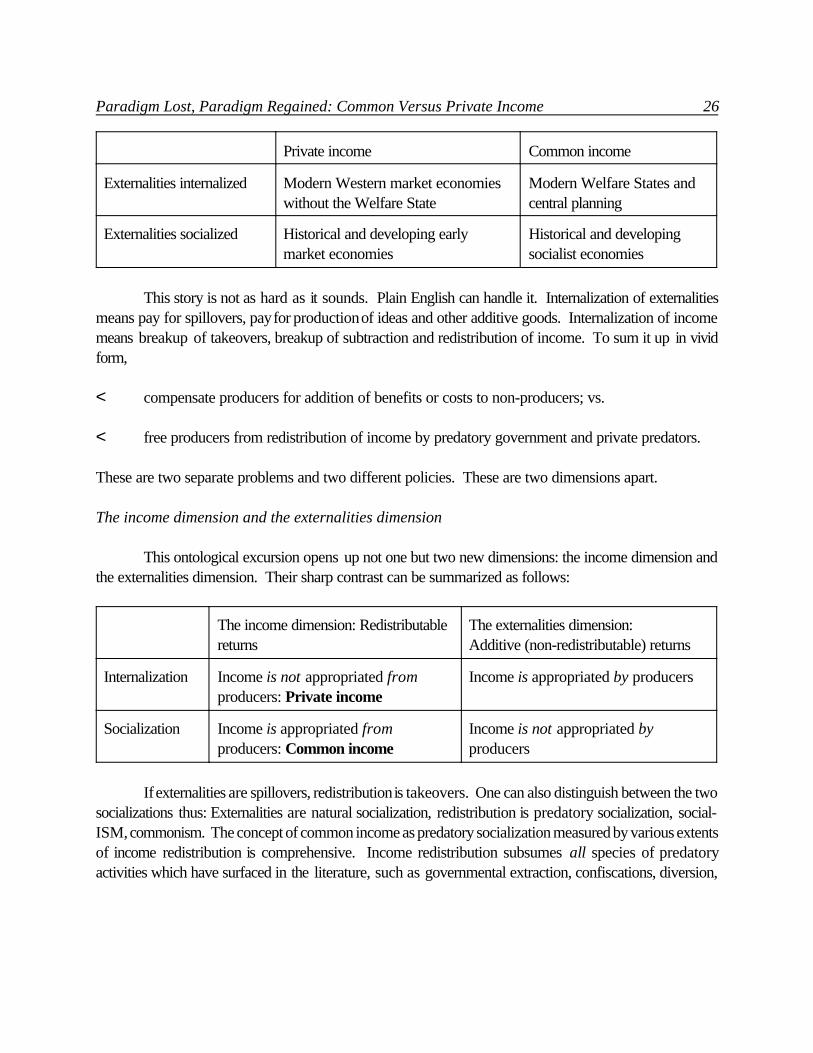
Paradigm Lost, Paradigm Regained: Common Versus Private Income 26
Private income Common income
Externalities internalized Modern Western market economieswithout the Welfare State
Modern Welfare States andcentral planning
Externalities socialized Historical and developing earlymarket economies
Historical and developingsocialist economies
This story is not as hard as it sounds. Plain English can handle it. Internalization of externalitiesmeans pay for spillovers, pay for production of ideas and other additive goods. Internalization of incomemeans breakup of takeovers, breakup of subtraction and redistribution of income. To sum it up in vividform,
< compensate producers for addition of benefits or costs to non-producers; vs.
< free producers from redistribution of income by predatory government and private predators.
These are two separate problems and two different policies. These are two dimensions apart.
The income dimension and the externalities dimension
This ontological excursion opens up not one but two new dimensions: the income dimension andthe externalities dimension. Their sharp contrast can be summarized as follows:
The income dimension: Redistributablereturns
The externalities dimension:Additive (non-redistributable) returns
Internalization Income is not appropriated fromproducers: Private income
Income is appropriated by producers
Socialization Income is appropriated fromproducers: Common income
Income is not appropriated byproducers
If externalities are spillovers, redistribution is takeovers. One can also distinguish between the twosocializations thus: Externalities are natural socialization, redistribution is predatory socialization, social-ISM, commonism. The concept of common income as predatory socialization measured by various extentsof income redistribution is comprehensive. Income redistribution subsumes all species of predatoryactivities which have surfaced in the literature, such as governmental extraction, confiscations, diversion,
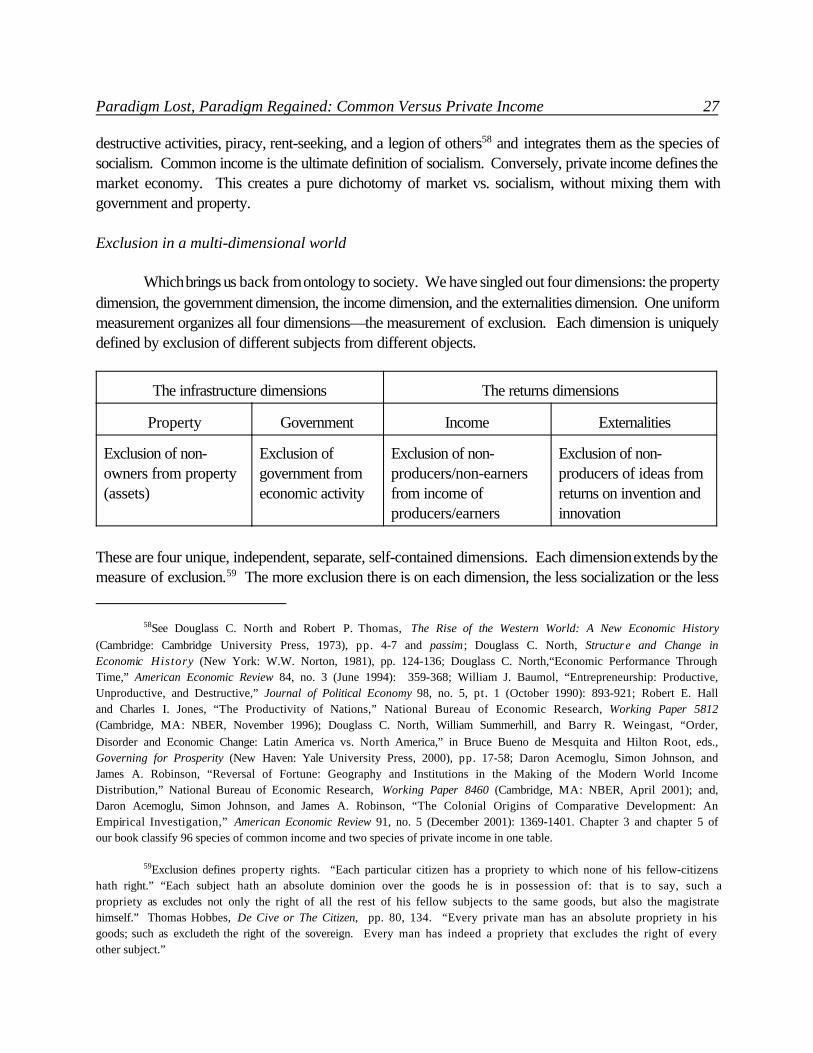
Paradigm Lost, Paradigm Regained: Common Versus Private Income 27
58See Douglass C. North and Robert P. Thomas, The Rise of the Western World: A New Economic History(Cambridge: Cambridge University Press, 1973), pp. 4-7 and passim; Douglass C. North, Structure and Change inEconomic History (New York: W.W. Norton, 1981), pp. 124-136; Douglass C. North,“Economic Performance ThroughTime,” American Economic Review 84, no. 3 (June 1994): 359-368; William J. Baumol, “Entrepreneurship: Productive,Unproductive, and Destructive,” Journal of Political Economy 98, no. 5, pt. 1 (October 1990): 893-921; Robert E. Halland Charles I. Jones, “The Productivity of Nations,” National Bureau of Economic Research, Working Paper 5812(Cambridge, MA: NBER, November 1996); Douglass C. North, William Summerhill, and Barry R. Weingast, “Order,Disorder and Economic Change: Latin America vs. North America,” in Bruce Bueno de Mesquita and Hilton Root, eds.,Governing for Prosperity (New Haven: Yale University Press, 2000), pp. 17-58; Daron Acemoglu, Simon Johnson, andJames A. Robinson, “Reversal of Fortune: Geography and Institutions in the Making of the Modern World IncomeDistribution,” National Bureau of Economic Research, Working Paper 8460 (Cambridge, MA: NBER, April 2001); and,Daron Acemoglu, Simon Johnson, and James A. Robinson, “The Colonial Origins of Comparative Development: AnEmpirical Investigation,” American Economic Review 91, no. 5 (December 2001): 1369-1401. Chapter 3 and chapter 5 ofour book classify 96 species of common income and two species of private income in one table.
59Exclusion defines property rights. “Each particular citizen has a propriety to which none of his fellow-citizenshath right.” “Each subject hath an absolute dominion over the goods he is in possession of: that is to say, such apropriety as excludes not only the right of all the rest of his fellow subjects to the same goods, but also the magistratehimself.” Thomas Hobbes, De Cive or The Citizen, pp. 80, 134. “Every private man has an absolute propriety in hisgoods; such as excludeth the right of the sovereign. Every man has indeed a propriety that excludes the right of everyother subject.”
destructive activities, piracy, rent-seeking, and a legion of others58 and integrates them as the species ofsocialism. Common income is the ultimate definition of socialism. Conversely, private income defines themarket economy. This creates a pure dichotomy of market vs. socialism, without mixing them withgovernment and property.
Exclusion in a multi-dimensional world
Which brings us back from ontology to society. We have singled out four dimensions: the propertydimension, the government dimension, the income dimension, and the externalities dimension. One uniformmeasurement organizes all four dimensions—the measurement of exclusion. Each dimension is uniquelydefined by exclusion of different subjects from different objects.
The infrastructure dimensions The returns dimensions
Property Government Income Externalities
Exclusion of non-owners from property(assets)
Exclusion ofgovernment fromeconomic activity
Exclusion of non-producers/non-earnersfrom income ofproducers/earners
Exclusion of non-producers of ideas fromreturns on invention andinnovation
These are four unique, independent, separate, self-contained dimensions. Each dimension extends by themeasure of exclusion.59 The more exclusion there is on each dimension, the less socialization or the less
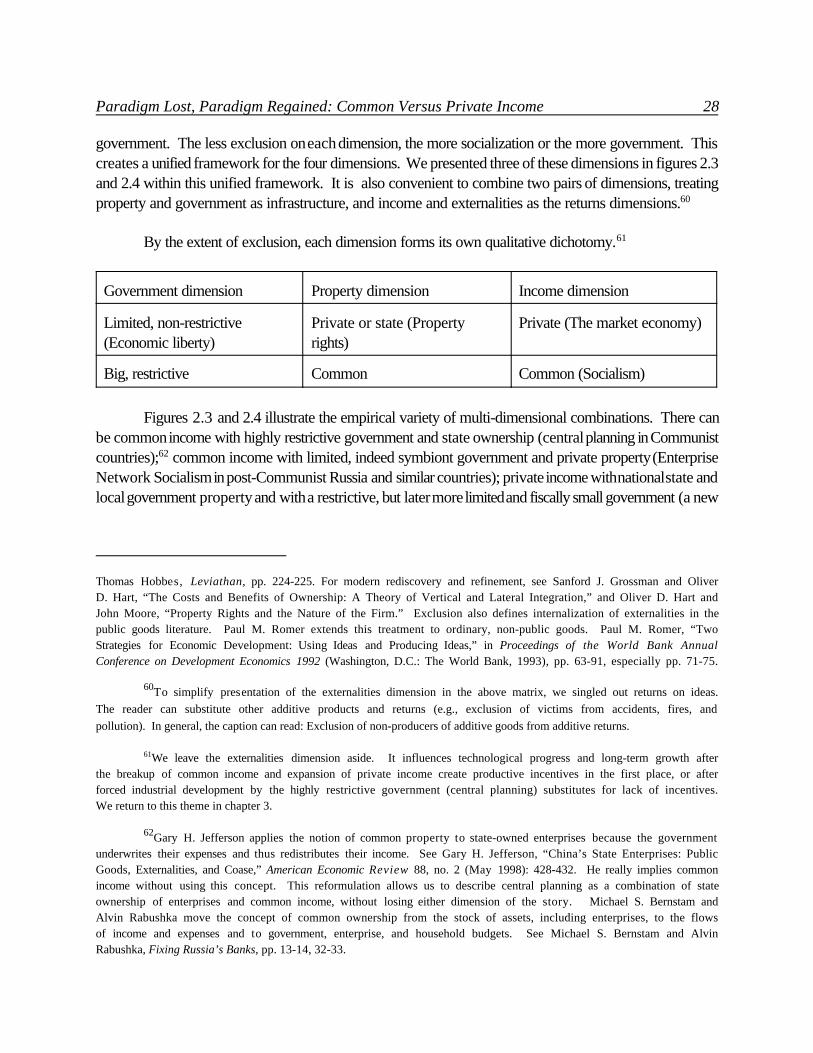
Paradigm Lost, Paradigm Regained: Common Versus Private Income 28
Thomas Hobbes, Leviathan, pp. 224-225. For modern rediscovery and refinement, see Sanford J. Grossman and OliverD. Hart, “The Costs and Benefits of Ownership: A Theory of Vertical and Lateral Integration,” and Oliver D. Hart andJohn Moore, “Property Rights and the Nature of the Firm.” Exclusion also defines internalization of externalities in thepublic goods literature. Paul M. Romer extends this treatment to ordinary, non-public goods. Paul M. Romer, “TwoStrategies for Economic Development: Using Ideas and Producing Ideas,” in Proceedings of the World Bank AnnualConference on Development Economics 1992 (Washington, D.C.: The World Bank, 1993), pp. 63-91, especially pp. 71-75.
60To simplify presentation of the externalities dimension in the above matrix, we singled out returns on ideas.The reader can substitute other additive products and returns (e.g., exclusion of victims from accidents, fires, andpollution). In general, the caption can read: Exclusion of non-producers of additive goods from additive returns.
61We leave the externalities dimension aside. It influences technological progress and long-term growth afterthe breakup of common income and expansion of private income create productive incentives in the first place, or afterforced industrial development by the highly restrictive government (central planning) substitutes for lack of incentives.We return to this theme in chapter 3.
62Gary H. Jefferson applies the notion of common property to state-owned enterprises because the governmentunderwrites their expenses and thus redistributes their income. See Gary H. Jefferson, “China’s State Enterprises: PublicGoods, Externalities, and Coase,” American Economic Review 88, no. 2 (May 1998): 428-432. He really implies commonincome without using this concept. This reformulation allows us to describe central planning as a combination of stateownership of enterprises and common income, without losing either dimension of the story. Michael S. Bernstam andAlvin Rabushka move the concept of common ownership from the stock of assets, including enterprises, to the flowsof income and expenses and to government, enterprise, and household budgets. See Michael S. Bernstam and AlvinRabushka, Fixing Russia’s Banks, pp. 13-14, 32-33.
government. The less exclusion on each dimension, the more socialization or the more government. Thiscreates a unified framework for the four dimensions. We presented three of these dimensions in figures 2.3and 2.4 within this unified framework. It is also convenient to combine two pairs of dimensions, treatingproperty and government as infrastructure, and income and externalities as the returns dimensions.60
By the extent of exclusion, each dimension forms its own qualitative dichotomy.61
Government dimension Property dimension Income dimension
Limited, non-restrictive(Economic liberty)
Private or state (Propertyrights)
Private (The market economy)
Big, restrictive Common Common (Socialism)
Figures 2.3 and 2.4 illustrate the empirical variety of multi-dimensional combinations. There canbe common income with highly restrictive government and state ownership (central planning in Communistcountries);62 common income with limited, indeed symbiont government and private property (EnterpriseNetwork Socialism in post-Communist Russia and similar countries); private income with national state andlocal government property and with a restrictive, but later more limited and fiscally small government (a new
Paradigm Lost, Paradigm Regained: Common Versus Private Income 29
63The size of the central government in China, measured by the tax burden as a share of GDP, fell from over 30percent in 1978 to just over 10 percent in 1995. See Alvin Rabushka, “The Great Tax Cut of China”, Wall Street Journal,August 7, 1997. Another key feature of China, which converges it with historical and contemporary archetypical marketeconomies is federalism—the devolution of economic and other power to provincial and local governments. SeeYuanzheng Cao, Yingui Qian, and Barry R. Weingast, “From Federalism, Chinese Style, to Privatization, Chinese Style,”Economics of Transition 7, no. 1 (February 1999): 103-131.
64One can also incorporate additional important dimensions: the type of political system, governance structure(centralized or federalist), war and peace, geographic conditions, factor endowments (land, natural resources, inheritedindustrial structure, human capital stock), culture, ideology, household system (family type), demographic regime, andothers. A model of the world will look like a polygonal space object with a taxonomy of historical and contemporarysocieties within it, dropping lines in their measured place on each of the dimensions. A computer program will movecountries inside the space when historical information is revised or contemporary conditions change.
market economy in post-Communist China);63 common income with private property and big, restrictivegovernment (central planning in Nazi Germany); common income with private property and limitedgovernment (slavery in the U.S. Antebellum South); largely private income with a mix of state and privateproperty and relatively big government (Western Europe in the decades after World War II); privateincome with private property and moderately limited government (the U.S.); and numerous othercombinations. Every reader can entertain his own encyclopedic knowledge applying the above matrix andthe frames of figures 2.3 and 2.4 to the facts of history and to the map of the world.64
A multi-dimensional perspective can better account for diverse post-Communist developments andharness the experience of Western market, central plan, developing, and post-Communist economies inone unified framework. A one-dimensional dichotomy of market vs. government is unable to treat all thesedifferent cases within a single, unified framework. It fails to explain even one diverse, post-Communistexperience, from the Great Contraction in Russia and similar countries to economic expansion in China andits neighbors. This chapter has introduced a multi-dimensional approach and the income dimension fromprivate to common income. The next chapter expands their dissection. It links private and common incometo production.
The Omnipresence of Common Income in a Multi-Dimensional World 1
Chapter 3The Omnipresence of Common Income in a Multi-Dimensional World
Post-Communist evolution in Russia, China, and other countries marked two systemic separations. China’sexperience detached the market economy from limited government and private property. Russia’sexperience split socialism from big, restrictive government and state ownership. Ubiquitous socialism inRussia and similar countries is run by the private enterprise network with free transactions under limitedgovernment. The new-entrant market economy in China and similar countries functions under restrictivegovernment controls and with government ownership at the local and national level. Chapters 1 and 2documented these developments. Chapter 2 extended them into a multi-dimensional perspectivesummarized in figure 2.4. This chapter follows with a multi-dimensional cross-section, accounting,measurement, and organization of economic systems.
Multi-dimensional permutation after central planning is extreme but not unique. Table 3.1assembles a three-dimensional catalog of all major economies for the last 10,000 years and beyond by thequalitative types of income, government, and property. It classifies economies by private vs. commonincome (the market economy vs. socialism), by restrictive vs. non-restrictive (limited) government, and byprivate, cooperative, local government, and national state ownership vs. common property. Table 3.1demonstrates that income types, government types, and property types are uncorrelated and form multiplecombinations. Their heterogeneity runs through time and space. Figures 3.1 to 3.3 quantify and locateeconomic groups from table 3.1 on a multi-dimensional map. Table 3.1 disaggregates into the table ofeconomic species, akin to the Periodic Table of Elements. The two-dimensional and four-dimensionalversions follow this chapter. Species are economic systems that are unique, self-contained, non-overlapping, and indivisible without breakups. The table of economic species currently enumerates 110elementary systems and is expandable.
Socialism operates through common income, the market economy though private income. Torecapitulate from Chapter 2, private income and common income are ontological and accounting concepts.Private income means exclusion of non-earners from a given income. Exclusion equalizes production andremuneration of redistributable goods. These are goods that can be taken away by non-producers fromproducers. Ordinary output and income itself are ontologically redistributable. Income redistribution isaddition of one man’ income by subtraction of another man’s income. This non-exclusion divergesremuneration from production of redistributable goods. Income redistribution from earners to non-earnersis the operational process of common income.
What unfolds in this chapter is the omnipresence of common income under all extents ofgovernment restriction and all types of property. Common income transpires as an original, enduring, andpredominant phenomenon of human existence. Private income phases in slowly, belatedly, and rarely.There is no amount of liberalization and property privatization that can make income not common. But thepolicy challenge is even bigger than that. The next chapters submit that common income suppressesproduction. The breakup of common income, the phase-in of private income is the missing link inunderstanding and making long-term economic progress.

The Omnipresence of Common Income in a Multi-Dimensional World 2
1The most elaborate analysis of the flow of funds can be found in the Flow of Funds Accounts of the UnitedStates, compiled by the Federal Reserve Board at http://www.federalreserve.gov/releases/z1/current/data.htm. Methodsof accounting for specific line items can be consulted in the National Product and Income Accounts compiled by the U.S.Department of Commerce at http://www.bea.doc.gov/bea/dn/nipaweb/SelectTable.asp?Selected=N. An excellentreconstruction of the flow of funds in Russia in 1991, the last year under central planning, is in The World Bank, Russian
Section A. Charting a Multi-Dimensional World
A multi-dimensional perspective returns Russia, China, and other post-Communist economies to the mapof the world. Figures 3.1 and 3.3 expand figure 2.4 to actual world economies. Russia and China fit themap together with all other major groups of economies, past and present. Russia and China add to the mapwhich includes primordial societies, historical economies around the globe, Western market economies,Communist central planning, and contemporary developing economies. Not a single major economiccluster is missing. The multi-dimensional map is comprehensive.
In contrast, Russia and China are missing on the one-dimensional map in figure 3.2. It tries to fitempirical world economies along the linear dichotomy of market vs. government. This map definessocialism as big government and state ownership and it equates the market economy with limitedgovernment and private property. On the single dimension, the market economy can be measured only asa residual of government, after accounting for the extent of government controls in the economy. EnterpriseNetwork Socialism in Russia with free transactions, limited government, and private property and the new-entrant market economy in China with restrictive government and marginal private property do not fit theline and fall out. They are off the one-dimensional map. Their fitting in figures 3.1 and 3.3 becomespossible due to multi-dimensional accounting. It separates common income (socialism) from restrictivegovernment and state ownership and splits private income (the market economy) from limited governmentand private property.
The two-dimensional frame
The government dimension on the vertical axis in figure 3.1 makes up the longitude of the map fromabsent to limited to restrictive to total government. The income dimension on the horizontal axis limns thelatitude of the map from the market economy to total socialism. They form the two-dimensional frame forfigure 3.1 and similar subsequent figures in this book.
This two-dimensional frame covers the entire flow of economic activity which adds up to GrossDomestic Product (GDP). It is the flow of funds between a multitude of economic actors—firms orenterprises, households, and the government. They all interact in a variety of allocative markets: productmarkets, factor markets of labor, capital and land, and intermediary, financial markets. The flow of funds,in turn, embodies a multitude of bilateral exchange transactions and unilateral confiscations and subsidiesbetween organizations (firms or enterprises), organizations and households, organizations and thegovernment, and households and the government. For brevity, we can call them transactions.1
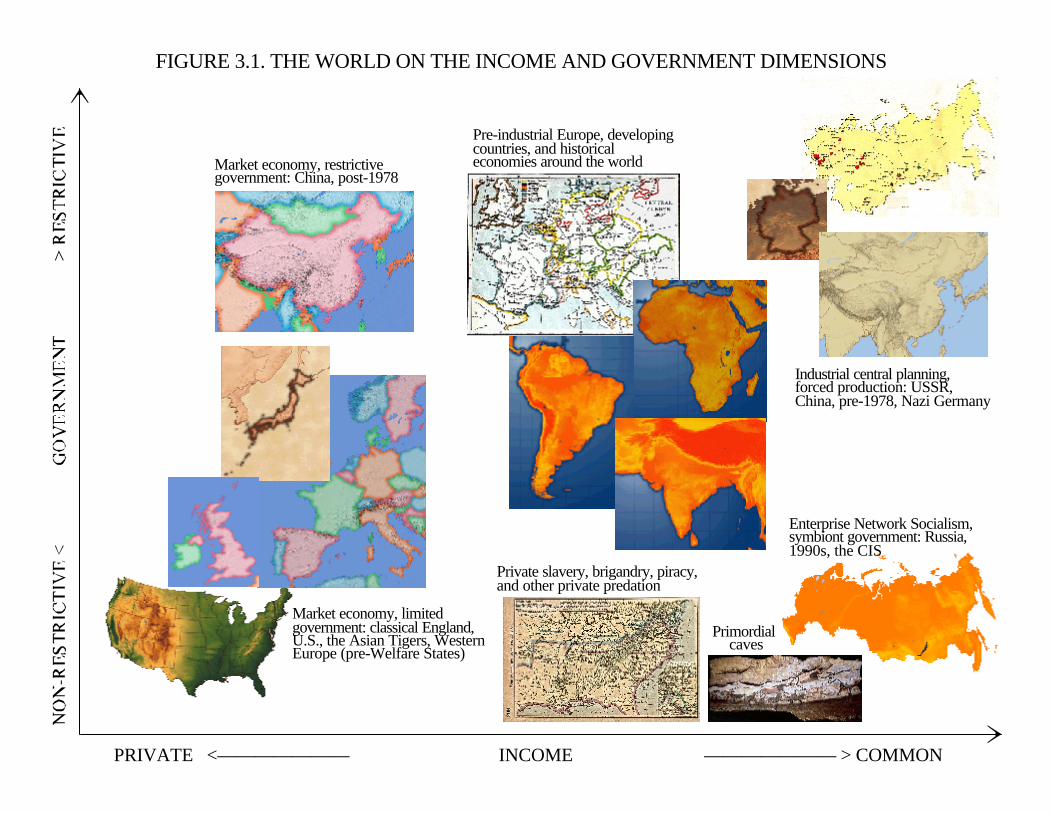
FIGURE 3.1. THE WORLD ON THE INCOME AND GOVERNMENT DIMENSIONS
PRIVATE <——————— INCOME ——————— > COMMON
Industrial central planning,forced production: USSR, China, pre-1978, Nazi Germany
Pre-industrial Europe, developingcountries, and historicaleconomies around the world
Private slavery, brigandry, piracy,and other private predation
Primordialcaves
Market economy, limitedgovernment: classical England,U.S., the Asian Tigers, WesternEurope (pre-Welfare States)
Enterprise Network Socialism,symbiont government: Russia,1990s, the CIS
Market economy, restrictivegovernment: China, post-1978
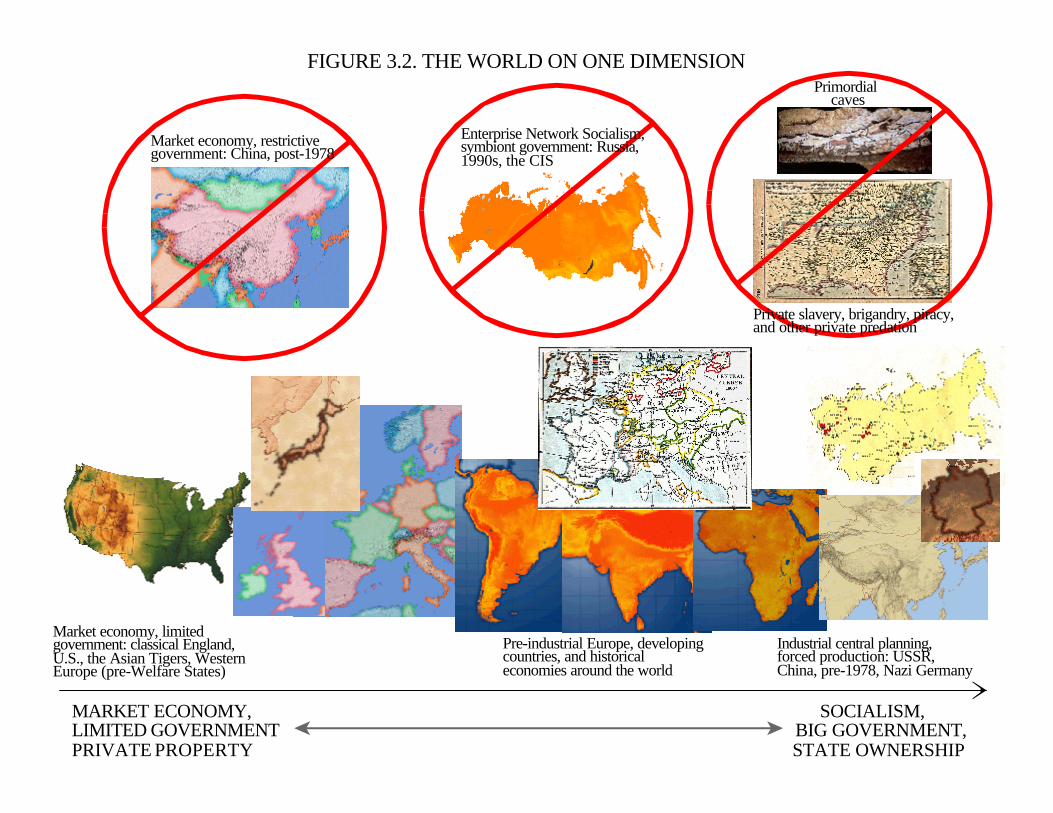
FIGURE 3.2. THE WORLD ON ONE DIMENSION
Industrial central planning,forced production: USSR, China, pre-1978, Nazi Germany
Pre-industrial Europe, developingcountries, and historicaleconomies around the world
Market economy, limitedgovernment: classical England,U.S., the Asian Tigers, WesternEurope (pre-Welfare States)
MARKET ECONOMY, SOCIALISM,LIMITED GOVERNMENT BIG GOVERNMENT,PRIVATE PROPERTY STATE OWNERSHIP
Primordialcaves
Market economy, restrictivegovernment: China, post-1978
Enterprise Network Socialism,symbiont government: Russia,1990s, the CIS
Private slavery, brigandry, piracy,and other private predation
The Omnipresence of Common Income in a Multi-Dimensional World 3
Economic Reform: Crossing the Threshold of Structural Change (Washington: The World Bank, 1992), pp. 239-241. Weowe to Yakir Plessner the idea to compare economic systems by their structures of the flow of funds.
2For an elaborate and quantitative discussion of measurement of economic liberty, see Walter E. Block, ed.,Economic Freedom: Toward a Theory of Measurement (Vancouver, B.C.: The Fraser Institute, 1991), especially AlvinRabushka, “Preliminary Definition of Economic Freedom,” pp. 87-108; Alvin Rabushka, “Freedom House Survey ofEconomic Freedoms,” pp. 57-71; and Zane Spindler and Laurie Still, “Economic Freedom Ratings,” pp. 135-175. See alsoMichael A. Walker, ed., Freedom, Democracy, and Economic Welfare: Proceedings of an International Symposium(Vancouver, B.C.: The Fraser Institute, 1988), especially Raymond D. Gastil and Lindsay M. Wright, “The State of theWorld Political and Economic Freedom,” pp. 85-119; and James Gwartney and Robert Lawson, with Chris Edwards, et.al., Economic Freedom of the World: 2002 Annual Report (Vancouver, B.C.: Fraser Institute, 2002).
In earlier economies, transactions enter the flow of non-monetary exchange of output. Foruniformity, we will treat this exchange as an implicit case of the flow of funds.
The flow of funds yields direct measurements of economic systems on the government and incomedimensions. These direct measurements are the rates of government restriction and income redistributionin the flow of funds.
Each transaction is controlled by the government to one or another extent of its value, from zeroto 100 percent. Like in science, control means exclusion of extraneous influences. To emphasize thegovernmental source of economic control, we will call it government restriction or, simply, restriction. Astransactions follow one another in the flow of funds, the extent of government control of each transactionin value terms represents the marginal rate of restriction. The weighted average of the marginal rates ofrestriction yields the rate of government restriction in the flow of funds in a given economy. Thisapproximates the extent of restriction in GDP from zero to 100 percent on the government dimension, fromabsent to total government. Conversely, exclusion of government from economic activity defines economicliberty in the accounting sense in the flow of funds. The rate of exclusion of government restriction providesdirect measurement of economic liberty as a share of GDP.2
In a similar vein, every bilateral transaction and every unilateral confiscation and subsidy containone or another extent of income redistribution, from zero to 100 percent of the value of a given transaction.These are redistributive transfers from producers/earners of a given income in a given transaction to non-producers/non-earners. For brevity, producers/earners can be called makers of income in a giventransaction and non-producers/non-earners can be called takers of the redistributive transfer in thistransaction. They are makers and takers in each specific transaction. This is not an occupational status.The qualifier ‘redistributive’ distinguishes redistributive transfers from charities, donations to causes,transfers in the family and, most importantly, from accounting government transfers such as taxes.Accounting government transfers include taxes and subsidies. While all subsidies constitute redistributivetransfers, taxes are ambivalent. Taxes may or may not be equivalent to the value of pure public services.Taxes may approximate effective user fees, making the government a public utility, and taxes may largely

The Omnipresence of Common Income in a Multi-Dimensional World 4
3James A. Mirrlees set forth that, in practice, redistribution is technically embedded in taxation. It is impossibleto match lump-sum payments from individual taxpayers for total government activities and government services forindividual taxpayers as specific users and as members of the public. James A. Mirrlees, “An Exploration in the Theoryof Optimum Income Taxation,” Review of Economic Studies 38, no. 2 (April 1971): 175-208.
4Approximation is due to the difference between the flow of funds and GDP in the coverage of home-producedoutput. Contemporary measurement of GDP in developing economies imputes the value of home-produced output andadds it to the value of marketed goods and services. Transactions include only interactive portions of home-producedoutput—informally exchanged, confiscated by the government or private predators, and restricted by national and localgovernments. By definition, transactions leave out non-interactive portions consumed within the household.
contain redistributive transfers.3
Redistributive transfers in each specific transaction between all economic actors measure exactlythe difference between returns to the economy and returns to the producer or, simply, between productionand remuneration (compensation). This difference applies equally on both ends of the given transaction,that is, as a subtraction of income from the maker and an addition of income to the taker. Thismeasurement of non-equivalence between production and remuneration is specific to the income dimension.It measures takeovers as opposed to uncompensated spillovers on the externalities dimension. Bydefinition, spillovers of ideas, invention, innovation, and other additive goods do not take income from theirproducers and do not give it to non-producers. There are no transactions and no transfers in spillovers.Uncompensated spillovers measure the difference between production and remuneration of additive goodsoutside of transactions in the flow of funds.
As transactions follow one another in the flow of funds, the share of each redistributive transfer inthe value of each transaction represents the marginal rate of income redistribution. In accounting practice,exactly because of transfers, these values and rates must be imputed from the full market value of outputin each transaction. The weighted average of the marginal rates of redistribution yields the rate of incomeredistribution in the flow of funds in a given economy. It can be simply calculated as the sum of allredistributive transfers divided by the sum of the values of all transactions. This approximates the extentof income redistribution as a share of GDP from zero to 100 percent on the income dimension, from totallyprivate to totally common income.4 The rate of income redistribution in the flow of funds gives the shareof common income in GDP. Conversely, the rate of exclusion of income redistribution measures the shareof private income. Private income defines the market economy in the accounting sense in the flow of funds.The share of private income yields direct measurement of the market sector in GDP.
Both the government and income dimensions in figure 3.1 and subsequent figures measure non-exclusion rather than exclusion. They measure government restriction instead of economic liberty. Theymeasure income redistribution instead of equalization of production and remuneration of ordinary output.One can readily set the government and income dimensions in reverse. They would then line up economicliberalization and progression towards the market economy. This reversal will not change the frame, themulti-dimensional cross-section, and comparative positions of economies on the map. But it may give an
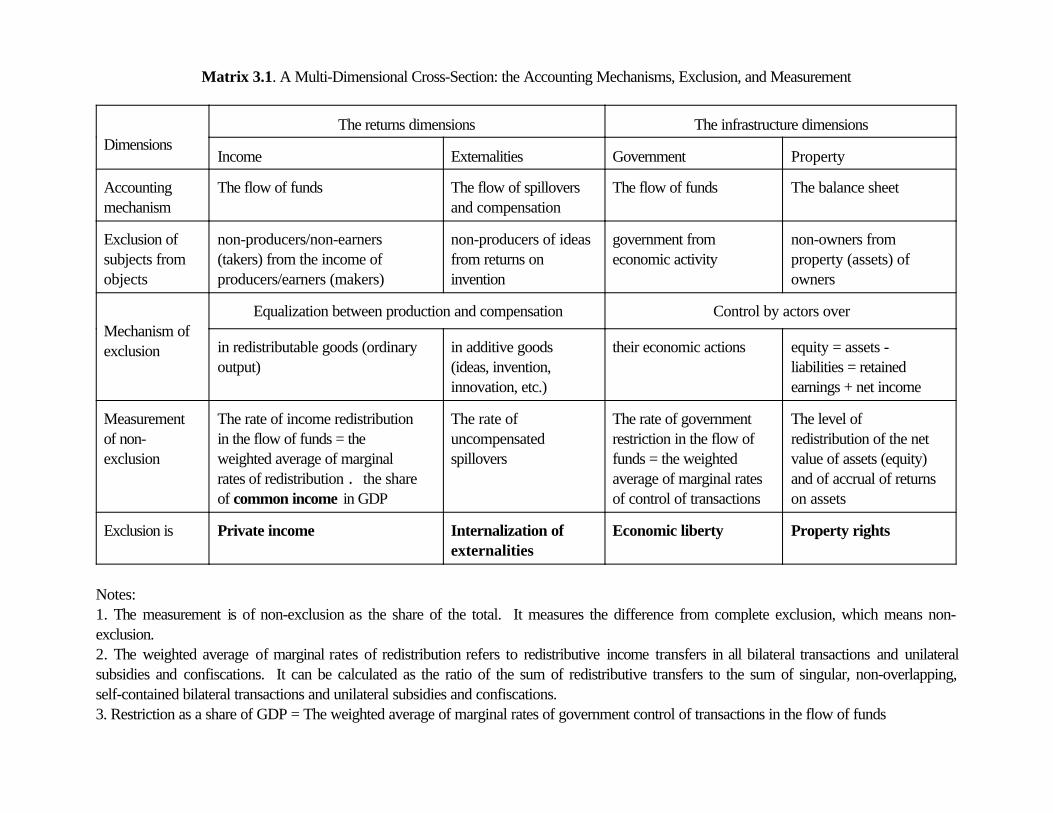
Matrix 3.1. A Multi-Dimensional Cross-Section: the Accounting Mechanisms, Exclusion, and Measurement
DimensionsThe returns dimensions The infrastructure dimensions
Income Externalities Government Property
Accountingmechanism
The flow of funds The flow of spilloversand compensation
The flow of funds The balance sheet
Exclusion ofsubjects fromobjects
non-producers/non-earners(takers) from the income ofproducers/earners (makers)
non-producers of ideasfrom returns oninvention
government fromeconomic activity
non-owners fromproperty (assets) ofowners
Mechanism ofexclusion
Equalization between production and compensation Control by actors over
in redistributable goods (ordinaryoutput)
in additive goods(ideas, invention,innovation, etc.)
their economic actions equity = assets -liabilities = retainedearnings + net income
Measurementof non-exclusion
The rate of income redistributionin the flow of funds = theweighted average of marginalrates of redistribution . the shareof common income in GDP
The rate ofuncompensatedspillovers
The rate of governmentrestriction in the flow offunds = the weightedaverage of marginal ratesof control of transactions
The level ofredistribution of the netvalue of assets (equity)and of accrual of returnson assets
Exclusion is Private income Internalization ofexternalities
Economic liberty Property rights
Notes: 1. The measurement is of non-exclusion as the share of the total. It measures the difference from complete exclusion, which means non-exclusion.2. The weighted average of marginal rates of redistribution refers to redistributive income transfers in all bilateral transactions and unilateralsubsidies and confiscations. It can be calculated as the ratio of the sum of redistributive transfers to the sum of singular, non-overlapping,self-contained bilateral transactions and unilateral subsidies and confiscations.3. Restriction as a share of GDP = The weighted average of marginal rates of government control of transactions in the flow of funds
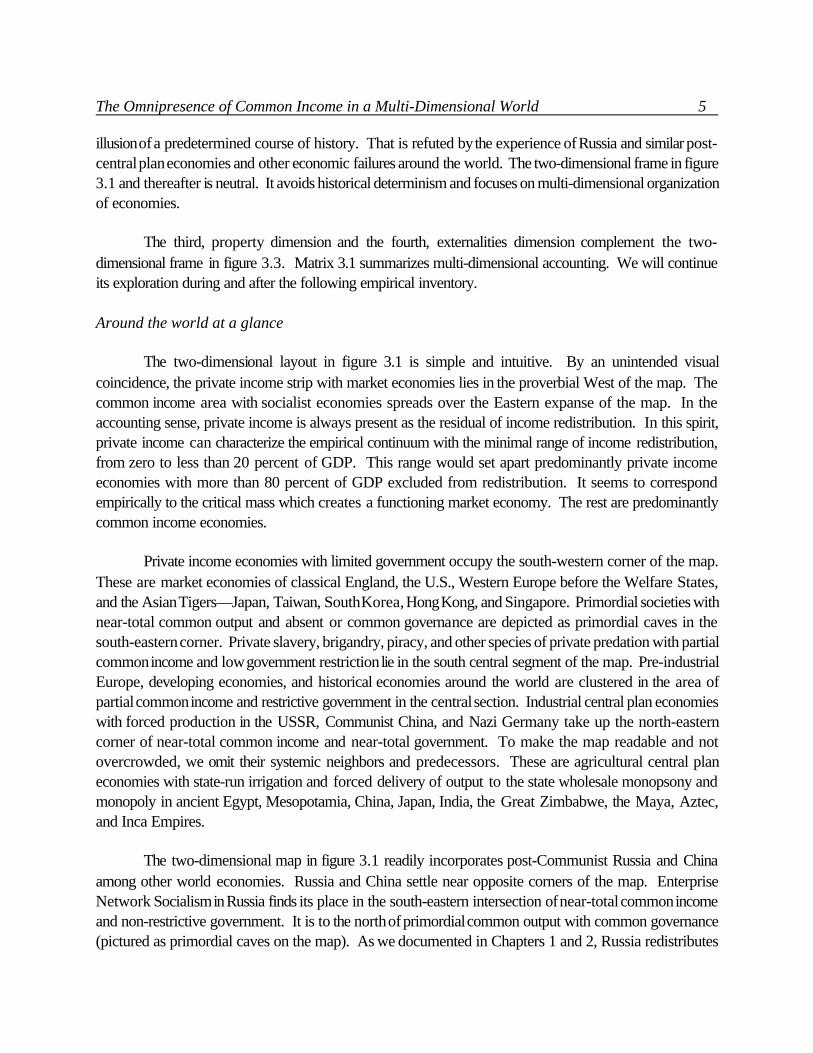
The Omnipresence of Common Income in a Multi-Dimensional World 5
illusion of a predetermined course of history. That is refuted by the experience of Russia and similar post-central plan economies and other economic failures around the world. The two-dimensional frame in figure3.1 and thereafter is neutral. It avoids historical determinism and focuses on multi-dimensional organizationof economies.
The third, property dimension and the fourth, externalities dimension complement the two-dimensional frame in figure 3.3. Matrix 3.1 summarizes multi-dimensional accounting. We will continueits exploration during and after the following empirical inventory.
Around the world at a glance
The two-dimensional layout in figure 3.1 is simple and intuitive. By an unintended visualcoincidence, the private income strip with market economies lies in the proverbial West of the map. Thecommon income area with socialist economies spreads over the Eastern expanse of the map. In theaccounting sense, private income is always present as the residual of income redistribution. In this spirit,private income can characterize the empirical continuum with the minimal range of income redistribution,from zero to less than 20 percent of GDP. This range would set apart predominantly private incomeeconomies with more than 80 percent of GDP excluded from redistribution. It seems to correspondempirically to the critical mass which creates a functioning market economy. The rest are predominantlycommon income economies.
Private income economies with limited government occupy the south-western corner of the map.These are market economies of classical England, the U.S., Western Europe before the Welfare States,and the Asian Tigers—Japan, Taiwan, South Korea, Hong Kong, and Singapore. Primordial societies withnear-total common output and absent or common governance are depicted as primordial caves in thesouth-eastern corner. Private slavery, brigandry, piracy, and other species of private predation with partialcommon income and low government restriction lie in the south central segment of the map. Pre-industrialEurope, developing economies, and historical economies around the world are clustered in the area ofpartial common income and restrictive government in the central section. Industrial central plan economieswith forced production in the USSR, Communist China, and Nazi Germany take up the north-easterncorner of near-total common income and near-total government. To make the map readable and notovercrowded, we omit their systemic neighbors and predecessors. These are agricultural central planeconomies with state-run irrigation and forced delivery of output to the state wholesale monopsony andmonopoly in ancient Egypt, Mesopotamia, China, Japan, India, the Great Zimbabwe, the Maya, Aztec,and Inca Empires.
The two-dimensional map in figure 3.1 readily incorporates post-Communist Russia and Chinaamong other world economies. Russia and China settle near opposite corners of the map. EnterpriseNetwork Socialism in Russia finds its place in the south-eastern intersection of near-total common incomeand non-restrictive government. It is to the north of primordial common output with common governance(pictured as primordial caves on the map). As we documented in Chapters 1 and 2, Russia redistributes
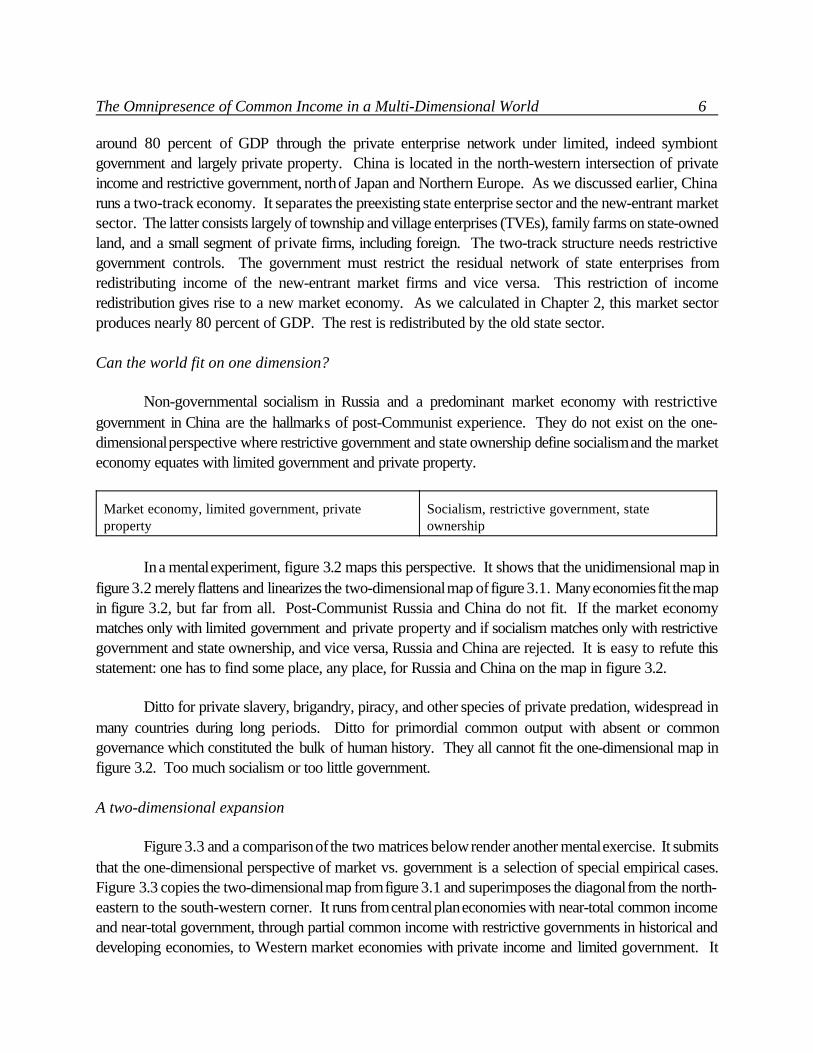
The Omnipresence of Common Income in a Multi-Dimensional World 6
around 80 percent of GDP through the private enterprise network under limited, indeed symbiontgovernment and largely private property. China is located in the north-western intersection of privateincome and restrictive government, north of Japan and Northern Europe. As we discussed earlier, Chinaruns a two-track economy. It separates the preexisting state enterprise sector and the new-entrant marketsector. The latter consists largely of township and village enterprises (TVEs), family farms on state-ownedland, and a small segment of private firms, including foreign. The two-track structure needs restrictivegovernment controls. The government must restrict the residual network of state enterprises fromredistributing income of the new-entrant market firms and vice versa. This restriction of incomeredistribution gives rise to a new market economy. As we calculated in Chapter 2, this market sectorproduces nearly 80 percent of GDP. The rest is redistributed by the old state sector.
Can the world fit on one dimension?
Non-governmental socialism in Russia and a predominant market economy with restrictivegovernment in China are the hallmarks of post-Communist experience. They do not exist on the one-dimensional perspective where restrictive government and state ownership define socialism and the marketeconomy equates with limited government and private property.
Market economy, limited government, privateproperty
Socialism, restrictive government, stateownership
In a mental experiment, figure 3.2 maps this perspective. It shows that the unidimensional map infigure 3.2 merely flattens and linearizes the two-dimensional map of figure 3.1. Many economies fit the mapin figure 3.2, but far from all. Post-Communist Russia and China do not fit. If the market economymatches only with limited government and private property and if socialism matches only with restrictivegovernment and state ownership, and vice versa, Russia and China are rejected. It is easy to refute thisstatement: one has to find some place, any place, for Russia and China on the map in figure 3.2.
Ditto for private slavery, brigandry, piracy, and other species of private predation, widespread inmany countries during long periods. Ditto for primordial common output with absent or commongovernance which constituted the bulk of human history. They all cannot fit the one-dimensional map infigure 3.2. Too much socialism or too little government.
A two-dimensional expansion
Figure 3.3 and a comparison of the two matrices below render another mental exercise. It submitsthat the one-dimensional perspective of market vs. government is a selection of special empirical cases.Figure 3.3 copies the two-dimensional map from figure 3.1 and superimposes the diagonal from the north-eastern to the south-western corner. It runs from central plan economies with near-total common incomeand near-total government, through partial common income with restrictive governments in historical anddeveloping economies, to Western market economies with private income and limited government. It
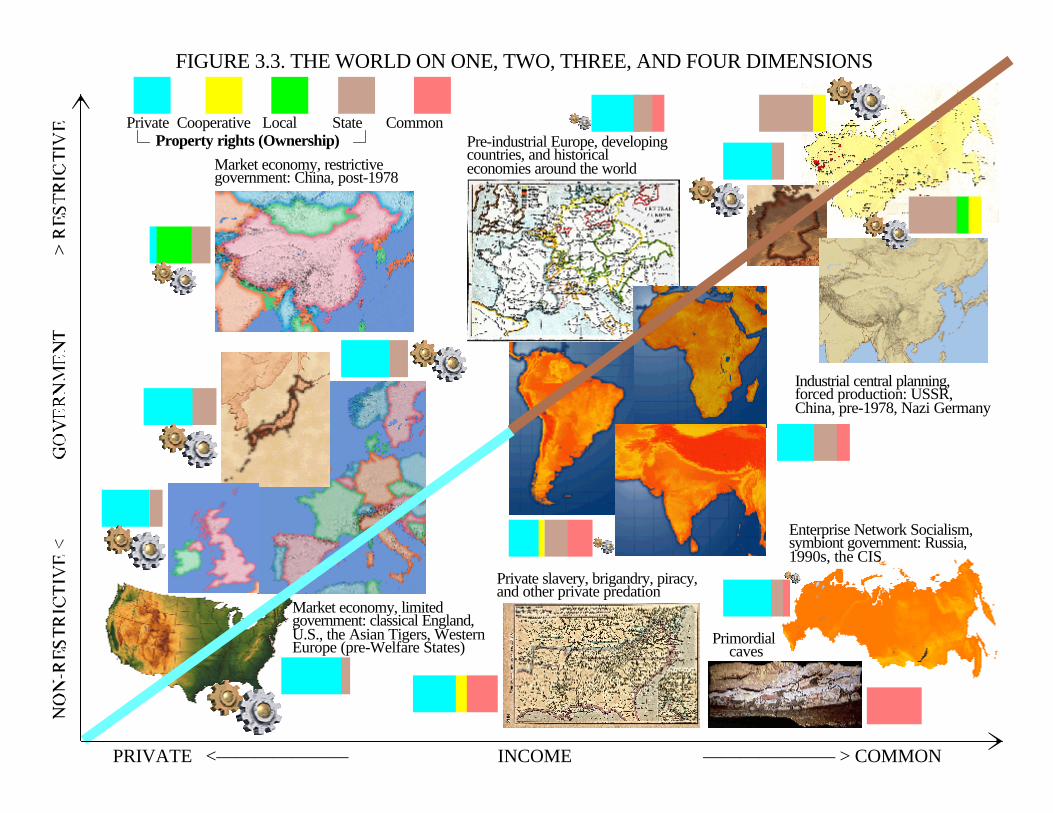
FIGURE 3.3. THE WORLD ON ONE, TWO, THREE, AND FOUR DIMENSIONS
PRIVATE <——————— INCOME ——————— > COMMON
Industrial central planning,forced production: USSR, China, pre-1978, Nazi Germany
Market economy, restrictivegovernment: China, post-1978
Pre-industrial Europe, developingcountries, and historicaleconomies around the world
Private slavery, brigandry, piracy,and other private predation
Primordialcaves
Market economy, limitedgovernment: classical England,U.S., the Asian Tigers, WesternEurope (pre-Welfare States)
Enterprise Network Socialism,symbiont government: Russia,1990s, the CIS
Private Cooperative Local State Common Property rights (Ownership)
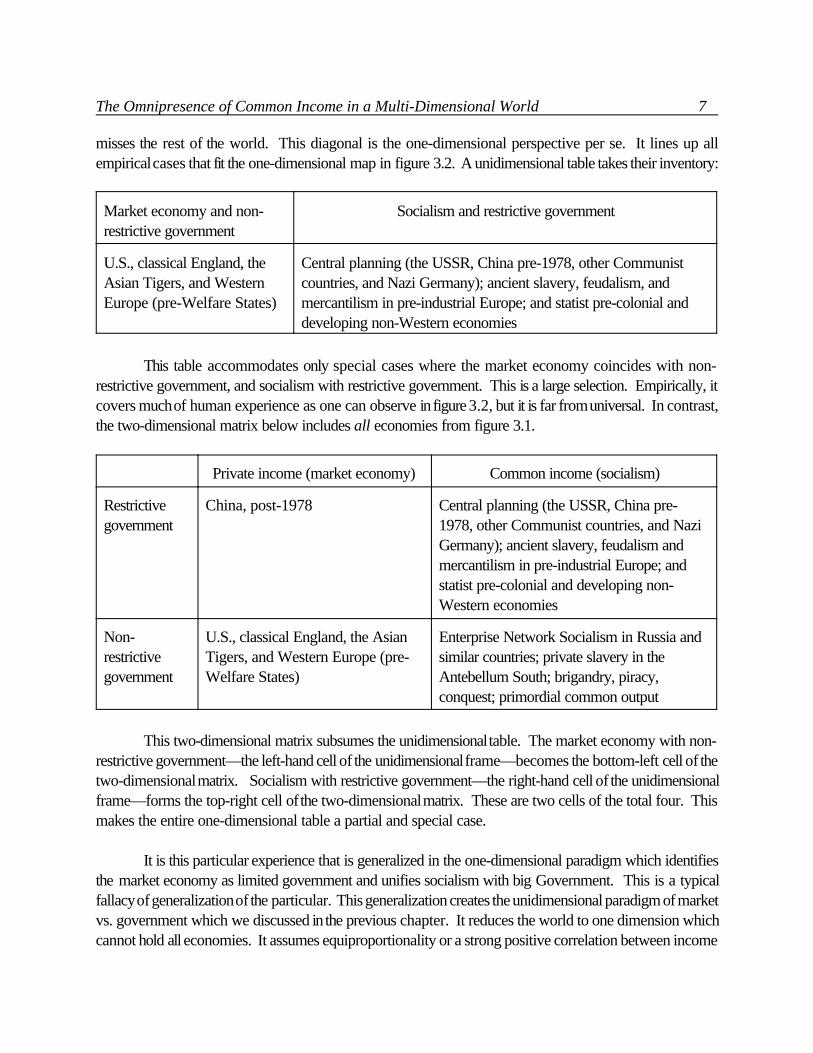
The Omnipresence of Common Income in a Multi-Dimensional World 7
misses the rest of the world. This diagonal is the one-dimensional perspective per se. It lines up allempirical cases that fit the one-dimensional map in figure 3.2. A unidimensional table takes their inventory:
Market economy and non-restrictive government
Socialism and restrictive government
U.S., classical England, theAsian Tigers, and WesternEurope (pre-Welfare States)
Central planning (the USSR, China pre-1978, other Communistcountries, and Nazi Germany); ancient slavery, feudalism, andmercantilism in pre-industrial Europe; and statist pre-colonial anddeveloping non-Western economies
This table accommodates only special cases where the market economy coincides with non-restrictive government, and socialism with restrictive government. This is a large selection. Empirically, itcovers much of human experience as one can observe in figure 3.2, but it is far from universal. In contrast,the two-dimensional matrix below includes all economies from figure 3.1.
Private income (market economy) Common income (socialism)
Restrictivegovernment
China, post-1978 Central planning (the USSR, China pre-1978, other Communist countries, and NaziGermany); ancient slavery, feudalism andmercantilism in pre-industrial Europe; andstatist pre-colonial and developing non-Western economies
Non-restrictivegovernment
U.S., classical England, the AsianTigers, and Western Europe (pre-Welfare States)
Enterprise Network Socialism in Russia andsimilar countries; private slavery in theAntebellum South; brigandry, piracy,conquest; primordial common output
This two-dimensional matrix subsumes the unidimensional table. The market economy with non-restrictive government—the left-hand cell of the unidimensional frame—becomes the bottom-left cell of thetwo-dimensional matrix. Socialism with restrictive government—the right-hand cell of the unidimensionalframe—forms the top-right cell of the two-dimensional matrix. These are two cells of the total four. Thismakes the entire one-dimensional table a partial and special case.
It is this particular experience that is generalized in the one-dimensional paradigm which identifiesthe market economy as limited government and unifies socialism with big Government. This is a typicalfallacy of generalization of the particular. This generalization creates the unidimensional paradigm of marketvs. government which we discussed in the previous chapter. It reduces the world to one dimension whichcannot hold all economies. It assumes equiproportionality or a strong positive correlation between income

The Omnipresence of Common Income in a Multi-Dimensional World 8
redistribution and government restriction in all special cases it covers, in order to collapse the world intothe one-dimensional line. Visually, this amounts to compressing all economies onto the diagonal in figure3.3.
This diagonal may hold equiproportional shares of income redistribution and government restriction,downward from one hundred percent to zero. The diagonal can be drawn also as a regression line witha different positive slope. It will not be equiproportional and would simply express a positive bivariatecorrelation between the extent of income redistribution and government restriction. The trade-off betweenmarket and government in the one-dimensional paradigm does not specify whether it is a one-for-one orsome other proportion. We leave the diagonal in figure 3.3 quantitatively loose within the two-dimensionalframe with the scales of unequal length.
The brown color on the diagonal line stands for state ownership, the blue color for private property.This corresponds to the one-dimensional perspective of socialism, restrictive government, and stateownership vs. the market economy, limited government, and private property. However, even theempirical cases which the diagonal fits deviate from this assertion about property types. To mention themost salient examples, Nazi Germany had predominantly private property while Singapore, Taiwan, and,to a lesser extent, Japan have a substantial share of state ownership.
In the two other cells of the two-dimensional matrix, private income (the market economy) coexistswith restrictive government and common income (socialism) combines with non-restrictive government.They encompass post-Communist experience in China and Russia, as well as private slavery, brigandry,piracy, other species of private predation, and primordial societies. The two-dimensional matrix is aqualitative summary which assumes no equiproportionality or positive correlation in the extent of incomeredistribution and government restriction. Accordingly, there is no trade-off between market andgovernment.
The two-dimensional expansion accommodates empirical cases with all possible quantitativecombinations between the rates of income redistribution and government restriction, uncorrelated andscattered all over the map. Visually, the two-dimensional perspective expands the world beyond thediagonal in figure 3.3 in all directions throughout the map.
A three-dimensional expansion
There is a simple empirical proof that the one-dimensional view of the world, the dichotomy ofmarket vs. government, cannot stand even as a first approximation. Table 3.1 further expands the two-dimensional matrix into three dimensions by adding property types. It takes an empirical inventory ofeconomies mapped in figure 3.1 and organizes them by qualitative types of income, government, andproperty. The trilateral cross-section includes private vs. common income, restrictive vs. non-restrictivegovernment, and a sequence of private, cooperative, local government, national state, and commonproperty.
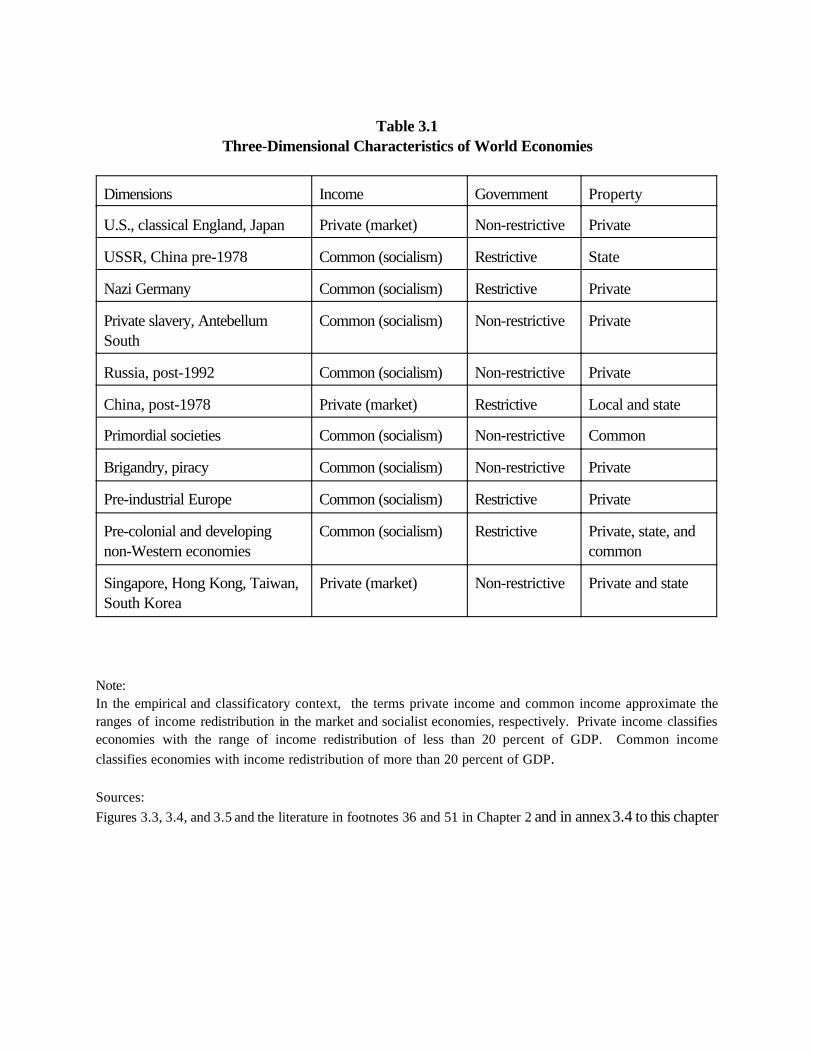
Table 3.1Three-Dimensional Characteristics of World Economies
Dimensions Income Government Property
U.S., classical England, Japan Private (market) Non-restrictive Private
USSR, China pre-1978 Common (socialism) Restrictive State
Nazi Germany Common (socialism) Restrictive Private
Private slavery, AntebellumSouth
Common (socialism) Non-restrictive Private
Russia, post-1992 Common (socialism) Non-restrictive Private
China, post-1978 Private (market) Restrictive Local and state
Primordial societies Common (socialism) Non-restrictive Common
Brigandry, piracy Common (socialism) Non-restrictive Private
Pre-industrial Europe Common (socialism) Restrictive Private
Pre-colonial and developingnon-Western economies
Common (socialism) Restrictive Private, state, andcommon
Singapore, Hong Kong, Taiwan,South Korea
Private (market) Non-restrictive Private and state
Note: In the empirical and classificatory context, the terms private income and common income approximate theranges of income redistribution in the market and socialist economies, respectively. Private income classifieseconomies with the range of income redistribution of less than 20 percent of GDP. Common incomeclassifies economies with income redistribution of more than 20 percent of GDP.
Sources: Figures 3.3, 3.4, and 3.5 and the literature in footnotes 36 and 51 in Chapter 2 and in annex 3.4 to this chapter
The Omnipresence of Common Income in a Multi-Dimensional World 9
Table 3.1 assembles eleven self-contained, non-overlapping groups of historical and contemporary,national and supra-national economies. These are more or less arbitrary clusters of different sizes whichmerely copy the selection in figure 3.1. One can make up different clusters and more clusters and thusrerun the test. Actually, it would be useful to do for verifying and falsifying our findings.
Table 3.1 demonstrates why the one-dimensional diagonal in figure 3.3 is a bunch of special cases.These are the cases which can be reduced to two trilateral combinations: (1) the market economy, limitedgovernment, and private property and (2) socialism, restrictive government, and state ownership. Together,these two combinations make up the one-dimensional perspective of market vs. government. They occupythe first and the second rows in the inventory in table 3.1. Table 3.1 submits that these are just two of atleast eight empirical combinations of income types, government types, and property types observedthrough history and around the world. They made up two cells out of four in the two-dimensional matrix.They make up two trilateral combinations out of eight in the three-dimensional table.
The qualitative types in table 3.1 are not subject to refined quantitative measurement. Theydisregard specific locations of economies on the map in figure 3.1. The breakdown by qualitative typesis simplistic but, in return, it escapes measurement errors. It takes a mere qualitative judgment based ongeneral knowledge about empirical cases by asking basic questions about income types (private orcommon?), government types (restrictive or non-restrictive?), and property types (private, cooperative,local, state, or common?). Errors of judgment are easily detectable in each empirical case. If errors ofjudgment are random, corrections will change the three-dimensional conjunctions of specific cases but willnot curtail the multiplicity of trilateral combinations and will not erase the overall three-dimensionalheterogeneity. If errors of judgement are not random but all err uniformly, away from the one-dimensionalperspective, corrections will annul multiple trilateral combinations and render the three-dimensionalheterogeneity null and void. This result will converge empirical cases to the unidimensional dichotomy andrepudiate the multi-dimensional approach. In any event, the test gives a definite answer to the question onwhether one dimension is sufficient or more dimensions are necessary.
The one-dimensional perspective like the diagonal in figure 3.3 accommodates only positivecorrelations between income redistribution, government restriction, and property types from private to state.Qualitatively, it asserts homogeneity of the market economy, limited government, and private property andbetween socialism, restrictive government, and state ownership. Table 3.1 records heterogeneousrelationships between types of income, government, and property in multiple combinations. There is nocorrelation and no uniform trilateral pattern in this empirical table, which covers all major economies aroundthe world and throughout history. One dimension covers a large selection of economies. A multi-dimensional framework covers all economies.
A four-dimensional expansion
In this vein, figure 3.3 expands the map to four dimensions. It takes the basic two-dimensionalframe of income and government and adds proxy layers of the property dimension and the externalities
The Omnipresence of Common Income in a Multi-Dimensional World 10
5Patents evolved from monopoly rights on ordinary services, such as the weighing of hay and straw in the cityof London (a renown poet Aemilia Lanyer held this grant in the early 17th century), to inventions and technologies.
dimension. These layers incorporate property types and compensation of spillovers (internalization ofexternalities). They increase multiplicity of combinations and add to empirical and analytical heterogeneityon the map of the world.
Empirically, the externalities dimension distinguishes specific historical and modern industrialeconomies by the extent of internalization of returns on production of ideas and other spillovers. Toapproximate their measure, the size of the gears symbolizes remuneration for technological development.It stands for various, crudely estimated rates of internalization of returns on ideas, invention, and innovation.The depiction notes the early, if modest, patronage of scientific discoveries in medieval Islamic states andpre-industrial Europe; promotion of science, invention, and innovation in industrial central plan economies;and a vast system of appropriation of returns on invention through market institutions, governmentinstitutions (e.g., patents), and subsidies in Western market economies, especially in the U.S.5 It alsoreflects the shrinkage of this sphere in post-Communist Russia and similar countries, in contrast with post-Communist China with its emphasis on technological advancement. We leave the externalities dimensionaside for the time being.
Addition of the property dimension in figure 3.3 visualizes empirical heterogeneity cataloged in table3.1. It distinguishes Communist central planning with state ownership in the USSR and China from thatwith private property in Nazi Germany. It distinguishes primordial common output with common propertyfrom Enterprise Network Socialism with its predominantly private property. It distinguishes private slaveryin the Antebellum South, with its private property rights firmly settled, from brigandry, piracy, and otherprivate predation, which confiscate private and other property and make property common until ownershipsettles. All other property combinations in major historical and contemporary clusters of economies arealso sketched on the map in figure 3.3.
Alas, operationalization of the property and externalities dimensions presents conceptual andtechnical difficulties. Compensation of spillovers is conceptually simple but technically difficult, if notinsurmountable, because of the very long-run effect of ideas. Can one relate Louis Pasteur’s remunerationto the billions of lives and tens of trillions of dollars his discovery has saved? The denominator growsexponentially, the numerator is fixed. Inventors of nuclear fission, genetically modified plants, vaccines thatstopped major epidemic diseases, and information technologies that boosted secular productivity,appropriated a small and incalculable fraction of their contribution to human progress. Incalculable is theoperative word, especially in view of future spillovers.
Measurement of property types is technically simple but conceptually difficult, if not insurmountable,because of the multiplicity of property types and the inherent paradox of property rights. The difficultystems from the hierarchical structure of property types. All observable property types subordinate to the
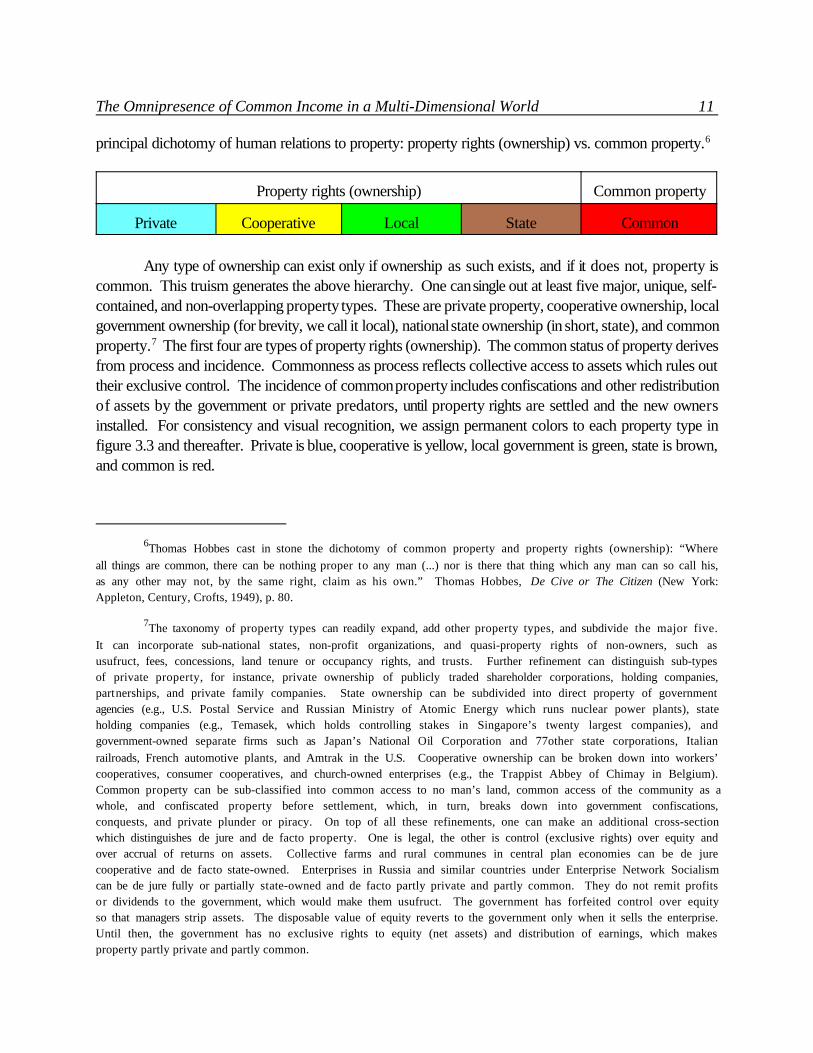
The Omnipresence of Common Income in a Multi-Dimensional World 11
6Thomas Hobbes cast in stone the dichotomy of common property and property rights (ownership): “Whereall things are common, there can be nothing proper to any man (...) nor is there that thing which any man can so call his,as any other may not, by the same right, claim as his own.” Thomas Hobbes, De Cive or The Citizen (New York:Appleton, Century, Crofts, 1949), p. 80.
7The taxonomy of property types can readily expand, add other property types, and subdivide the major five.It can incorporate sub-national states, non-profit organizations, and quasi-property rights of non-owners, such asusufruct, fees, concessions, land tenure or occupancy rights, and trusts. Further refinement can distinguish sub-typesof private property, for instance, private ownership of publicly traded shareholder corporations, holding companies,partnerships, and private family companies. State ownership can be subdivided into direct property of governmentagencies (e.g., U.S. Postal Service and Russian Ministry of Atomic Energy which runs nuclear power plants), stateholding companies (e.g., Temasek, which holds controlling stakes in Singapore’s twenty largest companies), andgovernment-owned separate firms such as Japan’s National Oil Corporation and 77other state corporations, Italianrailroads, French automotive plants, and Amtrak in the U.S. Cooperative ownership can be broken down into workers’cooperatives, consumer cooperatives, and church-owned enterprises (e.g., the Trappist Abbey of Chimay in Belgium).Common property can be sub-classified into common access to no man’s land, common access of the community as awhole, and confiscated property before settlement, which, in turn, breaks down into government confiscations,conquests, and private plunder or piracy. On top of all these refinements, one can make an additional cross-sectionwhich distinguishes de jure and de facto property. One is legal, the other is control (exclusive rights) over equity andover accrual of returns on assets. Collective farms and rural communes in central plan economies can be de jurecooperative and de facto state-owned. Enterprises in Russia and similar countries under Enterprise Network Socialismcan be de jure fully or partially state-owned and de facto partly private and partly common. They do not remit profitsor dividends to the government, which would make them usufruct. The government has forfeited control over equityso that managers strip assets. The disposable value of equity reverts to the government only when it sells the enterprise.Until then, the government has no exclusive rights to equity (net assets) and distribution of earnings, which makesproperty partly private and partly common.
principal dichotomy of human relations to property: property rights (ownership) vs. common property.6
Property rights (ownership) Common property
Private Cooperative Local State Common
Any type of ownership can exist only if ownership as such exists, and if it does not, property iscommon. This truism generates the above hierarchy. One can single out at least five major, unique, self-contained, and non-overlapping property types. These are private property, cooperative ownership, localgovernment ownership (for brevity, we call it local), national state ownership (in short, state), and commonproperty.7 The first four are types of property rights (ownership). The common status of property derivesfrom process and incidence. Commonness as process reflects collective access to assets which rules outtheir exclusive control. The incidence of common property includes confiscations and other redistributionof assets by the government or private predators, until property rights are settled and the new ownersinstalled. For consistency and visual recognition, we assign permanent colors to each property type infigure 3.3 and thereafter. Private is blue, cooperative is yellow, local government is green, state is brown,and common is red.
The Omnipresence of Common Income in a Multi-Dimensional World 12
8Thomas Hobbes laid down the definition of property rights as exclusion of non-owners, both private actorsand the government. “Each particular citizen has a propriety to which none of his fellow-citizens hath right.” “Eachsubject hath an absolute dominion over the goods he is in possession of: that is to say, such a propriety as excludesnot only the right of all the rest of his fellow subjects to the same goods, but also the magistrate himself.” ThomasHobbes, De Cive or The Citizen, pp. 80, 134. “Every private man has an absolute propriety in his goods; such asexcludeth the right of the sovereign. Every man has indeed a propriety that excludes the right of every other subject.”Thomas Hobbes, Leviathan (Cambridge: Cambridge University Press, 1996), pp. 224-225. “Whatsoever right any manrequireth to retain, he allow every other man to retain the same (...) The breach of this law is that which the Greeks callA8,@<,.4", which is commonly rendered covetousness, but seemeth to be more precisely expressed by the wordencroaching.” Thomas Hobbes, The Elements of Law Natural and Politic (Oxford: Oxford University Press, 1994), p.94.
9Modern literature rediscovered Thomas Hobbes’ idea of exclusion as the existential difference of humans.Property rights (ownership) are the most tangible manifestation of exclusion. Modern literature defines it as residualcontrol of owners over assets. Control is residual after allowing for the exercise of control by the government, creditors,the community, and the customary authority. See Sanford J. Grossman and Oliver D. Hart, “The Costs and Benefits ofOwnership: A Theory of Vertical and Lateral Integration,” Journal of Political Economy 94, no. 4 (August 1986): 691-719,and Oliver D. Hart and John Moore, “Property Rights and the Nature of the Firm,” Journal of Political Economy 98, no.6 (December 1990): 1119-1158. The accounting definition supercedes this formulation. The balance sheet automaticallyincludes and separates control by creditors because equity subtracts liabilities from assets and limits exclusive controlof owners to assets net of liabilities. The balance sheet and the profit and loss statement incorporate control by thegovernment in both fiscal and regulatory capacity because tax liabilities are subtracted from assets as part of overallliabilities, and because equity and returns on assets accrue after any impact of regulation on the income from a givenproperty. The latter allowance also applies to control by the community and the customary authority. The advantageof thinking in terms of exclusive control over equity and returns on assets rather than residual control of owners overassets is twofold. First, it is unambiguously identifiable and quantifiable. Second, it is a universal definition. Itaccommodates ownership of the modern corporation. The characteristic of the modern corporation is separation betweenownership by shareholders and control by managers. Residual control over assets can be exercised by managers, notshareholders. Defining ownership as residual control over assets does not answer who owns the moderncorporation—shareholders, managers, or both. Residual control and other non-accounting treatments of property rightsleave the modern corporation in analytical limbo. Exclusive control over the value of equity and distributed earnings(dividends) identifies the modern corporation as the private property of shareholders.
10The above example of the modern corporation is just such a test. Another, more complex test concerns dejure state ownership of Russian enterprises under Enterprise Network Socialism and their de facto combination of private
Accounting makes is possible to work out a simple, unambiguous, and comprehensive definitionof property rights (ownership). It derives property rights from the balance sheet and the profit and lossstatement. Ownership signifies exclusive control over equity (assets less liabilities, or net assets) and overaccrual of net disposable returns on assets (profits, distributed earnings or dividends, interest, other returnson financial assets, and rent). Control constitutes exclusion of non-owners from the disposable value ofnet assets and from accrual of net disposable returns on assets.8 We submit that this accounting definitionis more rigorous than the existing legal and economic definitions.9 It is fully and equally applicable to everypossible type of property rights and it clearly and unambiguously identifies the type of ownership in eachspecific case. One can run a simple test. In any empirical case, the disposable value of equity and returnson assets accrue to one or another owner. One can take any empirical case and determine the type ofownership and the identity of owner by this yardstick.10 If a case emerges wherein this test fails to perform,
The Omnipresence of Common Income in a Multi-Dimensional World 13
ownership by managers and common property between managers and the government. It was also discussed above.
11Common property spawned seminal literature. See H. Scott Gordon. “The Economic Theory of a Common-Property Resource: The Fishery,” Journal of Political Economy 62, no. 2 (April 1954): 124-142; Garrett Hardin, "TheTragedy of the Commons," Science 162 (December 1968): 1243-1248; Vernon L. Smith. “The Primitive Hunter Culture,Pleistocene Extinctions, and the Rise of Agriculture,” Journal of Political Economy 83, no. 4 (August 1975): 727-755;Garett Hardin and John Baden, eds., Managing the Commons (San Francisco: Freeman, 1977); Carlisle F. Runge,“Common Property Externalities: Isolation, Assurance, and Resource Depletion in a Traditional Grazing Context,”American Journal of Agricultural Economics 63, no. 4 (November 1981): 595-606; Elinor Ostrum, Governing theCommons (New York: Cambridge University Press, 1990); and Garrett Hardin, “The Tragedy of the UnmanagedCommons: Population and the Disguises of Providence,” in Robert V. Andelson, ed., Commons Without Tragedy:Protecting the Environment from Overpopulation—A New Approach (London: Shepheard-Walwyn; Savage, MD:Barnes & Noble, 1991), pp. 162-185. On the impact of property confiscation, see Douglass C. North, William Summerhill,and Barry R. Weingast, “Order, Disorder and Economic Change: Latin America vs. North America,” in Bruce Bueno deMesquita and Hilton Root, eds., Governing for Prosperity (New Haven: Yale University Press, 2000), pp. 17-58.
the definition of property rights proposed here is not sufficient and may not be necessary.
Common property is simply the antipode of property rights. It entails absence—non-existence ornullification—of ownership. There is no exclusive control over equity and over accrual of returns on assets.This makes assets common property.11
The technical part of measuring property types is simple. Consumer assets and most financialassets by the nature of savings are in private hands. They can be set aside. This leaves non-financialproducer assets which consist of production factors—capital stock and land—and inventories. The shareof producer assets by each property type in total assets gives a distribution of property types in theeconomy. Valuation of producer assets is based on their returns. It is sufficient to estimate the share ofGDP produced by capital stock and land of each property type as a first approximation. One barrel of oilor one pound of butter add the same value to GDP regardless of who owns assets. Distribution ofproduction by property types can approximate the distribution of assets by property types in every and alleconomies.
The conceptual difficulty begins to arise from the multiplicity of property types. If there were onlytwo types, most conveniently, private and state ownership, the shares of their output in GDP would givea comparative property measurement across all economies. Alas, there are at least five disparate propertytypes: private, cooperative, local, state, and common. Several historical and contemporary economiesexhibit only one or two types, for example, common property in primordial societies and predominantlystate ownership in industrial central plan economies (except Nazi Germany and Communist Yugoslavia)with the subordinate cooperative sector. But the rest of the world, past and present, extends to more thantwo property types. A comprehensive cross-national comparison over time requires a uniform standardwhich can measure all known property types on one scale.
The paradox of property rights, which we approach now, renders a unique standard for the scale
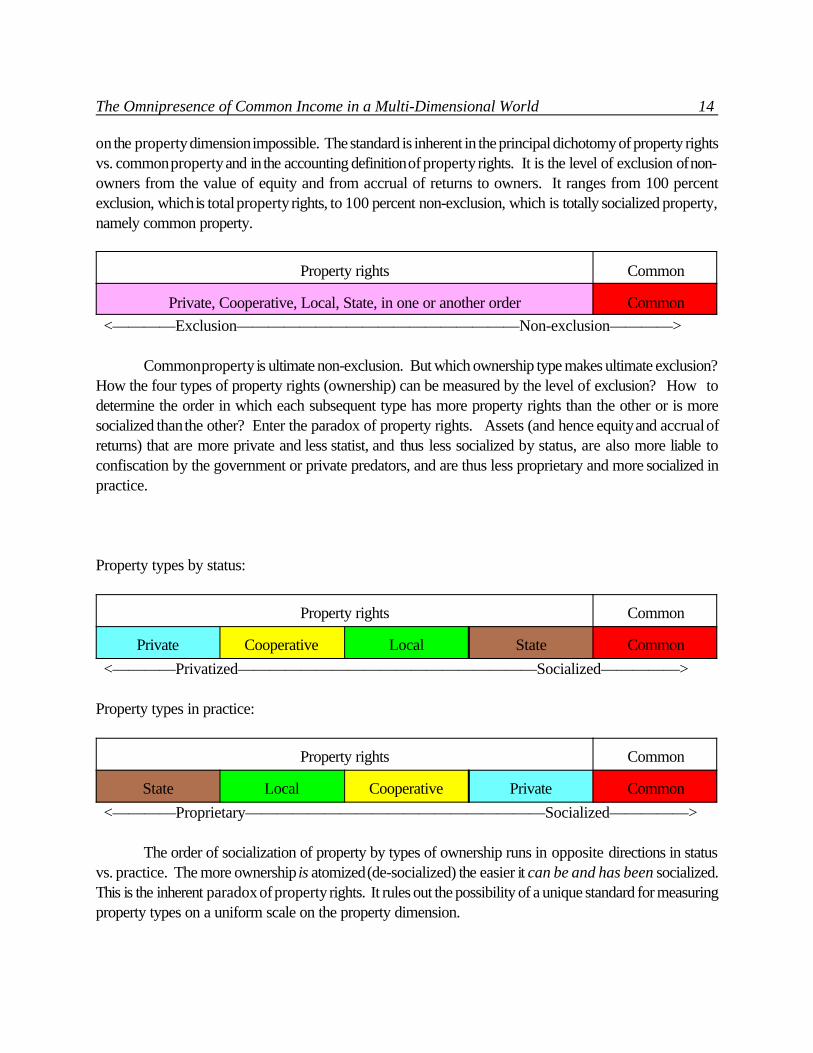
The Omnipresence of Common Income in a Multi-Dimensional World 14
on the property dimension impossible. The standard is inherent in the principal dichotomy of property rightsvs. common property and in the accounting definition of property rights. It is the level of exclusion of non-owners from the value of equity and from accrual of returns to owners. It ranges from 100 percentexclusion, which is total property rights, to 100 percent non-exclusion, which is totally socialized property,namely common property.
Property rights Common
Private, Cooperative, Local, State, in one or another order Common <————Exclusion——————————————————Non-exclusion————>
Common property is ultimate non-exclusion. But which ownership type makes ultimate exclusion?How the four types of property rights (ownership) can be measured by the level of exclusion? How todetermine the order in which each subsequent type has more property rights than the other or is moresocialized than the other? Enter the paradox of property rights. Assets (and hence equity and accrual ofreturns) that are more private and less statist, and thus less socialized by status, are also more liable toconfiscation by the government or private predators, and are thus less proprietary and more socialized inpractice.
Property types by status:
Property rights Common
Private Cooperative Local State Common <————Privatized———————————————————Socialized—————>
Property types in practice:
Property rights Common
State Local Cooperative Private Common <————Proprietary———————————————————Socialized—————>
The order of socialization of property by types of ownership runs in opposite directions in statusvs. practice. The more ownership is atomized (de-socialized) the easier it can be and has been socialized.This is the inherent paradox of property rights. It rules out the possibility of a unique standard for measuringproperty types on a uniform scale on the property dimension.
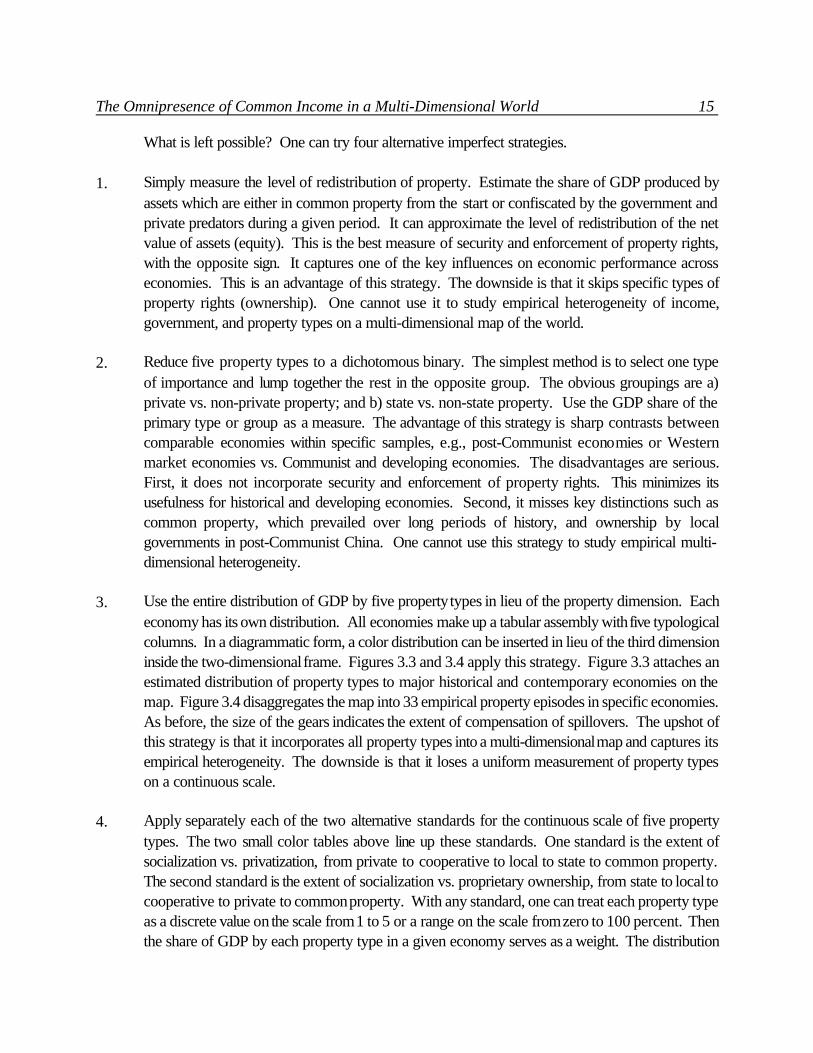
The Omnipresence of Common Income in a Multi-Dimensional World 15
What is left possible? One can try four alternative imperfect strategies.
1. Simply measure the level of redistribution of property. Estimate the share of GDP produced byassets which are either in common property from the start or confiscated by the government andprivate predators during a given period. It can approximate the level of redistribution of the netvalue of assets (equity). This is the best measure of security and enforcement of property rights,with the opposite sign. It captures one of the key influences on economic performance acrosseconomies. This is an advantage of this strategy. The downside is that it skips specific types ofproperty rights (ownership). One cannot use it to study empirical heterogeneity of income,government, and property types on a multi-dimensional map of the world.
2. Reduce five property types to a dichotomous binary. The simplest method is to select one typeof importance and lump together the rest in the opposite group. The obvious groupings are a)private vs. non-private property; and b) state vs. non-state property. Use the GDP share of theprimary type or group as a measure. The advantage of this strategy is sharp contrasts betweencomparable economies within specific samples, e.g., post-Communist economies or Westernmarket economies vs. Communist and developing economies. The disadvantages are serious.First, it does not incorporate security and enforcement of property rights. This minimizes itsusefulness for historical and developing economies. Second, it misses key distinctions such ascommon property, which prevailed over long periods of history, and ownership by localgovernments in post-Communist China. One cannot use this strategy to study empirical multi-dimensional heterogeneity.
3. Use the entire distribution of GDP by five property types in lieu of the property dimension. Eacheconomy has its own distribution. All economies make up a tabular assembly with five typologicalcolumns. In a diagrammatic form, a color distribution can be inserted in lieu of the third dimensioninside the two-dimensional frame. Figures 3.3 and 3.4 apply this strategy. Figure 3.3 attaches anestimated distribution of property types to major historical and contemporary economies on themap. Figure 3.4 disaggregates the map into 33 empirical property episodes in specific economies.As before, the size of the gears indicates the extent of compensation of spillovers. The upshot ofthis strategy is that it incorporates all property types into a multi-dimensional map and captures itsempirical heterogeneity. The downside is that it loses a uniform measurement of property typeson a continuous scale.
4. Apply separately each of the two alternative standards for the continuous scale of five propertytypes. The two small color tables above line up these standards. One standard is the extent ofsocialization vs. privatization, from private to cooperative to local to state to common property.The second standard is the extent of socialization vs. proprietary ownership, from state to local tocooperative to private to common property. With any standard, one can treat each property typeas a discrete value on the scale from 1 to 5 or a range on the scale from zero to 100 percent. Thenthe share of GDP by each property type in a given economy serves as a weight. The distribution

FIGURE 3.4. PROPERTY TYPES ON THE INCOME AND GOVERNMENT DIMENSIONS
PRIVATE <——————— INCOME ——————— > COMMON
Privately-owned firms with newly-madeproductive assets and private income:U.S., industrial Europe, Japan
Common property resources: primordial societies
State-owned firms with private income(”cash limits”): England, 1930s-1970s,France, Singapore, Taiwan
Local government-owned firms(TVEs) with private incomes:China, post-1978
Private and state-owned firmsand farms with incomes non-separable from government:Latin America, India, Africa
The redistributive networkof privatized and stateenterprises: Russia, 1990s
Privately-owned feudal manors withservitudes and fees: Europe, 700-1400
Centralized privately-runcolonies: Java, 1700s
Privately-owned corporateindustries under governmentplanning: Germany, 1933-45
Labor-owned and managedenterprises with central plan:Yugoslavia, 1950s-1980s
Privately-owned corporations withgovernment-directed investment: Japan, 1950s-1970s
Subsidized communalagribusinesses(Kibbutzim): Israel
Privately-owned, state-supplied slavery, state land,mines: ancient Greece, Rome
State, temple, communal, andprivate land, forced deliveryand irrigation: ancient Egypt,Mesopotamia, China, Inca
Assets with open access to private predation: Communal land,monasteries, conquests, brigandry, piracy, financial looting
Family farms on leased, state-owned land: China, post-1978
Private land and trade underfranchised state socialism:medieval Arab states, India
Peasant homesteads on long-termleases of land: Europe, 1400-1800
Private familyfarms: U.S.,Western Europe
Private firms andbanks nationalizedin the WelfareStates: WesternEurope, 1930s- 1980s
Voluntary plantationcommunes: Plymouth colony,1620s, Russia, 1918-20
Private slavery in market and state-socialist economies: U.S., Cuba,Brazil, 1600-1860, and plantations:Latin America, 1500 on
Neolithic storages of output surplusesand private land occupancy, privatedebt slavery, post-8000 B.C.
State-owned firms with incomescommon with the government:Western European Welfare States
Local turnpike trusts,city corporations,private canals:England, since 1630
Private plots on collectiveor state land, USSR
Communal land as a fiscaldevice: Imperial Russia
Cooperatives inforestry and fishery:Canada, U.S.
Private Cooperative Local State Common
Property rights (Ownership)property
Privately-owned pre-industrialfirms, guilds, and estates withprivileges: Europe, 1400-1700
Private plantations,peonage: LatinAmerica
Franchised serfdom: Russia, 1497-1861
State-owned enterprisesunder central planning(the nation-enterprise):USSR, China, pre-1978
Enslavement: pre-colonialAfrica and world-wide episodes

FIGURE 3.5. PROPERTY TYPES, INCOME TYPES, AND GOVERNMENT RESTRICTION: 33 EMPIRICAL EPISODES(Common property is in red. The crowd symbolizes common income;double crowd near-total common income)
1. Private ownership 2. Cooperative 3. Local 4. State ownership 5. Common propertyPRIVATIZED <——————— PROPERTY TYPES ——————— > SOCIALIZED
Privately-owned firms withnewly-made productive assetsand private income: U.S.,industrial Europe, Japan
State-owned firms withprivate income (”cash limits”): England,1930s-1970s, France,Singapore, Taiwan
Local government-owned firms (TVEs)with private incomes:China, post-1978
The redistributive network of privatizedand state enterprises: Russia, 1990s
Privately-owned feudal manors withservitudes and fees: Europe, 700-1400
Centralized privately-run colonies: Java,1700s
Privately-owned corporations with government-directed investment: Japan, 1950s-70s
Subsidizedcommunalagribusinesses(Kibbutzim):Israel
Privately-owned, state-supplied slavery,state land, mines: ancient Greece, Rome
Privately-owned pre-industrial firms, guilds,and estates with privileges: Europe, 1400-1700
Peasant homesteads on long-termleases of land: Europe, 1400-1800
Private family farms: U.S., Western Europe
Private slavery in market and state-socialisteconomies: U.S., Cuba, Brazil, 1600-1860
Local turnpike trusts, citycorporations, private canals:England, since 1630
Private land and trade under franchised statesocialism: medieval Arab states, India
Neolithic storages ofoutput surpluses andprivate occupancy ofland, private debtslavery, post-8000 B.C.
Labor-owned andmanaged enterpriseswith central plan:Yugoslavia, 1950-80s
State-owned firms with incomescommon with the government:Western European Welfare States
Private and state-owned firmsand farms with incomescommon with the government:Latin America, India, Africa
State, temple, communal, andprivate land, forced deliveryand irrigation: ancient Egypt,Mesopotamia, China, Inca
State-owned enterprisesunder central planning(the nation-enterprise):USSR, China, pre-1978
Private firms andbanks nationalized inthe Welfare States:Western Europe,1930s-1980s
Voluntary plantationcommunes: Plymouth colony,1620s, Russia, 1918-20
Common propertyresources: primordial societies
Cooperativesin forestryand fishery:Canada, U.S.
Assets with open access to private predation: Communal land,monasteries, conquests, brigandry, piracy, financial looting
Private plantations, peonage: Latin AmericaFranchised serfdom: Russia, 1497-1861
Family farms on leased, state-owned land: China, post-1978
Private plots oncollective or stateland, USSR
Communal landas a fiscal device:Imperial Russia
Privately-owned corporate industries undergovernment planning: Germany, 1933-45
Enslavement:pre-colonialAfrica andworld-wideepisodes
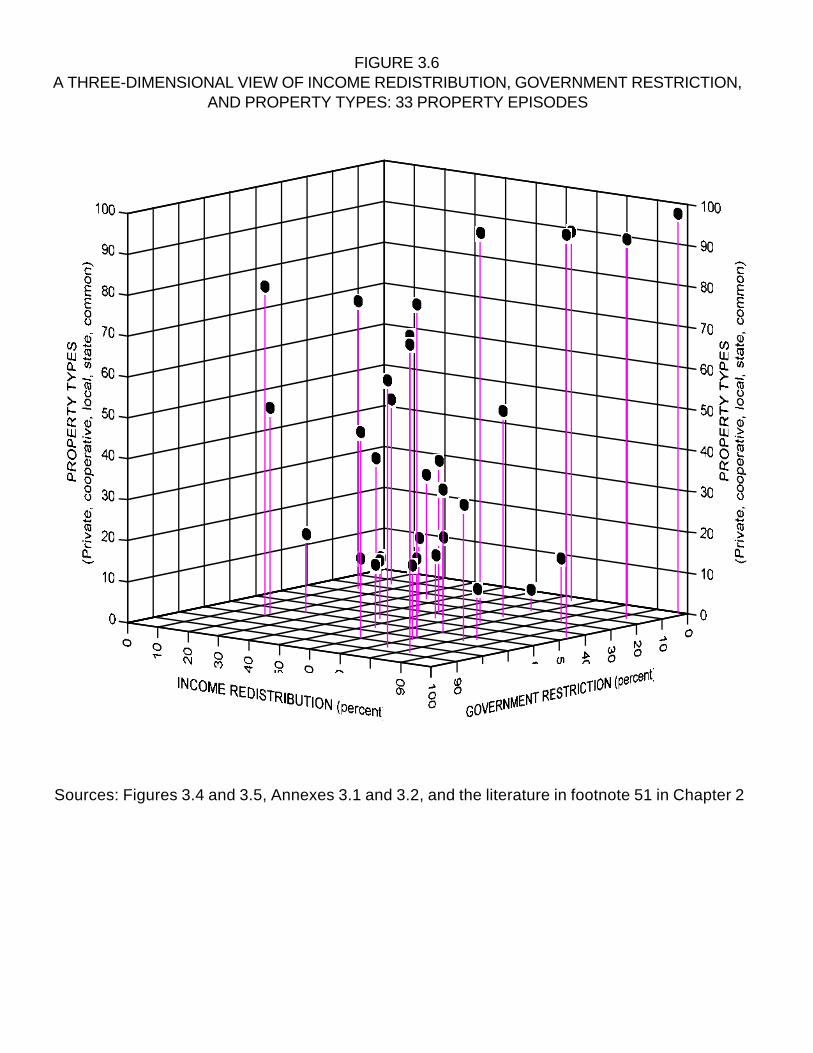
FIGURE 3.6A THREE-DIMENSIONAL VIEW OF INCOME REDISTRIBUTION, GOVERNMENT RESTRICTION,
AND PROPERTY TYPES: 33 PROPERTY EPISODES
Sources: Figures 3.4 and 3.5, Annexes 3.1 and 3.2, and the literature in footnote 51 in Chapter 2
The Omnipresence of Common Income in a Multi-Dimensional World 16
12We use the 33 empirical property episodes from figure 2.3 for reference. Their documenting literature is listedin footnotes 36 and 51 in Chapter 2. Figures 3.4 through 3.6 reapply these 33 empirical property episodes directly.
of GDP by property type yields the weighted average of property types in each economy. Figures3.5 and 3.6 chose as the standard the extent of socialization vs. privatization. Figure 3.5 arranges33 empirical property episodes by their dominant property type as an index from 1 to 5. Toaccount for the additional extent of socialization due to confiscation of assets, figure 3.5 adds redcolor for the share of common property in each relevant episode. Figure 3.6 applies directly theweighted average of socialization by property types (weighted by their share in production of GDP)estimated for the same 33 property episodes. One can choose an alternative standard of the extentof socialization vs. proprietary ownership. It will take a simple rearrangement of columns in figure3.5 (4 becomes 1, 3 becomes 2, 2 becomes 3, and 1 becomes 4) and a correspondingrecalculation of weighted averages in figure 3.6. The format of both figures will remain the same.The downside is that neither standard is definitive.
Figures 3.3 and 3.4 and figures 3.5 and 3.6 form two alternative pairs of the four-dimensionalexpansion. Figure 3.3 attaches crudely estimated distributions of property types (measured as shares ofGDP produced by given property types) to the countries and supra-national regions located on the two-dimensional map.12 By analogy with geographical maps, one can think of the property dimension as thealtitude while the income dimension serves as a latitude and the government dimension is the longitude.Unlike the altitude in geographical maps, we do not spread colors over territories because each specificdistribution of property types is scattered throughout a given economy. A geographical distribution ofproperty types in each economy is interesting in itself but does not necessarily correspond to the distributionof property types as shares in production of GDP. This is why we merely attach the distribution ofproperty types to each country or region.
Figure 3.4 disaggregates the map to 33 empirical property episodes. They are dispersed insidethe two-dimensional frame according to their extent of income redistribution and government restriction.Instead of national and supra-national economies, this map organizes the world by property types. Someproperty episodes represent historical or contemporary economies as a whole or almost as a whole, forexample, cental plan economies with state ownership in the USSR and Communist China, with cooperativeownership in Communist Yugoslavia, and with private ownership in Nazi Germany or privatized andnominally state-owned enterprises under Enterprise Network Socialism in post-Communist Russia. Otherproperty episodes exhibit only segments of complex economies in which multiple property types areprominent. In this case, the same economy appears at least twice on the same map. For example, privateplots on collective and state land, which accompany cooperative ownership in Communist countries,coexist with state-owned enterprises. The two-track economy in post-Communist China combinesseparate property episodes of the inherited state-owned enterprises, private family farms on state-ownedland, and local government-owned firms with private income, Township and Village Enterprises (TVEs).Although the property dimension is inserted inside the two-dimensional frame of income and government,the distinguishing variable in figure 3.4 is property types.
The Omnipresence of Common Income in a Multi-Dimensional World 17
Figure 3.5 makes the property dimension the primary dimension and property types the organizingvariable on the scale of privatization vs. socialization. The 33 property episodes line up by their dominantproperty types, with the adjustment for the extent of confiscation of assets in each episode. The incomedimension is inserted in three qualitative categories. The sign of the crowd symbolizes partial commonincome. Double crowd stands for near-total common income in ancient agricultural central plan economies,modern industrial central plan economies, the privately-run central plan colony of the Dutch Java, voluntaryplantation communes from the Plymouth Colony in the 1620s to Russian War Communism in 1918-20, inprimordial societies, and under Enterprise Network Socialism in Russia and similar countries. Economieswith private income escape a crowd sign. In one glance, one can assess the property status around theworld and through history on the scale from privatization to socialization of assets under limited andrestrictive government.
Figure 3.6 quantifies figures 3.4 and 3.5 in the three-dimensional frame. It maps the same 33empirical property episodes. It uses the same continuous standard of property types as figure 3.5 by theextent of socialization vs. privatization. Figure 3.6 drops the externalities dimension for simplicity.Quantification of the rates of income redistribution and government restriction as shares of GDP on the leftand right horizontal axes, respectively, is direct. All errors of measurement are correctable; they are notdue to limits to measurement. Quantification of property types on the vertical axis as the level ofprivatization vs. socialization in production of GDP in each economy or sector suffers from limits tomeasurement.
The principal limit is that we estimate a continuous dimension over the sequence of discrete rangesassigned to each property type. The levels of privatization and socialization in each property type, in eacheconomy, and in each empirical episode are additive to 100 percent. This linear approach prescribes nointrinsic rule for the selection of ranges for specific property types. One can say that common propertystarts at 60 percent socialization and goes to 100 percent whereas the four types of ownership cover equal15 percentage-point ranges. Alternatively, one can view private property as zero percent socialization, inthe same vein as pure private income equates with zero rate of income redistribution. This would line upa continuum from zero socialization of assets under private ownership to total socialization under purecommon property. In this case, the ascending of property types towards socialization starts withcooperative property at one percent socialization and passes through equal or unequal ranges to totalcommon property at 100 percent socialization. The choice of unequal ranges of the level of socializationfor each property type is infinite. For example, one can always argue that local government propertyoccupies a limited range whereas national state ownership covers a great range of socialization. The leastjudgmental solution is to simply ascribe the equal sequential 20 percentage-point ranges of socialization toeach of the five property types. The property dimension then divides into five quintiles. Private propertycovers one to 20 percent, cooperative property 21 to 40 percent, local government ownership 41 to 60percent, national state ownership 61 to 80 percent, and common property 81 to 100 percent socialization.Figure 3.6 takes this least discretionary approach. The distribution by quintiles makes it easier to adjusteach specific economy or empirical case for the incidence of property confiscation. If a given empiricalepisode is dominated by typical private property, in the range of 1 to 20 percent socialization, and one in

0
10
20
30
40
50
60
70
80
90
100
0 10 20 30 40 50 60 70 80 90 100INCOME REDISTRIBUTION (PERCENT OF GDP)
PI
PIG
GI
RE
TARS
PW
AW
RT
AT
SR
FV
HE
PL
BO
PB
MRRD
DL
WS
PR
ME
OS
FA
TR
IL
TS
MM
CM
PV
FE
PS
HM
GU
CS
CN
SU
FT
CT
FYSF
GS
FG
LB
IT
DT
CL
VI
NS
CATT
CR
TCIS
KI
WM
UB
FMFS
SG
DS
SS
PE
NR
PA
WF
CF
LA
RA
FF
PY
NA
FL
MA
TF
TU
TW
SE
VT
PD
CQ
SL
VC
BR
TPAC
KR
IC
AP
PC
CD
MD
IP
PTFD
FP
MP
PP
CPRP
FC
ZA
PO
LM
EN
CC
ENS
FN
VP
CO
Private Cooperative Local government National state Common
Notes:1. Codes are listed in the legend for the two-dimensional table of economic species2. Colors designate property types which dominate a given economic species:
3. The size of the bubble estimates the rate of remuneration for the production of ideas, invention, and technological innovation
ANNEX 3.2THE FOUR-DIMENSIONAL TABLE OF ECONOMIC SPECIES
The Omnipresence of Common Income in a Multi-Dimensional World 18
four units of assets is confiscated by the government or private predators during its life-time in the mostconventional manner, one can assign the average value of 10 to 75 percent of assets and the value of 90to 25 percent of assets. By the weighted average, this episode amounts to 30 percent socialization ofproperty. Figure 3.6 incorporates similar adjustments for each empirical property episode with theestimated incidence of property confiscation. These are crude approximations but the illustrative natureof this exercise makes it not sensitive to measurement errors.
Finally, one can select an alternative continuous standard for measuring property types by the extentof socialization vs. proprietary ownership. A new standard requires recalculation of the values for specificeconomies and empirical property episodes on the property dimension within the same three-dimensionalformat of figure 3.6. It may be germane to employ both quantitative standards of the property dimension.This is not necessary for our purpose. A different standard of measurement rearranges values but does notdiminish their vast dispersion. One property standard is sufficient to document empirical multi-dimensionalheterogeneity through ages around the world. A moveable map
To make the multi-dimensional map in figure 3.3 and other figures readable and not overcrowded,we singled out only big countries and aggregated other economies by supra-national regions. This broadbrush lumps together historical and contemporary economies by distinctive periods or whole epochs. Theyall can be disaggregated to any level of detail in time, space, and economic activity. The table of 110economic species in Annexes 3.1 and 3.2 submits an extensive, if incomplete, disaggregation. Noeconomic cluster is too big and no economy or its sector at any time span is too small for the multi-dimensional map. One can add to the map every individual economy, past and present, at any point in time,and every sector of each economy.
North Korea and Cambodia under the Khmer Rouge, extreme examples of near-total commonincome under near-total government and state ownership, would fit the tip of the north-eastern corner infigure 3.3. The Inca Empire, a veritable state agricultural commune, would lie nearby. Similar economieswith agricultural central planning, in ancient Egypt, Mesopotamia, India, China, Japan, the Great Zimbabwe,and the Aztec and Maya Empires, could find their place near Nazi Germany and Communist Yugoslavia.Annexes 3.1 and 3.2 approximate their locations. Post-Communist Poland, Hungary, and similareconomies, judging from their progression from common to private income in figure 2.1 and the estimatedextent of government restriction, can be located on a diagonal between post-Communist China and Russia.One can take the world in figure 3.3, itemize it into a long list of national economies as they have evolvedthrough history, and place each of them. This would make up a crowded map but not one observation willbe missed. The map can accommodate any and all economic entities, provided the relevant data exist.They all can find their place on the map by the extent of income redistribution and government restriction.The property type or mix and the status of spillovers in each observation enhance multilateral heterogeneity.
One can choose a variety of types of aggregation and disaggregation. Subsequent maps in ourbook offer a few examples. Figure 2.4 in Chapter 2 aggregated world economies by economic policy
The Omnipresence of Common Income in a Multi-Dimensional World 19
paths, such as breakup of common income, liberalization, and privatization. Figure 3.3 uses a simpleintuitive hierarchy of national economies and supra-national regions during specific periods. Figures 3.4through 3.6 disaggregate them by 33 empirical property episodes. The table of economic species inAnnexes 3.1 and 3.2 disaggregates world economies into 110 unique, self-contained, and indivisiblespecies defined by the rates of income redistribution and government restriction. Chapter 7 disaggregatesworld economies into thirteen major empirical clusters during the last 10,000 years in figure 7.1. Then itaggregates them in a sequence of figures into six systemic classes and builds a taxonomy of economicsystems. The learning opportunities seem to be unlimited. Various levels of aggregation can be geographic,historical, by types of economic systems, by aspects of economic activity, by economic performance andpaths of economic growth, and by any other conceivable cross-section of the universe.
Measurement is also a learning process. It derives from a consistent accounting approach whichis based on the uniform criteria of exclusion specific to each dimension. Matrix 3.1 summarizes theaccounting mechanisms and measurements on the four dimensions.
Measurement improves by learning. Locations of economies in figure 3.3 are crude and tentativeapproximations. The multi-dimensional map does not pretend to pinpoint exact locations of specificnational and supra-national economies at any period of time. Its objective is less ambitious and morefundamental. It is to show that each and every economy can be identified, located, and installed on themulti-dimensional map. The crude and tentative approximations serve merely as a starting point of learning.Each empirical case can be readily relocated on the map when more rigorous measurement and better datayield more accurate positions on one or more dimensions. All errors of measurement and judgement canbe rectified by relocations. Locations can be further adjusted and refined when more reliable informationarrives. We call it a moveable map in the same spirit as Ernest Hemingway called Paris of the 1920s “AMoveable Feast.”
The multi-dimensional framework does not make predictions about locations of specific economicobservations. It derives observations from sources of various validity and accuracy and makes the bestpossible estimates for each dimension. For this reason, correction of errors does not invalidate theframework and the layout of the multi-dimensional map. The map as such does not depend on theaccuracy of specific locations. The quality of the map does. Correction of errors and repositioning ofeconomies improves this quality and strengthens the multi-dimensional construct. One can say that in theprocess of learning, the multi-dimensional map is self-correctable.
The multi-dimensional designs in figures 3.3, 3.4, 3.5, and 3.6 are different. The finding is the same.Russia and China are not just transitional outliers from a one-dimensional world. Rather, they are salientcases of a universal pattern. Figures 3.3 through 3.6 demonstrate the lack of correlations between incomeredistribution, government restriction, and property types. They emerge as uncorrelated independentvariables. This is true around the world and through history.
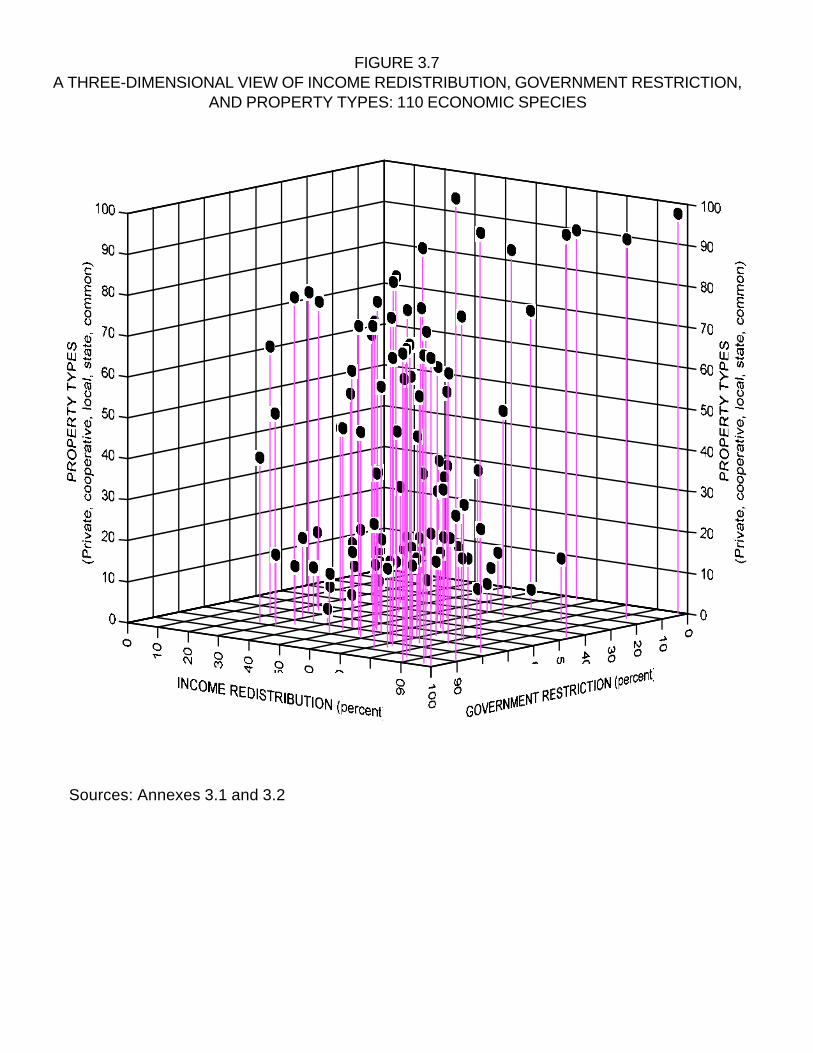
FIGURE 3.7A THREE-DIMENSIONAL VIEW OF INCOME REDISTRIBUTION, GOVERNMENT RESTRICTION,
AND PROPERTY TYPES: 110 ECONOMIC SPECIES
Sources: Annexes 3.1 and 3.2
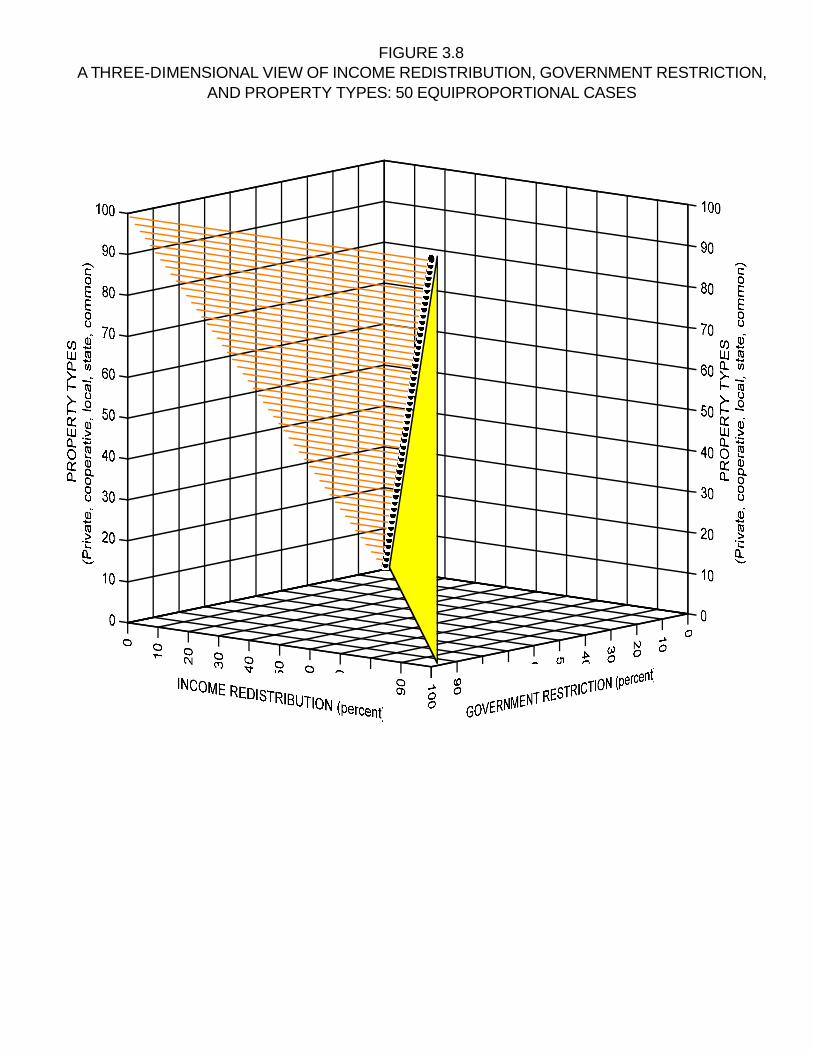
FIGURE 3.8A THREE-DIMENSIONAL VIEW OF INCOME REDISTRIBUTION, GOVERNMENT RESTRICTION,
AND PROPERTY TYPES: 50 EQUIPROPORTIONAL CASES
The Omnipresence of Common Income in a Multi-Dimensional World 20
Is this multi-dimensional map necessary and sufficient?
Two empirical conditions can each invalidate the multi-dimensional map exemplified in figure 3.3and subsequent figures. One makes it unnecessary, the other insufficient.
1. If all economies can be compressed to fit a unidimensional line such as the diagonal in figure 3.3or the scatter in figure 3.7, the split between income redistribution, government restriction, andproperty types becomes unnecessary. This is the test of strong positive correlations between thesevariables. It renders the separate income, government, and property dimensions unnecessary. Ahomogeneous world fits on one dimension. Multi-dimensional heterogeneity vanishes.
2. If one or more economies cannot be placed on the map within the two-dimensional frame ofincome and government, let alone the three-dimensional frame of figure 3.6, and lie outside, thismulti-dimensional framework is not sufficient. This is the test of universal inclusion.
Figures 3.3, 3.6, 3.7, and 3.8 offer two quick tests of positive trilateral correlations. These testsapply to different levels of aggregation.
The first test runs at the level of national economies and supra-national regions. One can comparethe one-dimensional diagonal in figure 3.3 with the rest of the map. The rest of the map should be emptyif the extents of income redistribution, government restriction, and socialization of property types convergein all empirical observations. If these extents are not equiproportional but still exhibit a strong positivecorrelation, a positively sloped regression line can be drawn. It will resemble the diagonal and will differfrom it only in the slope. The rest of the map outside of this line should be mostly empty, with a minimumof outlying observations. For the strong positive correlation between these variables to be possible, allconceivable measurement errors in figure 3.3 should not be random. All errors should constitute deviationsfrom the diagonal or from another positively sloped line. This is probable only if a multi-dimensionaldispersion in figure 3.3 was fabricated. Corrections of these measurement errors should converge alleconomies towards the unidimensional diagonal or a positively sloped line, relocate economies from alldirections onto or around one line. Moreover, even the heterogeneous qualitative characteristics andmultiple trilateral combinations in table 3.1 should disappear. Primordial common output, private slavery,brigandry, piracy, the two-track economy in post-Communist China, and Enterprise Network Socialismin post-Communist Russia should all be rendered non-existent or devoid of their unique trilateralcombinations. All these and other economies from figure 3.3 should find a place on the one-dimensionalmap in figure 3.2. This is a forthright test readily available to any observer.
The second test disaggregates national economies and supra-national regions into propertyepisodes and into elementary units, economic species. A comparison between figures 3.6, 3.7, and 3.8conducts this test in the three-dimensional frame with economies disaggregated into property episodes.Figure 3.6 plots 33 actual property episodes in historical and contemporary economies. They are identifiedin figures 3.4 and 3.5 by their extents of income redistribution, government restriction, and property types
The Omnipresence of Common Income in a Multi-Dimensional World 21
linearized on the scale of socialization vs. privatization. We discussed these measurements in detail above.The three-dimensional scatter diagram depicts each empirical episode with the blue dot and a drop-downprojection line to the respective rates of redistribution on the income dimension and restriction on thegovernment dimension. Figure 3.7 plots 110 elementary systems which are unique, self-contained, non-overlapping, and indivisible by themselves, in the absence of breakups. Their description can be found inthe Table of Economic Species in Annex 3.1. The measurement of economic species in three dimensionsin figure 3.7 is the same as the measurement of property episodes in figure 3.6. We will discuss the Tableof Economic Species in detail later in this chapter.
Against the two plots of actual observations in figures 3.6 and 3.7, figure 3.8 makes up 50 fictitiouscases with equiproportional extents of income redistribution, government restriction, and propertysocialization. We limited the number of fictitious cases to 50 for visibility only. The number ofequiproportional cases can be increased indefinitely. One could use any other trilateral proportions as longas the three variables are strongly positively correlated. One could also apply a different standard ofcontinuous measurement of property types. The picture would essentially be the same. A strong positivecorrelation between the three variables converges the scatter of 50 observations onto one linear trajectory.For visual comparison, the blue dots of 50 observations project the drop-down yellow lines to the equalrates of income redistribution and government restriction and the drop-down orange lines to the equalextents of income redistribution and property socialization.
The three-dimensional scatter diagram in figure 3.8 is appealing. Alas, its content does not exist.Its 50 observations represent a sequence of numerical matches which has no bearing in the real world. Thecontrast between figures 3.6 and 3.7 vs. 3.8 is stark. The real world is scattered all over the space withinthe three-dimensional frame in figures 3.6 and 3.7. It is uncorrelated between variables, in the same wayas the 33 empirical episodes are dispersed throughout the map in figures 3.4 and 3.5 and the 110 economicspecies are dispersed all over the map in Annexes 3.1 and 3.2. The imaginary world of strong positivecorrelations between the three variables lines up in figure 3.8. This imaginary world in figure 3.8corresponds to the one-dimensional world in figure 3.2. If one can reduce the scatters in figures 3.6 and3.7 to the string in figure 3.8, the multi-dimensional frame is unnecessary.
The test of universal inclusion is the same test for two and more dimensions as we applied to theone-dimensional map. The standard of proof and refutation is the same. Can the map cover,accommodate, and absorb all known and all conceivable empirical cases, big and small, around the worldand through history, from the beginning of human society to the time of this reading? If one can find a singleeconomy or segment, extant or extinct, which cannot be placed on the map in figure 3.3 or amongdisaggregated units in Annexes 3.1 and 3.2, the multi-dimensional framework has failed. Falsification isinstantaneous and irreversible. There should be no cases outside of the map.
This is a hard test. The condition of universal inclusion applies separately to each of the two basicdimensions, the income dimension and the government dimension, because they frame the latitude and thelongitude of the multi-dimensional map. A failure of one of these dimensions to accommodate and
The Omnipresence of Common Income in a Multi-Dimensional World 22
13The complementary, property and externalities dimensions, seem to be all-inclusive at the outset. There arealways some types of property rights vs. common property and some compensation of spillovers of ideas (even if zero).
assimilate a single empirical case throws an outlying case outside of the map and dooms the entireframework to perish. This condition tests whether the income and government dimensions are genuine andnot fabricated. The underlying problem with the one-dimensional perspective of government vs. marketis not that it forms only one dimension but that it is a false dimension which does not fit the world. Pilingup more false dimensions or even adding a genuine dimension such as property types cannot rectify thisproblem. The test of universal inclusion applied to the multi-dimensional map determines whether each ofits basic dimensions is genuine.13
Furthermore, if cases are missing due to lacunae in our knowledge and are discovered later, theymust be able to be installed on the map. If they do not fit any location within the two-dimensional frame,they invalidate the multi-dimensional approach. If errors of measurement and judgement are found in theplacement of any number of empirical cases, they can be corrected, cases disaggregated or aggregated,and economies or species relocated. If errors are not correctable and the cases cannot be properlyidentified, relocated, and assimilated within the map, the multi-dimensional system fails the test of universalinclusion and is invalidated. The multi-dimensional framework is permanently open to verification andfalsification. It can be immediately and irrevocably refuted by finding a single empirical exception to itsuniversal inclusiveness.
Pending such refutation, the world on the multi-dimensional map seems all-inclusive. It capturesuniversal experience. It is both static and dynamic. Any systemic metamorphosis and any policy shift ineach economy can be navigated on this map. When economic systems change, economies move on themap and add to the map. This is why the same countries at different times appear in different parts of figure3.3. China, the Soviet Union, and Nazi Germany under central planning and China, Russia, and unitedGermany after central planning find their specific locations on the same map. Similarly, pre-industrialEurope and contemporary Western market economies appear in different segments of the map. Figure 2.4in the previous chapter sketched the economic policy paths such as breakup of common income,liberalization, and privatization. It contrasted liberalization and privatization without the breakup of commonincome in Russia as it descended from central planning to Enterprise Network Socialism and the breakupof common income with limited liberalization in China on the road to the market economy. It comparedthese two paths with a more conventional synchronization of the breakup of common income, liberalization,and privatization in the evolution of Western market economies. We will further explore this dynamiccapacity of the multi-dimensional map later in this book.
The multi-dimensional framework illustrated in figure 3.3 and Annex 3.2 can encapsulate both theevolution of economic species from primordial common output to modern market and socialist economiesand the current position of all existing economies. The four dimensions render systemic characteristics ofall economies. Then the map framed by these four dimensions captures all economies and their paths. Thismulti-dimensional map creates a contemporaneous snapshot of all economies in the world throughout more
The Omnipresence of Common Income in a Multi-Dimensional World 23
than 10,000 years of their evolution.
The Omnipresence of Common Income in a Multi-Dimensional World 1
Chapter 3
The Omnipresence of Common Income in a Multi-Dimensional World
Section B. Patterns of Multi-Dimensional Heterogeneity
A quick glance at Annex 3.2 gives the sight of a multi-dimensional universe. It looks like aconstellation of heterogeneous economic systems. These are 110 economic species defined as elementarysystems that are unique, self-contained, non-overlapping, and indivisible by themselves, in the sense thatthey cannot exist after breakups. The 110 enumerated species are spread all over the map in theintersections of different rates of income redistribution and government restriction. They exhibit differentprincipal property types emphasized by five colors. They contain different extents of internalization ofpositive externalities: The larger is the size of the bubble the higher is the rate of remuneration for productionof ideas, invention, and technological innovation. In short, world economies are heterogeneous in fourdimensions.
In the one-dimensional world in figure 3.2, world economies differ only by one measure. It is thedegree of market distortions measured by the extent of government restriction. In the multi-dimensionaluniverse in figure 3.3 and Annex 3.2, world economies differ in four dimensions, by the rates of incomeredistribution, government restriction, and compensation of spillovers, and by property types. Adam Smithwas first to point out what we would now call a multi-dimensional heterogeneity of economic systems,particularly that free transactions, limited government, and private property may not reduce incomeredistribution and may even increase it.
The vision of Adam Smith
Adam Smith lays out a three-dimensional perspective succinctly. He observes that the burden ofslavery (and, by implication, of redistribution of output and income) is positively related to liberalgovernment and private property:
As the profit and success of the cultivation which is carried on by means of cattle, depend verymuch upon the good management of those cattle; so the profit and success of that which iscarried on by slaves, must depend equally upon the good management of those slaves; and inthe good management of their slaves the French planters, I think it is generally allowed, aresuperior to English. The law, so far as it gives some weak protection to the slave against theviolence of his master, is likely to be better executed in a colony where the government is ina great measure arbitrary, than in one where it is altogether free. In every country where theunfortunate law of slavery is established, the magistrate, when he protects the slave,intermeddles in some measure in the management of the private property of the master; and,
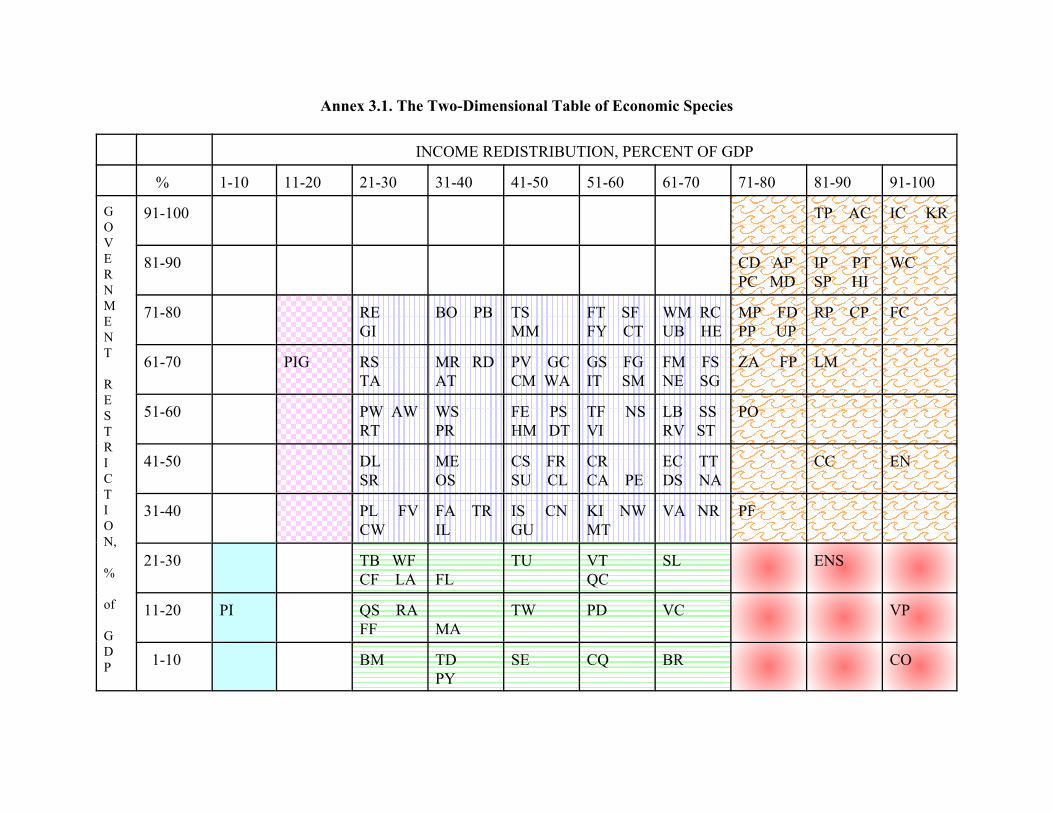
Annex 3.1. The Two-Dimensional Table of Economic Species
INCOME REDISTRIBUTION, PERCENT OF GDP
% 1-10 11-20 21-30 31-40 41-50 51-60 61-70 71-80 81-90 91-100
GOVERNMENT
RESTRICTION,
%
of
GDP
91-100 TP AC IC KR
81-90 CD APPC MD
IP PTSP HI
WC
71-80 RE GI
BO PB TS MM
FT SFFY CT
WM RCUB HE
MP FDPP UP
RP CP FC
61-70 PIG RSTA
MR RD AT
PV GCCM WA
GS FGIT SM
FM FSNE SG
ZA FP LM
51-60 PW AW RT
WS PR
FE PSHM DT
TF NSVI
LB SS RV ST
PO
41-50 DLSR
ME OS
CS FRSU CL
CR CA PE
EC TTDS NA
CC EN
31-40 PL FVCW
FA TRIL
IS CNGU
KI NWMT
VA NR PF
21-30 TB WF CF LA FL
TU VTQC
SL ENS
11-20 PI QS RAFF MA
TW PD VC VP
1-10 BM TD PY
SE CQ BR CO
Legend:
AC - agrarian commune with forced production (e.g., the Inca Empire)AP - agricultural central planning: centralized irrigation network and forced delivery of output to the state wholesale monopsony/monopoly (e.g., ancient Egypt, Mesopotamia, China, Japan, India, the Olmec, Maya, the Aztec Empire, the Great Zimbabwe)AT - arbitrary and confiscatory taxationAW - ancient Welfare State (e.g., Rome, 58 B.C.-453 A.D.)BM - black marketBO - bailouts (soft subsidies)BR - brigandryCA - castes (e.g., India)CC - centralized privately run colonies (e.g., Java)CD - collectivized delivery: forced delivery in collectivized agriculture, state-directed self-management in industry (Algeria, 1963-65)CF - corporate fraudCL - coloni (the late Roman Empire)CM - colonial mercantilism (e.g., Portugal, Holland, 1600s)CN - corruptionCO - common output of primordial hunters and gatherersCP - collectivized plantation: forced plantation labor and collectivized delivery in agriculture, nationalized industry (Madagascar, 1973-86)CQ - conquestCR - corporatism (e.g., South Africa, Argentina under Peron)CS - the corporate state (e.g., Fascist Italy)CT - collective (communal) taxation (e.g., pre-colonial India, pre-modern Islamic states, pre-Columbian America, Imperial Russia)CW - coordinated and open wholesale and foreign trade and workshop manufacturing, indirectly financed by the government (financed by private intermediaries from government deposits of accumulated tax revenues, that is, implicit fiscal lending for business finance) and free, private retail trade, agriculture, and hand manufacturing with slave labor; free product and labor markets apart from slavery (ancient Greece and Rome)DL - sectoral draft labor (e.g., corvee in France)DS - debt-based, local government-enforced private slavery (Mycenae, Sparta, pre-Solon Athens, pre-Republic Rome, and the ancient Near East)
DT - delegated taxation at specific tax rates levied by the government and collected by designated individuals (e.g., ancient Greek city-states, the Roman Republic, the early Roman Empire, the kingdom of Theodoric the Great, 488-526, under the government of Boethius, the Empire of Charlemagne, 768-814) EC - export control, mandated repatriation of foreign exchange revenues, which leads to enforcement of tax remittance under Enterprise Network Socialism (Russia since 1999)EN - enslavement (e.g., pre-colonial Africa, early medieval Germanic societies, the Vikings, 800-1050, Iran, 1501-1850, the Ottoman Empire, pre-colonial India, e.g., Malabar, the Indian societies of the American Northwest coast, e.g., Kwakiutl and Yurok, spin-offs of piracy, and other world-wide episodes)ENS - Enterprise Network Socialism, symbiont government (e.g., Russia in the 1990s)FA - foreign aidFC - forced plantation commune (e.g., Guarani)FD - franchised output delivery quotas: under franchised taxation and wholesale monopsony/monopoly, taxation in money or in kind with preset quotas for centralized remittance and residuals accruing to local governors converts into local forced delivery quotas (e.g., ancient and medieval Persia, medieval Arab states, the Ottoman Empire, pre-colonial India, medieval China and Japan)FE - feudal network (medieval Europe)FF - financial fraud and insurance fraud, including insurance risk abuse and bank insurance abuse (“moral hazard” in banking)FG - fiscal guilds (e.g., Byzantium)FL - financial looting (e.g., Chile in the late 1970s)FM - franchised taxation and franchised wholesale monopsony/monopoly (e.g., pre-Meiji Japan and late Imperial China)FP- franchised central planning with forced delivery (e.g., medieval and Tokugawa Japan, medieval China)FR - financial suppression, e.g., direct financial repression in Latin America and other less developed economies by the government and financial-industrial quasi-cartels and networksFS - franchised slavery (or franchised serfdom, which is a misnomer) (e.g., Russia, 1497-1861, Korea, 1392-1725, the Kanem Bornu Empire, 1580-1846, the Oyo Empire, 1650-1800, the Fulani Empire, 1790-1897)FT - franchised taxation (e.g., ancient and medieval Persia, medieval Arab states, the Ottoman Empire, pre-colonial India, medieval China)FV - franchised violent enterprises (government-franchised piracy) (e.g., colonial Portugal)FY - franchised tribute (e.g., the early Arab Caliphate, the Mongol Empire, Kievan Rus, Muscovy, 1147-1380)GC - government-financed colonization and resettlement of landless peasants (ancient Greece and Rome)GI - industrial policy and government-directed investment (e.g., post-World War II Japan, South Korea, China, 1990s, associational planning and the New Deal planning in the U.S., 1920s-1930s, indicative planning, France, 1950s-1960s)GS - government-supplied slavery (ancient Greece and Rome and non-agricultural sectors in Phoenicia and Carthage)
GU - private guilds (e.g., pre-industrial Europe)HE - helotry, a servitude community in private agricultural service to members of the ruling community under government management, and to the state directly (Sparta, 9th century-371 B.C.)HI - militarized central plan plantation (Hispaniola under Toussaint, 1800-1802)HM - hierarchical guild mercantilism (the Hanseatic League, 1158-1669)IC - industrial central plan commune with terror-enforced forced production and output quotas (e.g., North Korea)IL - IMF loans and subsidies from other international lending organizationsIP - multi-industry central planning with forced production, output quotas, and the soft budget constraint, without terror enforcement (e.g., the USSR, part of Eastern Europe, and China under Communism except for periods ca. 1940-1953 in the USSR, ca. 1958-71 in China, ca. 1949-1953 in Hungary, etc.)IS - indentured servitude (e.g., Spanish colonies in America and the Philippines)IT - imperial tribute/taxation (e.g., the Empire of Alexander the Great and the successive states, the Roman Empire)KI - subsidized communal income (kibbutzim) (Israel)KR - agricultural central plan commune with forced production (Communist Cambodia under the Khmer Rouge, 1975-79)LA - litigation abuseLB - wage scissors (landlord bias) - suppressed wages and sectoral wage/rent scissors (e.g., India, Pakistan, Bangladesh, Jordan)LM - state-coordinated labor management with implicit output quotas, forced delivery, forced investment and technology application but without suppressed wages and forced saving (Communist Yugoslavia)MA - mafia (e.g., Italy, U.S. cities) and other parasitic non-governmental and violent redistributive enterprises (e.g., Latin America) MD - managed delivery: forced delivery in agriculture, central plan with indicative output targets in industry (Egypt, 1960s)ME - mercantilism (e.g., pre-industrial Europe, Meiji Japan)MM - military mercantilism (e.g., Genoa, Venice, Florence)MP - mono-industrial central planning with forced production (output quotas) in the textile industry and forced delivery in agriculture (Egypt under Mohammad Ali, 1805-49)MR - monopoly rightsMT - collective monopsony/monopoly trade (e.g., Medieval Maghreb)NA - confiscations and nationalizations of firms, banks, and land (e.g., Western European Welfare States, 1930s-1980s, Latin America, and developing and post-colonial economies)NE - natural-resource based national estate, e.g., national oil company, with economic rents accruing to a theocratic or tribal network which subsidizes a welfare state for the rest of the population, including broad price subsidies and subsidies for secondary and tertiary industries (e.g., Saudi Arabia since the 1960s, Iran since 1979, Lybia since 1969, etc.)NR - pre-Neolithic and Neolithic rationing of output, emergence of income and government as insurance (e.g., Katal Huyuk, Jericho)
NS - network serfdom (e.g., the Polish Kingdom)NW - network wholesale monopsony as part of the encomienda system which started as the agglomerated local wholesale monopsony of settlers franchisee tax collectors in the New Spain (whose arbitrary tribute rights forced the Amerindians to produce output surpluses and sell untaxed surpluses to the franchisee monopsony for the lack of other wholesalers) and evolved into the network wholesale monopsony, network labor monopsony, and network landowner/labor monopsony after the Wars of Independence and the abolition of the encomienda system (Latin America, 1493-1811 and the network evolution thereafter)OS - other sectoral subsidiesPB - ad hoc subsidies (pork barrel)PC - peripheral franchised central planning with forced delivery of output and communal taxation for supporting the central irrigation and infrastructure network (e.g., pre-Columbian North America)PD - plunderPE - peonage (e.g., Spanish American colonies)PF - private joint-stock network of forced production (e.g., the Virginia colony)PI - near-total private income with government as public utility (classical market economy, e.g., England and the U.S. before the Welfare State, Singapore, Hong Kong)PIG - sectoral private income in a two-track economy, with government as protective custody, restricting the new-entrant market sector from the inherited network of state enterprises, and vice versa (e.g., China, post-1978, Vietnam, post-1986, Cambodia, Myanmar)PL - the Poor Laws (e.g., England)PO - private auxiliary plots and orchard plots (e.g., USSR, 1947-1991)PP - central planning over private corporations with output quotas of forced production and forced labor (e.g., Nazi Germany)PR - patronage, “crony capitalism” (e.g., India, Indonesia, Mexico)PS - private serfdom: unpaid non-free labor in lieu of rent (medieval Europe)PT - centrally planned slave trade and forced production (output quotas) by slaves on state plantations (Dahomey, 1680-1892)PV - privileges (e.g., pre-industrial Spain and France, Latin America)PW - public works (e.g., U.S., 1930s, China, 1990s)PY - piracyQC - quasi-cartels of private industrial, financial, and agricultural networks with labor monopsony (including landowner/labor monopsony) and suppressed wages (Mexico and other countries of Latin America since the 1810s, Chile until 1983, sub-Saharan Africa since the 1990s)QS - quasi-states of private colonies, large mining and industrial firms, and large farms (British South Africa under Cecil Rhodes)RA - racketeering (e.g., U.S. cities in the 1920s)
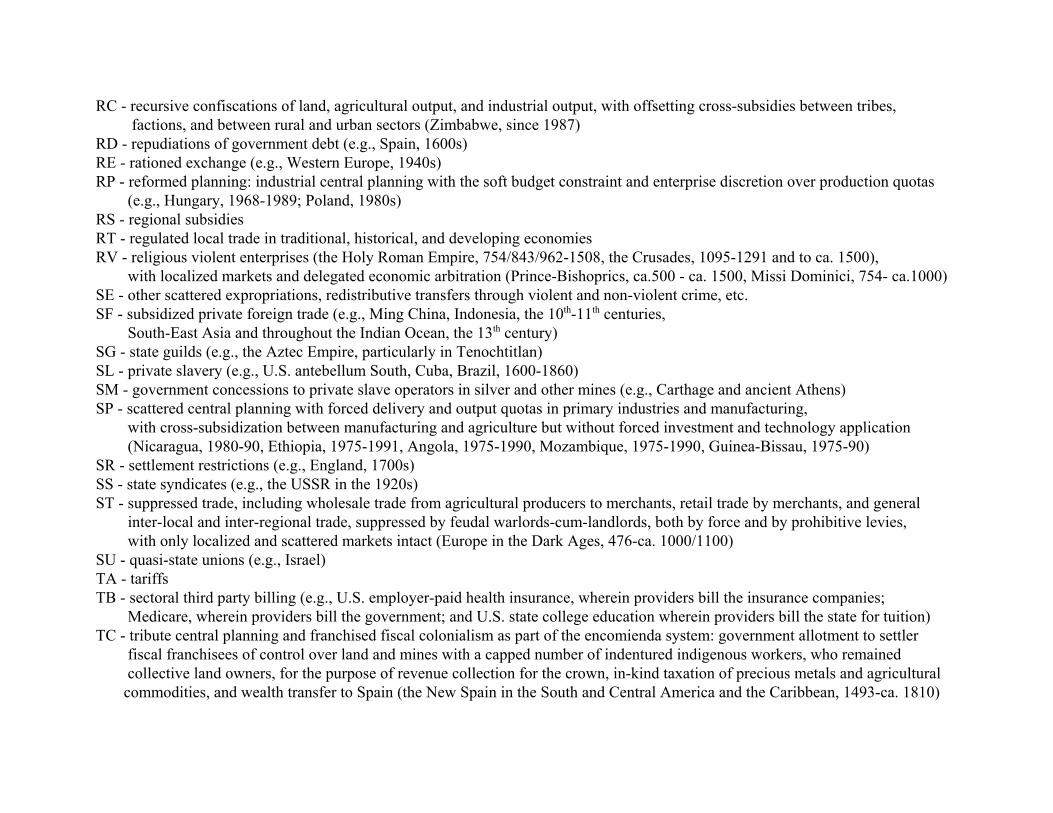
RC - recursive confiscations of land, agricultural output, and industrial output, with offsetting cross-subsidies between tribes, factions, and between rural and urban sectors (Zimbabwe, since 1987)RD - repudiations of government debt (e.g., Spain, 1600s)RE - rationed exchange (e.g., Western Europe, 1940s)RP - reformed planning: industrial central planning with the soft budget constraint and enterprise discretion over production quotas (e.g., Hungary, 1968-1989; Poland, 1980s)RS - regional subsidiesRT - regulated local trade in traditional, historical, and developing economiesRV - religious violent enterprises (the Holy Roman Empire, 754/843/962-1508, the Crusades, 1095-1291 and to ca. 1500), with localized markets and delegated economic arbitration (Prince-Bishoprics, ca.500 - ca. 1500, Missi Dominici, 754- ca.1000)SE - other scattered expropriations, redistributive transfers through violent and non-violent crime, etc.SF - subsidized private foreign trade (e.g., Ming China, Indonesia, the 10th-11th centuries, South-East Asia and throughout the Indian Ocean, the 13th century)SG - state guilds (e.g., the Aztec Empire, particularly in Tenochtitlan)SL - private slavery (e.g., U.S. antebellum South, Cuba, Brazil, 1600-1860)SM - government concessions to private slave operators in silver and other mines (e.g., Carthage and ancient Athens)SP - scattered central planning with forced delivery and output quotas in primary industries and manufacturing, with cross-subsidization between manufacturing and agriculture but without forced investment and technology application (Nicaragua, 1980-90, Ethiopia, 1975-1991, Angola, 1975-1990, Mozambique, 1975-1990, Guinea-Bissau, 1975-90)SR - settlement restrictions (e.g., England, 1700s)SS - state syndicates (e.g., the USSR in the 1920s)ST - suppressed trade, including wholesale trade from agricultural producers to merchants, retail trade by merchants, and general inter-local and inter-regional trade, suppressed by feudal warlords-cum-landlords, both by force and by prohibitive levies, with only localized and scattered markets intact (Europe in the Dark Ages, 476-ca. 1000/1100)SU - quasi-state unions (e.g., Israel)TA - tariffsTB - sectoral third party billing (e.g., U.S. employer-paid health insurance, wherein providers bill the insurance companies; Medicare, wherein providers bill the government; and U.S. state college education wherein providers bill the state for tuition)TC - tribute central planning and franchised fiscal colonialism as part of the encomienda system: government allotment to settler fiscal franchisees of control over land and mines with a capped number of indentured indigenous workers, who remained collective land owners, for the purpose of revenue collection for the crown, in-kind taxation of precious metals and agricultural commodities, and wealth transfer to Spain (the New Spain in the South and Central America and the Caribbean, 1493-ca. 1810)
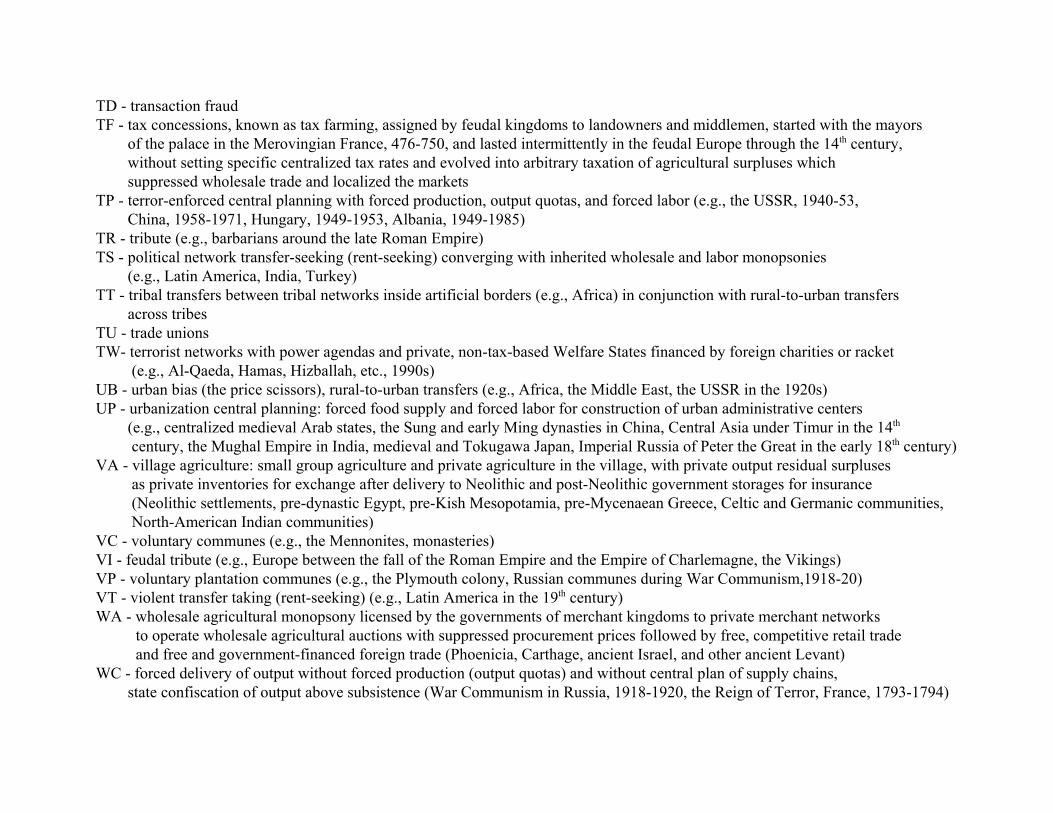
TD - transaction fraudTF - tax concessions, known as tax farming, assigned by feudal kingdoms to landowners and middlemen, started with the mayors of the palace in the Merovingian France, 476-750, and lasted intermittently in the feudal Europe through the 14th century, without setting specific centralized tax rates and evolved into arbitrary taxation of agricultural surpluses which suppressed wholesale trade and localized the marketsTP - terror-enforced central planning with forced production, output quotas, and forced labor (e.g., the USSR, 1940-53, China, 1958-1971, Hungary, 1949-1953, Albania, 1949-1985)TR - tribute (e.g., barbarians around the late Roman Empire)TS - political network transfer-seeking (rent-seeking) converging with inherited wholesale and labor monopsonies (e.g., Latin America, India, Turkey)TT - tribal transfers between tribal networks inside artificial borders (e.g., Africa) in conjunction with rural-to-urban transfers across tribesTU - trade unionsTW- terrorist networks with power agendas and private, non-tax-based Welfare States financed by foreign charities or racket (e.g., Al-Qaeda, Hamas, Hizballah, etc., 1990s)UB - urban bias (the price scissors), rural-to-urban transfers (e.g., Africa, the Middle East, the USSR in the 1920s)UP - urbanization central planning: forced food supply and forced labor for construction of urban administrative centers (e.g., centralized medieval Arab states, the Sung and early Ming dynasties in China, Central Asia under Timur in the 14th
century, the Mughal Empire in India, medieval and Tokugawa Japan, Imperial Russia of Peter the Great in the early 18th century)VA - village agriculture: small group agriculture and private agriculture in the village, with private output residual surpluses as private inventories for exchange after delivery to Neolithic and post-Neolithic government storages for insurance (Neolithic settlements, pre-dynastic Egypt, pre-Kish Mesopotamia, pre-Mycenaean Greece, Celtic and Germanic communities, North-American Indian communities)VC - voluntary communes (e.g., the Mennonites, monasteries)VI - feudal tribute (e.g., Europe between the fall of the Roman Empire and the Empire of Charlemagne, the Vikings) VP - voluntary plantation communes (e.g., the Plymouth colony, Russian communes during War Communism,1918-20)VT - violent transfer taking (rent-seeking) (e.g., Latin America in the 19th century)WA - wholesale agricultural monopsony licensed by the governments of merchant kingdoms to private merchant networks to operate wholesale agricultural auctions with suppressed procurement prices followed by free, competitive retail trade and free and government-financed foreign trade (Phoenicia, Carthage, ancient Israel, and other ancient Levant)WC - forced delivery of output without forced production (output quotas) and without central plan of supply chains, state confiscation of output above subsistence (War Communism in Russia, 1918-1920, the Reign of Terror, France, 1793-1794)
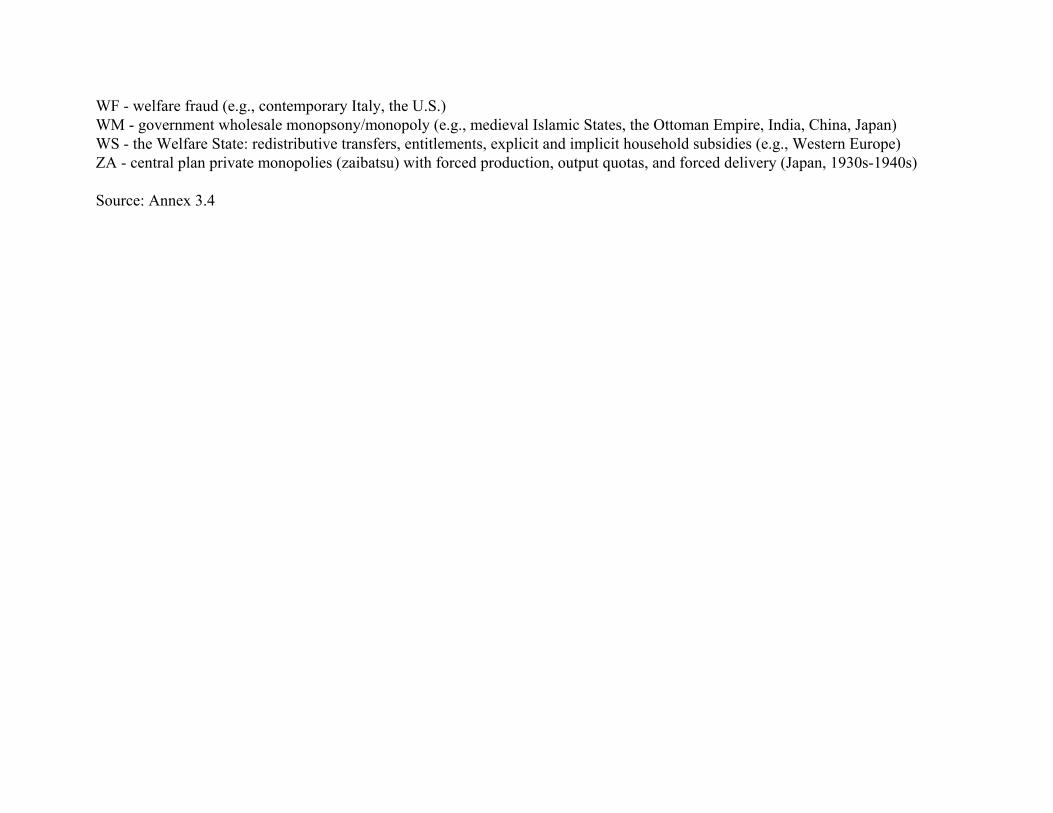
WF - welfare fraud (e.g., contemporary Italy, the U.S.)WM - government wholesale monopsony/monopoly (e.g., medieval Islamic States, the Ottoman Empire, India, China, Japan)WS - the Welfare State: redistributive transfers, entitlements, explicit and implicit household subsidies (e.g., Western Europe)ZA - central plan private monopolies (zaibatsu) with forced production, output quotas, and forced delivery (Japan, 1930s-1940s)
Source: Annex 3.4
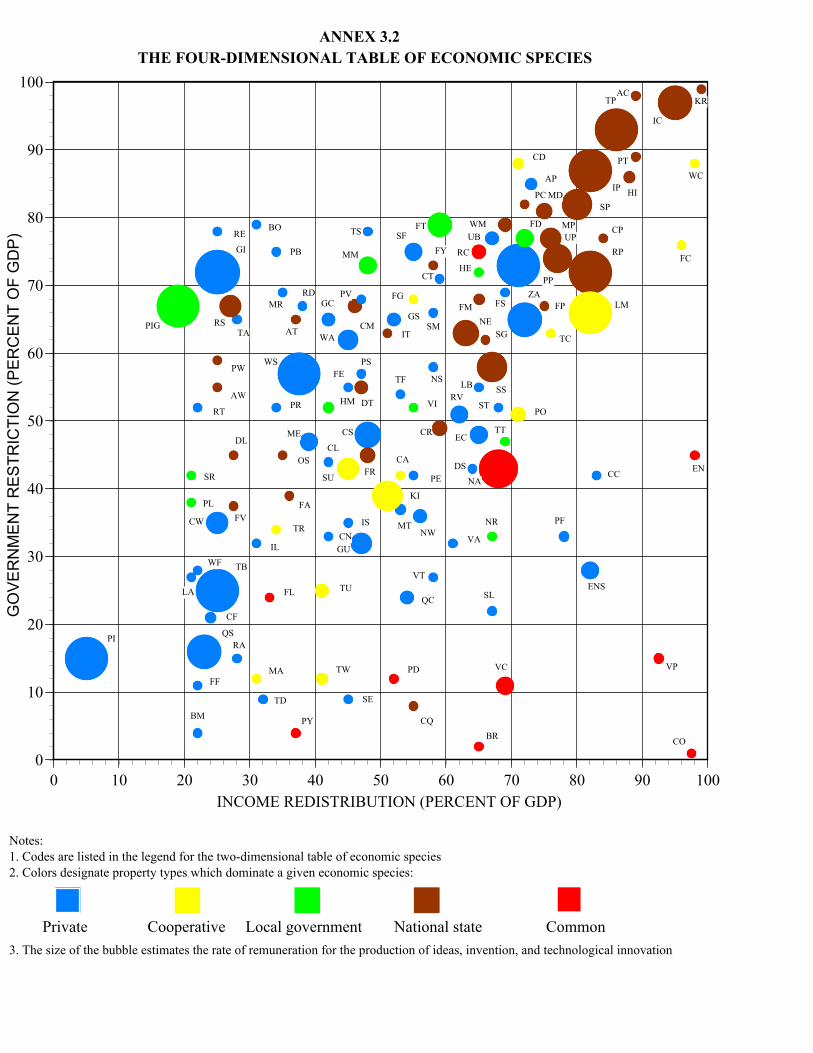
0
10
20
30
40
50
60
70
80
90
100
0 10 20 30 40 50 60 70 80 90 100
GO
VE
RN
ME
NT
RE
STR
ICTI
ON
(PE
RC
EN
T O
F G
DP
)
INCOME REDISTRIBUTION (PERCENT OF GDP)
PI
PIG
GI
RE
TARS
PW
AW
RT
DL
SR
FV
HE
PL
BO
PB
MRRD
AT
WS
PR
ME
OS
FA
TR
IL
TS
MM
CM
PV
FEPS
HM
GU
CS
CN
SU
FT
CT
FYSF
GS
FG
LB
IT
TF
CL
VI
NS
CA
TTCR
MTIS
KI
WMUB
FM FS
SG
DS
SS
PE
NR
VA
WF
CF
LA
RA
FF
PY
NA
FL
MA
TD
TU
TW
SE
VT
PD
CQ
SL
VC
BR
TPAC
KR
IC
AP
PC
CD
MDIP
PTWC
FP
MP
PP
CP
RPFC
ZA
PO
LM
ENCC
ENS
PF
VP
CO
BM
EC
NE
QC
QS
TB
UP
CW
WASM
GC
RV
SP
RC
HI
FD
FR
TC
ST
NW
DT
Private Cooperative Local government National state Common
Notes:1. Codes are listed in the legend for the two-dimensional table of economic species2. Colors designate property types which dominate a given economic species:
3. The size of the bubble estimates the rate of remuneration for the production of ideas, invention, and technological innovation
ANNEX 3.2THE FOUR-DIMENSIONAL TABLE OF ECONOMIC SPECIES
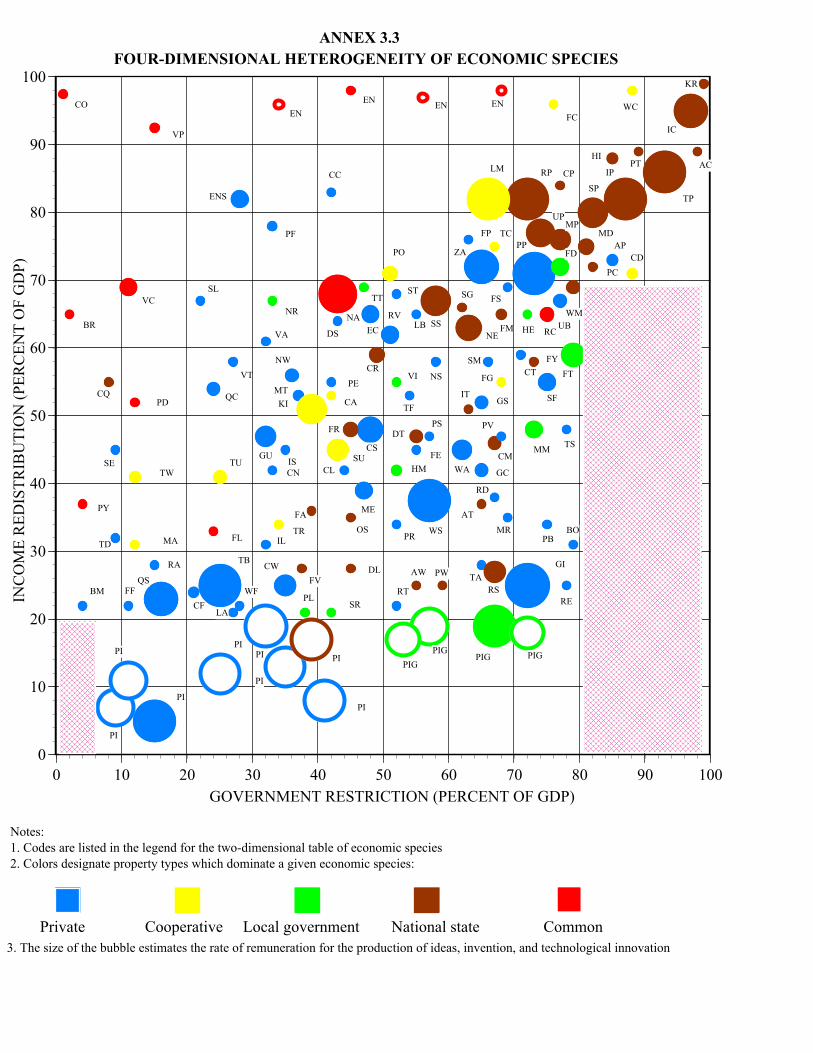
0
10
20
30
40
50
60
70
80
90
100
0 10 20 30 40 50 60 70 80 90 100
INC
OM
E R
EDIS
TRIB
UTI
ON
(PER
CEN
T O
F G
DP)
GOVERNMENT RESTRICTION (PERCENT OF GDP)
PI
PIG
GI
RE
TARS
PWAW
RT
DL
SR
FV
HE
PL
BOPB
MR
RD
AT
WSPR
ME
OSFA
TRIL
TSMMCM
PV
FE
PS
HMGU
CS
CNSU
FTCTFY
SFGS
FG
LB
ITTF
CL
VI NS
CA
TT
CR
MT
IS
KI
WMUBFM
FSSG
DSSS
PE
NR
VA
WFCF
LA
RA
FF
PY
NA
FLMATD
TUTW
SE
VT
PDCQ
SLVC
BR
TP
AC
KR
IC
AP
PCCD
MD
IPPT
WC
FPMP
PP
CPRP
FC
ZAPO
LM
EN
CC
ENS
PF
VP
CO
PIGPIG
PIPI PI
PI
PI
ENEN EN
PI
PI PIG
BM
EC NE
QC
QS
TB
UP
CW
WA
SM
GC
RV
SP
RC
HI
FD
FR
TC
ST
NW
DT
Private Cooperative Local government National state Common
Notes:1. Codes are listed in the legend for the two-dimensional table of economic species2. Colors designate property types which dominate a given economic species:
3. The size of the bubble estimates the rate of remuneration for the production of ideas, invention, and technological innovation
ANNEX 3.3FOUR-DIMENSIONAL HETEROGENEITY OF ECONOMIC SPECIES
The Evolution of Private Income: A Few Sketches and Approximations 1
1Adam Smith, An Inquiry into the Nature and Causes of the Wealth of Nations (Washington, D.C.: RegneryPublishing, Inc., 1998), pp. 945-946.
Chapter 4
The Evolution of Private Income: A Few Sketches and Approximations
In the Fifth Book of The Wealth of Nations, Adam Smith builds up a stunning paradox:
The private revenue of individuals, it has been shewn in the first book of this Inquiry, arisesultimately from three different sources: Rent, Profit, and Wages. (...)
The subjects of every state ought to contribute towards the support of the government, asnearly as possible, in proportion to their respective abilities; that is, in proportion to therevenue which they respectively enjoy under the protection of the state. The expense ofgovernment to the individuals of a great nation, is like the expense of management to the jointtenants of a great estate, who are all obliged to contribute in proportion to their respectiveinterests in the estate. (...)
The tax which individual is bound to pay out to be certain, and not arbitrary. (...) Thecertainty of what each individual ought to pay is, in taxation, a matter of so great importance,that a very considerable degree of inequality, it appears, I believe, from the experience of allnations, is not near so great an evil as a very small degree of uncertainty.1
Unless we are mistaken, Adam Smith is saying that (1) the basis of private income rests upon afoundation of well-defined public income directed to the provision of certain specific services. And (2) thispublic income amounts to the private income of the government. This conceptual equivalence means thatthe government, in effects, resembles a private enterprise-like entity, and that taxation is akin to a privatecontract between the government and the citizenry, in which citizens pay specific (and preferably low) taxesin exchanges for services rendered. Chapter 4 examines this seeming paradox.
The Origin of Private Income
In addition to orderly taxation, Adam Smith propounds several other important related insights. He alwaysequates privacy of revenue with its certainty, in the sense of rules as opposed to discretion and arbitrariness.
The Evolution of Private Income: A Few Sketches and Approximations 2
2Ibid., pp. 439-440, 441.
3Ibid., p. 15, 143.
4Ibid., p. 442.
5Ibid. See also Douglass C. North, Structure and Change in Economic History (New York: W.W. Norton, 1981),pp. 124-136.
6Douglass C. North, Structure and Change in Economic History, pp. 78-94, 100-102.
He maintains that rents in a prosperous economy are certain,2 that wages as return on labor effort and theability to command all output surplus are certain,3 and, that even in the absence of property rights andcontractual lease, the common law secures private returns on land improvement as investment.4
Those laws and customs so favourable to the yeomanry, have perhaps contributed more tothe present grandeur of England, than all their boasted regulations of commerce takentogether.5
The principle “no arbitrary taxation,” so prominent in the writing of Adam Smith, was formulatedby the English Parliament in the Petition of Right of 1628 and imposed on King Charles I. The Petition ofRight of 1628 was itself based on well-established common law, which allowed individuals to sue theCrown for breaches of authority and financial distress. The Petition of Right of 1628, among other clauses,prohibited arbitrary search and seizures, which later was included in the U.S. Constitution in the Bill ofRights.
It is instructive that the rule of no arbitrary taxation, which effectively formulated the principle ofprivate income, preceded in the Petition of Right of 1628 the rule of no arbitrary search and seizures, whichunderpinned the principle of private property. “A man’s home is his castle” is a famous English expression,reflecting this principle. Turning back the pages of history still further, private ownership of land existed inEngland before the Norman conquest in 1066. Several decades later, in 1086, the new Norman kingordered his agents to conduct an incredibly detailed survey of his nation’s wealth, visiting every householdto count and register each unit of land, animals, tools, and every other quantifiable asset. The purpose wasto determine the nation’s potential tax base. This survey has come down to us through history as thefamous Doomsday Book. Even though some 170 Norman barons took control of most large Anglo-Saxonestates, their land and other holdings were accurately registered in the king’s records. The recognition andregistration of private property provided the Crown with a basis for collecting taxes from the holders ofwealth and the surrounding communities that served each feudal estate. The point of this historicalexpedition is that free transactions and private property have existed for millennia in settled or even nomadicagriculture. But the two well-recognized features of markets—free exchange and private property—werenot sufficient, by themselves, to propel these ancient communities beyond a subsistence level of output andconsumption.6
The Evolution of Private Income: A Few Sketches and Approximations 3
7Douglass C. North, Structure and Change in Economic History, pp. 145-168; Douglass C. North, Institutions,Institutional Change and Economic Performance (Cambridge: Cambridge University Press, 1990), pp. 114-116; DouglassC. North, “Institutions,” Journal of Economic Perspectives 5, no. 1 (Winter 1991): 97-112; and, Douglass C. North,“Economic Performance Through Time,” American Economic Review 84, no. 3 (June 1994): 359-368. See also animportant discussion along similar lines in John Hicks, A Theory of Economic History (Oxford: Clarendon Press, 1969),pp. 81-86, 94-95. For a detailed analysis of the policies after the Glorious Revolution and the role of multi-layer federalism,see Barry R. Weingast, “The Economic Role of Political Institutions: Market-Preserving Federalism and EconomicGrowth,” Journal of Law, Economics and Organization 11, no. 1 (April 1995): 1-31. For a broad discussion, see JohnBrewer, The Sinews of Power: War, Money, and the English State, 1688-1783 (London and Boston: Unwin Hyman,1989). For a contrasting perspective of income redistribution in England and France, see Hilton L. Root, The Fountainof Privilege: Political Foundations of Economic Markets in Old Regime France and England (Berkeley, CA: Universityof California Press, 1994).
8Until the latter part of the eighteenth century, government expenditure and taxation in Britain remained low,generally less than 10 percent of GDP. The Napoleonic War drove up spending and debt service costs to 27.1 percentof GDP by 1811. When the war concluded in 1815, Britain embarked on several successive tax-cutting sprees and sharplyreduced public expenditure. Including debt service, gross public expenditure fell to 7.4 percent of GDP by 1871, andremain at this low level until the late 1890s. This reduction in the tax burden freed-up substantial funds for privateinvestment and transformed Britain into the world’s wealthiest nation, until it was supplanted by the United States. Forthe details of the reduction in the scope and size of government in Britain during this period, see Alvin Rabushka, FromAdam Smith to the Wealth of America (New Brunswick, N.J.: Transaction Books, 1985), pp. 24-81. It is important to notethat it took several decades after the Industrial Revolution to transform Britain into a wealthy nation. Indeed, the sharpreduction in the scope and size of government in the nineteenth century greatly facilitated the expansion of the Britisheconomy.
9Douglass C. North, Structure and Change in Economic History, p. 147.
For our purposes, it is important to note that the authors of the Petition of Right of 1628 placedprivate income ahead of private property. They probably understood that private property was of little useunless its owners could secure the private income generated by the property. By 1628, the unique Englishcommon law had settled rents, wages, and profits in a manner praised by Adam Smith—what, usingmodern language, we now call internalization of income. The heretofore missing element in the system ofprivate income was the origin of a reasonable level of orderly public income, which would representcontractual payment for government services, especially for protection of life and property, therebyminimizing the confiscation and redistribution that results from the arbitrary and uncertain taxation Smithdecried. This clarity of taxation, the source of public income, became the ultimate link to the stability andgrowth of private income. It laid the foundation for the great prosperity that was to a century later.
Douglass C. North describes a secular effort in England, which culminated after the GloriousRevolution of 1688, to set up a system of orderly taxation in place of traditional fiscal confiscations andredistribution of income. He argues that this development distinguished England from France and Spainand laid the foundation for the rise of large-scale private investment, which financed the IndustrialRevolution.7 Orderly taxation, in addition to its being certain and specific, was also low, taking from privatehouseholds less than 10 percent of GDP.8 Orderly and low taxation enabled investors to secure a highprivate rate of return on investment, invention, and innovation.9
The Evolution of Private Income: A Few Sketches and Approximations 4
10John Hicks, A Theory of Economic History, pp. 33-40, 53-61 and Douglass North, “The Paradox of the West,”in R.W. Davis, ed., The Origins of Modern Freedom in the West (Stanford: Stanford University Press, 1995), pp. 7-34.On these and subsequent developments, see a broad analysis in David S. Landes, The Unbound Prometheus:Technological Change and Industrial Development in Western Europe from 1750 to the Present (London: CambridgeUniversity Press, 1969); David S. Landes, The Wealth and Poverty of Nations: Why Some are So Rich and Some So Poor(New York: W.W. Norton, 1998); Jeffrey G. Williamson, Industrialization, Inequality, and Economic Growth(Cheltenham, U.K. and Brookfield, Vt.: Edward Elgar, 1997); and, Oliver E. Williamson, The Economic Institutions ofCapitalism: Firms, Markets, Relational Contracting (New York: Free Press, and London: Collier Macmillan, 1985).
11John Hicks, A Theory of Economic History, pp. 79-99, 144-151. Recall that the Bank of England wasestablished in 1694 as a private central bank and remained private until 1946. Hicks also contrasts English financialdevelopment with France, which saw a financial and fiscal debacle in the 1720s, thanks, ironically, to the English (orrather Scottish) economist and banker, John Law, creator of the infamous “Mississippi Bubble.” That was a momentoussetback for France. See Ibid., pp. 87-88, 145. An overview on the importance of the financial system in economicdevelopment around the world can be found in Ross Levine, “Financial Development and Economic Growth: Views andAgenda,” Journal of Economic Literature 35, no. 2 (June 1997): 688-726.
12Peter G.M. Dickson, The Financial Revolution in England: A Study in the Development of Public Credit,1688-1756 (London: Macmillan and New York: St. Martin’s Press, 1967).
13An interesting detail: Between 1473 and 1545 and again between 1614 and 1622, the English kings did notbother to return forced loans but did not want, unlike Spanish kings, to openly repudiate Crown debt. So theyreclassified forced loans as gifts and called them benevolence; however, those who were late in delivering benevolencewere declared to be in arrears and subject to legal recourse. One recalls this story reading how the Russian governmentblamed the IMF for welching on its obligations when the latter delayed the non-returnable (that is, rolling over) credittranches. Benevolence is back.
North and John Hicks contend that the spread of the fiscally-orderly state and the financialindependence of private economic activities distinguished the West from the rest of the world.10 Hicks alsoemphasizes the significance of the development of a private financial system, protected from governmentpredation. Its development resulted in the financial revolution that fostered strong capital formation andpreconditioned the Industrial Revolution.11 Peter G.M. Dickson, on whose work John Hicks draws in thisrespect, documents and details that the growth of a strong system of private finance in England was basedon orderly, well-developed public finance. At the same time, private debts became convertible intoequity.12
Orderly public debt replaced the practice of forced government loans and repudiations, which wasstandard in Europe and, before the eighteenth century, important, even if sporadic, in England.13 Orderlypublic debt capitalized banks and reduced interest rates, which enabled banks to conduct two new, crucialactivities:
1. Finance large-scale projects and make risky lump-sum investments in fixed capital, including thosein new industrial ventures.
2. Attract deposits and channel private savings into private investment.
The Evolution of Private Income: A Few Sketches and Approximations 5
14“I wonder whether undue attention has not been given to the magnitude of the savings ratio at the expenseof the form that savings take. Savings may well have been at least as large a fraction of income in the Middle Ages asin modern times; they then in considerable measure, perhaps in major part, took the form of cathedrals, which, howeverproductive of ultimate satisfaction and of social security in more than one sense of that term, were not productive ofworldly goods. I understand that budget studies for India, which at first sight seem to give very different results fromcorresponding studies for the United States, are found largely to duplicate the latter if the category ‘ornaments’ isinterpreted as savings or, in the jargon of budget studies, as ‘net changes in assets and liabilities.’ The East was for longregarded as a ‘sink’ for the precious metals, surely evidence both of substantial savings and of the particular form thatit took. Perhaps the crucial role that has been assigned to the savings ratio in economic development should be assignedinstead to the factors determining the form in which wealth is accumulated: to the investment rather than savingsprocess, as it were.” Milton Friedman, A Theory of the Consumption Function (Princeton, N.J.: Princeton UniversityPress, 1957), p. 236.
15Peter G.M. Dickson, The Financial Revolution in England, p. 6. See also Barry R. Weingast, “The EconomicRole of Political Institutions.”
16See Violet Barbour, Capitalism in Amsterdam in the 17th Century (Baltimore: Johns Hopkins Press, 1950);Charles R. Boxer, The Dutch Seaborne Empire, 1600-1800 (New York: Alfred Knopf, 1965); and, Pieter Geyl, TheNetherlands in the Seventeenth Century, 2 volumes (London: Ernest Benn, 1961-64).
Before the development of orderly public finance, private savings were generally directed into publicinvestment in such infrastructure as roads, aqueducts, canals, fortresses, palaces, and cathedrals.14 Dicksonpinpoints the timing of the Financial Revolution before the Industrial Revolution:
The proposals of the later Stuart period were realized during the sixty years after thepolitical revolution of 1688.15
It is instructive to contrast the development of private finance in England after 1688, and theenormous industrial and economic changes that followed, with the growth and decline of the Netherlandsduring its Golden Age. During the seventeenth and eighteenth centuries, Holland was the most prosperouscountry on the globe. There was, in the 1600s, a high level of private income. One can readily envisageHolland’s prosperity displayed in the splendid paintings of the great Dutch masters, such as Rembrandt,Vermeer, Hals, and Steen, and in the great merchant houses that line Amsterdam’s canals. TheNetherlands prospered from both domestic commerce and its expansive international trade. Dutch shippingwas truly global. The country developed diversified cottage industries from cash crops and livestock tovalue-added handicrafts, an embryonic firm (the system of putting-out contracting), a stable currency (thegulden was literally as good as gold), big cities, well-developed ports, sophisticated banking and finance,a stock market (the Amsterdam Bourse), contract law and enforcement, joint-stock companies, the bestmodels of cargo ships, shipbuilding wharfs, small textile factories, fossil fuel (peat) manufacturing, goodscience, a trained labor force, and many other prerequisites of modern industrial development.16
There was, however, one blight on this shining portrait: the economy of the Netherlands wasvictimized by a relatively high redistribution of income. The ruling authorities incurred enormous public debt
The Evolution of Private Income: A Few Sketches and Approximations 6
17For an excellent analysis, see Jan de Vries and Ad van der Woude, The First Modern Economy: Success,Failure, and Perseverance of the Dutch Economy, 1500-1815 (Cambridge and New York: Cambridge University Press,1997). The brilliance of the Italian Renaissance, the Netherlands of the Golden Age, and other pre-industrial Europeancommunities does not overshadow the fact that people were still poor, not much higher in income per head than inancient Rome, malnourished, physically stunted, and lived very short and unhealthy lives. See Robert W. Fogel,“Economic Growth, Population Theory, and Physiology: The Bearing of Long-Term Processes on the Making ofEconomic Policy,” American Economic Review 84, no. 3 (June 1994): 369-396; Angus Maddison, Monitoring the WorldEconomy, 1820-1992 (Paris: Development Center of the OECD, 1995); Angus Maddison, “Poor Until 1820,” The WallStreet Journal, January 11, 1999, p. R54; and, J. Bradford DeLong, “Estimating World GDP, One Million B.C.- Present,”http://econ161.Berkeley.EDU/TCEH/1998_Draft/World_GDP/Estimating_World_GDP.html.
18See Thomas Stamford Raffles, The History of Java, vols. 1 and 2 (London: Black, Parbury, and Allen, 1817)and J.W.B. Money, Java, or How to Manage a Colony, vols. 1 and 2 (London: Hurst and Blackett, Publishers, 1861);J. S. Furnivall, Burma En Ned.-Indie Vergeleken en Tegenover Elkaar Gesteld (Weltvreden: G. Kolff, 1933); J. S.Furnivall, Colonial Policy and Practice (New York: New York University Press, 1956); and, J. S. Furnivall, NetherlandsIndia (Cambridge, U.K.: Cambridge University Press, 1944). One can find a lucid account in “Dutch East India Company”in Encyclopaedia Britannica, article “Indonesia, History of.”
in order to finance Holland’s defense against Spain, England, and others, but especially to underwrite thegrowth of its overseas empire. High taxes that were imposed, often levied ad hoc in direct violation ofSmith’s maxim, thwarting the growth of large-scale private capital formation.17
Let’s be clear. For more than a century, the Dutch enjoyed the world’s highest living standards.Dutch shipping ruled the seas. But the foundation of private income on which this great prosperity restedwas at chronic risk due to the absence of an orderly system of public finance, and which would be itsultimate undoing when England chose to challenge Holland in a battle for global preeminence.
One of the main obstacles to orderly Dutch public finance and a severe disincentive to economicdevelopment was the hidden subsidization of the Dutch East India Company. Vereenigde Oost-IndischeCompagnie (the United East India Company) was a huge private central planning agency, a joint-stockfranchise monopoly. It operated forced production plantations across the Dutch Empire, from Indonesiato Ceylon to Malaya.18 It acquired monopoly rights on trading in spices, rice, coffee, sugar, tea, silk,porcelain, and cotton. Its monopoly right on cotton was crucial for Holland’s failure not to develop themost important industry of the day, textiles. Through convoluted arrangements, the company shipped high-tariff goods duty-free and thus shared (or rather did not share) tax revenues with the government. Highcommodity prices, due to high tariffs which were privatized by the company, reduced the demand forfinished goods, which forestalled viable textile and other industries.
In one breath, the Dutch East India Company gave its owners an enormous private gain, butinflicted an even larger public loss on the Dutch economy as a whole. Individuals of wealth and moderatemeans invested in the firm, rather than in industrial innovation. The Dutch East India Company attracted
The Evolution of Private Income: A Few Sketches and Approximations 7
19Despite large migrations from poorer Flanders, Germany, and Scandinavia, the Dutch population declined inthe second half of the seventeenth century and the eighteenth century, due both to a secular rise in mortality and toemigration to the Dutch East India Company’s empire of one million young men, most of whom died at sea or in Java.Jan de Vries, “The Population and Economy of the Preindustrial Netherlands,” in Roger S. Schofiled and E. AnthonyWrigley, eds., Population and Economy: Population and History from the Traditional to the Modern World (Cambridgeand New York: Cambridge University Press, 1986), pp. 108-109, 116-117.
20In addition to subsidies, the Dutch East India Company built up large debt in order to pay high dividends toshareholders (18 percent per year for 197 years), high salaries to managers, and high bribes to custom and other officials.One author suggested that the company’s logo, VOC, standing for Vereenigde Oost-Indische Compgnie, came to be readas Vergaan onder Corruptie (Perished by Corruption). See J.S. Furnivall, Netherlands India, p. 49.
21Ibid., p. 48.
22J. Walker, British Economic and Social History (London: Macdonald & Evans, 1968), pp. 88-92.
a large measure of Dutch human resources19 and Dutch financial resources.20 This was among the greatestmisallocations of investment before Soviet central planning. In our view, it became an Invisible Handcuffon the ability of the Netherlands to sustain its prosperity. In the end, Holland yielded both its naval andeconomic pre-eminence to England, and, most importantly, it fell behind in economic development. Itretained the Spice Islands (Indonesia), several small Caribbean islands, and a sliver of land in SouthAmerica, but was otherwise unimportant in global affairs until the second half of the twentieth century. Inthe language of Chapter 1, the Dutch East India Company was a precursor to the enterprise networksocialism that emerged in Russia in the early 1990s. It took over fiscal and monetary policy by securingfor itself, through monopoly rights and subsidies, revenue that precluded the establishment of orderly,separable public income. As J.S. Furnivall wrote in his great work, Netherlands India:
Fall of the Company....From the beginning the accountancy [of the Company] had beendefective; books were kept in India and also in Europe, but the two sets were neverbalanced. Then, when tribute took the place of trade as the main source of income, nodistinction was drawn between the revenue of the Company as sovereign and its profitsas trader, and no adequate provision was made for its expenditure as a sovereign powerin war charges and administration.21
England exhibited some parallels to Holland with regard to overseas trade. From the late sixteenthcentury, most overseas trade was restricted to members of specific overseas trading companies to whichthe Crown granted monopoly rights in specific regions.22 Among the famous companies were the MerchantAdventurers (active in northern and eastern Europe), the Levant Company (founded in 1581), the EastIndia Company (1600), which was not entirely abolished until 1858, the Royal African Company(rechartered in 1660), the several North American colonization companies—Virginia, Plymouth, HudsonBay—and the South Sea Company. At the time it was widely believed that commercial developmentwould occur only if reasonable guarantees were given that those who took great risks would enjoy theprofits. Some trading companies even became colonial powers in their own right when they established
The Evolution of Private Income: A Few Sketches and Approximations 8
23Alvin Rabushka, From Adam Smith to the Wealth of America (New Brunswick, N.J. and Oxford, U.K.:Transaction Books, 1985), p. 9. The Navigation Acts, which were finally repealed in 1849, were based on a series of lawsdating back to 1381, but which were significantly expanded in scope in 1650 for the express purpose of injuring Dutchcommerce and merchant marine strength. The Act of 1650 banned the carrying of goods from any English colony inforeign ships. The Navigation Act of 1660 defined English ships as those built in England, Ireland (excluded after 1670),or the colonies, which were manned by an English captain and had a minimum of three-quarters English crew. Englandspecifically prohibited the import of certain staples from the Netherlands on any vessel. Nor could any foreign-built shipbecome English by purchase. Historians do not universally agree that the anti-Dutch effects of these laws weresuccessful. J.R. McCulloch, in his essay on the commerce of Holland published in his Treatise on Economic Policy,argues, instead, that the decline of Dutch maritime power was not due to English navigation laws, but to excessivetaxation within Holland itself. Cited in Sidney Buxton, Finance and Politics: An Historical Study, 1783-1885, vol. I(London: Murray, 1888), p. 113.
24John Hicks notes that a mercantile economy and free exchange by themselves are not sufficient for creatingincentives for economic growth and industrial innovation. See John Hicks, A Theory of Economic History, pp. 37-38.
and governed settlements in North America, Africa, and India.23 Although several companies persistedinto the nineteenth century, most, especially those in North America, financed as they were by joint-stockcompanies with unlimited liabilities, not by subsidies, were small, short-lived, and mainly defunct in the earlyseventeenth century. Those which persisted into the nineteenth century ultimately were taken over by theCrown, most notably the East India Company, and ceased to overtake the government in control overtaxes derived from foreign trading.
In contrast with the lesser impact of royally chartered English trading companies on the developing,industrialized British economy, the Dutch East India Company, perhaps the most powerful agent in theDutch economy, lasted for almost 200 years and only collapsed in the late 18th century. The governmentshut it down exactly when England industrialized. Only thereafter could Holland reallocate financial andhuman resources and started gradually to catch up with England, but still industrialized later than Germany.
The story of the Dutch Golden Age illustrates the difference between the two perspectives on themarket economy, viz., free exchange and private income. From the standpoint of free exchange, Hollandwas a nascent market economy; from that of private income, Holland was largely a mercantile economywith segments of private income, but one heavily burdened with socialism. From the first standpoint,Holland might have been on the cusp of the Industrial Revolution; from the second, it had a long way to goand first had to break up its redistributive chains—chains in more than one sense of the word.24
Holland was the most advanced of the pre-industrial economies, but it was not alone as aneconomy exhibiting the features of markets. Centuries before the Industrial Revolution started in England,markets emerged in such civilizations as ancient Athens, Rhodes, Phoenicia, Rome, and PtolemaicAlexandria, in parts of medieval Africa North and South of Sahara, in Indonesia in the tenth and eleventhcenturies, in Southeast Asia and throughout the Indian ocean in the thirteenth century, throughout theHanseatic League cities, in Italian city-states, in Flanders, culminating in the great prosperity of Antwerp,
The Evolution of Private Income: A Few Sketches and Approximations 9
25For an enlightening discussion, see Carlo M. Cipolla, Before the Industrial Revolution: European Societyand Economy, 1000-1700 (New York: W.W. Norton, 1980); Jack A. Goldstone, “The Problem of the Early ModernWorld,” Journal of the Economic and Social History of the Orient 41, no. 3 (1998): 249-284; and, David S. Landes, TheWealth and Poverty of Nations. For a list of historical instances of economic freedom, which includes those mentionedin the text and others, see Alvin Rabushka, Hong Kong: A Study in Economic Freedom (Chicago: Graduate School ofBusiness, University of Chicago, 1979), pp. 102-121
26David S. Landes defines the Industrial Revolution as a shift to large-scale mechanized production. See DavidC. Landes, The Wealth and Poverty of Nations, p. 192ff.
27Ancient Rome during the late Republic and early Empire seemed to have come close. Its infrastructure andstandard of living remained unsurpassed in Europe, and probably in the world for a thousand years (some historians ofmedieval China may dispute this). But the Roman fiscal system grew confiscatory and redistributive. See John Hicks,A Theory of Economic History, pp. 87-88 and Charles Adams, For Good and Evil. The Impact of Taxes on the Courseof Civilization (London, New York, and Lanham: Madison Books, 1993), pp. 71-120. In addition, slavery minimized therole of profit in the narrow sense of return on additional capital substituting for labor. It is illuminating that the Romans,who built sophisticated bridges and aqueducts, did not know the wheelbarrow, the horseshoe, and the horse collar, allinvented in eleventh century Europe (the Chinese invented wheelbarrows and discovered coal fuel in the fifth centuryA.D.). The Romans, in contrast, had draft people and did not need hauling equipment and draft animals. The Romansdid not have widespread wages and thus profits. In contrast, and more than any other country in Europe, England hadwages very early throughout the economy, thanks in particular to its unique system of life-cycle service, wherein peasantyouth (of both sexes) served as farmhands in other peasant households. See Peter Laslett and Richard Wall, Householdand Family in Past Time (Cambridge, U.K.: Cambridge University Press, 1972). Wages thus existed not only betweenlandlords and peasants and between employers and day laborers but also between peasant households, resulting in acomprehensive labor market.
in the Dutch Republic, and other places.25 In the terminology of Adam Smith, these were the mercantileeconomies. They had significant segments of private, internalized income: (1) between producers andconsumers; (2) between producers along the value-added chains; (3) between producers and traders; (4)between lenders and borrowers; (5) between landlords and tenants; and, (6) between employers and wageworkers. On these foundations, the mercantile economies made a limited number of technologicaladvances, created financial arrangements for trade, built impressive infrastructure, and developed pocketsof factory-scale handicraft manufacturing. But they did not make a breakthrough from these foundationsto investment in mechanized production.26 The absence of orderly public income did not allow peopleto sufficiently internalize profits as private returns on capital. This, in turn, thwarted incentives to substitutecapital for labor, to invest in plant, equipment, and technology. The absence of orderly public income alsoprevented capital formation and financial intermediation for this investment.27
We can combine the insights of Peter Dickson, John Hicks, Douglass North, and David Landes,among others, and the evidence on the emergence of public and private finance. The development of awell-defined separation between public and private income solidified each of them on their own. Neithercan exist jointly, that is, if private and public income are fused, but, at the same time, neither can exist ona substantial aggregate scale without the other. This relationship constituted the foundation of privateincome as the two separable systems of public and private finance. Public finance is non-confiscatory,private finance is non-trespassable. Both are private systems, internal to the government and to the privatesector, respectively. They secure internalization of income on the part of asset owners and
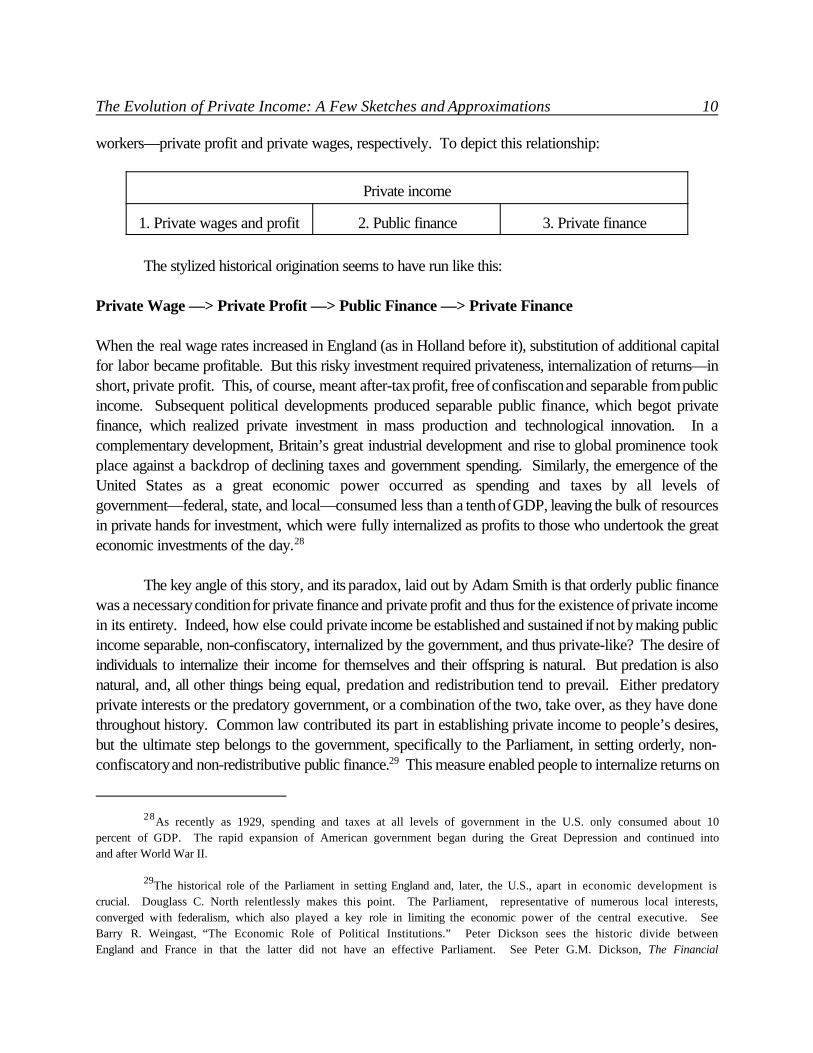
The Evolution of Private Income: A Few Sketches and Approximations 10
28As recently as 1929, spending and taxes at all levels of government in the U.S. only consumed about 10percent of GDP. The rapid expansion of American government began during the Great Depression and continued intoand after World War II.
29The historical role of the Parliament in setting England and, later, the U.S., apart in economic development iscrucial. Douglass C. North relentlessly makes this point. The Parliament, representative of numerous local interests,converged with federalism, which also played a key role in limiting the economic power of the central executive. SeeBarry R. Weingast, “The Economic Role of Political Institutions.” Peter Dickson sees the historic divide betweenEngland and France in that the latter did not have an effective Parliament. See Peter G.M. Dickson, The Financial
workers—private profit and private wages, respectively. To depict this relationship:
Private income
1. Private wages and profit 2. Public finance 3. Private finance
The stylized historical origination seems to have run like this:
Private Wage —> Private Profit —> Public Finance —> Private Finance
When the real wage rates increased in England (as in Holland before it), substitution of additional capitalfor labor became profitable. But this risky investment required privateness, internalization of returns—inshort, private profit. This, of course, meant after-tax profit, free of confiscation and separable from publicincome. Subsequent political developments produced separable public finance, which begot privatefinance, which realized private investment in mass production and technological innovation. In acomplementary development, Britain’s great industrial development and rise to global prominence tookplace against a backdrop of declining taxes and government spending. Similarly, the emergence of theUnited States as a great economic power occurred as spending and taxes by all levels ofgovernment—federal, state, and local—consumed less than a tenth of GDP, leaving the bulk of resourcesin private hands for investment, which were fully internalized as profits to those who undertook the greateconomic investments of the day.28
The key angle of this story, and its paradox, laid out by Adam Smith is that orderly public financewas a necessary condition for private finance and private profit and thus for the existence of private incomein its entirety. Indeed, how else could private income be established and sustained if not by making publicincome separable, non-confiscatory, internalized by the government, and thus private-like? The desire ofindividuals to internalize their income for themselves and their offspring is natural. But predation is alsonatural, and, all other things being equal, predation and redistribution tend to prevail. Either predatoryprivate interests or the predatory government, or a combination of the two, take over, as they have donethroughout history. Common law contributed its part in establishing private income to people’s desires,but the ultimate step belongs to the government, specifically to the Parliament, in setting orderly, non-confiscatory and non-redistributive public finance.29 This measure enabled people to internalize returns on
The Evolution of Private Income: A Few Sketches and Approximations 11
Revolution, p. 14. However, France started to catch up in the second quarter of the nineteenth century. The famouscaricature by Honore Daumier depicts King Louis Philippe as a beggar with his finance minister Adolphe Thiers as amonkey carrying a collection plate before the members of the National Assembly. This was the new order of things,which at the time appeared farcical to the French but would have looked nondescript—certainly not worthy acaricature—to the English. In this light, it is ironic that Western policy makers strongly supported in the 1990s theconcerted efforts of the Russian executive branch to destroy the Parliament as an institution and to monopolize economicpolicy—of course, in the name of market reform. The cause is always good. It is the consequences that fail.
30Invention of the government for protection does not contradict the fact that most governments in historyhave been imposed by force. It is the government as an organization that was invented, so that, using the terms ofMancur Olson, a stationary bandit replaced roving bandits, which, in many cases, was an improvement. See MancurOlson, Power and Prosperity: Outgrowing Communist and Capitalist Dictatorships (New York, N.Y.: Basic Books,2000).
their labor, capital, and land, permitting private finance to function effectively. The foundation of privateincome as an element in the great prosperity of first Britain and then the West in general was public incomein the sense of internal and separable income of the government.
Is the Government with Separable Public Income a Private Enterprise?
How would the government function under pure private income, including its own separable public income?We will show shortly that pure private income and the total separation of public income are not feasible inthe real world. But many market economies in the past, and some still, exhibit a sufficient degree of privateincome to make the above question pertinent.
The paradox of government is that it was invented by individuals to protect their income and wealthfrom predators, but the government itself can become the predator that was its purpose to prevent.30
Therefore, the problem of government was how to make it protect private income comprehensively,including from the government itself. This has been an inherent, perennial problem. What other solutioncan there be but a fiscal straightjacket, the financial isolation of the government, which rigidly separatespublic and private income from each other? The English found this unique solution in the development oforderly public finance. In so doing, they largely solved the problem of government, and, thereby, theproblem of ultimate protection of private income. This was arguably the most important human inventionin the social sphere since the invention of money and government itself. But this was only the first part ofthe solution, even if necessary for the also important second part.
The doctrine of limited government reflected this invention. In the particular context of the time,it joined together two dimensions: that of the government, ranging from small to big, and that of income, ona continuum from private to common. The correct form and amount of government is embodied in thecombination of private income and small, or limited, government. But the founding thinkers, such as John
The Evolution of Private Income: A Few Sketches and Approximations 12
31Chapter 8 continues this discussion.
32This approach further developed in American constitutionalism. On the crucial role of constitutional rules,as opposed to discretion, to build the wall against redistribution, see James M. Buchanan and Gordon Tullock, TheCalculus of Consent: Logical Foundations of Constitutional Democracy (Ann Arbor: University of Michigan Press,1962) and James M. Buchanan, The Limits of Liberty: Between Anarchy and Leviathan (Chicago: The University ofChicago Press, 1975).
33For a pioneering treatment, see Frederick C. Lane, Profits from Power: Readings in Protection Rent andViolence-Controlling Enterprises (Albany: State University of New York Press, 1979).
Locke, Francis Bacon, John Milton, Adam Smith, and others, had explored each dimension separately.31
The doctrine of limited government did not mean just a small government; it meant first and foremost aseparable government.32 Only later was this context of separation of public income from income of thefirms and household lost. The doctrine of limited government was reduced to one dimension, a mere size,regardless of the extent of socialism in the economy. The object of this chapter is to restore the notion ofthe government in the economy with its own private income to its initial sense.
The government as an organization with its own, separable income, which it has to earn from thepublic as payment for services, and with its own expense (which it has to match with income and with theability to raise returnable debt) functions in the financial sense like a separable, private enterprise. It is notprivate in the sense of ownership—indeed, it is a public enterprise, and the enterprise of the public. Butit is private in the sense of income because it internalizes revenues and expenses. That this enterprise doesnot make profit does not change the nature of internalization. The absence of profit results from the factthat the public is both the owner of the enterprise and the user of its services, and does not want it to makeprofit. This is similar to the case of a publicly-owned private corporation which is also a public utility, aconcession, a franchise, with fully overlapping ownership and service. Representative government actingas such a concession charges agreed-upon payments and user fees for public services rendered.33
Although the government is a public institution and everyone uses the term public finance, its incomeis private when it is both non-confiscatory and impregnable to confiscation and redistribution by otherprivate parties. As in the case of a publicly-owned private corporation, households and firms do not enjoyopen access to its revenues. The veritable label “Private property. No trespassing” applies. The signsposted on fenced-off government sites in Hong Kong, for example, read “Government Property. KeepOut,” even though the property was acquired with taxpayers’ funds. Public finance, or government finance,is, in effect, the private, exclusive finance of the government. The taxes and fees collected by thegovernment belong exclusively to it as a corporate-like entity. It is not a treasure chest to be raided byprivate individuals and enterprises, as we observed in the case of Russia and similar countries. In this vein,the income that accrues to the government, even though it is a public entity, has the same properties asprivate income. It is specific in the sense of being earned for services, exclusive from intruders, and internal.But there is also a big difference in outcomes, as we argue throughout this book, between an economy inwhich the government’s internal income reaches or exceeds half of GDP and one that collects a far smaller
The Evolution of Private Income: A Few Sketches and Approximations 13
34Edwin Chadwick, “Results of Different Principles of Legislation and Administration in Europe: Of Competitionfor the Field as Compared with Competition within the Field of Service,” Journal of the Royal Statistical Society, SeriesA22 (1859): 381-420.
35It is fitting that in the U.S., historically, ministers are called secretaries and the chief executive officer,president. Even the word governor does not have its cockney connotation because it emphasizes the precedence of thestates.
36Actually, they can converge not only in the sense of providing contractual services at an orderly price ona competitive basis, but also in the sense of predation, redistribution, monopoly pricing, cheating, overcharging, contractwelching, bureaucratic overspending on wasteful projects and on itself, and abuse of power. The opportunities forpredation are the same for the representative government and a private contractor. The classic example of the latter isthe Vereenigde Oost-Indische Compagnie, the Dutch United East India Company, mentioned earlier. It ruled the Indies(today’s Indonesia, Sri Lanka, Malaysia, and other countries) in 1602-1799 on the charter of the Dutch Republic andestablished central planning there.
share.
Viewing the government as a publicly-owned, corporate public utility is another way of expressingAdam Smith’s notion of the government as the manager of a private estate serving joint tenants. Similarto a corporation, investors (taxpayers) have placed their funds (taxes) in exchange for shares, although theshares are not tradeable as taxpayers cannot sell their citizenship to foreigners. Shareholders (taxpayers)are the owners of the corporation (government). In exchange for their funds, shareholders expect toreceive a return (public services) on their investment (taxes). As with a public utility, its technical monopolynaturally rests on decreasing costs of providing public services. The government can enforce a naturalmonopoly in the business of enforcement. But democratic elections make this public utility competitive andmake the fees it charges the public, contractual and limited by users (taxpayers). The famous formula byEdwin Chadwick about the concession applies: If competition within the field of service is impossible,competition for the field solves the problem of monopoly and price.34
Paradoxically, this view of the government as a publicly-owned private franchise (public utility)converges with the line of thought which sees the government as an obsolete and offensive organization andinvents various ingenious schemes for private providers of public services to replace the government. Fromthe perspective of the government as private enterprise with private income, it is the term “government,”not its function, that is obsolete and offensive.35 People of separable, private means are not governed;rather, they own a public utility concession and are served for a price, on contract. The government neednot be either deified or demonized, only franchised and audited. If the private nature of public income andthe competitive assignment of the concession are the rules, the government and the private contractor(concessioner) converge.36
This is not, by far, what public income is today in Western market economies. This is not what ithas typically been in practice. This is what it was meant to be when it originated at the time of John Locke,Adam Smith, and the Founders of the American Republic. But the invisible private core of orderly public
The Evolution of Private Income: A Few Sketches and Approximations 14
37We will pursue the discussion of these issues in Chapter 5.
38For an excellent overview of moral hazard in banking, see Ronald I. McKinnon, The Order of EconomicLiberalization. Financial Control in the Transition to a Market Economy (Baltimore and London: The Johns HopkinsUniversity Press, 1993), pp. 84-91.
39As a rule, markets automatically create only those institutions whose gains can be sufficiently (even if notfully) internalized by private agents. Examples include money, trade credit, the bill of exchange, credit and banking, etc.Markets call upon the government to create institutions with large social and relatively small private gains, like marketscall upon scientists and engineers to create new technologies. So the market creates institutions indirectly, through thedemand transmitted to the government. If one does not view market and government as the dichotomy, the problemdisappears. When the limited liability corporation was established by an act of the state of New York in 1811,contemporaries, notably The Economist of London, objected to this as government intrusion. They argued that if themarket wanted limited liability it would have created it automatically. A counter-argument is, if markets did not wantlimited liability, they could have easily negated government action: Creditors would simply not lend to limited liability
income remains intact today. Without this invisible core, Western market economies would not havesurvived the socialist tides of the twentieth century.
Self-Limitation and Self-Preservation of Private Income
In the real world of Western market economies, every government is bigger than warranted by its initialcontractual functions. More importantly, every government is redistributive to one or another degree andevery public income takes a bite out of private income. This does not mean that identification ofgovernment with socialism stands. This rather means that socialist segments, segments of common income,are present in every Western market economy. Their development may work through the government,embodied in excessive taxation and a panoply of subsidies and bailouts, and through private predation notsufficiently repelled by the government. Thus the real Western market countries exist along the dimensionof private and common income with the private core and common segments.37 Market economies lie ona continuum.
In addition, as we mentioned in the previous chapter, the market has natural limitations. It doesnot cover the total area of economic activity. Not all costs can be internalized, especially those associatedwith information gaps, excessive risks, uncertainty, and insurance, like the so-called moral hazard in bankingand other spillover effects.38 These circumstances often lead to government bailouts and other softsubsidies. Not all benefits can be internalized, as in the case of scientific discoveries, technologicalimprovements, and contributions of educated people to society, because ideas become available in thepublic domain. This leads to under-production of these goods and, paradoxically, does require a remedialsocial subsidy. The literature employs such fitting terms as externality and public goods effects to describethis class of phenomena (as opposed to internalization and privateness of payoffs and costs) and also anunfortunate term “market failure,” as if the market has failed, whereas it simply fails to encompass actionswhose gains and costs cannot be internalized.39 This confirms our chosen narrow definition of the market
The Evolution of Private Income: A Few Sketches and Approximations 15
corporations and thus defeat the whole purpose of the new institution. However, the limited liability company was oneof the greatest inventions in human history. It advanced private income by separating private liabilities of the firm fromprivate assets of the household. It limited the rights of creditors in their claims on shareholders. By doing so, itfacilitated capital formation through equity because the risk for shareholders of assuming company debts declined. Thisexpanded broad ownership and mass-based investment. This example shows the difference between private income andfree exchange perspectives on the market economy.
40See Barry R. Weingast, “The Economic Role of Political Institutions.”
41Gary S. Becker, “A Theory of Competition Among Pressure Groups for Political Influence,” Quarterly Journalof Economics 98, no. 3 (August 1983): 371-400.
as free, voluntary exchange with private, internalized income only—not any free exchange. In the cases ofexternalities people face natural socialization. Excessive taxation and subsidies in Western marketeconomies constitute man-made socialization and a true failure of public income to stay private andseparable.
This raises another paradox of private income, namely, its self-limitation. The self-limitation derivesfrom the fact that private income requires for its existence a foundation of public income. But the growthof public income acquires momentum of its own and leads, ineluctably, to a partial undoing of privateincome. The downside of private income is the natural continuation of its upside, a catch-22-like circle.This stems from two different, but overlapping, developments:
1. Representative democracy solidified numerous local and sectoral interests. It converged federalismwith Parliamentarism.40 These forces established public income, which separated public andprivate finance. This engendered private income and the market economy. The resulting economicgrowth and prosperity increased both the scope and power of sectoral and local interests. Theseinterests promoted various redistributive legislation to benefit themselves. Segments of commonincome spread across the entire body of the market economy. Successful rent-seeking amountsto appropriation of income from households beyond those contractually-implied payments forpublic services. It is, in short, socialization beyond the social contract. It undermines the privatecapacity of public income. The failure of representative government to fully sustain separability ofpublic and private income and full separability of all private incomes is natural. It results frominefficiencies in the democratic process of aggregating individual preferences into a public choice.Gary S. Becker dissected the mechanism of concentrated benefits and diffused costs: Benefits fromincome redistribution are large for pressure groups and are worth fighting for, while fiscal and othercosts spread across the society and are small for the average taxpayer and consumer, are notworth opposing.41 Public income becomes redistributed and private income partially socialized.
2. Growth and prosperity enlarge the middle class. It becomes the majority in society. It uses itspolitical power to enact and expand an array of redistributive programs of which it is the principalbeneficiary at the expense of higher and lower income groups. This phenomenon is known as
The Evolution of Private Income: A Few Sketches and Approximations 16
42George J. Stigler, “Director’s Law of Public Income Redistribution,” Journal of Law and Economics 13, no.1 (April 1970): 1-10. The law is named after its inventor, Aaron Director.
43This is why James M. Buchanan’s quest for constitutional rule is so crucial. See James M. Buchanan, TheLimits of Liberty: Between Anarchy and Leviathan.
Director’s Law of Public Income Redistribution.42 This created a system of income transfers,which has been mislabeled the Welfare State. The latter includes numerous sectoral subsidies andpreferential regulations, popularly known as corporate welfare. They represent a form of stealthconfiscation and may absorb significant amounts of GDP, as in the Scandinavian countries andmany other Western European democracies, where the governments routinely tax and spend half,and sometimes more than half, of the national income. Given the scope of the political interestsbehind the Welfare State it is not surprising that income redistribution in many Western marketcountries reached such exorbitant levels.
Thus public income in its private, separable capacity proves to be an inherently weak institution.It is vulnerable to politics. This sets an evolutionary limit on private income and prevents its completepermeation of Western market economies.43 However, the same developments create a self-preservationmechanism of private income. At some point, segments of common income and the Welfare State arestalled and even rolled back. 1. Diffuse costs become sufficiently large for the majority to fight against sectoral subsidies. The
expected benefits of globalization and universal free markets add opportunity costs and strengthenthe fight.
2. The further growth of the middle class turns the Welfare State into a perpetual motion ofredistribution among an essentially homogeneous population—a self-defeating proposition. Peoplerealize that their net benefits are nil whereas their opportunity costs, in terms of foregone economicgrowth and prosperity, due to economic distortions, are considerable.
In the U.S., Great Britain, Continental Europe, and even Scandinavian countries, the growth ofsocialization of income has been significantly reduced in the last two decades and rolled back in somecases. The emergence of the new, information-based economy both makes people more independent ofthe government and uproots some entrenched vested interests. This may give further momentum to therollback of segments of common income in Western market economies. Although public income as aprivate institution is weak, private income as a system is viable, enduring, and indeed interminable.
But there are no stable laws of disequilibrium dynamics. By that we mean that forces can emergewhich enlarge the scope and size of government for a considerable length of time; or, which shrinkgovernment. The former occurred during the twentieth century, when the level of government spending inthe U.S. rose from a tenth of GDP in 1929 to a third of GDP after World War II, and in Europe when the
The Evolution of Private Income: A Few Sketches and Approximations 17
44Ronald I. McKinnon, The Order of Economic Liberalization.
45See Ibid. and also Ronald I. McKinnon, Money and Capital in Economic Development (Washington, D.C.:Brookings Institution, 1973), and Edward S. Shaw, Financial Deepening in Economic Development (New York: OxfordUniversity Press, 1973).
46Ross Levine, “Financial Development and Economic Growth.”
postwar size of government grew to half or more of GDP. There is nothing intrinsically stable aboutgovernment taxing at 10 percent, 33 percent, 50 percent, or indeed 70 percent of GDP. But the trendsdescribed in the above paragraphs have, for the moment, produced a relative measure of stability in the sizeof government in the Western industrial democracies.
A Reference on the Role of Public Finance and Private Finance in EconomicDevelopment
The experience of countries that recently became successful market economies seems to conform, for allthe variety of specific policies, to the pattern found in eighteenth century England. Our understanding ofextensive work by Ronald I. McKinnon on the order of building market economies in East Asian and LatinAmerican countries in the 1960s-80s is that creating viable public finance was the key to establishingprivate finance. McKinnon points to ending financial repression and other predatory practices of thegovernment as a key to subsequent economic growth.44 Financial repression amply summarizes thepredatory activities of the government. It suppressed returns on private savings by depleting the value ofmoney balances through inflation, by putting caps on lending interest rates and thus on deposit interest rates,and by diverting investment from more productive to less productive uses.45 Ross Levine in a detailedoverview of studies and evidence on broad cross-country experience in recent decades emphasizes thecrucial role of developing private financial markets.46
The Paradox of Private Income after Central Planning
Successful post-Communist countries discovered, by design, chance, or evolutionary logic, that publicincome must be separated from enterprises. In China, Vietnam, Myanmar, and, to a lesser extent, Poland,Slovenia, Slovakia, Hungary, and the Czech Republic, the government broke up the inherited enterprisenetwork and established a measure of private income. We observed this development in Chapter 2. Wecan now discuss the principal policies applied to this end.
The methods of creating private, separable public income were stunning, if not damning, from theconventional perspective. Countries built market economies by applying apparently anti-market policies.They were stalling liberalization and privatization and even—in Eastern Europe, of all places—started with
The Evolution of Private Income: A Few Sketches and Approximations 18
47For a detailed institutional and policy overview by countries, see Ian Jeffries, Socialist Economies and theTransition to the Market: A Guide (London and New York: Routledge, 1993). This indispensable compendium alsoprovides a comparison of policies before and after 1989, which helps see both innovations and reversals in the early1990s. For the analysis of specific policies see Timothy D. Lane, "Wage Controls and Employment in Economies inTransition," Journal of Comparative Economics 19, no. 2 (October 1994): 171-187; Grzegorz W. Kolodko, From Shockto Therapy: The Political Economy of Postsocialist Transformation (New Haven: Yale University Press, 2000); andGregory C. Chow, "Challenges of China's Economic System for Economic Theory," American Economic Review 87, no.2 (May 1987): 321-327. For important country studies, see Fabrizio Corichelli and R.R. Rocha, "A Comparative Analysisof the Polish and Yugoslav Programmes of 1990," in P. Marer and S. Zecchini, eds., The Transition to a Market Economy(Paris: OECD, 1991), pp. 189-243; Erzsebet Viszt and Judit Vanyai, "Employment and the Labor Market in Hungary,"Eastern European Economics 32, no. 4 (July-August 1994): 13-18, 30-33; Kazimierz Z. Poznanski, Poland’s ProtractedTransition: Institutional Change and Economic Growth, 1970-1994 (Cambridge, U.K.: Cambridge University Press,1996), pp. 169-207; Stefan Bojnec, “Macroeconomic Stabilization and the Reform Process in Slovenia,” Eastern EuropeanEconomies 34, no. 1 (January-February 1996): 21-40; Barry Naughton, Growing out of the Plan: Chinese EconomicReform, 1978-1993 (New York: Cambridge University Press, 1994); Alvin Rabushka, The New China: ComparativeEconomic Development in Mainland China, Taiwan, and Hong Kong (Boulder: Westview Press, 1987), pp. 71-99; and,Markus Diehl, “Structural Change in the Economic Transformation Process: Vietnam 1986-1993,” Economic Systems 19,no. 2 (June 1995): 147-182.
48How could Eastern European countries get away with this? Forty years of subjugated experience begot skill.They treated the U.S. Treasury and the IMF the same way they treated the Soviet government and the Comintern in thepast: said one thing and did the other. Because of their publicly sworn allegiance to the orthodoxy, the IMF now can(and does) take credit for their partial success. In fairness, the IMF and other parties and research groups involved wereintellectually flexible and adopted as their own some of the policies introduced in China, Poland, and elsewhere, suchas the emphasis on the new-entrant private sector, which we discussed in Chapter 2.
49Hereinafter we draw heavily on a marvelous compendium of policies across post-Communist economies inEurope and Asia presented in Ian Jeffries, Socialist Economies and the Transition to the Market.
de-liberalization and de facto de-nationalization, thereby rolling back the partial liberal reforms of the1980s. This is a muted subject, although the documentation is in the public domain, and serious literatureexists.47 The principal task was not to open up free markets—that was relatively trivial—but rather toaccomplish this in such a way as to close down common access to public income after the abolition ofcentral planning. The latter task was non-trivial, indeed Herculean, due to the power of the enterprisenetwork and lack of precedents and learning. This task required impious and blasphemous measures.48
What follows is a set of policies that were relatively successful in unleashing the productive potential of realmarket forces.49
1. Split the economy apart. Instead of blanket reform, instead of opening up a unified, free market,the government promoted the new-entrant private sector (as well as the old private sector if itexisted); at the same time, it set aside the preexisting sector and kept it under stringent financial andownership controls. This broke up the enterprise network before it could emerge. Instead ofreforming, liberalizing, and privatizing the old sector, the government rather phased it out and
The Evolution of Private Income: A Few Sketches and Approximations 19
50Ironically, although this story immediately associates with China and, to a lesser extent, Poland, the mostconsistent protagonist was Germany after unification, with respect to enterprises in its Neue Landers. For an excellentdiscussion see Diane Glikmanas. “East German Economic Transition: A Challenge to the Economics of Transition?”Unpublished manuscript (Stanford, Ca. and Paris, France, Fall 1997). Estonia accomplished the same policy by default,due to the split along ethnic lines, as we mentioned in Chapter 2.
51See Michael S. Bernstam and Alvin Rabushka, Fixing Russia’s Banks: A Proposal for Growth (Stanford, Ca.:Hoover Institution Press, 1998), pp. 23-25. We will discuss this matter in detail in Chapter 5.
phased in the new sector with private income.50
2. Retain and reinforce state banking for the preexisting major enterprises. It is hard, indeedimpossible, for enterprises to practice tax non-remittance when the state banking systemautomatically seizes and remits profits and tax liabilities of state-owned enterprises. This puts apowerful constraint on the ability of liberated enterprises, even after price decontrol, to enforce thetax subsidy, which, in turn, makes excess invoices a self-defeating proposition. Note thatreinforcement of state banking in Eastern Europe in 1990 and thereafter for the purposes ofautomatic remittance of profits and taxes represented in some countries a rollback of liberal reformsof the 1980s. The government in the 1980s allowed enterprises to retain profits in expectation ofcreating productive incentives. But the government continued to subsidize the purchase of inputsthrough the soft budget constraint. This combination, instead of stimulating production, ledenterprises to maximize subsidies for converting them into wages and managerial bonuses. Beforethis liberalization, enterprises could use subsidies only for inputs, not for consumption, because thegovernment, through the state banking system, automatically remitted profits and taxes. In addition,wage controls secured government profits. Liberalization of the 1980s ruined public finance andended up in extreme inflations. It is a widespread illusion that money and banking under centralplanning played a minor role and served accounting and payment purposes only. On the contrary,they played a major role, although quite different from that in market economies. Money monitoredand enforced production51 and the state banking system monitored and enforced the fiscal rightsof the government as both the tax authority and the residual claimant of profits as the owner ofassets. Reinforcement of state banking in the early 1990s allowed the government to minimizesubsidies after the abolition of central planning and to repel the tax subsidy, thus establishing arelative degree of orderly and separable public finance.
3. Impose credit ceilings. These were quantitative credit quotas specific to banks and enterprises.They did not allow commercial banks and even private banks to lend above the cap. Thisprecluded the transmission of central bank credit to enterprises as part of the tax subsidy to fullymatch their excess invoices. Recall that central bank credit is issued and transmitted to enterprisesthrough the banking system to substitute for tax non-remittance (that is, to ensure tax remittance)in critical fiscal situations. Thereby, even though the central bank continued to print excessivemoney and provide inflationary credit to the banking system for the enterprise sector, as well asmonetize government budget deficits, enterprises could not enforce the tax subsidy. In combination
The Evolution of Private Income: A Few Sketches and Approximations 20
52See Timothy D. Lane, "Wage Controls and Employment in Economies in Transition," pp. 171-187. For specificcountry studies, see, e.g., Fabrizio Corichelli and R.R. Rocha, "A Comparative Analysis of the Polish and YugoslavProgrammes of 1990," pp. 189-243; Erzsebet Viszt and Judit Vanyai, "Employment and the Labor Market in Hungary,"pp. 13-18, 30-33; and, Kazimierz Z. Poznanski, Poland’s Protracted Transition: Institutional Change and EconomicGrowth, 1970-1994, pp. 169-207.
with the above inability to confiscate tax collection, this thwarted the claims of excess invoices anddefeated their purpose. This measure in some countries also comprised a rollback of earlierreforms, which allowed liberal commercial credit, originating, of course, in central bank moneyprinting. Although in Eastern European countries the second and third policies on this list could notbe fully enforced, because of the spread of commercial banks, especially private banks, and taxnon-remittance was widespread, the government could nonetheless protect and not surrender itsfiscal and monetary power. In China, the government simply periodically cracked down on unrulybanks and shut many of them down. We never said these measures were subtle.
4. Close down financial institutions if they pose any danger of passing their liabilities onto thegovernment. This is an extension of the previous measure. In most Western market anddeveloping economies, the government socializes the debt of failing financial institutions when it bailsthem out. This happens when the expected spillover effect, such as the loss of deposits andinvestments, exceeds the bailout costs. Examples range from the savings and loan debacle of the1980s to the Long-Term Capital Management hedge fund in 1998 to major Japanese banks andinsurance companies in the 1990s. Globalization of this practice is exemplified by IMF bailoutsduring the Asian crisis of 1997 and Brazilian crisis in 1998, which were effectively bailouts ofWestern lenders. The Chinese government acted counter to this practice, to the annoyance ofWestern investors. In 1999, it refused to assume the liabilities of Guangdong International Trustand Investment Corporation (GITIC), a failed investment fund owned by the Guangdong provincialgovernment, along with other bankrupt provincial ITICs. Furthermore, it abruptly shut down,without compensation of creditors, most other investment companies which borrowed fromWestern lenders to finance local ventures. This prevented the creation of a subsidy chain, whichcould have turned Township and Village Enterprises (TVEs), owned by provincial and localgovernments, into an enterprise network.
5. Retain or reimpose wage control. It restrains the tax subsidy and de-stimulates excess invoicing.Wage control can be direct or indirect, tax-based. If the government retains central planning inthe preexisting industrial sector, which it splits from the rest of the economy, as happened in China,direct wage control will do. If central planning is abolished, as in Eastern Europe, it is difficult toenforce wage control by direct administrative means. Then the efficient mechanism is indirect, tax-based wage control. This is a prohibitive, say, 300 percent taxation of wage increases above thegovernment-set baseline.52 Direct or tax-based, wage control in both cases limits the ability ofenterprises to pass the tax subsidy onto such specific beneficiaries as workers and managers. Thisis reinforced in the absence of legal privatization, when managers are not owners and their
The Evolution of Private Income: A Few Sketches and Approximations 21
53In 2000, after ten years of discouraging wage control wherever possible and de-emphasizing its successelsewhere, the IMF came to recognize its usefulness in view of mounting enterprise arrears and tax arrears and insistedon re-imposition of wage control in Romania. See The Financial Times, June 13, 2000. As we mentioned earlier, the IMF,like the Comintern before it, can be flexible.
54See Ronald H. Coase, “The Problem of Social Cost,” Journal of Law and Economics 3, no. 3 (October 1960):1-44.
compensation is also subject to wage control. In the case of direct wage control, the residualincome which constitutes government profit, is enhanced. The government seizes it, and thisnullifies the tax subsidy and renders excess invoicing impotent. The effect of indirect wage controlis the same. If the government enforces the remittance of taxes levied on wage increases—and itdoes, or else wage control is meaningless—this remittance offsets the tax subsidy extracted fromnon-remittance of other taxes. The money is fungible, and through a prohibitive tax the governmentnullifies the tax subsidy and the benefits of inflated invoices. On top of that, indirect wage controlaffects enterprises as buyers. Despite the loss of the tax subsidy, managers and owners stillincrease wages, due to workers’ pressure, because workers become partial de facto owners ofstate enterprises after the abolition of central planning. Then enterprises have to minimize non-laborcosts in order to cope with additional labor costs of punitive taxation for wage increases. Buyersno longer accept inflated invoices from sellers. In all, wage control breaks up the network ofcounterfeit spending.53 Under wage control, every enterprise is in business for itself, not as partof a network.
6. Stall privatization until private income acquires critical mass in the economy, over 50percent of GDP. When the enterprise network exists, privatization opens more access forenterprises to common income, indeed opens direct enterprise access to public income. Underthese conditions, the absence of private owners is a necessary, although not sufficient, conditionfor denying individuals the gains from the tax subsidy, from acquiring access to public income. Note that a de facto re-nationalization and a rollback of de facto privatization automatically occurwhen the government re-imposes and enforces remittance of profits on state-owned enterprises.Stalling or rolling back privatization is a direct corollary of the Coase Theorem, applied to commonincome. The Coase Theorem states that under market conditions (and provided that assets areeasily transferrable), property always ends up in the hands of most productive users. This happensbecause the most productive users are willing to pay the highest price for a given asset, since it isthey who can derive the highest return. Therefore, the initial allocation of property rights does notmatter because the most productive users will be the ultimate owners.54 It follows that even if therewas an initial theft of property, the most productive owners will bid it away from thieves and createwealth for everyone. It also follows that under market conditions asset stripping on the part of legalowners is uneconomical: Why strip assets if they can gain more by selling the firm intact to the mostproductive (and thus highest paying) users? The corollary to the Coase Theorem states that therationale changes diametrically if the market economy does not exist and income is common whileproperty is private. Then the value of the asset derives not from its market return but from the
The Evolution of Private Income: A Few Sketches and Approximations 22
55See the introduction of this corollary in Michael S. Bernstam and Alvin Rabushka, Fixing Russia’s Banks,pp. 14-15. The initial theft of assets under common income may appear neutral from the standpoint of eventual efficiency(or inefficiency), but it most definitely is not neutral from the fiscal perspective. What happens when the governmentgives away assets to predators or allows them to seize assets, instead of, say, using these assets to capitalize retirementaccounts, which would ease budgetary pressure in the future, or swap them in exchange for reducing government debt?Either the government has to raise payroll or other taxes to finance its expenditures, which were previously financed bythe return on the lost assets, or reduce pensions and perhaps default on debt service. If the government sold theseassets to Western investors at market prices and these assets eventually ended up in the hands of domestic predators,it is Western investors, not domestic taxpayers, who would have been robbed. The production (or contraction) effectmay be the same, but the fiscal effect is far worse if the predatory seizure of assets takes place in the beginning, not atthe end. The production (contraction) effect may actually worsen if a fiscally weakened government compensates itslosses by raising taxes or defaulting earlier than it would have otherwise been forced to do.
56See Gregory C. Chow, "Challenges of China's Economic System for Economic Theory," pp. 321-327; SocialistRepublic of Vietnam, General Statistical Office, Nien Giam Thong Ke [Statistical Yearbook] (Hanoi, 1994), pp. 17-21;Kazimierz Z. Poznanski, Poland’s Protracted Transition, pp. 169-207; and, Stefan Bojnec, “Macroeconomic Stabilizationand the Reform Process in Slovenia,” pp. 21-40.
share of redistribution it entails. After the abolition of central planning and in the presence of theinherited enterprise network, the true asset is access to public income, to the tax subsidy. Propertyrights, ownership of enterprises provide privileged access to common income. Property rightson productive assets become fiscal property rights on the tax subsidy. The corollary to theCoase Theorem states thus: Under enterprise network socialism, property always ends up in thehands of most capable predators on public income, masters of redistribution, subsidy extractors,because they are willing to pay the highest price (apply the greatest force and influence).55 Itfollows that stripping productive assets by legal owners is most profitable under these conditions,because it is not from production but from access that they derive their gains. They want to keepthe titles to continue to exploit their privileged access to common income and they add assetstripping as a dessert to the main course. It also follows that it matters little how privatization wasconducted and what methods were used, which is the subject of a voluminous literature. The best(worst) predators always come on top in the end. China, Vietnam, and other post-Communistcountries in Asia, and Poland and Slovenia in Eastern Europe eschewed privatization.56 Theyescaped its worst predatory outcomes which befell Russia. To recapitulate, the issue is not thetheft of property, because the end is the same even in the case of the cleanest initial assignment oflegal rights on assets. The issue is not improper privatization, the issue is that privatization isimproper under enterprise access to common income. The issue is predatory natural selection andself-selection of ultimate owners, the surrender of the country to worst predators.
7. Scrap SLiP. When a conventional market reform (a package of stabilization, liberalization, andprivatization, which we discussed in Chapter 2) begets contraction, do not stay the course, changethe policy. Countries that changed direction, as did Poland in 1993, performed much better thanthose that did not, such as the Czech Republic. It is one of the best-kept secrets of post-Communist experience that the relative success of Poland was due to a fundamental policy shift,
The Evolution of Private Income: A Few Sketches and Approximations 23
57For an insightful, insider account see Grzegorz W. Kolodko, From Shock to Therapy.
58The World Bank, From Plan to Market. World Development Report 1996 (New York: Oxford UniversityPress for the World Bank, 1996), pp. 29-30.
59To mix metaphors, let a hundred flowers blossom (let a hundred schools of thought contend), not just fleursdu mal.
60We show in Part Three how to achieve this.
61For an elaborate classification, see People’s Republic of China, State Statistical Bureau, China StatisticalYearbook 1996 (Beijing: China Statistical Publishing House, 1997), pp. 377,401, 404, 410-411.
not to a lagged effect of initial policies; not to continual initial policies but to their discontinuation.57
Do not sacrifice growth for reform. There is no such trade-off, given the extent of inherited valuesubtraction, discussed in Chapter 1. Contrary to the dominant literature, contraction is not aninvestment in future growth,58 it is a pure loss in both the income and asset sense, never recovered.Advocating a second edition of reform, as voiced by the U.S. government and the IMF for Russia,is calling for an accelerated contraction. It is never too late to scrap SLiP, but the sooner thebetter.
8. Let economic organizations and property types naturally evolve, self-select, and grow underrestricted access to common income and public finance.59 This is probably the most importantpolicy of all. Evolution will naturally select those types of property on productive assets that willadapt to conditions of private income. These will be optimal property types that are leastconducive to redistribution of income, socialization, networking, and gaining access to publicincome. If a country can wipe out the enterprise network in one fell swoop,60 private property maybe the immediate natural outcome. What type of ownership is optimal under incomplete privateincome depends on the degree to which the enterprise network is broken up. In Poland, some 30percent of GDP was produced outside the network even before the abolition of central planning.Such large industries as agriculture and services were already in the private income domain.Although the inherited enterprise network remained in the state sector, its financial claims wereconstrained by credit ceilings and wage control. New entrants naturally emerged as privatelyowned firms, filling up various market niches. Most of the new entrants could not join the inheritednetwork and thus, neither by government design nor by deliberate intention, expanded the domainof private income. New entrants started to compete with the inherited enterprise network of thestate sector, thereby reducing its share of GDP. This, in turn, strengthened the growth of privateincome for the next wave of new entrants. A virtuous circle developed. A different serendipity inEstonia led to similar results. Privatization into the hands of foreigners followed the breakup of theenterprise network, which consisted of Russian enterprises and which was razed for politicalreasons, not as an economic policy design. In other countries, the efficient approach selected itselfin China and was reinvented in Vietnam, Myanmar, and elsewhere. Many property types emerged,including shareholding and individually-owned private firms and rural units.61 But local government
The Evolution of Private Income: A Few Sketches and Approximations 24
62For an intellectually inspiring discussion see Gregory C. Chow, "Challenges of China's Economic System forEconomic Theory," pp. 321-327 and Ronald I. McKinnon, "Financial Growth and Macroeconomic Stability in China,1978-1992: Implications for Russia and Other Transitional Economies," Journal of Comparative Economics 18, no . 3(1994): 438-470. A detailed analysis on China is in Barry Naughton, Growing out of the; and, Alvin Rabushka, The NewChina, pp. 71-99. On Vietnam, see data in Socialist Republic of Vietnam, General Statistical Office, Nien Giam Thong Ke[Statistical Yearbook] (Hanoi, 1994), pp. 17-21. An analytical treatment is in Markus Diehl, “Structural Change in theEconomic Transformation Process,” pp . 147-182. The data and policy details on Myanmar are in Ministry of NationalPlanning and Economic Development [Myanmar], Review of the Financial, Economic and Social Conditions for1993/94.
63The World Bank, From Plan to Market, p. 51.
64Ibid.
or community ownership prevailed, such as Township and Village Enterprises (TVEs), in Chinaand Vietnam and Cantonment Municipal Enterprises in Myanmar.62 Chinese TVEs by themselvesset an economic record, turning in about 25 percent growth of output per year and 10 percentannual growth of productivity since the mid-1980s.63
What is their secret? The conventional literature dubs them as halfway houses between state andprivate property and advocates their convergence with standard private firms.64 In our view, theyare an organizational species sui generis. The secret of TVEs is twofold: Not only do theyembody private income, they, of all property types, inadvertently established separable publicincome from scratch. Consider the effect of provincial and local government ownership whenthe inherited enterprise network is set aside and kept under central fiscal control:
(a) The central government could not confiscate income of TVEs because they raised revenues forthe local governments that owned them. If the central government tried to seize these revenues,it would be stuck with the need to subsidize those local expenditures financed by TVE income. Asever, money is fungible.
(b) The central government could not subsidize TVEs because it did not want to subsidize localgovernments. It gave them economic freedom to set up TVEs in exchange for fiscal self-sufficiency. The central government closed budget subsidies to outsiders and newcomers such asTVEs, but also precluded allocating state bank credit to them.
(c) TVEs could not join the existing network of state-owned enterprises because the network isblocked from expansion by the central government through such tools as price control, creditceilings, and wage control, and because, to repeat, the central government did not want tosubsidize local government. In effect, a Chinese wall was built around the inherited network. Nordid the network of state enterprises have any incentive to let TVEs join the club. The networkwould not extend unpaid trade credit and free inputs to TVEs, because state enterprises alreadyreceive subsidies (the soft budget constraint) from the government and would rather sell resources
The Evolution of Private Income: A Few Sketches and Approximations 25
65See Yuanzheng Cao, Yingui Qian, and Barry R. Weingast, “From Federalism, Chinese Style, to Privatization,Chinese Style,” Economics of Transition 7, no. 1 (February 1999): 103-131.
on the open market.
(d) Local governments could not confiscate income of TVEs because they already receive TVEs’profits as their owners. One does not confiscate one’s own income. Confiscation of more incomewould amount to decapitalization of TVEs, which would deprive local governments of futurerevenues. This would amount to killing the goose that lays the golden eggs, and the Chinese muchpreferred a steady diet of eggs to a one-time feast on roast goose.
(e) Local governments could not subsidize TVEs because local governments derive their revenuesfrom the profits of TVEs, and have no sufficient alternative sources of revenues. The reason thatTVEs exist in the first place is to provide income to their local political jurisdictions, not to receivesubsidies. If TVEs do not prosper, local governments will shut them down. Managers of TVEsface incentives to perform because, unlike privatized enterprises, there are no preexisting assetsto loot. All parties are interested in creating new wealth.
(f) Local governments and TVEs could not establish a new network for extracting subsidies fromthe central government because they would not survive while they waited for the network tobecome sufficiently comprehensive to absorb them. As we discussed in Chapter 2, a network withenforcement powers over fiscal and monetary authority can only be inherited.
(g) Self-interest of local governments and TVEs beget competition among themselves for marketprofits, not collusion for the state subsidy. Local governments can raise capital from local savingsand foreign investors, forming local or provincial-level investment funds and using their power totax as a collateral. Market profits are feasible with relatively little risk. Attempting to secure taxsubsidies is more risky. Indeed, in China’s circumstances, TVEs made more sense as a form ofownership than genuinely privately-owned enterprises. Inasmuch as the latter have few assets andlimited opportunity to raise capital, they would have greater incentive to make an extra effort tobreak in into the existing network of state enterprises, to attach themselves to subsidized stateenterprises. TVEs rather thrive in the market in dividing production with state-owned enterprises,obtaining inputs from them, and selling some output to them (but mostly to consumers). Theircomplementarity creates wealth for the entire economy.
(h) It follows, then, that private finance develops after separable public finance. Local governmentscan raise capital for TVEs because their own income is non-trespassable and credible. Thisexperience of China and similar countries demonstrates that a multi-layer federalism can play acrucial role in separating public income and establishing private finance—a role similar to that inmerry old England.65
The Evolution of Private Income: A Few Sketches and Approximations 26
66Kelvin Lancaster and R. G. Lipsey, “The General Theory of Second Best,” The Review of Economic Studies24, no. 1 (63) (February 1957): 11-32.
The thrust of all these seemingly non-market policies, intentional or not, was (1) to preventliberalization of the enterprise network and (2) to close access of private interests to public income. Allthese policies were applied in part and in one or another mix in specific countries. Only to the extent theywere applied, did contractions stop or not occur, and growth followed or started instantly. The datapresented in figures 2.1 and 2.2 summarize evidence to this effect.
This paradoxical road to the market economy can be viewed from the general perspective of thesecond best, formulated by Kelvin Lancaster and R.G. Lipsey. They show that in the absence of fullmarkets and in the presence of distortions, market results in particular areas are impossible whatevermarket policies are applied. Non-market policies constitute the second best and can obtain the best resultspossible under the circumstances. Market policies, by contrast, can magnify distortions.66 This is intuitivelysimple. As in any system, if a crucial link is missing or broken, many others cannot work right. They mustbe adjusted in a wrong way from the standpoint of the initial equilibrium and system purity, but this isnecessary to enable the system to function at all. An alternative is a crash. Case in point: Russia duringthe 1990s.
The experience of all post-Communist economies shows that the issue is neither speed norsequence of policies but their thrust. If policies are found for separating public income and establishingprivate income, they can be applied at once. If they are not found, the policies of liberalization andprivatization should not be applied at all, not fast, not slow. Between these two extremes, every successfulcountry found its own mix, its own second-best solutions, and its own speed. If we combine our discussionof the evolution of private income in history with the experience of post-Communist countries, fourstrategies stand out:
1. Break up the enterprise network and establish orderly, separable public finance.
2. Create a framework for separable, non-trespassable private finance.
3. Assign property rights based on private, internalized income.
4. Liberalize product, labor, and capital markets, but only on the condition of internalization ofincome.
We discuss in Part Three of our book the details of how to implement these strategies.
Economies Evolve with the Type of Income
The Evolution of Private Income: A Few Sketches and Approximations 27
Let us combine the facts discussed in the first four chapters. Economic species evolve and adapt.Economies can evolve from mostly common to mostly private income, as did England after 1688 and Chinaafter 1978. To achieve this result, they need to establish a separate fiscal system and separate, privateincomes of firms and households. Everything else follows and adapts from these basic, fundamental steps.Going back to redistribution, as practiced by modern welfare states in the 1900s, defeats private income.Economies can also evolve from one species of common income to another. For this, they can increaseor reduce the role of the government in the economy. The government can take total control and movefrom confiscation of relatively free production to forced production under central planning. Or thegovernment can abolish central planning, liberalize, privatize, and surrender fiscal and monetary power tothe inherited enterprise network. Reducing the role of the government in the economy under commonincome does not lead to the market economy. Rather, it creates a new socialist species.
In this chapter, we have sketched the evolution of private income, its origin, and its partial retreat.The next chapter explores various species of common income. We do not claim to present a completetaxonomy, but rather a first approximation. Chapter 6 examines how common income evolves from onespecies to another. This brings us back to our primary subject, the emergence of enterprise networksocialism after central planning, this time from an evolutionary perspective. Chapter 7 tries to combine allprevious findings about private and common income economies into a unified taxonomy. Chapter 8 placesthis story in the context of economic philosophical thought on predatory and productive societies.
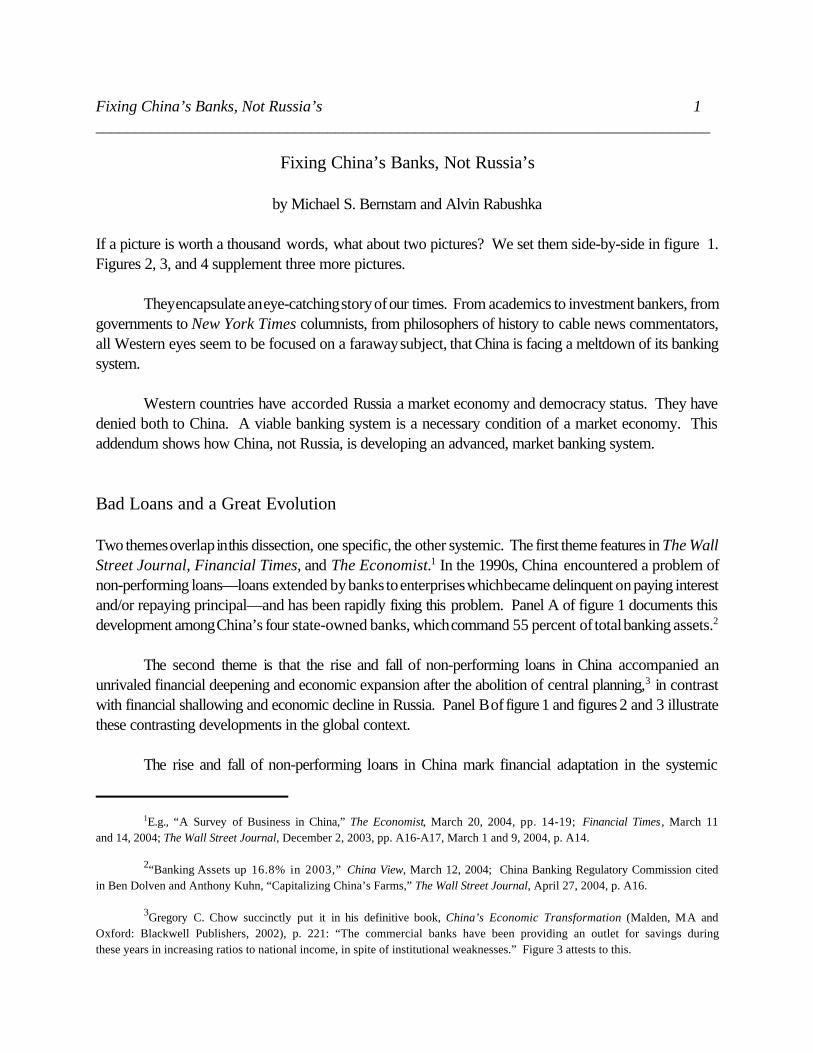
Fixing China’s Banks, Not Russia’s 1_____________________________________________________________________________
1E.g., “A Survey of Business in China,” The Economist, March 20, 2004, pp. 14-19; Financial Times, March 11and 14, 2004; The Wall Street Journal, December 2, 2003, pp. A16-A17, March 1 and 9, 2004, p. A14.
2“Banking Assets up 16.8% in 2003,” China View, March 12, 2004; China Banking Regulatory Commission citedin Ben Dolven and Anthony Kuhn, “Capitalizing China’s Farms,” The Wall Street Journal, April 27, 2004, p. A16.
3Gregory C. Chow succinctly put it in his definitive book, China’s Economic Transformation (Malden, MA andOxford: Blackwell Publishers, 2002), p. 221: “The commercial banks have been providing an outlet for savings duringthese years in increasing ratios to national income, in spite of institutional weaknesses.” Figure 3 attests to this.
Fixing China’s Banks, Not Russia’s
by Michael S. Bernstam and Alvin Rabushka
If a picture is worth a thousand words, what about two pictures? We set them side-by-side in figure 1.Figures 2, 3, and 4 supplement three more pictures.
They encapsulate an eye-catching story of our times. From academics to investment bankers, fromgovernments to New York Times columnists, from philosophers of history to cable news commentators,all Western eyes seem to be focused on a faraway subject, that China is facing a meltdown of its bankingsystem.
Western countries have accorded Russia a market economy and democracy status. They havedenied both to China. A viable banking system is a necessary condition of a market economy. Thisaddendum shows how China, not Russia, is developing an advanced, market banking system.
Bad Loans and a Great Evolution
Two themes overlap in this dissection, one specific, the other systemic. The first theme features in The WallStreet Journal, Financial Times, and The Economist.1 In the 1990s, China encountered a problem ofnon-performing loans—loans extended by banks to enterprises which became delinquent on paying interestand/or repaying principal—and has been rapidly fixing this problem. Panel A of figure 1 documents thisdevelopment among China’s four state-owned banks, which command 55 percent of total banking assets.2
The second theme is that the rise and fall of non-performing loans in China accompanied anunrivaled financial deepening and economic expansion after the abolition of central planning,3 in contrastwith financial shallowing and economic decline in Russia. Panel B of figure 1 and figures 2 and 3 illustratethese contrasting developments in the global context.
The rise and fall of non-performing loans in China mark financial adaptation in the systemic
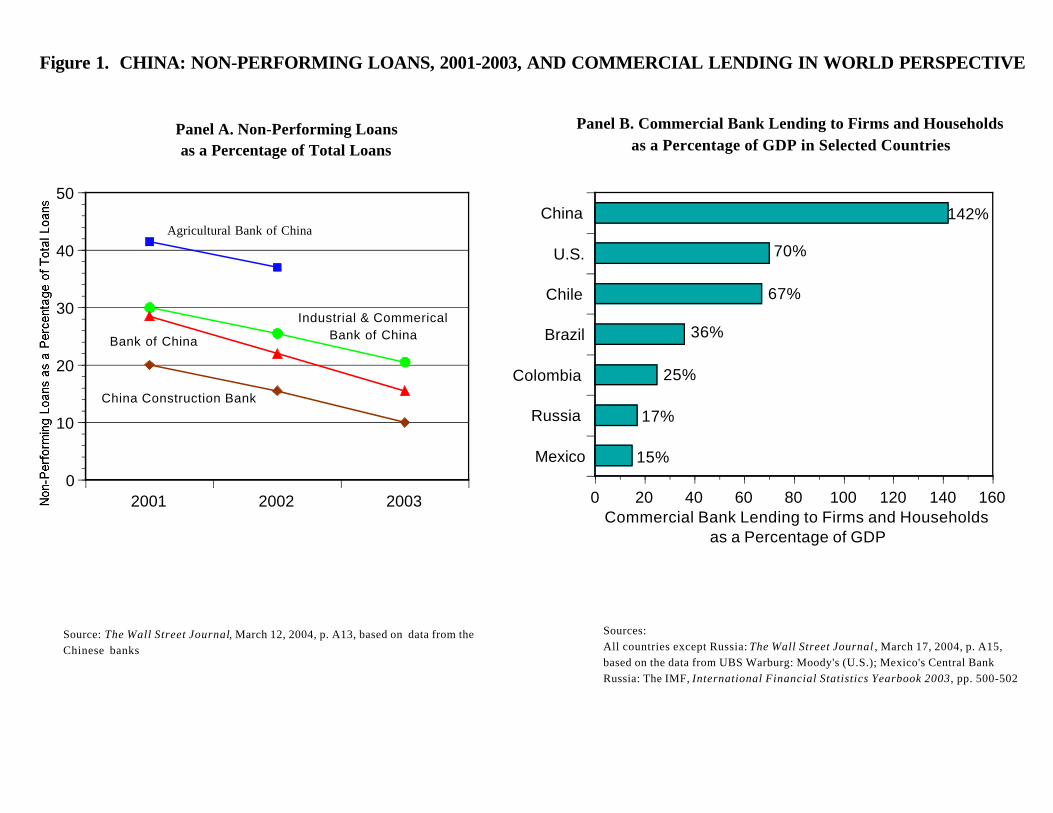
2001 2002 20030
10
20
30
40
50
Agricultural Bank of China
Industrial & CommericalBank of ChinaBank of China
China Construction Bank
Mexico
Russia
Colombia
Brazil
Chile
U.S.
China
0 20 40 60 80 100 120 140 160
142%
70%
67%
36%
17%
15%
25%
Commercial Bank Lending to Firms and Householdsas a Percentage of GDP
Figure 1. CHINA: NON-PERFORMING LOANS, 2001-2003, AND COMMERCIAL LENDING IN WORLD PERSPECTIVE
Panel A. Non-Performing Loansas a Percentage of Total Loans
Panel B. Commercial Bank Lending to Firms and Householdsas a Percentage of GDP in Selected Countries
Source: The Wall Street Journal, March 12, 2004, p. A13, based on data from theChinese banks
Sources:All countries except Russia: The Wall Street Journal , March 17, 2004, p. A15,based on the data from UBS Warburg: Moody's (U.S.); Mexico's Central BankRussia: The IMF, International Financial Statistics Yearbook 2003, pp. 500-502
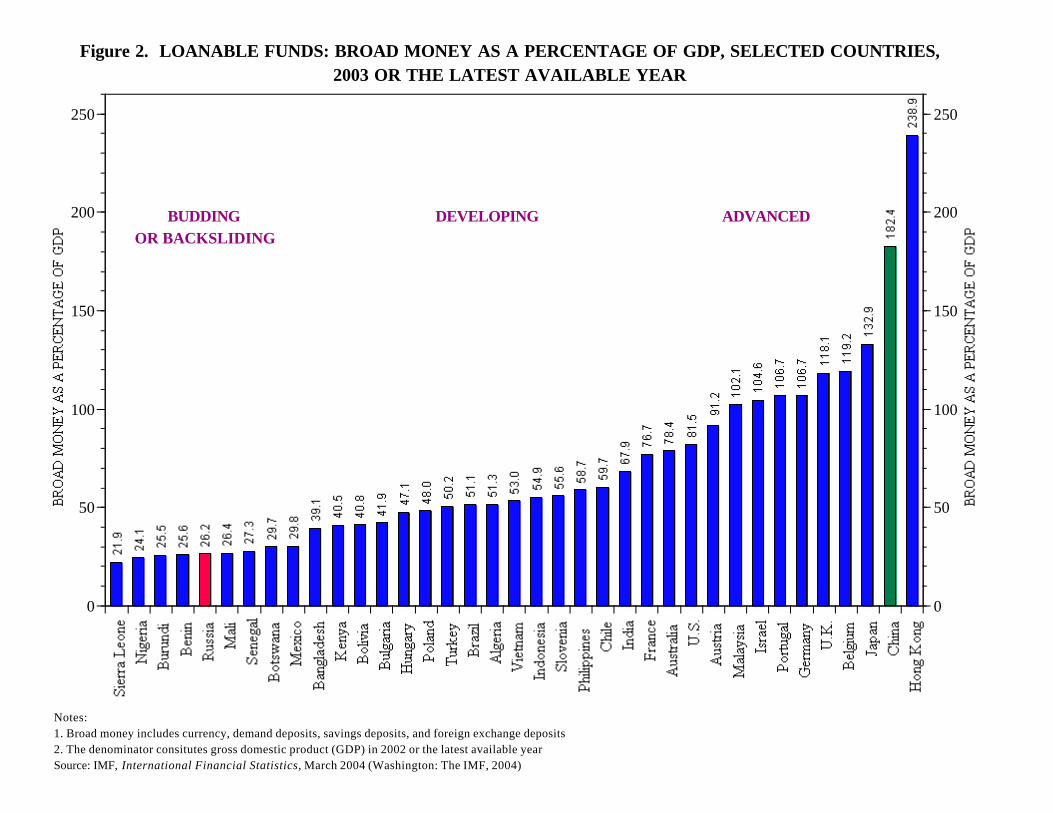
0
50
100
150
200
250
0
50
100
150
200
250
Figure 2. LOANABLE FUNDS: BROAD MONEY AS A PERCENTAGE OF GDP, SELECTED COUNTRIES,2003 OR THE LATEST AVAILABLE YEAR
Notes:1. Broad money includes currency, demand deposits, savings deposits, and foreign exchange deposits2. The denominator consitutes gross domestic product (GDP) in 2002 or the latest available yearSource: IMF, International Financial Statistics, March 2004 (Washington: The IMF, 2004)
BUDDING DEVELOPING ADVANCEDOR BACKSLIDING
24.8
33.337.4
41.4 43.746.9
51.957.2
65.570.4 68.2 71.2
83.087.4
94.1
103.4 100.5103.8
111.4
122.7
133.6
146.4152.2
158.6
182.4
70.0
70.868.5
33.7
23.9 21.217.9 16.6 18.4
22.9 20.7 21.4 23.526.2
29.8
1979 1980 1981 1982 1983 1984 1985 1986 1987 1988 1989 1990 1991 1992 1993 1994 1995 1996 1997 1998 1999 2000 2001 2002 2003 20040
20
40
60
80
100
120
140
160
180
200
0
20
40
60
80
100
120
140
160
180
200
Figure 3. LOANABLE FUNDS:BROAD MONEY AS A PERCENTAGE OF GDP, CHINA, 1979-2003, AND RUSSIA, 1990-2004
Notes:1. Broad money includes currency, demand deposits, savings deposits, and foreign exchange deposits2. The numerator constitutes the amount of broad money at the beginning of the year. The denominator constitutes gross domestic product (GDP) in the previous year3. Due to lack of data, the monetary aggregate M2 instead of broad money is used for Russia in 1990-93. This substitution understates loanable funds in 1990-93.4. The data for 1990 for Russia are estimated using national income accounts for 1989 and the incomplete monthly series on the money stock in 1990Sources: IMF, International Financial StatisticsYearbook, various years, except for Russia in 1990-93 and 2004, wherein the national official statistics are used
China
Russia
Fixing China’s Banks, Not Russia’s 2_____________________________________________________________________________
41991: Russian State Committee on Statistics, Finansy v Rossiiskoi Federatsii v 1992 Godu (Moscow, 1994),p. 55; 1997 and 2004: See the tables of outstandings in the flow of funds (the so called payments tables) at www.gks.ru.
5For a discussion, see Fixing Russia’s Banks and Chapter 1 of From Predation to Prosperity.
6In Shakespeare’s Merchant of Venice, the hostile Antonio offers Shylock surety for a loan of 3,000 ducats toBassanio for three months: “If thou wilt lend this money, / lend it not as to thy friends (....) / But lend it rather to thineenemy, / Who if he break, thou mayst with better face / Exact the penalty.”
evolution of China’s two-track economy from central planning to the market. Banks separated enterprisesand helped break up, forestall, and foreclose their inherited network. In the process, they separated creditfrom payments and established financial intermediation between households and enterprises. The rise andfall of non-performing loans in Russia (from one percent of total loans in 1991 to 19 percent in 1997 to 3percent in 2004)4 accompanied a different evolution after central planning. Russia’s banks do not existoff of and for financial intermediation. They function so as to transmit the subsidy extracted by theenterprise network from the government and the public.5 Banks share in this subsidy and roll over non-performing loans to facilitate the subsidy flow. In the process, credit was never separated from paymentsand the banks merely re-intermediate between enterprises. Figure 4 illustrates this divergent evolution inRussia and China.
This addendum will explore and link the two themes. The first section submits a taxonomy of non-performing loans and contrasts China’s and Russia’s financial development. The second section followscredit, payments, and banking in the evolution of economic systems after central planning.
As we suggested throughout From Predation to Prosperity (see, e.g., chapters 2, 3, 4, and 5),the contrast between Russia and China opens up a perspective on economic systems and hence on worldeconomies, past and present. Separation between credit and payments, which is the first-order outcomeof the rise of financial intermediation in banking, led to emancipation of investment from commerce on theeve of the industrial era. China has long since passed this evolution. Russia left behind industrial centralplanning but bypassed the world of modern financial intermediation and industrial investment.
A Taxonomy of Non-Performing Loans
Fixing non-performing loans has a long, creative history.6 Chinese policy makers found an original andefficient solution for fixing non-performing loans and other banking problems. It may look like creativeaccounting, and it certainly is, but it is more than that, for it maximizes value on the dollar (or Renminbi),minimizes losses, and wards off relapses.
Fixing China’s non-performing loans
Fixing China’s Banks, Not Russia’s 3_____________________________________________________________________________
7In 1998, we proposed a similar strategy for Russia’s enterprise payment arrears and similar capital swaps forinsolvent banks. See Fixing Russia’s Banks, pp. 91-98.
8See, e.g., James Kynge, “China’s Economy Soars Despite Beijing’s Curbs,” Financial Times, April 15, 2004;Credit rationing, such as sector-specific, bank-specific, and enterprise-specific credit ceilings, is a crude and illiberalmeasure which nevertheless worked as the second-best in Japan in the 1950s, in Taiwan in the 1960s, in South Koreain the 1970s-1980s, and in Poland and other fledging banking systems of Eastern Europe in the 1990s. See Ronald I.McKinnon, The Order of Economic Liberalization: Financial Control in the Transition to a Market Economy(Baltimore and London: The Johns Hopkins University Press, 1993), pp. 81-82, 85-88; Joseph E. Stiglitz and Andrew W.Weiss, “Credit Rationing in Markets with Imperfect Information,” American Economic Review 71, no. 3 (June 1981): 393-410 and “Credit Rationing: Reply,” American Economic Review 77, no. 1 (March 1987): 228-231; and Chapter 4 of FromPredation to Prosperity, pp. 18-25, especially item 3 on pp. 19-20.
9A brief list is in James Kynge, “China Bank Reforms to Cool Loan Growth,” Financial Times, March 24, 2004.
The Chinese solution is threefold.
1. The government recapitalized the four major state-owned commercial banks, the holders of non-performing assets, with $45 billion in foreign exchange assets from the People’s Bank of China (thecentral bank). This approach preempts the issue of bonds, with its ensuing debt service costs. Italso minimizes recidivism (as bailouts invite risky lending and beget new bailouts—what theliterature calls “moral hazard”) because domestic bonds can grow on trees but foreign bondscannot. Foreign bonds cannot be expected to bail out the banks the next time.
2. The government set up four asset management companies (AMCs) in 1999 and swapped banks’non-performing assets for their debt, on par value, for subsequent disposal at market value. Afterthe discount sale and/or negotiated debt collection from enterprises, the price of AMC bonds willdecline commensurate to the AMC reduced capacity to service their debt and redeem their bonds.They will then be able to buy back their debt at a discount and close shop after their mandated 10years. Better yet, the AMCs could swap enterprise debt for equity and sell this equity, acting asinvestment banks or venture capitalists. This is an efficient consignment and swap arrangementwhich minimizes losses.7
3. In lieu of uniform regulations, the China Banking Regulatory Commission and the People’s Bankof China refined sector-specific credit restrictions.8 Bank-specific reserve requirements are linkedto the ratio of non-performing loans in the bank’s portfolio. Sector-specific interest ratedifferentials for commercial banks have been sharpened to restrict risky credit.9 Bank capital mustbe raised to 8 percent of loans, which automatically constrains lending. The government will furtherrestrict lending if non-performing loans resurface and erode the equity capital of recapitalizedbanks. Later in 2004, foreign financial institutions will take stakes in two of the four big state banks.Meanwhile, China has opened its financial markets to competition from 62 major foreign bankswhich constrain credit by risk assessment.
Fixing China’s Banks, Not Russia’s 4_____________________________________________________________________________
10Gregory C. Chow proposed an improvement over the conventional policy triad in fixing non-performing loans.In economies with high long-term economic growth (China averaged 9 percent per annum in the last 25 years) and highsavings rates, the government can increase the money supply commensurately without causing inflation. Accordingly,the government can recapitalize banks with currency instead of bonds. Currency constitutes government bonds whichbear no interest and have infinite maturity, thus never have to be redeemed. When income elasticity of the demand formoney balances is about 1.2, as in China, the central bank can issue base money at a growth rate of 11 percent perannum, given a 9 percent growth of real income. This is a zero cost (although there are opportunity costs)recapitalization of banks, eradicating non-performing loans. Chow points out that this approach is not comprehensivefor it does not solve the problem of moral hazard and recidivism. Gregory C. Chow, China’s Economic Transformation,pp. 229-230.
11“The asset management company (....) has the power to supervise and monitor the financial position of thestate enterprises, being their creditor.” Gregory C. Chow, China’s Economic Transformation, p. 74. “Foreign AMCsundertake mainly to solve bank problems. Yet China wishes to solve the problems of banks and state-owned enterprisesand lighten financial burdens as well.” Li Ying and Li Xin, “Establishment of Financial Asset Management Companiesand Related Impacts,” Deleglertenburos der Deutschen Wirtschaft China und Hongkong, March 1, 2004.
A conventional triad applied in many countries consists of (1) recapitalization of banks withgovernment bonds and (2) a commensurate negotiation downward, disposal, and write-down of non-performing assets, accompanied by (3) increased regulation. This is a simple swap of good assets for badassets, at the taxpayers’ expense, while revamped regulation strives to preclude moral hazard andrecidivism. Policy (2) partially compensates for the short-term costs of policy (1), while policy (3)addresses the long-term costs of policy (1). This is a typical situation where it is hard to predict whetherthe cure will turn out to be better than the disease because bailouts tend to reproduce, indeed multiply, non-performing loans (the now-proverbial “moral hazard”).10
In contrast, in the Chinese approach, recapitalization is self-contained and moral hazard is thuscontained (again, because foreign bonds don’t grow on trees). There is no need to solve the moral hazardconsequences of policy (1) with policy (3). The Chinese approach builds-in the safeguards against moralhazard—that is, against policy (1)—within policy (1) itself. This allows policies (2) and (3) to addressbroader and deeper issues. Both policies lead to restructuring of enterprises, not only banks, and, hence,restructuring of borrowers, not only creditors. Asset Management Companies do not carry fixed liabilitiesto hundreds of millions of depositors; rather, they carry market-adjustable liabilities to four state-ownedbanks. They can concentrate on deriving the most value from their newly acquired assets, enterprise non-performing loans, and on streamlining enterprise finances along the way.11 The conventional triad overhaulsbanks, the Chinese approach overhauls enterprises along with banks.
A word of caution. China has been fixing its non-performing loans. It is too early to say whetherit will have them fully fixed. Overall, according to the China Banking Regulatory Commission, the ratio ofnon-performing loans to total loans in the entire banking sector fell from 28.0 percent in 1998 to 23.1
Fixing China’s Banks, Not Russia’s 5_____________________________________________________________________________
122003 and 2004: cited in Mure Dickie, “Tough Targets Set for China’s State Banks,” Financial Times, March11, 2004; 1998: cited in Makoto Ikeya, “Chinese Banking System: Impact of Asset Management Companies,” R&I RatingJoho (Hong Kong, November 1999).
13Karen Richardson, “China Moves on Loan Cleanup,” The Wall Street Journal, March 9, 2004, p. A14.
14Geoffrey Chaucer, The Canterbury Tales , “The Shipman’s Tale.”
percent in 2003 to 17.8 percent in 2004.12 Panel A of figure 1 displays rapid dissipation of non-performingloans during 2001-2003, from 41.5 percent of total loans of the Agricultural Bank to 37 percent (in 2002),from 30 percent of total loans of Industrial and Commercial Bank to 20.5 percent, from 28.5 percent oftotal loans of Bank of China to 15.5 percent, and from 20 percent of total loans of China ConstructionBank to 10 percent. But this may be a pure accounting result of removing bad assets from the balancesheets of the banks to the balance sheets of AMCs. A timing effect also played a role. A rapid expansionof new loans increases the denominator, total loans, without accounting, as yet, for the amounts that mayfail to be repaid and would augment the numerator, non-performing loans. Still, the AMCs have alreadysold about 30 percent of loans from their portfolio at some 20 cents on the dollar,13 and this is not anaccounting fluke. In the next two years, AMCs plan to dispose of another 25 percent of these loans. Thepace of reconstruction is swift. To adjudicate whether China will have the problem of non-performing loansfixed, one will need to extend this diagram at least three years ahead. If the curves turn upward, theproblem resumes. If the curves continue to go downward, the problem has been fixed. This is astraightforward proposition, fully verifiable and falsifiable. In the next few years, one has an opportunityto test a policy against reality.
“Or lend us gold, and that is perilous”14
Banking is a risky activity. Banks make money by making up money, one way or another—usuallyby issuing credit which returns with interest. But borrowers may fail to pay interest and repay debt, andthen banks lose money. To lend or not to lend is always the question. But lack of lending means neitherbusiness nor profit, so that non-performing loans are always a problem.
Non-performing loans pose at least four dangers, one for bank owners, one for depositors, andtwo for the economy at large.
1. Owners do not receive a market return on their capital. In the worst case, if the bank fails, ownerslose their assets. In modern times, this may affect a broad pool of shareholders.
2. Depositors do not receive a market return on savings. Banks pass their losses onto depositors bysuppressing interest rates. In the worst case, if banks fails, depositors lose their assets or anyuninsured balance. Banks also redistribute losses to other borrowers by charging higher interest.Lower deposit rates and higher lending rates repress savings and financial markets, which hampers
Fixing China’s Banks, Not Russia’s 6_____________________________________________________________________________
15See Chapter 1 of From Predation to Prosperity, pp. 23-25.
economic growth.
3. Non-performing loans epitomize bad investment. They misallocate credit from good projects,which do not receive funding, to failed projects. Bad investment ends up in misallocation of capitaland, by extension, labor and natural resources (and may even finance value subtraction, e.g., inRussia15). The economy performs below its production potential.
4. Non-performing loans may spill over the banking system and contract the money stock, which maylead to economic contraction. This spillover effect can channelize through illiquidity or bankinsolvency. (a) When many borrowers fail to pay interest, banks may experience liquidityshortages. These shortages can jam payments across the economy exactly like a power plantfailure in the Midwest in 2003 caused blackouts in New York and across many states. (b)Illiquidity constrains banks in paying depositors, e.g., cashing their paychecks. Banking panicsfollow. A run on banks by depositors only amplifies illiquidity. If banks fail, their deposits as partof the national money stock become inoperative. The money stock contracts and economiccontraction (recession or depression) follows. (c) Undercapitalized banks become insolvent if theamount of non-performing assets exceeds the banks’ capital base. Subsequent bank failureproduces the same contraction effect on the money stock and the economy as described in (b).
It follows that the extent of actual danger of non-performing loans for the economy depends on theoverall state and dynamics of loanable funds. If loanable funds of the banking system are large andgrowing, non-performing loans can be contained. If not, the financial system and the economy fail.
Loanable funds
How robust is China’s banking system? As usual, reasonable observers disagree. Gregory C.Chow discerns:
“Is the Chinese banking system in a crisis situation? The answer appears to be no, in spiteof the problems and shortcomings of the system (...) People have confidence in the value oftheir deposits in the banks because they believe that the government owns the banks andimplicitly guarantees their deposits. The fact that 20 to 25 percent of total bank loans arebad has not affected this confidence and is not likely to lead to large withdrawals of deposits.Given the high savings rate of the Chinese people and the limited alternatives for their savings,in the decade of the 1990s the ratio of savings deposits to GDP in China was rising (...)Improvement in liquidity in the banking sector was further evidenced by the reduction of itsloans-to-deposits ratio from 200 percent in 1991 to 140 percent in 1998 (...) The
Fixing China’s Banks, Not Russia’s 7_____________________________________________________________________________
16Gregory C. Chow, China’s Economic Transformation, pp. 72-73, 221. The significance of the last quotedsentence will become apparent at the end of our addendum.
17“A Survey of Business in China,” pp. 17, 19. The list of sources for this survey ignores Gregory C. Chow’sdefinitive book but features prominently The Coming Collapse of China by Gordon G. Chang (2001). In this spirit, theadjacent editorial, entitled “Losing Its Balance,” envisages “China’s dazzling success (...) some day, to turn to dust.”A subsequent editorial is entitled, as one could guess, “The Great Fall of China?” The Economist, May 13, 2004.
commercial banks have been providing an outlet for savings during these years in increasingratios to national income, in spite of institutional weaknesses. (...) The commercial bankshave been serving as financial intermediaries.”16
The Economist advances an opposite view, which is nearly universal in Western intellectual andpolicy circles:
“Outwardly robust China has a black hole for a heart (...) A developing economy with abroken financial system.”17
Who is right? Fortunately, the answer in this case is a matter of fact, not interpretation, a matterof evidence, not eloquence, with clarity seldom shining in the realm of social science and public policy. Thedata in figures 1, 2, 3, and 4 demonstrate that Chow is right and The Economist is wrong.
In the short time span of 25 years, China has developed one of the most advanced banking systemsin the world with incredible financial depth. Loanable funds, along with stock market capitalization, areusually employed to evaluate financial depth. The total domestic money stock M2 or M3 (currency plusdemand deposits plus savings deposits plus time deposits) or the stock of broad money (M3 plus foreignexchange deposits) approximate loanable funds. The ratio of the money stock M3 or broad money togross domestic product (GDP) measures financial depth (e.g., in figures 2 and 3). Another indicativemeasure is the ratio of commercial bank loans to GDP (e.g., in panel B of figure 1). An ultimate measureis the share of savings and time deposits in the money stock M3 (e.g., in figure 4). It shows the depth offinancial intermediation in banking—how much credit is available for long-term investment beyond financingshort-term payments. By all these measures, China’s financial system is as solid as the Rock of Gibraltarand as good as gold.
Panel B of figure 1 compares commercial bank lending to firms and households as a percentageof GDP in selected countries ca. 2003-2004. Mexico and Russia represent a low bound of the sample,with 15 and 17 percent, respectively. Columbia and Brazil are in the middle, typical for developingcountries, with 25 and 36 percent, respectively. Chile, the U.S., and China constitute the upper bound,with 67, 70, and 142 percent, respectively. In fact, China’s depth of commercial bank lending is twice that
Fixing China’s Banks, Not Russia’s 8_____________________________________________________________________________
18Extensive equity and other financial market instruments supplement ordinary credit markets in the U.S. andaugment its financial depth. Demographic and economic dynamics contribute to the high rate of savings (and, byextension, deposits and lending) in China. Rapid rise in personal incomes due to spectacular economic growth in thelast 25 years after decades of privation shifted the long-term ratios of saving and consumption disproportionally towardssaving. Most importantly, at the same time, high fertility and low mortality of the past period created an age distributionwith a high proportion of young people who save and a low proportion of old people who spend. See an elaboratediscussion in Franco Modigliani and Shi Larry Cao, “The Chinese Saving Puzzle and the Life-Cycle Hypothesis,” Journalof Economic Literature 42, no. 1 (March 2004): 145-170.
of the U.S.18 This puts China in context.
Figure 2 broadens the sample and the context. It plots directly the most widely used measure offinancial depth, the ratio of loanable funds to GDP (with loanable funds approximated as broad money),among 37 representative countries at all levels of economic and financial development, in 2003 or the latestavailable year. The sample readily lends itself to a breakdown into three developmental categories. Ç Economies with the ratio of loanable funds to GDP in the range under 30 percent can be viewed
as budding financial systems. In our sample, these are Sierra Leone, Nigeria, Burundi, Benin, Mali,Senegal, Botswana, and Mexico. In the unique case of Russia, which fell from 70.0 percent in1991 to 16.6 percent in 1997 and bounced back to 29.8 percent in 2004 (see figure 3), one cantalk about a backsliding instead of a budding financial system.
Ç Economies with ratios of loanable funds to GDP in the range between 30 and 60 percent can beviewed as developing financial systems. In our sample, these are Bangladesh, Kenya, Bolivia,Bulgaria, Hungary, Poland, Turkey, Brazil, Algeria, Vietnam, Indonesia, Slovenia, Philippines, andChile. Notice that post-central plan economies of Eastern Europe as well as Vietnam, unlikeRussia, belong to this group of developing financial systems.
Ç Economies with ratios of loanable funds to GDP in the range above 60 percent can be viewed asadvanced financial systems. In our sample, these are India, France, Australia, U.S., Austria,Malaysia, Israel, Portugal, Germany, U.K., Belgium, Japan, China, and Hong Kong. China, withthe ratio of 182 percent in 2003 is near the top of the list.
In terms of financial depth and development, measured by the ratio of loanable funds to GDP,figure 2 finds Russia in the cluster of African economies and China among the most advanced economiesof Western Europe, North America, and the Asian Tigers.
Contrary to dire predictions of financial collapse, China demonstrates rapid financial deepening—adynamic which may be even more important for assessing the impact of non-performing loans vs. loanablefunds than the static of financial depth. Figure 3 compares the ratio of loanable funds (approximated asbroad money) to GDP in China and Russia after the abolition of central planning. China started in 1979at the level of budding financial systems, 24.8 percent, which, ironically, is the average level where one can
Fixing China’s Banks, Not Russia’s 9_____________________________________________________________________________
find the backsliding Russia’s financial system in 1994-2004. China’s financial deepening from the 24.8percent ratio of loanable funds to GDP in 1979 to 182.4 percent in 2004 was swift, steady, and, duringthe last five years, accelerating. This ratio increased by 30 percent in 1994-1999 and by 50 percent in1999-2004. There is no leveling-off of financial deepening even at the most advanced stage of financialdevelopment.
Ironically, again, Russia started in 1990, before the abolition of central planning, at the level of the70 percent ratio of loanable funds to GDP, which is a lower bound of advanced financial systems, e.g.,India in 2003. China was at the same level in 1990. As figure 3 displays, China and Russia converged atthat level in 1990. Then Russia started its long march of financial shallowing and backsliding after theabolition of central planning, down to 16.6 percent in 1997, lower than most African countries. A partialrecovery in 1999-2004 brought Russia up to the 29.8 percent ratio of loanable funds to GDP—about thelevel in China in 1980. What The Economist above pronounced about China applies instead aptly toRussia.
Ten types with non-performing loans and one without
China’s non-performing loans are different and unique. This section discusses their difference andtheir origin after the abolition of central planning. Table 1 assembles ten different types of non-performingloans, due to different sources, plus one type of the banking system without non-performing loans.
The eleven items on the list in table 1 are neither necessary, because some may overlap, norsufficient, because there may be other, additional types of non-performing loans. This list serves merelya comparative purpose. It differentiates non-performing loans after the abolition of central planning underthe two-track economic system in China (line 9) and under Enterprise Network Socialism in Russia (line10) from numerous other types.
Let us start at the end of the list. Line 11, central planning. Central planning did not face theproblem of non-performing loans. This fact puts the matter in perspective. If one wants to single out aproblem and dwell on it outside of the systemic context, central planning is often a solution. There wereno non-performing loans, open inflation, measured unemployment, revenue deficiency, lack of monetarypolicy credibility, current account imbalances, exchange rate misalignments, currency crises, asset pricebubbles, underinvestment, overconsumption, over-leveraging, credit crunches, bank failures, moral hazard,liquidity traps, low-level equilibrium traps, dual markets, backward-bending labor supply curves, excessivelitigation, time inconsistency, commitment failures, incomplete contracts, predatory price cutting,externalities of deficient corporate governance, the Dutch Disease, the Olivera-Tanzi effect, rent-seeking,state capture, market failures, and a host of other catastrophes too numerous to mention.
Industrial central planning is an euphemism for economy-wide forced production. Central planningfunctioned as the nation-enterprise. The supply chain of enterprises acted as the assembly line of the
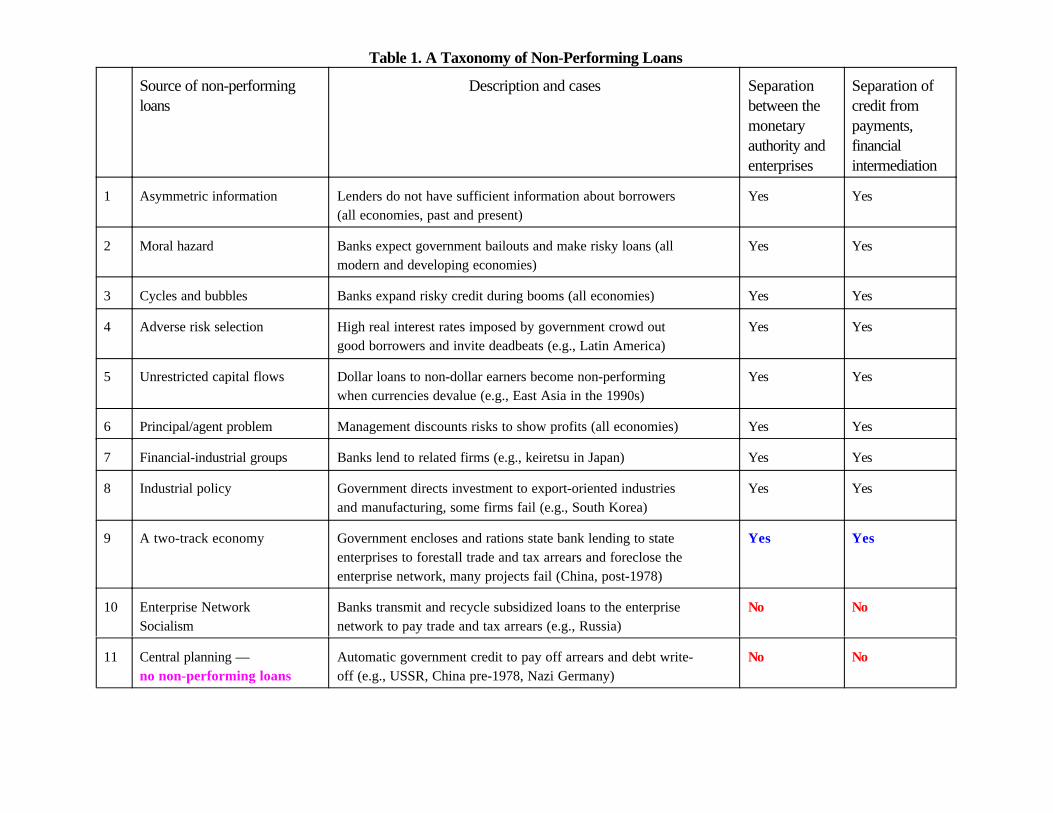
Table 1. A Taxonomy of Non-Performing Loans
Source of non-performingloans
Description and cases Separationbetween themonetaryauthority andenterprises
Separation ofcredit frompayments,financialintermediation
1 Asymmetric information Lenders do not have sufficient information about borrowers(all economies, past and present)
Yes Yes
2 Moral hazard Banks expect government bailouts and make risky loans (allmodern and developing economies)
Yes Yes
3 Cycles and bubbles Banks expand risky credit during booms (all economies) Yes Yes
4 Adverse risk selection High real interest rates imposed by government crowd outgood borrowers and invite deadbeats (e.g., Latin America)
Yes Yes
5 Unrestricted capital flows Dollar loans to non-dollar earners become non-performingwhen currencies devalue (e.g., East Asia in the 1990s)
Yes Yes
6 Principal/agent problem Management discounts risks to show profits (all economies) Yes Yes
7 Financial-industrial groups Banks lend to related firms (e.g., keiretsu in Japan) Yes Yes
8 Industrial policy Government directs investment to export-oriented industriesand manufacturing, some firms fail (e.g., South Korea)
Yes Yes
9 A two-track economy Government encloses and rations state bank lending to stateenterprises to forestall trade and tax arrears and foreclose theenterprise network, many projects fail (China, post-1978)
Yes Yes
10 Enterprise NetworkSocialism
Banks transmit and recycle subsidized loans to the enterprisenetwork to pay trade and tax arrears (e.g., Russia)
No No
11 Central planning —no non-performing loans
Automatic government credit to pay off arrears and debt write-off (e.g., USSR, China pre-1978, Nazi Germany)
No No
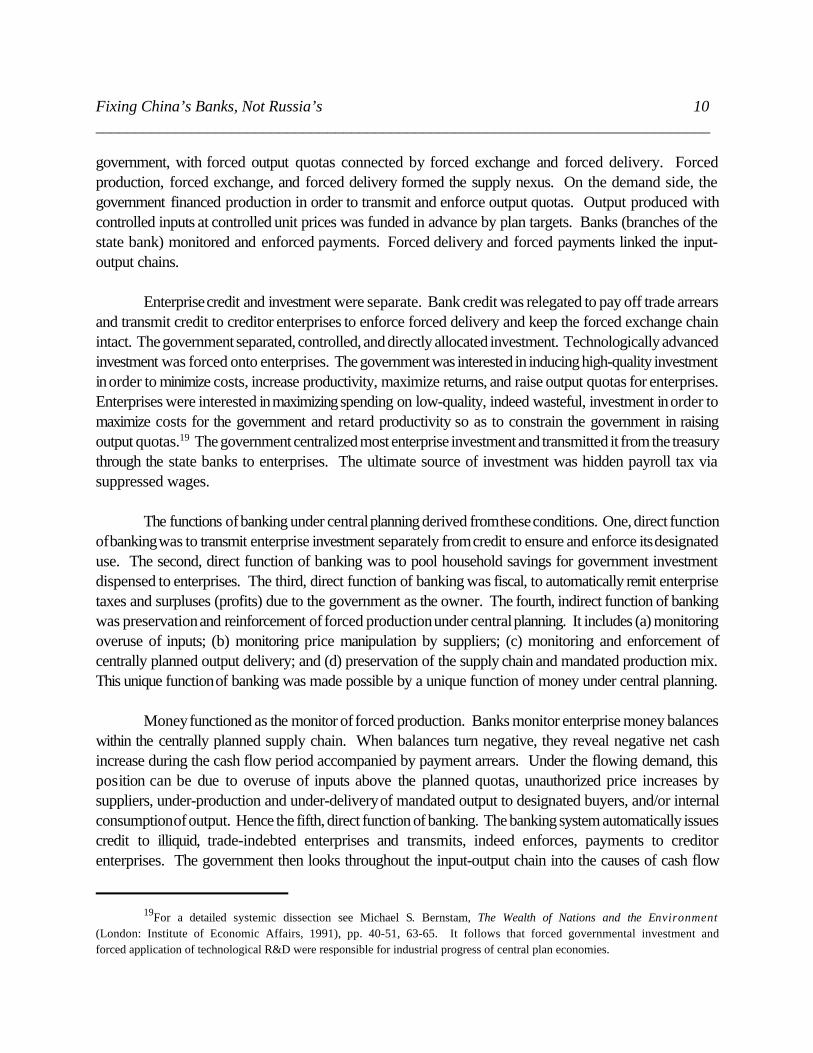
Fixing China’s Banks, Not Russia’s 10_____________________________________________________________________________
19For a detailed systemic dissection see Michael S. Bernstam, The Wealth of Nations and the Environment(London: Institute of Economic Affairs, 1991), pp. 40-51, 63-65. It follows that forced governmental investment andforced application of technological R&D were responsible for industrial progress of central plan economies.
government, with forced output quotas connected by forced exchange and forced delivery. Forcedproduction, forced exchange, and forced delivery formed the supply nexus. On the demand side, thegovernment financed production in order to transmit and enforce output quotas. Output produced withcontrolled inputs at controlled unit prices was funded in advance by plan targets. Banks (branches of thestate bank) monitored and enforced payments. Forced delivery and forced payments linked the input-output chains.
Enterprise credit and investment were separate. Bank credit was relegated to pay off trade arrearsand transmit credit to creditor enterprises to enforce forced delivery and keep the forced exchange chainintact. The government separated, controlled, and directly allocated investment. Technologically advancedinvestment was forced onto enterprises. The government was interested in inducing high-quality investmentin order to minimize costs, increase productivity, maximize returns, and raise output quotas for enterprises.Enterprises were interested in maximizing spending on low-quality, indeed wasteful, investment in order tomaximize costs for the government and retard productivity so as to constrain the government in raisingoutput quotas.19 The government centralized most enterprise investment and transmitted it from the treasurythrough the state banks to enterprises. The ultimate source of investment was hidden payroll tax viasuppressed wages.
The functions of banking under central planning derived from these conditions. One, direct functionof banking was to transmit enterprise investment separately from credit to ensure and enforce its designateduse. The second, direct function of banking was to pool household savings for government investmentdispensed to enterprises. The third, direct function of banking was fiscal, to automatically remit enterprisetaxes and surpluses (profits) due to the government as the owner. The fourth, indirect function of bankingwas preservation and reinforcement of forced production under central planning. It includes (a) monitoringoveruse of inputs; (b) monitoring price manipulation by suppliers; (c) monitoring and enforcement ofcentrally planned output delivery; and (d) preservation of the supply chain and mandated production mix.This unique function of banking was made possible by a unique function of money under central planning.
Money functioned as the monitor of forced production. Banks monitor enterprise money balanceswithin the centrally planned supply chain. When balances turn negative, they reveal negative net cashincrease during the cash flow period accompanied by payment arrears. Under the flowing demand, thisposition can be due to overuse of inputs above the planned quotas, unauthorized price increases bysuppliers, under-production and under-delivery of mandated output to designated buyers, and/or internalconsumption of output. Hence the fifth, direct function of banking. The banking system automatically issuescredit to illiquid, trade-indebted enterprises and transmits, indeed enforces, payments to creditorenterprises. The government then looks throughout the input-output chain into the causes of cash flow
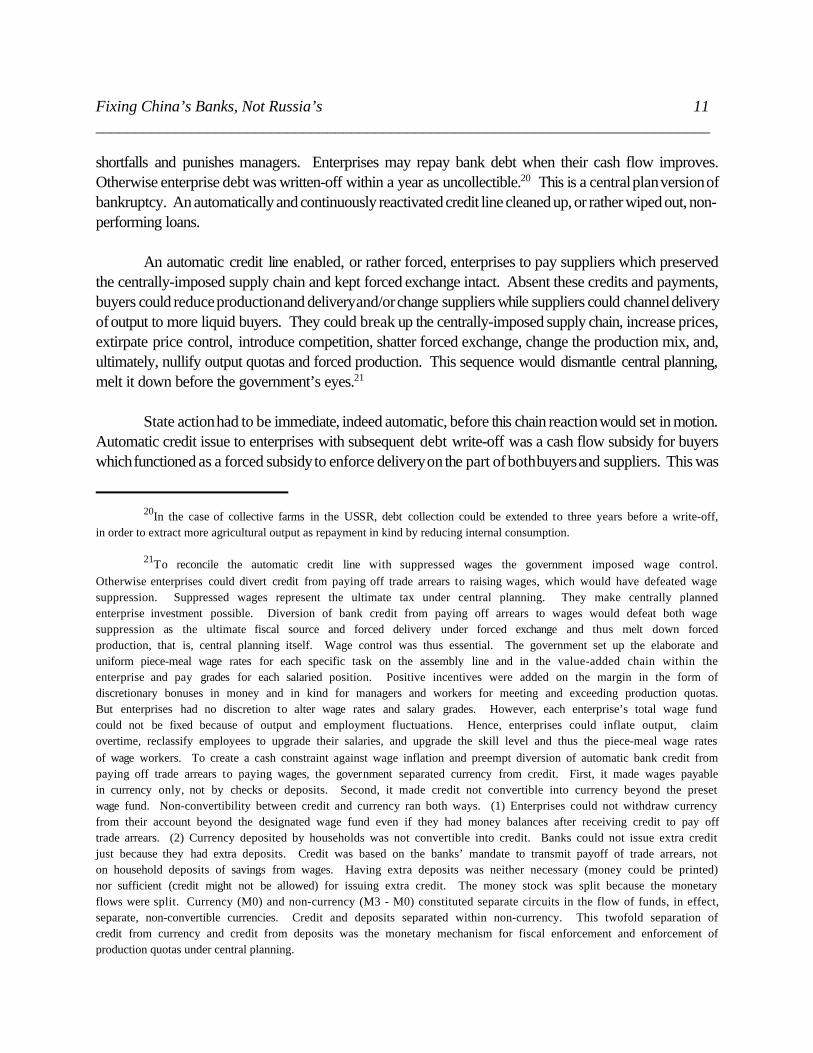
Fixing China’s Banks, Not Russia’s 11_____________________________________________________________________________
20In the case of collective farms in the USSR, debt collection could be extended to three years before a write-off,in order to extract more agricultural output as repayment in kind by reducing internal consumption.
21To reconcile the automatic credit line with suppressed wages the government imposed wage control.Otherwise enterprises could divert credit from paying off trade arrears to raising wages, which would have defeated wagesuppression. Suppressed wages represent the ultimate tax under central planning. They make centrally plannedenterprise investment possible. Diversion of bank credit from paying off arrears to wages would defeat both wagesuppression as the ultimate fiscal source and forced delivery under forced exchange and thus melt down forcedproduction, that is, central planning itself. Wage control was thus essential. The government set up the elaborate anduniform piece-meal wage rates for each specific task on the assembly line and in the value-added chain within theenterprise and pay grades for each salaried position. Positive incentives were added on the margin in the form ofdiscretionary bonuses in money and in kind for managers and workers for meeting and exceeding production quotas.But enterprises had no discretion to alter wage rates and salary grades. However, each enterprise’s total wage fundcould not be fixed because of output and employment fluctuations. Hence, enterprises could inflate output, claimovertime, reclassify employees to upgrade their salaries, and upgrade the skill level and thus the piece-meal wage ratesof wage workers. To create a cash constraint against wage inflation and preempt diversion of automatic bank credit frompaying off trade arrears to paying wages, the government separated currency from credit. First, it made wages payablein currency only, not by checks or deposits. Second, it made credit not convertible into currency beyond the presetwage fund. Non-convertibility between credit and currency ran both ways. (1) Enterprises could not withdraw currencyfrom their account beyond the designated wage fund even if they had money balances after receiving credit to pay offtrade arrears. (2) Currency deposited by households was not convertible into credit. Banks could not issue extra creditjust because they had extra deposits. Credit was based on the banks’ mandate to transmit payoff of trade arrears, noton household deposits of savings from wages. Having extra deposits was neither necessary (money could be printed)nor sufficient (credit might not be allowed) for issuing extra credit. The money stock was split because the monetaryflows were split. Currency (M0) and non-currency (M3 - M0) constituted separate circuits in the flow of funds, in effect,separate, non-convertible currencies. Credit and deposits separated within non-currency. This twofold separation ofcredit from currency and credit from deposits was the monetary mechanism for fiscal enforcement and enforcement ofproduction quotas under central planning.
shortfalls and punishes managers. Enterprises may repay bank debt when their cash flow improves.Otherwise enterprise debt was written-off within a year as uncollectible.20 This is a central plan version ofbankruptcy. An automatically and continuously reactivated credit line cleaned up, or rather wiped out, non-performing loans.
An automatic credit line enabled, or rather forced, enterprises to pay suppliers which preservedthe centrally-imposed supply chain and kept forced exchange intact. Absent these credits and payments,buyers could reduce production and delivery and/or change suppliers while suppliers could channel deliveryof output to more liquid buyers. They could break up the centrally-imposed supply chain, increase prices,extirpate price control, introduce competition, shatter forced exchange, change the production mix, and,ultimately, nullify output quotas and forced production. This sequence would dismantle central planning,melt it down before the government’s eyes.21
State action had to be immediate, indeed automatic, before this chain reaction would set in motion.Automatic credit issue to enterprises with subsequent debt write-off was a cash flow subsidy for buyerswhich functioned as a forced subsidy to enforce delivery on the part of both buyers and suppliers. This was
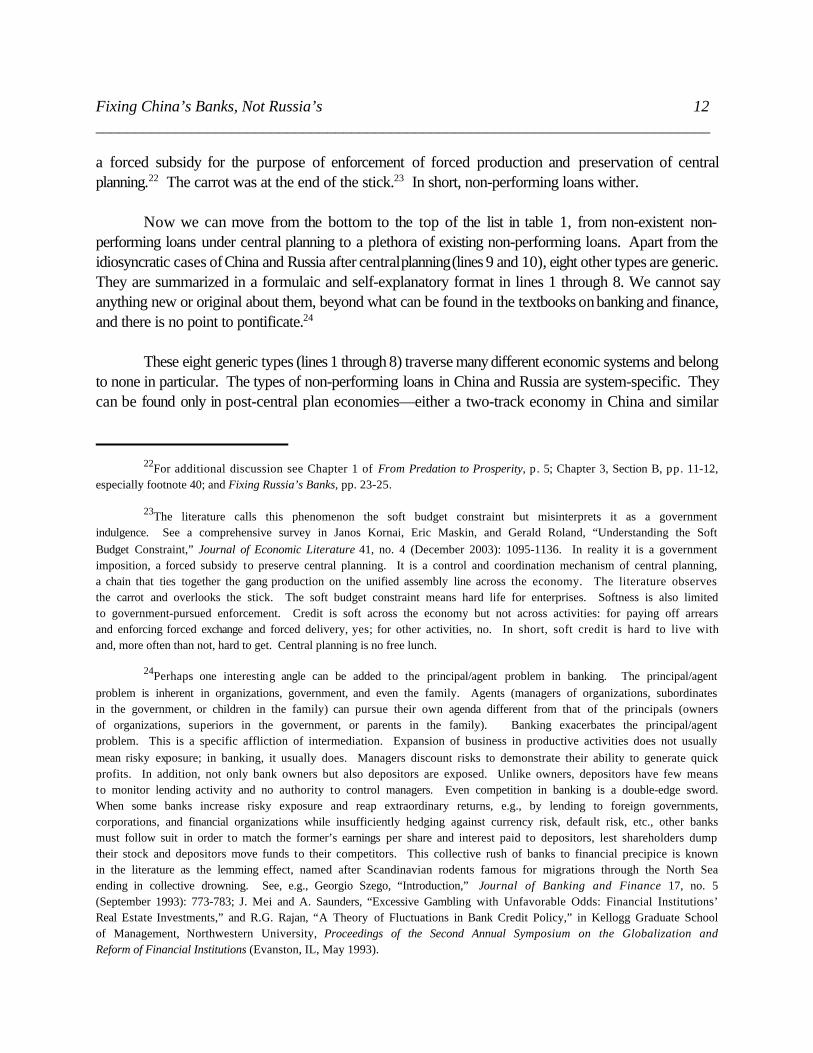
Fixing China’s Banks, Not Russia’s 12_____________________________________________________________________________
22For additional discussion see Chapter 1 of From Predation to Prosperity, p. 5; Chapter 3, Section B, pp. 11-12,especially footnote 40; and Fixing Russia’s Banks, pp. 23-25.
23The literature calls this phenomenon the soft budget constraint but misinterprets it as a governmentindulgence. See a comprehensive survey in Janos Kornai, Eric Maskin, and Gerald Roland, “Understanding the SoftBudget Constraint,” Journal of Economic Literature 41, no. 4 (December 2003): 1095-1136. In reality it is a governmentimposition, a forced subsidy to preserve central planning. It is a control and coordination mechanism of central planning,a chain that ties together the gang production on the unified assembly line across the economy. The literature observesthe carrot and overlooks the stick. The soft budget constraint means hard life for enterprises. Softness is also limitedto government-pursued enforcement. Credit is soft across the economy but not across activities: for paying off arrearsand enforcing forced exchange and forced delivery, yes; for other activities, no. In short, soft credit is hard to live withand, more often than not, hard to get. Central planning is no free lunch.
24Perhaps one interesting angle can be added to the principal/agent problem in banking. The principal/agentproblem is inherent in organizations, government, and even the family. Agents (managers of organizations, subordinatesin the government, or children in the family) can pursue their own agenda different from that of the principals (ownersof organizations, superiors in the government, or parents in the family). Banking exacerbates the principal/agentproblem. This is a specific affliction of intermediation. Expansion of business in productive activities does not usuallymean risky exposure; in banking, it usually does. Managers discount risks to demonstrate their ability to generate quickprofits. In addition, not only bank owners but also depositors are exposed. Unlike owners, depositors have few meansto monitor lending activity and no authority to control managers. Even competition in banking is a double-edge sword.When some banks increase risky exposure and reap extraordinary returns, e.g., by lending to foreign governments,corporations, and financial organizations while insufficiently hedging against currency risk, default risk, etc., other banksmust follow suit in order to match the former’s earnings per share and interest paid to depositors, lest shareholders dumptheir stock and depositors move funds to their competitors. This collective rush of banks to financial precipice is knownin the literature as the lemming effect, named after Scandinavian rodents famous for migrations through the North Seaending in collective drowning. See, e.g., Georgio Szego, “Introduction,” Journal of Banking and Finance 17, no. 5(September 1993): 773-783; J. Mei and A. Saunders, “Excessive Gambling with Unfavorable Odds: Financial Institutions’Real Estate Investments,” and R.G. Rajan, “A Theory of Fluctuations in Bank Credit Policy,” in Kellogg Graduate Schoolof Management, Northwestern University, Proceedings of the Second Annual Symposium on the Globalization andReform of Financial Institutions (Evanston, IL, May 1993).
a forced subsidy for the purpose of enforcement of forced production and preservation of centralplanning.22 The carrot was at the end of the stick.23 In short, non-performing loans wither.
Now we can move from the bottom to the top of the list in table 1, from non-existent non-performing loans under central planning to a plethora of existing non-performing loans. Apart from theidiosyncratic cases of China and Russia after central planning (lines 9 and 10), eight other types are generic.They are summarized in a formulaic and self-explanatory format in lines 1 through 8. We cannot sayanything new or original about them, beyond what can be found in the textbooks on banking and finance,and there is no point to pontificate.24
These eight generic types (lines 1 through 8) traverse many different economic systems and belongto none in particular. The types of non-performing loans in China and Russia are system-specific. Theycan be found only in post-central plan economies—either a two-track economy in China and similar
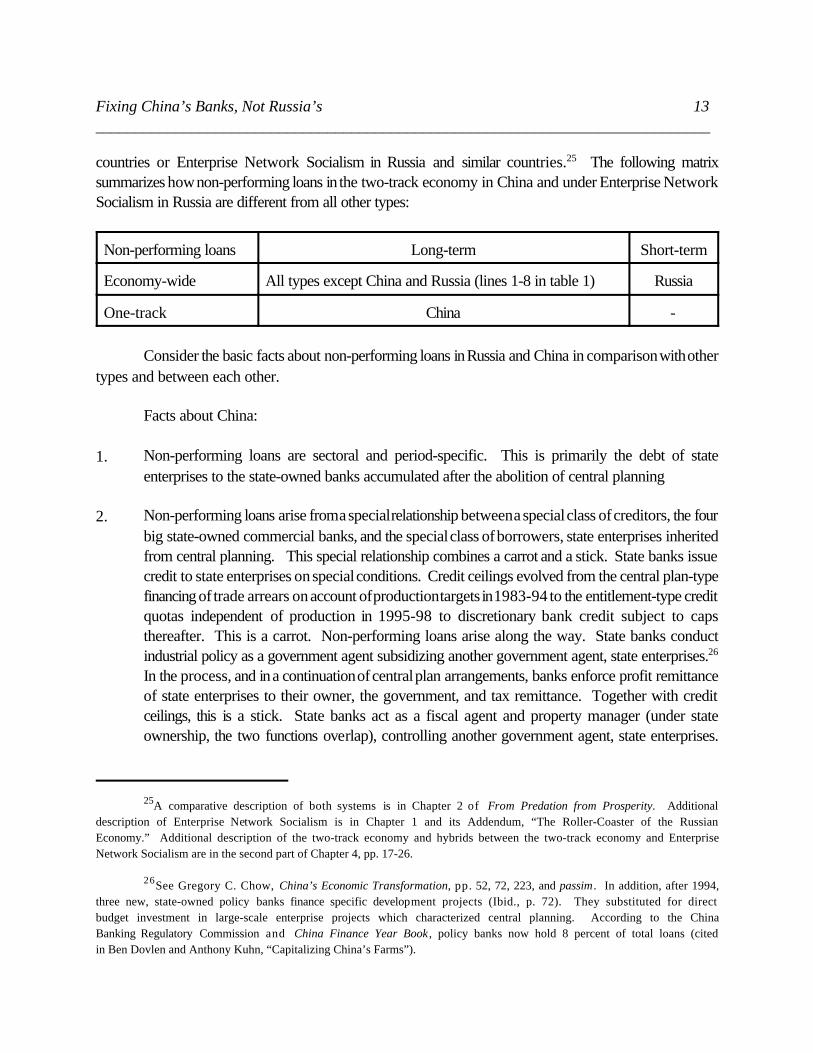
Fixing China’s Banks, Not Russia’s 13_____________________________________________________________________________
25A comparative description of both systems is in Chapter 2 of From Predation from Prosperity. Additionaldescription of Enterprise Network Socialism is in Chapter 1 and its Addendum, “The Roller-Coaster of the RussianEconomy.” Additional description of the two-track economy and hybrids between the two-track economy and EnterpriseNetwork Socialism are in the second part of Chapter 4, pp. 17-26.
26See Gregory C. Chow, China’s Economic Transformation, pp. 52, 72, 223, and passim . In addition, after 1994,three new, state-owned policy banks finance specific development projects (Ibid., p. 72). They substituted for directbudget investment in large-scale enterprise projects which characterized central planning. According to the ChinaBanking Regulatory Commission and China Finance Year Book , policy banks now hold 8 percent of total loans (citedin Ben Dovlen and Anthony Kuhn, “Capitalizing China’s Farms”).
countries or Enterprise Network Socialism in Russia and similar countries.25 The following matrixsummarizes how non-performing loans in the two-track economy in China and under Enterprise NetworkSocialism in Russia are different from all other types:
Non-performing loans Long-term Short-term
Economy-wide All types except China and Russia (lines 1-8 in table 1) Russia
One-track China -
Consider the basic facts about non-performing loans in Russia and China in comparison with othertypes and between each other.
Facts about China:
1. Non-performing loans are sectoral and period-specific. This is primarily the debt of stateenterprises to the state-owned banks accumulated after the abolition of central planning
2. Non-performing loans arise from a special relationship between a special class of creditors, the four
big state-owned commercial banks, and the special class of borrowers, state enterprises inheritedfrom central planning. This special relationship combines a carrot and a stick. State banks issuecredit to state enterprises on special conditions. Credit ceilings evolved from the central plan-typefinancing of trade arrears on account of production targets in 1983-94 to the entitlement-type creditquotas independent of production in 1995-98 to discretionary bank credit subject to capsthereafter. This is a carrot. Non-performing loans arise along the way. State banks conductindustrial policy as a government agent subsidizing another government agent, state enterprises.26
In the process, and in a continuation of central plan arrangements, banks enforce profit remittanceof state enterprises to their owner, the government, and tax remittance. Together with creditceilings, this is a stick. State banks act as a fiscal agent and property manager (under stateownership, the two functions overlap), controlling another government agent, state enterprises.
Fixing China’s Banks, Not Russia’s 14_____________________________________________________________________________
27In addition, the state track includes savings deposits institutions under the postal offices.
28Additional sub-divisions and institutions include trus t investment corporations, financing corporations, andfinancing and leasing corporations. For a full nomenclature of banks and non-banks, see National Bureau of Statisticsof China, China Statistical Yearbook 2003 (Beijing: China Statistical Press, 2003), p. 702.
29According to the China Banking Regulatory Commission and China Finance Year Book, the latestdistribution of loans is as follows: the four state-owned big banks hold 55 percent of total loans, policy banks 8 percent,joint-stock commercial banks 14 percent, rural credit cooperatives 10 percent, and others, primarily urban cooperativebanks and credit unions, 14 percent (cited in Ben Dovlen and Anthony Kuhn, “Capitalizing China’s Farms”). In all, thefirst-track banks hold about 63 percent of total loans and the second-track banks and rural credit cooperatives, 37percent.
30Agriculture with private farms holding tenure rights on state-owned land and forming rural credit cooperativesfor lending can be viewed as the third track. Without private land ownership, farms have no collateral and no accessto bank credit. This impedes sufficient agricultural investment and horizontal integration towards the optimal farm sizedetermined by the market. But this impediment also precludes farms from joining industrial enterprises in a network overthe value-added chain. Rural credit cooperatives fill the void of agricultural lending under the multi-track system.Separation of the third track has become more pronounced since the mid-1990s when joint-stock commercial banksdiscontinued lending to farms exactly in order to minimize their exposure to non-performing loans, which now amountto 26 percent of total loans of rural credit cooperatives. The national government started a drastic policy. It offers torepurchase 50 percent of non-performing loans of RCCs in those provinces which will tighten up RCCs. It strives toconsolidate 35,000 RCCs into 3,000 credit unions in order to diversify risk and intermediate deposits to the most efficientinvestments. This amounts to cutting-off subsidies to marginal farmers at the expense of more successful farmer
This is the state enterprise/state bank track.27
3. The new-entrant enterprises constitute the second track. These are, first and foremost, townshipand village enterprises (TVEs) owned by local governments, cooperative enterprises, jointventures, foreign ventures, and, lately and increasingly, private enterprises. Their financialcounterparts spawned in the 1990s are International Trade and Investment Corporations, ITICs(joint ventures of local governments and foreign entities), rural credit cooperatives (RCCs, grownup to 35,000 by 2004), urban cooperative banks and credit unions, city commercial banks, andthe 11 joint-stock commercial banks, national in scope.28 The second track is—by law and bystrictly enforced policy—financially separated from the first track of state enterprises and statebanks: trade, yes; credit, no. The government forbids the big four state banks to lend to thesecond track enterprises and banks. The best word to describe this policy is verboten.
4. Township and village enterprises and other new entrants had to rely initially on self-financing fromretained earnings. Now they can use the credit facility of the second-track banks.29 Uniquely incontemporary banking, this facility is effectively moral hazard-free, which makes second-trackbanks not prone to the buildup of non-performing loans. The second track is not like private andlocal government sectors in Western market and developing economies, intricately connected bymyriads of financial links to the national state sector. The second track is a separate track.30 The
Fixing China’s Banks, Not Russia’s 15_____________________________________________________________________________
depositors/credit cooperative members (Ben Dovlen and Anthony Kuhn, “Capitalizing China’s Farms”). The third trackis being phased-out by de-subsidization, migration of peasants to higher-wage urban areas, and industrial developmenton formed farmlands. Township and village enterprises have been displacing farms. In recent years, in addition tolegalized phase-outs, 178,000 development projects and 3,763 industrial parks formed by local governments displacedfarms in a rush of less-than-legal land deals (Jim Yardley, “China Races to Reverse Its Falling Production of Grain,” TheNew York Times , May 2, 2004, p. 6). In the process of consolidation of its productive and financial units, phase-out, andde-subsidization, the third track is converging with the second track of new-entrant enterprises such as TVEs.
31For a discussion of facts and the policy context, see Chapter 4 of From Predation to Prosperity, pp. 18-25.
32See From Predation to Prosperity, Chapter 1 and Addendum, “The Roller-Coaster of the Russian Economy.”
second track is enclosed. There is a Chinese wall of financial separation between the first and thesecond tracks. In Western market and developing economies, private banks, investmentinstitutions, and productive corporations or financial-industrial conglomerates are subject to moralhazard. They can be and are periodically bailed out because they are said to be “too big to fail.”That is, the spillover costs of their failure to the national economy (the lost of investments anddeposits and the subsequent contraction of the money stock and the economy) exceed the fiscalcosts of their bailout. The government socializes the cost of their failure and thus invites the nextfailure, which is the very nature of moral hazard.
In the Chinese second track, nothing and no one is too big to fail. Contrary to world-wideexpectations and the ire of Western investors, in 1999 China let the Guandong International Trustand Investment Corporation (GITIC), one of the largest ITICs, along with other, smaller ones, fail.Furthermore, the Chinese government abruptly shut down, without compensation of creditors, mostother insolvent investment companies which borrowed from Western lenders to finance localgovernment ventures.31 The cost of the second-track enterprises and banks joining the subsidizedfirst track and spreading the subsidy chain across the economy vastly exceeds the spillover costsof failures confined within the second track. The government forestalls the two tracks joiningtogether and forming an economy-wide network. This predatory network would have beenpowerful enough to build up trade arrears and tax non-remittance in order to extract monetizationand other self-enforceable subsidies, as in Russia.32
The Chinese wall of separation between the two tracks serves as a firewall. Second-trackcreditors are on their own to bear the costs of non-performing loans and apply risk-averse lendingto preempt them. Non-performing loans do not spread from the first track. Both nationalgovernment and the uninsured second-track investors (local governments, urban cooperativeowners-depositors, and foreign co-owners of the second-track banks), while pursuing theirdivergent, selfish, and indeed conflicting interests, implicitly cooperate to this end. Think of this asthe Chinese Invisible Hand on a two-track course.
Fixing China’s Banks, Not Russia’s 16_____________________________________________________________________________
33Central Bank of Russia, Biulleten Bankovskoi Statistiki (Bulletin of Banking Statistics), monthly, 1992-98.The last issue which published these data is no. 1 (56), 1998, pp. 54-55. The series of non-performing loans by maturitywas discontinued. This paucity is not important because non-performing loans themselves gradually dissipated in 1999-2003 to less than 3 percent of total loans by 2004, as part of the general trend of monetization of enterprise debts. See“The Roller-Coaster of the Russian Economy,” Addendum to Chapter 1 of From Predation to Prosperity.
341992-93: Central Bank of Russia, Tekushchie Tendentsii v Denezhno-Kreditnoi Sfere (Current Trends inMoney and Credit), no. 2 (April 1993), p. 13; 1993-2004: Central Bank of Russia, Biulleten Bankovskoi Statistiki (Bulletinof Banking Statistics), monthly, 1992-2004. Issues beginning with no. 2-3 (1998) are available athttp://www.cbr.ru/BBS/bank_bulletin.asp.
35Documentation is in table 1 and figures 1, 3, 4, and 7 of “The Roller-Coaster of the Russian Economy,”Addendum to Chapter 1 of From Predation to Prosperity.
36See Ibid. and Chapter 1 of From Predation to Prosperity for a detailed discussion of the tax subsidy.
Facts about Russia:
1. Between 97 and 99 percent of non-performing loans in Russia were short-term (under one year)in the 1990s.33 This is an awestruck statistic. It is sufficient to discern that, first, non-performingloans in Russia had nothing to do with credit for investment and everything to do with credit forpayments. Second, banks did not worry and did not stop lending for payments. They continuouslyrolled over delinquent short-term loans. In contrast, as table 1 attests, non-performing loans in allother economies constitute failed investment.
2. Between 80 and 95 percent of total loans in 1992-98 and 70-80 percent in 1999-2004 wereshort-term, under one year.34 Again, these loans constitute credit for payments, not for investment.Banks functioned, by and large, to recycle short-term loans which underwrite and facilitate tradecredit, not as quintessential financial creditors for investment.
3. Non-performing loans in Russia are not an independent banking phenomenon. They merelycomprise one more category of enterprise debt arrears, along with trade payment arrears, tax non-remittance, and payroll arrears. The roller coaster of non-performing loans, up from 1 percent oftotal loans in 1991 to 19 percent in 1997 and down to 3 percent in 2004, corresponds to the riseand fall of tax non-remittance and to the roller coaster of enterprise trade arrears relative to themoney stock during the same two periods.35 When trade payment arrears increased relative to themoney stock, so did tax non-remittance, payroll arrears, and non-performing loans. Whenmonetization (due to the new Central Bank policy of mandated repatriation of export revenues afterthe default of 1998) reversed this trend, payment arrears declined relative to the money stock. Taxnon-remittance, payroll arrears, and non-performing loans diminished accordingly. Non-performing loans in Russia are part of the system of the enterprise network arrears and their self-enforceable tax subsidy.36 Banks transmitted and recycled subsidized loans to the enterprise
Fixing China’s Banks, Not Russia’s 17_____________________________________________________________________________
37For an extensive discussion of a linear vs. a multi-dimensional approach to economic systems, see Chapter3 of From Predation to Prosperity, especially figure 3.3 and its accompanying exposition, and Chapter 5.
38Chapter 2 of From Predation to Prosperity, pp. 1-8 describes this evolution..
network as part of this subsidy to pay trade and tax arrears. This transmission is the basic bankingfunction in Russia.
To conclude the contrast, China’s non-performing loans are for investment, Russia’s non-performing loans are for payments. Table 1 lines up systemic differences between various types of non-performing loans. The unique feature of China’s non-performing loans is their predominant confinementto one, separate track of enterprises and banks in a multi-track economy. The unique feature of Russia’snon-performing loans is their short-term maturity and recycling as an appendage to enterprise paymentarrears.
The last two columns of table 1 raise bigger questions than non-performing loans. They addressthe core issues of financial intermediation and systemic separations of credit from payments and payments(and thus enterprises) from the monetary authority. The next section turns to them.
The Tale of Two Credits
China and Russia exemplify two vastly divergent paths in the systemic evolution of credit and paymentsafter the abolition of central planning. This section compares them. Under central planning, an automaticcredit line enforced the nexus of forced production, forced exchange, and forced delivery. This was a self-contained system, evolved and congealed over time. What new system could emerge and evolve whenthe old system is abolished? It depends on the way central planning is abolished. It is a-systemic to expecta linear progression towards a free market economy as the one and only, teleological path regardless ofa chosen direction.37
Two paths, two credits
If abolition of central planning comes through liberalization of transactions and privatization, thenation-enterprise immediately devolves into an enterprise network. This happens by default, without anycollusion on the part of enterprises.38 Throughout the inherited supply chain, liberalized seller-enterprisessend out invoices to buyer-enterprises overcharging them to the tune of expected inflation. Given the cashflow constraint, payments fall into arrears and the payment system becomes jammed. Seller-enterprisescompensate themselves for overdue receivables by not remitting to the government payroll taxes withheldfrom workers, profit taxes, and value-added taxes from the payments they receive. Enterprises thus takeover the fiscal system and bankrupt the government. To resume tax remittance, the government must

0
10
20
30
40
50
60
70
80
90
100
0
10
20
30
40
50
60
70
80
90
100
0
10
20
30
40
50
60
70
80
90
100
0
10
20
30
40
50
60
70
80
90
100
17.2
60.9
21.9
34.6
44.5
20.8
36.0
34.6
29.4
20.3
41.6
38.1
17.0
31.3
51.7
9.9
31.7
58.4
Currency Transaction Deposits Non-Transaction Deposits
1991 1997 2003 1980 1991 2003
Russia China
Notes:Currency refers to currency outside banks, the monetary aggregate M0. Transaction deposits include demand deposits and checkabledeposits. Transaction deposits = M1 - M0. Non-transaction deposits include savings and time deposits . Non-transactions deposits =M2 - M1. Monetary aggregate M2 sums up currency, transaction deposits, and non-transaction deposits.Sources:China, 1985: calculated from IMF, International Financial Statistics Yearbook 1995 (Washington: The IMF, 1995), pp. 292-295.China, 1991 and 2003, and Russia, 1997 and 2003: calculated from IMF , International Financial Statistics Yearbook 2003 (Washington:The IMF, 2003), pp. 223-224 and 500-502.Russia, 1991: calculated from national statistics.
Figure 4. RE-INTERMEDIATION OF PAYMENTS IN RUSSIA VS. SEPARATION OFCREDIT FROM PAYMENTS AND FINANCIAL INTERMEDIATION IN CHINA
AFTER CENTRAL PLANNING, SELECTED YEARS
1991 1997 2003 1985 1991 2003
Fixing China’s Banks, Not Russia’s 18_____________________________________________________________________________
39This paragraph summarizes a detailed description in Chapter 1 of From Predation to Prosperity andAddendum to Chapter 1, “The Roller-Coaster of the Russian Economy.” See evidence in figures 6, 7, and 8.
40For a detailed discussion of phasing-in the new enterprise sector and phasing-out the inherited sector across42 post-central plan economies, see Chapter 2 of From Predation to Prosperity.
monetize it. The Central Bank issues credit as a quasi-fiscal subsidy to enterprises.
The banking system serves to transmit this subsidy to enterprises and lives off this transmission.Bank credit by and large comprises transmission of this monetized subsidy. Inflationary expectations arevalidated. This feedback loop of over-invoicing, network payment arrears, tax non-remittance, and forcedCentral Bank credit (forced monetization) becomes a new financial system in its own right. Enterprises takeover the monetary system. Tax non-remittance and forced Central Bank credit sum up into a self-enforceable tax subsidy for the enterprise network.39 The predatory enterprise network emerges from thedevolution of the nation-enterprise through liberalization and privatization. Network arrears and the self-enforceable tax subsidy create economy-wide redistribution of income between enterprises and betweenenterprises, the government, and taxpaying households. Enterprise Network Socialism is born.
If the abolition of central planning comes through segregation of the economy on a multi-track path,credit is restricted on a track-specific, sector-specific, bank-specific, and enterprise-specific basis asdescribed earlier in this addendum. This multi-track approach breaks up the nation-enterprise andforestalls the enterprise network. The following discussion looks into implications of these two paths aftercentral planning for credit and investment. Figure 4 serves as background information for this comparison.The last two columns of table 1 and the juxtaposed columns of table 2 (The Table of Two Credits)summarize it.
A multi-track breakup of the nation-enterprise vs. its devolution into a network
We can now explore how payments, credit, investment, enterprise taxes and subsidies, banks, andthe monetary authority reassemble under the new economic systems in Russia and China. Different systemsevince different integrations and separations of these generic institutions. This re-assemblage marks theprocess of adaptation in the evolution of new economic systems past central planning.
To recapitulate, abolition of central planning tore apart the nation-enterprise on two layers at once.It (1) lifted forced production, forced exchange, and forced delivery and (2) deactivated their enforcing,automatic credit line. The third layer of the nation-enterprise, the inherited supply chain, remainedunderneath. This is a latent enterprise network. It was ready to activate instantaneously unless it wasdeliberately broken up, the old enterprise sector phased-out, the new enterprise sector phased-in.40
Liberalization and privatization let the inherited enterprise network loose and led to the devolution of central
Fixing China’s Banks, Not Russia’s 19_____________________________________________________________________________
41Separations of deposits from credit and currency from credit are unique. One is accustomed to think ofcurrency (and later, deposits) and credit as inseparable. They were inseparable in all economies since the monetary andcredit system of ancient Athens and the Thessalian League.
42Chapter 4 of From Predation to Prosperity discusses the financial revolution before the Industrial Revolution.
43In terms of the organizational chart, the State Bank was the penultimate monetary authority under industrialcentral planning. It made decisions on issuing credit. It did not make independent decisions on issuing currency. Underwage control and separation between credit and currency, this distinction mattered. The ultimate monetary authorityon issuing currency was the highest level of government. In the Soviet Union it was the Politburo of the Central
planning into Enterprise Network Socialism.
The automatic credit line under central planning forced enterprises to pay off trade arrears and thusforced suppliers to keep forced delivery current. This system necessitates two corollaries, the first alreadymentioned earlier and the second so extraordinary that its time to surface has arrived only now.
1. Confinement of credit to payments: Credit served the primary function of paying-off tradearrears when enterprises could not make payments from regular cash flow. Credit was enclosedto payments. What systemically followed was separation of credit from investment and fromdeposits, and hence lack of financial intermediation between households and enterprises throughthe banking system. The banking system was not a financial intermediary.
Although the automatic credit line is unique to industrial central planning, itsconsequences—confinement of credit to payment, separation of credit from investment, and lackof financial intermediation between enterprises and households—are not unique.41 For othersystemic reasons, primarily government and private confiscations of private savings and frequentrepudiation of government debt to financial entities, these features were universal before theFinancial Revolution and the Industrial Revolution in 18th century England and in all non-marketeconomies afterwards.42 It is their opposites that are novel and unique—separation of credit frompayments and integration of credit, investment, and deposits through financial intermediationbetween households and firms through the banking system. These are novel features, unique toWestern market economies, some modern developing and post-Communist economies (see themiddle, developing, cluster in figure 2), and the multi-track economy in China. These conditionsconstitute a prerequisite for the market economy.
2. Inseparability of monetary authority from payments and thus from enterprises: The automaticcredit line and confinement of credit to payments integrated the monetary authority with paymentsand enterprise cash flow, and, by extension, with enterprises as such. In the flow of funds, theautomatic credit line for paying off trade arrears was the direct monetary pipeline from the StateBank as a monetary authority through its branches to enterprises.43 Inseparability of monetary
Fixing China’s Banks, Not Russia’s 20_____________________________________________________________________________
Committee of the Communist Party which issued the document called “the emission directive.” It authorized currencyissuance by the State Bank and set money printing targets and limits for each period of time. In Nazi Germany, theReichsbank issued credit and printed currency, and had, under the presidency of Hjalmar Schacht in 1993-39, somecurrency discretion but the currency directive came from the Ministry of Finance and, ultimately, from theReichschancellor. Notice the following contrast. Schacht held dual positions of Commissioner of Currency andPresident of the Reichsbank in 1923-30, that is, before Nazi central planning and before separation between currency andcredit. After that, he held dual positions of President of the Reichsbank and either Minister of Economics orPlenipotentiary General for the War Economy in 1933-37 (Minister without Portfolio until 1943). He lost the Reichsbankpresidency in 1939 for trying to restrain the automatic credit line. He urged tightening of government credit and cautioususe of foreign exchange reserves, both to no avail, and in 1938 discontinued discounting short-term Reichsbank notesfor armament expenditures and in 1939 defied the directive of the Ministry of Finance on issuing credit for additionalgovernment salaries and contracts. See, e.g., John Weitz, Hitler’s Banker: Hjalmar Horace Greeley Schacht (Boston:Little, Brown, 1997).
44This characteristic applies to both multi-industry central planning in modern economies and to mono-industrial central planning in their historical antecedents such as Egypt under Muhammad Ali in 1805-1849. See Chapter5, Section A of From Predation to Prosperity, p. 11.
45Masahiko Aoki and Hugh Patrick, eds., The Japanese Main Bank System: Its relevance for Developing andTransforming Economies (Oxford and New York: Oxford University Press, 1994).
authority from payments, enterprise cash flow, and enterprises is a novel and unique systemicfeature of industrial central planning.44
Independence of the monetary authority from the fiscal authority and other government mandateshas been a major systemic issue in many economies. For example, to mark their separation,establishment of the independent central bank in Italy in 1947 was called “divorce.” Fundingdirected government investment under industrial policy in Japan and elsewhere after World WarII, in addition to financing and monetizing government debt, can be viewed as an extension ofinseparable fiscal and monetary systems. In Japan in the 1950s-1970s, the monetary authorityfunded the banking system (specifically the “main bank” of each keiretsu) for directed investmentprovided to firms as a matter of industrial policy.45 None of these systemic arrangements involvedan automatic credit line from the monetary authority to finance enterprise payments. Either throughthe fiscal authority or through the banks within an industrial conglomerate, the monetary authoritywas separated from payments and enterprises. Central planning built-in the inseparability of themonetary authority from payments and enterprises for its own enforcement—to enforce forcedproduction, forced exchange, and forced delivery. The column next to last in table 1 contrasts thisfeature across economic systems and cases.
When the monetary authority is separate from payments and enterprises, it can conduct monetarypolicy subject to fiscal mandates and conditions. When the monetary authority is inseparable frompayments and enterprises, it cannot conduct monetary policy by itself. Enterprises effectively runmonetary policy to one or another extent. This means that money as the store of value for
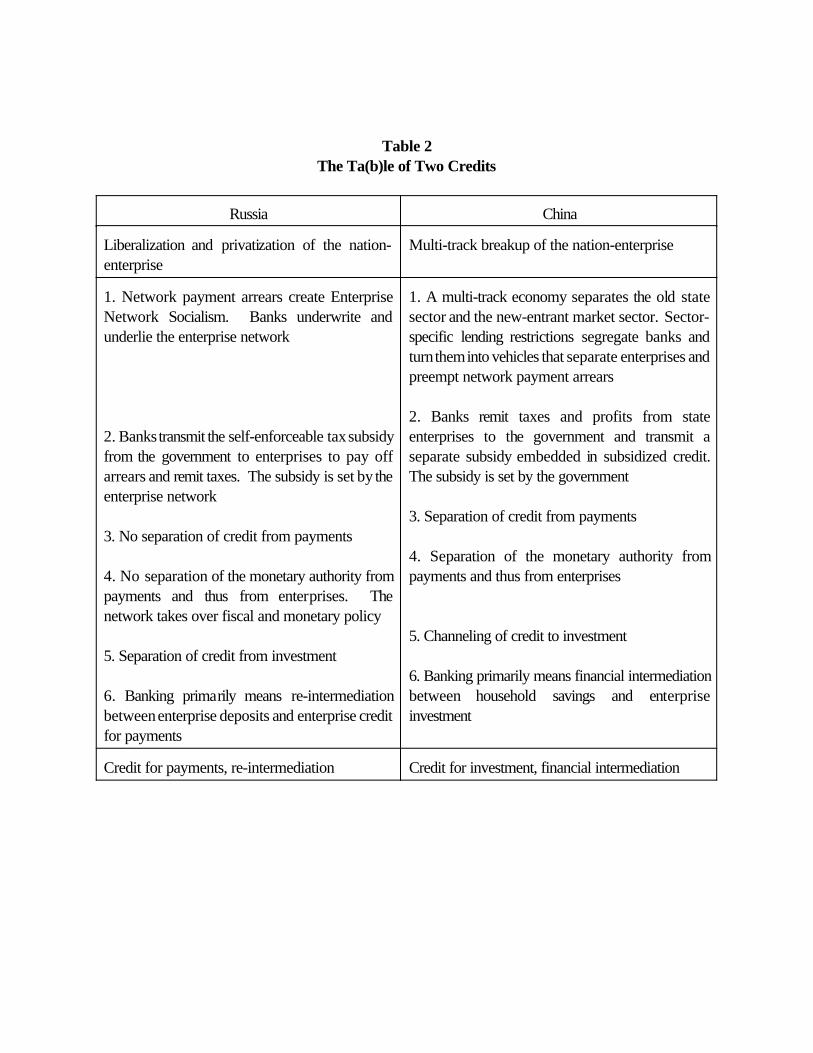
Table 2The Ta(b)le of Two Credits
Russia China
Liberalization and privatization of the nation-enterprise
Multi-track breakup of the nation-enterprise
1. Network payment arrears create EnterpriseNetwork Socialism. Banks underwrite andunderlie the enterprise network
2. Banks transmit the self-enforceable tax subsidyfrom the government to enterprises to pay offarrears and remit taxes. The subsidy is set by theenterprise network
3. No separation of credit from payments
4. No separation of the monetary authority frompayments and thus from enterprises. Thenetwork takes over fiscal and monetary policy
5. Separation of credit from investment
6. Banking primarily means re-intermediationbetween enterprise deposits and enterprise creditfor payments
1. A multi-track economy separates the old statesector and the new-entrant market sector. Sector-specific lending restrictions segregate banks andturn them into vehicles that separate enterprises andpreempt network payment arrears
2. Banks remit taxes and profits from stateenterprises to the government and transmit aseparate subsidy embedded in subsidized credit.The subsidy is set by the government
3. Separation of credit from payments
4. Separation of the monetary authority frompayments and thus from enterprises
5. Channeling of credit to investment
6. Banking primarily means financial intermediationbetween household savings and enterpriseinvestment
Credit for payments, re-intermediation Credit for investment, financial intermediation
Fixing China’s Banks, Not Russia’s 21_____________________________________________________________________________
46See documentation and discussion in Chapter 1 of From Predation to Prosperity and “The Roller-Coasterof the Russian Economy,” especially figures 6, 7, and 8. For an early notice of this process, see David Malpass, “TheMan Who’s Saving China from Soviet-Style Disaster,” The Wall Street Journal, July 29, 1993, p. A11. In Canto XXXof Inferno, Dante treats debasement of money as counterfeiting. Master Adam of Brescia was “coining florins, // Whichhad three carats of impurity.” “There is Romena, where I counterfeited // The currency imprinted with the Baptist, // Forwhich I left my body burned alive.” And recollect where Dante meets him.
47Various hybrids developed in between, in Poland and elsewhere. Additional paths were possible after theabolition of central planning. For example, the government can sequester enterprise receivables in arrears every month-and-a-half or two months on a consignment basis, dispose of them through factoring agencies which mark them tomarket, and remit the proceeds to creditor enterprises. Soon, enterprises will start operating as separate unitsdisconnected from a network of enterprises and arrears. They will sell output in quantities and at prices that buyers willpay in full and on time. This procedure will also work as a national auction settling the producer price level and quashinginflationary expectations. Marking trade arrears to market will mark the beginning of a market economy. The nation-enterprise will evolve into a nation of enterprises, a value-added chain of separate firms. This path is still possible,indeed necessary in Russia to shift it towards a market economy.
48See Gregory C. Chow, China’s Economic Transformation; Lawrence J. Lau, Yingui Qian, and Gerald Roland,“Reform Without Losers: An Interpretation of China’s Dual-Track Approach to Transition,” Journal of PoliticalEconomy 108, no. 1 (February 2000): 120-143; and Yuanzheng Cao, Yingui Qian, and Barry R. Weingast, “FromFederalism, Chinese Style, to Privatization, Chinese Style,” Economics of Transition 7, no. 1 (February 1999): 103-131.
individuals can be debased not only by the government and banks but also by non-financialenterprises. This feature potentially opens the door to collective counterfeiting. Wage control andseparation between currency and credit under central planning constrained this outcome. In Russia,liberalization and privatization of the latent enterprise network unleashed collective counterfeitingby enterprises.46
Abolition of central planning deactivated its enforcing, automatic credit line. This set off the chainsof financial separations and integrations in a systemic progression. Two opposite evolutions followed. Onepursued a multi-track breakup of the nation-enterprise into a restricted market economy with the newentrants in China. Another turned into a socialist devolution of the nation-enterprise via liberalization andprivatization in Russia.47
First, the chain of financial separations and integrations in China. They unwind how a multi-trackapproach forestalls the enterprise network from both sides. The government doesn’t let it be andenterprises—both old, state enterprises and the new-entrant market enterprises such as TVEs—don’t wantit to be. The nation-enterprise breaks up into a nation of enterprises.
1. The government breaks up the nation-enterprise across the seams of production, taxes, subsidies,and finance. This breakup is track-specific, sector-specific, region-specific, locality-specific,48 and,ultimately, enterprise-specific. The government sets restrictions on lending and non-lending specificto tracks, sectors, banks, and, by extension, enterprises. (a) Within the first track, the four big
Fixing China’s Banks, Not Russia’s 22_____________________________________________________________________________
state banks can lend only to the inherited state enterprises of the first track. Loans carry subsidiesby the virtue of being guaranteed and carry restrictions imposed by credit ceilings. Constrainedsubsidies pit enterprises in rivalry against one another and state enterprises as a whole against othertracks. This financial separation and the cap imposed by credit ceilings blocks any opportunity forenterprises to extract an open-ended monetary (quasi-fiscal) subsidy from the central bank forpaying off trade arrears and for remitting taxes, to enforce monetization of enterprise debts. Banksof the first track cannot act as the agents of networking enterprises and must and do act as theagents of the government. (b) Banks of the first track cannot lend to the new-entrant enterprisesof the second track, such as township and village enterprises of local governments, cooperativeenterprises, joint ventures, foreign ventures, and private firms. The second-track enterprises haveto rely on self-finance and/or uninsured commercial banks and non-banks of the second track suchas ITICs, urban cooperative banks, credit unions, and the 11 joint-stock banks. All the second-track financial institutions and their owners, especially local governments, cannot support any riskyattempt of any enterprises on their track to join a potential network of trade arrears and forcedgovernment subsidies. Here every enterprise is for itself to live or to die.
Restrictions and incentives work together. An enterprise network is blocked on both sides. (1)The government does not allow it and (2) enterprises, both old and new (and local governmentbehind the latter), have no incentives to participate in the network, and the banks seal its fate. Stateenterprises of the first track have both restrictions and incentives against acting as a network. Theyearn individual profits and receive individual subsidies. They furthermore have no incentives tocoopt the new-entrant enterprises into a network. The latter would mean extending trade creditwhich would fall into arrears. But, unlike Russia, these arrears will not be accommodated by thegovernment through the banking system. Tolerating arrears sans a compensatory, self-enforceablesubsidy ensues that state enterprises would provide free inputs to the new-entrants—a self-defeating proposition. This disincentive against forming the network symmetrically constrains thesecond-track enterprises. The new-entrant enterprises of the second track have both restrictionsand incentives against conjoining a latent network. Local government owners of township andvillage enterprises and other owners of market new entrants on the second track do not allow theirenterprises to build up payment arrears and risk cash flow shortfalls and potential bankruptcy.Banks can extend credit for investment only, not for overdue payments and subsidy extraction.
The banking system on all tracks can neither accord nor afford to serve as a subsidy transmissionfrom the monetary authority to enterprises. This conjunction of restrictions and incentives rendersthe network dead on arrival.
2. State banks of the first track act as the agents of the government and enforce tax remittance andprofit remittance on the part of state enterprises. Symmetric state ownership of banks andenterprises serves a systemic function of preventive custody against the latent network. Inheritedstate enterprises cannot initiate tax non-remittance as a means for extracting fiscal and quasi-fiscal
Fixing China’s Banks, Not Russia’s 23_____________________________________________________________________________
49The best known factor was the Count of Monte Cristo. Modern factoring agencies make money, not revenge.
(monetary) subsidy. Then they are not interested in overcharging invoices and building up paymentarrears. Network arrears do not emerge. The network is not born out of physical and juridicalremnants of central planning by inherited enterprises.
Absence of network arrears and the presence of credit ceilings lead to downsizing of those oldenterprises that do not reform to meet emerging market conditions. The breakup of agriculturalcommunes into individual farms with tenure rights on state-owned land pares off a large bloc fromthe inherited state sector. Lack of restrictions apart from restricted lending, controlled liberalization(this is not an oxymoron) phases-in the new-entrant enterprises on the second track. Phasing-innew enterprises and downsizing old, state enterprises automatically phases out the old enterprisesector. This is the evolutionary dynamics of the multi-track economy. This process hastransformed the nation-enterprise into a nation of separate enterprises bypassing the network.
3. Separation of credit from payments follows from the above. On the side of borrowers, when thewindows of tax non-remittance and monetization of trade and tax arrears are closed, enterprisescannot sustain payment arrears and build up their network. On the side of lenders, banks facedisincentives to issue credit for payments, save under political duress. Credit for payments ensueshigh transaction costs and prohibitively high risks of default. Enterprises continuously borrowingfor payments exhibit cash flow deficits. They are illiquid and—unless their network forcesmonetization by the central bank through banks to enterprises for paying off arrears—hover on theverge of technical bankruptcy. Bankrupt enterprises can pull down banks along with them intobankruptcy. This is why Western financial markets developed a special facility for factoringreceivables (purchasing them at discount, advancing cash to enterprises, and collecting fromdelinquent payers), which is separate from quintessential banking.49 A multi-track economy erectsadditional lines of separation. On the first track, credit ceilings not only bloc any emergence of anopen-ended credit for payments forced by the enterprise network, but also create trade-offsbetween payments and investment in allocation of credit. Under credit ceilings, both stateenterprises and state banks choose credit for investment. On the second track, local governments,depositors of credit unions, foreign ventures, and other owners cannot allow their uninsured banksto engage in risky lending for payments. They are free to lend by the virtue of being free to fail.Moreover, their very raison d’etre is to finance specific investment projects established by theirowners and co-owners, especially local governments and township and village enterprises. Thisis why the second-track banks replaced self-financing of TVEs and other second-track enterprises.
4. Separation of the monetary authority from payments follows from the above. State banks of thefirst track have neither a mandate (like under central planning) nor incentives (like under EnterpriseNetwork Socialism) to provide credit for payments to enterprises. All banks of both tracks—state
Fixing China’s Banks, Not Russia’s 24_____________________________________________________________________________
banks of the first track and various commercial banks and credit unions of the second track—haveno opportunity to transmit central bank credit to enterprises for payments of trade arrears andremittance of taxes. In the absence of network arrears and, hence, in the absence of tax non-remittance, the central bank is not forced to monetize enterprise debts and gives banks no facilityto transmit this monetary subsidy. This combination (no mandate, no incentives, no opportunity,and no facility) separates the monetary authority from enterprise payments. This evolution marksa fundamental separation of the monetary authority from enterprises.
5. Integration of credit and investment follows from the chain of separations unwound in the precedingparagraphs. The first-track banks have both a government mandate and incentives to channelcredit to investment. The second-track banks have incentives exclusively to issue credit forinvestment. The third-track banks, rural credit cooperatives, follow suit, and their forthcomingconsolidation will only reinforce this adaptation. Incentives for credit for investment are a mirror-image of disincentives for credit for payments in paragraph 3. Lending for payments carriesprohibitive risks and high transaction costs. Lending for investment carries manageable risks andtransaction costs. In the absence of a systemic mandate for credit for payments under centralplanning and a systemic, self-enforceable subsidy for credit for payments under EnterpriseNetwork Socialism, banks adapt and their incentives evolve to channel credit to investment. Bankscannot live off subsidy transmission and recycling of enterprise deposits through loans for payments.They can make profit by making credit into profitable investment. China’s banks of all three tracksfunction in the same vein as deposit money banks in Western market economies since the FinancialRevolution in England in the 18th century: they issue credit for investment.
Second, the chain of financial separations and integrations in Russia. It evolved in the directionopposite to China’s. The nation-enterprise transformed into an enterprise network. Fiscal and monetaryauthority was devolved to the enterprise network and its enforcing banks. The following points recapitulatean earlier discussion.
1. The enterprise network was ready-made. Enterprises as inherited units of the nation-enterpriseimmediately adapted to liberalization of transactions by overcharging invoices, building up paymentarrears, non-remitting taxes, and forcing subsequent monetization. Privatization of enterprisessealed this process. Banks became vehicles of transmission of quasi-fiscal subsidy from themonetary authority to enterprises. Banks help enterprises to enforce the tax subsidy determinedby the enterprise network through accumulation of arrears and tax non-remittance. Banks act asthe collective agent of the enterprise network.
2. The difference between the newly spawned commercial banks and deactivated branches of thedefunct State Bank is that banks do not have to enforce tax remittance by enterprises. Throughnon-remittance of taxes collected from workers and consumers, the enterprise network took overthe fiscal authority. Banks took passive part in this takeover by forfeiting tax remittance and active
Fixing China’s Banks, Not Russia’s 25_____________________________________________________________________________
50Saving is unique to the evolution of human species. Humans exhibit variable productivity of resources and,as a consequence, variable life expectancy. See Michael S. Bernstam, The Wealth of Nations and the Environment. Allmotivations for saving follow from this premise. An incomplete list of motivations includes (1) “to build up a reserveagainst unforseen contingencies” (the precautionary motive); (2) “to provide for an anticipated future relationshipbetween the income and the needs of the individual” (the life-cycle motive); (3) “to enjoy interest and appreciation” (theintertemporal substitution motive); (4) “to enjoy a gradually increasing expenditure” (the improvement motive); (5) “toenjoy a sense of independence and the power to do things” (the independence motive); (6) to secure a masse demanoeuvre to carry out speculative or business projects” (the enterprise motive); (7) “to bequeath a fortune” (thebequest motive); (8) “to satisfy pure miserliness” (the avarice motive); and (9) to accumulate deposits to buy houses,cars, and other durables (the downpayment motive). Martin Browning and Annamaria Lusardi, “Household Saving:Micro Theories and Micro Facts,” Journal of Economic Literature 34, no. 4 (December 1996): 1797-1855, the list is onp. 1797; the nomenclature in quotation marks reproduces the formulae of John Maynard Keynes, The General Theoryof Employment, Interest and Money (London: MacMillan, 1936).
part by re-intermediating non-remitted taxes in enterprise deposits as loans to other enterprises.
3. Banking transmission of monetary subsidy for the purposes of tax remittance and paying off arrearskept credit inseparable from payments. As we cited the evidence earlier, 80 to 95 percent of totalloans in 1992-98 and 70-80 percent in 1999-2004 were short-term loans for payments,continuously recycled.
4. It follows that non-separation of the monetary authority from payments and, ultimately, fromenterprises remained intact.
5. Confinement of credit to payments left investment to self-financing. Investment is not connectedto payment arrears and tax non-remittance and thus does not influence the quasi-fiscal (monetary)forced onto the monetary authority and transmitted through the banking system. Banks are notinterested in issuing credit for investment, which is a riskier and less rewarding proposition thantransmitting the central bank subsidy and re-intermediating between enterprise deposits andpayments. This leaves investment to self-finance by enterprises. Inseparability of credit frompayments separates credit from investment.
The first five propositions in table 2 summarize these contrasting chains of separations andintegrations in China and Russia. The last two columns of table 1 incorporate them to complete a historicaland cross-national comparison of banking systems. The next section moves to proposition 6 in table 2—tothe system-defining and epochal question of financial intermediation in banking or lack of thereof.
Financial intermediation in China vs. re-intermediation in Russia
There is always saving50 and there is always investment but investment does not necessarily createproductive capital. Investment may be channeled into consumption infrastructure, such as pyramids,
Fixing China’s Banks, Not Russia’s 26_____________________________________________________________________________
51“I wonder whether undue attention has not been given to the magnitude of the savings ratio at the expenseof the form that savings take. Savings may well have been at least as large a fraction of income in the Middle Ages asin modern times; they then in considerable measure, perhaps in major part, took the form of cathedrals, which, howeverproductive of ultimate satisfaction and of social security in more than one sense of that term, were not productive ofworldly goods. I understand that budget studies for India, which at first sight seem to give very different results fromcorresponding studies for the United States, are found largely to duplicate the latter if the category ‘ornaments’ isinterpreted as savings or, in the jargon of budget studies, as ‘net changes in assets and liabilities.’ The East was for longregarded as a ‘sink’ for the precious metals, surely evidence both of substantial savings and of the particular form thatit took. Perhaps the crucial role that has been assigned to the savings ratio in economic development should be assignedinstead to the factors determining the form in which wealth is accumulated: to the investment rather than savingsprocess, as it were.” Milton Friedman, A Theory of the Consumption Function (Princeton, N.J.: Princeton UniversityPress, 1957), p. 236.
52Milton Friedman, “The Quantity Theory of Money—A Restatement,” in Milton Friedman, ed., Studies in theQuantity Theory of Money (Chicago: University of Chicago Press, 1956), p. 14.
palaces, and cathedrals51, or in foreign exchange and assets abroad as has been Russia’s trend. In thelatter case investment is reclassified as capital outflow and enters national accounts as net exports.
Under central planning, the government controlled and confiscated household saving throughsuppressed wages, suppressed agricultural procurement prices, and forced subscription to bonds. Forcedsaving was channeled to investment by the government directly, bypassing financial intermediation.Additional, voluntary saving (including temporal saving for sporadic purchases of goods in short supply andhigh saving for durables in the absence of consumer credit) was pooled by the state banking system forgovernment use in investment. This was a contract between households and the government, not financialintermediation between households and enterprises. These systemic fixtures complement separations ofcredit from investment, deposits from credit, and credit from currency, which we dissected above.Exceptionally high rates of saving forced or induced under central planning were behind high rates ofinvestment in productive and human capital. They explain the success of central planning in industrializationfor several decades, until diminishing returns to capital without incentives for technological innovationretarded economic growth.
In the market economy, the nexus of household saving and banking credit for investment leads tocapital formation. Milton Friedman summarizes this systemic link:
“Banks [are] producers of money (...) The existence of banks enables productiveenterprises to acquire money balances without raising capital from ultimate wealth-owners[the households]. Instead of selling claims (bonds or equities) to them, it [the enterprise] cansell its claims to banks, getting money in exchange: in the phrase that was once so commonin textbooks on money, the bank coins specific liabilities into generally acceptableliabilities.”52
Fixing China’s Banks, Not Russia’s 27_____________________________________________________________________________
53For clarity and sharp distinction, specialists call the money created by deposit money banks “inside money,”as opposed to “outside money,” such as currency and specie printed and minted by the government or the central bank.Outside money forms the monetary base, which sums up currency outside banks and reserves held by the bankingsystem with the central bank. The money multiplier acquires a literal meaning. It indicates the multiplier of moneycreation by the banking system, the ratio of the total money stock (the sum of inside money and outside money) to thestock of outside money.
54Calculated from IMF, International Financial Statistics Yearbook 1995 (Washington: The IMF, 1995), pp.292-295; IMF, International Financial Statistics Yearbook 2003 (Washington: The IMF, 2003), pp. 223-224. The earliestdata on deposits by maturity and the composition of the money stock in these series are for 1985.
55Calculated from China Ministry of Finance, Finance Year Book of China 2002 (Beijing: Zhongguo Cai ZhengZa Zhi She, 2002), p. 468; and National Bureau of Statistics of China, China Statistical Yearbook 2003 (Beijing: ChinaStatistics Press, 2003), p. 705.
56Due to high reserve requirements and especially semi-voluntary excess reserves held by banks with thecentral bank—which is a prudent restriction in view of non-performing loans of the first-track banks and uninsured
Financial intermediation allocates household savings deposited with the banks to the mostproductive enterprise investment, creating money in the process.53 This allocation of capital derived fromsaving is the ultimate function of banking in the market economy.
China has been rapidly converging with the financial system of Western market economies.
• Total deposits denominated in national currency increased from 33 percent of the value of GDPin 1985 to 67 percent in 1991 to 100 percent in 1997 to 146 percent in 2002.54 This pattern offinancial deepening is the source of expansion of loanable funds documented in figure 3.
• Household deposits have become a growing proportion of total deposits. In 2002, about two-thirds of total deposits were household deposits such as “urban and rural saving deposits,”“agricultural deposits,” “trusted deposits,” etc., and only one-third were enterprise deposits.55
• Deposits as a proportion of the money stock M2 increased from 80 percent in 1985, and probablyless before that, to 90 percent in 2003. Figure 4 shows the trend in decomposition of monetaryaggregates in selected years after 1985, the first year for which these data are available. Thisseemingly modest change is profound. It indicates vigorous money creation by the banking systemin the process of financial intermediation between household saving and enterprise investment. Toput the data in reverse, the proportion of money created by the Central Bank in the money stockdeclined by half from 20 percent in 1985 to 10 percent in 2003. Figure 4 yields that the ratio ofthe monetary aggregate M2 to currency (the aggregate M0) doubled from five to ten. It reachedthe magnitude of the most advanced Western market economies. The implied money multiplier,the ratio of M2 to the monetary base (currency outside banks plus reserves, which sum up to themoney printed by the central bank), increased accordingly.56 By any measure, the relative share
Fixing China’s Banks, Not Russia’s 28_____________________________________________________________________________
deposits of the second-track banks—the ratio of M2 to the monetary base (money issued by the central bank) was about5 in 2004. See IMF, International Financial Statistics May 2004 (Washington: The IMF, 2004), pp. 276-277. In the U.S.,given low reserve requirements and low excess reserves, the ratio of M2 to the monetary base in 2004 stood at 8.3 andthe ratio of the monetary aggregate M3 to the monetary base reached 12.0. See Federal Reserve Board, tables H.3 (502)a n d H . 6 ( 5 0 8 ) a t h t t p : / / w w w . f e d e r a l r e s e r v e . g o v / r e l e a s e s / h 3 / C u r r e n t / a n dhttp://www.federalreserve.gov/releases/h6/Current/.
57Finance Year Book of China 2002 , p. 463. One reason why non-transaction deposits declined in the lastdecade might have been the broadening of the deposit base with the rise of the second-track banks, which carry nodeposit insurance. Their depositors may prefer transaction deposits (“current deposits” in the Chinese vernacular,corresponding to demand deposits and checkable deposits).
58Calculated from The Federal Reserve Board, “Assets and Liabilities of Commercial Banks in the United States,”May 7, 2004, at http://www.federalreserve.gov/releases/h8/Current/ .
59Calculated from IMF, International Financial Statistics Yearbook 2003, pp. 500-502, except the data for 1991derived from national statistics. For more detailed annual data and sources, see Fixing Russia’s Banks, p. 35, figure 5.
60Derived from Central Bank of Russia, Biulleten Bankovskoi Statistiki (Bulletin of Banking Statistics),monthly, 1992-2004. For the latest data series, see no. 4 (2004), pp. 39, 89 at http://www.cbr.ru/BBS/BBs0404r.pdf .
of money creation by the banking system in the process of financial intermediation doubled in 20years. Figure 4 demonstrates this systemic evolution.
• Non-transaction deposits (“fixed deposits,” in the Chinese vernacular), such as savings and timedeposits, increased as a ratio of total deposits in national currency from 61 percent in 1978 to 70percent in 2001. They actually stood at 83 percent of total deposits in 1990.57 For a comparison,in the U.S. in 2004, 87 percent of total deposits were non-transaction deposits.58 Figure 4 showsthat the share of non-transaction deposits in the monetary aggregate M2 in 2003 in China, 58percent, was twice as high as Russia’s 29 percent. Non-transaction deposits, which underwritethe core of long-term investment, dominate the money stock and banking activity in China.
Russia moved in the opposite direction. It forfeited financial intermediation between householdsaving and productive investment through the banking system.
• Total deposits denominated in national currency collapsed from 55 percent in relation to GDP in1991 to 10 percent in 1993-1997 and then recovered slightly to 12 percent in 200259 and 15percent in 2004. This is another mind-boggling statistic, which becomes grotesque when comparedwith the 146 percent ratio of total deposits to GDP in 2002 in China.
• Household deposits declined from 63 percent of total deposits in 1990 to 15 percent in 1992.Household deposits partially recovered their share and held steady at about 50 percent of totaldeposits from 1994 to 2004.60 Enterprise deposits made up another 50 percent of total deposits
Fixing China’s Banks, Not Russia’s 29_____________________________________________________________________________
61Calculated from IMF, International Financial Statistics Yearbook 2003, p. 500, except the data for 1991derived from national statistics.
62IMF, International Financial Statistics Yearbook 1995, p. 292.
63Central Bank of Russia, Biulleten Bankovskoi Statistiki (Bulletin of Banking Statistics), no. 4 (2004), p. 16.
64Ibid., p. 89.
since the mid-1990s. Thus household deposits make up a paltry 8 percent of GDP.
• The central bank rather than banks invariably dominated money creation in Russia in 1991-2003.Figure 4 shows that the proportion of currency in the money stock M2 doubled in the 1990s from17 to 35 percent and continued to increase in the 2000s. The proportion of deposits declined from83 percent in 1991 to 64 percent of the money stock in 2003. The ratio of M2 to M0 fell fromalmost six in 1991 to 2.8 in 2003, that is, more than halved. The implied money multiplier of M2to the monetary base declined accordingly. This signifies the collapse of money creation by thebanking system.
• Non-transaction deposits such as savings and time deposits staggered from 25 percent percentof total deposits denominated in national currency in 1991 and 22 percent in 1992 to 52 percentin 1997 to 32 percent in 1998 to 47 percent in 2003.61 Except for 1997, the majority of depositswere transaction deposits, primarily demand deposits. Figure 4 shows that in 2003 the share ofnon-transaction deposits in the money stock M2—investment-ready deposits, as it were—wastwice as high in China (58 percent) as in Russia (29 percent). Ironically, on this score Russiaended in 2003 where China started in 1978 when it abolished central planning. In 1978, thefraction of non-transaction deposits in M2 in China stood at 32 percent.62 This backwardcomparison corresponds to the finding in figure 3 that the overall ratio of broad money (standingfor loanable funds) to GDP in Russia in 2004, slightly under 30 percent, is at the level from whichChina took off in 1979-80.
• The low demand for deposits underlies financial shallowing in Russia depicted in figures 2 and 3as the high demand for deposits underlies financial deepening in China. Russian saving found analternative channel. Russian households hoard foreign currency, primarily dollars, outside of thebanking system. Retail trade in foreign exchange makes up banks’ major activity and profits. Itis impossible to estimate foreign exchange cash balances but it is possible to evaluate their orderof magnitude relative to household deposits with the banks. Recent time series of the Central Bankof Russia evaluate net capital outflow by enterprises and households during 1994-2003 as $168.3billion.63 Household deposits with the banking system stood in 2004 at R1,075 billion,64 which isequivalent to $37 billion at the current exchange rate. If any amount greater than 22 percent of thenet capital outflow of the last decade is held by households in foreign cash balances (that is, if up
Fixing China’s Banks, Not Russia’s 30_____________________________________________________________________________
65Calculated from national statistics for 1991-92; for 1993-2004, see IMF, International Financial StatisticsYearbook 2003, p. 500 and IMF, International Financial Statistics May 2004, p. 276. The difficulty in comparing thisindicator between China and Russia concerns inclusion of foreign exchange deposits in fractional reserve requirementsin Russia after the default of August 1998 but not before that and not in China. This is an unusual but prudential policyof the Central Bank of Russia. It is concerned with potential illiquidity of Russian banks not only on domestic currencybut also on foreign policy account, given overexposure of Russia’s banking system to foreign exchange contracts underexchange rate volatility.
to 78 percent of the new capital outflow purchased real and financial assets abroad), Russianhouseholds trust the Federal Reserve more than they trust Russia’s banking system. Their hedgeis prudent. Two devastating defaults of the banking system on the real value of deposits within onedecade, in 1992 and 1998, precipitated by fiscal defaults, reveal systemic failure and the inherentserial nature of defaults. Deposit insurance can guarantee nominal, not real (inflation-adjusted)value of deposits. Russian savers collectively know, and reveal in their asset allocating preferences,that what we said about Russia’s banking system is consistent with the facts. It does notintermediate and households do not trust it to intermediate, which forms a feedback loop.
• These facts and figure 4 unveil the nature of banking in Russia. In accordance with the low demandfor deposits in Russia, figure 4 implies that the money multiplier, the ratio of the money stock M2to the monetary base printed by the central bank, is systematically low. This multiplier fell fromabout 5 in 1991 to about 3 in mid-1992 and hovered under or around 2 in 1993-2004.65 Thisseemingly obscure technical indicator points to a systemic feature. It shows that the demand fordeposits in this system is the technical demand for the volume necessary to make payments. Notonly enterprises but also households hold deposits in national currency with the banking systemprimarily in order to make payments such as rent for municipal housing, condominium fees (whichin Russia are on par with subsidized municipal rent), and utilities. Credit for payments matchesdeposits for payments, and vice versa, both quantitatively and in the nature of the system.
A persistent money multiplier around 2 indicates that banks chiefly recycle payments by connectingdeposits kept for payments with credit for payments. The central bank monetizes the enterprisenetwork subsidy for paying off trade arrears and remitting taxes. Banks transmit monetized loansby adding to enterprise deposits, make payments, and re-deposit payment amounts less currencywithdrawn. If little else happens in the banking activity, the resulting multiplier, after monetarysubsidy transmission, depositing, re-depositing, meeting reserve requirements, and cashwithdrawals, would spin around twofold of the monetary base printed by the central bank. Themoney multiplier hovering around two in the ratio of M2 to the monetary base over a long periodof time is (1) a subtle, or perhaps not so subtle, indicator of this subsidy transmission to theenterprise network in arrears. (2) It also indicates that what follows this subsidy transmission is re-intermediation between payers and payees, both enterprises and households, but primarilyenterprises. This is re-intermediation between payers and payees who continuously trade placesand, in the case of enterprises, are both depositors and borrowers—in short, re-intermediation
Fixing China’s Banks, Not Russia’s 31_____________________________________________________________________________
66W. B. Yeats, “Sailing to Byzantium.”
67For a broad treatment, see Peter G.M. Dickson, The Financial Revolution in England: A Study in theDevelopment of Public Credit, 1688-1756 (London: Macmillan and New York: St. Martin’s Press, 1967); HenryRoseveare, The Financial Revolution, 1660-1760 (London: Longman, 1991); Stephen Quinn, “The Glorious Revolutionof 1688” (2003), EH.Net Encyclopedia, at http://eh.net/encyclopedia/quinn.revolution.1688.php , and Chapter 4 of FromPredation to Prosperity.
68Frequent debasement testifies to the fact that gold coinage and other metallic specie constituted a technicallimit to economic development before the invention of deposit money banking. An increase of production on the supplyside due to trade expansion, e.g., in Byzantine in the 11th century and in Venice, Genoa, and the rest of Europe thereafter,led to an increase of transactions on the demand side, which, in turn, for the lack of other options, chipped in currencydebasement. But debasement eventually limits, not expands, transactions. This is a negative feedback loop. Continuouswars for resources, which accompanied European-cum-global trade before the rise of domestic production and resourceefficiency during the industrial era, also fueled currency debasement. See an account in Costas Kaplanis, “TheDebasement of the ‘Dollar of the Middle Ages’,” The Journal of Economic History 63, no. 3 (September 2003): 768-801.Mercantilism, like every economic species, was an end, not a stage. Only the breakup of merchant and trade guilds andthe invention of free banking (printing private monies) as an early type of deposit money banking broke out of the abovetechnical limit to the road to financial and industrial expansion. For a discussion of institutional evolution of money andbanking, see Milton Friedman and Anna J. Schwartz, “Has Government Any Role in Money,” Journal of MonetaryEconomics 17, no.1 (January 1986): 37-62.
between payments. This is not financial intermediation, not capital formation, not allocation ofcapital, but only recycling of the government subsidy.
Two different banking systems arise from these comparisons and from figure 4. China’s banks areengaged in investment, financial intermediation, and extensive money creation. Russia’s banks are engagedin credit for payments, re-intermediation between payers and payees, primarily between enterprises, andin transmission of the Central Bank monetary subsidy instead of money creation. The sixth line-item andthe bottom line in table 2 summarize this stark contrast.
“Of what is past, and passing, and to come”66
One little-noticed systemic invention of the Financial Revolution in England in 1688-1756 was theseparation of credit from payments. It marked the rise of financial intermediation through the system ofdeposit money banks, which guided credit to investment in productive assets.67 Financial markets, throughbank and non-bank intermediaries, created impersonal investment pools. Financial depth expandedinvestment from agricultural (e.g., land and livestock) and trade assets (e.g., vessels and colonialplantations) to capital stock. Thus Europe crossed the bridge from the Commercial Revolution to theIndustrial Revolution.
In instrumental terms, one can think of the leap from gold coins and bills of exchange to moneycreated by the banking system, along with stocks and private bonds operated by non-bank intermediaries.68
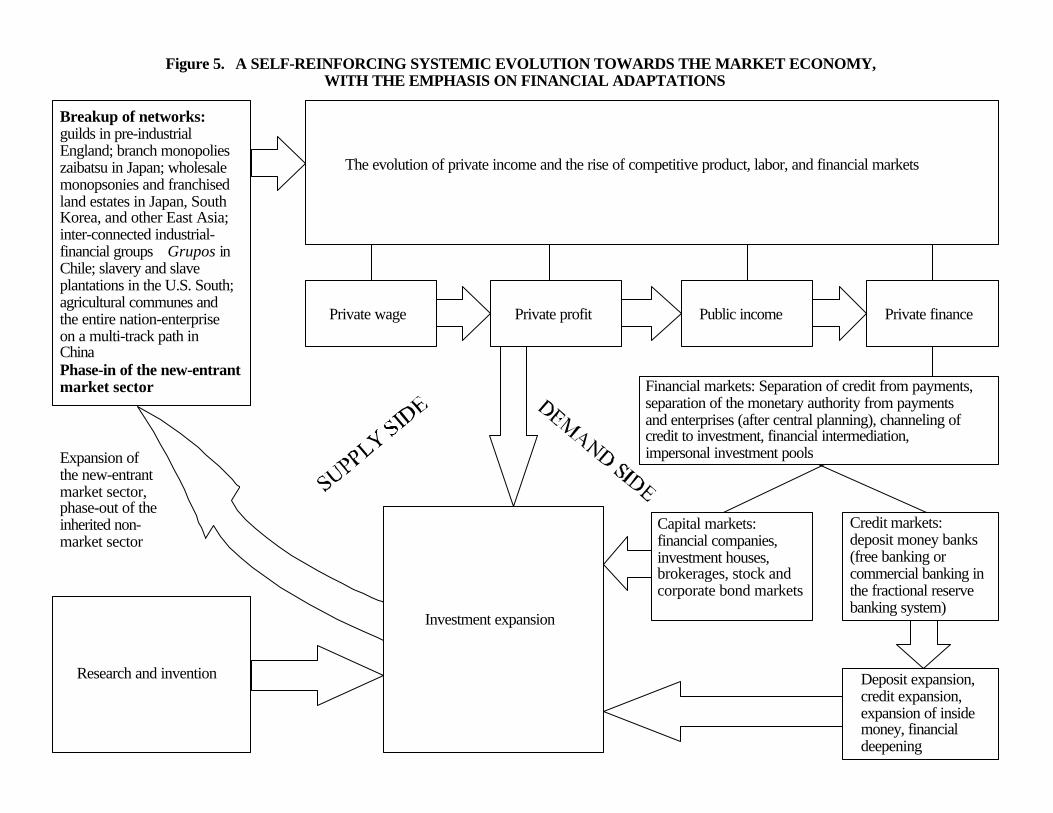
Figure 5. A SELF-REINFORCING SYSTEMIC EVOLUTION TOWARDS THE MARKET ECONOMY, WITH THE EMPHASIS ON FINANCIAL ADAPTATIONS
The evolution of private income and the rise of competitive product, labor, and financial markets
Private wage Private profit Public income Private finance
Investment expansion
Research and invention Deposit expansion,credit expansion,expansion of insidemoney, financialdeepening
Financial markets: Separation of credit from payments,separation of the monetary authority from paymentsand enterprises (after central planning), channeling ofcredit to investment, financial intermediation,impersonal investment pools
Capital markets:financial companies,investment houses,brokerages, stock andcorporate bond markets
Credit markets: deposit money banks(free banking orcommercial banking inthe fractional reservebanking system)
Breakup of networks:guilds in pre-industrialEngland; branch monopolieszaibatsu in Japan; wholesalemonopsonies and franchisedland estates in Japan, SouthKorea, and other East Asia;inter-connected industrial-financial groups Grupos inChile; slavery and slaveplantations in the U.S. South;agricultural communes andthe entire nation-enterpriseon a multi-track path inChinaPhase-in of the new-entrantmarket sector
Expansion ofthe new-entrantmarket sector,phase-out of theinherited non-market sector
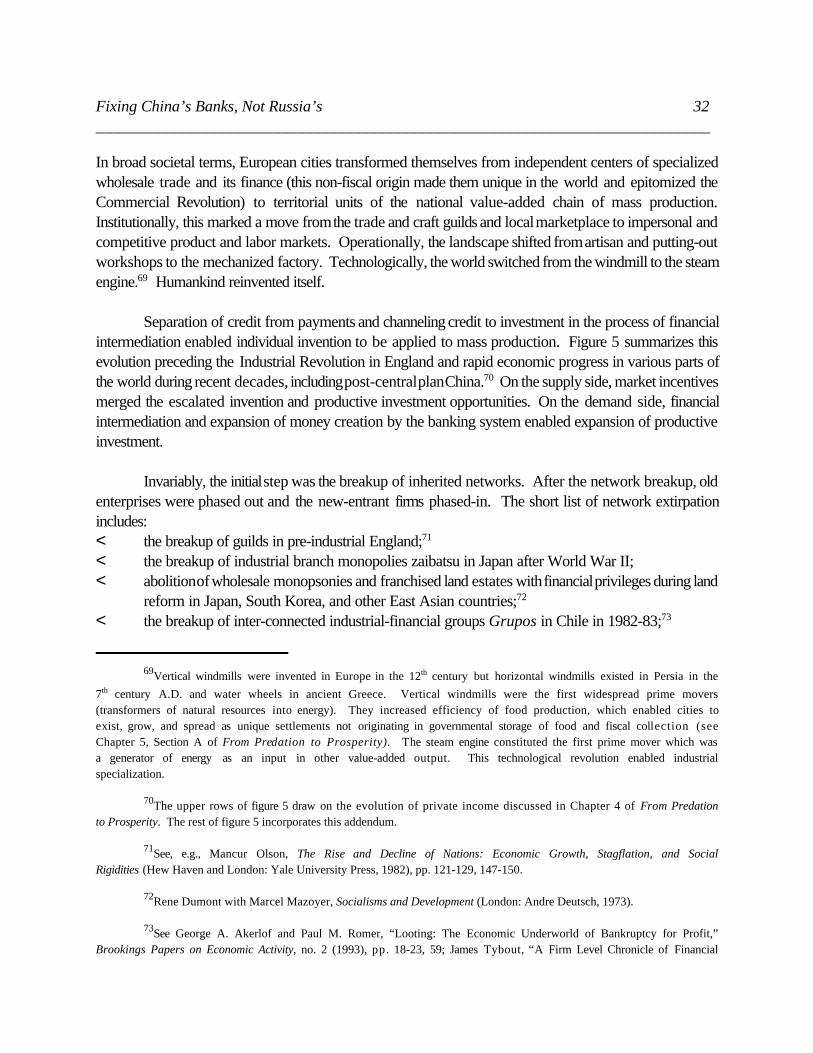
Fixing China’s Banks, Not Russia’s 32_____________________________________________________________________________
69Vertical windmills were invented in Europe in the 12th century but horizontal windmills existed in Persia in the7th century A.D. and water wheels in ancient Greece. Vertical windmills were the first widespread prime movers(transformers of natural resources into energy). They increased efficiency of food production, which enabled cities toexist, grow, and spread as unique settlements not originating in governmental storage of food and fiscal collection (seeChapter 5, Section A of From Predation to Prosperity). The steam engine constituted the first prime mover which wasa generator of energy as an input in other value-added output. This technological revolution enabled industrialspecialization.
70The upper rows of figure 5 draw on the evolution of private income discussed in Chapter 4 of From Predationto Prosperity. The rest of figure 5 incorporates this addendum.
71See, e.g., Mancur Olson, The Rise and Decline of Nations: Economic Growth, Stagflation, and SocialRigidities (Hew Haven and London: Yale University Press, 1982), pp. 121-129, 147-150.
72Rene Dumont with Marcel Mazoyer, Socialisms and Development (London: Andre Deutsch, 1973).
73See George A. Akerlof and Paul M. Romer, “Looting: The Economic Underworld of Bankruptcy for Profit,”Brookings Papers on Economic Activity, no. 2 (1993), pp. 18-23, 59; James Tybout, “A Firm Level Chronicle of Financial
In broad societal terms, European cities transformed themselves from independent centers of specializedwholesale trade and its finance (this non-fiscal origin made them unique in the world and epitomized theCommercial Revolution) to territorial units of the national value-added chain of mass production.Institutionally, this marked a move from the trade and craft guilds and local marketplace to impersonal andcompetitive product and labor markets. Operationally, the landscape shifted from artisan and putting-outworkshops to the mechanized factory. Technologically, the world switched from the windmill to the steamengine.69 Humankind reinvented itself.
Separation of credit from payments and channeling credit to investment in the process of financialintermediation enabled individual invention to be applied to mass production. Figure 5 summarizes thisevolution preceding the Industrial Revolution in England and rapid economic progress in various parts ofthe world during recent decades, including post-central plan China.70 On the supply side, market incentivesmerged the escalated invention and productive investment opportunities. On the demand side, financialintermediation and expansion of money creation by the banking system enabled expansion of productiveinvestment.
Invariably, the initial step was the breakup of inherited networks. After the network breakup, oldenterprises were phased out and the new-entrant firms phased-in. The short list of network extirpationincludes: < the breakup of guilds in pre-industrial England;71 < the breakup of industrial branch monopolies zaibatsu in Japan after World War II; < abolition of wholesale monopsonies and franchised land estates with financial privileges during land
reform in Japan, South Korea, and other East Asian countries;72 < the breakup of inter-connected industrial-financial groups Grupos in Chile in 1982-83;73
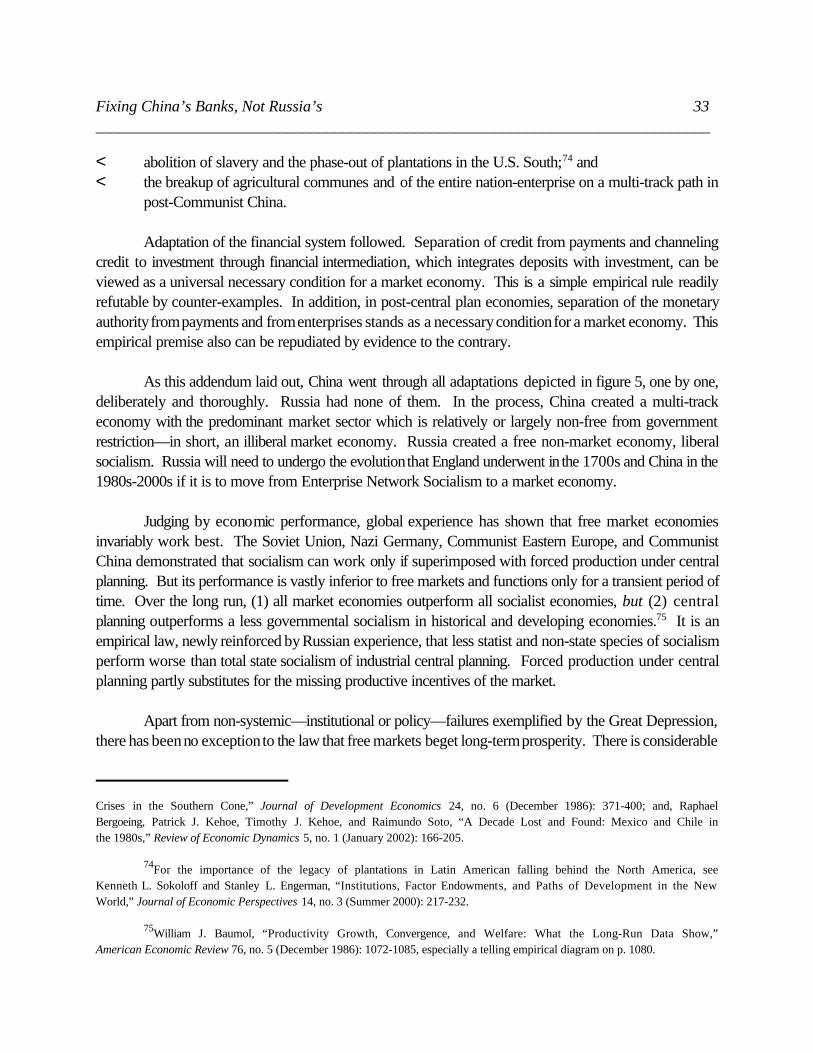
Fixing China’s Banks, Not Russia’s 33_____________________________________________________________________________
Crises in the Southern Cone,” Journal of Development Economics 24, no. 6 (December 1986): 371-400; and, RaphaelBergoeing, Patrick J. Kehoe, Timothy J. Kehoe, and Raimundo Soto, “A Decade Lost and Found: Mexico and Chile inthe 1980s,” Review of Economic Dynamics 5, no. 1 (January 2002): 166-205.
74For the importance of the legacy of plantations in Latin American falling behind the North America, seeKenneth L. Sokoloff and Stanley L. Engerman, “Institutions, Factor Endowments, and Paths of Development in the NewWorld,” Journal of Economic Perspectives 14, no. 3 (Summer 2000): 217-232.
75William J. Baumol, “Productivity Growth, Convergence, and Welfare: What the Long-Run Data Show,”American Economic Review 76, no. 5 (December 1986): 1072-1085, especially a telling empirical diagram on p. 1080.
< abolition of slavery and the phase-out of plantations in the U.S. South;74 and< the breakup of agricultural communes and of the entire nation-enterprise on a multi-track path in
post-Communist China.
Adaptation of the financial system followed. Separation of credit from payments and channelingcredit to investment through financial intermediation, which integrates deposits with investment, can beviewed as a universal necessary condition for a market economy. This is a simple empirical rule readilyrefutable by counter-examples. In addition, in post-central plan economies, separation of the monetaryauthority from payments and from enterprises stands as a necessary condition for a market economy. Thisempirical premise also can be repudiated by evidence to the contrary.
As this addendum laid out, China went through all adaptations depicted in figure 5, one by one,deliberately and thoroughly. Russia had none of them. In the process, China created a multi-trackeconomy with the predominant market sector which is relatively or largely non-free from governmentrestriction—in short, an illiberal market economy. Russia created a free non-market economy, liberalsocialism. Russia will need to undergo the evolution that England underwent in the 1700s and China in the1980s-2000s if it is to move from Enterprise Network Socialism to a market economy.
Judging by economic performance, global experience has shown that free market economiesinvariably work best. The Soviet Union, Nazi Germany, Communist Eastern Europe, and CommunistChina demonstrated that socialism can work only if superimposed with forced production under centralplanning. But its performance is vastly inferior to free markets and functions only for a transient period oftime. Over the long run, (1) all market economies outperform all socialist economies, but (2) centralplanning outperforms a less governmental socialism in historical and developing economies.75 It is anempirical law, newly reinforced by Russian experience, that less statist and non-state species of socialismperform worse than total state socialism of industrial central planning. Forced production under centralplanning partly substitutes for the missing productive incentives of the market.
Apart from non-systemic—institutional or policy—failures exemplified by the Great Depression,there has been no exception to the law that free markets beget long-term prosperity. There is considerable
Fixing China’s Banks, Not Russia’s 34_____________________________________________________________________________
uneasiness, though, lack of clarity, perhaps even reluctance to confront the question as to which part of thisconjunction of free markets works: Is this that markets are free? Or that this is a market economy asopposed to socialism defined as income redistribution? Or, are both components of free marketsinseparable and work only in tandem?
Russian and China contribute new experience and a sharp systemic contrast to address thesequestions. Judging by their economic performance since the abolition of central planning, an illiberal marketeconomy in China works, whereas liberal socialism in Russia does not. Non-free markets generate long-term economic growth on the path to prosperity on par with free market economies and liberalizethereafter. Free non-markets beget economic failure. These are all forever-testable propositions. Theyare measurable, verifiable, and falsifiable by past, current, and future evidence across world economies.
The Taxonomy of Common Income 1
1For seminal work on the taxonomies of economic systems, see John Hicks, A Theory of Economic History(Oxford: Clarendon Press, 1969); Frederick C. Lane, Profits from Power: Readings in Protection Rent and Violence-Controlling Enterprises (Albany: State University of New York Press, 1979); Manuel Gottlieb, A Theory of EconomicSystems (New York, London: Academic Press, 1984); and, Douglass C. North, Institutions, Institutional Change andEconomic Performance (Cambridge: Cambridge University Press, 1990). A two-variable taxonomy of economic systemsappears in a recent cross-national study by Robert E. Hall and Charles J. Jones, “Why Do Some Countries Produce SoMuch More Output than Others?” The Quarterly Journal of Economics 104, no. 1 (February 1999): 83-116.
Chapter 5
The Taxonomy of Common Income (Section A)
Post-Communist Russia and China break down the familiar view of the world. Each combines two seeminglyconflicting characteristics. Russia integrates universal redistribution of income and limited, indeed symbiontgovernment. Enterprise Network Socialism in Russia and similar countries is non-governmental totalsocialism, or, one can say, communism with a lower-case ‘c’. China and similar countries combine apredominantly market economy and a big government. The latter restricts the residual enterprise networkfrom access to the income of new-entrant market firms. Neither of these systems exists on the traditional,one-dimensional map of the world which stretches along a linear dichotomy of market versus government.This one-dimensional map equates market with limited government, defines socialism as restrictive biggovernment, and cannot locate on it economic systems which do not fit these conditions. With no place forpost-Communist reality, the canonical, single-dimensional approach misguides policy. It liberalizes andprivatizes the predatory enterprise network, which leads to Great Contractions. Wrong map, wrongnavigation.
The traditional map came down alongside the Berlin Wall. Its inability to accommodate post-Communist developments calls for a new map of the world. Chapter 5 shows how treating socialism andgovernment as separate dimensions opens a new, two-dimensional perspective on economic systems. Itoffers a comprehensive taxonomy of economic systems, which incorporates Enterprise Network Socialism.1
A better map, and, possibly, policy.
Two Maps of the World
To demonstrate from the outset the capacity of the two-dimensional map, figure 5.1 displays thirteen majorempirical economic clusters covering the last 10,000 years. It incorporates the Russian and Chineseeconomies of the 1990s and fits all of the clusters together on one page. Market and socialism lie on oneindependent dimension, while government lies on a wholly separate dimension. They form the latitude andthe longitude of the new map. The income dimension extends from market to socialism or, synonymously,from private to common income. It measures income redistribution from zero to 100 percent. Thegovernment dimension stretches from limited to restrictive government. It measures economic control orrestriction from nil to full. Intersections on the two dimensions define economic systems. The chronologicalinventory below summarizes the major economic clusters mapped in figure 5.1.
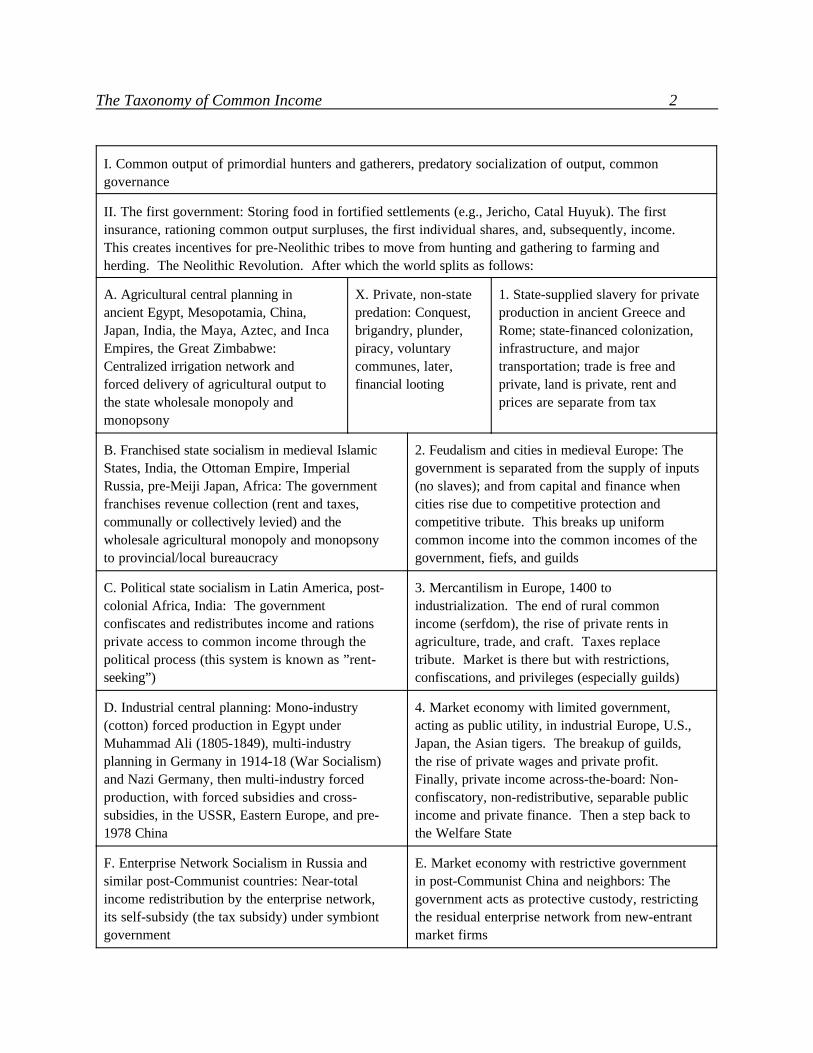
The Taxonomy of Common Income 2
I. Common output of primordial hunters and gatherers, predatory socialization of output, commongovernance
II. The first government: Storing food in fortified settlements (e.g., Jericho, Catal Huyuk). The firstinsurance, rationing common output surpluses, the first individual shares, and, subsequently, income. This creates incentives for pre-Neolithic tribes to move from hunting and gathering to farming andherding. The Neolithic Revolution. After which the world splits as follows:
A. Agricultural central planning inancient Egypt, Mesopotamia, China,Japan, India, the Maya, Aztec, and IncaEmpires, the Great Zimbabwe:Centralized irrigation network andforced delivery of agricultural output tothe state wholesale monopoly andmonopsony
X. Private, non-statepredation: Conquest,brigandry, plunder,piracy, voluntarycommunes, later,financial looting
1. State-supplied slavery for privateproduction in ancient Greece andRome; state-financed colonization,infrastructure, and majortransportation; trade is free andprivate, land is private, rent andprices are separate from tax
B. Franchised state socialism in medieval IslamicStates, India, the Ottoman Empire, ImperialRussia, pre-Meiji Japan, Africa: The governmentfranchises revenue collection (rent and taxes,communally or collectively levied) and thewholesale agricultural monopoly and monopsonyto provincial/local bureaucracy
2. Feudalism and cities in medieval Europe: Thegovernment is separated from the supply of inputs(no slaves); and from capital and finance whencities rise due to competitive protection andcompetitive tribute. This breaks up uniformcommon income into the common incomes of thegovernment, fiefs, and guilds
C. Political state socialism in Latin America, post-colonial Africa, India: The governmentconfiscates and redistributes income and rationsprivate access to common income through thepolitical process (this system is known as ”rent-seeking”)
3. Mercantilism in Europe, 1400 toindustrialization. The end of rural commonincome (serfdom), the rise of private rents inagriculture, trade, and craft. Taxes replacetribute. Market is there but with restrictions,confiscations, and privileges (especially guilds)
D. Industrial central planning: Mono-industry(cotton) forced production in Egypt underMuhammad Ali (1805-1849), multi-industryplanning in Germany in 1914-18 (War Socialism)and Nazi Germany, then multi-industry forcedproduction, with forced subsidies and cross-subsidies, in the USSR, Eastern Europe, and pre-1978 China
4. Market economy with limited government,acting as public utility, in industrial Europe, U.S.,Japan, the Asian tigers. The breakup of guilds,the rise of private wages and private profit. Finally, private income across-the-board: Non-confiscatory, non-redistributive, separable publicincome and private finance. Then a step back tothe Welfare State
F. Enterprise Network Socialism in Russia andsimilar post-Communist countries: Near-totalincome redistribution by the enterprise network,its self-subsidy (the tax subsidy) under symbiontgovernment
E. Market economy with restrictive governmentin post-Communist China and neighbors: Thegovernment acts as protective custody, restrictingthe residual enterprise network from new-entrantmarket firms
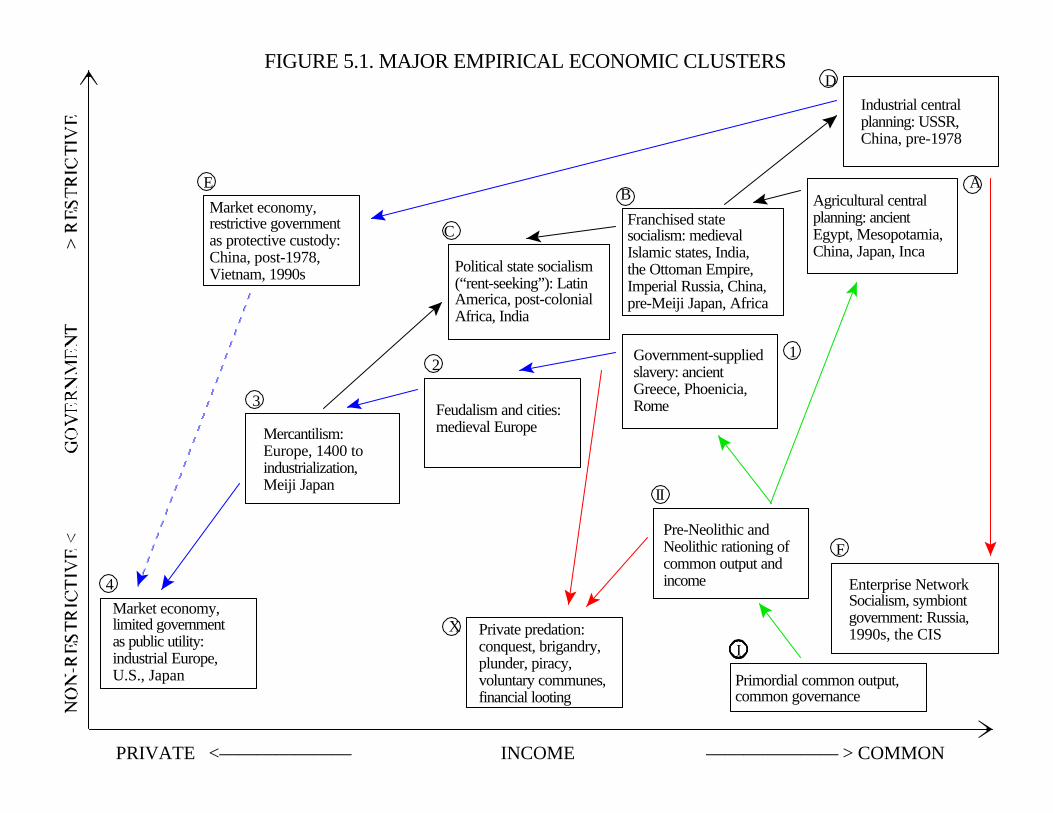
FIGURE 5.1. MAJOR EMPIRICAL ECONOMIC CLUSTERS
PRIVATE <——————— INCOME ——————— > COMMON
4
12
D
3
EB
Industrial centralplanning: USSR,China, pre-1978
Agricultural centralplanning: ancientEgypt, Mesopotamia,China, Japan, Inca
Franchised statesocialism: medievalIslamic states, India, the Ottoman Empire,Imperial Russia, China,pre-Meiji Japan, Africa
Government-suppliedslavery: ancientGreece, Phoenicia,RomeFeudalism and cities:
medieval EuropeMercantilism:Europe, 1400 toindustrialization,Meiji Japan
Market economy,limited governmentas public utility:industrial Europe,U.S., Japan
Market economy,restrictive governmentas protective custody:China, post-1978,Vietnam, 1990s
Enterprise NetworkSocialism, symbiontgovernment: Russia,1990s, the CIS
Pre-Neolithic andNeolithic rationing ofcommon output andincome
F
A
II
Private predation:conquest, brigandry,plunder, piracy,voluntary communes,financial looting
Political state socialism(“rent-seeking”): LatinAmerica, post-colonialAfrica, India
C
Primordial common output,common governance
IX
The Taxonomy of Common Income 3
2For vivid recent summaries see Rondo Cameron, A Concise Economic History of the World: From PaleolithicTimes to the Present (New York, Oxford: Oxford University Press, 1997) and David S. Landes, The Wealth and Povertyof Nations: Why Some are So Rich and Some So Poor (New York: W.W. Norton, 1999). For analytical insights, we alsodraw on Leon de Riedmatten, L’Economie Dirigee: Les Experiences Depuis les Pharaons d’Egypte Jusqu’ a Ce Jour(Versailles: Editions de l’Observateur, 1948); Evsey D. Domar, “The Causes of Slavery or Serfdom: A Hypothesis,” TheJournal of Economic History 30, no. 1 (March 1970): 18-32; John Hicks, A Theory of Economic History; Douglass C.North and Robert P. Thomas, The Rise of the Western World: A New Economic History (Cambridge: CambridgeUniversity Press, 1973); Carol A. Smith, “Exchange Systems and the Spatial Distribution of Elites: The Organization ofStratification in Agrarian Societies,” in Carol A. Smith, ed., Regional Analysis, vol. 2 (New York: Academic Press, 1976),pp. 309-374; Frederic L. Pryor, The Origins of the Economy: A Comparative Study of Distribution in Primitive andPeasant Economies (New York: Academic Press, 1977); Frederick C. Lane, Profits from Power: Readings in ProtectionRent and Violence-Controlling Enterprises ; Douglass C. North, Structure and Change in Economic History (New York:W.W. Norton, 1981); Mancur Olson, The Rise and Decline of Nations: Economic Growth, Stagflation, and SocialRigidities (Hew Haven and London: Yale University Press, 1982); and, Thomas Sowell, Conquests and Cultures: AnInternational History (New York: Basic Books, 1998).
3The first view is initiated in Leon Metchnikoff, La Civilisation et les Grands Fleuves Historiques (Paris:Hachette et. cie, 1889); Leon de Riedmatten, L’Economie Dirigee; and, Karl A. Wittfogel, Oriental Despotism: AComparative Study of Total Power (New Haven: Yale University Press, 1957). The most forceful expositions of thesecond view are in Morris Silver, Economic Structures of Antiquity (Westport, CT, and London: Greenwood Press, 1995)and David A. Warburton, State and Economy in Ancient Egypt: Fiscal Vocabulary of the New Kingdom (Fribourg,Switzerland: University Press and Gottingen: Vandenhoeck & Ruprecht, 1997).
4The second view is in David Granick, Job Rights in the Soviet Union: Their Consequences (Cambridge, NewYork: Cambridge University Press, 1987). It also underlies the theory of the soft budget constraint in Janos Kornai, “TheSoft Budget Constraint,” Kyklos 39, no. 1 (1986): 3-30. For a detailed presentation and bibliography, see Eric Maskin andAndras Simonovits, eds., Planning, Shortage, and Transformation: Essays in Honor of Janos Kornai (Cambridge: MA:The MIT Press, 2000).
These descriptive characteristics of major economic clusters are based on our understanding offacts and the literature.2 Details of each case will be discussed throughout this chapter. For the moment,the chronological inventory serves as a reference for figure 5.1. Descriptive characteristics determinelocations on the map in figure 5.1. Locations approximate the intersections of income redistribution andgovernment restriction for each specific cluster.
Objective and Verifiable Locations
There is no consensus in the literature on the characteristics, the choice, the structure, or even the namesof the empirical cases that we assembled in the 13 clusters that appear in figure 5.1. Interpretations vary,swing, and clash. For example, ancient Egypt and Mesopotamia (in cluster A) are alternatively viewed asstate-forced irrigation or as precursors of modern Western economies, which combine markets and publicworks.3 Central planning in the Soviet Union and China (in cluster D) is viewed, in one perspective, as anationwide forced labor camp or, from a different perspective, as the implementation of a full employmentpolicy by paternalistic Keynesian planners.4
What is important for our purposes is that the two-dimensional map can accommodate any
The Taxonomy of Common Income 4
5Monthly grain allowances to citizens in ancient Rome were established in 58 B.C. and lasted through the endof the Roman Empire. Limited initially to 220,000 plebeian recipients, this entitlement was converted into food stampsby the Third century A.D. and had become inheritable and tradeable. Physically, foods stamps represented bronzetablets on which the names of the recipients were engraved. Grain allowances developed into bread allowances whenbaking services supplemented entitlements and 274 bakeries in Rome disbursed bread to the recipients. Oil and porkrations were added later for five months of the year. For a detailed description, see Arnold H. M. Jones, The LaterRoman Empire, 284-602: A Social, Economic, and Administrative Survey (Oxford: Basil Blackwell, 1964), vol. 2, pp. 695-705. On the early modern Welfare State in Europe, see extensive data in Peter Flora, Jens Alber, et.al., State, Economy,and Society in Western Europe, 1815-1975: A Data Handbook , vol. 1, The Growth of Mass Democracies and WelfareStates (Frankfurt: Campus Verlag and London: Macmillan, 1983). The chronology of the introduction of the statepension, unemployment insurance, and health insurance programs is on p. 454.
6The founding articles on rent seeking are Gordon Tullock, “The Welfare Costs of Tariffs, Monopolies andTheft,” Western Economic Journal 5, no. 2 (June 1967): 224-232 and Anne O. Krueger, “The Political Economy of the
interpretation of specific economic clusters and cases (i.e., in which cluster they belong). First, clusters canbe easily relocated on the map within the two dimensions. As with geographic maps, knowledge changeslatitudes and longitudes of specific sites and improves the map. Second, the map uses direct measurementsof income redistribution and government restriction as shares of gross domestic product (GDP). Thesemeasurements are free of value judgements which influence interpretations. Whether ancient Egypt andMesopotamia ran state-forced projects or public works of the Welfare State does not affect theirmeasurement and location. Both interpretations imply a high degree of income redistribution andgovernment management. Whether Soviet and Chinese central planning were forced labor camps or ameans to attain full employment, they achieved the same near-total extent of income redistribution andgovernment control. Locations of cases, and the clusters in which they are placed, are objective, even ifnot precise. They are verifiable by evidence.
In short, the map is free of value judgements and adaptable to learning. A third dimension,property, can be readily added, in the same manner that geographical maps use colors to include additionaldimensions. The map is expandable. We will come to this in Section C of this chapter.
All Clusters, Big and Small
The clusters in the chronological inventory are empirically assembled. Each cluster consists of looselyrelated, time-specific, place-specific examples. Many empirical cases can be added to expand and adjustthe interpretation of a particular cluster, or to form one or more new clusters. Clusters can be merged orsub-divided, as illustrated in the following discussion.
# The Welfare State can be singled out as a cluster of its own, from ancient Rome to modernindustrial economies, in Germany, Austria, and Italy beginning in the 1880s, in France andDenmark in the 1890s, and in Belgium, Norway, and U.K. in the 1900s.5
# What we dub as political state socialism in Latin America, India, and Africa can be disaggregated.Political rent-seeking in Latin America, India, Turkey, and similar countries in recent decades6 is
The Taxonomy of Common Income 5
Rent-Seeking Society,” American Economic Review 64, no. 3 (June 1974): 291-303. A comprehensive compendium isRobert D. Tollison and Roger D. Congleton, eds., The Economic Analysis of Rent Seeking (Aldershot, U.K, andBrookfield, VT: Edward Elgar Publishing, 1995).
7See Douglass C. North, William Summerhill, and Barry R. Weingast, “Order, Disorder and Economic Change:Latin America vs. North America,” in Bruce Bueno de Mesquita and Hilton Root, eds., Governing for Prosperity (NewHaven: Yale University Press, 2000), pp. 17-58 and Steve J. Stern, “Feudalism, Capitalism, and the World-System in thePerspective of Latin America and the Caribbean,” in Robert Foster, ed., European and Non-European Societies, 1450-1800 (Aldershot, U.K.: Ashgate Publishing Ltd., 1997), pp. 19-75.
8On income transfer from rural to urban sectors through controlled prices in developing countries see MichaelP. Todaro, Economic Development (Reading, MA: Addison-Weseley, 1997) and the definitive article by Raaj Kumar Sahand Joseph E. Stiglitz, “The Economics of the Price Scissors,” American Economic Review 74, no. 1 (March 1984): 125-138. See also Michael Lipton, Why Poor People Stay Poor: Urban Bias in World Development (Cambridge, MA:Harvard University Press, 1976); Charles M. Becker, Andrew M. Hamer, and Andrew R. Morrison, Beyond Urban Biasin Africa: Urbanization in an Era of Structural Adjustment (Portsmouth, N.H.: Heinemann and London: J. Currey, 1994);and, Michael P. Todaro, Reflections on Economic Development: The Selected Essays of Michael P. Todaro (Aldershot,U.K. and Brookfield, VT: Edward. Elgar Publishing, 1995).
9On the overlap of mercantilism and rent-seeking, see Robert B. Ekelund, Jr., and Robert D. Tollison, SacredTrust: The Medieval Church as an Economic Firm (New York: Oxford University Press, 1996) and Robert B. Ekelund,Jr., and Robert D. Tollison, Politicized Economies: Monarchy, Monopoly, and Mercantilism (College Station, Texas:Texas A&M University Press, 1997).
a separate phenomenon from patronage in Indonesia and from corporatism in South Africa andArgentina under Peron (which can be grouped with the corporate state in Fascist Italy). In LatinAmerica, political state socialism stands apart from violent infighting over economic power in the18th-19th centuries7 and from essentially market economies in the second half of the 19th and early20th centuries in Ecuador, Argentina, and Chile. The rural-to-urban transfer of income in post-colonial Africa and Arab countries, known as urban bias or the price scissors,8 may warrant itsown cluster. It retains the government wholesale agricultural monopsony and monopoly, likefranchised state socialism that preceded it. Thus the government distributes not only inputs ofresources, land, and capital, as under political state socialism, but also agricultural and other output,akin to franchised state socialism.
# Political state socialism (“rent-seeking”) in Latin America, post-colonial Africa, and India andmercantilism in pre-industrial Europe are viewed by many researchers as one system.9 Thestructural difference between the two is that rent-seeking uses modern political institutions forsectoral redistributive gains while mercantilism relies on entrenched and long-term privileges. Thismeans that rent-seeking is highly competitive whereas privileged-based mercantilism is less so. Thisdifference has quantitative implications for the extent of income redistribution and governmentcontrol. Both the role of the government and the extent of income redistribution are greater in rent-seeking. Privileged redistribution is confined to isolated segments of commerce and agriculturewhereas rent-seeking spreads over industries and supply chains and constantly involves thegovernment. If empirical evidence does not warrant this differentiation, the rectangles of
The Taxonomy of Common Income 6
10The literature documenting and analyzing these two points is voluminous. It starts with the brilliant insightsof Francois Bernier and the path-breaking work of Henry Sumner Maine. See Francois Bernier, The History of the LateRevolution of the Empire of the Great Mogol: Together with the Most Considerable Passages for 5 Years Followingin That Empire. To Which is Added a Letter to the Lord Colbert, Touching the Extent of Indostan; the Circulation ofthe Gold and Silver of the World to Discharge Itself There, as Also the Riches, Forces, and Justice of the Same, andthe Principal Cause of the Decay of the States of Asia, vols. 1-4 (London: Moses Pitt, Simon Miller, and John Starkey,1671-1676) and Henry Sumner Maine, Village-Communities in the East and West (London: John Murray, 1872). To skimthe cream of the modern literature, see William H. Moreland, From Akbar to Aurangzeb: A Study in Indian EconomicHistory (London: Macmillan, 1923), pp. 145-233; William H. Moreland, The Agrarian System of Moslem India (Cambridge:W. Heffer & Sons, 1929); Winifred S. Blackman, The Fellahin of Upper Egypt: Their Religious, Social, and IndustrialLife Today with Special Reference to Survivals from Ancient Times (London: George G. Harrap & Company Ltd, 1927);Charles P. Issawi, ed., The Economic History of the Middle East, 1800-1914: A Book of Readings (Chicago: Universityof Chicago Press, 1966); Charles P. Issawi, ed., The Economic History of Turkey, 1800-1914 (Chicago: The Universityof Chicago Press, 1980); Baber Johansen, The Islamic Law on Land Tax and Rent: The Peasants’ Loss of Property Rightsas Interpreted in the Hanafite Legal Literature of the Mamluk and Ottoman Periods (London and New York: CroomHelm, 1988); Hossein Modarressi, Kharaaj in Islamic Law (Toptree, Essex: Anchor Press, 1983); Angus Maddison, ClassStructure and Economic Growth: India and Pakistan Since the Moghuls (London: George Allen & Unwin, 1971),especially pp. 17-34; Irfan Habib, The Agrarian Sys tem of Mughal India, 1556-1707 (New Dehli: Oxford University Press,1999); Harold Bolitho, Treasures Among Men: The Fudai Daimyo in Tokugawa Japan (New Haven: Yale UniversityPress, 1974); Peter J. Arnese, The Medieval Japanese Daimyo: The Ouchi Family’s Rule of Suo and Nagato (NewHaven: Yale University Press, 1979); Vasilii O. Kliuchevskii, A History of Russia, vol. 2 (London: J.M. Dent &Sons, Ltd.and New York: E.P. Dutton & Co., 1912); and, Solomon D. Goitein, A Mediterranean Society: An Abridgement in OneVolume (Berkeley: University of California Press, 1999). For a succinct statement see the section “Taxation andDistribution of Revenue Resources” in the article “India,” the articles “Iqta” and “Timar” and the sections “The Bakuhansystem” and “Daimyo” in the article “Japan” in Encyclopedia Britannica.
11Iqta in the Arab Califate, khubz in Mamluk Egyp t , timar in the Ottoman Empire, jigardar in India (the termof Persian origin), daimyo and han in Japan, and kormlenie in Russia are similar terms. They mean the official’s feedingand the land (locale) assigned for feeding. In China, the hierarchical terms circle around “the bowl” (“the rice bowl,” “the
mercantilism and political state socialism (rent-seeking) in figure 5.1 can be easily merged. Thetwo-dimensional map does not take sides in these debates. Rather, it is a learning tool.
# Franchised state socialism across medieval and pre-modern Asian, African, and Eastern Europeaneconomies may be too much to lump into one cluster. Two basic elements hold it together.
(1) The government distributes agricultural output. The state wholesale agricultural monopsony andmonopoly, inherited or reproduced from agricultural central planning, defines transactions betweenindependent peasant communities and the state, as well as rural-urban relations. It amalgamatestax and rent because producer surpluses above state-set purchase prices accrue to state revenues.Land tax, another principal revenue source, also fuses tax and rent.
(2) This revenue collection, together with the enforcement of the monopsony/monopoly and othertaxation, is franchised to provincial and local officials. For this purpose, they are allocated land (or,rather, territory and communities) to separately collect their own keep, initially in kind, and, later,in money income.10 This system of separate localized revenues is uniformly and independentlydubbed in various countries and languages as “feeding,” and its franchised collectors, as “eaters.”11
The Taxonomy of Common Income 7
porcelain bowl,” “the iron bowl,” “the rice and meat and wine bowl,” etc.) for the official-scholar, the local “tax captain,”and the li-chia community chief. See, e.g., Francois Bernier, Travels in the Mogul Empire A.D. 1656-1668 (Westminster:Archibald Constable & Co, 1891), p. 224; Eric L. Jones, The European Miracle: Environments, Economies, andGeopolitics in the History of Europe and Asia (Cambridge, New York: Cambridge University Press, 1987), pp. 198-201;Angus Maddison, Class Structure and Economic Growth: India and Pakistan Since the Moghuls, pp. 22-24, 33; HaroldBolitho, Treasures Among Men: The Fudai Daimyo in Tokugawa Japan; and, Vasilii O. Kliuchevskii, A History ofRussia, vol. 2, pp. 242-287.
12Francois Bernier, Travels in the Mogul Empire A.D. 1656-1668, p. 224: “the King, as proprietor of the land,makes over a certain quantity (...) [as] jah-ghir signifying the spot from which to draw (...) to governors, in lieu of theirsalary, and also for the support of their troops, on condition that they pay a certain sum annually to the King out of anysurplus that the land may yield.”
13The franchisees were interested to maximize current consumption, maximize debt, and leave it to the state upondeath or dismissal. See, e.g., Angus Maddison, Class Structure and Economic Growth: India and Pakistan Since theMoghuls , p. 23. In a series of reforms in the 16th-18th centuries, governments from Russia to the Ottoman Empire to Indiato Japan closed this loophole by making their tax collecting position and land holding claims hereditary. “The placedone” replaced “the fed one”: zamindar in India, malikanel in the Ottoman Empire, and pomeshchik in Russia replacedjigardar, timar, and kormlenshchik , respectively. Similarly, in Japan, under the bakuhan system, shugo daimyo, theappointed provincial revenue collectors, were supplanted by the hereditary sengoku daimyo. This last period offranchised state socialism may warrant a separate cluster.
14A pioneering Western study is August F. von Haxthausen, The Russian Empire, Its People, Institutions, andResources (London: Chapman and Hall, 1856), vols. 1-2. Before that, Ivan N. Boltin, Primechaniia na Istoriiu Drevniiai Nyneshniia Rossii g. Leklerka, vols. 1-2 (St. Petersburg: T. Gornago Uchilishcha, 1788), in response to good insightin Nicolas G. Le Clerc, Histoire Physique, Morale, Civile et Politique de la Russie Moderne, vol. 1 (Paris: Chez Froulle,1783). The most influential account to-date is Vasilii O. Kliuchevskii, A History of Russia, vols. 2-5 (London: J.M. Dent&Sons, Ltd. and New York: E.P. Dutton & Co., 1912-1931).
Why this isomorphic “feeding” system from the Arab states to the Ottoman Empire to India toBurma to Russia to China to Japan to Mali, Benin, and Madagascar? In the absence of forceddelivery of output to state storage facilities, the central government cannot monitor the fiscalperformance of its revenue franchisees and enforce full collection and remittance. To solve theenforcement problem, the government assigns fixed revenue targets and makes the franchisees theresidual revenue claimants.12 They get their own revenues from the same locale after they deliverspecified sums to the government. Any uncollected balance owed to the government comes fromtheir own revenues or accrues to their debt.13 In short, eat as you remit.
If the cluster of franchised state socialism is too inclusive in the judgement of experts, it can be sub-divided into two phenomena: (a) franchised taxation and indirect collective (communal) taxation in medievalIslamic states, India, medieval and Manchu China, medieval and Tokugawa Japan, and the OttomanEmpire, which accompanied government wholesale monopoly, and (b) franchised serfdom and directcommunal taxation in Imperial Russia.14
# Communal taxation may also be part of central planning. Examples include collective farms in theUSSR, communes in China before 1978, and villages in pre-Columbian America on the periphery
The Taxonomy of Common Income 8
15See Oscar Lewis, Life in a Mexican Village: Tepoztlan Restudied (Urbana, IL: University of Illinois Press,1951); Ernest Feder, The Rape of the Peasantry: Latin America’s Landholding System (Garden City, N.Y.: Anchor Books,1971); and, Andre G. Frank, Mexican Agriculture, 1521-1630: Transformation of the Mode of Production (Cambridge,New York: Cambridge University Press, 1979).
16Francois Bernier, who practiced medicine at the Indian court during 1656-1668 and greatly influenced hisfriend, another physician, John Locke, in 1675-79, grasped it all: “As the ground is seldom tilled otherwise than bycompulsion, and as no person is found willing and able to repair the ditches and canals for the conveyance of water, ithappens that the whole country is badly cultivated, and a great part rendered unproductive from the want of irrigation.The houses, too, are left in a dilapidated condition, there being few people who will either build new ones, or repair thosewhich are tumbling down. The peasant cannot avoid asking himself the question: ‘Why should I toil for a tyrant whomay come tomorrow and lay his rapacious hands upon all I possess and value, without leaving me, if such should behis humour, the means to drag on my miserable existence?’ The Timariots, Governors, and Revenue contractors, on theirpart reason in this manner: ‘Why should the neglected state of this land create uneasiness in our minds? and why shouldwe expend our own money and time to render it fruitful? We may be deprived of it in a single moment, and our exertionswould benefit neither ourselves nor our children. Let us draw from the soil all the money we can, though the peasantshould starve or abscond, and we should leave it, when commanded to quit, a dreary wilderness. The facts I mentionedare sufficient to account for the rapid decline of the Asiatic states.” Francois Bernier, Travels in the Mogul Empire, A.D.1656-1668, pp. 226-227.
17See the excellent treatment in John H. Moore, Growth with Self-Management: Yugoslav Industrialization,1952-1975 (Stanford, CA: Hoover Institution Press, 1980) and Svetozar Pejovich, Economic Analysis of Institutions andSystems (Boston: Kluwer Publishers, 1998).
18Figure 5.2 plots this diagonal based on the national data. We will return to its findings shortly.
of the centralized irrigation and infrastructure networks (peripheral franchised central planning andforced delivery of output). Also, communal taxation was carried over from peripheral centralplanning to political state socialism in Latin America.15 One can also view the price scissors inAfrica and elsewhere as an indirect method of communal taxation, inherited from franchised statesocialism.
# Another separate cluster can be set for franchised central planning in India under the MughalEmpire, in medieval and Manchu China, in medieval and Tokugawa Japan, and in pre-colonialMadagascar. But one can also view this element of forced production as a necessary part offranchised taxation.16
# Labor management in Communist Yugoslavia in the 1950s-1980s is, in the view of many scholars,a separate phenomenon from, rather than a special case of, central planning.17
# In the post-Communist world, Poland and other Eastern European economies can be located alongthe diagonal between Enterprise Network Socialism in Russia and market economy with restrictivegovernment in China (Poland, closer to China; the Czech Republic, closer to Russia).18 They canqualify as a separate cluster.
These examples and many other separate cases, which we did not map and will enumerate later,
The Taxonomy of Common Income 9
are not exceptions or outliers. They are all self-contained cases or possible clusters in their own right.They can be readily located on the map. They do not require special treatment. From the two-dimensionalperspective, any specific intersection of income redistribution and government restriction qualifies as anempirical case. As many empirical clusters and cases can be placed on the map as one deems fit,depending on how one interprets the evidence for specific cases and how to combine them to constituteclusters. Which cluster is big and which is small is in the eye of the beholder. It is merely up to aresearcher’s judgement to select empirical cases and bunch them into specific clusters or just scatter themover the map. This judgement or misjudgement on selection does not affect the map itself.
The two-dimensional map can accommodate all and any specific clusters at any level of aggregationand disaggregation, because all clusters (and all cases within each cluster) contain some extent of incomeredistribution and government restriction. Their intersections readily place clusters on the two-dimensionalmap. One can apply to the two-dimensional map the same simple and merciless test which we used forthe unidimensional approach. If a single case can be found outside of the map, or if the map cannot findroom for it, then the map fails to grasp comprehensively the relations between market, socialism, andgovernment. If all empirical clusters and cases in any combination can be placed on these two dimensions,and not on just one dimension and not on some other dimension, then we can say with confidence that thetwo-dimensional map (like figure 5.1) is both necessary and sufficient for capturing the relations betweenmarket, socialism, and government.
The objective of figure 5.1 is not to provide the exact selections, aggregations, and locations ofempirical clusters but to demonstrate the analytical capability of the two-dimensional map—the existenceof specific, identifiable location for every extinct and extant case. Later in this chapter (Section B) we willapproximate the specific locations of 86 major and minor empirical cases in a form akin to the PeriodicTable of Elements.
Patterns and Paths
Once major empirical clusters are assembled, figure 5.1 reveals their patterns and paths. If the descriptivecharacteristics in the chronological inventory are in the ballpark, the empirical clusters in figure 5.1 line upin four disparate groups:
# Prehistoric societies, from primordial predatory redistribution of common output to the NeolithicRevolution. We mark them with Roman numerals.
# Western societies, from ancient slavery to feudalism and cities to mercantilism to fully-fledgedmarket economies. They originate in Europe, extend to the British outstretches, and, later,incorporate Japan and the Asian Tigers. We denote them with Arabic numerals.
# Non-Western societies, from agricultural central planning to franchised state socialism to politicalstate socialism and industrial central planning, and, recently, to post-Communist economies. We
The Taxonomy of Common Income 10
19The terms “Western” and “Non-Western” are not strictly geographical or cultural, if only because Germanyand other countries occasionally bounced between the two groups of economic clusters. We use these terms, for thelack of better ones, to sketch a long-term milieu. It is a geographical coincidence that on the two-dimensional map infigure 5.1 the direction towards market is westward, and towards socialism, eastward.
20E.g., the S&L episode in the U.S. and the financial-industrial groups in Chile in the 1970s-early 1980s. SeeGeorge A. Akerlof and Paul M. Romer, “Looting: The Economic Underworld of Bankruptcy for Profit,” Brookings Paperson Economic Activity, no. 2 (1993): 1-73.
21See Allen W. Johnson and Timothy K. Earle, The Evolution of Human Societies: From Foraging Group toAgrarian State (Stanford: Stanford University Press, 2000) and Terry Y. LeVine, “The Study of Storage Systems,” inTerry Y. LeVine, ed., Inca Storage Systems (Norman, OK: University of Oklahoma Press, 1992), pp. 3-30. See also RobertM. Townsend, The Medieval Village Economy: A Study of the Pareto Mapping in General Equilibrium Models(Princeton: Princeton University Press, 1993) and Orazio Attanasio, “Consumption Smoothing in Village Economies:Some Evidence and Some Normative Theory,” Paper presented at the Econometrics Seminar, Department of Economics,Stanford University, March 2001.
22On the variable productivity of resources as the defining human characteristic and its material and economicaccounting, see Michael S. Bernstam, The Wealth of Nations and the Environment (London: The Institute of EconomicAffairs, 1991), pp. 29-37, 61-62.
identify them with Roman capital letters from A to F.19
# A diverse, world-wide grouping of private predation. It ranges from the timeless conquests,brigandry, and plunder to historical piracy and voluntary communes to modern financial looting.20
We designate it with an X.
The paths tell us more than the four groups themselves. If the locations in figure 5.1 are not too faroff mark, they yield three distinct paths:
# The government path: The government path is the development of government and income,depicted by green arrows. Communities invented government to insure their survival by smoothingconsumption. This first insurance entailed storing and rationing of very short-term surpluses ofcommon output (daily, weekly, monthly).21 The first government controlled access to commonoutput in order to check predatory socialization of output by individuals or small groups. Thegovernment broke up primordial common output. This started a 10,000-year march of separationof production from predation, as we discussed in Chapter 3. Breaking up common output formedthe basis for the development of unique human society. It is characterized by the capacity toproduce beyond subsistence, which releases the variable productivity of resources.22 Thus the riseof government, seen in the one-dimensional map as the thesis of socialism and the antithesis ofmarkets, in fact reduced the extent of socialism, as shown in figure 5.1. An important insight of thetwo-dimensional map is that the emergence of government initially reduced the degree ofredistribution. Put another way, the first relationship between government and redistribution was
The Taxonomy of Common Income 11
23The canonical view holds this relationship invariably positive, because government and redistribution arepostulated as one and the same.
24Hernando De Soto, The Mystery of Capital: Why Capitalism Triumphs in the West and Fails Everywhere Else(New York: Basic Books, 2000), p. 3 and passim .
25Afaf Lufti Sayyid-Marsot, Egypt in the Reign of Muhammad Ali (Cambridge, New York: Cambridge UniversityPress, 1984), pp. 142-185 and Fred H. Lawson, The Social Origins of Egyptian Expansionism during the MuhammadAli Period (New York: Columbia University Press, 1992), pp. 90-143. For an excellent summary, see David S. Landes, TheWealth and Poverty of Nations, pp. 404-407 and the entry “Muhammad Ali” in Encyclopedia Britannica, whichemphasizes the country-wide forced plantation. This case ended in 1849 and was in decline after 1837. Ironically, whenKarl Marx and Frederick Engels proposed an “industrial army, especially in agriculture” in The Communist Manifestoin 1848, the first test had been already completed nearby, but they did not notice it.
26Recently, Egypt has shed many elements of state socialism and moved significantly towards a marketeconomy. See a sweeping treatment by Charles P. Issawi, The Middle East Economy: Decline and Recovery. SelectedEssays (Princeton: Markus Wiener Publishers, 1995); and a broad overview in Hugh N. Kennedy, ed., TheHistoriography of Islamic Egypt, 950-1800 (Leiden, Boston: Brill, 2001). Egypt, post-Communist China, and southerncountries of Latin America in the second half of the 19th century testify that geography (factor endowments) and history(path dependence) are not destiny. In the past, they usually were. In modern times, the world market expanded countrypolicy choices. Chapter 7 will explore these themes. On path dependence in history, see recent summaries by the pioneerof this idea, Paul A. David, “Why are Institutions the Carriers of History? Path Dependence and the Evolution ofConventions, Organizations and Institutions,” Economic Dynamics and Structural Change 5, no. 2 (1994): 205-220; “The
negative.23 Government rationing allocated individual shares of common output. This wasequivalent to the invention of income and money and led to the birth of exchange. They, in turn,put in place incentives for the shift to agriculture because they enabled individuals (or families) tointernalize part of their output beyond a very short-term horizon. After the invention of governmentand income, the world subdivided into various types of government and income in the West andnon-West and also private predation.
# The socialist path: The socialist path is consolidation and realignment of common income, denotedby black arrows.
(1) The socialist path is primarily state socialism, bouncing back and forth between clusters. Thefamiliar example is Latin America. Much of it experienced consecutive clusters of state socialismfor centuries, despite at least four major market reforms since independence from Spain in the1820s24 and a period of successful market development in Ecuador, Argentina, and Chile in thesecond half of the 19th century. A fascinating example is Egypt. It moved from centralizedirrigation, with forced delivery of agricultural output to the government, at the age of the pyramidsto franchised state socialism under Arab, Mamluk, and Ottoman Empires to the first industrialcentral planning under Muhammad Ali in 1805-4925 to political rent-seeking after World War I tothe rural-to-urban transfers (“the price scissors”) and the wholesale monopsony/monopoly afterthe Revolution of 1952, and, at one point in the early 1960s, approached multi-industry centralplanning as in Soviet Central Asia—a full circle of state socialism from Djoser to Nasser.26
The Taxonomy of Common Income 12
Economics of Path Dependence in Industrial Organization,” International Journal of Industrial Organization 6, no. 6(October 1997): 643-852, Special issue, Christiano Antonelli and Paul A. David, eds.
27Martin C. McGuire and Mancur Olson, Jr., “The Economics of Autocracy and Majority Rule: The InvisibleHand and the Use of Force,” Journal of Economic Literature 34, no. 1 (March 1996), pp. 72-97.
The empirical bouncing back and forth on the socialist path can be explained in terms of thegovernment’s decision on how to maximize its fiscal take of the share of national income. Oneapproach is to reduce redistribution and predation in order to increase productive incentives andexpand the economy—smaller squeeze, greater pie, greater tax revenue.27 Reducing the taxburden to increase the tax base, which results in greater revenue over time, works at relativelymoderate or low levels of redistribution and restriction. At high levels of redistribution, analternative approach is to impose forced production under central planning—greater squeeze,greater pie, greater tax revenue. This second approach works only if additional enforcement costsare low and forced production is truly feasible. If both conditions hold, forced production mayoffer a larger payoff to the government than the first alternative. As we discussed in Chapter 3,forced production substitutes for voluntary productive incentives, the economy expands, and taxrevenue and other gains for the government increase. One can say that the government appliescost-benefit analysis to determine which approach, market incentives or forced production, yieldsthe highest return.
(2) The bouncing of common income between clusters does not necessarily result in state socialism.The red arrow on the map pointing southward from industrial central planning shows a differentoutcome, from state socialism to Enterprise Network Socialism. The result is the liberalization ofcommon income after the abolition of central planning, but with total income redistribution intact.This is socialist devolution, in which government restriction breaks up but common income doesnot.
# The market path: The market path is the path from state socialism to market, from governmentalcommon income to private income. The blue arrows designate the market path. This is the pathof serial breakups of common income.
(1) First, there was state-supplied slavery and state-financed colonization. They constitutedgovernment production of inputs (slaves, land, infrastructure, transportation) for private productionof output. Output itself was un-rationed. This was the shift from the Neolithic rationing of outputto free exchange of output in trade, while the government supplied the inputs. Figure 5.1 thuslocates the extent of common income and government restriction in ancient Europe at significantlylower levels than the rest of the world for centuries to come. (2) Second, feudalism and private serfdom removed the government from supplying inputs foragricultural production. Decentralized government, the feudal manors and the feudal network,regulated the inputs of land and labor (private serfdom) but did not produce them. This
The Taxonomy of Common Income 13
28Edward Ames and Richard T. Rapp, “The Birth and Death of Taxes: A Hypothesis,” The Journal of EconomicHistory 37, no. 1 (March 1977): 159-170.
29On the critical role of the breakup of private guilds and the rise of rural industries as the cradle ofindustrialization, see Mancur Olson, The Rise and Decline of Nations, pp. 121-129, 147-150; Eric L. Jones, The EuropeanMiracle: Environments, Economies, and Geopolitics in the History of Europe and Asia, pp. 98-102; and, David S.Landes, The Wealth and Poverty of Nations, pp. 242-245, 546-547. This pattern of rural industrial development at thelocal level, on the backdrop of the decline of traditional cities, reemerges in the Township and Village Enterprises (TVEs)in post-Communist China.
30We discussed this process in Chapter 4. But there was also backward bouncing from mercantilism to morestate socialism. Germany and parts of Eastern Europe saw the restoration of serfdom in the 16th and 17th centuries, oftenin the form of state-franchised serfdom. The most conspicuous example of backward bending is the introduction ofcentral planning of private corporations in Germany during War Socialism in 1914-18 and under the Nazi regime. The
differentiates feudalism from slavery. The advent of feudalism resulted in less redistribution, lessgovernment, their new interaction and different function, namely, regulation versus production ofinputs.
(3) Third, the emergence of cities separated government from handicraft production, transportation,finance, and investment. The government regulated but did not produce capital inputs. Thisdifferentiates medieval European cities from ancient cities (the government supplies inputs) andOriental cities (the government distributes output). Medieval European cities are economic entitieson their own, not secondary to the government economic function.
(4) Fourth, the age of Mercantilism spelled the breakup of labor rationing (serfdom), the end ofrural common income, which redistributed income from peasants to landlords, and the substitutionof centralized taxation for sweeping feudal tribute. The government specialized in protection andlevied taxes as payment for public service.28 Protectionism, privileges, and other subsidies ofmercantilism meant government regulation of output with generally free, unregulated inputs of labor,land, and capital. This development resulted in another reduction of redistribution and governmentrestriction.
(5) Fifth, came the breakup of guilds, both by market forces of spawning rural industries and bythe deliberate action of local and central governments.29 This breakup created private wages andprivate profit.
(6) Sixth, private profit incentives fostered the movement for separable, non-confiscatory, non-redistributive public income. It ended confiscations, subsidies of colonial plantations, debtrepudiations, and excessive, arbitrary taxation. Public income became the private income of thegovernment, separate from the private income of firms and households. The government startedto serve the people as a public utility—a market government, as it were. The breakup ofgovernment predation led to the Financial Revolution and private finance fueled the IndustrialRevolution.30

The Taxonomy of Common Income 14
classic account of the origins of War Socialism is Carl Ballod, Der Zukunftsstaat: Produktion und Konsum in Sozialstaat(Stuttgart: Dietz, 1920). Another example was the privately-run, state-subsidized central plan colony in Java under theDutch, which we described in Chapter 4. The Portugese Jesuits organized forced plantation communes with centralplanning among American Indians, amply called reducciones. The best known were the Guaranis in what is nowParaguay and several others in the Sao Paulo region in Brazil. See Philip Caraman, The Lost Paradise: The JesuitRepublic in South America (New York: Seabury Press, 1975); and, Selim Abou, The Jesuit Republic of the Guaranis(1609-1768) and its Heritage (New York: Crossroad Pub. Co., and Paris: UNESCO, 1997). The example which provedto make the most long-lasting influence, survived by today, was the adaptation of Spanish mercantilism, with its privilegepolitics, in the Latin American colonies. We depict it by the backward-bending black arrow from cluster (3) to cluster(C) in figure 5.1. In the words of Douglass C. North, “the Spanish encomienda system in Mexico substituted theoverlordship of Spanish encomenderos for Aztec rulers. In return for ‘protection and justice’, the new rulers receivedtribute and forced labor.” Douglass C. North, Structure and Change in Economic History, p. 145. For a detailed analysissee, Ernest Feder, The Rape of the Peasantry: Latin America’s Landholding System and Andre G. Frank, MexicanAgriculture, 1521-1630: Transformation of the Mode of Production.
31James Tybout, “A Firm Level Chronicle of Financial Crises in the Southern Cone,” Journal of DevelopmentEconomics 24, no. 6 (December 1986): 371-400 and George A. Akerlof and Paul M. Romer, “Looting: The EconomicUnderworld of Bankruptcy for Profit,” pp. 18-23, 59.
The serial breakups of common income build the market path. Japan, the Asian Tigers, Chile, othernon-European societies, and, finally, post-Communist China and Vietnam wound their way to marketthrough their own breakups of inherited state socialism. The physical destruction of the network of thecentrally planned private corporations in Germany at the end of World War II preceded Germany’s returnto the market path. The administrative breakup of central-plan private monopolies, zaibatsu, in Japan afterWorld War II had a similar effect. The breakup point in Chile was government eradication of the networkof predatory financial-industrial groups (known as Grupos) in 1981-82.31 South Korea, Thailand, andIndonesia went through a similar process after the crisis of 1997. China and Vietnam, as we discussed inprevious chapters, consistently broke up the redistributive network of inherited state enterprises. In thelatter instances, the government acted in a protective custodial manner by restricting the residual enterprisenetwork from access to the income of the new-entrant market economy. China and similar countriescreated market economies with non-market government. This is an impossibility if seen on the one-dimensional map of market versus government, but is a normal outcome if seen on the two-dimensionalmap. The broken blue arrow in figure 5.1 indicates a possible path of convergence to classical marketeconomies once the eradication of the inherited enterprise network is complete.
The government, market, and socialist paths describe economic evolution on the two-dimensionalmap. Apart from evolution, the red arrows indicate socialist devolutions, which are governmentbreakdowns from various types of state socialism to predation without breakups of redistribution. Themost familiar example is the collapse of the Roman Empire and subsequent brigandry across Europe.Others are incessant conquests after the Neolithic Revolution, the Thirty-Year War in Germany during1618-1648, and protracted conflicts in Latin America and post-colonial Africa. The latest socialistdevolution is Enterprise Network Socialism.
The two-dimensional map points out two key developments of human progress. The first
The Taxonomy of Common Income 15
32Friedrich A. Hayek, The Road to Serfdom (Chicago: The University of Chicago Press, 1945). Chapter 4discusses a partial comeback.
33The World Bank, From Plan to Market. World Development Report 1996 (New York: Oxford UniversityPress for the World Bank, 1996). The latest restatement of this approach is in Rudiger Dornbusch, Keys to Prosperity(Cambridge, MA: The MIT Press, 2000). This paradigm is dominant but not universal. Mancur Olson advanced apowerful analysis which combines an opposition of market and both predatory government and private predation, andcomplementarity of market and what he calls “market-augmenting government.” See Mancur Olson, Power andProsperity: Outgrowing Communist and Capitalist Dictatorships (New York: Basic Books, 2000). It is only a nextlogical step to make these premises two-dimensional.
development is the invention of government (and, subsequently, income), which marked the breakup ofcommon output. The second development is the series of breakups of common income.
Together, they form a counter-clock-wise movement from primordial predation to modernprosperity (first, the two westward-northward arrows on the map, then the blue arrows). An alternativemovement comes full circle from primordial predation to agricultural central planning to franchised statesocialism to industrial central planning to modern predation of Enterprise Network Socialism (first, thegreen arrows northeastward, then the black arrows back and forth, and, finally, the southward red arrow).
One of the key observations of Friedrich A. Hayek, now broadly recognized, is that the twentiethcentury saw a counter-movement. It went from market and limited government to state socialism, in theextreme, to central planning.32 Post-Communist experience in Russia and similar countries adds an extrastep backwards, the devolution from central planning towards the historical archetype of non-governmentalcommunism.
The Diagonal From State Socialism to Market as a Special Case
Examine the two-dimensional map of economic systems in figure 5.1. One can readily draw a diagonalrunning from central planning through various clusters of state socialism to the market economy with limitedgovernment. This diagonal represents a special case. It is unwarranted to generalize it and to infer fromit that government is the only redistributive force. It is also not valid to generalize that state socialism is theonly socialism, that the extent of income redistribution and government restriction are the same in everycluster, that market and government are opposites, and that liberalization always leads to market, and neverto predation.
The dichotomy of market versus government and the equivalence of government with socialismgrew out of this one generalization—movement from state socialism to markets with limited government.This doctrine was articulated in Marxism, which viewed nationalization and government control as thestarting point of socialism. Then, in a bizarre twist in the evolution of ideas, this approach was developedby the Austrian thinkers, until it became, in recent decades, part and parcel of the canonical, one-dimensional consensus.33 This construct gave rise to the unidimensional map:
The Taxonomy of Common Income 16
34This is a composite representation of economic systems and their empirical examples found across theliterature under these and different names. For summaries, see John Hicks, A Theory of Economic History, pp. 9-34;Frederick C. Lane, Profits from Power: Readings in Protection Rent and Violence-Controlling Enterprises, pp. 5-7, 50-65; Manuel Gottlieb, A Theory of Economic Systems, pp. 31-184; M anuel Gottlieb, Comparative Economic Systems:Preindustrial and Modern Cluster Studies (Ames, IO: Iowa State University Press, 1988); Robert E. Hall and CharlesI. Jones, “The Productivity of Nations,” National Bureau of Economic Research, Working Paper 5812 (November 1996),pp. 18-21, 28-29; Immanuel Maurice Wallerstein, The Modern World-System, vols. 1-3 (New York: Academic Press, 1974-1989); and, Graeme Donald Snooks, The Ephemeral Civilization: Exploding the Myth of Social Evolution (London andNew York: Routledge, 1997), pp. 56-59.
35See Douglass C. North and Robert P. Thomas, The Rise of the Western World, pp. 6-8, 94. For a most elaborateanalysis, see Frederick C. Lane, Profits from Power: Readings in Protection Rent and Violence-Controlling Enterprises.
36Mancur Olson emphasizes this outcome in his Power and Prosperity: Outgrowing Communist and CapitalistDictatorships.
37Frederick C. Lane emphasizes this outcome in his Profits from Power: Readings in Protection Rent andViolence-Controlling Enterprises.
Market economy Government and socialism (state socialism)
Or, empirically, and using our earlier terms for major and additional clusters:34
Market economy State socialism: Mercantilism, political state socialism, the Welfare State,feudalism, slavery, franchised state socialism, central planning
On the one-dimensional map, state socialism means that state is socialism and socialism isstate—the concepts are identical and interchangeable. On the two-dimensional map, state socialism meanssomething different, that the government monopolizes redistribution and access to common income—aspecial, even though prominent and frequent, combination.
The frequency of the group that constitutes state socialism is natural. Predators benefit from scale.Predation, like violence, exhibits decreasing costs, displaces competition, and leads to a naturalmonopoly.35 Predators either become government36 or are supplanted by government, which takes overpredation.37 This has been the rule until the post-Communist case of the enterprise network, whichsubordinates the government to it. The frequency of state socialism makes it a tendency, but one that isnot universal. Restrictive government is neither necessary for socialism (as exemplified by private predationand by today’s Russia) nor sufficient (as exemplified by post-1978 China). State socialism stands as aspecial case or group of clusters.
Empirically, the one-dimensional map locates 8 out of 13 major clusters in figure 5.1. The 8 include7 clusters of state socialism and one of market. The one-dimensional map misses prehistoric societies withtheir development of government and the Neolithic Revolution. Prehistoric economies do not fit the one-

The Taxonomy of Common Income 17
dimensional diagonal because primordial redistribution was greater than the scope of government rationing.The unidimensional map further misses non-governmental, private predation. Yet, until modern times andeven recently in some parts of the world, private predation constituted the bulk of human economicenterprise. For millenniums, civilizations were like islands in the ocean of conquests, brigandry, andplunder. A high degree of redistribution coupled with the absence of any effective government generallyresulted in non-state socialism. Clusters are not equal in scope over time and space. By missing privatepredation, the unidimensional map misses more than half of human experience counted in man-years.
Most importantly for our study, the unidimensional map rules out the entire realm of post-centralplan economies. It cannot include a market economy under the aegis of a restrictive government such asChina and similar countries where government serves the function of protective custody. The one-dimensional map automatically excludes Enterprise Network Socialism in Russia and similar countries withuniversal redistribution of income and symbiont government. Nor can Eastern European and other post-Communist countries, which combine features of Russia and China, fit the one-dimensional map.
Figure 5.2 plots data on 42 post-Communist economies in the mid-1990s. It displays that theentire post-Communist development occurs on the green-colored diagonal, which is opposite in directionfrom the blue-colored diagonal of state socialism. For reference and comparison with figure 5.1, we copiedthe two extreme clusters. Industrial central planning is placed in the northeastern corner and classicalmarket economies in the southwestern corner of the map.
The horizontal axis in figure 5.2 measures the share of income redistribution in GDP. It retrievesthe data on private income in figure 2.1, but recalculates the figures to express shares in terms of commonincome (thus, 77.8 percent private income in China’s GDP becomes 22.2 percent common income and21.8 percent private income in Russia’s GDP becomes 78.2 percent common income). Following themethod applied in Chapter 2, income redistribution is approximated by the output of the inherited enterprisenetwork, which is calculated as the difference between total output and the output of the new entrant andother independent enterprises outside the network. The vertical axis provides rough estimates ofgovernment restriction as a share of GDP.
In contrast with generating reasonably confident percentages on income redistribution, we did notdevelop a reliable method of quantifying government restriction on the basis of published statistics. Instead,we resort to crude approximations using statistics on the government share of income redistribution andvarious qualitative, descriptive accounts of government control over the rest of the economy. Our estimatesof government restriction may be inaccurate by as much as 10-15 percentage points for many countries.The greatest weakness is an overestimate of government restriction in resource-rich Central Asian countriesand Azerbaijan. The government ostensibly controls energy and other resource production and exports,but, in reality, the enterprise network is in charge and the government is a symbiont, as in Russia. Wechose to err on the side of the government, not on the side of the redistributive enterprise network, whichweakens the negative correlation between them, and flattens the slope of the green-colored diagonal.Various alternative tests with possible adjustments of our estimates affect only the slope of the negative
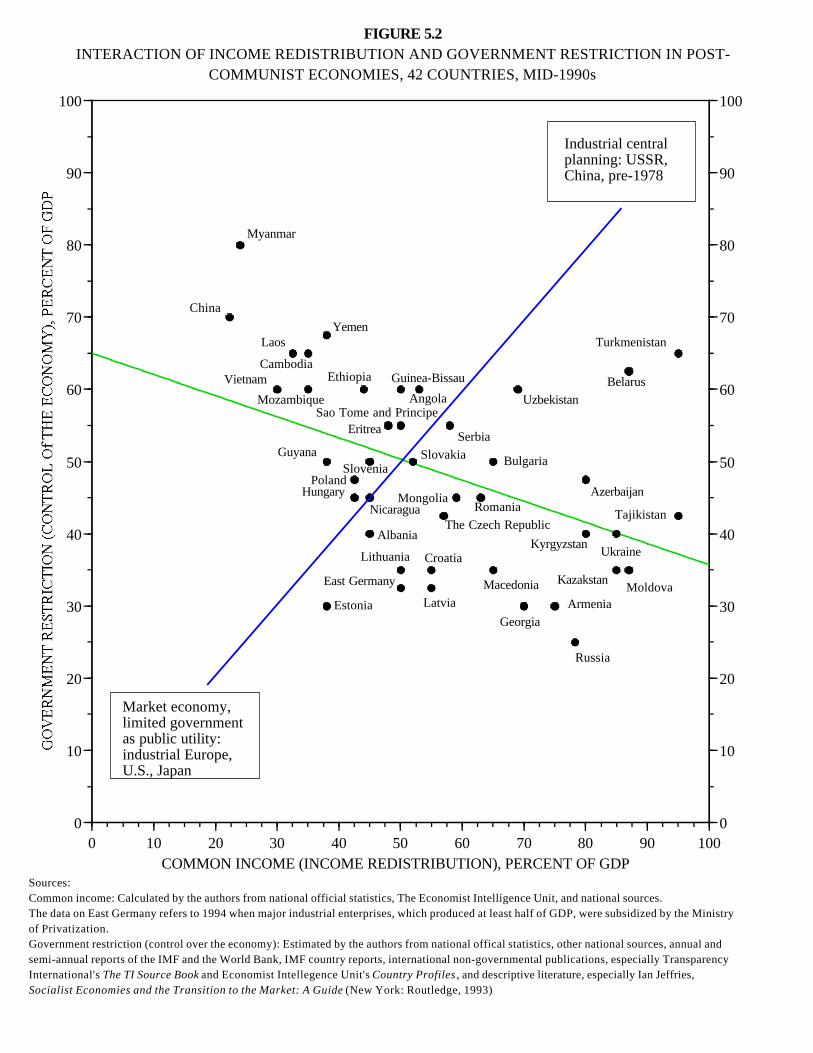
0
10
20
30
40
50
60
70
80
90
100
0
10
20
30
40
50
60
70
80
90
100
0 10 20 30 40 50 60 70 80 90 100COMMON INCOME (INCOME REDISTRIBUTION), PERCENT OF GDP
FIGURE 5.2INTERACTION OF INCOME REDISTRIBUTION AND GOVERNMENT RESTRICTION IN POST-
COMMUNIST ECONOMIES, 42 COUNTRIES, MID-1990s
China
Poland
Russia
Sources:Common income: Calculated by the authors from national official statistics, The Economist Intelligence Unit, and national sources.The data on East Germany refers to 1994 when major industrial enterprises, which produced at least half of GDP, were subsidized by the Ministryof Privatization.Government restriction (control over the economy): Estimated by the authors from national offical statistics, other national sources, annual andsemi-annual reports of the IMF and the World Bank, IMF country reports, international non-governmental publications, especially TransparencyInternational's The TI Source Book and Economist Intellegence Unit's Country Profiles , and descriptive literature, especially Ian Jeffries,Socialist Economies and the Transition to the Market: A Guide (New York: Routledge, 1993)
Georgia
RomaniaThe Czech Republic
MoldovaLatvia
Croatia
Mongolia
Kyrgyzstan
Belarus
Albania
Azerbaijan
Kazakstan
Estonia
Macedonia
Uzbekistan
Armenia
Turkmenistan
Tajikistan
Lithuania
Bulgaria
Serbia
Ukraine
Hungary
SloveniaSlovakia
East Germany
AngolaSao Tome and Principe
Nicaragua
Eritrea
Yemen
Ethiopia Guinea-Bissau
Mozambique
Cambodia
Myanmar
Guyana
Laos
Vietnam
Market economy,limited governmentas public utility:industrial Europe,U.S., Japan
Industrial centralplanning: USSR,China, pre-1978
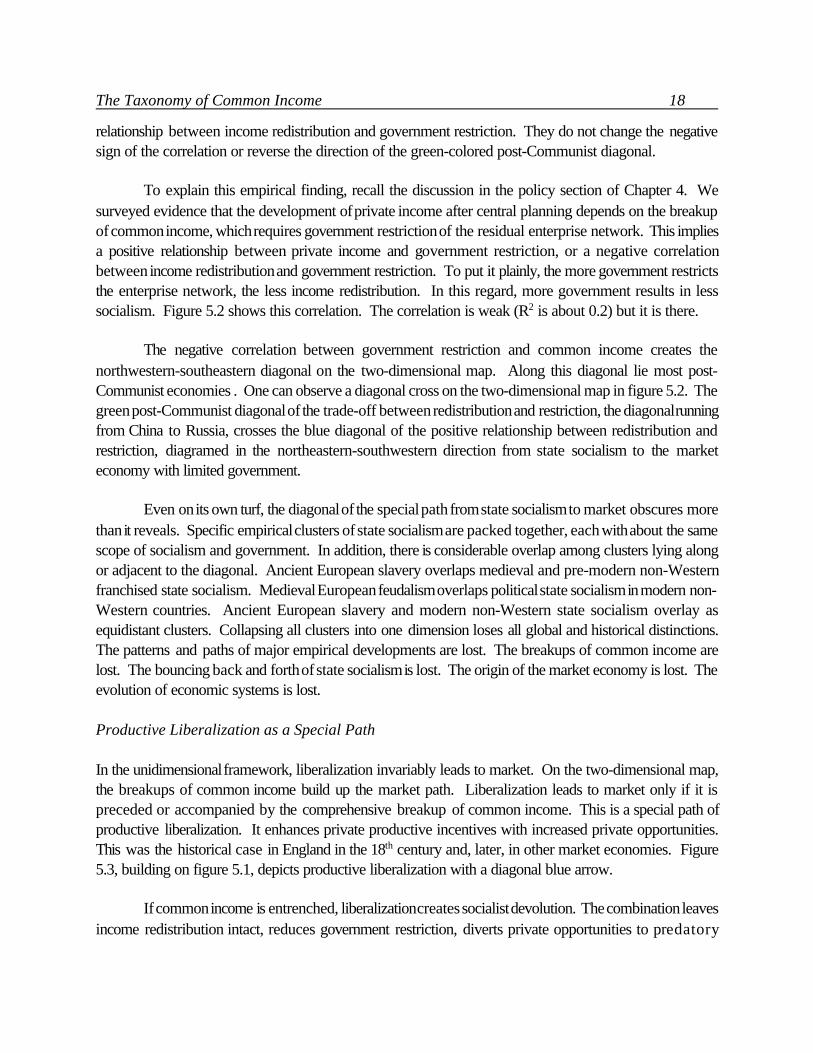
The Taxonomy of Common Income 18
relationship between income redistribution and government restriction. They do not change the negativesign of the correlation or reverse the direction of the green-colored post-Communist diagonal.
To explain this empirical finding, recall the discussion in the policy section of Chapter 4. Wesurveyed evidence that the development of private income after central planning depends on the breakupof common income, which requires government restriction of the residual enterprise network. This impliesa positive relationship between private income and government restriction, or a negative correlationbetween income redistribution and government restriction. To put it plainly, the more government restrictsthe enterprise network, the less income redistribution. In this regard, more government results in lesssocialism. Figure 5.2 shows this correlation. The correlation is weak (R2 is about 0.2) but it is there.
The negative correlation between government restriction and common income creates thenorthwestern-southeastern diagonal on the two-dimensional map. Along this diagonal lie most post-Communist economies . One can observe a diagonal cross on the two-dimensional map in figure 5.2. Thegreen post-Communist diagonal of the trade-off between redistribution and restriction, the diagonal runningfrom China to Russia, crosses the blue diagonal of the positive relationship between redistribution andrestriction, diagramed in the northeastern-southwestern direction from state socialism to the marketeconomy with limited government.
Even on its own turf, the diagonal of the special path from state socialism to market obscures morethan it reveals. Specific empirical clusters of state socialism are packed together, each with about the samescope of socialism and government. In addition, there is considerable overlap among clusters lying alongor adjacent to the diagonal. Ancient European slavery overlaps medieval and pre-modern non-Westernfranchised state socialism. Medieval European feudalism overlaps political state socialism in modern non-Western countries. Ancient European slavery and modern non-Western state socialism overlay asequidistant clusters. Collapsing all clusters into one dimension loses all global and historical distinctions.The patterns and paths of major empirical developments are lost. The breakups of common income arelost. The bouncing back and forth of state socialism is lost. The origin of the market economy is lost. Theevolution of economic systems is lost.
Productive Liberalization as a Special Path
In the unidimensional framework, liberalization invariably leads to market. On the two-dimensional map,the breakups of common income build up the market path. Liberalization leads to market only if it ispreceded or accompanied by the comprehensive breakup of common income. This is a special path ofproductive liberalization. It enhances private productive incentives with increased private opportunities.This was the historical case in England in the 18th century and, later, in other market economies. Figure5.3, building on figure 5.1, depicts productive liberalization with a diagonal blue arrow.
If common income is entrenched, liberalization creates socialist devolution. The combination leavesincome redistribution intact, reduces government restriction, diverts private opportunities to predatory
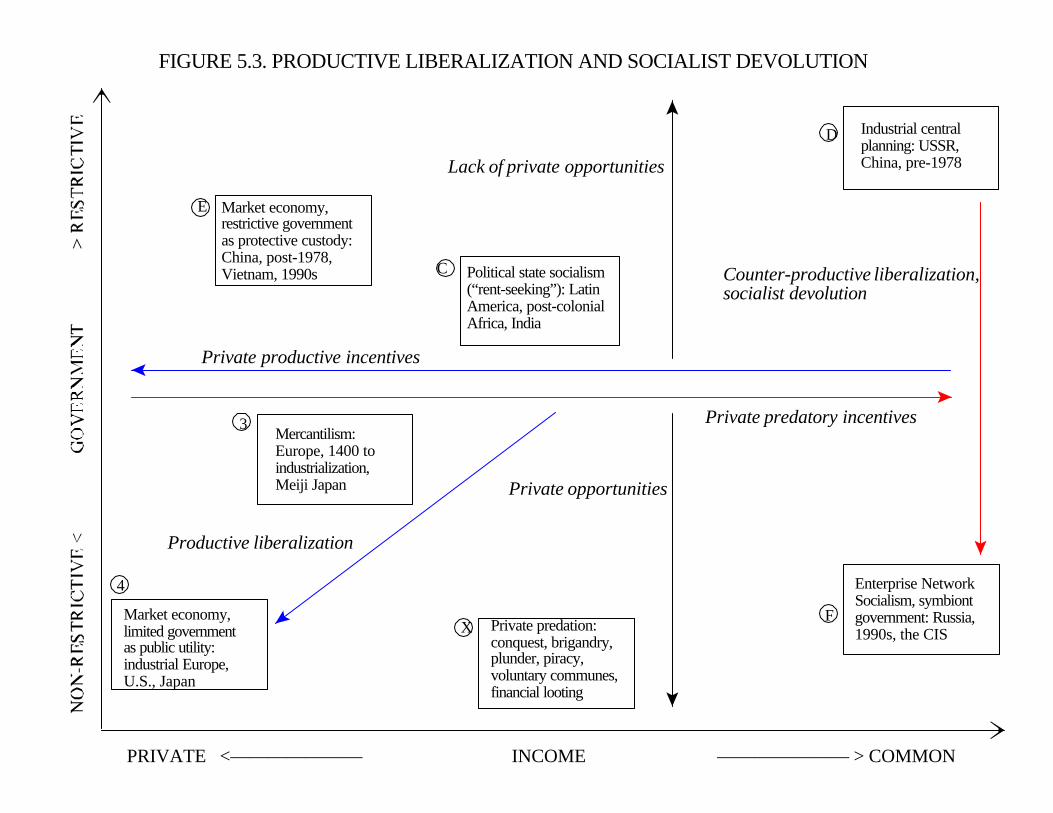
FIGURE 5.3. PRODUCTIVE LIBERALIZATION AND SOCIALIST DEVOLUTION
PRIVATE <——————— INCOME ——————— > COMMON
4
D
3
E
Industrial centralplanning: USSR,China, pre-1978
Mercantilism:Europe, 1400 toindustrialization,Meiji Japan
Market economy,limited governmentas public utility:industrial Europe,U.S., Japan
Market economy,restrictive governmentas protective custody:China, post-1978,Vietnam, 1990s
Enterprise NetworkSocialism, symbiontgovernment: Russia,1990s, the CIS
FPrivate predation:conquest, brigandry,plunder, piracy,voluntary communes,financial looting
Political state socialism(“rent-seeking”): LatinAmerica, post-colonialAfrica, India
C
X
Private productive incentives
Private predatory incentives
Lack of private opportunities
Private opportunities
Productive liberalization
Counter-productive liberalization,socialist devolution
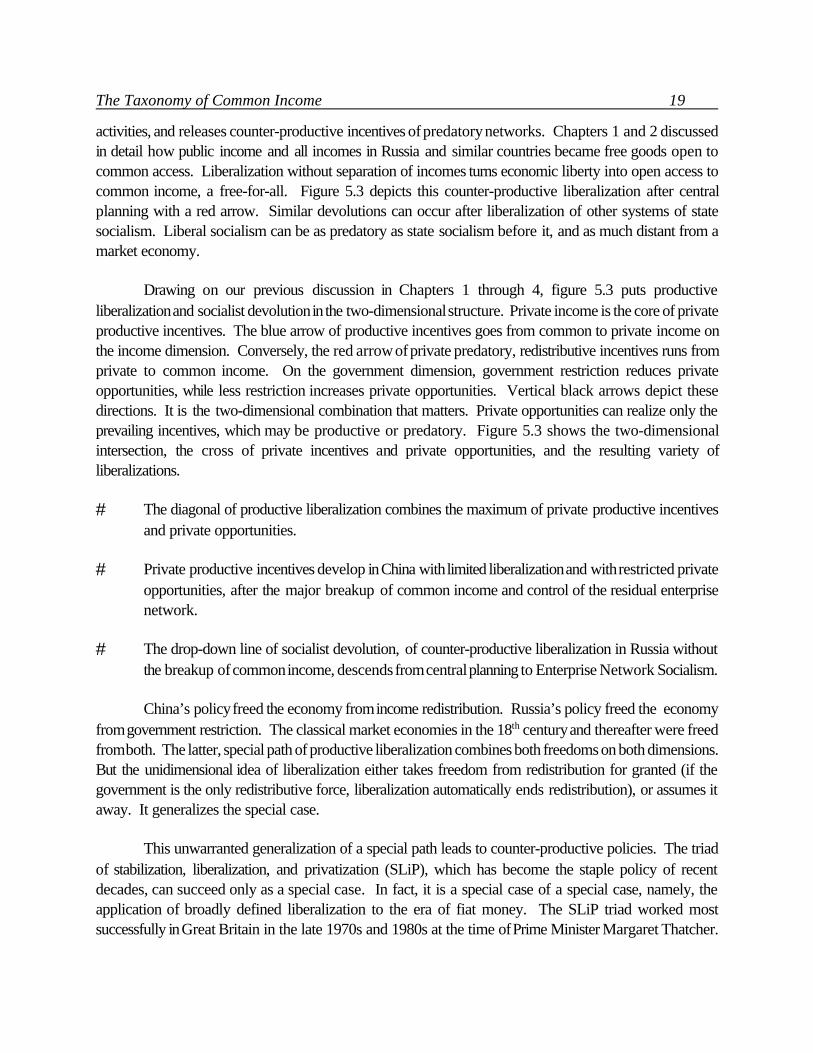
The Taxonomy of Common Income 19
activities, and releases counter-productive incentives of predatory networks. Chapters 1 and 2 discussedin detail how public income and all incomes in Russia and similar countries became free goods open tocommon access. Liberalization without separation of incomes turns economic liberty into open access tocommon income, a free-for-all. Figure 5.3 depicts this counter-productive liberalization after centralplanning with a red arrow. Similar devolutions can occur after liberalization of other systems of statesocialism. Liberal socialism can be as predatory as state socialism before it, and as much distant from amarket economy.
Drawing on our previous discussion in Chapters 1 through 4, figure 5.3 puts productiveliberalization and socialist devolution in the two-dimensional structure. Private income is the core of privateproductive incentives. The blue arrow of productive incentives goes from common to private income onthe income dimension. Conversely, the red arrow of private predatory, redistributive incentives runs fromprivate to common income. On the government dimension, government restriction reduces privateopportunities, while less restriction increases private opportunities. Vertical black arrows depict thesedirections. It is the two-dimensional combination that matters. Private opportunities can realize only theprevailing incentives, which may be productive or predatory. Figure 5.3 shows the two-dimensionalintersection, the cross of private incentives and private opportunities, and the resulting variety ofliberalizations.
# The diagonal of productive liberalization combines the maximum of private productive incentivesand private opportunities.
# Private productive incentives develop in China with limited liberalization and with restricted privateopportunities, after the major breakup of common income and control of the residual enterprisenetwork.
# The drop-down line of socialist devolution, of counter-productive liberalization in Russia withoutthe breakup of common income, descends from central planning to Enterprise Network Socialism.
China’s policy freed the economy from income redistribution. Russia’s policy freed the economyfrom government restriction. The classical market economies in the 18th century and thereafter were freedfrom both. The latter, special path of productive liberalization combines both freedoms on both dimensions.But the unidimensional idea of liberalization either takes freedom from redistribution for granted (if thegovernment is the only redistributive force, liberalization automatically ends redistribution), or assumes itaway. It generalizes the special case.
This unwarranted generalization of a special path leads to counter-productive policies. The triadof stabilization, liberalization, and privatization (SLiP), which has become the staple policy of recentdecades, can succeed only as a special case. In fact, it is a special case of a special case, namely, theapplication of broadly defined liberalization to the era of fiat money. The SLiP triad worked mostsuccessfully in Great Britain in the late 1970s and 1980s at the time of Prime Minister Margaret Thatcher.
The Taxonomy of Common Income 20
38Hernando De Soto, The Mystery of Capital: Why Capitalism Triumphs in the West and Fails EverywhereElse.
39More precisely, liberty is at least two-dimensional. To go beyond the two dimensions, confiscation ofproperty, such as capital and financial assets, limits one more liberty, and there are others. David Friedman sums it up:“Freedom is multi-dimensional because there are many different things with regard to which you can be free, and thereis no natural way of comparing them, of adding them up to give one number. So you have what mathematicians call apartial ordering of societies by how free they are. If country A has a certain amount of freedom in each dimension andcountry B has as much freedom in some dimensions and more in others, then we can say that B is freer than A. But ifcountry B has more of some freedoms and less of others, then B and A are incomparable, and that will often be the case.”In Walter E. Block, ed., Economic Freedom: Toward a Theory of Measurement. Proceedings of an International
Although Great Britain was a highly expansive Welfare State, with numerous producer and consumersubsidies, the core of its economy was based on private income. Liberalization and privatization in theWelfare State cut subsidies and curtailed segments of common income on the redistributive periphery.These segments of income redistribution are the essence of the Welfare State. When SLiP was appliedin the 1980s and 1990s to developing countries, which can be characterized as political state socialism(“rent-seeking”), it proved to be much harder to achieve sustained stabilization and sustained economicgrowth. Liberalization and privatization in much of Latin America and similar regions have been lessproductive than expected, and financial stabilization, unsustainable. Regarding this experience, Hernandode Soto chose a damning book subtitle: “Why capitalism triumphs in the West and fails everywhere else.”38
Under SLiP, deep-rooted redistributive networks evolved to replace old subsidies with new ones,sometimes on a larger scale. Examples include financial looting in Chile in the late 1970s-early 1980s untilthe government broke up the financial-industrial groups, the patronage system in Indonesia which explodedin 1997, sectoral subsidies in Brazil in the late 1990s, regional subsidies in Argentina, which resumed itseconomic crisis in 2000, and in many similar cases around the world.
Even worse outcomes evolved after the abolition of central planning. We discussed in detail inChapters 2 and 4 how SLiP invariably failed in post-Communist countries and how success was dependenton the policies of breaking up the inherited enterprise network Some of these policies liberalized marketsfor new-entrant firms. Other polices were illiberal, reinforcing government control over preexistingenterprises and restricting the links between the old and new sectors in the two-track economy. Illiberalpolicies may have limited private economic opportunities, but they had the beneficial effect of preventingpredatory devolution. Post-Communist experience demonstrates the two-dimensional trade-offs betweenfreedom from redistribution and freedom from restriction.
Two-Dimensional Liberty and Its Trade-Offs
Russia and China illustrate the idea which could have transpired from historical experience, namely, thateconomic liberty is two dimensional. One dimension is freedom from redistribution and the other is freedomfrom government restriction.39 Liberalization, in contrast, is one-dimensional. It is only freedom from
The Taxonomy of Common Income 21
Symposium (Vancouver, B.C.: The Fraser Institute, 1991), p. 46. One correction: countries B and A are comparable multi-dimensionally if their position on each dimension is measured separately and a comparison includes two or moremeasurements independently.
government restriction. If both freedoms develop in tandem, liberalization is productive. If not,liberalization releases redistribution from government monopoly and opens the redistribution of resourcesand income to common access. Once government control vanishes, predatory, redistributive networks ofenterprises and other economic participants are free to confiscate output and income from all members ofthe community.
The practical problem is that the two freedoms cannot work in tandem to achieve productiveliberalization unless the breakup of common income has already been attained to a significant degree. Thisprecondition existed in England in the 18th century. It did not, indeed cannot, exist at the time of thedissolution of central planning. This means that trade-offs exist between the two freedoms, resulting intrade-offs between private productive incentives and private opportunities. Consider the Chinese andRussian examples.
# The Chinese case (cluster E) entails more breakup of common income, more de-socialization, morefreedom from redistribution, but less liberalization. Private productive incentives increase, but thereare reduced private opportunities and temporary preservation of strong government controls.
# The Russian case (cluster F) entails more liberalization, less freedom from redistribution, more non-governmental predation, resulting in socialist devolution. Private opportunities increase, butcounter-productive incentives divert them to predation and cause contraction.
The trade-offs mean that we ask the two-dimensional, not the one-dimensional, questions. Thetwo-dimensional questions are, first, does government interference reduce or increase redistribution andby how much, and secondly, does liberalization reduce or increase redistribution. In contrast, the one-dimensional question is only if government interferes and how much.
As a general rule, the greater the extent of common income, the greater the initial distance from themarket, and the more that redistributive forces are entrenched in the economy, the less that liberalizationis initially warranted. Two simple conclusions follow, especially applicable to China and Russia.
1. In successful historical and contemporary economies, the more extensive the degree of common income,the more its breakup preceded or accompanied liberalization.
2. If redistribution did not decline before or together with government restriction, new private opportunitiesturned into access to preexisting common income. Open access to inherited common income led to privateand network predation within the pre-existing scope of redistribution.

The Taxonomy of Common Income 22
(Chapter 5, Section B follows)

0
10
20
30
40
50
60
70
80
90
100
0 10 20 30 40 50 60 70 80 90 100INCOME REDISTRIBUTION (PERCENT OF GDP)
PI
PIG
GI
RE
TARS
PW
AW
RT
AT
SR
FV
HE
PL
BO
PB
MRRD
DL
WS
PR
ME
OS
FA
TR
IL
TS
MM
CM
PV
FE
PS
HM
GU
CS
CN
SU
FT
CT
FYSF
GS
FG
LB
IT
DT
CL
VI
NS
CATT
CR
TCIS
KI
WM
UB
FMFS
SG
DS
SS
PE
NR
PA
WF
CF
LA
RA
FF
PY
NA
FL
MA
TF
TU
TW
SE
VT
PD
CQ
SL
VC
BR
TPAC
KR
IC
AP
PC
CD
MD
IP
PTFD
FP
MP
PP
CPRP
FC
ZA
PO
LM
EN
CC
ENS
FN
VP
CO
Private Cooperative Local government National state Common
Notes:1. Codes are listed in the legend for the two-dimensional table of economic species2. Colors designate property types which dominate a given economic species:
3. The size of the bubble estimates the rate of remuneration for the production of ideas, invention, and technological innovation
ANNEX 3.2THE FOUR-DIMENSIONAL TABLE OF ECONOMIC SPECIES

The Omnipresence of Common Income in a Multi-Dimensional World 2
14Adam Smith, An Inquiry Into the Nature and Causes of the Wealth of Nations (Washington: RegneryPublishing, Inc., 1998), pp. 669-670.
15Milton Friedman, A Theory of the Consumption Function (Princeton: Princeton University Press, 1957), p.16. Free markets in human beings also thrived in pre-industrial Russia, in the Ottoman Empire, etc.
16In the archaic Mediterranean, debtors were sold or self-sold into slavery which can be viewed as a debt/slavemarket. In classical Greece and Rome, slaves acquired in conquests were supplied by the government to mines in privateconcessions and plantations and then traded in secondary markets. In the Americas, slaves were imported from Africa(after the failed attempts to enslave American Indians, which was too costly to enforce) as a matter of private trade inprimary markets and then were sold and bought in secondary markets. In pre-industrial Russia, Korea, and some Islamicstates in Africa, slaves were a means of taxation by the centralized government. It assigned slaves together with land
in a free country, where the master is perhaps either a member of the colony assembly, or anelector of such a member, he dare not do this but with the greater caution and circumspection.The respect which he is obliged to pay to the master, renders it more difficult for him to protectthe slave. But in a country where the government is in a great measure arbitrary, where it isusual for the magistrate to intermeddle even in the management of the private property ofindividuals, and to send them, perhaps, a lettre de cachet if they do not manage it accordingto his liking, it is much easier for him to give some protection to the slave; and commonhumanity naturally disposes him to do so. The protection of the magistrate renders the slaveless contemptible in the eyes of his master, who is thereby induced to consider him with moreregard, and to treat him with more gentleness. Gentle usage renders the slave not only morefaithful, but more intelligent, and therefore, upon a double account, more useful. Heapproaches more to the condition of a free servant, and may possess some degree of integrityand attachment to his master’s interest, virtues which frequently belong to free servants, butwhich never can belong to a slave, who is treated as slaves commonly are in countries wherethe master is perfectly free and secure.
That the condition of a slave is better under an arbitrary than under a free government,is, I believe, supported by the history of all ages and nations.14
Multi-dimensional slavery
Before the world saw Enterprise Network Socialism in Russia and the two-track economy inChina, slavery alone was sufficient to abandon the paradigm of market vs. government. In the tough wordsof Milton Friedman, slavery comprised “a market in human beings.”15 Table 3.2 offers a short list ofvarious species of slavery in three dimensions.
The definition of slavery is as cruel as slavery itself. According to the article “Slavery” inEncyclopedia Britannica, “A slave was considered by law as chattel.” Historical practice confirms thislegal formula. In all societies listed in table 3.2, slaves were sold and bought in primary or secondarymarkets.16 Slaves were exported and imported, bequeathed and inherited, and exchanged for goods and
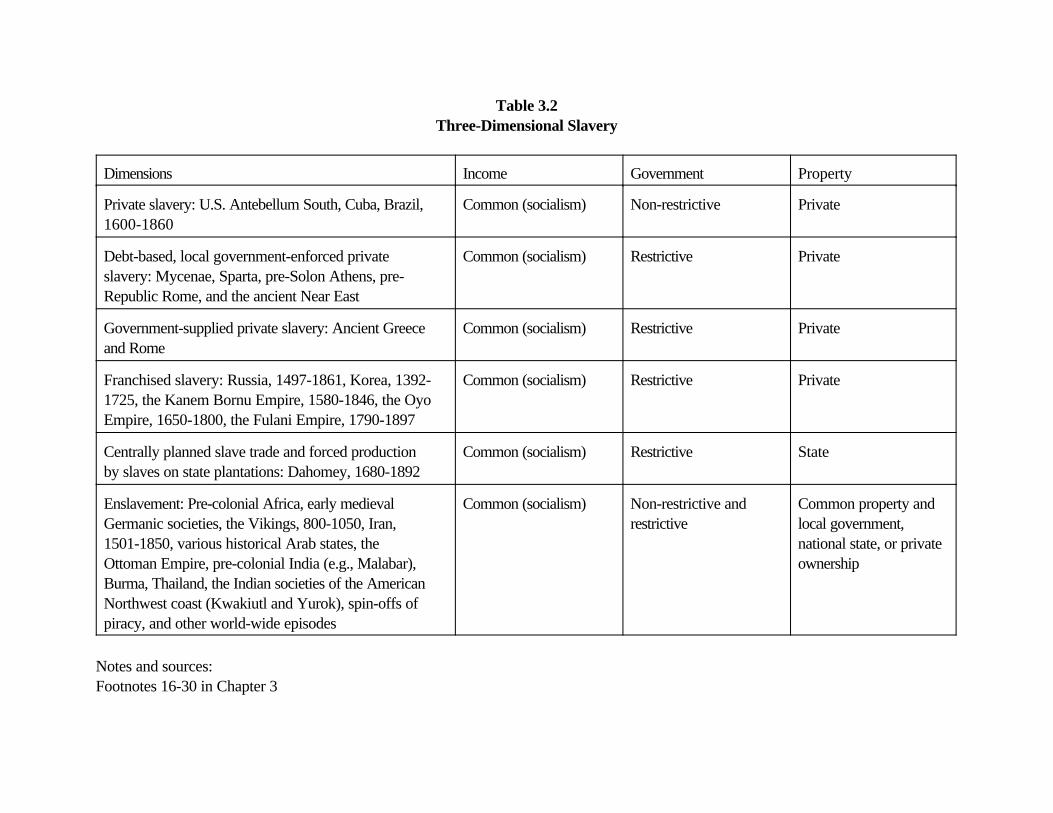
Table 3.2Three-Dimensional Slavery
Dimensions Income Government Property
Private slavery: U.S. Antebellum South, Cuba, Brazil,1600-1860
Common (socialism) Non-restrictive Private
Debt-based, local government-enforced privateslavery: Mycenae, Sparta, pre-Solon Athens, pre-Republic Rome, and the ancient Near East
Common (socialism) Restrictive Private
Government-supplied private slavery: Ancient Greeceand Rome
Common (socialism) Restrictive Private
Franchised slavery: Russia, 1497-1861, Korea, 1392-1725, the Kanem Bornu Empire, 1580-1846, the OyoEmpire, 1650-1800, the Fulani Empire, 1790-1897
Common (socialism) Restrictive Private
Centrally planned slave trade and forced productionby slaves on state plantations: Dahomey, 1680-1892
Common (socialism) Restrictive State
Enslavement: Pre-colonial Africa, early medievalGermanic societies, the Vikings, 800-1050, Iran,1501-1850, various historical Arab states, theOttoman Empire, pre-colonial India (e.g., Malabar),Burma, Thailand, the Indian societies of the AmericanNorthwest coast (Kwakiutl and Yurok), spin-offs ofpiracy, and other world-wide episodes
Common (socialism) Non-restrictive andrestrictive
Common property andlocal government,national state, or privateownership
Notes and sources:Footnotes 16-30 in Chapter 3
The Omnipresence of Common Income in a Multi-Dimensional World 3
to provincial and local officials for controlled production and tax collection and then slaves were traded in secondarymarkets. This was franchised serfdom affixed to franchised taxation (see below for details).
17Morris Silver, Economic Structures of Antiquity (Westport, CO, and London: Greenwood Press, 1995), pp.132-135.
18“Other questions (...) concerned the frequent necessity of defining the words ‘Goods and Commodities’. Wasmoney, that is, gold and silver coin and bullion, a commodity? If so deemed by the economists of the day, it was notso interpreted in enforcing the acts of trade. Were negroes ‘goods’ within the meaning of the act? The decision wasfinally rendered in the affirmative. (...) The earliest decision was rendered in 1689, when “the judges certified their opinionthat negroes were merchandise” (Calendar State Papers, Colonial, 1708-1709, ¶ 226). (...) The question not unnaturallyarises whether the term ‘dead commodities’ in the Barbadian Act of 1663, establishing the four and a half [percent] duty,was not intentionally so expressed in order to exclude negroes from its operation.” “The question was asked afterward,in 1720, whether Spanish ships, coming from Spanish possessions in America and laden with the products of thosecountries, could unload and sell their cargoes at an English plantation. (...) They brought negroes and English-manufactured goods and paid for them in silver coin and bullion. Such a trade was contrary to the navigation acts, whichforbade the exportation from the English colonies of any goods or commodities in foreign vessels. (...) This trade raisedtwo interesting questions: were negroes and money commodities under the navigation acts? If so the trade was clearlyillegal. The English crown lawyers easily decided the first question in the affirmative; but the second, a very serious onefrom the point of view of the money supply of England and the colonies, seemed to be covered by clause XV of the act,“Provided that this act or anything herein contained extend not to bullion,” and therefore never became an issue.”Charles M. Andrews, The Colonial Period of American History. England’s Commercial and Colonial Policy IV (NewHaven and London: Yale University Press, 1964), pp. 83-84, 62. The offensive language is that of the documents of thetime.
19In some cases, slaves served as the matching assets for government development subsidies. A Russian 19th
century classic, Dead Souls, by Nikolay Gogol, relates the story of an entrepreneur who purchases at discount from slaveowners the tax ledgers of their deceased slaves, which had not been registered yet as deceased in the tax rolls, in orderto use these slaves as collateral and qualifying assets for a land development subsidy from the Ministry of Finance.
20Stanley L. Engerman, “Slavery,” in The New Palgrave: A Dictionary of Economics, vol. 4 (London: TheMacmillan Press, 1987), pp. 350-355.
assets. Slaves were objects of titles and contracts since the ancient times.17 Slaves were objects ofproperty taxes, import tariffs, export duties, and trade regulations.18 Free people turned family membersor themselves into assets to redeem debt and were honored or seized as such assets. Slaves were usedand accepted as collateral for trade credit and bank loans.19 This list of functions is unambiguous: Slaveswere assets on the balance sheet against which owners could redeem or accumulate liabilities. In short,“slavery entails ownership of one person by another,”20 and by impersonal owners. Ownership of humanbeings as assets is the foundation of slavery.
In the spirit of the prior accounting discussion of property rights (ownership), we can offer theaccounting definition of slavery. Slaves are human beings operated as tradeable assets whose disposablenet value is under exclusive control of one or another owner. Accrual of returns on the labor of slaves isunder exclusive control of slave owners regardless of the eventual distribution of returns between slaves,owners, and the third parties such as the government. On the economic plane, slavery moves human beingsfrom labor markets to capital markets. In terms of the production function, slavery converts labor and
The Omnipresence of Common Income in a Multi-Dimensional World 4
21This point originates in John Locke. “This freedom from absolute, arbitrary power, is so necessary to, andclosely joyned with a man’s preservation, that he cannot part with, but by what forfeits his preservation and life together.For a man, not having the power of his own life, cannot, by compact, or his own consent, enslave himself to any one,nor put himself under the absolute, arbitrary power of another, to take away his life, when he pleases. No body can givemore power than he has himself; and he that cannot take away his own life, cannot give another power over it. (...) Thisis the perfect condition of slavery, which is nothing else, but the state of war continued, between a lawful conqueror,and a captive. For, if once compact enter between them, and make an agreement for a limited power on the one side, andobedience on the other, the state of war and slavery ceases, as long as the compact endures. For, as has been said, noman can, by agreement, pass over to another that which he hath not in himself, a power over his own life.” John Locke,“The Second Treatise of Government. An Essay Concerning the True Original, Extent, and End of Civil Government,”in John Locke, Two Treatises of Government (Cambridge: Cambridge University Press, 1988), pp. 284-285.
22This was fully understood by the contemporaries. Aleksandr Pushkin wrote in 1820: “Will I see, oh friends,the people non-oppressed and slavery fallen by the fiat of the Tsar?” Mikhail Lermontov wrote in 1837: “Farewell,unwashed Russia, the country of slaves, the country of masters (...) May it be that behind the mountain ridge of theCaucasus I will be hidden from your pashas,”—a rather prescient analogy with the Ottoman Empire.
23For extensive surveys see Seymour Drescher and Stanley L. Engerman, eds., A Historical Guide to WorldSlavery (New York: Oxford University Press, 1998); Paul Finkelman and Joseph C. Miller, eds., Macmillan Encyclopediaof World Slavery, v. 1-2 (New York: Simon & Schuster, 1998); Junius P. Ridriguez, ed., The Historical Encyclopedia ofWorld Slavery, v. 1-2 (Santa Barbara: ABC-CLIO, 1997); Junius P. Rodriguez, Chronology of World Slavery (Sant aBarbara: ABC-CLIO, 1999); Martin A. Klein, Historical Dictionary of Slavery and Abolition (Lanham, MD and London:The Scarecrow Press, 2002); Orlando Patterson, Slavery and Social Death: A Comparative Study (Cambridge: HarvardUniversity Press, 1982),pp. 353-364 and passim; William D. Phillips, Slavery from Roman Times to the Early TransatlanticTrade (Minneapolis: University of Minnesota Press, 1985); and Richard Hellie, “Slavery,” in Encyclopedia Britannica.
human capital into physical capital as a factor of production. On the existential plane, slavery representsseparation between human body as an ontological given and human capital, including human body itself.Slaves are human capital owned by others than those in whom individual human capital is embodied.21 Itis this existential separation that makes it possible that human beings become assets on the balance sheetof other owners.
This accounting definition of slavery makes a sharp distinction between slavery and serfdom.Slaves are tradeable assets, serfs are not. By this accounting definition, pre-industrial Russia in 1497-1861did not have serfdom. It was slavery par excellence.22 Numerous species of serfdom, indenturedservitude, peonage, and forced labor are different systems. They lie beyond table 3.2.
This accounting definition identifies various species of slavery across economies. It singles out sixmajor species of slavery in vastly different economies in table 3.2. Due to our fragmentary knowledge, thelist may be incomplete.23 This is a selection limited in enumeration of species (there may be more than sixmajor species) and in location of enumerated species (there are more examples of each species and somecases may need relocation or exception). We submit table 3.2 not as a comprehensive analysis of slaverybut only as a cross-section of trilateral heterogeneity exemplified by slavery. This is an exercise in three-dimensional accounting. All possible factual corrections reinforce the table if they verify three-dimensionalheterogeneity and refute it otherwise.
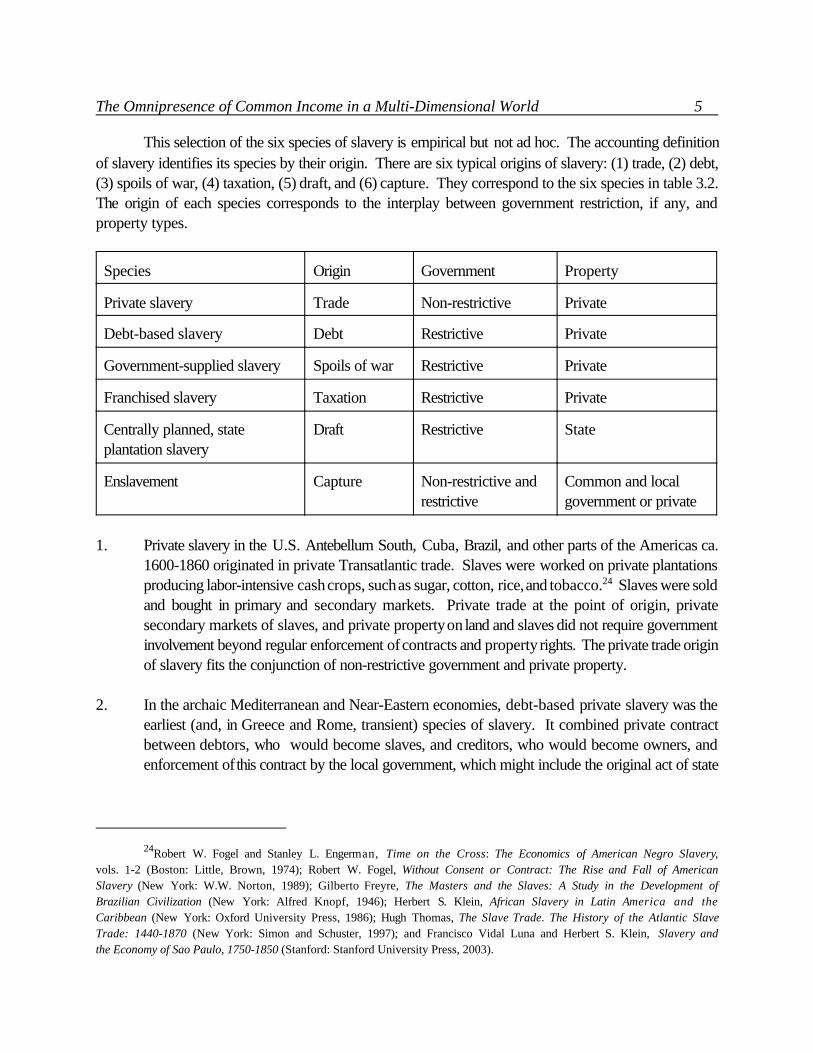
The Omnipresence of Common Income in a Multi-Dimensional World 5
24Robert W. Fogel and Stanley L. Engerman, Time on the Cross: The Economics of American Negro Slavery,vols. 1-2 (Boston: Little, Brown, 1974); Robert W. Fogel, Without Consent or Contract: The Rise and Fall of AmericanSlavery (New York: W.W. Norton, 1989); Gilberto Freyre, The Masters and the Slaves: A Study in the Development ofBrazilian Civilization (New York: Alfred Knopf, 1946); Herbert S. Klein, African Slavery in Latin America and theCaribbean (New York: Oxford University Press, 1986); Hugh Thomas, The Slave Trade. The History of the Atlantic SlaveTrade: 1440-1870 (New York: Simon and Schuster, 1997); and Francisco Vidal Luna and Herbert S. Klein, Slavery andthe Economy of Sao Paulo, 1750-1850 (Stanford: Stanford University Press, 2003).
This selection of the six species of slavery is empirical but not ad hoc. The accounting definitionof slavery identifies its species by their origin. There are six typical origins of slavery: (1) trade, (2) debt,(3) spoils of war, (4) taxation, (5) draft, and (6) capture. They correspond to the six species in table 3.2.The origin of each species corresponds to the interplay between government restriction, if any, andproperty types.
Species Origin Government Property
Private slavery Trade Non-restrictive Private
Debt-based slavery Debt Restrictive Private
Government-supplied slavery Spoils of war Restrictive Private
Franchised slavery Taxation Restrictive Private
Centrally planned, stateplantation slavery
Draft Restrictive State
Enslavement Capture Non-restrictive andrestrictive
Common and localgovernment or private
1. Private slavery in the U.S. Antebellum South, Cuba, Brazil, and other parts of the Americas ca.1600-1860 originated in private Transatlantic trade. Slaves were worked on private plantationsproducing labor-intensive cash crops, such as sugar, cotton, rice, and tobacco.24 Slaves were soldand bought in primary and secondary markets. Private trade at the point of origin, privatesecondary markets of slaves, and private property on land and slaves did not require governmentinvolvement beyond regular enforcement of contracts and property rights. The private trade originof slavery fits the conjunction of non-restrictive government and private property.
2. In the archaic Mediterranean and Near-Eastern economies, debt-based private slavery was theearliest (and, in Greece and Rome, transient) species of slavery. It combined private contractbetween debtors, who would become slaves, and creditors, who would become owners, andenforcement of this contract by the local government, which might include the original act of state
The Omnipresence of Common Income in a Multi-Dimensional World 6
25Among the voluminous literature see William L. Westermann, The Slave Systems of Greek and RomanAntiquity (Philadelphia: American Philosophical Society, 1955); Moses I. Finley, Early Greece: The Bronze and ArchaicAges (London: Chatto & Windus, 1981); Moses I. Finley, Economy and Society in Ancient Greece (New York: VikingPress, 1982); Paul Cartledge, Agesilaos and the Crisis of Sparta (London: Duckworth, 1987); Paul Cartledge, Sparta andLakonia: A Regional History, 1300-362 B.C. (London and New York: Routledge, 2002); Sandra R. Joshel, Work,Indentity, and Legal Status at Rome: A Study of the Occupational Inscriptions (Norman: University of Oklahoma Press,1992); Morris Silver, Economic Structures of Antiquity, pp. 117-122; Orlando Patterson, Slavery and Social Death, pp.124-126; and Gregory C. Chirichigno, Debt Slavery in Israel and the Ancient Near East (Sheffield: JSOT Press, 1993).
26The literature traditionally focused on slaves, masters, and free citizens but one can deduce the role of thegovernment at the point of origin. See Moses I. Finley, Economy and Society in Ancient Greece; Moses I. Finley,Ancient Slavery and Modern Ideology (London: Chatto & Windus, 1980); Moses I. Finley, Ancient History: Evidenceand Models (New York: Viking Press, 1986); Moses I. Finley, The Ancient Economy (Berkely: University of CaliforniaPress, 1999); W.V. Harris, “Demography, Geography, and Sources of Roman Slaves,” Journal of Roman Studies, vol.89 (Annual 1999): 62-76; Yvon Garlan, Slavery in Ancient Greece (Ithaca: Cornell University Press, 1988); Nicolas R. E.Fisher, Slavery in Classical Greece (London: Bristol Classical, 1993); Arnold H.M. Jones, The Later Roman Empire, 284-602: A Social, Economic, and Administrative Survey, vols. 1-2 (Oxford: Basil Blackwell, 1964); Keith R. Bradley, Slavesand Masters in the Roman Empire: A Study in Social Control (New York: Oxford University Press, 1987); Moses I.Finley, ed., Classical Slavery (London: F. Cass, 1987); Keith R. Bradley, Slavery and Society at Rome (Cambridge andNew York: Cambridge University Press, 1994); and Frederick H. Thompson, The Archaeology of Greek and RomanSlavery (London: Duckworth, 2003).
27This system is best described for India by Francois Bernier, Travels in the Mogul Empire A.D. 1656-1688(Westminster: Archibald Constable & Co., 1891), p. 224 and Angus Maddison, Class Structure and Economic Growth:India and Pakistan since the Moghuls (London: Gerge Allen & Unwin, 1971), pp. 17-34. For Russia, see Vasilii O.Kliuchevskii, A History of Russia, vol. 2 (London: J.M. Dent & Sons, Ltd. and New York: E.P. Dutton & Co., 1912).
enslavement.25 Private property interplayed with restrictive government.
3. The principal but largely overlooked feature of slavery in classical Greece and Rome is that it isgovernment-supplied by conquests and distributed to private owners as the spoils of war. Thegovernment allocated to citizens (1) land and slaves to cultivate it and (2) private concessions insilver and other metal mining and slaves to mine them. Plantations (e.g., Roman latifundia)accumulated both through private trade in land and slaves and through government allocations.26
This system matched restrictive government and private property.
4. Franchised slavery in Russia in 1497-1861, in Korea in 1392-1725, and in several African pre-colonial Islamic states originated in franchised taxation. The centralized government in manymedieval and pre-modern economies in Asia and Africa and in Russia assigned simultaneously taxcollection quotas and land allocations to provincial and local officials. They could collect taxrevenues for their own upkeep from peasant communities on the land under their control only afterand as a residual of the fixed revenue targets due to the central government.27 We call this systemfranchised taxation. All non-remitted tax balances accrue to the franchisees’ debt. In order to enforce remittance oftax revenues in full, the government at the next stage turned land into inheritable private property
The Omnipresence of Common Income in a Multi-Dimensional World 7
28There is no literature on Russia which directly corresponds to this interpretation but any economic and socialhistory text on Russia from the 15th century to 1861 can provide ample evidence. See, e.g., Vasilii O. Kliuchevskii, AHistory of Russia; Richard Hellie, Slavery in Russia, 1450-1725 (Chicago: University of Chicago Press, 1982); and PeterKolchin, Unfree Labor: American Slavery and Russian Serfdom (Cambridge: Harvard University Press, 1987). On Korea,see James B. Palais, Politics and Policy in Traditional Korea (Cambridge: Harvard University Press, 1991); James B.Palais, Confucian Statecraft and Korean Institutions (Seattle: University of Washington Press, 1996); Mark A. Peterson,“Slaves and Owners, or Servants and Masters? A Preliminary Examination of Slavery in Traditional Korea,” Transactionsof the Korea Branch of the Royal Asiatic Society 60, no. 1 (1985): 31-41; Seung-ki Hong, “A MethodologicalRetrospective on Comparative Studies of the Koryo Nobi,” Paper presented at the annual meeting of Association forAsian Studies, San Diego, March 2000; and Orlando Patterson, Slavery and Social Death, pp. 42, 183-184, 377, 468, andpassim . On slavery in Islamic states in Africa, which exhibited franchised slavery, see, e.g., John R. Willis, ed., Slavesand Slavery in Muslim Africa (London: F. Cass, 1985); Orlando Patterson, Slavery and Social Death, pp. 354-357 andpassim; Humphrey J. Fisher, Slavery in the History of Muslim Black Africa (New York: New York University Press, 2001).Orlando Patterson, Slavery and Social Death,pp. 122-123, provides examples of hierarchical transfers of thousands ofslaves in the Bornu, Oyo, and Fulani Empires by local to provincial governors and by the latter to the central governmentto redeem their respective tax (tribute) debts. He notes a similar pattern in Korea and elsewhere (pp. 123-124). In Russia,tax-indebted franchisees (dvoriane, meaning courtier/estate owners, and pomeshchiki, meaning servicemen placed onland and estate) rather mortgaged their slaves and remitted cash.
29Karl Polanyi, Dahomey and the Slave Trade: An Analysis of an Archaic Economy (Seattle: University ofWashington Press, 1968); Patrick Manning, Slavery, Colonialism, and Economic Growth in Dahomey, 1640-1960(Cambridge and New York: Cambridge University Press, 1982); Robin Law, “Slave-Raiders and Middlemen, Monopolistsand Free-Traders: The Supply of Slaves for the Atlantic Trade in Dahomey c. 1715-1850,” Journal of African History 30,no. 1 (January 1989): 45-69; Patience Essah, “Dahomey,” in Junius R. Rodriguez, ed., The Encyclopedia of World Slavery,v. 1, p. 207; and Martin A. Klein, “West Africa,” in Seymour Drescher and Stanley L. Engerman, eds., A Historical Guideto World Slavery, pp. 34-35.
of these officials, which made the tax collection duties and debts hereditary. Franchised taxationacquired an added feature in the countries with the open land and a high land/labor ratio wherepeasants could escape the tax levy. The government bonded peasants to land and to local land-owning tax officials in order to enforce tax collection. To make the tax debt of the franchisees(unpaid tax revenue balances) collectible, the government made their bonded peasants tradeableand inheritable assets. This is the specific origin of franchised slavery.28 It combines restrictivegovernment with private property.
5. Both the rise and the abolition of the Transatlantic slave trade engendered a unique species ofslavery—centrally planned, state plantation slavery in Dahomey, ca. 1680-1892. The governmentamassed slaves for export to Brazil and the Caribbean and alternated between their work on stateplantations and slave trade. Competitive slave trade under government control constituted privateconcessions and can be called franchised slave trade. When the Transatlantic slave trade wasbanned in the 19th century, the Dahomey government substituted domestic plantation labor inresponse to the growing European and Arab demand for plantation crops (palm oil, peanut oil,etc.).29 Forced production on state plantations was a species of central planning combined withstate slavery and franchised slave trade. One can mark near-total government and state ownershipfor this species of slavery.
The Omnipresence of Common Income in a Multi-Dimensional World 8
30In addition to encyclopedic overviews listed in footnote 23 and the literature surveyed by Orlando Patterson,Slavery and Social Death, pp. 105-131and 398-401, see miscellaneous cases in, e.g., Hugh Thomas, The Slave Trade.The History of the Atlantic Slave Trade: 1440-1870, pp. 33-286; Pierre Dockes, Medieval Slavery and Liberation(Chicago: University of Chicago Press, 1982); Michael McCormick, “New Light on the Dark Ages: How the Slave TradeFuelled the Carolingian Economy,” Past & Present, issue 177 (November 2002): 17-54; Carl I. Hammer, A Large-ScaleSlave Society of the Early Middle Ages: Slaves and their Families in Early-Medieval Bavaria (Burlington: Ashgate,2002); David A. Pelteret, Slavery in Early Mediaeval England: From the Reign of Alfred until the Twelfth Century(Woodbridge, U.K. and Rochester: Boydell Press, 1995); Ruth M. Karras, “Concubinage and Slavery in the Viking Age,”Scandinavian Studies 62, no. 2 (Spring 1990): 141-162; Muray Gordon, Slavery in the Arab World (New York: NewAmsterdam, 1989); Y. Hakan Erdem, Slavery in the Ottoman Empire and its Demise, 1800-1909 (Houndmills, U.K.:Macmillan Press and New York: St. Martin’s Press, 1996); Ehud R. Toledano, Slavery and Abolition in the OttomanMiddle East (Seattle: University of Washington Press, 1998); Leland Donald, “The Slave Trade on the Nort hwest Coastof North America,” in Barry L. Isaac, ed., Research in Economic Anthropology: A Research Annual, vol. 6 (Greenwich:JAI Press, 1984), pp. 121-158; Leland Donald, Aboriginal Slavery on the Northwest Coast of North America (Berkeley:University of California Press, 1997); Robert H. Ruby and John A. Brown, Indian Slavery in the Pacific Northwest(Spokane: A.H. Clark Co., 1993); David Feeny, “The Decline of Property Rights in Man in Thailand, 1800-1913,” Journalof Economic History 49, no. 2 (June 1989): 285-296; and Daniel J. Vitkus, ed, Piracy, Slavery, and Redemption: BarbaryCaptivity Narratives from Early Modern England (New York: Columbia University Press, 2001). And of course thereis the story of that most famous of all captive slaves, Miguel de Cervantes.
31Orlando Patterson, Slavery and Social Death, pp. 105-131.
6. Enslavement encapsulates hundreds of sub-species of slavery through history around the world.The best documented cases include pre-colonial Africa, early medieval Germanic societies, theVikings ca. 800-1050, Iran in 1510-1850, various historical Arab states, the Ottoman Empire,pre-colonial India (e.g., Malabar and other provinces), Burma, Thailand, the Indian societies of theAmerican Northwest coast (Kwakiutl and York), spin-offs of piracy, and numerous other world-wide incidences.30 For each individual not born in slavery, enslavement precedes other species ofslavery. It originates in capture and ends in what Orlando Patterson termed ‘social death.’31 Inaccounting terms, enslavement confiscates private body and human capital and converts them intocommon property between the individual and either private captors or the local government andnational state which enslaved the individual for trade. Enslavement automatically starts with makingproperty common and ends up in private, local government, or national state ownership in variousempirical cases under either limited or restrictive government.
This grim journey around the world of slaves and masters unveils universal bilateral heterogeneityon the government and property dimensions. Any extent of government restriction, from limited in theAntebellum U.S. South to near-total in Dahomey, can coexist with any property type, from commonproperty through enslavement to private and state ownership of human beings.
On the income dimension, slavery always entails common income. Remuneration of slaves, usuallyin kind, is always smaller than their economic contribution. Modern research has shown that the very raisond’etre of slavery is redistributive transfer of producer surpluses from slaves to slave owners:
The Omnipresence of Common Income in a Multi-Dimensional World 9
32Stanley L. Engerman, “Slavery,” p. 350. For a definitive study based on growth accounting techniques(accounting for the contribution of labor, capital, land, and factor productivity) see Robert W. Fogel and Stanley L.Engerman, Time on the Cross: The Economics of American Negro Slavery, vol. 1-2. An additional econometric test isin Elizabeth B. Field, “The Relative Efficiency of Slavery Revisited: A Translog Production Function Approach,”American Economic Review 78, no. 3 (June 1988): 543-549. For a similar reasoning on ancient classical slavery seeGeoffrey de Ste. Croix, The Class Struggle in the Ancient Greek World (Ithaca: Cornell University Press, 1981).
33This selection by owners and self-selection by slaves solves the problem of asymmetric information in a wayakin to sharecropping. On the latter, see a summary and the literature in Joseph E. Stiglitz, “Information and the Changein the Paradigm in Economics,” American Economic Review 92, no. 3 (June 2002): 460-501.
34See Arnold H.M. Jones, The Later Roman Empire; Pierre Bonnassie, From Slavery to Feudalism in SouthWestern Europe (Cambridge and New York: Cambridge University Press, 1991); and Jesper Carlsen, “Coloni,”in JuniusP. Ridriguez, ed., The Historical Encyclopedia of World Slavery, v. 1, p. 173.
35Ronald Findlay, “Slavery, Incentives, and Manumission: A Theoretical Model,” Journal of Political Economy83, no. 5 (October 1975): 923-933; Frank McGlynn, ed., Perspectives on Manumission, special issue of Slavery andAbolition (December 1989); and Rosemary Brana-Shute, “Manumission,” in Seymour Drescher and Stanley L. Engerman,eds., A Historical Guide to World Slavery, pp. 260-266.
“The benefit of coerced labor to the slave owner involves a redistribution of that part of theincome above subsistence that would go to a free worker.”32
If this were not so, slave owners would have waged manumissions to discount transaction costsof maintenance and enforcement, and slavery would have been a minor and transient phenomenon. Alas,manumissions occurred only when the slave population grew disproportionally relative to available land andthe marginal product of slaves rendered lower than maintenance and enforcement costs. The producersurplus for redistributive transfer from slaves to owners dissipated. At that point, it became efficient toselect the most productive slaves and convert them into indentured tenants. Owners moved to assign feesand give a buyout option to those slaves who could pay high rent in cash and in kind, by labor and a shareof output.33 The best known massive case of manumission was agricultural servitude in the Roman Empirecalled coloni.34 Its selective origin explains why slavery and coloni were complementary. Indenturedservitude instead of contractual rent ensured a buyout fee. Still, this selective coloni was a milder speciesof coerced labor than universal serfdom which replaced it in Western Europe when labor shortagesreemerged. But this is a story for another occasion. By and large, manumissions were rare.35 In all majorcases except Rome, slavery was abolished by government fiat. The secular persistence of slavery in eachempirical case proves that it carries redistribution of output and/or income. Otherwise slavery would notexist by the voluntary choice of slave owners. They would abolish it through manumission.
All species of slavery make income common. Each species of slavery exhibits its own specific rateof redistribution of income and/or output and its own specific rate of government restriction. We tried toapproximate them in Annexes 3.1 and 3.2. These estimates are as rough as can be expected when onelumps together numerous cases of each species in different countries and epochs. These are crudelyestimated averages for many historical specimens of each species of slavery. Examination of each specific
The Omnipresence of Common Income in a Multi-Dimensional World 10
36John K. Thornton, “Africa,” in Seymour Drescher and Stanley L. Engerman, eds. , A Historical Guide to WorldSlavery, p. 28.
37This observation belongs to F. Scott Fitzgerald. Found in The Short Stories of F. Scott Fitzgerald: A NewCollection (New York: Charles Scribner’s Sons, 1989), p. 209. In another context it is made, in the title and in substance,by David Feeny, “The Decline of Property Rights in Man in Thailand, 1800-1913.” This point can be viewed as the otherside of the positive relationship between property rights with economic freedom and the burden of slavery quoted earlierfrom Adam Smith. Adam Smith, An Inquiry Into the Nature and Causes of the Wealth of Nations, pp. 669-670.
case will not only refine measurements but increase the three-dimensional variation throughout the map.The purpose of this exercise is not an accurate evaluation of the rate of extraction of producer surplusesbut a demonstration of three-dimensional heterogeneity. Table 3.2 offers its qualitative assessment.Annexes 3.1 and 3.2 locate all species of slavery in different cells which indicate different deciles of incomeredistribution and government restriction. Slavery can combine various but always high extent of incomeredistribution with any, low or high, extent of government restriction and with any type of property.
Most importantly, limited government and private property coexist with high extent of commonincome under private, trade-based slavery in the Antebellum U.S. South and the Americas. This representsa major case of non-state socialism. A legal point leads to the above economic inference:
“In the legal sense, the slave has become the subject of a master rather than the subject of a state.The master takes over the rule-generating and enforcing functions of the state. (...) [This means]extrastatal jurisdiction (...) [and] the existence of an exempt sphere of private justice.”36
The treatment of private slavery as non-state socialism may sound paradoxical but it rests on asimple identity. Socialism is redistribution of income and/or output. Private slavery is redistribution ofincome and/or output conducted extra-state. Private slavery joins Enterprise Network Socialism,brigandry, piracy, voluntary communes (e.g., the Plymouth Colony), and primordial common output(communism without government) in the southern strip in figure 3.3 and in the bottom rows in Annexes 3.1and 3.2 as a species of non-state socialism.
More paradoxical and rather unsettling are implications of slavery for property rights.
1. The slave trade constitutes privatization of assets because it converts common property ofenslavement into private property.
2. Abolition of private slavery constitutes infringement upon and abrogation of property rights ofowners and confiscation of private assets by the government.37 It is transitory nationalization ofassets until human capital is vested in the emancipated human bodies.
The Omnipresence of Common Income in a Multi-Dimensional World 11
38“I absolutely insist on protecting private property. It is natural and salutary that the individual should beinspired by the wish to devote a part of the income from his work to building up and expanding a family estate. Supposethe estate consists of a factory. I regard it as axiomatic, in the ordinary way, that this factory will be better run by oneof the members of the family than it would be by a State functionary—providing, of course, that the family remainshealthy. In this sense, we must encourage private initiative. On the other hand, I am distinctly opposed to property inthe form of anonymous participation in societies of shareholders. This sort of shareholder produces no other effort butthat of investing his money, and thus he becomes the chief beneficiary of other people’s effort: the workers’ zest for theirjob, the ideas of an engineer of genius, the skill of an experienced administrator. (...) Such gains belong by right to thenation, which alone can draw a legitimate profit from them. In this way, at least, those who create these profits—theengineers and workers—are entitled to be the beneficiaries. In my view, joint-stock companies should pass in theirentirety under the control of the State.” Hitler’s Table Talk 1941-1944: His Private Conversations (New York: EnigmaBooks, 2000), pp. 362-363.
39This summary draws on Gerhard Mollin, Montankonzerne und Drittes Reich: Der Gegensatz ZwischenMonopolindustrie und Befehlswirschaft in der Deutschen Rustung und Expansion, 1936-1944 (Gottingen:Vandenhoeck und Ruprecht, 1988), and, Klaus P. Fischer, Nazi Germany: A New History (New York: Continuum, 1995),pp. 374-383.
Multi-dimensional heterogeneity: Central planning in Nazi Germany
In addition to post-Communist Russia and China and to private slavery, central planning in NaziGermany makes sharp distinctions between the income dimension, the government dimension, and theproperty dimension. Central planning in Nazi Germany combined near-total government with universalredistribution of income but based both on private property. This secured better incentives than Communistcentral planning based on state ownership. Owners and managers in Nazi Germany had more incentivesin meeting quotas of forced production and forced delivery than bureaucratic managers in Communistcentral plan economies. This is why Joseph Stalin shot managers to enforce central planning, while Hitleremployed profit to the same end.
Specifically, the Nazi regime preferred family-owned firms as opposed to shareholding corporationsbecause it is easier for the government to control production under concentrated rather than dispersedownership.38 Further concentration was achieved through forced cartelization of private industries undergovernment planning.39 Smaller private businesses were also integrated into vertical and horizontal guilds. The government forced private companies to make subsidized loans to a conglomerate of new industrialplants which was jointly owned by the government and private concerns (Herman Goering Werke). Atthe same time, the government subsidized plant expansion, research, and development among private firmsacross industries, financed construction, and provided relief to private farms and agricultural businesses.
All these subsidies accrued in exchange for meeting output quotas. This is the principal systemicfeature of central planning familiar from the experience of Communist countries. It combines investment
The Omnipresence of Common Income in a Multi-Dimensional World 12
40As we mentioned in Chapter 1, the nation-wide soft budget constraints necessarily accompany forcedproduction. Their sole raison d’etre is to enforce output delivery and production quotas. This enforcement mechanismis two-sided. Every producer enterprise is a buyer of inputs and a seller of output. Over the flow of payments, the seller-enterprises are creditors and the buyer-enterprises debtors. When payment arrears arise in trade credit, an automaticcash flow subsidy from the government to debtor-enterprises finances payment of arrears. This enables illiquid buyersto keep the centrally-planned supply chain in motion. Creditor-enterprises cannot divert inputs from government-designated buyers using arrears as an excuse. This keeps the centrally-planned supply chain intact. This, in turn,enforces output delivery from sellers to centrally-planned buyers across the supply chain. This makes a cash flowsubsidy to debtors a forced subsidy to creditors. On the other side of the coin, arrears and negative cash flow balancesamong debtor-enterprises reveal their failure to fulfill production quotas or output delivery quotas (that is, diversion ofoutput to internal consumption) and/or overuse of inputs. This is a violation of central planning. Managers are thenpunished and production quotas and delivery quotas enforced. This makes a cash flow subsidy to finance payment ofarrears a forced subsidy to debtor-enterprises. See also Michael S. Bernstam and Alvin Rabushka, Fixing Russia’sBanks: A Proposal for Growth (Stanford: Hoover Institution Press, 1998), pp. 23-25. In accounting terms, the soft budgetconstraints represent a special, financing subsidy to pay-off trade credit arrears. Operationally, it works as a regularlyreactivated credit line from the monetary and banking system followed by the debt write-off. The term ‘the soft budgetconstraints’ developed as a notion of this subsidy under central planning. How this term sounds, it is too oftenmisconstrued as a benevolent government subsidy to dependent enterprises. In reality, it is a forced subsidy tounwilling enterprises. It forces enterprises into the production line. Forced production needs these forced subsidiesto close the system. This is why the soft budget constraints had evolved independently under different species ofcentral planning in the USSR, Yugoslavia, and Nazi Germany. The notion of the soft budget constraints is often extendedto include a more familiar phenomenon, occasional sectoral bailouts in the Western Welfare States and developingeconomies. These occasional sectoral bailouts constitute the cash flow subsidies financing payment of arrears. Assuch, they operationally qualify as the soft budget constraints. This dissection readily makes up a taxonomy. Itdistinguishes the two types of the soft budget constraints. One is the nation-wide, automatic forced subsidy undercentral planning. The second is the occasional sectoral bailouts in the Welfare States and developing economies. Theyare not forced by the government onto enterprises but are rather solicited from the government by firms. This systemicdistinction is missing in the literature which views all subsidies as solicitations and does not consider the existence offorced subsidies. Another missing systemic distinction is more important. The principal feature of both types of thesoft budget constraints is that they are government-given, not enterprise-taken. They are given by the government, nottaken from the government. To use a sharp economic distinction, they are exogenous, not endogenous, to enterprisesand firms. The self-enforceable tax subsidy under Enterprise Network Socialism is taken by enterprises from thegovernment. It relates to the soft budget constraints the same way as counterfeiting and robbery from the Central Bankand the Treasury relate to government subsidies. The discussion in Chapter 1 submits that this is not a metaphor buta characterization. The difference is between governmental subsidies vs. non-governmental confiscations. These arethe specimens of state socialism vs. non-state socialism..
subsidies and the cash flow subsidies for paying off arrears (known as the soft budget constraint)40. Inaddition to output quotas of forced production, the Nazi government capped profits, managed investment,and imposed wage and price controls. Forced labor also resembled Communist countries even in minordetails. Work books (Arbeitsbuch) restricted job change. All males had to participate in compulsory laborservice; youth were also inducted into seasonal agricultural service. Like Communist central planeconomies, Germany functioned as the nation-enterprise, but it consisted largely of privately owned firms.
Constraints to multiple combinations and multi-dimensional heterogeneity
Multi-dimensional slavery, Nazi Germany, and post-Communist Russia and China exemplify

FIGURE 3.3. THE WORLD ON ONE, TWO, THREE, AND FOUR DIMENSIONS
PRIVATE <——————— INCOME ——————— > COMMON
Industrial central planning,forced production: USSR, China, pre-1978, Nazi Germany
Market economy, restrictivegovernment: China, post-1978
Pre-industrial Europe, developingcountries, and historicaleconomies around the world
Private slavery, brigandry, piracy,and other private predation
Primordialcaves
Market economy, limitedgovernment: classical England,U.S., the Asian Tigers, WesternEurope (pre-Welfare States)
Enterprise Network Socialism,symbiont government: Russia,1990s, the CIS
Private Cooperative Local State Common Property rights (Ownership)
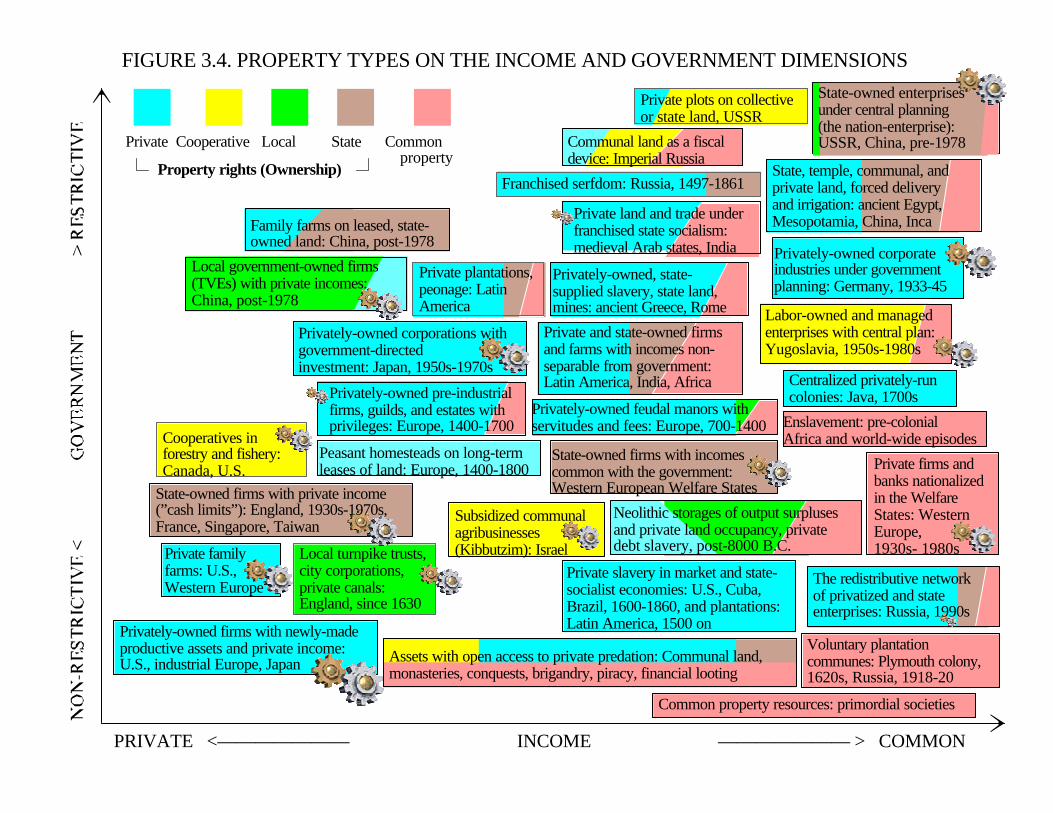
FIGURE 3.4. PROPERTY TYPES ON THE INCOME AND GOVERNMENT DIMENSIONS
PRIVATE <——————— INCOME ——————— > COMMON
Privately-owned firms with newly-madeproductive assets and private income:U.S., industrial Europe, Japan
Common property resources: primordial societies
State-owned firms with private income(”cash limits”): England, 1930s-1970s,France, Singapore, Taiwan
Local government-owned firms(TVEs) with private incomes:China, post-1978
Private and state-owned firmsand farms with incomes non-separable from government:Latin America, India, Africa
The redistributive networkof privatized and stateenterprises: Russia, 1990s
Privately-owned feudal manors withservitudes and fees: Europe, 700-1400
Centralized privately-runcolonies: Java, 1700s
Privately-owned corporateindustries under governmentplanning: Germany, 1933-45
Labor-owned and managedenterprises with central plan:Yugoslavia, 1950s-1980s
Privately-owned corporations withgovernment-directed investment: Japan, 1950s-1970s
Subsidized communalagribusinesses(Kibbutzim): Israel
Privately-owned, state-supplied slavery, state land,mines: ancient Greece, Rome
State, temple, communal, andprivate land, forced deliveryand irrigation: ancient Egypt,Mesopotamia, China, Inca
Assets with open access to private predation: Communal land,monasteries, conquests, brigandry, piracy, financial looting
Family farms on leased, state-owned land: China, post-1978
Private land and trade underfranchised state socialism:medieval Arab states, India
Peasant homesteads on long-termleases of land: Europe, 1400-1800
Private familyfarms: U.S.,Western Europe
Private firms andbanks nationalizedin the WelfareStates: WesternEurope, 1930s- 1980s
Voluntary plantationcommunes: Plymouth colony,1620s, Russia, 1918-20
Private slavery in market and state-socialist economies: U.S., Cuba,Brazil, 1600-1860, and plantations:Latin America, 1500 on
Neolithic storages of output surplusesand private land occupancy, privatedebt slavery, post-8000 B.C.
State-owned firms with incomescommon with the government:Western European Welfare States
Local turnpike trusts,city corporations,private canals:England, since 1630
Private plots on collectiveor state land, USSR
Communal land as a fiscaldevice: Imperial Russia
Cooperatives inforestry and fishery:Canada, U.S.
Private Cooperative Local State Common
Property rights (Ownership)property
Privately-owned pre-industrialfirms, guilds, and estates withprivileges: Europe, 1400-1700
Private plantations,peonage: LatinAmerica
Franchised serfdom: Russia, 1497-1861
State-owned enterprisesunder central planning(the nation-enterprise):USSR, China, pre-1978
Enslavement: pre-colonialAfrica and world-wide episodes
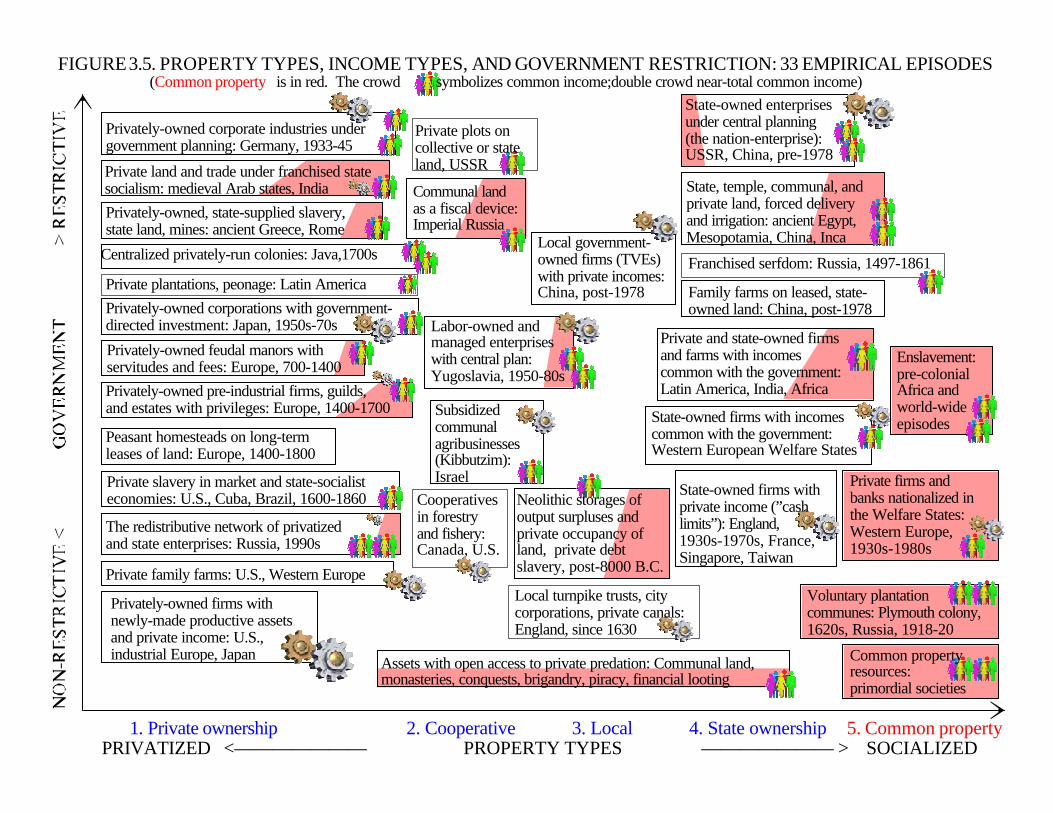
FIGURE 3.5. PROPERTY TYPES, INCOME TYPES, AND GOVERNMENT RESTRICTION: 33 EMPIRICAL EPISODES(Common property is in red. The crowd symbolizes common income;double crowd near-total common income)
1. Private ownership 2. Cooperative 3. Local 4. State ownership 5. Common propertyPRIVATIZED <——————— PROPERTY TYPES ——————— > SOCIALIZED
Privately-owned firms withnewly-made productive assetsand private income: U.S.,industrial Europe, Japan
State-owned firms withprivate income (”cash limits”): England,1930s-1970s, France,Singapore, Taiwan
Local government-owned firms (TVEs)with private incomes:China, post-1978
The redistributive network of privatizedand state enterprises: Russia, 1990s
Privately-owned feudal manors withservitudes and fees: Europe, 700-1400
Centralized privately-run colonies: Java,1700s
Privately-owned corporations with government-directed investment: Japan, 1950s-70s
Subsidizedcommunalagribusinesses(Kibbutzim):Israel
Privately-owned, state-supplied slavery,state land, mines: ancient Greece, Rome
Privately-owned pre-industrial firms, guilds,and estates with privileges: Europe, 1400-1700
Peasant homesteads on long-termleases of land: Europe, 1400-1800
Private family farms: U.S., Western Europe
Private slavery in market and state-socialisteconomies: U.S., Cuba, Brazil, 1600-1860
Local turnpike trusts, citycorporations, private canals:England, since 1630
Private land and trade under franchised statesocialism: medieval Arab states, India
Neolithic storages ofoutput surpluses andprivate occupancy ofland, private debtslavery, post-8000 B.C.
Labor-owned andmanaged enterpriseswith central plan:Yugoslavia, 1950-80s
State-owned firms with incomescommon with the government:Western European Welfare States
Private and state-owned firmsand farms with incomescommon with the government:Latin America, India, Africa
State, temple, communal, andprivate land, forced deliveryand irrigation: ancient Egypt,Mesopotamia, China, Inca
State-owned enterprisesunder central planning(the nation-enterprise):USSR, China, pre-1978
Private firms andbanks nationalized inthe Welfare States:Western Europe,1930s-1980s
Voluntary plantationcommunes: Plymouth colony,1620s, Russia, 1918-20
Common propertyresources: primordial societies
Cooperativesin forestryand fishery:Canada, U.S.
Assets with open access to private predation: Communal land,monasteries, conquests, brigandry, piracy, financial looting
Private plantations, peonage: Latin AmericaFranchised serfdom: Russia, 1497-1861
Family farms on leased, state-owned land: China, post-1978
Private plots oncollective or stateland, USSR
Communal landas a fiscal device:Imperial Russia
Privately-owned corporate industries undergovernment planning: Germany, 1933-45
Enslavement:pre-colonialAfrica andworld-wideepisodes
The Omnipresence of Common Income in a Multi-Dimensional World 13
heterogeneity between income redistribution, government restriction, and property types. Other cases ofmulti-dimensional heterogeneity abound at all levels aggregation and disaggregation. A quick glance atnational economies and supra-national regions in figure 3.3, at 33 property episodes in figures 3.4 to 3.6,and at 110 economic species in Annex 3.2 reveals the world dispersed throughout four dimensions.
Multi-dimensional heterogeneity of the world is vast but not universal. Multiple trilateralcombinations are constrained. The next exercise is concerned with these constraints. On the low and highends of income redistribution, government restriction, and property types, four bilateral combinations donot and cannot exist. Their dissection gives an unexpected insight into the nature of property rights andgovernment.
The main exhibit for this expedition is Annexes 3.2 and 3.3 although figures 3.3 to 3.6 join in.Annex 3.3 makes the same constellation of economic species as Annex 3.2 but reverses the axes of thetwo-dimensional frame. The government dimension from absent to total government (from zero to 100percent government restriction) becomes the horizontal axis. The income dimension from totally privateto totally common income (from zero to 100 percent income redistribution) serves as the vertical axis. Thisreversal helps identify the ranges of bilateral impossibilities when they are determined by the absent andnear-total government.
Annex 3.3 also adds the rings of the sub-species of private income economies (market economies)with limited and restrictive governments and the sub-species of enslavement. Annexes 3.1 and 3.2 over-simplified their measurements in crudely estimated averages and lumped many sub-species together in onecircle. Central plan and similar economies with near-total common income and total and near-totalgovernment are sub-divided into 22 separate species in Annexes 3.1 and 3.2. For example, terror-enforced central planning in the USSR ca. 1940-53, in China ca. 1958-71, in Hungary ca. 1949-53, etc.,makes up a different species from multi-industry central planning in the USSR, China, Hungary before andafter these periods. Hungary ca. 1968-89 and Poland in the 1980s are treated as a separate species ofreformed central planning with enterprise discretion, along with state-coordinated labor management inCommunist Yugoslavia, which constitutes another species sui generis. Central planning over privatecorporations in Nazi Germany is another separate species. A defense for this apparent analyticaldiscrimination in favor of a refined taxonomy of central planning against crude averaging and stacking ofmarket economies and enslavement is rather lame. Enslavement is a complicated subject and onlyadditional research, beyond the scope of this book, can tell whether government enslavement as opposedto tribal enslavement and, separately, to private enslavement qualify as separate species or as sub-species,and how to measure them in so many cases of enslavement. Market economies with restrictivegovernment, such as the new-entrant market sector within the two-track economy in China, Vietnam,Cambodia, Myanmar, and elsewhere are new and evolving phenomena. It would require more researchto even suggest whether or not to treat, say, the post-central plan Vietnamese economy as a sub-speciesalong with China or a separate species. Western market economies with private income and limitedgovernment present an opposite but an even more daunting problem. Exactly because there is so muchconflicting literature, it would constitute a separate subject in itself to adjudicate whether continental
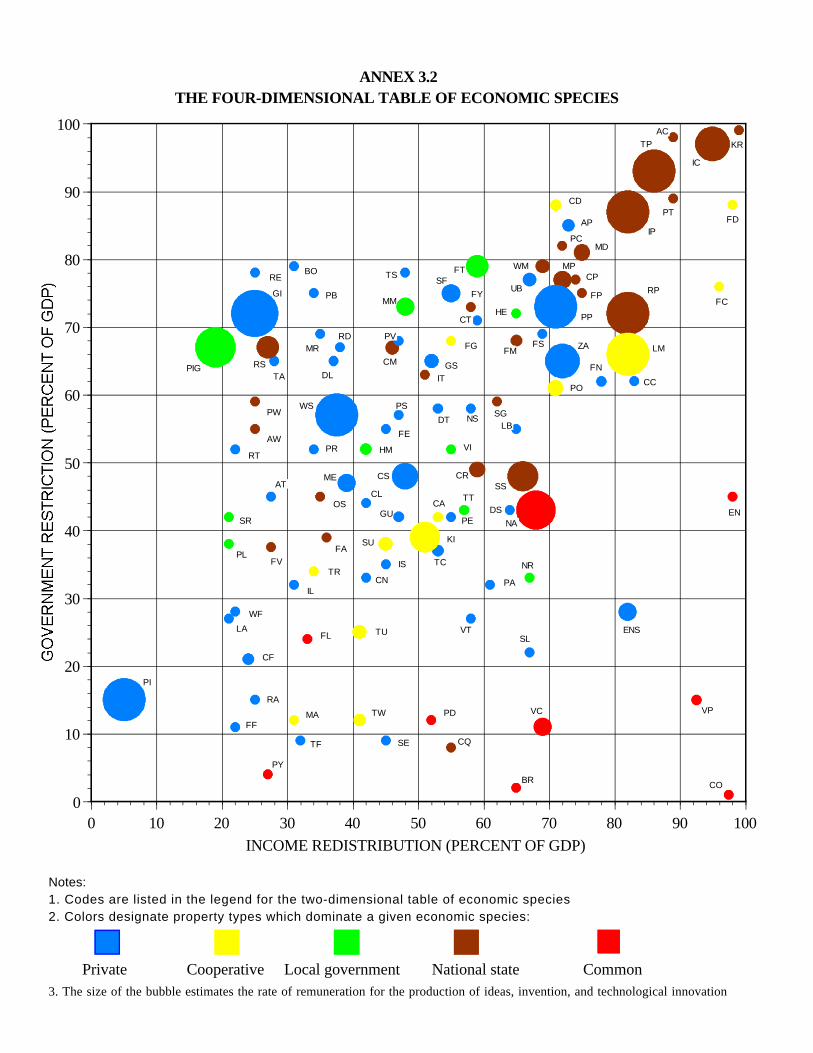
0
10
20
30
40
50
60
70
80
90
100
0 10 20 30 40 50 60 70 80 90 100INCOME REDISTRIBUTION (PERCENT OF GDP)
PI
PIG
GI
RE
TARS
PW
AW
RT
AT
SR
FV
HE
PL
BO
PB
MRRD
DL
WS
PR
ME
OS
FA
TR
IL
TS
MM
CM
PV
FE
PS
HM
GU
CS
CN
SU
FT
CT
FYSF
GS
FG
LB
IT
DT
CL
VI
NS
CATT
CR
TCIS
KI
WM
UB
FMFS
SG
DS
SS
PE
NR
PA
WF
CF
LA
RA
FF
PY
NA
FL
MA
TF
TU
TW
SE
VT
PD
CQ
SL
VC
BR
TPAC
KR
IC
AP
PC
CD
MD
IP
PTFD
FP
MP
PP
CPRP
FC
ZA
PO
LM
EN
CC
ENS
FN
VP
CO
Private Cooperative Local government National state Common
Notes:1. Codes are listed in the legend for the two-dimensional table of economic species2. Colors designate property types which dominate a given economic species:
3. The size of the bubble estimates the rate of remuneration for the production of ideas, invention, and technological innovation
ANNEX 3.2THE FOUR-DIMENSIONAL TABLE OF ECONOMIC SPECIES
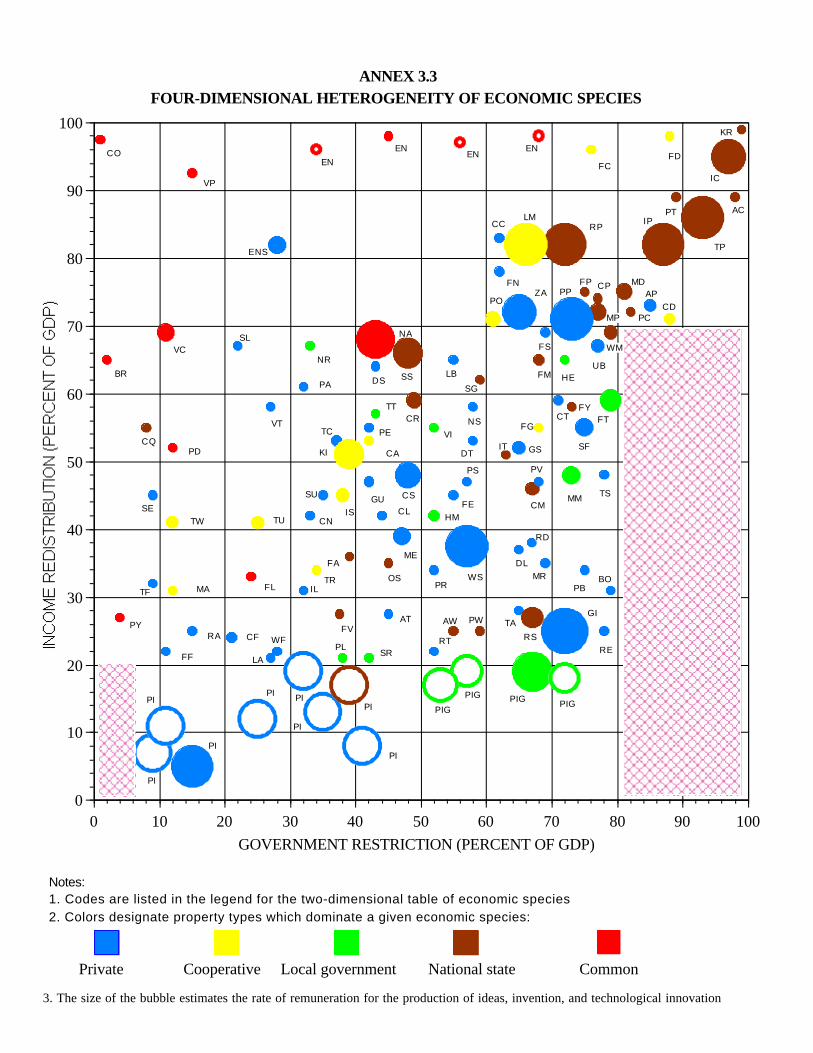
0
10
20
30
40
50
60
70
80
90
100
0 10 20 30 40 50 60 70 80 90 100GOVERNMENT RESTRICTION (PERCENT OF GDP)
PI
PIG
GI
RE
TA
RS
PWAW
RT
AT
SR
FV
HE
PL
BOPB
MR
RD
DL
WSPR
ME
OS
FA
TRIL
TSMMCM
PV
FE
PS
HM
GU CS
CN
SU
FTCTFY
SFGS
FG
LB
ITDT
CL
VINS
CA
TTCR
TC
IS
KI
WM
UBFM
FS
SGDS SS
PE
NR
PA
WFCF
LA
RA
FF
PY
NA
FLMATF
TUTWSE
VT
PDCQ
SLVC
BR
TP
AC
KR
IC
AP
PCCD
MD
IPPT
FD
FP
MP
PPCP
RP
FC
ZAPO
LM
EN
CC
ENS
FN
VP
CO
PIGPIG
PI PIPI
PI
PI
ENEN
EN
PI
PI PIG
Private Cooperative Local government National state Common
Notes:1. Codes are listed in the legend for the two-dimensional table of economic species2. Colors designate property types which dominate a given economic species:
3. The size of the bubble estimates the rate of remuneration for the production of ideas, invention, and technological innovation
ANNEX 3.3FOUR-DIMENSIONAL HETEROGENEITY OF ECONOMIC SPECIES
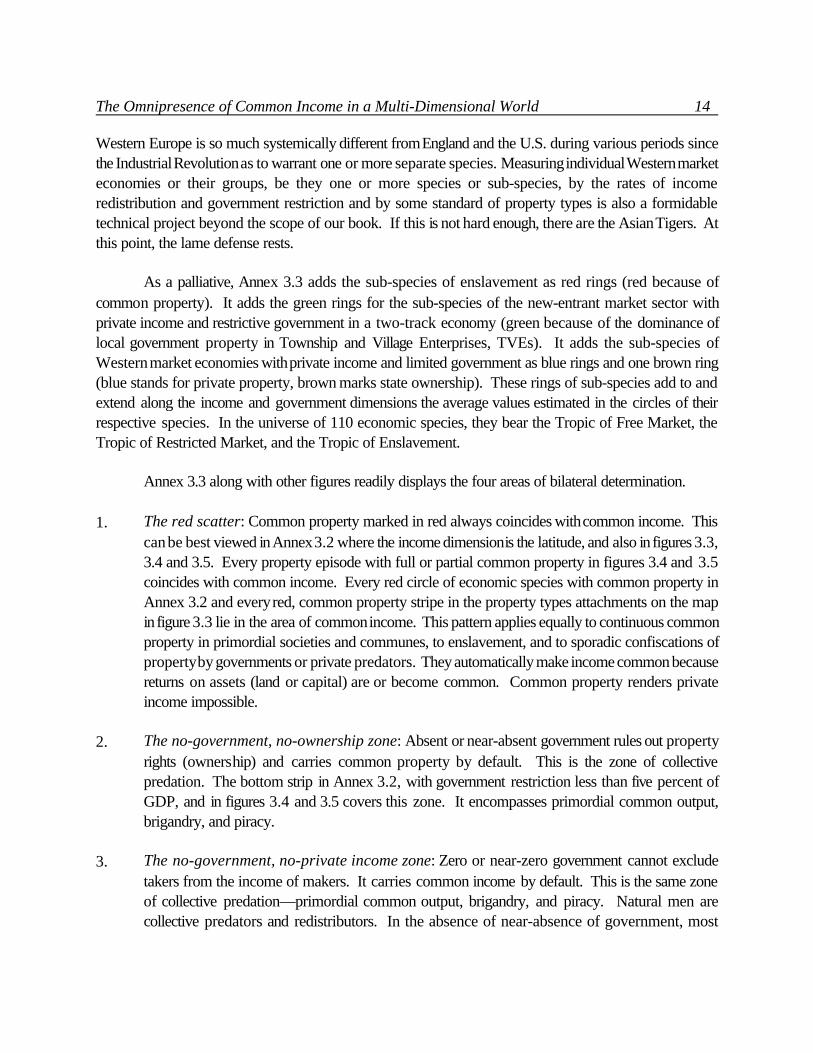
The Omnipresence of Common Income in a Multi-Dimensional World 14
Western Europe is so much systemically different from England and the U.S. during various periods sincethe Industrial Revolution as to warrant one or more separate species. Measuring individual Western marketeconomies or their groups, be they one or more species or sub-species, by the rates of incomeredistribution and government restriction and by some standard of property types is also a formidabletechnical project beyond the scope of our book. If this is not hard enough, there are the Asian Tigers. Atthis point, the lame defense rests.
As a palliative, Annex 3.3 adds the sub-species of enslavement as red rings (red because ofcommon property). It adds the green rings for the sub-species of the new-entrant market sector withprivate income and restrictive government in a two-track economy (green because of the dominance oflocal government property in Township and Village Enterprises, TVEs). It adds the sub-species ofWestern market economies with private income and limited government as blue rings and one brown ring(blue stands for private property, brown marks state ownership). These rings of sub-species add to andextend along the income and government dimensions the average values estimated in the circles of theirrespective species. In the universe of 110 economic species, they bear the Tropic of Free Market, theTropic of Restricted Market, and the Tropic of Enslavement.
Annex 3.3 along with other figures readily displays the four areas of bilateral determination.
1. The red scatter: Common property marked in red always coincides with common income. Thiscan be best viewed in Annex 3.2 where the income dimension is the latitude, and also in figures 3.3,3.4 and 3.5. Every property episode with full or partial common property in figures 3.4 and 3.5coincides with common income. Every red circle of economic species with common property inAnnex 3.2 and every red, common property stripe in the property types attachments on the mapin figure 3.3 lie in the area of common income. This pattern applies equally to continuous commonproperty in primordial societies and communes, to enslavement, and to sporadic confiscations ofproperty by governments or private predators. They automatically make income common becausereturns on assets (land or capital) are or become common. Common property renders privateincome impossible.
2. The no-government, no-ownership zone: Absent or near-absent government rules out propertyrights (ownership) and carries common property by default. This is the zone of collectivepredation. The bottom strip in Annex 3.2, with government restriction less than five percent ofGDP, and in figures 3.4 and 3.5 covers this zone. It encompasses primordial common output,brigandry, and piracy.
3. The no-government, no-private income zone: Zero or near-zero government cannot excludetakers from the income of makers. It carries common income by default. This is the same zoneof collective predation—primordial common output, brigandry, and piracy. Natural men arecollective predators and redistributors. In the absence of near-absence of government, most
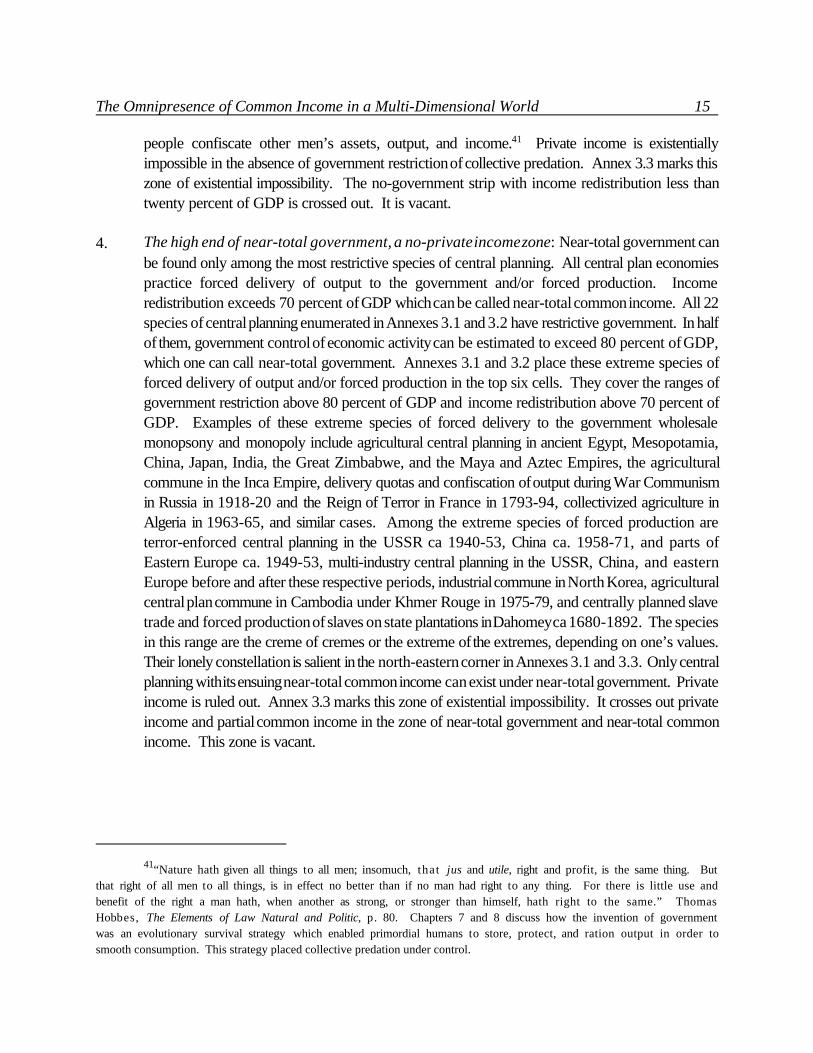
The Omnipresence of Common Income in a Multi-Dimensional World 15
41“Nature hath given all things to all men; insomuch, that jus and utile, right and profit, is the same thing. Butthat right of all men to all things, is in effect no better than if no man had right to any thing. For there is little use andbenefit of the right a man hath, when another as strong, or stronger than himself, hath right to the same.” ThomasHobbes, The Elements of Law Natural and Politic, p. 80. Chapters 7 and 8 discuss how the invention of governmentwas an evolutionary survival strategy which enabled primordial humans to store, protect, and ration output in order tosmooth consumption. This strategy placed collective predation under control.
people confiscate other men’s assets, output, and income.41 Private income is existentiallyimpossible in the absence of government restriction of collective predation. Annex 3.3 marks thiszone of existential impossibility. The no-government strip with income redistribution less thantwenty percent of GDP is crossed out. It is vacant.
4. The high end of near-total government, a no-private income zone: Near-total government canbe found only among the most restrictive species of central planning. All central plan economiespractice forced delivery of output to the government and/or forced production. Incomeredistribution exceeds 70 percent of GDP which can be called near-total common income. All 22species of central planning enumerated in Annexes 3.1 and 3.2 have restrictive government. In halfof them, government control of economic activity can be estimated to exceed 80 percent of GDP,which one can call near-total government. Annexes 3.1 and 3.2 place these extreme species offorced delivery of output and/or forced production in the top six cells. They cover the ranges ofgovernment restriction above 80 percent of GDP and income redistribution above 70 percent ofGDP. Examples of these extreme species of forced delivery to the government wholesalemonopsony and monopoly include agricultural central planning in ancient Egypt, Mesopotamia,China, Japan, India, the Great Zimbabwe, and the Maya and Aztec Empires, the agriculturalcommune in the Inca Empire, delivery quotas and confiscation of output during War Communismin Russia in 1918-20 and the Reign of Terror in France in 1793-94, collectivized agriculture inAlgeria in 1963-65, and similar cases. Among the extreme species of forced production areterror-enforced central planning in the USSR ca 1940-53, China ca. 1958-71, and parts ofEastern Europe ca. 1949-53, multi-industry central planning in the USSR, China, and easternEurope before and after these respective periods, industrial commune in North Korea, agriculturalcentral plan commune in Cambodia under Khmer Rouge in 1975-79, and centrally planned slavetrade and forced production of slaves on state plantations in Dahomey ca 1680-1892. The speciesin this range are the creme of cremes or the extreme of the extremes, depending on one’s values.Their lonely constellation is salient in the north-eastern corner in Annexes 3.1 and 3.3. Only centralplanning with its ensuing near-total common income can exist under near-total government. Privateincome is ruled out. Annex 3.3 marks this zone of existential impossibility. It crosses out privateincome and partial common income in the zone of near-total government and near-total commonincome. This zone is vacant.
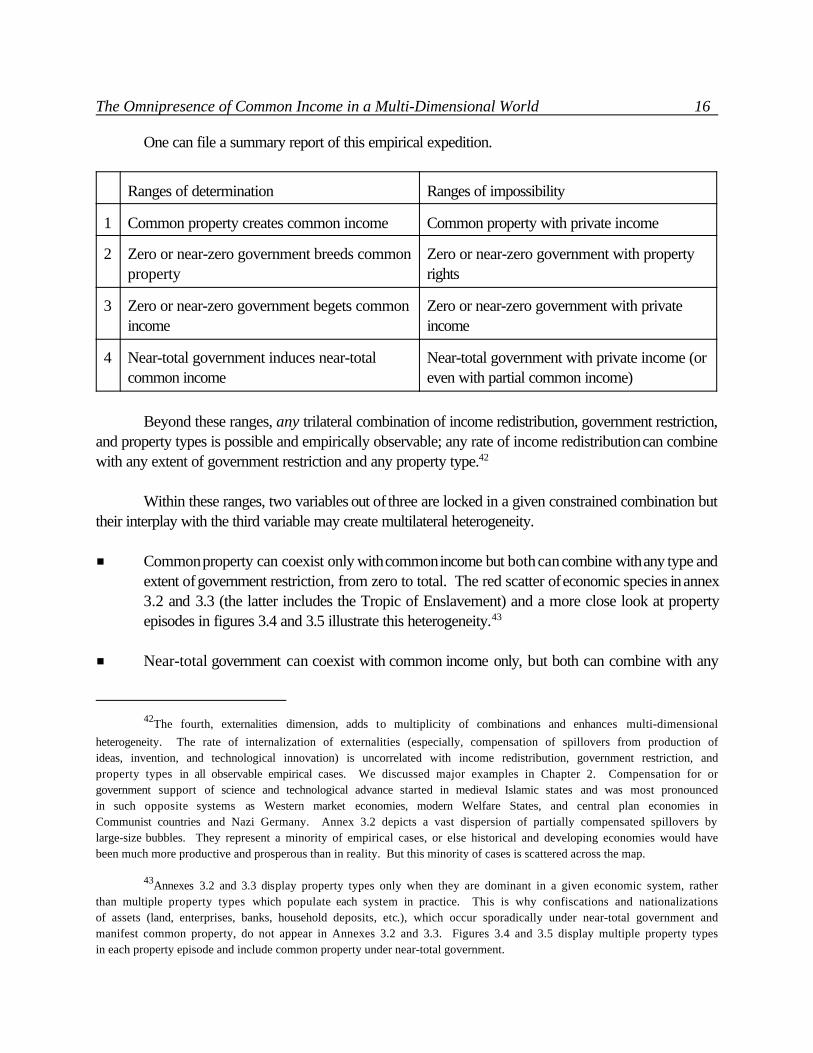
The Omnipresence of Common Income in a Multi-Dimensional World 16
42The fourth, externalities dimension, adds to multiplicity of combinations and enhances multi-dimensionalheterogeneity. The rate of internalization of externalities (especially, compensation of spillovers from production ofideas, invention, and technological innovation) is uncorrelated with income redistribution, government restriction, andproperty types in all observable empirical cases. We discussed major examples in Chapter 2. Compensation for orgovernment support of science and technological advance started in medieval Islamic states and was most pronouncedin such opposite systems as Western market economies, modern Welfare States, and central plan economies inCommunist countries and Nazi Germany. Annex 3.2 depicts a vast dispersion of partially compensated spillovers bylarge-size bubbles. They represent a minority of empirical cases, or else historical and developing economies would havebeen much more productive and prosperous than in reality. But this minority of cases is scattered across the map.
43Annexes 3.2 and 3.3 display property types only when they are dominant in a given economic system, ratherthan multiple property types which populate each system in practice. This is why confiscations and nationalizationsof assets (land, enterprises, banks, household deposits, etc.), which occur sporadically under near-total government andmanifest common property, do not appear in Annexes 3.2 and 3.3. Figures 3.4 and 3.5 display multiple property typesin each property episode and include common property under near-total government.
One can file a summary report of this empirical expedition.
Ranges of determination Ranges of impossibility
1 Common property creates common income Common property with private income
2 Zero or near-zero government breeds commonproperty
Zero or near-zero government with propertyrights
3 Zero or near-zero government begets commonincome
Zero or near-zero government with privateincome
4 Near-total government induces near-totalcommon income
Near-total government with private income (oreven with partial common income)
Beyond these ranges, any trilateral combination of income redistribution, government restriction,and property types is possible and empirically observable; any rate of income redistribution can combinewith any extent of government restriction and any property type.42
Within these ranges, two variables out of three are locked in a given constrained combination buttheir interplay with the third variable may create multilateral heterogeneity.
# Common property can coexist only with common income but both can combine with any type andextent of government restriction, from zero to total. The red scatter of economic species in annex3.2 and 3.3 (the latter includes the Tropic of Enslavement) and a more close look at propertyepisodes in figures 3.4 and 3.5 illustrate this heterogeneity.43
# Near-total government can coexist with common income only, but both can combine with any
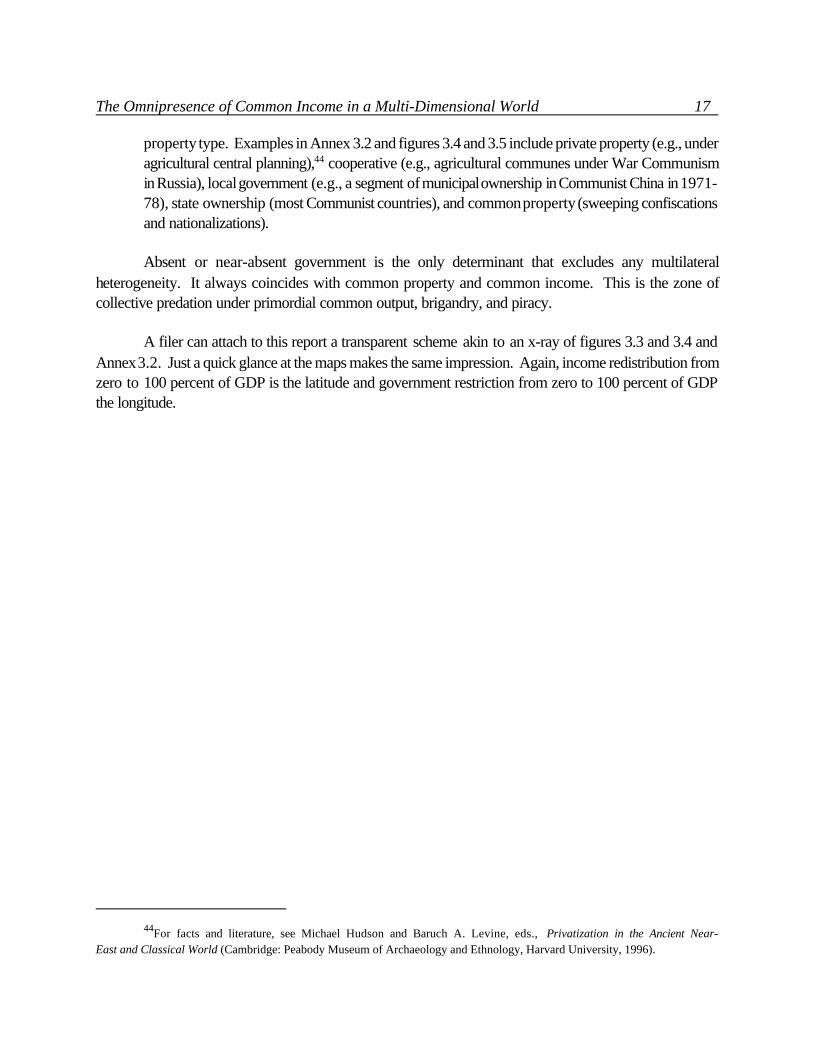
The Omnipresence of Common Income in a Multi-Dimensional World 17
44For facts and literature, see Michael Hudson and Baruch A. Levine, eds., Privatization in the Ancient Near-East and Classical World (Cambridge: Peabody Museum of Archaeology and Ethnology, Harvard University, 1996).
property type. Examples in Annex 3.2 and figures 3.4 and 3.5 include private property (e.g., underagricultural central planning),44 cooperative (e.g., agricultural communes under War Communismin Russia), local government (e.g., a segment of municipal ownership in Communist China in 1971-78), state ownership (most Communist countries), and common property (sweeping confiscationsand nationalizations).
Absent or near-absent government is the only determinant that excludes any multilateralheterogeneity. It always coincides with common property and common income. This is the zone ofcollective predation under primordial common output, brigandry, and piracy.
A filer can attach to this report a transparent scheme akin to an x-ray of figures 3.3 and 3.4 andAnnex 3.2. Just a quick glance at the maps makes the same impression. Again, income redistribution fromzero to 100 percent of GDP is the latitude and government restriction from zero to 100 percent of GDPthe longitude.
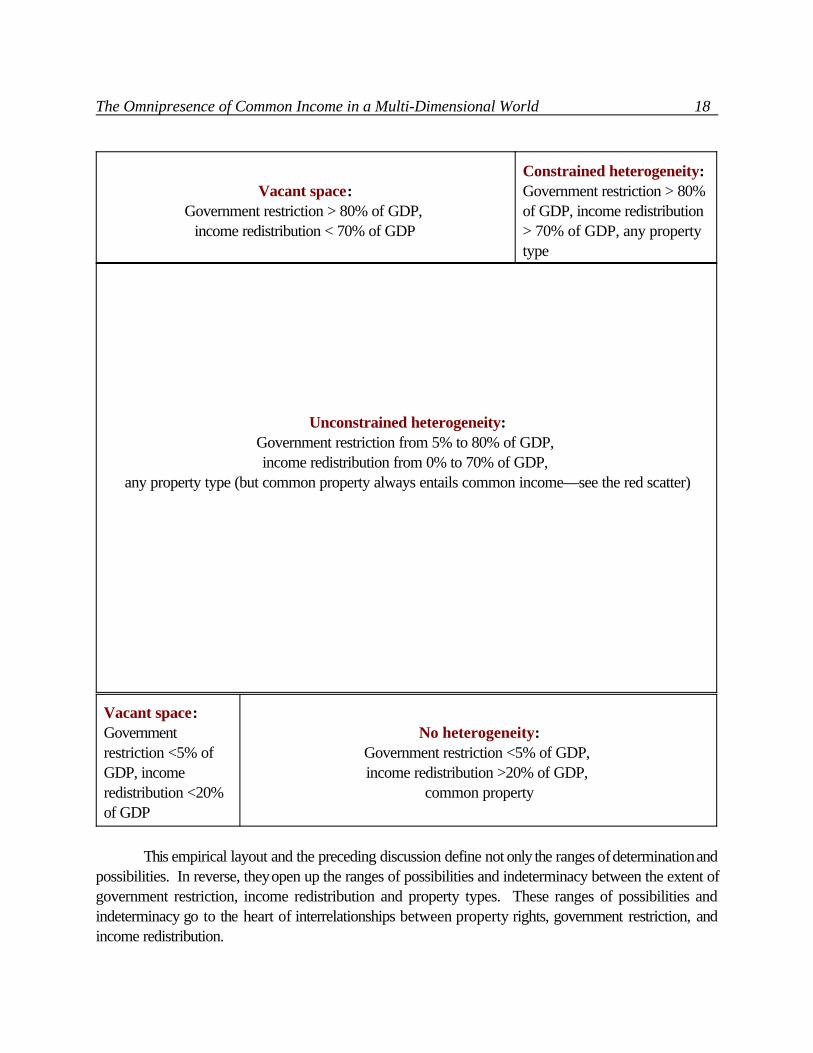
The Omnipresence of Common Income in a Multi-Dimensional World 18
Vacant space:Government restriction > 80% of GDP,
income redistribution < 70% of GDP
Constrained heterogeneity:Government restriction > 80%of GDP, income redistribution> 70% of GDP, any propertytype
Unconstrained heterogeneity:Government restriction from 5% to 80% of GDP, income redistribution from 0% to 70% of GDP,
any property type (but common property always entails common income—see the red scatter)
Vacant space:Governmentrestriction <5% ofGDP, incomeredistribution <20%of GDP
No heterogeneity:Government restriction <5% of GDP, income redistribution >20% of GDP,
common property
This empirical layout and the preceding discussion define not only the ranges of determination andpossibilities. In reverse, they open up the ranges of possibilities and indeterminacy between the extent ofgovernment restriction, income redistribution and property types. These ranges of possibilities andindeterminacy go to the heart of interrelationships between property rights, government restriction, andincome redistribution.
The Omnipresence of Common Income in a Multi-Dimensional World 19
Property rights, government restriction, and income redistribution
One more tabular summary sets the stage. It condenses all figures of this chapter and the table ofeconomic species. It puts together principal empirical findings from the previous discussion on the patternsof multi-dimensional heterogeneity. We use tinted cells to indicate the areas of bilateral determination.These areas only roughly correspond to the actual, quantitative ranges identified earlier. The purple colormarks the range wherein common property creates common income. The pink color indicates the rangeswhere zero or near-zero government begets common property and common income and where near-totalgovernment induces near-total common income.
Government Zero ornear-zero
More than near-zero, less than near-total (non-restrictive or restrictive)
Near-total
Property Common Property rights: private, cooperative, local, or state Common
Income Common, all extent Private Common, partial Common, near-total
The implications reveal themselves when one looks at this table row by row, upward anddownward, and checks specific combinations against empirical figures and the table of economic speciesin Annex 3.2. The next, accounting section demonstrates that the following implications have simple andsound accounting reasons (hint one: returns on assets make up only a fraction of returns in the economy,a fraction of national income; income redistribution can pervade other returns in the flow of funds; hint two:the government is not the only force in the economy that can redistribute income; everyone else seizes theopportunity to redistribute income throughout the flow of funds). At the moment, the implications derivefrom the empirical evidence summarized in figures 3.3 to 3.7, Annex 3.2, and the above layouts. Theseimplications may be contentious or unsettling but they rely on readily verifiable and falsifiable observations.
First, common property always creates common income but the opposite pair does not hold.Property rights (ownership) of any type, including private property, do not create private income. All typesof property rights can coincide with any extent of income redistribution, from partial common income in themodern Welfare States, in historical and developing economies, and under slavery (including privateproperty) to near-total common income under Communist central planning (state ownership and otherproperty types), in Nazi Germany (private property), and under Enterprise Network Socialism in Russia(private property). Annex 3.2 displays the scatter of all property types, including all types of ownership,throughout the common income area.
Whence follows the first implication: Property rights of one or another type are necessarybut not sufficient for the existence of private income (the market economy).
The Omnipresence of Common Income in a Multi-Dimensional World 20
45England established (but not followed) the tradition of private income for nat ionalized firms. Herbert Morrison(ironically, a Socialist Cabinet member), who presided over nationalization of the London Underground in 1931,formulated the best case against state subsidies and guarantees to all actors throughout the flow of funds, includingthe firm, labor, and consumers: Subsidies and guarantees “might well have encouraged a spirit of slackness, or evenrecklessness, on the part of the board in matters of management, on the part of the traveling public in demanding lowerfares and uneconomic facilities and on the part of the work people in asking for big concessions as to conditions oflabour.” (Cit. in Tony Jackson, “It’s a Monopoly, Stupid,” Financial Times, July 10, 2001). The principle of separateflows of funds became known in England and its colonies as “cash limits”. See David Begg and Richard Portes,“Enterprise Debt and Economic Transformation: Financial Restructuring of the State Sector in Central and EasternEurope,” in Colin mayer and Xavier Vives, eds., Capital Market and Financial Intermediation (Cambridge: CambridgeUniversity Press, 1993), pp. 230-261. Singapore adopted this system for its state-owned enterprises and it informed otherAsian Tigers.
46Adam Smith enlightened the ambiguity of government and the ambiguity of property rights in his comparisonof slavery in English and French colonies quoted above. Adam Smith, An Inquiry Into the Nature and Causes of theWealth of Nations, pp. 669-670. For a historical overview of the ambiguity of property rights, see Douglass C. North andRobert P. Thomas, The Rise of the Western World: A New Economic History (Cambridge: Cambridge University Press,1973), pp. 4-7 and passim . They are first in the modern literature to explicitly point this ambiguity of private propertyrights in the cases of monopoly rights, guilds, plantations, and similar examples.
Second, all types of property rights can combine with private income and underlie it. Examplesinclude private property in all Western market economies, episodes of cooperative property on theirmargins, local government property of Township and Village Enterprises (TVEs) in post-central plan China,and substantial state ownership in Singapore, Taiwan, and, to a lesser extent, Japan.. What is necessary,but may not be sufficient for the existence of private income, is that national state ownership is limited sothat it does not monopolize sectors and specific industries. Private property and/or local governmentownership in a critical mass, that is, a multiple ownership structure in the presence of state-owned firms,are necessary for the existence of competitive markets with private income. State-owned firms can haveprivate income only if their flow of funds is separate from the government and no explicit or implicitsubsidies ensue.45 Private property is not unique in relation to private income. Like any other type ofproperty rights, private property can combine with private income and can also undermine private incomeand underlie common income.
Whence follows the second implication: Private property is neither sufficient nornecessary as the dominant property type for the existence of private income.
From the two of the above, it follows that property rights of any type are ambiguous. They canequally undergird private income and common income, the market economy and socialism. As noexception, private property is ambiguous. It can promote socialism (e.g., Nazi Germany, private slavery,guilds and other mercantilism, Enterprise Network Socialism in post-Communist countries, and otherhistorical and world-wide examples in table 3.1, in figures 3.3 through 3.5 and the blue bubbles in Annex3.2). Alternatively, property rights and private property in particular can support competition, investment,technological innovation, and private income in the market economy.46
The Omnipresence of Common Income in a Multi-Dimensional World 21
47A pioneering empirical analysis of the determinants of the level of productivity across 133 contemporarynations by Robert E. Hall and Charles I. Jones explicitly suggests and statistically supports the non-linearity ofgovernment controls with respect to economic performance. Robert E. Hall and Charles I. Jones, “The Productivity ofNations,” National Bureau of Economic Research, Working Paper 5812 (Cambridge, MA: NBER, November 1996). Anabridged version is in Robert E. Hall and Charles I. Jones, “Why Do Some Countries Produce So Much More Output perWorker than Others?” Quarterly Journal of Economics 104, no. 1 (February 1999): 83-116.
Third, absent or near-absent government and near-total government restriction always createcommon income but the opposite pair does not hold. Limited and restrictive government in-between(restriction more than zero and less than near-total) do not always create private income. Any extent ofgovernment restriction, from zero to total, and any limited and restrictive government in between, cancoincide with one or another extent of income redistribution. The entire government dimension in figures3.3 to 3.5 and in Annex 3.2 is lined up or rather scattered with dozens of cases of common income, fromprimordial common output and Enterprise Network Socialism to Communist central planning. Annex 3.3shows that every decile of the government dimension in the common income area is filled up, often withmore than one economic species.
Whence follows the third implication: The government being more than near-absent andless than near-total is necessary but not sufficient for the existence of private income (themarket economy).
Fourth, any extent of government restriction in the range of more than near-absent and less thannear-total can combine with private income. This can be observed from limited government in Westernmarket economies to restrictive government in post-central plan China and throughout the Tropic of FreeMarket and the Tropic of Restricted Market in Annex 3.3. One can surmise that, eventually, all marketeconomies converge to the south-west corner of free market economies. But this historical or ratherteleological supposition is immaterial for the observable cross-sectional, multi-dimensional heterogeneity.Limited government, just like restrictive government, can support private income and can equally undermineprivate income and promote income redistribution, even near-total common income in the case ofEnterprise Network Socialism. Free socialism with private property in post-central plan Russia is not aparadox or an anomaly but only one of species in these multi-dimensional ranges, along with private slaveryand lesser lights.
Whence follows the fourth implication: Limited government is neither sufficient nornecessary for the existence of private income (the market economy).
From the two preceding implications, it follows that the government is non-linear and ambivalentwith respect to the market economy and socialism. It is non-linear because zero or near-zero governmentenables income redistribution everywhere, limited and restrictive government may restrain incomeredistribution in many cases, and near-total government raises income redistribution to the near-totalextent.47 It is ambivalent because both limited and restrictive government (more than near-absent, less than
The Omnipresence of Common Income in a Multi-Dimensional World 22
near-total) can enable, impose, or promote both private income and common income, the market economyand socialism. Both limited and restrictive government can enable and conduct income redistribution orthey can curtail and eradicate it, break up common income and phase-in private income.
It further follows for policy that no extent of liberalization and property privatization can bythemselves lead to the market economy and prosperity without the breakup of common income and phase-in of private income.
The most unsettling finding is the omnipresence of common income. It follows from all the aboveimplications and from empirical evidence submitted in this chapter at various levels of aggregation anddisaggregation. Socialism has occupied the bulk of human existence across historical and contemporaryeconomies with both restrictive and limited government and with all property types. It is universal. Privateincome has phased in gradually and intermittently. Only in the last three centuries has it started to dominatea bloc of economies, first England and its outstretches, then Western market economies at large, includingmore recently the Asian Tigers and a few others, and, lately, post-central plan China. But most of the mapof the world apart from the Tropic of Free Market and the Tropic of Restricted Market is the universe ofsocialism.
The omnipresence of common income has the underlying accounting reasons whereupon we nowturn the page.