can management effort be predicted for marine protected areas? new considerations for network design
TRANSCRIPT
Can management effort be predicted for marine protected areas?New considerations for network design
Kate S.G. Gormley a,n, Lauren H. McWhinnie a, Joanne S. Porter a, Angela D. Hull b,Teresa F. Fernandes a, William G. Sanderson a
a Centre for Marine Biodiversity and Biotechnology, School of Life Sciences, Heriot Watt University, Riccarton, Edinburgh, EH14 4AS,0131 451 3455, United Kingdomb Institute for Building and Urban Design, School of the Built Environment, Heriot Watt University, Riccarton, Edinburgh, EH14 4AS, United Kingdom
a r t i c l e i n f o
Article history:Received 21 September 2013Received in revised form29 January 2014Accepted 29 January 2014
Keywords:Marine protected areasManagement complexityManagement effortPriority marine featuresMaxent
a b s t r a c t
This study examined the level of management complexity (simultaneously occurring licensed humanactivities) within the currently designated Marine Protected Areas (MPAs) in Scottish waters and throughmodelling and statistical analysis determined which variables play an important role in defining the levelof management effort required for each MPA. This study utilised surveyed distribution data for PriorityMarine Features and modelled distribution data showing potential “Most Suitable” Priority MarineFeature habitat through the species distribution model, Maxent. Prediction indicators were developedthrough Spearman's Rank coefficients and a linear regression model. Results showed that, (1) there was asignificant negative correlation between the management complexity score within 5 km of a MPA andthe number of casework events (defined as any work or statutory consultation associated with an MPA,such as planning applications, discharges or new fisheries); and (2) a significant positive correlationbetween the number of casework events and location, number of features, and the type of features andmost suitable scores. Calculations showed that Lochs Duich, Long and Alsh, Loch Sunart, Loch Sween andLoch Creran may potentially require most effort to manage once they are designated as MPAs. This studyshowed that it is possible to evaluate options within an MPA network to achieve cost effective options forthe biodiversity and socio-economic objectives of MPA networks and that some MPAs are likely to bemore efficient than others in terms of management time.
& 2014 Elsevier Ltd. All rights reserved.
1. Introduction
The management of multi-use Marine Protected Areas (MPAs)can be complex and the potential costs (both monetary and time)associated with this management can be significant, requiringcareful and sometimes time consuming planning and considera-tion. Balmford et al. [1] reported that annual running costs per unitarea of an MPA were higher in MPAs that were smaller, closer tocoasts, and in high-cost, developed countries. In another study byBan et al. [2] modelled scenarios indicated that a single large no-take reserve is less expensive to manage than a multiple-use MPAof the same area with a 30% no-take component. The literature onMPA management tends to focus on the management of stake-holders [3,4], the direct financial costs of MPAs [1,2,5] or, the
prediction of management effectiveness in terms of the MPAsuccess (e.g. the achievement of conservation objectives) [6–8].
This study proposes to test the null hypothesis that the levelof management complexity (MC¼the measure of the number ofhuman activities occurring in an MPA simultaneously) within anMPA will not have a significant relationship to the MPAs manage-ment effort (number of casework events; defined as any work orstatutory consultation associated with an MPA, such as planningapplications, discharges or new fisheries). In addition, the studyproposes to test the null hypotheses that management effortwould not increase (a) as the number of qualifying features withinthe MPA increased; (b) with increased proximity to the coastline(e.g. offshore vs. inshore) [1]; and (c) if more ‘publicly appealing’features occurred within the MPA.
The aim of this study is to determine whether it is possible todevelop a suitable indicator to predict how challenging or time-consuming the management of MPAs in Scottish waters might be.This study will examine the level of management complexity withinthe currently designated MPAs (MPAs) in Scottish waters and
Contents lists available at ScienceDirect
journal homepage: www.elsevier.com/locate/marpol
Marine Policy
http://dx.doi.org/10.1016/j.marpol.2014.01.0210308-597X & 2014 Elsevier Ltd. All rights reserved.
n Corresponding author.E-mail address: [email protected] (K.S.G. Gormley).
Marine Policy 47 (2014) 138–146
through modelling and statistical analysis determine which vari-ables play an important role in defining the level of managementeffort required for each MPA. The analysis will subsequently beapplied to the proposed MPAs (pMPAs) to ascertain if a predictioncan be made to establish which of these MPAs may require the mostmanagement effort going forward.
2. Methodology
2.1. Data preparation, mapping and modelling
Priority Marine Features (PMFs) are habitats and species whichare considered to be of marine nature conservation priority inScottish waters [9] and this study only used those PMFs that arebenthic habitat forming species. This study included: Coral gar-dens, Zostera beds, Deep-sea sponge aggregations, Intertidal Myti-lus edulis beds on mixed and sandy sediments, Lophelia pertusareefs, maerl beds, Modiolus modiolus horse mussel beds andSea-pen and burrowing megafauna communities. Insufficient datawere available to justify the inclusion of Ostrea edulis beds andSaberllaria spinulosa reefs because records of these PMFs felloutside of the environmental data layers used.
This study utilised both actual surveyed distribution data for PMFsand modelled “Most Suitable” habitat distribution. PMF records wereextracted from the 2012 OSPAR priority habitats dataset [10]. TheOSPAR records were imported into ArcMap 10.1 and buffered by 1 kmto represent the extent of the PMF. The PMFs were each given a scoreof 1 and the number of co-occurring PMFs was summed (PMF Score).
In order to provide an assessment of areas that may be able tosupport PMFs and to predict PMFs outside the distribution andextent already reported (OSPAR 2012 dataset) a Species Distribu-tion Model (SDM) was used. It was deemed appropriate to providean assessment of modelled distribution of PMFs to account forareas that may not have been surveyed in full, in addition to thevalidation of the predictor indicators. The PMF records were run inthe selected Species Distribution Model, Maxent [11]. This combi-nation of modelling techniques (Maxent) has previously been usedby Gormley et al. [12] and Ross and Howell [13] to determine thepossible extent of habitat forming species. The method publishedby Gormley et al. [12] is adapted for use in this study.
Environmental data used in Maxent was obtained from anumber of online sources and converted in ArcMap 10.1 Geogra-phical Information System (GIS) Software and assigned to a 0.0051grid. The layers included: bathymetry, landscape, salinity, slope,seabed temperature and current velocity as outlined in Table 1.The layers were set to the extent of the Scottish waters (200 nmouter seaward limit). Following the method of Gormley et al. [12],the probability of occurrence values (0–1) estimated in the Maxentmodel were separated into 3 categories:
(i) 5–1.0 representing “most suitable habitat”;(ii) 0.1–0.49 representing “less suitable habitat”; and(iii) 0–0.09 representing “unsuitable” habitat.
The model was run for each PMF and the potential distributionof "Most Suitable" (MS) habitat was exported and mapped inArcMap 10.1. The model predictions were tested using the Areaunder the Curve (AUC) produced by Maxent. The data was
Table 1Environmental and human activity data sources.Source: environmental data adapted from Gormley et al. [12].
Environmental data Source
Bathymetry: depth (m) GEBCO_08 30'' Bathymetry resolution [14]Slope: percentage gradient of the seafloor (%) Adapted in ArcGIS 9.3 from: GEBCO_08 30'' Bathymetry
resolution [14]Sea bottom temperature: climatological annual mean sea bottom temperature (1C). Adapted fromNOAA depth interval data
NOAA World Ocean Atlas[15]
Bottom Salinity: climatological annual mean sea bottom salinity (PSS). Adapted from NOAA depthinterval data
NOAA World Ocean Atlas[16]
Landscape: seabed landscape features [Broad patterns in seabed character, such as seabed morphologydetermined by major geological and hydrographic processes]
UKSeaMap/MESH webGIS [17]http://www.searchmesh.net/ (“Marine Landscapes” layer oninteractive map)
Current speed: average spring current speed (m s�1) Atlas of UK marine renewable energy resources [18]Supplemented by: current speed data on UKHO navigationcharts[19] and BODC oceanographic data [20]
Human activities Source
Archaeology (wrecks): designated shipwrecks and marine archaeological sites RCAHMS, Historic ScotlandAquaculture (lease sites): Finfish and Shellfish (active) sites The crown estateCarbon dioxide storage (storage sites): hydrocarbon fields and saline aquifers DECCDredging and disposal (regulated areas): dredged areas under licence and dumping grounds Marine science Scotland, EDINAMilitary activities (restricted areas): firing danger areas, submarine areas and practice areas EDINANature conservation (protected areas): SPAs, SACs, SSSIs, World heritage sites, National nature reserves,ramsar sites with a marine component
Scottish natural heritage
Oil and gas (regulated areas): significant discoveries and oil and gas seabed Wells. Fallowing blocks,hydrocarbon fields and oil and gas areas under licence
DECC, EDINA
Ports, harbours and shipping (transportation areas): harbour jurisdictions, shipping and ferry routes,small craft facilities, IMO traffic scheme, Deep water route and caution areas
Maritime and coastguard agency, Department of transport, RYA,via EDINA and marine Scotland science
Renewables (lease sites): wind farm lease sites, tidal lease sites, wave lease sites and Scottish energyawards
The crown estate
Sea fisheries (regulated areas): Lamlash no take zone, inshore fisheries group, Mackerel and Codnursery grounds
CEFAS, marine science Scotland
Submarine pipelines and cables (spatial extent): Cables (coaxial, fibre optic and telegraph) andpipelines
UK deal via EDINA
K.S.G. Gormley et al. / Marine Policy 47 (2014) 138–146 139
randomly split into 90% training/10% test datasets using the optionin Maxent for internal random test setting and cross validation for10 replicate runs. Ten thousand randomly chosen pseudo-absence/background points were run for the whole study area [12]. TheMaxent outputs were imported in ArcMap and the MS habitatareas for each PMF were extrapolated (as outlined above) andgiven a score of 1. These scores were again summed, (MostSuitable (MS) Habitat score).
Licensed human activities that occur in Scottish waters werecollected and imported into ArcMap 9.3. The data sources areoutlined in Table 1. The human activities were given a score of1 and summed to represent the extent of management complexity(Management Complexity (MC) score).
The currently designated MPAs and proposed MPAs (pMPAs)were mapped in ArcMap 10.1 against the MC, PMF and MS scoresto determine the extent of human activities and, reported andpotential PMFs within each MPA. The data was exported to Exceland the area of each scores in the MPAs were calculated.
2.2. MPA management analysis and prediction indicator
In order to test the null hypothesis and to determine whichmeasured variables (Table 1) within a designated MPA provide themost information for the prediction of management time/effort ofproposed MPAs (pMPAs), two Prediction Indicator methods weredeveloped. Prediction Indicator 1 was based on ranking the pMPAsagainst the statistically significant correlations between the dif-ferent variables (outlined in Table 2). Prediction Indicator 2 wasdeveloped to provide a formula to calculate an approximate(average, maximum and minimum) number of casework eventsrequired for each pMPA based on the linear regression relationshipof the variables.
The variables considered within this study are outlined inTable 2. Where only qualitative data were available, a suitablenumerical score was applied in order to create quantitative datasuitable for statistical testing (Table 2). The MC, PMF and MS scoreswere extrapolated from the scores reported previously by theformulae in Table 2.
To determine the relationship between the mapped variables ateach MPA; Spearman's bivariate correlation coefficients werecalculated using SPSS. Variables with a significant correlation weredefined as our indicators (Prediction Indicator 1). The predictionindicators were then used to calculate the management effort ofpMPAs. The analysis was re-run to determine whether a correla-tion could be recorded within varying distances (1 km, 5 km and
10 km) from the MPAs. The variables and scoring were calculatedas before and the statistical analysis repeated.
The pMPAs were mapped against the available variables asabove (excluding no. features, type features and number caseworkevents as no data is currently available) in ArcMap 10.1 and thedata was exported into Excel. The scores of each indicator for eachpMPA were ranked in order of significance.
The variables were then tested in SPSS to assess if theirdistribution was normal and the linear regression between thenumber of casework events and each of the variables was derivedfor the variables showing normal distribution. Variables that didnot show normal distribution were discarded. Variables showing asignificant linear regression relationship were taken forward touse in the predictive calculation (Prediction Indicator 2) for thenumber of casework events for the pMPAs (1). Given that many ofthe offshore located MPAs reported no caseworks, it was necessaryto provide a correction for the MC Score as reflected in thefollowing formula to compensate for the zero in the originalcalculation (2). The following formulae were applied:
1. No. of casework events (inshore)¼(mvnvþc(7r2))/L2. No. of casework events (offshore)¼(mvn(L–v)þc(7r2))/L
where
3. Results
3.1. Species distribution model
The training and test AUC values for each PMF are shown inTable 3. The average training and test AUC values range from 0.881to 0.997 with very little variation across the replicated runs,indicating good to excellent model performance.
3.2. MPAs and scoring
The distribution maps illustrate where areas of reported PMF(Fig. 1) and potential PMF habitat (Fig. 2) co-occur, representing
mv (model variable)¼ 56.161 22.716 �63.138v (variable)¼ PMF score MS score MC scorec (constant)¼ 38.017 34.699 89.812L (location)¼ See Table 2
Table 2Variable scoring.
Variable Details Applied numerical scoring (if applicable)
Area Area of MPA calculated in ArcMap 10.1 (km2)Location Determined whether MPA falls within 12 nm (inshore) or
200 nm (offshore) Scottish boundariesOffshore¼2 Inshore¼1 Offshore and
Inshore¼1.5Type of feature Type of qualifying features within MPA.
Obtained from SNH SiteLinkMammals (otter, seal,cetacean)¼2
Benthic Habitat (reefs,mudflats, sandbanks)¼1
Other¼0.5 Birds¼0.1
No. of features in MPA Number of qualifying features within MPA. Obtained from SNH SiteLinkLevel of Management Number of casework events recorded for each MPA obtained from SNH SiteLink. casework is defined as any work
or statutory consultation associated with an MPA (e.g. planning applications, discharges or new fisheries)SNHi - Information Service SiteLink (http://gateway.snh.gov.uk/sitelink/index.jsp)
MC Score Number of co-occurring human activities
Formula applied: MC Score¼Σ(Area of MC Hotspots*MC Hotspot score)/Area of MPAPMF Score Number of co-occurring PMFs
Formula applied: PMF Score¼Σ(Area of PMF Hotspots*PMF Hotspot score)/Area of MPAMS Score Number of co-occuring "most suitable" habitats
Formula applied: MS Score¼Σ(Area of MS Hotspots*MS Hotspot score)/Area of MPA
K.S.G. Gormley et al. / Marine Policy 47 (2014) 138–146140
PMF and potential PMF biodiversity hotspots respectively (PMFscore and MS score).
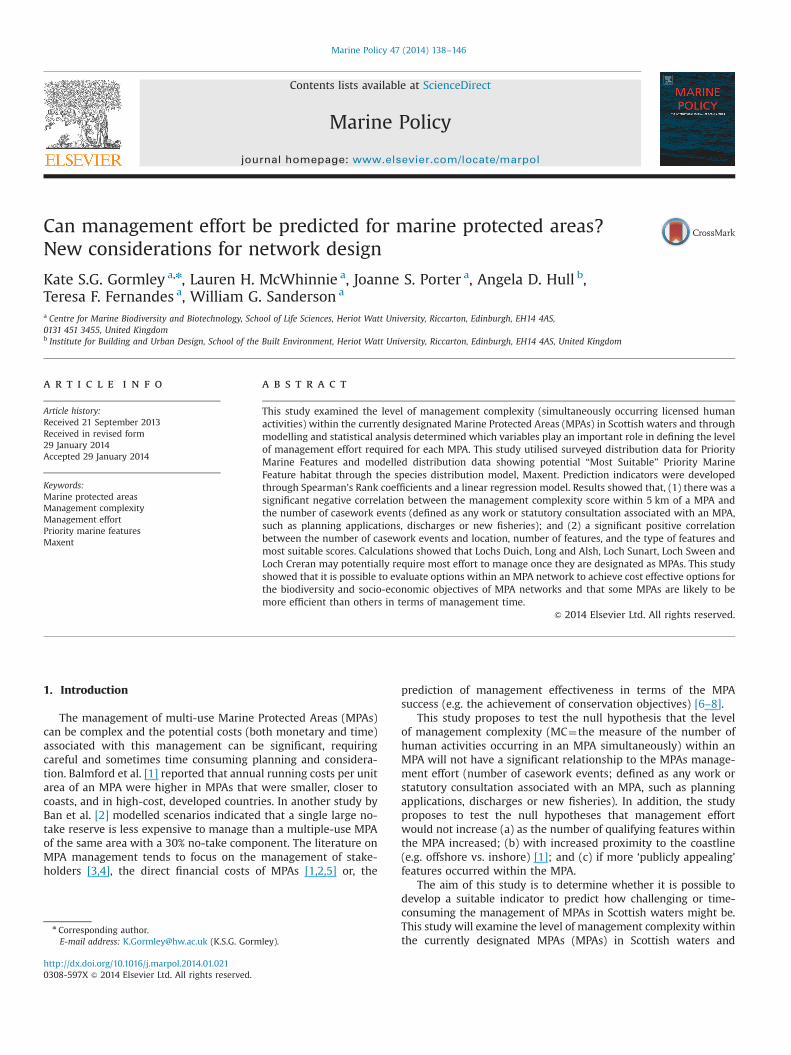
The reported PMF distribution map (Fig. 1) shows that there areareas where up to three PMFs may co-occur; with areas of highestPMF biodiversity primarily located along the west coast of Scot-land. One area of high PMF biodiversity is located further offshoreto the west of Scotland.
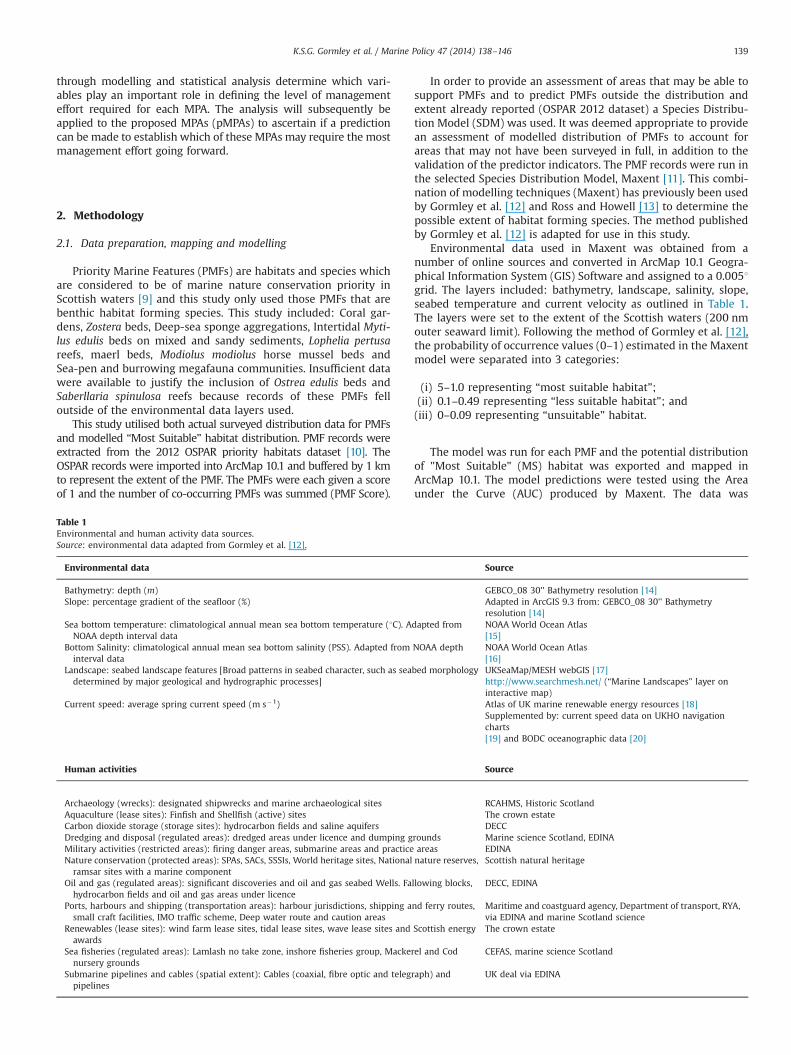
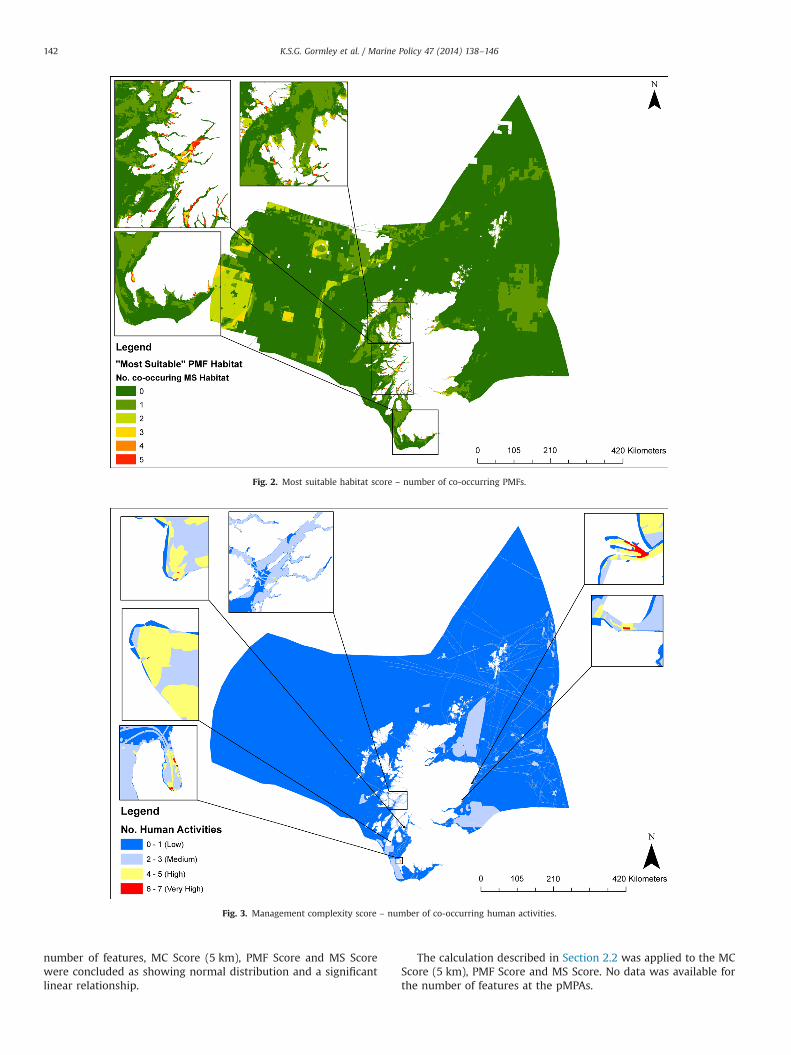
The modelled potential PMF map (Fig. 2) illustrates thatthere are areas where there is the potential for up to 5 co-occurring PMFs to occur. The results also indicate areas of higherpotential PMF biodiversity primarily occur on the west coastof Scotland, but with some additional areas appearing on theeast coast.
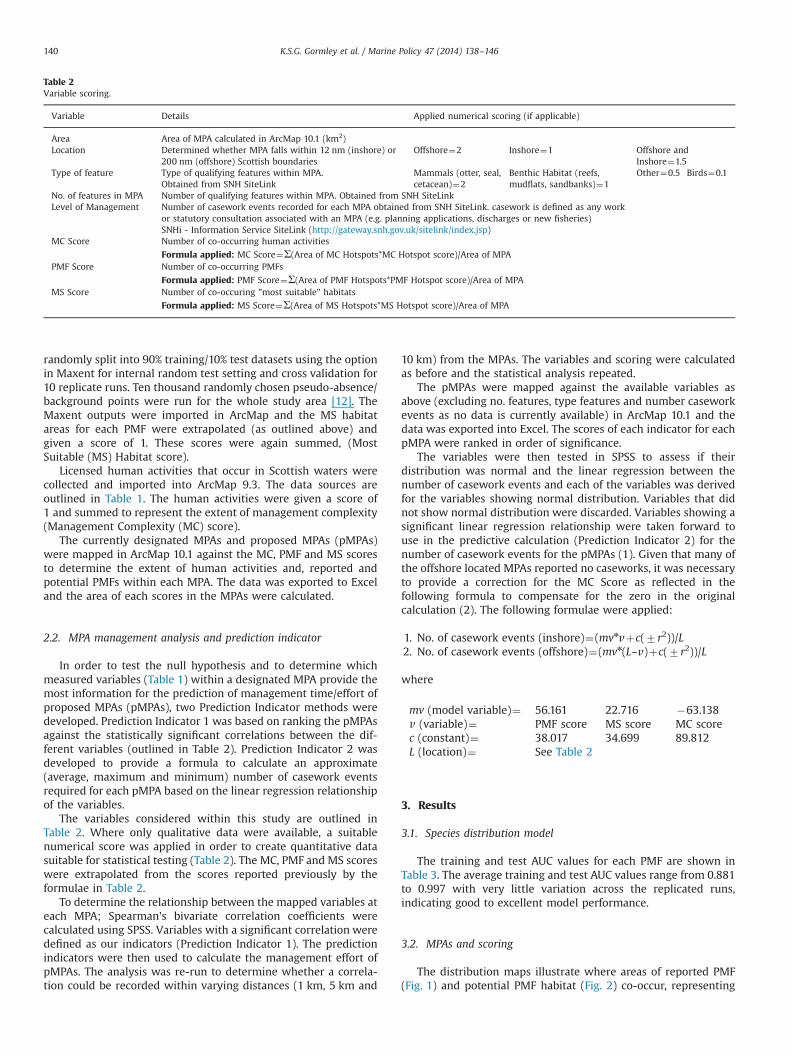
The human activity results (Fig. 3) show that there are upto 7 activities occurring simultaneously in some units of assess-ment. The majority of Very High management complexity (6–7activities) occurred at limited locations along the west coast ofScotland. Low activity areas (0–1 activities) dominate the offshoreregion.
3.3. MPA management analysis and prediction indicator
Table 4 shows the results of Spearman's rank correlation of theprocessed variables. Significant negative correlation (po0.001) wasreported between the number of casework events and the location ofthe MPA. This indicates that more management effort is required forMPAs in inshore areas compared with MPAs in offshore areas.
A positive correlation was reported between the number ofcasework events and the MS Score (po0.001), the number offeatures (p¼0.005), and the PMF score (p¼0.006. More manage-ment effort therefore appears to be required for MPAs with moreconservation features. Furthermore, the modelled (MS) number ofPMFs in an MPA was as good an indicator of management effort asthe actual number reported.
The MC score and the number of casework events showed nosignificant correlation as did the MC score and the area of the MPA(Table 4). This indicates that the number of licensed activities thatoccur within an MPA does not necessarily indicate that moremanagement effort will be required to manage the MPA. This alsoindicates that larger MPAs do not necessarily require more manage-ment effort, supporting the results outlined by Ban et al. [2].
Results showed that a significant negative correlation wasfound between the MC scores and number of casework eventsfor the 10 km and 5 km buffered MPAs (Table 5). This indicatesthat the number of casework events decreased as the MC scoreincreased in the general vicinity of MPAs.
Overall, the results showed that the MPA location, MS Scoreand PMF score (in order of significance) were the best predictors ofthe number of casework events and therefore probably manage-ment effort. The number of features was also significant, but thisdata is not available on the iSNH SiteLink for the pMPAs at presentand was therefore excluded.
The variable scores for the pMPAs were ranked in accordancewith the predictor indicators with the results shown in Table 6.Based on the linear regression predictor calculation, only the
Table 3Threshold-independent Area under the Curve (AUC) indices.
Priority marine habitat Average AUC
Training Test
Coral gardens 0.953 0.928Zostera beds 0.994 0.995Deep-sea sponge aggregations 0.933 0.903Intertidal Mytilus edulis beds on mixed and sandy sediments 0.998 0.997Lophelia pertusa reefs 0.916 0.881Maerl beds 0.987 0.985Modiolus modiolus horse mussel beds 0.989 0.985Sea-pen and burrowing megafauna communities 0.899 0.898
Fig. 1. PMF score – number of co-occurring PMFs.
K.S.G. Gormley et al. / Marine Policy 47 (2014) 138–146 141
number of features, MC Score (5 km), PMF Score and MS Scorewere concluded as showing normal distribution and a significantlinear relationship.
The calculation described in Section 2.2 was applied to the MCScore (5 km), PMF Score and MS Score. No data was available forthe number of features at the pMPAs.
Fig. 2. Most suitable habitat score – number of co-occurring PMFs.
Fig. 3. Management complexity score – number of co-occurring human activities.
K.S.G. Gormley et al. / Marine Policy 47 (2014) 138–146142
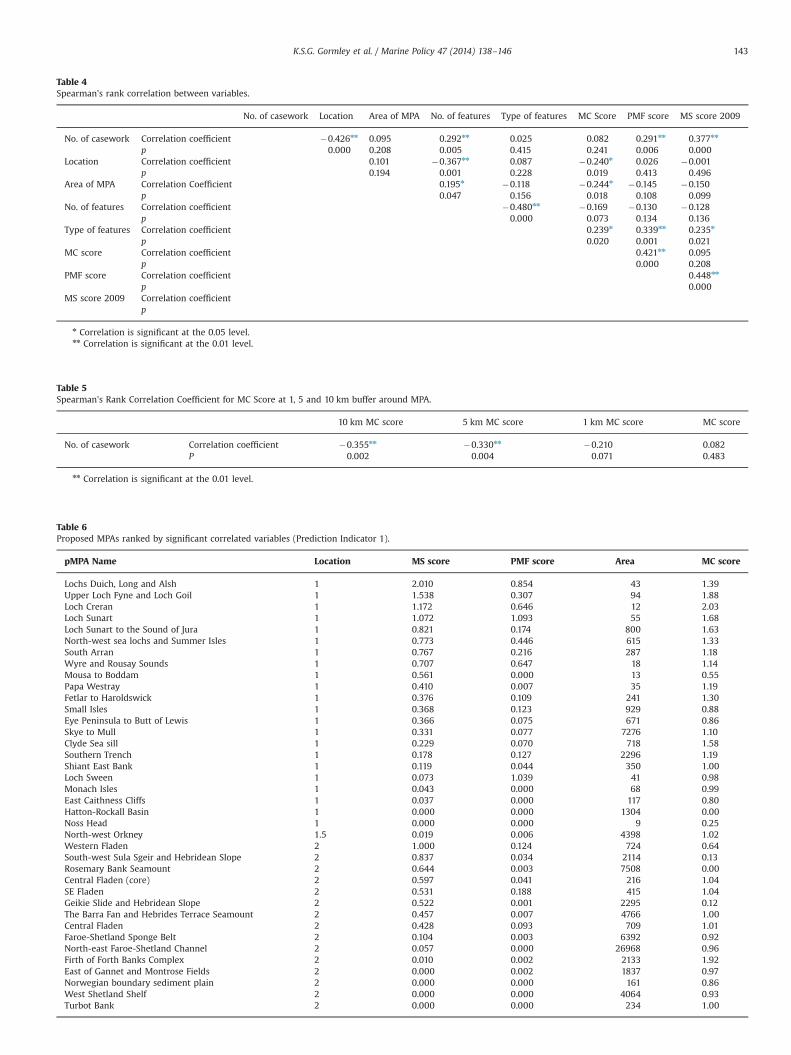
Table 4Spearman's rank correlation between variables.
No. of casework Location Area of MPA No. of features Type of features MC Score PMF score MS score 2009
No. of casework Correlation coefficient �0.426nn 0.095 0.292nn 0.025 0.082 0.291nn 0.377nn
p 0.000 0.208 0.005 0.415 0.241 0.006 0.000Location Correlation coefficient 0.101 �0.367nn 0.087 �0.240n 0.026 �0.001
p 0.194 0.001 0.228 0.019 0.413 0.496Area of MPA Correlation Coefficient 0.195n �0.118 �0.244n �0.145 �0.150
p 0.047 0.156 0.018 0.108 0.099No. of features Correlation coefficient �0.480nn �0.169 �0.130 �0.128
p 0.000 0.073 0.134 0.136Type of features Correlation coefficient 0.239n 0.339nn 0.235n
p 0.020 0.001 0.021MC score Correlation coefficient 0.421nn 0.095
p 0.000 0.208PMF score Correlation coefficient 0.448nn
p 0.000MS score 2009 Correlation coefficient
p
n Correlation is significant at the 0.05 level.nn Correlation is significant at the 0.01 level.
Table 5Spearman's Rank Correlation Coefficient for MC Score at 1, 5 and 10 km buffer around MPA.
10 km MC score 5 km MC score 1 km MC score MC score
No. of casework Correlation coefficient �0.355nn �0.330nn �0.210 0.082P 0.002 0.004 0.071 0.483
nn Correlation is significant at the 0.01 level.
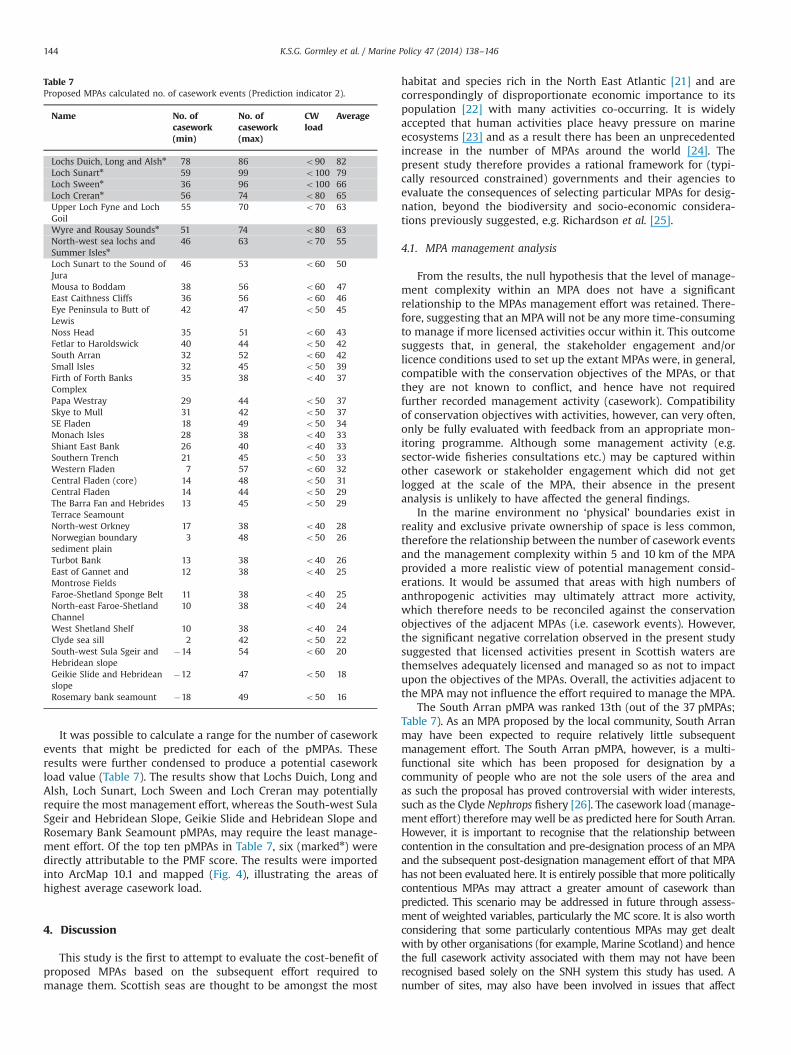
Table 6Proposed MPAs ranked by significant correlated variables (Prediction Indicator 1).
pMPA Name Location MS score PMF score Area MC score
Lochs Duich, Long and Alsh 1 2.010 0.854 43 1.39Upper Loch Fyne and Loch Goil 1 1.538 0.307 94 1.88Loch Creran 1 1.172 0.646 12 2.03Loch Sunart 1 1.072 1.093 55 1.68Loch Sunart to the Sound of Jura 1 0.821 0.174 800 1.63North-west sea lochs and Summer Isles 1 0.773 0.446 615 1.33South Arran 1 0.767 0.216 287 1.18Wyre and Rousay Sounds 1 0.707 0.647 18 1.14Mousa to Boddam 1 0.561 0.000 13 0.55Papa Westray 1 0.410 0.007 35 1.19Fetlar to Haroldswick 1 0.376 0.109 241 1.30Small Isles 1 0.368 0.123 929 0.88Eye Peninsula to Butt of Lewis 1 0.366 0.075 671 0.86Skye to Mull 1 0.331 0.077 7276 1.10Clyde Sea sill 1 0.229 0.070 718 1.58Southern Trench 1 0.178 0.127 2296 1.19Shiant East Bank 1 0.119 0.044 350 1.00Loch Sween 1 0.073 1.039 41 0.98Monach Isles 1 0.043 0.000 68 0.99East Caithness Cliffs 1 0.037 0.000 117 0.80Hatton-Rockall Basin 1 0.000 0.000 1304 0.00Noss Head 1 0.000 0.000 9 0.25North-west Orkney 1.5 0.019 0.006 4398 1.02Western Fladen 2 1.000 0.124 724 0.64South-west Sula Sgeir and Hebridean Slope 2 0.837 0.034 2114 0.13Rosemary Bank Seamount 2 0.644 0.003 7508 0.00Central Fladen (core) 2 0.597 0.041 216 1.04SE Fladen 2 0.531 0.188 415 1.04Geikie Slide and Hebridean Slope 2 0.522 0.001 2295 0.12The Barra Fan and Hebrides Terrace Seamount 2 0.457 0.007 4766 1.00Central Fladen 2 0.428 0.093 709 1.01Faroe-Shetland Sponge Belt 2 0.104 0.003 6392 0.92North-east Faroe-Shetland Channel 2 0.057 0.000 26968 0.96Firth of Forth Banks Complex 2 0.010 0.002 2133 1.92East of Gannet and Montrose Fields 2 0.000 0.002 1837 0.97Norwegian boundary sediment plain 2 0.000 0.000 161 0.86West Shetland Shelf 2 0.000 0.000 4064 0.93Turbot Bank 2 0.000 0.000 234 1.00
K.S.G. Gormley et al. / Marine Policy 47 (2014) 138–146 143
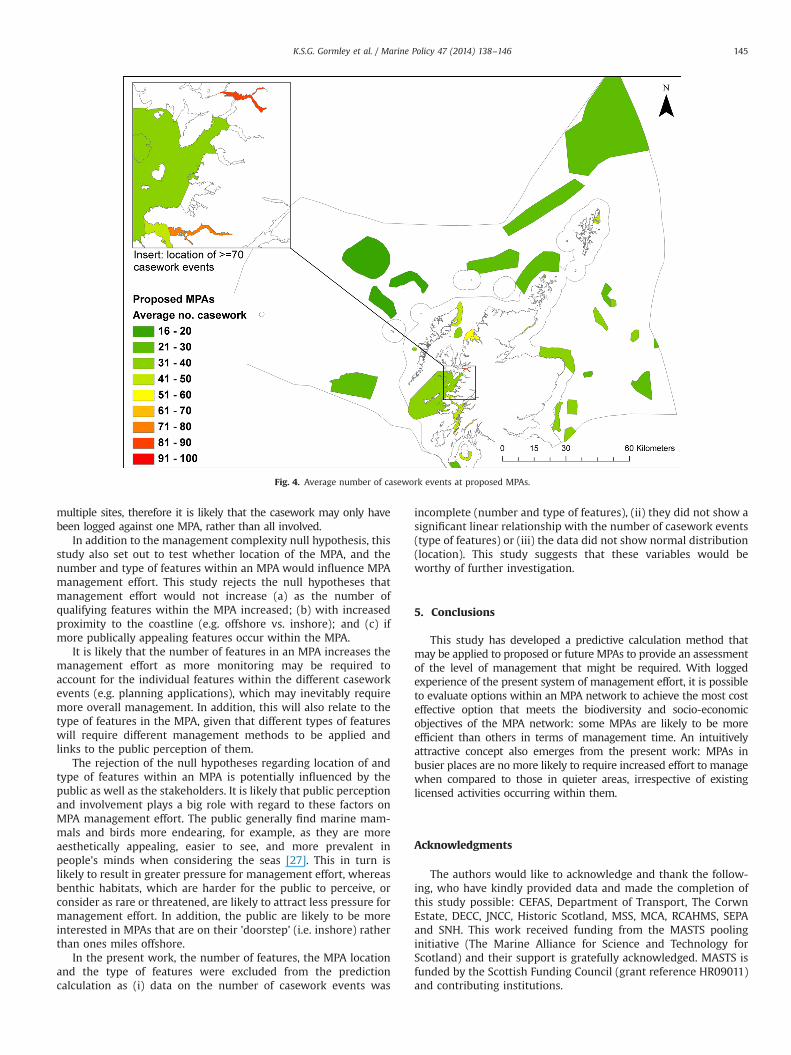
It was possible to calculate a range for the number of caseworkevents that might be predicted for each of the pMPAs. Theseresults were further condensed to produce a potential caseworkload value (Table 7). The results show that Lochs Duich, Long andAlsh, Loch Sunart, Loch Sween and Loch Creran may potentiallyrequire the most management effort, whereas the South-west SulaSgeir and Hebridean Slope, Geikie Slide and Hebridean Slope andRosemary Bank Seamount pMPAs, may require the least manage-ment effort. Of the top ten pMPAs in Table 7, six (markedn) weredirectly attributable to the PMF score. The results were importedinto ArcMap 10.1 and mapped (Fig. 4), illustrating the areas ofhighest average casework load.
4. Discussion
This study is the first to attempt to evaluate the cost-benefit ofproposed MPAs based on the subsequent effort required tomanage them. Scottish seas are thought to be amongst the most
habitat and species rich in the North East Atlantic [21] and arecorrespondingly of disproportionate economic importance to itspopulation [22] with many activities co-occurring. It is widelyaccepted that human activities place heavy pressure on marineecosystems [23] and as a result there has been an unprecedentedincrease in the number of MPAs around the world [24]. Thepresent study therefore provides a rational framework for (typi-cally resourced constrained) governments and their agencies toevaluate the consequences of selecting particular MPAs for desig-nation, beyond the biodiversity and socio-economic considera-tions previously suggested, e.g. Richardson et al. [25].
4.1. MPA management analysis
From the results, the null hypothesis that the level of manage-ment complexity within an MPA does not have a significantrelationship to the MPAs management effort was retained. There-fore, suggesting that an MPAwill not be any more time-consumingto manage if more licensed activities occur within it. This outcomesuggests that, in general, the stakeholder engagement and/orlicence conditions used to set up the extant MPAs were, in general,compatible with the conservation objectives of the MPAs, or thatthey are not known to conflict, and hence have not requiredfurther recorded management activity (casework). Compatibilityof conservation objectives with activities, however, can very often,only be fully evaluated with feedback from an appropriate mon-itoring programme. Although some management activity (e.g.sector-wide fisheries consultations etc.) may be captured withinother casework or stakeholder engagement which did not getlogged at the scale of the MPA, their absence in the presentanalysis is unlikely to have affected the general findings.
In the marine environment no ‘physical’ boundaries exist inreality and exclusive private ownership of space is less common,therefore the relationship between the number of casework eventsand the management complexity within 5 and 10 km of the MPAprovided a more realistic view of potential management consid-erations. It would be assumed that areas with high numbers ofanthropogenic activities may ultimately attract more activity,which therefore needs to be reconciled against the conservationobjectives of the adjacent MPAs (i.e. casework events). However,the significant negative correlation observed in the present studysuggested that licensed activities present in Scottish waters arethemselves adequately licensed and managed so as not to impactupon the objectives of the MPAs. Overall, the activities adjacent tothe MPA may not influence the effort required to manage the MPA.
The South Arran pMPA was ranked 13th (out of the 37 pMPAs;Table 7). As an MPA proposed by the local community, South Arranmay have been expected to require relatively little subsequentmanagement effort. The South Arran pMPA, however, is a multi-functional site which has been proposed for designation by acommunity of people who are not the sole users of the area andas such the proposal has proved controversial with wider interests,such as the Clyde Nephrops fishery [26]. The casework load (manage-ment effort) therefore may well be as predicted here for South Arran.However, it is important to recognise that the relationship betweencontention in the consultation and pre-designation process of an MPAand the subsequent post-designation management effort of that MPAhas not been evaluated here. It is entirely possible that more politicallycontentious MPAs may attract a greater amount of casework thanpredicted. This scenario may be addressed in future through assess-ment of weighted variables, particularly the MC score. It is also worthconsidering that some particularly contentious MPAs may get dealtwith by other organisations (for example, Marine Scotland) and hencethe full casework activity associated with them may not have beenrecognised based solely on the SNH system this study has used. Anumber of sites, may also have been involved in issues that affect
Table 7Proposed MPAs calculated no. of casework events (Prediction indicator 2).
Name No. ofcasework(min)
No. ofcasework(max)
CWload
Average
Lochs Duich, Long and Alshn 78 86 o90 82Loch Sunartn 59 99 o100 79Loch Sweenn 36 96 o100 66Loch Crerann 56 74 o80 65Upper Loch Fyne and LochGoil
55 70 o70 63
Wyre and Rousay Soundsn 51 74 o80 63North-west sea lochs andSummer Islesn
46 63 o70 55
Loch Sunart to the Sound ofJura
46 53 o60 50
Mousa to Boddam 38 56 o60 47East Caithness Cliffs 36 56 o60 46Eye Peninsula to Butt ofLewis
42 47 o50 45
Noss Head 35 51 o60 43Fetlar to Haroldswick 40 44 o50 42South Arran 32 52 o60 42Small Isles 32 45 o50 39Firth of Forth BanksComplex
35 38 o40 37
Papa Westray 29 44 o50 37Skye to Mull 31 42 o50 37SE Fladen 18 49 o50 34Monach Isles 28 38 o40 33Shiant East Bank 26 40 o40 33Southern Trench 21 45 o50 33Western Fladen 7 57 o60 32Central Fladen (core) 14 48 o50 31Central Fladen 14 44 o50 29The Barra Fan and HebridesTerrace Seamount
13 45 o50 29
North-west Orkney 17 38 o40 28Norwegian boundarysediment plain
3 48 o50 26
Turbot Bank 13 38 o40 26East of Gannet andMontrose Fields
12 38 o40 25
Faroe-Shetland Sponge Belt 11 38 o40 25North-east Faroe-ShetlandChannel
10 38 o40 24
West Shetland Shelf 10 38 o40 24Clyde sea sill 2 42 o50 22South-west Sula Sgeir andHebridean slope
�14 54 o60 20
Geikie Slide and Hebrideanslope
�12 47 o50 18
Rosemary bank seamount �18 49 o50 16
K.S.G. Gormley et al. / Marine Policy 47 (2014) 138–146144
multiple sites, therefore it is likely that the casework may only havebeen logged against one MPA, rather than all involved.
In addition to the management complexity null hypothesis, thisstudy also set out to test whether location of the MPA, and thenumber and type of features within an MPA would influence MPAmanagement effort. This study rejects the null hypotheses thatmanagement effort would not increase (a) as the number ofqualifying features within the MPA increased; (b) with increasedproximity to the coastline (e.g. offshore vs. inshore); and (c) ifmore publically appealing features occur within the MPA.
It is likely that the number of features in an MPA increases themanagement effort as more monitoring may be required toaccount for the individual features within the different caseworkevents (e.g. planning applications), which may inevitably requiremore overall management. In addition, this will also relate to thetype of features in the MPA, given that different types of featureswill require different management methods to be applied andlinks to the public perception of them.
The rejection of the null hypotheses regarding location of andtype of features within an MPA is potentially influenced by thepublic as well as the stakeholders. It is likely that public perceptionand involvement plays a big role with regard to these factors onMPA management effort. The public generally find marine mam-mals and birds more endearing, for example, as they are moreaesthetically appealing, easier to see, and more prevalent inpeople's minds when considering the seas [27]. This in turn islikely to result in greater pressure for management effort, whereasbenthic habitats, which are harder for the public to perceive, orconsider as rare or threatened, are likely to attract less pressure formanagement effort. In addition, the public are likely to be moreinterested in MPAs that are on their 'doorstep' (i.e. inshore) ratherthan ones miles offshore.
In the present work, the number of features, the MPA locationand the type of features were excluded from the predictioncalculation as (i) data on the number of casework events was
incomplete (number and type of features), (ii) they did not show asignificant linear relationship with the number of casework events(type of features) or (iii) the data did not show normal distribution(location). This study suggests that these variables would beworthy of further investigation.
5. Conclusions
This study has developed a predictive calculation method thatmay be applied to proposed or future MPAs to provide an assessmentof the level of management that might be required. With loggedexperience of the present system of management effort, it is possibleto evaluate options within an MPA network to achieve the most costeffective option that meets the biodiversity and socio-economicobjectives of the MPA network: some MPAs are likely to be moreefficient than others in terms of management time. An intuitivelyattractive concept also emerges from the present work: MPAs inbusier places are no more likely to require increased effort to managewhen compared to those in quieter areas, irrespective of existinglicensed activities occurring within them.
Acknowledgments
The authors would like to acknowledge and thank the follow-ing, who have kindly provided data and made the completion ofthis study possible: CEFAS, Department of Transport, The CorwnEstate, DECC, JNCC, Historic Scotland, MSS, MCA, RCAHMS, SEPAand SNH. This work received funding from the MASTS poolinginitiative (The Marine Alliance for Science and Technology forScotland) and their support is gratefully acknowledged. MASTS isfunded by the Scottish Funding Council (grant reference HR09011)and contributing institutions.
Fig. 4. Average number of casework events at proposed MPAs.
K.S.G. Gormley et al. / Marine Policy 47 (2014) 138–146 145
References
[1] Balmford A, Gravestock P, Hockley N, McClean CJ, Roberts CM. The worldwidecosts of marine protected areas. In: Proceedings of the National Academy ofSciences. 2004;101:9694–7.
[2] Ban NC, Adams V, Pressey RL, Hicks J. Promise and problems for estimatingmanagement costs of marine protected areas. Conserv Lett 2011;4:241–52.
[3] Himes AH. Performance indicators in MPA management: using questionnairesto analyze stakeholder preferences. Ocean Coast Manag 2007;50:329–51.
[4] Pomeroy R, Douvere F. The engagement of stakeholders in the marine spatialplanning process. Mar Policy 2008;32:816–22.
[5] McCrea-Strub A, Zeller D, Rashid Sumaila U, Nelson J, Balmford A, Pauly D.Understanding the cost of establishing marine protected areas. Mar Policy2011;35:1–9.
[6] Angulo-Valdés JA, Hatcher BGA. New methodology for assessing the effec-tiveness of marine protected areas. Rev Invest Marinas 2013;33:55–70.
[7] Pomeroy RS, Watson LM, Parks JE, Cid GA. How is your MPA doing? Amethodology for evaluating the management effectiveness of marine pro-tected areas Ocean Coast Manag 2005;48:485–502.
[8] Alder J, Zeller D, Pitcher T, Sumaila RA. Method for evaluating marineprotected area management. Coast Manag 2002;30:121–31.
[9] SNH. Priority marine features. Scottish Natural Heritage; 2011. ⟨http://www.snh.gov.uk/protecting-scotlands-nature/safeguarding-biodiversity/priority-marine-features/⟩.
[10] JNCC. Mapping OSPAR priority habitats; 2012. ⟨http://jncc.defra.gov.uk/⟩ p.1583.
[11] Phillips SJ, Anderson RP, Schapire RE. Maximum entropy modelling of speciesgeographic distributions. Ecol Model 2006;190:231–59.
[12] Gormley KSG, Porter JS, Bell MC, Hull AD, Sanderson WG. Predictive habitatmodelling as a tool to assess the change in distribution and extent of an OSPARpriority habitat under an increased ocean temperature scenario: conse-quences for marine protected area networks and management. Plos One2013;8(7):e68263.
[13] Ross RE, Howell KL. Use of predictive habitat modelling to assess thedistribution and extent of the current protection of 'listed' deep-sea habitats.Diversity and Distributions. Early View: Online 2012:1–13.
[14] GEBCO. The General Bathymetric Chart of the Oceans (GEBCO)_08 Grid,Version 20100927; 2011.
[15] Locarnini RA, Mishonov AV, Antonov TP, Boyer HE, Garcia OK, Baranova M,et al. World Ocean Atlas 2009, volume 1: temperature. In: Levitus S, editor.NOAA Atlas NESDIS 68. Washington, D.C.: U.S. Government Printing Office;2010. p. 184.
[16] Antonov JI, Seidov D, Boyer TP, Locarnini RA, Mishonov AV, Garcia HE, et al.World Ocean Atlas 2009, volume 2: salinity. In: Levitus S, editor. NOAA AtlasNESDIS 69. Washington, D.C.: U.S. Government Printing Office; 2010. p. 184.
[17] Connor DW, Gilliland PM, Golding N, Robinson P, Todd D, Verling E.UKseamap: the mapping of seabed and water column features of UK seas.Joint Nat Conserv Comm 2006.
[18] DTI. Atlas of UK marine renewable energy resources: technical report; 2004.p.154.
[19] Marine Digimap. UK Hydrographic Office Charted Raster Navigation Charts;2012.
[20] BODC. UK Digital Marine Atlas (UKDMAP). Version 3 ed. 1998.[21] Hiscock K. Marine nature conservation review: rational and methods. coasts
and seas of the United Kingdom. MNCR series. Peterborough: Joint NatureConservation Committee; 1996.
[22] Scottish Government. Scotland's National Marine Plan Pre-Consultation Draft;2011. ⟨http://www.scotland.gov.uk/Publications/2011/03/21114728/0⟩.
[23] Korpinen S, Meski L, Andersen JH, Laamanen M. Human pressures and theirpotential impact on the Baltic Sea ecosystem. Ecol Indic 2012;15:105–14.
[24] Gaston KJ, Jackson SF, Cantú-Salazar L, Cruz-Piñón G. The ecological perfor-mance of protected areas. Ann Rev Ecol, Evol Syst 2008;39:93–113.
[25] Richardson EA, Kaiser MJ, Edwards-Jones G, Possingham HP. Sensibilidad delDiseño de Reservas Marinas a la Resolución Espacial de Datos Socioeconómico[Sensitivity of marine-reserve design to the spatial resolution of socioeco-nomic data]. Conserv Biol 2006;20:1191–202.
[26] JMP. The Tangle of the Clyde: Why we must reform the management ofScotland's marine environment. WWF and SWT Joint Marine Programme;2008.
[27] Bianchi CN, Morri C. Marine biodiversity of the mediterranean sea: situation,problems and prospects for future research. Mar Pollut Bull 2000;40:367–76.
K.S.G. Gormley et al. / Marine Policy 47 (2014) 138–146146