on the protection of \"protected areas
TRANSCRIPT

On the protection of ‘‘protected areas’’Lucas N. Joppa, Scott R. Loarie, and Stuart L. Pimm*
Nicholas School of the Environment and Earth Sciences, Box 90328, Duke University, Durham, NC 23708
Communicated by Norman Myers, University of Oxford, Oxford, United Kingdom, March 19, 2008 (received for review October 23, 2007)
Tropical moist forests contain the majority of terrestrial species.Human actions destroy between 1 and 2 million km2 of such forestsper decade, with concomitant carbon release into the atmosphere.Within these forests, protected areas are the principle defenseagainst forest loss and species extinctions. Four regions—theAmazon, Congo, South American Atlantic Coast, and West Africa—once constituted about half the world’s tropical moist forest. Wemeasure forest cover at progressively larger distances inside andoutside of protected areas within these four regions, using data-sets on protected areas and land-cover. We find important geo-graphical differences. In the Amazon and Congo, protected areasare generally large and retain high levels of forest cover, as do theirsurroundings. These areas are protected de facto by being inac-cessible and will likely remain protected if they continue to be so.Deciding whether they are also protected de jure—that is, whethereffective laws also protect them—is statistically difficult, for thereare few controls. In contrast, protected areas in the Atlantic Coastforest and West Africa show sharp boundaries in forest cover attheir edges. This effective protection of forest cover is partiallyoffset by their very small size: little area is deep inside protectedarea boundaries. Lands outside protected areas in the AtlanticCoast forest are unusually fragmented. Finally, we ask whetherglobal databases on protected areas are biased toward highlyprotected areas and ignore ‘‘paper parks.’’ Analysis of a Braziliandatabase does not support this presumption.
biodiversity � tropical forest � conservation � deforestation
With species extinction rates running �100 times the back-ground rate and poised to increase another 10-fold (1),
assessing the success of conservation efforts is vital. For birds, thebest-known taxon, recent efforts have substantially reduced theextinction rate, even as the number of species threatened withextinction has increased dramatically (1, 2). Does such success applyto all species? Habitat destruction is the leading cause of speciesendangerment, and establishing protected areas is the principaldefense (3, 4). Protected areas cover �12% of the earth’s landsurface and serve many strategic purposes, including the preserva-tion of species. An obvious question is whether protected areas‘‘work’’ to protect biodiversity by retaining natural vegetation cover(5). Such protection is necessary, if not sufficient, to protectbiodiversity (6).
Tropical moist forests contain the large majority of terrestrialspecies (3), and so we focus on them. Human actions such as loggingand cultivation (7) destroy between 1 and 2 million km2 of suchforests per decade, with concomitant releases of carbon into theatmosphere (3). Even more forest is damaged by fires and selectiveharvesting (8, 9, 10). Four regions—the Amazon, Congo, SouthAmerican Atlantic Coast, and West Africa—once constitutedabout half the world’s tropical moist forest (3). We measure forestcover at progressively larger distances inside and outside of pro-tected area boundaries for these regions.
We ask three questions with regard to protected areas. First, ata given distance, do protected areas retain more natural vegetation[supporting information (SI) Fig. S1] than adjacent unprotectedlands? (And if there are differences, do these relate to differingmanagement objectives?) Second, how fragmented is the naturalvegetation within protected areas? [Other things being equal, highlyfragmented vegetation will be of less value for protecting biodiver-
sity (11).] Finally, are protected areas large enough to sustain viablepopulations of the species we wish to protect (12)?
Measuring SuccessThere are many measures of a protected area’s success (13). Whenconsidering just species protection, many protected areas may be inthe wrong place to be most effective in saving species (14).
Results of studies asking whether particular protected areas areeffective range from an emphatic ‘‘no’’ (15, 16, 17) to an equallyemphatic ‘‘yes’’ (8, 18, 19). The range of answers means thateffectiveness must depend on many local factors, including politicaland economic ones.
Are there any generalities, or must we analyze each protectedarea individually? There are two large-scale quantitative assess-ments. Vanclay (20) has disparaged one of these (21) as statisticallyflawed. Certainly, its measure of effectiveness—questionnaire re-sults from park employees and researchers (21)—clearly lacksindependent quantification.
The second assessment comes from DeFries et al. (22), whoexplicitly quantify deforestation in and around 198 (moist and drytropical forest) protected areas worldwide. The main conclusion issuggested by the paper’s declarative title: ‘‘Increasing isolation ofprotected areas in tropical forests over the past twenty years’’.Certainly, the paper itself fleshes out this result in detail andrecognizes considerable geographical variation in the results. Tounderstand this paper better, we mapped out these results (see SIText). In doing so, we found the geographical differences to be themost compelling, as we shall relate. Although this is essentially onlya matter of emphasis, it opens paths of inquiry.
Our data and analyses differ from those of Defries et al. in thatwe do not describe rates of change. This limits some inferences ofwhether protected areas actually protect forest. That said, we findthat whether protected areas do protect natural vegetation coverdepends on a complex of factors than vary geographically andcontextually.
We use global datasets to quantify remaining natural vegetationin and around protected areas in four tropical moist forests. We alsoestimate the fragmentation of the forests and how much area lieswithin a given distance inside the protected area boundaries. We dothis for several different management categories. The Amazon andCongo are ‘‘wilderness forests,’’ the two largest remaining tracts oftropical moist forest, whereas the Atlantic Coast and West Africaforests are biodiversity ‘‘hotspots’’ (23). These are regions with highnumbers of endemic species (�1,000 endemic plants) and highlevels of habitat loss (�30% of natural habitats remaining.) Weinitially chose the two New World regions because we haveextensive field experience there and feel that they provide theimportant geographical contrasts that we wish to explore. Weadded the two areas in Africa because they are clearly analogous tothe two New World regions. Importantly, we compare our results
Author contributions: L.N.J., S.R.L., and S.L.P. designed research; L.N.J. and S.R.L. performedresearch; L.N.J. and S.R.L. analyzed data; and L.N.J., S.R.L., and S.L.P. wrote the paper.
The authors declare no conflict of interest.
Freely available online through the PNAS open access option.
*To whom correspondence may be addressed. E-mail: [email protected].
This article contains supporting information online at www.pnas.org/cgi/content/full/0802471105/DCSupplemental.
© 2008 by The National Academy of Sciences of the USA
www.pnas.org�cgi�doi�10.1073�pnas.0802471105 PNAS � May 6, 2008 � vol. 105 � no. 18 � 6673–6678
ENV
IRO
NM
ENTA
LSC
IEN
CES

from the global protected area database with an independent onethat covers most of the two New World regions.
We survey tropical moist forests because they contain the largemajority of terrestrial species (24, 25) and their conversion to openpastures, crops, and other human-dominated ecosystems is clearlyvisible in remote sensor images.
Quantifying deforestation, fragmentation, and the size of rem-nant habitats is a coarse approach to an issue as complicated asdetermining whether protected areas protect species. It overlooksmany threats, only some of which we discuss below, and ignores thefact that some protected areas are not established for the purposeof species protection. There is always a tradeoff between generalityand specificity. As we noticed above, there are many specific studiesthat are certainly interesting in themselves but completely miss thegeneral patterns we uncover in this article.
Unlike other studies, ours is geographically and categoricallycomprehensive; we examine protected areas of multiple manage-ment types across four large tropical forests on two continents. Oursis an all-inclusive assessment of how natural vegetation changeswith distance across protected area boundaries. With this scopecomes limitations, of course, and our data are static; we do not lookat changes over time. Nonetheless, visualizing the distribution ofnatural vegetation in and around protected areas is essential ifconservation scientists are to make informed decisions regardingcurrent and future protected areas (26).
ResultsThe World Database on Protected Areas (WDPA). The distribution ofnatural vegetation in and around protected areas differs greatlydepending on the region. Fig. 1 shows the percentage of naturalvegetation in 2-km annuli in from, and out from, the boundary ofprotected areas in the Amazon, Atlantic Coast, West African, andCongo forests in various categories of World Conservation Union(IUCN) protected areas (see also Fig. S2). IUCN categories arearranged in descending in order of protection from I to VI.Categories I–IV are managed for biodiversity protection, whereasCategories V and VI are subject to multiple-use management (seeMaterials and Methods for details and SI Text for definitions ofmanagement categories). Protected areas of all management cat-
egories located in wilderness forests (Amazon, Congo) contain highpercentages of natural vegetation, as do the lands around them. Incontrast, protected areas of all management categories in hotspots(Atlantic Coast, West Africa) show a sharp change at the protectedarea boundary, with much more natural vegetation inside than out.In West Africa, the amount of natural vegetation inside protectedareas is lower than in the other three regions and remains so untilwell inside the reserve boundary. The SI Text provides maps ofthese regions, the categories of protected areas involved, and theland cover types.
Fig. 1 breaks down protected areas by IUCN category withinregion. The percentage of natural vegetation within protected areasis very similar in all categories in every region, with one exception:West Africa. Here, IUCN Categories V, VI, and ‘‘miscellaneous’’perform poorly relative to Categories I and II and III and IV.
Fig. 2 shows the total land area involved in the above calculations.The different shapes of the relationships reflect geometric con-straints. Inevitably, there is progressively less land at increasingdistances inside a reserve. For regions where protected areas aresmall—the Atlantic Coast and West African forests—there isalmost no area further than 10 km inside the boundary. Outside theboundary, the available land at different distances reflects the sizeand isolation of the protected areas. In the Atlantic forest, theprotected areas are small and isolated, so the area outside theboundary increases with distance. In West Africa, the protectedareas are also small, but the amount of land outside these areasdeclines with distance because of the high density of protected areas(primarily uncategorized ‘‘forest reserves’’).
Significantly, whereas putatively well-protected areas (IUCNcategories I and II) have the largest total areas in both regions ofSouth America, they constitute only a small component of WestAfrica’s protected areas (see Table S1 for a regional breakdown ofthe number of protected areas of by category, average size, andcorresponding variability of sizes). Also apparent is that WestAfrica is the only region with most reserves classified, if at all, in thelowest IUCN categories. Indeed, unclassified protected areas (pri-marily extractive forest reserves) make up the bulk of protectedareas in the region. This has significant implications for the com-bined results for West Africa, especially as compared to the AtlanticCoast, where very few protected areas lack IUCN classification.Across all regions, IUCN Categories III and IV are consistently theleast represented.
For a given amount of deforestation, the degree of fragmentationof natural vegetation can vary; it can cluster in a single large
Fig. 1. Percentage of natural vegetation inside and outside protected areasin the four geographic areas of analysis: Amazon forest (A), Atlantic coastforest (B), Congo forest (C), and West African forest (D). IUCN categories arearranged in descending order of protection from I to VI. Categories I–IV aremanaged for biodiversity protection, whereas Categories V and VI are subjectto multiple-use management. All protected areas are taken from the WDPA.Negative distances are inside protected areas; positive distances are outside.See also Fig. S2.
Fig. 2. Number of square kilometers included in the analysis at each 2-kmdistance increment in the four regions (see also Fig. S3). See Fig. 1 legend forsymbol definitions.
6674 � www.pnas.org�cgi�doi�10.1073�pnas.0802471105 Joppa et al.

fragment or be widely scattered. In practice, the amount of frag-mentation follows the patterns of deforestation, but it need not. Thetop panel of Fig. 3 shows how different amounts of fragmentation(two 200-km2 plots, both with between 40% and 45% remainingforest) can result in two radically different landscapes. One hasmany small forest fragments (Fig. 3A), the other has mostly intactforest cover in the southeast and few forests elsewhere (Fig. 3B).The corresponding values of the metric explained in the methodsare shown in Fig. 3E as points A and B.
Our metric readily compares points with different fragmentationbut similar deforestation, but has an obvious limitation when itcomes to comparing different levels of deforestation. At very lowand very high levels of deforestation (the results are triviallysymmetric), there can be only low levels of fragmentation; only atintermediate levels can there be widely different levels of fragmen-tation. We simulated 1,000 randomly deforested landscapes toillustrate in Fig. 3D the likely ranges of fragmentation for varyinglevels of deforestation. Real landscapes are nonrandom, withcontingent fragments, and so are generally much less fragmentedthan simulated ones.
To compare landscapes, one should simply plot the fragmenta-tion metric against deforestation, expecting the former to peakwhen deforestation is 50%. We do this in Fig. 3E.
The Amazon and the Congo show nearly identical patterns offragmentation; it increases in both places as deforestation increases.For deforestation of �10%, the Atlantic Coast Forest and WestAfrica are also broadly similar. It is at higher levels that differencesemerge. For a given level of deforestation, the Atlantic Coast forestis far more fragmented than West Africa, and where the boundariesof the protected areas lie on the two axes of deforestation andfragmentation is also very different. In West Africa, areas bothimmediately inside and outside of protected areas have �50%deforestation, the maximum amount of fragmentation as expectedby chance. In contrast, in the Atlantic coast, there is much lessdeforestation near the boundaries (�10%) and somewhat less
fragmentation. Some 10 kilometers outside a protected area, WestAfrica is mostly deforested (�75%) and so has a low fragmentation,whereas coastal Brazil is 50% deforested and is highly fragmented.
In all areas of analysis, the highest deforestation and fragmen-tation patterns inside protected areas occur within 4 km of theboundary. For the Amazon and Congo forests, less than 30% of theprotected land is further inside the protected areas than thisdistance. For the Atlantic Coast and West African forests, theequivalent numbers are 85% and 70%, respectively. This placesmost protected land in the two hotspots near the sharply definedboundaries seen in Fig. 1 A and C.
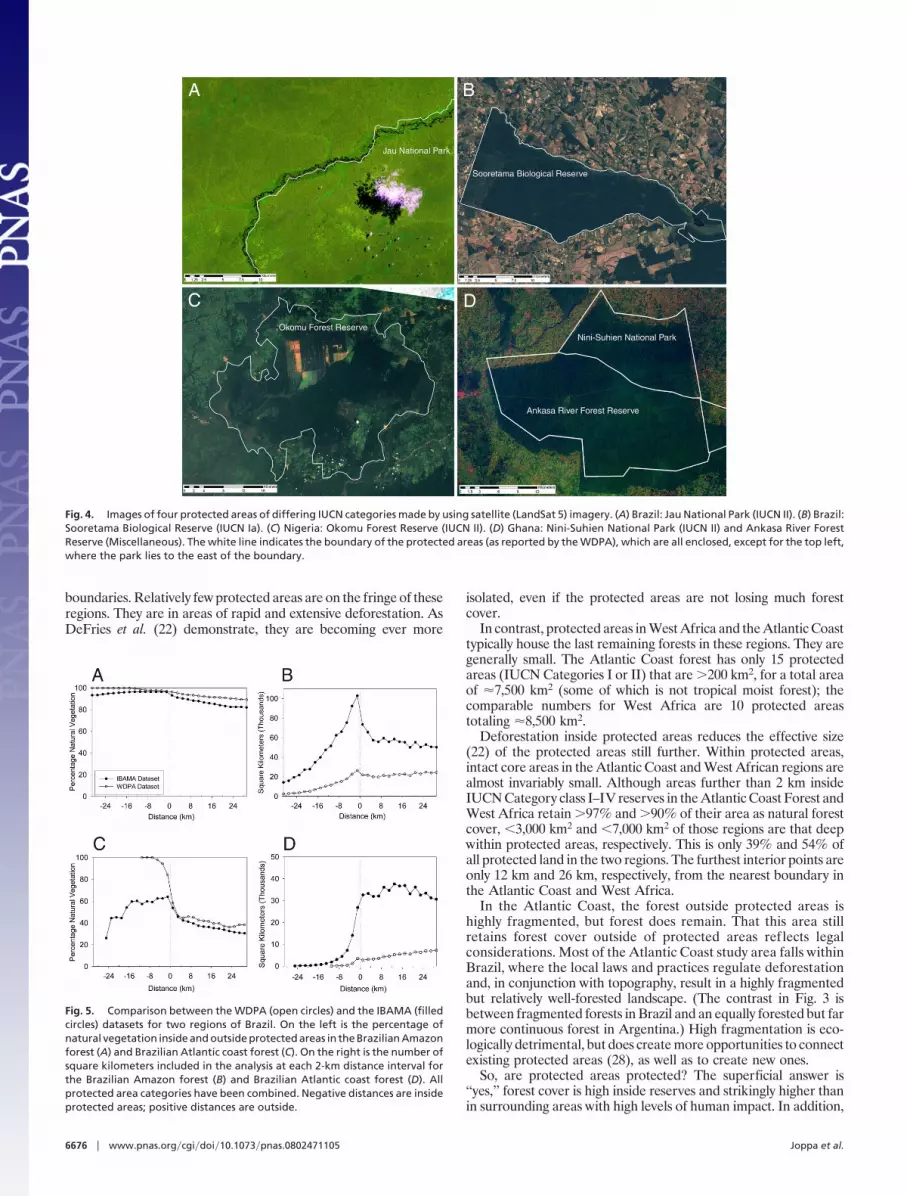
Fig. 4 provides finer scaled (Landsat 5 imagery) examples of thebroad patterns seen in Fig. 1. For example, Fig. 4A shows a portionof Jau National Park, a remote IUCN Category II protected areawithin the Brazilian Amazon. There is no obvious difference insideand outside the park. Fig. 4B shows Sooretama Biological Reserve(IUCN Category Ia, Brazilian Atlantic coast forest), and Fig. 4Dshows Nini-Suhien National Park (IUCN Category II protectedarea) and Ankasa River Forest Reserve (herein classified as a‘‘miscellaneous’’ protected area) in Ghana, West Africa. Bothimages (Fig. 4 B and D) highlight a remarkable change at thereserve’s boundary. Nonetheless, the protected areas are in threedifferent IUCN classes. Okomu Forest Reserve, (IUCN CategoryII, Nigeria, Fig. 4C) provides a case history of the difficulties ofmanaging protected areas, explored at length by Oates (27). Asoriginally planned, it was one of only five West African protectedareas covering �1,000 km2. Less than 200 km2 of natural forestremain within the reserve, albeit with a sharply defined boundary.
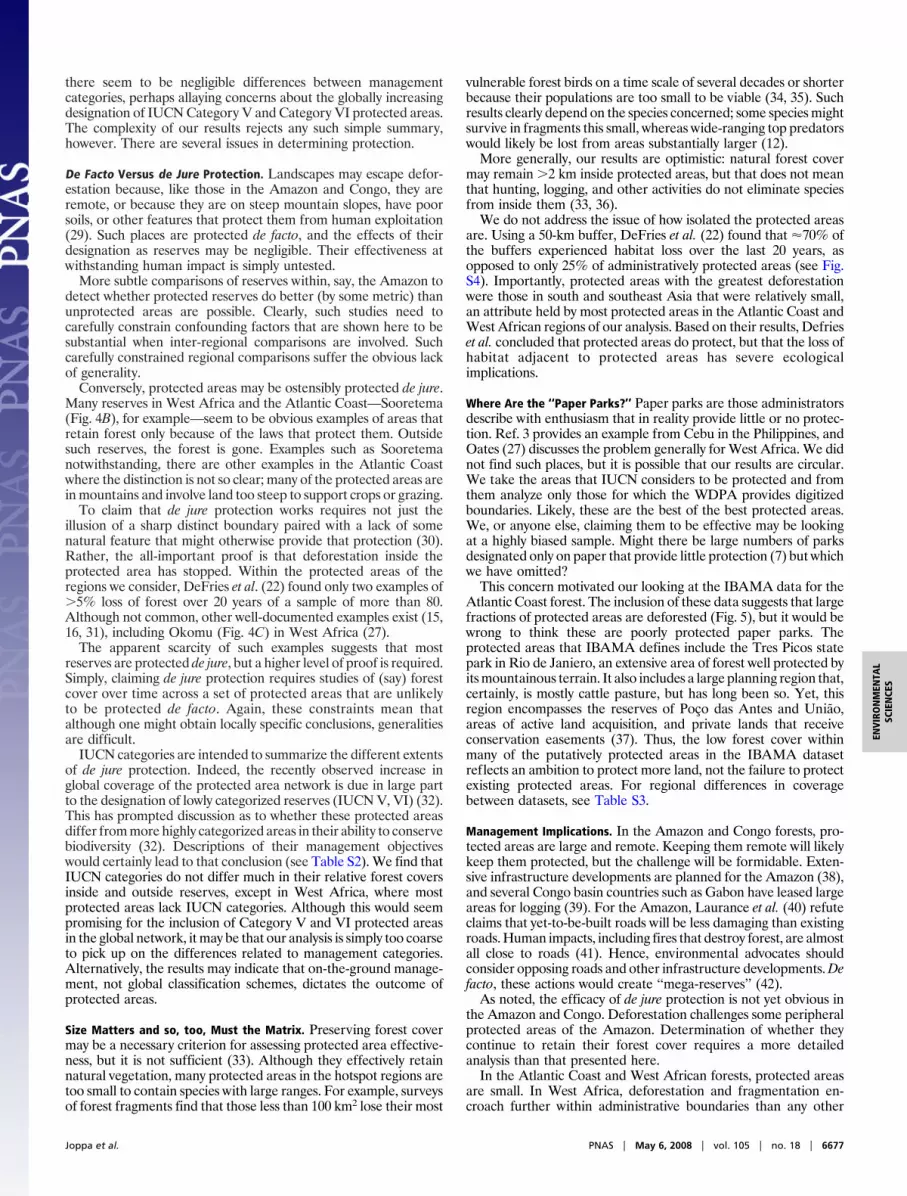
The Instituto Brasileiro do Meio Ambiente e dos Recursos NaturaisRenovaveis (IBAMA) Protected Area Database. As we shall discusspresently, a key concern is whether the WDPA provides a reason-able set of protected areas from which to draw our conclusions. Anobvious limitation of the WDPA is that it presents data in twoforms: the mapped protected areas we have analyzed thus far, andpoint locations with associated data on the size of the protected area(see SI Text for a detailed explanation). For West Africa, theCongo, and many other areas worldwide, the point data add onlya few percent extra to the mapped protected areas. Unfortunately,for the Amazon and Atlantic coast, the point data increase the totalarea by 50%, and for the Atlantic Coast by nearly five fold. In SIText, we do the only analysis possible—we imagine the protectedareas to be circular with an area equal to the known value andcentered on the location specified (for a well explicated discussionof the implications of this method, see ref. 14). Not surprisingly,such hypothetical protected areas encompass substantial deforestedareas, which in all probability the correctly delineated areas do not.Fortunately, for Brazil, which covers most of the Amazon andAtlantic Coast forest, there is an independent database availablefrom IBAMA (www.ibama.gov.br/).
Fig. 5 contrasts data from the IBAMA and from WDPA. The fargreater areas encompassed by the IBAMA data are obvious. Forthe Amazon, the two datasets broadly agree in the percentage ofnatural vegetation cover inside and outside of protected areas. Forthe Atlantic coast forest of Brazil, they do not. There is much lessforest within the areas IBAMA specifies, a point to which we willreturn.
DiscussionMost protected areas in the Congo and Amazon are remote, large,and almost completely forested and sit within large, also nearlycompletely forested landscapes. The Amazon and Congo forestscontain reserve networks of all management categories that incor-porate multiple large protected areas. Large forested areas exist farinside protected area boundaries. Under such circumstances, ananalysis of vegetation change is unnecessary: there could not havebeen extensive changes in forest cover either inside or outside the
Fig. 3. Fragmentation measurements for differing percent natural vegeta-tion across the four regions analyzed. (Upper) Two areas (A and B, both 200km2) experiencing similar deforestation (40–45%) but different levels offragmentation. The map outline in C highlights the locations of the two plotsin the Atlantic coast region of analysis. (Lower) (D) The range of fragmenta-tion possible from 1,000 randomly deforested landscapes. (E) The fragmen-tation and deforestation values in and around protected areas in the fourregions of analysis. Black circles on lines correspond to the distance in (neg-ative values) or out (positive values) from protected area boundaries. Distancevalues (in kilometers) are located immediately above each circle. All protectedarea categories were combined for the analysis. The deforestation and frag-mentation results of the two areas shown in A and B are highlighted by theletters A and B.
Joppa et al. PNAS � May 6, 2008 � vol. 105 � no. 18 � 6675
ENV
IRO
NM
ENTA
LSC
IEN
CES
boundaries. Relatively few protected areas are on the fringe of theseregions. They are in areas of rapid and extensive deforestation. AsDeFries et al. (22) demonstrate, they are becoming ever more
isolated, even if the protected areas are not losing much forestcover.
In contrast, protected areas in West Africa and the Atlantic Coasttypically house the last remaining forests in these regions. They aregenerally small. The Atlantic Coast forest has only 15 protectedareas (IUCN Categories I or II) that are �200 km2, for a total areaof �7,500 km2 (some of which is not tropical moist forest); thecomparable numbers for West Africa are 10 protected areastotaling �8,500 km2.
Deforestation inside protected areas reduces the effective size(22) of the protected areas still further. Within protected areas,intact core areas in the Atlantic Coast and West African regions arealmost invariably small. Although areas further than 2 km insideIUCN Category class I–IV reserves in the Atlantic Coast Forest andWest Africa retain �97% and �90% of their area as natural forestcover, �3,000 km2 and �7,000 km2 of those regions are that deepwithin protected areas, respectively. This is only 39% and 54% ofall protected land in the two regions. The furthest interior points areonly 12 km and 26 km, respectively, from the nearest boundary inthe Atlantic Coast and West Africa.
In the Atlantic Coast, the forest outside protected areas ishighly fragmented, but forest does remain. That this area stillretains forest cover outside of protected areas reflects legalconsiderations. Most of the Atlantic Coast study area falls withinBrazil, where the local laws and practices regulate deforestationand, in conjunction with topography, result in a highly fragmentedbut relatively well-forested landscape. (The contrast in Fig. 3 isbetween fragmented forests in Brazil and an equally forested but farmore continuous forest in Argentina.) High fragmentation is eco-logically detrimental, but does create more opportunities to connectexisting protected areas (28), as well as to create new ones.
So, are protected areas protected? The superficial answer is‘‘yes,’’ forest cover is high inside reserves and strikingly higher thanin surrounding areas with high levels of human impact. In addition,
Fig. 4. Images of four protected areas of differing IUCN categories made by using satellite (LandSat 5) imagery. (A) Brazil: Jau National Park (IUCN II). (B) Brazil:Sooretama Biological Reserve (IUCN Ia). (C) Nigeria: Okomu Forest Reserve (IUCN II). (D) Ghana: Nini-Suhien National Park (IUCN II) and Ankasa River ForestReserve (Miscellaneous). The white line indicates the boundary of the protected areas (as reported by the WDPA), which are all enclosed, except for the top left,where the park lies to the east of the boundary.
Fig. 5. Comparison between the WDPA (open circles) and the IBAMA (filledcircles) datasets for two regions of Brazil. On the left is the percentage ofnatural vegetation inside and outside protected areas in the Brazilian Amazonforest (A) and Brazilian Atlantic coast forest (C). On the right is the number ofsquare kilometers included in the analysis at each 2-km distance interval forthe Brazilian Amazon forest (B) and Brazilian Atlantic coast forest (D). Allprotected area categories have been combined. Negative distances are insideprotected areas; positive distances are outside.
6676 � www.pnas.org�cgi�doi�10.1073�pnas.0802471105 Joppa et al.
there seem to be negligible differences between managementcategories, perhaps allaying concerns about the globally increasingdesignation of IUCN Category V and Category VI protected areas.The complexity of our results rejects any such simple summary,however. There are several issues in determining protection.
De Facto Versus de Jure Protection. Landscapes may escape defor-estation because, like those in the Amazon and Congo, they areremote, or because they are on steep mountain slopes, have poorsoils, or other features that protect them from human exploitation(29). Such places are protected de facto, and the effects of theirdesignation as reserves may be negligible. Their effectiveness atwithstanding human impact is simply untested.
More subtle comparisons of reserves within, say, the Amazon todetect whether protected reserves do better (by some metric) thanunprotected areas are possible. Clearly, such studies need tocarefully constrain confounding factors that are shown here to besubstantial when inter-regional comparisons are involved. Suchcarefully constrained regional comparisons suffer the obvious lackof generality.
Conversely, protected areas may be ostensibly protected de jure.Many reserves in West Africa and the Atlantic Coast—Sooretema(Fig. 4B), for example—seem to be obvious examples of areas thatretain forest only because of the laws that protect them. Outsidesuch reserves, the forest is gone. Examples such as Sooretemanotwithstanding, there are other examples in the Atlantic Coastwhere the distinction is not so clear; many of the protected areas arein mountains and involve land too steep to support crops or grazing.
To claim that de jure protection works requires not just theillusion of a sharp distinct boundary paired with a lack of somenatural feature that might otherwise provide that protection (30).Rather, the all-important proof is that deforestation inside theprotected area has stopped. Within the protected areas of theregions we consider, DeFries et al. (22) found only two examples of�5% loss of forest over 20 years of a sample of more than 80.Although not common, other well-documented examples exist (15,16, 31), including Okomu (Fig. 4C) in West Africa (27).
The apparent scarcity of such examples suggests that mostreserves are protected de jure, but a higher level of proof is required.Simply, claiming de jure protection requires studies of (say) forestcover over time across a set of protected areas that are unlikelyto be protected de facto. Again, these constraints mean thatalthough one might obtain locally specific conclusions, generalitiesare difficult.
IUCN categories are intended to summarize the different extentsof de jure protection. Indeed, the recently observed increase inglobal coverage of the protected area network is due in large partto the designation of lowly categorized reserves (IUCN V, VI) (32).This has prompted discussion as to whether these protected areasdiffer from more highly categorized areas in their ability to conservebiodiversity (32). Descriptions of their management objectiveswould certainly lead to that conclusion (see Table S2). We find thatIUCN categories do not differ much in their relative forest coversinside and outside reserves, except in West Africa, where mostprotected areas lack IUCN categories. Although this would seempromising for the inclusion of Category V and VI protected areasin the global network, it may be that our analysis is simply too coarseto pick up on the differences related to management categories.Alternatively, the results may indicate that on-the-ground manage-ment, not global classification schemes, dictates the outcome ofprotected areas.
Size Matters and so, too, Must the Matrix. Preserving forest covermay be a necessary criterion for assessing protected area effective-ness, but it is not sufficient (33). Although they effectively retainnatural vegetation, many protected areas in the hotspot regions aretoo small to contain species with large ranges. For example, surveysof forest fragments find that those less than 100 km2 lose their most
vulnerable forest birds on a time scale of several decades or shorterbecause their populations are too small to be viable (34, 35). Suchresults clearly depend on the species concerned; some species mightsurvive in fragments this small, whereas wide-ranging top predatorswould likely be lost from areas substantially larger (12).
More generally, our results are optimistic: natural forest covermay remain �2 km inside protected areas, but that does not meanthat hunting, logging, and other activities do not eliminate speciesfrom inside them (33, 36).
We do not address the issue of how isolated the protected areasare. Using a 50-km buffer, DeFries et al. (22) found that �70% ofthe buffers experienced habitat loss over the last 20 years, asopposed to only 25% of administratively protected areas (see Fig.S4). Importantly, protected areas with the greatest deforestationwere those in south and southeast Asia that were relatively small,an attribute held by most protected areas in the Atlantic Coast andWest African regions of our analysis. Based on their results, Defrieset al. concluded that protected areas do protect, but that the loss ofhabitat adjacent to protected areas has severe ecologicalimplications.
Where Are the ‘‘Paper Parks?’’ Paper parks are those administratorsdescribe with enthusiasm that in reality provide little or no protec-tion. Ref. 3 provides an example from Cebu in the Philippines, andOates (27) discusses the problem generally for West Africa. We didnot find such places, but it is possible that our results are circular.We take the areas that IUCN considers to be protected and fromthem analyze only those for which the WDPA provides digitizedboundaries. Likely, these are the best of the best protected areas.We, or anyone else, claiming them to be effective may be lookingat a highly biased sample. Might there be large numbers of parksdesignated only on paper that provide little protection (7) but whichwe have omitted?
This concern motivated our looking at the IBAMA data for theAtlantic Coast forest. The inclusion of these data suggests that largefractions of protected areas are deforested (Fig. 5), but it would bewrong to think these are poorly protected paper parks. Theprotected areas that IBAMA defines include the Tres Picos statepark in Rio de Janiero, an extensive area of forest well protected byits mountainous terrain. It also includes a large planning region that,certainly, is mostly cattle pasture, but has long been so. Yet, thisregion encompasses the reserves of Poco das Antes and Uniao,areas of active land acquisition, and private lands that receiveconservation easements (37). Thus, the low forest cover withinmany of the putatively protected areas in the IBAMA datasetreflects an ambition to protect more land, not the failure to protectexisting protected areas. For regional differences in coveragebetween datasets, see Table S3.
Management Implications. In the Amazon and Congo forests, pro-tected areas are large and remote. Keeping them remote will likelykeep them protected, but the challenge will be formidable. Exten-sive infrastructure developments are planned for the Amazon (38),and several Congo basin countries such as Gabon have leased largeareas for logging (39). For the Amazon, Laurance et al. (40) refuteclaims that yet-to-be-built roads will be less damaging than existingroads. Human impacts, including fires that destroy forest, are almostall close to roads (41). Hence, environmental advocates shouldconsider opposing roads and other infrastructure developments. Defacto, these actions would create ‘‘mega-reserves’’ (42).
As noted, the efficacy of de jure protection is not yet obvious inthe Amazon and Congo. Deforestation challenges some peripheralprotected areas of the Amazon. Determination of whether theycontinue to retain their forest cover requires a more detailedanalysis than that presented here.
In the Atlantic Coast and West African forests, protected areasare small. In West Africa, deforestation and fragmentation en-croach further within administrative boundaries than any other
Joppa et al. PNAS � May 6, 2008 � vol. 105 � no. 18 � 6677
ENV
IRO
NM
ENTA
LSC
IEN
CES

region in our analysis. In both places, because of their small size,protected areas will likely lose species, however well they protectforest cover per se. Thus, any opportunities to connect forestfragments by restoring degraded habitats should be a priority (37).The unusually fragmented forests (Fig. 3) outside protected areasin the Atlantic Coast provide an opportunity to do just that, uniquewithin the four regions we consider.
Materials and MethodsWe present methods here in brief only (see SI Text for details). The World WildlifeFund provides a product that separates the earth into unique vegetative biomesand ecoregions (43). Biome 1 defines the extent of moist forest, from which weselectedthoseforestsoccurring infourregions.Withintheseregions,weusedtheGlobal Land Cover (GLC) 2000 product (44) as the source for current land cover.The GLC 2000, the most current global land cover dataset available, classifies theearth into 23 categories of vegetation at a 1-km2 resolution, with high accuracy(45). We considered each 1-km2 pixel to have experienced human disturbance ifit was in GLC Categories 16 (cultivated and managed areas), 17 (mosaic ofcropland with tree cover or other natural vegetation), 18 (mosaics of cropland,with shrubsorgrass cover), 19 (bareareas),or22 (artificial surfacesandassociatedareas). We considered all other categories to be natural vegetation.
We calculated the percentage of fragmentation from the revised GLC 2000.We did this by summing the length of edge (the boundary between human-dominated landscapes and natural vegetation) within each distance interval. Thelength of edge was calculated at the 1-km2 resolution of the GLC 2000 map. Each
sum was divided by the maximum possible edge within each distance bin—a1-km2 checkerboard of natural and human dominated landscapes—to obtain apercentage.
We included in our analysis all protected areas available as polygons in the2006 WDPA (46). The WDPA includes areas classified by IUCN into Categories I, II,III, IV, V, VI; Indigenous Areas; and Miscellaneous areas (see Table S2). For ease ofanalysis, we combined these categories in various ways, noting that they differsubstantially in their promise of conservation effectiveness. Although manyprotected areas are surrounded by management buffer zones, the WDPA doesnot delineate these, thus hindering our ability to address these areas explicitly.
Because our analysis provides a complete enumeration of the status of allpixels inside and outside the boundary of protected areas, we are not dealingwith statistical samples.
In addition to the data presented here, we used two other datasets. First,we analyzed a large set of WDPA data that present only the point location andarea of protected areas. Second, and only for Brazil, we used a differentclassification of protected areas. These datasets have considerable limitationsand alter some of the details presented here, but not the overarching con-clusions. We discuss the secondary WDPA dataset at length in SI Text.
ACKNOWLEDGMENTS. We thank the consortia that produced the World Data-base on Protected Areas, Global Land Cover 2000, and World Wildlife FederationEcoregions products for making their data freely available and the Duke EcologyDiscussion Group for their insightful comments. This work was supported by aNational Science Foundation Graduate Research Fellowship (to L.N.J.), and aNational Aeronautics and Space Administration Earth System Science Fellowship(to S.R.L.).
1. Pimm SL, Raven P, Peterson A, Sekercioglu CH, Ehrlich PR (2006) Forest losses predictbird extinctions in eastern North America. Proc Natl Acad Sci USA 103:10941–10946.
2. Butchart SHM, Stattersfield A, Collar N (2006) How many bird extinctions have weprevented? Oryx 40:266–278.
3. Pimm SL (2001) The World According to Pimm, a Scientist Audits the Earth (McGraw–Hill, New York).
4. Pimm SL, et al. (2001) Can we defy nature’s end? Science 233:2207–2208.5. Terborgh J, van Schaik CP (2002) Why the world needs parks. Making Parks Work,
Strategies for Preserving Tropical Nature, eds Terborgh J, van Schaik C, Davenport L,Rao M. (Island Press, Washington, DC), pp 3–14.
6. Parrish JD, Braun DP, Unnasch RS (2003) Are we conserving what we say we are?Measuring ecological integrity within protected areas. BioScience 53:851–860.
7. Myers N (1992) The Primary Source: Tropical Forests and Our Future (Norton, NewYork) rev ed.
8. Oliveira JPC, et al. (2007) Land-use allocation protects the Peruvian Amazon. Science317:1233–1236.
9. Nepstad DC, et al. (1999) Large-scale impoverishment of Amazonian forests by loggingand fire. Nature 398:505–508.
10. Cochrane MA (2003) Fire science for rainforests. Nature 421:913–919.11. Burkey TV (1989) Extinction in nature reserves: The effect of fragmentation and the
importance of migration between reserve fragments. Oikos 55:75–81.12. Woodroffe R, Ginsberg JR (1998) Edge effects and the extinction of populations inside
protected areas. Science 280:2126–2128.13. Hockings M (2003) Systems for assessing the effectiveness of management in protected
areas. BioScience 53:823–832.14. Rodrigues ASL, et al. (2004) Effectiveness of the global protected area network in
representing species diversity. Nature 428:640–643.15. Liu J, et al. (2001) Ecological degradation in protected areas: The case of Wolong
Nature Reserve for Giant Pandas. Science 292:98–101.16. Curran LM, et al. (2004) Lowland forest loss in protected areas of Indonesian Borneo.
Science 303:1000–1003.17. Roman-Cuesta RM, Martinez-Vilalta J (2006) Effectiveness of protected areas in miti-
gating fire within their boundaries: Case study of Chiapas, Mexico. Conserv Biol20:1074–1086.
18. Sanchez-Azofeifa GA, Rivard B, Calvo J, Moorthy I (2004) Dynamics of tropical defor-estation around national parks: Remote sensing of forest change on the Osa Peninsulaof Costa Rice. Mt Res Dev 22:352–358.
19. Nepstad DC, et al. (2006) Inhibition of Amazon deforestation and fire by parks andindigenous lands. Conserv Biol 20:65–73.
20. Vanclay JK (2001) The effectiveness of parks. Science 293:1007–1010.21. Bruner AG, Raymond E, Rice R, da Fonseca G (2001) Effectiveness of parks in protecting
biological diversity. Science 291:125–128.22. DeFries R, Hansen A, Newton A, Hansen M (2005) Increasing isolation of protected
areas in tropical forest over the past twenty years. Ecol Appl 15:19–26.23. Myers N, Mittermeier R, Mittermeier C, da Fonesca G, Kent J (2000) Biodiversity
hotspots for conservation priorities. Nature 403:853–858.
24. Raven PH (1980) Research Priorities in Tropical Biology (Natl Acad Sci Press, Washing-ton, DC).
25. Pimm SL, Brown JH (2004) Domains of diversity. Science 304:831–833.26. DeFries R, Hansen H, Turner BL, Reid R, Liu J (2007) Land use change around protected
areas: Management to balance human needs and ecological function. Ecol Appl17:974–988.
27. Oates JF (1999) Myth and Reality in the Rainforest, How Conservation Strategies areFailing in West Africa (Univ of California Press, Berkeley, CA).
28. Anderson A, Jenkins CN (2006) Applying Nature’s Design: Corridors as a Strategy forBiodiversity Conservation (Columbia Univ Press, New York).
29. Scott JM, et al. (2001) Nature reserves: Do they capture the full range of America’sbiological diversity? Ecol Appl 11:999–1007.
30. Ferraro PJ, Pattanayak S (2006) Money for nothing? A call for empirical evaluation ofbiodiversity conservation investments. Publ Libr Sci B 4:482–488.
31. Fuller DO, Jessup TC, Salim A (2004) Loss of forest cover in Kalimantan, Indonesia, sincethe 1997–1998 El Nino. Conserv Biol 18:249–254.
32. Locke H, Dearden P (2005) Rethinking protected area categories and the ‘‘new para-digm.’’ Environ Conserv 32:1–10.
33. Redford KH (1992) The empty forest. BioScience 42:412–422.34. Brooks TM, Pimm SL, Oyugi JO (1999) Time lag between deforestation and bird
extinction in tropical forest fragments. Conserv Biol 13:1140–1150.35. Ferraz G, et al. (2003) Rates of species loss from Amazonian forest fragments. Proc Natl
Acad Sci USA 100:14069–14073.36. Van Schaik CP, Terborgh J, Dugelby B (1997) The silent crisis: The state of rain forest
nature preserves. The Last Stand, Protected Areas and the Defense of TropicalBiodiversity, eds Kramer R, van Schaik CP, Johnson J (Oxford Univ Press, New York), pp64–89.
37. Pimm SL, Jenkins C (2005) Sustaining the variety of life. Sci Am (Sept.) 293:66–73.38. Laurance WF, et al. (2001) The future of the Brazilian Amazon. Science 19:438–439.39. Laurance WF, Alonso A, Lee M, Campbell P (2006) Challenges for forest conservation
in Gabon, Central Africa. Futures 38:454–470.40. Laurance WF, Albernaz AK, Fearnside PM, Vasconcelos HL, Ferreira LV (2004) Defor-
estation in Amazonia. Science 304:1109.41. Kirby KR, et al. (2006) The future of deforestation in the Brazilian Amazon. Futures
38:432–453.42. Laurance WF (2005) When bigger is better: The need for Amazonian mega-reserves.
Trends Ecol Evol 20:645–648.43. Olson DM, et al. (2001) Terrestrial ecoregions of the world: A new map of life on earth.
BioScience 51:933–938.44. Bartholome E, Belward A (2005) A new approach to global land cover mapping from
earth observation data. Int J Rem Sens 26:1959–1977.45. Mayaux P, et al. (2006) Validation of the global land cover 2000 map. IEEE Trans GeoSci
Rem Sens 44:1728–1739.46. WPDA Consortium (2006) World Database on Protected Areas. World Conservation
Union (IUCN) and UNEP-World Conservation Monitoring Center (UNEP-WCMC).
6678 � www.pnas.org�cgi�doi�10.1073�pnas.0802471105 Joppa et al.