protected areas and rural livelihoods - ucl discovery
TRANSCRIPT
Protected Areas and Rural Livelihoods:
Contrasting System s of Wildlife Management
in the Dem ocratic Republic o f Congo
Emmanuel de Merode
Thesis submitted in fulfilment of the requirements for the degree of Doctor of Philosophy
University College London University of London
July 1998

ProQuest Number: U642842
All rights reserved
INFORMATION TO ALL USERS The quality of this reproduction is dependent upon the quality of the copy submitted.
In the unlikely event that the author did not send a complete manuscript and there are missing pages, these will be noted. Also, if material had to be removed,
a note will indicate the deletion.
uest.
ProQuest U642842
Published by ProQuest LLC(2016). Copyright of the Dissertation is held by the Author.
All rights reserved.This work is protected against unauthorized copying under Title 17, United States Code.
Microform Edition © ProQuest LLC.
ProQuest LLC 789 East Eisenhower Parkway
P.O. Box 1346 Ann Arbor, Ml 48106-1346
A bstract
This multi-disciplinary study examines the ecological, social and economic consequences o f wildlife management within the Garamba ecosystem in the north east o f the Democratic Republic o f Congo. This protected area system comprises a national park, which is formally managed by state conservation authorities and where human resource use and settlement is prohibited. The national park is surrounded by hunting reserves, which contain resident human populations. The wildlife in the reserves is informally managed by socially defined user groups who derive financial and other benefits from wildlife resources. These systems are used to compare how different wildlife management practices meet conservation and local development objectives.
Long term ecological data are used to examine spatial and temporal variations in species distribution and abundance in relation to wildlife management and human related activities. Using ground transect and remote sensing techniques, spatial variations in species richness and abundance are compared to the presence o f agricultural communities, local markets and wildlife protection areas. Sampled aerial count data, collected over two decades by the Park authorities, are analysed to compare the temporal variations in animal abundance under different wildlife protection regimes. These ecological findings indicate that centralised wildlife protection meets conservation objectives because regulation is associated with high species richness and abundance. However, an analysis o f local resource use priorities indicates that the existing protectionist approaches implemented by the centralised authorities cannot contribute to local development objectives.
Against this ecological background, several hypotheses are tested to examine the extent to which existing forms o f wildlife management and utilisation can meet both conservation and development priorities. Analyses, using survey data from local households, hunters, and markets, provide the basis for examining the significance o f wild foods to local livelihoods and the potential for sustainable harvesting and local regulation o f wildlife offtake. Patterns o f resource use at the household level are analysed to understand the relationship between wealth status and resource use. Conservation behaviour amongst hunters is examined by testing the evidence for restraint during the hunt. These modes o f enquiry provide a basis for understanding people’s motivation to exploit natural resources sustainably. Analysis o f the bushmeat trade using anthropological methods (exploring bushmeat commodity chains, or filières) and economic models shows that the use o f bushmeat is socially regulated by local power relations between traditional, civil and military authorities. The period o f intense conflict in the region between 1996 and 1997 reveals the patterns o f wildlife offtake in the absence o f state and informal regulatory systems.
The combination o f long term ecological data with detailed socio economic variables provides an innovative approach to examining the impacts o f centralised and informal systems o f wildlife management. This study makes a direct contribution to current debates surrounding the impact o f regulatory and consumption based models o f wildlife management.
Table o f C ontents
A b s t r a c t .................................................................................................................................................... 2
T a b l e o f C o n t e n t s ..............................................................................................................................3
L is t o f F ig u r e s ..................................................................................................................................... 10
L is t o f T a b l e s ...................................................................................................................................... 13
L is t o f B o x e s .........................................................................................................................................16
A c k n o w l e d g e m e n t s ............................................................................................................ 17
A b b r e v ia t io n s ...................................................................................................................................... 19
A u t h o r ’s n o t e .................................. 19
C h a p t e r 1
In t r o d u c t io n .....................................................................................................................................20
1.1 Background; protected area policy and practice...................................................... 221.2 Dominant paradigms in African Conservation........................................................... 231.3 Centralised wildlife management................................................................................... 231.3.1 Assumptions o f centralised management and research questions....................... 24a. Human presence threatens biological diversity........................................................................24b. The contribution o f protected areas to development................................................................. 271.4 Devolved systems o f wildlife m anagem ent................................................................. 281.4.1 Participatory.................................................................................................................... 281.4.2 N eo-liberal.......................................................................................................................291.4.3 Assumptions o f devolved management and research questions..........................30a. The value o f wild resources........................................................................................................30b. Resource use as wildlife management........................................................................................ 321.5 Conclusion and thesis structure...................................................................................... 33
C h a p t e r 2:
B a c k g r o u n d ........................................................................................................................................ 36
2.1 Summary.............................................................................................................................. 362.2 Introduction....................................................................................................................... 37
2.2.1 Climate and topography............................................................................................ 382.2.2 Ecology..........................................................................................................................392.2.3 Ethnic composition o f the protected a re a ............................................................. 41
- 3 -
2.2.4 The demography and economy o f local people adjacent to the national park .............................................................................................................................................42
2.3 Focal study sites...................................................................................................................432.3.1 Kiliwa.............................................................................................................................. 432.3.2 D ungu ............................................................................................................................. 432.3.3 M am ba............................................................................................................................ 442.3.4 N ag ero ............................................................................................................................ 44
2.4 A history o f centralised management; Garamba National Park.................................462.4.1 The state control o f land and resources in C ongo ................................................ 462.4.2 International funding and centralised management............................................... 48
2.5 A history o f devolved management: the Zande Kingdom o f Wando, and the collapse o f state authority......................................................................................................... 49
2.5.1 The establishment o f Zande administration............................................................ 492.5.2 Colonial influences on local administration............................................................ 502.5.3. Political conflict and the rebirth o f a devolved administration ‘by default’ .... 522.5.4 The informal economy and an associated ‘shadow administration’ ................. 552.5.5 The law on local access to wildlife resources.........................................................57
2.4 Garamba ecology: a synthesis o f historical resource management and political processes...............................................................................................................................59
2.5 Conclusion............................................................................................................................ 62
C h a p t e r 3
M e t h o d s ................................................................................................................................................ 63
3.1 Ecological patterns and wildlife m anagem ent.............................................................. 633 .2 Wildlife utilisation and management............................................................................... 653 .4 Interpretation and analysis o f resu lts ...............................................................................683.5 Research assistants and Language...................................................................................683.6 Research Programme Sum m ary.......................................................................................68
C h a p t e r 4
C e n t r a l is e d a n d D e v o l v e d Sy s t e m s o f W il d l if e M a n a g e m e n t a n d U t il is a t io n a t G a r a m b a ............................................................................................................70
4.1 Summary..............................................................................................................................70
Pa r t I
C e n t r a l is e d w il d l if e p r o t e c t io n in t h e n a t io n a l p a r k ................................. 71
4.2 Introduction..........................................................................................................................714.3 Understanding wildlife protection: management zonation o f the protected area. 744.4 Data sources..........................................................................................................................74
4.4.1 Rhino population s ta tu s .............................................................................................. 754.4.2 Illegal activities..............................................................................................................754.4.3 Elephant distribution in the park and hunting reserves.....................................754.4.4 Human population distribution.................................................................................75
- 4 -
4.5 Results: data integration................................................................................................... 76
P a r t II
D e v o l v e d W il d l if e M a n a g e m e n t in t h e A z a n d e H u n t in g R e s e r v e s 80
4.6 Background........................................................................................................................... 804.7 Developing an understanding o f local resource use: the bushmeat commodity chain .............................................................................................................................................. 804.8 M ethods................................................................................................................................. 81
4.8.1 Access m apping.............................................................................................................824.9 Findings: wildlife benefits, access and con tro l............................................................ 83
4.9.1 P roducers....................................................................................................................... 834.9.2 T raders............................................................................................................................ 854.9.3 R egulators...................................................................................................................... 86
4.10 D iscussion...........................................................................................................................894.10.1 W ealth........................................................................................................................... 894.10.2 Gender........................................................................................................................... 904.10.3 R esidency.....................................................................................................................914.10.4 Informal regulation.................................................................................................... 92
4.11 Conclusion..........................................................................................................................94
C h a p t e r 5
Sp a t ia l V a r ia t io n s o f A n im a l A b u n d a n c e .....................................................................94
5.1 Summary................................................................................................................... 945.2 In troduction..........................................................................................................................955.3 H ypothesis............................................................................................................................ 965.4 M ethods.................................................................................................................................97
5.4.1 Animal distribution.......................................................................................................985.4.2 Explanatory variables...................................................................................................98
a. The presence o f agricultural communities.....................................................................................99b. The effects o f urban markets........................................................................................................ 102c. The effects o f conservation practices......................................................................................... 102d. Habitats.......................................................................................................................................... 102
5.5 Appraisal o f the methods u sed ....................................................................................... 1035.5.1 Dependent variables................................................................................................... 1045.5.2 Explanatory variables...............................................................................................104
a. The presence o f agricultural communities.................................................................... 104b. Distance as an indicator o f market and conservation influences........................................... 105c. Tree cover...................................................................................................................................... 105
5.6 Analysis................................................................................................................................ 1065.6.1 Species presence........................................................................................................ 1075.6.2 Species richness......................................................................................................... 1085.6.3 Species abundance and community structure................................................... 108
5.7 R esults............................................................................................................................... 1105.7.1 Species presence........................................................................................................ 1105.7.2 Species richness....................................................................................................... 1115.7.3 Species abundance.................................................................................................. 112
- 5-
5.7.4 Community structure ...............................................................................................1125.8 Discussion......................................................................................................................... 116
5.8.1 M arkets and mammal distributions.......................................................................1165.8.2 Agriculturalists and mammal distributions............................................................1175.8.3 The national park and mammal distribution......................................................... 118
5.9 Conclusion.......................................................................................................................... 120
C h a p t e r 6
T e m p o r a l V a r u t i o n s o f A n im a l A b u n d a n c e ............................................................121
6.1 Summary..............................................................................................................................1216.2 In troduction........................................................................................................................122
6.2.1 Management regim es................................................................................................. 1236.2.2 Changes in savanna herbivore populations............................................................123
6.3 Research hypotheses......................................................................................................... 1266.4 Methods: animal counts................................................................................................... 1266.5 Appraisal o f methods........................................................................................................ 1286.6 Analysis................................................................................................................................ 1296.7 R esu lts ................................................................................................................................. 131
6.7.1 Population trends........................................................................................................ 1316.7.2 Spatial variations in population change.................................................................1326.7.3 Changes in species relationships in relation to wildlife protection in the southern secto r...................................................................................................................... 135
6.8 D iscussion........................................................................................................................... 1376.8.1 Hypothesis 1: Large mammal abundance varies spatially and temporallywith the intensity o f wildlife protection.............................................................................1376.8.2 Hypothesis 2: Species abundance relationships are related to the intensityo f wildlife pro tection ............................................................................................................139
6.9 Conclusion.......................................................................................................................... 141
C h a p t e r 7
M u l t ip l e P e r s p e c t iv e s o n W il d l if e R e s o u r c e s .....................................................142
7.1 Summary..............................................................................................................................1427.2 In troduction...................................................................................................................... 1437.3 M ethods..................................................................................................................... 146
7.3.1 The distribution o f wildlife resources......................................................................1467.3.2 Adding intrinsic and direct-use value to wildlife resources...............................146
a. Intrinsic value............................................................................................................... 146h. Direct-use value................................................................................................................ 147
7.4 Analysis and Results: applying multiple perspectives to wildlife distributiond a ta ........................................................................................................................................... 1487.4.1 Mapping the distribution o f resources................................................................... 1497.4.2 Resource conflict analysis........................................................................................ 152
7.5 D iscussion......................................................................................................................... 1547.5.1 Methodological issues in land-use planning...................................................... 154
- 6 -
7.5.2 Conflicting landuse priorities in the hunting reserves...................................... 1567.6 Conclusions..................................................................................................................... 1^1
C h a p t e r 8
W e a l t h a n d w il d f o o d s ............................................................................................................. 162
8.1 Summary............................................................................................................................ 1628.2 In troduction...................................................................................................................... 1638.3 Research Hypotheses....................................................................................................... 167
8 .3 .1 Household consumption o f wild foods is determined by w ealth ................... 1678.3.2 A household’s modes o f procurement o f wild foods differs according to w ea lth .......................................................................................................................................167
8.4 M ethods............................................................................................................................... 1678.4.1 Sample preparation and household selection........................................................ 1678.4.2 Food consum ption...................................................................................................... 1698.4.3 Wealth status................................................................................................................ 169
a. Participatory wealth ranking............................................................................................ 170b. Measuring indicators o f wealth......................................................................................... 171
8.4.4 Standardising households.......................................................................................... 1728.5 Appraisal o f M ethods..................................................................................................... 1728.5.1 Food consumption..................................................................................................... 172
a. Intrinsic factors................................................................................................................. 172b. Extrinsic factors................................................................................................................ 172c. Error................................................................................................................................. 173d. Unaccounted sources o f variation...................................................................................... 174
8.5.2 Wealth sta tus............................................................................................................. 177a. Replication........................................................................................................................ 178b. Representation................................................................................................................... 178c. Methodological complementarity....................................................................................... 178
8.6 R esu lts ................................................................................................................................ 1858.6.1 The effects o f wealth on the quantities o f wild foods consumed......................1868.6.2 The effects o f wealth on the proportions o f wild foods consumed byhouseholds.............................................................................................................................. 1898.6.3 The analysis o f wealth and procurem ent............................................................... 191
8.7 Discussion.......................................................................................................................... 1958.7.1 Hypothesis 1 ; household consumption o f wild foods is determined by w ea lth .......................................................................................................................................1958.7.2 Hypothesis 2: A household’s modes o f procurement o f wild foods differs according to w ealth ...............................................................................................................198
a. Wild foods obtained through foraging............................................................................... 198b. Wild foods obtained as gifts............................................................................................... 200c. Wild foods that ore purchased............................................................................................ 201
8.7.3 Wealth, wild foods and sustainable natural resource utilisation......................2018.8 Conclusions.........................................................................................................................203
- 7 -
C h a p t e r 9
W il d l if e H a r v e s t in g a n d C o n s e r v a t i o n ......................................................................203
9.1 Summary..............................................................................................................................2039.2 Introduction....................................................................................................................... 204
9.2.1 Wildlife management and conservation by hunters.............................................2049.2.2 Reasons for hunting................................................................................................... 2079.2.3 Definitions o f hunting................................................................................................208
a. Technical definitions o f hunting.......................................................................................... 209b. Hunting techniques............................................................................................................. 209Direct hunting........................................................................................................................ 209Indirect hunting...................................................................................................................................210c. Legal definitions o f hunting................................................................................................ 210d. Cultural definitions o f hunting............................................................................................ 212
9.3 Research questions........................................................................................................... 2149.4 M ethods...............................................................................................................................214
9.4.1 Shotguns...................................................................................................................... 215a. The journey to the start o f the hunt..................................................................................... 216b. The hunt..............................................................................................................................216c. The return journey.............................................................................................................. 216
9.4.2 Automatic Rifles......................................................................................................... 2169.4.3 Net hunting...................................................................................................................2179.4.4 Snares............................................................................................................................ 217
9.5 R esu lts .................................................................................................................................2189.5.1 The characteristics o f hunting...................................................................................2189.5.2 Costs and benefits o f hunting decisions................................................................ 2199.5.3. Analysis o f hunters’ choices..................................................................................224
9.6 Discussion........................................................................................................................... 2279.6.1 Hunting patterns......................................................................................................... 2279.6.2 Hunting decisions.......................................................................................................2289.6.3 Self regulation by hunters..........................................................................................2319.6.4 Conservation implications........................................................................................ 234
9.7 Conclusions.........................................................................................................................236
C h a p t e r 10
W il d l if e R e g u l a t io n s in W a r a n d P e a c e .....................................................................237
10.1 Summary...........................................................................................................................23710.2 Background...................................................................................................................... 238
10. 2 . 1 Factors influencing the efficacy o f wildlife p ro tec tion .................................... 24010.3 M ethods............................................................................................................................ 242
10.3.1 Patterns o f bushmeat use in local m arkets.......................................................... 242a. Market sur\>eys................................................................................................................................242b. Traders’ supplies............................................................................................................................ 243
10.3 .2 Efficacy o f wildlife protection............................................................................ 244a. Manpower utilisation records.....................................................................................................244h. Patrol suniniarv sheets................................................................................................................... 244
c. Direct reporting...................................................................................................................244d. Summary o f patrols..........................................................................................................................244
10.4 R esults............................................................................................................................... 24510.4.1 Patterns o f bushmeat commercialisation.............................................................24610.4.2 Indicators o f success in wildlife pro tection ........................................................25010.4.3 The relationship between wildlife protection and the commercialisation o f w ildlife..................................................................................................................................... 252
10.5 Discussion......................................................................................................................... 25410.5.1 Markets as indicators o f wildlife utilisation........................................................25410.5.2 Patrol data as indicators o f efficacy in wildlife p ro tection ............................. 25410.5.3 The effects o f conflict on centralised wildlife p ro tection................................25510.5.4 Informal wildlife regulations during conflict..................................................... 25710.5.5 Village and urban m arkets......................................................................................258
10.6 Conclusions.......................................................................................................................259
C h a p t e r 11
C o n c l u d in g D is c u s s io n .............................................................................................................. 260
11.1 Main findings.................................................................................................................. 26011.1.1 Centralised and devolved m anagem ent...............................................................26011.1.2 The contribution o f centralised wildlife management to conservation and development........................................................................................................................... 262
a. Human presence..............................................................................................................................262b. Unregulated offtake........................................................................................................................ 262
11.1.3 Local alternatives to centralised wildlife m anagement.................................... 264a. Hunters as conservationists...........................................................................................................264b. Local regulators as conservationists............................................................................................ 265c. Who benefits?.................................................................................................................................. 267
11.3 Wider contributions to conservation policy and research................................... 267
R e f e r e n c e s ......................................... 268
Appe n d ix 1 ; In vento ry o f M a m m a ls in G a r a m b a N a tio n a l P a rk and
Su rr o u n d in g H u nting R e s e r v e s ..................................................................................291
Ap p e n d ix 2 ; H abitat Cl a ssific a tio n fo r the P a rk a n d H u ntin g Reser v es . 297
Appen d ix 3 : Wealth r a n k s .................................................................................................. 298
APPENDIX4; E xtracts FROM THE fr a m ew o r k DOCUMENT; Su ppo r tin g C o m m u n ity Institu tion s to P r o m o te Co n se r v a t io n a n d D ev elopm en t AROUND Ga r a m b a N a tio n a l Pa r k ................................................................................299
- 9 -
L ist o f F igures
Chapter 1
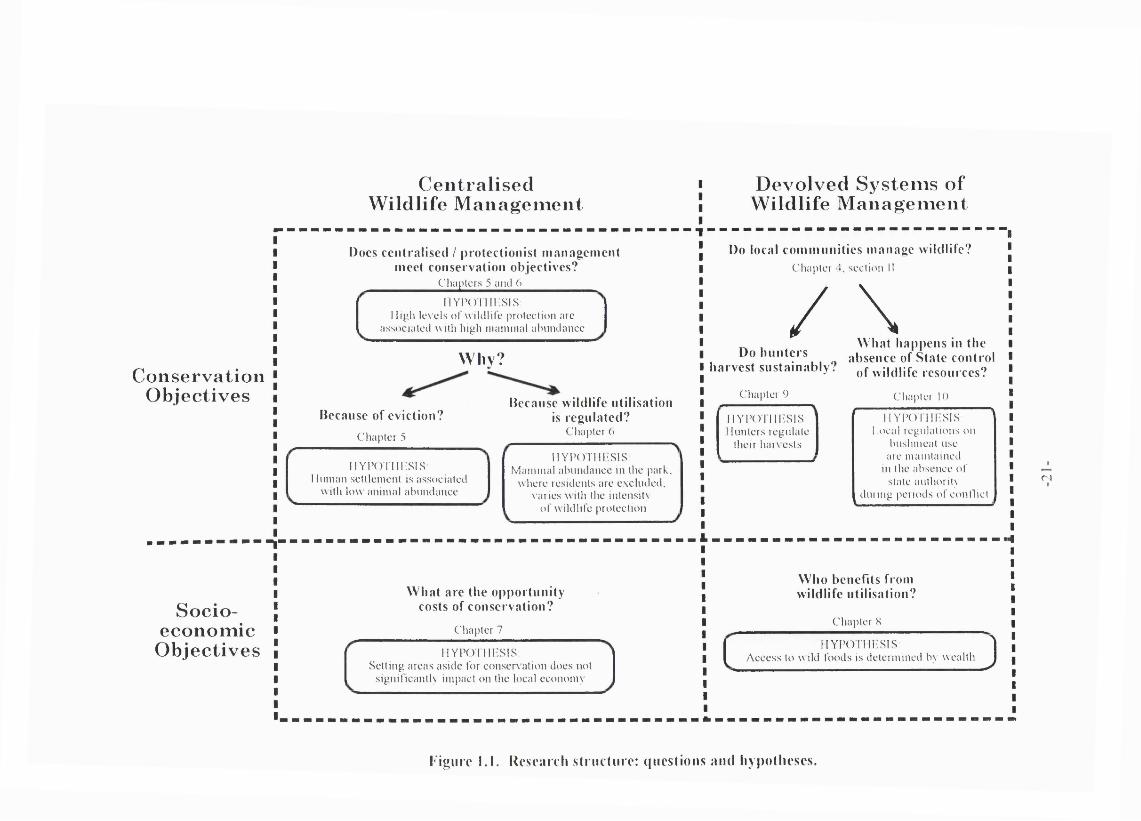
Figure 1.1. Research structure: questions and hypotheses...............................................21
Figure 1.2 Identifying active management as part o f local wildlife utilisation.............. 33
Chapter 2
Figure 2.1. Central Africa and the Garamba ecosystem in the north east o f theDemocratic Republic o f Congo..........................................................................................37
Figure 2.2. Rainfall and temperature readings at N agero ................................................. 38
Figure 2.3. Percentage tree cover estimates for the Garamba ecosystem derived from standard reconnaissance flight d a ta ........................................................................ 40
Figure 2.4. The Garamba ecosystem and the study sites................................................... 44
Figure 2.5. Trade routes o f the informal economy: principal wild resourcesexported, and manufactured commodities imported to the Garamba reg ion ..........55
Chapter 4
Figure 4.1. The time frame for activities planned by the Garamba National Park Project Management U n it................................................................................................... 71
Figure 4.2. Factors used for the zonation o f Garamba National Park and thesurrounding reserves.............................................................................................................76
Figure 4.3. Management zones in Garamba National Park and the surroundingreserves................................................................................................................................... 77
Figure 4.4. Conceptual framework showing the beneficiaries and the power relationships associated wildlife resources amongst residents in the Garamba ecosystem................................................................................................................................ 82
Figure 4.5. The role o f regulators in the bushmeat commodity chain............................ 84
Chapter 5
Figure 5.1. NO VI image covering a proportion o f the Garamba Ecosystem,showing the sample sites used to test the relationship between low index values and human presence............................................................................................................ 100
Figure 5.2. Explanatory variables.........................................................................................102
Figure 5.3. Polar ordination biplot using Jaccard’s index o f association on fivespecies and four explanatory variables.......................................................................... 110
Figure 5.4. Means and their 95% confidence intervals for species categories on the first and second principal com ponents..........................................................................114
- 10-
Chapter 6
Figure 6.1. Management zones in Garamba National P a rk ............................................ 121
Figure 6.2. Percentage change in mammal population numbers in GarambaNational Park between 1976 and 1995 (sampled aerial count data)........................ 130
Figure 6.3. Spatial and temporal variations in animal abundance(estimated from sampled aerial counts 1976-1995, error bars show 95% confidence intervals)... 132
Figure 6.4. Density - Mass ratios for the mammal assemblage in the southernsector o f Garamba National Park in 1976 and 1993................................................. 135
C h a p te r 7
Figure 7.1. The inverse distance interpolation showing the distribution o f mammal abundance weighted according to intrinsic value........................................................ 150
Figure 7.2. The inverse distance interpolation showing the distribution o f mammal abundance weighted according to direct-use value..................................... 151
Figure 7.3. Least squares regression to show the relationship between areas o f high conservation value and areas o f high importance for local wildlife utilisation.............................................................................................................................. 152
C h a p te r 8
Figure 8.1. Proportion o f each informant’s household wealth rank values thatcorrespond to those in the final wealth ra n k .................................................................179
Figure 8.2. Value o f wild food consumed by households according to wealth rank 185
Figure 8.3. The value o f wild foods as a proportion o f the value o f total household food consum ption................................................................................................................187
Figure 8.4. The value o f wild foods consumed by households, according to themethod obtained .................................................................................................................191
Figure 8.5. Proportion o f the value o f wild foods to the total value o f household food consumption................................................................................................................ 192
C h a p te r 9
Figure 9.1. The characteristics o f hunting........................................................................ 213
Figure 9.2. Characteristics o f the four surveyed hunting techniques in Kiliwa and M amba................................................................................................................................... 219
Figure 9.3. The approximate locations o f kills made around Kiliwa village during the hunter su rveys ..............................................................................................................220
Figure 9.4. Revenue from hunting according to the techniques used and theabundance o f wildlife......................................................................................................... 222
Figure 9.5. Stage o f the hunt at which a kill was made relative to animal w eigh t... 224
- 11-
Figure 9.6. Stage o f the hunt at which a kill was made relative to distance fromthe village (error bars each show one standard deviation from the mean) 224
Chapter 10
Figure 10.1 Sources and proportions o f meat sold at the Dungu market duringtimes o f relative stability (April to November 1996).................................................. 246
Figure 10.2 Sources and proportions o f meat sold at the Dungu market duringtimes o f conflict (December 1996 to February 1997)............................................... 247
Figure 10.3. The estimated daily value o f bushmeat from protected species passing through Kiliwa between April 1996 to February 1997............................................. 248
Figure 10.4. The estimated daily value o f bushmeat from unprotected speciespassing through Kiliwa between April 1996 to February 1997................................248
Figure 10.5. Scatter plot showing the relationship between wildlife protection and quantities o f bushmeat in the markets in Dungu (April 1996 to February 1997). 252
Figure 10.6. Scatter plot showing the relationship between wildlife protection and quantities o f bushmeat in the markets in Kiliwa (April 1996 to February 1997). 252
12-
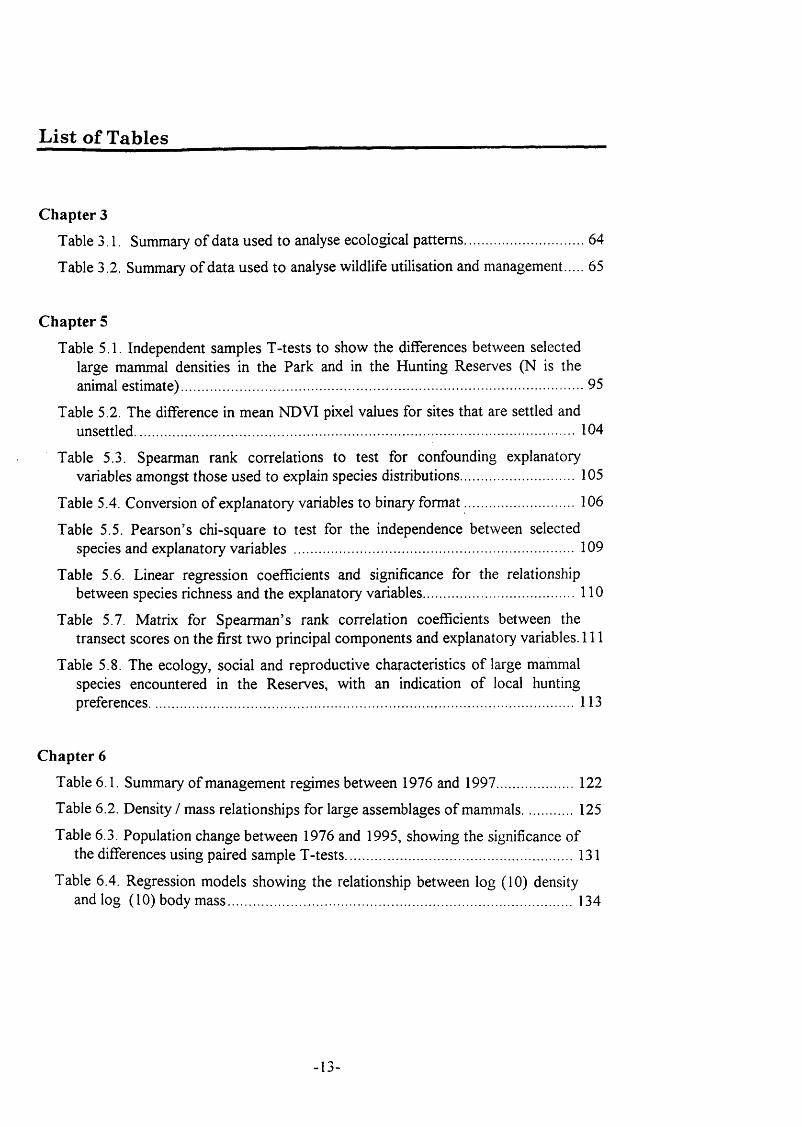
L ist o f Tables
Chapter 3
Table 3.1. Summary o f data used to analyse ecological patterns....................................64
Table 3.2. Summary o f data used to analyse wildlife utilisation and management 65
Chapter 5
Table 5.1. Independent samples T-tests to show the differences between selected large mammal densities in the Park and in the Hunting Reserves (N is the animal estimate)..................................................................................................................... 95
Table 5.2. The difference in mean NDVI pixel values for sites that are settled and unsettled.................................................................................................................................104
Table 5.3. Spearman rank correlations to test for confounding explanatory variables amongst those used to explain species distributions................................ 105
Table 5.4. Conversion o f explanatory variables to binary fo rm at................................. 106
Table 5.5. Pearson’s chi-square to test for the independence between selected species and explanatory variables ................................................................................ 109
Table 5.6. Linear regression coefficients and significance for the relationship between species richness and the explanatory variables............................................. 110
Table 5.7. Matrix for Spearman’s rank correlation coefficients between the transect scores on the first two principal components and explanatory variables. I l l
Table 5.8. The ecology, social and reproductive characteristics o f large mammal species encountered in the Reserves, with an indication o f local hunting preferences............................................................................................................................ 113
Chapter 6
Table 6.1. Summary o f management regimes between 1976 and 1997..................... 122
Table 6.2. Density / mass relationships for large assemblages o f mammals 125
Table 6.3. Population change between 1976 and 1995, showing the significance o f the differences using paired sample T-tests..................................................... 131
Table 6.4. Regression models showing the relationship between log (10) density and log (10) body m ass.....................................................................................................134
. j -
Chapter 7
Table 7.1. Species weighted according to their estimated intrinsic and direct-use values..................................................................................................................................... 146
Table 7.2. Example o f the procedure used for calculating intrinsic and direct-use value for a species (elephants) at a transect position...................................................148
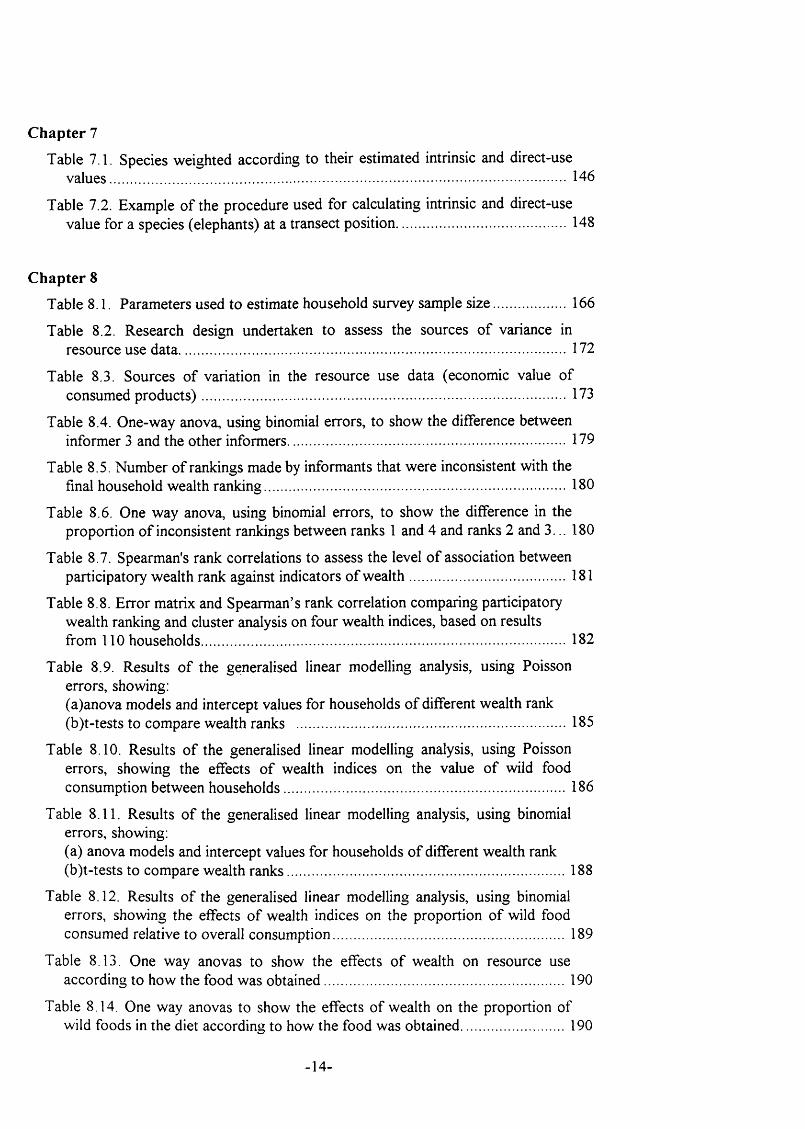
Chapter 8
Table 8.1. Parameters used to estimate household survey sample s ize ........................166
Table 8.2. Research design undertaken to assess the sources o f variance inresource use data..................................................................................................................172
Table 8.3. Sources o f variation in the resource use data (economic value o f consumed p ro d u c ts)...........................................................................................................173
Table 8.4. One-way anova, using binomial errors, to show the difference between informer 3 and the other informers................................................................................ 179
Table 8.5. Number o f rankings made by informants that were inconsistent with the final household wealth ranking.........................................................................................180
Table 8.6. One way anova, using binomial errors, to show the difference in the proportion o f inconsistent rankings between ranks 1 and 4 and ranks 2 and 3... 180
Table 8.7. Spearman's rank correlations to assess the level o f association between participatory wealth rank against indicators o f w ea lth ...............................................181
Table 8.8. Error matrix and Spearman’s rank correlation comparing participatory wealth ranking and cluster analysis on four wealth indices, based on results from 110 households...........................................................................................................182
Table 8.9. Results o f the generalised linear modelling analysis, using Poisson errors, showing;(a)anova models and intercept va.lues for households o f different wealth rank(b)t-tests to compare wealth ranks ............................................................................... 185
Table 8.10. Results o f the generalised linear modelling analysis, using Poisson errors, showing the effects o f wealth indices on the value o f wild food consumption between households...................................................................................186
Table 8 . 11. Results o f the generalised linear modelling analysis, using binomial errors, showing:(a) anova models and intercept values for households o f different wealth rank(b)t-tests to compare wealth ranks..................................................................................188
Table 8.12. Results o f the generalised linear modelling analysis, using binomial errors, showing the effects o f wealth indices on the proportion o f wild food consumed relative to overall consum ption.................................................................... 189
Table 8.13. One way anovas to show the effects o f wealth on resource use according to how the food was obtained.......................................................................190
Table 8.14. One way anovas to show the effects o f wealth on the proportion o f wild foods in the diet according to how the food was obtained............................. 190
- 14-
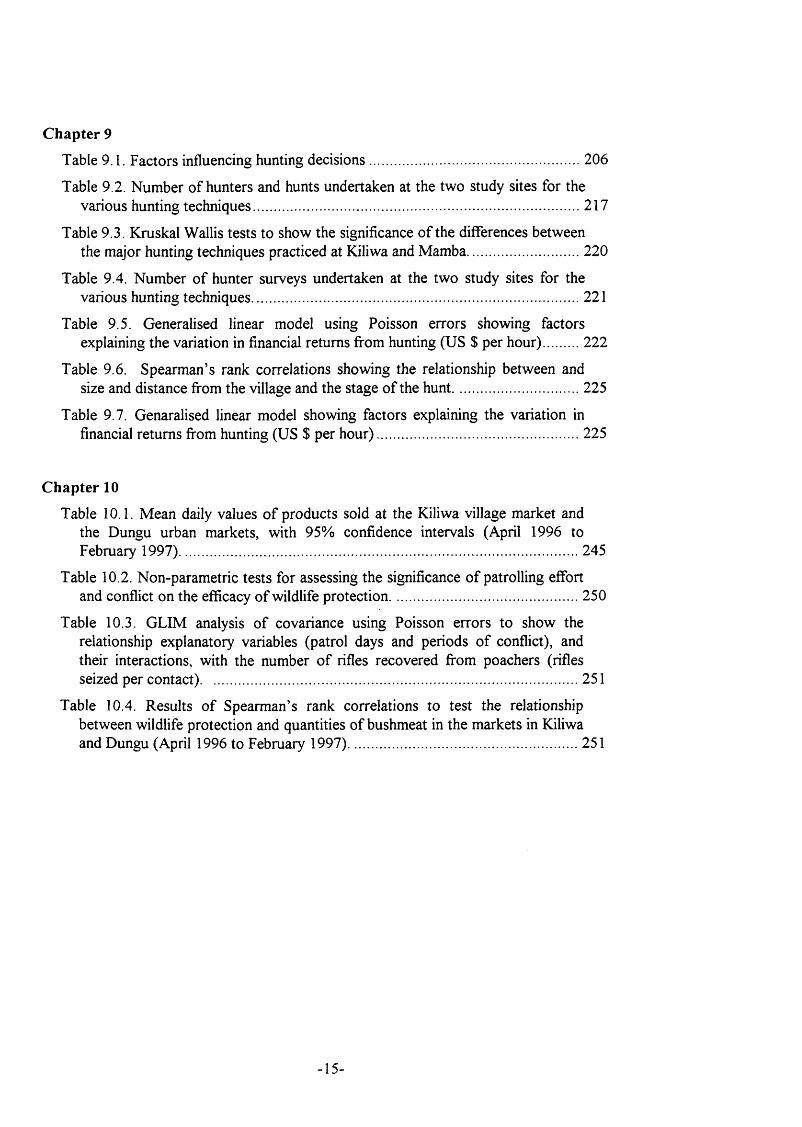
Chapter 9
Table 9.1. Factors influencing hunting decisions............................................................ 206
Table 9.2. Number o f hunters and hunts undertaken at the two study sites for the various hunting techniques..............................................................................................217
Table 9.3. Kruskal Wallis tests to show the significance o f the differences between the major hunting techniques practiced at Kiliwa and Mamba................................ 220
Table 9.4. Number o f hunter surveys undertaken at the two study sites for the various hunting techniques.............................................................................................. 221
Table 9.5. Generalised linear model using Poisson errors showing factors explaining the variation in financial returns from hunting (US $ per hour).......... 222
Table 9.6. Spearman’s rank correlations showing the relationship between and size and distance from the village and the stage o f the hunt....................................225
Table 9.7. Genaralised linear model showing factors explaining the variation in financial returns from hunting (US $ per hou r)......................................................... 225
Chapter 10
Table 10.1. Mean daily values o f products sold at the Kiliwa village market and the Dungu urban markets, with 95% confidence intervals (April 1996 to February 1997)................................................................................................................... 245
Table 10.2. Non-parametric tests for assessing the significance o f patrolling effort and conflict on the efficacy o f wildlife protection......................................................250
Table 10.3. GLIM analysis o f covariance using Poisson errors to show the relationship explanatory variables (patrol days and periods o f conflict), and their interactions, with the number o f rifles recovered from poachers (rifles seized per contact)............................................................................................................ 251
Table 10.4. Results o f Spearman’s rank correlations to test the relationship between wildlife protection and quantities o f bushmeat in the markets in Kiliwa and Dungu (April 1996 to February 1997).................................................................. 251
- 15-
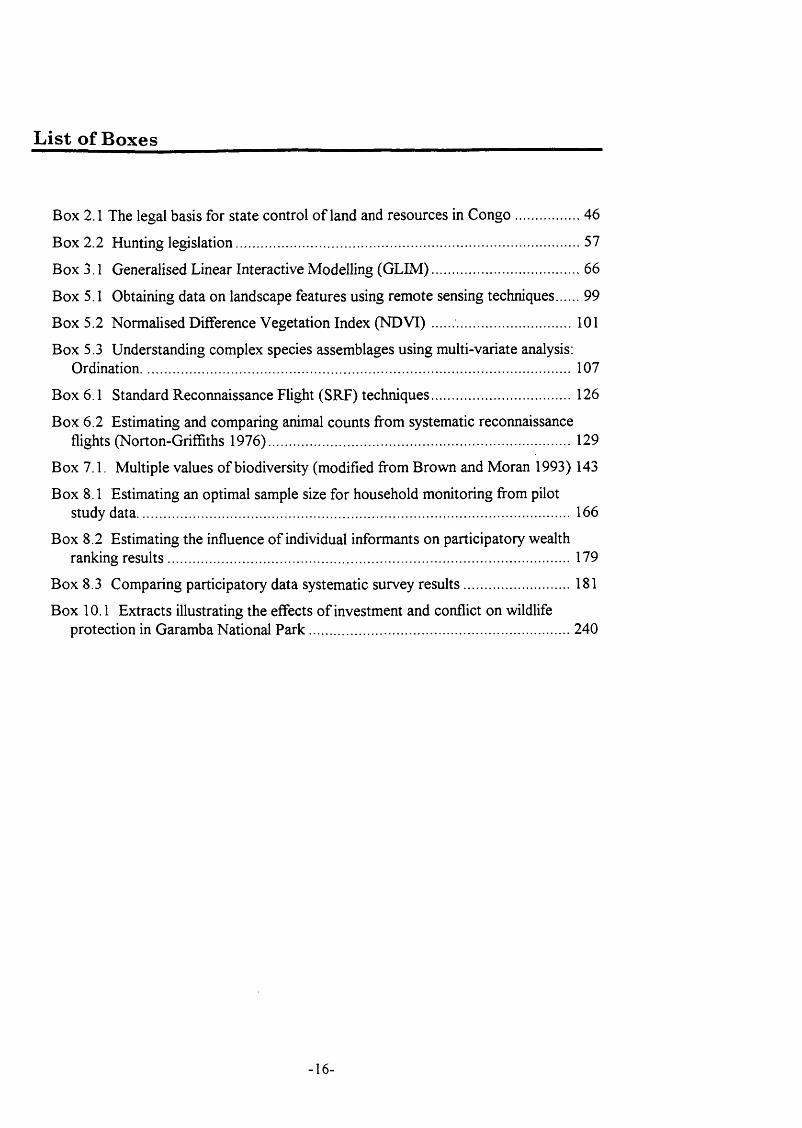
L ist o f B oxes
Box 2.1 The legal basis for state control o f land and resources in C o n g o ................... 46
Box 2.2 Hunting legislation.................................................................................................... 57
Box 3.1 Generalised Linear Interactive Modelling (G L IM )............................................66
Box 5.1 Obtaining data on landscape features using remote sensing techniques........99
Box 5.2 Normalised Difference Vegetation Index (N D V I) .................................. 101
Box 5.3 Understanding complex species assemblages using multi-variate analysis:Ordination..............................................................................................................................107
Box 6.1 Standard Reconnaissance Flight (SRF) techniques..........................................126
Box 6.2 Estimating and comparing animal counts from systematic reconnaissance flights (Norton-Griffiths 1976)..................................................................................... 129
Box 7.1. Multiple values o f biodiversity (modified from Brown and Moran 1993) 143
Box 8.1 Estimating an optimal sample size for household monitoring from pilot study data...............................................................................................................................166
Box 8.2 Estimating the influence o f individual informants on participatory wealth ranking resu lts ......................................................................................................................179
Box 8.3 Comparing participatory data systematic survey resu lts ................................181
Box 10.1 Extracts illustrating the effects o f investment and conflict on wildlifeprotection in Garamba National P a rk ............................................................................ 240
16-
A cknow ledgem ents
I would like to thank the Institut Congolais pour la Conservation de la Nature for their support and for authorising the research. Several organisations have contributed funds: the project ‘1’Avenir des Peuples des Forêts Tropicales’ o f DGVIII o f the European Union, University College London Graduate School, the Central Research Fund o f the University o f London and the Parkes Foundation. The research was carried out under the auspices o f the Garamba National Park Project, funded by the World Wide Fund for Nature, the Frankfurt Zoological Society and a several other donors. Technical support was given by the NASA Pathfinder Program (who provided the Landsat TM data). The Remote Sensing Unit o f the Department o f Geography, University College London, and UNEP’s Global Resource Information Database provided hardware and software support to develop the GIS and remote sensing components o f this thesis. Arc/Info software was donated by the Environmental Systems Research Institute, California.
I would like to express my gratitude to the field staff o f Garamba National Park and the members o f the local communities who hosted and welcomed me over the years. The friendships and support that I found at Garamba provided the foundation to my own ‘survival strategies’ w ithout which this work would not have been possible. In Kiliwa, Nagero, Mamba and Dungu, the people who made this research possible are too numerous to name, but I would like to acknowledge Kes and Fraser Smith who have been a constant support for me throughout my time in Garamba, and for generously sharing with me their unparalleled field experience. Their help and interest in my work made it possible. Claude Gambale and Beaudouine welcomed me to their home in Dungu and shared with me their ideas, concerns and hopes for their community. They also helped me to get back and forth from Congo during the difficult months o f 1997.
Chef Sangbelenze Ungua M oke hosted me in Kiliwa and was an unending source o f friendship and much needed support. M onungu Likango was my counterpart and I am grateful for his support in developing this study and sharing his understanding o f the hunting reserves. I was extremely fortunate to work with Raymond Banyo, Guillaume Tekipande, Emmanuel Beta, Modeste, François Likoyo and Gilbert who also brought such enjoyment to the fieldwork. On my two trips to Garamba by road, Jo and my father were each invaluable in helping to push an overloaded car through the mud over the ten day trip. In addition to their good company, Aaron Nicolas collected the ground transect data, and John Watkin developed the aerial count analysis procedures for Garamba which helped with the analysis presented in Chapter6. Muhindo Mesi, Mbayma Atalia, Amube Ndey, Jean-Claude Devestel and Antoinette, Shela Nightingale, Alan Root, Barbara Buis, Colin and Jane Howard, Billie Karesh, Martin Nicol, and o f course, Chyulu and Doungu all contributed to making Garamba the most exciting place in central Africa. In Nairobi, Mick Wilson, Laura Meszaros, Fran Michelmore and Louisa Lockwood have all hosted, advised and encouraged me during my movements to and from Garamba.
- 17-
Many individuals generously offered m e their advice on the design and development o f this study. In particular, Katherine Homewood, as my supervisor, has provided constructive criticism and support for th e study. Jo Abbot helped me throughout with the design and compilation o f the thesis. Pippa Trench and Amar Inamdar have been a constant source o f encouragement, and helped me to formulate my ideas from the start. Guy Cowlishaw and Dan Brockington read and advised on much o f my work. In the Anthropology Department at UCL, many gave freely o f their time in discussing my work: Ruth Mace, who was my second supervisor, Phil Burnham, Leslie Aiello, Sara Randall, Sian Sullivan, Adam Biran, Tania King, Alan Dangour, Dan Nettle, Hilda Kiwasila, Alena K ocourek and Eusebia Michel, Dawn Hartley, Y vette Evers and Simon Strickland. From APFT, Pierre de Maret, Anne Weis and Theodore Trefon have offered helpful advice. I am also grateful to Michel Massart, David Wilkie, Brian Curran, Richard Tchombe, Christine Dunn and Tim Allot for advice.
Finally, and most importantly, I would like to thank Jo and my family for their unfailing support over the years.
- 18-

A bbreviations
ADMADE Administrative Management Design for Game Management AreasAFDL Alliance des Forces Démocratique pour la Liberation du Congo-ZaïreANOVA Analysis o f VarianceCAMPFIRE Communal Areas Management Programme for Indigenous ResourcesCW M Community-based Wildlife ManagementDRC The Democratic Republic o f CongoF AO Food and Agriculture OrganisationFAZ Forces Armées ZaïroiseGIS Geographic Information SystemsGPS Global Positioning SystemGLIM Generalised Linear Interactive ModellingICCN Institut Congolais pour la Conservation de la NaturelU CN The World Conservation UnionNGO Non-Governmental OrganisationNTFP Non-Timber Forest ProductsPC A Principal Component’s AnalysisPRA Participatory Rural AppraisalRRA Rapid Rural AppraisalSPLA Sudanese People’s Liberation ArmySPSS Statistical Package for the Social SciencesUNHCR United Nations High Commissioner for RefugeesWFP World Food ProgrammeWWF World Wide Fund for Nature
A uthor’s note
The views and opinions expressed and conclusions reached in this thesis are those o f
the author alone and do not necessarily represent the individual or collective views o f
any o f the supporting or funding organisations. M aps have been prepared for the
convenience o f readers by the author and do not imply any judgement o f the legal
status o f the boundaries shown.
- 19-
C hapter 1
In trod u ction
W hen should the use o f wildlife resources be regulated, and by whom? This question
frames much o f the current debate surrounding conservation management in sub-
Saharan Africa. This thesis examines the ecological and social aspects o f resource
use by drawing on multidisciplinary research undertaken in a central African protected
area. The resource in question is an assemblage o f large mammals which has multiple
uses and multiple associated management strategies. The protected area consists o f a
national park surrounded by hunting reserves. The national park is centrally managed
by the Congolese national wildlife agency, but centralised management does not
extend into the hunting reserves. The use o f wildlife resources in the hunting reserves
is controlled by rights o f access which are determined by a number o f socially defined
control mechanisms based on status, social relations and coercion. The outcome is
that wildlife utilisation is regulated by specific local groups. This amounts to a system
o f wildlife management which operates with minimal external intervention.
The situation at, and around, Garamba provides an opportunity to explore centralised
and local systems o f wildlife management, and to test specific hypotheses about the
extent to which they meet current wildlife policy objectives (Figure 1.1). This chapter
reviews the literature which provides the background to this research. M ore detailed
reviews are provided within each chapter.
- 20 -
C en tra lised W ild life M an agem en t
C on servationO b jectives
Does centralised I protectionist management meet conservation objectives?
C h ap ters 5 an d 6
I IYP ( )TIII :SIS: l l i p l i l e \ e l s o l w i k l l i l e p r o te e l in n arc
a s s o c i a t e d w i th h ig h m a m m a l a ln in d a n c e
Why?
Because of eviction?
C h a p t e r 5
Because wildlife utilisation is regulated?
C h a p t e r 6
I I Y P ( ) T l l i ; S I S .H u m a n s e t t l e m e n t is a s s o c i a t e d
w ith l o w a n im a l a b u n d a n c e
I I Y P O r i l l i S I S : M a m m a l a b u n d a n c e in the park,
w h e r e r e s id e n t s are e x c l u d e d , v a r ie s w ith the in ten s i ty
o l w i ld l i l e p r o t e c t io n
D ev o lv ed S y stem s o f W ild life M an agem en t
Do local communities manage wildlife?C h a p t e r 4 , s e c t i o n II
/ \Do hunters
harvest sustainably?
C h a p t er 9
What happens in the absence of State control
of wildlife resources?
C h a p ter 10
I I Y P( n i l I -SIS:I lu n te r s r e g u la te
th e ir har \ e s t s
I I Y P ( ni l l -SIS:I ,o ea l r e g u la t io n s o n
b u s h m e a t u s e are m a in t a in e d
in the a b s e n c e ol' s ta te author ily
d u r in g p e r io d s o l e o n l l i c t
r i
S o c io eco n o m ic
O b jectives
What are the opportunity costs of conservation?
C h a p ter 7
Who benefits from wildlife utilisation?
C h a p t e r X
I I Y P O n i l ' S I S :S e t t in g a r e a s a s i d e for e o n s e r \ a t io n d o e s n o t
s i g n i l i c a n t l y im p a c t o n the lo c a l e c o n o m y
I I Y P O n i l ' S I S :A c c e s s to w i l d f o o d s is d e t e r m in e d b v w e a l t h J
r igiiiT 1.1. Research striicti ire: questions and hypotheses.
1.1 Background: protected area policy and practice
Policies relating to the protection o f biological diversity take place at different levels.
At the broadest level, international conventions, such as the Convention on
International Trade in Endangered Species (CITES), aim to achieve sustainable
offtakes o f wild resources by regulating trade. At the national level, legislation is
passed whereby extensive areas o f land are set aside for conservation. At the local
level, the outcome o f these policies is the establishment and maintenance o f protected
areas.
Protected areas are a widely established tool for conservation management. The
Yellowstone National Park framework for protected area management, established in
the last century, is still broadly applied today (lU CN 1994). This approach is best
described as legislation that restricts the human use o f land, primarily by local
residents and to a lesser degree by visitors (Munthali 1996). Whilst the justification
for protected areas is vigorously debated, and will be discussed below, there is little
doubt about their significance. Currently, 5.2 percent o f the Earth’s land area is
designated protected areas (WCMC 1992), and this is likely to increase. One o f the
conclusions o f the Fourth World Congress on National Parks and Protected Areas
(lU CN 1994) was that more, and better managed, protected areas were urgently
required. The Convention recommended that all countries should aim to designate
ten percent o f each biome within its boundaries as a protected area. The Global
Environment Facility, an outcome o f the United Nations Conference on Environment
and Development, has objectives which reflect a strong emphasis on the improved
management and growth o f protected areas (Ghimire and Pimbert 1997), and the
World Conservation Union also encourages its member states to develop their
protected area systems (lUCN 1994). Thus, the use o f protected areas as a tool for
biological diversity conservation is extensive, and likely to increase in future.
The last two decades have seen significant changes in the policy objectives o f
protected area systems. The World Conservation Strategy (WWF, lUCN & UNEP
1980) was one o f the first o f many documents to link conservation with development
agendas. The new integrated conservation and development agenda has raised an
- 22 -
overwhelming number o f conceptual problems about the compatibility o f these two
agendas, and has instigated numerous debates about the appropriate processes for
achieving these dual objectives. This thesis explores the capacity o f two systems o f
management, centralised and devolved, in meeting these two objectives within the
specific context o f the Garamba protected area system in the Democratic Republic o f
Congo.
1.2 Dom inant paradigm s in African Conservation
The priority placed on the growth o f protected areas by the lU CN ’s World
Convention on Protected areas (WCPA) hides the difficulties o f developing a unified
national and international policy on protected area legislation. Indeed, globally, there
are over 140 names that have been used to describe protected areas (lUCN 1994).
This results partly from the contrasting paradigms that have evolved with
conservation science and practice. Currently tw o approaches to wildlife management
appear to dominate the conservation debate (Blaikie and Jeanrenaud 1997). The first
operates through state institutions and involves the nationalisation o f wildlife
resources and their centralised management. The second approach can broadly be
defined as the devolution o f wildlife management authority to local institutions. The
following sections define these systems o f wildlife management, and outline some o f
the assumptions that will be tested in this thesis.
1.3 Centralised wildlife management
Centralised management has traditionally been founded on a concern for nature
preservation and has thus tended towards protectionist approaches to wildlife
conservation. This classical form o f conservation has been described as seeking
’"environmental solutions to perceived environmental problems''' and is sometimes
referred to as ''''fortress consen’a tio tf (Blaikie and Jeanrenaud 1997). Historically,
most protected areas in developing countries are founded on protectionist principles
(Pimbert and Pretty 1995). The theoretical rationale for centralised wildlife
management using protectionist policies is largely founded on a ‘reduction o f threats’
- 23 -
approach to conservation (Margolius and Salafsky 1998). The principle threats are
believed to be human presence, which is addressed by the eviction o f populations
from protected areas (West and Brechin 1994, Brockington 1998), and unsustainable
offtake, which is addressed by instituting and enforcing restrictions on wildlife
utilisation. Protectionist policies are also believed to be founded on a history o f
colonial hegemony in developing countries (Brockington and Homewood 1995),
expediency (Ghimire and Pimbert 1997), and to a lesser extent on the philosophical
arguments relating to the intrinsic right for species to exist (Nash 1970).
Conventional protected area planning and implementation in Africa involves a
centralised intervention by an agency, such as a government department or an
international organisation. Other institutions and individuals have a stake in the
natural resources within the protected area, but centralised bodies usually have the
greater legislative and financial backing. Thus, non local institutions often have the
greatest influence on wildlife management policies. Consequently, wildlife protection
tends to be highly centralised and capital intensive.
1.3.1 Assumptions o f centralised management and research questions
a. H uman presence threatens biological diversity
An underlying assumption o f state intervention in wildlife management is that
unchecked human activity poses a threat to the integrity o f an ecosystem. Early
notions o f community ecology reinforced the Malthusian notion that human
population pressure invariably de-stabilised the ‘balance o f nature’. In the context o f
savanna ecosystems, ecological studies emphasised stability and equilibrium as the
dominant forces shaping species abundance relationships (eg. Lamprey 1963, Bell
1971'). In the minds o f these ecologists, resource partitioning and niche
differentiation produced stable states where species interacted, but were maintained
within relatively static levels o f population abundance. Thus, population abundance
was seen to be controlled by density dependent factors, and the carrying capacity o f
' Bell has since revised many of his earlier concepts of ecosvstem dynamics, and addresses nonequilibrium processes (eg. Bell 1987).
- 24 -
the environment determined the limits to population growth (Nicholson 1954,
Diamond 1975). Human populations exploiting natural resources were also believed
to be subject to density dependent factors, but unlike other species, are capable o f
exceeding the carrying capacity o f the environment. Without the consequent negative
feedback mechanisms constraining human pressure, permanent environmental damage
was envisaged. This understanding underpins, both implicitly and explicitly, the
policies aiming to exclude human residents from protected areas.
Some authors have presented evidence to suggest that human presence, associated
with higher levels o f hunting, can result in depleted wildlife resources. In a broad
assessment o f the impact o f hunting in the Neotropics, Redford (1992) established
that mammal densities, in areas that are moderately or heavily hunted, are between
80.7 and 93.7 percent lower than in unhunted areas. Long term studies o f hunting
communities have shown that bushmeat yields decline over time, suggesting that the
resource base decreases when associated with utilisation (Vickers 1980, 1988).
Stearman (1990) compared the intensity o f hunting in the neo-tropics to population
growth models and found that offtake, at the time o f study, was unsustainable.
M ore recently, new approaches to savanna ecosystem dynamics have been used to
question the logic that human presence systematically provokes resource depletion
(for example, Leach and M eams 1996). The formulation o f non-equilibrium theories
in rangeland ecology questions the very concept that any single factor, such as human
pressure, is sufficient to provoke a systematic change in habitat quality or a reduction
in animal abundance (Walker 1981, Dublin 1991). The principle o f dynamic
disequilibrium suggests that the driving force in the ecology o f some systems is the
effect o f stochastic environmental events. For example, in arid environments, the
effects o f irregular rainfall override the density dependent population regulation o f
species contained within an ecosystem (Behnke et a l 1991). Other stochastic events
include disease and fire (Dublin et a l 1990, Sinclair and Arcese 1995), and in central
Africa, war has been described as a stochastic event which drives rapid ecological
change (Hart et a l 1997, de M erode et a l in print). Whilst war is a human induced
phenomenon, the ecological consequences o f war would suggest that a Malthusian
- 25 -
explanation for resource decline is inadequate. In other words, population pressure,
p er se, may be insufficient to cause o f biodiversity loss.
The results o f several studies argue against a causal relationship between human
presence and the depletion o f mammal populations. Indeed, in the Ituri Forest, less
than three hundred kilometres to the south o f Garamba, Wilkie and Finn (1990) have
shown that certain mammal densities increase at closer distances to settled areas.
Similar results are described by Johns and Skorupa (1987) in a global review o f the
evidence for primate population depletions in relation to habitat disturbance. They
conclude that although severe habitat disturbance, such as logging, has a direct
impact on populations, moderate human disturbance, such as shifting cultivation
which is common to most o f central Africa, is not associated with mammal population
depletion.
In spite o f the paucity o f evidence showing the link between human presence and low
biological diversity, there is an increasing body o f evidence to suggest that protected
area policy implementation is founded on an assumption o f resource degradation by
resident human populations (Leach and Meams 1996). It has been argued that
protected areas in Africa are the product o f historical legacies based on the specific
values o f political elites, and have little to do with current efforts to limit the loss o f
biological diversity (Anderson and Grove 1987, Munthali 1996). For example.
W estern (1994) point out that many African protected area systems were established
during the late colonial period. The prospect o f imminent independence created an
urge within the existing administration to legislate and gazette extensive areas as a
means o f ensuring the maintenance in perpetuity o f ‘pristine’ environments. Or, as
expressed by Bell (1987) ''the West fo u n d in A frica the Garden o f Eden o f its
romantic im aginatio tf. The distinction between biodiversity conservation and the
protection o f ‘pristine’ environments is made by Soule and Kohm (1989);
it is important to understand that protecting biological diversity, as a
practical matter, is independent o f the pursuit o f the H oly Grail o f
"pristine Just because a system is tiot pristine does not mean it is o f
- 26 -
no value fo r consen’ation. The task o f conservation is not to preserve
some ideal, pristine nature. Rather, its task is to preserve diversity.
The research framework adopted in this study examines biological indicators
(mammal species richness and abundance) and assesses the extent to which perceived
threats are indeed associated with a reduction in those indicators. Thus, the impact o f
factors such as human presence can be explored in terms o f biological factors that are
a measure o f conservation success.
b. The contribution o f protected areas to development
Protected areas are said to provide important benefits to society (lUCN 1994). For
example, they may provide habitat for harvested species (Gumming 1990), regulate
and purify waterflow, and provide income locally through eco-tourism (Child 1996).
However, a protected area is primarily a legal construct, and can either limit local
access to resources, or enhance access by ensuring that resources are used
sustainably. In practice, the eviction o f local residents from their land and stringent
regulations limiting local access to resources are often used as tools for protected
area management. In this context, the link between conservation practices and local
development is tenuous.
The local social and economic costs o f exclusion have been documented by a number
o f authors. Turnbull’s account o f social collapse amongst the Ik people o f Northern
Uganda, following their eviction from Kidepo Valley, is perhaps one o f the most cited
examples (Turnbull 1972). In the Democratic Republic o f Congo, Nzabandora
(1984) documents the consequences o f eviction for agriculturalists in the North Kivu
region, following their eviction from Albert National Park (now Virunga National
Park) without compensation for the loss o f land. Thus, it is increasingly recognised
that protected areas, in themselves, do not necessarily constitute an asset for local
development. This study explores the compatibility o f established wildlife
management practices with local development interests by contrasting the land-use
planning o f the centralised conservation authority with local resource use priorities
around Garamba.
- 27 -
1.4 Devolved systems o f w ildlife managem ent
Increasingly, there is a change o f emphasis in wildlife management from centralised to
local management. This section describes the rationale for this change o f emphasis,
and the two approaches that are most commonly cited for achieving devolved wildlife
management. The move tow ards local management appears to be the result o f two
independent processes;
• generally, decentralisation is part o f a wider process o f structural adjustment to
limit government spending, particularly in developing countries (UNDP 1997, Lutz
and Caldecott 1996);
• more specifically, international concern for the welfare o f protected area adjacent
populations in developing countries has instituted attempts to link wildlife
management to local livelihoods and community development
(lUCNAVWFAJNEP 1980).
Thus, two themes are emerging in the conservation debate. First is the principle o f
subsidiarity, whereby the central authority performs only those tasks that cannot be
achieved effectively at a lower level. Second, is the promotion o f human welfare.
Two dominant approaches to devolved wildlife management have had varied success
in meeting conservation and development objectives: participatory and neo-liberal.
1.4.1 Participatory
These approaches, also referred to as community based conservation (Western and
Wright 1994, IIED 1994), or populist conservation (Blaikie and Jeanrenaud 1997),
have evolved, particularly in developing countries, from a concern that protected area
adjacent populations are politically and economically marginalised. This
marginalisation is believed to be compounded by the local social and economic costs
that are imposed by the establishment and maintenance o f protected areas.
Consequently, it has become part o f the conservation agenda to address community
interests as an integral part o f sustainable resource management.
- 28 -
Central to community based conservation is the concept o f participation in wildlife
management. Participation is a term which has evolved and continues to be used and
misused in the jargon o f conservation professionals (Ghimire 1997). Pretty (in Dalai
Clayton and Dent 1993) produced a typology o f participation in development
initiatives consisting o f seven classes o f participation ranging from manipulative
participation through to self mobilisation. This raises a number o f issues concerning
the nature o f participation in complex socio-political environments which are
discussed in section 1.4.3.
1.4.2 Neo-liberal
This approach seeks market solutions to environmental problems. The underlying
concept is a simple one: wildlife is a financial asset, and for wildlife conservation to
succeed, sustainable wildlife management must be economically preferable to other
forms o f land use (Swanson and Barbier 1991, Rasker et a l 1993, Child 1996).
Western and Wright ( 1994) suggest that this approach to conservation is not new, but
was adopted by traditional societies as viable economic strategy for satisfying human
needs. According their analysis, the maintenance o f sustainable wildlife yields
provided the optimal resource use strategy for traditional societies. However, it does
represent significant departure from an approach to conservation founded on
ecological thinking, to one where pricing and tenurial rights become the basis for
decision making (Child 1996).
Management strategies based on the consumptive use o f wildlife have been
championed as the ‘third w ay’ for integrating conservation with development. Two
early programmes have been used as evidence for the feasibility o f consumption
driven conservation (Swanson and Barbier 1992, IIED 1994): in Zimbabwe, the
Communal Areas Management Programme for Indigenous Resources (CAMPFIRE)
(Metcalfe 1995), and in Zambia, the Administrative Management Design for Game
Management Areas (ADMADE) (Lewis and Alpert 1997).
- 29 -
1.4.3 Assumptions o f devolved management and research questions
a. The value o f w ild resources
Wild resources are believed to make an important contribution to rural subsistence.
There is an extensive literature reviewing the use o f wild resources. The primary
contributions o f wild resources to local subsistence have been summarised by
Falconer and Arnold (1991), focusing specifically on forest products:
• improving subsistence production: increasing diet quality and diversity, supply o f
fuelwood, income generation through commercial use o f wild products, (see also
Falconer and Koppell 1990, Scoones et a l 1992).
• supplementing seasonal short falls (see also Fleuret 1979, Chambers et a l 1981).
• providing additional security during periods o f stress, such as famine or war (see
also Vaughan 1987, de Waal 1988, Sullivan 1998).
However, the significance o f wild resources to rural subsistence has rarely been
quantified. Indeed, the drive to merge community interests with a conservation
agenda may have over-emphasised the importance o f wild resources to local
communities (Luxmore 1994). Whilst community based conservation satisfies the
need to develop a conservation agenda ‘with a human face’ (Bell 1987), the precise
benefits to rural people are not always clear. Misconceptions regarding the economic
contribution that wildlife makes to the rural economy is compounded by the value
that is attributed to large mammals by external influences, such as conservation lobby
groups: “where there is a spark o f interest in wildlife conservation, the flimsiest o f
economic arguments may be sufficient to fan it into life” (Luxmore 1994). This has
resulted in a number o f failed attempts to conserve wildlife on the, often spurious,
assertion that ‘wildlife can pay its way’.
Thus, the question remains as to whether the theory and practice of
grassroots/community participation in conservation actually provides an alternative
approach to conservation, or merely represents a new discourse within an entrenched
protectionist mindset. This question is raised by Homewood et a l (1997): “it is not
always clear whether the aim o f bringing the benefits o f conservation to local people
is an end in itself or a means to make conservation agendas and wilderness
preservation more successful” .
Furthermore, the integrated conservation and development agenda faces severe social
challenges: community participation, self mobilisation and natural resource
management are not always compatible in highly heterogeneous communities. The
strongly hierarchical organisation o f rural societies may exclude marginalised groups,
such as women and the poor from access to resources (Burnham 1993, Homewood et
a l 1997, Guijt and Shah 1998). In certain cultural and economic contexts, the
concept o f community conservation may contain inherent contradictions, particularly
if it includes community ownership o f wildlife resources through existing institutions
and power relations (Pimbert and Pretty 1995). Thus, despite the strong emphasis on
‘market driven conservation’ and ‘participatory conservation’ there remain a number
o f unanswered questions as to whether these approaches can bridge the gap between
conservation and development.
This study uses wealth status to examine the contribution o f wild resources to local
residents. Clearly, wealth is only one o f many characteristics which differentiate a
community. There are many others including gender, residence, ethnicity etc., but
wealth is used in this study because it is linked to these other characteristics
(Chambers 1997). General observations during the pilot phase suggested that female
headed households and temporary residents (such as refugees) tended to be the
poorest groups, while long established households were wealthier. Furthermore,
there was a substantial and obvious wealth differential which appeared to explain
access to, and use, o f wild resources. Finally, poverty elimination has become a
central goal in development (see for example UK Department for International
Development White Paper, November 1997). Therefore an understanding o f how
wealth affects access to and use o f resources can refine current thinking on how
development based on wild resource utilisation can contribute to the elimination o f
poverty.
- 31 -
h. Resource use as wildlife ma?iagement
The difficulties in achieving financial and institutional sustainability in community
based approaches to wildlife management have resulted in a situation whereby
recognised community conservation programmes are strongly donor driven and
dependent on external sources o f funding for their continuity (eg. IIED 1994). This
raises important questions as to whether these approaches can accurately be described
as devolved systems o f wildlife management. Garamba offers an opportunity to test
the existence o f community level systems o f wildlife management in the absence o f
centralised sources o f funding.
This thesis examines the existence o f local systems o f wildlife management. The
application o f market solutions to wildlife management makes two key assumptions.
First is that the solutions provided by participatory and free market management can
be applied equally successfully to all resource tenure regimes (Caughley 1993).
Second is the assumption that sustainable yields represent the optimal resource use
strategy.
The thesis uses the distinction made by Alvard (1994, 1995) between passive
‘epiphenomenal’ conservation, and deliberate wildlife management. Epiphenomenal
conservation occurs in the absence o f any active form o f conservation, and is simply
the use o f wildlife which does not significantly threaten bio-diversity. Epiphenomenal
conservation may be the outcome o f low demand resulting from particularly low
human population densities. This form o f ‘conservation’ is o f limited value in highly
differentiated and dynamic societies, which are susceptible to rapid demographic
change, mainly through immigration. Therefore the questions being asked in this
thesis are not just “do humans cause a reduction in wildlife species richness and
abundance?”, but also “do wildlife users respond to resource decline by deliberately
regulating offtake?” . This question is addressed directly by examining hunters’
choices regarding the sizes o f their harvests, and indirectly by exploring the power
relations associated with access to wildlife resources. Therefore, the thesis examines
the extent to which social constraints are imposed on the volume o f harvests by
particular groups in the community (Figure 1.2).
- 32 -
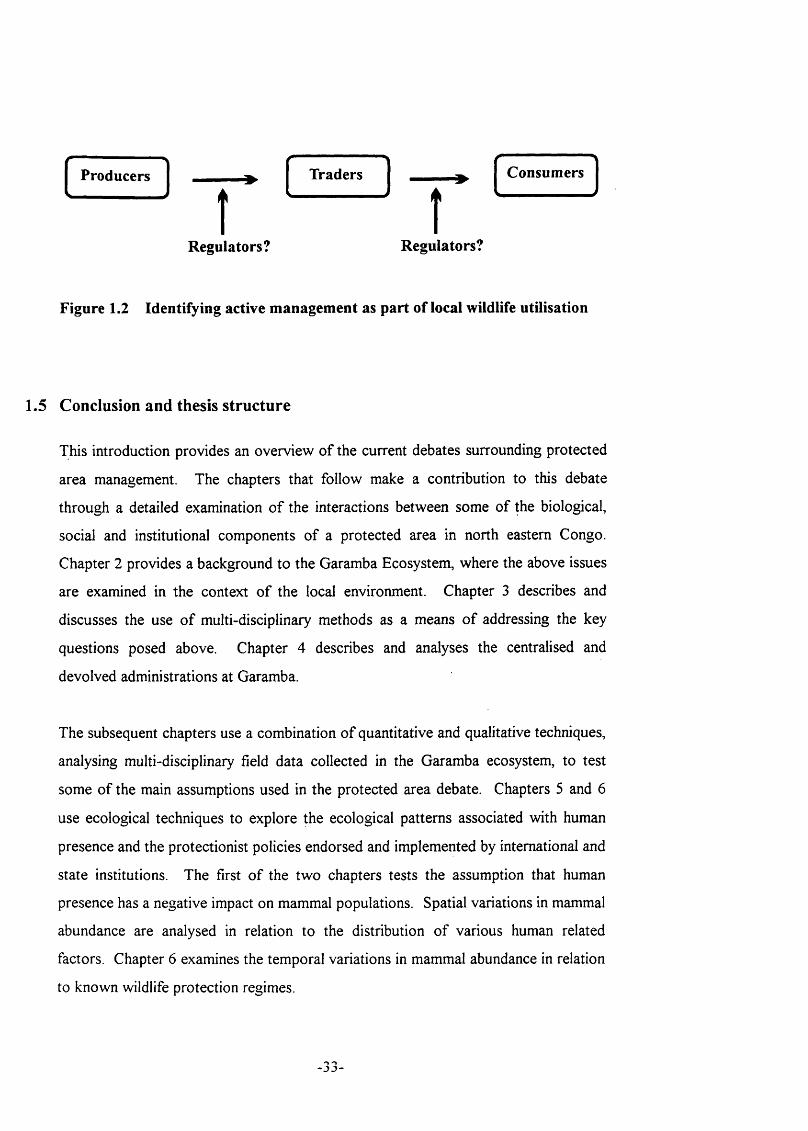
Producers Traders Consumers
Regulators? Regulators?
Figure 1.2 Identifying active management as part of local wildlife utilisation
1.5 Conclusion and thesis structure
This introduction provides an overview o f the current debates surrounding protected
area management. The chapters that follow make a contribution to this debate
through a detailed examination o f the interactions between some o f the biological,
social and institutional components o f a protected area in north eastern Congo.
Chapter 2 provides a background to the Garamba Ecosystem, where the above issues
are examined in the context o f the local environment. Chapter 3 describes and
discusses the use o f multi-disciplinary methods as a means o f addressing the key
questions posed above. Chapter 4 describes and analyses the centralised and
devolved administrations at Garamba.
The subsequent chapters use a combination o f quantitative and qualitative techniques,
analysing multi-disciplinary field data collected in the Garamba ecosystem, to test
some o f the main assumptions used in the protected area debate. Chapters 5 and 6
use ecological techniques to explore the ecological patterns associated with human
presence and the protectionist policies endorsed and implemented by international and
state institutions. The first o f the tw o chapters tests the assumption that human
presence has a negative impact on mammal populations. Spatial variations in mammal
abundance are analysed in relation to the distribution o f various human related
factors. Chapter 6 examines the temporal variations in mammal abundance in relation
to known wildlife protection regimes.
Chapter 7 explores the assumption that protected management makes a contribution
to the local economy by analysing local people’s landuse priorities. Chapter 8 uses
detailed and long term household consumption data to examine wildlife utilisation
patterns. Household wealth status is used as a measure to test the evidence for equity
and participation in community based wildlife management.
The final two analytical chapters examine informal, community level, wildlife
management practices; Chapter 9 examines the incentives for sustainable wildlife
management by analysing the patterns and outcome o f hunts undertaken with
members o f the community. Chapter 10 explores the relationship between wildlife
protection and utilisation. It compares market data on monthly volumes o f bushmeat
with data on national park patrols collated to reflect the level o f wildlife protection
over time.
The final concluding chapter re-examines the issues discussed in this chapter in
relation to the results o f the analytical chapters. Options for wildlife management at
Garamba are discussed in the context o f the findings presented in this thesis.
- 34 -
C hapter 2
B ackground
2.1 Summary
The Garamba ecosystem is a region well suited to an investigation o f centralised and
devolved wildlife management. First, several distinct resource management practices
can be identified for a single resource, large mammals. Second, the resource has
significant value to the groups who have a stake in wildlife management, such as the
Congolese state, international aid agencies and local residents. Finally, the protected
area contains discrete areas (the park and the hunting reserves) where each o f the two
approaches to wildlife are practised.
This chapter outlines the biological and socio-economic characteristics o f Garamba
National Park and the hunting reserves. It summarises the history and structure o f
centralised and devolved management in and around Garamba. First, the
management history o f the park by the Congolese conservation agency and external
aid organisations is described. Second the history o f local administration around
Garamba is summarised and discussed in the context o f wildlife utilisation and
management.
- 35 -
2.2 Introduction
Garamba National Park, gazetted in 1938, was one o f the first national parks to be
established in Africa (Offerman 1940). The park is situated in the north east com er o f
the Democratic Republic o f C ongo \ on the border with Sudan, between the latitudes
3° 8 ’ and 4° 4 ’ north and longitudes 29° and 30° west (Figure 2.1). The national park
was established to protect significant populations o f large mammals, in particular
elephants and rhinoceros (Hillman Smith 1989). The establishment o f the park, under
Belgian colonial administration, was closely tied to the Elephant Domestication
Centre, developed in the early 1920s at the park station o f Gangala na Bodio
(Troupin 1956). Residents within the boundaries o f the park were evicted from the
park, and the area has since been managed using a strict wildlife protection strategy.
In 1981 the ecosystem was declared a UNESCO World Heritage Site, and is currently
managed by the Institut Congolais pour la Conservation de la Nature (ICCN).
The park is surrounded by three hunting reserves or domaines de chasse. These
include Domaine de Chasse Azande in the west. Domaine de Chasse Gangala na
Bodio in the south and Domaine de Chasse Mondo Misa in the east. The reserves
were established at the same time as the national park for the regulated use o f wildlife
resources by resident populations (Hillman Smith 1989). The Domaine de Chasse
M ondo Misa had an additional clause to allow sport hunting (A taliapers comm.).
' Henceforth, the Democratic Republic of Congo (formerly Zaire) will be referred to as Congo. The People’s Rebublic of Congo will be referred to by its full name.
- 36 -
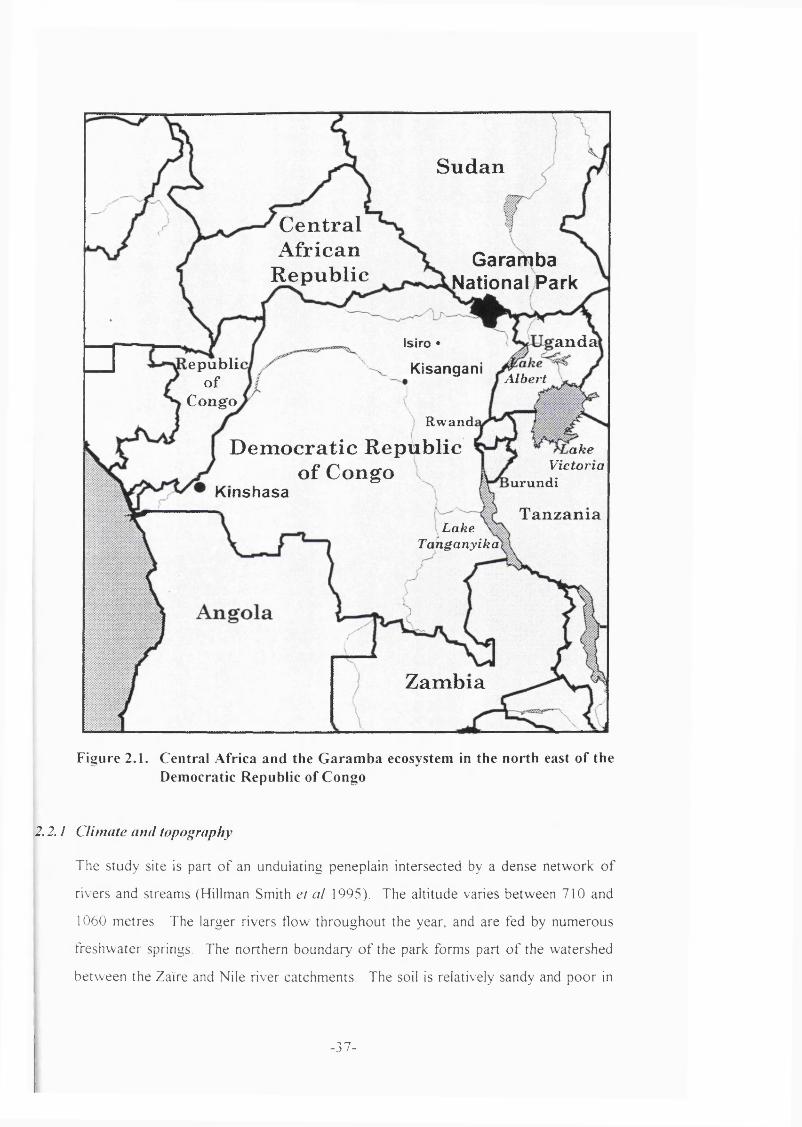
Sudan
CentralAfrican
RepublicGaramba
National Park
anda
A lbert
Isiro •
Kisanganie p u b li o f
C o n g oR w and
Democratic Republic of Congo
a ke Victoria
urundiKinshasaTanzania
Lake Tanganyika
Zambia
Figure 2.1. C entral A frica and the G aram ba ecosystem in the north east of the Democratic Republic of Congo
2 2 1 Climate and topography
The study site is part o f an undulating peneplain intersected by a dense network o f
rivers and streams (Hillman Smith et al 1995). The altitude varies between 710 and
1060 metres. The larger rivers flow throughout the year, and are fed by numerous
freshwater springs. The northern boundary o f the park forms part o f the watershed
between the Zaïre and Nile river catchments. The soil is relatively sandy and poor in
- 37 -
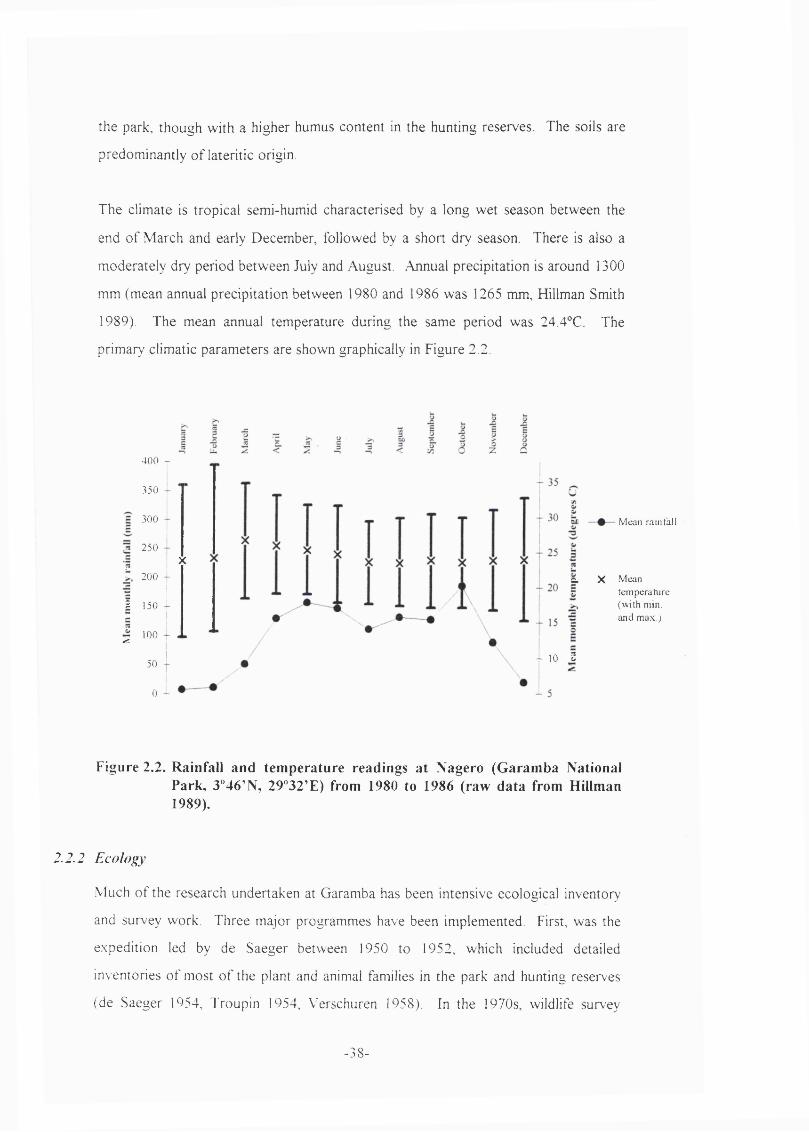
the park, though with a higher humus content in the hunting reserves. The soils are
predominantly of lateritic origin.
The climate is tropical semi-humid characterised by a long wet season between the
end of March and early December, followed by a short dry season. There is also a
moderately dry period between July and August. Annual precipitation is around 1300
mm (mean annual precipitation between 1980 and 1986 was 1265 mm, Hillman Smith
1989). The mean annual temperature during the same period was 24.4°C. The
primary climatic parameters are shown graphically in Figure 2.2.
4 0 0 -
3 50
3 00
2 50X
2001
2 1501
i -
1
l e î100
1 .
501
T0
- 10 S
Mean rainfall
c X Meantemperature (with nun. and max.)
Figure 2.2. Rainfall and tem perature readings at Nagero (G aram ba National Park, 3"46’N, 29°32’E) from 1980 to 1986 (raw data from Hillman 1989),
2.2.2 Ecology
Much of the research undertaken at Garamba has been intensive ecological inventory
and survey work. Three major programmes have been implemented. First, was the
expedition led by de Saeger between 1950 to 1952, which included detailed
inventories of most o f the plant and animal families in the park and hunting reserves
(de Saeger 1954, Troupin 1954, Verschuren 1958). In the 1970s, wildlife surv’ey
- 38 -
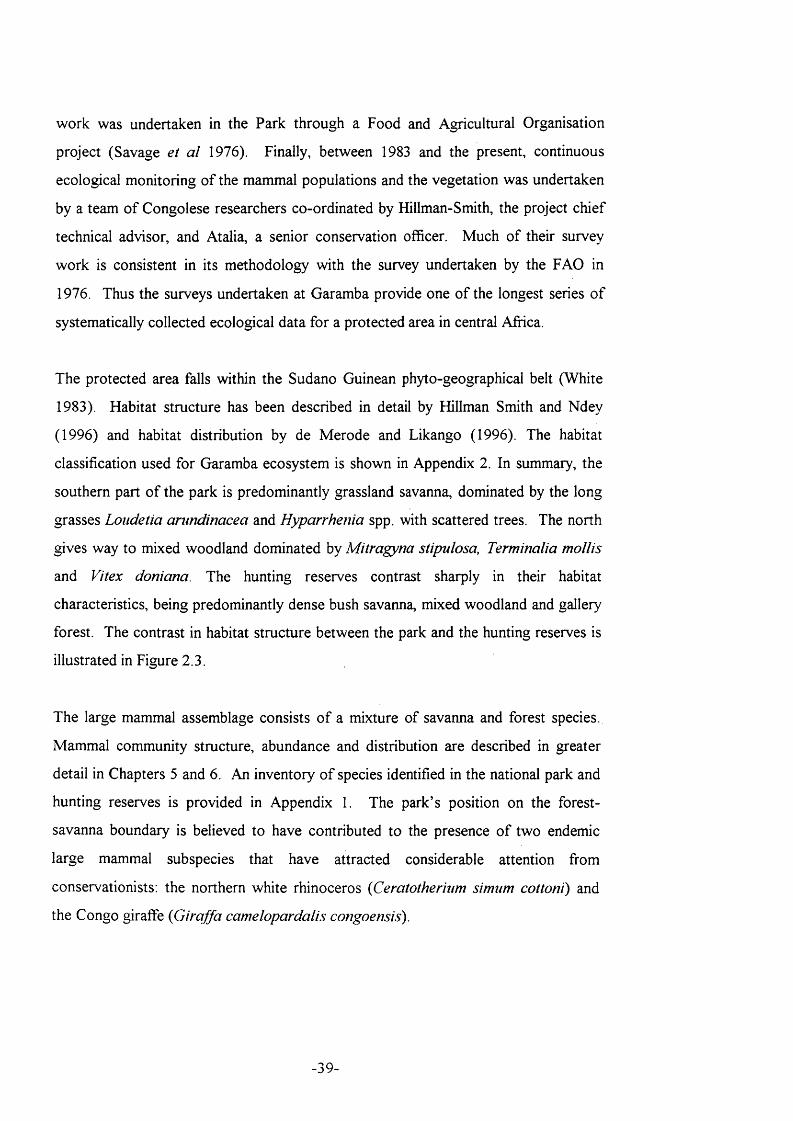
work was undertaken in the Park through a Food and Agricultural Organisation
project (Savage et a l 1976). Finally, between 1983 and the present, continuous
ecological monitoring o f the mammal populations and the vegetation was undertaken
by a team o f Congolese researchers co-ordinated by Hillman-Smith, the project chief
technical advisor, and Atalia, a senior conservation officer. Much o f their survey
w ork is consistent in its methodology with the survey undertaken by the F AO in
1976. Thus the surveys undertaken at Garamba provide one o f the longest series o f
systematically collected ecological data for a protected area in central Africa.
The protected area falls within the Sudano Guinean phyto-geographical belt (White
1983). Habitat structure has been described in detail by Hillman Smith and Ndey
(1996) and habitat distribution by de M erode and Likango (1996). The habitat
classification used for Garamba ecosystem is shown in Appendix 2. In summary, the
southern part o f the park is predominantly grassland savanna, dominated by the long
grasses Loiidetia anm dinacea and Hyparrhenia spp. with scattered trees. The north
gives way to mixed woodland dominated by M itragyna stipulosa, Terminalia mollis
and Vitex doniana. The hunting reserves contrast sharply in their habitat
characteristics, being predominantly dense bush savanna, mixed woodland and gallery
forest. The contrast in habitat structure between the park and the hunting reserves is
illustrated in Figure 2.3.
The large mammal assemblage consists o f a mixture of savanna and forest species.
Mammal community structure, abundance and distribution are described in greater
detail in Chapters 5 and 6. An inventory o f species identified in the national park and
hunting reserves is provided in Appendix 1. The park’s position on the forest-
savanna boundary is believed to have contributed to the presence o f two endemic
large mammal subspecies that have attracted considerable attention from
conservationists; the northern white rhinoceros {Ceratotherhim simum cottoni) and
the Congo giraffe {Giraffa Camelopardalis congoensis).
- 39 -
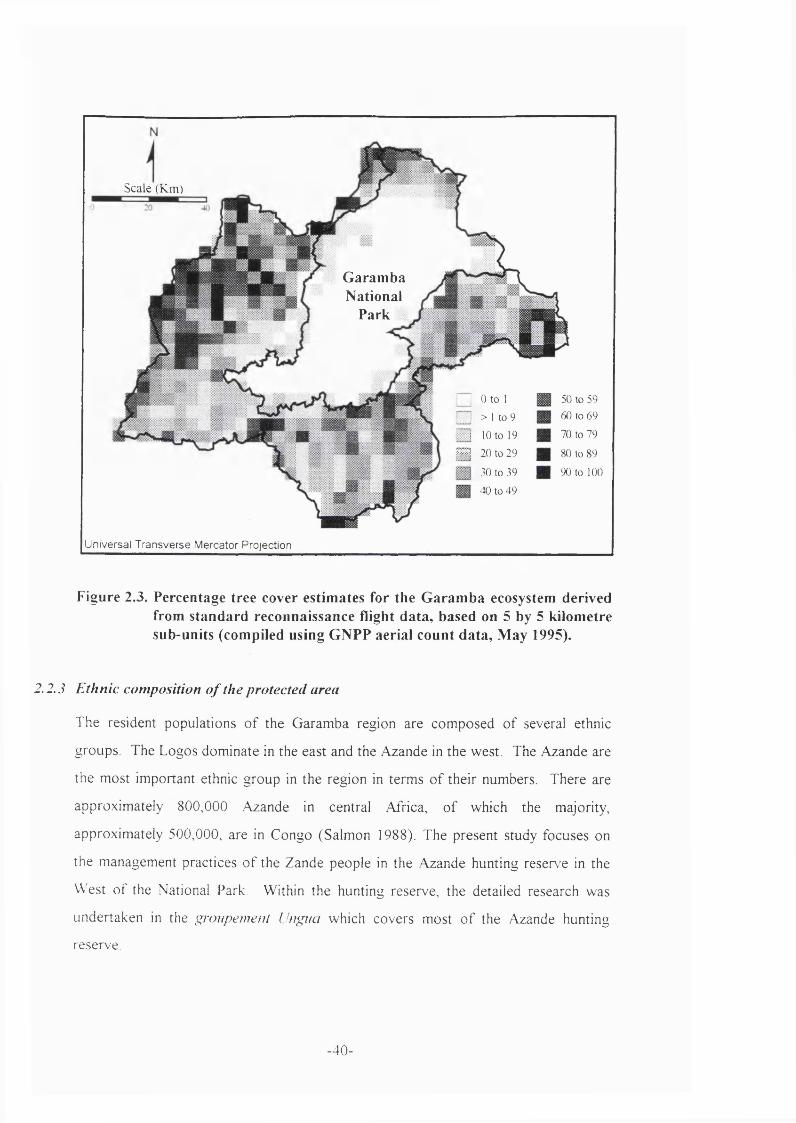
Scale (Km)
G aram ba National
Park
0 to 1
> 1 to 9
I 10 to 19
m 2 0 t o 2 9
30 to 39
40 to 4 9
50 to 59
60 to 69
70 to 79
g o t o 89
90 to 100
Universal Transverse Mercator Projection
Figure 2.3. Percentage tree cover estim ates for the G aram ba ecosystem derived from standard reconnaissance flight data , based on 5 by 5 kilom etre sub-units (compiled using GNPP aerial count data , M ay 1995).
2.2.3 E thnic composition o f the protected area
The resident populations of the Garamba region are composed of several ethnic
groups. The Logos dominate in the east and the Azande in the west. The Azande are
the most important ethnic group in the region in terms o f their numbers. There are
approximately 800,000 Azande in central Africa, o f which the majority,
approximately 500,000, are in Congo (Salmon 1988). The present study focuses on
the management practices of the Zande people in the Azande hunting reserve in the
West of the National Park. Within the hunting reserve, the detailed research was
undertaken in the gj'oupemeni [fngua which covers most o f the Azande hunting
reserve.
- 40 -
2.2.4 The demography and economy o f local people adjacent to the national park
The Garamba region forms part o f what is sometimes referred to by demographers as
the ‘infertility belt’ in central Africa (Laurentin 1974). M ore recent demographic
studies covering the Zone o f Dungu also point to a low fecundity and population
density as a result o f the prevalence o f endemic venereal diseases (Bilusa-Baila 1988,
Romaniuk 1980). Dubois (1990) explains the unusually low population densities in
the Haut Uele sub-region as being the result o f out-migration to Ituri sub-region,
whose population increased by 41.8% between 1970 and 1984, and Kisangani, which
increased by 20.8% during the same period.
Since 1984, human population estimates for the region are unavailable. Nevertheless,
estimates can be calculated based on aerial settlement counts (de M erode and
Likango 1993) and from the education statistics available through the Dungu Doruma
Catholic Diocese (Dubois 1990). Both o f these estimates indicate a population
density o f less than 2 per km^. This represents one o f the lowest population densities
in Congo (Bilusa-Baila 1989).
Because o f the relatively low population densities, demand for land does not appear
to impact on local livelihoods around Garamba as it does in other parts o f Congo.
For example, 53% o f all 5 by 5 kilometre sampled sub-units overflown in the hunting
reserves during the 1993 aerial count did not contain any settlement. This is
consistent with the fact that access to wildlife resources, and not land loss, was the
main complaint raised during a rapid appraisal o f local attitudes towards conservation
undertaken in the hunting reserves (de M erode et a l 1993).
The most detailed published accounts o f Zande agricultural practices are based on
field data collected before 1965 (Sauter 1975, Singer 1972, Evans-Pritchard 1971,
Reining 1966, de Schlippé 1956). de Schlippé’s work, based on several years field
work at Yambio, forty kilometres to the north o f Garamba, provides valuable insights
into Zande agricultural practices, many o f which are still practised (personnal
observation). Shifting agriculture remains the dominant form o f agriculture, although
permanent plots are cultivated closer to, and within, the urban centres. Manioc
- 41 -
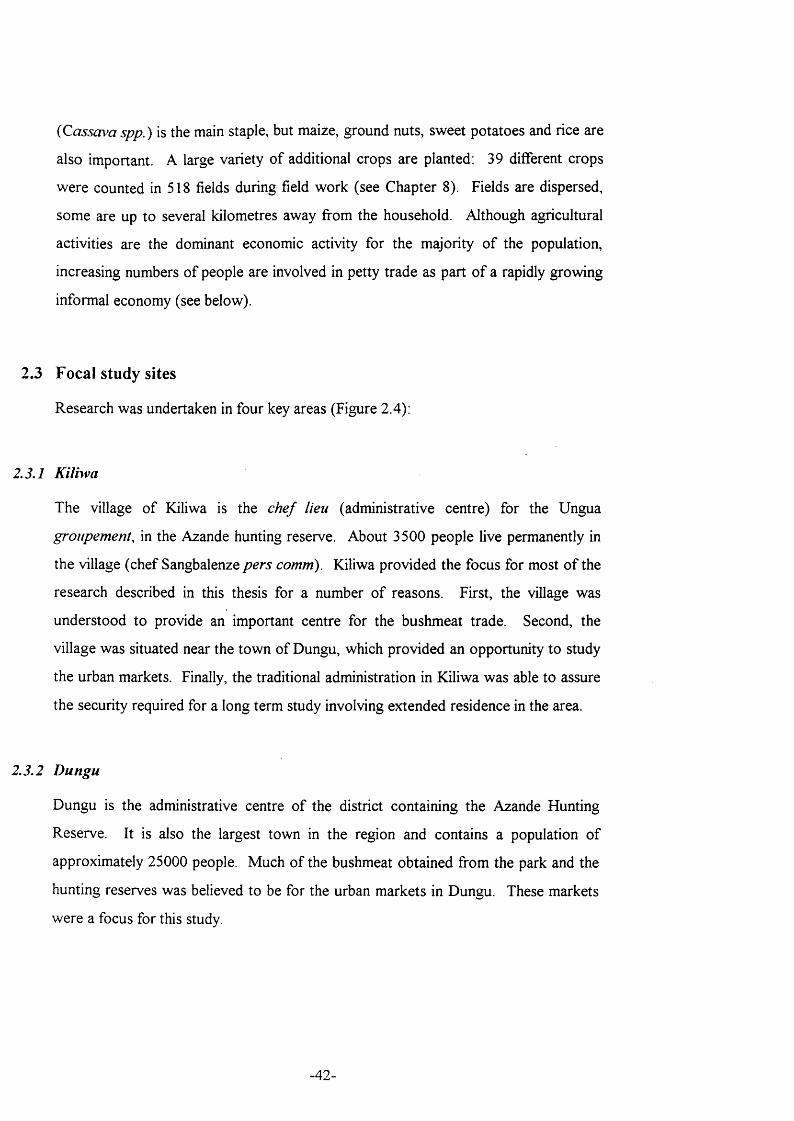
(Cassava spp.) is the main staple, but maize, ground nuts, sweet potatoes and rice are
also important. A large variety o f additional crops are planted; 39 different crops
w ere counted in 518 fields during field work (see Chapter 8). Fields are dispersed,
some are up to several kilometres away from the household. Although agricultural
activities are the dominant economic activity for the majority o f the population,
increasing numbers o f people are involved in petty trade as part o f a rapidly growing
informal economy (see below).
2.3 Focal study sites
Research was undertaken in four key areas (Figure 2.4):
2.3.1 Kiliwa
The village o f Kiliwa is the chef lieu (administrative centre) for the Ungua
groupement, in the Azande hunting reserve. About 3500 people live permanently in
the village (chef Sangbalenze pers comm). Kiliwa provided the focus for most o f the
research described in this thesis for a number o f reasons. First, the village was
understood to provide an important centre for the bushmeat trade. Second, the
village was situated near the town o f Dungu, which provided an opportunity to study
the urban markets. Finally, the traditional administration in Kiliwa was able to assure
the security required for a long term study involving extended residence in the area.
2.3.2 Dungu
Dungu is the administrative centre o f the district containing the Azande Hunting
Reserve. It is also the largest town in the region and contains a population o f
approximately 25000 people. Much o f the bushmeat obtained from the park and the
hunting reserves was believed to be for the urban markets in Dungu. These markets
were a focus for this study.
- 42 -

2.3.3 Mamba
Located in the Azande hunting reserve. Mamba is a village made up o f dispersed
settlements on the western boundary o f Garamba National Park. The village is
smaller than Kiliwa, although the inhabitants were not enumerated during the study.
Mamba is situated in an area o f high large mammal abundance. Therefore, hunting
practices in this village were studied to complement those in Kiliwa, where the
abundance o f mammals is lower.
2.3.4 Nagero
N agero is the field headquarters for Garamba National Park where most o f the ICCN
personnel are stationed. Research with wildlife officers and Garamba National Park
Project personnel was undertaken at Nagero.
- 43 -
Maridi (20 km) I I Nalii>n:\l I’ark
I I Ilunliiiy Reserves
Rivers
Major roads
Secotularv roads
I ^ I Major markets
I’ark sialioiis
( ’">'1111(1 ira usee Is
Y am bio
17Kurukwata
F aradiean gala
1S am b ia
Projection U niversal tr a n sv e r se M ercator W alsa
I 'iguie 2 .4. The (jaratiiba e c o s y s te m and the study sites
2.4 A history of centralised managem ent: Garam ba National Park
2.4.1 The state control o f land and resources in Congo
Centralised control o f the national park and its resources was instituted in 1938, as
stated in the royal decree o f 28 July 1936:
'‘les terres domaniales situées dans les territoires visés à l ’article 3 (les
parties des territoires du Congo-Belge et du Ruanda-Urundi réservées à
la poursuite des buts de l'institu t des Parcs Nationaux du Congo-Belge)
restent la propriété de la colonie ou du Ruanda-Urundi. E lles ne
peuvent être, ni cédées, ni concédées; elles ne peuvent recevoir
d'affectation contraire au buts de l'Institution tels qu 'ils sont indiqués à
l'article 2 du présent décre t”'
(cited from Strouvens and Piron 1943)
This formed the basis for the establishment o f a state conservation agency, the Institut
National pour la Conservation de la Nature, now the Institut Congolais pour la
Conservation de la Nature (ICCN). The agency, whose mandate is to promote nature
conservation, research and recreation in Congo’s network o f protected areas, is
centrally controlled from the capital, Kinshasa. The laws surrounding the protected
areas in Congo are part o f w ider legislation on land and resources which, in theory,
strengthen centralised control (Box 2.1)
“lands that are targeted for the implementation of article 3 (areas of the Belgian Congo and Ruanda-Urundi that are set aside to for the implementation of the objectives of the National Parks Institute of the Belgian Congo) remains the propert>' of the colony, or of Ruanda-Urundi. They cannot be given up or handed over: they cannot be used for anything other than meeting theobjectives of the Institute, as they are described in the present document” (Author's translation)
- 45 -
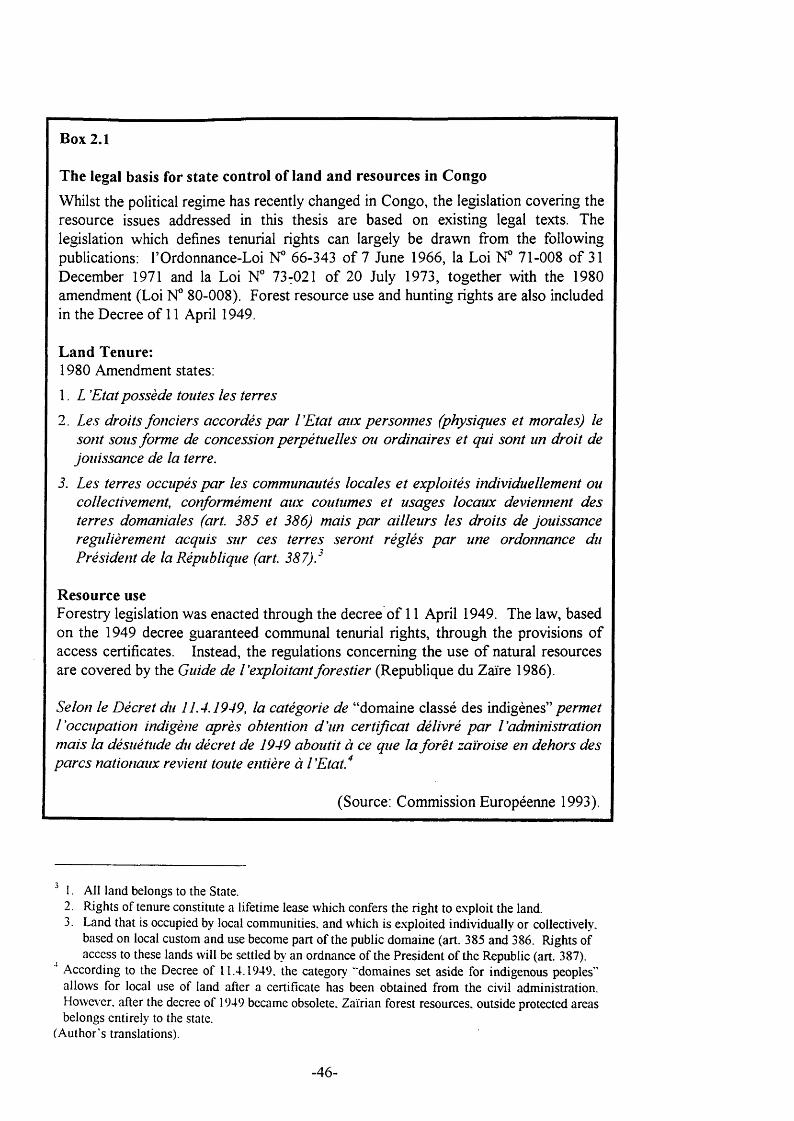
Box 2.1
The legal basis for state control of land and resources in Congo
Whilst the political regime has recently changed in Congo, the legislation covering the resource issues addressed in this thesis are based on existing legal texts. The legislation which defines tenurial rights can largely be drawn from the following publications: I’Ordonnance-Loi N° 66-343 o f 7 June 1966, la Loi N® 71-008 o f 31 December 1971 and la Loi N° 73^021 o f 20 July 1973, together with the 1980 amendment (Loi 80-008). Forest resource use and hunting rights are also included in the Decree o f 11 April 1949.
Land Tenure:1980 Amendment states:
1. L 'Etat possède toutes les terres
2. Les droits fonciers accordés par l ’E tat aux personnes (physiques et morales) le sont sous form e de concession perpétuelles ou ordinaires et qui sont un droit de jouissance de la terre.
3. Les terres occupés p a r les communautés locales et exploités individuellement ou collectivement, conformément aux coutumes et usages locaux deviennent des terres domaniales (art. 385 et 386) mais par ailleurs les droits de jouissance regidiérement acquis sur ces terres seront réglés p a r une ordonnance du Président de la République (art. 387).^
Resource useForestry legislation was enacted through the decree o f 11 April 1949. The law, based on the 1949 decree guaranteed communal tenurial rights, through the provisions o f access certificates. Instead, the regulations concerning the use o f natural resources are covered by the Guide de l'exploitant forestier (Republique du Zaïre 1986).
Selon le Décret du 11.4.1949, la catégorie de “domaine classé des indigènes” perm et l'occupation indigène après obtention d 'un certificat délivré p a r l'administration m ais la désuétude du décret de 1949 aboutit à ce que la fo rê t zaïroise en dehors des parcs nationaux revient toute entière à l'Etat."^
(Source: Commission Européenne 1993).
1. Ali land belongs to the State.2. Rights of tenure constitute a lifetime lease which confers the right to exploit the land.3. Land that is occupied by local communities, and which is exploited individually or collectively,
based on local custom and use become part of the public domaine (art. 385 and 386. Rights of access to these lands will be settled by an ordnance of the President of the Republic (art. 387).
According to the Decree of 11.4.1949. the category "domaines set aside for indigenous peoples” allows for local use of land after a certificate has been obtained from the civil administration. However, after the decree of 1949 became obsolete. Zairian forest resources, outside protected areas belongs entirely to the state.
(Author's translations).
- 46 -
2.4.2 International funding and centralised management
The history o f wildlife management at Garamba is one o f intermittent periods o f
active wildlife protection. The national park was established in 1938 to maintain the
high densities o f large mammals noted in the area (Offerman 1940). There appears to
have been high investment in conservation until shortly after independence in 1960,
reflected in the sophisticated infrastructure o f park roads and buildings developed
during this period. The findings from the de Saeger Expedition to Garamba between
1950 and 1954 indicate high densities o f large mammals in the park. The Simba
rebellion o f the mid 1960s produced political instability and appears to have been
associated with unsustainable levels o f animal offtake from the National Park,
resulting in the reduction o f the rhino population from an estimated 1300 in 1963 to
490 in 1976 (Hillman Smith 1989).
A Food and Agricultural Organisation (FAG) funded project began in 1970 which
provided support to the National Park Authorities to re-establish an effective wildlife
protection system at Garamba (Savidge et a l 1976). This project lasted until 1976,
after which poaching in the national park is reported to have increased substantially
until 1984 (Hillman Smith 1989). In 1984, the Garamba National Park Project was
established, with funding from various international donors. The project’s activities
focused primarily on rebuilding the National Park’s infrastructure for more effective
wildife protection.
- 47 -
2.5 A history of devolved management: the Zande Kingdom of W ando, and
the collapse o f state authority.
This section traces the development o f local systems o f administration around
Garamba, and introduces one o f the key arguments developed in this thesis; it is only
in the context o f underlying social, economic and political processes that it becomes
possible to understand the functioning o f wildlife management, and hence, to explain
many o f the associated ecological dynamics.
2.5.1 The establishment o f Zande administration
Zande political history and organisation has been extensively documented, largely
because o f its unique and extensive expansion through Central Africa during the
middle to late nineteenth century (Salmon 1988, Cordell 1983, Evans-Pritchard 1971,
Singer 1972, de Calonne-Beaufaict 1921 in Salmon 1988).
In brief, Zande history can be summarised in a number o f phases. Between 1600 and
1720, a period o f Zande expansion took place to the west o f the Mbomu river, on the
border o f the Central African Republic and Congo. Territorial consolidation followed
between 1720 and 1780. Political cohesion was largely achieved under the rule o f
Ngura who is believed to have devised the ‘Paix Zandéenne’ (de Schlippé 1956): a
system o f administration which proved to be extremely effective and facilitated the
assimilation o f neighbouring ethnic groups. Although the military power o f the
Azande enabled them to spread rapidly, it was their political organisation and
sophisticated administrative systems, which relied largely on the Avongara ruling clan,
that led to a uniquely stable tribal territory. Zandeland became a mosaic o f
autonomous kingdoms. The king, whilst being an autocrat, delegated his power
through a highly effective administrative hierarchy (Evans-Pritchard 1972).
Individual status did not depend merely on kinship, but could be accessed by members
o f newly assimilated clans through an ability to attract a following, whilst impressing
the chief, such that economic reciprocity was o f paramount importance in the
- 48 -
political and ju ra l organisation o f Zande society" (Singer 1972). The result was an
effective local administration.
Vongara domination o f the area around Garamba occurred after the Mahdist revolt in
southern Sudan in 1883, when European influence was temporarily at a low ebb. The
Kingdom o f Wando formed in the W est and the Kingdom o f Gbudwe to the north (in
Sudan) o f what is now Garamba National Park. The Moru ethnic group were
subjugated during this period o f expansion (Salmon 1988).
2.5.2 Colonial influences on local administration
From the late nineteenth century, however, Zande political structures were deeply
influenced by the wider political developments in Central Africa. This was associated
with an increase in conflict between adjacent Zande Kingdoms, and with dynastic
rivalries within the kingdoms themselves (Salmon 1988). Thus, "'the original impact
o f the European on the way o f life o f the Azande was a political one, although more
an impact o f chaos than one o f uniform change ” (Singer 1972). The conflicts within
the Zande political structure were compounded by the influence o f international
political divisions: the stand-off between Marchand and Kitchener at Fashoda in 1898
put an end to French political influence in Sudan. British imperial ambitions in the
region were further reinforced by the 1906 treaty when Leopold II, King o f the
Belgians, renounced any proprietal claim to the Nile Basin (Martin 1983). The result
o f these negotiations was a territorial division which fractured Zande territory along
the watershed o f the Nile and the Congo basins, and in the west along the border o f
French Equatorial Africa (CAR).
All three colonial powers, Belgium, Britain and France, practised a policy o f ‘divide
and rule’ as a means o f consolidating the territory acquired through negotiations in
Europe. Vongara chiefs gradually fell in line with their respective European
colonisers, and were drawn into wider conflicts which further fractured one o f the
most cohesive African political systems (Salmon 1988). In a succession of battles
between 1892 and 1905, Zande chiefs fought against external troops and against each
other. In the south, chiefs fought for the Independent State o f the Congo (the
- 49 -
private estate o f King Leopold II o f the Belgians until 1906), and in the north, with
Anglo-Egyptian troops. Others fought with the M ahdists in their dwindling efforts to
maintain the slave trade. The last truly independent Vongara chief, Yambio-Gbudwe,
was killed by Sudanese troops under British command at the battle o f Yambio in
1905 (Salmon 1988).
Against this background o f political transition came a process o f social upheaval
instigated by both British and Belgian colonial powers. From the 1920s, political and
legal restrictions were imposed on the population at large. One o f the most dramatic
changes came with the imposition o f new systems o f cultivation and residence. In
southern Sudan, resettlement schemes regrouped Zande households along roads in a
largely unsuccessful attempt to promote cotton yields. Households, which were
traditionally dispersed to enhance access to uncultivated land and to facilitate
rotation, were replaced by large and concentrated resettlement schemes (Reining
1966). In the Belgian Congo, between 1920 and 1935, traditional systems o f
cultivation were replaced by a system o f cotton production that serviced wider
industrial interests. A decree in 1918 legalised the use o f force by colonial
administrators at the point o f production (Likaka 1995). The limited ability o f the
colonial administration to manage the imposition o f cotton production led to the
recruitment o f traditional authorities to enforce cotton production.
This policy is reflected in a letter from the Governeur Générale o f Congo to the
provincial governors in 1931, in the context o f the programme aimed at boosting
cotton production; “le rendement trop limité des indigènes doit fa ire place an travail
co llec tif sons Vimpidsion de chefs qui ne seraient p in s senlement des autorités
politiqnes, mais anssi des intermédiaires chargés d 'une propagande active en favenr
de la production’' (in Salmon 1988)^. In practice, the traditional administration
became the lowest rank o f a centralised system aimed primarily at boosting cotton
production. Administrative control was shared by a combination o f private sector and
"The vcty limited yields produced by the natives must be increased through collective work encouraged by the chiefs. The chiefs would become more than mere political figures, but would have the role of intermediaries for an active propaganda programme to encourage production." (author’s translation).
- 50 -
colonial agents whose "'policy was to get the leading members o f local communities
into the lower colonial administrative positions: these leading citizens were then
trained to impose a rigorous work schedule and to use a wide array o f punishm ents
against peasants fa ilin g to perform work obligations” (Likaka 1995). Cotton
production became the financial backbone o f a subjugated traditional administration.
In 1930 - 1931 Ngilima, King o f Wando, received 21,000 francs in cotton production
premiums, compared to the average household in the Collectivité Wando, who
received 67 francs from cotton production (Sparano 1931, cited in Likaka 1995).
2.5.3 Political conflict and the rebirth o f a devolved administration ‘by default’
Congo’s colonial era saw the traditional administrative structures o f Wando drawn
into wider commercial and political spheres. Congo’s post-colonial era saw the
gradual disintegration o f national political, administrative and economic structures
(MacGaffey 1991). The collapse o f the formal administration led to new form o f
local administration, closely tied to the ‘informal economy’ discussed in the next
section.
During period between the fall o f the Tshombe Government in 1964 to the collapse o f
the M obutu regime in 1997, the north east o f Congo has been characterised by
intense conflict interspersed by periods o f gradual decline o f the state and other
economic institutions. The army mutinied in Stanleyville (now Kisangani) in 1964,
and again in 1967 (Gott 1996). This was accompanied by the Simba rebellion, a
movement defined by a mixture o f Maoist philosophy and violence. During this
period, north eastern Congo became a bloody playground for foreign ideological and
economic aspirations and attracted such contrasting characters as the militant
socialists Chou En-lai and Che Guevara and the mercenaries Hoare and Tavernier
(Gott 1996). This was followed by a period o f relative political stability, but
economic collapse, for the three decades under the M obutu regime (with the
exception o f two years o f conflict in Shaba in 1978 - 1979).
The relative political stability in Congo (then Zaire) was not matched in southern
Sudan, with the first and second civil wars in 1968 to 1972 and 1983 to the present.
- 51 -
The Garamba ecosystem, situated on the Sudanese border, was directly affected by
these conflicts. Political instability in Sudan since 1983, and more specifically the fall
o f Maridi and Yambio to Sudanese People’s Liberation Army (SPLA) troops in 1990,
has led to the forced migration o f southern Sudanese to north-eastern Congo.
Predominantly o f Azande origin, the Sudanese refugees have settled in a host region
which also comprises Azande communities. However, the Kingdoms o f origin o f the
two communities differ. The refugees are from the Kingdom o f Gbudwe yet they
have, on the whole, been welcomed by the traditional authorities o f the host Kingdom
o f Wando. The shared cultural origins o f the hosts and refugees has ‘softened’ the
impact o f the refugee presence, according to the UNHCR Field Coordinator, Claude
Gambale, himself Azande (pers. comm.). The relative ease o f assimilation o f over
90,000 Sudanese displaced people in the region is testimony to the adaptability and
functionality o f the new administration in the region (WFP and UNHCR 1993).
However, the type o f settlement strategy adopted by refugees is a key determinant o f
the ease and level o f integration (see below).
Communities in a situation o f crisis are entitled to protection (in terms o f food and
personal security) by their national governments. Should this fail, as with refugees,
the mandate o f the United Nations (implemented by UNHCR) is to intervene on their
behalf. In the case o f the Zande refugees in Dungu, neither national nor international
support has been maintained due to the political and economic isolation o f this region.
Food provisioning was halted in February 1995, forcing complete dependence on
local resources. In the absence o f alternative support, it is the traditional authority
that has been instrumental in facilitating the integration o f refugee and host
communities. The cohesive adaptability o f the Zande culture, despite its erosion by
the legacy o f colonial rule, underlies the survival strategies adopted within the refugee
affected area.
The refugees show three major patterns o f settlement. Firstly, clanic affinities have
led many Azande refugees to self-settle with relatives in Azande villages. The clan
related settlements match the Zande traditional pattern o f social organisation; the
refugee is a “brother” and guest, facilitating assimilation (Gambale pers. comm ).
- 52 -
Secondly, refugees from an urban background, have settled in the larger trading
centres, such as Dungu, where they subsist largely from trade. Finally, UNHCR
official settlements have been allocated by local and national government officials^.
These contain basic amenities and infrastructure: primary schools, health centres,
markets etc.. Each household receives residential and agricultural land but
households are settled with no regard to their origin or background. Their
interactions with the host communities are also complex but the refugees, even the
Azande, tend to be considered foreigners. A similar account o f refugee - host
interactions is provided by Leach (1991) in Sierra Leone. She also stresses the
importance o f existing existing ties in resolving some o f the potential difficulties faced
by displaced people.
The planned refugee settlements are situated outside the hunting reserves, whilst the
settled refugee families appear to have been assimilated within the resident
population. During this study, individuals o f Sudanese origin could not easily be
distinguished from the resident populations without a thorough understanding o f the
language. Occasionally, small details, such as people’s names, would reveal people’s
origins. For example a woman in Kiliwa was named Namba Wane. The English
derivation o f her name, ‘number one’ or first bom, revealed her Sudanese origins.
Nevertheless, it seemed that neither her material belongings nor her activities in
Kiliwa could be used to distinguish her from the Congolese community in which she
lived, by anyone other than local residents. For this reason, this study does not
explicitly draw the distinction between host communities and refugees.
Recent conflicts in Congo between September 1996 and May 1997, which led to the
collapse o f the M obutu regime, have had profound social and ecological
consequences for the region. The conflict, originating in the Great Lakes region, on
the border with Rwanda, initially extended northwards on two fronts with the
objective o f capturing Kisangani. The Garamba region was situated on the path of
This description of refugee settlements is partly based on a three week pilot study undertaken as part of this study in Kakal refugee settlement outside Dungu in 1996. The work was discontinued because of methodological and security difficulties.
- 53 -
the eastern advance o f the conquering Alliance des Forces Démocratique pour la
Libération du Congo-Zaïre (AFDL). Ahead o f the AFDL advance, retreating troops
o f the Forces Armées Zaïroise (FAZ) engaged in extensive looting and vandalism in
the region. Although the period o f conflict was relatively short lived, it had profound
effects. For the theme o f this thesis, the discussion focuses on resource use and the
management capacity o f the national park (GNPP 1997, Smith and Smith 1997).
Only the region to the north o f the Dungu River (the Azande hunting reserve) was
not extensively looted. This is understood to be because traditional chiefs in the
hunting reserve insisted that soldiers o f the FAZ should not cross the Dungu River
( G a m b a l e comm.).
2.5.4 The informal economy and an associated ‘shadow administration
The growth o f the informal sector is both a symptom of, and a response to the
collapse o f centralised authority in Congo. MacGaffey’s study o f the informal
economy in Congo (1991) estimates that unrecorded trade consists o f as much as
three times the official GDP. The growth o f the informal sector is, ironically,
associated with a process o f centralisation and nationalisation o f the productive sector
which began the state taking possession o f the Union Minières, the vast Belgian
copper mining company, in 1967. This was followed by the decrees o f
Zairianisation in 1973 whereby nationals were entitled to take possession o f all
foreign-owned businesses, and Radicalisation in 1975, when the state took over all
large-scale enterprises. The decrees o f Retrocession in 1976 tried, and largely failed,
to stem the collapse o f the national economy by attempting to encourage external
investment by allowing shared ownership o f national companies with foreign investors
(Young 1984). By the late 1970s the official marketing system had become almost
defunct, infrastructure was deteriorating and for petty producers, prices were
becoming “derisory in terms o f purchasing p o w er” (MacGaffey 1991) as a result o f
soaring inflation. However, most Congolese were not waiting for the political elites
to re-establish the state structures.
With rapidly increasing demand for food and other commodities from the growing
urban centres, new opportunities were developing to produce what Beckman (1987)
- 54 -
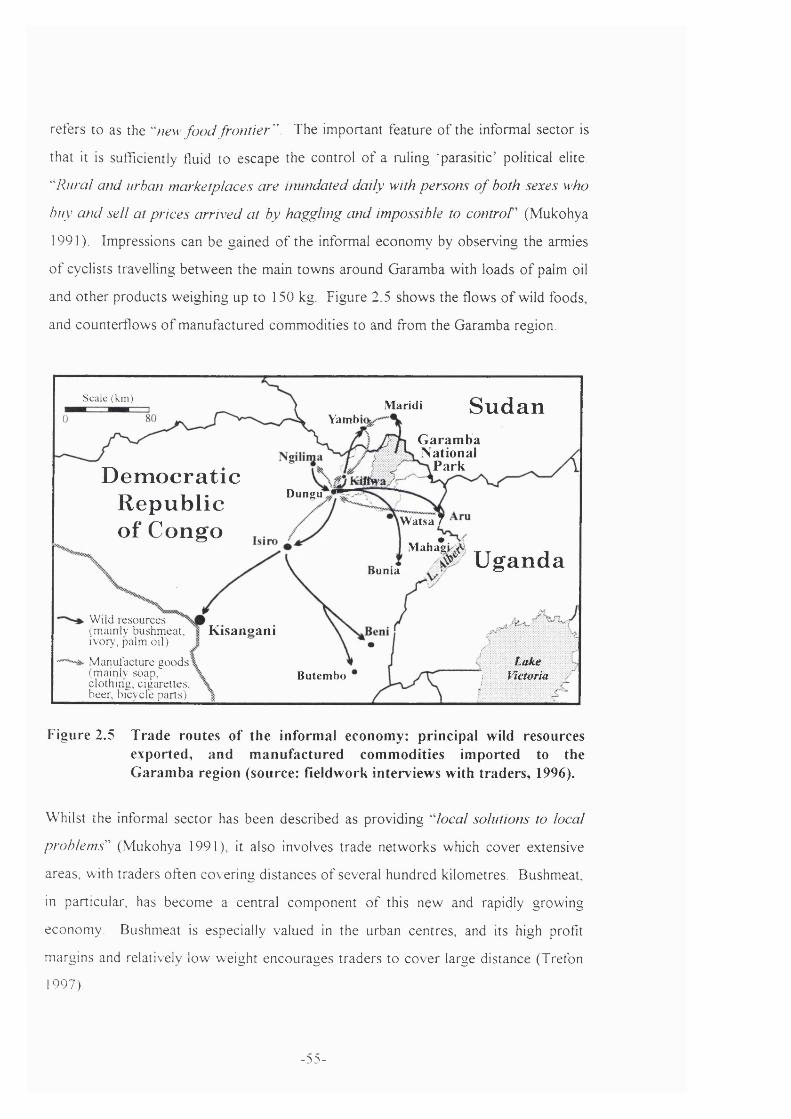
refers to as the ""new fo o d frontier". The important feature o f the informal sector is
that it is sufficiently fluid to escape the control o f a ruling ‘parasitic’ political elite.
''Rural and urban marketplaces are inundated daily with persons o f both sexes who
buy and sell at prices arrived at by haggling and impossible to controF (Mukohya
1991). Impressions can be gained o f the informal economy by observing the armies
o f cyclists travelling between the main towns around Garamba with loads o f palm oil
and other products weighing up to 150 kg. Figure 2.5 shows the flows o f wild foods,
and counterflows o f manufactured commodities to and from the Garamba region.
S ca le (k m ) SudanMaridiYambi
G aram ba National
P arkD em ocratic R ep u b lic o f C ongo
Dungu
W atsaZ
Maha^iU gandaBunia
W ild r e s o u r c e s ( m a in lv b u s h m e a t , iv o r v , p a lm o i l )
Kisangani
Lake Victoria
M a n u fa c tu r e g o o d s (m a in lv s o a p , c lo t h in g , c ig a r e t t e s , b e e r , b i c v c l e p a r ts )
Butembo
Figure 2.5 T rade routes of the inform al economy: principal wild resources exported, and m anufactured com modities im ported to the G aram ba region (source: fieldwork interviews with traders, 1996).
Whilst the informal sector has been described as providing ""local solutions to local
problems''^ (Mukohya 1991), it also involves trade networks which cover extensive
areas, with traders often covering distances o f several hundred kilometres. Bushmeat,
in particular, has become a central component o f this new and rapidly growing
economy. Bushmeat is especially valued in the urban centres, and its high profit
margins and relatively low weight encourages traders to cover large distance (Trefon
1997).
- 55 -
Just as the traditional administrations responded rapidly to the challenges resulting
from the influx o f displaced people from Sudan, traditional authorities have also
adapted to the opportunities offered by the informal economy. For ambitious and
enterprising traditional chiefs, the opportunities are only too obvious (chef
Sangbalenze pers. comm.): with the dramatic growth o f the informal economies came
a demand for appropriate arbitrators. For the majority o f the population, the
government is ""capricious and oppressive ” whilst the ‘"local administration is out o f
reach o f central Government whose decrees it does not always im p lem en f
(MacGaffey 1991). Traditional authorities hold one key advantage over higher
ranking officials; state officials are regularly moved from post to post, preventing
them from developing long term, stable trade relations. As a result, traditional chiefs
are in a position to provide the one service that is perhaps in greatest demand in
Congo, and which is conditional for economic growth: stability.
2.5.5 The law on local access to wildlife resources
As in most central African countries, resource tenure in Congo is based on a mixture
o f customary law and state legislation. The evolution o f Congolese legislation
concerning resource tenure is outlined in Box 2.2. In summary, traditional rights o f
access to wild resources were enshrined in the Royal Decree o f 1949. Jewsiewicki
(1983) explains this emphasis on an ‘indigenous law for the natives’ as a mechanism
for social engineering:
The rural world was administered by a native ch ie f with a native tribunal
and a complementary native tax system. Paradoxically, the economic
and administrative territory o f the colony was progressively unified after
1920, while ‘indigenisation’ simultaneously divided people into small
cultural units ... all Africans were excluded fro m credit, from private
ownership o f land and fro m the right to hire employees.
Whilst the maintenance o f communal law was used as a tool for alienating the vast
majority o f the indigenous population from positions o f economic and political
- 56 -
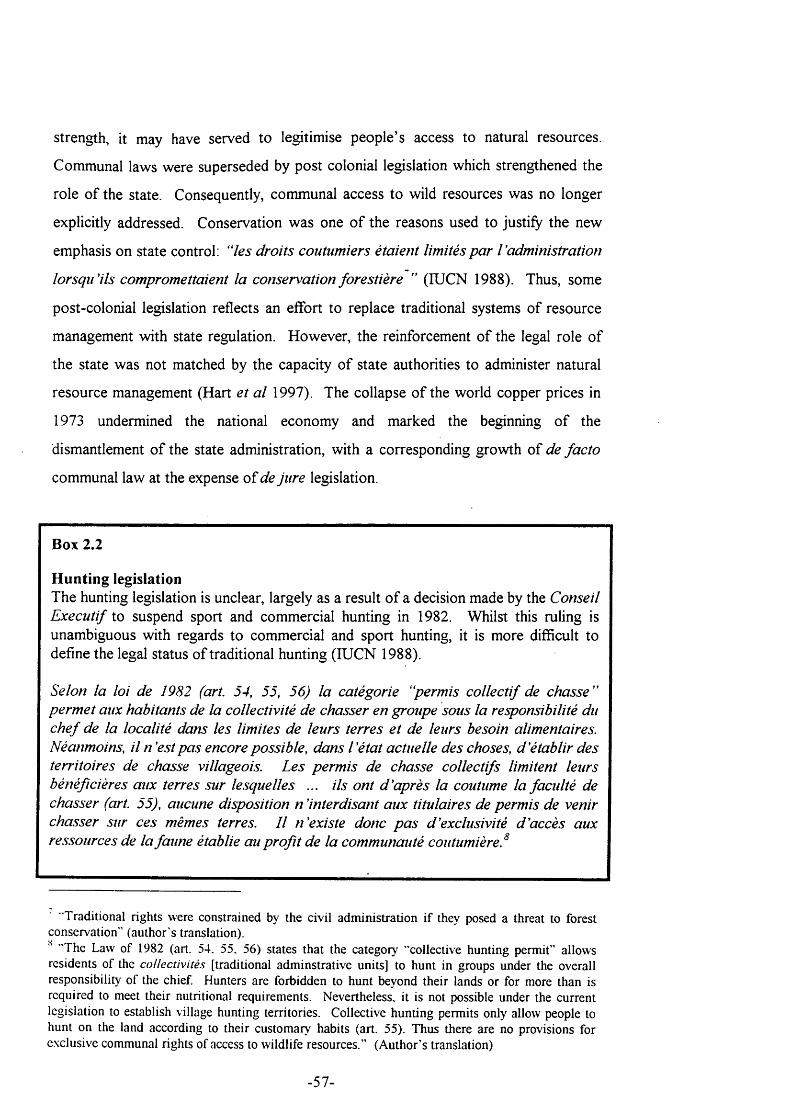
strength, it may have served to legitimise people’s access to natural resources.
Communal laws were superseded by post colonial legislation which strengthened the
role o f the state. Consequently, communal access to wild resources was no longer
explicitly addressed. Conservation was one o f the reasons used to justify the new
emphasis on state control: “les droits coutumiers étaient limités par l'administration
lorsqu'ils compromettaient la conservation forestière ” (lUCN 1988). Thus, some
post-colonial legislation reflects an effort to replace traditional systems o f resource
management with state regulation. However, the reinforcement o f the legal role o f
the state was not matched by the capacity o f state authorities to administer natural
resource management (Hart et a l 1997). The collapse o f the world copper prices in
1973 undermined the national economy and marked the beginning o f the
dismantlement o f the state administration, with a corresponding growth o f de fa c to
communal law at the expense o f de ju re legislation.
Box 2.2
Hunting legislationThe hunting legislation is unclear, largely as a result o f a decision made by the Conseil E xecu tif io suspend sport and commercial hunting in 1982. Whilst this ruling is unambiguous with regards to commercial and sport hunting, it is more difficult to define the legal status o f traditional hunting (lUCN 1988).
Selon la loi de 1982 (art. 54, 55, 56) la catégorie “perm is collectif de chasse’’ perm et aux habitants de la collectivité de chasser en groupe sous la responsibilité du c h e f de la localité dans les limites de leurs terres et de leurs besoin alimentaires. Néanmoins, il n 'est pas encore possible, dans l'é ta t actuelle des choses, d'établir des territoires de chasse villageois. Les perm is de chasse collectifs limitent leurs bénéficières aux terres sur le.squelles ... ils ont d 'après la coutume la facîd té de chasser (art. 55), aucune disposition n 'interdisatit aux titulaires de perm is de venir chasser sur ces mêmes terres. I l n 'existe donc p a s d'exclusivité d'accès aux ressources de la faune établie au pro fit de la communauté coutumière.^
"Traditional rights were constrained by the civil administration if they posed a threat to forest conservation” (author’s translation). "The Law of 1982 (art. 54. 55, 56) states that the category "collective hunting permit” allows
residents of the collectivités [traditional adminstrative units] to hunt in groups under the overall responsibility of the chief. Hunters are forbidden to hunt beyond their lands or for more than is required to meet their nutritional requirements. Nevertheless, it is not possible under the current legislation to establish village hunting territories. Collective hunting permits only allow people to hunt on the land according to their customaiy habits (art. 55). Thus there are no provisions for exclusive communal rights of access to wildlife resources.” (Author’s translation)
- 57 -
2.4 Garam ba ecology: a synthesis of historical resource managem ent and
political processes
Habitat and animal community structures are interdependent (Sinclair 1995, Dublin et
a l 1990). As described in Section 2.2, the national park contains grassland savanna,
whilst the surrounding reserves are composed o f dense bush savanna with extensive
gallery forest. These habitat characteristics are known to precede the establishment
o f the national park (Verschuren pers comm, in Hillman Smith 1989) and have a
profound effects on current mammal community structure and abundance. However,
there is no comprehensive explanation for the contrasting habitat characteristics o f the
park and the surrounding hunting reserves: the topography, geology and climatic
characteristics appear to be homogeneous throughout the ecosystem. Preliminary
pedological research suggests that soil samples collected in grassland and dense bush
savanna sites do not differ significantly (Likango pers comm.). Whilst the
development o f African savanna habitats are known to result from the interaction o f
such factors as elephants, fire and termitaria (Dublin et a l 1992, McNaughton and
Banyikwa 1995), there is no tested hypothesis for the occurrence o f savanna habitats
in the park as opposed to the surrounding reserves.
An explanation for the disjunct habitat types relates to the landuse history o f the
region (Hillman-Smith pers. comm.): the savanna grassland forms a north south belt
which corresponds fairly accurately with the eastern extremity o f Zande expansion
during the late nineteenth century (Evans-Pritchard 1971). Thus, the area now
included in the national park was an inter-tribal zone, prone to political conflict, and
with correspondingly low human population densities. This may have resulted in fire
regimes which differed consistently from those o f the surrounding areas. In the
populated areas, now contained in the hunting reserves, fire is used as an agricultural
tool (de Schlippé 1954). As such, fire is carefully managed and used primarily in the
early dry season, which prevents fire from reaching the high temperatures necessary
for the conversion o f forest to savanna habitat.
- 58 -
Le fe u est l'ou til le p lus importæit dans l'agriculture zande. I l fa u t
distinguer les fe u x de brousse qui s'attaquent de façon non contrôlée à
la végétation en saison sèche et constituent un des facteurs les p lus
graves de dégradation des sols et le brûlis de défrichements qui est
considéré comme un o u t i f
(de Schlippé 1954)
In contrast, the area contained in the national park would have had lower densities o f
agricultural populations. Thus, fire would not have been managed on an annual basis,
resulting in the accumulation o f combustible material followed by less regular but
devastating late dry season fires, de Schlippé makes direct reference to the Garamba
habitat structure to illustrate this:
II est intéressant de constater qu 'en beaucoup d'endroits non habités
soumis au fe u x intempestifs, tels le parc national de la Garamba au
nord du Congo, la végétation semble p lus dégradée que dans les régions
voisines peuplées où l'homm e protège ses cidiures en plaçant des
barrières contre l'extension du feu.^^
(de Schlippé 1954)
Hillman Smith (1996) suggests that the habitat characteristics o f the park reveal
patterns which could be associated with a savanna vegetation recently derived from
forest. This supports the hypothesis o f declining w oody vegetation in the park.
These characteristics include gallery forests, consisting o f species typically associated
with ombrophile forest (e.g. Chlorophora excelsa, Khaya grandifolid). Whilst the
‘more people, more trees’ explanation for habitat change is only one o f several
possible hypotheses in the Garamba ecosystem, it is consistent with empirical studies
o f the interaction between forests, savannas and people (see for example, Fairhead
"Fire is the most important of Zande agricultural tools. Bush fires, which bum the vegetation indiscriminately during the dry season and which degrade the soil, have to be distinguished from the fires used to clear fields, which are used as a tool.” (Author’s translation).
"It is interesting to note that in uninhabited areas subject to uncontrolled fire, such as in Garamba National Park, the vegetation seems more degraded than in neighbouring populated areas where people protect their fields by creating fire breaks.” (Author’s translation).
- 59 -
and Leach 1996, Chenevix-Trench 1997). Certainly, de Schlippé's depth o f
understanding o f indigenous resource management, and technical knowledge was well
ahead o f its time, which is perhaps why it was not well received by his
contemporaries, and he had to self-finance the original publication o f eco-cultnres
d 'Afrique (Dupriez 1953).
Current paradigms on the dynamics o f savanna ecosystems have embraced non
equilibrium explanations o f change in species community structure and abundance
(Sinclair 1995, Dublin 1995). These were explained in Chapter 1. Whilst these
processes have tended to focus on the effect o f high variability in physiological (eg.
rainfall, groundwater levels), or biological factors (eg. disease), it follows that socio
economic factors can also be highly variable and stochastic and have significant
ecological repercussions. An important example o f this is war, which is explored in
Chapter 10.
- 60 -
2.5 Conclusion
This chapter outlined the socio-economic and ecological characteristics which provide
a background to the thesis. The systems o f management were outlined in their
historical and legal contexts. Centralised management covers the role o f the state in
wildlife management. Congolese law vests most o f the rights over wildlife
management to the Government institution, ICCN. However, a legacy o f conflict and
economic collapse in Congo has limited the ability o f state institutions to assume
effective authority over wildlife management. At Garamba National Park, long term
financial and technical support has enabled the centralised authority to operate, but its
activities do not cover all parts o f the protected area. The centralised wildlife
authorities have only limited influence on wildlife management in the hunting
reserves. Local administrations exist in the hunting reserves, but these have also been
deeply influenced by historical legacies. These include efforts by colonial and
commercial interests to coerce traditional authorities into imposing cotton production
on the agricultural communities. Post colonial history saw the re-establishment o f
local systems o f authority, largely from the vacuum left by a declining state
administration. The local systems o f administration are now closely tied to a rapidly
growing informal economy, which largely revolves around the supply o f food to
urban markets. Bushmeat is an important part o f these systems o f trade.
Finally, this chapter outlined the current theories that show the linkages between the
historical landuse, political and ecological processes in the Garamba ecosystem.
These illustrate the significance o f social processes in understanding wildlife ecology.
Thus, the human dimensions o f animal ecology provides the main focus for this study.
- 61 -
C hapter 3
M ethods
This chapter provides an outline o f the techniques used to understand the process and
outcom e o f wildlife management practices o f the Garamba ecosystem. More detailed
methodologies are provided in each chapter. The research methods are
predominantly quantitative, as the approach is hypothesis driven. Nevertheless,
qualitative material is drawn on to frame the research questions and to contextualise
the discussion. All techniques were pilot tested prior to the main field work period.
The thesis draws on a combination o f inductive and deductive approaches to analyse
wildlife utilisation patterns.
The Introduction to this thesis emphasised the role o f received wisdom in shaping the
nature o f protected area policy and practice in sub-Saharan Africa. A number o f
authors have shown that this is compounded by a lack o f objectivity o f scientific
method, particularly in the study o f ecological processes (Chambers 1983, Leach and
M earns 1996). This, combined with a growing recognition o f the anthropic
landscape, where human factors both shape the ecosystem and are an integral part o f
it, has resulted in the increased use o f multi-disciplinary research techniques to
understand resource use issues (Commission Européenne 1993, Abbot 1996, Fairhead
and Leach 1996, Chenevix-Trench 1997, Sullivan 1998). The approach combines
techniques from the social and natural sciences so that evidence for causal
relationships can be established through a process o f triangulation (Lambin 1994).
- 62 -
3.1 Ecological patterns and w ildlife m anagem ent
The first part o f this thesis (Chapters 4 and 5) examines the relationship between
animal ecology and wildlife utilisation and management. The working definition o f
animal ecology used in this thesis is the distribution and abundance o f mammals
(Andrewartha and Birch 1954). A ‘natural experiment’ framework is used (Diamond
and Case 1986), whereby natural variations in ecological and socio-economic
parameters are used to test cause-effect hypotheses. However, in practice, natural
experiments rarely provide a rigorous basis for distinguishing causation from
correlation. This is because landscapes are infinitely complex, and all factors
influencing animal distribution and abundance cannot be controlled. A solution to this
problem is to analyse correlations across two axes o f variation; space and time. The
strength o f the results depends on how much the different analyses concur.
The data used in the analysis o f animal ecology were collected both as part o f the field
work for this study, and by the Garamba National Park’s research and monitoring
programme (Table 3.1). Spatial variations in animal abundance in the hunting
reserves are drawn from the raw data collected by Nicolas and Ndey (1995) using
ground transect techniques. These are compared to the spatial distribution o f
agricultural populations, drawn from the analysis o f Landsat TM satellite. Other
spatial factors are drawn from topographic charts using geographic information
system (GIS) techniques (Johnston 1998).
Data representing the temporal variations in animal abundance were available through
the regular ecological monitoring undertaken by the Garamba National Park Research
and Monitoring Programme. The unpublished sampled aerial count data were re
analysed to show patterns o f variation in animal abundance in the park between 1976
and 1995, under known wildlife management regimes.
- 63 -
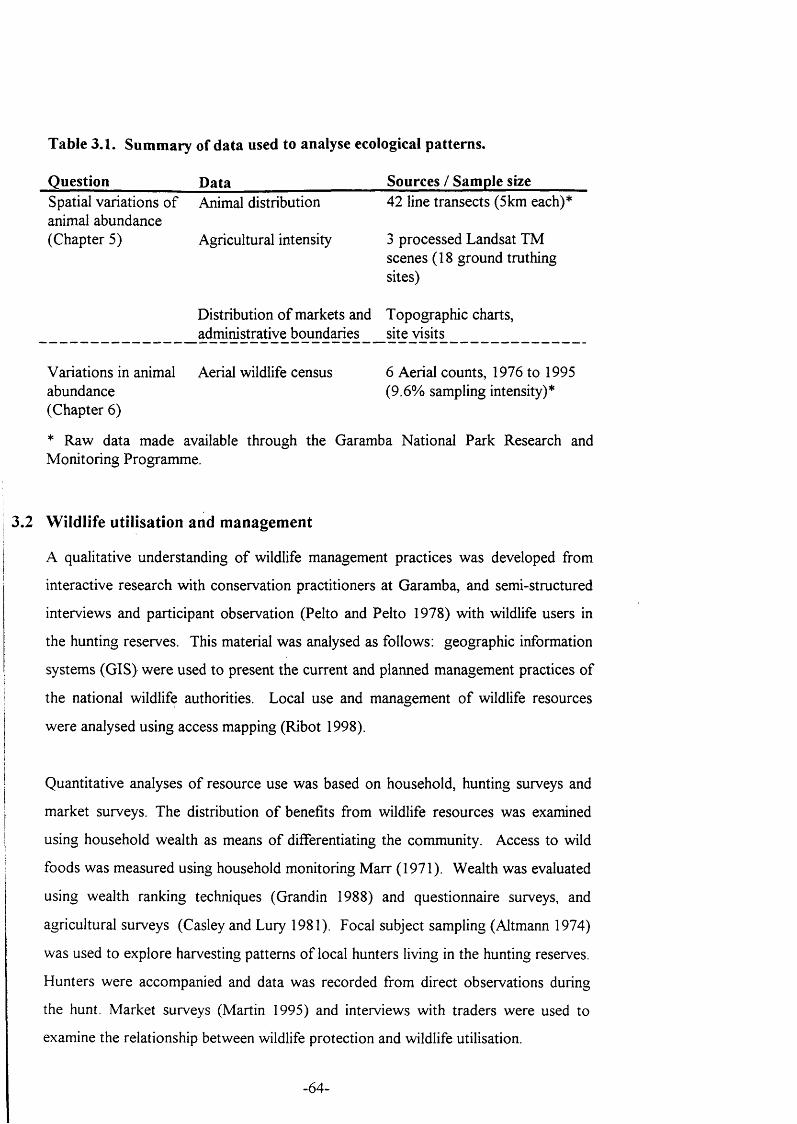
Table 3.1. Summary of data used to analyse ecological patterns.
Question__________ Data___________________ Sources / Sample size_______Spatial variations o f Animal distribution 42 line transects (5km each)*animal abundance(Chapter 5) Agricultural intensity 3 processed Landsat TM
scenes (18 ground truthing sites)
Distribution o f markets and Topographic charts,_____________________adnhni^r^iye boimdarie^___^lG_yisit^___________________
Variations in animal Aerial wildlife census 6 Aerial counts, 1976 to 1995abundance (9.6% sampling intensity)*(Chapter 6)
* Raw data made available through the Garamba National Park Research and M onitoring Programme.
3.2 W ildlife utilisation and management
A qualitative understanding o f wildlife management practices was developed from
interactive research with conservation practitioners at Garamba, and semi-structured
interviews and participant observation (Pelto and Pelto 1978) with wildlife users in
the hunting reserves. This material was analysed as follows: geographic information
systems (G IS) w ere used to present the current and planned management practices o f
the national wildlife authorities. Local use and management o f wildlife resources
were analysed using access mapping (Ribot 1998).
Quantitative analyses o f resource use was based on household, hunting surveys and
market surveys. The distribution o f benefits from wildlife resources was examined
using household wealth as means o f differentiating the community. Access to wild
foods was measured using household monitoring M arr (1971). Wealth was evaluated
using wealth ranking techniques (Grandin 1988) and questionnaire surveys, and
agricultural surveys (Casley and Lury 1981). Focal subject sampling (Altmann 1974)
was used to explore harvesting patterns o f local hunters living in the hunting reserves.
Hunters were accompanied and data was recorded from direct observations during
the hunt. Market surveys (Martin 1995) and interviews with traders were used to
examine the relationship between wildlife protection and wildlife utilisation.
- 64 -
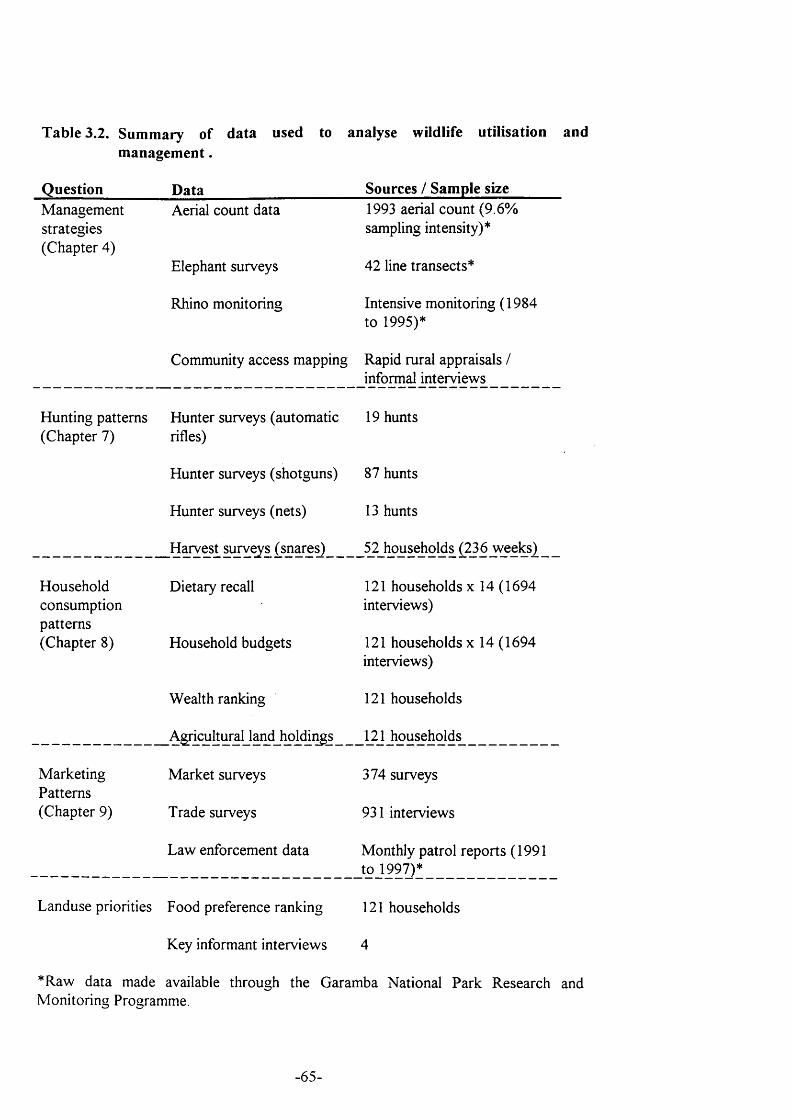
Table 3.2. Summary of data used to analyse wildlife utilisation and management.
Question Data Sources / Sample sizeManagement strategies (Chapter 4)
Aerial count data
Elephant surveys
Rhino monitoring
Community access mapping
1993 aerial count (9.6% sampling intensity)*
42 line transects*
Intensive monitoring ( 1984 to 1995)*
Rapid rural appraisals / informal interviews
Hunting patterns Hunter surveys (automatic 19 hunts(Chapter 7) rifles)
Hunter surveys (shotguns) 87 hunts
Hunter surveys (nets) 13 hunts
Harvest surveys (snares) 52 households (236 weeks^
Household Dietary recall 121 households x 14 (1694consumption interviews)patterns(Chapter 8) Household budgets 121 households x 14 (1694
interviews)
Wealth ranking 121 households
Agricultural land holdings 121 households
Marketing Market surveys 374 surveysPatterns(Chapter 9) Trade surveys 931 interviews
Law enforcement data Monthly patrol reports (1991 to 1997)*
Landuse priorities Food preference ranking 121 households
Key informant interviews 4
*Raw data made available through the Garamba National Park Research and Monitoring Programme.
- 65 -
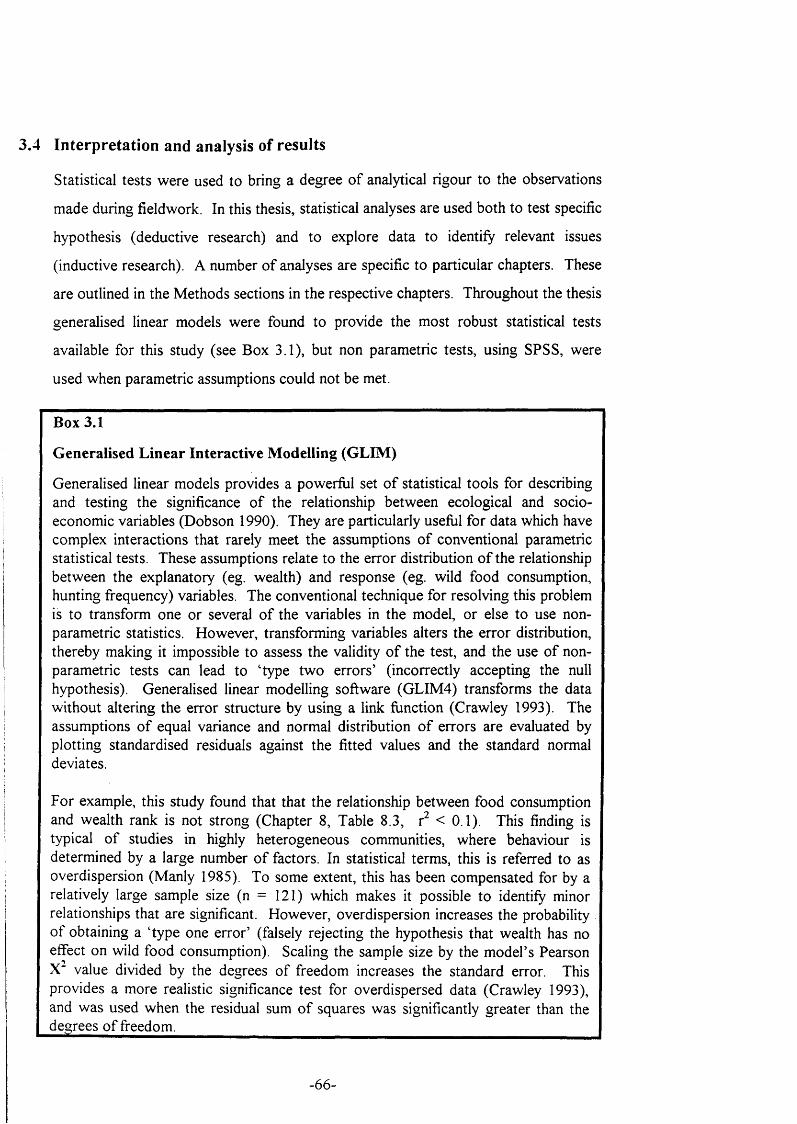
3.4 Interpretation and analysis of results
Statistical tests were used to bring a degree o f analytical rigour to the observations
made during fieldwork. In this thesis, statistical analyses are used both to test specific
hypothesis (deductive research) and to explore data to identify relevant issues
(inductive research). A number o f analyses are specific to particular chapters. These
are outlined in the M ethods sections in the respective chapters. Throughout the thesis
generalised linear models were found to provide the most robust statistical tests
available for this study (see Box 3.1), but non parametric tests, using SPSS, were
used when parametric assumptions could not be met.
Box 3.1
Generalised Linear Interactive Modelling (GLIM)
Generalised linear models provides a powerful set o f statistical tools for describing and testing the significance o f the relationship between ecological and socioeconomic variables (Dobson 1990). They are particularly useful for data which have complex interactions that rarely meet the assumptions o f conventional parametric statistical tests. These assumptions relate to the error distribution o f the relationship between the explanatory (eg. wealth) and response (eg. wild food consumption, hunting frequency) variables. The conventional technique for resolving this problem is to transform one or several o f the variables in the model, or else to use non- parametric statistics. However, transforming variables alters the error distribution, thereby making it impossible to assess the validity o f the test, and the use o f non- parametric tests can lead to ‘type two errors’ (incorrectly accepting the null hypothesis). Generalised linear modelling software (GL1M4) transforms the data without altering the error structure by using a link function (Crawley 1993). The assumptions o f equal variance and normal distribution o f errors are evaluated by plotting standardised residuals against the fitted values and the standard normal deviates.
For example, this study found that that the relationship between food consumption and wealth rank is not strong (Chapter 8, Table 8.3, r < 0.1). This finding is typical o f studies in highly heterogeneous communities, where behaviour is determined by a large number o f factors. In statistical terms, this is referred to as overdispersion (Manly 1985). To some extent, this has been compensated for by a relatively large sample size (n = 121) which makes it possible to identify minor relationships that are significant. However, overdispersion increases the probability o f obtaining a ‘type one error’ (falsely rejecting the hypothesis that wealth has no effect on wild food consumption). Scaling the sample size by the model’s Pearson X value divided by the degrees o f freedom increases the standard error. This provides a more realistic significance test for overdispersed data (Crawley 1993), and was used when the residual sum o f squares was significantly greater than the degrees o f freedom.____________________________________________________________
- 66 -
3.5 Research assistants and language
Interviews were conducted in French and Bangala. A number o f households spoke
only Pazande, in which case local interpreters were used. A team o f four local
researchers were used to assist with the market and household surveys. The research
assistants had all completed secondary education, but none had had prior research
experience. Training in interview and survey techniques was undertaken during the
pilot phase.
3.6 Research programme summary
This chapter has summarised some o f the techniques used to develop an
understanding o f the wildlife management strategies and their ecological and social
consequences. The research schedule for the study is as follows;
• October 1994 to April 1995
Literature review and development o f field methods. Existing ecological data from
Garamba were re-analysed and compiled (de Merode 1994, de M erode and
Likango 1995).
• April 1995 to October 1995
Pilot study and preliminary fieldwork, undertaken at Kiliwa, in the Dungu Refugee
settlements and at the National Park headquarters at Nagero. Relevant authorities
were visited and presentations were made at village markets. Pilot studies were
undertaken to test the feasibility o f the household and hunter surveys. In addition,
a training programme in GIS, remote sensing and statistics was organised and
carried out for ICCN research staff. Participatory analysis o f ICCN management
strategies at Garamba was undertaken at Nagero.
• November 1995 to February 1996
Analysis o f preliminary results and presentation o f a report outlining research
schedule for the remaining field work. Re-appraisal o f research methods.
- 67 -
• February 1996 to July 1996
Main research period undertaken in the Azande Hunting Reserve, at Kiliwa,
Dungu and Mamba. Household consumption was monitored over 8 months in
Kiliwa. M arket surveys were undertaken on a weekly basis in Dungu and Kiliwa.
Hunts were followed around Kiliwa and Mamba. Fieldwork was interrupted by
conflict in the region.
• August 1996 to July 1997
The data were analysed and the thesis was compiled in London.
• August 1997 to September 1997
Return to Congo to complete data collection and thank those who supported the
study.
• October 1997 to July 1998
The remaining data were analysed and the thesis was completed.
- 68 .
C hapter 4
C entralised and D evolved System s o f W ildlife M anagem ent and U tilisation at Garamba
4.1 Sum m ary
Chapters 1 and 2 described two levels o f wildlife management: centralised and
devolved. This chapter explores these two approaches using the results o f focused
enquiries during field work. The chapter presents a qualitative appraisal o f wildlife
management which sets the context for the subsequent analytical chapters. The
research was interactive and efforts were made to allow people to define and modify
the research agenda.
The first part o f the chapter explores the protectionist policy and practice o f the
wildlife authorities, supported by international donors. This was achieved through a
collaborative, GIS based planning and zoning exercise with wildlife officers and
project staff. Management zones are described, presenting present and future
management priorities for the protected area.
The second part o f this chapter examines the local systems wildlife management.
Participation in wildlife management is assessed by disaggregating the community to
understand who are the beneficiaries o f wild resource use and trade. This is achieved
by presenting bushmeat trade networks, or filières, developed from the technique o f
commodity access mapping (Ribot 1998). The filiè res reveal a sophisticated
management system with regulatory mechanisms based on control and patronage,
which is maintained by power relations between the groups.
- 69 -
Part I
C entralised w ild life p rotection in th e national park
4.2 Introduction
An understanding o f centralised wildlife protection was achieved by taking an active
part in the national park’s research and monitoring programme. The research project
presented in this thesis included a training programme for ICCN wildlife officers and
project staff in geographic information systems and data analysis. This exercise was
used as a basis for encouraging wildlife officers to outline the current and planned
wildlife management activities at Garamba.
Protected area management policy, to date, at Garamba is outlined in the ‘Draft
Framework Document for the development o f a Management Plan for Garamba
National Park’ produced in September 1995 (GNPP 1995). The document states that
the management o f the protected area centres around tw o objectives. First, a broader
“Development Objective” is to “maintain and develop the management capacity o f the
park” . Second, an “immediate objective” is to “reduce the level o f poaching to within
defined acceptable levels” . Acceptable levels were defined as a complete absence o f
rhino poaching, and no poaching in the southern part o f the park. Furthermore, levels
o f poaching throughout the national park had to be reduced to “below the levels
experienced in 1994” .
The approaches to implementing the above policies can be explored by examining the
conservation activities, both current and planned, that are listed in the framework
management plan (GNPP 1995). To this end. Figure 4.1 classifies park activities
according to whether they meet wildlife protection objectives (such as patrol support,
and infrastructural development in the Park), or local development objectives (such as
- 70 -
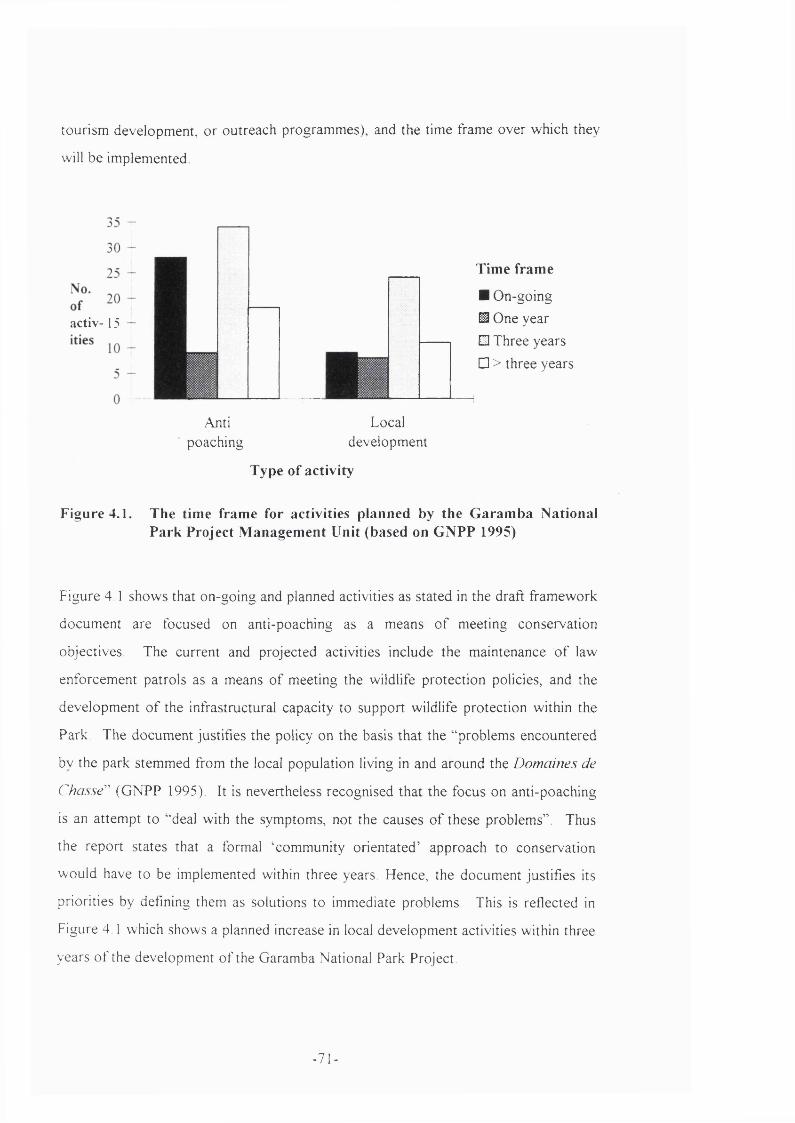
tourism development, or outreach programmes), and the time frame over which they
will be implemented.
a c t iv -15
T im e fram e
■ On-going ^ One year M Three years □ > three years
Antipoaching
Localdevelopment
T ype of activ ity
F igu re 4.1. T he tim e fram e fo r activ ities p lanned by the G a ra m b a N ational P a rk P ro jec t M anagem en t U nit (based on G N P P 1995)
Figure 4.1 shows that on-going and planned activities as stated in the draft framework
document are focused on anti-poaching as a means o f meeting conservation
objectives. The current and projected activities include the maintenance o f law
enforcement patrols as a means of meeting the wildlife protection policies, and the
development o f the infrastructural capacity to support wildlife protection within the
Park. The document justifies the policy on the basis that the “problems encountered
by the park stemmed from the local population living in and around the Domaines de
Chasse’’’' (GNPP 1995). It is nevertheless recognised that the focus on anti-poaching
is an attempt to “deal with the symptoms, not the causes of these problems” . Thus
the report states that a formal ‘community orientated’ approach to conservation
would have to be implemented within three years. Hence, the document justifies its
priorities by defining them as solutions to immediate problems. This is reflected in
Figure 4.1 which shows a planned increase in local development activities within three
years o f the development o f the Garamba National Park Project.
- 71 -
The results should be treated with some caution because they give no indication o f
the scale, in terms o f financial or other investment, o f a particular activity, nor o f the
likely impact o f those activities. Nevertheless, Figure 4.1 does reflect priorities as
defined by local management personnel. The time frame also indicates the priority
that is placed on a particular activity, although this may also be influenced by the
availability o f financial resources (a very costly, high priority activity may be planned
at a later date because the financial resources were not available at the time).
4.3 U nderstanding wildlife protection: management zonation o f the protected area
Central to planning the current conservation regime is the protectionist perspective o f
wildlife managers on local conditions and broader landscape characteristics. Thus, an
improved understanding o f policy formulation and implementation can be achieved by
examining the criteria they use to prioritise the zonation o f a protected area.
A simple decision support tool was developed as part o f this study to display the
distribution o f resources and other factors considered important by wildlife managers
(de M erode et a l 1996). GIS technology was used to facilitate the decision making
process by integrating a variety o f features related to the development o f land-use
policy, such as indicators o f ecological value and human presence. The outcome was
a protected area zonation which classified the landscape into optimal land use units
for meeting conservation objectives. The process is described below to illustrate the
development o f the protected area zonation at Garamba which reflects current
policies.
4.4 Data sources
The following types o f data were identified by a team o f three wildlife officers as
being important to develop an effective zonation map o f the protected area;
- 72 -
4.4.1 Rhino population status
The rhino population, as the main focus o f the research and monitoring programme,
has been intensively monitored since 1984 (Smith and Smith 1991). Regular data
collection is undertaken on rhino ecology and behaviour. A counting technique based
on individual recognition is used and positions are recorded from the ground or from
an aircraft to a precision o f at least one kilometre. Radio telegraphy has been used
over limited period using both radio collars and transmitters fixed in the rhino’s horns.
4.4.2 Illegal activities
These data are primarily collected by the national park guards and are collated by the
Park’s Research and Monitoring Programme. They provide information on illegal
activities encountered by guards patrolling the Park. The data collection techniques
are based on Bell (1984) and are analysed in greater detail in Chapter 10. They were
used as part o f the zonation to indicate the distribution and intensity o f illegal
activities in the national park.
4.4.3 Elephant distribution in the park and hunting reserves
The primary source o f data is derived from the systematic sampling aerial counts
flown over both the park and the reserves on a regular basis. These techniques are
described in detail in Chapter 6. As aerial count techniques do not provide accurate
elephant counts for areas o f high tree canopy cover, such as in the reserves, ground
transects measuring the frequency o f elephant faecal counts were used (Nicolas and
Ndey 1995; a description o f the techniques is provided in Chapter 5). These
produced an indication o f relative elephant distribution in the hunting reserves. The
data was interpolated to the whole reserve area using a weighted distance
interpolation (Eastman, 1995).
4.4.4 Human population distribution
No reliable demographic data exist for this area, and therefore hut counts made
during the aerial survey were used to estimate human population distribution. A
- 73 -
ground truthing exercise was carried out in the communities to determine the average
number o f people per hut (de M erode et a l 1996).
4.5 Results: data integration
Arc/Info and Idrisi GIS software were used to collate the data in a concise form that
could easily be interpreted. Figure 4.2 presents the integration o f extensive protected
area monitoring data into a single map, reflecting the Project Management Unit’s
understanding o f the processes taking place in the ecosystem. Poaching is
concentrated in the northern half o f the park, close to the border with Sudan. At the
time o f analysis, poaching was largely absent in the more intensively monitored rhino
sector in the south (depicted by an outer convex polygon joining the most peripheral
rhino observations, estimated to contain the rhino home range). The elephant
population is also concentrated in the south. In the hunting reserves, elephants were
taken to be a keystone species representing areas o f high conservation value. Human
population distribution is shown in the reserves, along with known refugee
settlements and those areas known to be exploited for gold.
Figure 4.3 represents a preliminary zonation based on these data. The management o f
the park is entirely focused on anti-poaching. A rhino sector is contained within the
central southern area, which is intensively monitored and patrolled. It can change in
size according to the ranging behaviour o f the rhino population. A central northern
area is covered by two northern sector patrols. This area acts as a buffer to prevent
the high levels o f poaching in the north o f the national park from impacting on the
rhino sector. To the north o f this is a peripheral area that is effectively abandoned as
far as patrolling effort is concerned because the area is considered excessively
dangerous for guards on patrol.
The hunting reserves are considered important by the wildlife authorities for the
management o f the park, but are not actively managed because o f limited resources.
Several project proposals have been developed to initiate conservation activities in the
hunting reserves by the wildlife authorities. To manage the hunting reserves two land
- 74 -
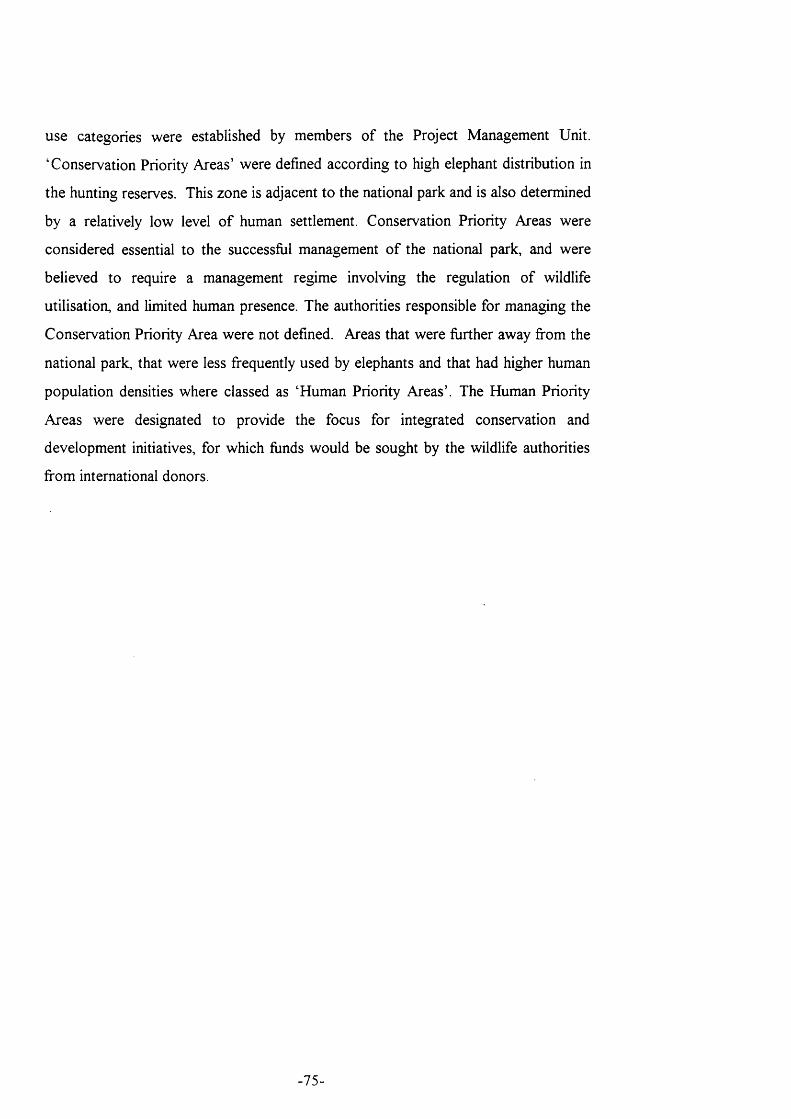
use categories were established by members o f the Project Management Unit.
‘Conservation Priority Areas’ were defined according to high elephant distribution in
the hunting reserves. This zone is adjacent to the national park and is also determined
by a relatively low level o f human settlement. Conservation Priority Areas were
considered essential to the successful management o f the national park, and were
believed to require a management regime involving the regulation o f wildlife
utilisation, and limited human presence. The authorities responsible for managing the
Conservation Priority Area were not defined. Areas that were further away from the
national park, that were less frequently used by elephants and that had higher human
population densities where classed as ‘Human Priority Areas’. The Human Priority
Areas were designated to provide the focus for integrated conservation and
development initiatives, for which funds would be sought by the wildlife authorities
from international donors.
- 75 -
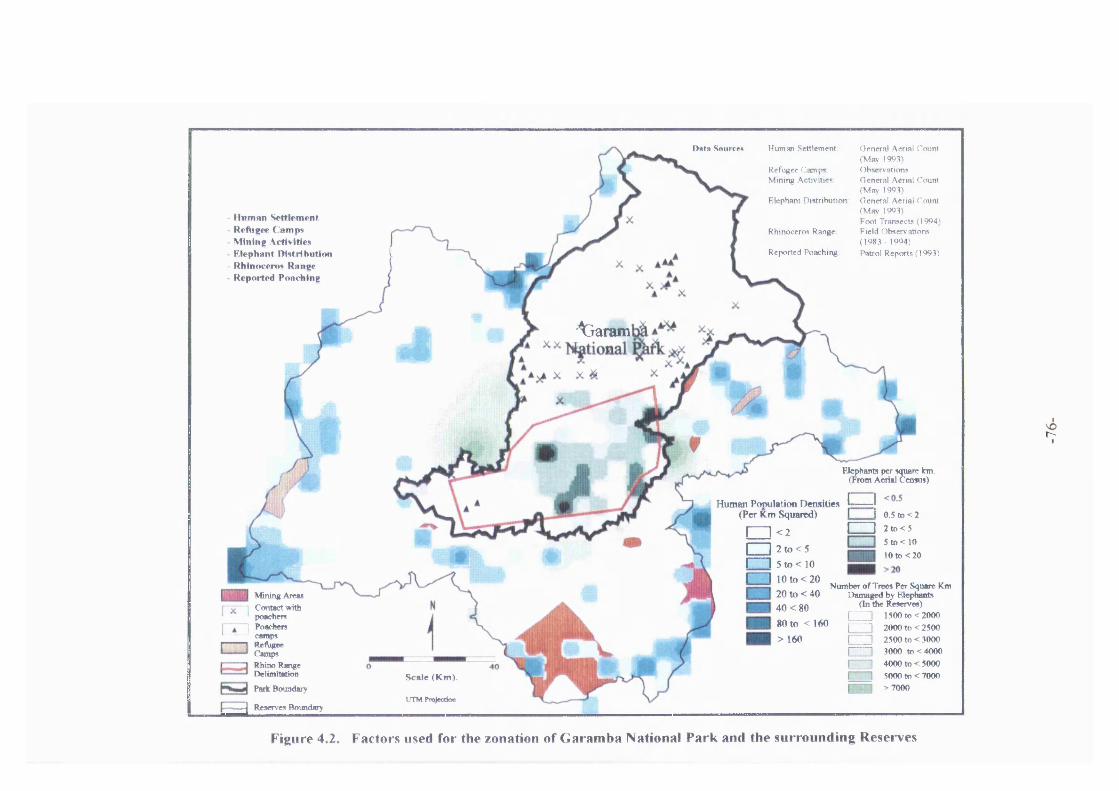
Data Source»
Hiimnn Settlement Reftigee ('ampa Mining Activities Elephant DIstrihution Rhinoceros Range Reported Poaching
H u m » i S e tt le m e n t
R e fu g e e C a m p s M in in g A c tiv i t ie s
E le p h a n t D is t r ib u t io n
R h in o c e r o s R a n g e
R e p o r te d P o a c h in g
G e n e ra l A e r ia l C o u n t (M a y 1 9 9 ^ ) O b s e rv a t io n s G e n e ra l A e ria l C o u n t (M a y 1 9 9 1 )G e n e ra l A e r ia l C o u n t (M a y 1 9 9 1 )F o o t T ra n s e c ts (1 9 9 4 ) F ie ld O b s e rv a t io n s (1 9 8 3 - 1 9 9 4 )
P a tro l R e p o r t s (1 9 9 3 )
^aram
Mining Areas Contact with poachers
1 Poachers camps
I 1 RefugeeCamps Rhino Range Delimltadon Scale (Km).
UTM ProiecdoaPark Boundary
Elephants per square km. (From Aerial Census)
^ Human Ptmulalimi Densities | -----1 ^(Per Km Squared) I 1 0.5 to < 2
I 1 < 2 C Z ] 2 t o < 5
□ □ 2 to < 5 I I 5 to < 10 r~~ l 10to <20
20 to < 40 40 <80 80 to < 160 >160
5 to <1010 to <20
Number of Trees Per Square Km Damaged by Rlt^thants
(In die Reserves)1500 to <2000 2000 to <2500 2500 to <3000 3000 to <4000 4000to<5000 5000 to < 7000 >7000
r-
-j^2^smves^oimdi^
Figure 4.2. Factors used for the zonation of G aram b a N ational P a rk and the su rround ing Reserves
Scale (Km).
C entral South
C entral N orth
Peripheral North
R hino Sector
W ildlife Priority Area
H um an Priority Area
Potential C onflict A reai in the Reserves
M ain Roads
Secondary Roads
M ain R ivers
r--
Figure 4.3. Defined M anagement Zones in G aram ba National P ark and surrounding hunting reserves.
P art II
D evolved W ildlife M anagem ent in th e A zande H u ntin g R eserves
4.6 Background
This section summarises wildlife utilisation and management in the hunting reserves.
The data were collected during a period o f nine months living in Kiliwa village. The
broad objective was to develop an understanding o f the social groups that had a stake
in wildlife utilisation and the power relations that had developed over access to
bushmeat resources. The investigation revealed a number o f internal regulatory
mechanisms relating to the exploitation o f wildlife. This supports the notion that, as a
resource, wildlife is actively managed by key groups amongst the local residents.
Wildlife management is driven by significant financial incentives for trading in
bushmeat. Thus, wildlife management by local residents in the hunting reserves can
be described in term s o f both the local participation and market driven paradigms
described in Chapter 1. This section serves only as a summary, because the
relationship between wildlife populations and resource use and management is
explored in greater detail in subsequent chapters.
4.7 Developing an understanding of local resource use: the bushmeat com m odity chain
The activities and relations that surround the use o f wildlife resources can be
understood in terms o f the bushmeat commodity chain. In his analysis o f the charcoal
trade in Senegal, Ribot (1998) describes a commodity chain as an ensemble o f
interlinked exchanges through which a product passes from when it is harvested until
it is traded and finally consumed. The commodity chain approach to studying trade in
resources represents a departure from formal neoclassical approaches to economic
- 78 -
modelling as the emphasis is on power relations rather than supply and demand. This
approach is increasingly used to understand the reality o f peoples’ livelihoods in
countries, such as Congo, where economic activities have been driven underground
by constraints o f a ""parasitic" formal economy. Tracing commodity flows has been
used successfully to ""analyse the connections between individual survival strategies,
wider social networks and the macrolevel political economy ” (Nkera and Grundfest
Schoepf 1991). This provides a useful basis to understand the socio-political context
o f wildlife utilisation in order to explore the management practices that have evolved
around what seems to be a highly lucrative trade.
The commodity chain approach was used here to contextualise the use o f wildlife
within relevant social relations and hierarchies. This engenders a broad approach to
wildlife regulation. A formal de ju re analysis o f the regulatory mechanisms that
determine wildlife utilisation would emphasise the role o f the state, and in particular
the wildlife authorities. However, an accurate understanding o f wildlife regulation
can only be understood by considering the broad spectrum o f socially mediated
restrictions on access to resources.
4.8 M ethods
The field work techniques used to understand access to, and control of, wild
resources were initially based on a selection o f Rapid Rural Appraisal (RRA) tools
widely used in development interventions. These included mapping, ranking and
scoring o f different wild resources to understand the constraints to people’s resource
use (FAO 1989, Chambers 1993). The research was undertaken with focal groups,
and three sessions were completed during the initial phases o f the field work. The
work produced valuable insights into people’s harvesting and trading patterns, but
was felt to be intrusive and demanding o f participants’ time. While the time expected
o f participants might be justified in the context o f a development intervention which
promises tangible benefits for the participants, such outcomes could not be provided
in this case. Instead, a semi-structured enquiry was undertaken over a prolonged
period consisting o f regular, informal interviews with a range o f individuals who were
- 79 -
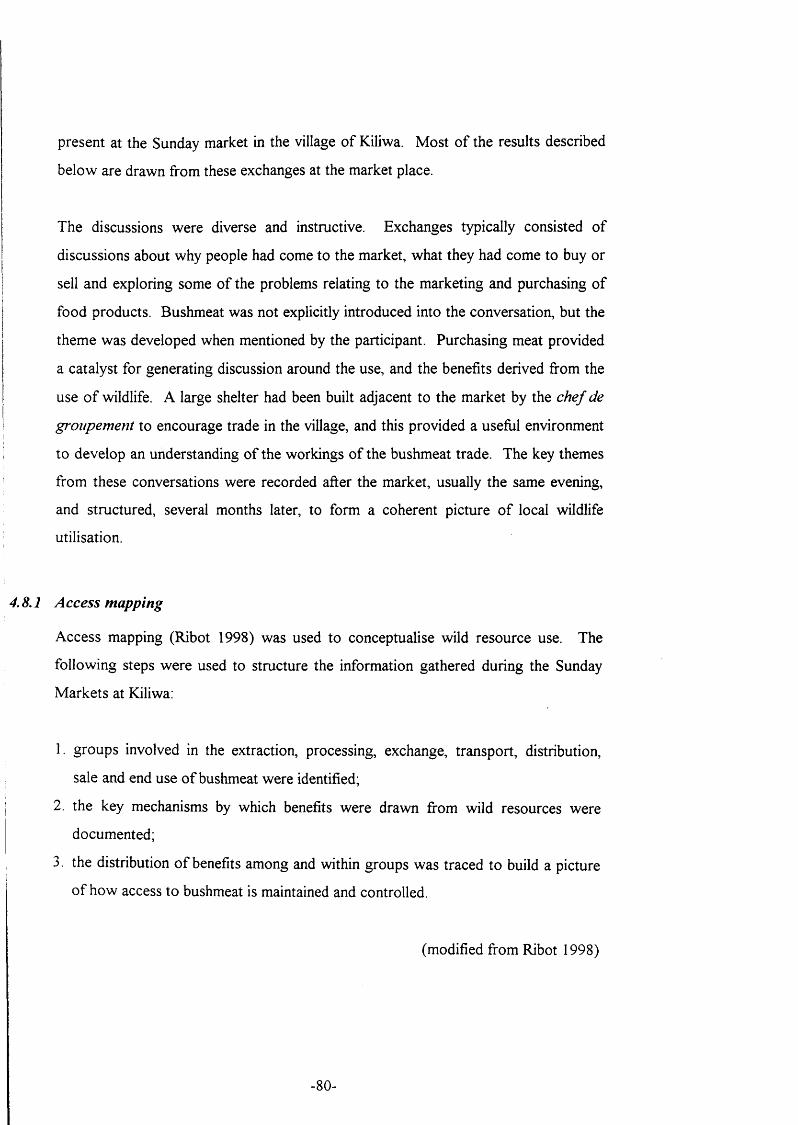
present at the Sunday market in the village o f Kiliwa. M ost o f the results described
below are drawn from these exchanges at the market place.
The discussions were diverse and instructive. Exchanges typically consisted o f
discussions about why people had come to the market, what they had come to buy or
sell and exploring some o f the problems relating to the marketing and purchasing o f
food products. Bushmeat was not explicitly introduced into the conversation, but the
theme was developed when mentioned by the participant. Purchasing meat provided
a catalyst for generating discussion around the use, and the benefits derived from the
use o f wildlife. A large shelter had been built adjacent to the market by the ch e f de
groupem ent to encourage trade in the village, and this provided a useful environment
to develop an understanding o f the workings o f the bushmeat trade. The key themes
from these conversations were recorded after the market, usually the same evening,
and structured, several months later, to form a coherent picture o f local wildlife
utilisation.
4.8.1 A ccess m apping
Access mapping (Ribot 1998) was used to conceptualise wild resource use. The
following steps w ere used to structure the information gathered during the Sunday
M arkets at Kiliwa;
1. groups involved in the extraction, processing, exchange, transport, distribution,
sale and end use o f bushmeat were identified;
2. the key mechanisms by which benefits were drawn from wild resources were
documented;
3 the distribution o f benefits among and within groups was traced to build a picture
o f how access to bushmeat is maintained and controlled.
(modified from Ribot 1998)
- 80 -
4.9 Findings: wildlife benefits, access and control
This section outlines the benefits, or value, drawn from wildlife resources by the key
groups described above. Ribot (1998) underlines the fact that ‘value’ can take
multiple forms, such as ''currencies, symbols, other persons, ... or any object o f
appropriation or iise'\ In this study cash income and profits are used as the primary
measures o f the benefits derived from wildlife. These provide useful measures o f the
benefits, can be discussed with members o f the local populations, and can easily be
analysed. Nevertheless, a number o f other benefits are associated with wildlife
utilisation, such as prestige and the recreational value o f hunting. A number o f
secondary benefits also exist. These arise from the way in which wildlife is exploited,
including factors such as immunity from prosecution through developing social
networks that provide privileged rights o f access for key individuals. This increases
demand for wildlife and adds financial value to bushmeat for those key individuals.
The main groups identified, and the mechanisms used to maintain access to, and
manage, the resource are described below. The patterns described are outlined
graphically in Figure 4.4.
4.9.1 Producers
Hunting appears to be exclusively undertaken by men. The techniques used are
diverse, as are the derived benefits. Hunting ranges from small scale harvesting, using
traditional techniques such as nets and snares, to the extraction o f large volumes o f
meat by targeting the larger, protected mammals using automatic rifles. The latter
requires a high level o f organisation (see Chapter 9).
Armed groups from Sudan are considered to be important users o f wildlife. They are
believed to hunt mainly in the park, but pass regularly through Kiliwa to trade
supplies in Dungu. It was alleged that a number o f Kiliwa households facilitated the
activities o f poaching groups by providing porters and safe houses {maisons
d'acceuil), where arms and ammunition could be stored to minimise the risk o f
encounters with Congolese authorities. None o f the individuals encountered during
- 81 -
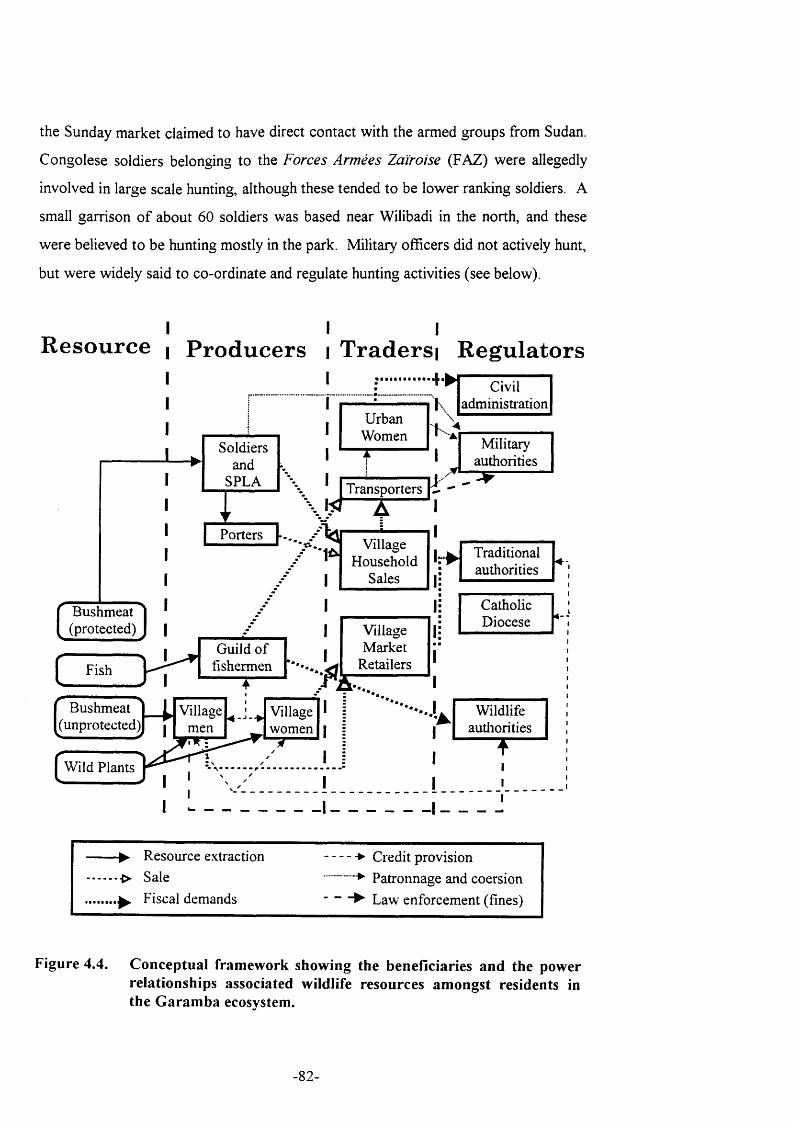
the Sunday market claimed to have direct contact with the armed groups from Sudan.
Congolese soldiers belonging to the Forces Armées Zaïroise (FAZ) were allegedly
involved in large scale hunting, although these tended to be lower ranking soldiers. A
small garrison o f about 60 soldiers was based near Wilibadi in the north, and these
were believed to be hunting mostly in the park. Military officers did not actively hunt,
but were widely said to co-ordinate and regulate hunting activities (see below).
R esource Producers i Traders i R egulators I : . . . . . . . . . . . 4 - H
Transporters
4 -
Porters
Villagemen
Villagewomen
Fish
V»Wild Plants
Bushmeat(protected)
Guild of fishermen
CatholicDiocese
Traditionalauthorities
Militaryauthorities
Civiladministiation
Wildlifeautliorities
Bushmeat(unprotected)
UrbanWomen
Soldiersand
SPLA
VillageHousehold
Sales
VillageMarket
Retailers
-► Resource extraction • ■> Sale^ Fiscal demands
-► Credit provision ► Patronnage and coersion
► Law enforcement (fines)
Figure 4.4. Conceptual framework showing the beneficiaries and the power relationships associated wildlife resources amongst residents in the Garamba ecosystem.
- 82 -
4.9.2 Traders
There appear to be two clearly defined parallel trade networks operating from Kiliwa.
Small scale hunters usually sell a proportion o f hunted meat directly at the village
market, the remainder being kept for household consumption. This trade is open and
considered to be authorised by the law. Nevertheless, on the few occasions when
national park guards were present in the village, the stalls used for selling meat were
empty.
A more important trade was said to operate outside the Kiliwa markets. Two groups
o f traders use Kiliwa as a base for trading in meat from large mammals. First, a small
group o f relatively wealthy women are the main actors selling bushmeat in urban
markets. These women come to Kiliwa from the town o f Dungu accompanied by
groups o f up to fifteen male porters on bicycles. They exchange meat for
commodities that are imported from Uganda, such as soap and clothing. It was
alleged that a small number o f households in the village sell large quantities o f meat to
these women on a regular basis. The meat consists largely o f protected species that
has been procured outside the village, close to, or within the national park. The
exchange is concealed and it was difficult to identify the participating households.
However, the women traders from the town appear to make little effort to conceal
their activities and it was alleged that they had close ties with military officers in the
town.
Second, are village meat traders who appear to conceal their activities because they
are acting as agents for the bushmeat hunters who hunt illegally. These bushmeat
hunters are men who have access to automatic rifles and are able to kill large
protected mammals. The SPLA hunters, in particular, were believed to sell their
products through village traders because their presence in Congo was illicit. Both the
hunters and the village traders risk prosecution if they bring their products directly to
the urban markets - especially as they would then be competing with the urban
women traders. Instead, they sell their meat to urban women traders at a much
reduced rate. Thus, Kiliwa served as a trading post where ‘illegal’ meat was sold to
women who were able to bring the meat to the urban markets without fear o f
- 83 -
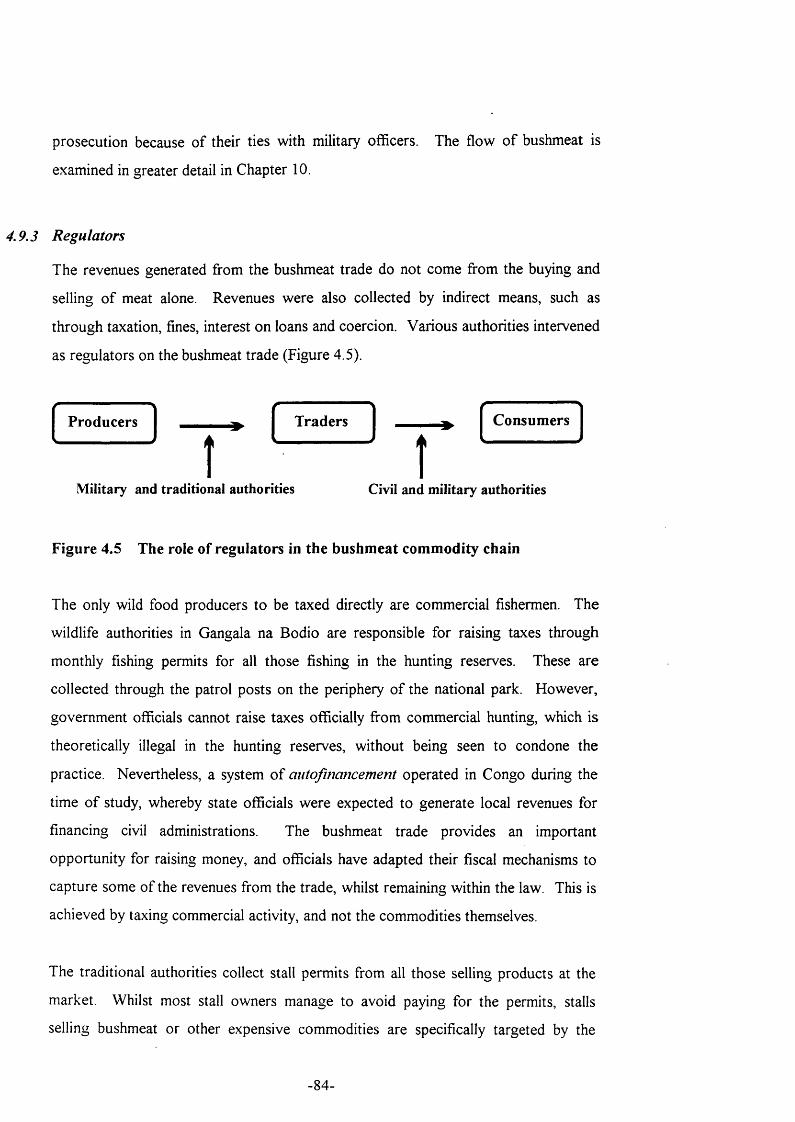
prosecution because o f their ties with military officers. The flow o f bushmeat is
examined in greater detail in Chapter 10.
4.9.3 Regulators
The revenues generated from the bushmeat trade do not come from the buying and
selling o f meat alone. Revenues were also collected by indirect means, such as
through taxation, fines, interest on loans and coercion. Various authorities intervened
as regulators on the bushmeat trade (Figure 4.5).
Producers Traders
Î —
Consumers
Military and traditional authorities Civil and military authorities
Figure 4.5 The role of regulators in the bushmeat commodity chain
The only wild food producers to be taxed directly are commercial fishermen. The
wildlife authorities in Gangala na Bodio are responsible for raising taxes through
monthly fishing permits for all those fishing in the hunting reserves. These are
collected through the patrol posts on the periphery o f the national park. However,
government officials cannot raise taxes officially from commercial hunting, which is
theoretically illegal in the hunting reserves, without being seen to condone the
practice. Nevertheless, a system o f autofinancement operated in Congo during the
time o f study, whereby state officials were expected to generate local revenues for
financing civil administrations. The bushmeat trade provides an important
opportunity for raising money, and officials have adapted their fiscal mechanisms to
capture some o f the revenues from the trade, whilst remaining within the law. This is
achieved by taxing commercial activity, and not the commodities themselves.
The traditional authorities collect stall permits from all those selling products at the
market. Whilst most stall owners manage to avoid paying for the permits, stalls
selling bushmeat or other expensive commodities are specifically targeted by the
- 84 -
ch ie fs officers, and rarely avoid paying the tax. In Kiliwa, local taxes were used to
maintain the ch iefs personnel, which included a clerk and five gendarmes. Fiscal
benefits also extended to other members o f the village: the stall permit revenues were
used to maintain the local school, and a dispensary was built at Paika, about 15
kilometres to the north o f Kiliwa using stall permit revenues.
Commercial taxes are imposed by the Civil authorities in Dungu. The town o f Dungu
is the administrative centre for the Zone de Dungu, and a significant number o f civil
servants reside in the town. Revenue for this administration is secured by imposing
taxes on commercial activities in the town. The fiscal arrangements are similar to
those in the villages, but on a larger scale. Bushmeat itself is not taxed because it is
technically illegal to exploit bushmeat. Nevertheless, bushmeat traders are specifically
targeted by tax collectors because the revenues generated from the sale o f meat are
considered to be exceptionally high.
At the time o f study, military personnel benefited from the sale o f meat by coercing
traders into relinquishing money or possessions. Road blocks were established
regularly and travellers were stopped. The amount o f money handed over to the
soldiers managing the road block usually depended on a prolonged process o f
negotiation. Not all travellers were stopped, but those with visible signs o f wealth,
such as traders, would normally be required to provide money or other possessions.
Fines also provide revenue for wildlife authorities. W hereas the fines imposed by
military personnel covered a range o f offences, including the sale o f bushmeat,
wildlife authorities were known only to have fined individuals for fishing without
licences. Less frequently, an individual might be found in illegal possession o f an
automatic rifle by the wildlife authorities. This would also result in the offender being
fined.
This study also revealed that conflict over control o f the markets existed between the
various levels o f authority. This had significant implications for the organisation o f
the bushmeat trade. Discussions with the chief in Kiliwa revealed that he actively
discouraged a military presence in the village military by writing to senior officers in
- 85 -
Dungu and Isiro to denounce specific acts o f indiscipline on the part o f soldiers in his
groupement. There are two reasons for this: first, during the late stages o f the
M obutu regime the FAZ rarely received their salaries. The incapacity o f lower
ranking soldiers to engage in alternative income generating activities resulted in the
regular pillaging o f the civilian population. Consistent remarks such as ""les FAZ ne
sont la que pour nous ravire nos biens'' suggest that this habit in the military in the
region had become institutionalised. Regular complaints to the chief by people from
the village placed him under pressure to address the problem. Indeed, during the
period o f study, two local chiefs from the region, including the senior C hef de
Collectivité, were suspended for their alleged ineptitude in addressing local needs.
Second, the presence o f the military discouraged local trade. This was pointed out by
the chief himself, who claimed that since 1988, when he began addressing the problem
o f indiscipline in the military, three new markets were established in the area. This
substantially increased his earnings from stall taxes.
There was obvious evidence for the authority o f the chief over lower ranking soldiers.
He hosted soldiers staying overnight in the village, fed them and provided them with
shelter. In so doing, he closely supervised their activities during their presence in the
village. On four occasions during my field work, I found myself engaged in
unpleasant discussions with soldiers over how much money I was carrying. In each
case it was possible to resolve the issue by suggesting that the chief should intervene.
The outcome o f these power relations between the military and the traditional
authorities in Kiliwa was that soldiers trading in bushmeat were discouraged from
passing through the village. This further reinforced the role o f women traders, who
had privileged access to bushmeat producers as a result o f their relationships with
senior ranking military officers.
A system o f patronage exists between hunters and wealthier individuals in the
population. The system o f patronage also involved hunters being provided with
credit or equipment to hunt. Military officers were said to act as patrons for large
numbers o f hunters, who are given rifles and ammunition and immunity from
- 86 -
prosecution by the military. Hunting can involve a high level o f risk, particularly
when meat is obtained from the national park. The client-patron relationships allow
wealthy individuals to benefit from the revenues generated by wildlife utilisation while
significantly reducing the risks involved in illegal hunting. The hunters benefit from
the credit that is made available, together with a level o f protection provided by the
patrons who often hold positions o f authority.
Another source o f credit was the Catholic Diocese. The credit that is made available
by the diocese is not specifically targeted to hunters. However, relatively high rates
o f interest have to be paid on the loans, and bushmeat is an important income
generating activity that can be used to service the loan.
4.10 Discussion
The mapping o f benefits down the commodity chain, from the hunt to the urban
market, shows that the resource use activities are varied in their socio-economic,
ecological and geographical characteristics. Two geographical scales can be
identified. One operates at the village level and targets small locally procured species,
which are used for domestic consumption or for trade in the local market. The
second operates on a much larger scale. This trade network targets larger mammals,
particularly where they are most abundant, such as in the national park. This form o f
resource use involves an assortment o f social groups with differing access to and
control over the flow o f resources. M eat is a high value commodity and different
parts o f that value are captured at several stages in the flow o f resources from its
extraction to its consumption. Different sectors o f the community are represented at
different stages o f the commodity chain. These are discussed below in terms o f the
different social groups by wealth, gender and origin. This is followed by a discussion
on informal wildlife regulations and their implications for conservation.
4.10.1 Wealth
The residents in the hunting reserves are highly differentiated in terms o f wealth. The
wealthiest sectors o f the community, such as the urban traders, or those in positions
- 87 -
o f authority are largely based in the urban centre in Dungu. Generally, they are not
directly involved in the extraction o f bushmeat. Instead, they use their authority, or
their connections with people in authority, to control the most lucrative links in the
trade: access to the urban markets and the taxes and fines that are imposed on
smaller scale traders. In the village, bushmeat is largely used for subsistence
purposes, with some being sold in the local market. While a number o f people in
Kiliwa use and trade bushmeat, the poorest members o f the community rarely have
access to bushmeat resources: they do not possess the capital to buy the rifles or
snares required to hunt animals, and do not have a sufficient income to purchase meat
at the market. The patterns o f wild resource use in relation to wealth at the village
level are examined in Chapter 8.
4.10.2 Gender
Hunting is primarily a male dominated activity. The male bias in hunting appears to
be a feature o f many cultures. Bailey and Aunger (1989), provide an exception when
they describe the strong participation o f women in net hunting in the Ituri Forest in
Congo. Net hunting is practised around Garamba, and large groups are usually
involved, but women were never present at the hunts observed during this study.
But, women are not excluded from the benefits that bushmeat offers. W omen’s
participation in the bushmeat trade appears to be greater than that o f men. At the
village level, most o f the bushmeat procured by village hunters is said to be consumed
by the hunter’s household. Women are prominent traders in the markets, both at the
village level and trade to urban markets. Indeed, observing people’s activities at the
Sunday markets in Kiliwa suggests that the market is a social forum for men and a
commercial centre for women: while the men congregate at the periphery o f the
market, women appear to manage most o f the stalls.
However, it is unclear whether the distribution o f the profits after the market benefits
the women. This point is raised by MacGaffey (1991), who suggests that Congolese
commercial society is exceptionally male biased. This bias is enshrined in the Family
Code o f Congo (Decret 87-010), which states that a wife must relinquish her
- 88 -
belongings to her husband if he can show that her ownership o f assets 'portent
atteinte à Vharmonie et aux inérêts péciiniraires du ménage In practice, this gives
men the legal basis to control their wives’ assets. So, while women are prominent in
the trading o f bushmeat commodities between Kiliwa and Dungu, they consisted o f
only a small group (almost certainly fewer than 12) who were, in any case, tied into
highly restrictive client-patron relationships with male military officers.
4.10.3 Residency
The groups benefiting from wild resources in the Azande hunting reserve are
differentiated according to whether they reside locally or elsewhere. The larger
proportion o f the financial benefits that are derived from the use o f wildlife are
collected by non residents. Local hunters tend to select smaller mammals, with
correspondingly lower returns. In contrast, hunters who exploit large mammals
usually hunt far from their place o f residence. Chapter 9 describes the characteristics
o f hunters in Kiliwa. Only one hunter from the sample o f 128 households studied in
Kiliwa (see Chapter 8) was recorded as exploiting large mammals. Trade in bushmeat
was described as operating at tw o levels. At the village level, small mammals such as,
duikers and primates, were marketed openly. At another level, greater volumes o f
meat that were derived from larger protected mammals were passing through Kiliwa
as a concealed trade. Urban traders operating through Kiliwa acquired most o f the
meat for the Dungu markets and beyond, and the considerable fiscal revenues and
fines extracted from these traders were drawn on by non-local authorities (the civil
and military authorities in Dungu).
This pattern o f wildlife use is not uncommon and has been described elsewhere:
Colell et a l (1995) data from Equatorial Guinea show that only a small proportion o f
bushmeat (less than 10%) is retained at the village level, and that this is composed
largely o f the smaller mammals. Colyn et a l (1987) also suggest that larger, more
lucrative mammals are rarely exploited at the village level in Congo. Juste et a l
(1995) explain the emphasis on urban markets not in terms o f availability, but because
' "goes against the household’s harmony and monetary interests" (MacGaffey’s translation)
- 89 -
o f the significantly greater purchasing power, and therefore demand for meat, in the
urban markets.
4.10.4 Informal regulation
From the point o f view o f this research, perhaps the most interesting aspect o f this
study o f bushmeat commodity chains, and the power relations governing access, is the
influence o f regulators, namely the traditional, civil and military authorities. What
was evident from the observations was that the power relations were dynamic and
sometimes volatile “/« what were clearly changing and open, rather than stable and
closed social system s” (Guyer 1993); for example, the influx o f automatic weapons
into the region following the periods o f intense conflict around Yambio and Maridi in
1990 and 1991 was said to have broadened local involvement in the bushmeat trade
because a wide range o f men were able to access these weapons and substantially
increase their harvests. This is said to have reduced the ability o f regulators to tax
those exploiting wildlife because the various authorities could not identify those
exploiting wildlife (chef Sangbalenzepers comm.).
Between 1991 and 1996 the park, military and traditional authorities were involved in
the recovery o f automatic weapons. Over two hundred automatic weapons were
known to have been recovered from the Azande hunting reserve during this period.
With reduced access to automatic weapons, those exploiting wildlife were more
evident to the authorities. Increased demand led to higher profit margins which could
contribute to tax revenue, and to servicing client-patron relationships between hunters
and traders and military officers. Changing power relations are examined
quantitatively in Chapter 10 where the flows o f bushmeat are analysed during periods
o f peace and conflict. During periods o f conflict, the ability o f the state wildlife
regulatory body (ICCN) to control trade in bushmeat was almost non existent. This
provides an opportunity to study the dynamics o f resource use, and the changes that
occurred in how the traders were dealing with hunters in the absence o f various key
regulators.
- 90 -
There is a growing debate in the anthropological literature on the nature o f wealth
and the pathways o f commodities through differentiated social systems. This can be
helpful in understanding the particular role that bushmeat represents for local elites.
For example, an interesting analogy can be drawn between the pre-colonial iron
smelting industry described by Guyer (1993) and the production and acquisition o f
bushmeat. Both are high prestige enterprises. Thus, the value o f labour, or ''se lf
realisatiori" (Guyer 1994) is high for these commodities. This value is out o f
proportion with their market value, and, as de M aret (1985) points out, the
ironmaster and blacksmith have considerable prestige which is associated with
chieftaincy in several parts o f central Africa. A changing economic and political
environment has altered the ‘prestige’ associated with many commodities such as, for
example, the processing o f iron among the Azande:
was one thing to marry a g irl with twenty spears when it was
extremely difficult to gain possession o f them. I t was another thing when
spears could be bought at a shop fo r ten piastres each and the whole
twenty could be bought by money earned by about two months ’ labour in
the service o f a European administrator. ”
(Evans Pritchard 1967)
In the case o f bushmeat, however, the control o f the trade is almost inseparable from
real authority, and more so than any other commodity, other than gold (chef
S^ngbdXtnzQ pers com m .). Bushmeat is a prestigie us-commodity, and the mGentwe-to -
- 91 -
4.11 Conclusion
It is commonly assumed that wildlife management only occurs when it is underwritten
by external aid interventions. This is reflected in the emphasis that is placed on
project work in a number documents that review conservation and development
issues (e.g., TIED 1995, NRI 1997). Some wildlife management activities at Garamba
are underwritten by external aid interventions. Currently these are concentrated
within the national park and focus on wildlife protection based on the ‘fortress
conservation’ model. However, wildlife protection by a government authority, with
technical and financial support from external aid agencies, constitutes only one aspect
o f the wildlife management practices undertaken in the Garamba ecosystem. This
chapter has shown that community based wildlife management, in the form o f
bushmeat utilisation and its associated socially defined regulatory mechanisms,
occurs alongside the protectionist activities o f the national park authorities. Groups
o f individuals residing in the hunting reserves practise forms o f wildlife management
that are both community based and market driven. The remainder o f the thesis
explores some o f the ecological and socio-economic consequences o f the various
forms o f wildlife management in the national park and surrounding reserves.
- 92 -
C hapter 5
S p atia l V ariations o f A nim al A bundance.
5.1 Summary
This chapter uses quantitative and statistical analyses o f wildlife census and remotely
sensed data to explore the relationship between human activity and the distribution o f
wildlife populations. Broad scale ecological patterns are explored in relation to three
variables which are used to describe human activity: the presence o f agricultural
communities, proximity to urban markets and proximity to effective wildlife
conservation areas. The analysis takes advantage o f the spatial heterogeneity o f the
hunting reserves to examine variations in mammal presence and community structure
under differing levels o f human activity. The area studied was extensive and wildlife
sampling and satellite image processing techniques were used to generate data on
wildlife distribution and the explanatory factors. The results show complex patterns
because o f the diversity o f the species assemblage. Nevertheless, it can be shown that
the distribution and abundance o f wild mammals are significantly affected by the
National Park, but not by the presence o f agricultural populations.
- 93 -
5.2 Introduction
There are two dominant paradigms in Afncan wildlife conservation. One restricts the
use o f wildlife. This approach is centrally controlled and usually involves the
application o f wildlife regulations through law enforcement in protected areas. The
other approach is driven by economic considerations associated with human
subsistence and commercial demands. Much debate has questioned the utility o f
protected areas, and an array o f ecological, ethical and economic criteria have been
used to justify these arguments (IIED 1993, Western and Wright 1994). This
research contributes to the debate by examining the influence that differing levels o f
human activity have on wildlife distribution and abundance.
The mammal populations o f the Garamba ecosystem are influenced by a variety o f
human related factors. This provides a good basis for assessing the impact o f human
presence and utilisation on wildlife populations. In the National Park, an active law
enforcement programme has been implemented for several decades. In the Hunting
Reserves, surrounding the National Park, wildlife is not actively protected. These
areas contain resident human populations who hunt and market wild mammals with
varying degrees o f intensity. There are significantly higher large mammal densities in
the National Park than in the surrounding Reserves (Hillman Smith 1989). . Aerial
count data have shown that there are statistically significant differences between
selected large mammals densities in the Park and in the Reserves (Table 5.1).
However, it is not clear how much o f the difference can be attributed to wildlife
protection, because there are also important habitat differences between the two areas
which may influence animal abundance. For instance, Hillman Smith et a l (1995)
have shown at Garamba that there is a statistically significant negative relationship
between elephant abundance and tree cover when aerial count data are analysed for
the whole ecosystem. Yet habitat differences can partly be explained by high elephant
densities in areas that are protected, because elephants are known to be important
agents o f habitat change (Dublin 1995). Thus, the factors that contribute to high
- 94 -
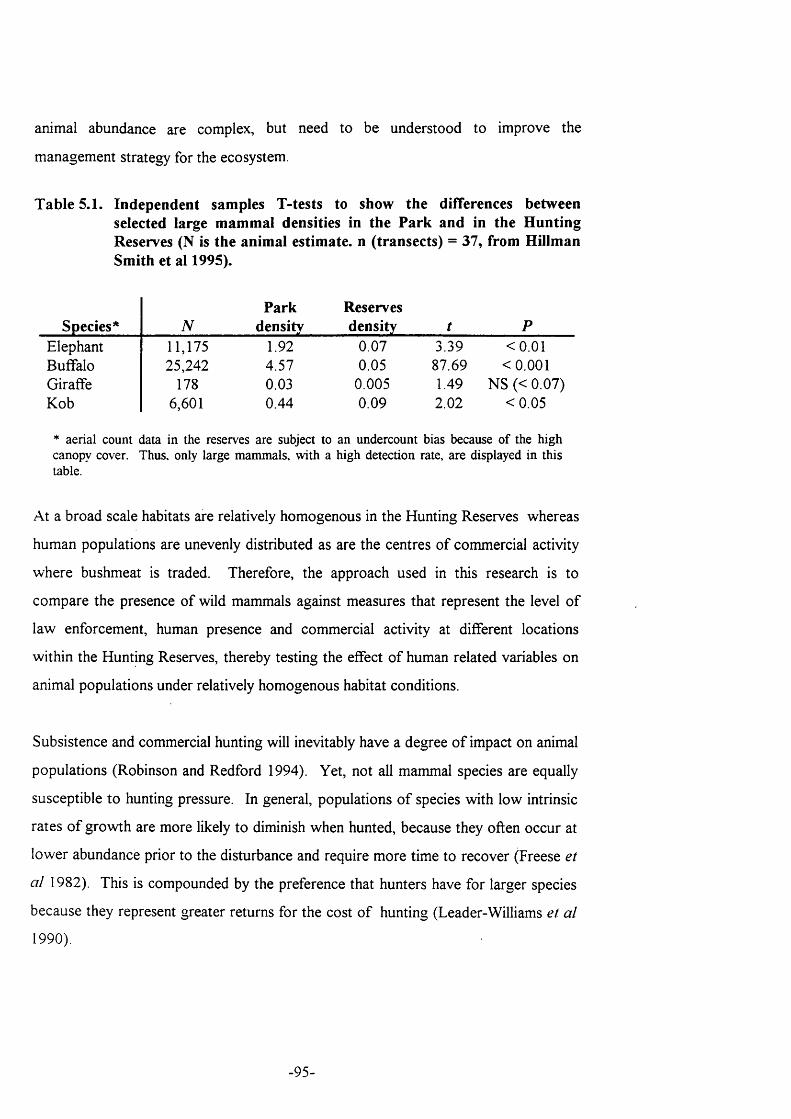
animal abundance are complex, but need to be understood to improve the
management strategy for the ecosystem.
Table 5.1. Independent samples T-tests to show the differences between selected large mammal densities in the Park and in the Hunting Reserves (N is the animal estimate, n (transects) = 37, from Hillman Smith et al 1995).
Species* NPark
densityReservesdensity t P
Elephant 11,175 1.92 0.07 3.39 <0.01Buffalo 25,242 4.57 0.05 87.69 <0.001Giraffe 178 0.03 0.005 1.49 NS (< 0.07)Kob 6,601 0.44 0.09 2.02 <0.05
* aerial count data in the reserves are subject to an undercount bias because of the high canopy cover. Thus, only large mammals, with a high detection rate, are displayed in this table.
At a broad scale habitats are relatively homogenous in the Hunting Reserves whereas
human populations are unevenly distributed as are the centres o f commercial activity
where bushmeat is traded. Therefore, the approach used in this research is to
compare the presence o f wild mammals against measures that represent the level o f
law enforcement, human presence and commercial activity at different locations
within the Hunting Reserves, thereby testing the effect o f human related variables on
animal populations under relatively homogenous habitat conditions.
Subsistence and commercial hunting will inevitably have a degree o f impact on animal
populations (Robinson and Redford 1994). Yet, not all mammal species are equally
susceptible to hunting pressure. In general, populations o f species with low intrinsic
rates o f growth are more likely to diminish when hunted, because they often occur at
lower abundance prior to the disturbance and require more time to recover (Freese et
a l 1982). This is compounded by the preference that hunters have for larger species
because they represent greater returns for the cost o f hunting (Leader-Williams et a l
1990).
- 95 -
It is also argued that some animal populations may increase in hunted areas. This
may result from reduced competition from other species that are selected by hunters
(Johns and Skorupa 1986). However, the importance o f resource competition
between mammals in determining a species’ abundance has been questioned
(Andrewartha and Birch 1954, Inamdar 1996). Another explanation is that improved
habitat quality results from slash and bum agriculture. This increases the quality o f
habitats for specific animal species close to human settlements because o f the greater
predominance o f secondary forest (Eisenberg and Seidensticker 1976, Wilkie and
Finn 1990).
In summary, the distribution o f mammal assemblages is likely to be complex, and
population densities o f individual species may differ substantially according to their
physiological and lifehistory traits. Therefore, this study examines the relationship
between human factors and mammal community structure. First, species richness (the
total number o f mammal species present at a site) is used as a simple measure o f
community structure which can be compared to the explanatory variables. Second,
species within the mammal assemblage are grouped according to meaningful
physiological, behavioural and habitat characteristics, and these are compared to the
explanatory variables.
5.3 H ypothesis
This study examines the correlation between a number o f indicators o f human activity
with the distribution o f wildlife populations in the Hunting Reserves. It is
hypothesised that the presence o f agricultural communities, proximity to urban
markets and conservation practices impact upon two characteristics o f population
distribution; the presence (range) and community structure o f large mammal
populations.
5.4 M ethods
This section describes the animal distribution data and the variables used to explain
the distribution.
- 96 -
5.4.1 Animal distribution
Patterns o f wildlife abundance in the Hunting Reserves were examined by analysing
the unpublished raw ground transect data collected by Nicholas and Ndey (1995)
between February and May 1994 (Hillman Smith et a l 1995). Counting animals in the
Hunting Reserves presents a number o f difficulties. The geographical extent o f the
Garamba ecosystem precludes a total count o f wildlife. Furthermore, counting animal
observations is unreliable in a densely vegetated environment. Thus, sampling
techniques are used to reduce the survey effort, and counts are made o f spoor, which
is more easily detected. These are standard techniques used by White (1992) and
Prins and Reitzma (1989).
Line transect methods were used to estimate mammal presence based on the methods
used by Burnham, Anderson and Laake (1980). Forty two transects were covered,
each o f five kilometres in length, using a stratified random sampling scheme. Data
were collected by three observers walking abreast along the transect line. Each
observer recorded observations within a two metre strip width either side o f his
centre line, to produce an overall sampling width o f 12 meters. Distances along the
transect line were measured using a topqfil thread meter. Two types o f observations
are used; wildlife tracks and faecal material. This approach produced relative
abundance data across the transects for 31 mammal species.
5.4.2 Explanatory variables
I Contextual data collected during the transect exercise, such as human presence and
I habitat types, were only gathered at close proximity to the transect line. These data
are o f limited value in explaining the presence or absence o f animals because o f the
mobility o f the species in question. Thus, alternative techniques were used to
generate explanatory data that represented a broader area around the transects.
These explanatory data focus primarily on human activity, but also include a
simplified measure o f habitat type (tree cover densities).
- 97 -
a. The presence o f agricultural communities
The presence o f agricultural communities is a difficult explanatory variable to
quantify. Human population census data are unavailable for this region since 1984,
and census across the Reserves would have been a prohibitively time consuming
exercise. However, the population density o f agriculturalists can be related to the
proportion o f land that is covered by agricultural fields. The processing o f satellite
data provides a means o f obtaining an estimate o f field cover in the areas around the
transects (see Box 5.1).
Normalised difference vegetation index (NDVI) data were generated from three geo
corrected scenes o f Landsat TM data as a means o f detecting agricultural land as an
indicator o f human presence (M ather 1987, see Box 5.2). The NDVI image enables
the detection o f agricultural land cover (an assessment o f the accuracy o f this method
is provided in the appraisal o f methods below).
All three scenes were scanned in December, which coincides with the post-harvest
period when there is likely to be a higher proportion o f exposed soil on agricultural
land (de Schlippé 1953, Lambin 1994). Thus, low index values were produced for
agricultural land relative to the surrounding vegetation. A geographic information
system (GIS) was used to select areas within five kilometres o f the transects. These
measured 149.5km^. The average NDVI value within these areas was used as an
index o f field cover.
Figure 5.1 shows one o f the NDVI scenes representing a land surface o f 200 by 180
kilometres containing most o f the Garamba ecosystem. The histogram below the
image shows that the data is bimodal. The darker areas on the image, corresponding
to low values, appear to represent three types o f land features; open water (major
rivers), burned savanna vegetation cover and areas that cluster around settlements.
Low NDVI values around settlements are hypothesised to correspond to exposed
agricultural soil following the early dry season harvest.
- 98 -
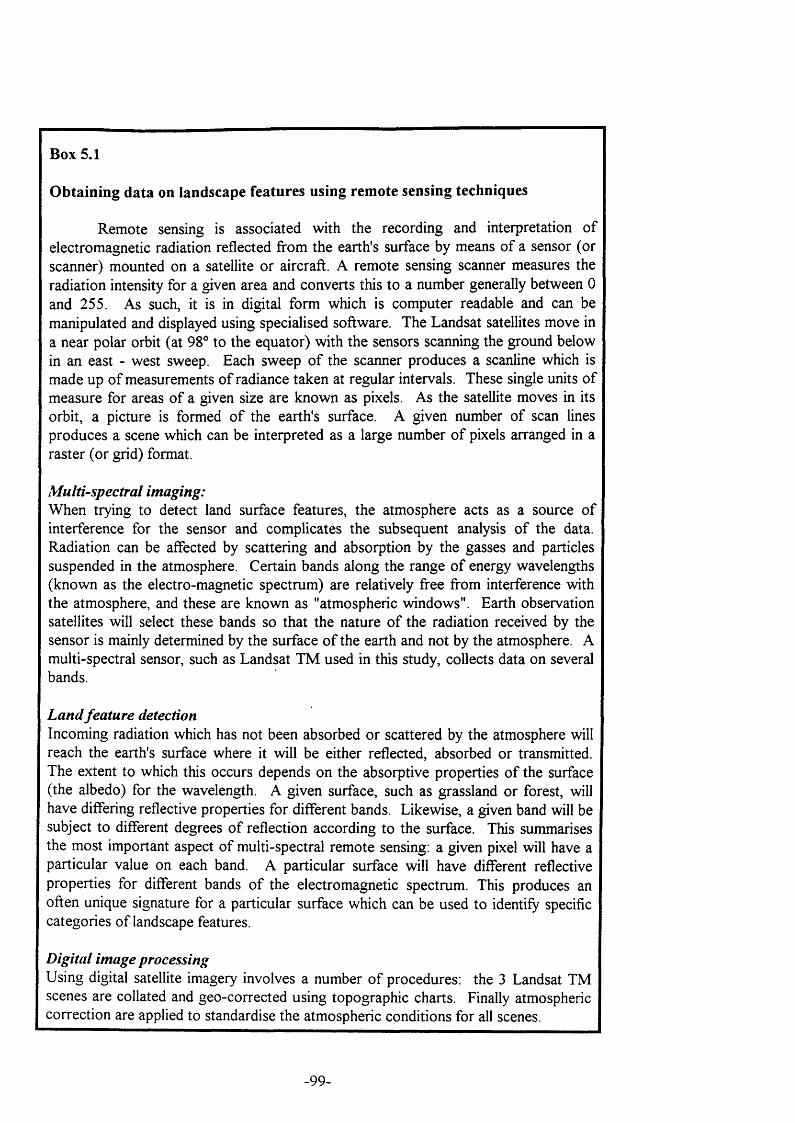
Box 5.1
Obtaining data on landscape features using remote sensing techniques
Remote sensing is associated with the recording and interpretation o f electromagnetic radiation reflected from the earth's surface by means o f a sensor (or scanner) mounted on a satellite or aircraft. A remote sensing scanner measures the radiation intensity for a given area and converts this to a number generally between 0 and 255. As such, it is in digital form which is computer readable and can be manipulated and displayed using specialised software. The Landsat satellites move in a near polar orbit (at 98° to the equator) with the sensors scanning the ground below in an east - west sweep. Each sweep o f the scanner produces a scanline which is made up o f measurements o f radiance taken at regular intervals. These single units o f measure for areas o f a given size are known as pixels. As the satellite moves in its orbit, a picture is formed o f the earth's surface. A given number o f scan lines produces a scene which can be interpreted as a large number o f pixels arranged in a raster (or grid) format.
Multi-spectral imaging:When trying to detect land surface features, the atmosphere acts as a source o f interference for the sensor and complicates the subsequent analysis o f the data. Radiation can be affected by scattering and absorption by the gasses and particles suspended in the atmosphere. Certain bands along the range o f energy wavelengths (known as the electro-magnetic spectrum) are relatively free from interference with the atmosphere, and these are known as "atmospheric windows". Earth observation satellites will select these bands so that the nature o f the radiation received by the sensor is mainly determined by the surface o f the earth and not by the atmosphere. A multi-spectral sensor, such as Landsat TM used in this study, collects data on several bands.
Land feature detectionIncoming radiation which has not been absorbed or scattered by the atmosphere will reach the earth's surface where it will be either reflected, absorbed or transmitted. The extent to which this occurs depends on the absorptive properties o f the surface (the albedo) for the wavelength. A given surface, such as grassland or forest, will have differing reflective properties for different bands. Likewise, a given band will be subject to different degrees o f reflection according to the surface. This summarises the most important aspect o f multi-spectral remote sensing: a given pixel will have a particular value on each band. A particular surface will have different reflective properties for different bands o f the electromagnetic spectrum. This produces an often unique signature for a particular surface which can be used to identify specific categories o f landscape features.
Digital image processingUsing digital satellite imagery involves a number o f procedures: the 3 Landsat TM scenes are collated and geo-corrected using topographic charts. Finally atmospheric correction are applied to standardise the atmospheric conditions for all scenes.
- 99 -
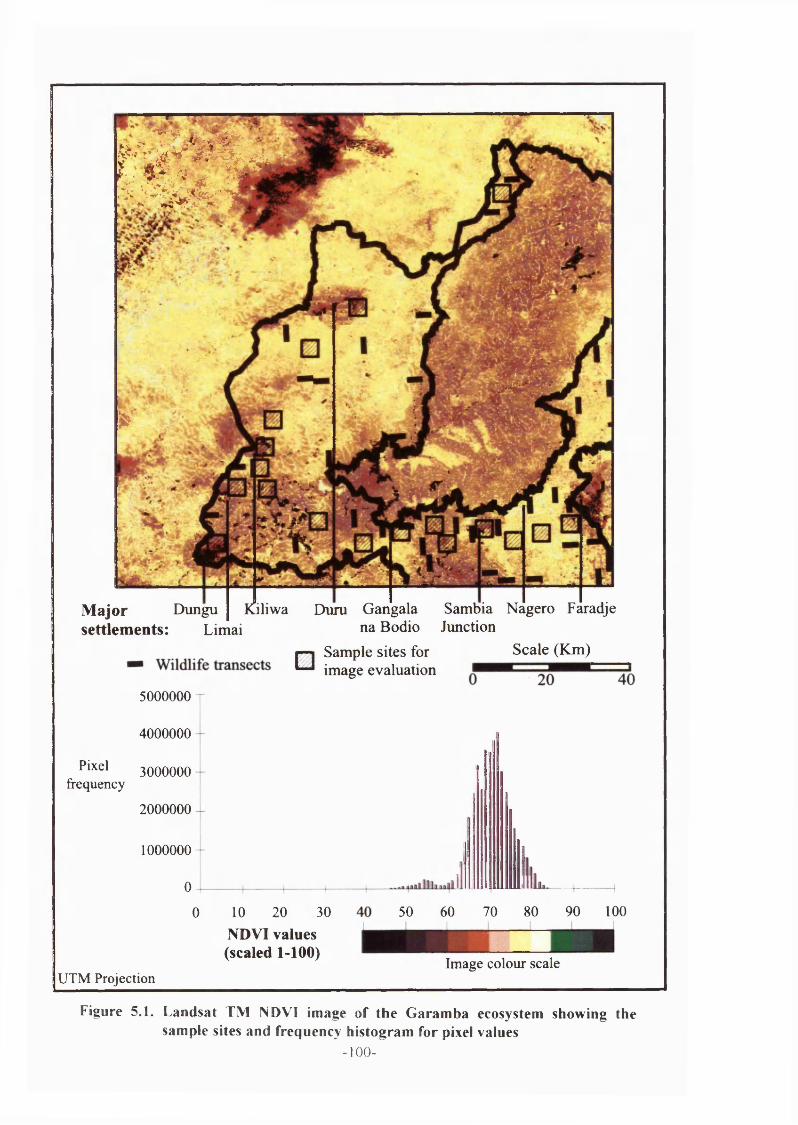
M ajor
1 ^ *
w
Dungu ïGliwa Duru Gangala Sambia Nagero Faradjesettlem ents: Lim ai na Bodio Junction
□ Sample sites for Scale (K m )image evaluation
5000000
Pixelfrequency
4000000
3000000
2000000
1000000
00 10 20 30
NDVI values (scaled 1-100)
50 60 70 80 90 100
UTM ProjectionImage colour scale
Figure 5.1. L andsa t T M NDVl image of the G a ra m b a ecosystem showing the sam ple sites and frequency h is togram for pixel values
- 100-
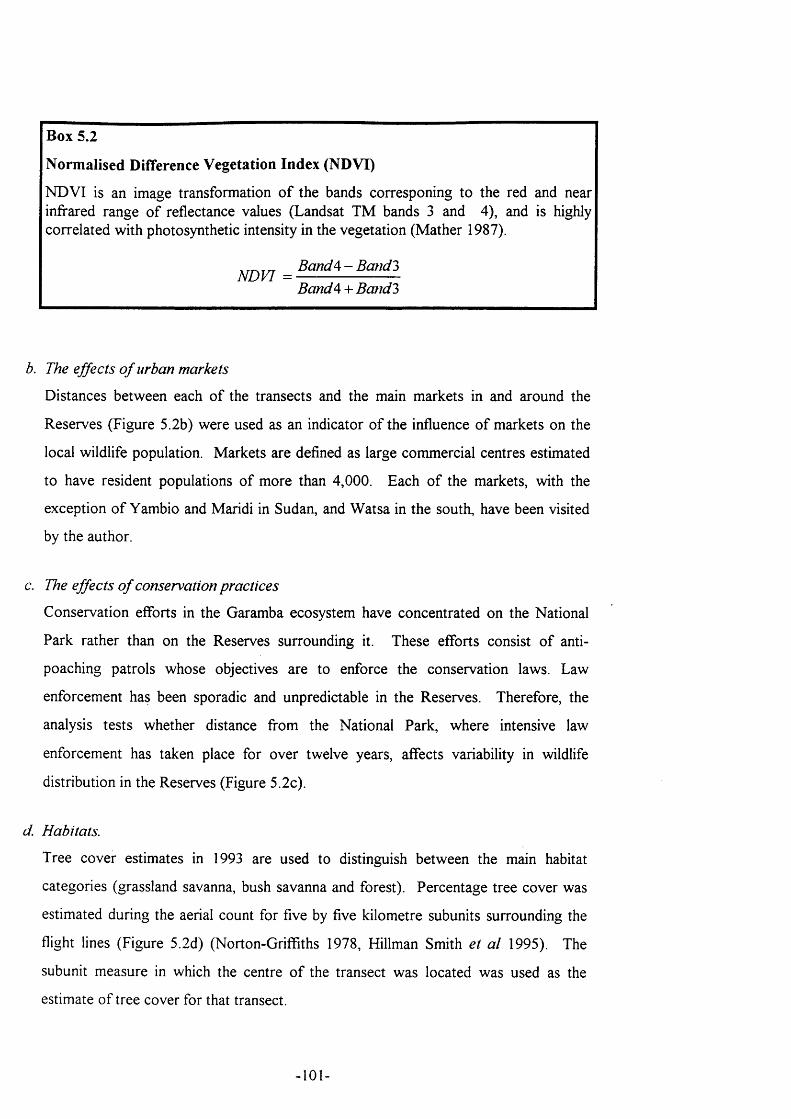
Box 5.2
Normalised Difference Vegetation Index (NDVI)
NDVI is an image transformation o f the bands corresponing to the red and near infrared range o f reflectance values (Landsat TM bands 3 and 4), and is highly correlated with photosynthetic intensity in the vegetation (M ather 1987).
. B and 4 - Band'^ND VI = ----------------------
Band A + Band3
b. The effects o f urban markets
Distances between each o f the transects and the main markets in and around the
Reserves (Figure 5.2b) were used as an indicator o f the influence o f markets on the
local wildlife population. Markets are defined as large commercial centres estimated
to have resident populations o f more than 4,000. Each o f the markets, with the
exception o f Yambio and Maridi in Sudan, and W atsa in the south, have been visited
by the author.
c. The effects o f conservation practices
Conservation efforts in the Garamba ecosystem have concentrated on the National
Park rather than on the Reserves surrounding it. These efforts consist o f anti
poaching patrols whose objectives are to enforce the conservation laws. Law
enforcement has been sporadic and unpredictable in the Reserves. Therefore, the
analysis tests whether distance from the National Park, where intensive law
enforcement has taken place for over twelve years, affects variability in wildlife
distribution in the Reserves (Figure 5.2c).
d. Habitats.
Tree cover estimates in 1993 are used to distinguish between the main habitat
categories (grassland savanna, bush savanna and forest). Percentage tree cover was
estimated during the aerial count for five by five kilometre subunits surrounding the
flight lines (Figure 5.2d) (Norton-Griffiths 1978, Hillman Smith et a l 1995). The
subunit measure in which the centre o f the transect was located was used as the
estimate o f tree cover for that transect.
- 101-
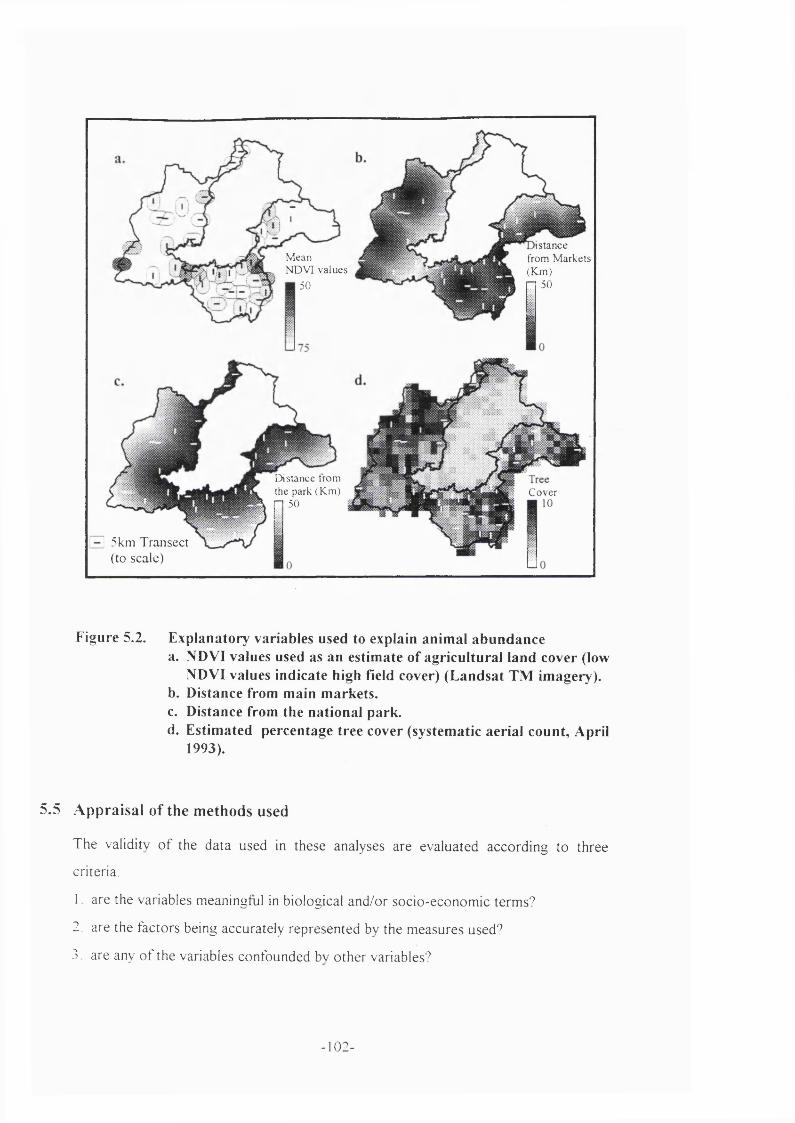
is ta n ce from M ark ets (K m )
50
M ean N D V I v a lu es
50
D istan ce trom the park (K m )
50C over
5km Transect (to scale)
Figure 5.2. E xp lanato ry variables used to explain an im al a b u n d a n c ea. NDVI values used as an estimate o f ag ricu ltu ra l land cover (low
NDVI values indicate high field cover) (L a n d sa t T M imagery).b. Distance from main m arkets .c. Distance from the na tional park .d. Estim ated percentage tree cover (systematic aerial count, April
1993).
5.5 A p p ra isa l o f th e m ethods used
T he validity o f the data used in these analyses are evaluated accord ing to th ree
criteria;
1 are the variables meaningful in biological and /or socio-econom ic terms'^
2. are the factors being accurately represented by the m easures used'i’
3 are any o f the variables confounded bv o th er variables'^
- 102-
5.5.1 D ependent variables
Inferring animal density measures from faecal counts can produce spurious results.
The problems involved in calculating population densities from faecal material and
spoor have been extensively documented (e.g. Barnes et a l 1995, Plumptre and Harris
1995). Underestimation is caused by low detection rates caused by dense understorey
vegetation cover. Barnes et a l also stress the extent to which detection is affected by
species specific parameters, such as faecal size and decomposition rates, together with
site specific variables, such as rainfall and canopy cover. Furthermore, Morrison et al
( 1992) suggest that a minimum o f forty faecal observations on a transect are required
to obtain an acceptable density estimate for a particular species. This is relatively rare
for any o f the species in the dataset. Furthermore, there appear to be only two
examples in the literature where precise population denrities for a large assemblage o f
African tropical moist forest mammals have been calculated using indirect
observations (Prins and Reitsma 1987, White 1992).
Given the difficulties involved in drawing population densities from spoor and faecal
material, presence or absence data and relative abundance are used in this study to
test hypotheses about the possible causal factors o f wildlife distribution. Using
presence and absence data does, o f course, have important limitations when trying to
answer a species performance question (the local success o f a species). However, a
relatively large sample size is used (42 transects) which validates the approach.
Analyses o f relative species abundance is based on faecal densities.
5.5.2 Explanatory variables
a. The presence o f agricultural communities
A number o f questions may be raised in assessing the presence o f agricultural
communities. First, does variation in agricultural land cover correlate with
agricultural population density? The variance o f total field size per household was
found to be small for a sample o f 121 households surveyed (see Chapter 8 for a
description o f field measurements). The mean landholding per household is o f 0.83
- 103 -
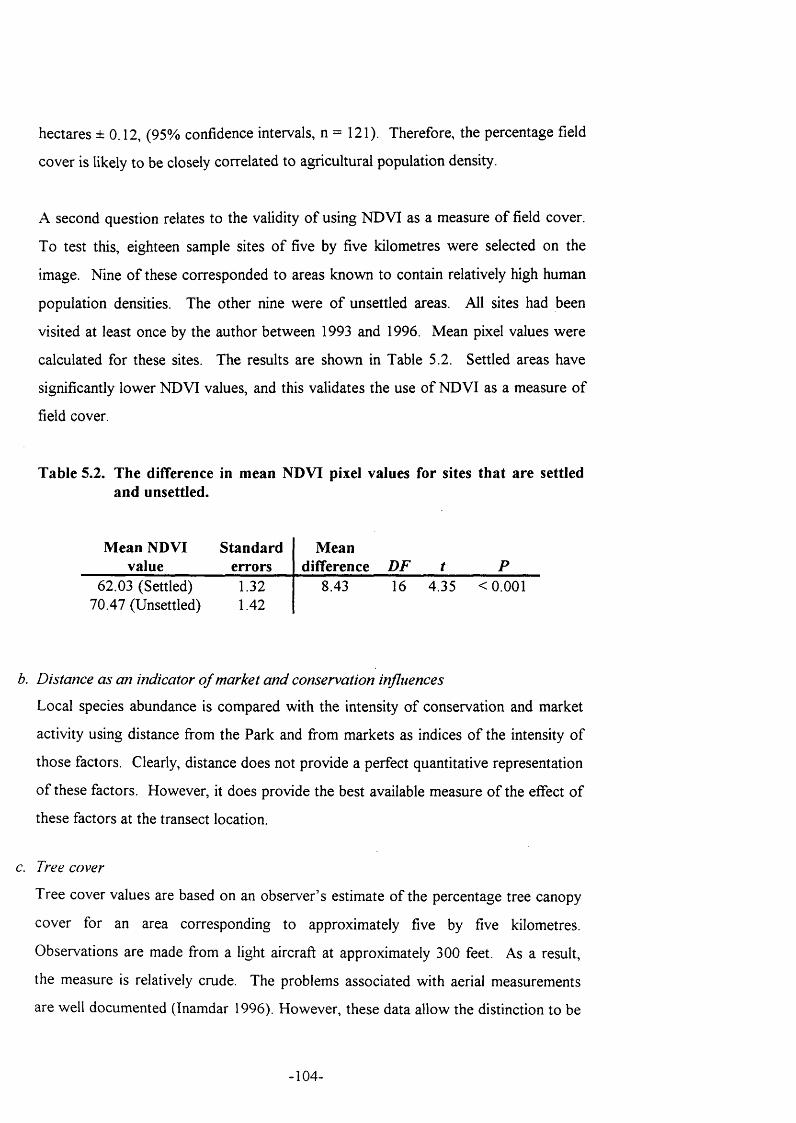
hectares ± 0.12, (95% confidence intervals, n = 121). Therefore, the percentage field
cover is likely to be closely correlated to agricultural population density.
A second question relates to the validity o f using NDVI as a measure o f field cover.
To test this, eighteen sample sites o f five by five kilometres were selected on the
image. Nine o f these corresponded to areas known to contain relatively high human
population densities. The other nine were o f unsettled areas. All sites had been
visited at least once by the author between 1993 and 1996. Mean pixel values were
calculated for these sites. The results are shown in Table 5.2. Settled areas have
significantly lower NDVI values, and this validates the use o f NDVI as a measure o f
field cover.
Table 5.2. The difference in mean NDVI pixel values for sites that are settled and unsettled.
Mean NDVI Standard Meanvalue errors difference D F t P
62.03 (Settled) 70.47 (Unsettled)
1.321.42
8.43 16 4.35 < 0.001
b. Distance as an indicator o f market and conservation influences
Local species abundance is compared with the intensity o f conservation and market
activity using distance from the Park and from markets as indices o f the intensity o f
those factors. Clearly, distance does not provide a perfect quantitative representation
o f these factors. However, it does provide the best available measure o f the effect o f
these factors at the transect location.
c. Tree cover
Tree cover values are based on an observer’s estimate o f the percentage tree canopy
cover for an area corresponding to approximately five by five kilometres.
Observations are made from a light aircraft at approximately 300 feet. As a result,
the measure is relatively crude. The problems associated with aerial measurements
are well documented (Inamdar 1996). However, these data allow the distinction to be
- 104-
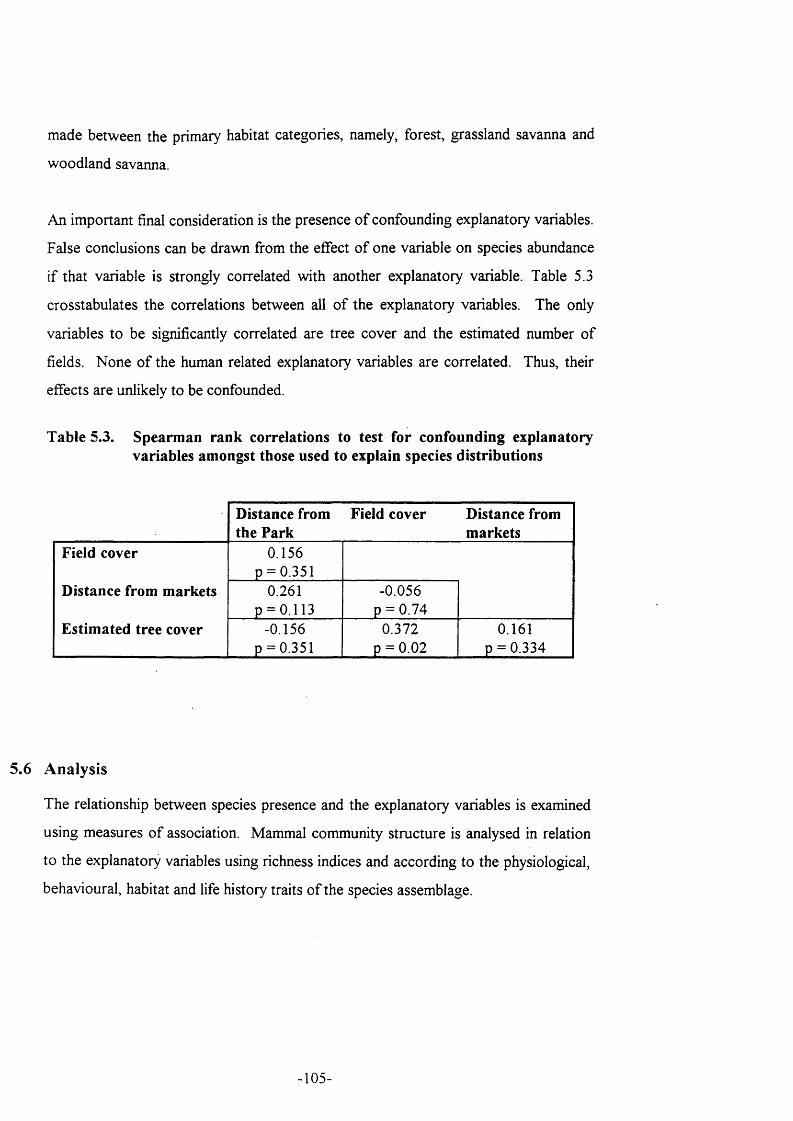
made between the primary habitat categories, namely, forest, grassland savanna and
woodland savanna.
An important final consideration is the presence o f confounding explanatory variables.
False conclusions can be drawn from the effect o f one variable on species abundance
if that variable is strongly correlated with another explanatory variable. Table 5.3
crosstabulates the correlations between all o f the explanatory variables. The only
variables to be significantly correlated are tree cover and the estimated number o f
fields. None o f the human related explanatory variables are correlated. Thus, their
effects are unlikely to be confounded.
Table 5.3. Spearman rank correlations to test for confounding explanatory variables amongst those used to explain species distributions
Distance from the Park
Field cover Distance from markets
Field cover 0.156 p = 0.351
Distance from markets 0.261 p = 0.113
-0.056 p = 0.74
Estimated tree cover -0.156 p = 0.351
0.372p = 0.02
0.161 p = 0.334
5.6 A nalysis
The relationship between species presence and the explanatory variables is examined
using measures o f association. Mammal community structure is analysed in relation
to the explanatory variables using richness indices and according to the physiological,
behavioural, habitat and life history traits o f the species assemblage.
- 105-
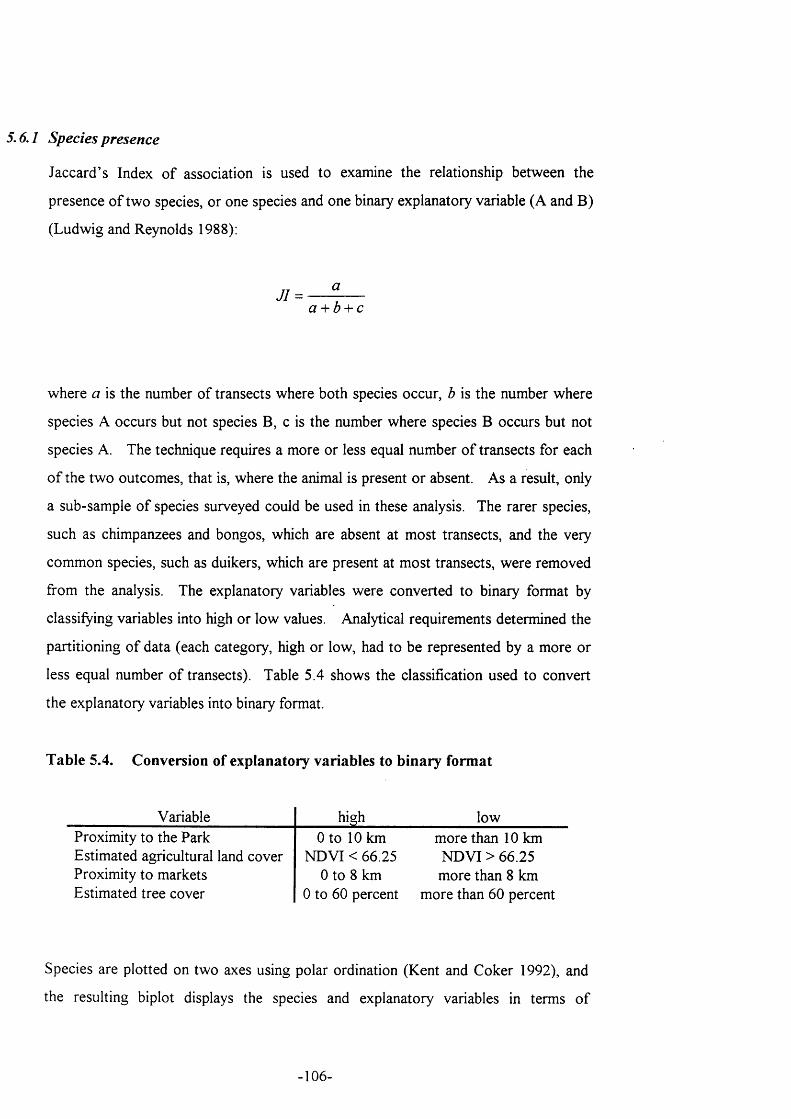
5.6.1 Species presence
Jaccard’s Index o f association is used to examine the relationship between the
presence o f two species, or one species and one binary explanatory variable (A and B)
(Ludwig and Reynolds 1988):
J / =a
a + b-\-c
where a is the number o f transects where both species occur, b is the number where
species A occurs but not species B, c is the number where species B occurs but not
species A. The technique requires a more or less equal number o f transects for each
o f the tw o outcomes, that is, where the animal is present or absent. As a result, only
a sub-sample o f species surveyed could be used in these analysis. The rarer species,
such as chimpanzees and bongos, which are absent at most transects, and the very
common species, such as duikers, which are present at most transects, were removed
from the analysis. The explanatory variables were converted to binary format by
classifying variables into high or low values. Analytical requirements determined the
partitioning o f data (each category, high or low, had to be represented by a more or
less equal number o f transects). Table 5.4 shows the classification used to convert
the explanatory variables into binary format.
Table 5.4. Conversion of explanatory variables to binary format
Variable high lowProximity to the Park 0 to 10 km more than 10 kmEstimated agricultural land cover NDVI < 66.25 NDVI > 66.25Proximity to markets 0 to 8 km more than 8 kmEstimated tree cover 0 to 60 percent more than 60 percent
Species are plotted on two axes using polar ordination (Kent and Coker 1992), and
the resulting biplot displays the species and explanatory variables in terms o f
- 106-

association distance. The significance o f the relationships described on the biplot is
assessed using Pearson’s chi squared independence testsV
5.6.2 Species richness
Richness indices provide a single measure to represent the importance o f the transects
in terms o f the number o f species present (Ludwig and Reynolds 1988). Emmons’
study (1984) o f the geographical variation o f mammal densities in Amazonia showed
that “the observed pattern o f variation in numbers o f individuals is mirrored by
species richness differences” . Thus, species richness provides a simple but effective
measure to analyse the effect o f the explanatory variables on species distribution.
5.6.3 Species abundance and community structure
So far, species presence has been used to test the effects o f the various explanatory
variables. Species presence is used because it provides a reliable indicator o f
distribution. However, presence alone does not provide the detail required to
describe fully animal distribution. Therefore the relative abundance o f the species
assemblage is analysed in relation to the explanatory variables. 31 species and three
explanatory variables constitute a complex dataset which is analysed using muli-
variate techniques known collectively as ordination (see Box 5.3).
Box 5.3
Understanding complex species assemblages using multi variate analysis: Ordination.Testing the effects o f various explanatory variables on the abundance o f a large species assemblage is complex because o f the number o f dependant variables (species) that make up the dataset. Multiple dependant variables can be analysed using techniques collectively known as ordination (Kent and Coker 1992, ter Braak 1995). These provide a useful means o f exploring the patterns o f variance in the distribution o f the 31 mammal species recorded in the hunting reserves in relation to wildlife management related factors. The benefits o f using ordination are that the data retain a high level o f detail by analysing all the species as well as the frequency o f observations at each o f the sample locations.___________________
Logistic regression would have produced a more robust analysis for these data (eg. Hill et al 1998), but the distributions did not meet the assumptions of the logistic model, as defined by Crawlev (1993).
- 107 -
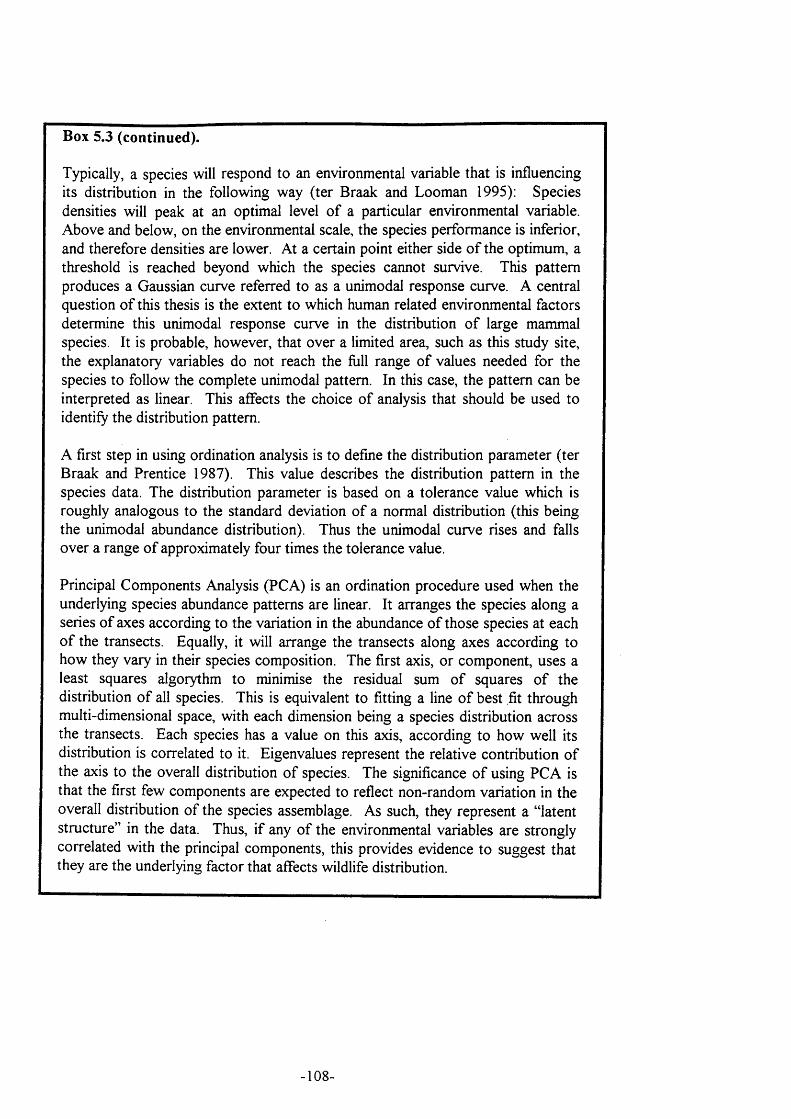
Box 5.3 (continued).
Typically, a species will respond to an environmental variable that is influencing its distribution in the following way (ter Braak and Looman 1995): Speciesdensities will peak at an optimal level o f a particular environmental variable. Above and below, on the environmental scale, the species performance is inferior, and therefore densities are lower. At a certain point either side o f the optimum, a threshold is reached beyond which the species cannot survive. This pattern produces a Gaussian curve referred to as a unimodal response curve. A central question o f this thesis is the extent to which human related environmental factors determine this unimodal response curve in the distribution o f large mammal species. It is probable, however, that over a limited area, such as this study site, the explanatory variables do not reach the full range o f values needed for the species to follow the complete unimodal pattern. In this case, the pattern can be interpreted as linear. This affects the choice o f analysis that should be used to identify the distribution pattern.
A first step in using ordination analysis is to define the distribution parameter (ter Braak and Prentice 1987). This value describes the distribution pattern in the species data. The distribution parameter is based on a tolerance value which is roughly analogous to the standard deviation o f a normal distribution (this being the unimodal abundance distribution). Thus the unimodal curve rises and falls over a range o f approximately four times the tolerance value.
Principal Components Analysis (PCA) is an ordination procedure used when the underlying species abundance patterns are linear. It arranges the species along a series o f axes according to the variation in the abundance o f those species at each o f the transects. Equally, it will arrange the transects along axes according to how they vary in their species composition. The first axis, or component, uses a least squares algorythm to minimise the residual sum o f squares o f the distribution o f all species. This is equivalent to fitting a line o f best fit through multi-dimensional space, with each dimension being a species distribution across the transects. Each species has a value on this axis, according to how well its distribution is correlated to it. Eigenvalues represent the relative contribution o f the axis to the overall distribution o f species. The significance o f using PCA is that the first few components are expected to reflect non-random variation in the overall distribution o f the species assemblage. As such, they represent a “latent structure” in the data. Thus, if any o f the environmental variables are strongly correlated with the principal components, this provides evidence to suggest that they are the underlying factor that affects wildlife distribution.
- 108-
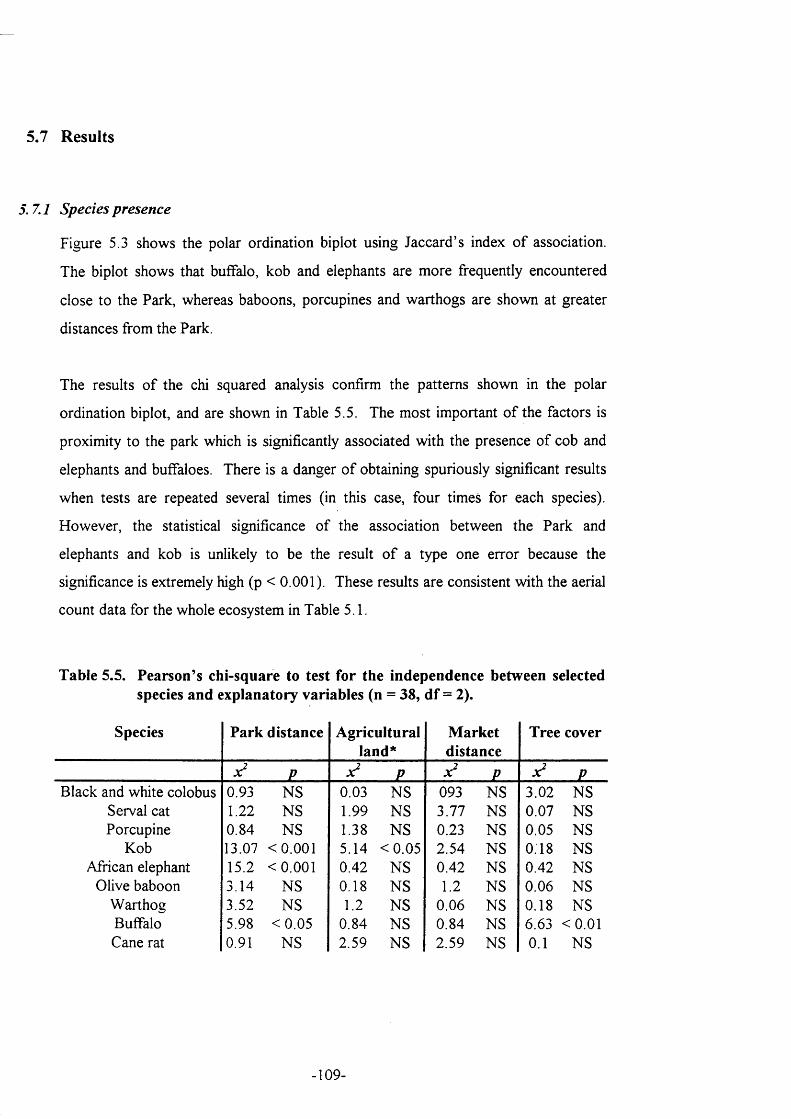
5.7 Results
5.7.1 Species presence
Figure 5.3 shows the polar ordination biplot using Jaccard’s index o f association.
The biplot shows that buffalo, kob and elephants are more frequently encountered
close to the Park, whereas baboons, porcupines and warthogs are shown at greater
distances from the Park.
The results o f the chi squared analysis confirm the patterns shown in the polar
ordination biplot, and are shown in Table 5.5. The most important o f the factors is
proximity to the park which is significantly associated with the presence o f cob and
elephants and buffaloes. There is a danger o f obtaining spuriously significant results
when tests are repeated several times (in this case, four times for each species).
However, the statistical significance o f the association between the Park and
elephants and kob is unlikely to be the result o f a type one error because the
significance is extremely high (p < 0.001). These results are consistent with the aerial
count data for the whole ecosystem in Table 5.1.
Table 5.5. Pearson’s chi-square to test for the independence between selected species and explanatory variables (n = 38, df = 2).
Species Park distance Agriculturalland*
Marketdistance
Tree cover
P P P PBlack and white colobus 0.93 NS 0.03 NS 093 NS 3.02 NS
Serval cat 1.22 NS 1.99 NS 3.77 NS 0.07 NSPorcupine 0.84 NS 1.38 NS 0.23 NS 0.05 NS
Kob 13.07 <0.001 5.14 < 0 .05 2.54 NS 0.18 NSAfrican elephant 15.2 <0.001 0.42 NS 0.42 NS 0.42 NS
Olive baboon 3.14 NS 0.18 NS 1.2 NS 0.06 NSWarthog 152 NS 1.2 NS 0.06 NS 0.18 NSBuffalo 5 98 < 0.05 0.84 NS 0.84 NS 6.63 <0.01Cane rat 0.91 NS 2.59 NS 2 59 NS 0.1 NS
- 109 -
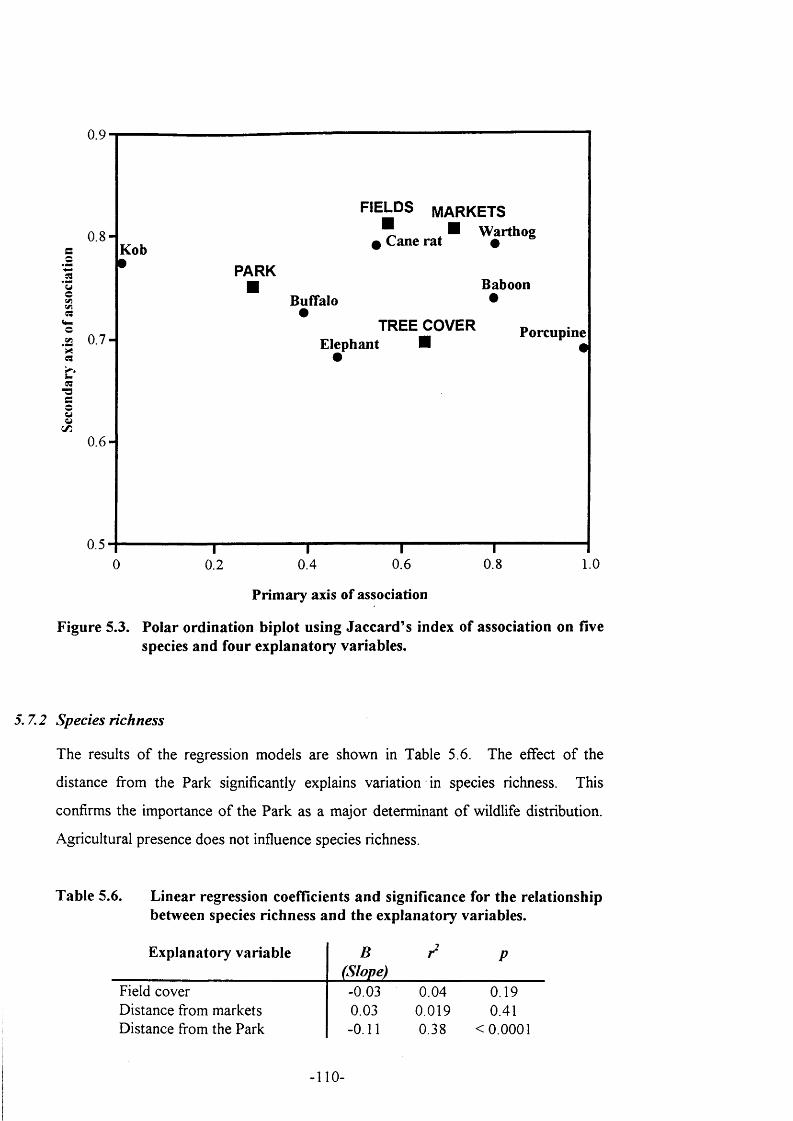
0.9
22 0.7 -
■aeo( jSJ
c/50 . 6 “
0.5
Kob0
FIELDS m a r k e t s■ I
m Cane rat Warthog
PARKBaboon
Buffalo
TREE COVERElephant
Porcupine0
T0.2 0.4 0.6
Primary axis of association
0.8 1.0
Figure 5.3. Polar ordination biplot using Jaccard's index of association on five species and four explanatory variables.
5.7.2 Species richness
The results o f the regression models are shown in Table 5.6. The effect o f the
distance from the Park significantly explains variation in species richness. This
confirms the importance o f the Park as a major determinant o f wildlife distribution.
Agricultural presence does not influence species richness.
Table 5.6. Linear regression coefficients and significance for the relationship between species richness and the explanatory variables.
Explanatory variable B(Slope)
/ P
Field cover -0.03 0.04 0.19Distance from markets 0.03 0.019 0.41Distance from the Park -0.11 0 38 <0.0001
- 110 -
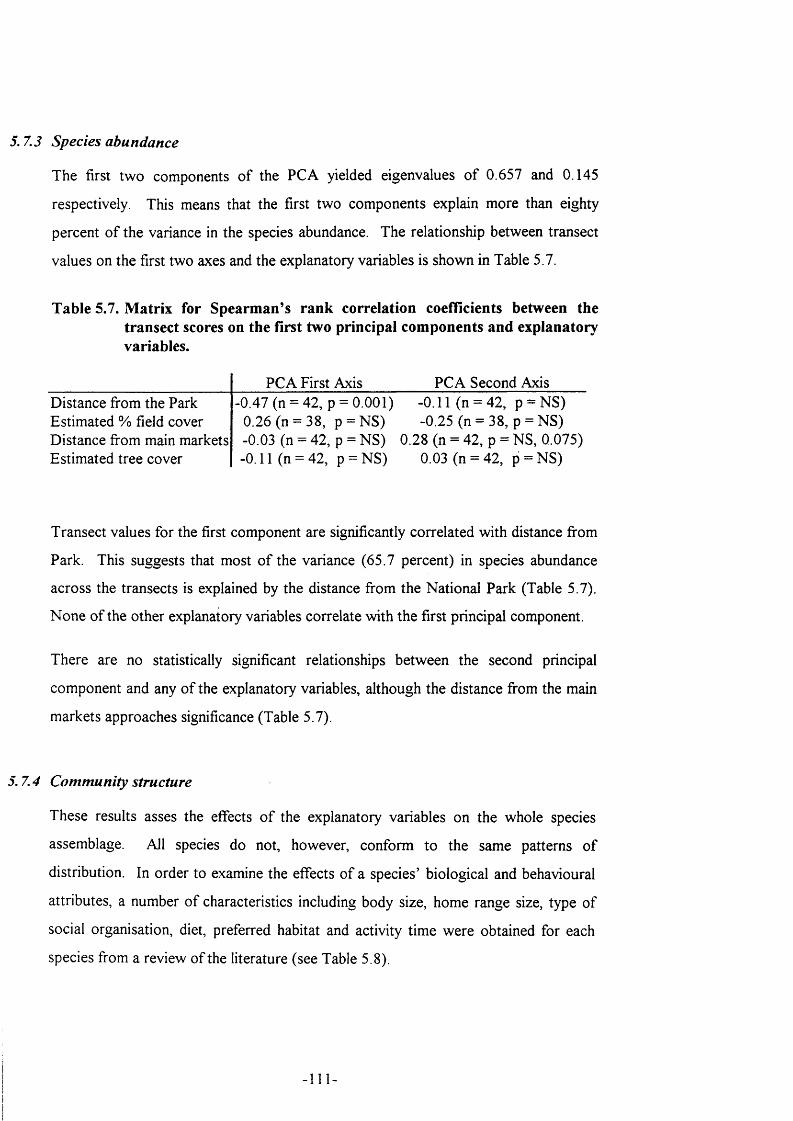
5. 7.3 Species abundance
The first tw o components o f the PCA yielded eigenvalues o f 0.657 and 0.145
respectively. This means that the first two components explain more than eighty
percent o f the variance in the species abundance. The relationship between transect
values on the first two axes and the explanatory variables is shown in Table 5.7.
Table 5.7. Matrix for Spearman^s rank correlation coefficients between the transect scores on the first two principal components and explanatory variables.
PCA First Axis PCA Second AxisDistance from the Park -0.47 (n = 42, p = 0.001) -0.11 (n = 42, p = NS)Estimated % field cover 0.26 (n == 38, p = NS) -0.25 (n = 38. p = NS)Distance from main markets -0.03 (n = 42, p = NS) 0.28 (n = 42, p = NS, 0.075)Estimated tree cover -0.11 (n == 42, p = NS) 0.03 (n = 42, p = NS)
Transect values for the first component are significantly correlated with distance from
Park. This suggests that most o f the variance (65.7 percent) in species abundance
across the transects is explained by the distance from the National Park (Table 5.7).
N one o f the other explanatory variables correlate with the first principal component.
There are no statistically significant relationships between the second principal
component and any o f the explanatory variables, although the distance from the main
markets approaches significance (Table 5.7).
5. 7.4 C om m unity structure
These results asses the effects o f the explanatory variables on the whole species
assemblage. All species do not, however, conform to the same patterns o f
distribution. In order to examine the effects o f a species’ biological and behavioural
attributes, a number o f characteristics including body size, home range size, type o f
social organisation, diet, preferred habitat and activity time were obtained for each
species from a review o f the literature (see Table 5.8).
- I l l -
Species were also characterised according to the way that they are exploited locally.
The dominant hunting techniques in the Reserves include the use o f firearms
(automatic weapons and locally constructed shotguns, known as fabrications) and
traditional techniques using nets (which includes the use o f dogs and spears) and
various traps and snares. The hunting techniques associated with each species (see
Table 5.8) are derived from tracking 59 hunts. Both successful and unsuccessful
stalks were used to associate a hunting technique with a particular species. In
addition, semi structured interviews with hunters were used to identify the principal
hunting technique for that species. If this failed to produce an association, the species
was considered unexploited.
Figures 5.4 shows how species are distributed on the first two component axes when
they are grouped according to various characteristics. The first principal component
is highly correlated with distance from the Park (Table 5.7). Species groups that have
values that deviate significantly from zero indicate groups that contribute substantially
to the variation contained in the principal component. 95 percent confidence intervals
for the mean values for species scores are also shown to distinguish those groups that
have significantly different scores to the rest o f the species. Thus, the species that are
more influenced by the first component include species hunted using firearms, have
large home ranges, use savanna habitats, are large bodied, diurnal, cover dependent
and are browsers or folivores. Species that are strongly influenced by the second
component include traditionally hunted species, species that have small home ranges,
are non cover dependent and are browsers or folivores.
112-
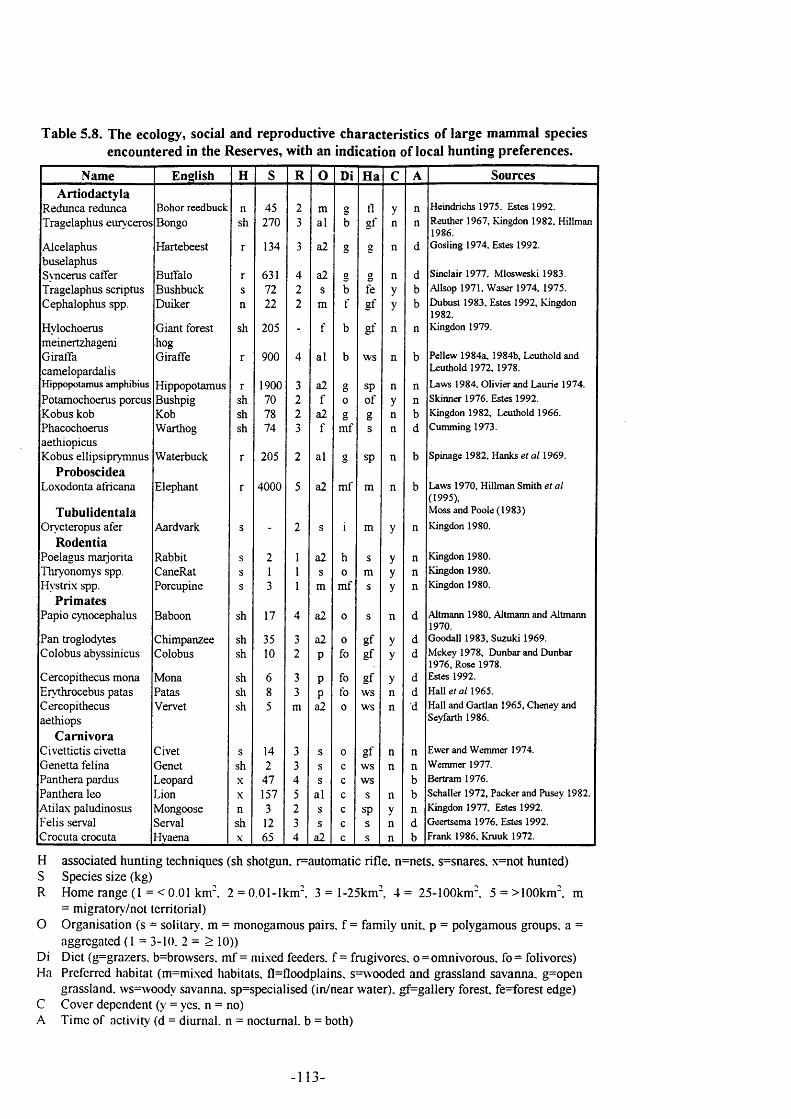
Table 5.8. The ecology, social and reproductive characteristics of large mammal species encountered in the Reserves, with an indication of local hunting preferences.
N a m e E n g l i s h H S R 0 D i H a c A S o u r c e s
A r t i o d a c t y l a
Redimca redunca Bohor reedbuck n 45 2 m S tl y n Heindrichs 1975, Estes 1992.Tragelaphus eurv'ceros Bongo sh 270 3 al b gf n n Reuther 1967, Kingdon 1982. Hillman
1986.Alcelaphus Hartebeest r 134 3 a2 g g n d Gosling 1974. Estes 1992.buselaphusSvTicerus caffer Buffalo r 631 4 a2 g g n d Sinclair 1977. Mlosweski 1983.Tragelaphus scriptus Bushbuck s 72 2 s b te y b Allsop 1971. Waser 1974. 1975.Cephalophus spp. Duiker n 22 2 m f gf y b Dubust 1983. Estes 1992, Kingdon
1982.Hylochoerusmeinertzhageni
Giant forest hog
sh 205 - f b gf n n Kingdon 1979.
GiratTaCamelopardalis
Giraffe r 900 4 al b ws n b Pel lew 1984a, 1984b, Leuthold and Leuthold 1972, 1978.
Hippopotamus amphibius Hippopotamus r 1900 3 a2 g sp n n Laws 1984. Olivier and Laurie 1974.Potamochoerus porous Bushpig sh 70 2 f 0 of y n Skinner 1976. Estes 1992.Kobus kob Kob sh 78 2 a2 g g n b Kingdon 1982, Leuthold 1966.Phacochoerus Warthog sh 74 3 f mf s n d Cumming 1973.aethiopicusKobus ellipsiprymnus Waterbuck r 205 2 al g sp n b Spinage 1982, Hanks et al 1969.
P r o b o s c i d e a
Loxodonta africana
T u b u l i d e n t a l a
Elephant r 4000 5 a2 mf m n b Laws 1970, Hillman Smith et al (1995),Moss and Poole (1983)
Orycteropus a ter Aardvark s - 2 s i m y n Kingdon 1980.
R o d e n t i a
Poelagus maijorita Rabbit s 2 1 a2 h s y n Kingdon 1980.Thryonomys spp. CaneRat s 1 1 s 0 m y n Kingdon 1980.Hystrix spp. Porcupine s 3 1 m mf s y n Kingdon 1980.
P r i m a t e s
Papio cynocephalus Baboon sh 17 4 a2 0 s n d Altmann 1980, Altmann and Altmann 1970.
Pan troglodytes Chimpanzee sh 35 3 a2 0 gf y d Goodall 1983, Suzuki 1969.Colobus abyssinicus Colobus sh 10 2 P fo gf y d Mckey 1978, Dunbar and Dunbar
1976, Rose 1978.Cercopithecus mona Mona sh 6 3 P fo gf y d Estes 1992.Erythrocebus patas Patas sh 8 3 P fo ws n d Hall et al 1965.Cercopithecusaethiops
Vervet sh 5 m a2 0 ws n d Hall and Gartian 1965, Cheney and Seyfarth 1986.
C a r n i v o r a
Civettictis civetta Civet s 14 3 s 0 gf n n Ewer and Wemmer 1974.Genetta felina Genet sh 2 3 s c ws n n Wemmer 1977.Panthera pardus Leopard X 47 4 s c ws b Bertram 1976.Panthera leo Lion X 157 5 al c s n b Schaller 1972, Packer and Pusey 1982.Atilax paludinosus Mongoose n 3 2 s c sp y n Kingdon 1977, Estes 1992.Felis serval Serval sh 12 3 s c s n d Geertsema 1976, Estes 1992.Crocuta crocuta Hyaena X 65 4 a2 c s n b Frank 1986, Kruuk 1972.
H associated hunting techniques (sh shotgun. r=automatic rifle. n=nets, s=snares. x=not hunted)S Species size (kg)R Home range (I = < 0 .01 km^ 2 = O.Ol-lkm". 3 = l-25km", 4 = 25-100km". 5 = > 100km". m
= migratory/not territorial)O Organisation (s = solitary, m = monogamous pairs, f = family unit, p = polygamous groups, a =
aggregated (1 = 3-10. 2 = >10))Di Diet (g=grazers. b=browsers. mf = mixed feeders, f = frugivores. o=omnivorous. fo= folivores) Ha Preferred habitat (m=mi\ed habitats. fl=floodplains. s=wooded and grassland savanna. g=open
grassland. ws=\voody savanna. sp=specialised (in/near water). gf=gallery forest. fe=forest edge) C Cover dependent (y = yes. n = no)A Time of activity (d = diurnal, n = nocturnal, b = both)
-11:
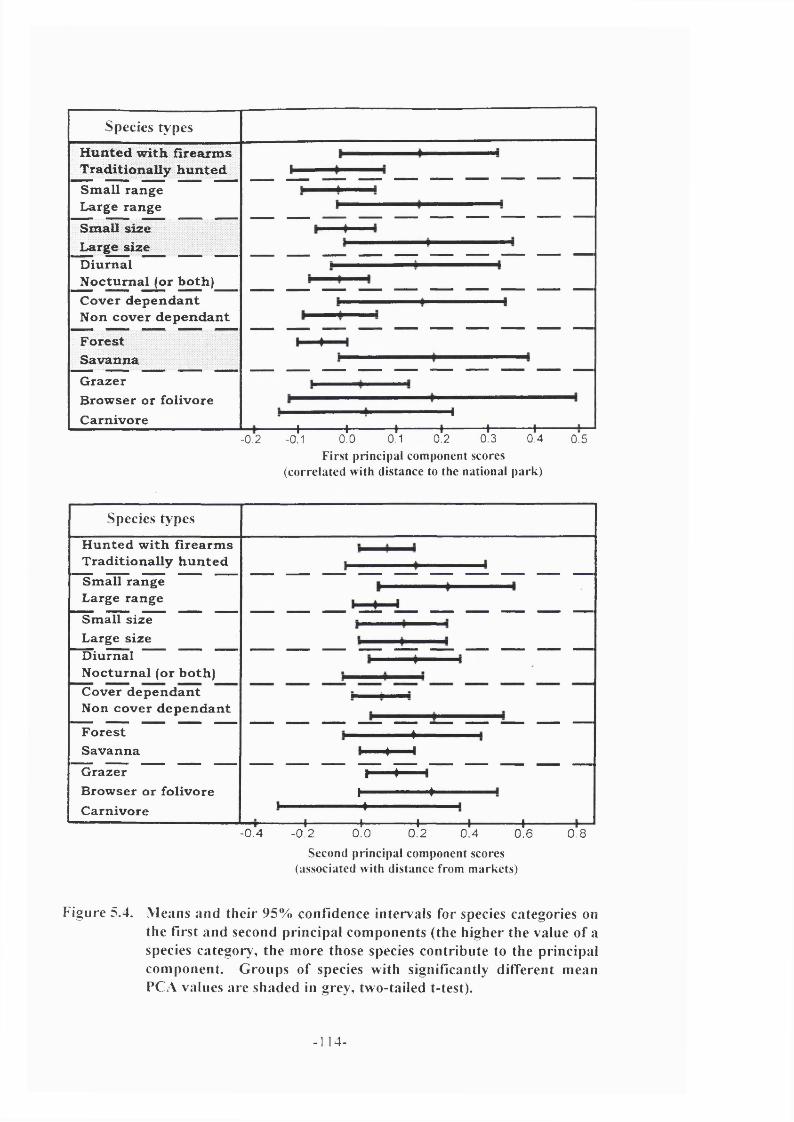
Species types
H u n ted w ith fîrearm s T raditionally h u n tedSm all range Large range
Sm all s ize Large s izeDiurnalN octurnal (or both)C over dep en d an t Non cover d ependan t
F orestSavannaGrazerBrowser or fo livore Carnivore H
+ + + + + +- 0.2 0.4-0.1 0.0 0.1 0.2 0.3
First principal component scores (correlated with distance to the national park)
0.5
Species types
H unted w ith firearm s T raditionally h u n tedSm all range Large rangeSm all s ize Large s izeDiurnalN octurnal (or both) Cover dependan t Non cover dep en d an t
F orestSavanna
4-I- 4— 1
GrazerBrowser or fo livore Carnivore
r ■■4— 4 I f4-
— I—- 0.2
— 4—0.0
— 1—0.2
— I—0.4
— I—0.6-0.4 0.8
Second principal component scores (associated with distance from markets)
Figure 5.4. M eans and their 95% confidence intervals for species categories on the first and second principal com ponents (the higher the value of a species category, the more those species contribute to the principal com ponent. G roups of species with significantly different mean PCA values are shaded in grey, two-tailed t-test).
- 1 1 4 -
5.8 Discussion
Two measures, presence and relative abundance, have been used to assess the effect
o f human activity on mammal distribution. Mammal presence is a reliable measure,
but does not provide the detail required to understand fully the relationship between
the performance o f the population and the explanatory variable. Furthermore, only a
limited selection o f mammals could be included in some o f the analyses used.
Conversely, faecal counts, as a relative measure o f abundance, describe the
relationship between the explanatory variables and animal performance in much
greater detail than presence alone. However, they are unlikely to provide a reliable
measure o f mammal abundance, because o f the problems o f inferring animal density
from faecal counts.
Nevertheless, there was a high level o f consistency between the analyses o f presence
and abundance. O f the three variables representing human activity, distance from the
National Park appears to have the strongest influence on the distribution o f wildlife.
The chi-squared analysis showed that the presence o f both elephants and kob was
significantly associated with proximity to the National Park. Mammal species
richness is also highly correlated with distance from the Park. Finally, the first
principal component, which accounted for 65.7% o f the variation o f the abundance o f
all species across the transects, was highly correlated with distance from the Park.
5.8.1 M arkets and m am m al distributions
The relationship between distance from markets and mammal distribution was non
significant. However the correlation between the second principal component, which
accounts for 14.5% for the variation in the density o f faecal counts, and the distance
from markets approached statistical significance (p = 0.075). This suggests that
markets may influence the distribution o f hunting intensity. Furthermore, both the
distribution o f species on the second principal component axis (Figure 5.4) and the
polar ordination (Figure 5.3) suggest that some o f the smaller species, such as
baboons, warthogs and porcupines, are negatively associated with proximity to
-115-
markets. This has ecological repercussions for wildlife populations. A number o f
authors have shown that the monetary value o f bushmeat varies spatially as a function
o f transport costs (see Godoy and Bawa 1993). The urban profit margin makes it
more beneficial to exploit non-timber forest products at closer proximity to markets
(Abbot 1996). This suggests that wildlife population densities will vary as a function
o f distance from urban markets and from principal transport networks leading to
those markets. The distribution o f markets, and the roads that connect them
potentially subdivides animal populations and can lead to population fragmentation.
Fragmentation is fundamental to the process o f species extinction (Maurer 1994), and
therefore, the potential for markets to fragment wild mammal populations appears to
be important.
By contrast, Gadsby (1990) suggests that market factors alone do not explain hunting
intensity. The higher profits associated with hunting in close proximity to the market
are offset by the fact that people in these areas can profitably market agricultural
products. These products are bulkier than bushmeat, and they have prohibitively high
transport costs at greater distances from the markets. Thus, hunting provides one o f
the few income generating activities for isolated communities who are unable to
transport their high volume agricultural products profitably. Thus, there may be a
higher incentive to exploit bushmeat at greater distances from markets because
transport costs are not significant.
5.8.2 Agriculturalists and mammal distributions
The presence o f agricultural communities is not associated with a statistically
significant decrease in the presence and abundance o f mammals. Indeed, the presence
o f agricultural communities is associated with a non-significant increase in mammal
species richness. Wilkie and Finn (1990) have studied the relationship between
human presence and the diversity and abundance o f terrestrial mammals o f the Ituri
Forest, in Congo. They found that forest clearing associated with agricultural activity
did not significantly affect 16 o f the 19 mammal species examined. The other three
species, okapi, yellow backed duikers and leopards, are less abundant in secondary
forest. The larger ungulates appeared to be less abundant near villages, but they
-116-
suggest that this could equally be due to increased hunting pressure near the markets.
They conclude that secondary forest is probably able to support populations at similar
or greater densities to climax forest, and refer to Eisenberg and Seidensticker’s
(1976) findings to support their claims. This South Asian study suggested that
mosaic habitats, consisting o f secondary, post agricultural vegetation and climax
forest, support a greater animal biomass than mature tropical forest. Johns and
Skorupa’s (1987) review o f the effects o f habitat modification on primates show that
moderate habitat disturbance from agriculture is unlikely to provoke a decline in
primate populations.
5.8.3 The national p ark and m am m al distribution
Distance from the National Park consistently explained animal distribution and
abundance. It is difficult to disassociate the effects o f habitat from those o f wildlife
protection because the two are spatially correlated. One plausible explanation is that
the higher species richness at distances nearer the National Park can be attributed to
the unique habitat o f the area, whilst the high abundance o f large mammals can be
attributed to the protection regime in the National Park. Indeed, the 31 large
mammal species recorded in the Reserves is unusually high for an African ecosystem,
if compared to both forested habitats (Prins and Reitzma 1989, Wilkie and Finn 1990,
White 1994), and savanna habitats (Lamprey 1964, Dowsett 1966, Montford 1972,
Leuthold and Leuthold 1976). The explanation may lie in the habitat structure o f the
ecosystem. The area closest to the National Park represents a forest savanna
boundary, where both savanna and forest mammals coexist. This may explain the
significantly higher species richness associated with proximity to the National Park:
past inventories have recorded a total o f 46 mammals in the Reserves compared to 35
in the Park (Verschuren 1958, Hillman-Smith 1989).
The abundance o f large savanna mammals at close proximity to the National Park is
perhaps best explained by the protection regime within the Park. This agrees with the
assessment o f animal distributions as a whole, based on the aerial counts, which show
the greatest abundance o f large mammals to be concentrated in National Park
(Hillman-Smith et a l 1995). A number o f studies have shown that investment in anti-
117-
poaching contributes to the higher abundance o f large targeted mammals (Leader-
Williams and Albon 1988, Jachman and Billiouw 1997). The comparison between
animal densities inside the Park, where investment in conservation is high, and in the
Reserves, where investment is low, supports this (Table 5.1). Even giraffes, whose
more suitable habitat is in the Reserves, are more abundant in the Park. Similar
patterns were revealed when mammal community structures were examined in
relation to the explanatory factors. The principal components analysis showed that
the mammals whose abundance varied the most with distance from the Park were
typically large savanna species. This was also shown by the polar ordination (Figure
5.3). These species are also targeted by hunters, and their abundance is likely to be
greatest in the National Park where off-take through poaching is restricted.
Whilst the exact causes o f variation in mammal distribution and abundance are
difficult to establish from these data, what has become clear from this analysis is that
the low density presence o f subsistence agricultural populations does not have a
significant impact on wildlife distribution within the Reserves. This is an important
finding if human communities are to be perceived as an integral part o f a sustainable
ecosystem.
-118-
5.9 Conclusion
Although the National Park has an overwhelming effect on the abundance o f certain
large mammals, the results o f this study show that human presence, as indicated by
agricultural field cover, does not appear to affect mammal distribution. The
consistent absence o f any relationship between the presence o f agriculturalists and
animal presence and abundance suggests that this result is not an artefact o f an
inadequate sample size. The results contribute to an increasing body o f evidence
which suggests that, contrary to the received wisdom, human presence alone does not
provoke wildlife depletion. The effects o f markets on the distribution and abundance
o f species only approaches statistical significance. This is insufficient evidence to
state that markets are having an impact on animal distribution. However, a larger
sample size would be required to answer this question appropriately.
Proximity to the National Park was taken as an indicator o f the effects of
conservation activities on wildlife distribution and abundance. The variable is highly
correlated with animal presence and abundance, emphasising the importance o f the
National Park for protecting large mammals. The exploratory analysis o f mammal
community structure suggests that the National Park boundary represents a niche
overlap for forest and savanna type species. This would explain the greater species
richness which occurs near to the Park. The significantly greater large mammal
abundance close to the Park would appear to result from the Park’s quality as a
‘sanctuary’ for these species.
-119-
Chapter 6
Tem poral V ariations o f A nim al A bundance
6.1 Summary
The previous chapter showed that high mammal abundance was positively correlated
with proximity to the National Park. Two features characterise the National Park in
contrast to the surrounding Hunting Reserves. First, the National Park is the focus o f
intensive wildlife protection activities. Second, the National Park is composed o f
savanna grassland habitat, which is known to be selected by large mammal
populations (Sinclair and Arcese 1995). By contrast, the surrounding habitats are
more densely wooded. Thus, both the management practices within the National
Park and the habitat structure o f the ecosystem as a whole could explain the unusual
spatial variations in large mammal abundance. This contributes to a dilemma
frequently encountered in the ecological research o f complex environments, whereby
causation cannot easily be distinguished from correlation (Inamdar 1996). The
present chapter addresses this question by analysing temporal and spatial variations in
large mammal abundance in relation to known management practices. These analyses
show that the abundance o f most mammals is correlated with management intensity,
both temporally and spatially.
120-
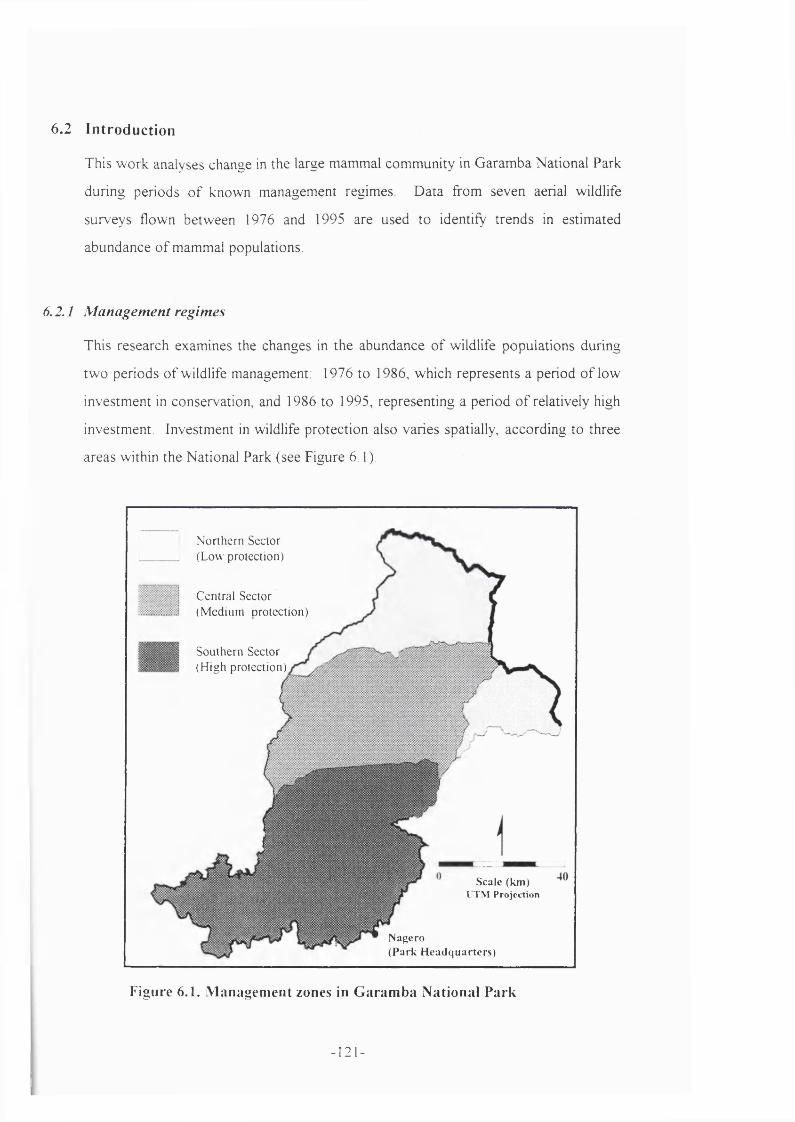
6.2 Introduction
This work analyses change in the large mammal community in Garamba National Park
during periods o f known management regimes. Data from seven aerial wildlife
surveys flown between 1976 and 1995 are used to identify trends in estimated
abundance o f mammal populations.
6.2.1 M anagem ent regimes
This research examines the changes in the abundance o f wildlife populations during
two periods o f wildlife management: 1976 to 1986, which represents a period o f low
investment in conservation, and 1986 to 1995, representing a period o f relatively high
investment. Investment in wildlife protection also varies spatially, according, to three
areas within the National Park (see Figure 6.1).
Northern Sector (Low protection)
Central Sector (Medium protection)
Southern Sector (High protection)
Scale (km) L'TM Projection
Nagero(Park Headquarters)
Figure 6.1. M anagem ent zones in G aram ba N ational Park
- 1 2 1 -
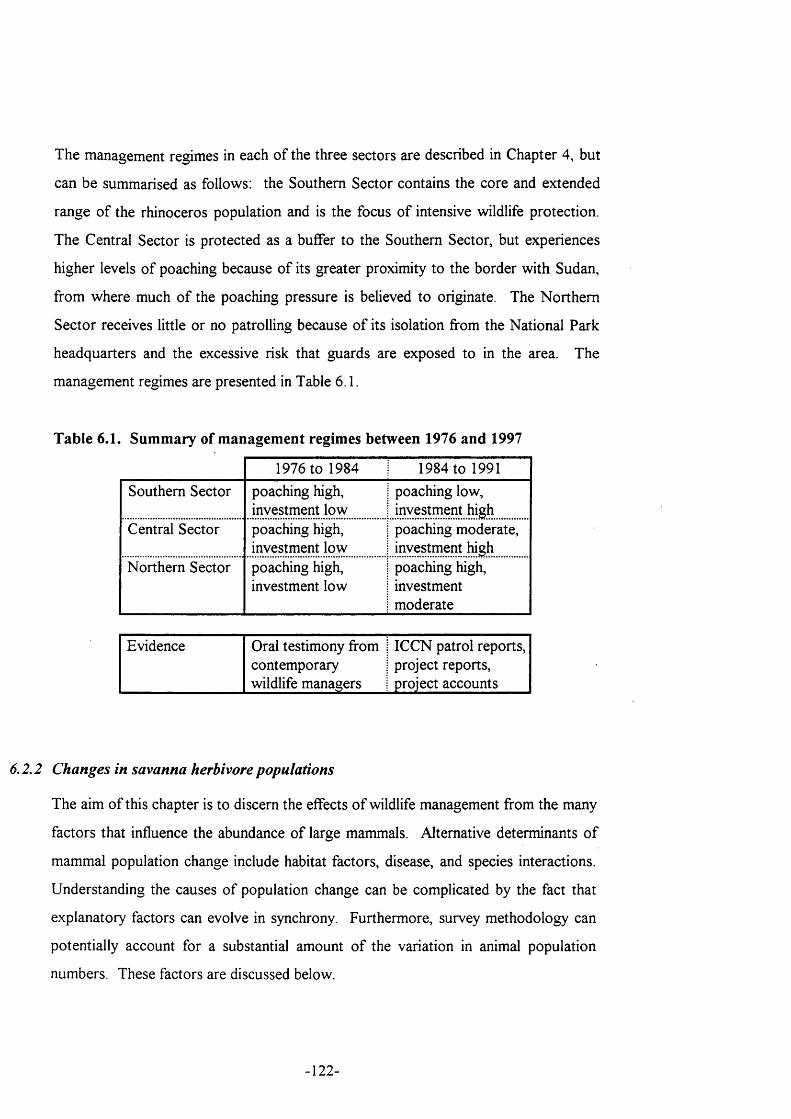
The management regimes in each o f the three sectors are described in Chapter 4, but
can be summarised as follows: the Southern Sector contains the core and extended
range o f the rhinoceros population and is the focus o f intensive wildlife protection.
The Central Sector is protected as a buffer to the Southern Sector, but experiences
higher levels o f poaching because o f its greater proximity to the border with Sudan,
from where much o f the poaching pressure is believed to originate. The Northern
Sector receives little or no patrolling because o f its isolation from the National Park
headquarters and the excessive risk that guards are exposed to in the area. The
management regimes are presented in Table 6 .1.
Table 6.1. Summary of management regimes between 1976 and 1997
1976 to 1984 1984 to 1991Southern Sector poaching high,
investment lowpoaching low, investment high
Central Sector poaching high, investment low
poaching moderate, investment high
Northern Sector poaching high, investment low
poaching high,investmentmoderate
Evidence Oral testimony from contemporary wildlife managers
ICCN patrol reports, project reports, project accounts
6.2.2 Changes in savanna herbivore populations
The aim o f this chapter is to discern the effects o f wildlife management from the many
factors that influence the abundance o f large mammals. Alternative determinants o f
mammal population change include habitat factors, disease, and species interactions.
Understanding the causes o f population change can be complicated by the fact that
explanatory factors can evolve in synchrony. Furthermore, survey methodology can
potentially account for a substantial amount o f the variation in animal population
numbers. These factors are discussed below.
122-
Many ecological theories have promoted the notion that, in the absence o f human
interference, mammal populations are stable. However, with increased access to long
term ecological data for a number o f eastern and southern African savanna
ecosystems, this notion has increasingly been brought into question (Owen-Smith
1988). Several authors emphasize dynamic disequilibrium, and not stasis, as the
dominant process in savanna ecology (Dublin et a l 1990, Sinclair 1995). These
authors argue that unpredictable rainfall, and the complex interplay o f randomly
varying, but synergistic factors such as fire, grazing, browsing and disease accounts
for most o f animal (and plant) population change.
Coe et a l (1976) have shown a significant correlation between large savanna
herbivore biomass and rainfall. Similarly, Owen-Smith (1988) has shown that kudu
populations in Kruger National Park, South Africa, increased by almost 250 percent
in the 1970s and demonstrated that this could largely be attributed to changing
rainfall. Changes in the Tsavo ecosystem in Kenya have inflamed the debate over the
causes o f ecological change. The so-called ‘elephant problem’ has focused attention
on the role o f a single species in influencing the structure o f the animal community as
a whole. It was argued that the growth o f the elephant populations within the
ecosystems in the late 1960s and early 1970s would profoundly influence the
community ecology, and lead to catastrophic declines in other species populations.
Ultimately, it was shown that the absence o f rainfall was the most significant
determinant o f population abundance; the drought o f 1970 to 1972 caused a
catastrophic decline in elephant numbers within the Tsavo ecosystem (Corfield 1973).
Subsequent studies in Tsavo similarly demonstrate a lack o f inter-species interactions
in determining species abundance, whilst emphasising the significance o f
unpredictable rainfall (Inamdar 1996).
The studies mentioned above relate largely to semi arid savanna environments, with
low mean annual, though highly variable, rainfall. However, the Garamba ecosystem
receives over 1200mm o f rainfall, which rarely falls below 800mm (Hillman Smith
1989, see Figure 2.2). Although the national park shares many o f the large herbivore
species found in the more arid habitats described above, it is unlikely that rainfall
-123-
regulates population numbers in the same way. Other factors, such as disease, have
been proposed as factors driving disequilibrium ecology (Sinclair 1995). In this
thesis, it is argued that conflict is another important stochastic event which has
significant ecological repercussions.
Thus, the present Chapter begins with the hypothesis that levels o f human off-take
has been the primary determinant o f change in mammal population abundance in the
Garamba ecosystem between 1976 and 1995. Conservation practices regulate the
offtake o f wildlife by hunters. Thus, the level o f investment in maintaining the laws o f
conservation should influence the rate o f population growth for large mammal
species. The present analyses test whether the interplay between human offtake and
wildlife protection explains the variation in mammal abundance within the Garamba
ecosystem by assessing the variations in population abundance over time and space
and between species under known management regimes.
Two approaches are used. The first simply examines the variations in animal
abundance over time and space relative to the management regimes shown in Table
6.1. The second explores the relationships between species, particularly between
large and small mammals. Damuth (1981) proposes that a species assemblage will
contain more small species than large species. Tests o f the allometric laws which
relate population density to body size (D:M) consistently produce a significant
negative linear relationship when compared on logarithmically transformed scales
(Peters 1983, Cotgreave and Stockley 1994, Silva and Downing 1995). Thus,
Damuth (1981) asserts that 74% o f global variations in the densities o f herbivorous
mammals can be explained by body mass alone. It is argued that this results from the
relationship between population energy use and body mass, to produce the ‘rule o f
energetic equivalence’ (an explanation for this rule can be found in Currie and Fritz
1993, and is critiqued by Blackburn et a l 1993). However, the debate over the
validity o f this explanation is not o f direct relevance here. What is important is the
empirical consistency o f the results when the log-log regression is applied to large
species assemblages (see Table 6.2).
-124-
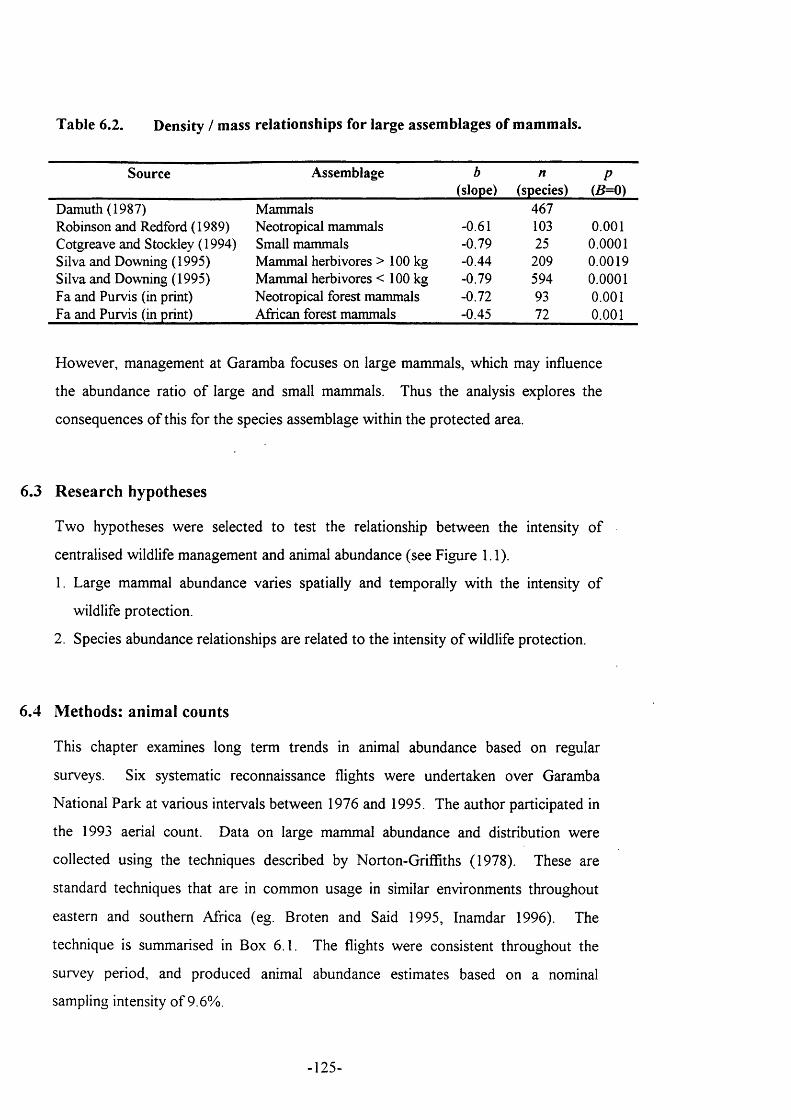
Table 6.2. Density / mass relationships for large assemblages of mammals.
Source Assemblage b n P(slope) (species) (B=0)
Damuth (1987) Mammals 467Robinson and Redford (1989) Neotropical mammals -0.61 103 0.001Cotgreave and Stockley (1994) Small mammals -0.79 25 0.0001Silva and Downing (1995) Mammal herbivores > 100 kg -0.44 209 0.0019Silva and Downing (1995) Mammal herbivores < 100 kg -0.79 594 0.0001Fa and Purvis (in print) Neotropical forest mammals -0.72 93 0.001Fa and Purvis (in print) African forest mammals -0.45 72 0.001
However, management at Garamba focuses on large mammals, which may influence
the abundance ratio o f large and small mammals. Thus the analysis explores the
consequences o f this for the species assemblage within the protected area.
6.3 Research hypotheses
Two hypotheses were selected to test the relationship between the intensity o f
centralised wildlife management and animal abundance (see Figure 1.1).
1. Large mammal abundance varies spatially and temporally with the intensity o f
wildlife protection.
2. Species abundance relationships are related to the intensity o f wildlife protection.
6.4 Methods: animal counts
This chapter examines long term trends in animal abundance based on regular
surveys. Six systematic reconnaissance flights were undertaken over Garamba
National Park at various intervals between 1976 and 1995. The author participated in
the 1993 aerial count. Data on large mammal abundance and distribution were
collected using the techniques described by Norton-Griffiths (1978). These are
standard techniques that are in common usage in similar environments throughout
eastern and southern Africa (eg. Broten and Said 1995, Inamdar 1996). The
technique is summarised in Box 6.1. The flights were consistent throughout the
survey period, and produced animal abundance estimates based on a nominal
sampling intensity o f 9.6%.
-125-
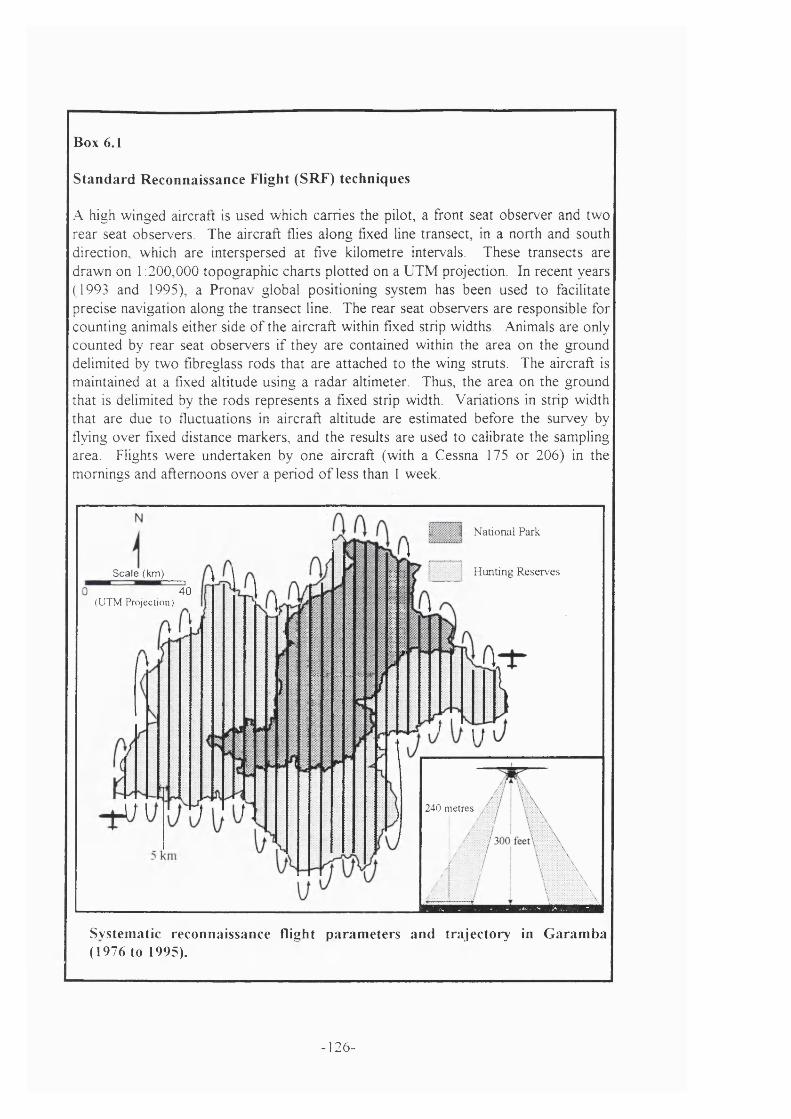
Box 6.1
S tandard Reconnaissance Flight (SRF) techniques
A high winged aircraft is used which carries the pilot, a front seat observer and two rear seat observers. The aircraft flies along fixed line transect, in a north and south direction, which are interspersed at five kilometre intervals. These transects are drawn on 1:200,000 topographic charts plotted on a UTM projection. In recent years (1993 and 1995), a Pronav global positioning system has been used to facilitate precise navigation along the transect line. The rear seat observers are responsible for counting animals either side o f the aircraft within fixed strip widths. Animals are only counted by rear seat observers if they are contained within the area on the ground delimited by two fibreglass rods that are attached to the wing struts. The aircraft is maintained at a fixed altitude using a radar altimeter. Thus, the area on the ground that is delimited by the rods represents a fixed strip width. Variations in strip width that are due to fluctuations in aircraft altitude are estimated before the survey by flying over fixed distance markers, and the results are used to calibrate the sampling area. Flights were undertaken by one aircraft (with a Cessna 175 or 206) in the mornings and afternoons over a period o f less than 1 week.
r j National Park
Hunting ReservesScale (km)
40(UTM Projection)
2 40 metres
Systematic reconnaissance flight param eters and trajectory in G aram ba (1976 to 1995).
-126-
6.5 Appraisal of methods
Several studies have analysed the accuracy o f systematic reconnaissance flight data
(Caughley 1974, ILCA 1983, Inamdar 1996). A number o f parameters may introduce
bias into the aerial count data. This bias usually results in the undercounting o f
animals, particularly the smaller species. Survey altitude emerges as potentially the
most important factor contributing to the undercounting o f mammals. The aircraft’s
altitude represents a trade-off between the detection rate o f mammals and the
sampling intensity o f the survey. Other important parameters which may influence
accuracy include vegetation cover, season, visibility, and the size and behaviour o f
mammals being counted (Inamdar 1996). These are discussed below.
The detection rate o f animals falls sharply with tree cover. The areas with high tree
cover are predominantly in the Hunting Reserves, outside the National Park.
Therefore these areas, although surveyed on several occasions, were not included in
the analysis. Within the National Park gallery forest conceals certain mammals, such
as primates, and therefore this study focuses on the large herbivores. All o f the
surveys except 1984 were undertaken during late dry season, after the fires, when
vegetation cover is lowest.
Visibility may also be related to the season. In Garamba, the late dry season is the
period o f the Harmattan winds which carry dust from the north, together with high
levels o f smoke from the late dry season bums. However, the effect o f low visibility
caused by dust and smoke is likely to be minor at the low altitudes used for the
survey. Inamdar’s (1996) analysis o f aerial count data in Tsavo National Park show
that the seasonal effects on detection rates are non significant.
An important characteristic about the aerial surveys undertaken at Garamba between
1976 and 1995 is the consistency with which they were undertaken. With the
exception o f the 1976 survey, all surveys were coordinated by the same researcher,
who also trained the observers. The same parameters were used during all o f the
counts, and these were based on the original 1976 count. Thus, aircraft altitude, strip
width, transect intervals and locations and airspeed were consistent for all the
-127-

surveys. Consequently, while the sources o f bias mentioned above may have
contributed to undercounting o f animals any errors are likely to be systematic. As
this study is primarily interested in change in mammal populations over time, change
can be accurately detected because o f the methodological consistency o f the aerial
counts over twenty years.
6.6 Analysis
Animal abundance data were estimated following each o f the counts using parametric
statistics. Jolly’s method 2, also known as the ratio method, has been used to
calculate standard errors on the data, from which confidence intervals were drawn
(see Box 6.2, Norton-Griffiths 1978). This technique is used because each transect
line is used as a data point, and therefore the analysis has to compensate for the
unequal size o f transects. T-tests for paired samples were used to test the significance
o f the differences in population abundance between surveys. Two pairs o f surveys,
each separated by approximately ten years, were used to represent change during
periods o f low investment in wildlife protection (1976 to 1986) and periods o f high
investment in wildlife protection (1986 to 1995).
Species abundances vary considerably across the national Park. Consequently, the
variance across the transects is considerable, producing high standard errors and
imprecise estimates. To reduce the variance, the National Park was divided into three
strata according to the density distribution within the National Park. Strictly
speaking, the correct approach is to define the strata prior to the survey, and fly each
stratum independently (Norton Griffiths 1978). However, because o f constraints in
time and flight costs, the transects were flown as continuous transects, and the survey
area was stratified post hoc (Hillman Smith et a l 1995). Stratifying the survey area
post hoc does not present analytical problems because each o f the strata contain the
same sampling intensity. The advantage o f stratifying the data is that the confidence
intervals for the overall count estimates are smaller, and population estimates exist
-128-
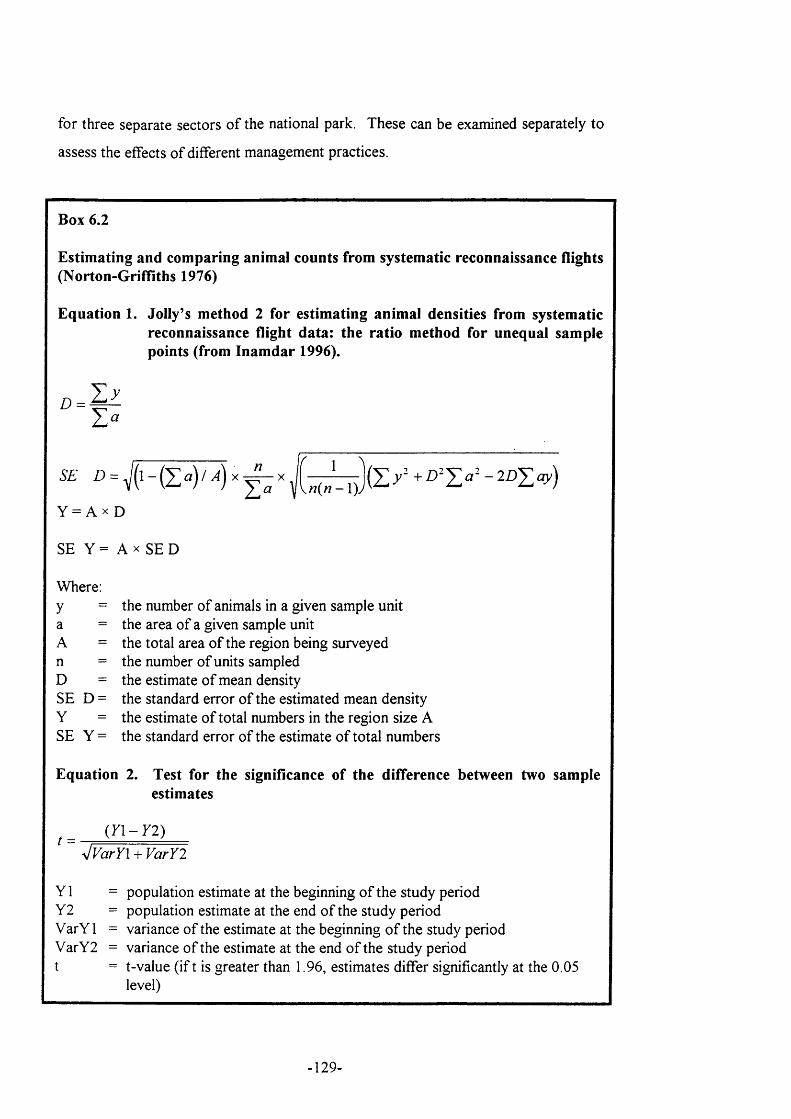
for three separate sectors o f the national park. These can be examined separately to
assess the effects o f different management practices.
Box 6.2
Estimating and comparing animal counts from systematic reconnaissance flights (Norton-Griffiths 1976)
Equation 1. Jolly s method 2 for estimating animal densities from systematicreconnaissance flight data: the ratio method for unequal samplepoints (from Inamdar 1996).
Z) = ^
S£ O = J(l - ( I .) / J) , Y = A X D
SE Y = A X SE D
Where:y = the number o f animals in a given sample unita = the area o f a given sample unitA = the total area o f the region being surveyedn = the number o f units sampledD = the estimate o f mean densitySE D = the standard error o f the estimated mean densityY = the estimate o f total numbers in the region size ASE Y = the standard error o f the estimate o f total numbers
Equation 2. Test for the significance of the difference between two sample estimates
( n - T 2 )
ylVarYl + V arY l
Y1 = population estimate at the beginning o f the study period Y2 = population estimate at the end o f the study period V arYl = variance o f the estimate at the beginning o f the study period VarY2 = variance o f the estimate at the end o f the study period t = t-value (if t is greater than 1.96, estimates differ significantly at the 0.05
level)
-129-
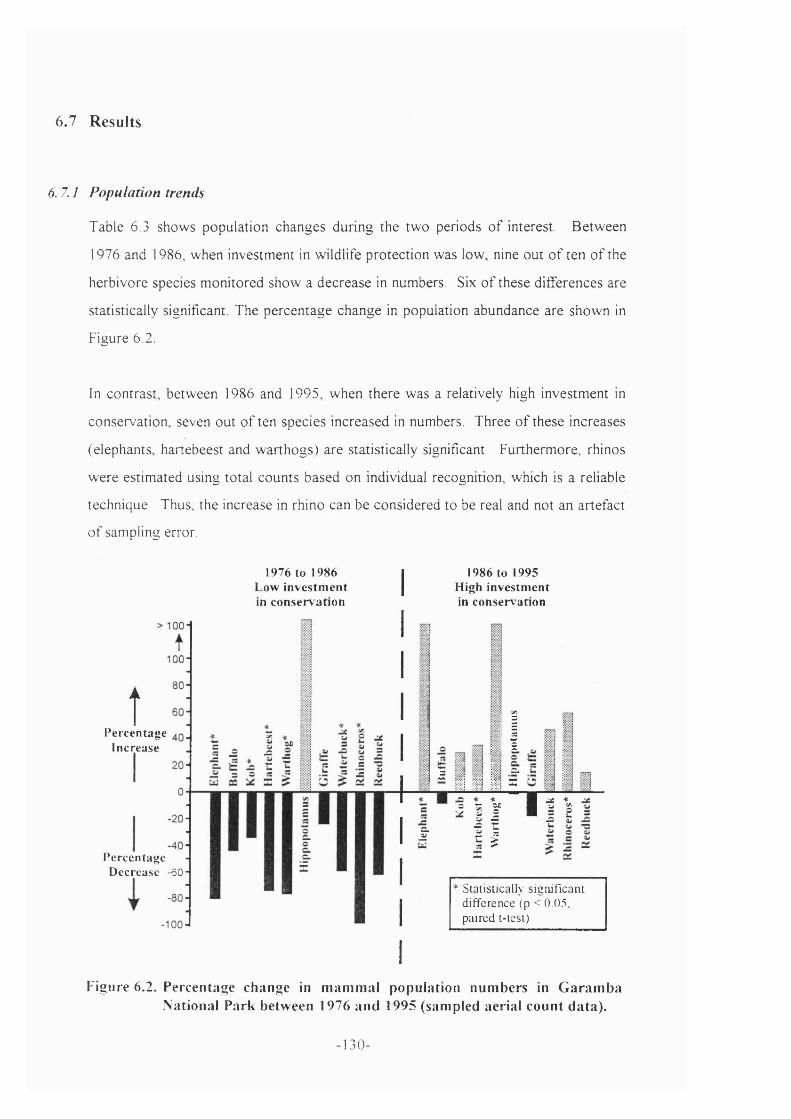
6.7 Results
6. 7.1 Population trends
Table 6.3 show s population changes during the tw o periods o f interest. B etw een
1976 and 1986, w hen investm ent in wildlife p ro tec tion was low, nine out o f ten o f the
herbivore species m onitored show a decrease in numbers. Six o f these d ifferences are
statistically significant. The percen tag e change in population abundance are show n in
F igure 6.2.
In con trast, betw een 1986 and 1995, w hen there w as a relatively high investm ent in
conservation , seven out o f ten species increased in numbers. T hree o f these increases
(elephants, hartebeest and w arthogs) are statistically significant. F urtherm ore, rhinos
w ere estim ated using to tal counts based on individual recognition, which is a reliable
technique. Thus, the increase in rhino can be considered to be real and not an artefact
o f sam pling error.
1976 to 1986 Low investm ent in conservation
ÎPercentage
Increase
Percentage Decrease -60
1986 to 1995 High investm ent in conservation
=1i
i ! I c.“ iii =
1 III I
r 1 1
* Statistically significant difference (p < 0.05. paired t-test)
Figure 6.2. Percentage change in m am m al population num bers in G aram ba National Park between 1976 and 1995 (sampled aerial count data).
-1 j 0 -
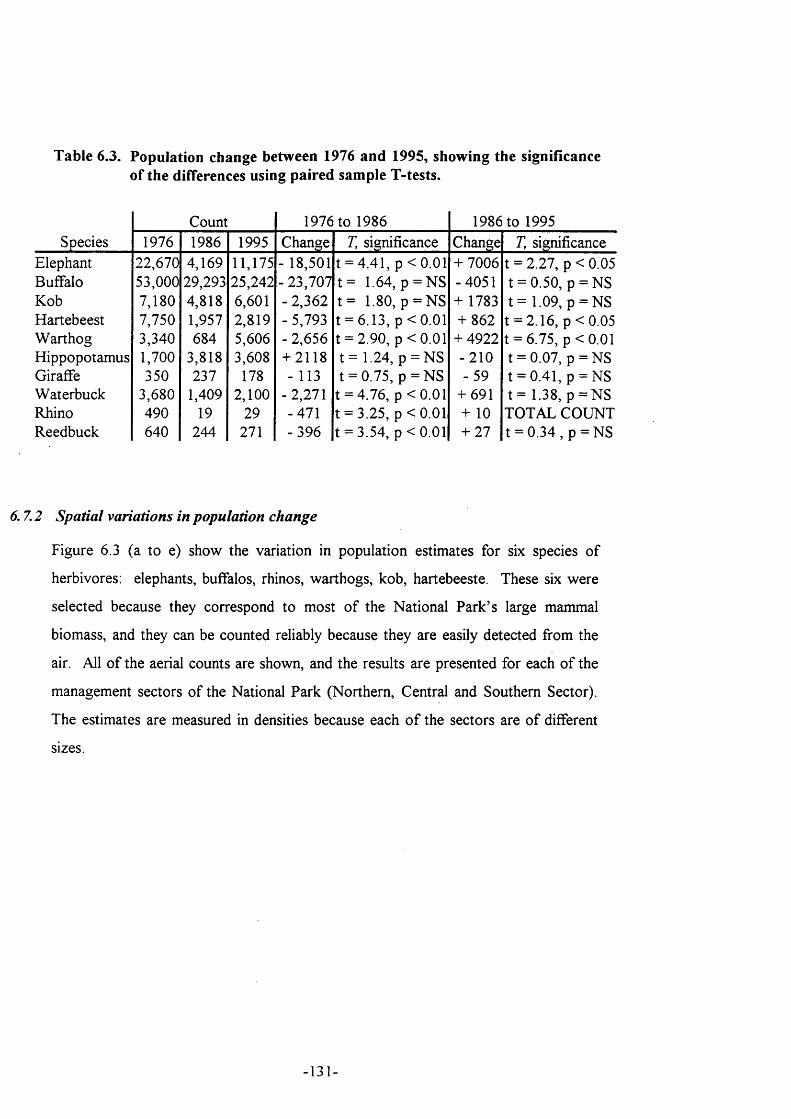
Table 6.3. Population change between 1976 and 1995, showing the significance of the differences using paired sample T-tests.
Count 1976 to 1986 1986 to 1995Species 1976 1986 1995 Change 7, significance Change 7 significance
Elephant 22,670 4,169 11,175 - 18,501 t = 4.41, p < 0.01 + 7006 t = 2.27, p < 0.05Buffalo 53,000 29,293 25,242 - 23,707 t = 1.64, p = NS -4051 t = 0.50, p = NSKob 7,180 4,818 6,601 - 2,362 t = 1.80, p = N S + 1783 t = 1.09, p = NSHartebeest 7,750 1,957 2,819 - 5,793 t = 6.13, p < 0.01 + 862 t = 2.16, p < 0.05W arthog 3,340 684 5,606 - 2,656 t = 2.90, p < 0.01 + 4922 t = 6.75, p < 0.01Hippopotamus 1,700 3,818 3,608 + 2118 t = 1.24, p = N S -2 1 0 t = 0.07, p = NSGiraffe 350 237 178 - 113 t = 0.75, p = NS -5 9 t = 0.41, p = NSW aterbuck ^ 6 8 0 1,409 2,100 -2,271 t = 4.76, p < 0.01 + 691 t = 1.38, p = NSRhino 490 19 29 -471 t = 3.25, p < 0.01 + 10 TOTAL COUNTReedbuck 640 244 271 -3 9 6 t = 3.54, p < 0.01 + 27 t = 0.34 , p = NS
6. 7.2 Spatial variations in population change
Figure 6.3 (a to e) show the variation in population estimates for six species o f
herbivores: elephants, buffalos, rhinos, warthogs, kob, hartebeeste. These six were
selected because they correspond to most o f the National Park’s large mammal
biomass, and they can be counted reliably because they are easily detected from the
air. All o f the aerial counts are shown, and the results are presented for each o f the
management sectors o f the National Park (Northern, Central and Southern Sector).
The estimates are measured in densities because each o f the sectors are o f different
sizes.
-131-
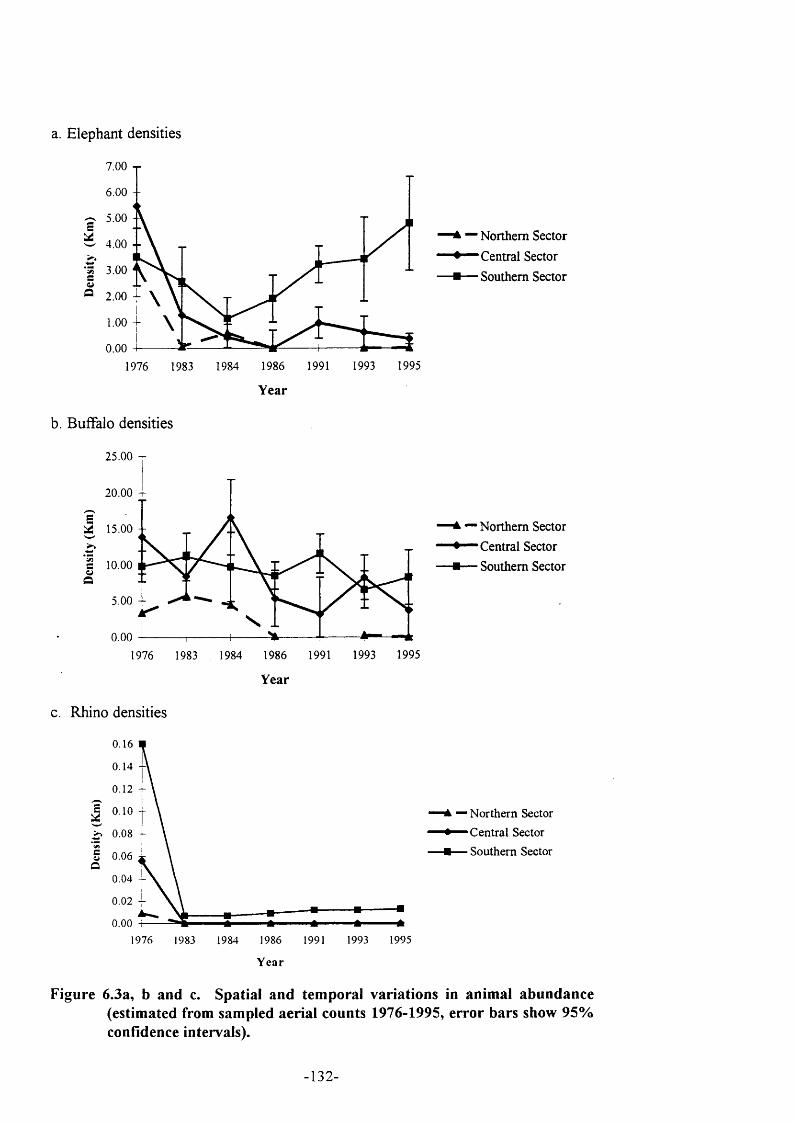
a. Elephant densities
7.00 - r
6.00 - -
4.00 --
3 3.00
■A — Northern Sector • " Central Sector
# — Southern Sector
1993 1995
b. Buffalo densities
25.00 T
20.00
I 15.00 --
' I 10.00CJQ5.00
1976 1983 1984 1986 1991 1993 1995
Year
c. Rhino densities
0 .1 6
0 .1 4
0.12
0.10 r
>> 0 .0 8 -
g 0 .0 6 i
0 .0 4 -
0.02 -
0.0019951986 1991 19931976 1983 1984
— Northern Sector Central Sector
-#— Southern Sector
' Northern Sector
‘Central Sector
• Southern Sector
Year
Figure 6.3a, b and c. Spatial and temporal variations in animal abundance (estimated from sampled aerial counts 1976-1995, error bars show 95% confidence intervals).
-132-
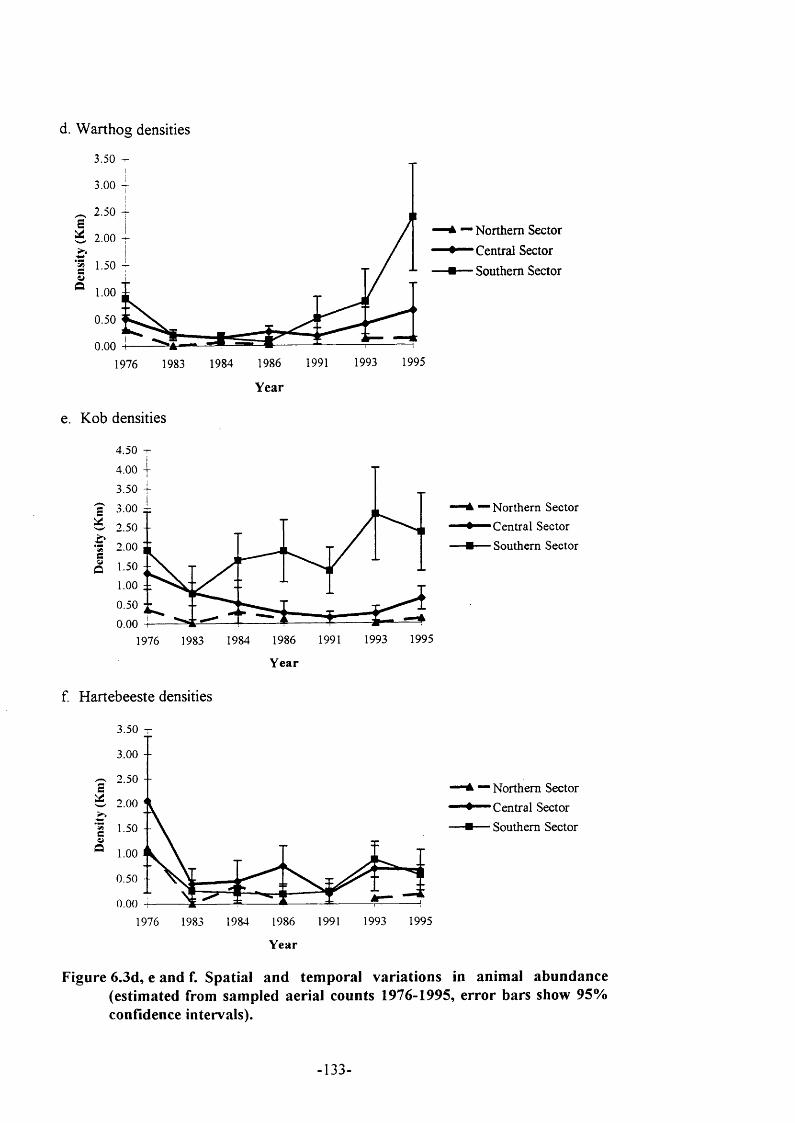
d. Warthog densities
3.50 -
3.00
2.50 TS
sa 1.00
0.50
0.001995199319911986198419831976
— Northern Sector— Centrai Sector— Southern Sector
Year
e. Kob densities
II -
-------i-------t z j0 .0 0 -f
1976 1983 1984
f. Hartebeeste densities
3.50 1-
1986 1991
Year
3.00 --
2.50 --E% 2.00r*
1.50 --I0.50 --
199519931986 19911976 19841983
Year
là — Northern Sector '♦'■—Central Sector 4#— Southern Sector
1993 1995
— Northern Sector • Central Sector
Hi— Southern Sector
Figure 6.3d, e and f. Spatial and temporal variations in animal abundance (estimated from sampled aerial counts 1976-1995, error bars show 95% confidence intervals).
133-
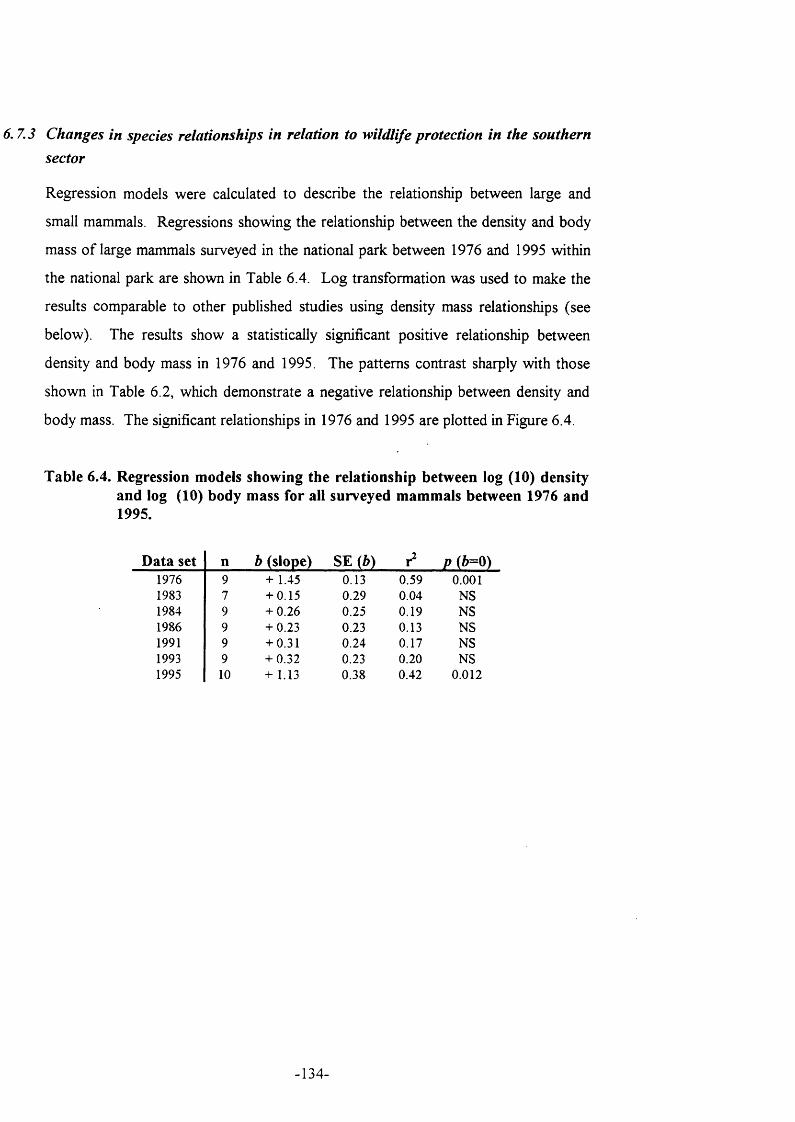
6. 7.3 Changes in species relationships in relation to wildlife protection in the southern sector
Regression models were calculated to describe the relationship between large and
small mammals. Regressions showing the relationship between the density and body
mass o f large mammals surveyed in the national park between 1976 and 1995 within
the national park are shown in Table 6.4. Log transformation was used to make the
results comparable to other published studies using density mass relationships (see
below). The results show a statistically significant positive relationship between
density and body mass in 1976 and 1995. The patterns contrast sharply with those
shown in Table 6.2, which demonstrate a negative relationship between density and
body mass. The significant relationships in 1976 and 1995 are plotted in Figure 6.4.
Table 6.4. Regression models showing the relationship between log (10) density and log (10) body mass for all surveyed mammals between 1976 and 1995.
Data set n b (slope) SE ib) r= P (*=0)1976 9 + 1.45 0.13 0.59 0.0011983 7 + 0.15 0.29 0.04 NS1984 9 + 0.26 0.25 0.19 NS1986 9 + 0.23 0.23 0.13 NS1991 9 + 0.31 0.24 0.17 NS1993 9 + 0.32 0.23 0.20 NS1995 10 + 1.13 0.38 0.42 0.012
-134-
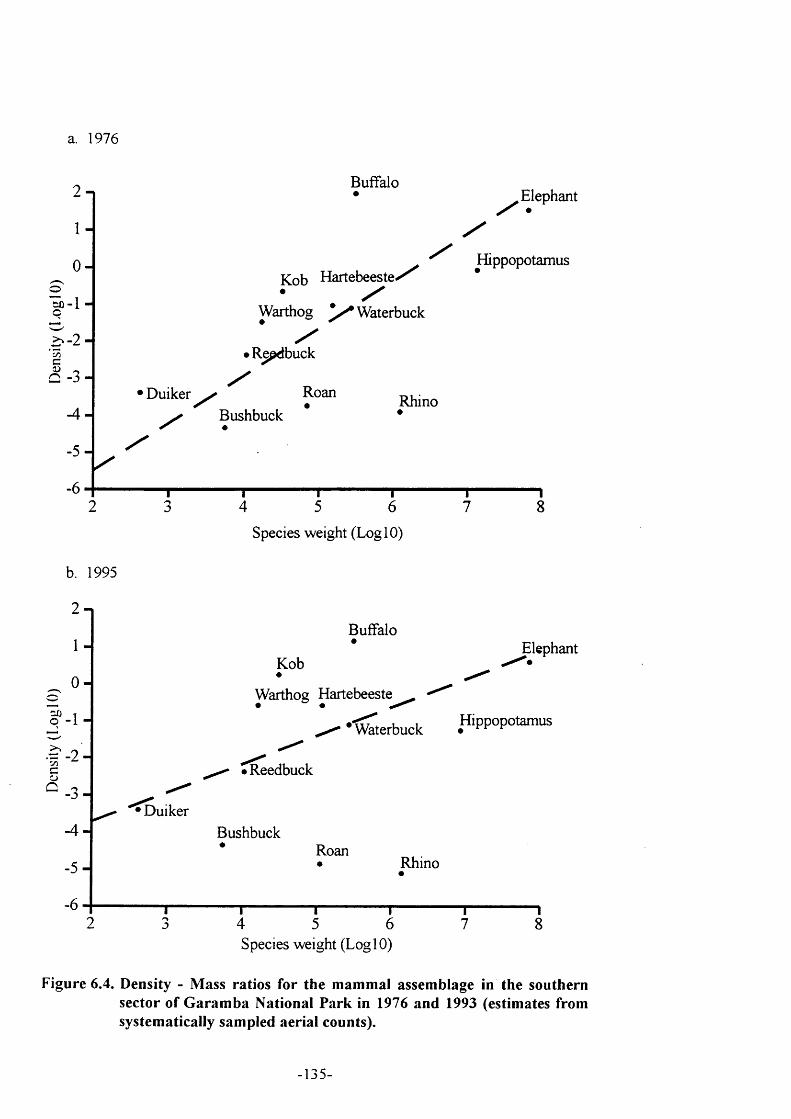
oi:ü)
I
a. 1976
2 n
1 -
0 -
1 -
2 -
3 -
4 -
5 -
6
BuffaloElephant
DuikerBushbuck
Kob H a r te b e e s te ./ /
Warthog Waterbuck
/R^pdbuck
Roan
Hippopotamus
Rhino
//
Species weight (Log 10)
b. 1995
2 - |
1 -
0 -
0 - 1
• t -2
&
- 4 -
.5 -
-6
Buffalo
KobElephant
Warthog H a r te b e e s te ^
^ 'IWerbuck H'PPopotamus
' Reedbuck
DuikerBushbuck
RoanRhino
Species weight (Log 10)
Figure 6.4. Density - Mass ratios for the mammal assemblage in the southern sector of Garamba National Park in 1976 and 1993 (estimates from systematically sampled aerial counts).
-135-
6.8 Discussion
The results o f these analyses have revealed some important patterns which support
the results o f other chapters. It is evident from these results that a policy o f wildlife
protection, when effectively implemented, has an overwhelming effect on the growth
o f populations o f very large mammals.
6.8.1 H ypothesis 1: Large m am m al abundance varies spatially and temporally with the
intensity o f wildlife protection.
The two time periods o f high and low investment in wildlife protection provide a
good basis for a natural experiment to test the effects o f investment in wildlife
protection on the abundance o f large mammals. The two periods are approximately
equal in time, and the consistent methodology used for all counts contributes to the
high level o f confidence in the estimate o f change.
Evidence for low investment in conservation between 1976 and 1986 is based on the
absence o f an aid project working in collaboration with the national wildlife agency.
But it must be recognised that investment in conservation is a difficult variable to
measure. Indeed, a study undertaken to assess the standard o f living o f National Park
guards suggest that their purchasing power was infact higher during the period 1976
to 1986 than during the period 1986 to 1995 when the National Park authorities were
receiving support from the aid project (de M erode et a l 1994). This can largely be
attributed to the economic crisis in Congo, whereby the national economy
deteriorated significantly during the 1970s and 1980s (Hart and Hart 1996). The
crisis affected both the guards’ government salaries and the income generating
activities o f the guards and their families. The importance o f insufficient investment
as a constraint to conservation throughout Africa has been emphasised by Leader-
Williams and Albon (1988).
Although the living standards o f the guards may have been higher during 1976 to
1986, the wildlife protection activities undertaken within the National Park were
-136-
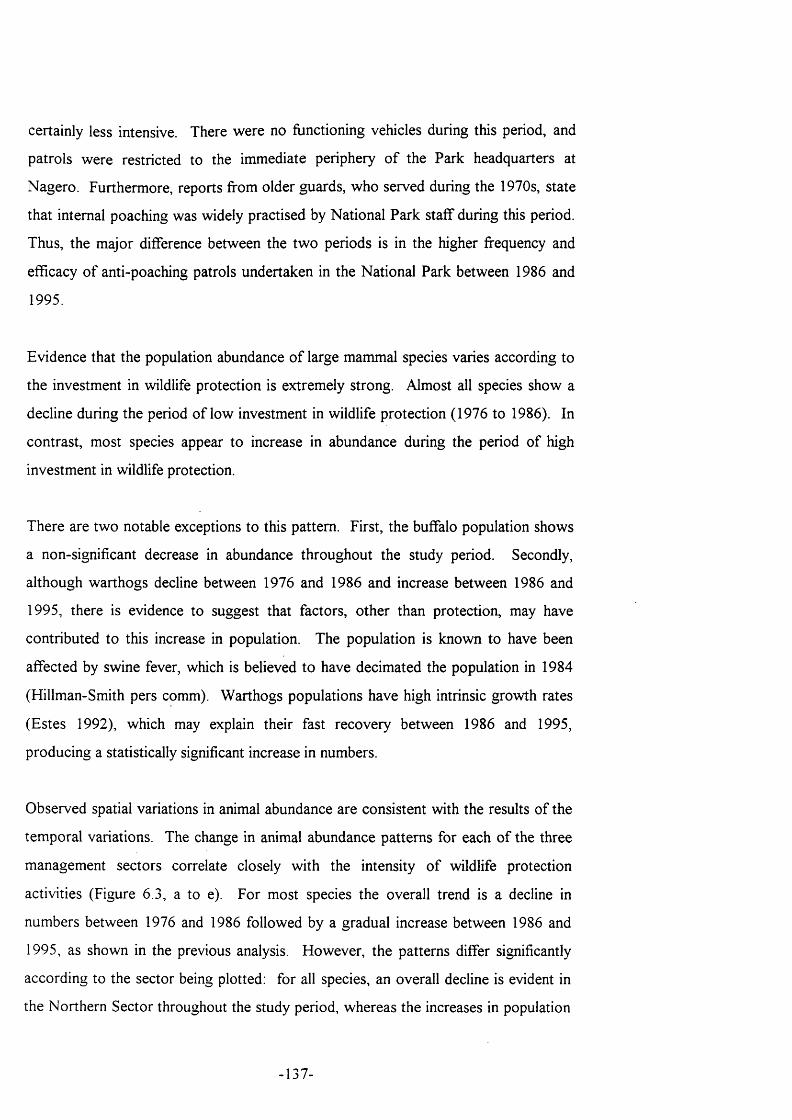
certainly less intensive. There were no functioning vehicles during this period, and
patrols were restricted to the immediate periphery o f the Park headquarters at
Nagero. Furthermore, reports from older guards, who served during the 1970s, state
that internal poaching was widely practised by National Park staff during this period.
Thus, the major difference between the tw o periods is in the higher frequency and
efficacy o f anti-poaching patrols undertaken in the National Park between 1986 and
1995.
Evidence that the population abundance o f large mammal species varies according to
the investment in wildlife protection is extremely strong. Almost all species show a
decline during the period o f low investment in wildlife protection (1976 to 1986). In
contrast, most species appear to increase in abundance during the period o f high
investment in wildlife protection.
There are two notable exceptions to this pattern. First, the buffalo population shows
a non-significant decrease in abundance throughout the study period. Secondly,
although warthogs decline between 1976 and 1986 and increase between 1986 and
1995, there is evidence to suggest that factors, other than protection, may have
contributed to this increase in population. The population is known to have been
affected by swine fever, which is believed to have decimated the population in 1984
(Hillman-Smith pers comm). Warthogs populations have high intrinsic growth rates
(Estes 1992), which may explain their fast recovery between 1986 and 1995,
producing a statistically significant increase in numbers.
Observed spatial variations in animal abundance are consistent with the results o f the
temporal variations. The change in animal abundance patterns for each o f the three
management sectors correlate closely with the intensity o f wildlife protection
activities (Figure 6.3, a to e). For most species the overall trend is a decline in
numbers between 1976 and 1986 followed by a gradual increase between 1986 and
1995, as shown in the previous analysis. However, the patterns differ significantly
according to the sector being plotted; for all species, an overall decline is evident in
the Northern Sector throughout the study period, whereas the increases in population
-137-
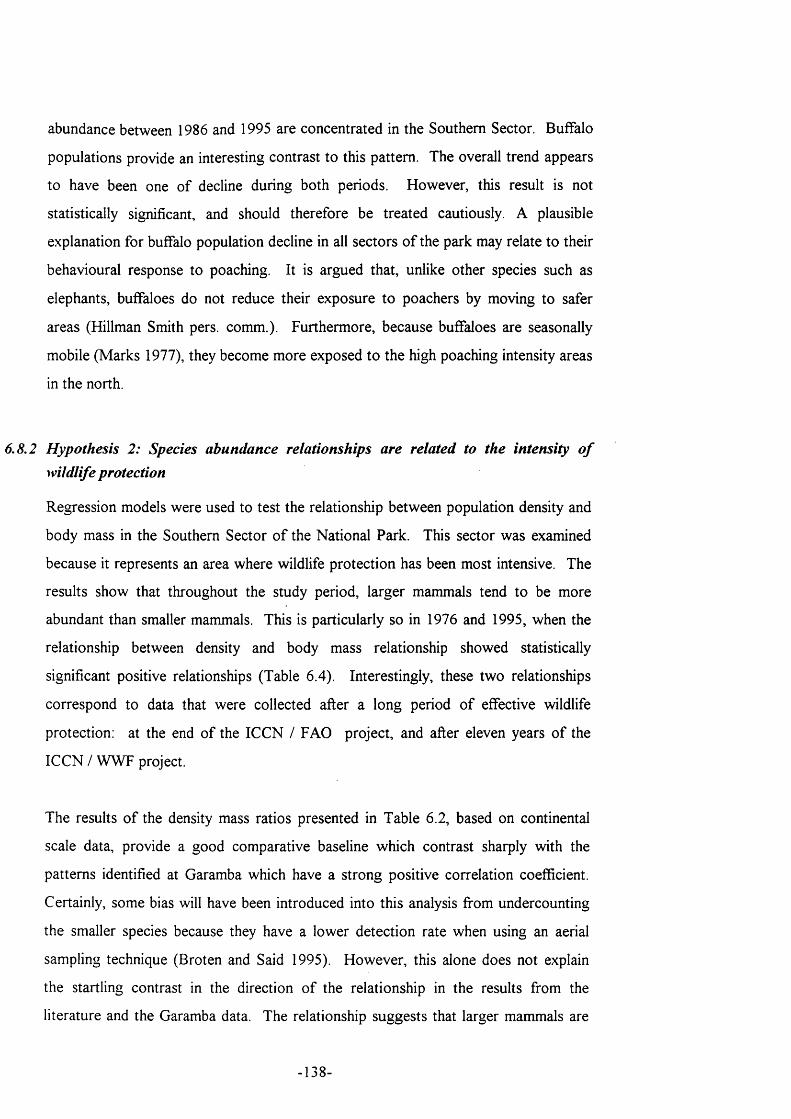
abundance between 1986 and 1995 are concentrated in the Southern Sector. Buffalo
populations provide an interesting contrast to this pattern. The overall trend appears
to have been one o f decline during both periods. However, this result is not
statistically significant, and should therefore be treated cautiously. A plausible
explanation for buffalo population decline in all sectors o f the park may relate to their
behavioural response to poaching. It is argued that, unlike other species such as
elephants, buffaloes do not reduce their exposure to poachers by moving to safer
areas (Hillman Smith pers. comm.). Furthermore, because buffaloes are seasonally
mobile (Marks 1977), they become more exposed to the high poaching intensity areas
in the north.
6.8.2 Hypothesis 2: Species abundance relationships are related to the intensity o f wildlife protection
Regression models were used to test the relationship between population density and
body mass in the Southern Sector o f the National Park. This sector was examined
because it represents an area where wildlife protection has been most intensive. The
results show that throughout the study period, larger mammals tend to be more
abundant than smaller mammals. This is particularly so in 1976 and 1995, when the
relationship between density and body mass relationship showed statistically
significant positive relationships (Table 6.4). Interestingly, these two relationships
correspond to data that were collected after a long period o f effective wildlife
protection: at the end o f the ICCN / PAO project, and after eleven years o f the
ICCN / WWF project.
The results o f the density mass ratios presented in Table 6.2, based on continental
scale data, provide a good comparative baseline which contrast sharply with the
patterns identified at Garamba which have a strong positive correlation coefficient.
Certainly, some bias will have been introduced into this analysis from undercounting
the smaller species because they have a lower detection rate when using an aerial
sampling technique (Broten and Said 1995). However, this alone does not explain
the startling contrast in the direction o f the relationship in the results from the
literature and the Garamba data. The relationship suggests that larger mammals are
138-
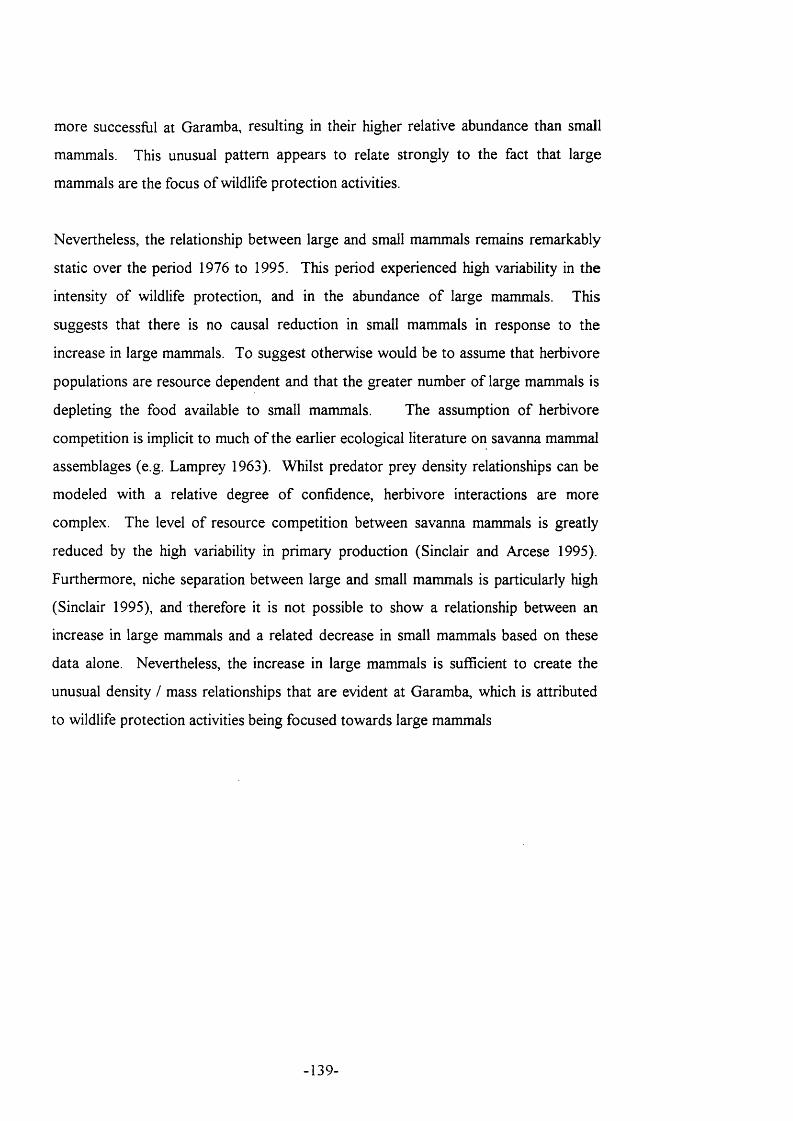
more successful at Garamba, resulting in their higher relative abundance than small
mammals. This unusual pattern appears to relate strongly to the fact that large
mammals are the focus o f wildlife protection activities.
Nevertheless, the relationship between large and small mammals remains remarkably
static over the period 1976 to 1995. This period experienced high variability in the
intensity o f wildlife protection, and in the abundance o f large mammals. This
suggests that there is no causal reduction in small mammals in response to the
increase in large mammals. To suggest otherwise would be to assume that herbivore
populations are resource dependent and that the greater number o f large mammals is
depleting the food available to small mammals. The assumption o f herbivore
competition is implicit to much o f the earlier ecological literature on savanna mammal
assemblages (e.g. Lamprey 1963). Whilst predator prey density relationships can be
modeled with a relative degree o f confidence, herbivore interactions are more
complex. The level o f resource competition between savanna mammals is greatly
reduced by the high variability in primary production (Sinclair and Arcese 1995).
Furthermore, niche separation between large and small mammals is particularly high
(Sinclair 1995), and therefore it is not possible to show a relationship between an
increase in large mammals and a related decrease in small mammals based on these
data alone. Nevertheless, the increase in large mammals is sufficient to create the
unusual density / mass relationships that are evident at Garamba, which is attributed
to wildlife protection activities being focused towards large mammals
-139-
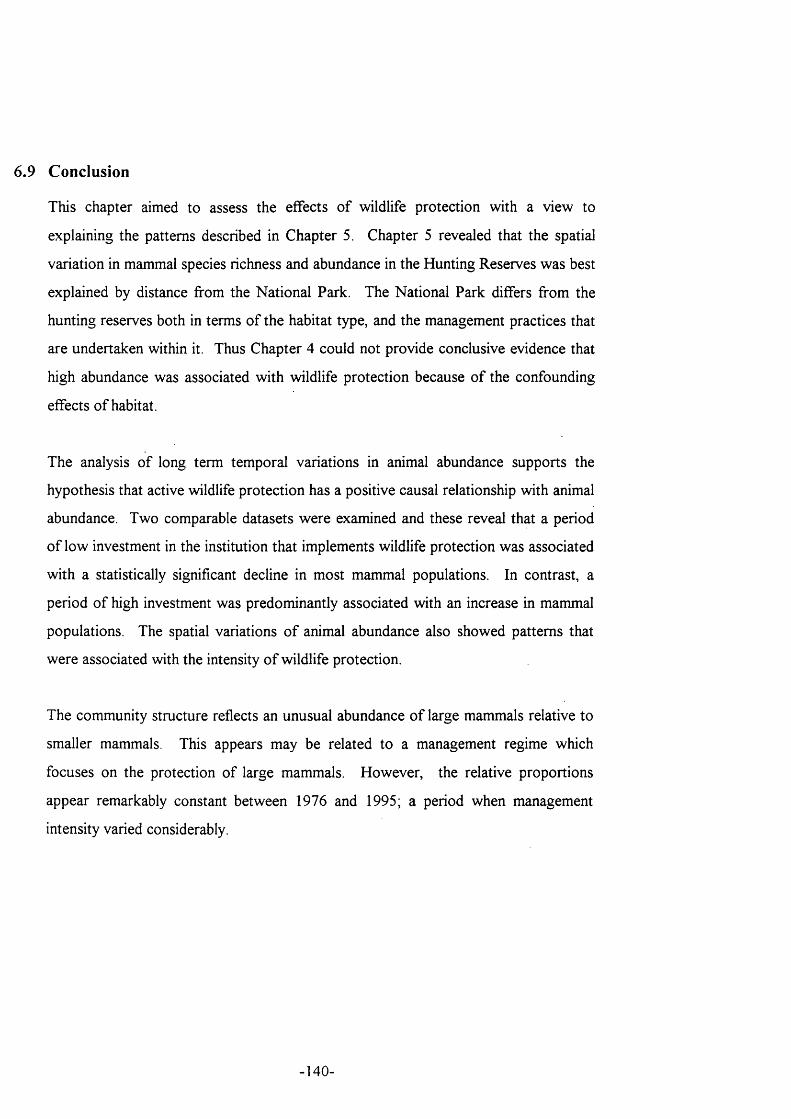
6.9 Conclusion
This chapter aimed to assess the effects o f wildlife protection with a view to
explaining the patterns described in Chapter 5. Chapter 5 revealed that the spatial
variation in mammal species richness and abundance in the Hunting Reserves was best
explained by distance from the National Park. The National Park differs from the
hunting reserves both in terms o f the habitat type, and the management practices that
are undertaken within it. Thus Chapter 4 could not provide conclusive evidence that
high abundance was associated with wildlife protection because o f the confounding
effects o f habitat.
The analysis o f long term temporal variations in animal abundance supports the
hypothesis that active wildlife protection has a positive causal relationship with animal
abundance. Two comparable datasets were examined and these reveal that a period
o f low investment in the institution that implements wildlife protection was associated
with a statistically significant decline in most mammal populations. In contrast, a
period o f high investment was predominantly associated with an increase in mammal
populations. The spatial variations o f animal abundance also showed patterns that
were associated with the intensity o f wildlife protection.
The community structure reflects an unusual abundance o f large mammals relative to
smaller mammals. This appears may be related to a management regime which
focuses on the protection o f large mammals. However, the relative proportions
appear remarkably constant between 1976 and 1995; a period when management
intensity varied considerably.
-140-

Chapter 7
M ultiple P erspectives on W ildlife R esources
7.1 Summary
Chapter 4 presented the planned zonation o f the hunting reserves whereby
conservation practitioners demarcated areas o f ‘conservation priority’ (with high
elephant abundance) and areas o f ‘development priority’ (with high levels o f human
settlement). This mirrors how conservation objectives in the Garamba ecosystem
have traditionally been implemented, by limiting the settlement o f resident populations
and regulating wildlife utilisation through law enforcement: Chapters 5 and 6 show
that these policies meet conservation objectives: areas where human presence is
restricted show higher animal abundance and species richness. However, the cost o f
setting land aside for conservation and its implications for local development have not
been evaluated at Garamba.
Understanding the costs o f conservation in the hunting reserves requires an evaluation
o f competing demands for wildlife resources. This analysis compares resource
distribution in terms o f the priorities expressed by two groups with a stake in wildlife
resources: local residents and conservation officers. GIS and geo-statistical
techniques are used to combine data generated using participatory and quantitative
survey methods so that multiple perspectives on wildlife resources can be compared
systematically. The results show that ‘conservation priority areas’ within the game
reserves are also the areas most valued by local residents for resource use. This
suggests that conservation and local development objectives cannot easily be
reconciled using traditional protectionist paradigms that set aside land for
conservation. This conclusion provides the basis for the second part o f this thesis
which examines alternative approaches to wildlife management in the hunting
reserves.
-141-
7.2 Introduction
Currently, most protected area policies state the dual objective o f maintaining an
area’s biological diversity, and providing services to surrounding populations (WWF,
lU CN and UNEP 1980). In essence, they seek to satisfy the needs o f all
stakeholders. However, the impacts o f protected area policies on local livelihoods are
increasingly being examined. The implementation o f protected areas, by definition,
restricts human access to natural resources. Yet, the value o f the natural resources,
such as wild foods, pasture and fuelwood that are contained within many protected
areas is considerable and can be critical in supporting rural livelihoods in the
developing world (Weaver 1979, Malaisse and Parent 1985, Scoones et a l 1992).
Consequently, it has been shown that, rather than enhancing human welfare,
protected areas can bring about resource alienation which may cause economic
hardship for adjacent human populations (Brockington and Homewood 1996,
Colchester 1997, Pimbert and Gujja 1997).
The evaluation o f the costs and benefits o f a policy is a key element o f policy
appraisal (Department o f the Environment 1992). Yet there are few examples o f
quantified assessments o f the costs o f protected area policies. This may be because
the costs and the benefits o f biodiversity conservation operate at different spatial and
temporal scales. Typically, the costs are felt at the local level and within a short time
frame. In contrast, the benefits o f biodiversity conservation are said to accrue at a
national or global level and are aimed at future generations. The discourse
surrounding protected areas usually highlights their global value for humanity, for
example the UNESCO’s World Heritage Sites which include Garamba National Park,
and not their local benefits.
Another factor which complicates the objective analysis o f the costs o f conservation
policies are the conflicting values o f multiple stakeholders. Few resources evoke such
diverse emotions as wildlife. In the eyes o f some, African wildlife produces positive
images o f beautiful but threatened mammals. In stark contrast, others experience
wildlife as a threat to their livelihoods or to their security (see Tchamba 1997 for an
account o f the impacts o f wildlife on local agricultural production in Cameroon, and
-142-
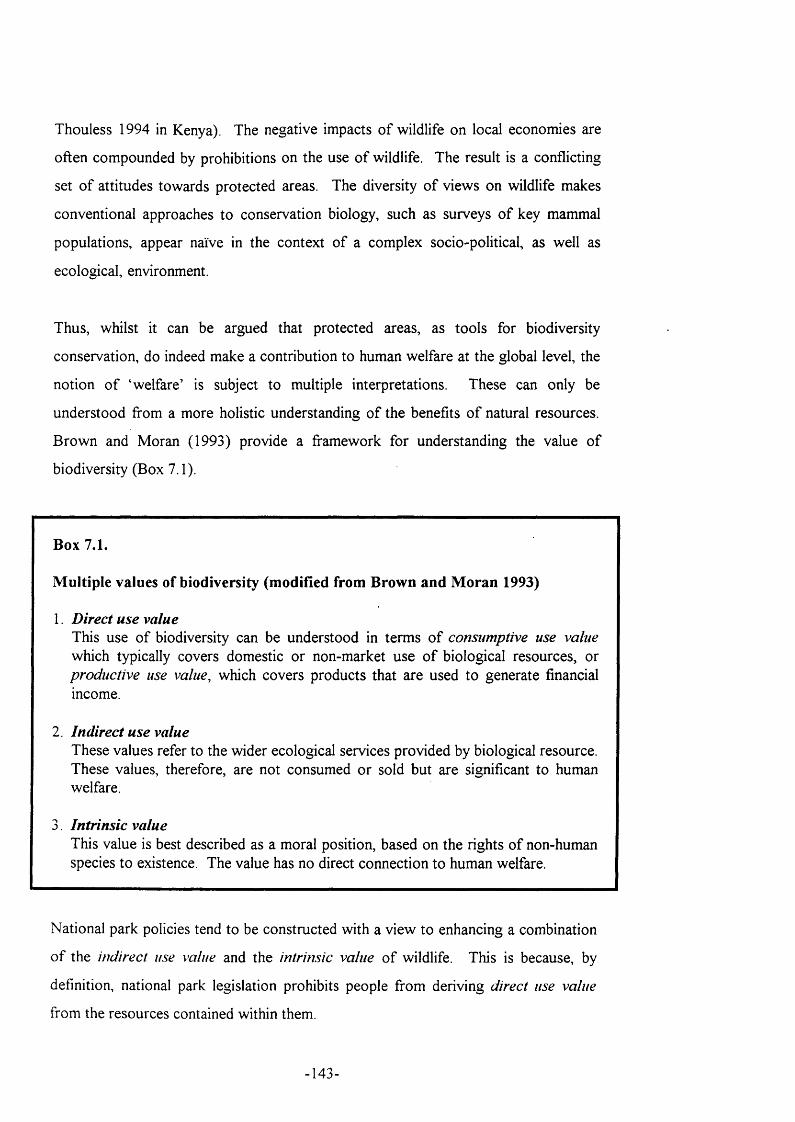
Thouless 1994 in Kenya). The negative impacts o f wildlife on local economies are
often compounded by prohibitions on the use o f wildlife. The result is a conflicting
set o f attitudes towards protected areas. The diversity o f views on wildlife makes
conventional approaches to conservation biology, such as surveys o f key mammal
populations, appear naïve in the context o f a complex socio-political, as well as
ecological, environment.
Thus, whilst it can be argued that protected areas, as tools for biodiversity
conservation, do indeed make a contribution to human welfare at the global level, the
notion o f ‘welfare’ is subject to multiple interpretations. These can only be
understood from a more holistic understanding o f the benefits o f natural resources.
Brown and Moran (1993) provide a framework for understanding the value o f
biodiversity (Box 7.1).
Box 7.1.
Multiple values of biodiversity (modified from Brown and Moran 1993)
1. D irect use valueThis use o f biodiversity can be understood in terms o f consumptive use value which typically covers domestic or non-market use o f biological resources, or productive use value, which covers products that are used to generate financial income.
2. Indirect use valueThese values refer to the wider ecological services provided by biological resource. These values, therefore, are not consumed or sold but are significant to human welfare.
3. In trinsic valueThis value is best described as a moral position, based on the rights o f non-human species to existence. The value has no direct connection to human welfare.
National park policies tend to be constructed with a view to enhancing a combination
o f the indirect use value and the intrinsic value o f wildlife. This is because, by
definition, national park legislation prohibits people from deriving direct use value
from the resources contained within them.
-143-
The framework is helpful in understanding the motivation behind the protected area
zonation at Garamba. Chapter 4 described the criteria used to define management
priorities. These criteria aim to protect large mammals, such as rhinos and elephants.
Thus, areas in the hunting reserves classified as conservation priority areas are
designated for the regulation o f wildlife utilisation and direct use is restricted. It is
difficult to identify the local indirect use values provided by large mammals. Indeed,
many agriculturalists in the region argue that large mammals are an environmental
hazard contributing to high levels o f crop damage (see de M erode et a l 1994, Hillman
Smith et a l 1995, Buis, 1997). Thus, the values behind the conservation objectives at
Garamba can largely be explained in terms o f the intrinsic value that is attached to the
wildlife.
The present analysis uses the concepts o f direct-use and intrinsic (non-use or
conservation) values o f wildlife, re-classifying the landscape using local resource use
criteria and recognised conservation criteria (species existence value, endemism and
vulnerability). A spatial approach using GIS and geo-statistical techniques is used to
apply these alternative values to standard wildlife survey data so that the results are
directly comparable to the zonation map in Chapter 4 (Figure 4.3). Figure 4.3
represents the perspectives o f one stakeholder, the conservation authority. The
analyses presented below add the resource use perspectives o f local residents,
enabling a comparison o f the differing land-use priorities o f two stakeholders.
The introduction o f local values into spatial analysis contributes to a growing debate
surrounding the requirements for ‘politically aware’ quantitative analysis. For,
example, Harris et a l (1995) discuss the potential for “community integrated GIS”,
which breaks away from the extractive nature o f information gathering in rural
communities. The use o f exclusive decision making technology, such as GIS,
compounds and formalises the distinction between so called ‘experts’ and local
stakeholders whose livelihoods are most affected (Dunn et a l 1995, Abbot et al
1998). Recent attempts to develop functional links between participatory approaches
and GIS are an attempt to redress the imbalance in the influence o f remote decision
-144-
makers and local stakeholders. The contributions o f this analysis to this emerging
debate are considered in the analysis.
7.3 M ethods
The methodology applied conservation (intrinsic) and local resource use (direct-use)
priorities to data on mammal distribution within the hunting reserves.
7.3.1 The distribution o f wildlife resources
Mammal abundance data in the hunting reserves is drawn from the five kilometre line
transects described in Chapter 5. In summary, 42 transects were distributed
throughout the hunting reserve using a stratified random sampling scheme. Faecal
counts are used as an indicator o f animal abundance.
7.3.2 Adding intrinsic and direct-use value to wildlife resources
a. Intrinsic value
This was defined by the Conservateur Principal at Garamba National Park, Mbayma
Atalia. A list was drawn o f all mammal species identified during the line transect
exercise (Table 7.1). These species were then weighted by the wildlife officer
according to the conservation criteria used by ICCN (Table 7.1); vulnerability and
endemism (A taliapers. comm.). Species were given a value o f 0 or 1 depending on
whether or not each criterion was met. All species were given an existence value o f
1 .
145.
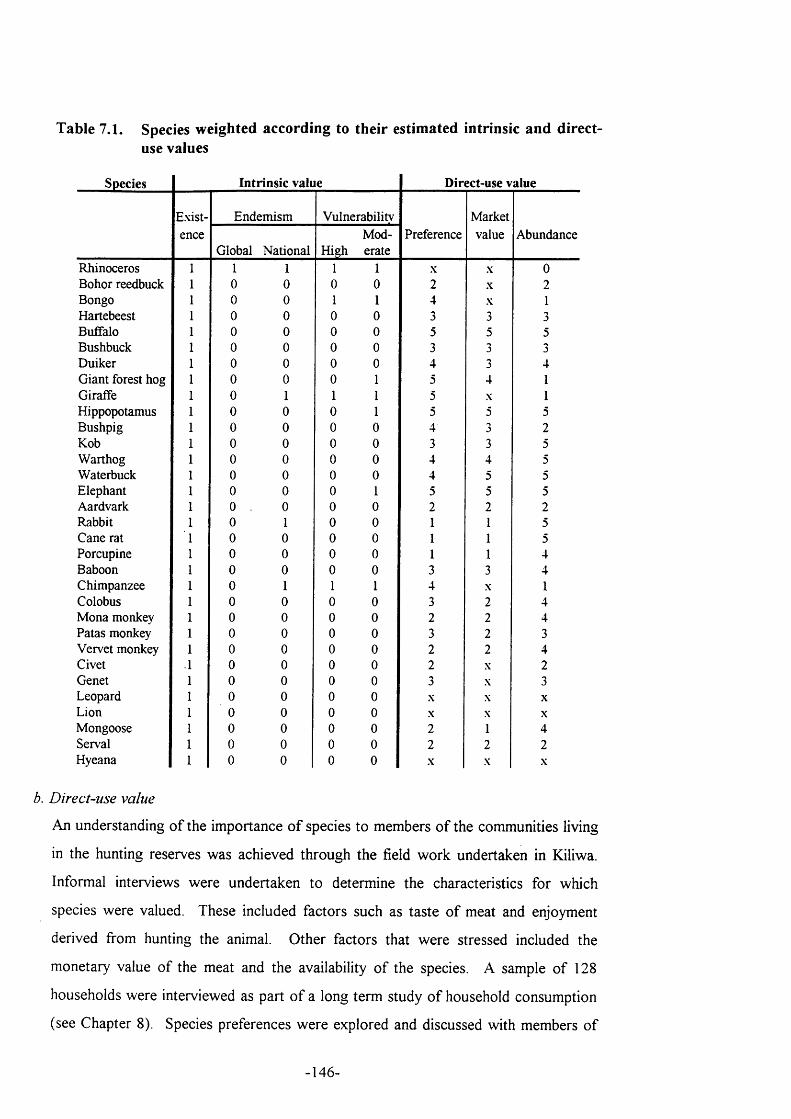
Table 7.1. Species weighted according to their estimated intrinsic and direct- use values
Species Intrinsic value Direct-use value
Exist Endemism Vulnerabilitv Marketence
Global National HighModerate
Preference value Abundance
Rhinoceros 1 1 1 1 1 X X 0Bohor reedbuck 1 0 0 0 0 2 X 2Bongo 1 0 0 1 1 4 X 1Hartebeest 1 0 0 0 0 3 3 3Buffalo 1 0 0 0 0 5 5 5Bushbuck 1 0 0 0 0 3 3 3Duiker 1 0 0 0 0 4 3 4Giant forest hog 1 0 0 0 1 5 4 1Giraffe 1 0 1 1 1 5 X 1Hippopotamus 1 0 0 0 1 5 5 5Bushpig 1 0 0 0 0 4 3 2Kob 1 0 0 0 0 3 3 5Warthog 1 0 0 0 0 4 4 5Waterbuck 1 0 0 0 0 4 5 5Elephant 1 0 0 0 1 5 5 5Aardvark 1 0 . 0 0 0 2 2 2Rabbit 1 0 1 0 0 1 1 5Cane rat 1 0 0 0 0 1 1 5Porcupine 1 0 0 0 0 1 1 4Baboon 1 0 0 0 0 3 3 4Chimpanzee 1 0 1 1 1 4 X 1Colobus 1 0 0 0 0 3 2 4Mona monkey 1 0 0 0 0 2 2 4Patas monkey 1 0 0 0 0 3 2 3Vervet monkey 1 0 0 0 0 2 2 4Civet 0 0 0 0 2 X 2Genet 1 0 0 0 0 3 X 3Leopard 1 0 0 0 0 X X X
Lion 1 0 0 0 0 X X X
Mongoose 1 0 0 0 0 2 1 4Serval 1 0 0 0 0 2 2 2Hyeana 0 0 0 0 X X X
b. Direct-use value
An understanding o f the importance o f species to members o f the communities living
in the hunting reserves was achieved through the field work undertaken in Kiliwa.
Informal interviews were undertaken to determine the characteristics for which
species were valued. These included factors such as taste o f meat and enjoyment
derived from hunting the animal. Other factors that were stressed included the
monetary value o f the meat and the availability o f the species. A sample o f 128
households were interviewed as part o f a long term study o f household consumption
(see Chapter 8). Species preferences were explored and discussed with members o f
-146-
the households using images o f species scanned from Dorst and Dandelot (1970).
The images were enlarged and printed on A4 sized sheets o f paper. Members o f the
households were asked to rank them in order o f preference. This usually involved a
certain amount o f debate between members o f the households before a preference
ranking was developed.
The monetary value o f bushmeat was derived from the market data on bushmeat (see
Chapter 10), and from the abundance data drawn from the survey work (both aerial
counts and ground transects, see Chapters 5 and 6). Use values were scaled to a
range o f 1 (least valued species) to 5 (most valued species). An X denotes species
that do not contribute to local livelihoods.
7.4 Analysis and Results: applying multiple perspectives to wildlifedistribution data
To understand the importance o f each species to each stakeholder, the intrinsic and
direct use values are calculated for each o f the 31 species by summing the attributes
associated with each type o f value. These values are then applied to data on the
distribution o f the species obtained from faecal observations at each o f the transects.
This prioritises the landscape according to each stakeholder’s perspective.
The result, however, is heavily biased by certain species, such as elephants and
buffalos, which have a much higher detection rate than other species. The bias is
partly because o f their higher densities, but also because they leave conspicuous signs
o f their presence. An equal weighting can be given to all species by standardising the
number o f faecal observations made along the transects for each o f the species
individually. These standardised values are calculated in number o f standard
deviations from the mean number o f observations for the species (z-scores).
The outcome o f this exercise is to produce a set o f transect values for each species.
The range o f values was the same for all species, because standardised transect scores
were used. This can be interpreted as a dataset whereby all am mais are equals and
can subsequently be individually weighted according to intrinsic and direct-use values.
-147-
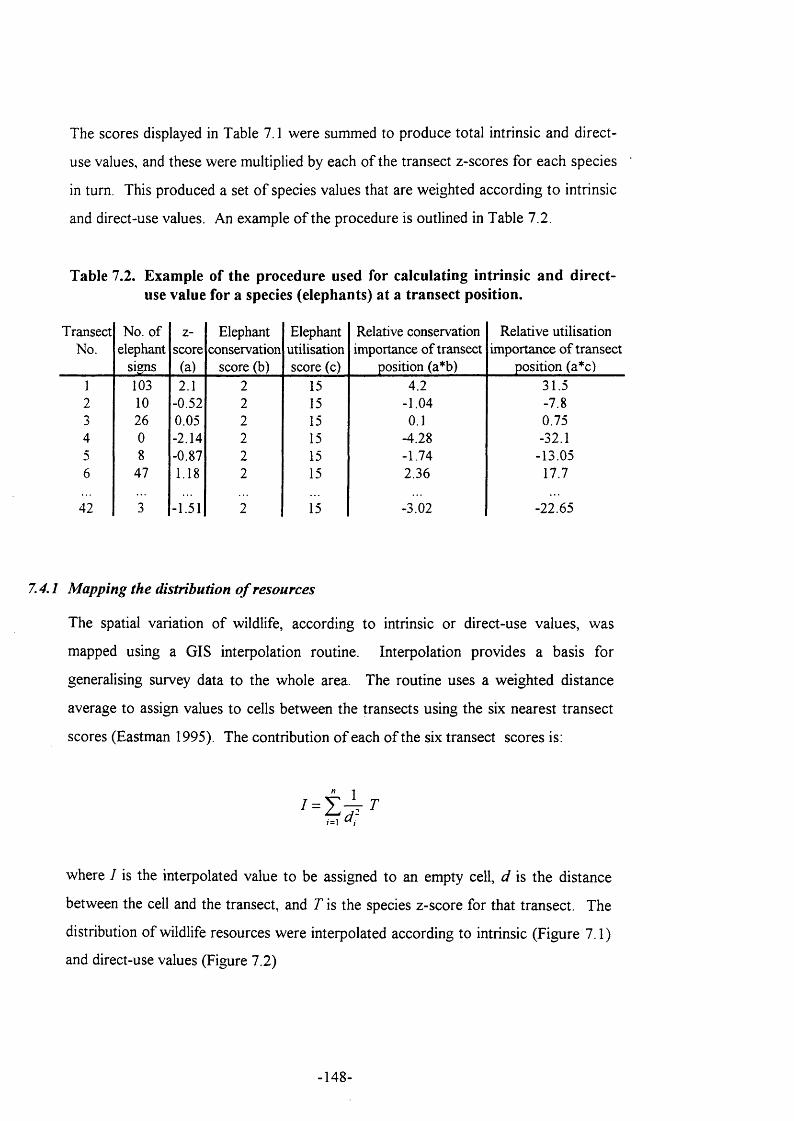
The scores displayed in Table 7.1 were summed to produce total intrinsic and direct-
use values, and these were multiplied by each o f the transect z-scores for each species
in turn. This produced a set o f species values that are weighted according to intrinsic
and direct-use values. An example o f the procedure is outlined in Table 7.2.
Table 7.2. Example of the procedure used for calculating intrinsic and direct- use value for a species (elephants) at a transect position.
TransectNo.
No. of elephant
signs
z-score
(a)
Elephant conservation
score (b)
Elephant utilisation score (c)
Relative conservation importance of transect
position (a*b)
Relative utilisation importance of transect
position (a*c)1 103 2.1 2 15 4.2 31.52 10 -0.52 2 15 -1.04 -7.83 26 0.05 2 15 0.1 0.754 0 -2.14 2 15 -4.28 -32.15 8 -0.87 2 15 -1.74 -13.056 47 1.18 2 15 236 17.7
42 3 -1.51 2 15 -3.02 -22.65
7.4.1 M apping the distribution o f resources
The spatial variation o f wildlife, according to intrinsic or direct-use values, was
mapped using a GIS interpolation routine. Interpolation provides a basis for
generalising survey data to the whole area. The routine uses a weighted distance
average to assign values to cells between the transects using the six nearest transect
scores (Eastman 1995). The contribution o f each o f the six transect scores is:
where / is the interpolated value to be assigned to an empty cell, d is the distance
between the cell and the transect, and T is the species z-score for that transect. The
distribution o f wildlife resources were interpolated according to intrinsic (Figure 7.1)
and direct-use values (Figure 7.2)
-148-
The confidence levels on the interpolated results were measured using simple geo-
statistical tests. Observed (transect data) and expected values (interpolated data)
were compared. Observed values are simply the transect values (the two right hand
columns in Table 7.2). Expected values were generated from the interpolation
routine as follows; a transect is removed from the dataset and the interpolation is
computed. The position where the removed transect was located subsequently
contains an interpolated (or expected) value. This can be compared to the actual
value o f the removed transect which represents the observed value. This procedure is
repeated 42 times to produce observed and expected values for all transects. The
observed and expected values are plotted on a semi-variogram (Isaaks and Srivastava
1989). If all interpolated values were equal to the actual values (in other words,
correct), the plotted points would all fall exactly on the line x = y. Thus, the residuals
from the line x = y represent the interpolation error, and confidence intervals can be
generated from these residuals (note that the standard deviation o f residuals, rather
than the standard error is used to define confidence intervals because the ‘average
error’, and not the sampling error is being measured here). The confidence intervals
are relatively small and are within the margins typically associated with wildlife survey
data (Inamdar 1996, Hillman-Smith e/ a l 1995). However, it should be noted that the
results o f this accuracy assessment tend to be conservative because the expected
values are computed from a smaller sample as a result o f removing a transect from
sample dataset (41 transects are used for the accuracy assessment, instead o f the
actual 42 used in the original interpolation).
149-
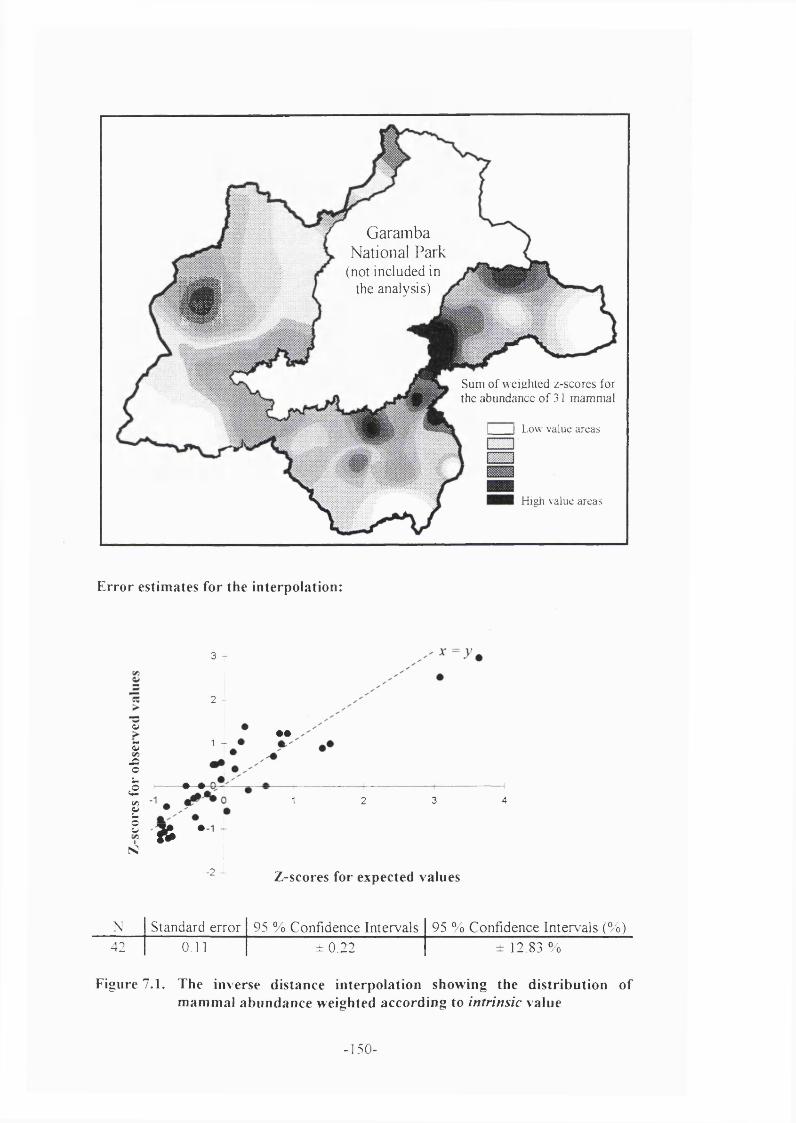
G arainba N ational Park
(not included in the analysis)#
Sum of weighted z-scores for the abundance of 31 mammal
I I Low value areas
High value areas
E rro r estimates for the interpolation:
3 -
2 -
oZ.2O
1 -• •
’m. • #sC/3tÔUs
1 2 3 4
» •
-2 - Z-scores for expected values
N Standard erro r 95 % C onfidence Intervals 95 % C onfidence In tervals (% )42 0.11 ±0.22 ± 12.83 %
Figure 7.1. The inverse distance interpolation showing the d istribution of m ammal abundance weighted according to intrinsic value
- 1 5 0 -
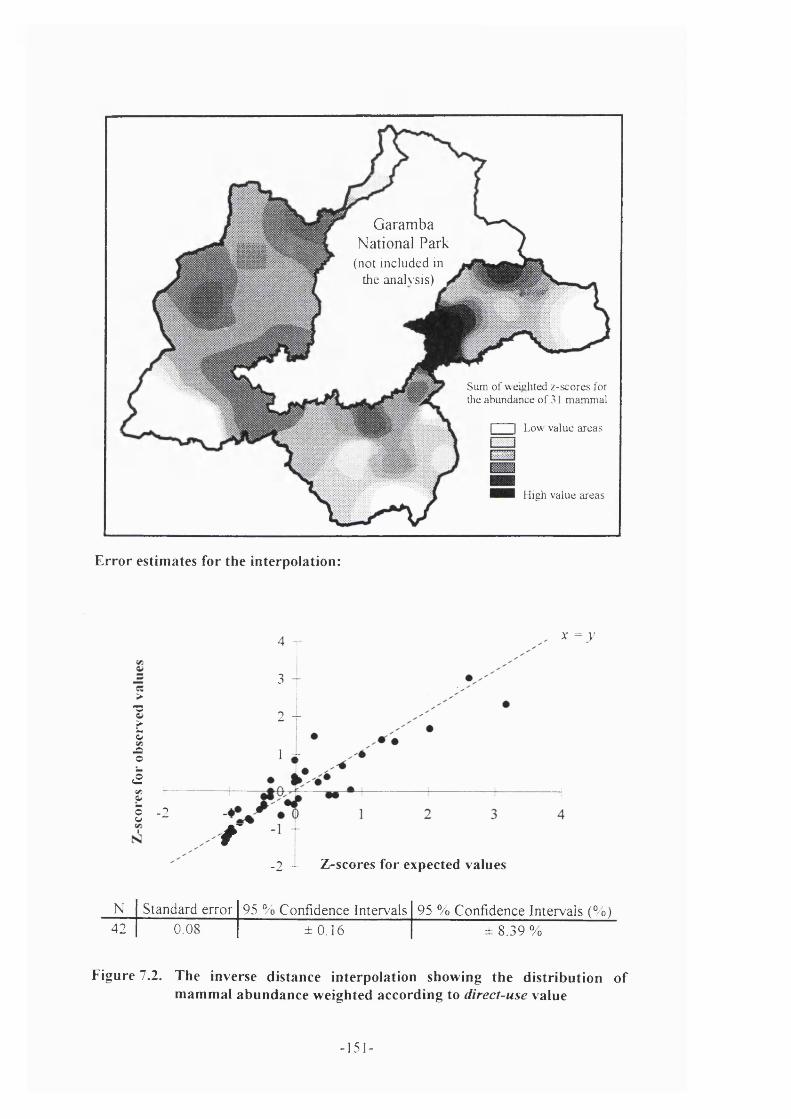
% G aram ba N ational Park
(not included in the analysis)
y /Z i'///''
S u m o f w e io h te d z -s c o r e s lor tlie a b u n d an ce o f 31 m a m m a l
I I Low v a lu e area s
H ig h v a lu e area s
E r ro r estimates for the interpolation:
>" 3
.>Z.aoa£ “ g -2
4 -
3 -
2 -
1 ST
X- = > '
/ ■ “
-2 — Z-scores for expected values
N Standard error 95 % Confidence Intervals 95 % Confidence Intervals (%)42 0 08 ±0.16 ± 8 . 3 9 %
Figure 7.2. The inverse distance in terpolation showing the d is tr ibu t ion o f m am m al abu n d an ce weighted accord ing to direct-use value
- 1 5 1 -
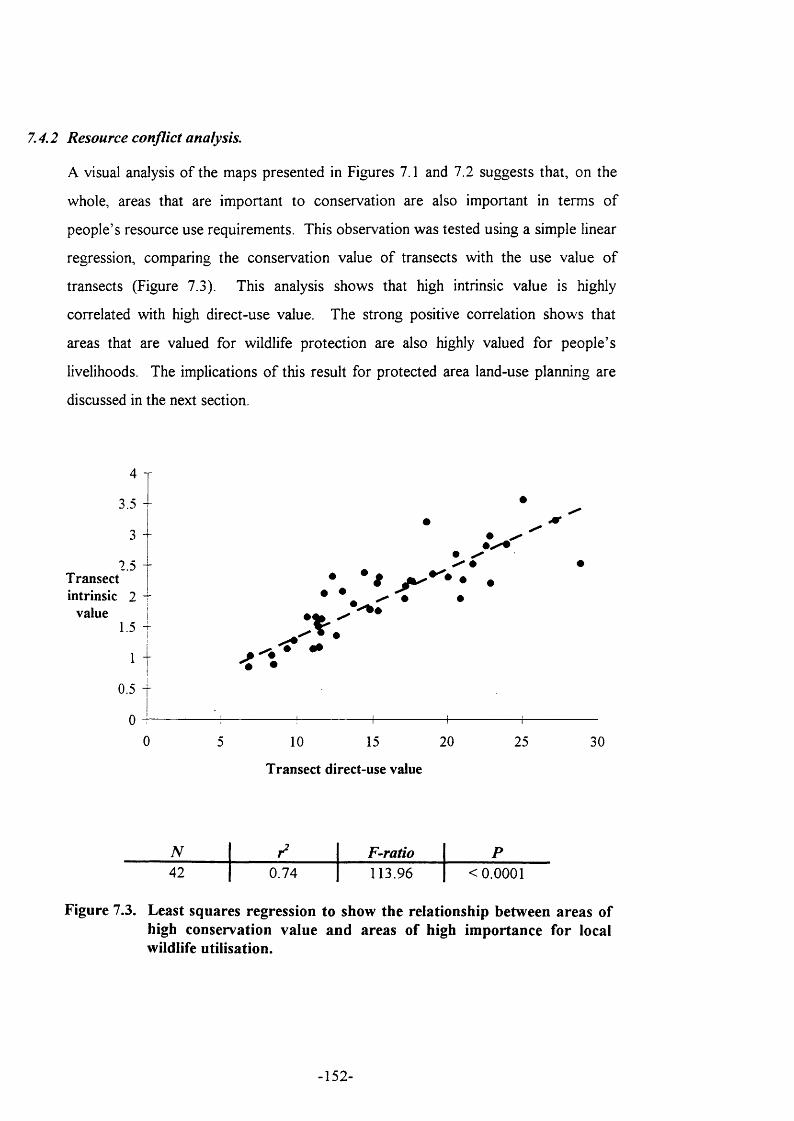
7.4.2 Resource conflict analysis.
A visual analysis o f the maps presented in Figures 7.1 and 1 2 suggests that, on the
whole, areas that are important to conservation are also important in terms o f
people’s resource use requirements. This observation was tested using a simple linear
regression, comparing the conservation value o f transects with the use value o f
transects (Figure 7.3). This analysis shows that high intrinsic value is highly
correlated with high direct-use value. The strong positive correlation shows that
areas that are valued for wildlife protection are also highly valued for people’s
livelihoods. The implications o f this result for protected area land-use planning are
discussed in the next section.
4 T
3.5 -
3
2.5 —T ransect intrinsic 2 -
value I1.5 j
1 I
0.5 -
00
.#
'• «*
5 10 15 20
Transect direct-use value
25 30
N F-ratio P42 0.74 113.96 <0.0001
Figure 7.3. Least squares regression to show the relationship between areas of high conservation value and areas of high importance for local wildlife utilisation.
152-
7.5 Discussion
The results o f the analyses presented in this chapter may appear self evident: areas
that are important for conservation are also important to local people for their wildlife
utilisation requirements. However, it is useful to make this trade-off explicit,
particularly in the context o f the protected zonation outlined in Section 1 o f Chapter
4. This zonation demarcated the hunting reserves into ‘conservation priority areas’
and ‘development priority areas’. This zonation, developed by conservation
practitioners, is intended to provide the basis for ‘community conseiwation’.
However, local residents were not consulted. Thus, the zonation exercise documented
in Chapter 4 shares many o f the characteristics o f protected area planning in Africa:
extensive areas o f land are gazetted by stakeholders who do not bear the costs o f the
land-use policy (Pimbert and Pretty 1995).
This chapter has explored some o f the apparent contradictions in attempting to merge
established conservation agendas with development objectives. Two issues emerge
from this study and are discussed. The first is methodological, and examines the use
o f information and the representation o f the landscape using GIS by conservation
practitioners. The second addresses the implications o f conflicting land-use
objectives for protected area management at Garamba.
7.5.1 Methodological issues in land-use planning
Geographic information systems have been heralded as a tool for objective decision
making in land-use planning. This was the assumption behind the GIS zonation in
Section 1 o f Chapter 4, and is reflected in some conservation thinking, for example:
It is best to a\>oid 'mixing apples and oranges' and instead fo c u s on
getting the biological priorities right in the firs t step o f the process.
Other kinds o f data can then be superimposed on the biological
foundation using a Geographic h fo rm a tion System (GIS) and thus
153-
develop meaningful and scientifically-based consen>ation agendas.
(Mittermeir and Bowles 1993, cited in Pimbert and Pretty 1997)
Whilst a GIS approach may bring a certain level o f analytical rigour to decision
making, the uncritical use o f the technology fails to provide a meaningful
representation o f the issues “because o f the selective participation o f groups in
data/information production ” (Harris et a l 1995). As GIS increasingly becomes part
o f the conservation and development planning ‘toolkit’, there is a concern that
centralised and top-down development planning will be reinforced at the expense o f
local knowledge and interests. The caveats o f centralised planning are clearly shown
by comparing the community priorities in Figure 7.2 o f this chapter with the GIS
planning exercise in Chapter 4 (Figures 4.2 and 4.3). The zonation map in Chapter 4
was intended facilitate ‘community conservation’, but used only biological criteria to
prioritise the landscape categories.
GIS hardware, software, and data are expensive, require technical expertise and are
often defined as ‘expert’ systems. These concerns formed the basis o f a workshop in
January 1998 in Durham, United Kingdom, which aimed to address the political
context o f systems analyses, such as GIS. A number o f simple questions emerged:
“Whose interests are considered in local policy? Who owns the information and decides
what is important? What are the goals o f local politicians, experts and bureaucrats?”
(Abbot et a l 1998). This discourse increasingly reflects the limitations o f statements
such as Mittermeir and Bowles’s quoted above, for example:
A GIS reflects the mandate o f the agency that operates it. Agencies ha\’e
internal rules and value systems, as well as a stake in self-preservation.
The extent to which GIS represents objectivity in terms o f what data is
used, or how it is classified, or hoM’ it is analysed, or the interpretations
droH’n from it, is clearly highly questionable. Value-neutral GIS sim ply
do not exist.
(Harris et al 1995)
154-
The use o f GIS as a planning tool, and the practices that ensue, have particular
significance in a context such as this, when land-use planning decisions are influenced
by outside agencies, namely international environmental NGOs. As Ghimire and
Pimbert (1997) point out, “there exists no legal or political fram ew ork that would
perm it local popidations to seek justice fo r social conflicts and m iseiy caused by any
international or national conservation organisations and environmentalists”. Thus,
the selective use o f information, that is narrowly defined according to environmental
protection criteria and which neglects social needs, can serve to meet external
agendas in a way that is wholely unaccountable, yet is masked behind a shield o f
‘meaningful scientifically-based’ techniques.
The use o f GIS to represent local values goes some o f the way in achieving the
objectives o f ‘participatory G IS’. However, an important aspect o f participatory
decision making is ownership over the data and the analysis. In this context, local
residents have been consulted, but have had little input into the types o f information
that were considered important to landuse planning. Thus, the data gathering
techniques are extractive, and residents have no control over how the information is
processed and subsequently used. This is largely because o f the limitations o f a
research project, whose remit did not include a land-use planning and implementation
process by local communities. Nevertheless, the process o f consultation with local
communities does provide the basis for a more “community integrated GIS”
advocated by Harris et al (1995), which is perhaps a more achievable objective than
‘participatory GIS’.
7.5.2 Conflicting landuse priorities in the hunting resen^es
Acknowledging multiple perspectives on wildlife resources can have profound
significance on the implementation o f conservation policy. The maps shown in
Figures 7.1 and 7.2 represent landuse priorities based on conservation and local social
and economic priorities respectively. The similarity between the two maps shows that
conservation priority areas are also most valued for their wildlife resources by local
residents. The significance o f the regression presented in Figure 7.3 quantifies this
conflict over resources.
-155-
To date, wildlife conservation policies at Garamba have been implemented by the
eviction o f residents, followed by the enforcement o f laws restricting access to the
land, and the resources contained within in it. The approach, whereby “it is thought
m cessa iy fo r the state to owm land so as to direct development, and to protect it from
destruction by local p e o p le ” (IIED 1994) is common throughout Africa and
elsewhere. For example, M oorehead and Diakité (1991) document the eviction o f
over 3,000 residents from the agricultural land o f the Bahr Azoum river system in
Chad, in order to develop the Zakouma National Park. The forced eviction o f
pastoral communities in east Africa has also been extensively documented: in
northern Tanzania at least 1,000 Maasai pastoralists and their livestock were evicted
from the Serengeti plains in 1959 and moved to the Ngorongoro Conservation area,
where their access to pasture was subsequently restricted further (Homewood and
Rodgers 1991). Some early ethnographic texts, such as Turnbull’s (1972) portrayal
o f the Ik o f Northern Uganda have been used to illustrate the adverse social impacts
o f eviction from the area that is now Kidepo Valley National Park (Brechin et a l
1991, Calhoun 1991). A long term study o f the impacts o f eviction on pastoralists
around Mkomazi National Park, Tanzania indicated “that the livelihoods fo llow ed are
more vulnerable to misfortune, and generally more precarious than before
[eviction]” (Brockington 1998).
Thus, the social costs o f eviction as a tool for wildlife conservation are self-evident
and are increasingly seen as a cause for concern. However, Chapters 5 and 6 in this
thesis provide indications o f the biological outcomes o f eviction: higher mammal
species richness and abundance are associated with the area from which people have
been evicted. This represents a dilemma whereby “conservation and development
seem to represent diametrically opposed aims, so that management will be a t best a
compromise and at worst a destructive conflict between the two” (Homewood and
Rodgers 1991).
One response to the dilemma has been to present protected areas as means o f
achieving sustainable development. It is said that one o f the most important outcomes
156-
of the UNCED agreements is the universal acceptance o f the concept o f conservation
with development. A development agenda is now included in almost all protected area
policy documents as a m atter o f course. However, in practice protected area policies
are founded on values which vary from site to site. Indeed, ''''five years after the Earth
Summit in Rio, it is not uncommon to hear Western-trained conservation biologists
argue in favour o f taking over large portions o f the world to expand the netw>ork o f
protected areas"'' (Ghimire and Pimbert 1997). Advocates o f protectionist approaches
to wildlife management are beginning to use the concepts o f protected areas and
sustainable development interchangeably. As a result, protected areas, in themselves,
are presented as tools for development.
Contradictory statements coming from within the same organisation reflect an inability
to reconcile conservation agendas with local development needs. For example, the
World Wide Fund for N ature’s position paper on Indigenous Peoples and
Conservation (WWF 1996) states that “WWF recognises that indigenous peoples
have the rights to the lands, territories, and resources that they have traditionally
owned or otherwise occupied or used’’’. This does not sit comfortably with the
statements published by some o f the same organisation’s employees, for example:
"These forests represent largely intact and complex ecosystems, lightly
touched by the hand o f man. I t is our responsibility to protect them fo r their
own intrinsic value. We cannot do this by handing over our responsibilities
to uninformed local communities who lack the scientific hw w ledge to
manage these large and complex ecosystems "
(Gartlan 1997, WWF representative for Cameroon).
The analysis presented in this chapter reflects how established protected area
management practices cannot easily be reconciled with goals that aim to prom ote the
interests o f local residents when eviction, or other practices that constrain human
presence, are used. The assumption o f the zonation presented in Chapter 4 was that
‘community development’ could be achieved by setting highest biodiversity value
areas aside for conservation, and promoting community development elsewhere. By
-157-
definition, this means restricting access in areas that are most valued for their wildlife
resources, and focusing development interventions at a greater distance from the
national park. M oorehead and Hammond ( 1992, cited in IIED 1994) discuss a similar
approach to community conservation at Korup National Park, Cameroon, whereby
the focus o f development aid by the conservation agency was directed away from
those residing in close proximity to the national park. Thus, those who lost the most
from the presence o f the national park, through loss o f access to land and wild
resources, benefited the least from the conservation agency’s development
intervention.
The use o f development agendas to promote purely conservation goals is not new.
Nzabandora (1984) describes the eviction o f the residents in North Kivu, Congo
earlier this century. Over 2,000 local fishing and agricultural households were moved
from the Semliki Valley and Lake Edward region as part o f a sleeping sickness
eradication programme between 1928 and 1930. This programme was established
under the District Commissioner Hackers, who was also Conservateur Prificipal
(senior wildlife officer) o f Albert National Park (now Virunga National Park). In
1935, Bloc XIII was established, which extended the boundaries o f Albert National
Park to cover the evacuated areas. The fact that the sleeping sickness epidemic was
used to justify eviction meant that the former residents o f the area could not claim
compensation. A report in 1959 by the District Commissioner o f N orth Kivu
(Caprasse 1959, cited in Nzabandora 1984), stated that there were no cases o f
sleeping sickness in the area concerned between 1928 and 1930.
Whilst this is perhaps an extreme example o f the abuses that are possible in the name
o f conservation and development, it highlights the dangers o f mixing development
discourse with what are essentially conservation objectives. Land-use planning as
outlined in Chapter 4 has the potential to leave local residents further alienated from
their resources, but without the option o f compensation because the land-use policy
was community development and implemented ‘in their interest’.
-158-
Benefit sharing schemes have been implemented to compensate local residents (IIED
1994, Western 1994). Although these do alleviate some o f the social costs o f
eviction, as a process o f community development, they have proved less than
satisfactory. For example. Bell (1987) suggests that the weakness o f the Windfall
community conservation programme in Zimbabwe was the failure to involve local
level recipients in management decisions. The relationship with local residents as
passive recipients o f funds suggested that they were considered “a nuisance that is
being bribed to keep q u ie f (Bell 1987). This has not provided a sound basis for
community based wildlife management.
The inadequacy o f benefit-sharing schemes explains why it is increasingly recognised
that effective biodiversity conservation must begin with an understanding o f existing
local wildlife utilisation and management practices. Section II in Chapter 4 showed
that local level wildlife management practices are well established around Garamba,
and involve large numbers o f local groups. Furthermore, the analysis o f animal
distribution and abundance in Chapters 5 and 6 indicates that it is the regulation o f
offtake that influences animal abundance, and not necessarily the eviction o f local
residents: the presence o f agricultural populations was not correlated with a decrease
in animal species richness or abundance. Thus, the solution to the apparent
incompatibility between conservation and community objectives may lie in the active
management o f wildlife resources by local residents. The remainder o f this thesis
explores the potential for local conservation management, based on current wildlife
utilisation practices.
-159-
7.6 Conclusions
The use o f GIS and geo-statistical techniques made it possible systematically to
compare areas that were important in terms o f their conservation value with areas that
were important in terms o f their use value. The results showed that areas that were
important to conservation were consistently those areas that were important to local
residents. Consequently, setting areas aside as ‘conservation priority areas’ would
bring significant costs to the local economy. At Garamba, the assumption o f
‘conservation M>ith development’ cannot be made without a better understanding o f
the trade-offs between conservation and economic development.
This Chapter discussed the difficulties o f meeting what are perhaps mutually exclusive
conservation and development objectives. The analysis o f animal distribution and
abundance presented in the two preceding chapters showed that the restriction o f the
human use o f wildlife tended to be associated with increased species richness and
abundance. However, in the past this has been associated with the eviction o f local
residents from parts o f the protected area and the enforcement o f coercive measures
for law enforcement. The remainder o f this thesis will explore local systems o f
wildlife utilisation and management as an option for meeting conservation and
development objectives.
-160-
Chapter 8
W ealth and Wild Foods
8.1 Summary
The previous chapter emphasised the difficulties in reconciling centralised wildlife
protection with local resource use priorities, and concluded by emphasising the need
to consider community level wildlife management as an alternative. Thus the present
chapter develops this theme by addressing two issues.
First, it explores who are the primary beneficiaries o f wild foods. Wild foods are
frequently cited as important to rural food security, particularly for the more
vulnerable households (Chambers and Leach 1986, Hunter et a l 1990, M cGregor
1995). Indeed, increased reliance on wild foods is sometimes used as an indicator o f
impending famine, during which time poorer households use wild foods as an
important survival strategy (Vaughan 1987, de Waal 1988). The benefits o f wild
foods to the poorer and more vulnerable sectors o f a community are often used as an
important justification for community level wildlife management (Pimbert and Pretty
1995). However, recent work has questioned the notion that poorer households
benefit more from wild foods (Wickramasinghe et a l 1996, Chenevix-Trench 1997).
An understanding o f the benefits o f extractive wildlife utilisation requires a clear
assessment o f the beneficiaries o f this system o f wildlife management.
Second, the study examines the relationship between wealth and people’s entitlements
to wild foods. This emphasises people’s modes o f procurement o f wild foods and
helps to build a better understanding o f the relationship between human resource use,
harvesting practices and the sustainable management o f natural resources.
-161-

8.2 Introduction
Chapters 5 and 6 used ecological approaches to understand the effects o f wildlife
management on animal populations. Distinct patterns o f variation were identified in
the abundance o f mammals in the Garamba protected area. Wildlife abundance
appears to be significantly influenced by the application o f wildlife regulations to
specific parts o f the protected area. Areas where the conservation laws have been
actively enforced contain relatively high levels o f mammal abundance. Paradoxically,
areas with higher levels o f human settlement do not always show correspondingly low
levels o f mammal abundance. This is surprising in view o f the higher demand for wild
meat that could be expected in these areas, and justifies a closer examination o f
wildlife utilisation and the processes that underlie the consumption o f wild foods.
Thus, this chapter examines patterns o f wild food consumption by households in a
village community at Kiliwa, in the Azande Hunting Reserve to the west o f Garamba
National Park.
Wealth is used to understand the processes that determine wild food consumption.
Wealth differences provide one o f the most important characteristics that differentiate
people within a community (Chambers 1997). Furthermore, wealth is often strongly
correlated with other community level inequalities, such as race and origin, that
explain much about household well-being. Wealth is determined by access to, or
control over, economic resources. Thus, defining wealth is central to understanding
the dynamics o f natural resource use within a community because it is the single most
important determinant o f producer behaviour. Wealth determines factors, such as
access to the capital inputs to exploit wild resources (e.g. shotguns, nets etc.), and the
resources to market their products (e.g. bicycles). The rich to poor continuum
provides a basis on which to understand the incentive for exploiting wild resources;
as wealth increases, so does the opportunity cost o f extracting wild foods, and the
incentive for richer households to exploit wild resources can decrease (Bailey and
Headland 1991). However, this can be offset by new technologies for extracting and
marketing wild foods. These may substantially increase the productivity o f labour and
-162-
increase the incentive for wealthier households to exploit wild resources (Hames and
Vickers 1983). Furthermore, greater wealth can increase a household’s access to
wild foods at the marketplace (Robinson and Redford 1991).
Patterns o f resource use that correspond to wealth status are useful in understanding
the processes by which human communities impact on wildlife populations. It is
important to examine these processes to understand the relationship between wildlife
utilisation, conservation and economic development in the reserves. Natural resource
economists (e.g.Vincent and Binkley 1991) present the use o f wild resources as
passing through a series o f defined stages. When traditional communities are exposed
to wider markets, their resource use patterns expand and then stabilise. In the context
o f a growing local and national economy, resource use declines, because o f the
growth o f alternative income generating activities. Associated with this, however, is
an increasing specialisation amongst small groups exploiting selected natural
resources. Increasing income and a decreasing availability o f those wild resources
gives rise to a process o f substitution o f wild foods by industrial and farmed products.
Finally, in a more developed industrial society, wild resources provide relatively little
in terms o f food resources. Their primary value is recreational and in providing
environmental services.
The initial stages o f the above process predict increased resource specialisation and
reduced relative incomes from wild resources amongst wealthier households. A
study by Godoy et a l (1995) has tested for these changes in foraging behaviour
associated with a growing cash economy in a central American rural population.
Rapid appraisal methods were used to record monetary and non-monetary income
together with wage levels and to evaluate foraging behaviour. Some o f their
conclusions contrast with the above predictions in that high income families do not
develop more specialised foraging behaviour. This suggests, in these communities,
wealthier households do not become specialised in the exploitation o f wild resources
as an income generating activity. Other studies, such as Wickramasinghe et a l {\ 996)
and Chenevix-Trench (1997) also suggest that the level o f wild resource use does not
increase with wealth. Understanding the relationship between wealth and
-163-
consumption o f wild foods in the context o f a growing economy has important
implications for the sustainability o f wild resources, because o f the corresponding
increase in household wealth during periods o f economic growth.
This chapter contributes to this debate by examining food consumption patterns
associated with wealth status in a Zande subsistence agricultural community. The
research seeks to address the question; do wealthier households use m ore wild
resources? This question is important in understanding the relationship between
conservation and development. Micro economic theories suggest that if development
is initially driven by wild resource use, the opportunity cost o f foraging and hunting
will increase as, inevitably, new income generating activities develop (Vincent and
Binkley 1991). This corresponds to the resource use patterns described by resource
economists, and provides a self regulating mechanism for natural resource use.
Conversely, if wild resource use increases with income, as a result o f access to more
efficient technology (Ayres et a l 1991), or through greater access to meat purchased
at the market (Asibey 1986), then the consumption o f wild foods will increase in a
growing economy. This shows that it is important to examine the broader concept o f
a household’s entitlements to wild foods in order to understand the dynamics o f
resource use, and their implications for the sustainable use o f natural resources.
Household entitlement is a term that encompasses the diverse strategies used by a
household to gain access to resources (Young 1992). In this study, these are
classified as hunting or foraging, purchasing foods, or obtaining them as a gift from
another household.
Godoy and Bawa (1993) review 24 studies o f the economics o f wild resources in the
tropics and identify four main problems: “incompatibility o f results, a tendency to
examine flora (mainly) or fauna but not both, a lack o f attention to sustainability, and
a disproportionate attention to Latin America” . This chapter attempts to address all
four o f these problems by studying the use o f wild foods in a Zande community.
First, a quantitative approach is used that ensures replicability o f results, making the
findings directly comparable to other quantitative studies. Second, a disaggregated
approach to the collection o f wild food data is made, so that wild animal and wild
-164-
plants can both be examined and compared. Third, the relevance o f these findings to
the sustainable use o f wild resources are discussed. This forms the basis o f
subsequent chapters which address the question o f sustainability more directly.
Finally, the findings from this Central African community are presents in relation to
similar studies from other regions.
8.3 Research Hypotheses
These research hypotheses are chosen to examine the importance o f local resource
use to local development, as shown in Figure 1.1.
8.3.1 Household consumption o f wild foods is determined by wealth
The study will test the hypothesis that the consumption o f wild foods is particularly
important to poor households.
8.3.2 A household's modes ofprocurement o f wild foods differs according to wealth
This hypothesis examines how wild food consumption varies on the poor to rich
continuum according to how wild foods are obtained. This makes it possible to
discuss the conservation implications o f natural resource use in the context o f
economic growth.
8.4 M ethods
8.4.1 Sample preparation and household selection
A preliminary, informal survey o f the community was undertaken. This was preceded
by a meeting with the village authorities to solicit their permission to undertake the
study. A formal introduction at a village gathering during the weekly market was
made, whereby the objectives o f the study were outlined to the community. They
were asked to make a collective decision on whether to accept the study in their
community. A general sense o f the social and spatial organisation o f the village was
-165-
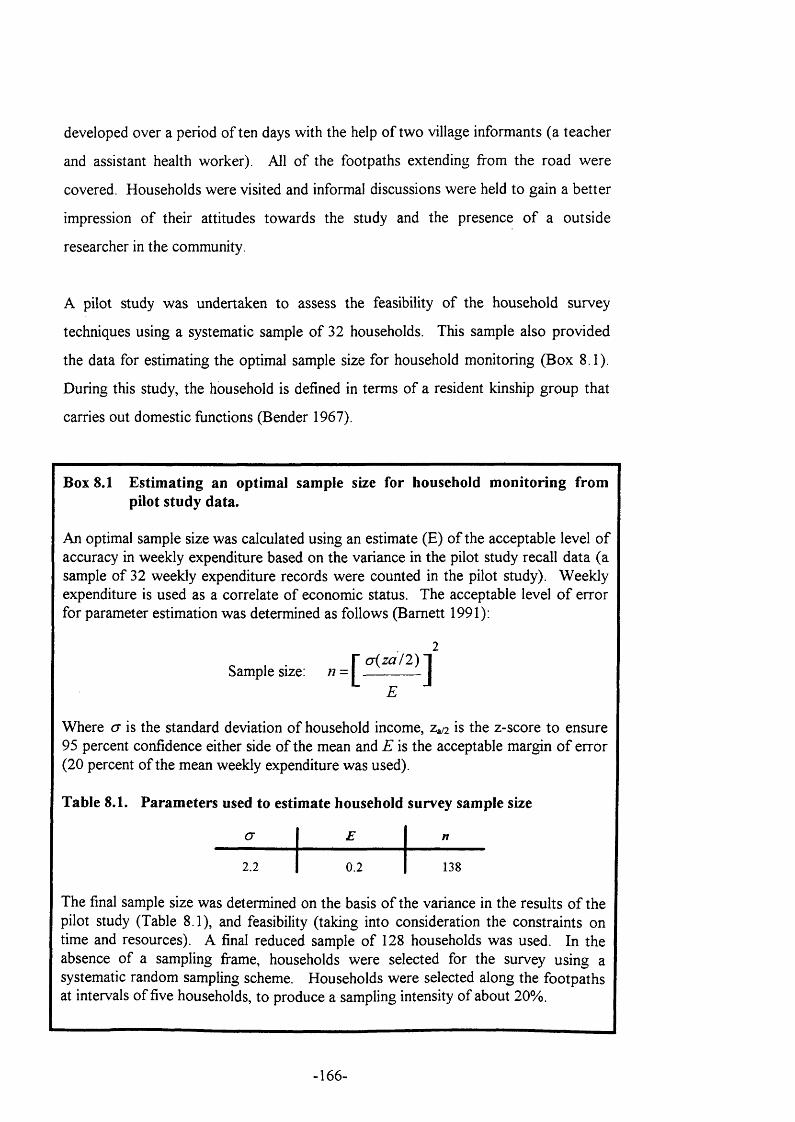
developed over a period o f ten days with the help o f two village informants (a teacher
and assistant health worker). All o f the footpaths extending from the road were
covered. Households were visited and informal discussions were held to gain a better
impression o f their attitudes towards the study and the presence o f a outside
researcher in the community.
A pilot study was undertaken to assess the feasibility o f the household survey
techniques using a systematic sample o f 32 households. This sample also provided
the data for estimating the optimal sample size for household monitoring (Box 8.1).
During this study, the household is defined in terms o f a resident kinship group that
carries out domestic functions (Bender 1967).
Box 8.1 Estimating an optimal sample size for household monitoring from pilot study data.
An optimal sample size was calculated using an estimate (E) o f the acceptable level o f accuracy in weekly expenditure based on the variance in the pilot study recall data (a sample o f 32 weekly expenditure records were counted in the pilot study). W eekly expenditure is used as a correlate o f economic status. The acceptable level o f error for parameter estimation was determined as follows (Barnett 1991);
. r d z a / 2 ) 1Sample size: ti = I - - - - - - - - - - - - I
Where cr is the standard deviation o f household income, Za/2 is the z-score to ensure 95 percent confidence either side o f the mean and E is the acceptable margin o f error (20 percent o f the mean weekly expenditure was used).
Table 8.1. Parameters used to estimate household survey sample size
G E n
2.2 0.2 138
The final sample size was determined on the basis o f the variance in the results o f the pilot study (Table 8.1), and feasibility (taking into consideration the constraints on time and resources). A final reduced sample o f 128 households was used. In the absence o f a sampling frame, households were selected for the survey using a systematic random sampling scheme. Households were selected along the footpaths at intervals o f five households, to produce a sampling intensity o f about 20%.
-166-
8.4.2 Food consu mption
A 24 hour recall technique was used to collect data on household dietary intake and
on household budgets. D ata were collected with the help o f two locally recruited
research assistants. Both were trained in household monitoring techniques over a
three month pilot study period. Detailed descriptions were made o f all foods and
beverages consumed, together with the mode o f procurement. All items purchased or
sold by any member o f the household were recorded in the same way. Quantities o f
foods were made in local household measures (the same measures which are used in
the market).
The research schedule involved visiting each household on a daily basis for one week.
This made it possible to avoid biases resulting from the daily variation in consumption
associated with the day o f the week (market days were associated with higher food
consumption and expenditure). Questions were addressed to the member o f the
household who had prepared the food. When this member was not present, the
researcher would return later in the day, or the following day. Recordings that could
not be made within 48 hours o f consumption were omitted. Food items were
converted to their economic value based on market prices over the period o f study.
8.4.3 Wealth status
Wealth differences can be identified by assessing the level o f income. However, the
definition o f wealth status is not consistent across communities where the nature o f
economic resources, and patterns o f access to them, vary considerably (Grandin
1988). Chambers (1983) stresses that wealth should not be defined as merely an
economic attribute. Rather, it is the combined effect o f important social, political and
economic correlates, including such factors as patronage and authority as well as
access to wider resources such as education and other services. Therefore, two
techniques were used to collect data on wealth status and establish a broader
assessment o f wealth.
167-

a. Participatory M>ealth ranking
This technique is used as a non-intrusive approach to estimating relative wealth
(Grandin 1988). In using participatory methods, it is argued that many o f the
complex social definitions o f wealth are more accurately assessed (Guijt 1992). The
approach adopted was a modification o f the standard participatory approach to
wealth ranking developed by Grandin (1988) and used by PRA practitioners (e.g.
Sarch 1992, Schaefer 1992). In the approach used in the present study, a greater
emphasis was placed on the information provided by key informants, rather than by
the households themselves. This emphasis reflects the difficulties in using
participatory methods in scientific research, where excessive demands for information
from members o f a community cannot be justified in the context o f a research project
where no immediate tangible benefits can be provided to the community. Four key
informants were used in this study and included a teacher, an assistant health w orker
and two agriculturalists.
The pilot sample o f 32 households was used to obtain locally defined wealth
categories. Each household was visited, and the head o f household’s name w as
marked on a card. Whilst moving between households, the group discussed the
wealth characteristics o f the previous household, and ranked the households in
relation to the households previously visited. The justification for the ranking o f each
household was recorded. When the 32 households were completed^ each informant
was consulted individually. Each was asked to place the cards into groups o f similar
wealth status, and to discuss the characteristics o f each group. Following this, all
informants met and the groupings were discussed. Attention was drawn to the
differences between the results o f each informant, and this was discussed until a
consensus was reached. Finally a list o f attributes characterising each o f the four
wealth ranks was compiled (Appendix 3). This list was used to characterise the
wealth rank o f all subsequent households included in this study.
-168-
b. M easuring indicators o f wealth.
A survey was carried out to quantify wealth related characteristics that had been
highlighted in the participatory wealth ranking exercise. The characteristic that was
stated as being most important in characterising wealth was agricultural production.
The size o f exploited agricultural land was used as an indicator o f the level o f
agricultural production. Field sizes were measured using a survey wheel and a
magnetic compass. 378 fields were measured for 110 households (the full sample o f
128 households was not measured because o f the untimely end to the field work, as
described in Section 3.6). These field measurements were plotted on to 2 millimetre
graph paper and the fields were drawn at a scale o f 1:1000. The resulting co
ordinates were entered into a geographic information system (Arc/Info) and field
areas were calculated.
From the participatory wealth ranking, other important indicators o f wealth included
household assets, disposable income and the quality o f the food that was consumed.
Household assets were recorded using a formal questionnaire survey o f visible signs
o f wealth (bicycles, radios etc.), and resource use (nets and shotguns) (Oppenheim
1992).
Finally, the participatory wealth ranking indicated that household budgets were an
important component o f wealth. These were calculated from the 24 hour budget
recall data. This included total monetary income to the household from all o f its
members (this was converted to US dollars based on the weekly exchange rate
provided by the Catholic Mission in Dungu). However, non-monetary income is said
to provide a more accurate estimate o f household income than household expenditure
(Deaton 1988, Godoy et al. 1995). Data on non-monetary income were based on the
market value o f goods produced or foraged by the household, supplied in exchange
for labour (there are few opportunities for financial earnings from wage labour in this
community), or provided as a gift by other households.
169-
8.4.4 Standardising households
Households differ in a number o f factors that have to be controlled for to compare
their wealth status and consumption patterns. These include demographic
characteristics such as age, sex and kin relations. Every 24 hour recall interview was
preceded by questions aimed at establishing the household composition for the
previous day. Members o f the household were characterised in terms o f kin relations
and aged, using dates o f births or an historical event calendar if dates o f birth w ere
unknown {cf. Biran 1997).
8.5 Appraisal of methods
8.5.1 Food consumption
Sources o f error in 24 hour recall data can be considerable, and have been extensively
documented (Fleuret 1979, Bingham 1987, Aunger 1993). Recall error and
deliberate under or over-estimations are recognised as important sources o f error
wherever food consumption surveys are undertaken. These problems may be
compounded in anthropological research in developing countries when
communication between the members o f a community and a researcher is difficult
initially, and the objectives o f the study can easily be misinterpreted.
Patterns o f variance provide a useful indication o f the nature o f error that can be
found in household monitoring data. There are a number o f sources o f variance.
Some o f these have to be analysed in detail, because they are o f primary interest to
this study (for example, variance that is caused by differences in household wealth),
others are not o f direct interest, but have to be controlled for to avoid confounding
effects with the main explanatory variables. The sources o f variance can be classified
as follows:
a. Intrinsic factors
These can broadly be defined as variation in resource use variables that are caused by
the characteristics o f the household. It is hypothesised that the most important o f
170-
these is wealth, however, other sources o f variation might arise from other household
characteristics such as average age or the sex ratio o f the household. Assessing the
variation that can be explained by household wealth is the primary purpose o f this
study, and it is therefore important to assess its magnitude.
b. Extrinsic factors
These are factors that affect all households equally, and include sources o f variation
such as seasonality and the effect o f the day o f the week. The study included all days
o f the week and both the late dry season (often referred to as the hungry season),
when there is an increased dependence on wild foods, and the wet season, when
agricultural products are relied on to a greater extent.
c. Error
Some o f the variance in the data is likely to be caused by inaccuracies in the data.
This is caused either by inaccuracies in data collection, or in sampling error. There
are two primary sources o f error in the data collection. Firstly, incorrect information
may be provided by the subject. Initial contact with members o f a household was
sometimes associated with a certain amount o f suspicion with regard to the perceived
motives for the study. This could lead to under-reporting o f dietary intake, and the
avoidance o f reporting certain food items. Furthermore, initial misunderstandings on
the part o f the subjects about the precise nature o f the information required could also
constitute a source o f error. Informal conversations held with members o f the
households suggested that the types o f incorrect information provided by the subjects
diminished as the study progressed. An analysis o f temporal variation in the sequence
o f data collection is likely to reflect the level o f this error. Secondly, there may be
mis-reporting on the part o f the researcher. The response o f subjects to the enquiries
is considerably influenced by the researcher’s behaviour. Important effects would be
reflected by a difference in the results from each o f the two researchers. An analysis
o f the variation between the researchers is likely to reflect the systematic differences
in the collection of data between the tw o researchers.
-171-
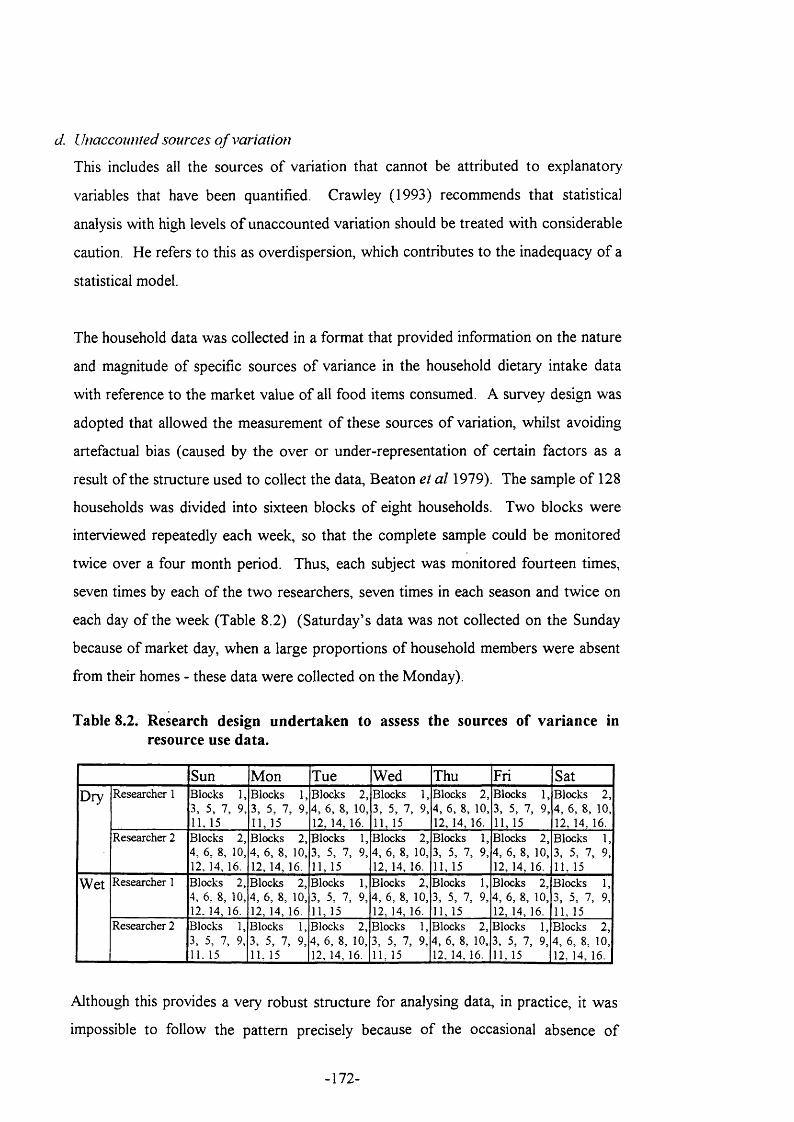
d. Utiaccomiied sources o f variation
This includes all the sources o f variation that cannot be attributed to explanatory
variables that have been quantified. Crawley (1993) recommends that statistical
analysis with high levels o f unaccounted variation should be treated with considerable
caution. He refers to this as overdispersion, which contributes to the inadequacy o f a
statistical model.
The household data was collected in a format that provided information on the nature
and magnitude o f specific sources o f variance in the household dietary intake data
with reference to the market value o f all food items consumed. A survey design was
adopted that allowed the measurement o f these sources o f variation, whilst avoiding
artefactual bias (caused by the over or under-representation o f certain factors as a
result o f the structure used to collect the data, Beaton et a l 1979). The sample o f 128
households was divided into sixteen blocks o f eight households. Two blocks were
interviewed repeatedly each week, so that the complete sample could be monitored
twice over a four month period. Thus, each subject was monitored fourteen times,
seven times by each o f the tw o researchers, seven times in each season and twice on
each day o f the week (Table 8.2) (Saturday’s data was not collected on the Sunday
because o f market day, when a large proportions o f household members w ere absent
from their homes - these data were collected on the Monday).
Table 8.2. Research design undertaken to assess the sources of variance in resource use data.
Sun Mon Tue Wed Thu Fri SatDry Researcher 1 Blocks 1,
3. 5. 7, 9, IL 15
Blocks 1, 3, 5, 7, 9, 11, 15
Blocks 2, 4, 6, 8, 10, 12, 14, 16.
Blocks 1, 3, 5, 7, 9,11, 15
Blocks 2, 4, 6, 8, 10, 12, 14, 16.
Blocks 1, 3, 5, 7, 9, 11, 15
Blocks 2, 4, 6, 8, 10, 12. 14. 16.
Researcher 2 Blocks 2, 4, 6, 8, 10, 12, 14, 16.
Blocks 2, 4, 6, 8, 10, 12, 14, 16.
Blocks 1, 3, 5, 7, 9,11, 15
Blocks 2, 4, 6, 8, 10, 12, 14, 16.
Blocks 1, 3, 5, 7, 9, 11, 15
Blocks 2, 4, 6, 8, 10, 12, 14, 16.
Blocks 1, 3, 5, 7, 9, 11, 15
Wet Researcher 1 Blocks 2, 4, 6, 8, 10, 12. 14, 16.
Blocks 2, 4, 6, 8, 10, 12, 14,16.
Blocks 1, 3, 5. 7, 9, 11, 15
Blocks 2, 4, 6, 8, 10, 12, 14, 16.
Blocks 1, 3, 5, 7, 9,11, 15
Blocks 2, 4, 6, 8, 10, 12, 14, 16.
Blocks 1, 3, 5, 7, 9, 11. 15
Researcher 2 Blocks 1, 3, 5, 7, 9, 11. 15
Blocks 1, 3. 5. 7, 9, 11. 15
Blocks 2, 4, 6, 8, 10, 12, 14, 16.
Blocks 1, 3, 5, 7, 9, 11. 15
Blocks 2, 4, 6, 8, 10, 12, 14, 16.
Blocks 1, 3, 5, 7, 9.11, 15
Blocks 2, 4, 6, 8, 10, 12. 14, 16.
Although this provides a very robust structure for analysing data, in practice, it was
impossible to follow the pattern precisely because o f the occasional absence o f
-172-
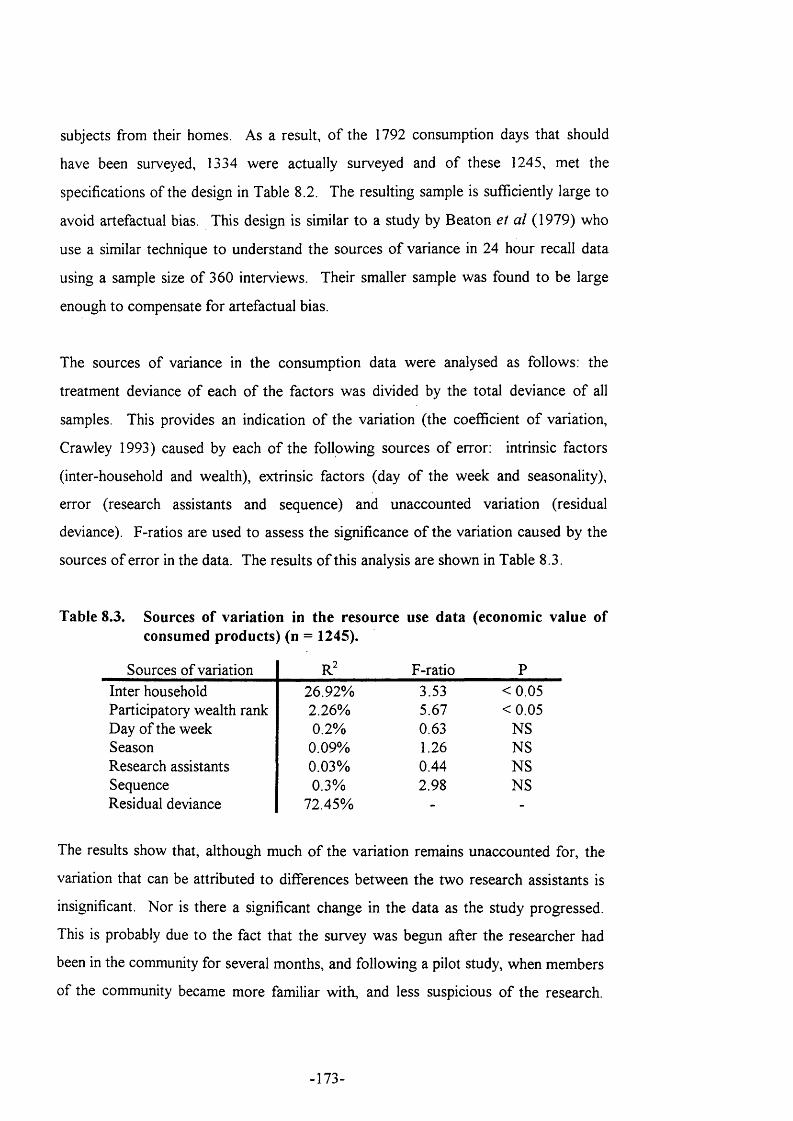
subjects from their homes. As a result, o f the 1792 consumption days that should
have been surveyed, 1334 were actually surveyed and o f these 1245, met the
specifications o f the design in Table 8.2. The resulting sample is sufficiently large to
avoid artefactual bias. This design is similar to a study by Beaton et a l (1979) who
use a similar technique to understand the sources o f variance in 24 hour recall data
using a sample size o f 360 interviews. Their smaller sample was found to be large
enough to compensate for artefactual bias.
The sources o f variance in the consumption data were analysed as follows: the
treatment deviance o f each o f the factors was divided by the total deviance o f all
samples. This provides an indication o f the variation (the coefficient o f variation,
Crawley 1993) caused by each o f the following sources o f error: intrinsic factors
(inter-household and wealth), extrinsic factors (day o f the week and seasonality),
error (research assistants and sequence) and unaccounted variation (residual
deviance). F-ratios are used to assess the significance o f the variation caused by the
sources o f error in the data. The results o f this analysis are shown in Table 8.3.
Table 8.3. Sources of variation in the resource use data (economic value of consumed products) (n = 1245).
Sources o f variation R^ F-ratio PInter household 26.92% 3.53 < 0 .05Participatory wealth rank 2.26% 5.67 < 0 .05Day o f the week 0.2% 0.63 NSSeason 0.09% 1.26 NSResearch assistants 0.03% 0.44 NSSequence 0.3% 2.98 NSResidual deviance 72.45% - -
The results show that, although much o f the variation remains unaccounted for, the
variation that can be attributed to differences between the two research assistants is
insignificant. Nor is there a significant change in the data as the study progressed.
This is probably due to the fact that the survey was begun after the researcher had
been in the community for several months, and following a pilot study, when members
o f the community became more familiar with, and less suspicious o f the research.
-173-
Thus, the sources o f error that can be described by the variance in the data are not
significant.
However, these two sources o f variation only provide an indication o f the level or
error that results from the researcher’s behaviour, or that can be attributed to the
early stages o f the research. As discussed above, other important problems include
recall error and under-reporting as result o f a maintained level o f suspicion on the part
o f the informant. Only a qualitative assessment can be made on these more general
forms o f survey error. Based on extensive discussions with key informants and with
the members o f the households themselves, it is felt that, with a few exceptions (one
o f whom asked to be withdrawn from the survey), members o f the community were
happy to be interviewed. A useful indication was that all households were prepared
to discuss potentially difficult topics, such as bushmeat.
Recall error is often referred to as the main problem in 24-hour diet recall. It is
certainly true that 24-hour recall data cannot provide the level o f precision needed for
studies on nutritional requirements that require precise weights for food items
(Dangour 1996). However, this study does not require the levels o f precision needed
for a nutritional assessment. Rather, the study makes an assessment o f the relative
economic value o f household consumption. F o r this purpose, 24-hour recall methods
seem appropriate.
Extrinsic factors (seasonal and daily differences in resource use) do not appear to play
an important role in explaining variations in the value o f food consumed. However,
intrinsic factors, the variance caused by differences between households, are sufficient
to justify further analysis, although the participatory wealth ranking differences
explain only a small proportion o f the variation. There are two possible reasons for
this: either participatory wealth ranking does not provide a good description o f
wealth, and therefore does not sufficiently explain the variation that is defined by true
wealth status in the community, or, simply, w ealth status does not explain inter
household variations in the value o f food consumption. This may be the case in a
community such as this, where diets are relatively homogenous and increased wealth
174-
does not necessarily imply increased expenditure on food. Although wealth does not
explain much o f the variation in the value o f consumption as a whole, this may not be
the case o f particular subsets o f the diet, such as wild foods. The extent to which
participatory wealth ranking is an appropriate measure o f wealth status in the
community is discussed below. The importance o f wealth in explaining consumption
is the main question o f this chapter and is analysed and presented in the research
results.
8.5.2 Wealth status
As a multi disciplinary study, this research adopts both a formal, quantitative
approach and a participatory approach, that draws on the experiences o f community
members, to make an assessment o f relative household wealth. This section discusses
the merits o f each approach.
Participatory wealth ranking has sparked considerable recent interest as an
appropriate tool for understanding wealth and for classifying households using criteria
that are defined at the community level. Participatory wealth ranking enables
community members to explore their own perceptions o f wealth, thereby providing
the researcher with an understanding o f the rich to poor continuum that is locally
relevant, and not merely based on monetary income (Mukheijee 1992). The
prolonged discussions that ensued (both as part o f the exercise and for several months
afterwards) provided this study with valuable information about the structure o f the
community. It provided the qualitative context from which the quantitative survey
was formulated and enabled the selection o f quantitative indicators o f wealth to be
critically assessed.
The current enthusiasm for experience based research techniques has not been subject
to extensive scientific scrutiny. This is partly because the philosophy that underlies
participatory learning techniques is considered incompatible with a structured,
quantitative approach to social research. There are many well documented
justifications for using an approach to understanding communities that is not
structured according to conventional systematic research design (see Scoones et a l
175.
1992, Chambers 1997). These approaches stress that validity and reliability in the
results is best ensured by understanding the experiences o f community members.
However there are also potential problems that may bring into question the reliability
o f the results. The analysis that follows discusses the limitations in using participatory
techniques in a scientific study. It does not discuss, or question, the considerable
advantages to using participatory approaches to field work for local consultation and
as part o f a process o f community empowerment.
There are potential problems with using participatory approaches (see for example,
PLA Notes special issues on “Wealth Ranking”, no. 15, and “Critical Reflections
from Practice” no. 24), some o f which include:
a. Replication
The assessment o f wealth is specific to the community that has been studied. It is
difficult to determine the extent to which the understanding o f wealth in one
community can be extended to other communities. Repeating the exercise in another
community does not produce an inter-community comparison.
b. Representation
The exercise is carried out by a limited number o f informants. There is no estimation
o f the degree to which the opinions o f the informants are representative o f those o f
the community as a whole. Nor is there usually any assessment o f the contribution
each individual informant makes to the results, potentially leading to biased findings.
All too often, the individuals making up such groups are drawn from a small subset o f
powerful interest groups (Guijt and Shah 1998).
c. M ethodological complementarity
This is best expressed by Chambers’ term ‘optimal ignorance’ (1997), w here
emphasis is placed on accuracy rather than precision. Chambers correctly asserts that
it is better to be approximately right than precisely wrong. However, the inability to
compare levels o f precision can make it difficult to use multi-disciplinary approaches
effectively (Guijt and Cornwall 1995). Lindblade (1995) cautions against the use o f
participatory methods without triangulation with other methods. She supports her
176-
argument by suggesting that local realities can be shaped external interests: from her
study in Uganda, she found that British colonial officers had stressed the effects o f
overpopulation on land degradation as part o f an ""intense campaign o f education and
propagandd\ These pervasive views were reflected in people’s accounts and reflect
""what they think we want to hear'" (Lindblade 1995). This tendency may be reflected
in the suggestion by an elderly woman in Kiliwa that perhaps a return to cotton
production would improve village prosperity. Whilst this may have been music to the
ears o f Belgian colonial extension officers, it almost certainly would not be reflected
in a quantitative analysis o f people’s wealth during the cotton producing period in the
1920s and 1930s (Likaka 1995).
The above problems do not, by any means, represent a fatal flaw in the participatory
learning approach. Indeed, good PRA practitioners are aware o f them, but may only
consider them to be o f secondary importance. However, there is little evidence in the
participatory learning literature o f work that has assessed the extent o f error caused
by factors such as informer bias, or the use o f households that do not represent the
full range o f diversity that exists in the community.
As a multi-disciplinary and collaborative study, participatory learning techniques were
used together with quantitative survey data. Therefore, to enhance compatibility, it is
important to assess the level o f error in the participatory wealth ranking results using
criteria similar to those used to assess formal quantitative data. Statistical techniques
are most often used to determine the extent to which a sample is representative o f the
population from which it was selected. Participatoiy appraisal usually uses a sample
to make a general statement about a community, but there is rarely any recognition
that the results refer to the sample, and not to the whole community (e.g. Steinich
1996). When formal social surveys are undertaken, statistical tests give an estimate
o f the extent to which the sample is representative o f the community, but certain strict
assumptions have to be met. The most important o f these is that each household has
an equal probability o f being included in the sample and thus households are randomly
selected. However during a participatory survey, the members o f the community
- 177-
decide on the households to be assessed. It cannot be assumed that these have been
randomly selected.
The analyses presented in Boxes 8.2 and 8.3 estimate the degree o f confidence that
can be placed in the participatory results. First, the consistency between the
information provided by each o f the informants and the final result o f the pilot sample
is analysed, and second the participatory wealth ranking is compared to the
quantitative survey data.
- 178-
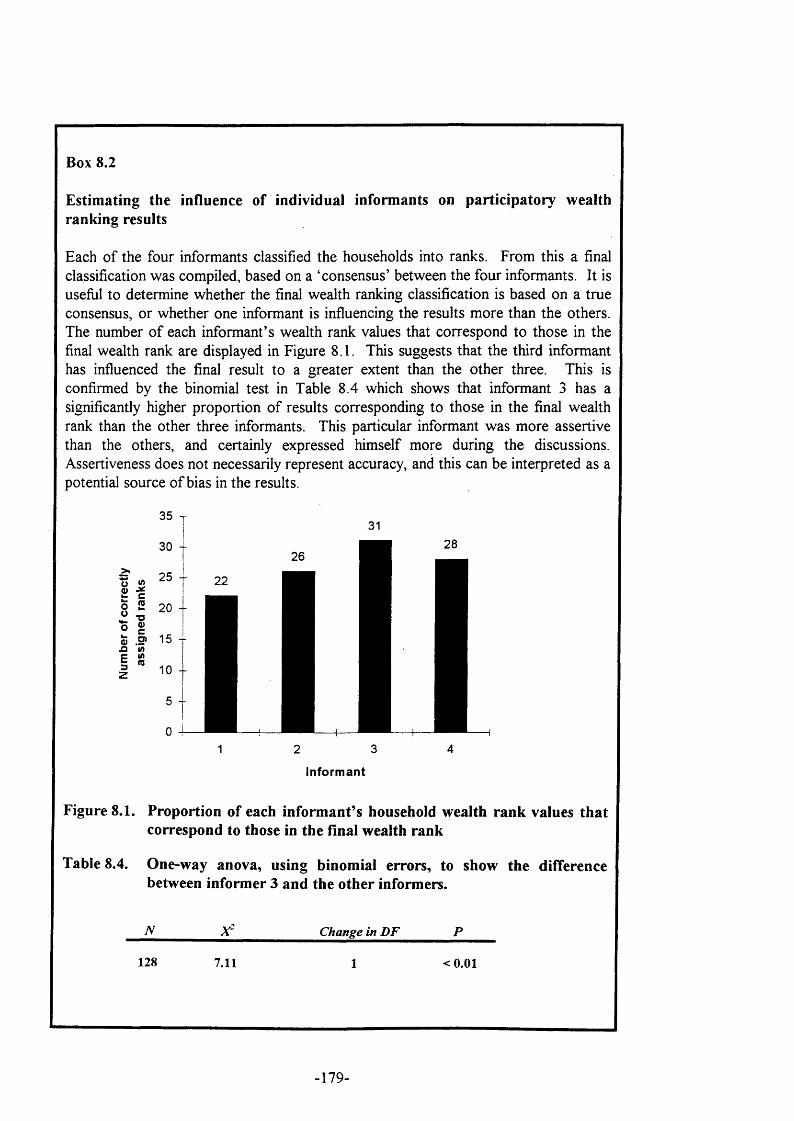
Box 8.2
Estimating the influence of individual informants on participatory wealth ranking results
Each o f the four informants classified the households into ranks. From this a final classification was compiled, based on a ‘consensus’ between the four informants. It is useful to determine whether the final wealth ranking classification is based on a true consensus, or whether one informant is influencing the results more than the others. The number o f each informant’s wealth rank values that correspond to those in the final wealth rank are displayed in Figure 8.1. This suggests that the third informant has influenced the final result to a greater extent than the other three. This is confirmed by the binomial test in Table 8.4 which shows that informant 3 has a significantly higher proportion o f results corresponding to those in the final wealth rank than the other three informants. This particular informant was more assertive than the others, and certainly expressed himself more during the discussions. Assertiveness does not necessarily represent accuracy, and this can be interpreted as a potential source o f bias in the results.
35 -r
30 -
g J225 T
II: £n lA.2» 15 -
10 -
I n fo r m a n t
Figure 8.1. Proportion of each informantes household wealth rank values that correspond to those in the final wealth rank
Table 8.4. One-way anova, using binomial errors, to show the difference between informer 3 and the other informers.
N
128
X-
7.11
Change in DF
< 0.01
-179-
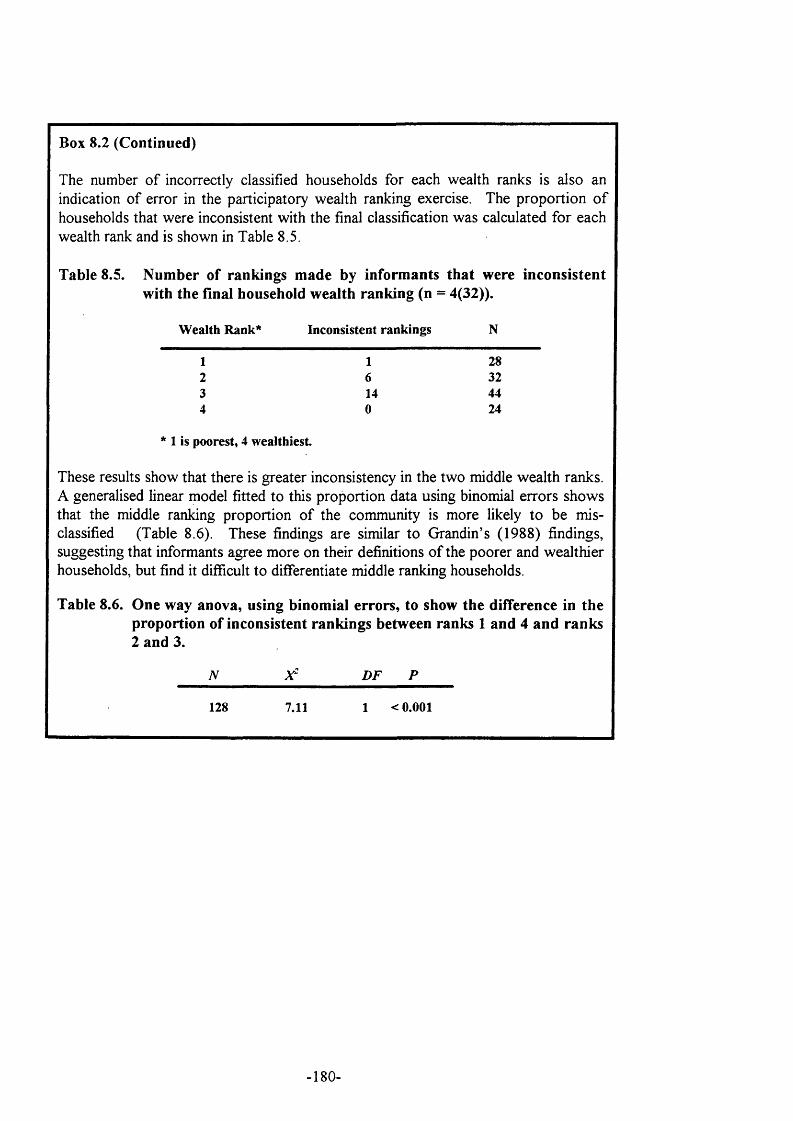
Box 8.2 (Continued)
The number o f incorrectly classified households for each wealth ranks is also an indication o f error in the participatory wealth ranking exercise. The proportion o f households that were inconsistent with the final classification was calculated for each wealth rank and is shown in Table 8.5.
Table 8.5. Number of rankings made by informants that were inconsistent with the final household wealth ranking (n = 4(32)).
W e a l t h R a n k * I n c o n s i s t e n t r a n k i n g s N
1 1 2 8
2 6 3 2
3 1 4 4 4
4 0 2 4
* 1 i s p o o r e s t , 4 w e a l t h i e s t .
These results show that there is greater inconsistency in the two middle wealth ranks. A generalised linear model fitted to this proportion data using binomial errors shows that the middle ranking proportion o f the community is more likely to be mis- classified (Table 8.6). These findings are similar to Grandin’s (1988) findings, suggesting that informants agree more on their definitions o f the poorer and wealthier households, but find it difficult to differentiate middle ranking households.
Table 8.6. One way anova, using binomial errors, to show the difference in the proportion of inconsistent rankings between ranks 1 and 4 and ranks 2 and 3.
N____ ____ DF P
1 2 8 7 . 1 1 1 < 0 . 0 0 1
-180-
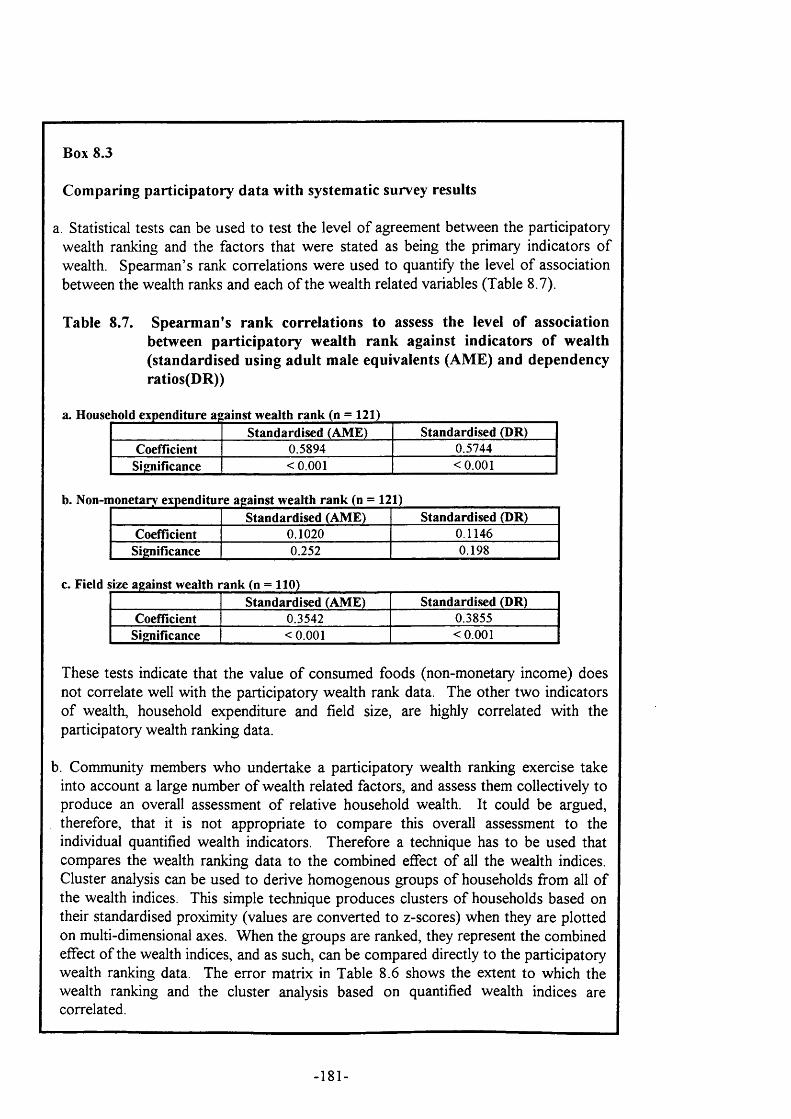
Box 8.3
Comparing participatory data with systematic survey results
a. Statistical tests can be used to test the level o f agreement between the participatory wealth ranking and the factors that were stated as being the primary indicators o f wealth. Spearman’s rank correlations were used to quantify the level o f association between the wealth ranks and each o f the wealth related variables (Table 8.7).
Table 8.7. Spearman’s rank correlations to assess the level of association between participatory wealth rank against indicators of wealth (standardised using adult male equivalents (AME) and dependency ratios(DR))
Standardised (AM E) Standardised (DR)Coefficient 0.5894 0.5744
Significance < 0 .001 < 0 .001
b. Non-m onetar) expenditure against w ealth rank (n = 121)Standardised (AM E) Standardised (DR)
Coefficient 0.1020 0.1146Significance 0.252 0.198
c. Field size against wealth rank (n = 110)Standardised (AM E) Standardised (DR)
Coefficient 0.3542 0.3855Significance < 0 .001 < 0.001
These tests indicate that the value o f consumed foods (non-monetary income) does not correlate well with the participatory wealth rank data. The other two indicators o f wealth, household expenditure and field size, are highly correlated with the participatory wealth ranking data.
b. Community members who undertake a participatory wealth ranking exercise take into account a large number o f wealth related factors, and assess them collectively to produce an overall assessment o f relative household wealth. It could be argued, therefore, that it is not appropriate to compare this overall assessment to the individual quantified wealth indicators. Therefore a technique has to be used that compares the wealth ranking data to the combined effect o f all the wealth indices. Cluster analysis can be used to derive homogenous groups o f households from all o f the wealth indices. This simple technique produces clusters o f households based on their standardised proximity (values are converted to z-scores) when they are plotted on multi-dimensional axes. When the groups are ranked, they represent the combined effect o f the wealth indices, and as such, can be compared directly to the participatory wealth ranking data. The error matrix in Table 8.6 shows the extent to which the wealth ranking and the cluster analysis based on quantified wealth indices are correlated.
-181-
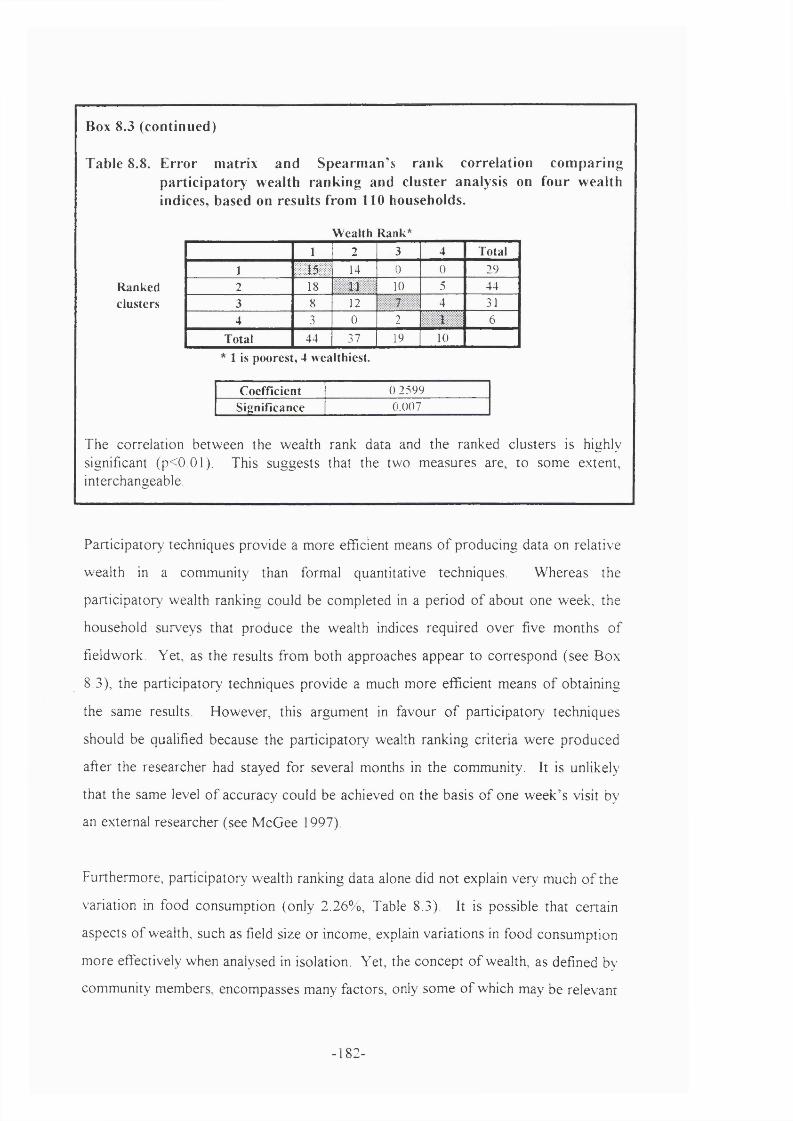
Box 8.3 (continued)
Table 8.8. E rro r m atrix and Spearm an’s rank correlation com paring partic ipatory wealth ranking and cluster analysis on four w ealth indices, based on results from 110 households.
Wealth Rank*
Rankedclusters
1 2 3 4 Total1 0 # # 14 0 0 292 18 U 10 5 443 8 12 4 314 3 0 2 6
Total 44 37 19 101 is poorest, 4 wealthiest.
Coefficient 0.2599Significance 0.007
The correlation betw een the w ealth rank data and the ranked clusters is highly significant (p<0.01). This suggests that the tw o m easures are, to som e extent,interchangeable.
Partic ipatory techniques provide a m ore efficient m eans o f producing data on relative
w ealth in a com m unity than form al quantitative techniques. W hereas the
participator)^ w ealth ranking could be com pleted in a period o f about one w eek, the
household surveys that p roduce the w ealth indices required over five m onths o f
fieldw ork. Y et, as the results from both approaches appear to correspond (see B ox
8.3), the partic ipatory techniques provide a much m ore efficient m eans o f ob tain ing
the sam e results. H ow ever, this argum ent in favour o f partic ipatory techn iques
should be qualified because the partic ipatory w ealth ranking criteria w ere p roduced
after the researcher had stayed fo r several m onths in the com m unity. It is unlikely
that the sam e level o f accuracy could be achieved on the basis o f one w eek ’s visit by
an external researcher (see M cG ee 1997).
F urtherm ore, partic ipatory w ealth ranking data alone did not explain very m uch o f the
variation in food consum ption (only 2.26% , Table 8.3). It is possible that certain
aspects o f wealth, such as field size o r incom e, explain varia tions in food consum ption
m ore effectively w hen analysed in isolation. Y et, the concep t o f w ealth, as defined by
com m unity m em bers, encom passes m any factors, only som e o f which may be relevant
- 1 8 2 -
in explaining resource use. Participatory wealth ranking data do not provide the
means to disaggregate wealth into these various components so that they can be
examined in isolation.
Participatory wealth ranking has been shown to have limitations in the context o f a
study on resource use by a community. It is difficult to address the question o f bias in
participatory data unless very careful note is taken o f how the data were collected
(which households were selected, and how) and analysed (who produced the results,
and to what extent were they based on stated criteria). This study has examined these
sources o f bias, but in doing so, may have detracted from the truly participatory
nature o f a community assessment.
This appraisal o f methods has shown that both quantitative survey data and
participatory techniques have important limitations in a study such as this. However,
using participatory techniques in conjunction with formalised quantitative surveys has
the combined effect o f focusing the research on wealth related issues that are locally
relevant, whilst collecting data that make it possible to use a rigorous and quantitative
approach to understanding resource use.
8.6 Results
This section analyses the relationships between wealth and natural resource use by
exploring patterns o f association between the measured household consumption o f
wild foods and the measures o f wealth described above. The market value o f foods is
used as an estimate o f their importance. This provides an effective measure o f value
that is consistent for all food types.
Two approaches are used. The first examines the total consumption o f wild foods by
households. The second examines the consumption o f wild foods as a proportion o f
total household food consumption. The distinction is made because absolute values
are a reflection o f a household’s consumption o f wild foods, whilst proportions
provide a better reflection o f the importance o f wild foods to the household.
183-
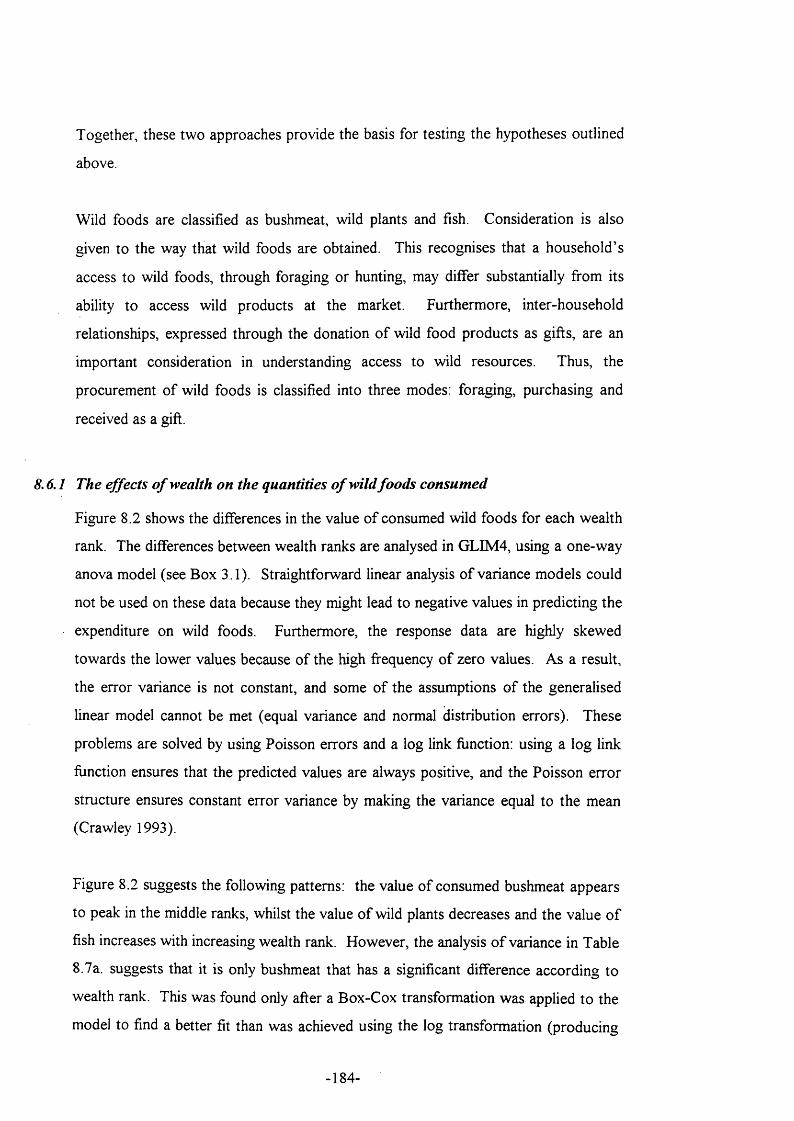
Together, these two approaches provide the basis for testing the hypotheses outlined
above.
Wild foods are classified as bushmeat, wild plants and fish. Consideration is also
given to the way that wild foods are obtained. This recognises that a household’s
access to wild foods, through foraging or hunting, may differ substantially from its
ability to access wild products at the market. Furthermore, inter-household
relationships, expressed through the donation o f wild food products as gifts, are an
important consideration in understanding access to wild resources. Thus, the
procurement o f wild foods is classified into three modes; foraging, purchasing and
received as a gift.
8.6.1 The effects o f wealth on the quantities o f wild foods consumed
Figure 8.2 shows the differences in the value o f consumed wild foods for each wealth
rank. The differences between wealth ranks are analysed in GLIM4, using a one-way
anova model (see Box 3.1). Straightforward linear analysis o f variance models could
not be used on these data because they might lead to negative values in predicting the
expenditure on wild foods. Furthermore, the response data are highly skewed
towards the lower values because o f the high frequency o f zero values. As a result,
the error variance is not constant, and some o f the assumptions o f the generalised
linear model cannot be met (equal variance and normal distribution errors). These
problems are solved by using Poisson errors and a log link function: using a log link
function ensures that the predicted values are always positive, and the Poisson error
structure ensures constant error variance by making the variance equal to the mean
(Crawley 1993).
Figure 8.2 suggests the following patterns: the value o f consumed bushmeat appears
to peak in the middle ranks, whilst the value o f wild plants decreases and the value o f
fish increases with increasing wealth rank. However, the analysis o f variance in Table
8.7a. suggests that it is only bushmeat that has a significant difference according to
wealth rank. This was found only after a Box-Cox transformation was applied to the
model to find a better fit than was achieved using the log transformation (producing
-184-
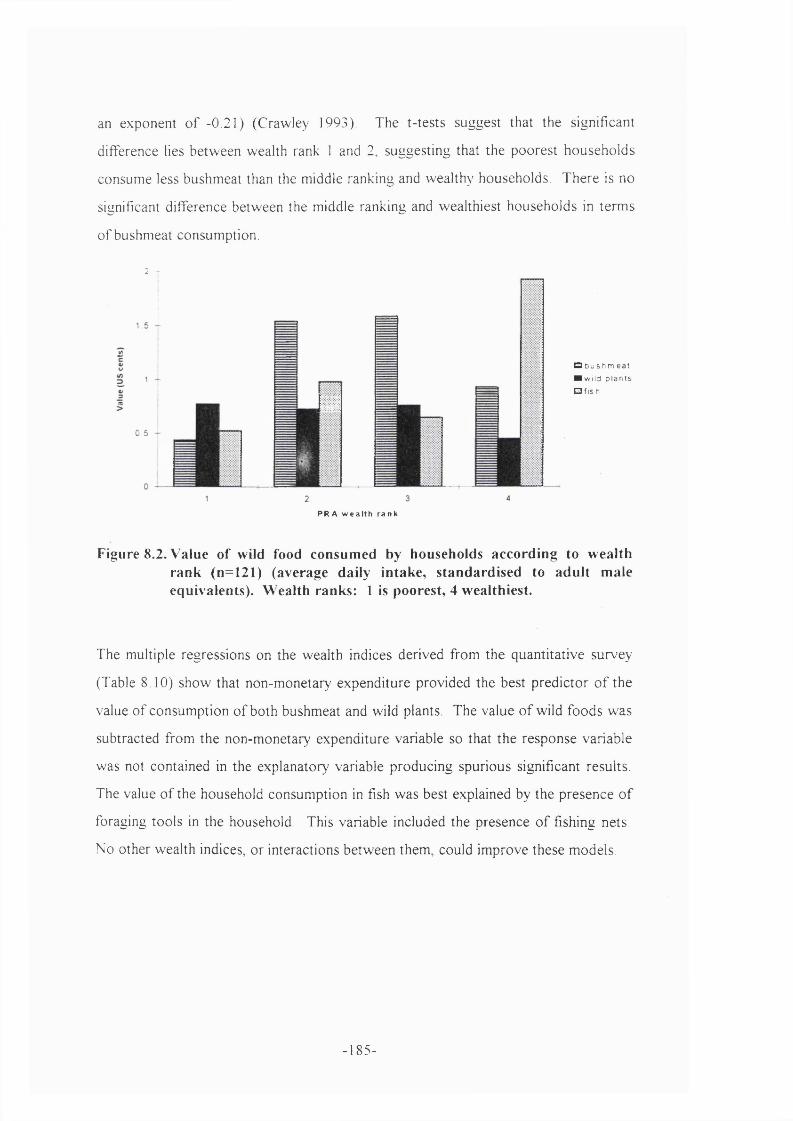
an exponent o f -0 .21) (C raw ley 1993). The t-tests suggest that the significant
difference lies betw een w ealth rank 1 and 2, suggesting that the poorest househo lds
consum e less bushm eat than the m iddle ranking and w ealthy households. T here is no
significant difference betw een the m iddle ranking and w ealthiest households in term s
o f bushm eat consum ption.
2 -
■
P R A w e a l t h r a n k
C5 b u s h m e a t
■ wi l b p l a n t s
□ f is h
Figure 8.2. Value of wild food consumed by households according to w ealth rank (n=121) (average daily intake, standardised to adult male equivalents). W ealth ranks: 1 is poorest, 4 wealthiest.
The m ultiple regressions on the w ealth indices derived from the quantitative survey
(Table 8.10) show that non-m onetary expenditure provided the best p red ic to r o f the
value o f consum ption o f both bushm eat and wild plants. The value o f wild foods w as
subtracted from the non-m onetary expenditure variable so that th e response variable
was not contained in the explanatory variable producing spurious significant results.
The value o f the household consum ption in fish w as best explained by the p resence o f
foraging too ls in the household. This variable included the presence o f fishing nets.
N o o ther w ealth indices, o r interactions betw een them , could im prove these m odels.
- 185 -
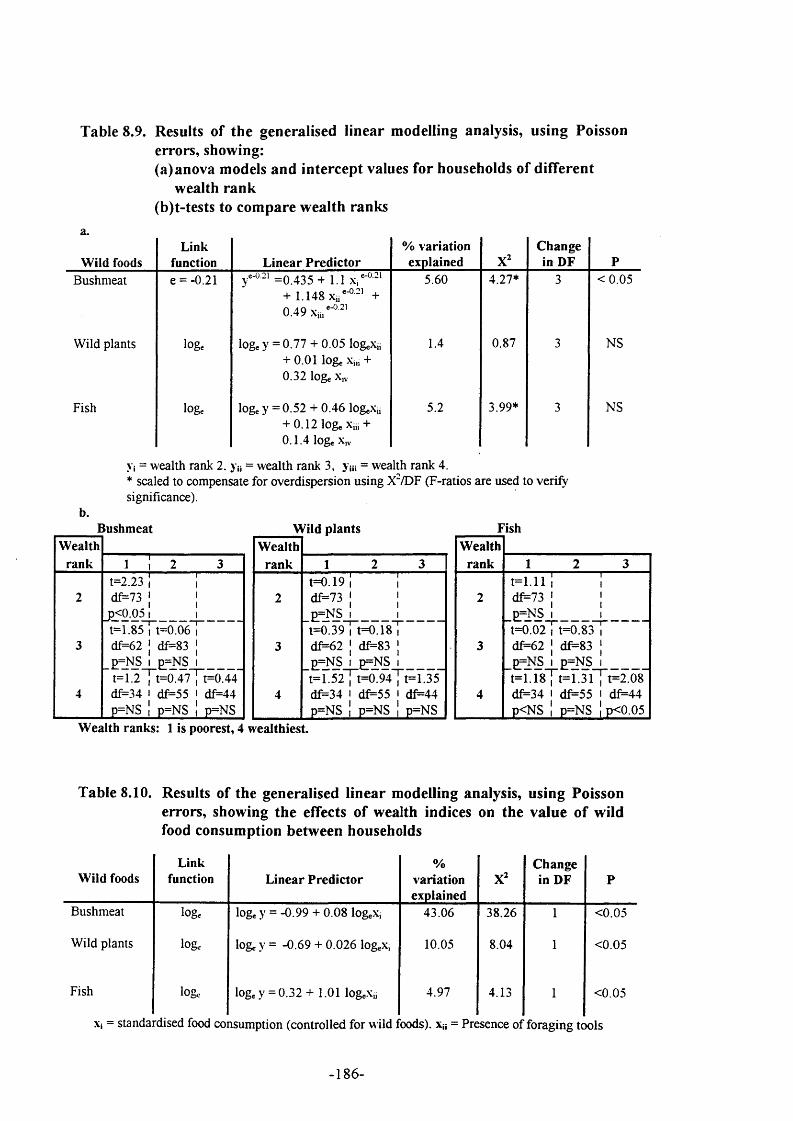
Table 8.9. Results of the generalised linear modelling analysis, using Poisson errors, showing:(a)anova models and intercept values for households of different
wealth rank(b)t-tests to compare wealth ranks
a.
W ild foodsLink
function L inear P redictor% variation
explainedC hange
in DF PBushmeat e = -0.21 ye-0.21 = 0 .435 + 1.1 X."'®"'
+ 1.148 Xi.'-®-’ + 0.49 x..,'-® '
5.60 4.27* 3 < 0 .0 5
Wild plants loge loge y = 0 .7 7 + 0.05 logeXi. + 0.01 loge Xi,. + 0.32 loge Xiv
1.4 0.87 3 NS
Fish loge loge y = 0 .5 2 + 0.46 logeXi. + 0.12 loge Xii. + 0.1.4 loge X.V
5.2 3.99* 3 NS
Vi = wealth rank 2. y» = wealth rank 3, yui = wealth rank 4.* scaled to compensate for overdispersion using X“/DF (F-ratios are used to verify significance).
b.Bushmeat
W ealthrank 1 ! 2 3
t=2.23 1 12 df=73 I 1
p < 0 .051 1t=1.85 1 t=0.06 1
3 df^62 1 df=83 1p=NS 1 p=NS 1t=1.2~[~t=0.47T"[=0.44
4 df=34 1 df=55 1 df=44p=NS 1 p=NS 1 p=NS
W ild plants FishW ealth
rank 1 2 3t=0.19 1 1
2 df^73 1 1p=NS 1 1t= 0 .3 9 T t= 0 .1 8 T
3 df=62 1 df^83 1p=NS 1 p=NS 1t=1.52 , t= 0 .94 j t=1.35
4 df=34 1 df=55 1 df=44p=NS ! p=NS ! p=NS
W ealthrank 1 2 3
t = l . l l l i2 df^73 j 1
' _____1 ________t= 0 .02T t= 0 .8 3 T
3 df=62 1 df^83 Ip=NS 1 p=NS 1t=1.18 I t=1.31 , t=2.08
4 df=34 1 df=55 1 df=44p<NS 1 p=NS 1 p<0.05
W ealth ranks: 1 is poorest, 4 w ea lth iest
Table 8.10. Results of the generalised linear modelling analysis, using Poisson errors, showing the effects of wealth indices on the value of wild food consumption between households
W ild foodsLink
function L inear P redictor%
variationexplained
X=Change in DF P
Bushmeat loge loge y = -0.99 + 0.08 lOgeX. 43.06 38.26 1 <0.05
Wild plants loge loge y = -0.69 + 0.026 logeX. 10.05 8.04 1 <0.05
Fish loge loge y = 0 .3 2 +1 . 0 1 logeXü 4.97 4.13 1 <0.05
Xi - standardised food consumption (controlled for w ild foods), xn = Presence o f foraging tools
-186-
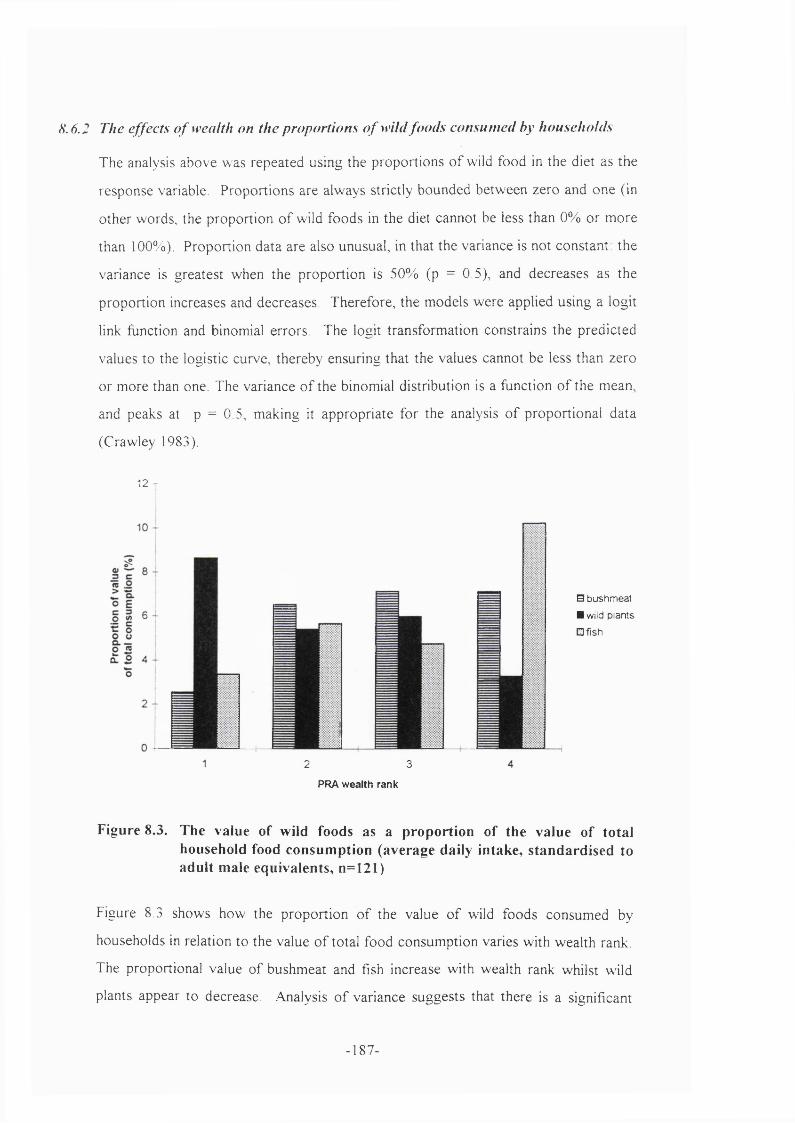
8.6.2 The effects o f wealth on the proportions o f wild foods consum ed by households
The analysis above was repeated using the proportions o f wild food in the diet as the
response variable. Proportions are always strictly bounded between zero and one (in
other words, the proportion o f wild foods in the diet cannot be less than 0% or more
than 100%). Proportion data are also unusual, in that the variance is not constant; the
variance is greatest when the proportion is 50% (p = 0.5), and decreases as the
proportion increases and decreases. Therefore, the models were applied using a logit
link function and binomial errors. The logit transformation constrains the predicted
values to the logistic curve, thereby ensuring that the values cannot be less than zero
or more than one. The variance o f the binomial distribution is a function o f the mean,
and peaks at p = 0.5, making it appropriate for the analysis o f proportional data
(Crawley 1983).
12 '
B bushmeat
■ wild plants
Elfish
2 3PRA wealth rank
F ig u r e 8 .3 . T h e v a lu e o f w ild f o o d s a s a p r o p o r t io n o f th e v a lu e o f to ta l h o u s e h o ld fo o d c o n s u m p t io n ( a v e r a g e d a ily in ta k e , s t a n d a r d is e d to a d u lt m a le e q u iv a le n t s , n = 1 2 1 )
Figure 8.3 shows how the proportion o f the value o f wild foods consumed by
households in relation to the value o f total food consumption varies with wealth rank.
The proportional value of bushmeat and fish increase with wealth rank whilst wild
plants appear to decrease. Analysis o f variance suggests that there is a significant
- 1 8 7 -
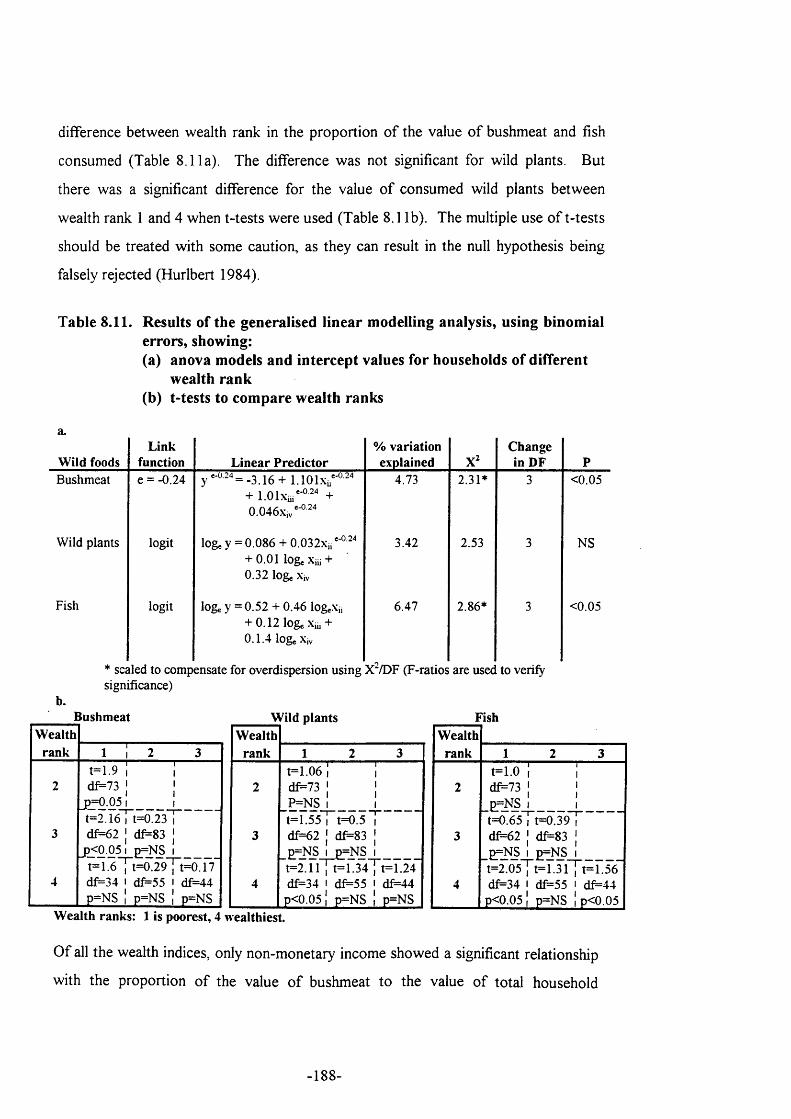
difference between wealth rank in the proportion o f the value o f bushmeat and fish
consumed (Table 8.11a). The difference was not significant for wild plants. But
there was a significant difference for the value o f consumed wild plants between
wealth rank 1 and 4 when t-tests were used (Table 8.11b). The multiple use o f t-tests
should be treated with some caution, as they can result in the null hypothesis being
falsely rejected (Hurlbert 1984).
Table 8.11. Results of the generalised linear modelling analysis, using binomial errors, showing:(a) anova models and intercept values for households of different
wealth rank(b) t-tests to compare wealth ranks
a.
W ild foodsLink
function L inear Predictor% variation
explainedC hange
in DF PBushmeat e = -0.24 y«-^24^-3 16^. 1 iQij. e-0.24
+ + 0.046x,/-^^"
4.73 2.31* 3 <0.05
Wild plants logit loge y = 0 .0 8 6 + 0.032x..*'° " + 0 .0 1 loge X», +0.32 loge x,v
3.42 2.53 3 NS
Fish logit loge y = 0 .5 2 H- 0.46 logeXi. + 0.12 loge Xii, -1- 0.1.4 loge Xiv
6.47 2.86* 3 <0.05
* scaled to compensate for overdispersion using X ‘/DF (F-ratios are used to verify significance)
Bushm eatW ealth
rank 1 ! 2 3t = i . 9 1 ;
2 df=73 1 1p= 0 .051 1t=2.16 1 t=0.23 1
3 df=62 1 df=83 Ip<0.05 1 p=NS 1t=1.6 1 t=0.29 , t=0.17
4 df=34 1 df=55 1 df=44p=NS 1 p=NS 1 p=NS
W ild plants Fish
W ealth ranks: 1 is poorest, 4 wealthiest.
W ealthrank 1 2 3
t=1.06 ! i2 df^73 ' '
P=NS 1 1t= 1 .5 5 T t= 0 .5 T
3 df=62 1 df=83 1p=NS 1 p=NS 1t= 2 .1 iy t=1 .34"î”t=1.24
4 df=34 1 df=55 1 df=44p<0.05 1 p=NS ! p=NS
W ealthrank 1 2 3
t= i.o ; ;2 df=73 1 j
' ____ 1t= 0.65T t= 0 .3 9 T
3 df=62 1 df=83 1p=NS 1 p=NS 1t=2.05 \ t=1.31 , t=1.56
4 df=34 1 df=55 1 df=44p<0.05 1 p=NS 1 p<0.05
O f all the wealth indices, only non-monetary income showed a significant relationship
with the proportion o f the value o f bushmeat to the value o f total household
-188-
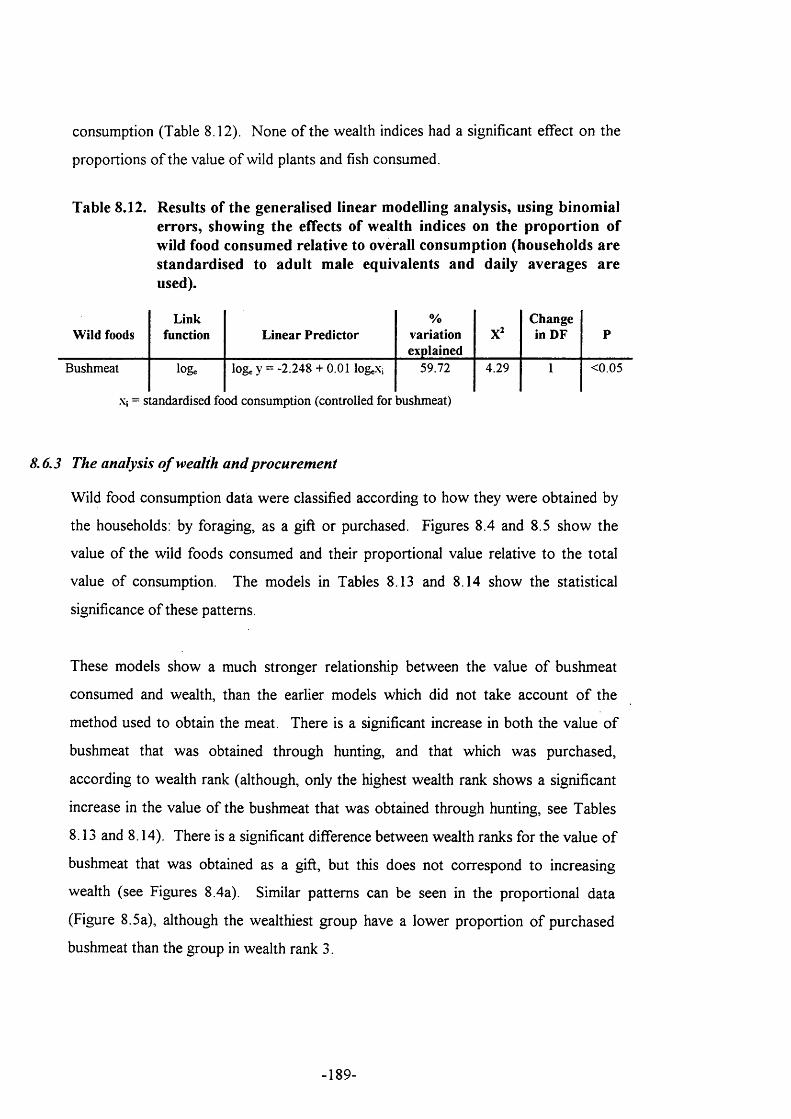
consumption (Table 8.12). None o f the wealth indices had a significant effect on the
proportions o f the value o f wild plants and fish consumed.
T ab le 8.12. R esu lts o f th e g enera lised lin e a r m odelling analysis, using b in o m ia l e rro rs , show ing th e effects o f w ea lth indices on th e p ro p o rtio n o f w ild food consum ed re la tiv e to overall co n su m p tio n (h o u seh o ld s a re s ta n d a rd ise d to a d u lt m ale eq u iv a len ts a n d da ily av erag es a re used).
W ild foodsLink
function L inear Predictor%
variationexplained
C hange in DF P
Bushmeat loge lo g e y = -2.248 + 0.01 logeX, 59.72 4.29 1 <0.05
Xi = standardised food consumption (controlled for bushmeat)
8.6.3 The analysis o f wealth and procurem ent
Wild food consumption data were classified according to how they were obtained by
the households: by foraging, as a gift or purchased. Figures 8.4 and 8.5 show the
value o f the wild foods consumed and their proportional value relative to the total
value o f consumption. The models in Tables 8.13 and 8.14 show the statistical
significance o f these patterns.
These models show a much stronger relationship between the value o f bushmeat
consumed and wealth, than the earlier models which did not take account o f the
method used to obtain the meat. There is a significant increase in both the value o f
bushmeat that was obtained through hunting, and that which was purchased,
according to wealth rank (although, only the highest wealth rank shows a significant
increase in the value o f the bushmeat that was obtained through hunting, see Tables
8.13 and 8.14). There is a significant difference between wealth ranks for the value o f
bushmeat that was obtained as a gift, but this does not correspond to increasing
wealth (see Figures 8.4a). Similar patterns can be seen in the proportional data
(Figure 8.5a), although the wealthiest group have a lower proportion o f purchased
bushmeat than the group in wealth rank 3.
189-
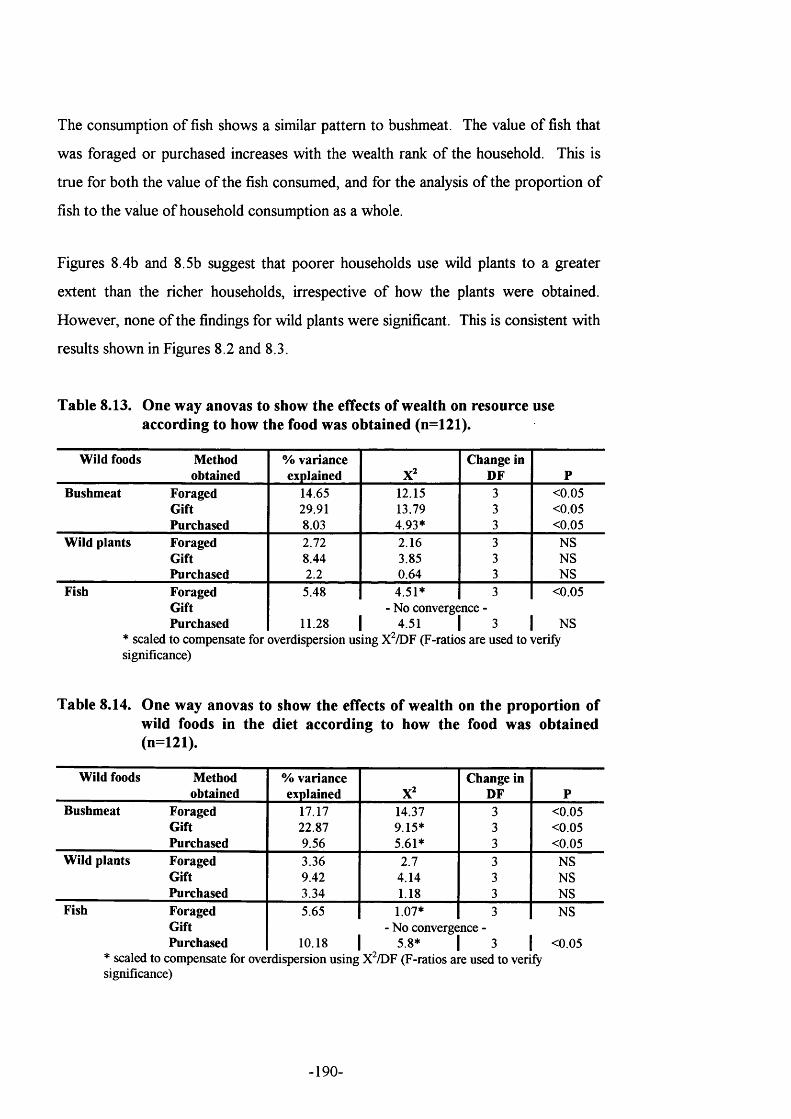
The consumption o f fish shows a similar pattern to bushmeat. The value o f fish that
was foraged or purchased increases with the wealth rank o f the household. This is
true for both the value o f the fish consumed, and for the analysis o f the proportion o f
fish to the value o f household consumption as a whole.
Figures 8.4b and 8.5b suggest that poorer households use wild plants to a greater
extent than the richer households, irrespective o f how the plants were obtained.
However, none o f the findings for wild plants were significant. This is consistent with
results shown in Figures 8.2 and 8.3.
T ab le 8.13. O ne w ay anovas to show th e effects o f w ea lth on reso u rce use acco rd in g to how th e food w as o b ta in e d (n=121).
W ild foods M ethodobtained
% variance explained
Change in DF P
Bushm eat Foraged 14.65 12.15 3 <0.05Gift 29.91 13.79 3 <0.05Purchased 8.03 4.93* 3 <0.05
W ild plants Foraged 2.72 2.16 3 NSG ift 8.44 3.85 3 NSPurchased 2.2 0.64 3 NS
Fish Foraged 5.48 4.51* 3 <0.05G ift - No convergence -Purchased 11.28 4.51 3 NS
significance)
T ab le 8.14. O ne w ay anovas to show th e effects o f w ea lth on th e p ro p o rtio n o f w ild foods in th e d ie t acco rd in g to how th e food w as o b ta in e d (n=121).
W ild foods M ethodobtained
% variance explained
Change in DF P
Bushm eat Foraged 17.17 14.37 3 <0.05Gift 22.87 9.15* 3 <0.05Purchased 9.56 5.61* 3 <0.05
W ild plants Foraged 3.36 2.7 3 NSGift 9.42 4.14 3 NSPurchased 3.34 1.18 3 NS
Fish Foraged 5.65 1.07* 3 NSGift - N o convergence -Purchased 10.18 5.8* 3 <0.05
significance)
-190-
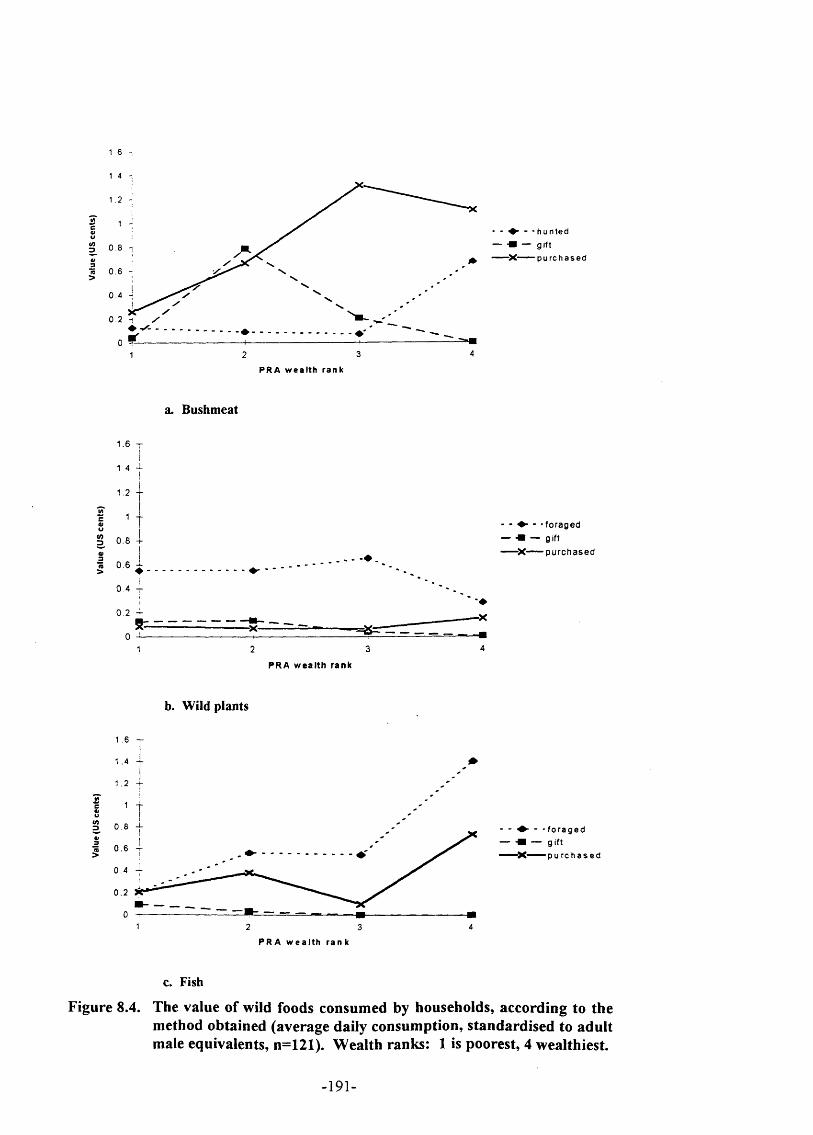
1 6
1 4
1 .2
1
0.8
0.6
0.4
0.2
04321
* - - - h u n t e d
— — gift X p u r c h a s e d
P R A w e a l t h r a n k
a. Bushmeat
1.6 T
1 4 -L
1.2
1 0.8 - 1-
- * - - f o r a g e d
— - # — gift
X p u r c h a s e d
•5 0 .6 ♦0.4 -
0.2 4
2 3P R A w e a l t h r ank
b. W ild plants
1 - 6 T
1 .4
1 .2
1
0. 8
0.6
0.4
0. 2
01 2 3 4
■ - - f o r a g e d — gi f t
— pu r c h a s e d
P R A w e a l t h r a n k
c. Fish
Figure 8.4. The value of wild foods consumed by households, according to the method obtained (average daily consumption, standardised to adult male equivalents, n=121). Wealth ranks: 1 is poorest, 4 wealthiest.
-191-
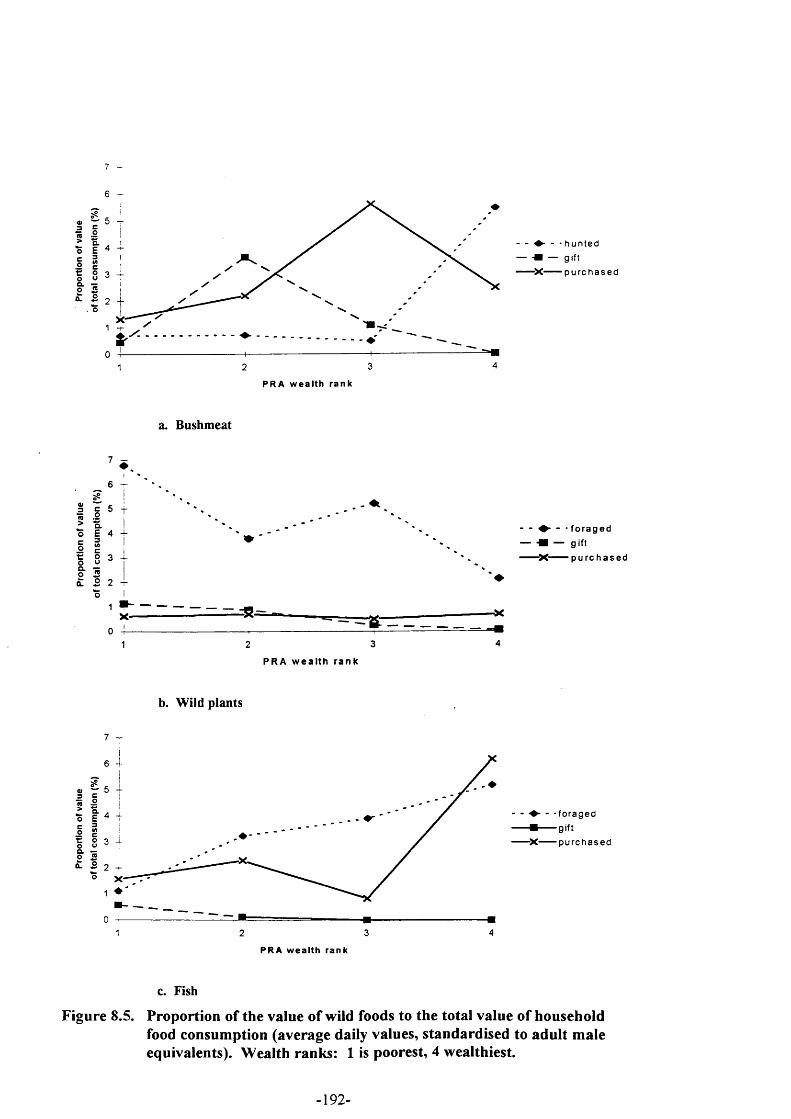
7 -
6 —
S
2
S
I 4
§ 3
o2
1
04321
♦ - - • h u n t e d
- X p u r c h a s e d
P R A w e a l t h r a n k
a. Bushmeat
« O
6 - r
I
5 t
o 3 ;iLi- - - * f o r a g e d
— *■ — gift' X p u r c h a s e d
---------------------2 3
P R A w e a l t h r a n k
-X-m
4
1 -
b. W ild plants
6
— 5
4
♦ - -8 3
I 2
1
03 41 2
♦ - - - f o r a g e d
- = gi ft
- X p u r c h a s e d
P R A w e a l t h r a n k
c. Fish
Figure 8.5. Proportion of the value of wild foods to the total value of household food consumption (average daily values, standardised to adult male equivalents). Wealth ranks: 1 is poorest, 4 wealthiest.
-192-
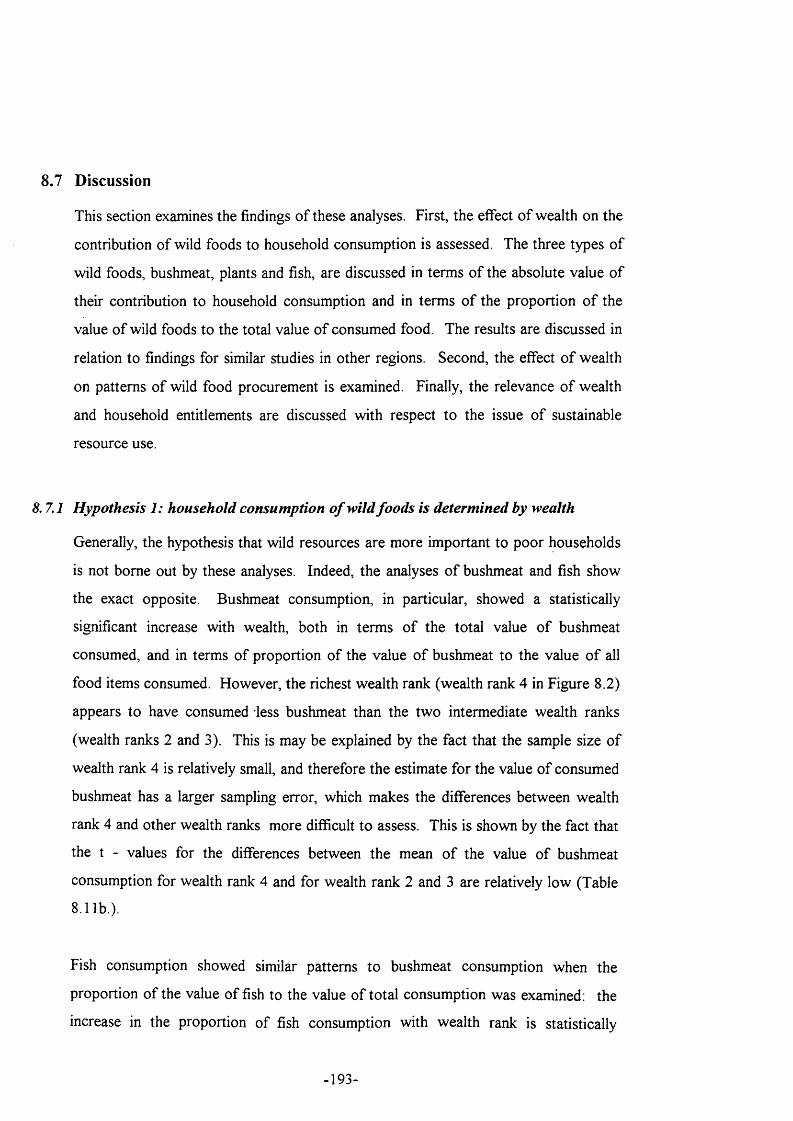
8.7 Discussion
This section examines the findings o f these analyses. First, the effect o f wealth on the
contribution o f wild foods to household consumption is assessed. The three types o f
wild foods, bushmeat, plants and fish, are discussed in terms o f the absolute value o f
their contribution to household consumption and in terms o f the proportion o f the
value o f wild foods to the total value o f consumed food. The results are discussed in
relation to findings for similar studies in other regions. Second, the effect o f wealth
on patterns o f wild food procurement is examined. Finally, the relevance o f wealth
and household entitlements are discussed with respect to the issue o f sustainable
resource use.
8.7.1 Hypothesis 1: household consumption o f wild foods is determined by wealth
Generally, the hypothesis that wild resources are more important to poor households
is not borne out by these analyses. Indeed, the analyses o f bushmeat and fish show
the exact opposite. Bushmeat consumption, in particular, showed a statistically
significant increase with wealth, both in term s o f the total value o f bushmeat
consumed, and in terms o f proportion o f the value o f bushmeat to the value o f all
food items consumed. However, the richest wealth rank (wealth rank 4 in Figure 8.2)
appears to have consumed less bushmeat than the two intermediate wealth ranks
(wealth ranks 2 and 3). This is may be explained by the fact that the sample size o f
wealth rank 4 is relatively small, and therefore the estimate for the value o f consumed
bushmeat has a larger sampling error, which makes the differences between wealth
rank 4 and other wealth ranks more difficult to assess. This is shown by the fact that
the t - values for the differences between the mean o f the value o f bushmeat
consumption for wealth rank 4 and for wealth rank 2 and 3 are relatively low (Table
8.11b.).
Fish consumption showed similar patterns to bushmeat consumption when the
proportion o f the value o f fish to the value o f total consumption was examined: the
increase in the proportion o f fish consumption with wealth rank is statistically
-193-
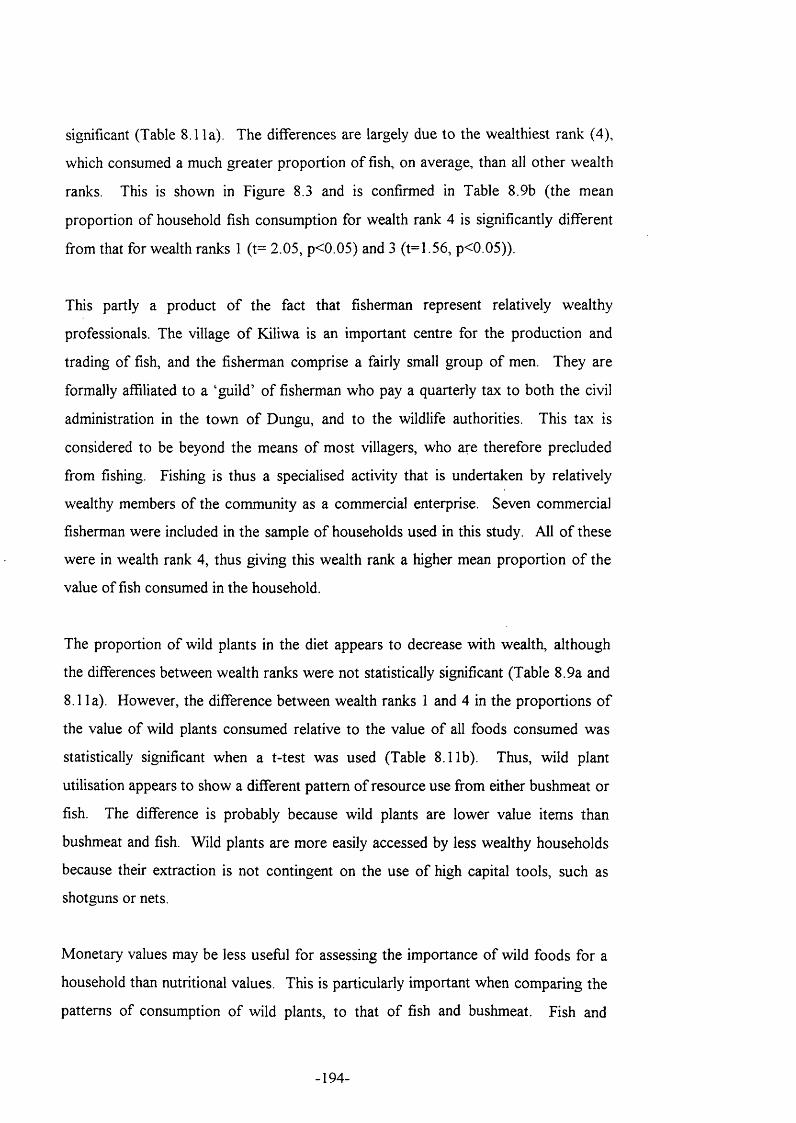
significant (Table 8 .11a). The differences are largely due to the wealthiest rank (4),
which consumed a much greater proportion o f fish, on average, than all other wealth
ranks. This is shown in Figure 8.3 and is confirmed in Table 8.9b (the mean
proportion o f household fish consumption for wealth rank 4 is significantly different
from that for wealth ranks 1 (t= 2.05, p<0.05) and 3 (t=1.56, p<0.05)).
This partly a product o f the fact that fisherman represent relatively wealthy
professionals. The village o f Kiliwa is an important centre for the production and
trading o f fish, and the fisherman comprise a fairly small group o f men. They are
formally affiliated to a ‘guild’ o f fisherman who pay a quarterly tax to both the civil
administration in the town o f Dungu, and to the wildlife authorities. This tax is
considered to be beyond the means o f most villagers, who are therefore precluded
from fishing. Fishing is thus a specialised activity that is undertaken by relatively
wealthy members o f the community as a commercial enterprise. Seven commercial
fisherman were included in the sample o f households used in this study. All o f these
were in wealth rank 4, thus giving this wealth rank a higher mean proportion o f the
value o f fish consumed in the household.
The proportion o f wild plants in the diet appears to decrease with wealth, although
the differences between wealth ranks were not statistically significant (Table 8.9a and
8.1 la). However, the difference between wealth ranks 1 and 4 in the proportions o f
the value o f wild plants consumed relative to the value o f all foods consumed was
statistically significant when a t-test was used (Table 8.11b). Thus, wild plant
utilisation appears to show a different pattern o f resource use from either bushmeat or
fish. The difference is probably because wild plants are lower value items than
bushmeat and fish. Wild plants are more easily accessed by less wealthy households
because their extraction is not contingent on the use o f high capital tools, such as
shotguns or nets.
Monetary values may be less useful for assessing the importance o f wild foods for a
household than nutritional values. This is particularly important when comparing the
patterns o f consumption o f wild plants, to that o f fish and bushmeat. Fish and
-194-
bushmeat are high financial value food items, and therefore their market values
probably inflate their importance in terms o f contribution to the diet. It is possible
that the nutritional value o f wild plants is greater than that o f bushmeat and fish,
although the economic analysis does not reflect this importance.
Economic value o f wild foods was used because it could be interpreted more easily by
both the informants and the researcher collecting the data. It is based on the rationale
that 24-hour recall data cannot be used to measure the nutritional value o f
consumption precisely.
Thus, these findings appear to contradict the conventional wisdom that wild foods are
most important to the poorest households in a community (e.g. Scoones et a l 1992).
Several recent studies o f wealth and resource use, using extensive quantitative data,
produce similar results to the findings o f this study. In a study o f the use o f forest
resources amongst pastoralists in Northern Kenya, Chenevix-Trench (1997) found
that wealth did not significantly affect the level o f reliance on wild resources, although
these findings were affected by the provision o f relief aid in the area. Similarly, a
study by Wickramasinghe et a l (1996) in Sri Lanka, used regression models to
examine the factors which explain the value o f household consumption o f wild foods
and other forest resources and found the relationship between household wealth and
resource use to be non-significant.
A number o f studies have explored the significance o f household size in explaining
resource use patterns (e.g. Abbot 1996, Biran 1996, Wickramasinghe et a l 1996).
However, contrary to this study’s findings, these authors show that household size
shows a significant relationship with the amount o f wild products used. In the case o f
Wickramasinghe’s study, households were not standardised according to household
size, so their results largely reflect total household values, which are a function o f
household size. Thus, large households will tend to have a higher gross consumption
by virtue o f having more members that consume. Therefore, their conclusion that
larger households derive a greater income from wild products because o f their
195-
increased access to labour is questionable because their results do not represent per
capita gains.
The present study found that family size had no effect on increased consumption o f
wild foods for the member o f a household. This is probably because family size is
positively correlated with the dependency ratio (Pearson’s correlation coefficient
0.287, n = 121, p < 0.01), which implies that larger families tended to have more
unproductive mouths to feed. Other studies have found that family size does infact
provide a good explanation for household consumption. This is the case for a study
o f fuelwood consumption amongst a fishing community in Malawi (Abbot 1996) and
for water consumption amongst pastoralists in Tanzania (Biran 1997). However, in
these communities, per capita consumption decreases with family size. This is
explained by an economy o f scale: larger families benefit from the more efficient use
o f specific commodities, such as fuelwood and water, which reduces their p er capita
consumption. This does not apply to food products.
8.7.2 Hypothesis 2: A household's modes o f procurement o f wild foods differs according to wealth
The methods used to obtain wild foods were examined in detail in order to
understand how rural households can access wild resources. It is increasingly
recognised that rural households differ considerably in their entitlements to wild
resources, whatever the abundance o f wild foods in their environment (de Waal
1989). This study has highlighted these differences by examining household access to
wild foods through foraging, as gifts or by purchasing the products.
a. W ildfoods obtained throi4gh foraging
The consumption o f foraged bushmeat and fish increases with wealth rank, both in
terms o f the value o f the wild food consumed, and in terms o f the proportions o f
value o f the resource to the total value o f all food consumed. The difference in the
value o f fish consumed between wealth ranks is largely explained by the fact that the
wealthiest rank (4) consumes significantly more than the other three. This
corresponds to the earlier explanation: fishing is essentially a commercial activity
-196-
dominated by a minority o f specialised fisherman who derive relatively large incomes
from fishing. This result contrasts with Godoy el aPs (1995) findings in Central
America which show that increased wealth is not associated with greater levels o f
specialisation in the procurement o f the wild resources.
The value o f consumed meat that was procured through hunting shows a similar
pattern, which is probably explained by the fact that much o f the bushmeat is hunted
using shotguns. The value o f a locally constructed shotgun is in excess o f US $150,
which is beyond the means o f most households. Those that could afford the capital
cost o f a shotgun together with the expense o f the ammunition were mainly in wealth
rank 4.
All households obtained most o f their wild plants through foraging (f-ratio=46.35,
n=121, p<0.01, and a ‘Tukey’s least significant difference test’ showed the difference
between the value o f foraged wild plants and wild plants that were purchased and
obtained as a gift to be most significant). Poor households appeared to forage the
most wild plants, both in terms o f the absolute value o f plants and the proportional
value o f consumption, although this was not statistically significant. The foraging o f
wild plants would appear attractive to poorer households because their acquisition
does not require any specialised equipment. Furthermore, the majority o f wild plants
that appeared in the diet were seasonally available products, such as mushrooms.
These were abundant in the early wet season, when household provisions w ere low,
particularly amongst the poorer households. This pattern has also been noted by
Toulmin (1986) in Central Mali, who describes the differences in wild food foraging
between poor and rich households. During the dry season, poorer households
procure more wild foods to ensure that their food supplies are sufficient until the next
harvest, whilst richer households, that are more likely to have larger food stores,
focus their labour activity on the acquisition o f non-food wild products, such as
building materials. Thus, wild plants seem particularly important as ‘hungry season’
resources for the poorer households who have less access to stored agricultural
products (Chambers e fa /1 9 8 1 , de Garine and Koppert 1988).
-197-
b. Wild foods obtained as g ifts
On average, more bushmeat was obtained as a gift than was obtained by hunting.
There are two possible explanations for this. First, successful hunts result in the
acquisition o f large amounts o f bushmeat (most hunted mammals weigh more than
five kilogrammes). It is difficult for a household to store large quantities o f meat, and
it may choose to distribute it to other households. When a relatively large animal,
such as a warthog or baboon was caught, most o f the animal would be distributed to
other households (see Chapter 9). Furthermore, hunts are usually composed o f
several individuals, only some o f whom have shotguns. The others assist with the
tracking, and killing o f an animal if it has been wounded, and with carrying the
carcass back to the village. These unequipped members o f the hunt are usually
provided with a portion o f the hunt as a gift. It is probably for this reason that the
middle ranks have larger amounts o f bushmeat acquired as a gift.
The second reason for the importance o f bushmeat acquired through gifts has been
explained by hunters in the course o f the field work. Excessive good fortune is
perceived to be at the expense o f the community as a whole, and may even bring mis
fortune to particular families. A string o f successful hunts is one form o f excessive
good fortune, and suspicion and animosity from other members o f the community is
most effectively curbed by distributing portions o f meat. Selling the surplus at the
market is likely to instil high levels o f suspicion because the market place is a public
arena, and the hunter is seen to capitalise further on his excessive good fortune (see
Evans Pritchard 1972). Giving bushmeat is another case o f the use o f gifts, widely
acknowledged as cohesive gestures in communities (e.g. Mauss 1952, Guyer 1994).
Fishing, on the other hand does not instil the same suspicions amongst members o f
the community. Fishing is perceived as a profession, and therefore a successful
fisherman is considered hard working or intelligent rather than lucky. Fishing is more
o f a commercial activity in the village, and fish is therefore rarely provided as a gift
between households. When a fisher obtains large quantities o f fish, they can readily
be disposed o f at the market. Likewise, wild plants are rarely given as gifts. Their
-198-
relatively low value, together with their relative abundance in the environment, make
them accessible to all households.
c. Wild fo o d s that are purchased
The purchasing o f meat at the market is the most important means by which
households are able to obtain bushmeat. This is because the immediate area around
the village, where local villagers hunt, has a low abundance o f large mammals. Large
mammals provide the bulk o f commercialised meat, and they appear to be obtained
away from the village by commercial hunters.
Both bushmeat and fish are relatively high cost food items, and this is reflected in the
data by an increase in both the quantity and the proportion o f purchased bushmeat
and fish in relation to increasing wealth rank. Wild plants, on the other hand, are
rarely purchased, largely because o f their high abundance in the environment in and
around the village.
8.7.3 Wealth, wild foods and sustainable natural resource utilisation
This study o f wild food use in a community in the hunting reserves does not allow for
any reliable statements to be made about the sustainability o f wildlife utilisation.
Indeed, an accurate impact assessment o f wild resource use requires accurate
quantitative data on the abundance o f the resources as well as the levels o f resource
offtake. Ideally, these should be examined over a sufficiently long period o f time to
be able to detect a causal link between human offtake and significant reductions in
animal or plant abundance (Cunningham 1990).
This study has not been sufficiently extensive to provide the data to answer questions
about sustainability. Indeed, there appear to be no examples in the literature o f long
term datasets that can show a causal link between animal population trends and
human resource use (Godoy and Bawa 1993). Given the lack o f feasibility o f such
studies, a multi-disciplinary approach that examines resource use from various
perspectives at one point in time, covering population structure and distribution as
well as consumption and supply, can successfully improve our understanding o f the
199-
impacts o f resource use through a process o f triangulation o f evidence (eg. Abbot
1996, Chenevix-Trench 1997, Sullivan 1998). This study has given important insights
into the current patterns o f resource use. Increased wealth is significantly associated
with increased demand for high value wild foods. As shown in Figure 8.4a, the
wealthier households purchased most o f their meat. Their demand appears to be met
by an increase in the marketing o f wild foods. Although richer households also hunt
more, this does not appear to fully meet their demand and they purchase from the
market to bridge the shortfall between the demand and household catch.
This raises important questions, both from a legal perspective (the Code Penal only
permits subsistence hunting in the reserves) and from the perspective o f the impact o f
hunting on animal populations; is subsistence hunting in the periphery o f the village
viable, or is demand met primarily by hunting larger mammals from areas where they
are currently more abundant? The rest o f this thesis will address these questions by
examining the costs and benefits o f subsistence and commercial hunting, and the
incentives for marketing bushmeat from different locations in the reserves.
-200-
8 .8 C on clu sion s
When wild foods are aggregated, and when the market value is used as an indication
o f the level o f consumption, the results suggest that the use o f wild foods does not
benefit the poorer households to a greater extent than the wealthier households.
However, these results are heavily influenced by the effects o f bushmeat and fish, that
are high value products, and whose use correlates with wealth. By contrast, wild
plants do appear to be used to a greater extent by poorer households, both in term s o f
their absolute value, and the proportion o f their value in relation to the value o f all
consumed food items.
A better understanding o f the effects o f wealth on resource use is gained by
examining a household’s entitlements to wild foods. This study has shown that the
patterns o f procurement o f wild foods differ substantially according to wealth.
Wealthier households are more likely to forage and purchase high value wild foods
(bushmeat and fish). Fishing is dominated by a small minority o f households
belonging to the wealthiest sector o f the community. Bushmeat is predominantly
purchased at the market, suggesting that the commercial sale o f bushmeat is more
important than the subsistence hunting o f bushmeat at Kiliwa. These results indicate
that increased wealth is associated with a greater demand for high value wild foods.
This demand is met primarily by specialised hunters and fisherman who distribute
their products through markets. This will be examined further in Chapters 9 and 10,
which assess the costs and benefits o f hunting, and o f marketing bushmeat.
-201-
Chapter 9
W ildlife H arvesting and C onservation
9.1 Summary
Data on faunal harvests at two locations in the Hunting Reserves are presented to
explore the incentives to hunt and the ecological implications o f hunting amongst the
Zande communities around Garamba National Park. Hunting practices were
observed and recorded in Zande communities at two locations, Kiliwa and Mamba.
Kiliwa is a site o f relatively low animal abundance and Mamba, which is close to the
National Park Boundary, is a site o f high animal abundance (see Figure 2.4). The
data were analysed to test the hypothesis that hunters manage their resources as
conservationists. The alternative hypothesis is that hunters make decisions to
maximise their short term economic benefits. The results reveal that the benefits from
hunting activities are diverse and cannot be explained solely in terms o f economic
incentives. An understanding o f wildlife utilisation that takes account o f the legal
constraints and the social incentives to hunt provide a better explanation for Zande
hunting patterns. Nevertheless, there is no evidence to show that hunters make
decisions based on conservation objectives. The implications o f these findings for
community based conservation are discussed.
-202-
9.2 Introduction
Hunting as a form o f wildlife management has received considerable attention in the
conservation literature because it is seen as a viable alternative to the more coercive
strategies implicit in ‘protectionist’ wildlife management (Barbier et a l 1990). The
rationale for this argument is that communities have an incentive to manage resources
sustainably when they generate local profits. This ‘use it or lose it’ principle now
underpins several conservation policies, particularly in Southern Africa (Child 1990,
Murphree 1990, 1996, Pearce 1996).
The contribution o f wild game to the economy is often underestimated because it is
concealed within the informal sector, and often provides local as opposed to national
level financial benefits (Asibey 1974, Butynski and von Richter 1974, Ghimire 1991).
The net profits from wild mammal populations often exceed those o f domestic herds
(de Vos 1977). Thus, the incentives to exploit wild animal populations are
considerable. Nevertheless, it is not an implicit consequence that hunters will
deliberately conserve their resources because the resources are highly profitable.
Indeed, the economically rational decision for individual hunters might be to maximise
their rate o f returns from hunting (Milner-Gulland and Leader-Williams 1992) as
restraint on the part o f an individual is likely to profit other hunters who do not show
restraint when exploiting finite resources (Smith 1983). This chapter examines the
motivations behind wildlife harvesting patterns with a view to providing a better
understanding o f hunting strategies and their implications for conservation.
9.2.1 Wildlife management and conservation by hunters
This thesis examines the patterns and consequences o f wildlife management. Two
definitions o f wildlife management have been proposed (see Chapter 1). The first was
described as a centralised, state managed system whose implementation focuses on
the protection o f animal populations by a recognised wildlife authority. The
authority’s mandate is well defined, and its activities were documented in Chapter 4.
The second system o f wildlife management was defined as consumption-based and is
-203-
driven by the nutritional, economic and other needs o f the human populations in the
region. Consumption-based wildlife management is loosely defined because it
encompasses the many aspects o f the relationship between human and wildlife
populations. The rationale for the integration o f broad-based ‘community’
approaches into wildlife management has been extensively documented and advocated
(IIED 1993, Pimbert and Pretty 1994, see also Chapter 8 for an analysis o f a
community’s use o f wildlife resources). Nevertheless, there are relatively few studies
that have explicitly tested the assumptions that the consumptive use o f animal
populations can be described as a form o f wildlife management.
The use o f the term ‘wildlife management’ is sufficiently broad to encompass a range
o f wildlife utilisation practices. For instance, the economically rational decision to
deplete a resource in order to convert it to a m ore profitable commodity (money) can
be interpreted as an effective form o f wildlife management. Indeed, it has been
postulated that this is the most appropriate form o f wildlife management for certain
large mammal populations if a criterion o f economic efficiency is used (Caughley
1993). In contrast, conservation management involves the maintenance o f wild
populations to ensure that their numbers are not depleted in the long term.
This chapter tests whether the wildlife management practices o f resident communities
can be linked to long term conservation objectives on the part o f the individuals who
exploit the wildlife populations. This means that communities must exploit the
resource sustainably. This condition is met when human populations do not hunt
their prey to extinction. A biological definition o f sustainability relates to the
population dynamics, whereby “a stable or fluctuating equilibrium is obtained when a
predator population is limited in its ability to drive its prey population to extinction”
(Taylor 1984, in Alvard 1995). Thus, a broad definition o f conservation would
include the maintenance o f a stable or fluctuating “equilibrium” in species populations
over prolonged periods o f time. Although somewhat vague, this concept o f
conservation does provide a basis for understanding the conservation component o f
local wildlife management practices.
-204-
A number o f authors have asserted that indigenous communities are dependent on
natural resources for their subsistence and therefore have a vested interest in
managing the resource sustainably, thus maintaining an equilibrium in the animal
populations (Feit 1973, Bunyard 1989). Indeed, the popular belief that indigenous
communities have established a “balance with Nature” is a strongly held view,
supported more by a concern for the loss o f traditional culture than by empirical
evidence for sustainable resource use (Robinson and Redford 1991).
Certainly, hunting communities can be shown to have a non-significant impact on
natural resources if they do not contribute to a systematic decline in the abundance o f
the resource. This was shown to be the case in the Hunting Reserves around
Garamba National Park, because the presence o f agricultural populations could not be
associated with a decline in the abundance o f most mammals (see Chapter 5).
However, Alvard (1993, 1995) warns against the assertion that this can be used as
evidence for ‘community conservation’. He maintains that an understanding o f the
decisions o f individuals is more important to the definition o f conservation
management by hunters than is the sustainability o f their hunting. This is because
evidence for sustained yields from hunting does not necessarily support the hypothesis
that hunters are managing the resource. It may simply be an artefact o f density
dependant and other relationships between the hunter and the prey. Thus, Alvard
describes sustainable hunting in the absence o f any pro-active conservation as
‘epiphenomenal’.
Alvard’s definition o f conservation involves an understanding o f the hunter’s
motivations; “conservation can be thought o f as enduring a cost in the present so that
some benefits will be realised in the future” (Alvard 1993). This is a useful definition
o f conservation for two reason. First, conservation management can be operationally
defined by assessing the evidence for restraint in people’s hunting practices. Second,
sustainable yields are an artefact o f the current socio-economic and demographic
context. In view o f the rapid change affecting rural communities, future sustainability
can only be predicted through an understanding o f people’s motivations.
-205-
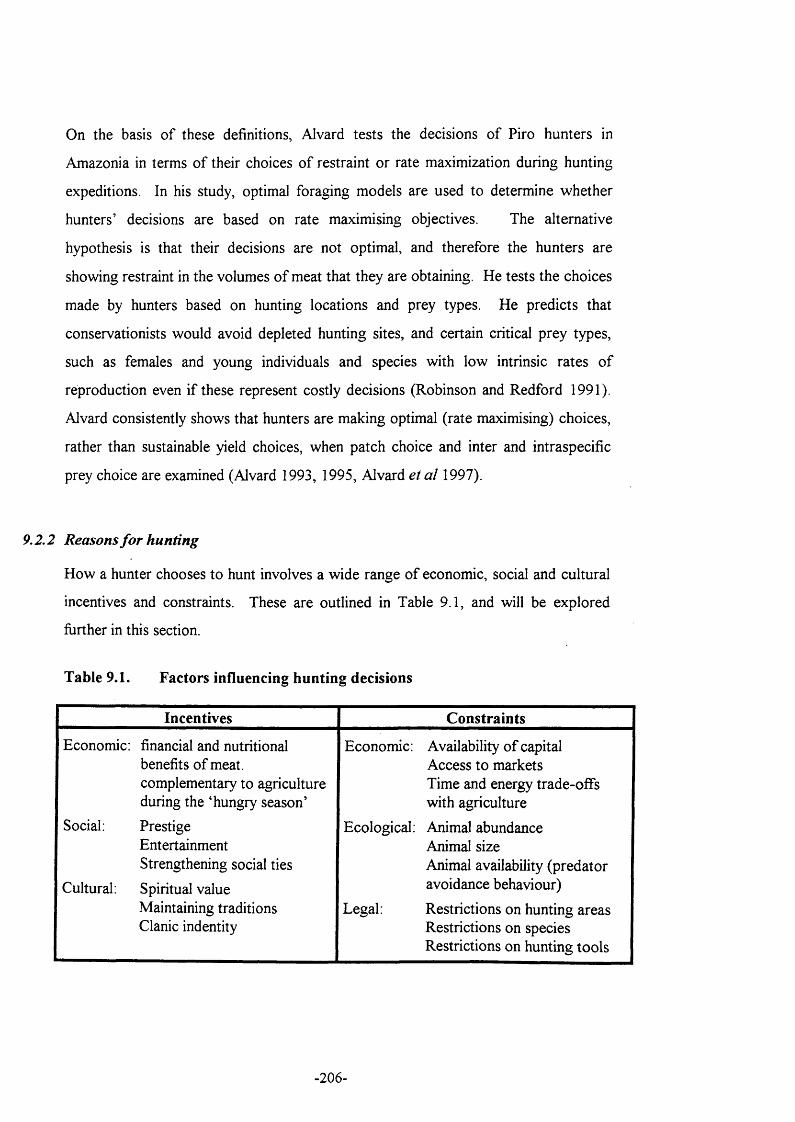
On the basis o f these definitions, Alvard tests the decisions o f Piro hunters in
Amazonia in terms o f their choices o f restraint or rate maximization during hunting
expeditions. In his study, optimal foraging models are used to determine whether
hunters’ decisions are based on rate maximising objectives. The alternative
hypothesis is that their decisions are not optimal, and therefore the hunters are
showing restraint in the volumes o f meat that they are obtaining. He tests the choices
made by hunters based on hunting locations and prey types. He predicts that
conservationists would avoid depleted hunting sites, and certain critical prey types,
such as females and young individuals and species with low intrinsic rates o f
reproduction even if these represent costly decisions (Robinson and Redford 1991).
Alvard consistently shows that hunters are making optimal (rate maximising) choices,
rather than sustainable yield choices, when patch choice and inter and intraspecific
prey choice are examined (Alvard 1993, 1995, Alvard e t a l 1997).
9.2.2 Reasons fo r hunting
How a hunter chooses to hunt involves a wide range o f economic, social and cultural
incentives and constraints. These are outlined in Table 9.1, and will be explored
further in this section.
Table 9.1. Factors influencing hunting decisions
Incentives Constraints
Economic: financial and nutritional Economic: Availability o f capitalbenefits o f meat. Access to marketscomplementary to agriculture Time and energy trade-offsduring the ‘hungry season’ with agriculture
Social: Prestige Ecological: Animal abundanceEntertainment Animal sizeStrengthening social ties Animal availability (predator
Cultural: Spiritual value avoidance behaviour)
Maintaining traditions Legal: Restrictions on hunting areasClanic indentity Restrictions on species
Restrictions on hunting tools
-206-
9.2.3 Definitions o f hunting
Hunting techniques can be defined in terms o f the physical properties o f hunting tools
as well as the strategies used by hunters to exploit wildlife. However, there are also
wider cultural, legal and ecological characteristics which define Zande hunting.
Various characteristics have been employed to categorise hunting in other studies o f
hunting societies (see, for example Hart and Hart 1979, for the Mbuti o f the Ituri
Forest in eastern Congo, or Berry and Petty 1992, for an agricultural community in
Malawi). A broad description o f hunting around Garamba National Park is
summarised below, according to technical as well as the legal, ecological and
economic context o f the area.
a. Technical definitions o f hunting
Much o f the hunting technology is artisanally constructed and is therefore varied in
design and function. Nevertheless three broad classes o f tools are typically used by
the Azande in the region: nets, snares and firearms.
1. Nets are used as part o f a group hunting exercise. Net hunting usually involves
groups o f four to twelve hunters, carrying nets and spears. Nets measure between
fifteen and forty metres in length and are just over a metre in height. They are
constructed locally using bark from a variety o f species o f trees. Nets are valuable
because o f the high time investment that is required to construct them. There are
some specialised net makers in the village, although most men have a good
knowledge o f net construction and maintenance. M ost households have nets, and
these can easily be indentified hanging from the food stores. Trained dogs play a
key role in the hunt. The owner o f the dogs is the most prestigious member o f the
hunt. The dogs have wooden bells attached to their necks to increase the noise
during the tracking o f game. The bells are filled with leaves when not in use.
Bailey and Aunger 1989, Hart and Hart 1986 and Bahuchet and Pujol 1975 all
provide descriptions from the region o f hunting techniques using nets.
2. Snares and traps vary from small nylon snares used to capture wild fowl and
rodents to large pits that are dug to capture animals as large as the giant forest
hog. Some snares are relatively expensive, such as the large wire snares, made o f
-207-
Steel cable, that are used for capturing medium sized animals, whilst others are
locally constructed from wild resources.
3. Firearms used fall into two categories. Firstly, there are locally constructed
shotguns, known as fabrications. M ost are built in the town o f Isiro, about three
hundred kilometres away. The amunition is either purchased as pre-fabricated
cartridges, or made locally with used cartridges, lead from disused vehicle batteries
and gun powder that is usually bought from the military. The locally constructed
cartridges are cheaper, but have a much higher rate o f misfiring. During this
research, 43 percent o f the locally made cartridges misfired, compared to none o f
the purchased cartridges. Secondly, automatic rifles have become widely available,
and cheap to purchase, following the prolonged civil war in southern Sudan.
These primarily include Chinese built AK47s and American built G3s.
Ammunition is cheaper than for shotguns, but there are heavy penalties if a hunter
is found in possession o f an automatic weapon.
b. Hunting techniques
Bahuchet (1971) provides a useful classification for hunting techniques based on the
relationship between the hunter and the prey. The hunter’s objective is either to come
into direct contact with the prey and kill the animal directly, or to maintain a distance
with the animal and capture it before killing it;
Direct hunting
These activities rely on a technology that brings the hunter in direct contact with the
prey. They imply a calculated approach on the animal, followed by the kill. Several
hunting strategies are included in this category:
1 Provoking the animal to flee: This is typified by net hunting, whereby the dogs
are used to frighten the animal, directing them into the concealed nets o f the
hunters. Nets are laid out relatively close to the point o f departure, and most o f
the hunts take place within the village itself. The hunt is organised several days
before the arranged date. On the day o f the hunt, hunters are summoned using a
gong to the house o f the man responsible for coordinating the hunt. Hunters are
-208-
usually related or have close ties o f friendship, and each hunter has an assigned
role.
2. Provoking the animal to approach the hunter; this form o f hunting is only used by
the more experienced hunters using firearms. It seems to be particularly effective
for hunting primates. One hunter in Kiliwa was able to attract certain species o f
monkeys to within a few metres by mimicking their calls.
3. Provoking as little reaction from the animal as possible: this technique is adopted
when hunting mammals using firarms. Shotgun hunting is usually undertaken
individually because hunters are more concealed. In the case o f hunts using
automatic weapons, large groups o f men may take part because the hunt can last
several days and large amounts o f meat may need to be carried. However, the
hunt itself is usually carried out by an individual. The hunt usually takes place at
considerable distances from the village. The most organised o f these hunts are the
poaching expeditions in the park, which are well equipped and usually very
productive.
Indirect hunting
These techniques can be summarised by the use o f traps and snares. The principle is
to maintain as great a distance as possible between the hunter and the animal. Traps
and snares are usually owned and placed by individuals, although the task o f
monitoring can be allocated to other members o f the owner’s household. Prescribed
rules exist for the distribution o f the catch if someone other than the owner finds an
animal in a snare or trap. The person is allowed to kill the animal, but is not allowed
to touch the animal after having killed it. The person then has to find the owner, and
the owner is obliged to provide them with one front limb. Snare and traps are often
placed relatively close to the owners fields so that they serve the dual purpose o f
protecting the fields from crop raiding animals, as well as providing meat.
c. Legal definitions o f hunting
The legal status o f hunting in the reserves is defined in the Code Civil Zairois 1982
(owing to the change o f government, this has recently been revised, but is not
available at the time o f writing). The law classifies the use o f wild animal resources
into hunting or poaching. Hunting is permitted in the hunting reserves in Congo
-209-
within certain constraints, based on the species used and the methods used to kill the
animal. Giraffes, rhinoceros, elephants, bongos, apes and buffalos are protected
species, and cannot be hunted. A number o f other large mammal species are partially
protected, and can be seasonally hunted, with a permit from the wildlife authorities.
Hunting for commercial gain is prohibited, as is the use o f firearms.
However, the laws as published in the civil code often have little bearing on how the
law is administered in the region. For instance, shotguns can be used openly if a
hunting permit is purchased. Furthermore, the agency that is responsible for
maintaining the laws o f conservation, ICCN, has only a limited presence in the
Hunting Reserves. Thus, most hunting activities that take place in the Reserves are
unconstrained by the law, w hether the activities are technically legal or not. Perhaps
the only important influence that the laws o f conservation have on hunting behaviour
is the restrictions that they place on hunting in the National Park, where law
enforcement is largely financed by international conservation organisations. Thus, in
practice, the effect o f the laws on hunting are largely determined by the resources that
are available to enforce their regulation.
Milner-Gulland and Leader-Williams (1993) define ‘illegality’ in the context o f
hunting and poaching as an action that is ""irregular and im m o ra r. However, local
interpretations o f what constitutes ‘legal’ or ‘illegal’ hunting certainly do not appear
to be inspired from the civil code, nor for that matter, from any conservation
objectives. Indeed, local terminology such as Nyama y a l'état (the state’s meat)
reflects a belief that certain species are set aside, not for conservation objectives, but
for a privileged élite, symbolised by, and concealed behind, the authority o f the state.
The differences that exist between local practice and statutory law result partly from
the inconsistencies that arise from the conflict between two distinct systems o f
thought: whereas Zande hunting practices have evolved to fulfil nutritional,
economic, and cultural needs, the origins o f the laws that criminalise the use o f
natural resources have diverse origins, some o f which can be traced back to Feudal
Europe (Grove 1990). Certainly, the wildlife laws in many Afncan states were largely
passed under alien colonial administrations (Brockington and Homewood 1996,
-210-
Marks 1984, Bell 1987, Mackenzie 1987). As such, they have little bearing on the
local context other than the fact that they represent a means o f controlling resources
that have not been subsumed by private ownership (Lynch and Alcorn 1994).
d. Cultural definitions o f hunting
This research focuses on the functional characteristics o f hunting, drawing on
quantitative analytical techniques. Thus, hunting is studied as a system o f food
production (Caughley and Gunn 1996), and hunting techniques are studied in term s o f
the technology used and the outcome (the volume and type o f meat obtained).
Nevertheless, hunting is also a social process and the cultural definitions o f hunting
must be considered simultaneously. With reference to ‘techniques’ in general, M auss
(1935) describes them as '"actions which are both effective traditional Thus,
contemporary hunting behaviour among the Azande is based on a combination o f
traditional and imported ideas interacting in a complex social environment. Thus,
hunting techniques are more than simply the optimal means o f obtaining meat within
ecological and economic constraints.
An accurate description o f hunting techniques among the Azande must take into
account religious and ‘magical’ phenomena (Evans-Pritchard 1972). Certainly the
cultural expression o f magic (rituals) appears to have physical consequences that w ere
perhaps overlooked during the planning o f this study. This is best explained by using
a curious example from my field work in the Zande community at Kiliwa; I
undertook hunter follows over a period o f seven months (the methods are described
below). During the first month, the outcome from the hunts in which I participated
was felt to be unusually poor by many o f the hunters, and several hunters suggested
that my presence was contributing to this. After consistently bad results, a term ite
oracle was consulted by a hunter. The oracle concluded that I had been bewitched. I
was approached and instructed to discuss the matter with the ‘culprit’ who was a
hunter that I knew well. I spoke to this hunter, stressing that I was merely curious.
He rejected the accusation, and I did not pursue the issue any further. About a year
later, on analysing the hunting data, I was intrigued to find a significantly higher
hunting success rate in the month after this incident than in the month before: the
-211-
average hunt yield 0.12 kg o f meat before the incident and 1.34 kg after (one-tailed,
independent samples t-test, t = 6.95, p < 0.01, n = 36).
Whilst this may be dismissed as a type 1 error, scientific rigour would dictate that
other explanations should be sought. For example, the size o f an individual’s
bushmeat harvest is socially constrained, because an unusually successful hunter is
likely to incite jealousy from other members o f the community. In Zande
communities, as in many other cultures, accusations o f witchcraft are often the
expression o f jealousy (Evans-Pritchard 1972). Accusations o f witchcraft enable an
individual to target the animosity o f a whole community against a successful hunter
by drawing on the community’s fear o f the supernatural. This provides a powerful
incentive for restraint in the volumes o f meat that are harvested from the wild.
Consequently, the effects o f magic and witchcraft on the volume o f an individual’s
bushmeat harvest may be as important as the availability o f wildlife, the technology
or the skills o f the hunter.
Thus, the cultural properties o f hunting behaviour can be pictured as traditional
hunting systems superimposed to varying degrees by modem techniques and
approaches. The use o f firearms, for instance, may appear to represent a significant
departure from traditional hunting techniques. Nevertheless, hunters using firearms
have retained a number o f traditional traits, such as the mles determining the
distribution o f the catch, and certain clanic taboos on the species that can be hunted
(Evans Pritchard 1972). Certainly, the magical dimensions to hunting behaviour are
not exclusively Zande, nor are they exclusively a tool for restraint. For instance,
magic is used in Southern Africa to the extent that certain sport hunting companies
use magic as a means o f securing a kill for their clients (K. Wilson, pers comm.).
In summary, hunting takes place in a wide cultural, economic and ecological context
which has to be studied as a whole if hunting techniques are to be appreciated. This
study tests the importance o f the economic and ecological dimensions o f hunting.
This can help to understand the importance o f other factors that influence how people
hunt. These are addressed in the discussion. For the purposes o f this study a simple
-212-
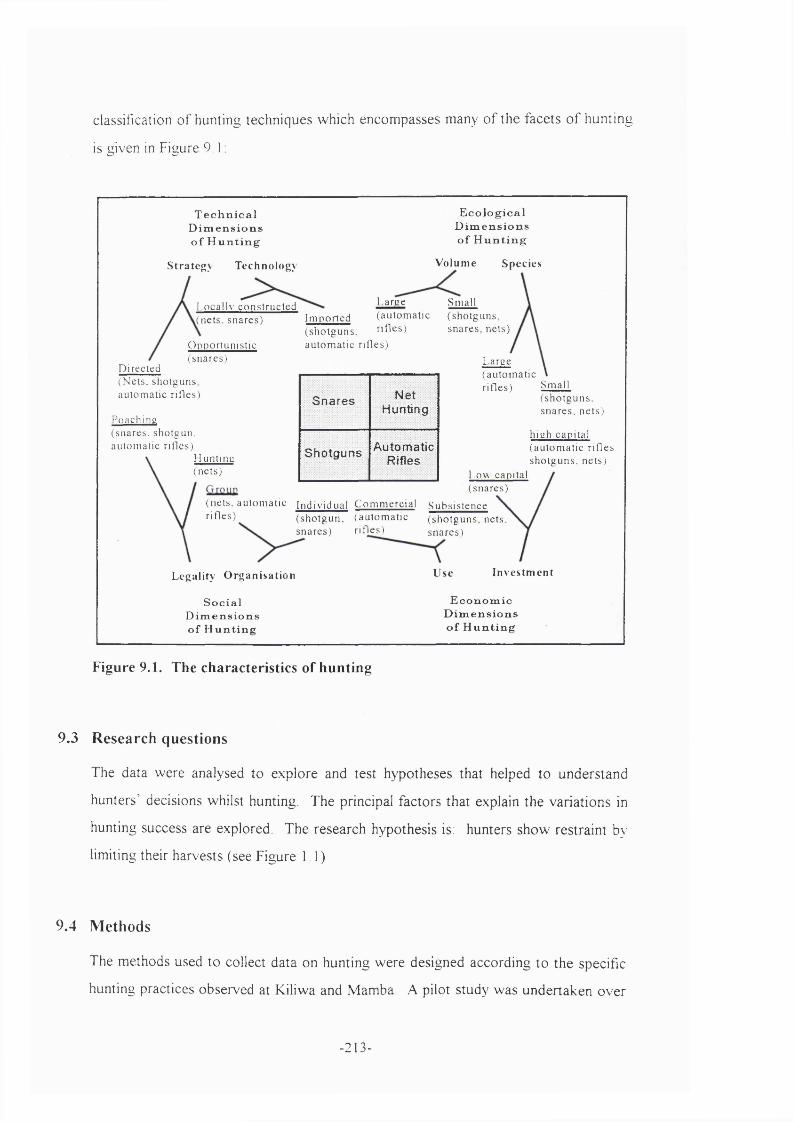
classification o f hunting techniques which encompasses many o f the facets o f hunting
is given in F igure 9.1
T echnica l D im en sions o f Hunt ing
Strategy Technology
L o c a l l s c o n s t r u c t e d (n e t s , s n a r e s )
Ecologica l D im ens ions of Hunt ing
Volume Species
D ir e c te d
O p p o r t u n i s t i c( s n a r e s )
L a rg e
I m p o r t e d ( a u t o m a t i c( s h o t g u n s , r i f l e s )
a u t o m a t i c r i f l e s )
( N e t s , s h o t g u n s , a u t o m a t i c r i l l e s )
P o a c h i n g ( s n a r e s , s h o t g u n , a u t o m a t i c r id e s )
H u n t in g( n e t s )
Snares NetHunting
Shotguns AutomaticRifles
S m a l l( s h o t g u n s , s n a r e s , n e t s )
L a rg e( a u t o m a t i c r i f l e s ) S m a l l
( s h o t g u n s , s n a r e s , n e t s )
h ig h ca p i ta l ( a u t o m a t i c r i f l e s s h o t g u n s , n e t s )
L o w cap ita l ( s n a r e s )
( n e t s , a u t o m a t i c 2ndj_yjd_i^ C onijn^rcm J S u b s i s t e n c e r i f l e s ) ( s h o t g u n , (a u t o m a t i c
s n a r e s ) r i f l e s )( s h o t g u n s , ne ts , s n a r e s )
Legality Organisation
Social D im ens ions o f Hunt ing
Use Investment
Economic D im ens ions o f Hunt ing
F ig u r e 9 .1 . T h e c h a r a c t e r i s t i c s o f h u n t i n g
9.3 R esearch questions
The data w ere analysed to explore and test hypotheses that helped to understand
hun ters’ decisions whilst hunting. The principal factors that explain the varia tions in
hunting success are explored. The research hypothesis is; hunters show restrain t by
limiting their harvests (see F igure 1.1)
9.4 M ethods
The m ethods used to collect data on hunting w ere designed according to the specific
hunting practices observed at Kiliwa and M am ba. A pilot study w as undertaken ov er
-213-
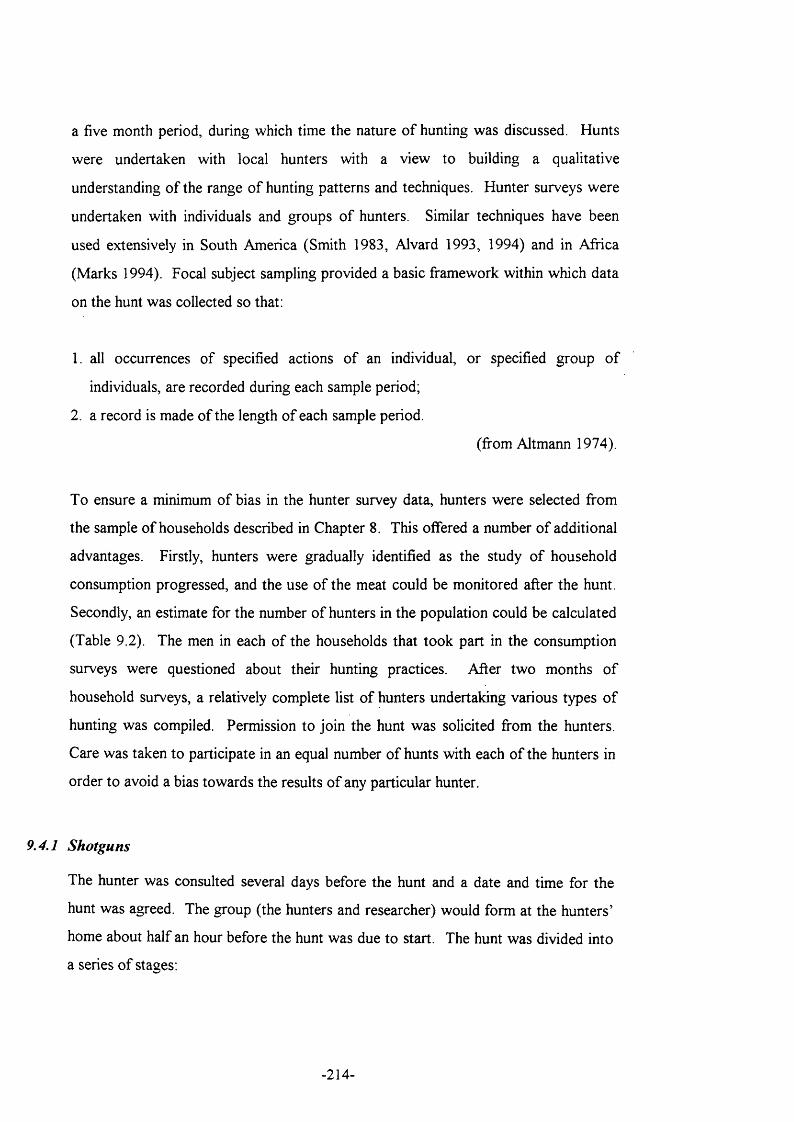
a five month period, during which time the nature o f hunting was discussed. Hunts
were undertaken with local hunters with a view to building a qualitative
understanding o f the range o f hunting patterns and techniques. Hunter surveys were
undertaken with individuals and groups o f hunters. Similar techniques have been
used extensively in South America (Smith 1983, Alvard 1993, 1994) and in Africa
(Marks 1994). Focal subject sampling provided a basic framework within which data
on the hunt was collected so that;
1. all occurrences o f specified actions o f an individual, or specified group o f
individuals, are recorded during each sample period;
2. a record is made o f the length o f each sample period.
(from AJtmann 1974).
To ensure a minimum o f bias in the hunter survey data, hunters were selected from
the sample o f households described in Chapter 8. This offered a number o f additional
advantages. Firstly, hunters were gradually identified as the study o f household
consumption progressed, and the use o f the meat could be monitored after the hunt.
Secondly, an estimate for the number o f hunters in the population could be calculated
(Table 9.2). The men in each o f the households that took part in the consumption
surveys were questioned about their hunting practices. After two months o f
household surveys, a relatively complete list o f hunters undertaking various types o f
hunting was compiled. Permission to join the hunt was solicited from the hunters.
Care was taken to participate in an equal number o f hunts with each o f the hunters in
order to avoid a bias towards the results o f any particular hunter.
9.4.1 Shotguns
The hunter was consulted several days before the hunt and a date and time for the
hunt was agreed. The group (the hunters and researcher) would form at the hunters’
home about half an hour before the hunt was due to start. The hunt was divided into
a series o f stages:
-214-
a. The journey to the start o f the h in t
The start o f the hunt was marked by the hunter preparing the shotgun and removing
the cartridges from a sack. Data were collected on the time taken to reach the
hunting site, and the mode o f transport (walking or cycling).
h. The hunt
This corresponded to the period when the hunter was actively seeking animals to
shoot. Data were collected on a broad range o f variables including
a. search time and stalking time;
b. the amount o f time spent in each habitat;
c. species characteristics: the species encountered and whether they were stalked,
number o f individual animals in the group;
d. the outcome: the number o f shots, animals that were killed, wounded or missed,
the weight o f the animal killed and the use o f the meat after the hunt.
c. The return journey
Time taken to return to the hunter’s home was recorded. The hunter usually stated
when the hunt was complete, although this could be difficult to determine because a
number o f animals were encountered and subsequently shot on the return journey.
A sketch map was drawn during the hunt to record the positions o f the above data.
These data were then transcribed to a more accurate map based on Landsat TM
satellite data.
9.4.2 Automatic Rifles
Whereas shotgun hunts could be monitored directly, it was not possible to participate
in the hunts using automatic weapons because o f the legal implications: the
unauthorised possession o f automatic weapons in Congo is an offence in terms o f
both the conservation laws and the criminal law. For this, and for security reasons,
the researcher was unable to participate in the hunt. Thus, research data were
collected by interviewing the hunter. The hunters were visited prior to the hunt, and
the researcher waited at his household until his return. On the hunters return, an
-215-
interview was undertaken to obtain data on the hunt, described above. The meat
obtained from the hunt was weighed directly, and a description o f the animal was
made by direct observation.
9.4.3 Net hunting
Information on a forthcoming net hunt could usually be obtained several days before
it was due to occur because it involves a considerable amount o f planning. The
organiser o f the hunt was approached and if his permission was granted, he was
interviewed to obtain information on the other participants. The roles played by each
o f the hunters and equipment o f each member o f the hunt was recorded, together with
their relationship to the organiser and to each o f the other members o f the hunt. The
hunt was followed and same data were collected as for shotguns.
9.4.4 Snares
Snare hunting was difficult to monitor directly because o f the protracted nature o f the
hunt; when a snare is laid, it may remain in place for up to five months. Furthermore,
the members o f the household check the snares opportunistically and at irregular
intervals. As a result, the animals that were caught were nearly always consumed
before the researcher could record data directly. Thus, data had to be based on
hunters recalling the events o f the hunt.
Before the snares were monitored, the researcher spent time discussing the objectives
o f the study and the kinds o f data that were required with members o f the household.
I f the household agreed to participate in the research, each snare was visited and the
time taken to reach and check all the snares was recorded. Subsequently, the
household was visited twice a week and the owner o f the snares (usually the head o f
the household) was interviewed on the success o f the snares since the last visit. Data
on the characteristics and use o f the animals caught are recorded.
-216-
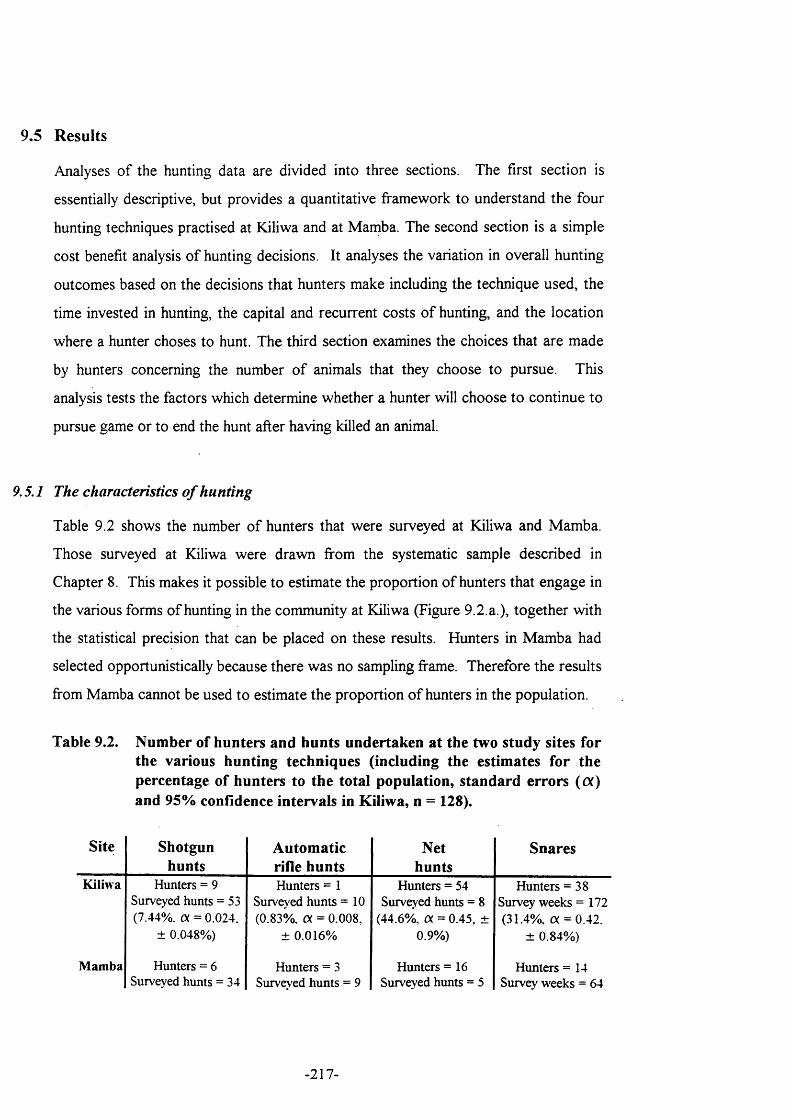
9.5 Results
Analyses o f the hunting data are divided into three sections. The first section is
essentially descriptive, but provides a quantitative framework to understand the four
hunting techniques practised at Kiliwa and at Mamba. The second section is a simple
cost benefit analysis o f hunting decisions. It analyses the variation in overall hunting
outcomes based on the decisions that hunters make including the technique used, the
time invested in hunting, the capital and recurrent costs o f hunting, and the location
where a hunter choses to hunt. The third section examines the choices that are made
by hunters concerning the number o f animals that they choose to pursue. This
analysis tests the factors which determine whether a hunter will choose to continue to
pursue game or to end the hunt after having killed an animal.
9.5.1 The characteristics o f hunting
Table 9.2 shows the number o f hunters that were surveyed at Kiliwa and Mamba.
Those surveyed at Kiliwa were drawn from the systematic sample described in
Chapter 8. This makes it possible to estimate the proportion o f hunters that engage in
the various forms o f hunting in the community at Kiliwa (Figure 9.2.a.), together with
the statistical precision that can be placed on these results. Hunters in M amba had
selected opportunistically because there was no sampling frame. Therefore the results
from Mamba cannot be used to estimate the proportion o f hunters in the population.
Table 9.2. Number of hunters and hunts undertaken at the two study sites for the various hunting techniques (including the estimates for the percentage of hunters to the total population, standard errors ((X) and 95% confidence intervals in Kiliwa, n = 128).
Site S ho tgunh u n ts
A u to m a tic rifle h u n ts
N eth u n ts
S n a res
K i l i w a Hunters = 9 Hunters = 1 Hunters = 54 Hunters = 38Surveyed hunts = 53 Surveyed hunts = 1 0 Surveyed hunts = 8 Survey weeks = 1 7 2(7.44%. « = 0.024. (0.83%, a = 0.008, (44.6%, a. = 0.45, ± (31.4%, a = 0.42.
± 0.048%) ± 0.016% 0.9%) ± 0.84%)
M a m b a Hunters = 6 Hunters = 3 Hunters = 16 Hunters = 1 4Surveyed hunts = 34 Surveyed hunts = 9 Surveyed hunts = 5 Survey weeks = 64
-217-
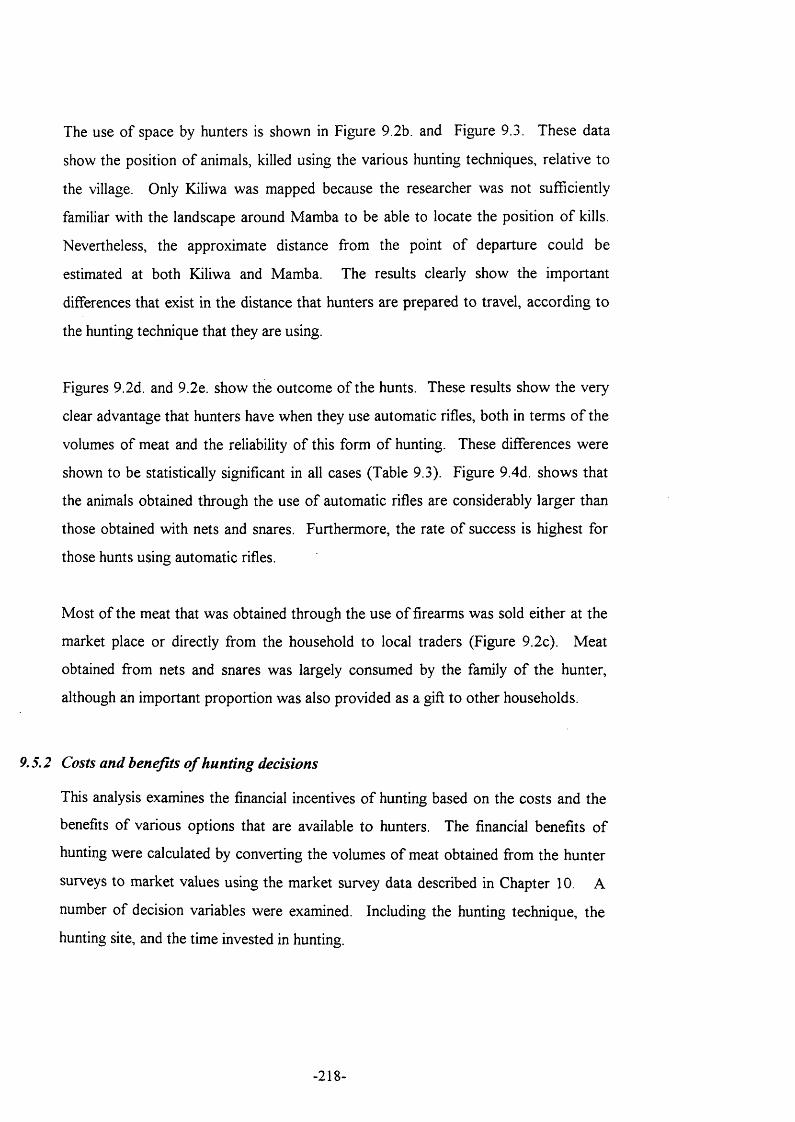
The use o f space by hunters is shown in Figure 9.2b. and Figure 9.3. These data
show the position o f animals, killed using the various hunting techniques, relative to
the village. Only Kiliwa was mapped because the researcher was not sufficiently
familiar with the landscape around Mamba to be able to locate the position o f kills.
Nevertheless, the approximate distance from the point o f departure could be
estimated at both Kiliwa and Mamba. The results clearly show the important
differences that exist in the distance that hunters are prepared to travel, according to
the hunting technique that they are using.
Figures 9.2d. and 9.2e. show the outcome o f the hunts. These results show the very
clear advantage that hunters have when they use automatic rifles, both in terms o f the
volumes o f meat and the reliability o f this form o f hunting. These differences were
shown to be statistically significant in all cases (Table 9.3). Figure 9.4d. shows that
the animals obtained through the use o f automatic rifles are considerably larger than
those obtained with nets and snares. Furthermore, the rate o f success is highest for
those hunts using automatic rifles.
Most o f the meat that was obtained through the use o f firearms was sold either at the
market place or directly from the household to local traders (Figure 9.2c). M eat
obtained from nets and snares was largely consumed by the family o f the hunter,
although an important proportion was also provided as a gift to other households.
9.5.2 Costs and benefits o f hun ting decisions
This analysis examines the financial incentives o f hunting based on the costs and the
benefits o f various options that are available to hunters. The financial benefits o f
hunting were calculated by converting the volumes o f meat obtained from the hunter
surveys to market values using the market survey data described in Chapter 10. A
number o f decision variables were examined. Including the hunting technique, the
hunting site, and the time invested in hunting.
-218-
a. b.
50
% of 30saiiple
population
50
40-
30-Mcan distance tra\elled 2 0 *
(kill)10"
Sliotguns Automatic rifles
Nets Snares
10" H
0 ^ - H _Sliotguns Automatic
riflesNets Snares
% value 5Q of meat
d.
Meananmial
120
100
80
60weight
(kg)20
0
Sliotguns Automaticrifles
Nets
Percentage of hunts
successful
^ Gift
■ Consumed
□ Sold
Snares
Sliotguns Automatic rifles
Nets Snares Shotguns Autcttnatic nfles
Nets Snares
Figure 9.2. C haracteristics of the four surveyed hunting techniques in Kiliwa and M am ba.a. P roportion of sample population of households (n=121)b. Distance travelled from the village during the hunt (n=335)c. Use of the hunted m eat (n=74)d. M ean weight of anim als killed (n=74)e. Percentage of hunts resulting in a kill (n=335)
- 2 1 9 -
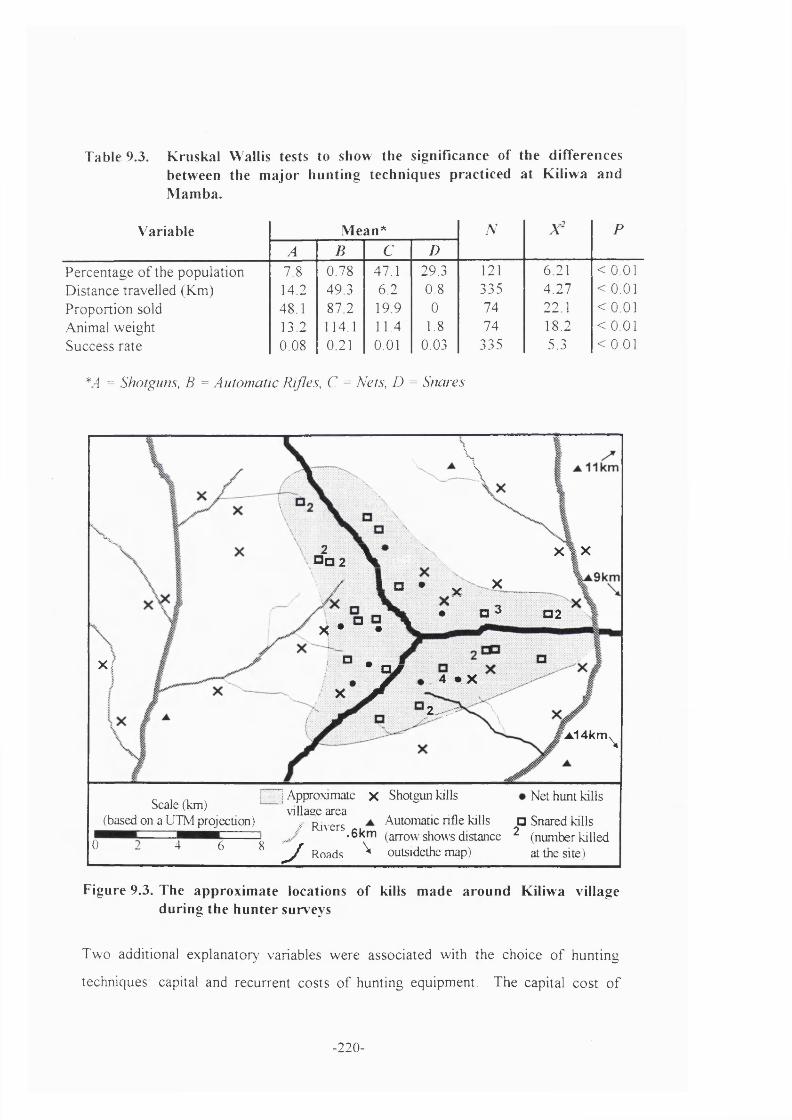
Table 9.3. K riiskal Wallis tests to show the significance of the differences between the m ajor hunting techniques practiced a t K iliwa and M am ba.
V ariable M ean* N A* PA B C D
P ercen tage o f the population 7.8 0.78 47.1 29.3 121 6.21 <0.01D istance travelled (Km ) 14.2 49.3 6.2 0.8 335 4.27 <0.01Proportion sold 48 1 87 2 19 9 0 74 22.1 <0.01Animal weight 13.2 114.1 11.4 1.8 74 18.2 <0.01Success ra te 0.08 0.21 0.01 0.03 335 5.3 <0.01
*4 = Shotguns, B = Automatic Rifles, C = Nets, D = Snares
X .
Xf
\A
2 \° 0 2 V : : A i
/ & □ • X X
, a * o ^X • • ^
! □ ..........f * UÆ
# ■ S Æ 4 # X ........X ^
X I X
0 2
' 2 ^
W4km \
Scale (km)^Approximate X Shotgun kills
village area / Rivers
Net hunt kills
0
(based on a UTM projection)
~ ^ PoAds ^ outsidethe map)
Automatic rifle kills □ Snared kills(number ki at the site)
.6km (arrow shows distance ^ (number killed
Figure 9.3. The approxim ate locations of kills made around Kiliwa v illage during the hun ter surveys
T w o additional explanatory^ variables w ere associated w ith the choice o f hunting
techniques: capital and recurrent costs o f hunting equipm ent. The capital cost o f
-220-
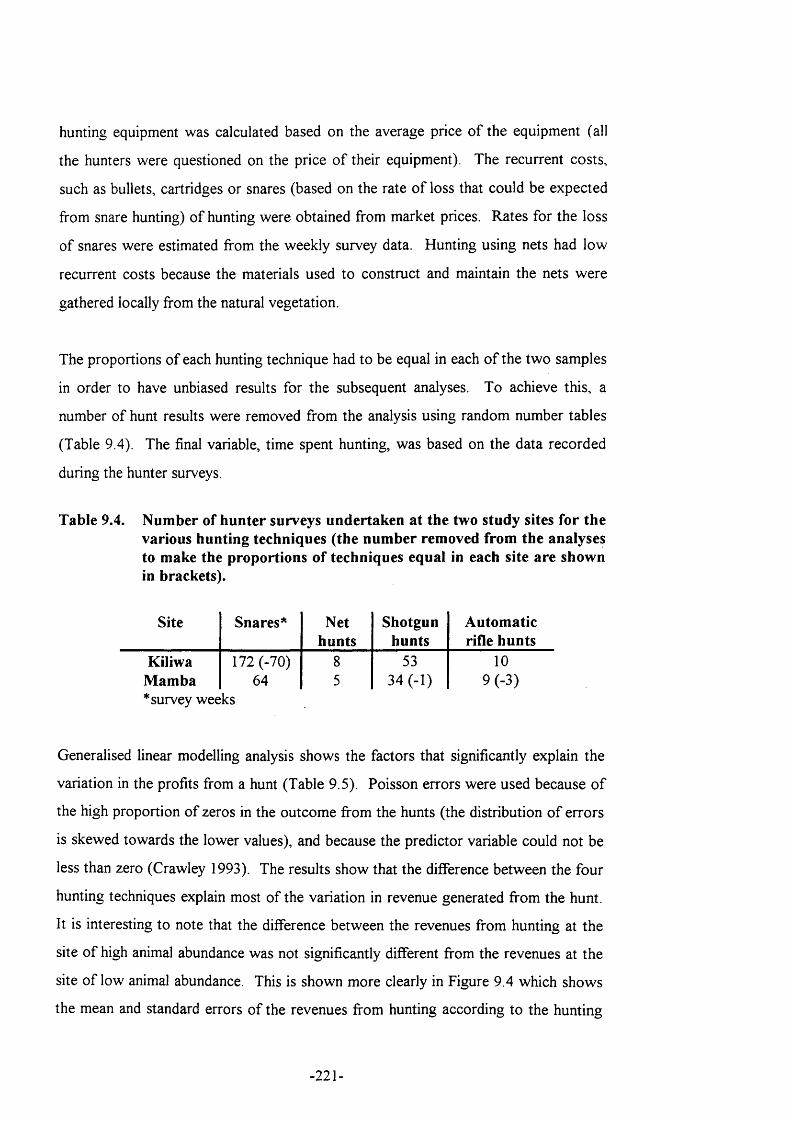
hunting equipment was calculated based on the average price o f the equipment (all
the hunters were questioned on the price o f their equipment). The recurrent costs,
such as bullets, cartridges or snares (based on the rate o f loss that could be expected
from snare hunting) o f hunting were obtained from market prices. Rates for the loss
o f snares were estimated from the weekly survey data. Hunting using nets had low
recurrent costs because the materials used to construct and maintain the nets were
gathered locally from the natural vegetation.
The proportions o f each hunting technique had to be equal in each o f the two samples
in order to have unbiased results for the subsequent analyses. To achieve this, a
number o f hunt results were removed from the analysis using random number tables
(Table 9.4). The final variable, time spent hunting, was based on the data recorded
during the hunter surveys.
Table 9.4. Number of hunter surveys undertaken at the two study sites for the various hunting techniques (the number removed from the analyses to make the proportions of techniques equal in each site are shown in brackets).
Site Snares* Nethunts
Shotgunhunts
Automatic rifle hunts
Kiliwa 172 (-70) 8 53 10Mamba 64 5 34 (-1) 9 (-3)* survey weeks
Generalised linear modelling analysis shows the factors that significantly explain the
variation in the profits from a hunt (Table 9.5). Poisson errors were used because o f
the high proportion o f zeros in the outcome from the hunts (the distribution o f errors
is skewed towards the lower values), and because the predictor variable could not be
less than zero (Crawley 1993). The results show that the difference between the four
hunting techniques explain most o f the variation in revenue generated from the hunt.
It is interesting to note that the difference between the revenues from hunting at the
site o f high animal abundance was not significantly different from the revenues at the
site o f low animal abundance. This is shown more clearly in Figure 9.4 which shows
the mean and standard errors o f the revenues from hunting according to the hunting
- 221-
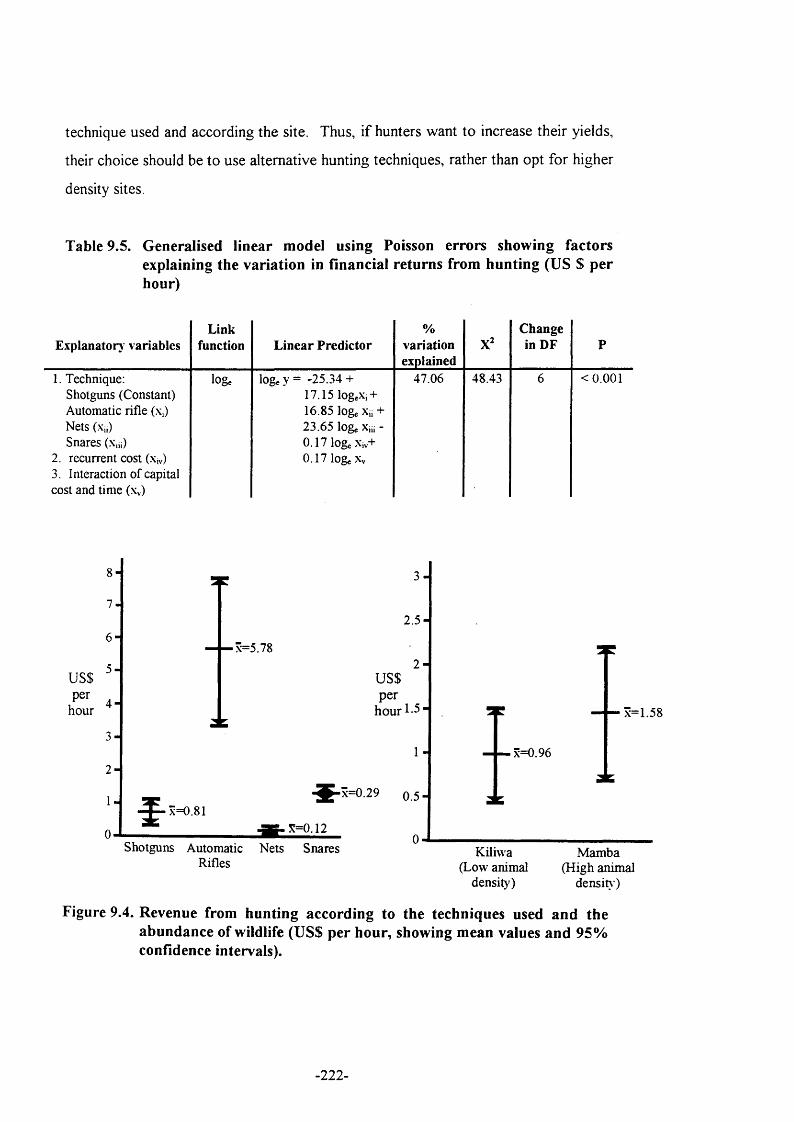
technique used and according the site. Thus, if hunters want to increase their yields,
their choice should be to use alternative hunting techniques, rather than opt for higher
density sites.
Table 9.5. Generalised linear model using Poisson errors showing factors explaining the variation in financial returns from hunting (US $ per hour)
Explanator) variablesLink
function Linear Predictor%
variationexplained
Change in DF P
1. Technique:Shotguns (Constant) Automatic rifle (x,) Nets (Xii)Snares (x,.;)
2 . recurrent cost (x,v)3. Interaction of capital cost and time ( x j
loge loge y = -25.34 +17.15 lOgeXj + 16.85 loge Xii + 23.65 loge x,ü - 0.17 loge Xiv+ 0.17 loge Xv
47.06 48.43 6 <0.001
2 .5 -
x=5.78
US$
r 4 .hour
US$per
hour 1-5 ■ x=1.58
x=0.96
-^ x = 0 .8 1* _________ .ag- =o-i2
Shotguns Automatic Nets Snares Rifles
Kiliwa (Low animal
Mamba (High animal
density) densit) )
Figure 9.4. Revenue from hunting according to the techniques used and the abundance of wildlife (US$ per hour, showing mean values and 95% confidence intervals).
-222-
9.5.3. Analysis o f hunters’ choices
This analysis assesses the outcome o f hunters’ choices after killing an animal. This is
achieved by examining what happens after the first kill has been made. I f the animal
was killed at or near the end o f a hunt, this is taken to be an indication that the hunter
chose not to pursue game further. Conversely, if the animal was killed in the early
stages o f the hunt, this indicates that the hunter chose to continue hunting after
making a kill. The x axis in Figures 9.5 and 9.6 show the proportion o f the duration
o f the hunt. Thus, a kill plotted as 0.1 indicates that the kill was made in the initial
stages o f the hunt and, therefore, the hunter decided to continue hunting after making
a kill. Conversely, a kill made at 0.9 indicates that the hunter has refrained from
further hunting after making a kill.
Figures 9.5 and 9.6 relate the hunters decision to pursue game after making a kill
according to the size o f the animals killed and to the distance from the village. The
results are also classified according to the method used to kill the animal (snares are
not included in the analysis because they involve different choices). The patterns
reveal that the decision to pursue more game is highly correlated with both the size o f
the animal and the distance from the village where the animal was killed (Table 9.6).
Thus hunters ceased to persue more animals after killing large animals, at greater
distances from the village.
The generalised linear model in Table 9.7 examines all the variables simultaneously as
part o f an analysis o f covariance. This analysis revealed that there is cross correlation
between the animal weight and the distance from the village where the animal was
killed. It also shows that most o f the variation in the decision on whether to pursue
more prey is explained by the techniques used. In other words, hunters that used
automatic rifles were less likely to pursue more prey after they had killed an animal.
The interaction o f hunting technique and animal size is also statistically significant.
This shows that hunters will be influenced by the size o f their catch in their decision
on whether to pursue the hunt further, irrespective o f which hunting technique is
used.
-223-
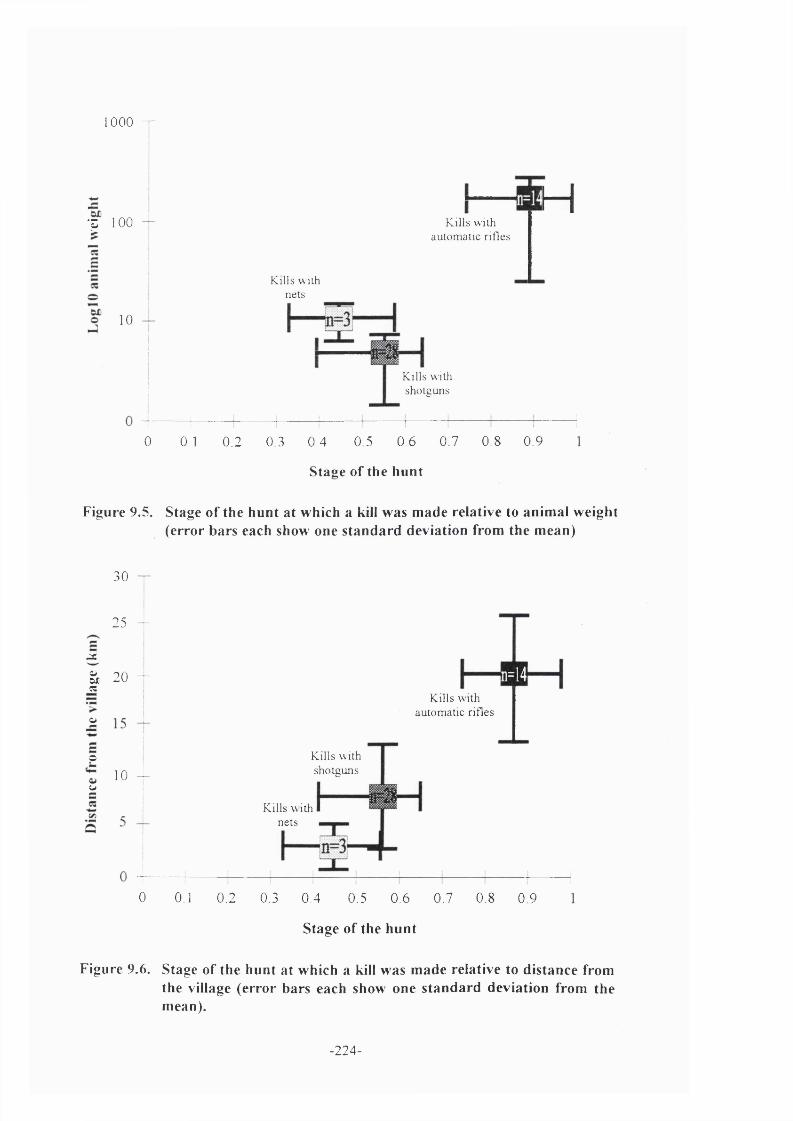
1000 —
'3 100
10
Kills with nets
K ills with automatic rifles
H
Kills with shotguns
0 0.1 0.2 0.3 0.4 0.5 0.6 0.7 0.8 0.9
Stage of the hunt
Figure 9.5. Stage of the hunt at which a kill was made relative to anim al weight (error bars each show one standard deviation from the mean)
30
25 —
I 2 0 - n=14C5
Kills with automatic riflesCJ
Kills with shotguns
o
10 —
oKills with
nets
0 0.1 0.2 0.3 0.4 0.5 0.6 0.7 0.8 0.9
Stage of the hunt
Figure 9.6. Stage of the hunt at which a kill was m ade relative to distance from the village (erro r bars each show one standard deviation from the mean).
- 2 2 4 -
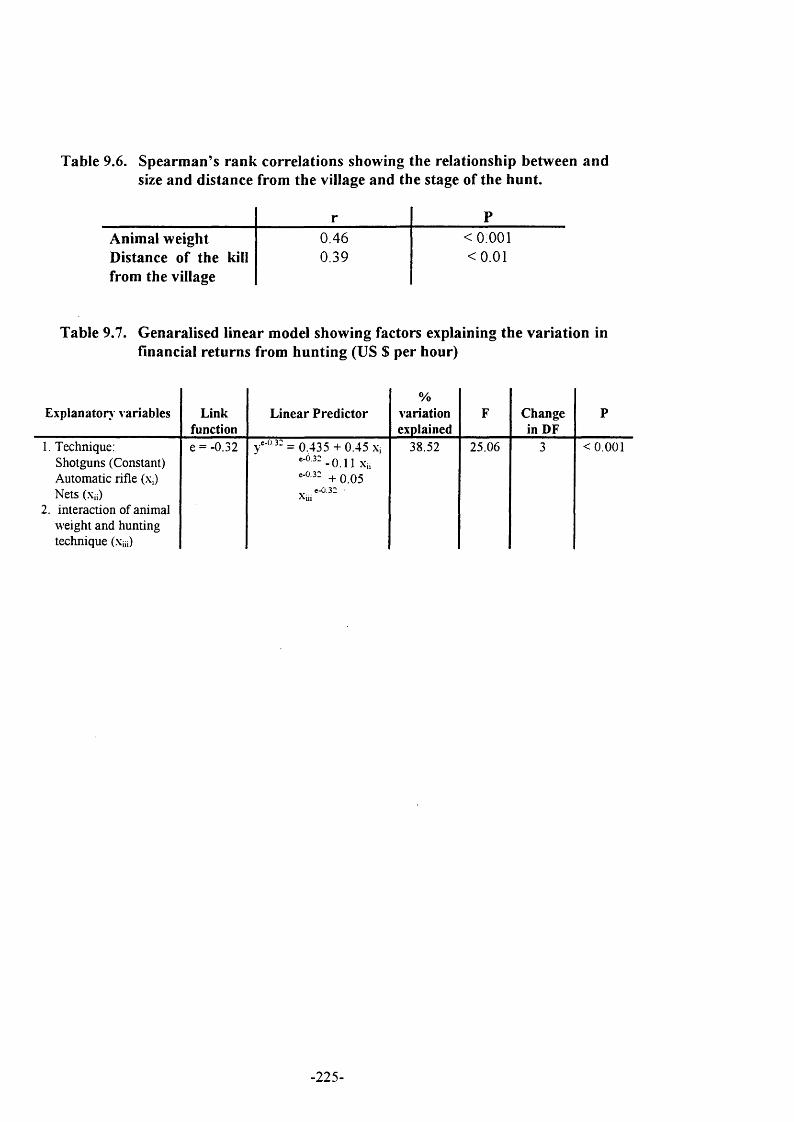
Table 9.6. S pearm an’s ra n k correlations showing the relationship between and size and d istance from the village and the stage of the hun t.
r PAnim al w eight 0.46 <0:001D istance of the kill 0.39 <0.01from the village
Table 9.7. G enaralised lin ear m odel show ing factors explaining th e varia tion in financial re tu rn s from h u n tin g (US $ per hour)
Explanatory variables Linkfunction
L inear P redictor%
variationexplained
F Change in DF
P
1. Technique;Shotguns (Constant) Automatic rifle (.\,) Nets ( X i i )
2 . interaction o f animal weight and hunting technique ( X m )
e = -0.32 y e . 0 . 3 ; ^ 0 4 2 3 + 0.45 X ,
*'°^--0.11 X i,
+ 0 .0 5
38.52 25.06 3 < 0 .0 0 1
-225-
9.6 Discussion
This section discusses the patterns o f hunting behaviour, the factors contributing to
people’s hunting decisions and their implications for ‘consumption based’ wildlife
management described in Chapter one o f this thesis (see Figure 1.1).
9.6.1 Hunting patterns
The results show that the patterns and outcomes o f hunting are highly variable. But,
this can largely be explained by the choice o f hunting technique. O f the five
characteristics o f hunting examined (proportion o f village population, distance
travelled by hunters, use o f the meat, animal weight and percentage o f hunts resulting
in a kill, see Table 9.3 and Figure 9.2), all showed significant differences according
the hunting technique used. Hunters using automatic rifles, in particular, showed
markedly different resource use patterns to all other hunters. They represent a
minority o f the population, hunt at greater distances from the village, are much more
successful in the frequency and volume o f meat they obtain and tend to sell most o f
their catch.
These differences can partly be explained by the technology. Automatic rifles are
more reliable than shotguns, and allow the hunter to kill much larger animals than any
other hunting tool. The effect o f technology on the outcome o f a hunt has been well
documented in Amazonia by Yost and Kelley (1983). They quantify the benefits o f
using shotguns, blowguns and spears and show the significant increase in productivity
that can be acheived by using firearms. Their results emphasise the significance o f the
technology used in explaining variation in hunting productivity. However, the
Amazonian study was based on data from two different communities. One
community used firearms and the other blowguns and spears. Therefore their study
cannot be used to understand the hunting choices that are made by hunters in each o f
the two communities, because their options are not the same.
-226-
9. 6.2 Hunting decisions
The analysis o f the costs and benefits o f hunting reveal an interesting apparent
contradiction; the significantly higher benefits from hunting with automatic rifles are
not counterbalanced by correspondingly high economic costs. Indeed, both the
recurrent and capital costs o f hunting with shotguns are higher than those o f hunting
with automatic rifles (the cost both o f a shotgun and o f shotgun cartridges are
significantly higher than an automatic rifle and bullets). These differences are
interesting because they contrast with the results that would be predicted using
optimal foraging models (see Alvard 1993, 1995, Smith 1983, Stephens and Krebs
1978), which predict that hunting decisions are the outcome o f rate maximising
criteria. These criteria should encourage hunters to use the optimal hunting technique
to gain the highest profits. This would predict that hunters would automatic rifles on
large mammals at considerable distances from the village. These data show that only
a small minority o f hunters at Kiliwa decide to hunt using the rate maximising
techniques. This provides strong evidence to suggest that hunters base their decisions
on wider, possibly non-economic, incentives and constraints (see Table 9.1).
Discussions held with hunters during the hunter surveys revealed that many hunters
felt that the risk o f being caught with an automatic weapon outweighed the benefits o f
obtaining the much higher yields. A number o f studies have examined the relationship
between people’s hunting behaviour and law enforcement. Milner-Gulland and
Leader-Williams’s (1992) analysis o f the effect o f law enforcement on hunting
patterns examines the trade-ofifs between the severity o f the penalty and the chance o f
being caught. They conclude that the probability o f being caught has a more
significant effect on people’s hunting decisions than the severity o f the punishment.
People were dissuaded from hunting illegally if the probability o f being caught was
high, but not necessarily if the penalty was high.
Thus, a regime o f high penalties for illegal hunting associated with a low probability
o f being caught by National Park guards is unlikely to deter hunters from hunting
illegally. At Kiliwa, National Park guards are rarely present and generally have a
limited impact on people’s hunting activities. Nevertheless, people still claim to avoid
- 227-
illegal hunting (ie. with automatic weapons), and the data show that only a small
proportion o f the populations are recorded as hunting with automatic weapons (Table
9.3). The constraints on people hunting with automatic weapons are therefore more
complex than simply the effect o f the wildlife authorities’ law enforcement activities.
The real constraints on hunting with automatic weapons appear to relate more to the
risk o f possessing an automatic weapon than to using it for hunting. This is for tw o
reasons. Firstly, the Groupement Ungua, which contains both Kiliwa and Mamba is
administered by a traditional chief who has been active in taking automatic weapons
out o f circulation. Enquiries into the ch iefs activities revealed documentary evidence
{remise d 'armes) for 61 automatic rifles handed over to military and civil authorities
since 1991 (Sangbalenze 1995).
The second disincentive for using automatic weapons relates to the heavy military
presence in the region. Whilst certain soldiers at the time o f study were known to
take an active part in hunting using their automatic weapons, they also seemed intent
on preventing civilians from possessing their own automatic rifles. Indeed, all o f the
hunters who were observed using automatic rifles had borrowed them from soldiers,
and were subsequently indebted to them. A significant proportion o f the animals
killed had to be given to the owner o f the rifle. Thus, borrowing a rifle from a soldier
provides a means o f significantly reducing the risk o f being caught in possession o f an
illegal weapon because the hunter is not in permanent possession o f the rifle.
Furthermore, he is likely to benefit from the protection o f the soldier who owns the
rifle.
Another factor which explains the use o f ‘less profitable’ forms o f hunting is the
social function o f some forms o f hunting, especially net hunting. Net hunts are
typically undertaken on Saturday or Sunday mornings. They provide a focus for
groups o f men that have strong family or friendship ties to participate in an activity
that could be described more appropriately as sport than an economic activity.
Furthermore, much o f the meat that is caught is often used o f social occasions such as
the retour de deuil (these are commemorative celebrations carried out forty days
after the death o f a relative and then repeated one year later). There were relatively
-228-
few instances o f individuals selling meat that had been obtained through a net hunt.
Meat from net hunting was the product o f a collective activity, whereas the selling o f
meat at the market usually only benefits the individual. Whereas the killing o f game
individually generates greater profits, hunting collectively brings prestige based on the
cultural values o f reciprocity and mutual support. The effects o f these values on
hunting behaviour have been extensively documented in the social anthropological
literature. For instance, Lee (1979) describes the social trade-offs that are implicit to
the hunting decisions o f the !Kung San on the border o f Botswana and Nambia.
Whereas the killing o f game and the distribution o f meat brings prestige and status to
the individual, cultural values based on reciprocity, modesty and egalitarianism act
against individuals profiting from large harvests.
Snare hunting also appeared to be a less profitable form o f hunting. However,
hunting with snares differs substantially from the other forms o f hunting. Hunting
with nets or firearms correspond to Bahuchet’s (1971) direct form o f hunting, and
requires all o f the hunter’s time and attention during the hunt. Snaring, on the other
hand, is an indirect form o f hunting and can be combined with other economic and
social activities, such as agriculture, going to the market or visiting friends. The
incentives to hunt were based on the weight o f meat obtained per hour, and the time
required to check snares was calculated by visiting each o f the snares with the owner.
In reality, the owner checks the snares opportunistically, and often the time used in
checking the snares coincides with agricultural work and the owner is not diverted
from other activities. Therefore, time is not usually a constraint for snare hunting.
Nevertheless, the cost o f the snares makes this form o f hunting less profitable than
many other forms. Furthermore, snares can easily be lost or stolen.
In discussing snares with household members, it was evident that they are valued for a
variety o f reasons. They are considered to be a low cost means o f obtaining meat
relying on a technique which involves all the members o f the family, and not just the
male head o f the household (hunting with nets and firearms is an exclusively male
activity). This means that members o f the household, other than household men, are
prepared to invest their time and money in snare hunting. Small nylon snares are
- 229-
preferred to the larger metallic snares which are more expensive. Furthermore,
metallic snares have to be placed at greater distances from the household where larger
mammals are more abundant. As a result, a greater number o f metallic snares are lost
or stolen when compared with nylon snares. Furthermore, nylon snares that are
placed in close proximity to the fields where they are believed to protect the fields
from animal crop raiding and require little additional travel.
9.6.3 Self regulation by hunters
The conservation implications o f these results are better understood by re-examining
the results o f Chapter 5. These results showed that, on the whole, species diversity or
abundance did not appear to be influenced by proximity to agricultural population
settlements. However, large herbivores were significantly more abundant near to the
national park, where they are protected. This pattern is consistent with the results o f
the hunting data presented in this chapter. The returns from hunting techniques which
target smaller mammals (using nets, snares and shotguns) produced significantly
smaller yields than automatic rifles. Furthermore, they targeted smaller species which
typically have higher intrinsic rates o f reproduction, and are therefore less prone to
population depletion from wildlife harvesting (Caughley and Gunn 1995, Robinson
and Redford 1991). Shotgun, net and snare hunters hunt close to, or within, the
village because they claim that their chances o f making a kill are no greater further
away. This suggests that the areas around the village are not heavily depleted.
In contrast, harvesting patterns associated with the use o f automatic weapons show
signs o f producing unsustainable yields: large herbivores which tend to have a low
intrinsic rates o f reproduction are targeted. The results o f the analysis o f the financial
benefits o f hunting (Table 9.5) revealed that there was no significant difference in the
profitability o f hunting large herbivores in a relatively high abundance area (Mamba)
versus a low abundance area (Kiliwa). This implies that wildlife harvesting that is
driven by financial incentives is not dependant on the density o f the large herbivore
populations. In other words, it is nearly always profitable to hunt large mammals,
even when they are at very low levels o f abundance. This is because the profits from
killing single large mammals always outweigh the costs o f a hunting expedition, even
-230-
if the expedition lasts several days. Thus, animal density dependant regulation is
unlikely to occur when hunters use automatic rifles. This provides an explanation for
the spatial patterns o f mammal community structures around the hunting reserves (see
Figure 5.4). Those mammals that appeared to be significantly influenced by distance
from the National Park were the large herbivores. These animals are targeted by
hunters using automatic weapons who are prepared to travel considerable distances to
hunt them. Thus, large herbivore abundance is greatest where they are actively
protected in the National Park, by contrast, the optimal locations for hunting smaller
mammals are nearer to the villages, because hunting does not seem to provoke
systematic depletions.
The evidence for deliberate restraint on the part o f the hunters was tested by looking
at their decisions on whether to end or continue the hunt after killing an animal. The
data revealed that hunters were more likely to end a hunt after a large animal had
been killed (Figure 9.4). If a small animal was killed, hunters were likely to continue
the hunt. This is likely to correspond to an optimal economic decision, as opposed to
a deliberate conservation decision. The threshold, representing the critical animal
weight when hunters decided to terminate the hunt, was based on the hunter’s limited
ability to carry the meat back to the village. Ending the hunt due to weight limitations
has been described as an optimal foraging constraint by Stiner (1991). Obtaining
more meat than could be returned to the village in one trip was sometimes futile. For
example, it was reported that much o f the meat from a hippopotamus killed in the
reserves was stolen because hunters were unable to transport all o f the meat back to
the village in one trip. The meat was unguarded for a period o f six hours which was
sufficient time for other people to steal the meat.
When distance from the village is examined as a factor explaining the decision to end
the hunt, the same pattern emerges. Hunters are more likely to end the hunt when
they are at a greater distance from the village (Figure 9.6). The opposite pattern
would be expected if hunters were making conservation based decisions; hunters
should show restraint in the more depleted sites near the village. However, this
conclusion is probably over simplified. When the results shown in Figure 9.5 are
-231-
examined according to the hunting technique used it is evident that the decision to
end the hunt is best explained by the hunting method used: animal size and distance
from the village are both dependant variables o f hunting techniques. Hunters using
shotguns, nets or snares tend to hunt near to the village and are constrained to smaller
animals because o f the limitations o f the technology. They tend to continue hunting
after having made a kill because the constraint o f having to carry a small carcass does
not prevent them from hunting further.
The pattern o f kills with distance from the village shown in Figure 9.6 seemed to be
more or less random, suggesting that shotgun hunters have an approximately equal
chance o f making a kill at any distance from the village. Most shotgun hunters began
searching for animals almost immediately after leaving their home, and continued
searching with increasing distance from the village. After making a kill, they
generally continued hunting in the hope o f killing another animal. With a few
exceptions, these hunters rarely stalked an animal for more than 15 minutes. In
contrast, hunters with automatic weapons didn’t begin to search until they were at
considerable distances from the village. Usually they set off on bicycle, and began the
hunt at least ten kilometres from the village. They tended to commit themselves to
one animal, and would stalk it for several hours, or even days. This strategy can be
seen as a process contributing to the depletion o f a prey population: hunters are
prepared to invest considerable amounts o f time into killing large mammals
throughout the reserves even when large mammals are relatively scarce.
These analyses help to assess the relevance o f Alvard’s definitions o f conservation to
the hunting communities around Garamba National Park. Hunters using shotguns or
nets do not appear to cause population depletion. This conclusion is based on the
results o f this chapter as well as those o f Chapter 5. Firstly, hunters hunt in close
proximity to the village suggesting that there is sufficient animal abundance to make
hunting worthwhile. Secondly, the animal abundance data, derived from the line
transect data in Chapter 5, did not show a significant reduction with increasing
proximity to populated areas. Nevertheless, there is no evidence to show that these
hunters are deliberately conserving their wildlife resources. Hunting patterns follow
-232-
optimal decision rules and there is no evidence o f restraint on the part o f a hunter
after they have made a kill. As such, the sustainable outcome o f hunting with nets or
shotguns appears to be an example o f ‘epiphenomenal conservation’.
Restraint on the use o f snares could not be used to test Alvard’s hypothesis because
there is no decision process after an animal has been killed. Nevertheless, hunting
with snares is usually carried out close to the hunters’ homes. Qualitative data from
discussions with hunters suggest that hunters do not deliberately limit their harvest if
their yields exceed a certain level. Hunters using automatic weapons do appear to
show restraint because they tend to stop hunting after they have killed an animal. But
this is explained by their limited ability to carry large volumes o f meat back to the
village rather than any conservation related decision. Thus, they also carry out
optimal, rate maximising, resource use.
Thus, under the current demographic and socio-economic conditions, the hunting
techniques based on the use o f shotguns, nets or snares, are unlikely to have a
significant impact on animal populations. However, under different density
relationships between hunters and prey (ie. when offtake increases as a result o f an
increase in the number o f hunters in the reserves) this form o f hunting could become
unsustainable. Amongst the hunters studied there is no evidence for self regulating
behaviour based on resource abundance. Under current hunting regimes, it does not
appear that hunters will reduce their yields if their offtake is unsustainable. In the
case o f hunters using automatic rifles, it is clear that they continue to hunt at rate
maximising levels irrespective o f the abundance o f large mammals. The extremely
low rhinoceros densities at Garamba (Hillman Smith 1989) are a consequence o f
hunters continuing to hunt irrespective o f the abundance o f their prey.
9.6.4 Conservation implications
These findings contribute to our understanding o f the potential for community based
conservation in the Garamba ecosystem. Hunting is important in adding value to
wildlife resources at the local level, and this is believed to be a condition for the long
term success o f a conservation programme (Eltringham 1984, M arks 1988).
-233-
However, hunters do not appear to practise conservation in the way that they hunt.
Whilst it may be in the interest o f the community as a whole to conserve the resource
base for the future, individual hunters make optimal foraging decisions, which may
result in the depletion o f mammal populations. This has been shown to be the case
for those hunters who use automatic rifles and target large mammals. They continue
to exploit low abundance areas, such as around Kiliwa, because the technology makes
it possible for them to generate high profits at very low animal densities.
Nevertheless, these conclusions assume that hunters would not change their
behaviour as resources become scarcer. This has been shown with the collapse in the
number o f rhinos at Garamba between 1960 and 1984. Only hunters using automatic
rifles have been shown to hunt unsustainably. Other hunters may show restraint if the
wildlife abundance were to drop significantly, but this cannot be verified from the data
in this study.
The conclusion that the hunters studied do not show conservation related behaviour
in the way that they hunt cannot be used as evidence to suggest that human resource
use and conservation are incompatible activities. Whereas wildlife utilisation has been
used as a basis for several conservation programmes (see Child 1990, Lewis et aJ
1990, Murombedzi 1991), it is unlikely, in its present form, to contribute to the
conservation o f mammal populations at Garamba because hunters do not show any
evidence o f restraint when animal populations become depleted. Nevertheless, these
results suggest that certain forms o f ‘epiphenomenal conservation’ also have the
potential to give community members the incentive to conserve their wildlife.
Epiphenomenal conservation, in this case is an activity that benefits conservation, but
is not motivated by an explicit desire to manage the resource sustainably. Several
examples o f this exist, such as activities o f the traditional chiefs who seize illegally
held automatic rifles. The motivation to seize automatic rifles is largely explained by
the chief s incentives to create a climate o f stability in his area. This is because
stability enhances economic development. Activities aimed at promoting stability in
the region also create important constraints on the unsustainable exploitation o f very
large mammals in the hunting reserves. The potential o f these activities for the
improved conservation management o f the Garamba ecosystem is described in
-234-
Appendix 4. These activities may provide a more realistic basis for community based
conservation around Garamba than unregulated utilisation, and, unlike established
protectionist practices, have the potential to contribute directly to local development.
9.7 Conclusions
This study has shown that the major variations in hunting are explained by the choice
o f hunting techniques used, either shotguns, automatic weapons, nets or snares.
Hunters that used automatic rifles differed from all other forms o f hunting. They
hunted at greater distances from the village, killed larger prey, obtained significantly
higher bushmeat yields and subsequently made much higher profits from hunting.
The analysis o f the costs and benefits o f hunting revealed that if hunting decisions
were exclusively based on financial incentives, all hunters would choose to use
automatic rifles; automatic weapons are relatively inexpensive and make very large
mammals available to the hunter. Thus, the profits from hunting with automatic rifles
were considerable, even at relatively low levels o f large mammal population
abundance. Yet the number o f hunters claiming to use automatic rifles represent less
than one percent o f the study population. This is explained by the legal constraints on
hunting with automatic rifles, and the high risks if caught, together with the non-
financial incentives to hunt using other techniques. These include the social and
cultural benefits that a hunter gets from group hunting.
Hunters did not show any evidence o f restraint in the number o f kills made. In the
case o f hunters using shotguns, nets or snares, populations o f the species that were
targeted did not appear to be depleted in the sites where they were being hunted, and
therefore there is no obvious reason why hunters should show restraint. This was
described as ‘epiphenomenal conservation’. Hunters using automatic rifles tended to
end the hunt after making a kill, however, this is better explained by the constraint o f
having to carry the meat back to the village rather than by any deliberate decision to
refrain from hunting.
-235-
The results from this chapter complement the study o f landscape scale variations in
mammal abundance described in Chapter 5, particularly by the finding that the
variations in animal density and abundance do not appear to be influenced by the
presence o f agricultural populations. These data show that shotgun, net and snare
hunting result in a relatively low offtake, and targeted small mammals that w ere
typically more resilient to population depletion from hunting than the large mammals
targetted by automatic weapons. Thus, these species remained relatively abundant
throughout the reserves. The large mammals, that were targeted by hunters using
automatic weapons are less resilient to high levels o f offtake from hunting.
Furthermore, hunters were prepared to cover much greater distances to catch these
large mammals. As a result, they appear depleted throughout the protected area
except where they are actively protected, in the national park.
-236-
Chapter 10
W ildlife R egulations in War and Peace
10.1 Summary
This chapter explores the relationship between the enforcement o f wildlife regulations
and the commercialisation o f bushmeat during periods o f relative stability and during
periods o f conflict. Market surveys were undertaken in village and urban markets and
patterns o f trade in bushmeat are presented. A number o f significant differences
emerge from these analyses. An estimated 6.4% o f bushmeat sold in the village
markets and 58.9% sold in the urban markets consists o f large protected mammals
originating from the national park.
Indicators o f success in wildlife protection are assessed using patrol data collected by
the national park’s research and monitoring programme from April 1996 to February
1997. An analysis o f the variations in effective wildlife protection showed that the
most important factor determining level o f wildlife protection was political conflict,
partly because o f its effect on donor support to the centralised conservation.
Effective wildlife protection dropped sharply during the conflict months o f late 1996
and early 1997.
Whilst the village markets are not significantly affected by changes in wildlife
protection, the urban markets showed a marked increase in the sale o f bushmeat
during periods o f conflict. Furthermore, the bushmeat filières described in Chapter 4
changed significantly during the conflict months because urban traders avoided Kiliwa
as a commercial centre and obtained their meat directly from the hunters at source.
-237-
10.2 Background
Trade in bushmeat has been presented as the primary threat to wild mammal
populations in Central Africa (Mittermeier 1987, Peer 1993, Fa et a l 1998).
Robinson and Redford’s (1991) simple model for measuring sustainability from
harvesting rates provided the basis for a number o f studies examining the relationship
between the marketing o f bushmeat and animal populations. For example. Juste et a l
(1994) undertook long term monitoring o f markets in Equatorial Guinea and analysed
the effects o f wildlife harvesting on local mammal populations. A similar study was
undertaken in the Arabuko-Sokoke Forest in Kenya by Fitzgibbon et a l (1995). The
objectives o f these studies were to assess the sustainability o f wildlife harvesting, and
to identify those species that were subject to over-harvesting. Fa et a l (1995) use the
Equatorial Guinean market data to recommend greater regulation through ""the
maintenance o f already decreed protected areas ... where control o f hunting is vital
fo r conserving the endemic fa u n d \
Regulating off-take is an obvious solution for reducing the amount o f meat in the
markets. However, there have been relatively few studies that examine the
relationship between the flow o f bushmeat in the markets and differing intensities o f
wildlife protection. This section explores the relationship between the flow o f
bushmeat through the Azande hunting reserve and the intensity o f wildlife protection
in the national park.
Chapter 4 provided an outline o f the bushmeat chain through Kiliwa, highlighting that
trade in bushmeat operates at two levels. A village trade relies on resident hunters
providing the markets with meat which is largely sold to households within the
village. A second, parallel trade operates through the village. These activities involve
much larger volumes o f meat, comprising large protected mammals. This meat is
mostly sold in the five urban markets in Dungu. The objective o f this chapter is to
examine the relationship between the marketing o f meat and the implementation o f
wildlife regulations in the protected area. M arket value o f bushmeat is used as an
-238-
indicator o f the volumes o f bushmeat passing through the hunting reserves. The
market in Kiliwa and the markets in Dungu are examined separately to provide a
comparison o f urban and village trade. These patterns are then related to the levels o f
wildlife protection in the park.
10.2.1 Factors influencing the efficacy o f wildlife protection
Exclusion and law enforcement remains the dominant management strategy in
protected areas throughout Africa (lUCN 1993). Yet there have been relatively few
systematic studies to assess the efficacy o f law enforcement in protected areas or the
factors that may contribute to, or threaten, its success in securing a sustainable
resource base. The factors which influence the efficacy o f law enforcement need to
be understood to establish its viability as a wildlife conservation strategy. This
section will focus on the impact o f two factors on effective law enforcement. First,
external financial investment in wildlife protection, establishing the extent to which
wildlife protection regimes are viable in the absence o f external sources o f funding.
The second factor that will be examined is the effect o f military conflict as a
constraint to effective law enforcement.
Leader Williams and Albon (1989) have published data to show the levels o f financial
investment required to ‘guarantee the integrity’ o f protected areas. They propose a
ball-park figure o f US$ 200 per km^, yet law enforcement budgets in most African
protected areas are less than five percent o f this estimate (Dublin et a l 1995). They
conclude that underinvestment in wildlife protection is a major constraint for
conservation in Africa. This constraint applies to the efficacy o f wildlife protection at
Garamba (see Box 10.1).
Regional assessments, such as Hart and Hart (1997), emphasise the consequences o f
conflict as the major challenges to wildlife conservation. They cite the lack o f reliable
financial support for protected area management as a consequence o f conflict.
-239-
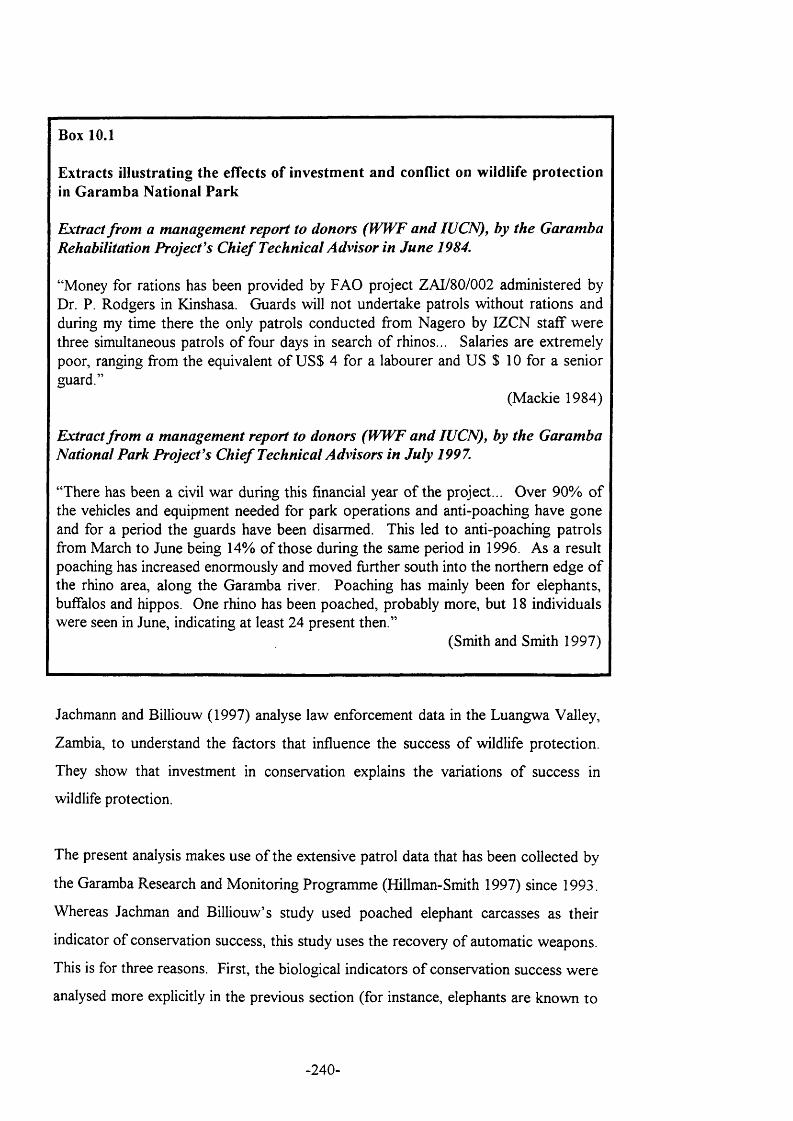
Box 10.1
Extracts illustrating the effects of investment and conflict on wildlife protection in Garamba National Park
Extract from a management report to donors (WWF and lUCN), by the Garamba Rehabilitation Project’s Chief Technical Advisor in June 1984.
“Money for rations has been provided by F AO project ZAI/80/002 administered by Dr. P. Rodgers in Kinshasa. Guards will not undertake patrols without rations and during my time there the only patrols conducted from Nagero by IZCN staff w ere three simultaneous patrols o f four days in search o f rhinos... Salaries are extremely poor, ranging from the equivalent o f US$ 4 for a labourer and US $ 10 for a senior guard.”
(Mackie 1984)
Extract from a management report to donors (WWF and lUCN), by the Garamba National Park Project’s Chief Technical Advisors in July 1997.
“There has been a civil war during this financial year o f the project... Over 90% o f the vehicles and equipment needed for park operations and anti-poaching have gone and for a period the guards have been disarmed. This led to anti-poaching patrols from March to June being 14% o f those during the same period in 1996. As a result poaching has increased enormously and moved further south into the northern edge o f the rhino area, along the Garamba river. Poaching has mainly been for elephants, buffalos and hippos. One rhino has been poached, probably more, but 18 individuals were seen in June, indicating at least 24 present then.”
(Smith and Smith 1997)
Jachmann and Billiouw (1997) analyse law enforcement data in the Luangwa Valley,
Zambia, to understand the factors that influence the success o f wildlife protection.
They show that investment in conservation explains the variations o f success in
wildlife protection.
The present analysis makes use o f the extensive patrol data that has been collected by
the Garamba Research and Monitoring Programme (Hillman-Smith 1997) since 1993.
Whereas Jachman and Billiouw’s study used poached elephant carcasses as their
indicator o f conservation success, this study uses the recovery o f automatic weapons.
This is for three reasons. First, the biological indicators o f conservation success were
analysed more explicitly in the previous section (for instance, elephants are known to
-240-
have increased substantially in recent years). Second, elephant carcass counts are less
intensively monitored than the outcom e o f patrols, and therefore provide a less
reliable measure o f conservation efficacy. Lastly, the number o f automatic weapons
recovered can be expressed as a rate relative to the number o f patrols, and to the
number o f encounters between park guards and poachers. This produces rates which
are less likely to have a confounding effect than the number o f elephant carcasses. In
other words, elephant carcasses, as an indicator o f conservation efficacy, can be
confounded by other factors, such as an increase in the demand for meat.
Nevertheless, there are inaccuracies associated with patrol data which will be
discussed below.
10.3 M ethods
10.3.1 Patterns o f bushmeat use in local markets
a. Market surveys
Five markets in Dungu and two markets in Kiliwa were surveyed during the period
April 1996 to February 1997. Standard techniques were used to monitor the flow o f
all products through the market (M artin 1995). The number o f stalls in the market
was enumerated every two hours, and the proportion that was selling meat
documented. All stall owners selling meat were interviewed and the quantity o f meat
available for sale was weighed. Stall keepers were questioned about the geographical
origin o f the meat. The meat from the Azande hunting reserve came predominantly
from four locations: Limai and Kiliwa, where meat was bought by urban traders from
intermediate traders (as described in Chapter 4), and Mamba and Wilibadi, where
meat was bought directly from the hunters.
Meat was usually processed before being taken to the market. This involved cutting
it into smaller pieces and possibly smoking the meat, to preserve it and to reduce the
weight during transport. As a result, it was not always possible to recognise the
mammal species from the processed meat. However, the form and texture o f the
-241-
meat meant that the larger, protected species were easily identifiable, and therefore it
was possible to use the category o f protected / unprotected to describe the meat.
The Dungu market surveys were based on a sample o f the total number o f market
days. Two o f the five markets in Dungu were open every day o f the week, one
market was open three days a week and tw o were open one day a week. This
produced a total o f 19 market days per week in Dungu. Each week, six o f the
nineteen possible markets were randomly selected to produce a sample o f 282 market
days, and a sampling intensity o f 31.6% o f all the markets days in Dungu. Thus, the
value o f the products passing through the Dungu markets could be evaluated using
standard statistics by extrapolating from the sample mean values.
Each o f the two markets in Kiliwa were open for only one day a week, Sunday and
Wednesday. This made it feasible to survey every market during the study period. 92
market days were surveyed in Kiliwa, which represents a total count for the Kiliwa
markets.
b. Traders' supplies
A second technique was used which provided an accurate measurement o f the
quantity o f bushmeat leaving the Azande hunting reserve. Traders were interviewed
on the road between Kiliwa and Dungu. The contents o f the load o f every eighth
trader passing along the road was documented and weighed. The survey was
maintained for seven days a month. The survey started at 6.30 am and ended at 8 pm
each day. A total o f 931 trader records were made between April 1996 and February
1997.
Traders were initially suspicious about the motives behind this research. However,
careful explanations and discussions created a more relaxed relationship with the
traders after about one month. Therefore, the first month’s data (March 1996) were
omitted from the analysis.
-242-
10.3,2 Efficacy o f wildlife protection
Patrol data have been collected at Garamba for several decades. Since 1989, data
have been systematically collected as part o f the law enforcement monitoring exercise
(Hillman-Smith 1997). Patrols are carried out by teams typically ranging from 10 to
20 armed guards (more recently patrols o f over 30 guards have been used in response
to the increased size and fire power o f organised poaching groups). D ata on the
distribution and intensity o f illegal activities have been collected as follows:
a. ManpoM>er utilisation records
These are kept by the central store keeper, who also produces monthly summaries o f
data including the number o f days patrolled by each guard, the total number o f man
days and patrol days undertaken each month % together with the number o f encounters
with poachers, and the number o f weapons recovered subsequent to those
encounters.
b. Patrol summary sheets
Monthly patrol summary sheets have been maintained since July 1996, providing
more detailed descriptions o f the nature and outcome o f patrols.
c. Direct reporting
This is undertaken on a daily basis by patrols in the field, and the information is
recorded by the radio operator at the National Park headquarters.
d. Summaiy o f patrols
A new summary o f patrols sheet was completed for 1997. This was a tem porary
measure taken during the war in 1996 to 1997 because o f the absence o f a store
keeper. This provided a summary o f the more detailed information normally collected
during the debriefing o f patrol leaders.
The accuracy o f patrol data is difficult to assess. Guards are provided with
performance related pay, and consequently, contact with poachers is probably
Man days and patrol da>'S are not proportional because the patrol sizes have varied over the years.
-243-

exaggerated. However, payment is related to the number o f days spent on patrol,
together with direct indications o f success, such as arrests and the seizing o f arms,
which make it difficult for guards to exaggerate the number o f encounters with
poachers.
To evaluate the accuracy o f patrol reporting, the author joined a two week patrol in
the north east o f the National Park in June 1994. On the third day, the patrol was
attacked, and subsequently pursued for about three kilometres by poachers o f
Sudanese origin. This incident was registered in the patrol report as a success, with
the park guards causing the poachers to flee back to Sudan. This was known not to
be the case. Guards experience considerable levels o f stress from the high risks
associated with patrolling the National Park. Consequently, the details contained in
the patrol reports are not necessarily accurate. Thus, this analysis relies on tangible
evidence for the reported success o f a patrol, namely the recovery o f automatic rifles
from poachers, which is thought to provide a more accurate measure o f success.
Monthly summaries o f patrol days and man days are used as an index o f conservation
efficacy by using the ‘catch - effort’ ratios developed by Bell (1984). Patrolling effort
(man days spent in the park and patrol days) are related to the number o f contacts
with poachers and the number o f arms seized from poachers. Summaries based on
patrol data collected between January 1992 and July 1997 are used, although a small
proportion o f months were ommitted because o f inadequate reporting. Conservation
efficacy is tested by comparing monthly summaries during periods o f relative stability
and during periods o f conflict. The first five months o f 1992 and the months between
December 1996 and July 1997 w ere classed as conflict months.
10.4 Results
The results below first describe the analyses used to explore the patterns o f variation
in the outcome o f patrols and the volumes and characteristics o f bushmeat in the
Azande hunting reserve. The assumption o f normality o f distribution and errors could
not be maintained on either the patrol data or the market data. Therefore, non
-244-
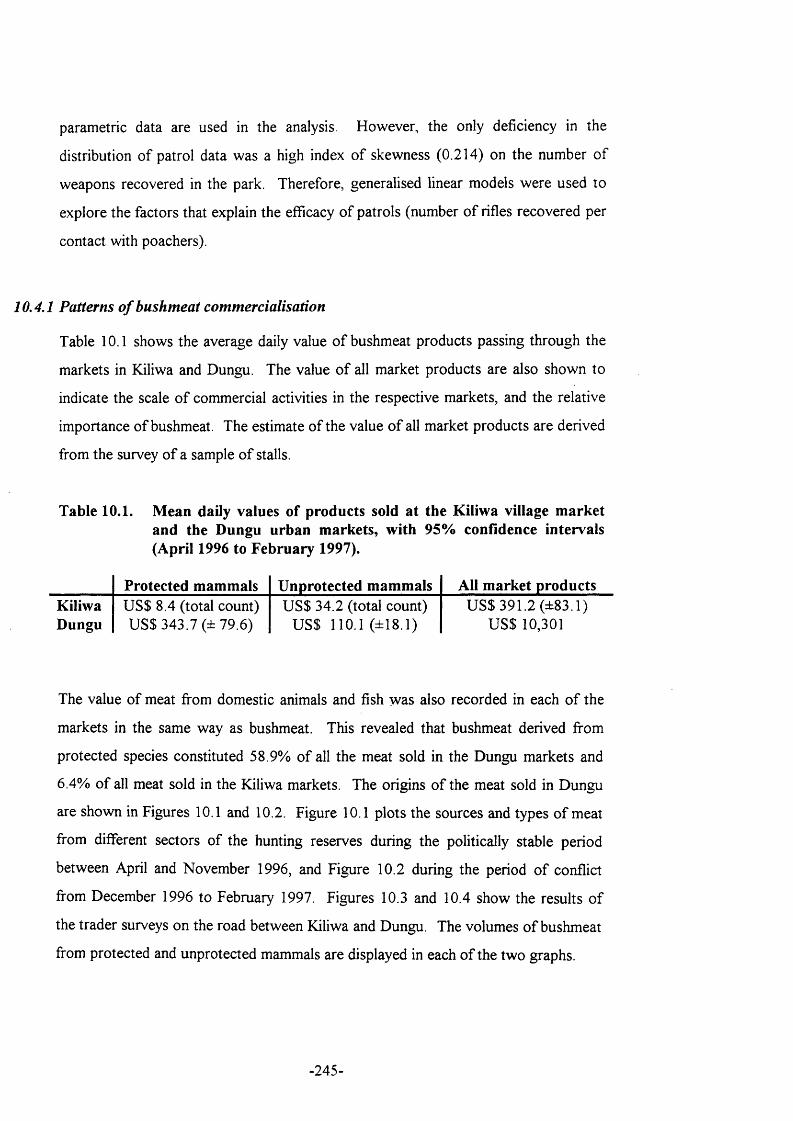
parametric data are used in the analysis. However, the only deficiency in the
distribution o f patrol data was a high index o f skewness (0.214) on the number o f
weapons recovered in the park. Therefore, generalised linear models were used to
explore the factors that explain the efficacy o f patrols (number o f rifles recovered per
contact with poachers).
10.4.1 Patterns o f bushmeat commercialisation
Table 10.1 shows the average daily value o f bushmeat products passing through the
markets in Kiliwa and Dungu. The value o f all market products are also shown to
indicate the scale o f commercial activities in the respective markets, and the relative
importance o f bushmeat. The estimate o f the value o f all market products are derived
from the survey o f a sample o f stalls.
Table 10.1. Mean daily values of products sold at the Kiliwa village market and the Dungu urban markets, with 95% confidence intervals (April 1996 to February 1997).
Protected mammals Unprotected mammals All market productsKiliwaDungu
US $ 8.4 (total count) US$ 343.7 (± 79.6)
US $ 34.2 (total count) US$ 110.1 (±18.1)
U S$391.2 (±83.1) USS 10,301
The value o f meat from domestic animals and fish was also recorded in each o f the
markets in the same way as bushmeat. This revealed that bushmeat derived from
protected species constituted 58.9% o f all the meat sold in the Dungu markets and
6.4% o f all meat sold in the Kiliwa markets. The origins o f the meat sold in Dungu
are shown in Figures 10.1 and 10.2. Figure 10.1 plots the sources and types o f meat
from different sectors o f the hunting reserves during the politically stable period
between April and November 1996, and Figure 10.2 during the period o f conflict
from December 1996 to February 1997. Figures 10.3 and 10.4 show the results o f
the trader surveys on the road between Kiliwa and Dungu. The volumes o f bushmeat
from protected and unprotected mammals are displayed in each o f the two graphs.
-245-
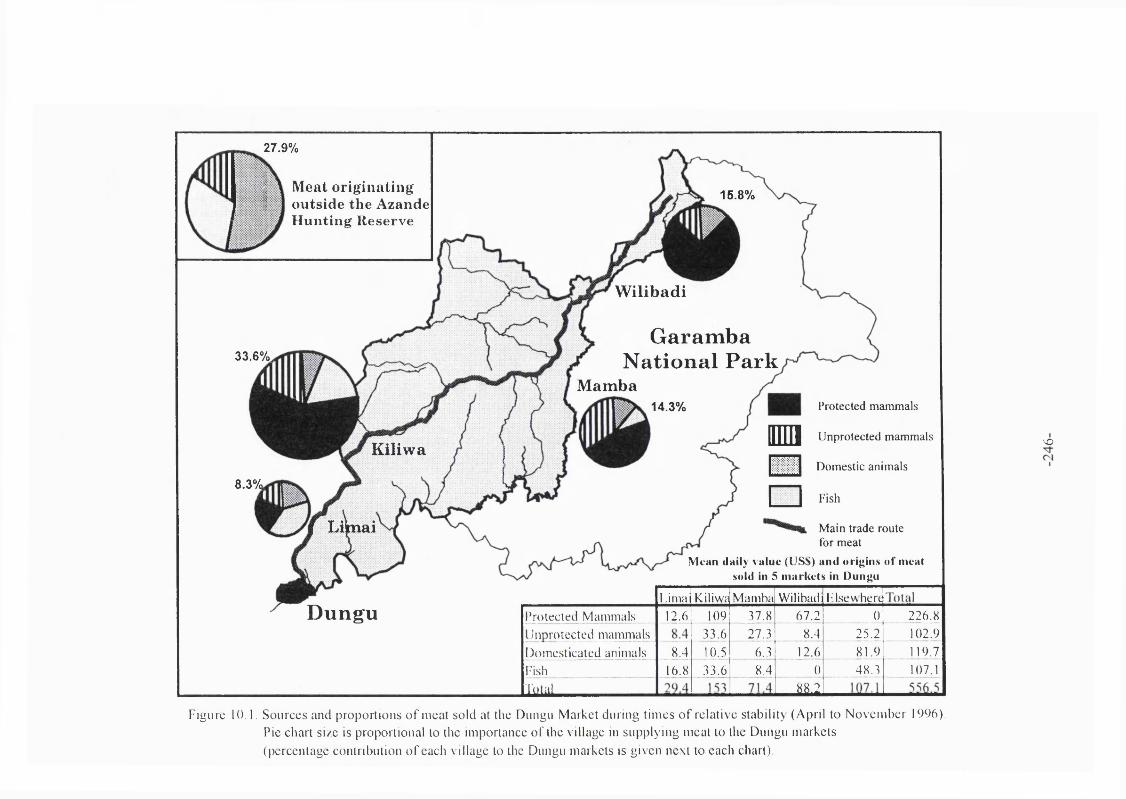
27.9%
M e a t o r i g i n a t i n g o u t s id e t h e A z a n d e H u n t i n g R e s e rv e
3 3 . 6 % .
8 . 3 % .
1 6 . 8 %
W ilibadi
Garamba National Park
Mamba1 4 . 3 %
Kiliwa
Liknai
Protected mammals
n m i Unprotected mammals
H Domestic animals
□ Fish
Main trade routefor meat
Mean daily value (US$) and o ricins of meat sold in 5 markets in Dun^u
Dungu Prolecled Mammalslinpmtected mammals Domesticated animalsFish
m i
l-imai Kiliwa Mamba Wilibadi F.lsewhert12.6
_ 8 .416.8
10933.610.533.6
_2 7 .827.3
6.38.4
67.28.4
1 Z 60
«8.2
025.2 81.948.3
22^8102.9119.7107.1
\o
Figure 10.1. Sources and proportions o f meat sold at the Dungu Market during times o f relative stability (April to N ovem ber 1996). Pic chart si/.c is proportional to the importance o f the village in supplying meat to the Dungu markets (percentage contribution o f each village to the Dungu markets is given next to each chart).
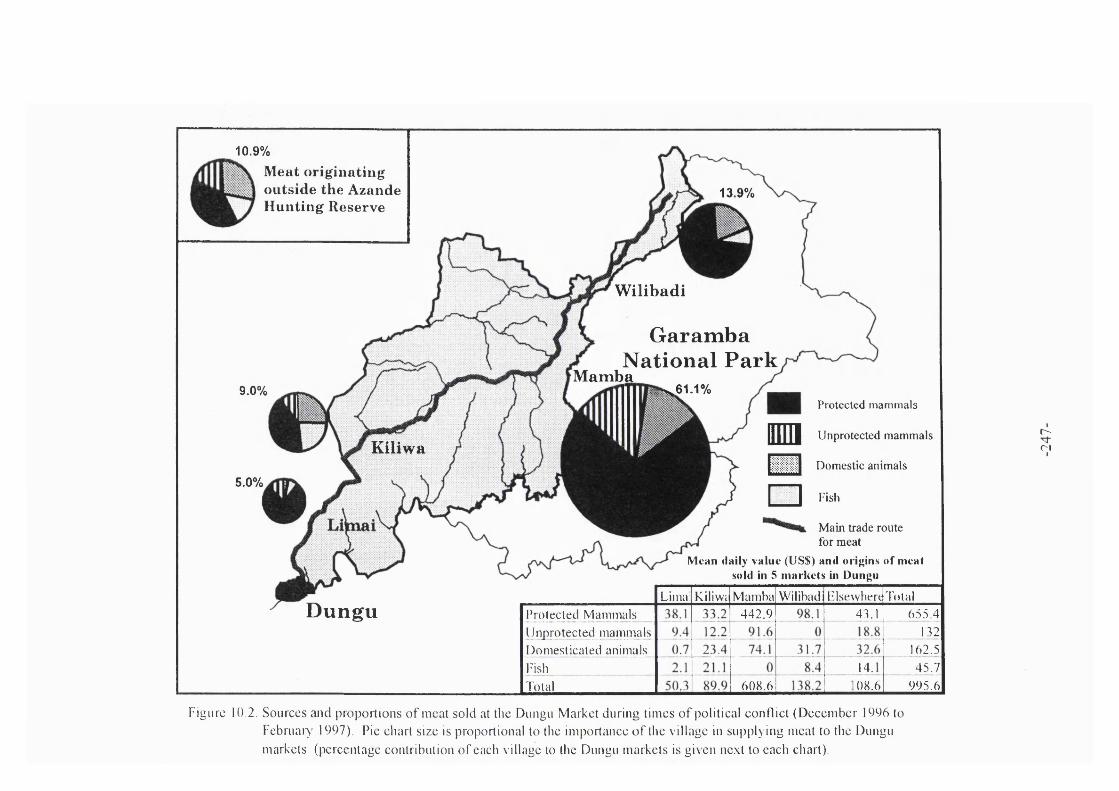
10.9%
M e a t o r ig i n a t i n g o u t s id e t h e A z a n d e H u n t i n g R e s e rv e
9.0%
5 . 0 %
1 3 . 9 %
W ilibadi
Garamba National Park
M amba^ 61.1%
Kiliwa
Dungu Protected MammalsUnprotected mamnials Domesticated animals Fish Total
Protected m a m m a l s
mni Unprotected mammals
□ Domestic animals
□ Fish
Main trade routefor meat
Mean daily value (US$) and origins of meat sold in 5 markets in Dungu
Limai Kiliwii Mamba Wilibadi LIsewhere Total43.1
14.108.6
Figure 10,2. Sources and proportions o f meat sold at the Dungu Market during times o f political conflict (Decem ber 1996 to Februaiy 1997). Pie chart size is proportional to the importance o f the village in supplying meat to the Dungu
markets (percentage contribution o f each village to the Dungu markets is given next to each chart).
442.9
608.6
655.4 132
162.5 45,7
995.6
r-n
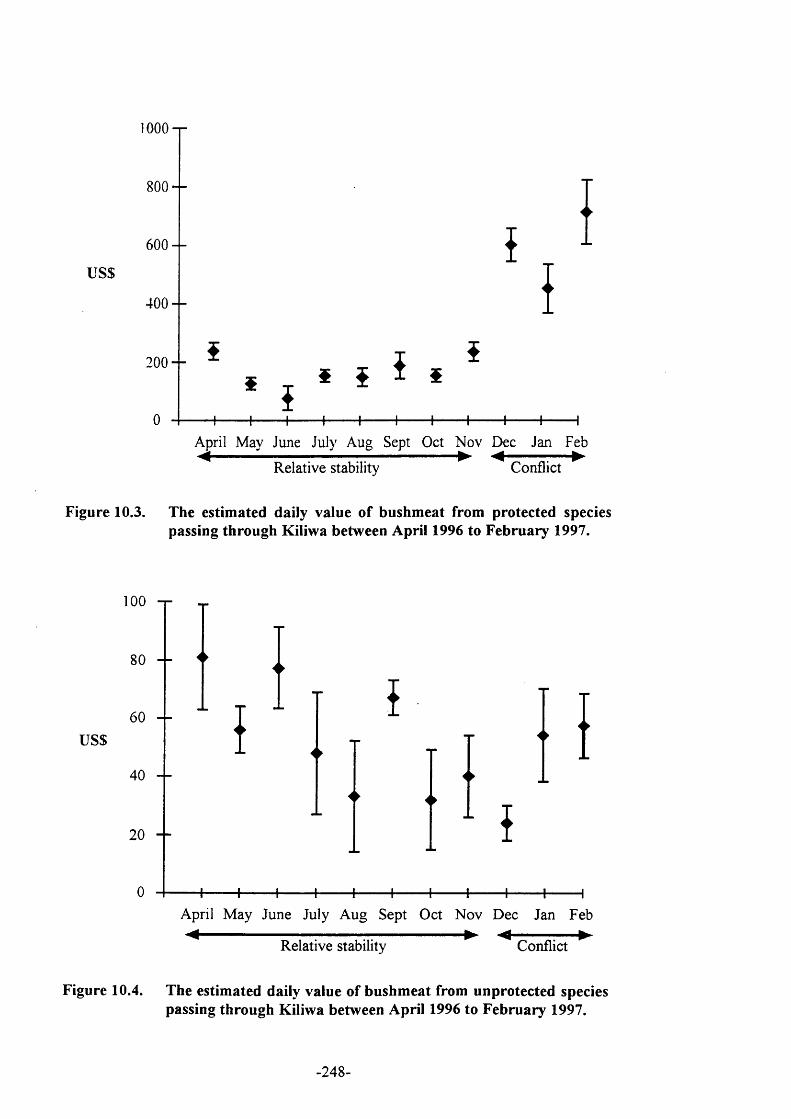
1000-r
800 - -
600 —
u s $
400 —
200 —
April May June July Aug Sept Oct Nov Dec Jan Feb
ConflictRelative stability
Figure 10.3. The estimated daily value of bushmeat from protected species passing through Kiliwa between April 1996 to February 1997.
100
u s $
i ►
i ► i ►
April May June July Aug Sept Oct Nov Dec Jan Feb
Relative stability Conflict
Figure 10.4. The estimated daily value of bushmeat from unprotected species passing through Kiliwa between April 1996 to February 1997.
-248-
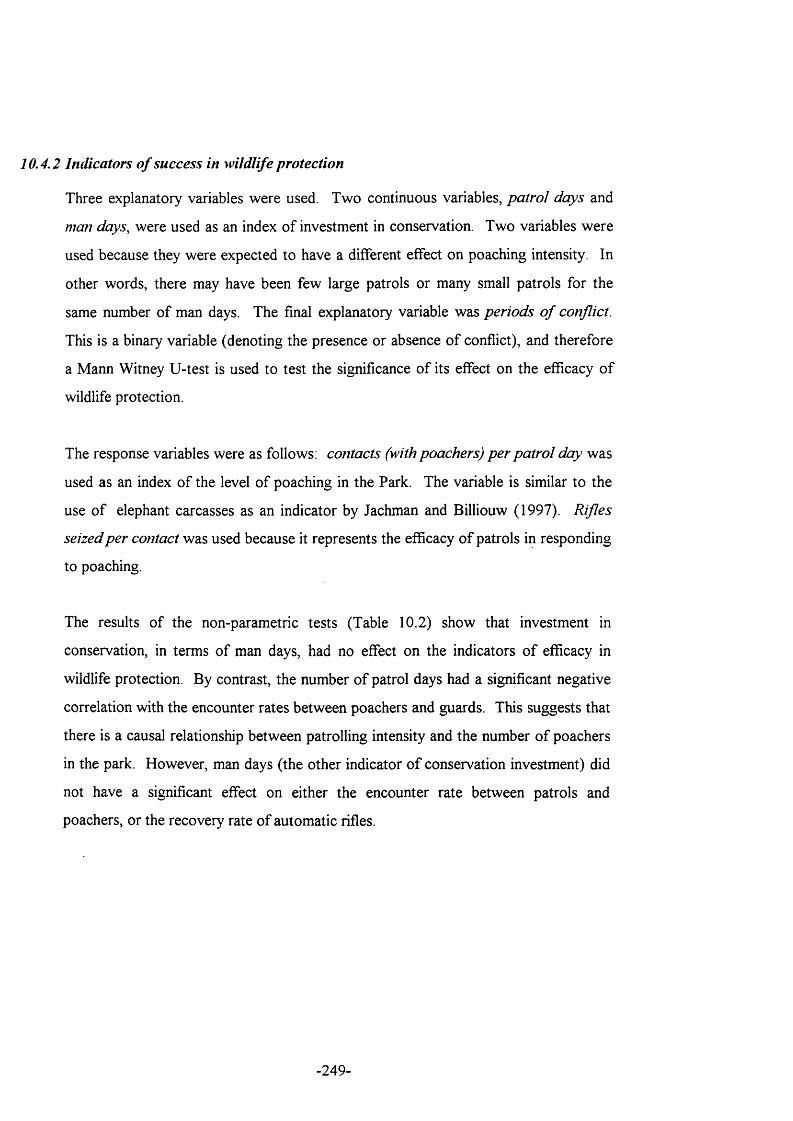
10.4.2 Indicators o f success in wildlife protection
Three explanatory variables were used. Two continuous variables, patro l days and
man days, were used as an index o f investment in conservation. Two variables were
used because they were expected to have a different effect on poaching intensity. In
other words, there may have been few large patrols or many small patrols for the
same number o f man days. The final explanatory variable was periods o f conflict.
This is a binary variable (denoting the presence or absence o f conflict), and therefore
a Mann Witney U-test is used to test the significance o f its effect on the efficacy o f
wildlife protection.
The response variables were as follows; contacts (with poachers) p er pa tro l day was
used as an index o f the level o f poaching in the Park. The variable is similar to the
use o f elephant carcasses as an indicator by Jachman and Billiouw (1997). Rifles
seized per contact was used because it represents the efficacy o f patrols in responding
to poaching.
The results o f the non-parametric tests (Table 10.2) show that investment in
conservation, in terms o f man days, had no effect on the indicators o f efficacy in
wildlife protection. By contrast, the number o f patrol days had a significant negative
correlation with the encounter rates between poachers and guards. This suggests that
there is a causal relationship between patrolling intensity and the number o f poachers
in the park. However, man days (the other indicator o f conservation investment) did
not have a significant effect on either the encounter rate between patrols and
poachers, or the recovery rate o f automatic rifles.
-249-
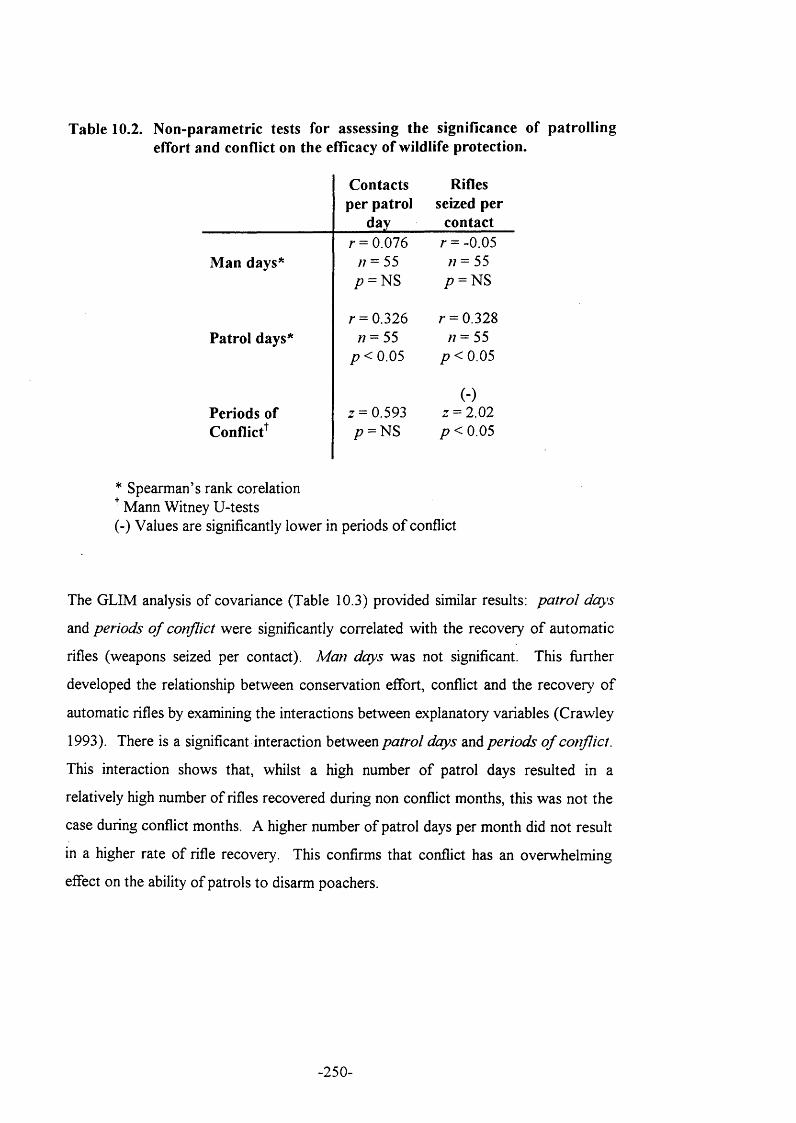
Table 10.2. Non-parametric tests for assessing the significance of patrolling effort and conflict on the efficacy of wildlife protection.
Contacts Riflesper patrol seized per
day contactr = 0.076 r = -0.05
n = 55 n = 55/? = NS /? = NS
r = 0.326 r = 0.328n - 55 n = SS
p < 0 . 0 5 p<O.OS
(-)2 = 0.593 2 = 2.02p = NS p < 0 . 0 5
Man days’
Patrol days’
Periods of Conflict^
* Spearman’s rank corelation Mann Witney U-tests
(-) Values are significantly lower in periods o f conflict
The GLIM analysis o f covariance (Table 10.3) provided similar results: pa tro l day’s
and periods o f conflict were significantly correlated with the recovery o f automatic
rifles (weapons seized per contact). M an days was not significant. This further
developed the relationship between conservation effort, conflict and the recover)^ o f
automatic rifles by examining the interactions between explanatory variables (Crawley
1993). There is a significant interaction between patro l days and periods o f conflict.
This interaction shows that, whilst a high number o f patrol days resulted in a
relatively high number o f rifles recovered during non conflict months, this was not the
case during conflict months. A higher number o f patrol days per month did not result
in a higher rate o f rifle recovery. This confirms that conflict has an overwhelming
effect on the ability o f patrols to disarm poachers.
-250-
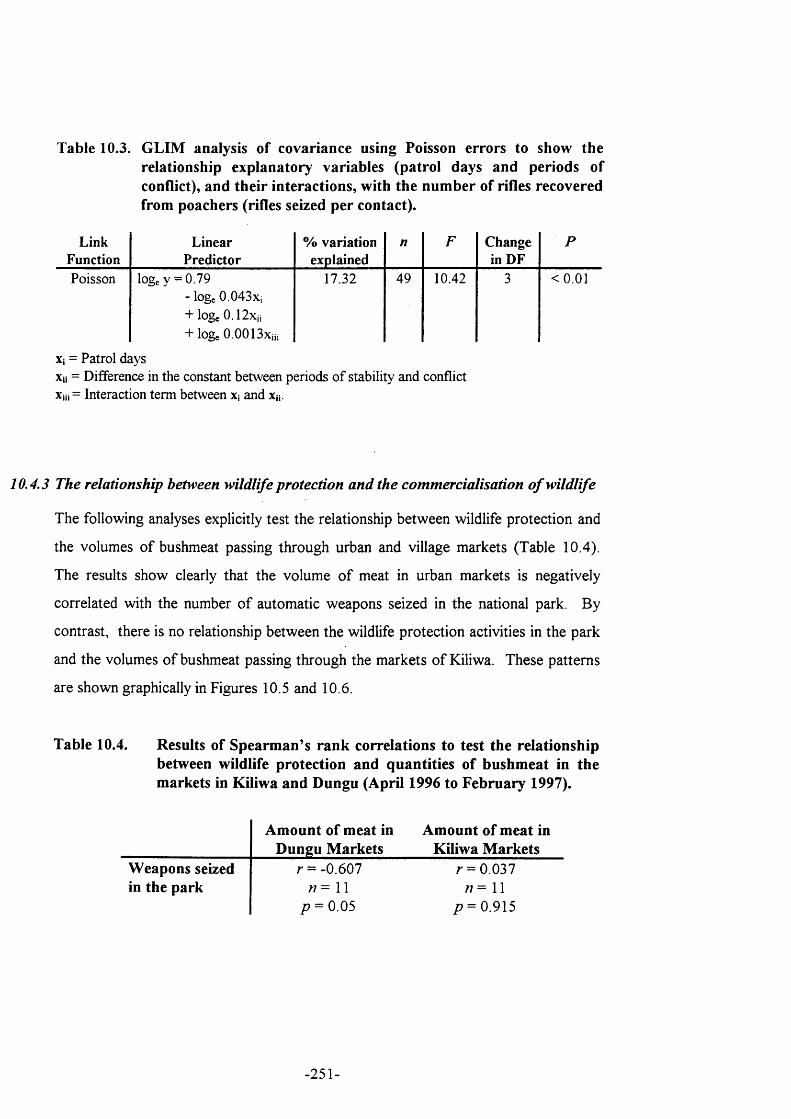
Table 10.3. GLIM analysis of covariance using Poisson errors to show the relationship explanatory variables (patrol days and periods of conflict), and their interactions, with the number of rifles recovered from poachers (rifles seized per contact).
LinkFunction
LinearPredictor
% variation explained
n F Change in DF
P
Poisson loge y = 0.79- loge 0.043Xi + loge 0.12x,i + loge 0.0013Xii,
17.32 49 10.42 3 <0.01
Xi = Patrol daysXii = Difference in the constant between periods of stability and conflict Xjii = Interaction term between Xj and Xü.
10.4.3 The relationship between wildlife protection and the commercialisation o f wildlife
The following analyses explicitly test the relationship between wildlife protection and
the volumes o f bushmeat passing through urban and village markets (Table 10.4).
The results show clearly that the volume o f meat in urban markets is negatively
correlated with the number o f automatic weapons seized in the national park. By
contrast, there is no relationship between the wildlife protection activities in the park
and the volumes o f bushmeat passing through the markets o f Kiliwa. These patterns
are shown graphically in Figures 10.5 and 10.6.
Table 10.4. Results of Spearman’s rank correlations to test the relationship between wildlife protection and quantities of bushmeat in the markets in Kiliwa and Dungu (April 1996 to February 1997).
Amount of meat in Amount of meat inDungu Markets Kiliwa Markets
Weapons seized r = -0.607 r = 0.037in the park « = 1 1 « = 11
p = 0.05 p = 0.915
-251-
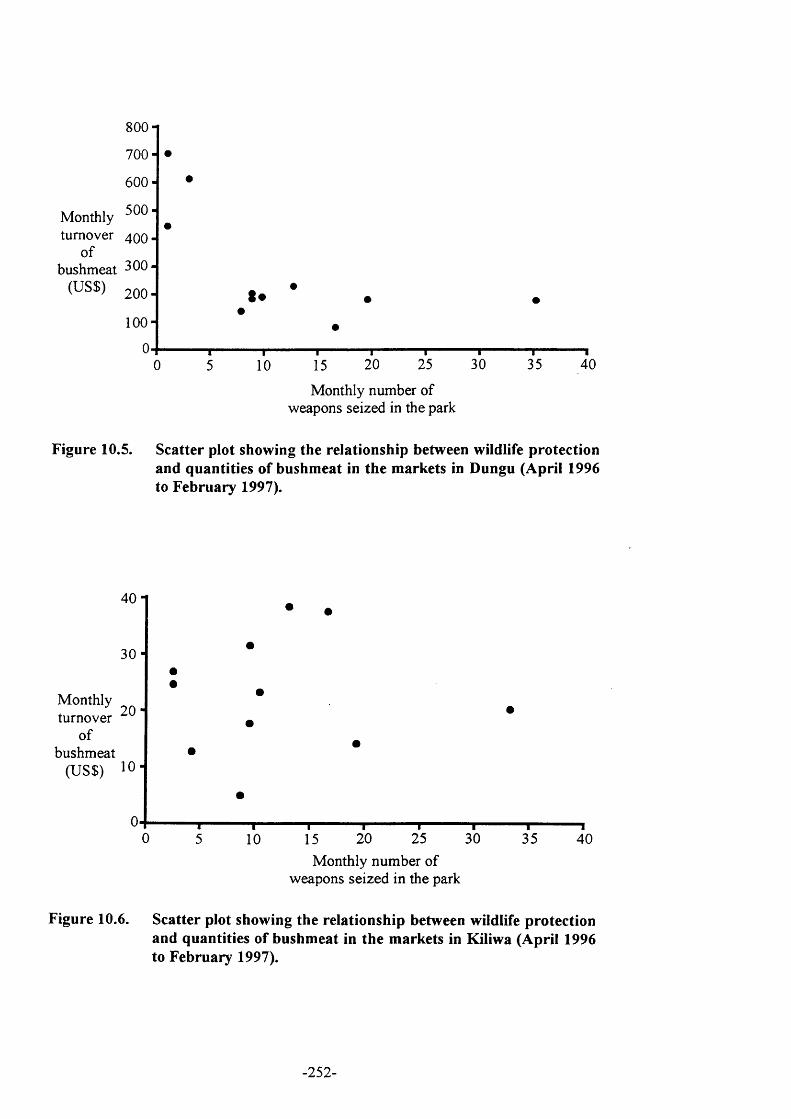
800-
700"
600 ■
Monthly 500-
turnover 400-of
bushmeat 300-(US$) 200-
100-
0-10 15 20
—|—25
—r -30
nr"35 40
Monthly number of weapons seized in the park
Figure 10.5. Scatter plot showing the relationship between wildlife protection and quantities of bushmeat in the markets in Dungu (April 1996 to February 1997).
40
30
20Monthly turnover
ofbushmeat
(US$) 10
10 15 20 25 30Monthly number of
weapons seized in the park
~ T ~35 40
Figure 10.6. Scatter plot showing the relationship between wildlife protection and quantities of bushmeat in the markets in Kiliwa (April 1996 to February 1997).
-252-
10.5 Discussion
10.5.1 Markets as indicators o f wildlife utilisation
Juste et al (1995) suggest that most hunted ungulates and primates end up in the
markets, but that some species, such as rodents or other small mammals, are more
likely to be consumed by the hunter’s family without the meat reaching the market.
The fact that village hunters eat meat directly after hunting introduces some bias into
the results because a measure o f the meat in the village markets underestimates the
amount consumed by village residents. The results o f Chapter 9, which examines
people’s harvesting patterns, showed that, excluding meat obtained from snares over
25% o f bushmeat obtained by village hunters is subsequently sold at the local market.
Thus, the meat represented in village markets is likely to represent less than a quarter
o f the total amount o f meat consumed in the village. By contrast, the meat recorded
in the urban markets represents most o f the meat consumed by urban dwellers.
10.5.2 Patrol data as indicators o f efficacy in wildlife protection
Greater accuracy in predicting the efficacy o f wildlife protection could have been
achieved if precise data on poaching intensity in the park were available. For
example, a more accurate measure o f patrol efficacy is provided by Abbot and M ace
(in press) for women wood collectors in Lake Malawi National Park. This study
provided an additional level o f accuracy in the measurement o f patrol efficacy because
the researcher was able to monitor both the anti-poaching, by using patrol reports,
and simultaneously monitor the illegal use o f park resources, by accompanying local
women into the park on their fuelwood gathering forays. They were able to show
that the detection rate o f women is low, just 12% o f incursions by women into the
park are intercepted by guards. They also show that the detection rates would have
to increase to 58% to prevent wood collection in the park.
Following poaching groups at Garamba was not a practical research option, given the
risks o f bushmeat hunting in the park. Thus, the results are limited to the
interpretation o f poaching intensity by using the ‘catch - effort’ ratios recommended
-253-
by Bell (1984). Nevertheless, the variations in patrolling effort and encounters with
poachers was sufficient to detect the primary factors explaining the efficacy o f wildlife
protection at Garamba during the study period. These are largely explained by the
effects o f the periods intense conflict which started in December 1996.
Much o f the variation in the indicators o f conservation efficacy can also be explained
by both investment in conservation. A high number o f patrols in the park was
associated with a relative decrease in the frequency o f encounters with poachers. In
addition, when encounters did take place, the rate o f recovery o f automatic rifles was
higher than when there were fewer patrols.
10.5.3 The effects o f conflict on centralised wildlife protection
The analysis o f both the market and patrol data revealed that the three conflict
months between December 1996 and February 1997 had an overwhelming effect on
patterns o f bushmeat trade and wildlife protection in the national park. The
ecological consequences o f the Rwandan civil war for the Parc National des Volcans
were described by Plumbtre et a l (1997) and show a similar marked increase in the
use o f bushmeat. The experience in Garamba has highlighted that the ecological
consequences o f war are based on a multitude o f factors occuring in succession: at
one level, conflict is associated with immeasurable levels o f human suffering during
which time conservation concerns cannot be prioritised. Wildlife authorities were not
immune to the predicament, which was compounded by the curtailment o f existing
structures o f external support during the conflict. Although project field staff
maintained regular supplies to ICCN staff throughout the war, this was o f little help in
maintaining activities, particularly when the national park headquarters N agero
became a focal point o f the conflict between foreign mercenaries and the advancing
troops o f the AFDL (Smith pers comm). The sharp decrease in patrol days during
this period is self evident.
Hart and Hart (1997) analyse the effects o f conflict on conservation initiatives in
north eastern Congo and emphasise the inadequacy o f the existing financial support
-254-

structures throughout the region. They explain how the financial basis to
conservation management in Congo is dependant on international aid. International
aid is primarily channeled through non-governmental organisations and ICCN, who
implement conservation interventions within Congo’s protected areas. Aid is
provided within an economic development framework, which is influenced by the
country’s wider political context. Consequently, the financial input to protected area
management is curtailed during periods o f conflict.
At another level, the war created a number o f commercial opportunities which are not
available during times o f stability. This is reflected in the sharp increase in the
volumes o f meat passing throught the markets in Dungu, and along the road between
Kiliwa and Dungu (Figures 10.3 and 10.4). This meat consists predominantly o f
protected species.
When the changes in mammal population abundance, outlined in Chapter 6, are re
examined in relation to the analyses o f anti-poaching performance indicators, a
pattern emerges. The period 1976 to 1986 was associated with an overall decline in
animal population abundance within the National Park. This was a period o f relative
political stability in the region. The period 1986 to 1995 was associated with an
increase in mammal population abundance, yet this was a period o f conflict: the
Second Civil War o f Southern Sudan began in 1983 and has been fought with varying
degrees o f intensity to the present day. The period 1996 to 1997 was a period o f
generalised conflict, both in Sudan and Congo. Whilst there is no comparative
ecological data to show mammal population change during this period, the results
above show that the efficacy o f wildlife protection declined significantly.
Furthermore, a rapid aerial survey undertaken in June 1997 indicated that poaching in
the Park had increased substantially, and spread to the southern sector o f the National
Park during the conflict months o f 1996 and 1997 (Smith and Smith 1997).
On the basis o f the above observations, however, it could be argued that conflict
alone does not provide an explanation for the decline o f large mammal abundance.
Indeed the period o f conflict in Southern Sudan was associated with relative increase
-255-

in large mammal abundance. Thus, the immediate symptoms o f war, such as the
widespread availability o f automatic weapons and the increased demand for
bushmeat, do not explain fully the collapse o f effective wildlife protection regimes.
The reduction in international support received by the institution responsible for
maintaining effective wildlife protection (ICCN) seems to be o f greater importance.
Smith and Smith (1997) describe a decrease o f over 90% o f anti-poaching resources
to the Garamba Project. This resulted largely from the confiscation and looting o f
equipment, but is also explained by the difficulties experienced by external donor
agencies in maintaining support for anti-poaching as a result o f the conflict.
The immediate consequence o f the decline in the resources available for conservation
was a decrease in the number patrols in the park: the number o f man days spent in
the park by national park guards was significantly less during the conflict months than
during the more stable periods (z = 3.285, p < 0.001, Mann Witney U-test). These
results show that, whilst wildlife protection appears to have the intended ecological
consequences (the maintenance or increase o f animal abundance), the efficacy o f
wildlife protection is strongly influenced by the ability o f external aid agencies to
provide support to the local implementing institution.
10.5,4 Informal wildlife regulations during conflict
The patterns o f trade in the urban markets during periods o f stability and conflict
reflect the efficacy o f the structures that regulate the offtake o f wildlife. The
reduction in the capacity o f the centralised wildlife authorities to regulate poaching
has been discussed using patrol data in section 10.5.3. The market data in the tow n
o f Dungu also reflect the changes that have affected the informal regulators operating
in the Azande Hunting Reserve. Before the conflict, a small number o f traders
provided Dungu with bushmeat, and obtained the meat from Kiliwa. These were the
urban women traders described in Chapter 4. However, during the conflict larger
numbers o f traders bought meat to sell in Dungu. These traders did not obtain their
meat from middle men in Kiliwa as shown in Figure 10.1, but instead bought it
directly from the hunters in areas such as Mamba and Wilibadi (Figure 10.2), where
they could secure higher profits. This new pattern o f trade is probably best explained
- 256 -
by the departure o f the military from the region, who had formerly restricted access to
bushmeat to their own clients. This highlights the significance o f informal power
relations in the hunting reserve in lowering the offtake from the national park.
Alternative community based regulatory mechanisms that take account o f the impact
o f local power relations in limiting offtake o f wildlife are presented in Appendix 4.
These concepts are based on greater collaboration between centralised and local
authorities to regulate the flow o f bushmeat through the hunting reserves using
appropriate incentive mechanisms.
10.5.5 Village and urban markets
The pattern that emerges from these data is that village markets tend to sell small
unprotected mammals and the urban markets sell large mammals (see Table 10.1).
The volumes o f meat passing through the urban markets appear to vary significantly
with the level o f effective wildlife protection in the park. This is reflected in Table
10.4 and Figure 10.5. Wildlife management at Garamba focuses on the protection o f
large mammals which would suggest that the meat passing through the urban markets
is significantly regulated by wildlife protection in the Park.
However, the Figures 10.1 and 10.2, which show the locations from where bushmeat
is obtained by urban traders, offer a level detail which suggests that regulation in the
park alone is insufficient to explain the volumes and patterns o f bushmeat entering the
Dungu markets. These maps indicate that during the periods o f conflict, the elaborate
bushmeat filiè res described in Chapter 4 are no longer practised. During periods o f
relative stability urban traders buy most o f their meat at the villages o f Limai and
Kiliwa. This is because the trade networks between the villages o f M amba and
Wilibadi, near to the park where bushmeat was harvested, and Kiliwa and Limai, were
largely controlled by the military who have a garrison near Wilibadi. During the
conflict months FAZ personnel fled the region ahead o f the advancing troops o f the
AFDL. This was probably an important reason for the change in patterns o f
bushmeat use in Dungu. Whereas before the conflict, the bushmeat trade was under
the control o f the military and a handful o f urban women, after the departure o f the
military, all traders were able to exploit bushmeat by going straight to the producers
-257-
in Mamba and Wilibadi. Thus, to suggest that the extraction o f bushmeat from the
park is solely determined by the levels o f wildlife protection in the park would be to
over-simplify the situation. It is likely that the power relations and control
mechanisms that existed prior to the conflict limited the flow o f bushmeat to the
urban markets. The collapse o f the filières is likely to confound the strong
correlation between wildlife protection and the volumes o f meat in the markets in
Dungu.
10.6 Conclusions
This chapter revealed a number o f important patterns which help to understand the
relationship between the bushmeat trade and wildlife regulations, both centralised and
informal. The results showed that there are tw o bushmeat trade networks. One
operates at the village level, and the other serves the urban markets at the periphery
o f the reserves. The two systems o f trade respond differently to the intensity o f
wildlife protection and to the effects o f war in the region. Whereas the village trade
in bushmeat remained largely unchanged during this period, patterns o f bushmeat use
in the urban markets changed significantly. There was a greater use o f large
protected species which were obtained from hunters closer to the national park. This
development appears to be the result o f two factors. First, the efficacy o f wildlife
protection dropped significantly during the period o f conflict. This was shown in the
analysis o f variation in patrolling efficacy. Second, the filières, or bushmeat trade
networks described in Chapter 4, no longer existed after the departure o f the military
forces alligned with the ousted regime. The military no longer controlled the
bushmeat trade, and a greater number o f traders were able to purchase and sell meat.
-258-
Chapter 11
C oncluding D iscussion
This thesis has explored various dimensions o f wildlife management policy and
practice in and around Garamba National Park. The outcome o f current management
practices were analysed in relation to their impacts on the conservation status o f large
mammals and on their contribution to local development. Thus, the thesis has
analysed the social, economic and biological outcomes o f conservation management.
This chapter summarises these findings and outlines their potential contribution to
improved conservation management at Garamba in the future.
11.1 Main findings
11.1.1 Centralised and devolved management
The thesis began by exploring the various forms o f wildlife management at Garamba
National Park and in the surrounding hunting reserves. Broadly these were defined as
centralised and devolved systems o f management. Describing centralised
management is straightforward: policy documents are produced by the management
body o f the national park, and a zoning and planning exercise was undertaken to
deepen the understanding o f centralised wildlife management.
Devolved and informal systems o f wildlife management are more complex. This is
because the local systems o f wildlife management are tied into wider power networks
and long established patterns o f wild meat use that have come into existence through
the rapid development o f the informal economy in Congo. Bushmeat is an important
component o f the informal economy. To trace the flow o f bushmeat along the
informal commodity chains, between its harvesting and subsequent sale at village and
-259-
urban markets, the study used access mapping o f bushmeat filières, or trade
networks (Ribot 1998). These revealed that wildlife utilisation around Garamba is
highly structured, and is organised through the competing demands for access to a
profitable trade. Local regulations limit the offtake o f bushmeat. Regulators include
the traditional, civil and military authorities who compete for fiscal revenues from the
informal economy. An example o f this is the restriction o f the movement o f soldiers,
who trade in bushmeat, through the village o f Kiliwa. This is administered by the
traditional authorities because a military presence in the village discourages others
from trading (the chief raises market taxes from non-military traders for his own
administration).
Another example is that the military themselves discourage hunting and trade in
bushmeat by anyone other than their clients, to who are either a small selection o f
urban women traders, or local hunters who are provided with automatic w eapons by
the military. Chapter 10 showed that departure o f the FAZ during the conflict months
was associated with higher volumes o f meat passing throught the hunting reserve (see
Figure 10.3), and with traders dealing directly with hunters rather than through the
military’s clients (the urban women traders, see Figure 10.1 and 10.2).
11.1.2 The contribution o f centralised wildlife management to conservation and development
The analyses o f animal abundance provide compelling evidence that centralised
wildlife management at Garamba has contributed significantly to the objective o f
increasing the number o f large mammals in the ecosystem. While high variability in
animal abundance would be expected in savanna ecosystems if current thinking on
non-equilibrium population dynamics is accepted (Dublin 1991, Behnke et a l 1993,
this variability is highly consistent with the intensity o f protectionist regimes. This
pattern was shown on both spatial (Chapter 5) and temporal (Chapter 6) axes o f
variation, which strengthens the hypothesis that, generally, most variation in
abundance is explained by the wildlife protection regimes and not by random events.
-260-
Local development agendas have not yet been integrated into centralised wildlife
management practice at Garamba. Instead, centralised wildlife management is based
largely on a ‘reduction o f threats’ approach to wildlife management (Margolius and
Salafsky 1998). Thus, conservation activities have focused on the eviction o f resident
populations and the restriction o f wildlife utilisation by the enforcement o f wildlife
regulations. These policies and practices were outlined in Section 1 o f Chapter 4.
The zonation exercise described the management regimes that were planned for
different areas o f the park and hunting reserves. This analysis showed that an
approach based on protectionist paradigms was also envisaged for the future
management o f the hunting reserves. This approach involved setting areas in the
hunting reserves aside for conservation. Chapter 7 analysed the extent to which these
protection approaches conflicted with local resource use priorities. The analyses
showed that an approach which focused on the setting aside o f areas for conservation,
and could be described as an incipient form o f eviction, was incompatible with the
local development objectives that have, in theory, become central to global protected
area policy (WWF, lUCN, UNEP 1980, lUCN 1994).
The difficulties o f reconciling protectionist conservation and local developement
objectives highlight the need to examine further the ecological justifications for
protectionist conservation practices. This thesis has argued that the ‘human th rea t’ to
biological diversity is an assumption that that is not always tested using empirical
evidence (Brockington and Homewood 1996). The results presented in this thesis
provide an insight into the ecological validity o f the two perceived threats that
underpin current conservation practices: human presence and unregulated offtake.
a. Human presence
At first sight, the outcome o f eviction from Garamba National Park appears to be the
significant increase in large mammal populations. This notion is supported by the
significantly higher animal population abundance in the national park, where human
populations were evicted in 1938, compared to the hunting reserves where human
populations are present. However, the detail that emerged from the analysis o f animal
abundance over time and space suggests that eviction, in itself, does not provide a
-261
satisfactory explanation for higher animal abundance: the distribution and abundance
o f wildlife in the hunting reserves was not significantly affected by human presence.
Furthermore, the northern sector the national park, where populations had been
evicted, showed evidence o f a substantial decrease in animal abundance between
1976 and 1995. This northern sector o f the park experiences relatively little
patrolling effort because it was effectively abandoned due to instability and conflict
due to its position on the border with Sudan. This indicates that effective regulations,
and not eviction per se, are likely to be the primary determinant o f conservation
success.
b. Unregulated offtake
The enforcement o f wildlife regulations appears to provide a better explanation for
high mammal abundance than the absence o f local residents. The spatial and temporal
dynamics o f mammal populations in the park can be explained by the intensity o f law
enforcement. The proximity to the national park explained most o f the overall
variation in animal abundance in the hunting reserves, with high abundance being
negatively corelated with increasing distance from the park. Within the national park,
the effective enforcement o f wildlife regulations is also associated with high animal
abundance: the populations o f most mammals increased during the period when
wildlife protection was being funded by an external donor. Furthermore, this increase
in animal abundance is largely concentrated in the southern sector o f the national
park, which is the focus o f wildlife protection activities because o f the presence o f the
rhino population.
However, it should be noted that data from the hunting reserves show that current
law enforcement influences species differently. The analysis in Chapter 5, o f the
different guilds o f species, characterised according to their physiological and life-
history traits as well as the modes o f wildlife exploitation, reveals that the distribution
o f larger mammals is influenced by the regulation o f wildlife utilisation. Larger
mammals are significantly more abundant near to the national park where they are
protected. However, the abundance o f smaller mammals did not appear to be
significantly influenced by distance from the national park.
-262-
The result o f the ecological analyses concur with those o f the market data analyses
presented in Chapter 10: when regulations were less intensive as a result o f political
conflict in the region, the trade in large mammals, destined for the urban markets,
increased substantially. In contrast, trade associated with village markets, which
tended to focus on smaller mammals, was not significantly influenced by the absence
o f law enforcement during the conflict months.
Thus, two levels o f wildlife utilisation, with different regulators, markets,
technologies and ecological impacts, are apparent at Garamba. One level is the
exploitation o f large mammals which has a high impact on the their distribution. The
networks associated with this trade are largely dominated by the military and the
SPLA, together with the civil administration in Dungu. The meat is largely destined
for urban markets in Dungu and Isiro.
At another level, village markets trade in smaller mammals whose distribution and
abundance does not appear to be significantly influenced by resource use by local
residents. In Kiliwa, the trade is largely controlled by the traditional authorities, who
both promote commercial activities in the village by creating a climate o f stability, and
who exploit them by generating fiscal revenues imposed on those who use the market.
This level o f resource use is not influenced by the presence or absence o f external
wildlife regulations: this is shown in Chapter 10, which shows that the flow o f
bushmeat through local markets is not influenced by the efficacy o f the centralised
wildlife management. Thus, during the conflict months between December 1996 and
February 1997, when the intensity o f centralised wildlife protection was very low,
village trade in bushmeat did not increase. The potentional for village level wildlife
management in meeting conservation objectives is discussed below.
11.1.3 Local alternatives to centralised wildlife management
The difficulties in reconciling centralised conservation with local development
agendas at Garamba justifies a closer examination o f the potential for local,
consumption-based, wildlife management. The justification for this change o f
-263-
emphasis is supported by the finding that effective wildlife regulation, and not
eviction, provides the best explanation for successful conservation o f large mammal
species. It is therefore o f interest to explore the possibilities for community based
regulation. This study examined the evidence for existing wildlife utilisation
regulations among those who harvested the resources (hunters), and amongst those
who most influenced the trade in bushmeat (the local regulators described in Chapter
4).
a. Himters as consen’ationisis
As a first step in analysing the potential for local conservation, hunting behaviour was
analysed (Chapter 9). During the hunts surveyed as part o f this study, there was no
evidence to show that hunters displayed characteristics in their harvesting patterns
that could be attributed to deliberate conservation o f the resource base. While
diverse forms o f hunting practices could be identified, none showed anything other
than the rate maximising objectives that Alvard (1995) attributes to optimal foraging
strategies. Hunters decisions were largely determined by economic criteria, except
when the risk was high. Thus, hunters were prepared to forfeit the very high profits
obtained from the use o f automatic weapons because o f the high penalties, both from
the wildlife and the military authorities. Also, there was no evidence that hunters
deliberately limited their yields in order to conserve the resources. Hunters make rate
maximising decisions that would be predicted by optimal foraging models: hunters
usually continued to hunt after they had made a kill. Those who ceased to hunt after
a kill usually did so because they were unable to carry more meat back to the village,
and not necessarily to avoid over-harvesting.
The absence o f restraint in the harvesting patterns o f local hunters may be explained
by the lack o f local ownership o f wildlife resources: the system o f resource tenure
around Garamba, which is a combination o f de ju re state ownership and de fa c to free
access, is unlikely to provide the incentives for local users to exploit the resources
sustainably. Changing the system o f tenure, possibly through the establishment o f
exclusive rights to exploit wildlife, may provide an incentive mechanism encouraging
local hunters to exploit wildlife sustainably. The revenues generated from license fees
-264-

have the potential to broaden the benefits o f wildlife harvesting to the community as a
whole. A precedent to this approach exists with the fishing guilds around Kiliwa,
who sometimes provide benefits to the community within the group (fisherman
purchased the beds for the village clinic in Kiliwa), and through the payment o f
license fees to civil and wildlife authorities. The extent to which this benefits the
community has not been established although the potential for this is discussed below.
This approach is necessarily tied to the region’s legislative and administrative
structures, and their efficacy in regulating resource users.
h. Local regulators as conservationists
The absence o f meaningful sustainable offtake mechanisms from existing harvesting
patterns implies that external organised regulation o f bushmeat offtakes would be
required to promote the sustainable management o f wildlife. Currently this regulation
is centralised. The ecological impacts o f this are shown by the exceptionally high
abundance o f large mammals where and when effective wildlife regulations are in
place (see Chapters 5 and 6). The analysis o f the filières, or trade networks showed
that offtake from the park was also socially regulated. The bushmeat trade provided
opportunities that were seized by various levels o f authority in the hunting reserve,
including traditional, civil and military authorities. Although none o f these regulatory
mechanisms could be linked to planned conservation o f wildlife resources, local and
informal regulations were shown to have both ecological and local development
implications. For example, the sale o f bushmeat is regulated by both the traditional
authorities and by the military and civil authorities. Traditional authorities are largely
concerned with village markets which focus on the sale o f small mammals by village
hunters. At this level, the village trade in relatively small mammals appears to have a
limited impact on animal ecology. The spatial analyses o f animal abundance
presented in Chapter 5 show that the abundance o f small mammals was not
significantly affected by proximity to rural populations.
A critical challenge in developing local approaches to wildlife management is to
establish incentive and regulatory mechanisms that function appropriately within the
existing power relations in the region. Using traditional and local systems o f
- 265 -
authority to achieve non-local objectives is not new around Garamba, and past
experiences highlight the potential dangers o f this approach. Chapter 2 described
how local systems o f authority were used in the first half o f the twentieth century to
promote cotton production. Coercive measures were adopted by colonial and
commercial interests to ensure that traditional authorities enforced cotton production
on subjugated local populations. Besides the hardships that were imposed on rural
communities, these approaches proved to be neither profitable nor sustainable in the
long term (Isaacman and Roberts 1995). Field work observations indicated that
traditional authorities, particularly at the groupement level, are dependent on local
consent. This is exemplified by the suspension o f two chiefs in the area through
popular opposition to their authority. These incidents indicate that local consent is
not only a desirable objective, in terms o f a policy that seeks to meet local
development needs, but is also a condition for sustainable conservation management
in the hunting reserves.
A framework for the development o f such initiatives is outlined in Appendix 4. This
approach combines local incentive mechanisms for sustainable management o f wildlife
resources with existing regulatory authorities. The incentive mechanisms are
financial, and are based on the lucrative bushmeat and fish trade. The approach
outlined above would require a significant departure from established approaches to
conservation at Garamba, although such approaches are not without precedent in
other regions o f Africa (see for example Metcalfe 1995).
c. Who benefits?
The present study explored the benefits o f resource use for two reasons. Given the
current emphasis on integrating conservation and development objectives (WWF,
lUCN and UNEP 1980), benefits have to be understood to determine the extent to
which wildlife resources contribute to local development. Second, the success o f
devolved wildlife management in meeting conservation objectives is directly linked to
the level o f support that local administrators receive from local residents in the
hunting reserves. Thus, the success o f local authorities appears to rely on local
- 266 -
consent. This emphasises the importance o f local administrations being associated
with local benefits.
This thesis showed that, whilst the benefits from wildlife utilisation are considerable,
they reinforce existing power, wealth and gender differentials (Chapters 4 and 8).
Bushmeat is expensive to hunt and to purchase, and is therefore less accessible to
poorer households than lower value resources, such as wild plants (Chapter 8).
However, some redistribution o f meat does occur through the giving o f gifts. Whilst
women are prominent in the bushmeat trade, the extent o f their benefits is unclear.
Fiscal decentralisation provides a mechanism to enhance equity in the allocation o f
conservation benefits, as well as financing a local administration (see Appendix 4).
11.3 W ider contributions to conservation policy and research
The target audience for this thesis has primarily been decision makers concerned with
conservation and development in north eastern Congo. However, many o f the themes
addressed during this study are common to other regions o f Africa and elsewhere, and
the work can be drawn on to contribute to those debates.
The first is methodological. The research was able to link a social science approach
to long term ecological data collected over two decades by the Garamba National
Park Project. This study contributes to a growing understanding that conservation
issues require the integration o f social and natural science approaches. Furthermore,
CIS helps to present the complexity o f multiple perspectives regarding wildlife
resources within a comparative framework. This provides a basis for balancing
competing demands for wildlife resources, but only where all the stakeholders
perspectives are represented (Chapter 7).
This form o f analysis contributes to a growing understanding that ‘scientific data’ are
not value-free. Sullivan (1998) describes the environmental and land policies in
Namibia as being largely founded on “crisis narratives” . This decision making process
is not uncommon throughout Africa (see for example, Fairhead and Leach 1996, for
-267-
an example in West Africa, and Homewood el a l 1997, in East Africa). It is partly
symptomatic o f the distance that exists between policy makers and local realities, and
partly due to the imbalance in power relations between different stakeholders. This
work has attempted to close this gap by presenting local level ecological and social
data and make possible more informed management based on indepth analyses o f
processes and linkages.
Current thinking, that savanna ecology is determined by disturbance, is largely
founded on ‘natural’ processes such as rainfall, disease and fire. These pervasive
views have sometimes failed to consider human induced disturbance as an
overwhelming cause for ecological change. This thesis has quantified the effects o f
war on animal ecology, thereby reinforcing the need to consider the resilience o f local
institutions in periods o f conflict to ensure effective conservation management.
Centralised wildlife authorities have been effective during times o f relative stability,
but are largely dependent on external support which decreases during periods o f
conflict. Because informal administrations are locally financed, they are better able to
adapt to rapidly changing contexts. Thus, their enhanced role in meeting
conservation and development objectives should be considered a priority.
The issue o f devolved or centralised management may ultimately be resolved by
attrition more than deliberate decision making: as wildlife declines and the capacity o f
a centralised conservation authority is eroded by the isolation o f Garamba, by the
legacy o f war in Congo and the continuing conflict in Sudan, government and donor
support is likely to diminish. In this context decentralised management may provide a
viable approach. Indeed, this thesis has shown the potential complementarity o f the
two systems o f wildlife management. Centralised regulation o f wildlife offtake has
increased the value o f wildlife resources. This in turn has contributed to the financial
basis o f an informal administration which both regulates offtake and has the potential
to make effective linkages between conservation and local development. The political
will for centralised authorities to collaborate with local administrations could achieve
this more integrated and potentially more sustainable and resilient system o f wildlife
management.
-268-
R eferences
Abbot, J. 1996, Rural Subsistence and Protected areas: community use o f the miombo woodlands o f Lake Malawi National Park. PhD Thesis. University College London.
Abbot, J. Chambers, R. de Merode, E. Dunn, C Harris, T. Porter, G. Townsend, J. and Weiner, D. 1998, GIS and Participation: opportunity or oxymoron? Notes on Participatory Learning and Action 33, October.
Abbot, J. and Mace, R. in press. Managing protected woodlands: Women, woodfuel and law enforcement in Lake Malawi National Park. Consen’ation B iology forthcoming.
Allsop, R. 1971, Seasonal breeding in bushbuck, Tragelaphus scriptus. East African Wildlife Journal 9, 146 - 49.
Altmann, J. 1974, Observational study o f behaviour: sampling methods. Behconour X L IX 227-265.
Altmann, J. 1980, Baboon mothers and u fants. Harvard University Press, Cambridge.
Altmann, S.A. and Altmann, J. 1970, Baboon Ecology. University o f Chicago Press, Chicago.
Alvard, M. Robinson, J.G. Redford, K. Kaplan, H. 1997, The sustainability o f subsistence hunting in the Neotropics. Conservation Biology 11(4): 977 - 982.
Alvard, M. 1993, Testing the “Ecologically Noble Savage” hypothesis: interspecific prey choice by Piro hunters o f Amazonian Peru. Human Ecology, 21(4): 355 - 387.
Alvard, M. 1995, Intraspecific prey choice by Amazonian hunters. Current Anthropology 36 (5): 789 - 818.
Anderson, D. and Grove R. (eds ), 1987, Conservation in Africa: people, policies and practice. Cambridge University Press.
Andrewartha, H.G. and Birch, L.C. 1954, The distribution and abimdance o f animals. University o f Chicago Press, Chicago.
Asibey, E. 1986, Wildlife and fo o d security. Paper prepared for Forestry Department, F AO, Rome.
-269-

Asibey, E.O.A. 1974, Wildlife as a source o f protein in Africa south o f the Sahara. Biological Conservation, 6(1): 32 - 39.
Ayres, M.J. de Magalhàes Lima, D. de Souza Martins, E. and Barreiros, J.L. 1991, On the track o f the road: changes in subsistence hunting in a BrazilianAmazonian village. In: Robinson, J. and Redford, K. (eds.) Neotropical M>ildlife use and conservation. The University o f Chicago Press.
Bahuchet, S. and Pujol, R. 1975, Etude ethnozoologique de la chasse et des pièges chez les Isongo de la forêt centrafricaine. In: L ’homme et l’animal. Premier Colloque d’Ethnozoologie, Institut International d ’Ethnosciences, Paris: 181 - 192.
Bailey, R. and Headland T. 1991, The tropical rain forest: is it a productiveenvironment for human foragers? Human Ecology 19 (2), 261 - 289.
Bailey, R.C. and Aunger, R. 1989, Net hunters and archers: variation in wom en’s subsistence strategies in the Ituri Forest. Human Ecology 17(3), 273 - 97.
Barbier, E. Burgess, J. Swanson, T. and Pearce, D. 1990, Elephants, Econom ics and Ivory. Earthscan Publications Ltd. London.
Barnes, R.F.W. Blom, A. and Alers, M.P.T. 1995, A review o f the status o f forest elephants Loxodanta afficana in central Africa. Biological Consen’ation 71, 125 - 132.
Barnett, V, 1991, Sample sur\>ey: principles and methods. Edward Arnold.
Beaton, G.H. Milner, J. Corey, P. Mcguire, V. Cousins, M. Stewart, E. de Ramos, M. Hewitt, D. Grambsch, P. Kassim, N. Little, J. 1979, Sources o f variance in 24-hour dietary recall data: implications for nutritional study design and interpretation. The American Journal o f Clinical Nutrition 32, 2546 - 2559.
Beckman, B. 1987, Public investment and agrarian transformation in northern Nigeria. In Watts, M. (ed.) State, oil and agriculture in Nigeria. Institute o f International Studies, Berkeley, California.
Behnke, R.H. Scoones, I. and Kerven, C. 1993, Range ecology a t disequilibrium: new models o f natural variability and pastoral adaptation in African sa\>atmas. GDI, IIED, Commonwealth Secretariat, London.
Bell, R.H.V. 1971, A grazing ecosystem in the Serengeti. Scientific American 224(1): 8 6 -9 3 .
Bell, R.H.V. 1984, M onitoring o f illegal activity and law enforcement in African conservation areas. In: Bell, R.H.V. and McShane-Caluzi Conser\’ation and M’ildlife management in Africa. Proceedings o f a workshop organised by the US Peace Corps at Kasungu National Park, Malawi.
-270-
Bell, R.H.V. 1987, Conservation with a human face; conflict and reconcilation in African land use planning. In: Anderson, D. and Grove R. (eds.) Conservât ion in Africa: people, policies and practice. Cambridge University Press.
Bender, B. 1967, A refinement o f the concept o f household: families, co-residence, and domestic functions. American Anthropologistl 69, 493 - 504.
Berry, V. Petty, C. 1992, The Nyasaland Sur\>ey Papers 1938 - 1943: agriculture, fo o d and health. Academy Books Limited, London.
Bertram, B.C. 1979, Serengeti predators and their social systems. In: Sinclair, A.R.E. and Norton Griffiths, M. Serengeti, dynamics o f an ecosystem. University o f Chicago Press, Chicago.
Bilusa-Baila, 1988, Determinants socio-culturels de la faible fécondité de I’Uele, Zaïre. Actes du Congrès africain. Dakar.
Bingham, S.A. 1987, The dietary assessment o f individuals: Methods, accuracy, new techniques and recommendations. Nutritional Abstracts Review 57.
Biran, A, 1997, Time allocation and domestic work among Maasai women: anevolutionary approach. Ph D Thesis, University o f London.
Blackburn, T.M. Brown V.K. Doube, B.M. Greenwood, J.J.D. Lawton, J.H. and Stork, N.E. 1993, The relationship between abundance and body size in natural animal assemblages. Journal o f Anim al Ecology 62: 519 - 528.
Blaikie, P. and Jeanrenaud, S. 1997, Biodiversity and human welfare. In: Ghimire and Pimbert (eds.) Social change and consen’ation. Earthscan.
Brechin, S.R. West, P C Harmon, D. and Kutay, K. 1991, Resident peoples and protected areas: a framework for inquiry. In: West, P C. and Brechin S.R. (eds.) Resident peoples and national parks: social dilemmas and strategies in international conser\’ation. The University o f Arizona Press, Tucson.
Brockington, B. 1998, The effects o f eviction on pastoralists moved from the Mkomazi Game Reserve, Tanzania. Ph D Thesis, University College London.
Brockington, D. Homewood, K. 1996, Wildlife, Pastoralists and Science: debates concerning Mkomazi Game Reserve, Tanzania. In: Leach, M. and M eams, R. (eds.) The Lie o f the Land: challengitig received wisdom on the A fricanenvironment. The International African Institute, London.
Broten, M.D. and Said, M. 1995, Population trends o f ungulates in and around Kenya’s Masai Mara Reserve. In: Sinclair, A R E. and Arcese, P. Serengeti II: Dynamics, management, and conser\’ation o f an ecosystem. University o f Chicago Press. Chicago.
Brown, G. and Moran, H. 1993, The valuation o f biological diversity. University o f Pennsylvania Press.
- 271 -
Buis, B 1997, The social and economic consequences o f animal crop damage around Garamba National Park, Zaire. Unpublished Masters Thesis, University o f New Hampshire.
B unyard, P. 1989, Guardians o f the Amazon. New Scientist 35: 38 -41.
Burnham, K.P. Anderson, D.R. and Laake, J.L. 1980, Estimation o f density from line transect sampling o f biological populations. Wildlife Monographs, 72, 1- 202.
Burnham, P. 1993, The cultural context o f rainforest conservation in Cameroon. Proceedings o f the Thirty-Sixth Annual M eeting o f the African Studies association, Boston.
Butynski, T.M. and von Richter, W. 1974, In Botswana most o f the meat is wild. Unasylva 26(106): 2 4 - 2 9 .
Calhoun, J.B. 1991, The plight o f the Ik. In: West, P C and Brechin S.R. (eds.) Resident peoples and national parks: social dilemmas and strategies ininternational conser\>ation. The University o f Arizona Press, Tucson.
Caprasse, L. 1959, Dossier PNA A 12/AG. Archive de la Division Régionale des Affaires Fonçières à Bukavu.
Casley, D.J. and Lury, D.A. 1981, D ata collection in developing countries. Clarendon Press, Oxford.
Caughley 1974, Bias in aerial survey. Joutmal o f wildlife management 38(4), 921 - 933.
Caughley, G. 1993, Elephants and economics. Conservation Biology 7(4), 943 - 945.
Caughley, G. and Gunn, A. 1996, Conservation biology in theory and practice. Blackwell Science Ltd. Oxford.
Chambers, R, 1983, Rural DevelopmeiU: putting the last first. Longman Scientific and Technical, Essex.
Chambers, R, 1997, Whose reality counts? Putting the f ir s t last. Intermediate Technology Publications.
Chambers, R. and Longhurst, R, 1986, Trees, seasons and the poor. ID S Bulletin, 17 (3), 44 - 50.
Chambers, R. Longhurst, R and Pacey, A, 1981, Seasonal dimensions to rural poverty. Frances Pinter, London.
Chenney, D.L. and Seyfarth, R.M. 1986, The recognition o f social alliances by vervet monkeys. Anim al Beha\ùour 34, 1722-31 .
-272-
Chenevix-Trench, P, 1997, People and Cattle: agents o f ecological change in a dry montane forest, Samburu District, Kenya. PhD Thesis, University o f London.
Child, B. 1990, Assessment o f wildlife utilisation as a land use option in the semi-arid rangelands o f Southern Africa. In; Kiss, A. Living with M>ildlife: wildlife resource management with local participation in Africa. World Bank Technical Paper N° 130, Africa Technical Department Series, Washington D C.
Child, G. 1996, The wildlife manager’s perspective on tourism. In: African Wildlife Policy Consultation. Overseas Development Administration.
Child, G. 1996, Conservation beyond Yellowstone: an economic framework for wildlife conservation. In: African Wildlife Policy Consultation. Overseas Development Administration.
Coe, M. J. Cumming, D.H. and Phillipson, J. 1976, Biomass and production o f large African herbivore in relation to rainfall and primary and production. Oecologia 22: 341 - 54.
Colchester, M 1997, Salvaging nature: indigenous peoples and protected areas. In: Ghimire, K.B. and Pimbert, M.P. (eds.). Social change and conser\’ation. Earthscan.
Colell, M. Mate, C. and Fa, I.E. 1995, Hunting by M oka Bubis in Bioko: dynamics o f exploitation at the village level. Biodiversity and Conservation 3, 939 - 950.
Colyn, M. Dudu, A. and M ankoto, M. 1987, Exploitation du petit et moyen gibier des forets ombrophiles du Zaïre. Nature et Faune 3, 22 - 39.
Commission Européenne 1993, Situation des population indigènes des fo rê ts denses et humides. CECA-CE-CEEA, Bruxelles.
Corfield, T.F. 1973, Elephant mortality in Tsavo National Park, Kenya. East A frican Wildlife Journal 11: 33 9 - 368.
Cotgreave, P. and Stockley, P. 1994, Body size, insectivory and abundance in assemblages o f small mammals. Oikos 71: 8 9 - 9 6 .
Crawley, M, 1993, G LIM fo r ecologists. Blackwell Scientific Publications.
Cumming, D.H.M. 1975, A field study o f the ecology and behaviour o f warthog. Museum M em oir 7. Salisbury, Rhodesia.
Cumming, D.H.M. 1990, Wildlife products and the market place: a view from southern Africa. Project paper ?io. 13. WWF, Harare.
Cunningham, A. 1990, People and Medicines: The exploitation and Conservation o f traditional Zulu medicinal plants. Proceedings o f the tw>elth plenary m eeting o f AETFAT, Hamburg 979 - 990.
.273.
Curran, P.J. 1983, Multi-spectral remote sensing for estimation o f green leaf area index. Philosophical Iransaciiotis o f the Royal Society o f London. 309 A, 257 - 270.
Currie, D.J. and Fritz, J.T 1993, Global patterns o f animal abundance and species energy use. Oikos 67: 56 - 68.
Dalai Clayton, D.B. and Dent, D. 1993, Surveys, plans and people: a review o f land resource information and its use in developing countries. Environmenial Planning Issues No. 2. International Institute for Environment and Development, London.
Damuth, J, 1981, Population density and body size in mammals. Nature 290, 699 - 700.
de Garine, I. and Koppert, G. 1988, Coping with seasonal fluctuations in food supply among savanna populations: the Massa and Mussey o f Chad and Cameroon. In: de Garine, I. Harrison, G.A. (eds.). Coping with uncertainty in fo o d supply. Clarendon Press, Oxford.
de Maret, P. 1985, The smith’s myth and the origin o f leadership in central Africa. In: Haaland, R. and Shinnie, P. (eds ). African iron working - ancient and traditional. Norwegian University Press, Oslo.
de Merode, E. Hillman-Smith A.K.K. and Gambale, C 1997, Human threats and human solutions for conservation and development in periods o f conflict: Experiences from the Democratic Republic o f Congo. Conservation and Development Forum Series, Gainesville, Florida.
de Merode, E. Khllman-Smith, A.K.K. Mbikongime, G. Obama, M. Panziama, G. Atama To, Kobode, E. 1994, An assessment o f attitudes towards rhino conservation in Garamba National Park and its surrounding reserves. Garamba National Park Project, internal report.
de Merode, E. and Likango, M. 1996, The interpretation o f Landsat MSS data for the production o f a habitat map o f Garamba National Park and its adjacent reserves. Garamba National Park Project, internal report.
de Merode, E. M. Likango, K. Hillman Smith, 1996, Geographic Information Systems for Protected Area Zonation at Garamba National Park, Zaïre. In: Powers, C. Grichner, A. (eds ). GIS and remote sensing fo r natural resource management. Universit}' of Greenwich.
de Saeger 1954, Exploration du Parc National de la Garamba. Institut des Parcs Nationaux du Congo Belge.
de Schlippé, P. 1953, Ecocultures d'Afrique. Editions Terre et Vie, l’Harmattan, Nivelles, Belgique.
de Vos, A. 1977, Game as food: a report on its significance in Africa and Latin America. Unasylva 29(116): 2 - 12.
-274-
de Waal, A. 1988, Famine early warning systems and the use o f socio-economic data. Disaslers, 12, 81 -91.
Deaton, A. 1988, Analysis o f household expenditure. World Bank, W ashington DC
Department o f the Environment, 1992, Policy Appraisal. HMSO.
DfID 1997, UK Department for International Development White Paper, November 1997. HMSO.
Diamond, J.M. 1975, Assembly o f species communities. In; Cody, M.L. and Diamond, J.M. (eds.). Ecology and evolution o f communities. Belknap, Cambridge, Massachussetts.
Diamond, J.M. and Case, T.J. 1986, Community ecology. Harper and Row, New York.
Dobson, A. 1990, An introduction to generalised linear models. Chapman and Hall.
Dorst, J. and Dandelot, P. Larger mammals o f Africa. Collins.
Dublin, H.T. 1991, Dynamics o f the Serengeti-Mara woodlands: an historicalperspective. For. Conserw Hist. 35, 169- 78.
Dublin, H.T. 1995, Vegetation dynamics in the Serengeti-Mara Ecosystem: The role o f elephants, fire, and other factors. In: Sinclair, A R E. and Arcese, P. Serengeti II: Dynamics, management, and conservation o f an ecosystem.University o f Chicago Press. Chicago.
Dublin, H.T. Sinclair, A.R.E. and McGlade, J. 1990, Elephants and fire as causes o f multiple stable states in the Serengeti-Mara woodlands. Journal o f Anim al Ecology 59, 1147 - 64.
Dubois, J-F 1990, Etude de la scolarisation dans le diocèse de Dungu-Doruma. Rapport du diocèse de Dungu-Doruma.
Dubost, G. 1983, Le comportement du Cephalophus monticola Thunberg et C dorsalis Gray, et la place des céphalophes au sein des ruminants. Part I. M ammalia Al, 281 -310 .
Dunbar, R.I.M. and Dunbar, E. 1976, Contrasts in social structure among black- and-white colobus monkey groups. Anim al Behaviour 24, 84 - 92.
Dunn C E . Atkins P.J. and Townsend J.G. 1997, GIS for development: acontradiction in terms? Area 19, 151-159.
Eastman R. \99S,Idrisi. User's Guide. Clarke University, W orcester, USA.
-275-
Eisenberg, J. and Seidensticker, 1976, Habitat, economy and society; some correlations and hypotheses for the neotropical primates. In: I.S. Bernstein and E.O. Smith (eds.). Primate ecology and human origins, pp 215 - 262. Gartland STPM Press, New York.
Eltringham, S. K. 1984, Wildlife resources and economic development. New York: John Wiley and Sons.
Emmons, L.H. 1984, Geographic variation in densities and diversities o f non-flying mammals in Amazonia. Biotropica 16, 210 - 222.
Estes, R.D. 1992, The behaviour guide to African mammals. The University o f California Press.
Evans Pritchard, E. 1972, Oracles, magic and witchcraft among the Azande. Clarendon Press, Oxford.
Evans-Pritchard, E.E. 1971, The Azande. History and Political Institutions.Clarendon Press, Oxford.
Ewer, R.F. and Wemmer, C. 1974, The behaviour in captivity o f the African civet, Civettictis civetta (Schreber). Z Tierpsychol. 34, 359 - 94.
Fa, J.E. and Purvis, in print. Body size, diet and population density in afro-tropical forest mammals: a comparison with neo-tropical species. Journal o f animal ecology.
Fa, J.E. Juste, J.E. Castelo, R. and Perez, J. 1998, The bushmeat trade and the demise o f primates in Bioko Island: what are the alternatives? In: Bushmeat Hunting and African Primates, PSGB.
Fairhead, J. and Leach, M. 1996, Re-thinking the forest savanna mosaic: colonial science and its relics in West Africa. In: Leach, M. and Meams, R. (eds ). The lie o f the land: challenging received Mùsdom on the African environment. African Issues, Heinemann.
Falconer, J. and Arnold, J.E.M. 1991, H ousehold fo o d security and forestry: an analysis o f socio-economic issues. Food and Agricultural Organisation, Rome.
Falconer, J. and Koppell, C.R.S 1990, 77?e major significance o f 'm inor' fo res tproducts: the local use and value o f forests in the west African H um id Forest Zone. Food and Agricultural Organisation, Rome.
F AO 1989, Community forestry: participatory assessment, monitoring andevaluation. Food and Agricultural Organisation, Rome.
Feer, F. 1993, The potential for sustainable hunting and rearing o f game in tropical forests: In: Hladik, C.M. et a l (eds). Tropical forests, people and foo d : biocultural interactions and applications to development. MAB series 13. UNESCO Paris and Parthenon Publishing Group, UK.
-276-
Feit, H. 1973, The ethno-ecology o f the Waswanipi Cree, or how hunters can handle their resources. In: Cox, B. (ed.) Cultural Ecology. Toronto: McClelland and Stewart.
Fienburg, S.E. 1979, The analysis o f cross-classified categorical data. The Massachusetts Institute o f Technology Press, Cambridge, Massachesetts.
Fitzgibbon, C D Mogaka, H. and Fanshaw J.H. 1995, Subsistence hunting in Arabuko-Sokoke Forest, Kenya and its effects on mammal populations. Consei'vation Biology 9(5), 1116- 1126.
Fleuret, A, 1979, M ethods for evaluation o f the role o f fhiits and wild greens in Shambaa diet: a case study. M edical Anthropology 3, 249 - 269.
Frank, L.G. 1986, Social organisation o f the spotted hyena {Crocuta crocuta), 1: Demography. Anim al Behcrviour 34, 1510 - 27.
Freese, C.H. Heltne, P.G. Castro, N.R. and Whitesides, G. 1982, Patterns and determinants o f monkey densities in Peru and Bolivia, with notes on distributions. InternationalJoiirnal o f Prim atology,2, 53 - 90.
Gartland, S. 1997, Every man for himself and God against all: History, social science and the conservation o f Nature. Proceedings o f the WWF A nnual Conference 1997.
Geertsema, A. 1976, Impressions and observations on serval behaviour in Tanzania, East Africa. M am malia AQ, 13 - 19.
Ghimire, K 1997, Conservation and social development: an assessment o f W olong and other panda reserves in China. In: Ghimire, K.B. and Pimbert, M.P. (eds.). Social change and conservation. Earthscan.
Ghimire, K.B. 1991, Parks and People: .Livelihood issues in National Parksmanagement in Thailand and Madagascar. Discussion Paper 29. United Nations Research Institute for Social Development, Geneva.
Ghimire, K.B. and Pimbert, M.P. (eds.). 1997, Social change and conservation. Earthscan.
Gibson, C.C. Marks, S.A. 1995, Transforming rural hunters into conservationists: an assessment o f community-based wildlife management programs in Africa. World Development, 23(6): 941 - 957.
GNPP 1995, Draft framework document for the development o f a management plan for Garamba National Park, Zaire. Garamba National Park Project, internal report.
GNPP 1997, Annual report. Internal document, Garamba National Park Project.
-277-
Godoy, R. and Bawa, K. 1993, The economic value and sustainable harvest o f plants and animals from the tropical forests: assumptions, hypotheses, andmethods. Economic Botany 41 (3), 215 -219 .
Godoy, R. Brokaw, N. Wilkie, D. 1995, The effect o f income on the extraction o f non-timber tropical forest products: model, hypotheses, and preliminaryfindings from the Sumu Indians o f Nicaragua. Human Ecology 23 (1), 29 - 52.
Goodall, J. 1983, Population dynamics in one population o f free living chimpanzees in the Gombe National Park, Tanzania. Primates 21, 545 - 49.
Gosling, L.M. 1974, The social behaviour o f Coke’s hartebeest {Alcelaphus bnselaphus cokei). In: Geist, V. and Walthur, F.R. (eds.). The behaviour o f ungulates and its relation to management. lUCN Publ. New Series No. 24. Morges, Switzerland.
Gott, R 1996, Che Guevara and the Congo. New> Left Review 220: 3 - 35.
Grandin, B. 1988, Wealth ranking in smallholder communities: a f ie ld manual. Intermediate Technology Publications.
Grove, R.H. 1990, Colonial conservation, ecological harmony and popular resistance: towards a global synthesis. In: Mackenzie, J. (ed.) Imperialism and the natural world. New York: Manchester University Press.
Guijt and Shah, M. (eds.) 1998, M yth o f the community: Gender dimensions o f participatory development. Intermediate Technology Publications.
Guijt, I. 1992, The elusive poor: a wealth o f ways to find them. RRA Notes 15, 7 - 13.
Guyer, J. 1993, Wealth in people and self-realisation in Equatorial Africa. M an 28, 243 - 65.
Hall, K.R.L. and Gartlan, J.S. 1965, Ecology and behaviour o f the vervet monkey, Cercopithecus aethiops, Lolui Island, Lake Victoria. Proceedings o f the Zoological Society o f London 17, 37 - 56.
Hall, K.R.L. Boelkins, R.C. and Goswell, M.J. 1965, Behaviour o f Patas,Eiythrocebus patas, in captivity, with notes on the natural habitat. FoliaPrimatol. 3, 2 2 - 4 9 .
Hames, R. and Vickers, W, 1983, Adaptive responses o f Native Amazonians. Academic Press, New York.
Hanks, J. Stanley-Price, R.W. and Wrangham W. 1969, Some aspects o f theecology and behaviour o f the defassa waterbuck {Kobus defassa) in Zambia. Mammelia 33, 473 - 97.
Harris, T. Weiner, D. Warner, T. and Levin, R. 1995, Persuing social goalsthrough participatory GIS? Redressing South Africa’s historical political
-278-
ecology. In: Pickles, J. (ed.) G round truth: the social implicatiotis o fgeographic information systems. New York, Guildford Publications.
Hart, T.B. Hart J.A. and Hall, J.S. 1997, Conservation in a declining nation state: a view from eastern Zaire. Conser\’ation Biology 10(2), 685 - 686.
Hart, T.E. Hart, J.A. 1986, The ecological basis o f hunter-gatherer subsistence in African rain forests: the Mbuti o f eastern Zaire. Human Ecology, 14: 29 - 55.
Hendrichs, H. 1971, Observations on a population o f bohor reedbuck, Redunca redunca {?dX\diS 1767). Z Tierpsychol 38, 44 - 54.
Hillman Smith, A.K.K. de Merode, E. Nicholas, A. Buis, B. and Ndey, A. 1995, Factors affecting elephant distribution at Garamba National Park and surrounding reserves, Zaire, with a focus on elephant-human conflict. Pachyderm 19, 3 9 - 4 8 .
Hillman, J.G. 1986, Aspects o f the biology o f the bongo antelope, Tragelaphus eurycerus Ogilby 1837, in southwest Sudan. Biological Conservation 38, 255 -72.
Hillman-Smith, A.K.K. 1997, Garamba National Park, Research and M onitoring Programme Annual Report. Internal Report.
Hillman-Smith, A.K.K. and Ndey, A. 1996, Eco-classification o f the habitats o f Garamba National Park and surrounding reserves. Garamba National Park Project, internal report.
Hillman-Smith, A.K.K. 1989, Ecosystem Resource Inventory. Unpublished manuscript o f the Garamba National Park Project.
Homewood, K. Kiwasila, H. and Brockington, D. 1997, Conservation with development? The case o f Mkomazi, Tanzania. Report to ESCOR, o f the Department for International Development, May 1997.
Homewood, K. and Rodgers, W.A. 1991, M aasailand ecology: Pastoralistdevelopment and wildlife conservation in Ngongoro, Tanzania. Cambridge University Press, Cambridge.
Hunter, M.L. Hitchcock, R.K. and Wyckoff-Baird, B, 1990, Women and wildlife in Southern Africa. Conservation Biology, 4(4), 448 -451.
Hurlbert, S. 1984, Pseudoreplication and the design o f ecological field experiments. Ecological M onographs 54, 187-211 .
Inamdar, A. 1996, The ecological consequences o f elephayit depletion. PhD Thesis. University o f Cambridge.
International Institute for Environment and Development 1993, W hose Eden? An overview o f community approaches to wildlife management.
-279-
International Institute for Environment and Development, 1993, Whose Eden?, IIED London.
Isaacman, A. and Roberts. R. (eds.), 1995, Codon, colonialism and social history in sub-Saharan Africa. Heinemann.
Isaaks, E.H. and Srivastava, M R. 1989, A pplied Geostatistics. Oxford University Press, Oxford.
lUCN 1988, Le droit de la forêt, de la fa u n e et de la flo re dans les pays de la fo rê t dense humide africaine. Programme utilisation rationelle des écosystèmes forestiers en Afrique centrale. lUCN, Suisse.
rUCN 1994, Guidelines fo r protected area management categories. lUCN WCMC.
Jachman, H. and Billiouw, M. 1997, Elephant poaching and law enforcement in the central Luangwa Valley, Zambia. Jo tm ia l o f Applied Ecology 34, 233 - 244.
Jewsiewicki, B. 1983, Rural society and the Belgian colonial economy. In; Birminghm, D. and Martin, P.M. H istory o f Central Africa. Longman Group, UK.
Johns, A.D. and Skorupa, J.P. 1987, Responses o f rain-forest primates to habitat disturbance: A review. InternationalJournalofPrim atology, 8, 157-191.
Johnston, D. 1998, Geographic Information Systems in Ecology. Blackwell Scientific Publications.
Juste, J. Fa, J.E. Perez Del Val, J. and Castroviejo, J. 1995, M arket dynamics o f bushmeat species in Equatorial Guinea. Journal o f Applied Ecology 32(3), 454 - 467.
Kent, M. and Coker, P. 1992, Vegetation description and analysis: a practical approach. John Wiley and sons.
Kingdon, J.S. 1977, East African mammals, vol. 3a (carnivores). New York, Academic Press.
Kingdon, J.S. 1980, East A frican mammals, vol. 3b (large herbivores). New York, Academic Press.
Kingdon, J.S. 1982, East African mammals, vol. 3c and d (bovids). New York, Academic Press.
Kolasa, J. 1989, Ecological systems in hierarchical perspective: breaks incommunity structure and other consequences. Ecology 70, 36 - 47.
Kruuk, H. 1972, The spotted hyena. University o f Chicago Press, Chicago.
-280-
Lambin, E. 1994, Modelling deforestation processes; A review. Trees Series B: Research report no. 1. European Commission, Joint Research Centre.
Lamprey, H.F. 1963, Ecological separation o f the large mammal species in the Tarangire Game Reserve, Tanganyika. East African Wildlife Journal 1, 63 -92.
Laurentin, R 1974, Fécondiié en Afrique noire: maladie et conséquences sociales. Masson et Cie, Paris.
Laws, R M 1970, Biology o f African elephants. Sci. Prog. Oxf. 58, 251 - 62.
Laws, R.M. 1984, Hippopotamuses. In: Macdonald, D.W. (ed.). The encyclopedia o f mammals. 506 - 11. Facts on File: New York.
Leach, M. 1991, Refugee - host relations in local perspective: food security and environmental implications o f the Liberian influx into rural communities o f Sierra Leone, 1990 - 1991. Report to the MacArthur Project. Institute o f Development Studies.
Leach, M. and Mearns, R. (eds ). 1996, The lie o f the land: challenging received wisdom on the African environment. African Issues, Heinemann.
Leader-Williams, N. and Albon, S.D. 1988, Allocation o f resources for conservation. Nature, 336, 533 -535.
Leader-williams, N. Albon, S.D. and Berry, P.S.M. 1990, Illegal exploitation o f black rhinoceros and elephant populations: patterns o f decline, lawenforcement and patrol effort in the Luangwa Valley, Zambia. Journal o f Applied Ecology, 27, 1055 - 1087.
Lee, R.B. 1979, The IKung San: men, women and work in a forag ing society. Cambridge: Cambridge University Press.
Leuthold, B.M. and Leuthold, W. 1972, Food habits o f giraffe in Tsavo National Park, Kenya. East A frican Wildlife Journal 10, 129 - 4L
Leuthold, B.M. and Leuthold, W. 1978, The ecology o f the giraffe in Tsavo East National Park, Kenya. East Afin can Wildlife Journal 16, 1 - 20.
Leuthold, W. 1966, Variations in territorial behaviour o f Uganda kob, Adenota koh thomasi (Neumann 1896). Behcnnour 27, 214 - 57.
Lewis D M. and Alpert P. 1997, Trophy hunting and wildlife conservation in Zambia. Conservation Biology' 11(1), 59 - 68.
Lewis, D. Mwenya, A. Kaweche, G.B. 1990, African solutions to wildlife problems in Africa: insights from a community-based project in Zambia. Unasylva161(41): 5 4 - 56.
-281
Lewis, D. M. Phiri A. 1995, Wildlife management by snaring: household needs and lessons for consen’ation planners. Unpublished manuscript.
Likaka, O. 1995, Forced cotton cultivation and social control in the Belgian Congo. In: Isaacman, A. and Roberts. R. Cotton, colonialism and social history in sub-Saharan Africa. Heinemann.
Ludwig, J.A. and Reynolds, J.F. 1988, Statistical Ecology: a prim er o f m ethods and computing. John Wiley and Sons, Inc.
Lutz, E. and Caldecott, J. 1996, Decentralisation and biodiversity conservation. World Bank.
Luxmore, R A 1994, Impact on conservation. In Hudson et a l (eds). Wildlife production systems. Cambridge.
Lynch, O.J. and Alcorn, J.B. 1994, Tenurial rights and community-based conservation. In: Western, D. Wright, R.M. and Strum, S.C N aturalConnections: perspectives in community based wildlife management. Island Press.
MacGafFey, J. 1991, The real economy in Zaïre. The University o f Pennsylvania Press.
Mackie, C. 1984, A preliminary evaluation o f conservation developments in Garamba National Park, Zaïre. Report to lUCN, WWF
Malaisse, F. and Parent, G 1985, Edible wild vegetable products o f the Zambezian woodland area: a nutritional and ecological approach. Ecology o f F ood and Nutrition 18, 43 - 82.
Manly, B. 1985, The statistics o f natural selection on anim al populatiojis. Chapman and Hall, London.
Margoluis, R. and Salafsky, N. 1998, M easures o f Success: a systematic approach to designing, managing and monitoring community-oriented conservation projects. Biodiversity Support Programme: Adapative Management Series, Washington.
Marks, S. A. 1977, Buffalo movements and accessibility to a community o f hunters in Zambia. Exist African Wildlife Journal 15: 2 5 1 -6 1 .
Marks, S. A. 1984, The Im perial Lion: human dimensions o f wildlife management in Central Africa. Boulder, CO: Westview Press.
Marks, S.A. 1988, Small scale hunting economies in the tropics. In Hudson et a l (eds). Wildlife production systems. Cambridge.
Marks, S.A. 1994, Local hunters and wildlife surveys: a design to enhance participation. African Journal o f Ecology 32 (3).
-282-
Marr, J.W. 1971, Individual dietary surveys: Purpose and methods. W orld Review o f nutrition and dietetics, Vol 13, pp. 105 - 164.
Martin, G.J. 1995, Efhnobotany. Chapman and Hall.
Martin, P.M. 1983, The violence o f empire. In: Birminghm, D. and M artin, P.M. History o f Central Africa. Longman Group, UK.
Mather, P. 1987, Computer processing o f remotely-sensed images. John Wiley and Sons, New York.
Mauss, M. 1935, Les techniques du corps. Journal de Psychologie 32(3-4): 271 -93.
Mauss, M. 1952, The Gift. Clarendon Press, Oxford.
Mcgee, R. 1997, Ethnography and rapid appraisal in doctoral research on poverty. Notes on Participatoiy Learning and Action 28, 55 - 58.
Mckey, D. 1978, Soils, vegetation and seed eating by black colobus monkeys. In: Montgomery, G.G. (ed.). The ecology o f arboreal folivores. 423 - 39. Smithsonian Institute Press. Washington, D C
McNaughton, S.J. and Banyikwa, F.F. 1995, Plant communities and herbivory. In: Sinclair, A.R.E. and Arcese, P. Serengeti II: Dynamics, management, and conser\’ation o f an ecosystem. University o f Chicago Press. Chicago.
Metcalfe, S. 1995, The Zimbabwe Communal Areas Management Programm e for Indigenous Resources (CAMPFIRE). In: Western, D. Wright, R.M. and Strum, S.C. Natural Connections: perspectives in community based wildlife management. Island Press.
Milner-Gulland, E.J. Leader-Williams N. 1992, A model o f incentives for the illegal exploitation o f black rhinos and elephants: poaching pays in Luangwa Valley, Zambia. Journal o f Applied Ecology 29: 388 - 401.
Mittermeier, R .A 1987, Effects o f hunting on rain forest primates. In: Mittermeir, R.A. and Marsh, C.M. (eds.) Primate conservation in the tropical rain forest. Alan R. Liss, New York.
Mloszewski, M.J. 1983, The behcanour and ecology o f the African buffalo. Cambridge University Press. Cambridge.
Moorehead, R and Diakité M. 1991, Le Parc National de Zakouma et les communautés habitants les zones limitrophes du Parc: proposition pourr Avenir. CARE UK, London.
Moorehead, R. and Hammond, T. 1992, An assessment o f the rural development programme o f the Korup National Park Project. CARE UK, London.
-283-
Morrison, M.L. Marcot, B.G. and Mannon, R.W. 1992, W ildlife-hahitat relationships: Concepts and applications. The University o f Wisconsin Press.
Moss, C.J. and Poole, J. 1983, Relationships and social structure o f African elephants. In Hinde, R. (ed.). Primate social relationships: an integrated approach. Blackwell, Oxford.
Mukherjee, N. 1992, Villagers’ perceptions o f rural poverty through the mapping methods ofPR A . RRA Notes 15, 7 - 13.
Mukohya, V. 1991, Import and export in the second economy in North Kivu. In; MacGaffey, J. 1991, The real economy in Zame. The University o f Pennsylvania Press.
Munthali, S. 1996, In: Policy, financial, legislative and institutional arrangements. African Wildlife Policy Consultation. Overseas Development Administration.
Murombedzi, J. 1991, Decentralising common property resources management: a case study o f the Nyaminyami district council o f Zimbabwe’s wildlife management Programme. IIED Drylands Issues Paper, 32. International Institute for Environment and Development, London.
Murphree, M.W. 1990, Community conservation and wildlife management outside protected areas - Southern African experiences and perspectives: implications for policy formation. AWF Report.
Murphree, M.W. 1996, Approaches to community participation. In: AfricanWildlife Policy Consultation. Overseas Development Administration.
Nash, R. 1970, The American invention o f national parks. American Quarterly 22 (3), 2 2 - 4 1 .
Nicholas, A. and Ndey, A. 1995, The residts o f a transect exercise in the Domaines de Chasses surrounding Garamba National Park, Zaïre. Technical Report, Garamba National Park Project, IZCN, WWF.
Nicholson, A.J. 1954, An outline o f the dynamics o f animal populations. Australian Journal o f Zoology 2: 9 - 65.
Nkera, R. and Grundfest Schoepf, B. 1991, Unrecorded trade in southwest Shaba and across Zaire’s southern borders. In: MacGaffey, J. 1991, The realeconomy in Zaire. The University o f Pennsylvania Press.
Norton-Griffiths, M. 1978, Counting animals. African Wildlife Foundation.
NRI 1997, Literature review o f wildlife policy and legislation. Natural Resources Institute. Chatham.
Nzabandora, M. 1984, Les expropriations fonçières effectuées au projet du P.N.A. et les réactions des paysans au nord Kivu (Zaïre). Cahiet's du CERPU 1: 41 - 98.
-284-
Offerman, P P M 1940, Contribution à l’étude écologique de al région de Gangala na Bodio. Service des Eaux et Forêts, Chasse et Pêche, Congo Belge.
Olivier, R.C.D. and Laurie, W.A. 1974, Habitat utilisation by hippopotamuses in the Mara River. East A frican Journal o f Ecology 12, 3 2 - 4 8 .
Oppenheim, A, 1992, Questionnaire design, inter\newing and attitude measurement. Pinter Publications, London.
Owen-Smith, R.N. 1988, Megaherbivores: the influence o f very large body size on ecology. Cambridge University Press, Cambridge.
Packer, C. and Pusey, A.E. 1982, Cooperation and competition within coalitions o f male lions: kin selection or game theory? Nature 296, 740 - 42.
Pearce, D. 1996, An economic overview o f wildlife and alternative land uses. In: African Wildlife Policy Consultation. Overseas Development Administration.
Pel lew, R A. 1984a, Giraffe and okapi. In: Macdonald, D.W. (ed.). The encyclopedia o f mammals. 534 - 41. Facts on File: New York.
Pellew, R. A. 1984b, The feeding ecology o f a selective browser, the giraffe {Giraffa Camelopardalis). Journal o f the Zoological Society o f London 202, 5 7 - 81 .
Pelto, P.J. and Pelto, G.H. 1978, Anthropological research: the structure o finquiry. Cambridge University Press, Cambridge.
Peters 1983, The ecological implications o f body size. Cambridge University Press, Cambridge.
Pimbert, M. and Gujja, B. 1997, Village voices challenging wetland management policies: experiences in participatory rural appraisal from India and Pakistan. Nature and Resources 33(1): 3 4 - 4 1 .
Pimbert, M. P. and Pretty, J.N. 1995, Parks people and professionals: pu tting “participation’' into protected area management. United Nations Research Institute for Social development. International Institute for Environment and Development, World Wide Fund for Nature. Discussion Paper 57.
Plumbtre, A.J. Bizumuremyi, J-B. Uwimana, F. and Ndaruhebeye, J-D. 1997, The effects o f the Rwandan civil w ar on poaching o f ungulates in the Parc National des Volcans. 0 /y r 31 (4), 265 -273.
Plumptre, A.J. and Harris, S. 1995, Estimating the biomass o f large mammelian herbivores in a tropical montane forest: a method o f faecal counting that avoids using a ‘steady state’ system. Journal o f Applied Ecology 32, 111 - 120.
Prins, H.H.T. and Reitsma J.M. 1989, Mammelian Biomass in an African equatorial rain forest. Journal o f Anim al Ecology 58, 851 - 861.
-285-
Rasker, R. Martin, M Y. Johnson, R.L. 1993, Economics; theory versus practice in wildlife management. Consen^aüon Biology' 6(3), 338 - 349.
Redford, K. 1992, The empty forest. Bioscietice 42, 412 - 422.
Reining, C. 1966, The Zatide Scheme: an anthropological case study o f economic development in Africa. Northwestern University Press, Evanston Illinois.
Ribot, J.C. 1998, Theorizing access: forest profits along Senegal’s charcoalcommodity chain. D evelopment and Change 29, 307-341 .
Robinson, J. and Redford, K. 1986, Body size, diet and population density o f neotropical forest mammals. The Am erican Naturalist 128 (5), 665 -680.
Robinson, J. and Redford, K. 1991, Subsistence and commercial uses o f wildlife in Latin America. In: Robinson, J. and Redford, K, (eds.) Neotropical w’ildlife use and conser\>ation. The University o f Chicago Press.
Robinson, J. and Redford, K. 1991, Sustainable harvest o f Neotropical forest mammals. In: Neotropical M>ildlife use and consei'vation. Robinson, J. Redford, K. (eds.) Chicago. University o f Chicago Press.
Romaniuk, R. 1980, Increase in natural fertility during the early stages o f modernisation: evidence from an African case study, Zaire. Popidation Studies 34(2), 293 - 310.
Rose, M.D. 1978, Feeding and associated positional behaviour in black and white colobus monkeys (Colobus guereza). In: Montgomery, G.G. (ed.). Theecology o f arboreal folivores.. Smithsonian Institute Press. Washington, D C pp. 423 - 39.
Salmon, P. 1988, La chefferie Wando: un monstre administratif. CEMUBAC,Université Libre de Bruxelles, Bruxelles.
Sangbalenze, chef (Ungua Moke), 1995, Appercu du Chef du Groupement Ungua, Sangbalenze, à la Délégation du WWF présente à Nagero le 18 Avril 1996.
S arch, M. 1992, Wealth ranking in the Gambia: Which households participated in the FITT Programme? RRA Notes 15, 7 - 1 3 .
Sauter, G. 1975, Une enquête exemplaire: l’emploi du temp agricole en pays Zandé. Etudes Rurales 60, 73 - 88.
Savage, J.M. Woodford, M.H. and Croze, H. 1976, Report on a mission to Zaïre. FAO W/K1593 KEN/71/526 - ZAI/70/001.
Schaller, G. 1972, Predators o f the Serengeti. Natural History 81, 6 0 - 69.
Scheafer, S. 1992, The ‘beans gam e’ - experiences with a variation o f wealth ranking in the Kivu Region, Eastern Zaire. RRA N otes 15, 7 - 1 3 .
-286-
Scoones, I. Melnyk, and M. Pretty, J. 1992, The hidden Harvest. World Wide Fund for Nature, Swedish International Development Agency, International Institute for Environment and Development.
Silva, M. and Downing, J.A. 1995, The allometric scaling o f density and body mass: a nonlinear relationship for terrestrial mammals. The American Naturalist 145(5), 704- 727.
Sinclair, A.R.E. 1995, Population limitations o f resident herbivores. In: Sinclair, A.R.E. and Arcese, P. Serengeti II: Dynamics, management, and conservation o f an ecosystem. University o f Chicago Press. Chicago.
Sinclair, A.R.E. 1995, Equilibria in plant-herbivore interactions. In: Sinclair, A.R.E. and Arcese, P. Serengeti II: Dynamics, management, and conservation o f an ecosystem. University o f Chicago Press. Chicago.
Sinclair, A.R.E. and Arcese, P. 1995, Serengeti 2: dynamics, management andconservation o f an ecosystem. University o f Chicago Press.
Sinclair, A.R.E. 1977, The African buffalo. The University o f Chicago Press. Chicago.
Singer, A. 1972, Ethnography and ecosystem: a Zande example. In: Singer, A. (ed.) Zande Themes: Essays presented to E.E. Evans Pritchard. Cambridge.
Skinner, J.D. Braytenback, G.J. and Maberly, C.T.A. 1976, Observations on the ecology and biology o f bushpig {Potamochoerus porcus) in the northern Transvaal. S. Afr. J. Wildl. Res. 6, 123 -28.
Smith, E. A. 1983, Anthropological applications o f optimal foraging theory: acritical review. Current Anthropology 24: 625-51.
Smith, F. and Smith, A.K.K. 1997, Garamba National Park Project, Annual Report. Report to WWF.
Sparano, F. 1931, Culture et commerce du coton. Bulletins Agricoles du Congo Belges 22(3), 412 - 430 .
Spinage, C A 1982, A territorial antelope: the Uganda waterbuck. New York: Academic Press.
Stearman, A.M. 1990, The effect o f settler incursion on fish and game resources o f the Yuqui, a native Amazonian society o f eastern Bolivia. Human organisation 49, 373 - 385.
Steinich, M. 1996, Participatory shaping o f institutional landscapes. Notes on Participatory Learning and Action 27, 52 - 56.
Stephens, D. and Krebs, J. 1978, Foraging Theory. Princeton. PrincetonUniversity Press.
-287-
Stiner, M. 1991, The ecology o f choice: procurement and transportation o f animal resources by Upper Pleistocene hominids in West-Central Italy. Ph.D. dissertation. University o f New Mexico, Albuquerque, N.M.
Strouvens, L. and Piron, P. 1943, Codes ei lois du Congo Belge. Textes annotés d ’après les rapport du Conseil Colonial, les instructions officielles et la Jurisprudence de Tribunaux. Leopoldville: Edition de Code Louwers.
Sullivan 1998, people, p lants and practice in drylands: socio-political andecological dimensions o f resource use hy Damara farm ers in north-west Namibia. Unpublished Ph.D. University College London.
Suzuki, A. 1969, An ecological study o f chimpanzees living in savanna woodland. Primates 10, 103 -48.
Swanson, T. and Barbier, E. 1991, Economics fo r the wilds: wildlife, wildlands, diversity and development. Earthscan Publications.
Taylor, R. 1984, Predation. New York. Chapman and Hall.
Tchamba, M.N. 1995, The problem elephants o f Kaélé: a challenge for elephant conservation in northern Cameroon. Pachyderm 19, 26 - 32.
ter Braak, C.J.F. and Looman, C.W.N. 1995, Regression. In: Jongman, R.H.G. terBraak, C.J.F. and van Tongeren, O.F.R. (eds.). Data analysis in community and landscape ecology. Cambridge University Press.
ter Braak, C.J.F. 1995, Ordination. In: Jongman, R.H.G. ter Braak, C.J.F. and van Tongeren, O.F.R. (eds ). Data analysis in community and landscape ecology. Cambridge University Press.
Thouless, C R 1994, Conflicts between humans and elephants in northern Kenya. Oiyx2%, 119-127.
Toulmin, C, 1986, Access to food: dry season strategies and household size amongthe Bambarra o f Central Mali. ID S Bulletin 17, 58 -66.
Trefon. T. 1997, City dwellers and the central African Tropical Forest: resource use and perceptions. Avenir des Peuples des Forêts Tropicales. Preliminary Report.
Troupin, G. 1956, La phytosociologie du Parc N ational de la Garamba. Musée Royale d ’Afrique Centrale, Tervuren, Belgique.
Turnbull, C.H. 1972, The M ountain People. Simon and Schuster, New York.
UNDP 1997, Rehabilitation of Protected Areas in the Democratic Republic of the Congo. Proposal for Review: Global Environment Facility.
Vaughan, M. 1987, The story o f an African fam ine: gender and fam ine in twentieth century Malawi. Cambridge University Press.
-288-
Verschuren, J. 1958, Ecologie et biologie des grands mammifères. In; de Saeger, H. Exploration des Parc Nationaux du Congo Belge. Institut des Parc Nationaux Belges.
Verschuren, J. 1987, Inventaire de la faune du Parc National de la Garamba. Biologie 57; 17-29.
Verschuren, J. 1958, Ecologie et biologie des grands mammifères. \n. Exploration du Parc National de la Garamba. Edited by de Seager, H. Institut des Parcs Nationaux du Congo Belge. Brussels.
Vickers, W.T. 1988, Game depletion hypothesis o f Amazonian adaptation: data from a native community. Science 239: 1521 -22.
Vickers, W.T. 1980, An analysis o f Amazonian hunting yields as a function o f settlement age. In: Vickers, W.T. and Kensinger, K.M. (eds.) WorkingPapers on South American Indians. Bennington, Vermont.
Vincent, J. and Binkley, C, 1991, Forest-based industrialization: a dynamicperspective. Harvard Institute for International Development. Development and Discussion Paper No. 389.
Walker, B.H. 1981, Is succession a viable concept in African savanna ecosystems? In: West, D C. Shugart, H.H. and Botkin, D.B. Forest succession concepts and applications. Springer-Verlag, New York.
Waser, P.M. 1974, Spatial association and social interactions in a “solitary” ungulate: the bushbuck (Pallas). Z. Tierspychol. 37, 24-36.
Waser, P.M. 1975, Diurnal and nocturnal strategies o f the bushbuck Tragelaphus scriptiis. East African Wildlife Journal 13, 49 - 63.
WCMC 1992, Global Biodiversity: status o f the earth's living resources. Chapman and Hall, London.
Weaver, P. 1979, Agri-silviculture in tropical America. Unasylva, 7>\{\16), 2 - 1 2 .
Wemmer, C.M. 1977, Comparative ethology o f the large spotted genet (Genetta tigiina) and some related viverrids. Smiths. Contrib. Zool. 239, 1 -93.
West, P C. and Brechin S.R. (eds.) 1994, Resident peoples and national parks: social dilemmas and strategies in international conservation. The University o f Arizona Press, Tucson. W estern 1994.
Western, D. 1994, Ecosystem conservation and rural development: the case o f Amboseli. In: Western, D. Wright, R.W. and Strum, S.C. (eds.) 1994,Natural Connectiotis. University o f Chicago Press.
Western, D. Wright, R.W. and Strum, S.C. 1994, Natural Connections. University o f Chicago Press.
-289-
WFP and UNHCR 1994, Report on the joint mission by UNHCR and WFP to assess the food aid requirements o f Sudanese and Ugandan refugees in Haut Zaïre, 25 January - 5 February 1993. WFP, UNHCR, internal report.
White, F 1983, The vegetation o f Africa: a descriptive memoir to accompany the UNESCO/AETFA T/UNSO vegetation map o f Africa. UNESCO.
White, L.J.T. 1992, Vegetation history and logging disturbance: effects on rain fo rest mammals in the Lopé R esen’e, Gabon. PhD thesis. University o f Edinburgh.
White, L.J.T. 1994, Biomass o f rain forest mammals in the Lopé Reserve, Gabon. Journal o f Anim al Ecology 63, 499 - 512.
Wickramasinghe, A. Ruiz Pérez, M. and Blockhus, J, 1996, Nontimber forest product gathering in Ritigala Forest (Sri Lanka); Household strategies and community differentiation. Hiwran Ecology, 24 (4), 493 - 519.
Wilkie, D.S. and Finn, J.T. 1990, Slash-bum cultivation and mammal abundance in the Ituri Forest, Zaïre. Biotropica 22, 90 - 99.
WWF 1996, Indigenous Peoples and Conservation: WWF statement o f principles. A WWF International Position Paper.
WWF, lUCN, UNEP 1980, The World Conservation Strategy. Gland, Switzerland: The World Conservation Union.
Yost, J.A. Kelley, P.M. 1983, Shotguns, blowguns and spears: the analysis o f technological efficiency. Hames, R.B. Vickers, W.T. (eds). Adaptive responses o f native Amazonians. Academic Press, New York.
Young, H, 1992, Food Scarcity and Famine: assessment and response. Oxfam Practical Health Guide No. 7. Oxfam Publications.
Young, M.C. 1984, Zaire: is there a state? In: Jewsiewicki, B. (ed.) EtatIndépendant du Congo, République Démocratique du Congo, République du Zaïre? Edition SAFI Press, Quebec.
-290-
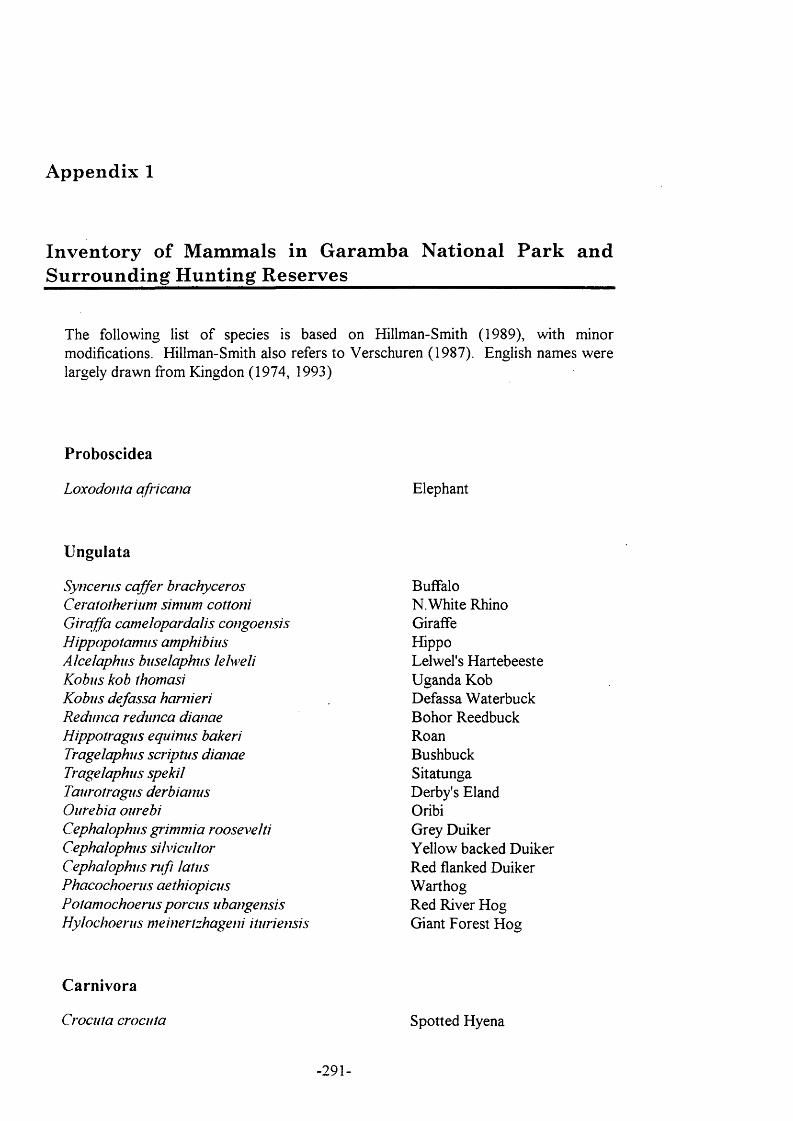
A ppendix 1
Inventory o f M am mals in Garamba N ational Park and Surrounding H unting R eserves
The following list o f species is based on Hillman-Smith (1989), with minor modifications. Hillman-Smith also refers to Verschuren (1987). English names were largely drawn from Kingdon (1974, 1993)
Proboscidea
LoxodofUa qfricŒia Elephant
Ungulata
Syncem s caffer brachyceros Ceraiotherium simum cottoni Giraffa Camelopardalis cojigoemis Hippopotamus amphibius Alcelaphus bnselaphus lehveli Kobus kob thomasi Kobus defassa harnieri Redutica redimca dianae Hippotragus equimis bakeri Tragelaphus scriptus dianae Tragelaphus spekil Taurotragus derbianus Ourebia ourebiCephalophus giim m ia roosevelti Cephalophus silvicultor Cephalophus rufi latus Phacochoerus aethiopicus Potamochoerus porcus uba?igensis Hylochoerus meinertzhageni ituriensis
BuffaloN. White RhinoGiraffeHippoLelwel's Hartebeeste Uganda Kob Defassa W aterbuck Bohor Reedbuck Roan Bushbuck Sitatunga Derby's Eland OribiGrey Duiker Yellow backed Duiker Red flanked Duiker W arthog Red River Hog Giant Forest Hog
Carnivora
Crocuta crocuta Spotted Hyena
-291-
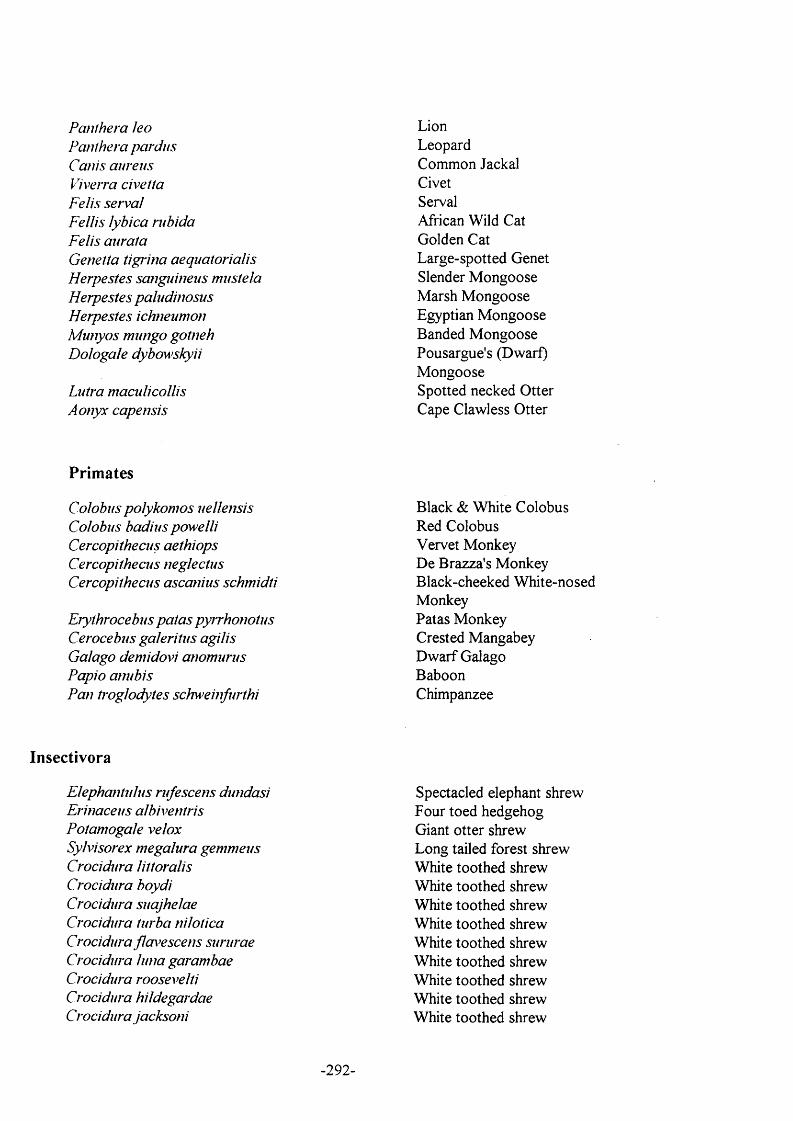
Pœithera leo Patilhera pardus Caiiis aureus Viverra civeUa Felis serval Fellis lybica rubida Felis auralaG em tta tigiina aequaiorialis Herpestes sanguineus mustela Herpestes paludinosus Herpestes ichneumon M unyos mungo gotneh Dologale dyboM>skyii
Luira maculicollis Aonyx capensis
Lion Leopard Common Jackal Civet ServalAfrican Wild Cat Golden Cat Large-spotted Genet Slender M ongoose Marsh M ongoose Egyptian M ongoose Banded M ongoose Pousargue's (Dwarf) M ongooseSpotted necked Otter Cape Clawless Otter
Primates
Colobus polykomos uellensis Colobus badius powelli Cercopithecus aethiops Cercopithecus neglectus Cercopithecus ascanius schmidti
Eiythrocebus patas pyrrhonotus Cerocebus galeritus agilis Galago demidovi anomurus Papio anubisPan troglodytes schM>einfurthi
Black & White ColobusRed ColobusVervet MonkeyDe Brazza's MonkeyBlack-cheeked White-nosedMonkeyPatas MonkeyCrested MangabeyD w arf GalagoBaboonChimpanzee
Insectivora
Elephantulus rufescens dundasi Erinaceus albiventris Potamogale velox Sylvisorex megalura gemmeus Crocidura littoralis C rod dura boydi Crocidura suajhelae Crocidura turba nilotica C rod dur a flavescens sururae Crocidura luna garambae Crocidura roosevelti Crocidura hildegardae Crocidura jacksoni
Spectacled elephant shrew Four toed hedgehog Giant otter shrew Long tailed forest shrew White toothed shrew White toothed shrew White toothed shrew White toothed shrew White toothed shrew White toothed shrew White toothed shrew White toothed shrew White toothed shrew
-292-
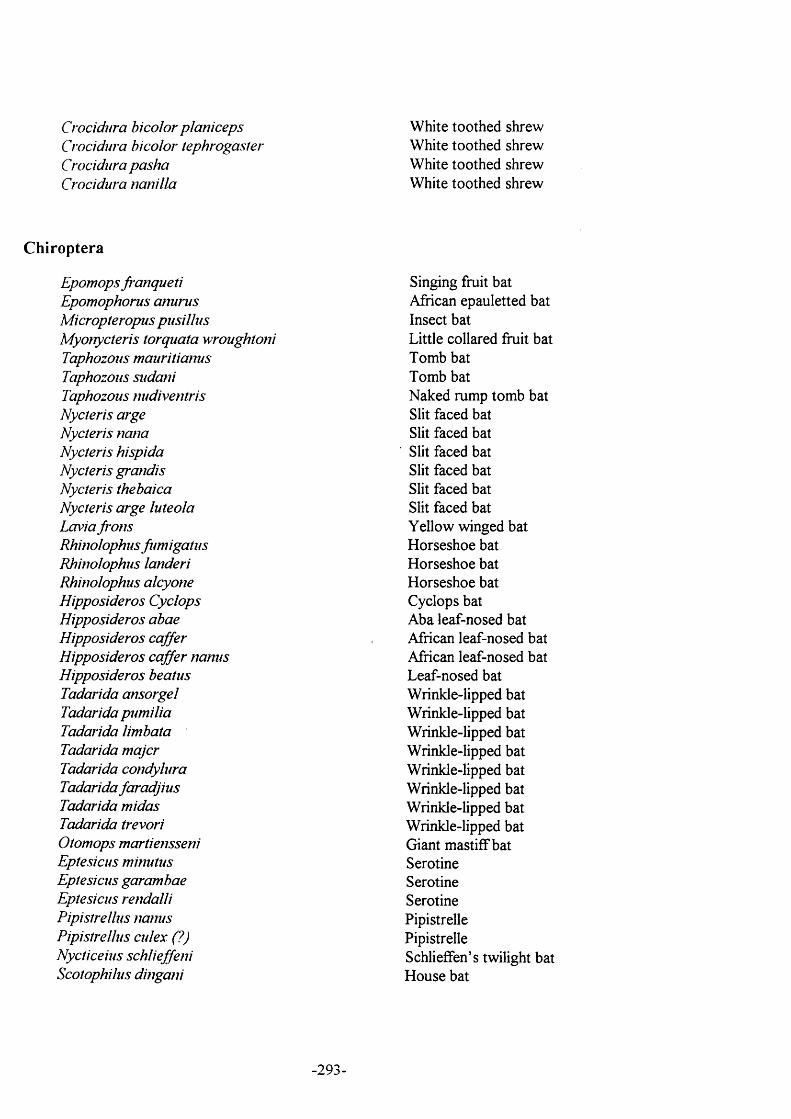
Crocidjira bicolor planiceps Crocidura bicolor tephrogaster Crocidura pasha Crocidura nanilla
White toothed shrew White toothed shrew White toothed shrew White toothed shrew
Chiroptera
Epomops fi'anqueti Singing fruit batEpomophorus anurus African epauletted batMicropteropus pusillus Insect batM yonycteris torquata wroughtoni Little collared fruit batTaphozous m auritiaims Tomb batTaphozoiis Sudani Tomb batTaphozous nudiventris Naked rump tomb batNycteris arge Slit faced batNycteris nana Slit faced batNycteris hispida Slit faced batNycteris grandis Slit faced batNycteris thebaica Slit faced batNycteris arge luteola Slit faced batLa\’ia fro tts Yellow winged batRhinolophus fum igatus Horseshoe batRhinolophus landeri Horseshoe batRhinolophus alcyone Horseshoe batHipposideros Cyclops Cyclops batHipposideros abae Aba leaf-nosed batHipposideros caffer African leaf-nosed batHipposideros caffer nanus African leaf-nosed batHipposideros beatus Leaf-nosed batTadarida ansorgel Wrinkle-lipped batTadarida pum ilia Wrinkle-lipped batTadarida limbata Wrinkle-lipped batTadarida majcr Wrinkle-lipped batTadarida condylura Wrinkle-lipped batTadarida faradjius Wrinkle-lipped batTadarida midas Wrinkle-lipped batTadarida trevori Wrinkle-lipped batOtomops martiensseni Giant mastiff batEptesicus minutus SerotineEptesicus garambae SerotineEptesicus rendalli SerotinePipistrellus nanus PipistrellePipistrel lus cul ex (?) PipistrelleNycticeius schlieffeni Schlieffen’s twilight batScotophilus dingani House bat
-293-
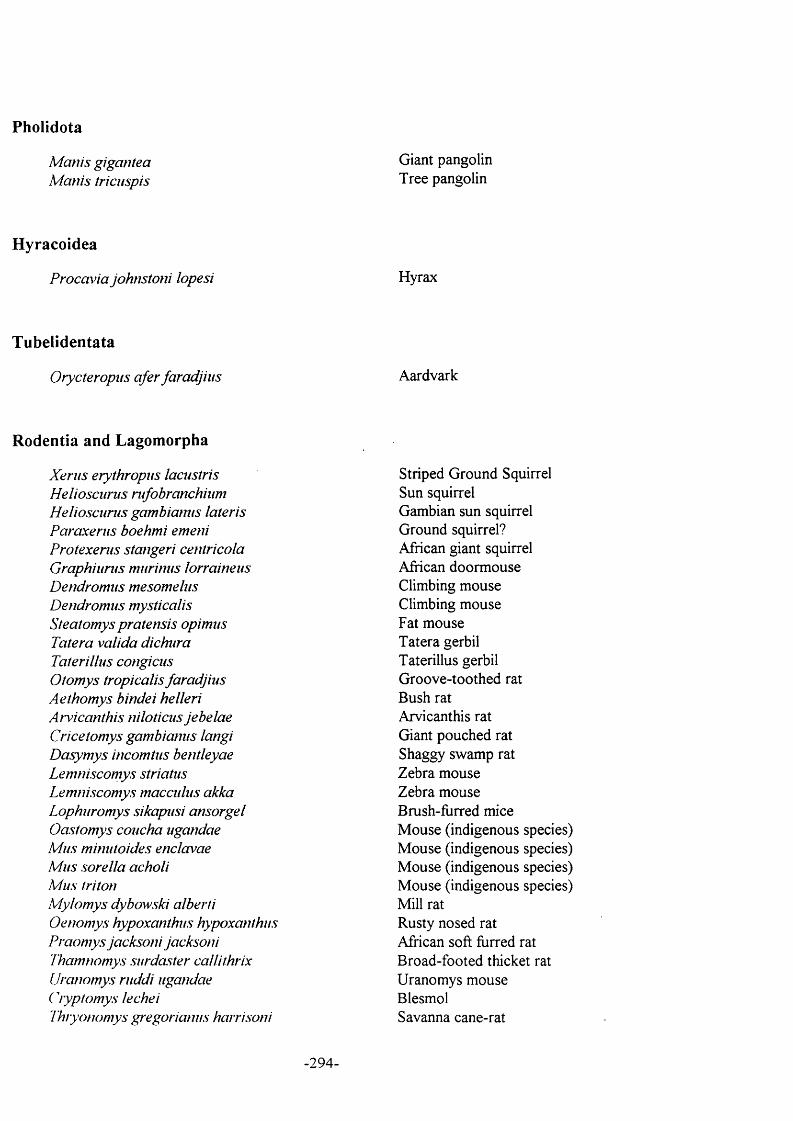
Pholidota
M anis gigantea M anis triciispis
Giant pangolin Tree pangolin
H yracoidea
Procavia johnstoni lopesi Hyrax
Tubelidentata
Orycteropiis afer faradjius Aardvark
Rodentia and Lagomorpha
X en is erythropns lacustris Striped Ground SquirrelHeliosciirus nifobranchium Sun squirrelHeliosciirus gambiamis lateris Gambian sun squirrelParaxenis boehmi emeui Ground squirrel?Protexerus stangeri centricola African giant squirrelGraphiurus murinus lorraineus African doormouseDendromus mesomelus Climbing mouseDendromus mysticalis Climbing mouseSteatomys pratetisis opimus Fat mousePatera valida dichura Tatera gerbilTaterillus congicus Taterillus gerbilOtomys tropicalis faradjius Groove-toothed ratAethornys bindei helleri Bush ratArvi can this niloticiis jebelae Arvicanthis ratCricetomys gambiarius langi Giant pouched ratDasymys incomtus bentleyae Shaggy swamp ratLemniscomys striatus Zebra mouseLemniscomys macculus akka Zebra mouseLophuromys sikapusi ansorgel Brush-furred miceOastomys coucha ugandae Mouse (indigenous species)M us minutoides enclavae Mouse (indigenous species)M us sorella acholi Mouse (indigenous species)M us triton Mouse (indigenous species)M ylomys dybowski alberti Mill ratOenomys hypoxanthus hypoxanthus Rusty nosed ratPraomys jacksoni jacksoni African soft furred ratThamnomys surdaster callithrix Broad-footed thicket ratUranomys ruddi ugandae Uranomys mouseCryptomys lechei BlesmolThryonomys gregorianus harrisoni Savanna cane-rat
-294-

H ysthx crisîata PorcupinePoelagiis m ajohta m a--onta Uganda grass-hare
-295-
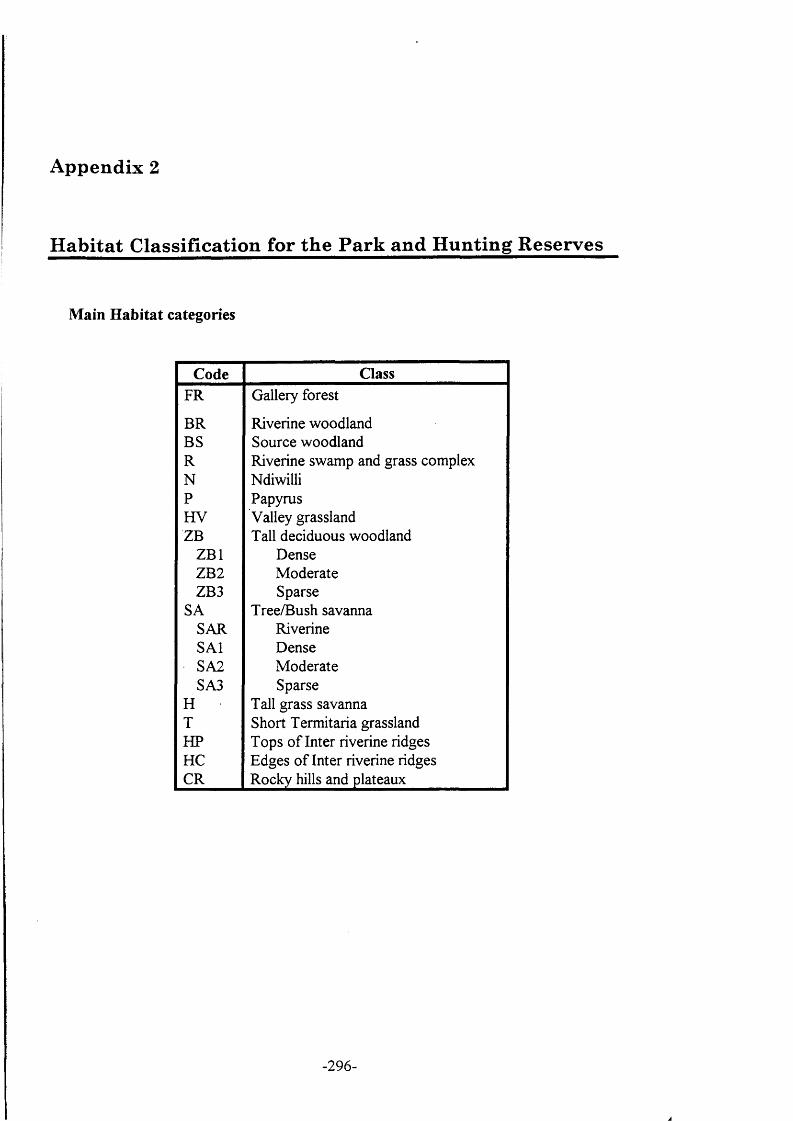
A ppendix 2
H abitat C lassification for th e Park and H unting R eserves
Main Habitat categories
Code ClassFR Gallery forest
BR Riverine woodlandBS Source woodlandR Riverine swamp and grass complexN NdiwilliP PapyrusHV Valley grasslandZB Tall deciduous woodland
ZB l DenseZB2 M oderateZB3 Sparse
SA Tree/Bush savannaSAR RiverineSAl Dense
■ SA2 M oderateSA3 Sparse
H Tall grass savannaT Short Termitaria grasslandHP Tops o f Inter riverine ridgesHC Edges o f Inter riverine ridgesCR Rocky hills and plateaux
- 296 -
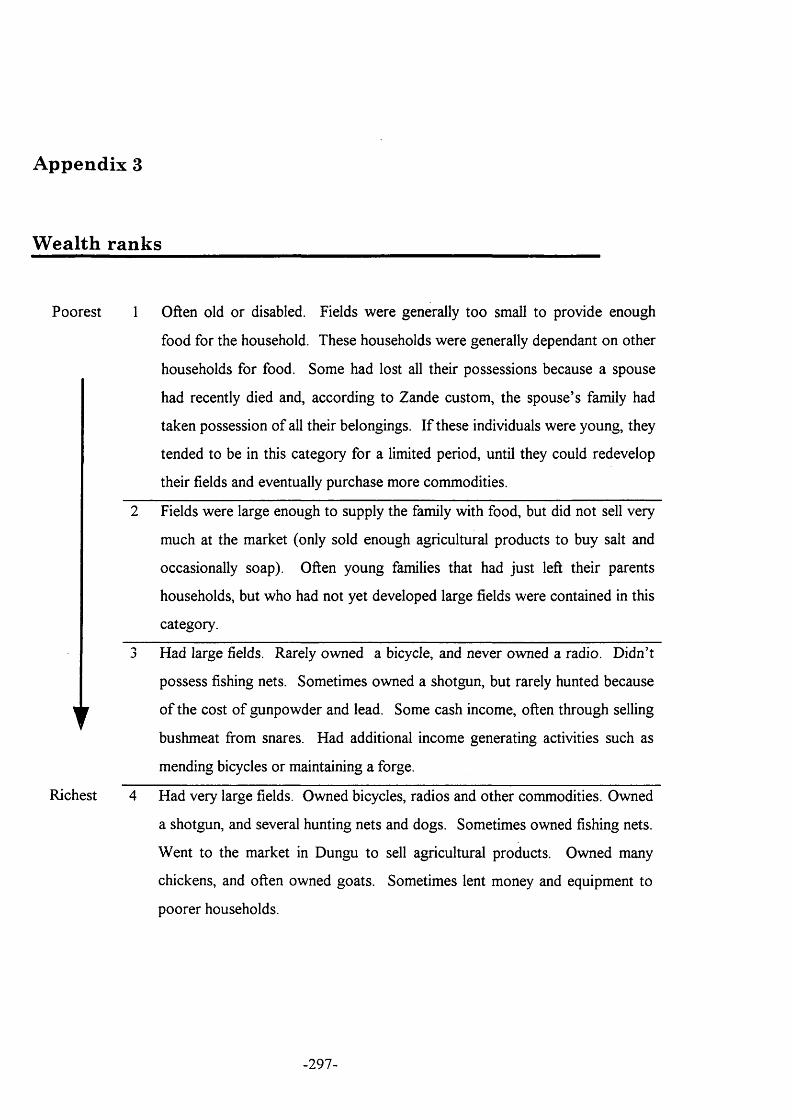
A ppendix 3
W ealth ranks
Poorest 1 Often old or disabled. Fields were generally too small to provide enough
food for the household. These households were generally dependant on other
households for food. Some had lost all their possessions because a spouse
had recently died and, according to Zande custom, the spouse’s family had
taken possession o f all their belongings. I f these individuals were young, they
tended to be in this category for a limited period, until they could redevelop
their fields and eventually purchase more commodities.
2 Fields were large enough to supply the family with food, but did not sell very
much at the market (only sold enough agricultural products to buy salt and
occasionally soap). Often young families that had just left their parents
households, but who had not yet developed large fields were contained in this
category.
3 Had large fields. Rarely owned a bicycle, and never owned a radio. Didn’t
possess fishing nets. Sometimes owned a shotgun, but rarely hunted because
o f the cost o f gunpowder and lead. Some cash income, often through selling
bushmeat from snares. Had additional income generating activities such as
mending bicycles or maintaining a forge.
Richest 4 Had very large fields. Owned bicycles, radios and other commodities. Owned
a shotgun, and several hunting nets and dogs. Sometimes owned fishing nets.
Went to the market in Dungu to sell agricultural products. Owned many
chickens, and often owned goats. Sometimes lent money and equipment to
poorer households.
-297-
A ppendix 4
Extracts from the framework document:
Supporting Community Institutions to Promote Conservation and Development around Garamba National Park
P roposed by
C laude G am bale(The B akhita F oundation , D ungu, D em ocratic R epublic o f Congo)
E m m anuel de M erode(G aram ba N ational Park P roject / U n iv ersity C ollege London)
-298-
a4.1 Summary
The concepts outlined in this document are founded on the shared experience o f individuals who have a long term commitment to the objectives o f conserving Garamba’s wildlife resources and improving the welfare o f the communities surrounding the National Park. The activities described below will make a substantial and tangible contribution to both o f these objectives. They are based on the following understanding:
1. Under the current circumstances, many o f the ecosystem’s most valuable resources are vulnerable to unsustainable exploitation.
2. A conservation priority at Garamba is the successful and recognised ability o f wildlife managers to integrate the area’s natural resources into the process o f local development.
3. Successful conservation with development can only occur through the creation o f innovative and appropriate incentive mechanisms for local people to conserve wildlife resources. The following document summarises how this can be achieved through:
• community controlled wildlife protection (Section 1),• fiscal devolution (Section 2) and,• private sector partnerships (Section 3).
The activities outlined in this document use a ‘minimalist’ approach based on the following principles:
1. Costs are kept to a minimum by relying as much as possible on local institutions, expertise, labour and other resources.
2. It is planned that activities are financially viable beyond the five year programme period
3. Programme planning is based on the current political climate. Lessons are drawn from the experience o f recent conflicts in the region. The programme focuses on institutions and activities that were not undermined by the conflict, and capital equipment, such as vehicles, is kept to a minimum
The present document proposes a process project, using principles o f adaptive management. Thus, the document will form the basis for a more comprehensive proposal developed through other interested parties (l’Institut Congolais pour la Conservation de la Nature, community representations, potential donors etc.). Detailed project proposals for each activity are developed by the Programme Coordinator and Advisory Board in year 1 o f the programme. This framework document explains the institution building and the institutional relationships required to initiate locally appropriate projects which respond to current needs in the current context o f this region o f the Democratic Republic o f the Congo.
-299-
a4.2 Section 1. Traditional authorities and wildlife protection
Ra t io n a l e :• Many o f the threats to the wildlife o f Garamba national Park emanate from the
Hunting Reserves surrounding the Park;
a. in recent years, the focus o f poaching activities in the national park has moved southwards, thereby increasing the vulnerability o f the rhino population and other large mammals, concentrated in the south. Poachers o f Sudanese origin come from the north and are increasingly using the hunting reserves to gain access to the southern sector o f the Park in order to reduce their exposure to patrols. Some members o f the local communities are complicit, providing refuge, storage for weapons and porters for the poaching expeditions.
b. soldiers present in the Hunting Reserves are often unsupervised and can be undisciplined. Some o f these soldiers take part in poaching on regular basis as a means o f supplementing their salaries.
c. as a result o f recent events, automatic weapons are widely available in the Hunting Reserves. A minority o f individuals aniongst the local communities hold automatic weapons and regularly take part in poaching
• Although armed patrols can be effective within the National Park, they are ineffective and inappropriate in populated areas:
a. patrolling the hunting reserves is logistically difficult and expensive
b. inadequately supervised armed guards amongst the communities can substantially increase the existing tensions between the communities and the National Park
c. inadequately supervised armed guards are susceptible to getting involved in poaching
Ex ist in g S ol u tio n s
Many o f the threats to conservation outlined above relate to the climate o f instability in the area. The symptoms o f political instability, which include the widespread availability o f automatic weapons and the free movement o f armed groups, are as much a problem for state officials concerned about the welfare and development o f the local community as they are for wildlife managers. This provides the basis for a much stronger collaboration between the wildlife authorities and effective civil authorities.
Traditional chiefs, or c h e f de groupement, have a long history o f local administration which dates back to the last century. They have been assimilated into the state hierarchy because o f their effectiveness and self-sufficiency in managing a local
-300-
administration. Traditional authorities are well placed to address human related threats to conservation because o f their intimate knowledge and contact with the resident population, together with their legally recognised mandate to enforce the law in their constituencies.
To this end, traditional chiefs currently use a small unarmed force o f 'gendarmes' to maintain the law in their administrative areas. The Gendarmes are local residents who share kinship and social ties with the rest o f the community. They differ fundamentally from other law enforcement agents in the Congo, in that their strength is derived not from their weapons, but from the personality o f the chief who’s authority is based on local traditions and the respect that he is afforded from the community as a whole. Thus, the efficacy the system relies largely on the personal motivation o f the chief.
There are currently 9 chiefs in the Domaines de Chasse around Garamba National Park. Whilst chiefs’ capacity to manage conservation and development initiatives is varied, there is evidence to suggest that a number o f chiefs are extremely motivated, and would benefit from the support o f the wildlife authorities. For instance, research undertaken by the Garamba Project staff in the Groupement Kiliwa has revealed the efficacy o f the traditional leadership in maintaining a climate o f stability. This experience also highlights the mutual benefits that could be gained from a closer collaboration between the wildlife and traditional authorities. O f all the systems o f authority in the region, traditional systems are the most accountable to the local population. Exceptionally, some chiefs are less responsible and operate through patronnage and coercion, however there have been a number o f incidents o f chiefs being deposed through popular pressure. A number o f successful chiefs have the consent o f the population in the groupement, which provides a basis for effective collaboration for both conservation and development in the region:
• The chiefs have access to detailed information on Sudanese movements resulting from their close relationship and the high level o f trust that has been established with the community. Incursions by the Sudanese are reported well in advance and can be referred to Park authorities.
• Soldiers passing through the village report to the chiefs. They are provided with accommodation at the chiefs’ residence and he maintains control over their movements. Lack o f discipline is repeatedly reported to higher authorities until action is taken.
• The above approaches have resulted in the voluntary handing over o f automatic weapons to the traditional authorities. For example, documentary evidence exists to show that the traditional authority o f Kiliwa recovered 61 automatic rifles between 1989 and 1995. These were delivered to the military, civil and park authorities. This is achieved with the help o f unarmed Gendarmes.
A c tiv itie s
The programme will use a ‘pilot project’ approach. Initially, efforts will focus on strengthening the remarkable success o f the traditional authorities o f the groupement
-301-
Kiliwa. This experience will be used as a basis for collaborating with other traditional authorities, using the chief from Kiliwa as a key facilitator in the process.
The Programme Coordinator will build the capacity o f traditional chiefs to maintain the laws o f conservation by;
• develop consent for conservation activities through improved communication and accountability to village commitees. Presentations at village markets also provide a mechanism for communicating the link between conservation and community benefits outlined in sections 2 and 3 below. Participatory monitoring and evaluation will be initiated as the project develops.
developing a system o f rewards (primes) for chiefs and gendarmes for their performance in recovering automatic weapons and providing useful information to the wildlife authorities
act as liaison officer between the traditional authorities and the park authorities, reporting regularly to the Conservateur Principal.
develop a database drawing on the knowledge o f the traditional chiefs and other key informants on the situation in the reserves pertaining to the threats to wildlife conservation
Should the traditional authorities’ means o f managing particular illegal activities be inadequate to tackle a particular problem, the programme coordinator will advise the Park authorities on appropriate supportive action.
replicate the successes by identifying and encouraging other traditional chiefs that are capable and willing to undertake the same conservation activities.
Im p a c t s AND th e ir M e a su r e m e n t
These activities will significantly reduce the number o f automatic weapons that are illegally held around the national park. The approach will reduce the overall cost o f managing the protected area, and improve relations between wildlife authorities and local populations. In conjunction with the activities outlined in sections 2 and 3, this programme will produce a system o f wildlife management that is sustainable in the long term. The decreased availability o f automatic weapons will increase stability which is associated with the development o f markets and other community driven welfare initiatives, such as the maintenance o f local schools and dispensaries.
The benefits can be measured in the short term through the remise d 'armes. These are certificates which document the transfer o f weapons from traditional chiefs to higher authorities. In the medium term, the benefits will be shown in a reduction in the incidence o f contacts between poachers and guards in the park. These are monitored through patrol reports.
-302-

• The Programme Coordinator will develop criteria for selecting welfare initiatives and ensure that they reach appropriate groups, such as the poor and women. The Programme Coordinator will facilitate the implementation o f these projects by consulting with representative groups from the community.
• The Programme Coordinator will research, and if successful, design and implement the following issues;
a. the use o f taxation to monitor offtake from the protected area.b. the use o f taxation to regulate offtake from the protected area.
-305-
a4.4 Partnerships in Conservation and Local Enterprise
Ra t io n a l e :
• Certain development activities, such as trade in bushmeat and gold mining, present a direct threat to conservation
• Development in certain areas, such as at the boundary o f the National Park, is likely to have a higher negative impact on Park resources than development at the periphery o f the Hunting Reserves
• Economic development in the hunting reserves is an inevitable process. Therefore, wildlife managers must take an active part in economic development, and must position themselves to influence the nature and geographical focus o f the process. This will mitigate the growth o f ‘high impact’ economic activities.
• A long term threat may arise if conservation is increasingly perceived by the local communities as a hindrance to the development process
E x is t in g so lu t io n s:
• The informal economy in Congo provides the ‘backbone’ to local administration. The continued growth o f the informal economy can strengthen the capacity o f local administrators to ensure sustainable resource use.
• Experience at Kiliwa, far from the Park boundary, is evidence o f the positive effects that conservation compatible economic development can have; the village, on the periphery o f the reserves, is an economic growth pole, and consequently, has been associated with a movement o f populations from the immediate periphery o f the national park (Bagbele and Mamba) to Kiliwa.
• Certain economic activities, such as animal husbandry, have been successfully undertaken in the reserves, and may reduce the demand for bushmeat. For example, at Kiliwa, the chief has developed a ‘goat lending scheme’, whereby poorer families are lent a pair o f goats from the ch iefs herd. The offspring from this pair are shared between the household, who are responsible for looking after the pair, and the chief who owns them. Both parties benefit: the poor household is able to develop their own herd, and the chief loses fewer goats to predators because o f the more intensive protection offered by the poor household.
- 306 -
A c t iv it ie s :
The programme will use a ‘micro-enterprise’ approach to development that has been tested with considerable success throughout the developing world (UNDP 1996). The initiative is based on the ‘solidarity group model’, in which five to fifteen individuals pursue their own micro-enterprise using a small loan ($50 to $200) and provide joint guarantees for each person’s loan. The credit groups are self-selecting. Access to credit through the programme is subject to each member o f the group being current with their repayments. The rewards are high for good performance and the penalties are immediate for poor performance.
The approach offers the following advantages:
it uses locally available skillsthe framework is easily understood by members o f the communities it promotes an entrepreneurial culture, based on community level initiatives, and not on well intentioned ‘hand-outs’ from above which have been the downfall o f many development interventions
• it charges market interest rates on loans, which will make the programme cover itscosts, reach more people and be financially viable in the long term
• it can reach a truly substantial number o f poor households, especially women who often have a better record for credit worthiness
• it is labour intensive and creates significant employment• they can serve as a basis for community participation, and a focus for
environmental awareness
The programme will begin with the M icrostart framework developed by UNDP, and adapt it to the local context. The approach uses a minimum o f staff (most o f the development administration is provided by the entrepreneurs themselves) requiring little capital equipment.
Trial credit groups have recently been set up by the Bakita Foundation according to the framework summonsed above. Larger scale activities will draw on this experience and replicate successes.
307-

a 4 .5 P la n n in g , M o n ito r in g and E v a lu a tio n
Planning will be undertaken by the Programme Coordinator, with the help o f the Advisory Board (see section 6). The Programme Coordinator will ensure that a representative selection o f community members are consulted. The Programme Coordinator will sensitive to the problems o f unduly raising expectations.
The Programme Coordinator will develop a set o f economic, social and conservation indicators that accurately measure the success o f the programme.
The Programme Coordinator will research the impacts o f economic development on conservation in north eastern Congo.
The Programme Coordinator, in collaboration with the Board o f Advisors, will write up the evaluation results to the standards expected for recognised scientific journals
-308-