efficient management capacity evaluation of tourism in protected areas
TRANSCRIPT

This article was downloaded by: [University of Waterloo]On: 15 August 2014, At: 11:26Publisher: RoutledgeInforma Ltd Registered in England and Wales Registered Number: 1072954 Registeredoffice: Mortimer House, 37-41 Mortimer Street, London W1T 3JH, UK
Journal of Environmental Planning andManagementPublication details, including instructions for authors andsubscription information:http://www.tandfonline.com/loi/cjep20
Efficient management capacityevaluation of tourism in protectedareasJuan Carlos Valdiviesoa, Paul F.J. Eaglesb & Joan Carles Gilaa Department of Management, Universitat Politècnica deCatalunya, Barcelona, Spainb Department of Recreation and Leisure Studies, University ofWaterloo, Waterloo, CanadaPublished online: 08 Aug 2014.
To cite this article: Juan Carlos Valdivieso, Paul F.J. Eagles & Joan Carles Gil (2014): Efficientmanagement capacity evaluation of tourism in protected areas, Journal of Environmental Planningand Management, DOI: 10.1080/09640568.2014.937479
To link to this article: http://dx.doi.org/10.1080/09640568.2014.937479
PLEASE SCROLL DOWN FOR ARTICLE
Taylor & Francis makes every effort to ensure the accuracy of all the information (the“Content”) contained in the publications on our platform. However, Taylor & Francis,our agents, and our licensors make no representations or warranties whatsoever as tothe accuracy, completeness, or suitability for any purpose of the Content. Any opinionsand views expressed in this publication are the opinions and views of the authors,and are not the views of or endorsed by Taylor & Francis. The accuracy of the Contentshould not be relied upon and should be independently verified with primary sourcesof information. Taylor and Francis shall not be liable for any losses, actions, claims,proceedings, demands, costs, expenses, damages, and other liabilities whatsoever orhowsoever caused arising directly or indirectly in connection with, in relation to or arisingout of the use of the Content.
This article may be used for research, teaching, and private study purposes. Anysubstantial or systematic reproduction, redistribution, reselling, loan, sub-licensing,systematic supply, or distribution in any form to anyone is expressly forbidden. Terms &

Conditions of access and use can be found at http://www.tandfonline.com/page/terms-and-conditions
Dow
nloa
ded
by [
Uni
vers
ity o
f W
ater
loo]
at 1
1:26
15
Aug
ust 2
014
Efficient management capacity evaluation of tourism in
protected areas
Juan Carlos Valdiviesoa*, Paul F.J. Eaglesb and Joan Carles Gila
aDepartment of Management, Universitat Polit�ecnica de Catalunya, Barcelona, Spain;bDepartment of Recreation and Leisure Studies, University of Waterloo, Waterloo, Canada
(Received 23 January 2014; final version received 18 June 2014)
Despite the increasing number of protected areas around the world and theirimportance in the conservation of species and ecosystems, protected areasmanagement capacity remains difficult to evaluate. A standard is needed to helppolicy makers compare the goals with the results obtained. This empirical researchbuilds a tool to analyze the management efficiency and predicts the new touristicoutcomes in case of a policy change. Using as example the state parks agencies in theUSA, this paper develops a technological frontier using data envelopment analysisbased on the Protected Areas Management Approach. After that, a prediction of theoutcomes is analyzed with a budget change for any state park agency. Data suggestthat many of them need to improve their performance to be more efficient. Anotherresult obtained shows how budget changes will affect each agency’s performance indifferent degrees and, therefore, budget reductions should be modeled separately.
Keywords: protected areas; efficient management; data envelopment analysis;tourism
1. Introduction
“A protected area is a clearly defined geographical space, recognized, dedicated andmanaged, through legal or other effective means, to achieve the long term conservation ofnature with associated ecosystem services and cultural values” (Dudley 2008, 9).
Dudley’s definition explains the importance of protected areas (PAs) for the
“conservation of nature”. The World Database on Protected Areas (WDPA) catalogs
130,709 areas covering 24.23 million km2, 27,188 of which are international (World
Heritage Sites, Man and the Biosphere Programme and Ramsar Convention) PAs
(WDPA 2012). The number of PAs has increased significantly in the last few years. For
example, in 2011 there were 130,709 national PAs around the world. Those areas have
different restrictions and can be classified in different categories, but they all play a
similar role: to protect the natural resources available and to provide sites for
environmental education and nature-based tourism. They now cover 12.7% of the
terrestrial surface (Bertzky et al. 2012).
The main reason for a government to decide to protect a biozone is because of the
ecological (defense and protection of nature and the environment) and the biological
importance of the zone. They are trying to protect an area that is important regionally,
nationally, or globally. Those natural assets attract tourism (Whitelaw, King, and Tolkach
2014).
*Corresponding author. Email: [email protected]
� 2014 University of Newcastle upon Tyne
Journal of Environmental Planning and Management, 2014
http://dx.doi.org/10.1080/09640568.2014.937479
Dow
nloa
ded
by [
Uni
vers
ity o
f W
ater
loo]
at 1
1:26
15
Aug
ust 2
014
Although the objective proposed by the World Commission on Environment and
Development in 1987 of having 12% of the terrestrial land as PA has been attained, there
are many problems sustaining these important areas. These problems will increase given
the new expanded objective set by the Convention on Biological Diversity in the Aichi
Biodiversity Targets CBD 2010. Target 11 indicates that, by 2020, at least 17% of the
land area and 10% of marine areas should be protected, this requires much higher levels
of management capacity than currently exist.
Even with the importance of these areas for the conservation of the environment, many
governmental agencies and NGOs are finding it very difficult to finance them with public
funds (Saayman and Saayman 2006; Adams et al. 2008; Whitelaw, King, and Tolkach
2014). Many PAs have become “paper parks” (Dharmaratne, Yee Sang, and Walling 2000)
or “half-empty” forests (Redford and Feinsinger 2001). Some parks were never opened for
public use, while others have been closed (Eagles 1995). Many alternatives to a tax-based
approach are being considered with tourism fees and charges as a major alternative. Some
PAs are very attractive for tourists and tourism fees are the main source of income for
some countries, such as those of eastern and southern Africa.
The literature reveals the links between environmental conservation in parks and
tourism in those parks. Many have shown the negative impact that poorly managed
tourism can have on the environment (Green, Hunter, and Moore 1990; Hardy and
Beeton 2001; Huybers and Bennett 2003). There is a paradox confronting tourism and
environmental conservation in PAs (Williams and Ponsford 2009; Wearing and Neil
2009). Poorly managed tourism can have a negative impact on the environment, but at
the same time, a good environmental resource gives a significant attraction to the area.
This explains the importance of a well-preserved area in competition with other touristic
zones. Although the relationship between tourism and a PA is complex; tourism is almost
always a critical component that must be taken into account in the establishment and
management of PAs (Eagles, McCool, and Haynes 2002).
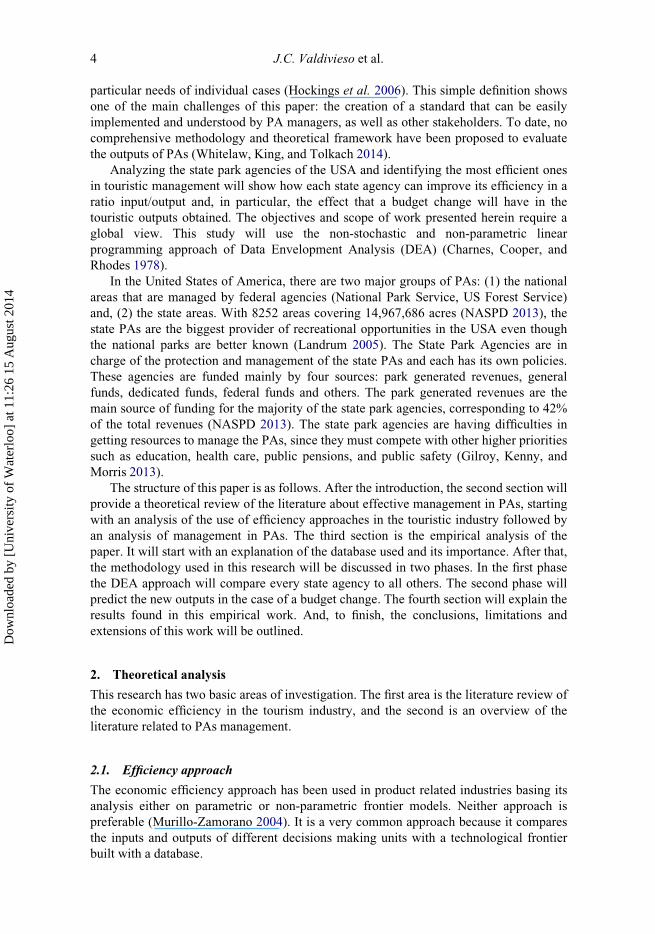
Tourism in PAs can generate both positive and negative impact (McCool 2006).
Figure 1 shows the interaction of stakeholders in PAs. It is important to emphasize the
connection between tourism and environment. Indiscriminate and uncontrolled tourism can
cause damage that may be irreversible, especially in areas that are ecologically fragile.
Conversely, well-managed tourism creates a conservation constituency in society and has
major positive economic impacts in rural areas. Tourism has also an influence in land
preserved for nature, especially in terms of quantity (Van der Duim and Caalders 2002).
The idea of a use-restricted PAs will, most likely, not provide long term protection of
biodiversity becoming a “protection paradigm” (Wilshusen et al. 2002). The challenge is
to manage the touristic use, which generates revenue and employment, while minimizing
the negative impact of tourism on the environment and conserving the local ecosystems
(Blanke and Chiesa 2008), taking into account that the two main objectives of PAs are:
(i) the conservation and management of the natural resources and (ii) offering
educational and leisure services to the visiting public (Eagles and McCool 2002). This is
especially important in countries where tourism is a significant factor for development
and strengthening rural economies.
Managing PAs is profoundly difficult given the multiple and, at times, ambiguous
mandates (Naughton-Treves, Holland, and Brandon 2005). The key questions are
whether the responsible authorities have the capacity to manage their PAs effectively and
whether this management is being delivered on the ground (Hockings et al. 2006).
Despite some improvements in the protection of important areas, global biodiversity is
decreasing significantly (Butchart et al. 2010) showing the importance that not only is it
2 J.C. Valdivieso et al.
Dow
nloa
ded
by [
Uni
vers
ity o
f W
ater
loo]
at 1
1:26
15
Aug
ust 2
014
crucial to increase the number of PAs around the world, but also having an effective and
efficient management capacity to attain site objectives. A sustainability standard has not
been developed (Kates et al. 2001) and one is difficult to identify (Moore and Polley
2007). At the same time, it is important to create a standard model that could estimate the
adequate resources needed for PAs to have good management (Hockings et al. 2006). A
standard that could tell a manager how well his work would fulfill the touristic goals in
PA is desirable.
Managerial effectiveness and efficiencies are best understood through comparisons
with others. How can governments know the amount of money a park needs to properly
implement its goals? How can policy makers make decisions, if they do not know if a PA
agency is doing well or how it can improve? (Hockings et al. 2006) A core question of
sustainability science is how can today’s relatively independent activities of research
planning, monitoring, assessment, and decision support be better integrated into systems
for adaptive management and societal learning (Kates et al. 2001).
This study aims to develop a tool to facilitate and provide adequate information to
PAs managers. To attain this goal, a use of this tool allows for a comparison of results
between similar agencies to help set new objectives. This approach intends to create a
standard economic model of efficient touristic management for PAs. The idea is to know
the inputs needed to achieve a long-term preservation of nature and the appropriate levels
of human recreational use.
In their simplest form, standards can be used for application to the management of
virtually all PAs, but they are necessarily general and relatively insensitive to the
Figure 1. Interaction between the different stakeholders in protected areas.
Journal of Environmental Planning and Management 3
Dow
nloa
ded
by [
Uni
vers
ity o
f W
ater
loo]
at 1
1:26
15
Aug
ust 2
014
particular needs of individual cases (Hockings et al. 2006). This simple definition shows
one of the main challenges of this paper: the creation of a standard that can be easily
implemented and understood by PA managers, as well as other stakeholders. To date, no
comprehensive methodology and theoretical framework have been proposed to evaluate
the outputs of PAs (Whitelaw, King, and Tolkach 2014).
Analyzing the state park agencies of the USA and identifying the most efficient ones
in touristic management will show how each state agency can improve its efficiency in a
ratio input/output and, in particular, the effect that a budget change will have in the
touristic outputs obtained. The objectives and scope of work presented herein require a
global view. This study will use the non-stochastic and non-parametric linear
programming approach of Data Envelopment Analysis (DEA) (Charnes, Cooper, and
Rhodes 1978).
In the United States of America, there are two major groups of PAs: (1) the national
areas that are managed by federal agencies (National Park Service, US Forest Service)
and, (2) the state areas. With 8252 areas covering 14,967,686 acres (NASPD 2013), the
state PAs are the biggest provider of recreational opportunities in the USA even though
the national parks are better known (Landrum 2005). The State Park Agencies are in
charge of the protection and management of the state PAs and each has its own policies.
These agencies are funded mainly by four sources: park generated revenues, general
funds, dedicated funds, federal funds and others. The park generated revenues are the
main source of funding for the majority of the state park agencies, corresponding to 42%
of the total revenues (NASPD 2013). The state park agencies are having difficulties in
getting resources to manage the PAs, since they must compete with other higher priorities
such as education, health care, public pensions, and public safety (Gilroy, Kenny, and
Morris 2013).
The structure of this paper is as follows. After the introduction, the second section will
provide a theoretical review of the literature about effective management in PAs, starting
with an analysis of the use of efficiency approaches in the touristic industry followed by
an analysis of management in PAs. The third section is the empirical analysis of the
paper. It will start with an explanation of the database used and its importance. After that,
the methodology used in this research will be discussed in two phases. In the first phase
the DEA approach will compare every state agency to all others. The second phase will
predict the new outputs in the case of a budget change. The fourth section will explain the
results found in this empirical work. And, to finish, the conclusions, limitations and
extensions of this work will be outlined.
2. Theoretical analysis
This research has two basic areas of investigation. The first area is the literature review of
the economic efficiency in the tourism industry, and the second is an overview of the
literature related to PAs management.
2.1. Efficiency approach
The economic efficiency approach has been used in product related industries basing its
analysis either on parametric or non-parametric frontier models. Neither approach is
preferable (Murillo-Zamorano 2004). It is a very common approach because it compares
the inputs and outputs of different decisions making units with a technological frontier
built with a database.
4 J.C. Valdivieso et al.
Dow
nloa
ded
by [
Uni
vers
ity o
f W
ater
loo]
at 1
1:26
15
Aug
ust 2
014
The efficiency approach has also been largely used in the tourism industry, especially
in the private sector. The usual use of this approach in the tourism sector is in the hotel
industry. Some of the research uses the stochastic frontier approach (Anderson et al.
1999; Chen 2007) while others use the DEA approach (Tsaur 2001; Brown and Ragsdale
2002; Hwang and Chang 2003; Barros 2005; Hsieh and Lin 2010).
Other papers that use the efficiency approach in the touristic sector focus on restaurants
(Reynolds and Biel 2007; Sanjeev 2007) or travel agencies (Barros and Matias 2006;
K€oksal and Aksu 2007). In the tourism industry, another popular use of efficiency is with
airlines (Barla and Perelman 1989; Coelli, Perelman, and Romano 1999; Good, Roller, and
Sickles 1995; Fethi, Jackson, and Weyman-Jones 2000; Semenick and Sickles 2000; Adler
and Golany 2001; Scheraga 2004; Barbot, Costa, and Sochirca 2008).
It is very hard to find researchers that use this approach in PAs and forestry because of
the difficulty of collecting the required input data. Among the few papers related with this
topic are Hof et al. (2004), Bosetti and Locatelli (2006) and Beech et al. (2008). The first
paper uses DEA to identify areas in the USA where there is maximum potential for
improving forest and rangeland condition. The second paper uses DEA to evaluate
efficiency in Natural Parks in Italy. The last paper uses a stochastic approach in marine
PAs in the Caribbean Sea.
A new tendency of studies in the tourism industry is the so-called eco-efficiency,
where a comparison between economic welfare and environmental damage are analyzed
(G€ossling et al. 2005; Kuosmanen and Kortelainen 2005).
2.2. Protected areas management
The number of PAs around the world is increasing and it is important to improve their
efficiency and effectiveness. More PAs does not necessarily mean a better environmental
protection; many are not adequately managed or exist only in theory (Cifuentes, Izurieta,
and de Faria 2000).
Parks play an important role in the conservation of ecosystems and species around the
world. For example, in scenarios with a moderate climate change, PAs can still be an
important conservation strategy (Hannah et al. 2007), or that the majority of tropical
parks are successful at stopping land clearing and, to a lesser degree, effective at
mitigating logging, hunting, fire and grazing (Bruner et al. 2001). Good governance and
good management are important for long-term conservation and understanding of PAs
(Smith et al. 2003; Eagles 2009).
It is essential that PAs agencies have effective management so that they can attain the
stated objectives, especially in preserving the environment for future needs. PAs can only
be preserved and understood by present generations, if the uses are sustainable and
contribute to sustainable development, through good governance and good management
(Romagosa, Eagles, and Duitschaever 2012). Management in PA is “the combination of
actions with a legal, political, administrative, research, planning, protective,
coordinating, interpretative or educational character, that results in the better use and
permanence of a protected area, and the accomplishment of its objectives” (Cifuentes,
Izurieta, and de Faria 2000). Understanding the management effectiveness of PAs has
emerged as a dynamic subfield of PAs management (Hockings 2003).
One of the approaches that analyze the management in parks is protected area
management effectiveness (PAME). PAME is the “assessment of how well the protected
area is being managed, primarily the extent to which it is protecting values and achieving
goals and objectives” (Hockings et al. 2006, xiii). This framework was developed for the
Journal of Environmental Planning and Management 5
Dow
nloa
ded
by [
Uni
vers
ity o
f W
ater
loo]
at 1
1:26
15
Aug
ust 2
014
International Union for Conservation of Nature (IUCN) and the World Commission on
Protected Areas IUCN�WCPA. The effectiveness in PAs can be considered at four
different, complementary levels: coverage, broad scale outcomes, PA management
effectiveness assessments and detailed monitoring (Leverington et al. 2010).
The use of PAME as a measure of the effectiveness studies is expanding and now
many agencies use it or demand the use of it, especially after the Convention of
Biological Diversity’s Programme of Work on Protected Areas has set the goal of
evaluating and improving the effectiveness of PAs management across the world
(Belokurov et al. 2009). A study developed by Leverington et al. (2010) shows that more
than 8000 evaluations of effectiveness of PA management have been conducted,
revealing the widespread utility of this concept.
It is crucial to develop a “clear and unbiased picture of the inputs available and to identify
gaps and shortfalls (or waste and over-spend if this is occurring)” in PAs management
(Hockings et al. 2006) and this is precisely what this study is trying to determine.
2.2.1. PAME: inputs/outputs
The study of efficiency in PAs has a special challenge. The efficiency approach has been
largely used in industries with physical products because it is easier to quantify the inputs
needed to develop such a product. On the other hand, PAs have a much more complex
approach because it is difficult to define and quantify the inputs and outputs of the
services, such as ecological and tourism services.
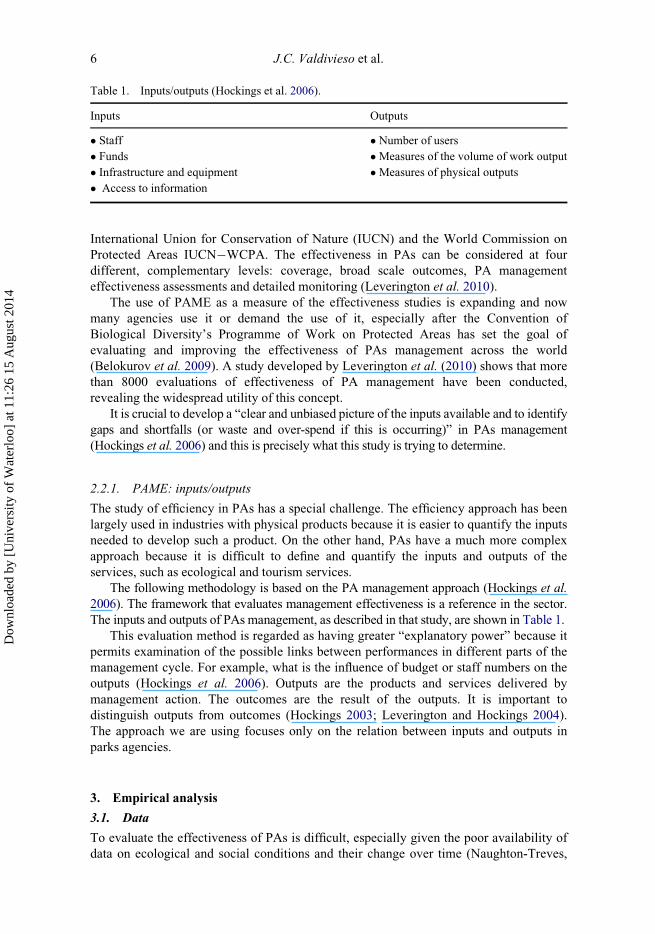
The following methodology is based on the PA management approach (Hockings et al.
2006). The framework that evaluates management effectiveness is a reference in the sector.
The inputs and outputs of PAs management, as described in that study, are shown in Table 1.
This evaluation method is regarded as having greater “explanatory power” because it
permits examination of the possible links between performances in different parts of the
management cycle. For example, what is the influence of budget or staff numbers on the
outputs (Hockings et al. 2006). Outputs are the products and services delivered by
management action. The outcomes are the result of the outputs. It is important to
distinguish outputs from outcomes (Hockings 2003; Leverington and Hockings 2004).
The approach we are using focuses only on the relation between inputs and outputs in
parks agencies.
3. Empirical analysis
3.1. Data
To evaluate the effectiveness of PAs is difficult, especially given the poor availability of
data on ecological and social conditions and their change over time (Naughton-Treves,
Table 1. Inputs/outputs (Hockings et al. 2006).
Inputs Outputs
� Staff � Number of users
� Funds �Measures of the volume of work output
� Infrastructure and equipment �Measures of physical outputs
� Access to information
6 J.C. Valdivieso et al.
Dow
nloa
ded
by [
Uni
vers
ity o
f W
ater
loo]
at 1
1:26
15
Aug
ust 2
014
Holland, and Brandon 2005); this happens even in countries with a high number of
tourists in national parks like Spain (Mu~noz-Santos and Benayas 2012).One exception is the extensive data set found in the National Association of State Park
Directors (NASPD) Annual Information Exchange Report. This report is developed
yearly and has important information about PAs state agencies in the United States of
America. This important dataset and the associated report are developed every year by
the NASPD. All data are provided by the 50 state park agencies for their respective
states. For this study we are using the information for the period between 1 July 2011 and
30 June 2012.
Given the focus of this study and the dataset available, this research uses as
inputs the budget, the number of staff members, and the total number of campsites.
The outputs are the total number of visitors and the total revenue generated. To
date, the most widely used tourism related approach to funding PAs has involved
the levying of fees directly on visitors or through licensing commercial operators
and the provision of concessions and leases (Whitelaw, King, and Tolkach 2014). In
this case, due to the debate in the literature related to the optimal number of tourists
in PAs, the variable of total number of visitors has been treated as a fixed output.
This means that the analysis will be run assuming that the number of visitors cannot
be changed. Historically, the parks receive whatever visitor use occurs, and then try
to develop mechanisms to define and manage appropriate activities and levels of use
(Eagles 2002). The relationship between visitor numbers and the marketability or
attractiveness of the area will shape the style of the services offered and the prices
that are charged (Whitelaw, King, and Tolkach 2014).
3.2. Methodology
The model builds an economic standard for tourism in PAs management capacity that
evaluates the impact that a change in the inputs will have in the new outputs. In the
literature, there is a need for such a model for an evaluation of efficiency and
effectiveness in PAs. This research aims to fill this gap by developing and testing an
economic standard that can be replicated in different regions and countries.
This research was developed in two phases. The first phase is a comparison of the
different decision making units (DMU) using a non-parametric approach that compares
them with a technological frontier. Based on the PAME approach, three available inputs
will be used: total operating expenses, total staff, and total number of campsites
available. These resources will be contrasted with two outputs: the total number of
visitors and total revenue generated. The first phase will analyze the most efficient DMUs
by comparing them with the technological frontier created. This study allows analysis of
whether management is getting the maximum results with the resources available. The
second phase is the development of a tool, based on the technological frontier developed
in the previous phase, to predict future results if one or more inputs change in a specific
state park agency. This prediction will be done running a simulation with the new
resources.
3.2.1. Phase 1
DEA is a non-stochastic and non-parametric linear programming approach that calculates
efficiency in relation to a production frontier established by the industry (Coelli et al.
Journal of Environmental Planning and Management 7
Dow
nloa
ded
by [
Uni
vers
ity o
f W
ater
loo]
at 1
1:26
15
Aug
ust 2
014
2005). In other words, it measures the performance of each unit in relation to the
performance of the other units with the same goals and objectives.
DEA was first introduced by Charnes, Cooper, and Rhodes (1978) based on the
quantity index constructed by Malmquist (1953) and an extension of the Farrell’s
estimation of technical efficiency with respect to the production frontier (Farrell 1957).
Charnes, Cooper and Rhodes proposed that “the measure of the efficiency of any DMU
is obtained as the maximum of a ratio of weighted outputs to weighted inputs subject to
the condition that the similar ratios for every DMU be less than or equal to unity”
(1978, 430). The idea is to maximize the outputs obtained using a certain amount of
inputs. This will calculate the efficiency of a DMU with respect to a production frontier.
It is a very common approach because no assumption is done and prices or cost data are
not involved.
In this case, the DMUs will be the state park agencies and n is the number that will be
evaluated. Every DMU will use m inputs to produce s outputs. Let Xj be the input
consumption vector for DMUj where Xj D (x1j; . . .; xmj)T, and Yj the output production
vector, Yj D (y1j; . . .; ysj)T.This model is output-oriented because the objectives of the parks are not standardized.
This means that not all state park agencies or parks have the same objectives. Therefore,
this method will look for the maximum outputs possible using the inputs available in the
present. The idea can be simplified as: if two parks agencies have the same inputs, the
one with more outputs is more efficient than the other one. In other words, this approach
defines efficiency as the maximum possible output (i.e. total revenue generated) that
could be obtained with the current inputs given the present technological frontier.
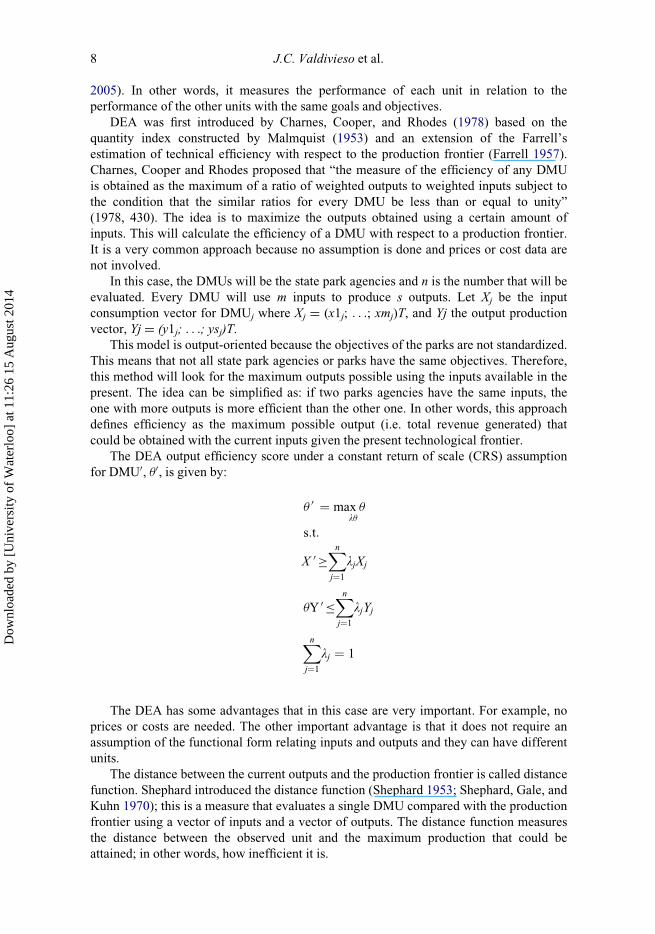
The DEA output efficiency score under a constant return of scale (CRS) assumption
for DMU0, u0, is given by:
u 0 ¼ max uλu
s:t:
X 0 �Xn
j¼1
λjXj
uY 0 �Xn
j¼1
λjYj
Xn
j¼1
λj ¼ 1
The DEA has some advantages that in this case are very important. For example, no
prices or costs are needed. The other important advantage is that it does not require an
assumption of the functional form relating inputs and outputs and they can have different
units.
The distance between the current outputs and the production frontier is called distance
function. Shephard introduced the distance function (Shephard 1953; Shephard, Gale, and
Kuhn 1970); this is a measure that evaluates a single DMU compared with the production
frontier using a vector of inputs and a vector of outputs. The distance function measures
the distance between the observed unit and the maximum production that could be
attained; in other words, how inefficient it is.
8 J.C. Valdivieso et al.
Dow
nloa
ded
by [
Uni
vers
ity o
f W
ater
loo]
at 1
1:26
15
Aug
ust 2
014
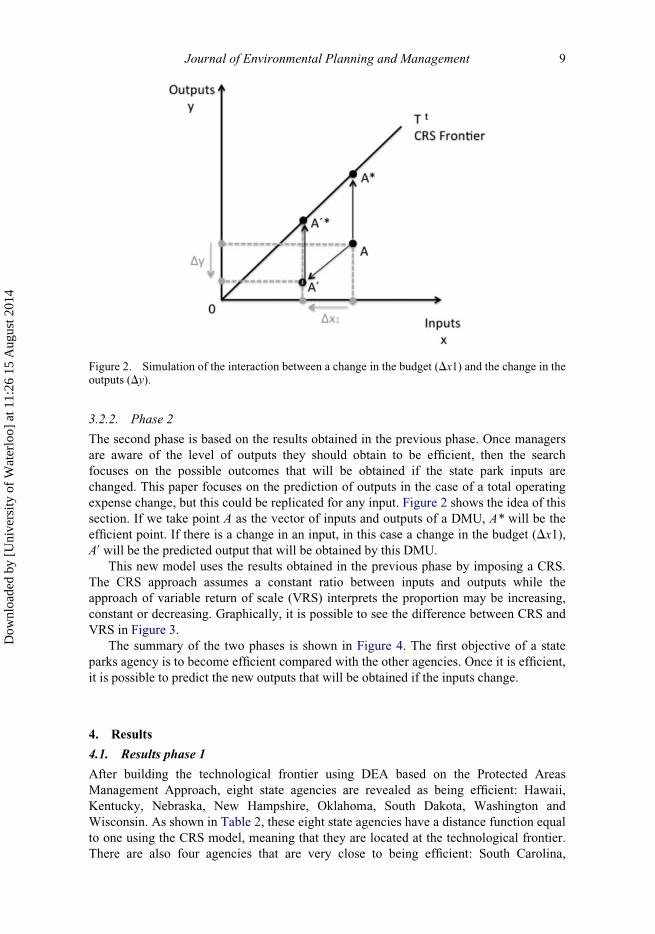
3.2.2. Phase 2
The second phase is based on the results obtained in the previous phase. Once managers
are aware of the level of outputs they should obtain to be efficient, then the search
focuses on the possible outcomes that will be obtained if the state park inputs are
changed. This paper focuses on the prediction of outputs in the case of a total operating
expense change, but this could be replicated for any input. Figure 2 shows the idea of this
section. If we take point A as the vector of inputs and outputs of a DMU, A* will be the
efficient point. If there is a change in an input, in this case a change in the budget (Dx1),A0 will be the predicted output that will be obtained by this DMU.
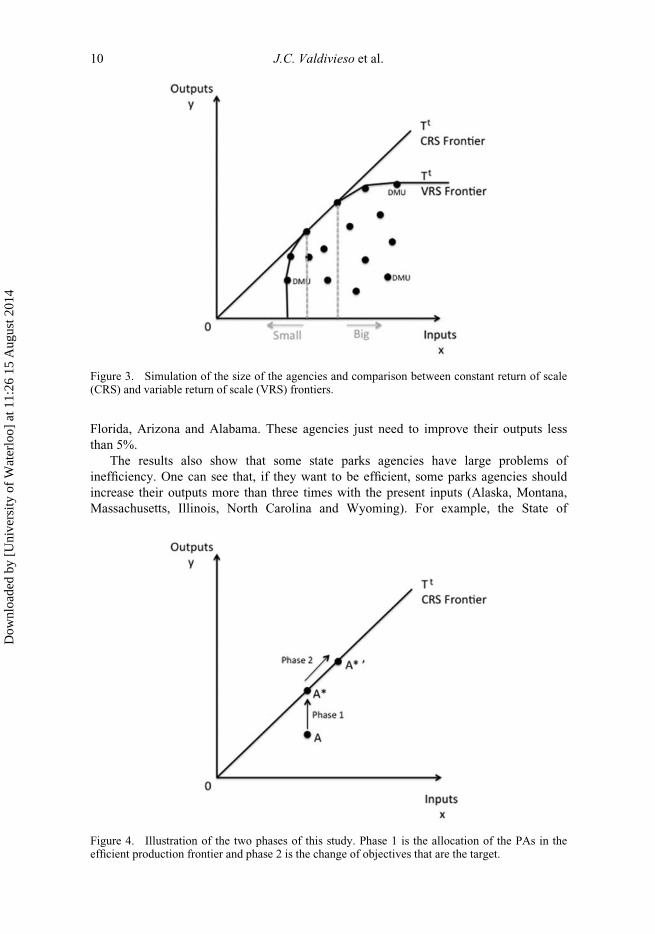
This new model uses the results obtained in the previous phase by imposing a CRS.
The CRS approach assumes a constant ratio between inputs and outputs while the
approach of variable return of scale (VRS) interprets the proportion may be increasing,
constant or decreasing. Graphically, it is possible to see the difference between CRS and
VRS in Figure 3.
The summary of the two phases is shown in Figure 4. The first objective of a state
parks agency is to become efficient compared with the other agencies. Once it is efficient,
it is possible to predict the new outputs that will be obtained if the inputs change.
4. Results
4.1. Results phase 1
After building the technological frontier using DEA based on the Protected Areas
Management Approach, eight state agencies are revealed as being efficient: Hawaii,
Kentucky, Nebraska, New Hampshire, Oklahoma, South Dakota, Washington and
Wisconsin. As shown in Table 2, these eight state agencies have a distance function equal
to one using the CRS model, meaning that they are located at the technological frontier.
There are also four agencies that are very close to being efficient: South Carolina,
Figure 2. Simulation of the interaction between a change in the budget (Dx1) and the change in theoutputs (Dy).
Journal of Environmental Planning and Management 9
Dow
nloa
ded
by [
Uni
vers
ity o
f W
ater
loo]
at 1
1:26
15
Aug
ust 2
014
Florida, Arizona and Alabama. These agencies just need to improve their outputs less
than 5%.
The results also show that some state parks agencies have large problems of
inefficiency. One can see that, if they want to be efficient, some parks agencies should
increase their outputs more than three times with the present inputs (Alaska, Montana,
Massachusetts, Illinois, North Carolina and Wyoming). For example, the State of
Figure 3. Simulation of the size of the agencies and comparison between constant return of scale(CRS) and variable return of scale (VRS) frontiers.
Figure 4. Illustration of the two phases of this study. Phase 1 is the allocation of the PAs in theefficient production frontier and phase 2 is the change of objectives that are the target.
10 J.C. Valdivieso et al.
Dow
nloa
ded
by [
Uni
vers
ity o
f W
ater
loo]
at 1
1:26
15
Aug
ust 2
014
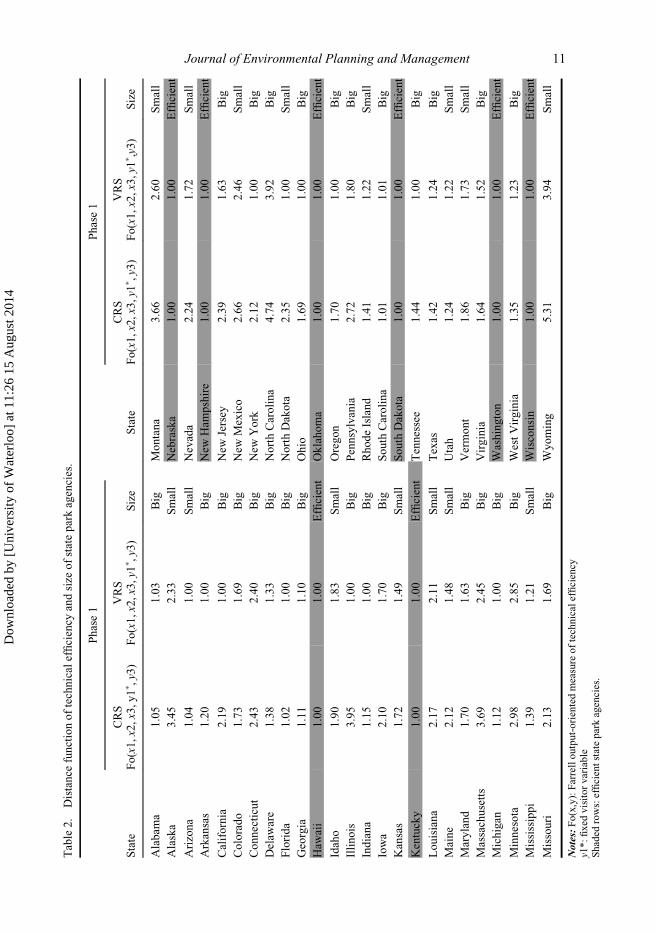
Table2.
Distance
functionoftechnicalefficiency
andsize
ofstateparkagencies.
Phase1
Phase1
State
CRS
Fo(x1,x2,x3,y1� ,y3)
VRS
Fo(x1,x2,x3,y1
� ,y3)
Size
State
CRS
Fo(x1,x2,x3,y1
� ,y3)
VRS
Fo(x1,x2,x3,y1
� ,y3)
Size
Alabam
a1.05
1.03
Big
Montana
3.66
2.60
Small
Alaska
3.45
2.33
Small
Nebraska
1.00
1.00
Efficient
Arizona
1.04
1.00
Small
Nevada
2.24
1.72
Small
Arkansas
1.20
1.00
Big
New
Ham
pshire
1.00
1.00
Efficient
California
2.19
1.00
Big
New
Jersey
2.39
1.63
Big
Colorado
1.73
1.69
Big
New
Mexico
2.66
2.46
Small
Connecticut
2.43
2.40
Big
New
York
2.12
1.00
Big
Delaw
are
1.38
1.33
Big
NorthCarolina
4.74
3.92
Big
Florida
1.02
1.00
Big
NorthDakota
2.35
1.00
Small
Georgia
1.11
1.10
Big
Ohio
1.69
1.00
Big
Haw
aii
1.00
1.00
Efficient
Oklahoma
1.00
1.00
Efficient
Idaho
1.90
1.83
Small
Oregon
1.70
1.00
Big
Illinois
3.95
1.00
Big
Pennsylvania
2.72
1.80
Big
Indiana
1.15
1.00
Big
RhodeIsland
1.41
1.22
Small
Iowa
2.10
1.70
Big
South
Carolina
1.01
1.01
Big
Kansas
1.72
1.49
Small
South
Dakota
1.00
1.00
Efficient
Kentucky
1.00
1.00
Efficient
Tennessee
1.44
1.00
Big
Louisiana
2.17
2.11
Small
Texas
1.42
1.24
Big
Maine
2.12
1.48
Small
Utah
1.24
1.22
Small
Maryland
1.70
1.63
Big
Vermont
1.86
1.73
Small
Massachusetts
3.69
2.45
Big
Virginia
1.64
1.52
Big
Michigan
1.12
1.00
Big
Washington
1.00
1.00
Efficient
Minnesota
2.98
2.85
Big
WestVirginia
1.35
1.23
Big
Mississippi
1.39
1.21
Small
Wisconsin
1.00
1.00
Efficient
Missouri
2.13
1.69
Big
Wyoming
5.31
3.94
Small
Notes:Fo(x,y):Farrelloutput-orientedmeasure
oftechnicalefficiency
y1*:fixed
visitorvariable
Shaded
rows:efficientstateparkagencies.
Journal of Environmental Planning and Management 11
Dow
nloa
ded
by [
Uni
vers
ity o
f W
ater
loo]
at 1
1:26
15
Aug
ust 2
014

Massachusetts could multiply its revenues by 3.69 times with the present technological
frontier. This means that, compared with the other state parks agencies, the State of
Massachusetts could be able to increase its revenues by 369%. In this research, the
greater the distance function, the higher the inefficiency.
Another visible result in this study is the scale problems and the size of the state park
agencies. In Table 2, we can see that some park agencies are efficient in the VRS model
and not in the CRS model. One of the reasons for this difference is due to the scale
problems. In Figure 3, it is possible to observe graphically how the DMUs that are
located at the left of the efficient ones are too small and the ones at the right are too big.
For example, California has an inefficiency of 2.19 in the CRS, but it is efficient in the
VRS. This means that this DMU should decrease in size, i.e. it is too big compared to the
other state parks agencies. The same happens, in a smaller level, with New York State
Agency. On the other hand, Arizona and North Dakota State Park Agencies are too small
and should increase their size. The average productivity at the most productive scale size
may not be attainable for other scale sizes (Banker, Charnes, and Cooper 1984). This
refers only to the management input and not to the size of the PAs. It is interesting to see
that, besides the efficient agencies, the other state agencies’ management capacities are
either too small or too big. The explanation of this behavior could be that the eight
efficient state agencies are very close to each other and they have the ideal size, at least
for this model.
4.2. Results phase 2
The results from phase 2 of this empirical research reveal that each state park agency will
have a different reaction in case of a change in the inputs. This model uses as example a
5% increase and a 5% decrease in the budget. This percentage followed the 5%
sequestration budget cuts mandated by the Congress of the United States of America in
March 2013 for federal agencies. This was a federal government reduction, but the figure
gives a possible change that could occur in state parks.
As expected, a budget change will not affect the outputs of all agencies in the same
extent. Some state park agencies will not be affected with this change and others will be
widely affected. In Table 3, it is possible to see that this budget change will lead to a
change between 0% and 10.2% of the total revenue. The reason is due to the weight that
budget has in the outcomes of each state park agency. If we take as an example the State
of Texas, we can see that an increase of 5% in the budget will result in an increase of
2.61% in the outputs. This means that, for example, the total predicted revenue generated
would increase more than $1 million with a 5% increase in the budget, from $39,279,567
to $40,304,763. To be efficient, they have to increase the revenues to almost
$57.5 million.
This phase 2 finding can be interpreted as the effect that a decision would have in the
outputs. Returning to Figure 2, we see that a change in the budget would change the new
point of efficiency but maintain the theoretical distance to the technological frontier. If
we take the State of New York as an example, a variation of 5% in the budget would have
an effect on the total revenue of 2.75%, but the distance to the technological frontier
would still be 2.12.
It is surprising to see that some state parks agencies are not affected in the same
proportion with the increase of 5% of the budget than with the decrease of 5%. This
difference between an increase and a decrease in the budget could be due to the so-called
12 J.C. Valdivieso et al.
Dow
nloa
ded
by [
Uni
vers
ity o
f W
ater
loo]
at 1
1:26
15
Aug
ust 2
014
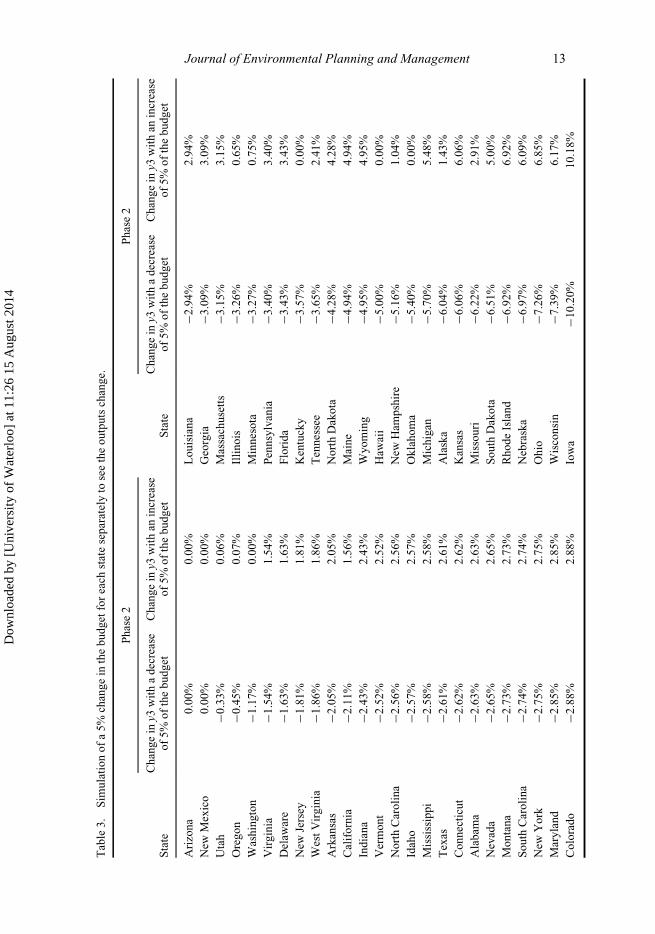
Table3.
Sim
ulationofa5%
changein
thebudgetforeach
stateseparatelyto
seetheoutputschange.
Phase2
Phase2
State
Changein
y3withadecrease
of5%
ofthebudget
Changein
y3withan
increase
of5%
ofthebudget
State
Changein
y3withadecrease
of5%
ofthebudget
Changein
y3withan
increase
of5%
ofthebudget
Arizona
0.00%
0.00%
Louisiana
¡2.94%
2.94%
New
Mexico
0.00%
0.00%
Georgia
¡3.09%
3.09%
Utah
¡0.33%
0.06%
Massachusetts
¡3.15%
3.15%
Oregon
¡0.45%
0.07%
Illinois
¡3.26%
0.65%
Washington
¡1.17%
0.00%
Minnesota
¡3.27%
0.75%
Virginia
¡1.54%
1.54%
Pennsylvania
¡3.40%
3.40%
Delaw
are
¡1.63%
1.63%
Florida
¡3.43%
3.43%
New
Jersey
¡1.81%
1.81%
Kentucky
¡3.57%
0.00%
WestVirginia
¡1.86%
1.86%
Tennessee
¡3.65%
2.41%
Arkansas
¡2.05%
2.05%
NorthDakota
¡4.28%
4.28%
California
¡2.11%
1.56%
Maine
¡4.94%
4.94%
Indiana
¡2.43%
2.43%
Wyoming
¡4.95%
4.95%
Vermont
¡2.52%
2.52%
Haw
aii
¡5.00%
0.00%
NorthCarolina
¡2.56%
2.56%
New
Ham
pshire
¡5.16%
1.04%
Idaho
¡2.57%
2.57%
Oklahoma
¡5.40%
0.00%
Mississippi
¡2.58%
2.58%
Michigan
¡5.70%
5.48%
Texas
¡2.61%
2.61%
Alaska
¡6.04%
1.43%
Connecticut
¡2.62%
2.62%
Kansas
¡6.06%
6.06%
Alabam
a¡2
.63%
2.63%
Missouri
¡6.22%
2.91%
Nevada
¡2.65%
2.65%
South
Dakota
¡6.51%
5.00%
Montana
¡2.73%
2.73%
RhodeIsland
¡6.92%
6.92%
South
Carolina
¡2.74%
2.74%
Nebraska
¡6.97%
6.09%
New
York
¡2.75%
2.75%
Ohio
¡7.26%
6.85%
Maryland
¡2.85%
2.85%
Wisconsin
¡7.39%
6.17%
Colorado
¡2.88%
2.88%
Iowa
¡10.20%
10.18%
Journal of Environmental Planning and Management 13
Dow
nloa
ded
by [
Uni
vers
ity o
f W
ater
loo]
at 1
1:26
15
Aug
ust 2
014
“slack”. The problem with slacks continues to be deficient in DEA in its treatment to non-
zero slacks (Cooper, Seiford, and Zhu 2011).
5. Conclusions, limitations and extensions
Target 11 of the Aichi Targets calls for an increase of the number of PAs, and an increase
in effective and equitable management (Woodley et al. 2012). It is recommended that
management agencies, partners and funders continue to cooperate to help PAs achieve
minimum basic standards (Leverington et al. 2010). This empirical work shows
interesting results that can be useful for stakeholders. Visitor related developments
generally represent both the best opportunity for appreciation of the park and the key
internal threats to its biophysical or cultural integrity (Eagles and McCool 2002).
Two main conclusions were found in this study. The first one is the importance that
DEA has for comparing parks agencies and evaluating their touristic management
capacity. Tourism will not only provide needed funding for management but also serve as
an engine of economic development and benefits for nearby residents and communities
(McCool et al. 2012). This methodology allows for comparison of the managers’
performance of the different PA systems through evaluating the results of the revenue
generated.
Managers will want to know who is affected by an action and how (Eagles and
McCool 2002). The second part of the research answers this uncertainty: how they are
affected by a change? It is important to know the impacts that the different actions will
have on the outputs. This section shows that it is possible to predict the new outputs if
there is a change in the inputs. Particularly, this analysis illustrates the effect that a 5%
change in the agency’s budget will have in the total revenue they will generate. This will
help stakeholders to quantify changes and consequently to take better decisions. As a
conclusion of this section, we can say that each state agency will be affected in a different
degree and if the government decides to make a budget reduction, it should consider that
each park agency would be affected in a different degree.
Finally, this paper allows state park agencies in the USA to see their performance and
the problems associated with achieving the tourism efficiency. This methodology could
be replicated and some extensions could be done with other groups of agencies or with
individual PAs.
DEA is an effective approach in cases with no strict functional relationship between
factors of production like the public sector or the non-profit organizations (Golany and
Roll 1989). At the same time it has some limitations. The first challenge facing this
approach, in order to be implemented, is the need to have all the values of the required
variables (Sena 2003), this reduces the number of DMUs available. It also evaluates only
the relative efficiency within the studied group (Golany and Roll 1989) and not with the
theoretical maximum. Related to this study specifically, the research uses an extensive
dataset that was created for other purposes. For that reason the approach had to be
adapted. For example, for the input infrastructure and equipment, the only data available
to all states were the number of campsites. This variable only exemplifies the
infrastructure available. Another important limitation of this methodology is that it only
compares the inputs and outputs of PAs and does not take into account the entire
framework for assessing management effectiveness of PAs.
Other than the limitations of the methodology per se, this approach has also other
ones. This study uses only quantitative variables that are easier to obtain but they are not
always representative. For example, not only it is important to use the number of
14 J.C. Valdivieso et al.
Dow
nloa
ded
by [
Uni
vers
ity o
f W
ater
loo]
at 1
1:26
15
Aug
ust 2
014
employees but also the level of education, the personnel incentives and the effective time
dedicated to the park. For future studies, it will be important to take this limitation into
account.
Several extensions can be derived from this study. This paper only analyzed the
efficiency from a touristic point of view. Future studies should involve all outputs of
the protected areas management effectiveness. This is especially difficult to due to the
absence of data available containing the information required. In case of obtaining the
information, it would also be interesting to replicate the research comparing the different
governance model and study if there are differences between them. For that research, it
will be important to focus on the eight most common management models: (1) Golden
Era National Park model; (2) Parastatal model; (3) Non-profit Organization model;
(4) Ecolodge model; (5) Public and For-profit Private Combination model; (6) Public and
Non-profit Private Combination model; (7) the Aboriginal Ownership and Government
Management model; and (8) Traditional-Community model (Eagles 2009).
Another interesting extension to this approach will be to add, to the model, bad
outputs (Scheel 2001). Normally, when using DEA approach, the outputs analyzed are
good outputs. But this is not always true because bad outputs such as CO2 emissions,
deforestation or animal extinction may exist.
Funding
This work was supported by the Government of Ecuador under a scholarship from the Secretar�ıaNacional de Educaci�on Superior, Ciencia, Tecnolog�ıa e Innovaci�on.
References
Adams, C., R. Seroa da Motta, R.A. Ortiz, J. Reid, C. Ebersbach, and P.A. de Almeida. 2008. “TheUse of Contingent Valuation for Evaluating Protected Areas in the Developing World:Economic Valuation of Morro Do Diabo State Park, Atlantic Rainforest, S~ao.” EcologicalEconomics 66 (2): 359�370.
Adler, N., and B. Golany. 2001. “Evaluation of Deregulated Airline Networks Using DataEnvelopment Analysis Combined with Principal Component Analysis with an Application toWestern Europe.” European Journal of Operational Research 132 (2): 260�273.
Anderson, R.I., M. Fish, Y. Xia, and F. Michello. 1999. “Measuring Efficiency in the HotelIndustry: A Stochastic Frontier Approach.” International Journal of Hospitality Management18 (1): 45�57.
Banker, R.D., A. Charnes, and W.W. Cooper 1984. “Some Models for Estimating Technical andScale Inefficiencies in Data Envelopment Analysis.”Management Science 30 (9): 1078�1092.
Barbot, C., A. Costa, and E. Sochirca. 2008. “Airlines Performance in the New Market Context: AComparative Productivity and Efficiency Analysis.” Journal of Air Transport Management14 (5): 270�274.
Barla, P., and S. Perelman. 1989. “Technical Efficiency in Airlines Under Regulated andDeregulated Environments�.” Annals of Public and Cooperative Economics 60 (1): 103�124.
Barros, C.P. 2005. “Measuring Efficiency in the Hotel Sector.” Annals of Tourism Research 32 (2):456�477.
Barros, C.P., and �A. Matias. 2006. “Assessing the Efficiency of Travel Agencies with a StochasticCost Frontier: A Portuguese Case Study.” International Journal of Tourism Research 8 (5):367�379.
Beech, T., M. Dowd, C. Field, B. Hatcher, and S. Andr�efou _et. 2008. “A Stochastic Approach toMarine Reserve Design: Incorporating Data Uncertainty.” Ecological Informatics 3 (4�5):321�333.
Belokurov, A., C. Besancon, H. Pavese, N.D. Burgess, N. Dudley, S. Stolton, M. Hockings, F.Leverington, K. MacKinnon, and T. Whitten. 2009. “New Resources for Assessing theEffectiveness of Management in Protected Areas.” Oryx 43 (1): 14.
Journal of Environmental Planning and Management 15
Dow
nloa
ded
by [
Uni
vers
ity o
f W
ater
loo]
at 1
1:26
15
Aug
ust 2
014
Bertzky, B., C. Corrigan, J. Kemsey, S. Kenney, C. Ravilious, C. Besancon, and N. Burgess. 2012.Protected Planet Report 2012: Tracking Progress towards Global Targets for Protected Areas.Gland, Switzerland and Cambridge, UK: UNEP-WCMC, IUCN.
Blanke, J., and T. Chiesa. 2008. “The Travel & Tourism Competitiveness Index 2008: MeasuringKey Elements Driving the Sector’s Development.” In The Travel & Tourism CompetitivenessReport 2008: Balancing Economic Development and Environmental Sustainability, 3�26.Geneva, Switzerland: World Economic Forum.
Bosetti, V., and G. Locatelli. 2006. “A Data Envelopment Analysis Approach to the Assessment ofNatural Parks’ Economic Efficiency and Sustainability. The Case of Italian National Parks.”Sustainable Development 14 (4): 277�286.
Brown, J.R., and C.T. Ragsdale. 2002. “The Competitive Market Efficiency of Hotel Brands: AnApplication of Data Envelopment Analysis.” Journal of Hospitality & Tourism Research26 (4): 332�360.
Bruner, A.G., R.E. Gullison, R.E. Rice, and G.A. da Fonseca. 2001. “Effectiveness of Parks inProtecting Tropical Biodiversity.” Science 291 (5501): 125�128. doi:10.1126/science.291.5501.125.
Butchart, S.H.M., M. Walpole, B. Collen, A. Van Strien, J.P.W. Scharlemann, R.E.A. Almond, J.E.M. Baillie, B. Bomhard, C. Brown, and J. Bruno. 2010. “Global Biodiversity: Indicators ofRecent Declines.” Science 328 (5982): 1164�1168.
CBD (Convention on Biological Diversity). 2010. “Strategic Plan for Biodiversity 2011-2010 andthe Aichi Biodiversity Targets.” In Conference Of The Parties To The Convention OnBiological Diversity. Nagoya, Japan.
Charnes, A., W.W. Cooper, and E. Rhodes. 1978. “Measuring the Efficiency of Decision MakingUnits.” European Journal of Operational Research 2 (6): 429�444.
Chen, C.F. 2007. “Applying the Stochastic Frontier Approach to Measure Hotel ManagerialEfficiency in Taiwan.” Tourism Management 28 (3): 696�702.
Cifuentes, M., A. Izurieta, and H.H. de Faria. 2000. “Measuring Protected Area ManagementEffectiveness.” Turrialba (Costa Rica): World Wildlife Fund.
Coelli, T., S. Perelman, and E. Romano. 1999. “Accounting for Environmental Influences inStochastic Frontier Models: With Application to International Airlines.” Journal ofProductivity Analysis 11 (3): 251�273.
Coelli, T.J., D.S. Prasada Rao, C.J. O’Donnell, and George E. Battese. 2005. “Data EnvelopmentAnalysis.” In An Introduction to Efficiency and Productivity Analysis, 161�181. Springer US.http://www.springer.com/economics/econometrics/book/978-0-387-24265-1
Cooper, W., L. Seiford, and J. Zhu. 2011. Data Envelopment Analysis: History, Models, andInterpretations. In Handbook on Data Envelopment Analysis, Second Edition, 1�39. SpringerUS.
Dharmaratne, G.S., F. Yee Sang, and L.J. Walling. 2000. “Tourism Potentials for FinancingProtected Areas.” Annals of Tourism Research 27 (3): 590�610.
Dudley, N. 2008. Guidelines for Applying Protected Area Management Categories. Gland,Switzerland: IUCN.
Eagles, P.F.J. 1995. “Tourism and Canadian Parks: Fiscal Relationships.” Managing Leisure 1 (1):16�27.
Eagles, P.F.J. 2002. “Trends in Park Tourism: Economics, Finance and Management.” Journal ofSustainable Tourism 10 (2): 132�153.
Eagles, P.F.J. 2009. “Governance of Recreation and Tourism Partnerships in Parks and ProtectedAreas.” Journal of Sustainable Tourism 17 (2): 231�248.
Eagles, P.F.J., S.F. McCool, and C.D. Haynes. 2002. Sustainable Tourism in Protected Areas:Guidelines for Planning and Management. Gland, Switzerland and Cambridge, UK: IUCN.
Eagles, P.F.J., and S.F. McCool. 2002. Tourism in National Parks and Protected Areas: Planningand Management. Wallingford: CABI.
Farrell, M.J. 1957. “The Measurement of Productive Efficiency.” Journal of the Royal StatisticalSociety. Series A (General) 120 (3): 253�290.
Fethi, M.D., P.M. Jackson, and TG Weyman-Jones. 2000. “Measuring the Efficiency of EuropeanAirlines: An Application of DEA and Tobit Analysis.” University of Leicester Efficiency andProductivity Research Unit.
16 J.C. Valdivieso et al.
Dow
nloa
ded
by [
Uni
vers
ity o
f W
ater
loo]
at 1
1:26
15
Aug
ust 2
014
Gilroy, L., H. Kenny, and J. Morris. 2013. “Parks 2.0: Operating State Parks Through Public-PrivatePartnerships.” Washington D.C.:Conservation Leadership Council and Reason Foundation &Buckeye Institute.
Golany, B., and Y. Roll. 1989. “An Application Procedure for DEA.” Omega 17 (3): 237�250.Good, D.H., L.H. Roller, and R.C. Sickles. 1995. “Airline Efficiency Differences between Europe
and the US: Implications for the Pace of EC Integration and Domestic Regulation.” EuropeanJournal of Operational Research 80 (3): 508�518.
G€ossling, S., P. Peeters, J.P. Ceron, G. Dubois, T. Patterson, and R.B. Richardson. 2005. “The Eco-Efficiency of Tourism.” Ecological Economics 54 (4): 417�434.
Green, H., C. Hunter, and B. Moore. 1990. “Assessing the Environmental Impact of TourismDevelopment� 1: Use of the Delphi Technique.” Tourism Management 11 (2): 111�120.
Hannah, L., G. Midgley, S. Andelman, M. Ara�ujo, G. Hughes, E. Martinez-Meyer, R. Pearson, andP. Williams. 2007. “Protected Area Needs in a Changing Climate.” Frontiers in Ecology andthe Environment 5 (3): 131�138.
Hardy, A.L., and R.J.S. Beeton. 2001. “Sustainable Tourism or Maintainable Tourism: ManagingResources for More than Average Outcomes.” Journal of Sustainable Tourism 9 (3): 168�192.
Hockings, M. 2003. “Systems for Assessing the Effectiveness of Management in Protected Areas.”Bioscience 53 (9): 823�832.
Hockings, M., S. Stolton, F. Leverington, N. Dudley, and J. Courrau. 2006. EvaluatingEffectiveness: A Framework for Assessing Management Effectiveness of Protected Areas.Second Edition. Gland, Switzerland and Cambridge, UK: IUCN.
Hof, J., C. Flather, T. Baltic, and R. King. 2004. “Forest and Rangeland Ecosystem ConditionIndicators: Identifying National Areas of Opportunity Using Data Envelopment Analysis.”Forest Science 50 (4): 473�494.
Hsieh, L.F., and L.H. Lin. 2010. “A Performance Evaluation Model for International Tourist Hotelsin Taiwan�An Application of the Relational Network DEA.” International Journal ofHospitality Management 29 (1): 14�24.
Huybers, T., and J. Bennett. 2003. “Environmental Management and the Competitiveness ofNature-Based Tourism Destinations.” Environmental and Resource Economics 24 (3):213�233.
Hwang, S.N., and T.Y. Chang. 2003. “Using Data Envelopment Analysis to Measure HotelManagerial Efficiency Change in Taiwan.” Tourism Management 24 (4): 357�369.
Kates, R.W., W.C. Clark, R. Corell, J.M. Hall, C.C. Jaeger, I. Lowe, J.J. McCarthy, et al. 2001.“Sustainability Science.” Science 292 (5517): 641�642.
K€oksal, Can Deniz, and A. Akin Aksu. 2007. “Efficiency Evaluation of A-Group Travel Agencieswith Data Envelopment Analysis (DEA): A Case Study in the Antalya Region, Turkey.”Tourism Management 28 (3): 830�834.
Kuosmanen, T., and M. Kortelainen. 2005. “Measuring Eco�efficiency of Production with DataEnvelopment Analysis.” Journal of Industrial Ecology 9 (4): 59�72.
Landrum, N.C. 2005. “Entrepreneurism in America’s State Parks.” The George Wright Forum, 22(2): 26�32.
Leverington, F., and M.T. Hockings. 2004. “Evaluating the effectiveness of protected areamanagement: the challenge of change.” In Securing Protected Areas in the Face of GlobalChange Issues and Strategies, 169�212. Gland and Cambridge: IUCN Publications ServicesUnit.
Leverington, F., K. Lemos Costa, H. Pavese, A. Lisle, and M. Hockings. 2010. “A Global Analysisof Protected Area Management Effectiveness.” Environmental Management 46 (5): 685�698.
Malmquist, S. 1953. “Index Numbers and Indifference Surfaces.” Trabajos de Estadistica Y deInvestigacion Operativa 4 (2): 209�242.
McCool, S.F. 2006. “Managing for Visitor Experiences in Protected Areas: PromisingOpportunities and Fundamental Challenges.” Parks: The International Journal for ProtectedAreas Managers 16 (2): 3�9.
McCool, S., Y. Hsu, S. Brant Rocha, A.D. SæÞ�orsd�ottir, L. Gardner, and W. Freimund. 2012.“Building the Capability to Manage Tourism as Support for the Aichi Target.” PARKS 18 (2):92�106.
Moore, S.A., and A. Polley. 2007. “Defining Indicators and Standards for Tourism Impacts inProtected Areas: Cape Range National Park, Australia.” Environmental Management 39 (3):291�300.
Journal of Environmental Planning and Management 17
Dow
nloa
ded
by [
Uni
vers
ity o
f W
ater
loo]
at 1
1:26
15
Aug
ust 2
014

Mu~noz-Santos, M., and Javier Benayas. 2012. “A Proposed Methodology to Assess the Quality ofPublic Use Management in Protected Areas.” Environmental Management 50 (1) (Jul):106�22. doi:10.1007/s00267-012-9863-0.
Murillo-Zamorano, L.R. 2004. “Economic Efficiency and Frontier Techniques.” Journal ofEconomic Surveys 18 (1): 33�77.
NASPD (National Association of State Park Directors). 2013. “Statistical Report of State ParkOperations: 2011�2012 (Vol. 34).” Raleigh, NC.
Naughton-Treves, L., M. Buck Holland, and K. Brandon. 2005. “The Role of Protected Areas inConserving Biodiversity and Sustaining Local Livelihoods.” Annual Review of Environmentand Resources 30: 219�252.
Redford, K.H., and P. Feinsinger. 2001. “The Half-Empty Forest: Sustainable Use and the Ecologyof Interactions.” In Conservation of Exploited Species, 370�400. Cambridge: ConservationBiology Series.
Reynolds, D., and D. Biel. 2007. “Incorporating Satisfaction Measures into a RestaurantProductivity Index.” International Journal of Hospitality Management 26 (2): 352�361.
Romagosa, F., P.F.J. Eagles, and W. Buteau Duitschaever. 2012. “Evaluaci�on de La Gobernanza EnLos Espacios Naturales Protegidos. El Caso de La Columbia Brit�anica Y Ontario (Canad�a).”Anales de Geograf�ıa de La Universidad Complutense 32:133�151.
Saayman, M., and A. Saayman. 2006. “Estimating the Economic Contribution of Visitor Spendingin the Kruger National Park to the Regional Economy.” Journal of Sustainable Tourism, 14 (1):67�81.
Sanjeev, G.M. 2007. “Measuring Efficiency of the Hotel and Restaurant Sector: The Case of India.”International Journal of Contemporary Hospitality Management 19 (5): 378�387.
Scheel, H. 2001. “Undesirable Outputs in Efficiency Valuations.” European Journal of OperationalResearch 132 (2): 400�410.
Scheraga, C.A. 2004. “Operational Efficiency versus Financial Mobility in the Global AirlineIndustry: A Data Envelopment and Tobit Analysis.” Transportation Research Part A: Policyand Practice 38 (5): 383�404.
Semenick, A., and R.C. Sickles. 2000. “Time Series Analysis of Deregulatory Dynamics andTechnical Efficiency: The Case of the US Airline Industry.” International Economic Review41 (1): 203�218.
Sena, V. 2003. “The frontier approach to the measurement of productivity and technical efficiency.”Economic Issues-Stoke on Trent 8 (2): 71�98.
Shephard, R.W. 1953. Cost and production functions. Princeton, NJ: Princeton University Press.Shephard, R.W., D. Gale, and H.W. Kuhn. 1970. Theory of cost and production functions.
Princeton, NJ: Princeton University Press.Smith, R.J., R.D.J. Muir, M.J. Walpole, A. Balmford, and N Leader-Williams. 2003. “Governance
and the Loss of Biodiversity.” Nature 426 (6962): 67�70.Tsaur, S.H. 2001. “The Operating Efficiency of International Tourist Hotels in Taiwan.” Asia
Pacific Journal of Tourism Research 6 (1): 73�81.Van der Duim, R., and J. Caalders. 2002. “Biodiversity and Tourism: Impacts and Interventions.”
Annals of Tourism Research 29 (3): 743�761.WDPA (World Database on Protected Areas). 2012. Growth in Global Number of Protected Areas
(1911�2011). Cambridge: IUCN and UNEP-WCMC.Wearing, S., and J. Neil. 2009. Ecotourism: impacts, potentials and possibilities. Oxford: Elsevier.Whitelaw, P.A., B.E.M. King, and D. Tolkach. 2014. “Protected Areas, Conservation and
Tourism�financing the Sustainable Dream.” Journal of Sustainable Tourism 22 (4): 584�603.Williams, P.W., and I.F. Ponsford. 2009. “Confronting Tourism’s Environmental Paradox:
Transitioning for Sustainable Tourism.” Futures 41 (6): 396�404.Wilshusen, P.R., S.R. Brechin, C.L. Fortwangler, and P.C. West. 2002. “Reinventing a Square
Wheel: Critique of a Resurgent ‘Protection Paradigm’ in International BiodiversityConservation.” Society & Natural Resources 15 (1): 17�40.
Woodley, S., B. Bertzky, N. Crawhall, N. Dudley, J.M. Londo~no, K. MacKinnon, K. Redford, andT. Sandwith. 2012. “Meeting Aichi Target 11: What Does Success Look like for ProtectedArea Systems?” PARKS 18 (1): 23.
18 J.C. Valdivieso et al.
Dow
nloa
ded
by [
Uni
vers
ity o
f W
ater
loo]
at 1
1:26
15
Aug
ust 2
014