do climatic or institutional factors drive seasonal patterns of tourism visitation to protected...
TRANSCRIPT

Tourism GeographiesVol. 13, No. 2, 187–208, May 2011
Do Climatic or Institutional Factors DriveSeasonal Patterns of Tourism Visitationto Protected Areas across Diverse ClimateZones in Eastern Australia?
WADE L. HADWEN*, ANGELA H. ARTHINGTON*, PAUL I. BOON**,BRETT TAYLOR† & CHRISTINE S. FELLOWS*
*Australian Rivers Institute, Griffith University, Nathan, Brisbane, Australia**Institute for Sustainability & Innovation, Victoria University, Melbourne, Australia†Biodiversity Assessment and Management (BAAM), Brisbane, Australia
Abstract Seasonality in tourism is a regular and predictable cycle of visitation across ayear. Although seasonality in visitation is extremely common and is known, in principle,often to be driven by temporal changes in a range of natural and institutional factors, therelative importance of different individual pressures has yet to be quantified for any large-scalegeographical areas. To assess the relative importance of natural versus institutional factorsin driving tourism seasonality, data on visitation patterns were collated from 23 protectedareas across six Koppen climate zones in eastern Australia. Analyses sought to determine thedegree to which climatic variables (such as mean monthly rainfall and minimum and maximumtemperatures) explained visitation patterns, and to understand how these relationships couldassist in the prediction of tourism futures. Climate was the principal force driving seasonalpatterns of visitation in equatorial, tropical, desert, grassland and temperate zones, whereasvisitation to alpine/sub-alpine areas was driven by a complex array of natural and institutionalfactors. Tourism seasonality was driven mostly by institutional factors only in the sub-tropicalclimate zone. These analyses suggest that seasonal characteristics of current visitation couldbe used to predict the degree to which changes in climate and/or institutional arrangements,such as school holiday periods, might influence tourism opportunities in protected areas ineastern Australia.
Key Words: Koppen climate zones, climate change, visitation, future tourism, management,adaptation
Correspondence Address: Wade L. Hadwen, Australian Rivers Institute, Griffith University, Griffith Schoolof Environment, Nathan Campus, Nathan, Brisbane, 4111, Australia. Fax: +61 7 3735 7615; Tel.: +61 73735 3987; Email: [email protected]
ISSN 1461-6688 Print/1470-1340 Online /11/02/00187–22 C© 2011 Taylor & FrancisDOI: 10.1080/14616688.2011.569568
Downloaded By: [Griffith University] At: 20:38 8 June 2011

188 W. L. Hadwen et al.
Introduction
Growth in demand for natural area tourism over the past two decades has seen annualvisitor numbers rise in protected areas globally (Newsome et al. 2002). Patterns of vis-itation to many protected areas are typically highly seasonal, often with peak periodsoccurring in relatively narrow windows of time (Baum & Lundtorp 2001; Grindley2005; Hadwen et al. 2008). Such strong temporal patterns in visitation (known as‘tourism seasonality’) to natural areas are, however, unsurprising, as seasonality isone of the most significant defining characteristics of tourism (Butler 2001; Scott &Lemieux 2009). Indeed, many researchers have highlighted the significant challengethat tourism seasonality poses for employment opportunities, visitor accommoda-tion and the sustainable use of natural resources, especially in regional destinations(Ashworth & Thomas 1999; Adler & Adler 2003; Jang 2004).
Researchers have identified two main causes of seasonality in tourism: (i) factorsrelated to natural phenomena, such as climate, landforms and ecological charac-teristics; and (ii) factors that are institutional and/or social (Butler 2001). Naturalseasonality is driven largely by climatic conditions (e.g. temperature, rainfall) andother aspects of the natural world (such as migrations of iconic animal species, wild-flower flowering times etc.), whereas institutional seasonality is driven largely bysocietal practices and factors, such as the timing of major holiday periods (Butler2001). Depending on the destination and the sector of interest, different researchershave claimed that either natural or institutional factors have a greater influence onseasonality in tourism. For example, Nadal et al. (2004) and Parrilla et al. (2007)indicated that economic and accommodation factors, respectively, determined sea-sonality in tourism in Spain. In contrast, Scott et al. (2008a) and Scott & Lemieux(2009) have recently highlighted the critical role that climate can play in drivingholiday destination choice and tourism seasonality in North America.
Other studies have suggested that tourism seasonality in natural areas is influencedby both natural and institutional factors. For example, Grindley (2005) noted a pro-nounced temporal variability of visitation to Elgon National Park in Uganda, withpeaks in July/August and December/January that were closely tied both to anticipatedweather patterns (a climatic and, thus, natural, factor) and the annual holiday periodsof the dominant overseas visitors from Europe and North America (an institutionalfactor). For many protected areas, such as national parks, it is not unreasonable topostulate that climate plays a strong role in explaining visitation patterns, as thesesites often have few or limited facilities to provide visitors with respite from adverseweather events (such as heavy rain or high humidity, extreme cold or heat, and sandor snow storms), which could restrict visitation to particular times of year (Butler2001). Moreover, it is the natural environment in protected areas that is attractiveto tourists and its appeal will change with seasonal patterns in weather and criticalecological processes, such as animal migration and plant flowering. Indeed, manyresearchers have commented on the role of climate (and/or weather) in influencing
Downloaded By: [Griffith University] At: 20:38 8 June 2011

Seasonal Tourism Visitation to Diverse Climate Zones, Australia 189
tourism and recreation in natural areas (e.g. de Freitas 2003; Keller et al. 2005).Given that both natural and institutional factors can, in principle, establish and main-tain tourism seasonality in natural areas, planners require an understanding of therelative importance of these different sorts of factors to ensure future provision offacilities, accommodation and activities for visitors (Scott & Lemieux 2009).
While many studies have identified the types of natural and institutional driversthat affect seasonality in tourism for particular destinations over relatively smallspatial scales (Ashworth & Thomas 1999; Nadal et al. 2004; Parrilla et al. 2007),there have been few or no large-scale geographical analyses of patterns of tourismseasonality and the factors that control it, nor many analyses that span a large rangeor diversity of Koppen climate zones. For example, whilst studies in Canada by Jones& Scott (2006) and the USA by Hyslop (2007) have examined the role of climate(and climate change) in influencing visitation in national parks across many differentclimate zones, neither of these studies incorporated investigations of institutionaldrivers of seasonality.
Australia provides an excellent case study for which analyses of tourism season-ality can be elaborated, since the entire country (7,617,930 km2) is governed by asingle Federal government (albeit with separate State and Territory governments)and, therefore, has relatively homogeneous institutional arrangements that fix thetiming of school and public holidays. Furthermore, given its large size, Australiahas climatic conditions that are extraordinarily diverse along a gradient of over 30◦
latitude (Colls & Whitaker 2001), with six Koppen climate zones stretching fromthe equatorial north (c. 10◦S) to the cool temperate south of the country (c. 45◦S)(Figure 1). These climate zones range latitudinally from monsoonal and wet–drytropics in the north to alpine and cool temperate climate zones in the south. Thediversity and climatic contrasts of the country support a wide variety of ecosys-tem types and biological phenomena across Australia, for example, bird-breedingevents, wildflower seasons and fishing opportunities. Coupled with the demon-strated appeal of the natural environment for domestic and international travellersto Australia (Newsome et al. 2002), the diversity in climate and ecosystem typessuggests that the drivers of tourism seasonality across Australia may vary consid-erably with location along the latitudinal gradient and related change in climaticzone.
In light of the appeal of natural area settings and the broad range of climates andecosystems that occur across the country, it was predicted that natural, and especiallyclimatic, variables would explain most of the seasonality of tourist visitation to naturalareas in Australia, especially in the more climatically extreme northern and arid inlandparts of the country. Indeed, there is a general and somewhat intuitive understandingof climatic seasonality in Australia and its implications for tourism, as seen in thetravel recommendations provided on the Australian Bureau of Meteorology website(www.bom.gov.au; accessed 4 July 2009). These state that:
Downloaded By: [Griffith University] At: 20:38 8 June 2011
190 W. L. Hadwen et al.
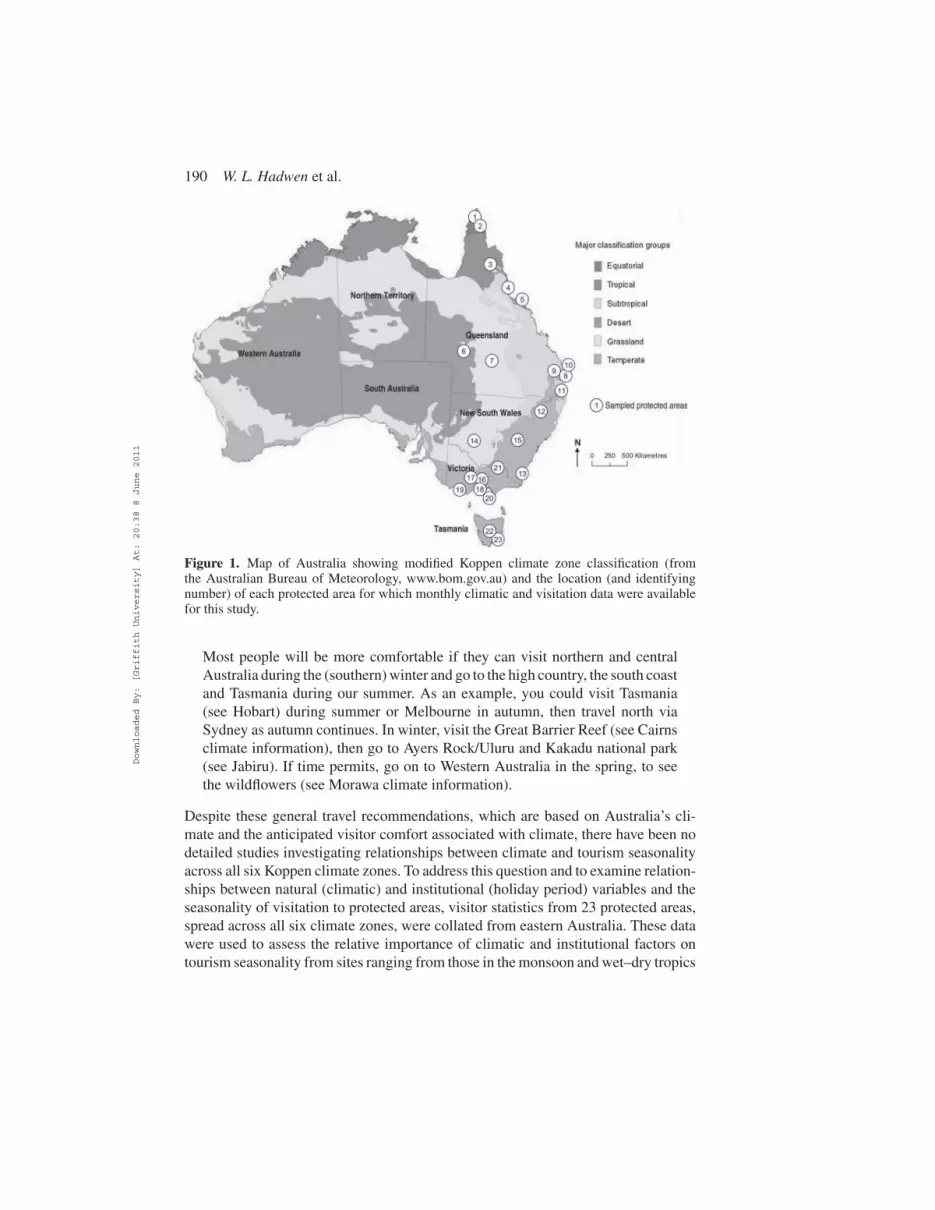
Figure 1. Map of Australia showing modified Koppen climate zone classification (fromthe Australian Bureau of Meteorology, www.bom.gov.au) and the location (and identifyingnumber) of each protected area for which monthly climatic and visitation data were availablefor this study.
Most people will be more comfortable if they can visit northern and centralAustralia during the (southern) winter and go to the high country, the south coastand Tasmania during our summer. As an example, you could visit Tasmania(see Hobart) during summer or Melbourne in autumn, then travel north viaSydney as autumn continues. In winter, visit the Great Barrier Reef (see Cairnsclimate information), then go to Ayers Rock/Uluru and Kakadu national park(see Jabiru). If time permits, go on to Western Australia in the spring, to seethe wildflowers (see Morawa climate information).
Despite these general travel recommendations, which are based on Australia’s cli-mate and the anticipated visitor comfort associated with climate, there have been nodetailed studies investigating relationships between climate and tourism seasonalityacross all six Koppen climate zones. To address this question and to examine relation-ships between natural (climatic) and institutional (holiday period) variables and theseasonality of visitation to protected areas, visitor statistics from 23 protected areas,spread across all six climate zones, were collated from eastern Australia. These datawere used to assess the relative importance of climatic and institutional factors ontourism seasonality from sites ranging from those in the monsoon and wet–dry tropics
Downloaded By: [Griffith University] At: 20:38 8 June 2011

Seasonal Tourism Visitation to Diverse Climate Zones, Australia 191
in the northern parts of eastern Australia, to the arid interior, the coastal sub-tropicsand the alpine and cool temperate zones of south-eastern Australia.
Materials and Methods
Visitor Data
To examine visitation variability for a range of protected areas throughout Australia,all Australian State and Territory government agencies responsible for protected-area management were contacted, with a request for access to visitor statistics fromprotected areas within their jurisdictions. This request specifically sought monthly (orshorter) duration visitor statistics, as the major aim of the analyses was to determinewhether there were significant intra-annual relationships between visitation, climateand holiday periodicity, rather than to interrogate the data for long-term (i.e. inter-annual) trends in visitation.
Responses from government agencies for access to their visitation statistics werehighly variable. Across most agencies and for most protected areas, generally very lit-tle suitable data were available to assess intra-annual temporal variation (i.e. monthlyand seasonal patterns) in visitor numbers. This lack of suitable data is perhaps due, atleast in part, to the fact that entry to natural areas is typically free in Australia and, asa result, there are few opportunities for protected-area managers to collect visitationstatistics. As a result, the protected areas that were included in this study were de-pendent largely on whether appropriate visitor data were available with the necessaryquality and temporal resolution. The availability of useable visitor data restricted ouranalyses to national parks in Queensland and a smaller number of national parks andreserves from New South Wales, Victoria and Tasmania, that is, eastern Australia(see Figure 1 and below for details). Although data were requested from agenciesin the Northern Territory, Western Australia and South Australia, none were madeavailable. In total, visitor information from 23 protected areas was collated. Fortu-nately, these sites spanned all of the six major Koppen climate zones in Australia(Figure 1).
In addition to the patchiness of visitor statistics across the jurisdictions, the qualityand quantity of data from each of the four State agencies were variable (Table 1).Most importantly, the methods of data collection used by different natural-area man-agers differed, from ‘number of camping permits sold’ to ‘road counter estimates ofvisitor loads’ to ‘visitor counts in visitor information centres’. Even within a singleprotected area, these different recording methods are known to be subject to substan-tial error (Newsome et al. 2002; Cessford & Muhar 2003; Arnberger et al. 2005).Nevertheless, given the absence of better and/or more comparable data sources andthe broad-scale approach of our analysis, these data were deemed suitable for thestudy.
Downloaded By: [Griffith University] At: 20:38 8 June 2011

192 W. L. Hadwen et al.Ta
ble
1.V
isita
tion
data
char
acte
rist
ics
and
colle
ctio
nm
etho
dsfr
om23
prot
ecte
dar
eas
inQ
ueen
slan
d,N
ewSo
uth
Wal
es,
Vic
tori
aan
dTa
sman
ia
Prot
ecte
dar
eas
for
whi
chsu
itabl
eda
taD
ata
colle
ctio
nY
ears
ofTe
mpo
rals
cale
Stat
ew
ere
avai
labl
e∗D
ata
type
met
hods
data
ofda
ta
Que
ensl
and
Jard
ine
Riv
erN
atio
nalP
ark
(1),
Iron
Ran
geN
atio
nalP
ark
(2),
Lak
efiel
dN
atio
nalP
ark
(3),
Dai
ntre
eN
atio
nalP
ark
(4),
Whi
tsun
day
Isla
ndN
atio
nalP
ark
(5),
Dia
man
tina
Nat
iona
lPar
k(6
),C
arna
rvon
Nat
iona
lPar
k(7
),B
ribi
eIs
land
Nat
iona
lPar
k(8
),B
unya
Mou
ntai
nsN
atio
nalP
ark
(9),
Gir
raw
een
Nat
iona
lPar
k(1
0),
Gre
atSa
ndy
Nat
iona
lPar
k(1
1)
Num
ber
ofca
mpe
rspe
rm
onth
atca
mps
ites
with
inse
lect
edpr
otec
ted
area
s
Dat
aco
llate
dfr
omca
mpi
ngpe
rmit
sale
sfo
rea
chpr
otec
ted
area
1995
–200
0M
onth
ly
New
Sout
hW
ales
War
rum
bung
les
Nat
iona
lPar
k(1
2),
Mim
osa
Roc
ksN
atio
nalP
ark
(13)
Num
ber
ofve
hicl
esat
one
orm
ore
cam
psite
sV
ehic
leco
unte
rson
road
sto
cam
psite
s20
00–6
Mon
thly
New
Sout
hW
ales
Mun
goN
atio
nalP
ark
(14)
,Mou
ntC
anob
olas
Stat
eC
onse
rvat
ion
Are
a(1
5)
Veh
icle
coun
tsm
ultip
lied
byav
erag
enu
mbe
rof
occu
pant
s–
estim
ate
ofnu
mbe
rof
visi
tors
Veh
icle
coun
ters
onro
ads
toca
mps
ites
2000
–6M
onth
ly
Vic
tori
aD
ande
nong
Ran
ges
Nat
iona
lPar
k(1
6),G
ram
pian
sN
atio
nalP
ark
(17)
,Mor
ning
ton
Peni
nsul
aN
atio
nalP
ark
(18)
,Por
tCam
pbel
lN
atio
nalP
ark
(19)
,Wils
on’s
Prom
onto
ryN
atio
nalP
ark
(20)
,M
tBuf
falo
Nat
iona
lPar
k(2
1)
Num
ber
ofvi
sito
rsV
isito
rm
onito
ring
and
vehi
cle
road
coun
ts20
01–2
Dai
ly
Tasm
ania
Cra
dle
Mou
ntai
n–L
ake
StC
lair
Nat
iona
lPar
k(C
radl
eM
ount
ain
Sect
ion)
(22)
,Fre
ycin
etN
atio
nal
Park
(23)
Vis
itsE
stim
ated
thro
ugh
aco
mbi
natio
nof
traf
fican
dco
unts
unde
rtak
enth
roug
hvi
sito
rce
ntre
s
2004
–6M
onth
ly
∗ Num
bers
inpa
rent
hese
sco
rres
pond
tonu
mbe
rof
prot
ecte
dar
eaon
Figu
re1.
Downloaded By: [Griffith University] At: 20:38 8 June 2011

Seasonal Tourism Visitation to Diverse Climate Zones, Australia 193
Queensland
Monthly visitation data were available from the Queensland Environmental ProtectionAgency (Q EPA) for official camp campsites within most of the State’s National Parksfor the period 1996–2000. In total, information was available for 11 National Parksin Queensland (Table 1). Information was recorded via sales of camping permits andis likely to be relatively accurate. However, campers who did not buy permits or didnot camp in designated campsites within protected areas fall outside the range ofthese data. Furthermore, the data do not account for day visitors to protected areas,who can constitute a sizeable proportion of total visitors, particularly in protectedareas close to major population centres where day trips are common (e.g. Dwyer& Edwards 2000). Although day-users of wilderness areas can be quite differentfrom overnight campers in their perceptions, attitudes and activities (Cole 2001),their seasonal patterns of visitation are likely to be very similar to those of overnightcampers. Therefore, for the purposes of the present study, data on the number ofcampers in any given park are suitable for the analysis of seasonal visitation patterns.
New South Wales
Data were obtained from the Visitor Data and Research Officer from the Parksand Wildlife Group within the New South Wales Department of Environment andClimate Change (NSW DECC). Visitor data were provided for four protected areas:two national parks in central New South Wales, one conservation area in the westernregion and one national park on the south coast (Table 1). All visitor data wererecorded using road counters, which means that cars passing a given entrance pointwere counted rather than a direct quantification of actual visitor numbers. The rawdata were then processed in different ways by NSW DECC for each of the fourprotected areas: in some cases, data were provided to us as raw vehicle numbers,whilst others were presented as ‘vehicle numbers multiplied by the average numberof occupants’ to generate an estimate of total visitor numbers (Table 1). In addition tosuch differences in the available data, the time frames for which data were availablewere highly variable across the four protected areas. They ranged from two to sixyears for each site between the years of 1999 and 2007 (Table 1). Nevertheless, theavailable data were suitable in that they provided the seasonal patterns in visitationthat were critical for the analysis of tourism seasonality.
Victoria
Daily visitor data were made available by the Information Officer of Parks Victoria forthe State’s Corporate Indicator Parks from September 2001 to August 2002. Thesedata were collected by the agency by using a combination of visitor monitoringtechniques and road counters (Table 1). Unlike most of the information available for
Downloaded By: [Griffith University] At: 20:38 8 June 2011

194 W. L. Hadwen et al.
other States, the original data for Victoria were highly resolved temporally, so thedaily numbers were summed up to a monthly scale to make them consistent with thescale of data that was available from the other jurisdictions.
Tasmania
Access was granted by the Tasmanian Parks and Wildlife Service to monthly datafrom April 2004 to September 2005 for several well-known and heavily visitednational parks. To account for the fact that different counting systems were in placein different sites within Tasmania (see Table 1), the raw data for each protected areawere standardized to generate a set of data with the necessary spatial and temporalresolution for the seasonality analysis.
School Holiday Periods
An institutional factor that might explain much of the seasonality in visitation toprotected areas is the timing of holiday periods. Specifically, it might be expectedthat visitation in some protected areas would rise and fall most strongly with schooland/or public holidays in nearby population centres. Despite some minor differencesacross States and among schools, holidays for school children in Australia are usually2–3 weeks in each of March, June and September, with a longer period of 4–6 weeksover the Christmas and New Year holiday period in December and January. There arealso significant public holidays around Easter and Christmas and these are two timesof the year when families traditionally travel and go on holidays (sensu Hadwen &Arthington 2003).
As it was possible that temporal accessibility to protected areas influenced theobserved seasonality in visitation, a categorical index of holiday periodicity wasdeveloped which ranked each month of the year according to the occurrence andfrequency of public and school holidays for the relevant State. A month with nodesignated public or school holidays was given a score of zero (e.g. November), amonth with some public holidays was given a score of one (e.g. May), a month withschool holidays was given a score of two (e.g. September) and a month with bothschool and public holidays was given a score of three (e.g. December). An additionalbenefit of this month-by-month scoring system is that it allows for a short periodeither side of the nominal school holiday period for families to visit protected areas;it is not uncommon for children to be withdrawn from school for brief periods eitherside of the formal holiday period. Although a monthly time-step scaling of holidayperiods is not optimal in terms of capturing inter- and intra-regional differences inthe timing and length of holidays, the fact that the climate and visitation data areavailable only as monthly averages meant that it would be inappropriate to develop amore refined index of holiday periods in the context of this study.
Downloaded By: [Griffith University] At: 20:38 8 June 2011

Seasonal Tourism Visitation to Diverse Climate Zones, Australia 195
Climatic Data
Climatic data for all protected areas were downloaded from the Australian Bureauof Meteorology’s website and were calculated from records collected over long-term recording stations, with most data spanning the 1890s to the 1990s. Regionalclimatic data were collated for each protected area for which visitor data were madeavailable. Data on mean monthly rainfall (mm) and mean monthly maximum andmean monthly minimum temperatures (◦C) were obtained for single locations withinor nearby (within a 50 km radius of) the 23 protected areas for which visitation datawere available. These climatic variables were chosen specifically because temperatureand rainfall (including snowfall) have been shown to influence the decision-makingbehaviours of visitors engaging in outdoor tourism and recreation (Kozak 2002;Hamilton & Lau 2005).
Although most tourist-comfort indices also include relative humidity as a variable(Mieczkowski 1985; de Freitas et al. 2008), humidity was not included in this studyfor two reasons. First, not all meteorological stations in Australia routinely recordrelative humidity, so monthly humidity records were not available for many of theprotected areas studied. Secondly, for those sites that did have humidity data, theobservable trends in mean monthly humidity did not vary sufficiently, either annuallywithin a site or between sites, to be a useful climatic predictor in the subsequentanalysis.
Analytical Approach
Temporal variability in visitation patterns to protected areas acrosssix climate zones in eastern AustraliaThe Koppen classification is used widely to delimit and describe climatic regionsacross Australia (www.bom.gov.au, Figure 1). There are six main Koppen climatezones across the country: equatorial, tropical, desert, subtropical, grassland and tem-perate. These climate zones were identified by the Australian Bureau of Meteorologyusing a modified Koppen classification system, on the basis of a standard 30-yearclimatology record that covered the period 1961 to 1990. When combined with thevisitation datasets described above, differences in protected-area visitation acrosseach of the six Koppen climate zones in Australia could be examined (Figure 1). Theresults are presented principally in relation to the Koppen climate zones from hereon, although some regional and State context is provided where necessary.
Variability in visitation patterns across Koppen climate zonesTo examine the seasonality of visitation across all six Koppen climate zones, datawere collated from all 23 protected areas and mean monthly visitation statistics werecalculated for each Koppen climate zone, as depicted in Figure 1.
Downloaded By: [Griffith University] At: 20:38 8 June 2011

196 W. L. Hadwen et al.
Regression analyses examining drivers of seasonality in visitationMean monthly visitor numbers from the different sites were transformed from rawvisitor numbers to percentages of total annual visitor numbers across each month,in order that the data could be compared across different protected areas that hadlarge differences in total visitors but similar visitation seasonality. The transformeddata were then regressed (using a separate linear mean squares regression for eachvariable) against the range of climate and holiday variables. As mentioned above, theclimatic variables used were mean monthly minimum temperatures, mean monthlymaximum temperatures and mean monthly rainfall (which was also treated as a per-centage of total annual rainfall). Visitation seasonality was also regressed against thecategorical ‘holiday periods’ variable, in an attempt to examine the relative influenceof domestic holiday periods on visitation variability. By regressing visitor statisticsagainst categorical values for holiday periods, the relative importance of temporalaccessibility (holiday periods) on visitor loads was determined for the protected areasassessed in each region. This approach accounted for potential visitation seasonalitythat was driven by the capacity of domestic travellers to visit the selected protectedareas in any given month. To examine broad and local patterns in visitation, all re-gression analyses were conducted both at the Koppen climate zone scale (n = 6) andat the individual protected-area scale (n = 23).
Results
Broad-scale Temporal Patterns in Visitation to Protected Areasin Different Climate Zones
There was substantial variability in the average timing and magnitude of visitor peaksand troughs to protected areas across the six Koppen climate zones (Figure 2). Patternsfor the six protected-area sites in equatorial, tropical and desert climate zones (seeFigure 1) revealed very strong peaks in visitation during two mid-year months, Juneand July, which represent the dry season in this part of the country (Figure 2). Forexample, visitation in the equatorial zone occurred in a very short peak in this dryseason, with more than 55 percent of the annual visitor load in the region comingin just two months, July and August (Figure 2). In contrast, visitation to tropicaland desert climate zones tended to be spread over a wider period than that for theequatorial sites (Figure 2). Significantly, visitation in all three of these zones wasvery low (less than 5% of the total annual visitor numbers) in the hottest and wettestmonths of the year, which in northern Australia occur from November through toMarch.
In contrast to the strong mid-year peaks in equatorial, tropical and desert climatezones, visitation seasonality was tri-modal for the four protected-area sites in the sub-tropical zone (Figure 2). For protected areas in this climatic type, which were all insouth-east Queensland (Figure 1), distinct visitation peaks occur around the autumn
Downloaded By: [Griffith University] At: 20:38 8 June 2011

Seasonal Tourism Visitation to Diverse Climate Zones, Australia 197
Figure 2. Temporal patterns of variability in visitation to protected areas in equatorial, tropical,desert, subtropical, grassland and temperate Koppen climate zones. Data points represent thepercentage of total annual visitor load for each month, calculated from mean visitor loads toprotected areas within each climate zone.
(April), spring (September–October) and summer (December–January) school hol-iday periods. The month-by-month contribution to annual visitation is relativelysimilar across these three peaks, with each contributing about 12 percent of the totalvisitor numbers annually. Thus, with five months of the year each contributing around12 percent of the annual load (thus together accounting for around 60% of the annualvisitor numbers), this region displayed a greater spread in visitation across the yearthan any other climate zone examined in the study.
Peaks in visitation in autumn (April) and spring (September) were also evident indata for the grassland climate zone (data from protected areas in western Queenslandand western New South Wales). However, unlike the subtropical (south-east Queens-land) zone, the mid-summer (December–January) peak in visitation was absent forthese grassland zone sites (Figure 2). For the grassland zone, it may be that highersummertime temperatures deter visitors during this period, as seems to be the case
Downloaded By: [Griffith University] At: 20:38 8 June 2011

198 W. L. Hadwen et al.
for the equatorial, tropical and desert zones also (Figure 2). Indeed, the shape of theseasonal visitation curve for the grassland zone seems to be a hybrid of the desert andsubtropical zones. This result is, perhaps, unsurprising given that the grassland zonesits geographically between the desert and subtropical zones, at least in the northernhalf of eastern Australia (Figure 1).
Protected areas in temperate zones in southern Australia displayed a seasonal trendin visitation that was characterized by a strong peak in numbers during the summer(December–March/April) and low visitation for the remainder of the year, particularlythrough the colder months (May–August) (Figure 2). In contrast, seasonality in theonly alpine area examined in our study (Mt Buffalo National Park, in Victoria), whichis also in the temperate Koppen climate zone but at considerably higher altitude andexperiences wintertime snowfalls, showed both summertime and wintertime peaks(Figure 2). The possible reasons for this unusual bimodal pattern are considered inthe ‘Discussion’ section.
Factors Explaining Visitation Seasonality
The degree to which climatic and holiday period data explained temporal patternsin visitation varied considerably across the six different climate zones and, to somedegree, with State or region within a State (Table 2). For protected area sites withinthe equatorial zone, the strongly seasonal visitation was best explained by meanmonthly minimum temperatures (Table 3). That variable explained 93 percent ofthe annual visitation variability, with higher minimum temperatures correspondingto lower visitation levels. Mean maximum temperatures and mean monthly rainfallexplained considerably less of the visitation seasonality (less than 75%).
Similar relationships existed for the tropical climate zone sites, where meanmonthly minimum temperature, which was strongly negatively correlated to visitationnumbers, was again the variable that best explained visitation patterns. Mean monthlymaximum temperatures and mean monthly rainfall explained more than 88 percentof the variation in visitation statistics for this tropical climate type, which highlightedboth the degree to which climate explained visitation and the auto-correlative natureof these two sets of measures in this region. Similarly, all three climatic variablesexplained between 75 percent and 93 percent of the variation in visitor numbers toprotected areas in the desert climate zone, although mean monthly rainfall (75%) ex-plained less variation in the seasonality of visitation than the maximum and minimumtemperature variables (Tables 2 and 3).
In contrast to the protected areas in the extreme north of the country, visitationseasonality in the subtropical climate zone of south-east Queensland was explainedbest by holiday periodicity (31% of the visitation variability). None of the climaticvariables explained more than 16 percent of temporal variation in visitation for thissubtropical climate type. In the grassland climate zone (which lies to the west of
Downloaded By: [Griffith University] At: 20:38 8 June 2011

Seasonal Tourism Visitation to Diverse Climate Zones, Australia 199
Table 2. Summary of R2 values for linear regressions of Koppen climate zone (andState/region) summaries of visitation data against holiday period scores (holidays), meanmonthly maximum temperatures (mean max), mean monthly minimum temperatures (mean
min) and mean monthly rainfall (mean rain) for protected areas in eastern Australia
Koppen climate zoneand State/region Holidays Mean max Mean min Mean rain
Equatorial (Cape York,Queensland)
0.00 0.73 0.93 0.71∗
Tropical (far north Queensland) 0.00 0.89 0.94 0.89∗∗
Desert (far western Queensland) 0.09 0.90 0.93 0.75∗∗
Subtropical (south-eastQueensland)
0.31 0.16 0.10 0.00
Grassland (western Queenslandand NSW)
0.05 0.55§ 0.55§ 0.44
Temperate (northern NSW) 0.08 0.51 0.52 0.48Temperate (southern NSW,
Victoria and Tasmania)0.03 0.90 0.87 0.86
Temperate (Victorian alps) 0.00 0.09 0.20 0.22All temperate zone protected
areas (mean ± SE)0.04 (0.02) 0.50 (0.23) 0.53 (0.19) 0.52 (0.19)
All regression R2 values are for linear relationships, except for: ∗exponential relationships; ∗∗logarithmicrelationships; §polynomial relationships.The regression results highlight the degree to which the selected variables explain the seasonality ofvisitation in each of these climate zones. Regressions used mean visitation statistics (percentage of annualvisitation for each month) calculated from the available data for all protected areas in each climatezone.
the subtropical zone), however, climatic variables explained most of the variationin visitation seasonality, with mean minimum temperatures and mean maximumtemperatures both explaining around 55 percent of the variation in the dataset in theseparate linear regressions.
For protected-area sites in temperate climates in northern New South Wales, thethree climatic variables each explained around 50 percent of the annual variation invisitation (Table 2). In contrast, in temperate climate zone sites in southern New SouthWales, Victoria and Tasmania, almost 90 percent of visitation variability could beexplained by mean monthly maximum temperatures alone (Table 3). Again, all threeclimatic variables explained a large proportion (>85%) of the variability in visitationto protected areas in this zone. In the Victorian Alps (temperate Koppen zone but abovethe snowline), almost 20 percent of the annual variation in visitation was explained bymean monthly maximum temperatures. Overall, however, the seasonality in visitationto this particular protected area was explained poorly by the selected climatic andholiday period variables.
Downloaded By: [Griffith University] At: 20:38 8 June 2011

200 W. L. Hadwen et al.Ta
ble
3.Su
mm
ary
ofR
2va
lues
for
regr
essi
ons
ofvi
sita
tion
data
agai
nst
holid
aype
riod
scor
es(h
olid
ays)
,m
ean
mon
thly
max
imum
tem
pera
ture
s(m
ean
max
),m
ean
mon
thly
min
imum
tem
pera
ture
s(m
ean
min
)an
dm
ean
mon
thly
rain
fall
(mea
nra
in)
for
23pr
otec
ted
area
sac
ross
six
Kop
pen
clim
ate
zone
sin
east
ern
Aus
tral
ia
Fact
ors
Prot
ecte
dK
oppe
nN
ame
ofar
eanu
mbe
rcl
imat
ezo
neSt
ate
prot
ecte
dar
eaH
olid
ays
Mea
nm
axM
ean
min
Mea
nra
in
1E
quat
oria
lQ
LD
Jard
ine
Riv
erN
atio
nalP
ark
0.00
0.36
0.81
0.72
∗∗
2E
quat
oria
lQ
LD
Iron
Ran
geN
atio
nalP
ark
0.00
0.73
0.96
0.63
∗
3T
ropi
cal
QL
DL
akefi
eld
Nat
iona
lPar
k0.
000.
930.
970.
60∗∗
4T
ropi
cal
QL
DD
aint
ree
Nat
iona
lPar
k0.
000.
750.
840.
90∗∗
5T
ropi
cal
QL
DW
hits
unda
yIs
Nat
iona
lPar
k0.
320.
420.
500.
39∗∗
6D
eser
tQ
LD
Dia
man
tina
Nat
iona
lPar
k0.
000.
840.
890.
58∗∗
7G
rass
land
QL
DC
arna
rvon
Nat
iona
lPar
k0.
000.
660.
640.
69∗∗
8Su
b-tr
opic
alQ
LD
Bri
bie
Isla
ndN
atio
nalP
ark
0.24
0.07
0.05
0.06
9Su
b-tr
opic
alQ
LD
Bun
yaM
tsN
atio
nalP
ark
0.20
0.23
0.18
0.07
10Su
b-tr
opic
alQ
LD
Gir
raw
een
Nat
iona
lPar
k0.
240.
060.
030.
0011
Sub-
trop
ical
QL
DG
reat
Sand
yN
atio
nalP
ark
0.32
0.18
0.15
0.01
12Te
mpe
rate
NSW
War
rum
bung
les
Nat
iona
lPar
k0.
000.
51§
0.52
§0.
4713
Tem
pera
teN
SWM
imos
aR
ocks
Nat
iona
lPar
k0.
050.
820.
800.
0614
Gra
ssla
ndN
SWM
ungo
Nat
iona
lPar
k0.
100.
44§
0.46
§0.
1915
Tem
pera
teN
SWM
ount
Can
obol
asC
onse
rvat
ion
Res
erve
0.18
0.46
0.41
0.69
16Te
mpe
rate
VIC
Dan
deno
ngR
ange
sN
atio
nalP
ark
0.14
0.61
0.61
0.61
17Te
mpe
rate
VIC
Gra
mpi
ans
Nat
iona
lPar
k0.
040.
710.
740.
6718
Tem
pera
teV
ICM
orni
ngto
nPe
nins
ula
Nat
iona
lPar
k0.
000.
730.
640.
8819
Tem
pera
teV
ICPo
rtC
ampb
ellN
atio
nalP
ark
0.00
0.80
0.76
0.78
20Te
mpe
rate
VIC
Wils
ons
Prom
Nat
iona
lPar
k0.
000.
870.
770.
8021
Tem
pera
teV
ICM
tBuf
falo
Nat
iona
lPar
k0.
000.
090.
200.
2222
Tem
pera
teTA
SC
radl
eM
ount
ain-
Lak
eSt
Cla
irN
atio
nalP
ark
0.00
0.89
0.90
0.87
23Te
mpe
rate
TAS
Frey
cine
tNat
iona
lPar
k0.
000.
740.
740.
14
All
regr
essi
onR
2va
lues
rela
ted
tolin
ear
regr
essi
ons,
exce
ptfo
r:∗ e
xpon
entia
lrel
atio
nshi
ps;∗
∗ log
arith
mic
rela
tions
hips
;§po
lyno
mia
lrel
atio
nshi
ps.
The
regr
essi
onre
sults
high
light
the
degr
eeto
whi
chth
ese
lect
edva
riab
les
expl
ain
the
seas
onal
ityof
visi
tatio
nin
each
prot
ecte
dar
ea.
Downloaded By: [Griffith University] At: 20:38 8 June 2011

Seasonal Tourism Visitation to Diverse Climate Zones, Australia 201
Discussion
Relative Roles of Natural and Institutional Factors in DrivingSeasonality in Visitation
Butler (2001) undertook a theoretical analysis of the range of factors that coulddrive visitation. His predictions have been broadly supported by empirical studies(e.g. Donatos & Zairis 1991; Koenig & Bischoff 2003; Grindley 2005) that haveshown that seasonality in visitation can be driven by a range of both natural andinstitutional factors. Whilst very valuable locally, the findings from the existingempirical studies have been obtained typically from within only a single climatezone, which therefore limits the degree to which a more general understanding of therole of climate in influencing visitation seasonality can be developed. As identifiedby Scott & Lemieux (2009), there is a growing need for broad-scale analysis oftourism seasonality and the role of climate as a driver of large-scale patterns oftourism seasonality to ensure that tourism planning can accommodate any futurechanges in climate. Although there have been some studies in North America thathave examined tourism seasonality, visitor comfort and possible tourism futuresin light of anticipated changes in climate in the future (Scott et al. 2004; 2008b),none has explicitly examined tourism seasonality and the relative role of naturaland institutional variables across multiple and contrasting climate zones. As a result,of those published in the literature, only this current study has enabled a broaderexamination of the relative importance of natural and institutional factors in drivingseasonality in visitation to protected areas across six major climate zones betweenlatitudes c. 10◦S and c. 45◦S.
Climatic variables strongly explained current visitation seasonality in many ofthe protected areas examined in this study across the climatically diverse parts ofeastern Australia. This is not particularly surprising given that other climate-visitationanalyses in national parks across entire countries (Canada – Jones & Scott 2006; theUSA – Hyslop 2007) have identified similarly strong relationships between climaticvariables and visitation seasonality. However, the relative importance of climateas a whole and the role of individual climatic variables in explaining the greatestpercentage of visitation seasonality differed substantially across the range of differentgeographical and climate types. Other than undertaking a meta-analysis (which wouldrequire many studies having been undertaken previously), the only way that thisspatial variation in the relationships between visitation, climate and geography couldbe detected is via a study like this one, which spanned a large number of climatezones.
The results of this study show convincingly that analysis of broad climate typesalone can provide a strong predictive capacity to expected visitation seasonalityacross eastern Australia, especially in regions with marked variations in climate(e.g. substantial differences between summer and winter temperatures in alpine ortemperate zones; the existence of a pronounced wet/dry dichotomy in the monsoonal
Downloaded By: [Griffith University] At: 20:38 8 June 2011
202 W. L. Hadwen et al.
tropics, etc.). For such locations, climate explained up to 94 percent of the intra-annual variation in tourist visitation, whereas holiday periods explained, at best, onlytwo percent of the seasonality in tourism (Table 2). Based on the strength of theseexplanatory relationships, predictions of visitation seasonality across Koppen climatezones could be made with relatively high confidence. Furthermore, given the generalpaucity of reliable visitation data for many protected areas in Australia (Hadwen et al.2007; 2008), predictions based on these types of relationships could certainly helpprotected-area managers develop and implement visitor management plans (Chhetri& Arrowsmith 2008).
In contrast to the strongly seasonal impact on visitation generated by climaticfactors discussed above, a relatively small number of protected areas showed temporalpeaks in visitor numbers that were strongly related to institutional factors – in this caseholiday periodicity. These patterns occurred in regions with more stable climates (i.e.less strongly seasonal) and in climates that were more tolerable for people (i.e. lessrange in extreme temperature and rainfall and therefore less physiologically stressfulconditions). For example, for the four protected-area sites from the subtropical zonein south-east Queensland, 31 percent of the annual variation was explained by holidayperiodicity. In contrast, each of the climatic variables explained, at best, no more than16 percent of the annual variation in visitation for these sites (Table 2). As all of theprotected-area sites in this sample are reasonably close (within 350 km) to Brisbane,the State’s capital city, it is likely that the result is also partially driven by the factthat they are close to a significant population source of domestic visitors.
Whilst proximity to large population centres is undoubtedly an important factorin affecting the temporal variability in visitation to many protected areas in south-ern Australia and the more densely populated east coast, its converse is likely to besignificant also in less populated areas of the country. For example, the populationdensity in the Northern Territory is < 0.2 people km−2 and, for protected areas innorthern Australia, such low local populations are likely to be a critical factor inexplaining the small influence that holiday periodicity has on visitation. For theseparts of the country, many visitors to protected areas will have travelled significantdistances (>1000 km) from population centres in the south or overseas and need tobe assured that areas of interest will be accessible and comfortable when they doarrive. The strong wet–dry seasonality in climate in northern Australia means thatpeaks in visitor numbers should therefore occur during the dry season (June–July),when humidity is low and roads are still open; much of northern Australia is un-passable during the wet summer months. In the wet (‘rainy’) season, most secondaryroads are closed by floodwaters and the humidity is oppressive (e.g. >70% duringJanuary for much of northern Australia). These two factors would inhibit or dis-courage visitation. Moreover, this is the time of year when tropical cyclones passacross northern Australia (Colls & Whitaker 2001) and these large-scale and po-tentially catastrophic climatic events are likely also to influence visitation as theyincrease both the uncertainty surrounding accessibility and the risk of dangerous
Downloaded By: [Griffith University] At: 20:38 8 June 2011

Seasonal Tourism Visitation to Diverse Climate Zones, Australia 203
(life-threatening) conditions. Accordingly, the observed seasonality in visitation tothese more remote areas in northern Australia is predictably and strongly driven byclimatic variables, which control not only human comfort, but also visitor safety andaccessibility. Climate appears also to strongly influence visitation to protected areasin inland regions of Australia (the desert region within the Koppen desert climatezone), with visitation statistics strongly and negatively related to mean monthly max-imum temperatures. Maximum daytime temperatures in tourism centres in centralAustralia, such as Alice Springs, often exceed 40◦C in summer and the highest shadetemperature recorded in Australia (53.1◦C) was recorded (at Cloncurry) in this partof the continent (Colls & Whittaker 2001). Tourism in these hot, dry periods is notonly extremely unpleasant and physiologically stressful, but ventures to remote areascan be life threatening. As with the monsoonal and wet–dry tropics in the equatorialzone, a combination of personal comfort and safety perceptions thus drives visitationseasonality in the arid zone. Whilst heavy summer rainfall might be expected todeter visitors to the arid zone of inland Australia, its intermittency in these regions(Sheldon 2005) probably also explains why rainfall is less influential than maximumtemperatures in explaining the recorded long-term trends in visitation seasonality inthis climatic zone. However, rainfall itself might be a powerful positive influence onvisitation to the arid zone when large wetlands, such as Lake Eyre, fill in responseto high discharge in rivers (e.g. Cooper Creek and the Diamantina and GeorginaRivers). Floods along these river systems can generate spectacular growth in wildlifepopulations that serve as strong attractants for visitors (Larson 2006).
In cool temperate southern Australia (temperate climate zone), minimum tempera-tures and winter rainfall negatively influence visitor loads, resulting in visitation peaksin mid-summer (December–January). An interesting exception to this uni-modal peakin visitation to protected areas in southern Australia was seen with Mt Buffalo Na-tional Park, in the Victorian alpine region. Although snow is rare or unknown inmost parts of Australia, wintertime tourism in the alpine regions of south-east Aus-tralia depends largely on snow-based activities and, hence, is contingent upon lowmean temperatures and winter precipitation as snowfall (Whetton et al. 1996; Mules2005). However, these alpine areas also attract summertime tourists for activities suchas bushwalking, bird watching and viewing wildflowers. This type of summertimetourism in alpine and sub-alpine areas is reliant upon warm, dry conditions conduciveto outdoor activities and the timing of critical ecological events, such as floweringtimes and bird breeding. This divergence in climatic conditions and tourism activitiesacross the seasons in Mt Buffalo National Park probably accounts for the complextemporal pattern observed in visitation and, overall, the weak explanatory power ofthe selected climatic variables for this region, despite the markedly seasonal patternsin temperature and rainfall. Furthermore, the period (2000–1) for which the visitationdata were available for this protected area was not only very limited but data were alsocollected over an exceptionally dry period, referred to colloquially as ‘the Milleniumdrought’ (Bond et al. 2008). Wintertime visitation was probably affected strongly by
Downloaded By: [Griffith University] At: 20:38 8 June 2011

204 W. L. Hadwen et al.
this drought and the lack of a strong wintertime peak most likely relates to the poorsnowfall in the surveyed years. More than for any other region, it is likely that daily toweekly conditions (i.e. ‘weather’ as opposed to climate) in alpine regions influenceshort-term visitor decision-making processes, because the success of their trip reliesvery heavily on climate (snowfall) as a resource (Scott & Lemieux 2009). Similarconclusions, regarding the importance of snow as a resource and as a condition thatwill influence visitation, have been drawn from other studies examining climate andwintertime tourism in ski fields (Whetton et al. 1996; Scott et al. 2007).
Impact of Altered Institutional or Natural Factors on Visitation to AustralianProtected Areas
Depending on the climate zone or bioregion in question, an understanding of therelative importance of institutional versus natural factors in influencing tourism sea-sonality can aid in the prediction of tourism futures, particularly if one or both of thesefactors is likely to change over time. The findings from this study, for example, indi-cate that the timing of school holidays is the single most influential factor controllingseasonality in visitation to protected areas in subtropical south-east Queensland. As aresult, the shape of annual visitation curves to these protected areas is buffered fromchanges in climate to some extent, at least in the short–medium term. Conversely,however, visitation to these areas is likely to be influenced strongly by social andor institutional factors, such as changes in the timing of school holidays, populationgrowth or decline, visitation priorities by tourists from southern States, and changesto infrastructure (e.g. road, rail and airport links) in south-east Queensland. Similarfindings, particularly in reference to factors influencing the seasonality in domestictourism markets, have been reported elsewhere (Sindiga 1996).
A quite different set of conditions holds for tourism in the monsoonal wet–drytropics and arid and semi-arid zones of Australia. Indeed, for most of the climatezones examined in this study, natural (climatic) factors explained far more of thevariation in annual visitation patterns than did institutional factors. These findingsare broadly consistent with other analyses of tourism seasonality (and anticipatedresponses to climate change) in natural destinations, such as those by Pickering& Buckley (2003) and Scott et al. (2007). For these protected areas, where climatestrongly influences visitation, foreseeable changes in institutional factors are unlikelyto re-shape the current seasonality in visitation. Instead, changes (including increasedvariability and extremes) in natural climatic and weather factors are more likely tomodify the existing patterns in visitation.
Conclusions and Future Directions
These analyses have shown that in a country as large as Australia, with its widevariety of climatic zones and ecosystem types but rather uniform institutional systems,
Downloaded By: [Griffith University] At: 20:38 8 June 2011

Seasonal Tourism Visitation to Diverse Climate Zones, Australia 205
there are marked regional differences in the seasonality of visitation in protectednatural areas. The relative importance of natural (climatic) and institutional (holidayperiodicity) factors varies across the country (largely according to climate zone) and,in most zones, climate dominates as the main factor controlling visitation seasonality.However, population density and accessibility to protected areas is a likely covariatein explaining visitation patterns. It appears that large population centres can dampenthe degree to which climate drives visitation seasonality, especially in subtropicalregions with their moderate weather patterns and reduced climatic seasonality.
These results suggest that for most of the climate zones examined in this study,changes to future climates have strong potential to influence spatial and temporalpatterns of visitation in protected areas across much of the country. To inform furtherresearch activity in this area, these findings were used to generate a series of climate-related questions and issues of importance to the Australian tourism industry.
1. Is visitation to protected areas that have visitation patterns driven strongly byinstitutional factors, such as the timing of school holidays, ‘buffered’ from changesin climate?
2. Can investment in institutional factors (e.g. hard infrastructure and associatedclimate-change adaptation initiatives) buffer the expected impacts of altered cli-mate on the seasonality of tourism in those protected areas where climate exertsa major control on visitation patterns? For example, will the provision of sealedroads alleviate problems with limited access to tropical and arid-zone protectedareas?
3. Will protected areas in highly seasonal (and physiologically stressful) climatezones (e.g. monsoonal wet–dry topics, arid zones) see a reduction in the peaksand length of tourism seasons as climate variability increases, maximum temper-atures increase and rainfall decreases? And, how might changes in the frequency,intensity and perception of extreme climate events, such as tropical cyclones orextensive flooding, influence visitation, both over short and long time-scales?
4. Will tourism opportunities increase in southern Australia because of possible localpositive aspects of climate change (e.g. warmer and drier winters) and negativechanges in northern Australia (e.g. more severe tropical storms and increasedrainfall). In other words, could there be destination substitution at the nationalscale. If so, will there be a time lag and consequent dip in international visitornumbers to Australia as perceptions change about the suitability of particular areasfor visitation?
These future research questions will need to couple the relationships generated inthis current study to regional climate-change projections in order to develop robustpredictions about the shape and possible shifts in tourism seasonality over the comingdecades. These predictions could, in turn, form the basis of climate-change adaptationresponses both at the national and regional scale for protected-area managers and
Downloaded By: [Griffith University] At: 20:38 8 June 2011

206 W. L. Hadwen et al.
tourism and hospitality businesses, especially those that service the needs of visitorsseeking experiences in natural and protected areas.
References
Adler, P. A. & Adler, P. (2003) Seasonality and flexible labor in resorts: Organizations, employees, andlocal labor markets, Sociological Spectrum, 23, pp. 59–89.
Arnberger, A., Haider, W. & Brandenburg, C. (2005) Evaluating visitor-monitoring techniques: A com-parison of counting and video observation data, Environmental Management, 36, pp. 317–327.
Ashworth, J. & Thomas, B. (1999) Patterns of seasonality in employment in tourism in the UK, AppliedEconomics Letters, 6, pp. 735–739.
Baum, T. & Lundtorp, S. (2001) Seasonality in tourism: An introduction, in: T. Baum & S. Lundtorp (Eds)Seasonality in Tourism, pp. 1–5 (Oxford, UK.: Elsevier Science Ltd).
Bond, N. R., Lake, P. S. & Arthington, A. H. (2008) The impacts of drought on freshwater ecosystems: anAustralian perspective, Hydrobiologia, 600, pp. 13–16.
Butler, R. W. (2001) Seasonality in tourism: Issues and implications, in: T. Baum & S. Lundtorp (Eds)Seasonality in Tourism, pp. 5–22 (Oxford, UK: Elsevier Science Ltd).
Cessford, G. & Muhar, A. (2003) Monitoring options for visitor numbers in national parks and naturalareas, Journal for Nature Conservation, 11, pp. 240–250.
Chhetri, P. & Arrowsmith, C. (2008) GIS-based modelling of recreational potential of nature-based touristdestinations, Tourism Geographies, 10(2), pp. 233–257.
Cole, D. N. (2001) Day Users in Wilderness: How Different Are They? (Ogden, UT USA: Department ofAgriculture, Forest Service, Rocky Mountain Research Station).
Colls, K. & Whitaker, R. (2001) The Australian Weather Book (Sydney: New Holland Publishers).de Freitas, C. R. (2003) Tourism climatology: evaluating environmental information for decision making
and business planning in the recreation and tourism sector, International Journal of Biometeorology,48, pp. 45–54.
de Freitas, C. R., Scott, D. & McBoyle, G. (2008) A second generation climate index for tourism (CIT):specification and verification, International Journal of Biometeorology, 52, pp. 399–407.
Donatos, G. & Zairis, P. (1991) Seasonality of foreign tourism in the Greek island of Crete, Annals ofTourism Research, 18, pp. 515–519.
Dwyer, L. & Edwards, D. (2000) Nature-based tourism on the edge of urban development, Journal ofSustainable Tourism, 18(4), pp. 267–287.
Grindley, M. E. (2005) Visitor characteristics in Mount Elgon National Park. Available at http://www.see.leeds.ac.uk/misc/elgon/visitors.html Project Elgon 1997 (accessed 12 February 2007).
Hadwen, W. L. & Arthington, A. H. (2003) The significance and management implications of percheddune lakes as swimming and recreation sites on Fraser Island, Australia, The Journal of TourismStudies, 14(2), pp. 35–44.
Hadwen, W. L., Hill, W. & Pickering, C. M. (2007) Icons under threat: Why monitoring visitors andtheir ecological impacts in protected areas matters, Ecological Management and Restoration, 8, pp.177–181.
Hadwen, W. L., Hill, W. & Pickering, C. M. (2008) Linking visitor impact research to visitor impactmonitoring in protected areas, Journal of Ecotourism, 7, pp. 1–7.
Hamilton, J. M. & Lau, M. A. (2005) The role of climate information in tourist destination choice decision-making, in: S. Gossling & C. M. Hall (Eds) Tourism and Global Environmental Change, pp. 229–250(London: Routledge).
Hyslop, K. E. (2007) Climate change impacts on visitation in National Parks in the United States, Mastersdissertation, University of Waterloo, Ontario, Canada.
Jang, S. C. (2004) Mitigating tourism seasonality – A quantitative approach, Annals of Tourism Research,31, pp. 819–836.
Downloaded By: [Griffith University] At: 20:38 8 June 2011

Seasonal Tourism Visitation to Diverse Climate Zones, Australia 207
Jones, B. & Scott, D. (2006) Climate change, seasonality and visitation to Canada’s National Parks, Journalof Park and Recreation Administration, 24, pp. 42–62.
Keller, M. C., Fredrickson, B. L., Ybarra, O., Cote, S., Johnson, K., Mikels, J., Conway, A. & Wager, T.(2005) A warm heart and a clear head: the contingent effects of weather on mood and cognition,Physchological Science, 16, pp. 724–731.
Koenig, N. & Bischoff, E. E. (2003) Seasonality of tourism in Wales: A comparative analysis, TourismEconomics, 9, pp. 229–254.
Kozak, M. (2002) Comparative analysis of tourist motivations by nationality and destinations, TourismManagement, 23, pp. 207–220.
Larson, S. (2006) Importance of floods to regional viability: Stakeholder perceptions, in: 14th BiennialConference of the Australian Rangeland Society, September 3–7 2006, Renmark, South Australia.
Mieczkowski, Z. (1985) The tourism climatic index: A method of evaluating world climates for tourism,The Canadian Geographer, 29, pp. 220–233.
Mules, T. (2005) Economic impacts of national park tourism on gateway communities: the case ofKosciuszko National Park, Tourism Economics, 11, pp. 247–259.
Nadal, J. R., Font, A. R. & Rossello, A. S. (2004) The economic determinants of seasonal patterns, Annalsof Tourism Research, 31, pp. 697–711.
Newsome, D., Moore, S. A. & Dowling, R. K. (2002) Natural Area Tourism: Ecology, Impacts andManagement (Clevedon, UK: Channel View Publications).
Parrilla, J. C., Font, A. R. & Nadal, J. R. (2007) Accommodation determinants of seasonal patterns, Annalsof Tourism Research, 34, pp. 422–436.
Pickering, C. M. & Buckley, R. C. (2003) Swarming to the summit – Managing tourists at Mt Kosciuszko,Australia, Mountain Research and Development, 23, pp. 230–233.
Scott, D., Gossling, S. & de Freitas, C. R. (2008a) Preferred climates for tourism: case studies fromCanada, New Zealand and Sweden, Climate Research, 38, pp. 61–73.
Scott, D., Jones, B. & Konopek, J. (2007) Implications of climate and environmental change for nature-based tourism in the Canadian Rocky Mountains: A case study of Waterton Lakes National Park,Tourism Management, 28, pp. 570–579.
Scott, D., Jones, B. & Konopek, J. (2008b) Exploring potential visitor response to climate-inducedenvironmental changes in Canada’s Rocky Mountain National Parks, Tourism Review International,12, pp. 43–56.
Scott, D. & Lemieux, C. (2009) Weather and Climate Information for Tourism. Tourism Sector WhitePaper. Report commissioned by the World Meteorological Organisation (Geneva) and the UnitedNations World Tourism Organisation (Madrid).
Scott, D., McBoyle, G. & Schwartzentruber, M. (2004) Climate change and the distribution of climaticresources for tourism in North America, Climate Research, 27, pp. 105–117.
Sheldon, F. (2005) Incorporating natural variability into the assessment of ecological health in Australiandryland rivers, Hydrobiologia, 552, pp. 45–56.
Sindiga, I. (1996) Domestic tourism in Kenya, Annals of Tourism Research, 23, pp. 19–31.Whetton, P. H., Haylock, M. R. & Galloway, R. (1996) Climate change and snow-cover duration in the
Australian Alps, Climatic Change, 32, pp. 447–479.
Notes on Contributors
Dr Wade L. Hadwen is an aquatic ecologist whose research focuses on the assess-ment of aquatic ecosystem responses to disturbances, including studies of the effectsof visitor activities on pristine environments. Much of his research has investigatedpathways of carbon and nitrogen through lake, river and estuarine environments, but
Downloaded By: [Griffith University] At: 20:38 8 June 2011

208 W. L. Hadwen et al.
more recently, he has also become interested in the ecological and human dimensionsof climate change adaptation and more broadly, how climate variability influencesboth ecological and human systems.
Professor Angela H. Arthington is an aquatic ecologist who has experience workingon the ecology and management of lakes, wetlands and rivers. Angela has workedextensively on the ecology of dune lakes and on the biology, ecology and conservationof native and introduced freshwater fish in these unusual wetland systems. She is alsokeenly interested in river management, especially the allocation and monitoring ofenvironmental flows, and has pioneered an ecosystem approach to water allocationfor the environment.
Professor Paul I. Boon is an aquatic ecologist with research interests in the rehabilita-tion of high-value wetlands around the Gippsland Lakes in eastern Victoria, Australia,and the use of natural, created and constructed wetlands for nutrient interception. Re-cently completed research includes studies on the role of nutrient enrichment ineffecting a shift across stable states in aquatic vegetation, the salinity sensitivity ofthe Australian freshwater biota, and the effects of water and salt regimes on the lifehistories of wetland vegetation.
Mr Brett Taylor is a terrestrial ecologist with interests in species diversity, distri-butions and sustainability. Following his time at Griffith University in the AustralianRivers Institute, Brett became a Senior Ecologist for Biodiversity Assessment andManagement Pty Ltd (BAAM), a specialist ecological consulting company.
The late Dr Christine Fellows was an ecosystem ecologist whose research interestsfocused on pathways of nutrient processing in streams and rivers and their adjoiningriparian zones. Christine’s research, across a wide array of aquatic ecosystems, con-tributed greatly to our understanding of ecosystem functioning and the interactiveeffects of flow and human modifications to catchments and streams.
Downloaded By: [Griffith University] At: 20:38 8 June 2011