body-fluid diagnostics in microliter samples
TRANSCRIPT
BODY-FLUID DIAGNOSTICS IN MICROLITER SAMPLES
by
GAUTAM N. SHETTY
Submitted in partial fulfillment of requirements
for the degree of Doctor of Philosophy
Thesis Advisor: Dr. Miklós Gratzl
Co-advisor: Dr. Koji Tohda
Department of Biomedical Engineering
CASE WESTERN RESERVE UNIVERSITY
May, 2006

CASE WESTERN RESERVE UNIVERSITY
SCHOOL OF GRADUATE STUDIES
We hereby approve the thesis/dissertation of
Gautam N. Shetty .
candidate for the Ph. D. degree *.
(signed) Miklós Gratzl (chair of the committee)
Koji Tohda
Barry Miller
Clive. R. Hamlin
Mark D. Pagel
(date) 01/26/06
*We also certify that written approval has been obtained for any proprietary material
contained within.

I grant to Case Western Reserve University the right to use this work, irrespective of any
copyright, for the University’s own purposes without cost to the University or to its
students, agents and employees. I further agree that the University may reproduce and
provide single copies of the work, in any format other than in or from microforms, to the
public for the cost of reproduction.
Gautam N. Shetty . (sign)

To my hardworking parents
iv

TABLE OF CONTENTS
List of figures…………………………………………………………………………….vii
List of tables………………………………….……………………………………….......ix
Acknowledgements……………………………………………………………………......x
List of Abbreviations……………………………………………………………………..xi
Abstract…………………………………………………………………………………..xii
Introduction: Significance, hypotheses and specific aims………………………………...1
Part I Optimization of RSS system parameters
Chapter 1 Hydrodynamic Electrochemistry in 20 μL drops in the Rotating
Sample System……………………………………………………………………4
Part II Investigation of RSS performance in biological samples
Chapter 2 Rotating Sample System: Hydrodynamic Electrochemistry in
Biological Matrices………………………………………………………………28
Chapter 3 Rotating Sample System: A Simple Tool for Rheological Examination
of the Air-Solution Interface……………………………………………………..50
Part III Investigation of electrode ‘fouling’ in biological samples
Chapter 4 Protein Adsorption on the electrode of the Rotating Sample System…66
Chapter 5 Electrochemical Desorption of Proteins……………………………...82
Part IV Trace Pb analyses
Chapter 6 Rotating Sample System: Trace Pb(II) Analyses in Serum and Blood
Samples…………………………………………………………………………..96
v
Part V
Chapter 7 Summary and Future Work………………………………………….114
Appendix A……………………………………………………………………………..122
Appendix B……………………………………………………………………………..129
Appendix C……………………………………………………………………………..137
Bibliography……………………………………………………………………………147
vi
List of Figures
Figure 1-1 Schematic diagram of home-made Rotating Sample System
Figure 1-2 Schematic diagram of microfabricated Rotating Sample System
Figure 1-3 Cyclic voltammograms for electrode position close to the axis of rotation at
different rotation rates of the sample
Figure 1-4 Images of dye injection to visualize bulk flow patterns
Figure 1-5 Trace Pb analyses in aqueous (non-biological) samples using the RSS
Figure 2-1 Schematic diagram of Rotating Sample System (Top and Front view)
Figure 2-2 Cyclic voltammetry in rotated and stationary samples containing different
dilutions of fetal bovine serum
Figure 2-3 Lipid-protein interplay illustrated by cyclic voltammetry
Figure 2-4 Affect of electrode protein adsorption on mass transport properties
Figure 3-1 Cyclic voltammetry in rotated sample of different BSA concentration
Figure 3-2 Cyclic voltammograms depicting lipid-protein interfacial interactions
Figure 3-3 Calculating CMC from plateau currents in RSS
Figure 4-1 Using Hydrogen UPD to get electrode active surface area
Figure 4-2 Adsorption kinetics
Figure 4-3 Adsorption kinetics with and without Nafion coating
Figure 4-4 Comparison in voltammograms with and without Polyurethane coating
Figure 5-1 Adsorption and Desorption kinetics
Figure 5-2 Desorption in fetal bovine serum matrix
Figure 6-1 Anodic stripping voltammetry of 2.5 ppm Pb for optimization of CAP
vii

membrane
Figure 6-2 Repeatability of detection of Pb in 10 μL serum samples
Figure 6-3 Convection properties in hemoglobin samples
Figure 6-4 Pb analysis in human blood
Figure 6-5 Trace Pb detection in human blood
viii

List of Tables
Table 1-1 Diffusion layer thickness as a function of the position and the inner diameter
of nozzle for a single air jet
Table 1-2 Plateau and edge currents at various air flow rates for different positions of the
Pt mini-disc electrode, using two anti-parallel air jets for sample rotation
Table 4-1 Comparison of different membrane for coating electrode
Table A-1 Comparison of electrode area obtained using different techniques
Table C-1 Summary of Standards and Regulations for Pb
ix

Acknowledgements
I would like to thank my advisor Prof. Gratzl; I am fortunate to have had the opportunity
to learn under him. I am indebted for the education which I am certain will hold me in
good stead for the future. I would also like to thank my co-advisor Dr. Tohda, who has
always been a great resource (all things except whitewater rafting!). I am grateful to Dr.
Barry Miller, Dr. Clive Hamlin and Dr. Marty Pagel for serving on my committee; I
would also like to thank for their constant guidance and encouragement. I would like to
thank my colleagues at the Laboratory for Biomedical Sensing; my research experience
would be incomplete without you all.
I would like to sincerely thank for first employers at the Center for Health Promotion
Research, Department of Epidemiology and Biostatistics for their support in my initial
period here; I would never have made it this far if not for my job there. I would like to
thank my friends at Case, Cleveland chapter of Asha for Education, the Cleveland
Cricket Club and numerous others in the Cleveland community for enriching my
Cleveland experience.
I would like to thank my family and friends for their constant support. Coming from a
country where one in three children do not have access to primary schooling, I would like
to thank all my teachers; I am indebted to them for the gift of education.
x

List of Abbreviations
BSA : Bovine serum albumin
CAP : Cellulose acetate hydrogen phthalate
CCD : Charge coupled device
CV : Cyclic voltammetry
CMC : Critical micelle concentration
HSA : Human serum albumin
ppm : parts-per-million
ppb : parts-per-billion
ppt : parts-per trillion
RDE: Rotating disc electrode
RSS : Rotating sample system
WE : Working electrode
UPD : Under-potential deposition
xi

Body-fluid Diagnostics in Microliter Samples
Abstract
by
Gautam N. Shetty
The Rotating Sample System (RSS) has been conceived in our laboratory for diagnostics
of microliter samples. The design of the RSS enables effective convection generation in
microliter sized samples. Convection aids in mass-transport and is essential in improving
sensitivity in applications such as trace metal diagnostics. In diagnostics applications
such as titration and enzyme activity measurements, convection helps in homogenization
of the sample. Capability to investigate microliter sized samples is essential to extend
diagnostic capability for neonates and small children without having to draw body-fluids
(e.g blood) in the order of milliliters for analyses. Also, smaller size of the system would
make it portable and attractive for use in point-of-care applications eliminating need for
storage and transportation of samples. Small samples also ensure that storage and
disposal issues are minimal. Natural physical properties such as surface tension, which
are usually ignored for larger sample volumes, become prominent with microliter sample
sizes; these can be engineered to develop simple yet robust tools for body fluid
diagnostics. Optimization of system parameters for optimal system performance has been
undertaken as part of this work. Study of the hydrodynamic performance of the RSS in
xii
biological matrix was conducted and revealed interplay between proteins and lipids at the
liquid-air interface. The RSS is unique in the sense that it imparts convection to the
sample via its surface. Hence, utility of the RSS as a tool to probe the interfacial
properties of samples containing surface-active molecules has been investigated. The
RSS by providing information about both bulk and surface properties of a sample fosters
better diagnostics of biological samples. Challenges are posed to electrochemical analysis
by non-specific adsorption of proteins onto electrode surfaces; hence methods to protect
the electrode by coating with a suitable spacer polymer membrane have been developed.
For the first time, a technique to electrochemically effect desorption of proteins is
demonstrated. Using the RSS’ favorable convective properties, trace Lead (Pb) analyses
in model aqueous samples and detection capability in serum and blood matrices has been
demonstrated. A detection limit of 260 ppt for Pb was achieved in aqueous samples.
xiii
INTRODUCTION: Significance, hypothesis and specific aims
Conventional analytical systems and techniques are limited in their ability to address
small samples. These systems designed for larger samples cannot be scaled down in size
to work with microliter sized samples - a pre-requisite for biomedical applications.
Natural properties of liquids such as surface tension, which tend to be ignored for larger
volumes, become significant in smaller volumes. This has been engineered to enable us
to build a platform for analysis of microliter sized samples. The Rotating Sample System
(RSS) was thus conceived in our laboratory.
The RSS consists of a microliter sized drop placed atop a hydrophilic substrate such as
glass and kept in position by a hydrophobic ring. The internal diameter of the ring is
calculated such that the sample forms a hemisphere. Strong surface tension forces ensure
that the sample is indeed hemispherical. Tangential air-jets are applied to the sample drop.
The linear gas jet velocity couples onto the sample surface and translates into rotation of
the drop thereby generating convection in it. The sensing elements which include a
working electrode (WE) are embedded in the substrate.
Various convection-based systems are available for analysis; e.g. rotating wires,
streaming mercury electrodes, vibrating electrodes, and systems where there is forced
flow past a stationary electrode such as conical, tubular, screen, packed-bed electrodes in
fluid streams, channel electrodes, bubbling electrodes, and most prominently, the
Rotating Disc Electrode (RDE) system. These systems are limited in their ability to
address microliter sized samples- a pre-requisite in the biomedical context.
1
The aim of my PhD study is to test the hypothesis that the Rotating Sample System can
be employed for diagnostics of microliter sized biomedical samples. To this end, the
specific aims are:
Specific Aim 1: To investigate hydrodynamic variations at the base of the rotating drop
and optimize system parameters
The RSS affords convection to a microliter sized drop by coupling air jet velocity to the
surface of the sample. Due to the non-rigid nature of an aqueous sample, it is plausible
that variations in the hydrodynamics may manifest along the radius of the sample. This
variation will be investigated by varying the electrode position in the substrate and
evaluating the electrochemical performance at each position for a given rotation of the
sample. Results of this study will lead to optimal design and performance for specific
RSS applications. This aim is addressed in Part I, chapter 1, appendix A.
Specific Aim 2: To investigate the hydrodynamic performance of the RSS in a biological
matrix
Biological matrices manifest different rheological properties as compared to non-
biological samples. This may modulate the performance of the RSS since it affords
convection to the biological sample through its surface. This will be investigated by
studying the hydrodynamics in different dilutions of fetal bovine serum solutions and
model protein solutions. This aim is addressed in Part II, chapter 2.
2

Specific Aim 3: To evaluate electrode ‘fouling’ caused by non-specific adsorption of
proteins in biological matrices
Proteins are known to block access to the electrode by non-specific adsorption. This
limits the lifetime of the electrode in a biological environment. This problem is more
severe when investigating microliter sized samples since the electrode sizes involved are
smaller, loss of electrode area would undermine its ability to analyze the sample.
Electrochemical methods to investigate protein adsorption kinetics will be devised and
methods to protect the electrode from fouling will be explored. This aim is addressed in
Part III, chapter 4.
Specific Aim 4: To analyze trace Lead (Pb) in microliter samples
Pb analysis using current state-of-art employs bulky instrumentation requiring vials of
blood (order of milliliters) to be drawn from patients. This is more serious an issue with
small children who are more prone to the toxic effects due to Pb exposure. Model
samples containing Pb will be analyzed for detection using RSS to check for sensitivity;
Pb would then be analyzed in serum and blood matrices. This aim is addressed in Part IV,
chapter 6.
3

Chapter 1
Hydrodynamic Electrochemistry in 20 μL Drops in the
Rotating Sample System
Gautam N. Shetty, Nilofar Syed, Koji Tohda, Miklós Gratzl Department of Biomedical Engineering
CASE, Cleveland OH 44106
This work was published in Analytical Science, 2005, 21(10), 1155-1160
(reproduced with kind permission)
4
1.1 Abstract
The Rotating Sample System (RSS) has been conceived in the authors’ laboratory as a
convection platform for microliter-sized solution volumes. Convection is achieved by
rotating a small drop of sample on a stationary substrate by humidified gas jets directed
tangentially at the drop base with the working electrode and a liquid junction embedded
in it. Simplicity and portability of the device, and substrates complete with
microfabricated electrode and junction made potentially disposable, are further
competitive advantages with respect to competing, conventional analytical systems. In
this work the RSS’ performance with variation of system parameters such as the position
and size of gas jets used for sample rotation, and position of the working electrode in the
substrate are studied. Trace levels of Pb could be detected with this system and is
reported here.
1.2 Introduction
Conventional electrochemistry typically involves planar macro-electrodes and is
diffusion limited. One dimensional diffusion in these systems leads to progressive
depletion at the working electrode (WE), making the more desirable stationary
techniques out of reach, and sensitivities often insufficient. Forced convection can be
used to limit diffusive transport to within the immediate vicinity of the WE, resulting in
higher sensitivities as well as steady state mass transport and thus, stationary
voltammetry. Besides the obvious advantages in analytical applications, this renders also
mechanistic studies of electrode processes as well as related homogeneous reactions,
5
more efficient. To achieve the requisite conditions, different methodologies have been
proposed such as rotating wires, streaming mercury electrodes, vibrating electrodes, and
systems where there is forced flow past a stationary electrode such as conical, tubular,
screen, packed-bed electrodes in fluid streams, channel electrodes, bubbling electrodes,
and most prominently, the Rotating Disc Electrode (RDE) system [Bard, 2001].
The Rotating Sample System (RSS, Figure 1) which has been conceived and developed
in the authors’ laboratory [Cserey et al., 1997; Cserey, 2001] derives its inspiration from
the RDE approach. The RSS cell generates convection by rotating a liquid microsample
atop a stationary hydrophilic substrate with the working electrode and liquid junction
embedded flush with it (Figure 1) and surrounded by a hydrophobic ring to keep the
sample in position. This in effect provides a very simple equivalent to the costly,
complex, and much larger RDE system. Yet, the RSS approach does not involve any
moving mechanical parts since rotation is achieved by employing a humidified gas (e.g.,
air) jet or jets. The fact that the sample volume can be very small (in the order of ten to
twenty microliters), and that the substrate can be microfabricated and disposable, renders
the RSS system attractive for use in biomedical and environmental applications. Its
utility can be extended to monitoring and measuring contaminants in industrial samples,
and for basic electrochemical studies.
The RSS approach has been shown to achieve diffusion layer thicknesses in the order of
10 μm and less, at comfortable gas flow rates (around 100 mL/min) [Cserey et al., 1997].
This performance is equivalent to a disc electrode rotated at about 3,000 rpm, yet no
signs of deformation of the sample drop are apparent to the eye: it remains semi-
spherical which indicates the remarkable strength of surface tension at the boundaries of
6

a miniature aqueous drop and air. Earlier findings [Cserey et al., 1997] corroborated the
expected trend that the diffusion layer thickness decreases with increasing sample
rotation rate. Also, considering that the results are very reproducible suggest that laminar
flow conditions exist in the rotating drop.
Using the Rotating Sample platform with a microfabricated platinum ring electrode
(Figure 2), determination of Mercury [Cserey et al., 1997] in aqueous samples has been
shown to be feasible using anodic stripping voltammetry. Copper detection capability in
an acid pre-treated and filtered (to remove serum proteins) serum matrix has been
demonstrated in our laboratory [Cserey, 2001]. In addition, the RSS’ utility in detection
of other metal ions has also been explored [Gratzl et al., 2001-2003]. Given the potential
for useful applications, a better understanding of the RSS’ performance vis-à-vis its
system parameters is warranted.
While similarities can be drawn between the RSS and the RDE [Levich, 1952],
differences exist in specific details. The unique aspect of the RSS is that sample drop
integrity is maintained during rotation due to surface tension. Also, since a gas jet (or
jets) is used to achieve sample rotation instead of directly rotating a “rigidly” coupled
electrode as in the RDE approach, a “soft” mechanical coupling of the gas jet and the
surface of the liquid sample is to be considered. In this work these aspects, unique to the
Rotating Sample System, are explored experimentally. Dependence on the number, and
placement of gas jet(s) relative to the sample to examine coupling of the air jet(s) with
the sample, and the effects of gas flow rate and nozzle diameter on the ultimate
electrochemical properties of the RSS, are also investigated.
7
Trace analysis of Pb in 20 microliter samples is also reported here. Pb in blood is
considered to have several deleterious effects on human health [Needleman, 2004]. The
RSS here could provide with an alternative to the expensive, bulky and labor intensive
current state-of-the-art AAS [Baralkiewicz et al., 1996] and ICP-MS [Hansen et al.,
2002] techniques. Several electrochemical approaches to Pb detection such as the RDE
[Brihaye et al., 1983], sonoelectroanalysis [Banks et al., 2004], flow injection [Jaenicke
et al., 1998], and stirred systems [Bartlett et al., 2000] have also been explored. The RSS
operates with much smaller sample volume than is required in the aforementioned
methodologies. Moreover, the RSS can be modified to employ different electrode
materials such as carbon [Brihaye et al., 1983; Bartlett et al., 2000], boron doped
diamond electrodes [Banks et al., 2004; Maeda et al., 2003] and mercury [Jaenicke et al.,
1998; , Tekutskaya et al., 1999; Duinker et al., 1977] for Pb detection purposes.
1.3 Experimental
1.3.1 Materials
All chemicals were from Sigma (St Louis, MO, USA); solutions were made with Milli-Q
water (18.2 MΩ cm Milli-QUV plus from Millipore, Billerica, MA, USA). For trace Pb
analysis the water was distilled using a quartz distiller to obtain ultra-pure water. Also,
polypropylene flasks (Nalge Nunc International, Rochester, NY, USA) were used for
storing Pb solutions to preempt any contamination due to storage in glass containers
[Prichard, 1996]. The two RSS setups used in this work (Figures 1 and 2) were
characterized using 1.0 mM K3[Fe(CN)6]with 0.1 M KNO3 as supporting electrolyte.
8
Capillary tubes (0.025 mm wall thickness; A.H. Thomas Co., Philadelphia, PA, USA) of
0.5 mm inner diameter (i.d.) were used to rotate the drops in experiments with flexible
cell geometry (Figure 1). Capillaries of different i.d. values were used in the experiments
involving the microfabricated RSS cell (Figure 2). In order to visualize flow patterns
within a rotating drop, Evans blue dye was inserted into a rotating drop using a pulled
glass capillary.
1.3.2 Apparatus
To evaluate system performance by changing the position of the air jet and the diameter
of the air-nozzle used for sample rotation, a microfabricated RSS cell was used with a Pt
ring WE, deposited symmetrically around the junction hole (Figure 2). Fabrication of
this device has been described earlier [Cserey et al., 1997; Cserey, 2001]. The nozzle of
the humidified air jet was mounted on a three axis manipulator (WPI, Sarasota, FL,
USA). The nozzle positions were recorded by taking a top view image of the RSS setup
using a CCD camera (CV-S3200 from JAI, Copenhagen, Denmark).
To evaluate system performance for different positions of the WE in the substrate with
respect to the sample drop, another system with a Pt mini-disc electrode and flexible
geometry was adopted. The corresponding electrochemical cell (Figure 1) was fabricated
using a part of a microscope glass slide (7.5 cm × 2.5 cm and 0.1 cm thick, from Fisher
Scientific, Pittsburgh, PA, USA) as substrate. The WE was made from 150 μm diameter
platinum wire (Alfa Aesar, Ward Hill, MA, USA). Silicone elastomer (DOW Corning,
Midland, MI, USA) was applied to form the hydrophobic ring that confines the sample
9
drop into a semi-sphere. Epoxy resin (ITW Performance Polymers, Riviera Beach, FL,
USA) was used for gluing purposes. A similar setup was also used for trace Pb analyses.
The Ag|AgCl reference (BAS, West Lafayette, IN, USA) and stainless steel counter
electrodes (Alfa Aesar) were placed under the substrate in 0.1 M KNO3, connected to the
sample side by a liquid junction filled with 1 wt% agar gel (Sigma). Humidified air jets
driven by an aquarium pump (Wollinger Bros., Oakland, NJ, USA) were directed toward
the sample from 0.5 mm i.d. glass capillaries. Air flow rates were measured with
volumetric flow meters (Cole-Parmer Instrument Co., Niles, IL, USA). For trace Pb
analysis, a humidified nitrogen gas jet was used instead of air jet.
Electrochemical measurements for testing effects of the position of gas jets were
performed using BAS 100W potentiostat (BAS, West Lafayette, IN, USA) with
microfabricated sensors [Cserey et al., 1997] (Figure 2). For all other studies a CH100
electrochemical workstation (CH Instruments, Austin, TX, USA) was used. Images of
the rotated sample drop were acquired using a CCD camera (see above).
All calculations were done using Matlab 6.0 (Math Works, Natick, MA, USA).
1.3.3 Procedures
1.3.3.1 Fabrication of the electrochemical cell with flexible geometry (Figure 1-1)
Two holes 1 mm in diameter were drilled through the glass slide. Glass of the same
material was heat melted around the tip of the platinum wire with 150μm diameter so as
to cover the tip completely with a glass bead, a little larger than the drilled hole. This end
of the wire was inserted in one of the holes so that it fits in snugly. The bead was then
10
glued onto the substrate using epoxy resin. The substrate surface was then polished to
leave a flush platinum mini-disc exposed to form the WE (Figure 1-1). The other hole is
for the liquid junction. Silicone elastomer was printed to form a hydrophobic ring to
keep the sample in position; the internal diameter of this ring is calculated as 4.2 mm for
a 20 μL drop to ideally form a perfect hemisphere. Different positions of the electrode
were realized by simply re-applying the elastomer in different positions by shifting the
relative position of the circular hole in the elastomer. This way the axis of rotation of the
sample vis-à-vis the electrode position could be shifted while ensuring similar electrode
surface conditions; therefore an exact comparison in the responses is possible. This
arrangement also allowed the investigation of system characteristics with the working
electrode positioned at the center of the sample drop.
Junction hole
20μL sample drop
Air jet
Stationary disc electrode
Hydrophobic ring
Glass substrate Air jet
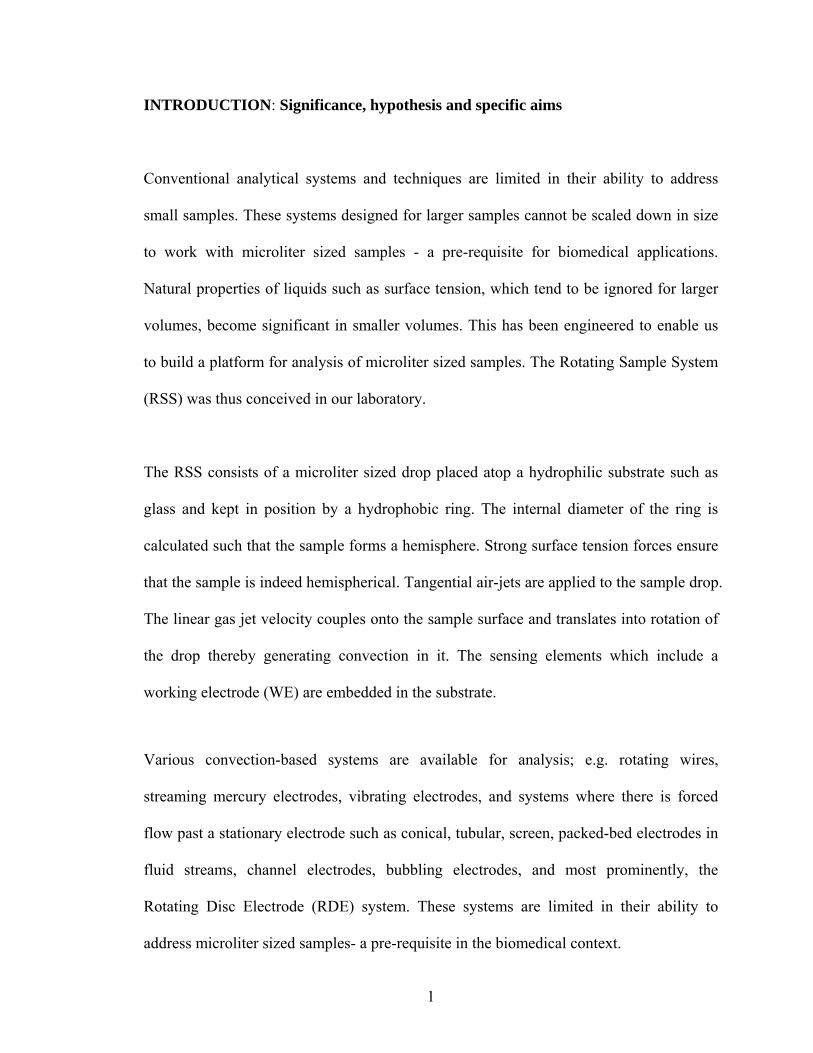
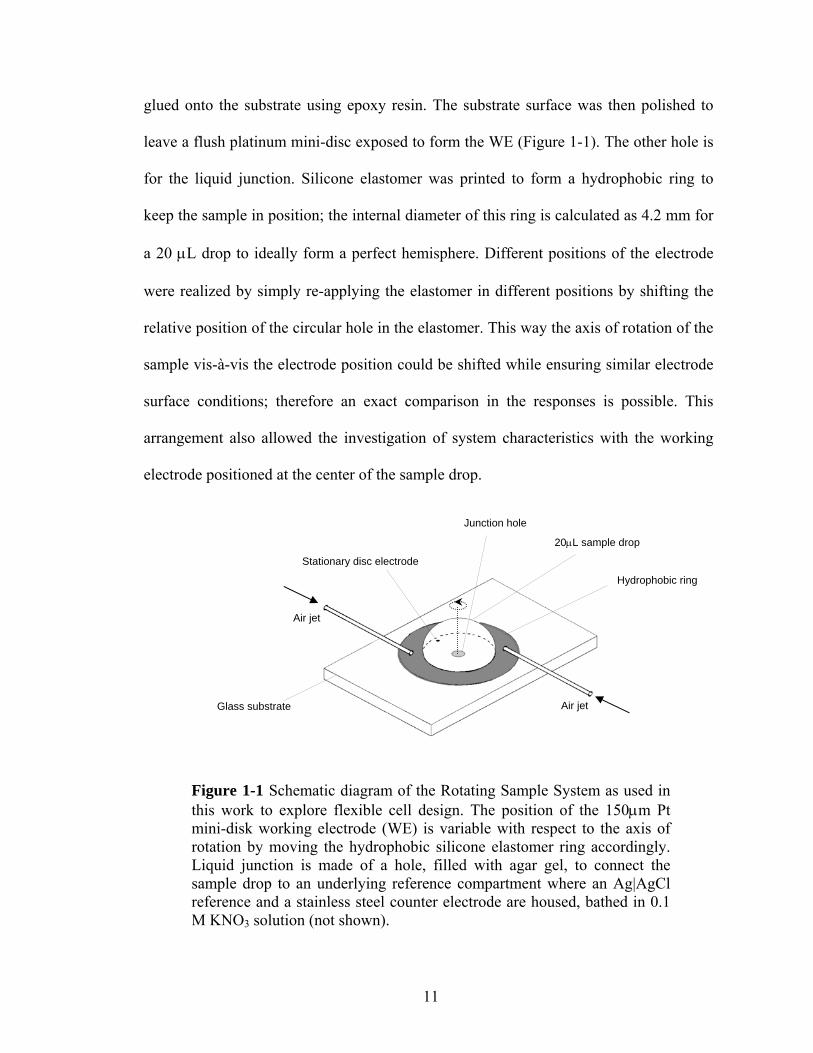
Figure 1-1 Schematic diagram of the Rotating Sample System as used in this work to explore flexible cell design. The position of the 150μm Pt mini-disk working electrode (WE) is variable with respect to the axis of rotation by moving the hydrophobic silicone elastomer ring accordingly. Liquid junction is made of a hole, filled with agar gel, to connect the sample drop to an underlying reference compartment where an Ag|AgCl reference and a stainless steel counter electrode are housed, bathed in 0.1 M KNO3 solution (not shown).
11
It is noted that the presence of an electrical contact line between the electrode and the
contact pad of the substrate may have an averaging effect along the radius of the drop.
This was minimized by fabricating a contact line very thin with respect to the ring
electrode in the cell shown in Figure 2. In the setup shown in Figure 1, electrical contact
is made on the other side of the glass slide which eliminates this problem altogether.
Also, mechanical polishing of the WE is possible in contrast to earlier microfabricated
electrodes (Figure 1-2) since this is in comparison a mechanically more robust electrode.
x
y
o
(a) (b)
(d)
(e) (f)
(c)
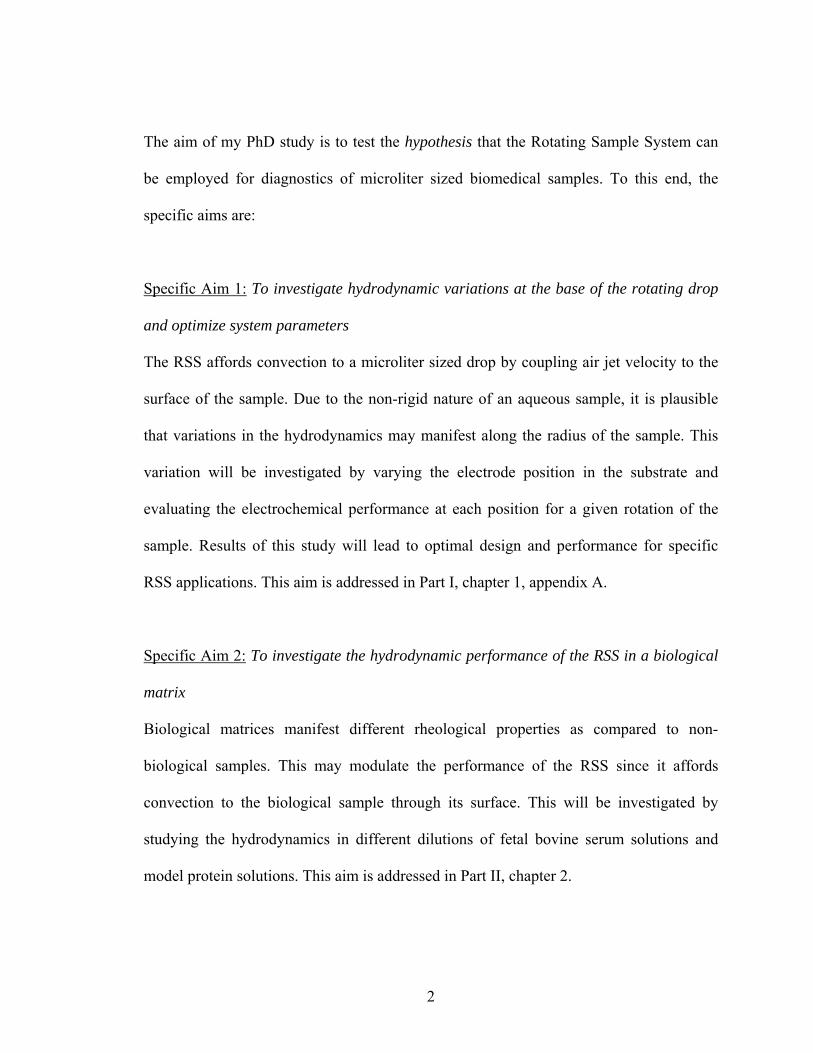
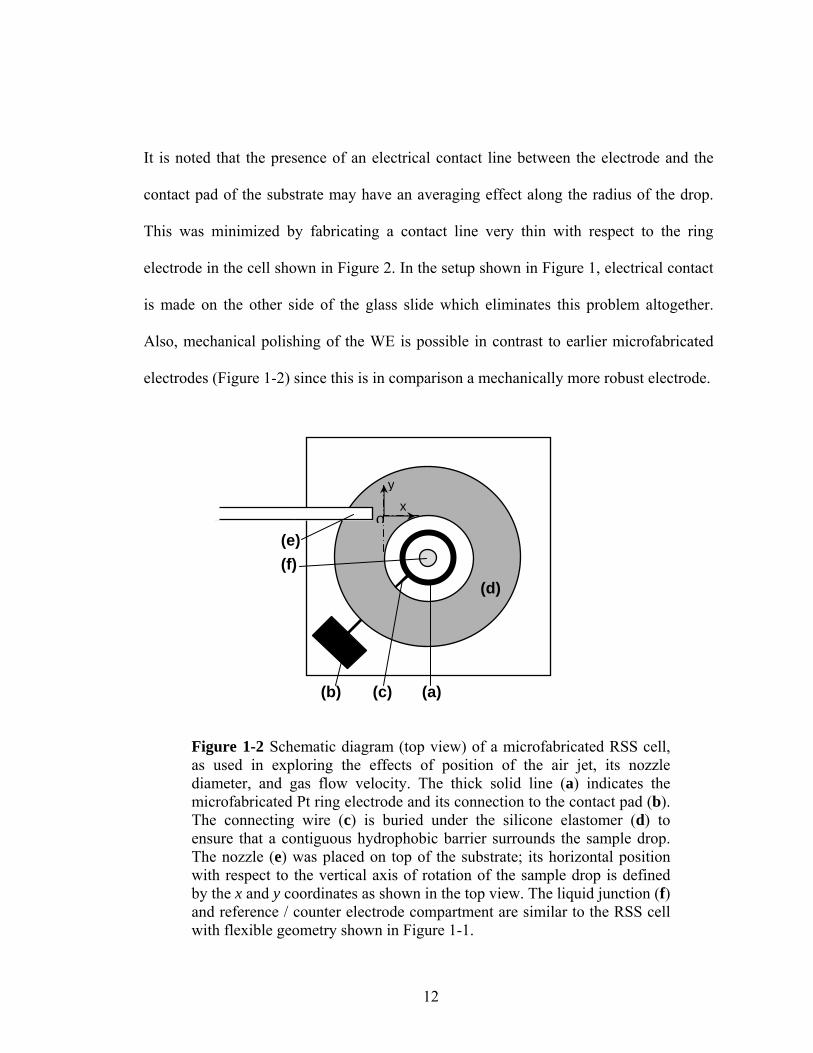
Figure 1-2 Schematic diagram (top view) of a microfabricated RSS cell, as used in exploring the effects of position of the air jet, its nozzle diameter, and gas flow velocity. The thick solid line (a) indicates the microfabricated Pt ring electrode and its connection to the contact pad (b). The connecting wire (c) is buried under the silicone elastomer (d) to ensure that a contiguous hydrophobic barrier surrounds the sample drop. The nozzle (e) was placed on top of the substrate; its horizontal position with respect to the vertical axis of rotation of the sample drop is defined by the x and y coordinates as shown in the top view. The liquid junction (f) and reference / counter electrode compartment are similar to the RSS cell with flexible geometry shown in Figure 1-1.
12
Two anti-parallel humidified air jets were employed in this device for more axis-
symmetric rotation of the sample. Humidified air-jets ensure that loss of sample volume
due to evaporation is minimal [Cserey et al., 1997]. The position of the electrode vis-à-
vis these jets was kept such that the electrode – junction hole line was parallel to the axes
of the jets in all experiments (Figure 1-1).
1.3.3.2 Determination of the effective surface area at, and edge current of, the working
electrode and the diffusion layer thickness
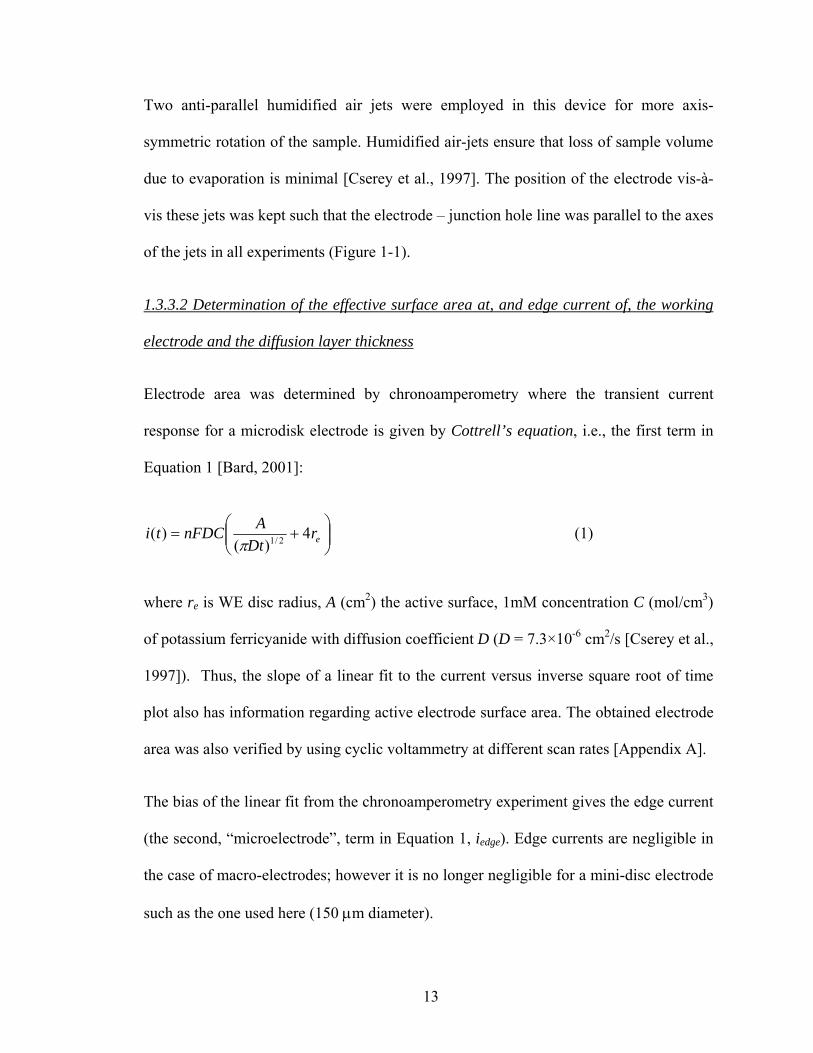
Electrode area was determined by chronoamperometry where the transient current
response for a microdisk electrode is given by Cottrell’s equation, i.e., the first term in
Equation 1 [Bard, 2001]:
⎟⎟⎠
⎞⎜⎜⎝
⎛+= erDt
AnFDCti 4)(
)( 2/1π (1)
where re is WE disc radius, A (cm2) the active surface, 1mM concentration C (mol/cm3)
of potassium ferricyanide with diffusion coefficient D (D = 7.3×10⁻⁶ cm2/s [Cserey et al.,
1997]). Thus, the slope of a linear fit to the current versus inverse square root of time
plot also has information regarding active electrode surface area. The obtained electrode
area was also verified by using cyclic voltammetry at different scan rates [Appendix A].
The bias of the linear fit from the chronoamperometry experiment gives the edge current
(the second, “microelectrode”, term in Equation 1, iedge). Edge currents are negligible in
the case of macro-electrodes; however it is no longer negligible for a mini-disc electrode
such as the one used here (150 μm diameter).
13
Plateau currents of stationary CV plots, obtained when the sample was efficiently rotated
in the RS system, have been used earlier [Cserey et al., 1997] to estimate the diffusion
layer thickness (δ), correcting here also for edge currents:
edgeplateaucorrected ii
nFADC−
=δ (2)
1.3.3.3 Trace Pb analysis
Pb measurement with the RSS in the 160-1600 parts-per-billion (ppb) range was first
performed using differential pulse stripping voltammetry. Mercury was pre-deposited
onto the electrode from a 1.5 mM HgCl2 solution containing 5% HCl for 250 seconds.
This is done to prevent hydrogen evolution, which would mask the Pb stripping current
on a bare platinum electrode [Bartlett et al., 2000; Yekutskaya et al., 1999; Duinker et al.,
1977]. After pre-concentration of Pb on the WE during rotation of the sample for 30 s, a
30 s quiet time was applied with the air jets were switched off. The potential at the WE
was clamped at deposition potential during all this time to avoid any oxidation of Pb that
might otherwise occur due to corrosion processes. Blank runs (with samples containing
no Pb), simulating identical experimental conditions were interspersed between
subsequent Pb tests so that the system self-cleans itself and ensures no residual Pb
contributed to the stripping current.
Two 0.5 mm i.d. glass capillaries were glued to the glass substrate to preempt any
variation in diffusion layer thickness which may have been caused due to slight variation
in nozzle positions. Thus for each individual sample, RSS system parameters such as
electrode position, nozzle position and gas flow rate (180 mL/min) were fixed.
14

Pb solutions were prepared by serial dilutions of a Pb standard solution for atomic
absorption spectrometry. A solution with 0.1 M KNO3 was used as background at pH 2.3,
acidified with trace-select HNO3. Three sets of calibrations (increasing followed by
decreasing followed by increasing concentration of Pb: ‘up-down-up’) were performed.
A background solution with no Pb was also used as a blank. A 300 μm diameter Pt mini-
disc electrode with its center positioned 1.8 mm from the axis of rotation was used.
To test for reproducibility and to confine enhanced sensitivity by using RSS parameters
tuned for lower Pb concentrations, measurements were also performed for 16 ppb
samples (n=5). Hg pre-deposited, Pt mini-disc electrode with 100 μm diameter, whose
center was positioned 1.8 mm from the axis of rotation was used in this case for a 750
second pre-concentration time for Pb.
1.4 Results and Discussion
1.4.1 Air-nozzle study
To optimize the air jet – drop mechanical coupling, the relative jet – drop position as
well as the nozzle inner diameter for air jet were systematically varied with the same
volumetric gas flow rate. The experiments were conducted with a single gas jet and
using the microfabricated version of the RSS cell incorporating a Pt ring electrode
(Figure 1-2). Plateau current of cyclic voltammetry (CV) was used to determine the
15

diffusion layer thickness (Equation 3); the active electrode area was obtained from
chronoamperometry.
The narrower the nozzle the thinner the diffusion layer, i.e., the better is the
electrochemical performance of the system (Table 1-1). Thus, the same volumetric gas
flow rate that translates to higher linear gas velocities in narrower tubing apparently
induces higher rotation rate of the drop. This observation indicates that deterioration of
the soft mechanical coupling between jet and drop due to decreasing contact area with
reduced nozzle inner diameter is less pronounced than the simultaneous positive effect
of increasing air jet velocity.
It is noted that average air jet velocity is inversely proportional to the square of nozzle
inner diameter while the contact area is proportional to the diameter. Thus, their mutual
effects could, in principle, compensate each other for the same volumetric gas flow. The
fact that this is not the case suggests that divergence of the air jet upon exit from the
nozzle is quite significant, even over the short distance from nozzle to drop. The contact
area therefore decreases to a lesser extent than the cross sectional area of the nozzle. Air
jet velocity therefore increases faster than the contact area decreases, which explains the
findings.
16
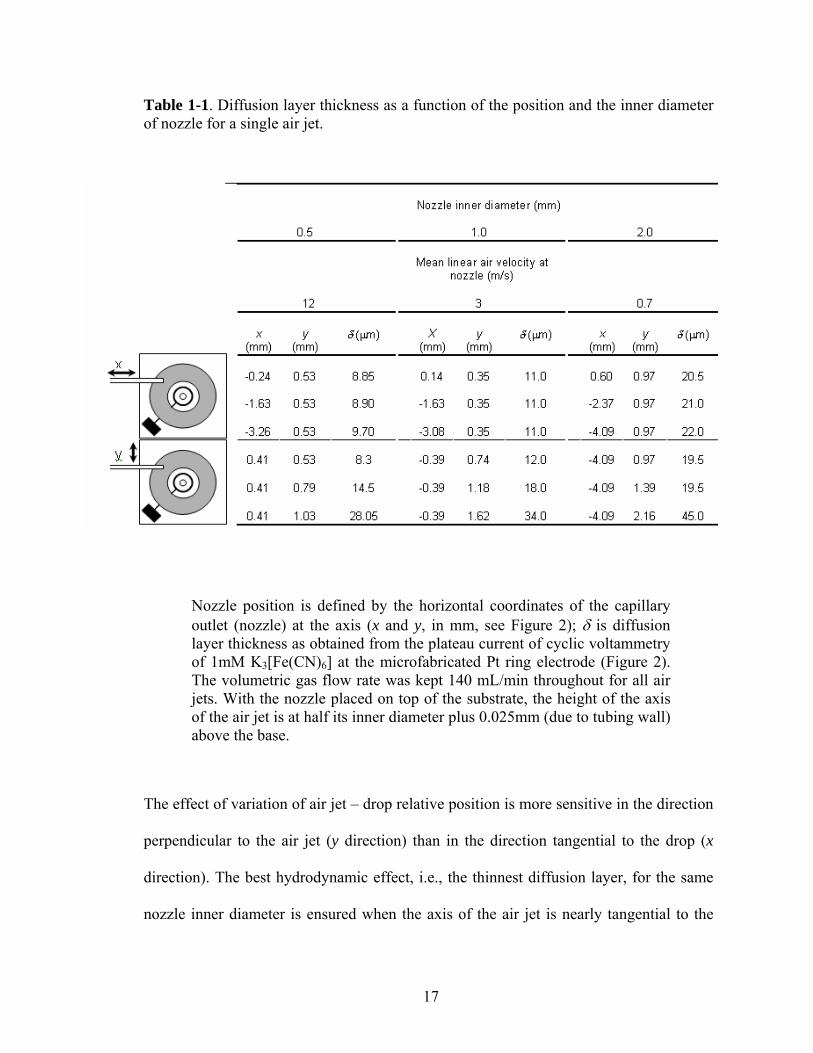
Table 1-1. Diffusion layer thickness as a function of the position and the inner diameter of nozzle for a single air jet.
Nozzle position is defined by the horizontal coordinates of the capillary outlet (nozzle) at the axis (x and y, in mm, see Figure 2); δ is diffusion layer thickness as obtained from the plateau current of cyclic voltammetry of 1mM K3[Fe(CN)6] at the microfabricated Pt ring electrode (Figure 2). The volumetric gas flow rate was kept 140 mL/min throughout for all air jets. With the nozzle placed on top of the substrate, the height of the axis of the air jet is at half its inner diameter plus 0.025mm (due to tubing wall) above the base.
The effect of variation of air jet – drop relative position is more sensitive in the direction
perpendicular to the air jet (y direction) than in the direction tangential to the drop (x
direction). The best hydrodynamic effect, i.e., the thinnest diffusion layer, for the same
nozzle inner diameter is ensured when the axis of the air jet is nearly tangential to the
17
drop (lowest value of y in Figure 1-2, see Table 1-1) and closest to it (highest x value).
This position with the narrowest nozzle used can ensure a diffusion layer in the order of
8 microns thick with this simple system and using just a single gas jet for sample
rotation.
1.4.2 Variation in diffusion layer thickness with WE position along the drop radius
The RSS with flexible geometry (Figure 1-1) was used to compare system performance
for various positions of the working electrode. Two anti-parallel, tangential air jets were
employed.
The active surface area of the Pt mini-disc electrode of this cell was determined using a
chronoamperometry experiment. The values for electrode area were also validated using
cyclic voltammetry experiments using different scan rates. The area thus obtained
compared well with each other as well as with the nominal area (wire cross-section), the
latter being always somewhat larger (Appendix A).
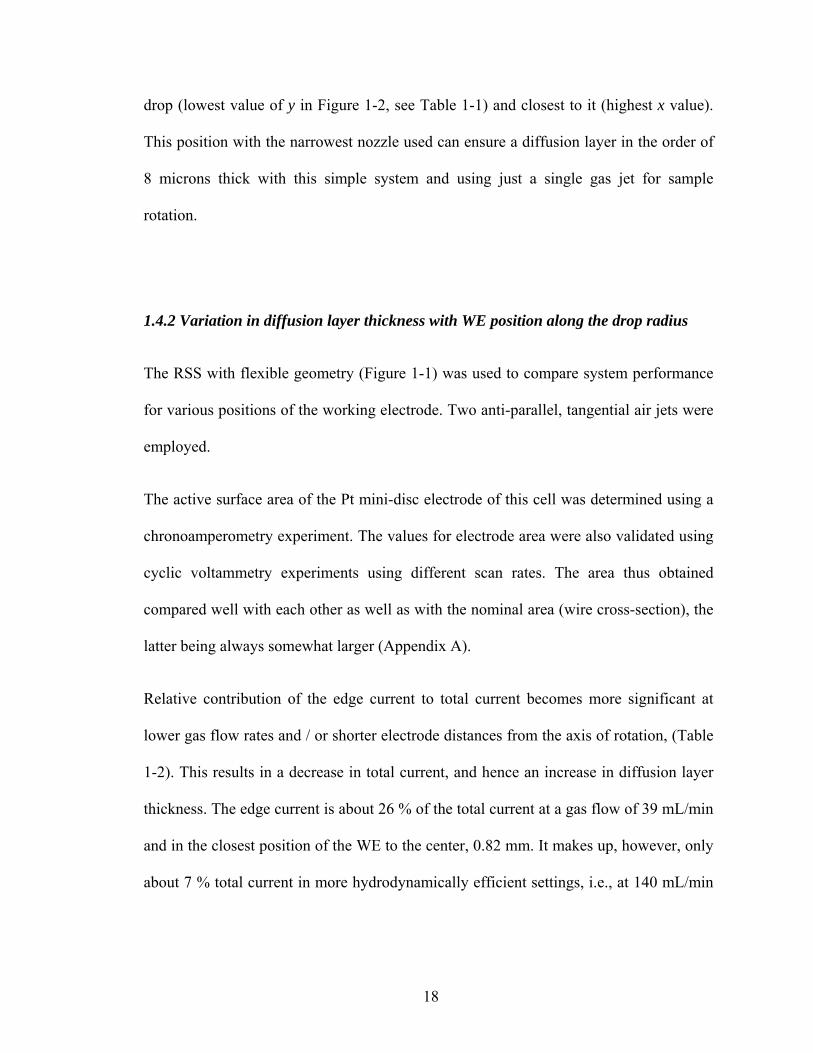
Relative contribution of the edge current to total current becomes more significant at
lower gas flow rates and / or shorter electrode distances from the axis of rotation, (Table
1-2). This results in a decrease in total current, and hence an increase in diffusion layer
thickness. The edge current is about 26 % of the total current at a gas flow of 39 mL/min
and in the closest position of the WE to the center, 0.82 mm. It makes up, however, only
about 7 % total current in more hydrodynamically efficient settings, i.e., at 140 mL/min
18
flow rate and r = 1.89 mm. The diffusion layer thickness was evaluated according to
Equation 2 at different positions of the electrode at different air flow rates (Table 1-2).
Table 1-2. Plateau and edge currents at various air flow rates for different positions of the Pt mini-disc electrode, using two anti-parallel air jets for sample rotation.
Electrode position is measured from axis of rotation of the sample drop. Edge current in each case was calculated using chronoamperometry. The system in Figure 1-1 was used in these experiments.
19
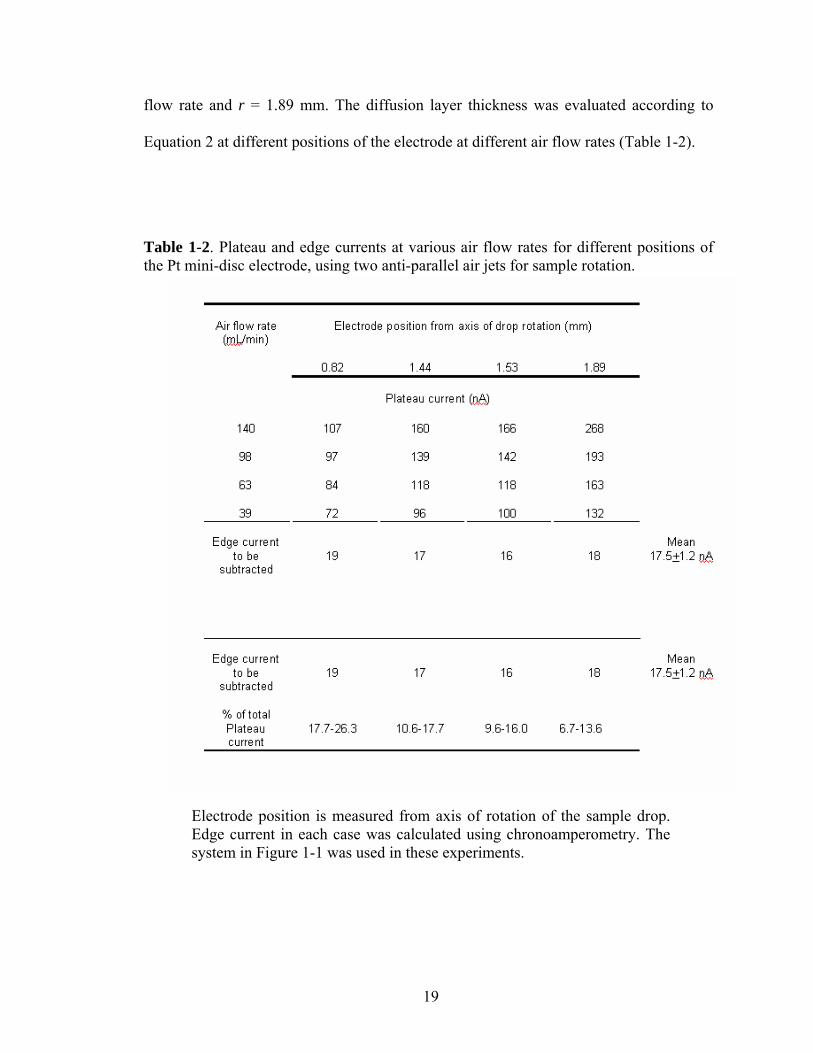
For the working electrode positioned at the axis of rotation of the drop, as the rotation
rate is increased, the current slightly increases indicating increasing hydrodynamic flow
at the surface of the electrode, but peaks in the cyclic voltammograms are still
discernable (Figure 1-3a-f) as opposed to the plateau current which was observed for
electrode positions away from the axis of rotating drop (not shown). This indicates that
while some convection effects are noticeable with slightly increased peak heights,
quiescent conditions exist close to the axis of rotation. Diffusion here is in between
semi-infinite and diffusion layer limited regimes.
Figure 1-3 Cyclic voltammograms (CV) in a 20μL sample drop containing 1 mM K3[Fe(CN)6] with 0.1M KNO3 as background electrolyte for the Pt mini-disc electrode positioned at the axis of rotation on the substrate with various air jet flow rates (a=0ml/min, b=20ml/min, c=39ml/min, d=63ml/min, e=98ml/min, f=140ml/min, g=140ml/min). Initial potential 350 mV, scan rate = 100 mV/s. Two anti-parallel air jets were used, except for the highest air flow rate where CV was also obtained with one air jet.
20
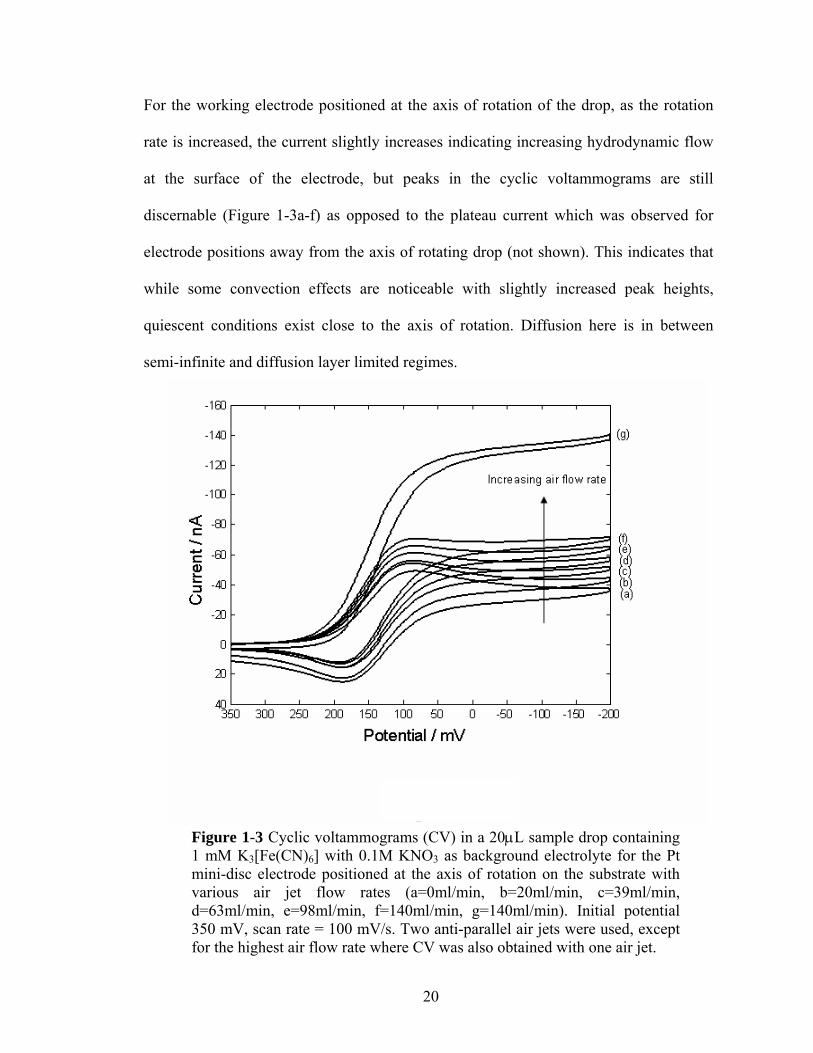
To explain this effect, a very small amount of Evans blue dye solution was introduced at
the apex of a rotating drop from a pulled capillary tip for the observation of
hydrodynamic flow pattern. It was found that the trajectory pattern visualized by the
applied dye solution indicates a spiral path down towards the base of the drop along the
surface; the trace then re-appeared at the axis of rotation beginning to move up before
dilution of the dye (Figure 1-4). This observation indicates that in addition to the primary
motion of rotation, secondary flow patterns exist in the bulk of the drop. Close to the
axis of rotation of the drop the dye trace indicates an upward flow exists. This leads to
quiescent conditions there as evidenced from the cyclic voltammetry experiments.
t=0 t=0.5
t=1.5 t=2.0
Figure 1-4 Images showing flow patterns in a rotating drop by injection of Evans dye at the apex of the drop. Pictures of the drop rotated by 39 ml/min gas jet were taken.
21
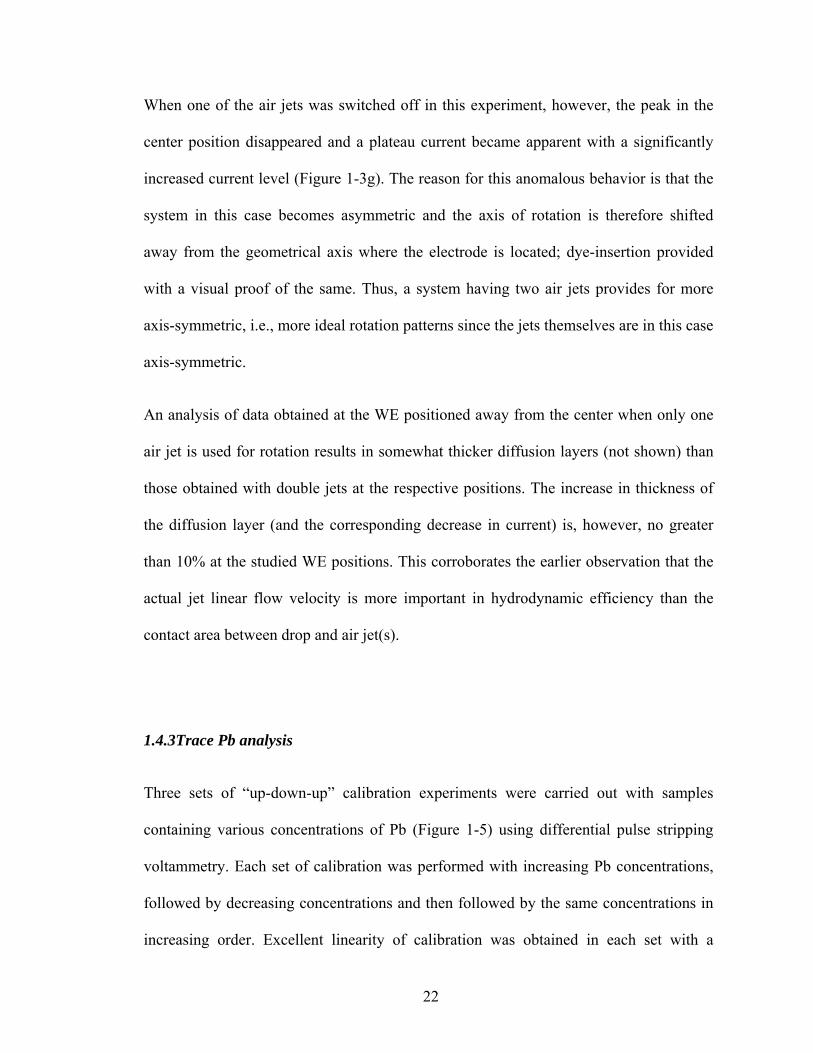
When one of the air jets was switched off in this experiment, however, the peak in the
center position disappeared and a plateau current became apparent with a significantly
increased current level (Figure 1-3g). The reason for this anomalous behavior is that the
system in this case becomes asymmetric and the axis of rotation is therefore shifted
away from the geometrical axis where the electrode is located; dye-insertion provided
with a visual proof of the same. Thus, a system having two air jets provides for more
axis-symmetric, i.e., more ideal rotation patterns since the jets themselves are in this case
axis-symmetric.
An analysis of data obtained at the WE positioned away from the center when only one
air jet is used for rotation results in somewhat thicker diffusion layers (not shown) than
those obtained with double jets at the respective positions. The increase in thickness of
the diffusion layer (and the corresponding decrease in current) is, however, no greater
than 10% at the studied WE positions. This corroborates the earlier observation that the
actual jet linear flow velocity is more important in hydrodynamic efficiency than the
contact area between drop and air jet(s).
1.4.3Trace Pb analysis
Three sets of “up-down-up” calibration experiments were carried out with samples
containing various concentrations of Pb (Figure 1-5) using differential pulse stripping
voltammetry. Each set of calibration was performed with increasing Pb concentrations,
followed by decreasing concentrations and then followed by the same concentrations in
increasing order. Excellent linearity of calibration was obtained in each set with a
22
unified regression coefficient of 0.9927 (Figure 1-5). Using 3σ [Banks et al., 2004;
Analytical Methods Committee, 1987], these settings yielded a detection limit of 14 ppb
Pb level.
The amount of Pb, N, deposited during time t, is the difference between the initial
amount in the sample and the decreased amount at the end of the deposition step.
Diffusion limited depletion being proportional to concentration in the sample, deposition
flux decreases exponentially with time [Cserey et al., 1997]:
⎟⎟⎠
⎞⎜⎜⎝
⎛−=
− tVAD
eVCN δ10 (3)
where V is the volume of the sample (20 microliters), C0 is the initial concentration of Pb
in the drop, A is the area of the electrode, D is diffusion coefficient of Pb2+ in aqueous
solution, and δ is the diffusion layer thickness. The amount deposited can be obtained
experimentally by integration of the stripping current. Equation 3 suggests that
exhaustive deposition of the analyte requires long deposition times and/or a large
electrode area. Since the electrode size used here is small and the deposition times are
moderate, the deposited amount can be estimated with a linear approximation of
Equation 3 that is valid for short time period. The diffusion layer thickness (δ) for Pb
stripping analysis is therefore estimated using
NADtC0=δ (4)
23

The estimated diffusion layer thickness was 10.2 + 1.6 μm obtained for set of
experiment of decreasing Pb concentrations.
Figure 1-5 Up-down-up calibrations for anodic stripping analysis of trace Pb in 20 μl aqueous drops. Linear regression is shown for peak differential currents of samples containing 160, 400, 800, 1200 and 1600 ppb Pb. Pre-concentration potential of -750 mV was used as measured against Ag|AgCl reference electrode with junction (3M KCl) with a pre-concentration time of 30 s. In stripping step differential pulse voltammetry (DPV), the following parameters were used: 25 mV of amplitude, 4 mV of voltage step, 0.05 s of pulse width, 0.012 s of sampling period, 0.1 s of pulse period. Nitrogen gas jets for the sample rotation were switched off 30 s before the stripping step; the potential was clamped at -750 mV during this period (quiet time). A Hg pre-deposited, Pt mini-disc with 300 μm diameter was used as WE. Inset: Stripping Voltammograms for samples containing 16 ppb Pb (n=5). Pre-concentration time used here was 750 s for a 100 μm Hg layer pre-deposited onto the Pt mini-disc electrode. DPV parameters were the same as those used for up-down-up calibrations.
24
Repeatability and sensitivity for trace Pb detection using the RSS in the lower tens of
ppb range was then tested. A Hg pre-deposited, platinum mini-disc electrode with 100
μm diameter was used for detection of 16 ppb Pb. Improved signal to noise ratio was
achieved in this case by increasing the deposition time to 750 seconds (inset, Figure 1-5).
The measurement was repeated five times to test for reproducibility. The coefficient of
variation for stripping peak heights and peak areas were 1.8% and 1.4% respectively.
The diffusion layer thickness estimated from the five measurements was 9.2 + 0.1 μm.
With improved signal-to-noise ratio, this setup and protocol yielded a detection limit of
240 ppt (parts-per-trillion) Pb level based on 3σ [Banks et al., 2004; Analytical Methods
Committee, 1987].
1.5 Conclusions
The Rotating Sample System is based on the idea that for very small aqueous samples,
effective hydrodynamic electrochemistry can be realized by turning the Rotating
Electrode System upside down and keeping the electrode steady while rotating the
sample drop on top via soft mechanical coupling with tangential air jets. At such small
volume of the sample, surface tension ensures that drop integrity is maintained during
rotation.
25
Increasing the number of air jets with the same air velocity each does not necessarily
increase rotation very much, but provides for more axis-symmetric rotation of the drop.
At least two air jets would be required for axis-symmetric rotation of the sample.
Secondary bulk flow patterns exist in addition to the primary rotation of the sample. This
secondary flow within the drop bulk modulates the diffusion layer thickness. These
secondary flow patterns also contribute to the mixing effect in the sample. Minor
variations of diffusion layer thickness are hence manifest with varying the distance of
the working electrode from the axis of rotation. At the center of the sample, quiescent
condition exists and offers an ideal location for the reference junction to be positioned.
Currents can be increased, and in stripping detection, deposition times shortened,
however, by positioning the electrode as close to the drop edge as possible since the
diffusion layer is the thinnest here. This position is empirically the most optimal position
for trace metal analysis. At the expense of increased pre-concentration time, improved
signal-to-noise ratio can be obtained by decreasing the electrode size. Larger electrodes
reduce the deposition time, but their detection level is limited by the background that
forms the baseline. Therefore, for lower concentration ranges, as the results show, using
a smaller electrode will enhance sensitivity significantly.
26
1.6 Acknowledgements
The authors gratefully acknowledge Prof. C.-C. Liu’s assistance in providing access to
fine drilling equipment. The Pb analysis work was partially supported by Vision Sensors
LLC. We would like to thank the Case School of Engineering for a Case Prime
Fellowship to GS.
27
Chapter 2
Rotating Sample System: Hydrodynamic Electrochemistry in
Biological Matrices
Gautam N. Shetty, Miklós Gratzl Department of Biomedical Engineering
CASE, Cleveland OH 44106
This work was submitted to Analytical Chemistry, October 2005
(reproduced with kind permission)
28
2.1 Abstract
The rotating sample system (RSS) has been conceived in the authors’ laboratory as a
convection platform for analysis in microliter sized samples. The sample is placed atop a
stationary substrate such as glass and kept in position by a hydrophobic ring with
electrode(s) for electrochemical analyses embedded flush with the substrate. Tangential
air jets rotate the sample about its axis, generating vigorous convection in it. This
enhances mass transport and thus increases sensitivity and/or reduces detection time in
electrochemical stripping analysis. In other applications the mixing effect of convection
helps homogenize the sample. Due to its ability to address miniature samples, the RSS is
ideal for analyses of biological fluids. Convection properties of the RSS in aqueous, non-
biological samples have been established in earlier works. We report here how
biomolecular components such as proteins and lipids affect the rotation of acid pre-
treated fetal bovine serum solutions. Effects of protein adsorption at the air-sample and
adsorption at sample-electrode interfaces on the convective properties in the sample are
also discussed. The utility of lipids in effecting better convection properties in protein-
containing samples is also reported.
2.2 Introduction
A number of techniques have been employed to generate convection in aqueous samples
to aid electrochemical analysis, such as rotating wires, streaming mercury electrodes,
29
vibrating electrodes, and systems where there is forced flow past a stationary electrode
such as conical, tubular, screen, packed-bed electrodes in fluid streams, channel
electrodes, bubbling electrodes, and most prominently, the rotating disc electrode (RDE)
system [Bard, 2001]. The rotating sample system (RSS) in comparison to the above
operates with a sample size in the order of microliters. Surface tension, which is
negligible in comparison to body forces in larger samples, becomes a significant factor in
small volumes that are analyzed using the RSS. The resultant near semi-spherical shape
of the sample drop is a result of a trade-off between surface tension, gravity and adhesion
between the drop and the substrate [Neumann, 1996]. Surface tension is so dominant a
factor that drop integrity is maintained even in the presence of strong centrifugal forces at
high rotation speeds. Titration [Xie et al., 1996] and trace metal analyses [Chapter 1;
Cserey et al., 1997] in microliter samples have been shown to be feasible in model
aqueous samples using the RSS. This makes the RSS an attractive platform for the
analysis of biological samples.
Proteins constitute a major component of biological fluids such as serum and blood [Voet,
1998]. Presence of proteins alters the physicochemical properties of aqueous samples. In
addition to inducing changes in viscosity, proteins have a tendency to migrate to the air-
liquid interface and alter surface properties as well [Aschaffenburg et al., 1946]. The
latter is of particular interest vis-à-vis the RSS since it is a convective system where
convection is imparted to the target sample drop via coupling of a tangential gas jet(s)
with the sample surface. This is in contrast to all other systems where convection is
afforded to the sample bulk. Surface tension of serum (50 dyne/cm [Geigy
30
Pharmaceuticals, 1962]) is much lower than that of water (72 dyne/cm [Ross, 1988]).
This reduction in surface tension affects the ability of the gas jets (e.g. nitrogen jets) in
rotating the sample drop effectively and is one of the motivations of this study.
We have shown that pre-treatment by filtering out proteins improves the convection
properties of serum [Cserey, 2001]. However, filtering is not a practical approach in case
of microliter sized samples. The only practically feasible pre-treatment that is also
sometimes essential, is the dilution of the biological sample to reduce viscosity. For trace
metal analysis in biological matrices, dilution with a strong acid is essential for extraction
of the target metal ion from its protein complex [Cserey, 2001; Banks et al., 2004;
Kruusma et al., 2004]. Dilution of the biological samples also ensures that the problem of
electrode fouling is reduced, since the amount of protein adsorbed is proportional to its
concentration [Jaenicke et al., 1998].
Convection assists in mass transport since diffusion in a convected system is limited
across a thin layer at the electrode called the ‘diffusion layer’. The RSS has been shown
to achieve a diffusion layer thickness of less than 10 μm when rotated by air-jets with
flow rates of about 100 mL/min [Chapter 1; Cserey et al., 1997]. Protein adsorption onto
the electrode surface also causes reduction in active surface area available for
electrochemical analysis [Rai et al., 2003; Guo et al., 1996] called electrode ‘fouling’. It
is believed that the layer of adsorbed proteins is a monolayer thick [Young et al., 1988].
In the case of insulin however, there is aggregation of insulin monomers leading to a
thicker (greater than monolayer) coverage by the adsorbed protein molecules [Nylander
31

et al., 1994]. It is not clear in what way this adsorbed layer impedes access to the
electrode and affects the hydrodynamic performance in convection-based electrochemical
systems. Increased diffusion layer thickness due to the adsorbed protein layer would
results in reduced sensitivities and increased detection times.
In light of all of the above a better understanding of the convective properties of
biological matrices is warranted.
2.3 Experimental
2.3.1 Materials
All chemicals were from Sigma (St Louis, MO); solutions were made with 18.2 MΩ
Milli-Q water (Milli-QUV plus from Millipore, Billerica, MA). Regular fetal bovine
serum (Equitech-Bio Inc., Kerrville, TX) and dialyzed (triple 0.1 micron filtered) fetal
bovine serum (Gibco, Invitrogen Corp., Carlsbad, CA) were used to study the
hydrodynamic performance of RSS in a biological matrix. Serum samples were diluted
with pH 1 sulphuric acid (Sigma). These serum samples were characterized
electrochemically using analytical grade potassium ferrocyanide (Sigma) such that its
final concentration in a 20 microliter sample is 2.5mM. Lyophilized bovine serum
albumin (BSA) (Sigma) and lyophilized human serum albumin (HSA) (Sigma) were used
to simulate the presence of protein component in serum samples; lyophilized human
hemoglobin (Sigma) was used to simulate the same in a blood matrix. Intralipid 20%
(Baxter Healthcare Corp., Deerfield, IL), a 20% lipid fat emulsion was used to simulate
32
the presence of lipids in blood and serum. Capillary tubes (A.H. Thomas Co.,
Philadelphia, PA) having 0.025 mm wall thickness and 0.5 mm i.d. were used to direct
the nitrogen jets to rotate the samples. Nitrogen flow rate was measured with a
volumetric flow meter (Cole-Parmer Instrument Co., Niles, IL) and was maintained at
140 mL/min when the samples were rotated.
2.3.2 Apparatus
Electrochemical measurements were made using CH100 electrochemical workstation
(CH Instruments, Austin, TX). Homemade substrates with platinum mini-disc electrodes
were employed. The electrochemical cell (Figure 1) was fabricated using Corning glass
slide (7.5 cm × 2.5 cm and 0.1 cm thick, from Fisher Scientific, Pittsburgh, PA) as
substrate. The WE was made from 150 μm and 250 μm diameter platinum wires (Alfa
Aesar, Ward Hill, MA). Silicone elastomer (DOW Corning, Midland, MI) was applied to
form the hydrophobic ring that confines the sample drop into a semi-sphere (Figure 1).
Electrodes were polished on Microcloth polishing pad (Buehler, Lake Bluff, IL) mounted
on a Delta 31-120 disk sander (Delta, Jackson, TN). Alumina polishing paste (Buehler) of
1 and 3 micron sizes were used for polishing.
The Ag|AgCl (3N KCl)reference electrode (BAS, West Lafayette, IN) and gold wire
spiral counter electrode (Alfa Aesar) were placed under the substrate in 0.1 M KNO3,
connected to the sample side by a liquid junction filled with 1 wt% agar gel (Sigma)
(Figure 1).
33
YM-10 centrifuge filter units (Millipore) were used for filtration of serum with a
Labofuge 400 (Heraeus Instruments, Hanau, Germany) centrifuge. Rotating disc
electrode (RDE) system (Pine Instruments, Grove City, PA) was used for comparative
studies.
2.3.3 Procedures
2.3.3.1 Fabrication of the electrochemical cell
Silicone elastomer was deposited on a glass micro slide substrate to form a hydrophobic
ring to keep the sample in position; internal diameter of this ring was calculated as 4.2
mm for a 20 μL drop to ideally form a hemisphere (Figure 2-1). Two holes 1mm in
diameter were drilled through the glass micro slide. Glass of the same material was
melted around the tip of a 250 μm diameter platinum wire so as to cover the tip
completely with a glass bead that was a little larger than the drilled hole. This end of the
wire was inserted in one of the holes so that it fits in snugly. The bead was then glued
onto the substrate using an epoxy resin. The substrate surface was then polished to leave
a platinum 250 μm diameter mini-disc electrode (working electrode - WE) flush with the
glass substrate. The WE position was offset 1.8 mm from the center of the hydrophobic
ring. The other hole, drilled at the center is for the liquid junction and consists of a 1 wt%
agar liquid junction that connects the sample to a chamber containing an Ag|AgCl
reference and gold counter electrodes (Figure 2-1).
34

Anti-parallel gas jets
Silicone elastomer ring
Glass slide substrate
20 μL sample
250 μm dia. Pt electrode1 wt% agar gel junction
TOP VIEW
SIDE VIEW
Figure 2-1 Schematic diagram of Rotating Sample System. Nitrogen is humidified before directing it to the sample for rotation. The agar gel junction connects the sample to an underlying compartment housing the reference and counter electrodes immersed in 0.1 M KNO3 solution (not shown).
2.3.3.2 Electrode Polishing
The electrode on exposure to a biological matrix is fouled [Rai et al., 2003; Guo et al.,
1996] by non-specific adsorption of proteins. Hence, after each experiment involving
electrode contact with a biological sample, the electrode was polished before it could be
re-used. The electrode was polished with 1 and 3 micron alumina powder on a polishing
disk mounted on a disk sander. After every polishing routine, electrode responses in non-
biological solutions were used for comparison and ensure uniformity of electrode surface
conditions.
35
2.3.3.3 Assessing RSS’ convective properties in various fetal bovine serum dilutions and
comparison with RDE
Cyclic voltammetry of potassium ferrocyanide has been used to characterize convection
in stationary and rotated model aqueous samples [Chapter 1, Cserey et al., 1997].
However, due to the reducing properties of serum proteins [Sakoguchi et al., 1984;
Bryant et al., 1929], freshly made potassium ferrocyanide was employed to investigate
the convective properties of samples with different fetal bovine serum concentrations of
1%, 5%, 10% and 50%, all diluted in pH 1 sulphuric acid. Cyclic voltammograms were
conducted in both stationary and rotated samples. The flow rate in the gas-jets for the
rotated samples was maintained at 140 mL/min in all cases. In order to compare the
results obtained with the RSS with a conventional convection platform, the above set of
experiments was repeated using an RDE with the electrode rotated at 3000 rpm.
2.3.3.4 Studying convection in the RSS with filtered serum samples
As a control to understand the contribution of proteins to the convective properties in
biological matrices using the RSS, experiments to study convection were conducted in
samples where the proteins were filtered out. Dialyzed fetal bovine serum, which consists
of only high molecular weight proteins was used. This dialyzed serum was then filtered
using a Centricon Millipore filter (10 kDa nominal molecular weight limit);
centrifugation was done for 15 minutes at 3500 rpm. The filtrate thus obtained was the
non-protein component of serum. The convection properties of samples containing
different concentrations of this filtrate were analyzed using cyclic voltammetry.
2.3.3.5 Studying convection using model proteins simulating serum samples
36
In order to understand the mechanisms underlying the convective properties in serum
samples, convection studies were done in samples of model protein solutions. The protein
contribution to the convective properties in serum samples was simulated with samples
containing BSA. Albumin is the most abundant protein present in serum; it constitutes
about 60% of the total protein content [Geigy Pharmaceuticals, 1962]. Hence, the
properties of BSA would dominate the convective properties of serum. Diluting a stock
solution containing 3.9 g/dL BSA (native concentration of BSA in serum) using the same
dilution protocols used for fetal bovine serum used before, convection studies were done
using cyclic voltammetry.
Dilution of biological samples is an established method to reduce their viscosity and also
alleviate the problem of protein adsorption onto electrodes by reducing its concentration.
Samples of solutions containing 3.9 mg/dL (0.1% of native concentration) BSA and 0.39
mg/dL (0.01% of native concentration) BSA were investigated for their convective
properties. This was done to find out the lowest concentration level of BSA that its
presence would affect convection properties in the RSS. The convective properties of
BSA samples were also tested at pH 7.4.
Although HSA and BSA have different molecular weights, their structures share
analogous regions [Sakata et al., 1980] and the two can be considered as homologous to
each other [Bradshaw et al., 1969]. Its convective properties were also tested to ensure
that the findings of the rotation studies of samples containing BSA would extend to
human serum samples. In blood hemoglobin is the most significant protein component.
Therefore, for blood analyses, it is important that the convective properties of
hemoglobin solutions be understood. From a stock solution of 13 g/dL of hemoglobin
37
(native hemoglobin concentration in blood [Geigy Pharmaceuticals, 1962]), different
dilutions were tested for their convective properties.
2.3.3.6 Convection study in protein solutions with lipid addition
In addition to proteins, lipids constitute an important component of biological fluids.
Samples of model protein solutions simulate the protein contribution to the convective
properties of serum. In order to better characterize the convection properties of serum,
lipid addition to model protein samples is necessary. Intralipid (a widely used intravenous
lipid emulsion) was used as the model lipid component, and is known to contain all the
essential fatty acids [Wretlind, 1981]. Intralipid was diluted using pH 1 sulphuric acid
and added to the protein sample such that 1 wt% Intralipid was present in the sample,
also containing 2.5mM potassium ferrocyanide.
2.3.3.7 Effect of protein adsorption on mass-transport to electrode surface
Non-specific adsorption of proteins causes reduction in active surface area of the
electrode; this is electrode fouling. If this adsorbed protein layer forms a diffusion
limiting barrier by increasing the diffusion layer thickness, it would result in longer
detection times and/or reduced sensitivities, especially in applications such as trace metal
analyses involving hydrodynamic electrochemistry. In order to understand the effect of
protein adsorption on mass-transport to the electrode, we conducted cyclic voltammetry
experiments first in samples containing no protein but 2.5 mM potassium ferrocyanide
acidified by pH 1 sulphuric acid. The peak current corresponding to the oxidation of
potassium ferrocyanide in a stationary sample is given by [Bard, 2001]:
21
21
23
51069.2 νCAFDnipeak ×= (1)
38
where n is no of electrons exchanged, A (cm2) is the electrode area, F is the Faraday’s
constant (96500 C/mol), D (cm2/s) is the diffusion constant of potassium ferrocyanide, C
(mol/cm3) is the concentration of potassium ferrocyanide and v is the scan rate (V/s). In a
rotated sample, the potassium ferrocyanide oxidation current is limited by a diffusion
layer δ (cm) and an increased plateau current becomes visible given by [Chapter 1]:
δnFADCi plateau = (2)
A stationary sample containing 0.39 g/dL BSA (10% of native BSA concentration),
acidified by pH 1 sulphuric acid was placed for 10 seconds to allow for the BSA to
adsorb onto the electrode. The sample was then replaced by one containing only 2.5 mM
potassium ferrocyanide acidified at pH 1. The peak current in a stationary sample
measured using cyclic voltammetry is given by equation 1. The ratio of the peak currents
before and after adsorption of BSA provides the fraction of accessible electrode surface
area, considering all other parameters remain the same. In rotated samples, the peak
current is replaced by a plateau current given by equation 2. The diffusion layer
thicknesses being identical, then the ratio of plateau currents before and after BSA
adsorption also characterizes the fraction of accessible electrode surface area. The above
two ratios would be identical if all other parameters remain unchanged. Hence, a
comparison of the above ratios was done to identify the effect of protein adsorption on
mass-transport to the electrode. The same set of experiments was also repeated for BSA
adsorption times of 5, 25, 35, 50 and 75 seconds. Comparisons were made for currents
measured in BSA free samples to ensure that changes in diffusivity of potassium
ferrocyanide in protein matrices is not a factor [Chang et al., 2005].
39
2.4 Results and Discussion
2.4.1 Convective properties of fetal bovine serum dilutions assessed with the RSS and
comparison with RDE
Convective properties in samples containing different concentrations of acidified fetal
bovine serum were studied using cyclic voltammetry in both stationary and rotated
samples. Oxidation current of potassium ferrocyanide in the sample was monitored in
each case. In stationary samples, a reduction in the ferrocyanide oxidation peak was
observed with increasing serum concentration (Figure 2-2A). This implies increased
protein adsorption onto the electrode surface and reduced diffusivity, both of which result
in reduced currents with increasing serum concentration. However, results with rotated
samples yielded a contrasting trend (Figure 2-2B); increasing serum concentrations
elicited increased currents (Figure 2-2B). Efficient convection properties were expected
at lower concentrations of serum due to lower viscosity. The increased current densities
at higher serum concentration are indicative of significantly better convective properties
with increasing concentrations of serum. Improvement in convection properties with
increasing serum concentrations was observed despite reduced diffusivity, increased
viscosity and reduced electrode area.
40
100 200 300 400 500 600
-0.1
0
0.1
0.2
0.3
0.4
0.5
0.6
0.7
0.8
0.9
Potential (Vs Ag|AgCl) / mV100 200 300 400 500 600
-0.1
0
0.1
0.2
0.3
0.4
0.5
0.6
0.7
0.8
0.9
Potential (Vs Ag|AgCl) / mV
Cur
rent
/ μA
A B
No serum
No serum
1%
10%
5%
50%
1%
10%
5%
50%
Cur
rent
/ μA
Potential (vs Ag|AgCl) / mV Potential (vs Ag|AgCl) / mV
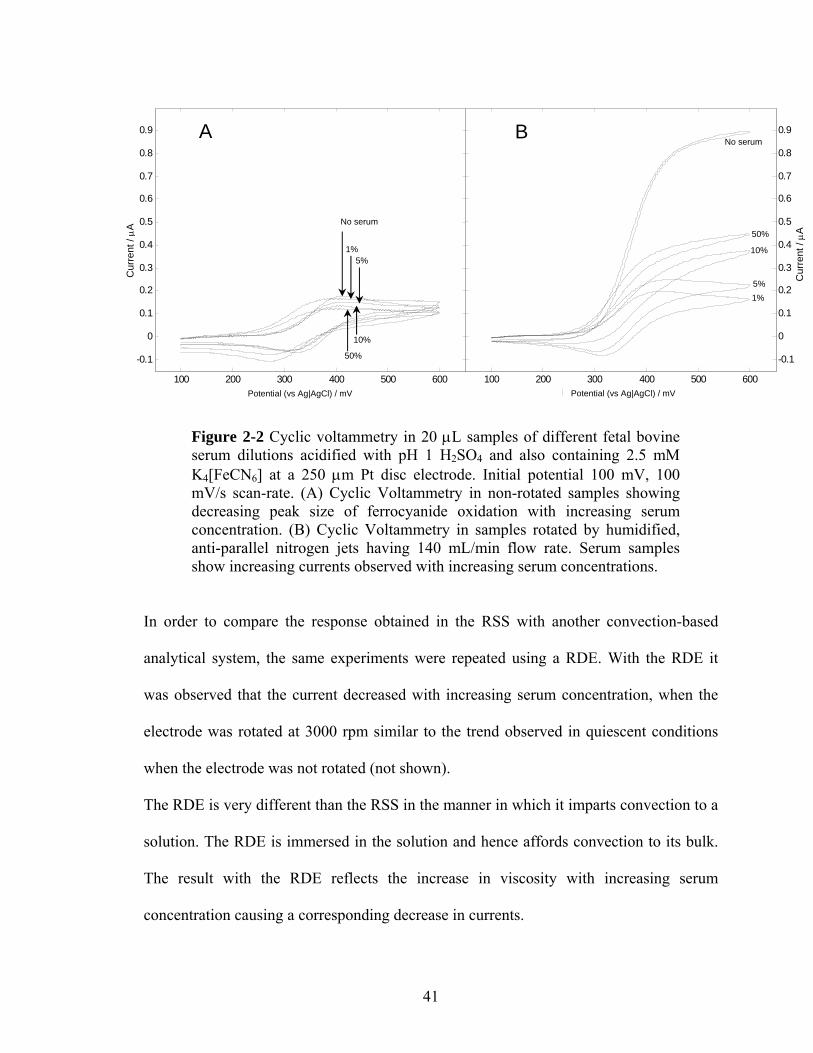
Figure 2-2 Cyclic voltammetry in 20 μL samples of different fetal bovine serum dilutions acidified with pH 1 H2SO4 and also containing 2.5 mM K4[FeCN6] at a 250 μm Pt disc electrode. Initial potential 100 mV, 100 mV/s scan-rate. (A) Cyclic Voltammetry in non-rotated samples showing decreasing peak size of ferrocyanide oxidation with increasing serum concentration. (B) Cyclic Voltammetry in samples rotated by humidified, anti-parallel nitrogen jets having 140 mL/min flow rate. Serum samples show increasing currents observed with increasing serum concentrations.
In order to compare the response obtained in the RSS with another convection-based
analytical system, the same experiments were repeated using a RDE. With the RDE it
was observed that the current decreased with increasing serum concentration, when the
electrode was rotated at 3000 rpm similar to the trend observed in quiescent conditions
when the electrode was not rotated (not shown).
The RDE is very different than the RSS in the manner in which it imparts convection to a
solution. The RDE is immersed in the solution and hence affords convection to its bulk.
The result with the RDE reflects the increase in viscosity with increasing serum
concentration causing a corresponding decrease in currents.
41

The RSS imparts convection to a solution sample via its surface; a better understanding
of the surface properties of biological solutions provides the basis for understanding the
results obtained with the RSS.
In order to identify the reason for the surprising results obtained in rotated serum samples
using the RSS, another control was run by separating the protein and non-protein
components of dialyzed serum by filtration through centrifugation. The filtrate, which
consists of the non-proteinaceous fraction of serum showed results consistent with the
RDE (not shown). This implies that proteins were responsible for the poor convection
properties in a sample even when present at low concentrations levels in the sample.
2.4.2 Effect of presence of proteins on the convective properties of RSS
Bovine serum albumin (BSA), the largest protein component of bovine serum was used
to simulate the effect of the presence of proteins on the convective properties of RSS in
serum. Cyclic voltammetry experiments were conducted in samples containing different
dilutions of a 3.9 g/dL BSA solution (native concentration of BSA in serum) and 2.5 mM
potassium ferrocyanide. Even at 39 mg/dL BSA content (equivalent to 1% native
concentration of BSA in serum), the rotated samples did not show an increase in current
(not shown) in comparison to the currents observed in a stationary sample. This was
similar to the result obtained at low serum concentrations. However, unlike the trend with
bovine serum samples, there was no increase in currents with increasing BSA
concentration (not shown). This implies that although the presence of proteins in the
sample causes poor convective properties in a sample, for higher concentrations of serum,
the presence of proteins alone does not characterize its convective properties. This is
42

because better convection in the sample was observed with increasing concentrations of
serum.
Studies of BSA in solution [Poole et al.., 1984, 1989] have indicated its proclivity to
migrate to the air-water interface and adsorb onto it [Langmuir et al.., 1940; Gonzalez et
al.., 1970]. The adsorbed proteins form a contiguous film, which is elastic [Poole, 1989].
This film is known to be resistant to shear and contributes to surface viscosity [Prins et al.,
1998]. The presence of this film explains the fact that no convection effects are manifest
in samples containing only BSA. The RSS affords convection to the sample via coupling
of the air-jet onto the sample surface. Alteration in the surface properties of the sample
affects the ability of the RSS to translate linear air jet velocities into rotation of the
sample drop. Hence, the poor convective properties exist in samples containing only BSA,
unless the concentration of BSA is too low to form a contiguous film at the surface of the
sample drop.
The above set of experiments was repeated with human serum albumin, and similar
results were observed (not shown). Convective properties in solutions of hemoglobin, the
most significant protein component in blood, showed similar results to those obtained
with BSA. Hence, the results obtained with BSA can be considered representative of
convective properties of human serum and blood matrices.
2.4.3 Convection in BSA solutions with added lipid
Lipids besides proteins form another important constituent of biological fluids. Therefore,
the effect of the presence of lipids on the convective properties in protein-containing
samples was investigated. Cyclic voltammetry of 2.5 mM potassium ferrocyanide in the
43
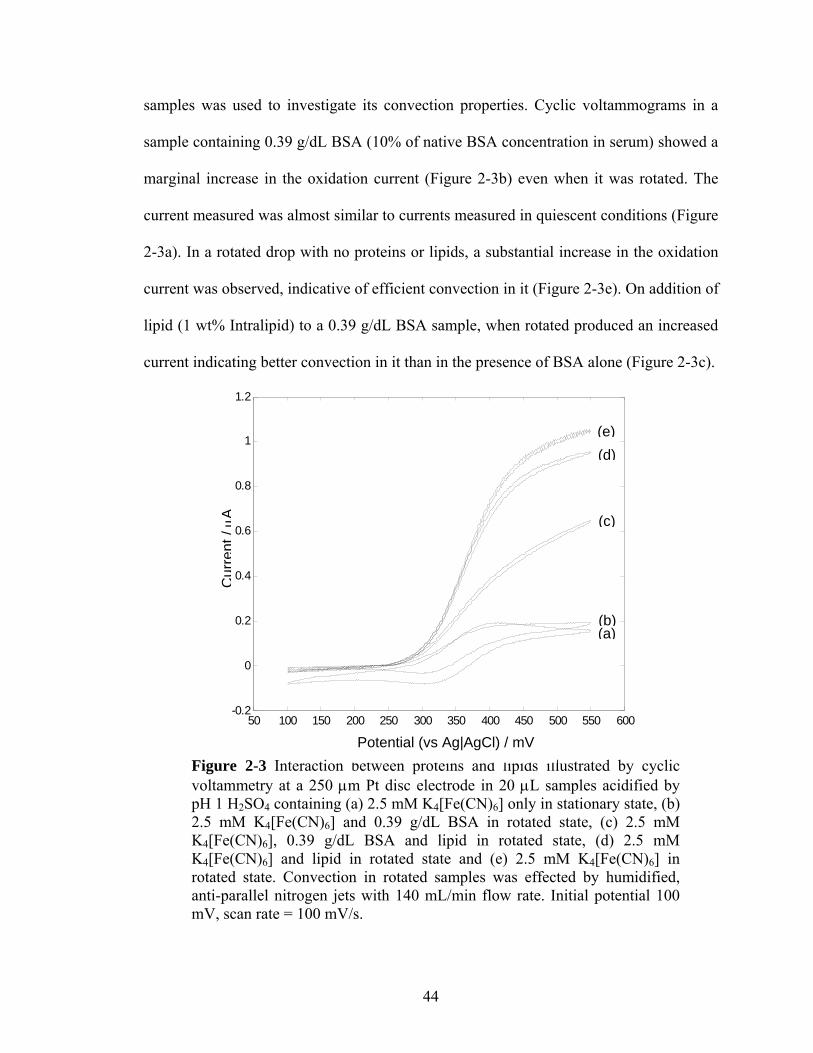
samples was used to investigate its convection properties. Cyclic voltammograms in a
sample containing 0.39 g/dL BSA (10% of native BSA concentration in serum) showed a
marginal increase in the oxidation current (Figure 2-3b) even when it was rotated. The
current measured was almost similar to currents measured in quiescent conditions (Figure
2-3a). In a rotated drop with no proteins or lipids, a substantial increase in the oxidation
current was observed, indicative of efficient convection in it (Figure 2-3e). On addition of
lipid (1 wt% Intralipid) to a 0.39 g/dL BSA sample, when rotated produced an increased
current indicating better convection in it than in the presence of BSA alone (Figure 2-3c).
Figure 2-3 Interaction between proteins and lipids illustrated by cyclic voltammetry at a 250 μm Pt disc electrode in 20 μL samples acidified by pH 1 H2SO4 containing (a) 2.5 mM K4[Fe(CN)6] only in stationary state, (b) 2.5 mM K4[Fe(CN)6] and 0.39 g/dL BSA in rotated state, (c) 2.5 mM K4[Fe(CN)6], 0.39 g/dL BSA and lipid in rotated state, (d) 2.5 mM K4[Fe(CN)6] and lipid in rotated state and (e) 2.5 mM K4[Fe(CN)6] in rotated state. Convection in rotated samples was effected by humidified, anti-parallel nitrogen jets with 140 mL/min flow rate. Initial potential 100 mV, scan rate = 100 mV/s.
50 100 150 200 250 300 350 400 450 500 550 600-0.2
0
0.2
0.4
0.6
0.8
1
1.2
Potential (Vs Ag|AgCl) / mV
Cur
rent
/μA
(d) (e)
(c)
(b) (a)
Potential (vs Ag|AgCl) / mV
44
Cyclic voltammetry in a rotated sample containing only lipid showed a substantial
increase in the oxidation current that was more than that observed in the presence of BSA,
but slightly less than in the case with neither BSA nor lipid in the sample (Figure 2-3d).
Lipids have been known to displace proteins from the air-water interface [Langmuir et al.,
1940; Poole et al., 1986; Poole, 1989], and disrupt protein films. In case of the RSS too,
the presence of lipids disrupt the contiguity of the protein film resulting in a fractured
sample surface. This fractured surface provides for better convection properties than
when a contiguous protein film exists at the interface. In the absence of lipids, the gas jet
velocity is expended in merely stretching of the elastic protein film without generating
any convection in the sample (Figure 2-3b).
In light of the above results, we can infer that at lower serum concentration trace amount
of lipid did not disrupt the protein film sufficiently enough to improve convection in the
sample. However, at higher serum concentration the lipid concentration was sufficiently
high to effectively fragment the protein film and hence effect better convection in it.
2.4.4 Effect of protein fouling on mass-transport to the electrode surface
Cyclic voltammetry experiments were used to assess the effect of protein adsorption on
mass-transport to the working electrode surface (Figure 2-4). Cyclic voltammetry of
potassium ferrocyanide in stationary BSA-free samples serve as a reference for electrode
surface area before protein adsorption. The same in rotated samples provides information
about the mass-transport properties in the absence of protein adsorption onto the
electrode surface. Adsorption of BSA onto the electrode surface was allowed from a
stationary sample containing 0.39 g/dL BSA for 10 seconds. This BSA sample was then
45
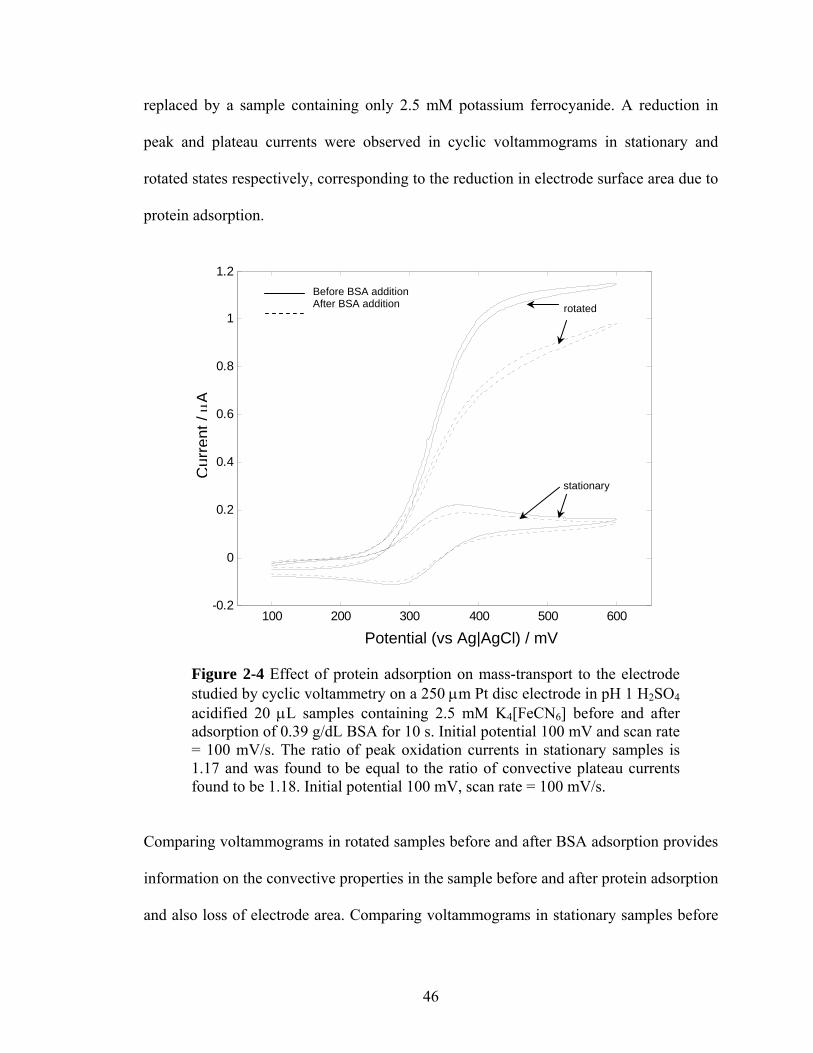
replaced by a sample containing only 2.5 mM potassium ferrocyanide. A reduction in
peak and plateau currents were observed in cyclic voltammograms in stationary and
rotated states respectively, corresponding to the reduction in electrode surface area due to
protein adsorption.
100 200 300 400 500 600-0.2
0
0.2
0.4
0.6
0.8
1
1.2
Potential (Vs Ag|AgCl) / mV
Cur
rent
/μA
Before BSA addition After BSA addition
stationary
rotated
Potential (vs Ag|AgCl) / mV
Figure 2-4 Effect of protein adsorption on mass-transport to the electrode studied by cyclic voltammetry on a 250 μm Pt disc electrode in pH 1 H2SO4 acidified 20 μL samples containing 2.5 mM K4[FeCN6] before and after adsorption of 0.39 g/dL BSA for 10 s. Initial potential 100 mV and scan rate = 100 mV/s. The ratio of peak oxidation currents in stationary samples is 1.17 and was found to be equal to the ratio of convective plateau currents found to be 1.18. Initial potential 100 mV, scan rate = 100 mV/s.
Comparing voltammograms in rotated samples before and after BSA adsorption provides
information on the convective properties in the sample before and after protein adsorption
and also loss of electrode area. Comparing voltammograms in stationary samples before
46
and after BSA adsorption however, provides information only about the loss of electrode
area due to protein adsorption. Results from both can be combined to identify whether
adsorbed proteins act as a mass-transport barrier. Comparison of the ratios of currents
before and after protein adsorption in stationary and rotated samples showed that the
ratios were identical indicating that there was no increase in the diffusion layer thickness
even after protein adsorption..
It was found that for adsorption times 5, 25, 35, 50, 75 seconds from a 0.39 g/dL BSA
sample, the aforementioned ratios were identical (variance in difference between ratios
for each adsorption time was 1.5%), even though the absolute measured current reduced
with increasing adsorption times. This implies that there was no appreciable increase in
diffusion layer thickness due to BSA adsorption. The adsorbed protein layer does not
impede mass-transport to the electrode; but, it blocks parts of the electrode surface
reducing the active surface area available for analysis. It has been shown that the
adsorbed protein layer by itself therefore does not contribute to increasing the diffusion
layer thickness.
2.5 Conclusions
The RSS’ ability to address microliter sized samples makes the system well-suited for
analyses of biological samples. The RSS by coupling linear, tangential air-jets with the
surface of a liquid micro-sample is unique in the way it affords convection to the sample.
Changes in the surface properties of the sample modulate the convection generated in the
sample. This is true also for biological matrices since bio-molecules have an affinity to
47
migrate to the liquid-air interface, thereby affecting the properties of the sample surface.
Usual convection based systems are oblivious to surface modifications since they afford
convection directly to the sample bulk. A better understanding of the interaction that
exists between lipids and proteins at the surface of biological samples can be leveraged to
ensure that the RSS generates effective convection in the sample.
Proteins such as BSA have an affinity to migrate to and adsorb at the air-water interface
forming an elastic film. When tangential gas-jets are applied, only stretching of this film
occurs; linear gas-jet velocity does not translate into rotation of the sample drop. Lipids
however displace proteins from the liquid-air interface and disrupt the contiguity of the
protein film. If the concentration of lipid is high enough, then it negates the effect of
protein film formation on rotation of the sample. This finding can be leveraged to ensure
efficient convection in a sample containing proteins such as BSA. This effect was
observed in protein samples at both acidic and neutral pH and is true of protein samples
present in human serum and blood matrices. This interaction between lipids and proteins
at the air-water interface can be exploited to generate efficient convection in the sample
for applications such as trace metal analyses, titration, electrochemical reaction kinetics
etc.
With increasing serum concentration, the increased amounts of lipids present in it provide
for better convection properties in the sample. Hence, in the case of the RSS dilute
samples with trace amounts of lipid in it have poorer convection properties. However,
high serum concentration samples with higher protein content contribute to greater
48
fouling of the electrode by non-specific adsorption onto it and also have a higher
viscosity. The above two can be reconciled by addition of lipid additives such as
Intralipid to disrupt the protein films in diluted biological samples.
The protein layer adsorbed onto the electrode is a monolayer thick. This work
experimentally proves that in a convected system the proteins adsorbed on the electrode
surface do not impede mass-transport to the electrode surface by way of an increase in
the diffusion layer thickness. The adsorbed proteins do however reduce the active surface
area available for analysis by blocking access to the electrode surface.
Modification of surface properties of the sample modulates the response of the RSS. The
RSS is hence is a unique tool to probe both sample bulk and surface properties.
2.6 Acknowledgements
This work was partly supported by NSF grant 0352443. We would like to thank Dr. Clive
Hamlin, Pathology- CASE, for his invaluable inputs and providing access to centrifuge
facilities at University Hospitals. Advice from Drs. Koji Tohda, Barry Miller and Mark
Pagel are also acknowledged. We would also like to thank Case School of Engineering
for partial Case Prime Fellowship to GS.
49
Chapter 3
Rotating Sample System: A Simple Tool for Rheological
Examination of the Air-Solution Interface
Gautam N. Shetty, Miklós Gratzl Department of Biomedical Engineering
CASE, Cleveland OH 44106
This work is to be submitted to Journal of Colloid and Interface Science
50
3.1 Abstract
The Rotating Sample System (RSS) has been conceived in our laboratory as a convection
platform for analyses of microliter sized samples. Convection is afforded to the sample
via its surface using tangential air-jets that rotate it. The RSS is hence unique in the way
that it generates convection in the sample, i.e. via its surface. Changes in the surface
properties of aqueous samples therefore modulate the hydrodynamic performance of the
RSS. Therefore, the RSS provides a simple tool to study the surface properties of the
sample. We report in this work how protein-protein and protein-lipid interactions at the
air-liquid interface can be analyzed by investigating bulk hydrodynamics using the RSS.
We also report the use of the RSS as a tool for calibration-free determination of the
Critical Micelle Concentration (CMC) of surfactants using the example of Triton X-100.
3.2 Introduction
The RSS consists of an aqueous microliter sample placed atop a stationary substrate and
kept in position by a hydrophobic film ring with inner diameter such that the sample
forms a near-hemisphere [Chapter 1, Cserey et al., 1997]. An electrode for
electrochemical analysis is embedded flush with the substrate. This sample is rotated
about its axis by tangential air jets that generate convection in it. Convective properties of
the RSS have been documented with trace Pb [Chapter 1] and Hg [Cserey et al., 1997]
analyses. The RSS is the only known convective system that affords convection to a
sample through its surface. Hence, it is in a unique position to probe not only the sample
51
bulk (e.g. trace metal analysis [Chapter 1, 6]) but also the sample surface, both of which
provide very useful information about the sample.
The study of interfaces is of great interest to researchers across different areas of science.
Examination of a surface containing surface-active molecules such as proteins, lipids,
surfactants and the like provide an insight into their physicochemical properties. Several
techniques that have been employed include FRAP (fluorescence recovery after
photobleaching) [O’Connell et al., 2005, Kragel et al., 1999], radioactivity [Small et al.,
1992] and UV spectroscopy [Suzuki et al., 1970].
Adsorption of protein molecules at the air-water interface has been investigated by
researchers to study their conformation [Burgess et al., 1992] and the effects of pressure
on adsorption of proteins at air-water interfaces [Gonzalez et al., 1970; Langmuir et al.,
1940; Graham et al., 1979]. Protein adsorption at interfaces plays an important role in
many biological processes [Burgess et al., 1992]. Surface of solution containing proteins
and lipids has been investigated to study the interactions that exist between them [Sprong
et al., 2001; Verger et al., 1982; Nylander, 1998]. The breakdown of lipids by the enzyme
lipase occurs at the air-liquid interface [Pieroni et al., 1990]; monitoring change at this
changing interface provides information of the enzyme activity. Surfaces of solutions
containing emulsifying and foaming agents used in food, pharmaceuticals, paper,
petrochemical products etc. have been studied; protein-lipid interactions at these
interfaces play a crucial role in the stability of these systems [Nylander, 1998; Poole et al.,
1984, 1986, 1989]. Pulmonary surfactants used to prevent collapsing of lung alveoli in
52
case of patients suffering from asthma and also deep-sea divers, are a mixture of specific
phospholipids and apoproteins [Ruiz et al., 1989]; another example of the importance of
interfacial interaction of lipids and proteins. Pulmonary surfactants reduce alveolar
surface tension, and this allows reduction in the work needed for breathing and helps
stabilize the alveoli. Measuring the surface tension of amniotic fluid is used as a measure
of fetal lung maturity [Kashiwabara et al., 1986].
Surface tension is hence an important parameter to be monitored for studying the
properties of a given solution containing surface-active components such as proteins and
lipids. Various techniques are in use to provide with information on surface tension viz.,
Wilhelmy plate [Gonzalez et al., 1970; Kashiwabara et al., 1986], Lecomte du Nouy ring
tensiometer [Lunkenheimer et al., 1981], pulsating bubble surfactometer [Enhorning,
2001] etc. Surface tension is also used as a measure of CMC (critical micelle
concentration) of surfactants [Tsujii, 1998]. The CMC value is very important in order to
ensure optimal use of surfactants [Tsujii, 1998].
In this work, the RSS platform is introduced as a simple tool for examination of surface
properties by examination of BSA, BSA-lipid and Triton X-100 samples. The RSS
platform has also been used to evaluate the CMC (critical micelle concentration) of
Triton X-100.
3.3 Experimental
53
3.3.1 Materials
All chemicals were from Sigma (St Louis, MO); solutions were made with 18.2 MΩ
Milli-Q water (Milli-QUV plus from Millipore, Billerica, MA). Lyophilized bovine
serum albumin (BSA) (Sigma) and Intralipid (Baxter Healthcare Corp., Deerfield, IL), a
20% lipid fat emulsion was used in the interfacial study of proteins and lipids. The
samples were characterized electrochemically using freshly prepared analytical grade
potassium ferrocyanide (Sigma) such that its final concentration in a 20 microliter sample
is 2.5mM. Capillary tubes (A.H. Thomas Co., Philadelphia, PA) having 0.025 mm wall
thickness and 0.5 mm i.d. were used to direct the nitrogen jets to rotate the samples. The
air flow rates were fixed at 160 mL/min for all measurements. A 1000 ppm stock solution
of surfactant Triton X-100 (Sigma) in distilled water was used to prepare different
dilutions of the surfactant.
3.3.2 Apparatus
Electrochemical measurements were made using CH100 electrochemical workstation
(CH Instruments, Austin, TX). Homemade substrates with platinum mini-disc electrodes
were employed. The electrochemical cell was fabricated using Corning glass slide (7.5cm
× 2.5cm and 0.1cm thick, from Fisher Scientific, Pittsburgh, PA) as substrate. The WE
was made from 150μm, 250μm diameter Platinum wire (Alfa Aesar, Ward Hill, MA).
Silicone elastomer (DOW Corning, Midland, MI) was applied to form the hydrophobic
ring that confines the sample drop into a semi-sphere (fabrication procedure is described
earlier [21]). Electrodes were polished on Microcloth polishing pad (Buehler, Lake Bluff,
54
IL) mounted on a Delta 31-120 disk sander (Delta, Jackson, TN). Alumina polishing
paste (Buehler) of 1 and 3 micron sizes were used for polishing.
The Ag|AgCl (3N KCl) reference electrode (BAS, West Lafayette, IN) and gold wire
spiral counter electrode (Alfa Aesar) were placed under the substrate in 0.1 M KNO3,
connected to the sample side by a liquid junction filled with 1 wt% agar gel (Sigma).
3.3.3 Procedures
3.3.3.1 Using the RSS to investigate protein-protein interaction by rheological
examination of samples containing different concentrations of BSA
It is known that proteins have a proclivity to migrate towards the air-liquid interface and
adsorb there [Gonzalez et al., 1970; Langmuir et al., 1940; Poole et al., 1984]. Once at
the surface, they undergo a change in conformation and reside in their lowest energy state
[Prins et al., 1998]; lateral interactions occur between adjacent proteins resulting in the
formation of a contiguous protein film. We investigated these properties by conducting
cyclic voltammetry experiments in 20 μl rotated samples containing 0.039, 0.0039 and
0.00039 g/dL BSA. These samples were prepared in pH 1 sulphuric acid; this implies that
the BSA was in a completely unfolded state [Carter et al., 1994]. Potassium ferrocyanide
was also added to the sample such that its final concentration was 2.5 mM. Potassium
ferrocyanide was used to characterize the electrode response. One nitrogen jet was used
and same position of the jet vis-à-vis the sample was maintained to ensure reproducible
coupling of the sample surface and gas-jet in each case. Nitrogen flow rate was
maintained at 160 mL/min.
55
3.3.3.2 Assessing lipid-protein interaction at the surface
Investigation of lipid-protein interaction at the surface shows the competing tendencies of
proteins and lipids to occupy the air-liquid interface. This interaction has been the
continued object of investigation by researchers [Sprong et al., 2001, Verger et al., 1982;
Nylander, 1998, Pieroni et al., 1990; Poole et al., 1984, 1986, 1989]. Intralipid, a 20%
intravenous fat emulsion was used as a model lipid solution [Wretlind, 1981]. For a given
concentration of BSA (0.39 g/dL) the lipid content was varied and cyclic voltammetry of
experiments were conducted in pH 1 acidified samples rotated by same gas-jet flow rate.
Here too, one nitrogen jet was used and same position of the jet vis-à-vis the sample was
maintained to ensure uniform coupling of the sample surface and gas-jet for accurate
comparisons. As a control, cyclic voltammetry for samples containing lipid only (no
protein) were conducted using the same experimental parameters. For a constant lipid
concentration (10:4000 dilution of Intralipid), the BSA concentration was varied and
rotation properties of these samples were investigated using cyclic voltammetry. Nitrogen
flow rate was maintained constant at 160 mL/min in all cases and the air-jet position was
kept same for repeatable results .
3.3.3.3 Evaluating Critical Micelle Concentration (CMC) using RSS
Surfactants at concentrations lower than CMC are loosely integrated into the water
structure. However in the region of CMC, the surfactants form a monolayer at the surface
and micelles in the interior. Surfactants are known to reduce the surface tension of water
at the air-water interface. With increasing surfactant concentration, the surface tension
decreases until it reaches a value close to the CMC. Beyond this value, the surface
56
tension remains constant [Tsujii, 1998]. Tensiometers have been used to evaluate CMC
[26].The use of surface tension to evaluate CMC was attempted using the RSS. Surfaces
with lower surface tension are by nature elastic. The elasticity of the surface alters the
rotation of the sample and this has been probed by conducting cyclic voltammetry
experiments in rotated samples with incremental concentrations of Triton X-100
surfactant (100 ppb to 250 ppm). In this case too, one nitrogen jet was used and same
position of the jet vis-à-vis the sample was maintained to ensure uniformity. Also, using
the same RSS setup 10 μL samples were used since they were better able to withstand the
shear caused by the gas-jet for low values of surface tension at higher concentrations of
the surfactant. Nitrogen flow rate was maintained constant at 160 mL/min in all cases.
3.4 Results and Discussion
3.4.1 Assessing rheological properties of samples containing different BSA
concentrations
For concentration of BSA at 0.01 wt%, cyclic voltammetry in a rotated sample showed
the redox peaks of potassium ferrocyanide (figure 3-1); this response is similar to when
the sample is not rotated and is unlike the plateau currents observed in rotated (non-
protein) aqueous samples [Chapter 1, 2]. The presence of these peaks is indicative of a
stationary sample, despite the air-jet used to rotate it. Rotated samples containing higher
BSA concentrations (greater than 0.01 wt%) also show similar results [Chapter 2]. When
the concentration of BSA is reduced further at 0.001 wt%, the current slightly increases
in the rotated sample (Figure 3-1), and this is indicative of convection in the sample.
57
When the BSA amount is diluted to 0.0001 wt%, the current observed in the
voltammograms becomes comparable to a sample with no BSA in the sample (Figure 3-
1).
At 0.01 wt% of BSA and above, the there is complete coverage of the sample surface by
BSA. There exists here lateral hydrophobic interaction with adjacent BSA molecules at
the surface and a contiguous film is formed [Poole et al., 1984; Prins et al., 1998]; this
shows protein-protein interaction at the air-water interface. This film is central to the
stability of foams [Poole et al., 1984, 1986; Prins et al., 1998] and is known to be
resistive to shear [Prins et al., 1998]; this manifests in the no increase in current even
when rotation of the sample is attempted. Due to this shear-resistive film the sample
surface, the gas jet velocity does not into rotation of the sample. At 0.001 wt % BSA and
lower, the concentration of BSA is no longer sufficient to ensure complete coverage of
the sample surface. This manifests in the slightly increased current in comparison to the
case where a contiguous protein film exists. The current observed is however much lower
compared to case when there is no protein in the sample. Presence of proteins at the
interface reduces the surface tension; lower surface tension surfaces are inherently more
elastic in comparison to a high surface tension surface. Hence part of the air-jet velocity
that rotates the sample is expended in stretching of this elastic surface which results in
less efficient rotation of the sample than in a sample with higher surface tension. This
effect of low surface tension due to the presence of proteins progressively decreases with
decreasing protein concentration. At 0.0001 wt%, the current observed is almost similar
to the sample with no protein. Hence, results from the study of solutions with different
58
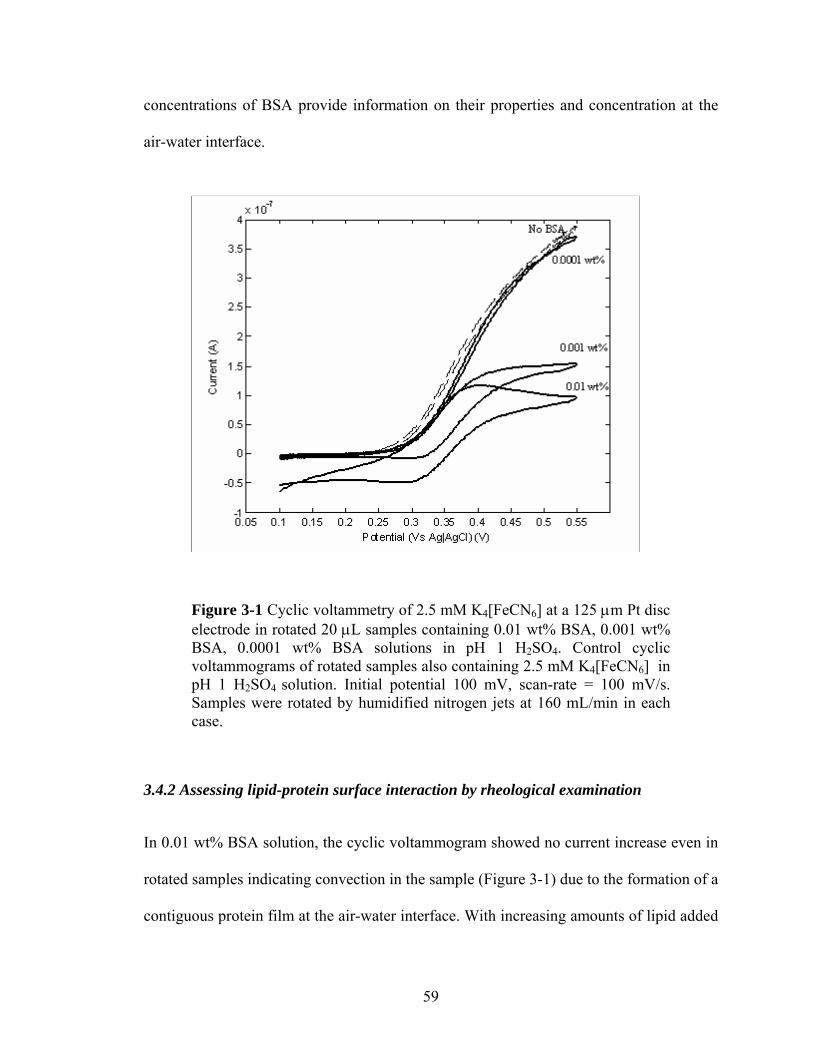
concentrations of BSA provide information on their properties and concentration at the
air-water interface.
Figure 3-1 Cyclic voltammetry of 2.5 mM K4[FeCN6] at a 125 μm Pt disc electrode in rotated 20 μL samples containing 0.01 wt% BSA, 0.001 wt% BSA, 0.0001 wt% BSA solutions in pH 1 H2SO4. Control cyclic voltammograms of rotated samples also containing 2.5 mM K4[FeCN6] in pH 1 H2SO4 solution. Initial potential 100 mV, scan-rate = 100 mV/s. Samples were rotated by humidified nitrogen jets at 160 mL/min in each case.
3.4.2 Assessing lipid-protein surface interaction by rheological examination
In 0.01 wt% BSA solution, the cyclic voltammogram showed no current increase even in
rotated samples indicating convection in the sample (Figure 3-1) due to the formation of a
contiguous protein film at the air-water interface. With increasing amounts of lipid added
59
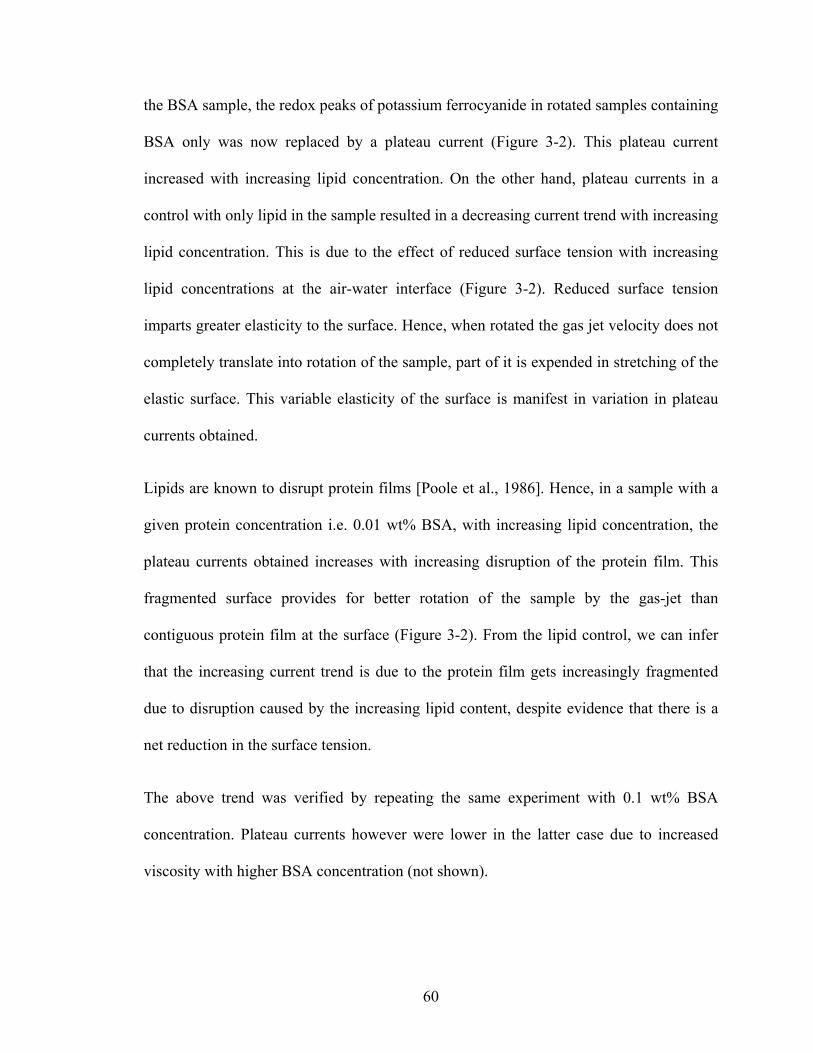
the BSA sample, the redox peaks of potassium ferrocyanide in rotated samples containing
BSA only was now replaced by a plateau current (Figure 3-2). This plateau current
increased with increasing lipid concentration. On the other hand, plateau currents in a
control with only lipid in the sample resulted in a decreasing current trend with increasing
lipid concentration. This is due to the effect of reduced surface tension with increasing
lipid concentrations at the air-water interface (Figure 3-2). Reduced surface tension
imparts greater elasticity to the surface. Hence, when rotated the gas jet velocity does not
completely translate into rotation of the sample, part of it is expended in stretching of the
elastic surface. This variable elasticity of the surface is manifest in variation in plateau
currents obtained.
Lipids are known to disrupt protein films [Poole et al., 1986]. Hence, in a sample with a
given protein concentration i.e. 0.01 wt% BSA, with increasing lipid concentration, the
plateau currents obtained increases with increasing disruption of the protein film. This
fragmented surface provides for better rotation of the sample by the gas-jet than
contiguous protein film at the surface (Figure 3-2). From the lipid control, we can infer
that the increasing current trend is due to the protein film gets increasingly fragmented
due to disruption caused by the increasing lipid content, despite evidence that there is a
net reduction in the surface tension.
The above trend was verified by repeating the same experiment with 0.1 wt% BSA
concentration. Plateau currents however were lower in the latter case due to increased
viscosity with higher BSA concentration (not shown).
60
Figure 2 Plateau currents obtained from cyclic voltammetry of 2.5 mM K4[FeCN6] on a 125 μm Pt disc electrode in rotated 20 μL samples containing 0.01 wt% BSA and different concentrations of Intralipid in pH 1 H2SO4 demonstrating protein-lipid interactions at the air-liquid interface. Plateau currents from cyclic voltammograms 2.5 mM K4[FeCN6] in samples containing only Intralipid in pH 1 H2SO4 are shown as a control. Initial potential 100 mV, scan-rate = 100 mV/s. Samples were rotated by humidified nitrogen jets at 160 mL/min.
Using a fixed concentration of the lipid in the sample (1 wt% Intralipid in pH 1 sulphuric
acid) the BSA concentration was varied from 0.01 wt% to 0.05 wt% resulted in the
plateau currents of cyclic voltammograms showing a decreasing trend with increasing
BSA concentration (not shown). This is due to increasing viscosity of the sample with
increasing protein concentration. The surface area of the hemispherical sample is fixed.
Lipids and proteins compete to occupy the air-water interface, the composition of which
is dictated by their individual affinities for the interface. We have showed that at 0.01
61
wt% BSA concentration a protein film encapsulates the sample. On addition of a fixed
amount of lipid, the increased affinity of the lipid displaces some of the protein molecules
from the interface. Increasing the protein concentration does not alter the surface
composition; the increased protein concentration however does contribute to an increase
in viscosity of the sample. This higher viscosity results in lower currents. Hence, once the
surface of the sample is standardized, changes in the bulk properties (e.g. viscosity) of the
sample can be investigated.
This rheological study of lipid-protein solutions articulates how their surface interactions
can be investigated using the RSS. By standardizing the properties of the surface, it is
possible to investigate the bulk properties of such solutions. Hence, the RSS can be used
as a simple tool to study sample surface as well as bulk.
3.4.3 Evaluating Critical Micelle Concentration (CMC) using RSS
Since the RSS affords convection to the liquid micro-sample through its surface, changes
in surface tension are reflected in the cyclic voltammograms of rotated samples. At low
concentrations of surfactants in water, surfactant molecules are loosely integrated in the
solvent (i.e. water) and some present at the air-water interface with the hydrophobic part
preferring to reside at the air-water interface and reducing the surface tension. At CMC,
the surfactant molecules in the bulk of the solution form micelles and there is monolayer
coverage of surfactant molecules at the air-water interface. For concentrations of
surfactant greater than CMC, there are more micelles formed in the bulk, but no change
in the constitution of the monolayer at the air-water interface. Therefore, the surface
tension becomes constant at concentrations higher than CMC.
62
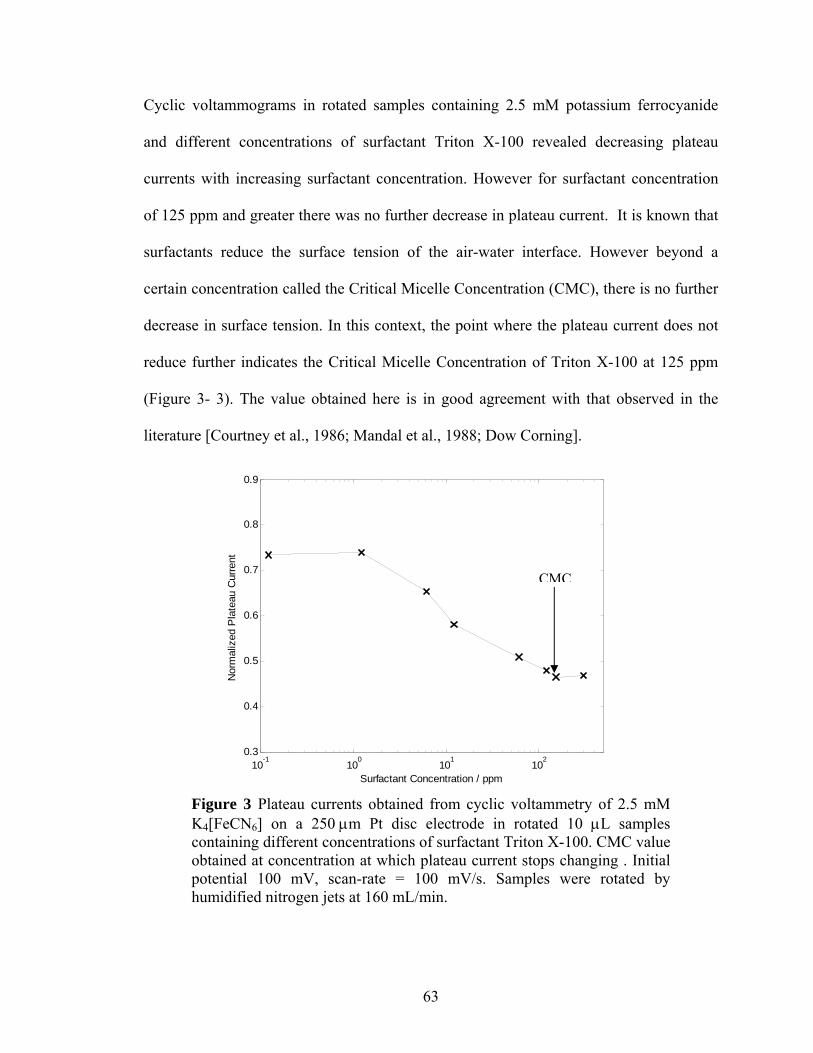
Cyclic voltammograms in rotated samples containing 2.5 mM potassium ferrocyanide
and different concentrations of surfactant Triton X-100 revealed decreasing plateau
currents with increasing surfactant concentration. However for surfactant concentration
of 125 ppm and greater there was no further decrease in plateau current. It is known that
surfactants reduce the surface tension of the air-water interface. However beyond a
certain concentration called the Critical Micelle Concentration (CMC), there is no further
decrease in surface tension. In this context, the point where the plateau current does not
reduce further indicates the Critical Micelle Concentration of Triton X-100 at 125 ppm
(Figure 3- 3). The value obtained here is in good agreement with that observed in the
literature [Courtney et al., 1986; Mandal et al., 1988; Dow Corning].
10-1
100
101
102
0.3
0.4
0.5
0.6
0.7
0.8
0.9
Surfactant Concentration / ppm
Nor
mal
ized
Pla
teau
Cur
rent
CMC
Figure 3 Plateau currents obtained from cyclic voltammetry of 2.5 mM K4[FeCN6] on a 250 μm Pt disc electrode in rotated 10 μL samples containing different concentrations of surfactant Triton X-100. CMC value obtained at concentration at which plateau current stops changing . Initial potential 100 mV, scan-rate = 100 mV/s. Samples were rotated by humidified nitrogen jets at 160 mL/min.
63
From the electrochemical investigations of surfactant solutions, we have demonstrated
the utility of the RSS as a simple tool to calculate the CMC.
3.5 Conclusions
The presence of surface-active molecules such as proteins, lipids and surfactants (e.g.
Triton X-100) at the air-liquid interface of rotated samples in the RSS modulates the
hydrodynamic electrochemistry of potassium ferrocyanide. Each of the aforementioned
samples modulates rotation of the sample differently; this modulation has been used to
interpret the interfacial properties of the above samples.
Samples containing protein BSA were used as an example to demonstrate ability of the
RSS platform to study protein-protein interactions at the air-water interface. At high
enough concentration of the protein, this interaction leads to the formation of a
contiguous film that encapsulates the aqueous protein sample; this film is known to
oppose shear stresses and stabilize foam surfaces. The presence of this film was
determined electrochemically using the RSS, where currents in air-jet rotated samples are
equivalent to those obtained with stationary samples. For concentrations of protein not
sufficient enough to form a film, electrochemical response from rotated samples are
reflective of the change in surface tension associated with different concentrations of
protein in the sample.
The RSS’ ability to study lipid-protein interaction at the air-liquid interface demonstrated.
Lipids are known to disrupt protein films; this was illustrated by the fact that currents
64

increased during rotation of the sample with increasing lipid concentrations for a fixed
protein concentration. This was not the case when no lipid (and also at low lipid
concentration) was present in the sample. Lipids and proteins compete for the air-liquid
interface and it was demonstrated that by rotation of the sample, quantifiable
measurements are possible to study lipid-protein solutions and the interaction that exists
between them.
The RSS is sensitive to changes in surface tension. Changes in sample surface tension are
reflected in changes in currents measured; lower currents correspond to lower surface
tension. The advantage of the RSS here is that since convection is afforded through the
surface by air/gas jets, there is no change in the interface as opposed to conventional
methodologies where contact is made with the surface in order to measure surface tension.
This was used to evaluating the CMC of surfactant Triton X-100.
Another advantage of using rotation of a liquid sample by air-jets to study its surface
properties would mean that the surface would reach equilibrium faster. The favorable
mass transport properties of the sample would enable the surface-active components to
reach the surface faster; the surface is analyzed in steady-state conditions. The ability to
investigate surface properties of small samples is a significant advantage in the analyses
of biological and biomedical applications where sample sizes available are smaller.
65
Chapter 4
Electrochemical Determination of Protein Adsorption onto the
Electrode in Rotating Sample System
Gautam N. Shetty, Koji Tohda, Miklós Gratzl Department of Biomedical Engineering
CASE, Cleveland OH 44106
66
4.1 Abstract
When exposed to biological matrices, electrodes are confronted with the problem of non-
specific adsorption of proteins onto their surface. This results in reduction of the active
surface area available for electrochemical analyses. In order to obtain a measure of the
extent of this inhibition of the electrode surface several techniques have been investigated
by several research groups. In this work, we seek to employ a method to estimate
adsorption of proteins onto the electrode surface in the Rotating Sample System (RSS).
By monitoring the current due to the under-potential deposition (UPD) of hydrogen and
its subsequent oxidation in a cyclic voltammogram on a platinum disc electrode, we were
able to study the extent of fouling of the electrode surface by proteins. Coating electrodes
with polymer spacer membranes have been employed to help alleviate the problem of
protein adsorption. Suitable choices of membrane to coat the electrode to be used in
biological matrices have been explored in this work.
4.2 Introduction
The surface activity of proteins is a fundamental property of these complex
macromolecules. Substrates of almost any type that come into contact with proteins tend
to become quickly occupied by proteins, leading to profound alterations in the
physicochemical and biological properties of the substrate. Electrochemical analyses in
biological matrices are hampered by the adsorption of proteins onto the electrode surface
reducing the active surface area available for analyses [Brabec et al, 1981]. This limits
67
the lifetime of the electrode and hence its efficacy. The process of protein adsorption onto
electrode surfaces is thought to be irreversible [Clark, 2002, Fang, 2001], and is known as
electrode ‘fouling’.
Protein adsorption is a major concern in the electrochemical analyses of microliter sized
samples, since the electrode size involved is already small. Any further reduction in the
electrode active area due to non-specific adsorption of proteins would severely impair its
capability for analyses in a biological matrix. Also, in the case of analyses of microliter
sized samples, conventional filtering protocols are inaccessible.
Several techniques have been employed to study adsorption of proteins onto surfaces viz.
ellipsometry [Logothetidis et al., 2005], surface enhanced resonance Raman scattering
(SERRS) [Rospendowski et al., 1991], attenuated total reflection infrared spectrometry
(ATR) [Ishida et al., 1991], total internal reflection fluorescence (TIFR) spectroscopy
[Fisher 1996], photon correlation spectroscopy (PCS) [Gun'ko et al., 2003], small angle
x-ray scattering (SAXS) [Rosenfeldt et al., 2004], radioactive labeling [Rosenbloom et al.,
2004], solution depletion [Cornelius et al., 1992], scanning tunneling microscopy (STM)
[Friis et al., 1997], surface plasmon resonance [Silin et al., 2003], atomic force
microscopy (AFM) [Friis et al., 1997] and cantilevers [Moulin et al., 1999].
Electrochemical techniques such as impedance spectroscopy [Xie et al., 2003] and
voltammetry of potassium ferrocyanide [Guo et al., 1996] have also been used to study
adsorption of proteins onto electrode surfaces.
68
A commonly used electrochemical technique that provides information on the free
electrode area is explored in this work for the purpose of investigating protein adsorption
for the first time. Electrochemical analysis of potassium ferrocyanide for studying protein
adsorption is not possible in acidic pH due to its poor stability at low pH [Potassium
ferrocyanide MSDS sheets]. However, assessing protein adsorption at low pH is
especially important in case of trace metal diagnostics in biological samples, since the
pre-treatment protocol involves acid dilution. We have explored in this work the use of
under potential deposition of hydrogen as a technique to measure the electrode active
area [Angerstein-Kozlowska, 1984]. This technique has been used to study the crystal
structure of electrode materials [Yeager, 1978] and hence is a sensitive technique.
Coating of the electrode with a membrane has been used as an approach to alleviate the
problem of fouling by proteins. To that end, we have explored in this work suitability of
Nafion, polyurathene and cellulose acetate hydrogen phthalate as possible choices. Their
adhesion to the sensor substrate (including the electrode) and permeability were
investigated.
4.3 Experimental
4.3.1 Materials
All chemicals were from Sigma (St Louis, MO); solutions were made with 18.2 MΩ
Milli-Q water (Milli-QUV plus from Millipore, Billerica, MA). Lyophilized bovine
serum albumin (Sigma) solutions were used to test repeatability of adsorption kinetics
69
obtained. Fetal bovine serum (Equitech-Bio Inc., Kerrville, TX) was used as model
matrix to simulate a biological matrix. Dilutions of the fetal bovine serum were made in
pH 1 sulphuric acid (Sigma). For studying adsorption of proteins in rotated samples,
capillary tubes (A.H. Thomas Co., Philadelphia, PA) having 0.025 mm wall thickness
and 0.5 mm i.d. were used to direct the nitrogen jets to rotate the samples. The air flow
rates were fixed at 160 mL/min. The efficacy of Nafion (Sigma), polyurathene (Fluka)
and cellulose acetate hydrogen phthalate (Sigma) was tested to provide protection to the
electrode from adsorption of proteins.
4.3.2 Apparatus
Electrochemical measurements were made using CH100 electrochemical workstation
(CH Instruments, Austin, TX). The RSS platform was employed as the electrochemical
cell to study adsorption onto the electrode surface. Homemade substrates with platinum
mini-disc electrodes were employed [Chapter 1, 2]. The electrochemical cell was
fabricated using Corning glass slide (7.5cm × 2.5cm and 0.1cm thick, from Fisher
Scientific, Pittsburgh, PA) as substrate. The WE was made from 150μm diameter
Platinum wire (Alfa Aesar, Ward Hill, MA). Silicone elastomer (DOW Corning, Midland,
MI) was applied to form the hydrophobic ring that confines the sample drop into a semi-
sphere (fabrication procedure is described earlier [Chapter 1]). Electrodes were polished
on Microcloth polishing pad (Buehler, Lake Bluff, IL) mounted on a Delta 31-120 disk
sander (Delta, Jackson, TN). Alumina polishing paste (Buehler) of 1 and 3 micron sizes
were used for polishing.
70
The Ag|AgCl (3N KCl) reference electrode (BAS, West Lafayette, IN) and gold wire
spiral counter electrode (Alfa Aesar) were placed under the substrate in 0.1 M KNO3,
connected to the sample side by a liquid junction filled with 1 wt% agar gel (Sigma).
Humidified nitrogen gas jets were directed toward the sample from 0.5 mm i.d. glass
capillaries.
4.3.3 Procedures
4.3.3.1 Underpotential deposition of hydrogen as a measure of electrode active (free)
area
Cyclic voltammetry in pH 1 sulphuric acid was used to study how the electrode active
area changes with protein adsorption. Underpotential deposition of hydrogen occurs just
before the evolution of hydrogen gas. This deposition corresponds to monolayer coverage
of hydrogen [Angerstein-Kozlowska, 1984]; this region of the cyclic voltammogram has
been used to calculate the electrode area. We use in this work the section of the
voltammogram corresponding to the oxidation of the underpotential deposited hydrogen
monolayer (hydrogen desorption) (Figure 4-1); this too provides information on the
electrode free area.
Cyclic voltammetry is repeated several times until voltammograms become reproducible
[Yeager, 1978]. This protocol is repeated before each experiment to study adsorption on
the electrode as a standardization procedure. Voltammograms measured during
adsorption are compared to this voltammogram conducted in a solution containing pH 1
sulphuric acid only.
71
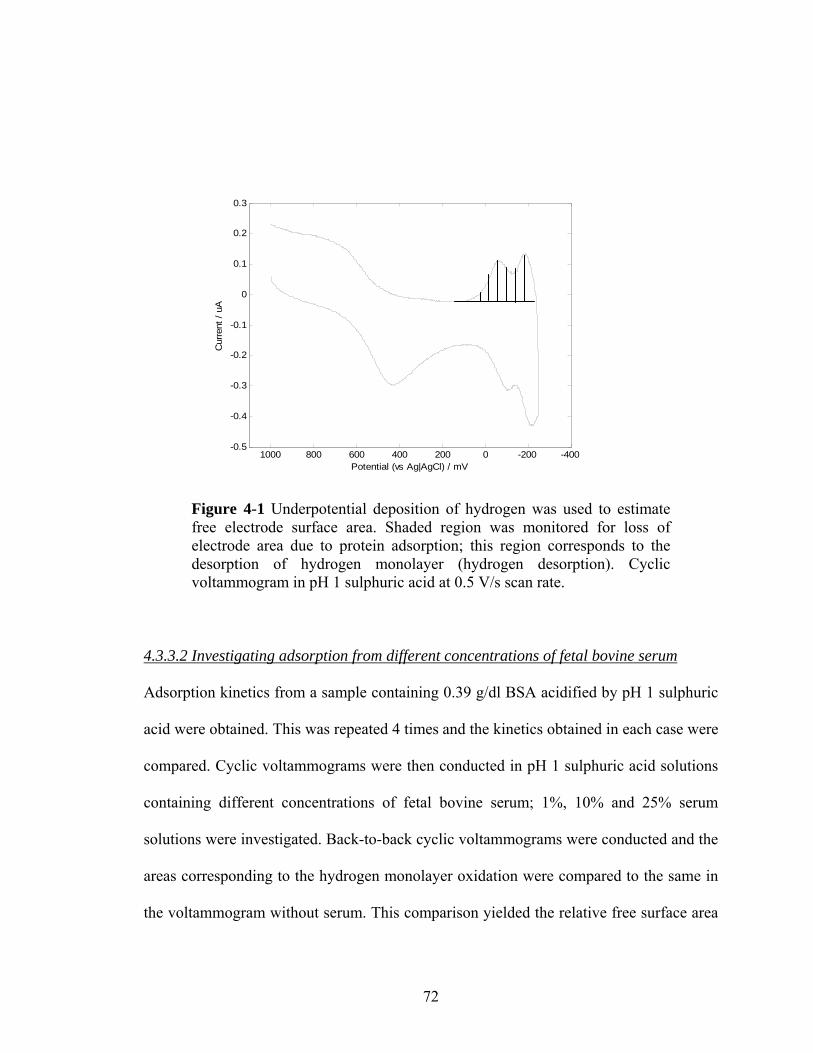
-400-20002004006008001000-0.5
-0.4
-0.3
-0.2
-0.1
0
0.1
0.2
0.3
Potential (vs Ag|AgCl) / mV
Cur
rent
/ uA
Figure 4-1 Underpotential deposition of hydrogen was used to estimate free electrode surface area. Shaded region was monitored for loss of electrode area due to protein adsorption; this region corresponds to the desorption of hydrogen monolayer (hydrogen desorption). Cyclic voltammogram in pH 1 sulphuric acid at 0.5 V/s scan rate.
4.3.3.2 Investigating adsorption from different concentrations of fetal bovine serum
Adsorption kinetics from a sample containing 0.39 g/dl BSA acidified by pH 1 sulphuric
acid were obtained. This was repeated 4 times and the kinetics obtained in each case were
compared. Cyclic voltammograms were then conducted in pH 1 sulphuric acid solutions
containing different concentrations of fetal bovine serum; 1%, 10% and 25% serum
solutions were investigated. Back-to-back cyclic voltammograms were conducted and the
areas corresponding to the hydrogen monolayer oxidation were compared to the same in
the voltammogram without serum. This comparison yielded the relative free surface area
72
[Guo et al., 1996]. Comparison of each of the back-to-back conducted voltammograms
gave the adsorption kinetics.
4.3.3.3 Comparing protein adsorption in rotated and stationary samples
It is imperative to know how adsorption of proteins occurs in convected systems. Since,
the RSS application for body-fluid diagnostics would entail rotation of the sample,
adsorption from samples containing 10% fetal bovine serum was compared in stationary
and rotated samples. The relative free areas were evaluated in each case.
4.3.3.4 Protecting electrode by coating with Nafion
Nafion has been employed as a membrane coated on the electrode to protect it from
protein adsorption [Jaenicke et al., 1998; Kruusma et al., 2004]. Efficacy of the Nafion
coated electrode was tested by cyclic voltammograms in a 10% fetal bovine serum
solution and this was compared to the same with no serum. This comparison was also
made for different thicknesses of the Nafion membrane viz. 1μm, 3 μm and 5 μm
(thicknesses were calculated from the values of densities of Nafion and its concentration
provided by the manufacturer). This is done to provide with an optimal thickness of the
Nafion membrane. The choice of membrane thickness would be such that it affords
maximum protection to the electrode but at the same time contributing significantly to an
increase in the diffusion layer thickness. It is also essential that the membrane
demonstrate good adhesion to the sensing substrate especially when the sample is rotated.
This was also tested by rotating a 10% fetal bovine serum sample with a humidified
nitrogen jet at 160 mL/min.
4.3.3.5 Testing for efficacy of polyurethane and cellulose acetate hydrogen phthalate
(CAP) as an electrode coating membrane
73
Polyurethane has been employed for coating of biosensors [Shin et al., 2004] and hence
was investigated if it can be use as an electrode coating material in the RSS setup. Cyclic
voltammograms were conducted in pH 1 sulphuric acid solutions and a comparison was
made between voltammograms with and without the membrane. Cellulose acetate
hydrogen phthalate [CAP] was also investigated as an electrode coating membrane. It has
been employed as an enteric coating for capsules or tablets [Maharaj et al., 1984] and is
insoluble at low pH [Spitael et al., 1980]. Same experiments as those conducted for
polyurathene were conducted to test for efficacy of CAP.
4.4. Results and Discussion
Protein adsorption onto a platinum disc electrode was characterized by investigating the
reduction in free surface area by UPD of hydrogen. Cyclic voltammograms in a pH 1
sulphuric acid sample containing protein were compared with a voltammogram in a
sample with no protein to monitor protein adsorption.
4.4.1 Adsorption from different concentrations of fetal bovine serum
In order to test repeatability of the results obatined, back-to-back voltammograms were
conducted in 0.4 wt% BSA solutions. Each voltammogram when compared to the
corresponding voltammogram in a sample containing pH 1 sulphuric acid only (figure 4-
2A) provides information about the relative decrease in free electrode area at that instant.
A plot of relative free electrode area obtained from each voltammogram provides the
adsorption kinetics (Figure 4-2).
74

-400-20002004006008001000-0.5
-0.4
-0.3
-0.2
-0.1
0
0.1
0.2
0.3
Potential (vs Ag|AgCl) / mV
Cur
rent
/ uA
0 50 100 150 200 250 3000
0.1
0.2
0.3
0.4
0.5
0.6
0.7
0.8
0.9
1
Time / s
Rel
ativ
e fre
e ar
ea
A B
Figure 4-2 (A) Monitoring the region of hydrogen desorption in the CV provides information on protein adsorption; (B) comparison with region without protein gives relative free area and on repeating the same gives information on protein adsorption kinetics. Cyclic voltammogram in pH 1 sulphuric acid and 10 % fetal bovine serum at 0.5 V/s scan rate.
Adsorption kinetics was obtained in samples containing 1%, 10% and 25% serum in pH 1
sulphuric acid for 300 s. With increasing serum concentration the relative free area
decreased indicating increasing protein adsorption onto the electrode. This is consistent
with the fact that there will be increased adsorption with increased concentration of the
protein. Hence, it is possible to employ the method of using UPD of hydrogen to study
adsorption of proteins onto the electrode.
4.4.2 Adsorption in stationary and rotated samples
75
Adsorption studies in a 10% serum sample in stationary and rotated samples revealed that
there is increased amount of adsorption of the protein in a rotated sample than a
stationary sample. Favorable mass-transport properties exist in rotated samples.
Adsorption of proteins is inhibited however by steric hindrances caused by already
adsorbed proteins [Yang et al., 2003], and this limits adsorption of proteins despite
favorable mass-transport properties in a rotated sample. The enhanced mass-transport
however, provides for denser packing of the adsorbed protein molecules and hence the
slightly increased amount of protein adsorption. Enhanced mass-transport also provides
for the protein molecule with the most affinity for adsorption onto the electrode [Slack,
1995] faster despite its lower concentration in some cases.
4.4.3 Nafion as an electrode coating material for protection from fouling
In the comparison of a bare electrode, it is observed that more relative free area is exists
when the electrode is coated with a Nafion membrane (Figure 4-3). To understand how
membrane thickness can affect the relative extent of protein adsorption, adsorption from
10% fetal bovine serum solution onto an electrode coated with Nafion membrane of
different thicknesses was studied. It was observed that there was an improvement in the
relative free area when the membrane thickness was increased from 1μm to 3μm.
Comparison of electrode areas measured with 1μm to 3μm membranes in the absence of
any proteins showed a reduction in the absolute area with an increase in membrane
thickness. When the membrane thickness was increased to 5μm the relative free area did
not increase relative to the electrode coated with a 3μm membrane. This shows that the
there is improvement in protection from adsorption only up to a certain thickness of
76

Nafion (empirically estimated as 3 μm for Nafion); beyond this an increase in the
membrane thickness would only contribute to an increase in the diffusion layer thickness.
However, when adhesion of Nafion was tested in a rotated serum matrix, it was observed
that the membrane flaked off from the substrate and consequently from the electrode.
Poor adhesion of Nafion onto electrode surfaces is known [Cha et al, 1993]; however this
becomes a more severe problem when the sample is rotated. Nafion helps protect the
electrode from adsorption of proteins, but due to its poor adhesion properties it is not
suitable in the context of the hydrodynamic electrochemistry in biological matrices.
0 50 100 150 200 250 3000
0.1
0.2
0.3
0.4
0.5
0.6
0.7
0.8
0.9
1
Time (s)
Rel
ativ
e fre
e ar
ea
bare electrode3 micron Nafion
Figure 4-3 Protein adsorption kinetics with and without Nafion. A 3 μm Nafion membrane was coated on a 250 μm Pt disc electrode. Cyclic voltammograms were conducted in pH 1 sulphuric acid and 10 % fetal bovine serum at 0.5 V/s scan rate.
4.4.4 Exploring polyurethane and CAP as electrode coating materials
Polyurethane has been employed as a biosensor coating material. A comparison of cyclic
voltammograms in stationary sample containing only pH 1 sulphuric acid before and after
77
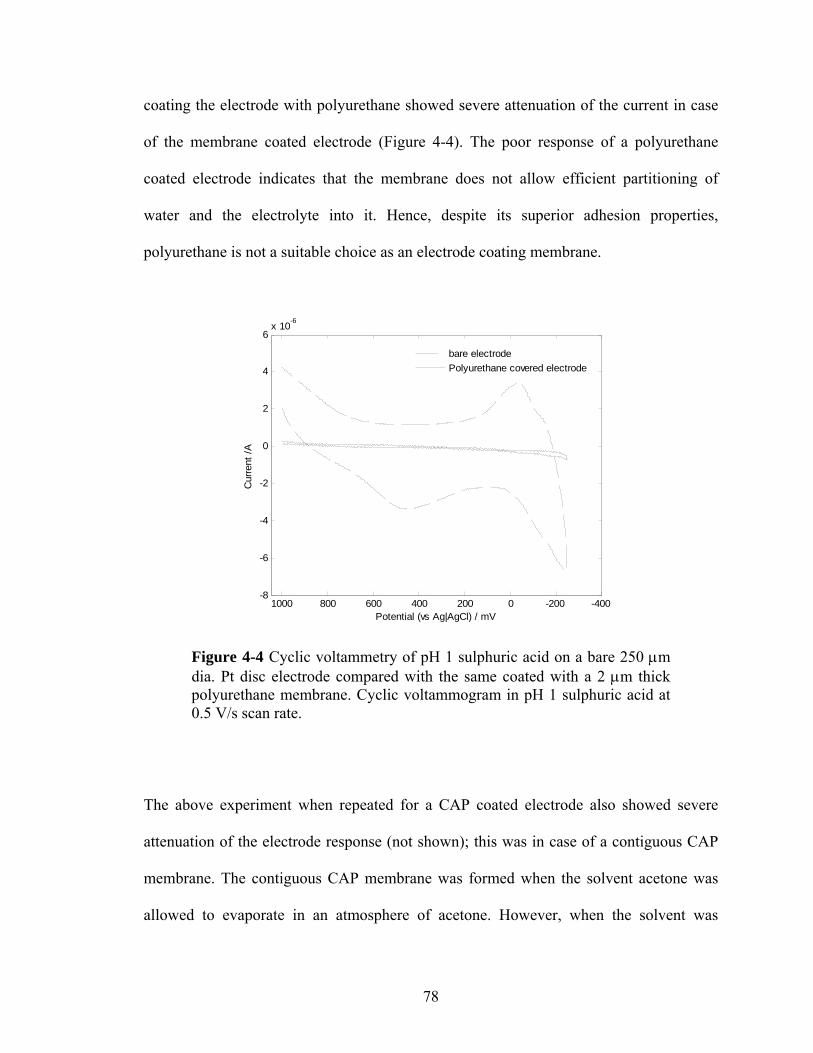
coating the electrode with polyurethane showed severe attenuation of the current in case
of the membrane coated electrode (Figure 4-4). The poor response of a polyurethane
coated electrode indicates that the membrane does not allow efficient partitioning of
water and the electrolyte into it. Hence, despite its superior adhesion properties,
polyurethane is not a suitable choice as an electrode coating membrane.
-400-20002004006008001000-8
-6
-4
-2
0
2
4
6x 10⁻⁶
Potential (vs Ag|AgCl) / mV
Cur
rent
/A
bare electrodePolyurethane covered electrode
Figure 4-4 Cyclic voltammetry of pH 1 sulphuric acid on a bare 250 μm dia. Pt disc electrode compared with the same coated with a 2 μm thick polyurethane membrane. Cyclic voltammogram in pH 1 sulphuric acid at 0.5 V/s scan rate.
The above experiment when repeated for a CAP coated electrode also showed severe
attenuation of the electrode response (not shown); this was in case of a contiguous CAP
membrane. The contiguous CAP membrane was formed when the solvent acetone was
allowed to evaporate in an atmosphere of acetone. However, when the solvent was
78
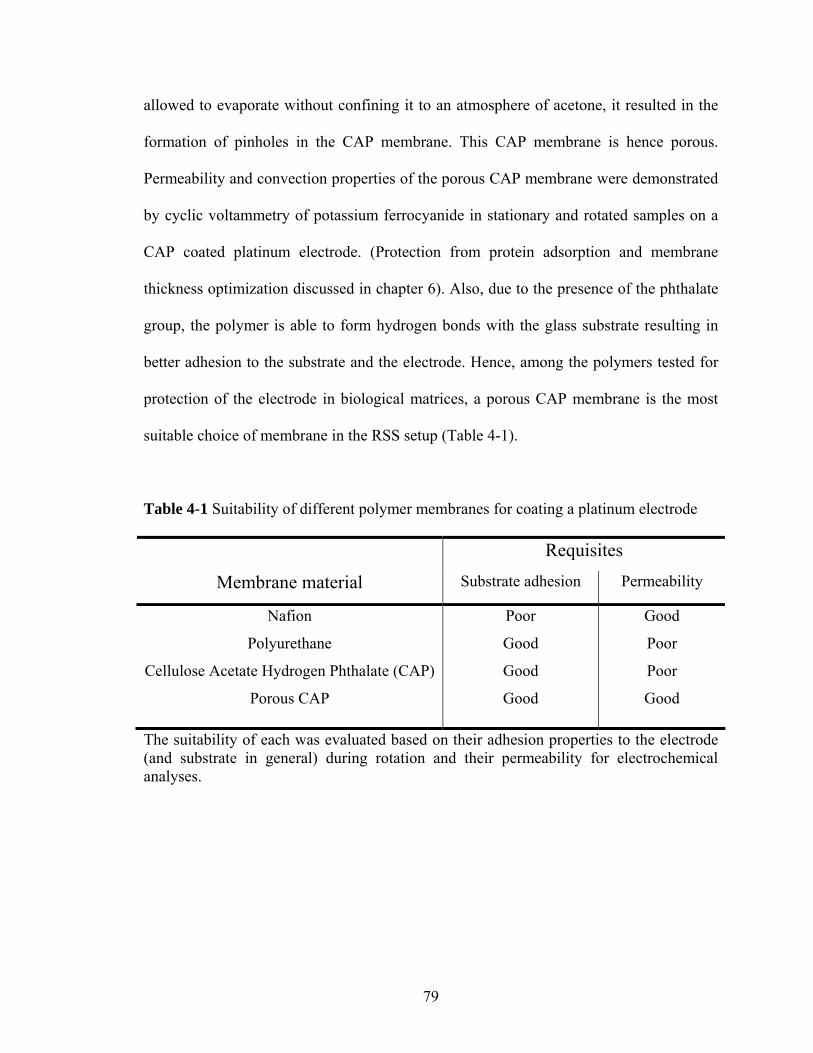
allowed to evaporate without confining it to an atmosphere of acetone, it resulted in the
formation of pinholes in the CAP membrane. This CAP membrane is hence porous.
Permeability and convection properties of the porous CAP membrane were demonstrated
by cyclic voltammetry of potassium ferrocyanide in stationary and rotated samples on a
CAP coated platinum electrode. (Protection from protein adsorption and membrane
thickness optimization discussed in chapter 6). Also, due to the presence of the phthalate
group, the polymer is able to form hydrogen bonds with the glass substrate resulting in
better adhesion to the substrate and the electrode. Hence, among the polymers tested for
protection of the electrode in biological matrices, a porous CAP membrane is the most
suitable choice of membrane in the RSS setup (Table 4-1).
Table 4-1 Suitability of different polymer membranes for coating a platinum electrode
Requisites
Membrane material Substrate adhesion Permeability
Nafion Poor Good
Polyurethane Good Poor
Cellulose Acetate Hydrogen Phthalate (CAP) Good Poor
Porous CAP Good Good
The suitability of each was evaluated based on their adhesion properties to the electrode (and substrate in general) during rotation and their permeability for electrochemical analyses.
79
4.5 Conclusions
Adsorption of proteins reduces the active electrode area; this fact was used to study
protein adsorption on electrodes. It was shown that by monitoring the region of a cyclic
voltammogram corresponding to the underpotential deposition of hydrogen and its
corresponding oxidation (hydrogen desorption), protein adsorption onto the electrode can
be assessed. This process however also effects desorption of proteins (described in
chapter 5) and hence cannot be employed as a quantitative tool for investigating protein
adsorption on surfaces. However, it is an effective method to study the trends of
adsorption and can also be employed as a simple tool to estimate adsorption for system
design purposes.
Convection causes increased adsorption of proteins onto the surface. Adsorption on the
surface is limited by steric hindrances caused by adsorbed proteins. Coating by protective
polymer membranes helps prevent substantial reduction in active surface area due to
protein adsorption. Coating by the membrane itself causes a reduction in electrode area
since the polymer is in direct contact with the electrode. However, a larger electrode
fabricated to off-set reduction of electrode area caused by the polymer coating can help
overcome this problem.
Three polymer membrane materials viz. Nafion, Polyurethane and CAP were evaluated
for suitability of coating of electrode and were tested for adhesion to the substrate and the
electrode, and permeability. The porous form of CAP was found to be the most suitable
80

for coating of the electrode for analyses in biological matrices. Although a spacer
membrane helps protect the electrode from adsorption, it does not completely eliminate
adsorption of proteins. It does help however, in increasing the lifetime of the electrode in
a biological matrix.
81
Chapter 5
Electrochemical Desorption of Proteins
Gautam N. Shetty, Miklós Gratzl Department of Biomedical Engineering
CASE, Cleveland OH 44106
This work is to be submitted to Nature Methods
82
5.1 Abstract
Protein adsorption onto a surface is thought to be irreversible. Adsorption of proteins
hence severely impacts the workability and longevity of electrodes in biological
environments. This phenomenon is also prevalent in food and dairy industries and is a
matter of concern. A method to effect desorption of proteins electrochemically is reported
in this work for the first time. In this work, using cyclic voltammetry desorption is
demonstrated by effecting desorption of bovine serum albumin (BSA) and in a fetal
bovine serum matrix. Controls to understand the underlying mechanisms are also
reported.
5.2 Introduction
The fouling of metal surfaces by non-specific adsorption of proteins is a matter of
concern in biomedical sensing, in the food processing industry and in the dairy industry.
Protein adsorption during in vivo or in vitro electrochemical analyses affects the lifetime
of the electrode [Chapter 4]. Adsorptive adhesion of proteins enhances the adhesion of
bacteria, resulting in ‘biofouling’. In the dairy industry, deposition of thermally unstable
materials in heat-transfer surfaces poses a problem [Geesey et al., 2000]. The process of
protein adsorption onto these surfaces is until now known to be irreversible [Clark, 2002,
Fang, 2001]. There are several types of interactions that may cause a protein to adsorb
onto a surface; Van der Waals forces, electrostatic interactions and the hydrophobic
83

effect [Nadarajah et al., 1995]. Researchers have demonstrated how varying the electrode
potential affects adsorption onto it demonstrating electrostatic basis for protein adsorption
[Guo et al., 1996]. The hydrophobic effect is considered in most cases as the chief cause
of protein adsorption on surfaces [Tilton et al., 1991]. This also forms the basis for
irreversibility of protein adsorption.
Surfactants have been used to address the problem in the dairy industry [Biswas et al.,
2002]. Surfactants however interact with proteins and helps effect its desorption from the
surface [Arnebrant et al., 1995]. However, the use of surfactants in alleviating the
problem of ‘fouling’ by proteins has met with only limited success [Biswas et al., 2002].
Surfactants have not been applied for biosensor applications, and even less in the case of
in vivo analyses. Attempts to address the ‘fouling’ of electrodes in biosensors involved
coating the electrode with spacer membranes such as Nafion [Jaenicke et al., 1998],
cellulose acetate [Cserey et al., 2001] and the like. Although, this provides protection to
the electrode it attenuates the electrode response since it blocks off some part of the
electrode area itself [Chapter 4], and acts as a mass transport barrier. In addition,
reproducible fabrication of the membrane coating is a non-trivial task [Kruusma et al.,
2004]. Efforts have also been made to explore use of lipids to dissolve adsorbed proteins
[Wilson et al., 2004]. It is known that proteins with higher affinity for the substrate
displace proteins previously adsorbed on the surface, which is known as the Vroman
effect [Slack et al., 1995]; for obvious reasons this does not however alleviate the
problem of fouling.
84
In this work for the first time a method by which desorption of proteins can effected
electrochemically. By successive cyclic voltammetry scans, the ability to desorb proteins
from the electrode surface is demonstrated.
5.3 Experimental
5.3.1 Materials
All chemicals were from Sigma (St Louis, MO); solutions were made with 18.2 MΩ
Milli-Q water (Milli-QUV plus from Millipore, Billerica, MA). Fetal bovine serum
(Equitech-Bio Inc., Kerrville, TX) was used as model matrix to demonstrate desorption
of protein in a heterogeneous protein matrix. Lyophilized bovine serum albumin (BSA)
(Sigma) to demonstrate and understand the mechanism of desorption. Solutions of BSA
and fetal bovine serum were made in pH 1 sulphuric acid (Sigma). For studying
desorption of proteins in rotated samples, capillary tubes (A.H. Thomas Co., Philadelphia,
PA) having 0.025 mm wall thickness and 0.5 mm i.d. were used to direct the nitrogen jets
to rotate the samples. The air flow rates were fixed at 160 mL/min.
5.3.2 Apparatus
Electrochemical measurements were made using a CH100 electrochemical workstation
(CH Instruments, Austin, TX). The RSS platform was employed as the electrochemical
cell to study adsorption onto the electrode surface. Homemade substrates with platinum
mini-disc electrodes were employed [Chapter 1, 2]. The electrochemical cell was
85
fabricated using Corning glass slide (7.5cm × 2.5cm and 0.1cm thick, from Fisher
Scientific, Pittsburgh, PA) as substrate. The WE was made from 150μm diameter
Platinum wire (Alfa Aesar, Ward Hill, MA). Silicone elastomer (DOW Corning, Midland,
MI) was applied to form the hydrophobic ring that confines the sample drop into a semi-
sphere (fabrication procedure is described earlier [Chapter 1]). Electrodes were polished
on Microcloth polishing pad (Buehler, Lake Bluff, IL) mounted on a Delta 31-120 disk
sander (Delta, Jackson, TN). Alumina polishing paste (Buehler) of 1 and 3 micron sizes
were used for polishing.
The Ag|AgCl (3N KCl) reference electrode (BAS, West Lafayette, IN) and gold wire
spiral counter electrode (Alfa Aesar) were placed under the substrate in 0.1 M KNO3,
connected to the sample side by a liquid junction filled with 1 wt% agar gel (Sigma).
5.3.3 Procedures
5.3.3.1 Standardizing electrode condition
Back-to-back cyclic voltammetry scans were conducted until reproducible cyclic
voltammograms were obtained [Yeager et al., 1978]. This ensures stable and
homogenous electrode surface conditions. This was undertaken before the sample was
investigated for adsorption and desorption of proteins. The number of repetitive runs
varied from 60 to 300.
5.3.3.2 Demonstrating desorption
Back-to back cyclic voltammograms in a sample containing 0.39 mg/dL BSA in pH 1
sulphuric acid were conducted to obtain the adsorption kinetics (this protocol is identical
to the one discussed in Chapter 4). The serum sample was replaced by sample containing
86
pH 1 sulphuric acid. And back-to-back cyclic voltammograms were conducted and the
region of hydrogen desorption was monitored for duration of time equal to adsorption
which in this case was 300 s.
5.3.3.3 Controls for identifying factor causing desorption
In order to further understand the causative agents of desorption of proteins, we
conducted a control. From the experiment demonstrating desorption of proteins, we
identified two probable causes viz. desorption due to presence of acid and cyclic
voltammetry. We allowed adsorption of protein from a 5% fetal bovine serum solution
and obtained an adsorption kinetic profile for 300 s. Then, in order to decouple the effect
of acid from the cyclic voltammograms, the serum solution was replaced by a pH 1
sulphuric acid solution and allowed to stand for 300 s after which a cyclic voltammogram
was conducted to check for change in electrode area. This was then followed by back-to-
back cyclic voltammograms in the pH 1 sulphuric acid sample to confirm the cause of
desorption. Further controls to understand the mechanisms involved in desorption were
conducted in samples containing BSA.
5.3.3.4 Demonstrating desorption of proteins in a protein matrix
In the above experiments desorption was demonstrated by replacing the serum/protein
solution by sulphuric acid. In order for this to be applied in a practical scenario, we need
to demonstrate the ability to desorb proteins in a biological matrix. For this purpose, we
studied the adsorption kinetics in three scenarios using cyclic voltammetry. In the first
case, back-to-back voltammograms and the adsorption kinetics was obtained. In the
second case successive cyclic voltammograms were run with a 5 second delay between
successive runs. In the third case, a 10 second delay was introduced between successive
87
runs. In all three scenarios voltammograms were conducted in a solution containing 5%
fetal bovine serum solution in pH 1 sulphuric acid. The adsorption kinetics in each case
was compared.
5.4 Results and Discussion
Desorption of proteins was first demonstrated in a solution containing a known protein
viz. BSA. Desorption was then studied in a heterogeneous matrix such fetal bovine serum.
5.4.1 Demonstrating desorption of serum proteins
Scanning the electrode potential in the reduction direction (in this case +1.0V to -0.25V
versus Ag|AgCl reference electrode), leads to the underpotential deposition (UPD) of a
hydrogen monolayer; this is the hydrogen reduction step [Will et al., 1960]. On scanning
back in the oxidation direction, this monolayer gets oxidized. Integrating either the
oxidation or reduction current corresponding to this region of the cyclic voltammogram
conducted in sulphuric acid solutions has been established as a method to obtain free
electrode area [Angerstein-Kozlowska, 1984]. This technique has also been used to study
the crystal structure of the electrode materials [Yeager et al., 1978]; hence, it is a
technique sensitive in the atomic scale to estimate electrode area. Back-to-back cyclic
voltammograms were measured in pH 1 sulphuric acid solution at 0.5 V/s scan rate,
adsorption kinetics from 0.39 g/dL of BSA acidified to pH 1 by sulphuric acid was
monitored for 300 seconds (60 back-to-back voltammograms). Successive cyclic
voltammograms in this matrix showed decrease in current corresponding to oxidation and
reduction of the hydrogen monolayer. This is attributed to the reduction in electrode
88
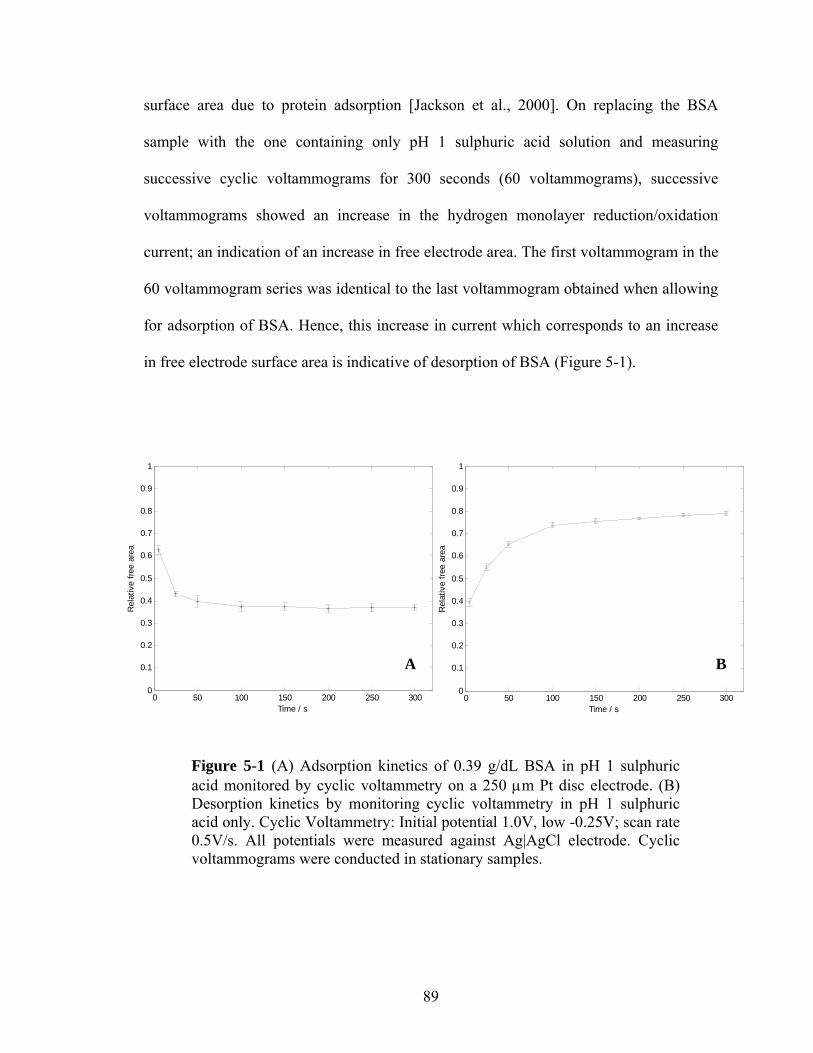
surface area due to protein adsorption [Jackson et al., 2000]. On replacing the BSA
sample with the one containing only pH 1 sulphuric acid solution and measuring
successive cyclic voltammograms for 300 seconds (60 voltammograms), successive
voltammograms showed an increase in the hydrogen monolayer reduction/oxidation
current; an indication of an increase in free electrode area. The first voltammogram in the
60 voltammogram series was identical to the last voltammogram obtained when allowing
for adsorption of BSA. Hence, this increase in current which corresponds to an increase
in free electrode surface area is indicative of desorption of BSA (Figure 5-1).
1
0 50 100 150 200 250 3000
0.1
0.2
0.3
0.4
0.5
0.6
0.7
0.8
0.9
1
Time / s
Rel
ativ
e fre
e ar
ea
B
0 50 100 150 200 250 300
Figure 5-1 (A) Adsorption kinetics of 0.39 g/dL BSA in pH 1 sulphuric acid monitored by cyclic voltammetry on a 250 μm Pt disc electrode. (B) Desorption kinetics by monitoring cyclic voltammetry in pH 1 sulphuric acid only. Cyclic Voltammetry: Initial potential 1.0V, low -0.25V; scan rate 0.5V/s. All potentials were measured against Ag|AgCl electrode. Cyclic voltammograms were conducted in stationary samples.
0
0.1
0.2
0.3
0.4
0.5
0.6
0.7
0.8
0.9
Time / s
Rel
ativ
e fre
e ar
ea
A
89
5.4.2 Controls to identify mechanism of desorption
The first control experiment was conducted to understand the mechanism of desorption
observed on measuring successive cyclic voltammograms in acidic solution. This control
was to test if desorption of proteins was due to any cleansing action of the acid or the
cyclic scanning of the electrode potential.
In order to test if the acid cleansed the electrode of the protein adsorbed, proteins were
allowed to be adsorbed from a 5% fetal bovine serum for 300 s and this was monitored
using cyclic voltammetry. This serum sample was then was replaced by a pH 1 sulphuric
acid solution; a cyclic voltammogram was measured in this solution immediately and
compared with the same measured after waiting for 300 seconds. No difference in the
relative free area was observed, confirming that the strong acidic condition did not cause
the proteins to desorb. However with back-to-back cyclic voltammograms, the desorption
effect was visible again (not shown). This confirmed that successive cyclic
voltammograms are responsible for desorption of proteins.
Controls were then conducted to find which region within a cyclic voltammogram was
responsible for desorption of proteins. The potential in the voltammogram was scanned
between 1.0V and -0.25V (versus Ag|AgCl reference electrode). In the reduction scan,
the region between 1.0V and 0.3V corresponds to the reduction of Pt oxide [Will et al.,
1960]. The region between 0 and -0.25V corresponds to the underpotential deposition of
hydrogen during the reduction scan [Will et al., 1960]. In the oxidation scan, the potential
between -0.25V and 0V corresponds to desorption of hydrogen and 0.3V and 1.0V
corresponds to the formation of Pt oxide layer [Will et al., 1960].
90
Isoelectric point or ‘pI’ is the pH value at which the net charge on a protein is ‘zero’
[Voet, 1980]. For pH values below the pI, the protein exhibits a net positive charge. It is
known that by varying electrode potential, we can alter adsorption onto an electrode [Guo
et al., 1996]. Desorption experiments above were conducted in solutions at pH 1. The
adsorbed proteins are hence in contact with a solution with pH much lower than their
isoelectric point (pI). Although unknown before, it could be possible that electrode
potential could effect desorption of proteins. To test this, two controls were run. In both
controls protein BSA was allowed to adsorb from a 0.39 g/dL solution of BSA in pH 1
sulphuric acid for 300 seconds. In the first control the electrode potential was clamped at
the most positive potential (i.e. +1.0V versus Ag|AgCl electrode) employed in the
voltammogram for 300 seconds in a pH 1 sulphuric acid solution. In the second control
the potential was cycled between +1.0V and +0.3V (positive potential region of the scan);
this was repeated for 300 seconds in all. In order to monitor the free active surface area
available and to test for desorption of the protein, after each control a cyclic
voltammogram was conducted by replacing the protein sample with a pH 1 sulphuric acid
solution and the potential was scanned between 1.0V and -0.25V. It was observed that in
each of the controls, no desorption of the protein could be observed. In the case of
clamping the potential at +1.0V, we did observe a large increase in the Pt oxide reduction
peak because of the clamping the electrode at that potential would have produced a large
amount of platinum oxide. This proves that desorption was not caused by electrostatic
repulsion and provides further evidence that the protein-electrode interaction is not
electrostatic. Hence, by the process of elimination, we can imply that the region of
91
hydrogen UPD is responsible for observed desorption of proteins and also that the
principal driving force of adsorption is the ‘hydrophobic effect’.
A third control that was conducted was repeating the above protocol for protein
desorption in a pH 4.8 sulphuric acid solution. BSA desorption was observed in this case
from cyclic voltammograms after allowing for adsorption of BSA from a 0.39 g/dL
solution of BSA. The pI of BSA is 4.9 [Lockwood, 2000, Teramoto, 1999]; desorption of
BSA at pH 4.8 further emphasizes the fact that desorption is not driven by electrostatic
repulsion.
Cyclic voltammograms at physiological pH (7.4) have been used to study the
conformation of proteins and this effect is not visible there [Jackson et al., 2000]. No
desorption of proteins was reported. Hence, in order to effect desorption increased
coverage of the hydrogen monolayer (i.e. higher density of hydrogen in the monolayer) is
required, which is available lower pH (acidic) solutions.
5.4.3 Desorption in the presence of proteins
All of the above experiments demonstrated desorption in acidic solutions using cyclic
voltammograms with no protein added in it (i.e. the original protein solution from which
adsorption had occurred was replaced by a solution containing only sulphuric acid). In
order to test for the efficacy of this technique in a protein-containing sample, in three
different scenarios, the electrode potential was scanned between 1.0 V and -0.25 V
(versus Ag|AgCl reference electrode) in a solution containing 10% fetal bovine serum
diluted with pH 1 sulphuric acid and cyclic voltammograms were measured in each case.
Three sets of experiments involved one with successive cyclic voltammograms were run
92

back-to-back, second with 5 second delays between voltammograms and thirds with 10
second delay between voltammograms. The relative loss of free area due to protein
adsorption was monitored in each case over a period of 300 seconds. It was observed that
when back-to-back cyclic voltammograms were conducted more relative free area was
observed and it was least when there were 10 second delays between successive
voltammograms (Figure 5-3). This set of experiments is similar to that used to study
adsorption of proteins onto the electrode [Chapter 4]. However, it demonstrates how
successive cyclic voltammograms can be used to desorb proteins in acidic solutions even
in the presence of proteins in the solution.
0 50 100 150 200 250 3000
0.1
0.2
0.3
0.4
0.5
0.6
0.7
0.8
0.9
1
Time (s)
Rel
ativ
e fre
e ar
ea
back-to-back CVs5 second delay10 second delay
Figure 5-2 Comparison between adsorption profiles from cyclic voltammograms conducted back-to-back, 5 second delay and 10 second delay in 5% fetal bovine serum samples acidified by pH 1 sulphuric acid. This is to demonstrate capability to effect desorption in protein matrices. Cyclic Voltammetry: Initial potential 1.0V, low -0.25V; scan rate 0.5V/s. All potentials measured against Ag|AgCl electrode. Cyclic voltammograms were conducted in stationary samples.
93
5.5 Conclusions
An understanding of hydrogen UPD reveals that the HUPD adatoms are intrinsically
repulsive to each other [Zolfaghari et al., 1997]. In an aqueous solution, the hydrophobic
regions of the proteins are first exposed to randomly oriented water molecules. However,
an ordering of water molecules occurs around the hydrophobic regions. Close to the
substrate an ordered layer of water molecules stays between the protein and the substrate,
squeezing out randomly oriented water molecules. This results in adsorption of proteins
onto a surface by way of the hydrophobic effect and is driven by a reduction of entropy
around the hydrophobic region of the protein due to the presence of ordered water
molecules [Tilton et al., 1991]. The protein molecule stays adsorbed onto the surface
unless its vibrational energy makes adsorption untenable [Brash et al., 1995] due to an
increase in its internal energy. There exists a layer of structured water molecules between
the protein and the surface, therefore reduction of protein content in the solution does not
produce desorption of the protein from the surface by way of concentration equilibrium.
This was demonstrated by the fact that a standing acid solution did not effect desorption.
It is possible however for a protein molecule to displace an already adsorbed protein
molecule if it is able attain a lower entropic state than the previously adsorbed protein
[Slack et al., 1995]; this is the Vroman effect. The ability of surfactants to partially effect
desorption of proteins is another example of this effect [Arnebrant et al., 1995]. The
formation of repulsive UPD hydrogen adatoms is able to provide the protein molecule
94
with extra vibrational energy that causes to increase the internal energy of the protein
needed to overcome hydrophobic force causing adsorption of the protein.
This technique of being able to desorb proteins using cyclic voltammetry can be used in
electrochemical sensing for biomedical applications that are hampered by protein
adsorption onto electrode surfaces from biological samples. In case of dairy and food
manufacturing this method would eliminate the need to employ surfactants and eliminate
disposal problems.
We have exploited the use of hydrogen UPD to effect desorption of proteins. We have
shown in this work that hydrogen evolution is not necessary for protein desorption; the
electrode potential was scanned negative enough only to form a monolayer of hydrogen
and not electrochemically evolve hydrogen. Evolution of hydrogen showed increased
desorption rates, but would be impractical in protein containing solutions due to high
physical stability of any bubbles that may be formed. For applications requiring cleaning
of surfaces fouled by protein adsorption (e.g. dairy), evolving hydrogen by reduction of
water would be more effective method to desorb proteins.
95
Chapter 6
Rotating Sample System: Trace Pb(II) Analyses in Serum and
Blood Samples
Gautam N. Shetty, Koji Tohda, Miklós Gratzl Department of Biomedical Engineering
CASE, Cleveland OH 44106
96

6.1 Abstract
The Rotating Sample System (RSS) has been conceived in the authors’ laboratory as a
convection platform for microliter sized samples. With favorable mass-transport
properties, we report detection capability of trace Lead (Pb) in microliter sized serum and
blood matrices on an Hg pre-deposited platinum electrode. Adsorption of proteins onto
electrodes is a deterrent to electrochemical analyses in biological matrices. We introduce
in this work the use of a Hg pre-deposited Pt electrode coated with porous cellulose
acetate hydrogen phthalate (CAP) membrane for protection from fouling by proteins. Due
to the miniature nature of the system, the RSS provides an enabling technology platform
for point-of-care screening for toxicity due to Pb exposure.
6.2 Introduction
Trace metals in body-fluids need to be monitored; some for their toxicity and some for
their necessity. With better understanding of the toxicity of certain metals even in trace
quantities, their monitoring in body fluids has gained increased importance [Wang, 1982].
Conventional methodologies for trace metal detection include Atomic Absorption
Spectroscopy (AAS) [Baralkiewicz et al, 1996], Inductively Coupled Plasma- Mass
Spectroscopy (ICP-MS) [Hansen et al, 2002] and electrochemical detection systems such
as rotating disc electrode (RDE) [Brihaye et al, 1983], sono-electroanalysis [Banks et al,
2004] and flow-injection [Jaenicke et al, 1998] techniques. AAS and ICP-MS techniques
involve bulky instrumentation and are labor intensive. They are also not amenable for
97
point-of-care applications and samples to be analyzed using these techniques would have
to factor issues related to transportation and storage of these samples. Electrochemical
techniques listed above need samples in the order of milliliters for analysis. This would
entail drawing out of larger amounts of sample (e.g. blood) for analysis.
We consider the example of trace Pb analysis in this work. The deleterious effects of Pb
on human health include neurological [Goyer, 1996], renal [Batuman et al, 1981],
hematological [DeSilva, 1981], endocrine [ATDSR, 1999], cardiovascular [Victery et al,
1988], reproductive and developmental abnormalities and is considered as a probable
carcinogen [Cooper, 1976] (toxic effects on Pb are discussed in Appendix C). The toxic
effects of Pb are even more serious in case of children and neonates [Ernhart et al, 1986]
because of the severe impact of Pb on their development. Hence it is essential to provide
with a platform for analyses in microliter sized samples.
The RSS has the capability to generate efficient convection in microliter sized samples.
The aforementioned electrochemical systems employ different methods to generate
convection in the solutions they are employed to analyze. Convection in electrochemical
trace metal analysis is essential since it helps reduce the pre-concentration time needed
for analysis due to improved mass transport in comparison to quiescent solutions
[Chapter 1]. The RSS generates convection by coupling linear gas jets’ velocities to the
surface of a microliter sized sample drop placed on a stationary substrate and kept in
position by a hydrophobic film in the shape of a ring. The inner diameter of the ring is
calculated such that a 20 μL sample drop forms a near-hemisphere. The coupling of the
98
gas jets with the sample surface translates into rotation of the drop, thereby generating
convection in it. The RDE system has been adapted to generate convection in samples as
small as 500 μL [Miller, 1974]. The RSS however does not contain any moving
mechanical parts and, also has an advantage that since the samples involved have
minimal waste problems; also the sensing substrate can be microfabricated and made
disposable. All of these make the RSS platform ideal for trace metal analyses in body-
fluids. Efficient Convection properties of the RSS have been demonstrated in aqueous
samples [Chapter 1, Cserey et al, 1997]. Trace Pb analysis has been demonstrated in
aqueous samples using the RSS and a limit-of-detection of 260 ppt has been achieved
[Chapter 1].
Electrochemical analysis of blood for detection of Lead [Jaenicke et al, 1998; Kruusma et
al, 2004], Cadmium [Kruusma et al, 2004], Zinc [Kruusma et al, 2004] has been
demonstrated, although in much larger blood samples for large dilutions.
In this work, we will demonstrate detection capability of Pb in serum and blood matrices.
Although Pb is not present in serum since it is present primarily in blood [Appendix C],
the example of Pb in serum is used to prove detection capability of other metals such as
Cu, Zn etc. that are analyzed in serum [Soylak et al, 2001]. Also in this work, for the first
time the use of cellulose acetate hydrogen phthalate (CAP) as a suitable membrane to
prevent fouling of the electrode in biological matrices is demonstrated.
6.3 Experimental
99
6.3.1 Materials
All chemical solutions were made with 18.2 MΩ Milli-Q water (Milli-QUV plus from
Millipore, Billerica, MA). The water thus obtained was then distilled using a quartz
distiller to obtain ultra-pure water. Samples were acidified with trace-select nitric acid
(Sigma) with which pH of the sample was maintained at 1. Lead solutions were prepared
from different dilutions of atomic absorption standard (Sigma). Polypropylene flasks
(Nalge Nunc International, Rochester, NY, USA) were used for storing Pb solutions to
preempt any contamination due to storage in glass containers [16]. Intralipid (Baxter
Healthcare Corp., Deerfield, IL), a 20% lipid fat emulsion was used as the lipid additive
for better rotation properties in serum and blood samples [Chapter 2 ,3]. 1 wt% of this in
pH 1 nitric acid was used as a lipid additive. Whole blood tested for HIV, HCV, HbsAg
and syphilis (Innovative Research Inc., Southfield, MI) was used for blood analysis.
EDTA-Na was used as the anti-coagulant. Acid pre-treated blood was filtered by a 0.45
μm cellulose acetate filter (Corning, NY) and centrifuged (Eppendorf, Germany) to filter
out large-sized precipitates. Capillary tubes (A.H. Thomas Co., Philadelphia, PA) having
0.025 mm wall thickness and 0.5 mm i.d. were used to direct the nitrogen jets to rotate
the samples. The air flow rates were fixed at 160 mL/min for all measurements.
6.3.2 Apparatus
100
Electrochemical measurements were made using CH100 electrochemical workstation
(CH Instruments, Austin, TX). Homemade substrates with platinum mini-disc electrodes
were employed. The electrochemical cell was fabricated using Corning glass slide (7.5
cm × 2.5 cm and 0.1 cm thick, from Fisher Scientific, Pittsburgh, PA) as substrate. The
WE was made from 125 μm, 250 μm diameters platinum wire (Alfa Aesar, Ward Hill,
MA). Silicone elastomer (DOW Corning, Midland, MI) was applied to form the
hydrophobic film ring that confines the sample drop into a semi-sphere (fabrication
procedure is described earlier [21]). The electrode center is offset 1.8mm from the center
of the ring. Electrodes were polished on microcloth polishing pad (Buehler, Lake Bluff,
IL) mounted on a Delta 31-120 disk sander (Delta, Jackson, TN). Alumina polishing
paste (Buehler) of 1 and 3 micron sizes were used for polishing.
The Ag|AgCl (3N KCl)reference electrode (BAS, West Lafayette, IN) and gold wire
spiral counter electrode (Alfa Aesar) were placed under the substrate in 0.1 M KNO3,
connected to the sample side by a liquid junction filled with 1 wt% agar gel (Sigma).
6.3.3 Procedures
6.3.3.1 Coating electrode with CAP and optimizing thickness for Pb analysis
An acetone solution containing 3 mg/mL of CAP was prepared for coating an Hg pre-
deposited platinum electrode. Hg was pre-deposited ex situ from a 1.5 mM Hg solution in
5% HCl. 3 μL of the CAP solution was placed as if a sample and the solvent was allowed
to evaporate. Since this is not done in an atmosphere of acetone vapor, evaporation is
rapid and the resultant CAP membrane thus formed is porous (pin-hole formation).
Electrochemistry on this CAP coated electrode was evaluated by stripping voltammetry
101

of Pb. A stationary sample containing 2.5 ppm Pb acidified to pH 1 by nitric acid was
evaluated on the electrode with and without CAP. Also, the same was evaluated with a
2.5 ppm Pb stationary sample also containing 25% fetal bovine serum. Pre-concentration
times in each case were adjusted such that all produced equivalent stripping currents.
From these results, the CAP membrane thickness was optimized.
6.3.3.2 Pb detection in spiked fetal bovine serum samples and resolving shape change
during rotation of sample
Using optimized CAP membrane parameters, detection capability of the RSS in a 20 μL
sample containing 25% serum, lipid additive (for better rotation [Chapter 2, 3]) and Pb in
the 75-750 ppb range was investigated. The samples were acidified to pH 1 using nitric
acid. Samples were rotated by humidified nitrogen jet with flow rate 160 mL/min. The
same was also repeated for 10 μL samples.
6.3.3.3 Convection properties in hemoglobin samples
Studies in solutions simulating proteins (serum albumin) in serum were conducted to
understand their convective properties [Chapter 2]. However, in blood hemoglobin is the
most significant component [Geigy Pharmaceuticals, 1962], hence it is essential to
understand how its presence alters convective properties of blood vis-à-vis the RSS. A
sample containing 2.5 mM potassium ferrocyanide, 3.25 g/dL hemoglobin (normal blood
hemoglobin is 13 g/dL) was evaluated for in electrochemical response in both stationary
and rotated samples. A control was also run in rotated and stationary sample without
hemoglobin or lipid for comparison.
102
6.3.3.4 Pb detection in spiked blood samples
Protocol similar to that done with serum was repeated. In a stationary sample containing
2.5 ppm Pb, 25% whole blood acidified by pH 1 nitric acid, stripping analysis was
undertaken. The time taken for the stripping current with and without blood was
compared to understand how blood matrix affects Pb detection. Feasibility of Pb
detection was undertaken by stripping analysis of 100 ppb total Pb content in a 10%
whole blood matrix. Lipid was added in this case to facilitate better rotation of the sample.
The sample was rotated using humidified, anti-parallel nitrogen jets at 160 mL/min.
For trace Pb detection in blood samples, a mixture containing one part (100 μL) whole
human blood, one part pH 1 nitric acid and one part containing 100 ppb Pb was filtered
using a 0.5 micron filter and a centrifuge. This is equivalent to having 100 ppb of Pb in
blood diluted 1:3 with pH 1 nitric acid. The filtrate was then diluted 1:2 by adding lipid
(1 wt% Intralipid) for better rotation of the sample. 10 μL of this sample was rotated by
160 mL/min anti-parallel nitrogen jets.
6.4 Results and Discussion
Feasibility of Pb detection was established in aqueous non-biological samples [Chapter 1].
Trace Pb was detected on an Hg pre-coated Pt electrode. However, analyses in biological
matrices require coating the electrode with a spacer membrane to prevent its fouling by
proteins, and polymer membrane CAP has been employed for this purpose. Optimization
of the CAP based sensing system was conducted in stationary serum and blood samples.
103
Optimization studies also helped in testing the robustness of the CAP coated electrode,
when exposed to serum and blood matrices.
6.4.1 CAP optimization
Stripping analysis in stationary 2.5 ppm Pb was conducted on a bare and CAP coated
electrode; the same was conducted in a 25% fetal bovine serum matrix containing 2.5
ppm Pb. Employing rotated samples is not possible because of the differences in rotation
due to the presence of protein molecules at the air-water interface [Chapter 2]. Hence,
comparisons between different samples were made in stationary conditions only. Pb
stripping current was obtained from stationary, non-biological sample with a bare Hg pre-
deposited electrode with 30 s pre-concentration time. It was observed that the CAP
coated electrode needed 200 s and in presence of serum, the CAP coated membrane took
600 s (Figure 6-1A) to obtain the same amount of Pb stripping current.
The CAP solution was then diluted 10 times (0.3 mg/mL in acetone). With a thinner CAP
membrane and for a 60 s pre-concentration time in each case only slight difference in Pb
stripping peaks was observed with and without CAP (Figure 6-1B). However, in a 25%
serum matrix, the Pb stripping peak is reduced for a 60 s pre-concentration time. This
reduction in peak is due to a combined effect of reduction in area due to some adsorption
of protein and due to reduced diffusivity [Chapter 2] in a protein matrix. With the thicker
membrane, we observed that it takes about 3 times longer to get the same amount of Pb
stripping current in a serum matrix as opposed to a sample with no serum. Similarly, the
reduction in peak current in case of sample with serum as opposed to no serum is less by
104
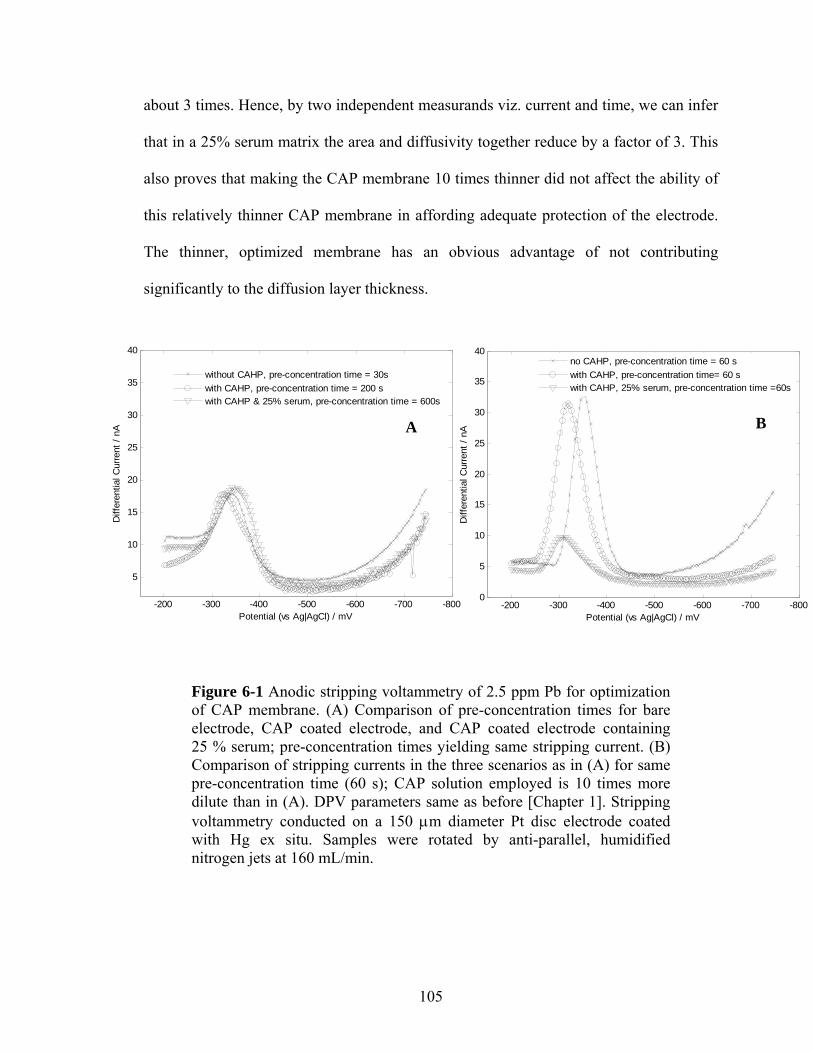
about 3 times. Hence, by two independent measurands viz. current and time, we can infer
that in a 25% serum matrix the area and diffusivity together reduce by a factor of 3. This
also proves that making the CAP membrane 10 times thinner did not affect the ability of
this relatively thinner CAP membrane in affording adequate protection of the electrode.
The thinner, optimized membrane has an obvious advantage of not contributing
significantly to the diffusion layer thickness.
-800-700-600-500-400-300-200
5
10
15
20
25
30
35
40
Potential (vs Ag|AgCl) / mV
Diff
eren
tial C
urre
nt /
nA
without CAHP, pre-concentration time = 30swith CAHP, pre-concentration time = 200 swith CAHP & 25% serum, pre-concentration time = 600s
-800-700-600-500-400-300-2000
5
10
15
20
25
30
35
40
Potential (vs Ag|AgCl) / mV
Diff
eren
tial C
urre
nt /
nA
no CAHP, pre-concentration time = 60 swith CAHP, pre-concentration time= 60 swith CAHP, 25% serum, pre-concentration time =60s
A B
Figure 6-1 Anodic stripping voltammetry of 2.5 ppm Pb for optimization of CAP membrane. (A) Comparison of pre-concentration times for bare electrode, CAP coated electrode, and CAP coated electrode containing 25 % serum; pre-concentration times yielding same stripping current. (B) Comparison of stripping currents in the three scenarios as in (A) for same pre-concentration time (60 s); CAP solution employed is 10 times more dilute than in (A). DPV parameters same as before [Chapter 1]. Stripping voltammetry conducted on a 150 μm diameter Pt disc electrode coated with Hg ex situ. Samples were rotated by anti-parallel, humidified nitrogen jets at 160 mL/min.
105
6.4.2 Pb detection in serum samples
Using the optimized CAP membrane, pH 1 acidified samples of 75-750 ppb Pb samples
also containing 25% serum were analyzed. A linear calibration was obtained with a
regression coefficient (r2) of 0.87 (not shown). Although promising, this performance is
not as good as that obtained in aqueous samples (r2=0.99) [Chapter 1]. Analysis in
aqueous samples in this concentration range yielded a limit of detection of 14 ppb
[Chapter 1]. One observation made here was that during rotation of the sample, due to its
low surface tension on account of the presence of proteins and lipids at the air-water
interface [Chapter 3], there was distortion of the sample shape during rotation as opposed
to the near-hemispherical shape in case of aqueous samples.
Due to the low surface tension, the surface is unable to withstand the shear caused by the
high nitrogen jet velocities. The sample acquires a shape that can withstand this shear
force and has good mechanical stability. The resultant shape however is not reproducible.
Also, the sample spills beyond the area marked by the hydrophobic ring. We had reported
excellent linearity, repeatability and reproducibility when the coupling between the air-
jets and the sample was kept the same [Chapter 1]. However, due to irreproducibility of
sample shape and subsequently non-identical coupling of the air-jet with the sample, the
results obtained are less ideal in the case of analysis in a 20 μL biological sample.
106
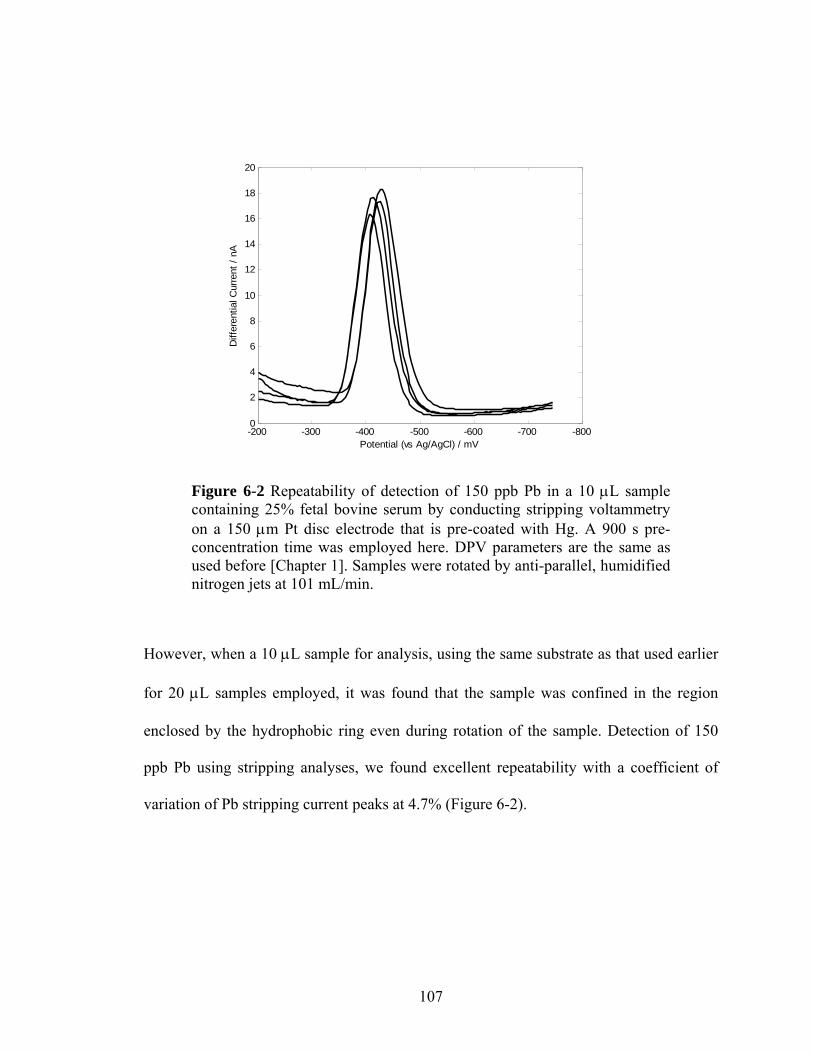
-800-700-600-500-400-300-2000
2
4
6
8
10
12
14
16
18
20
Potential (vs Ag/AgCl) / mV
Diff
eren
tial C
urre
nt /
nA
Figure 6-2 Repeatability of detection of 150 ppb Pb in a 10 μL sample containing 25% fetal bovine serum by conducting stripping voltammetry on a 150 μm Pt disc electrode that is pre-coated with Hg. A 900 s pre-concentration time was employed here. DPV parameters are the same as used before [Chapter 1]. Samples were rotated by anti-parallel, humidified nitrogen jets at 101 mL/min.
However, when a 10 μL sample for analysis, using the same substrate as that used earlier
for 20 μL samples employed, it was found that the sample was confined in the region
enclosed by the hydrophobic ring even during rotation of the sample. Detection of 150
ppb Pb using stripping analyses, we found excellent repeatability with a coefficient of
variation of Pb stripping current peaks at 4.7% (Figure 6-2).
107
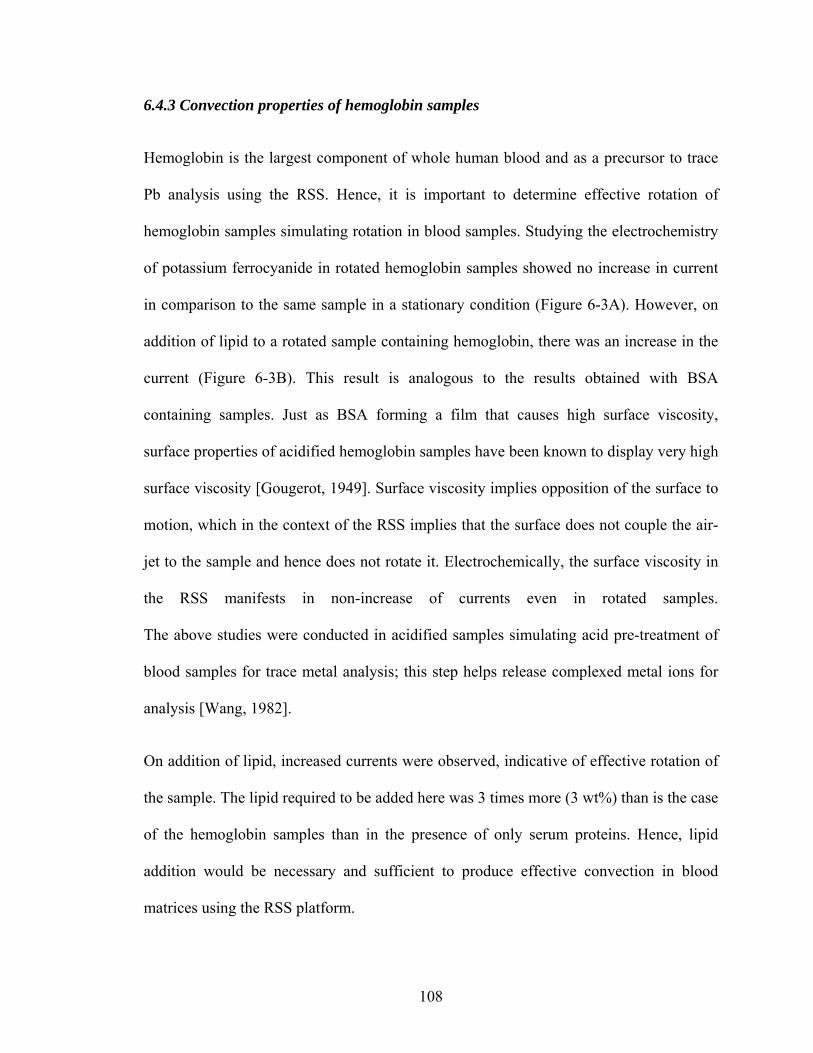
6.4.3 Convection properties of hemoglobin samples
Hemoglobin is the largest component of whole human blood and as a precursor to trace
Pb analysis using the RSS. Hence, it is important to determine effective rotation of
hemoglobin samples simulating rotation in blood samples. Studying the electrochemistry
of potassium ferrocyanide in rotated hemoglobin samples showed no increase in current
in comparison to the same sample in a stationary condition (Figure 6-3A). However, on
addition of lipid to a rotated sample containing hemoglobin, there was an increase in the
current (Figure 6-3B). This result is analogous to the results obtained with BSA
containing samples. Just as BSA forming a film that causes high surface viscosity,
surface properties of acidified hemoglobin samples have been known to display very high
surface viscosity [Gougerot, 1949]. Surface viscosity implies opposition of the surface to
motion, which in the context of the RSS implies that the surface does not couple the air-
jet to the sample and hence does not rotate it. Electrochemically, the surface viscosity in
the RSS manifests in non-increase of currents even in rotated samples.
The above studies were conducted in acidified samples simulating acid pre-treatment of
blood samples for trace metal analysis; this step helps release complexed metal ions for
analysis [Wang, 1982].
On addition of lipid, increased currents were observed, indicative of effective rotation of
the sample. The lipid required to be added here was 3 times more (3 wt%) than is the case
of the hemoglobin samples than in the presence of only serum proteins. Hence, lipid
addition would be necessary and sufficient to produce effective convection in blood
matrices using the RSS platform.
108

100 200 300 400 500 600
-0.5
0
0.5
1
1.5
2
Potential (Vs Ag|AgCl) / mV
Cur
rent
/ uA
100 150 200 250 300 350 400 450 500 550 600
0
0.5
Figure 6-3 Convection properties of hemoglobin samples were studied by cyclic voltammetry of 2.5 mM potassium ferrocyanide acidified by pH 1 nitric acid (A) Comparison between stationary ( ___ ) and rotated (-----) 20 μL samples containing 3.25 g/dL of hemoglobin. (B) Comparison between stationary and rotated samples of hemoglobin also containing 3 wt% Intralipid; control (-----) in samples containing neither hemoglobin nor lipid was also done. Voltammetry conducted on a bare 250 μm Pt disc electrode. Cyclic voltammetry conducted between 100 mV (also initial potential) and 600 mV at scan rate of 100 mV/s. Samples were rotated by anti-parallel, humidified nitrogen jets at 160 mL/min.
6.4.4 Pb analyses in whole blood
Similar to the experiments in serum, the efficacy of the CAP membrane that was
optimized for analysis in serum was evaluated by stripping voltammetry of 2.5 ppm Pb in
stationary samples of 25% whole blood (Figure 6-4); a comparison was then made with
sample with no blood. When extrapolated, it was found that it would roughly take time an
order of magnitude more in a blood matrix than the time to obtain equivalent stripping
current without blood. It was learnt that the blood supplied was treated with EDTA as an
1
1.5
2
Potential (Vs Ag|AgCl) / mV
Cur
rent
/ uA
B A
Rotated samples
Stationary samples
109
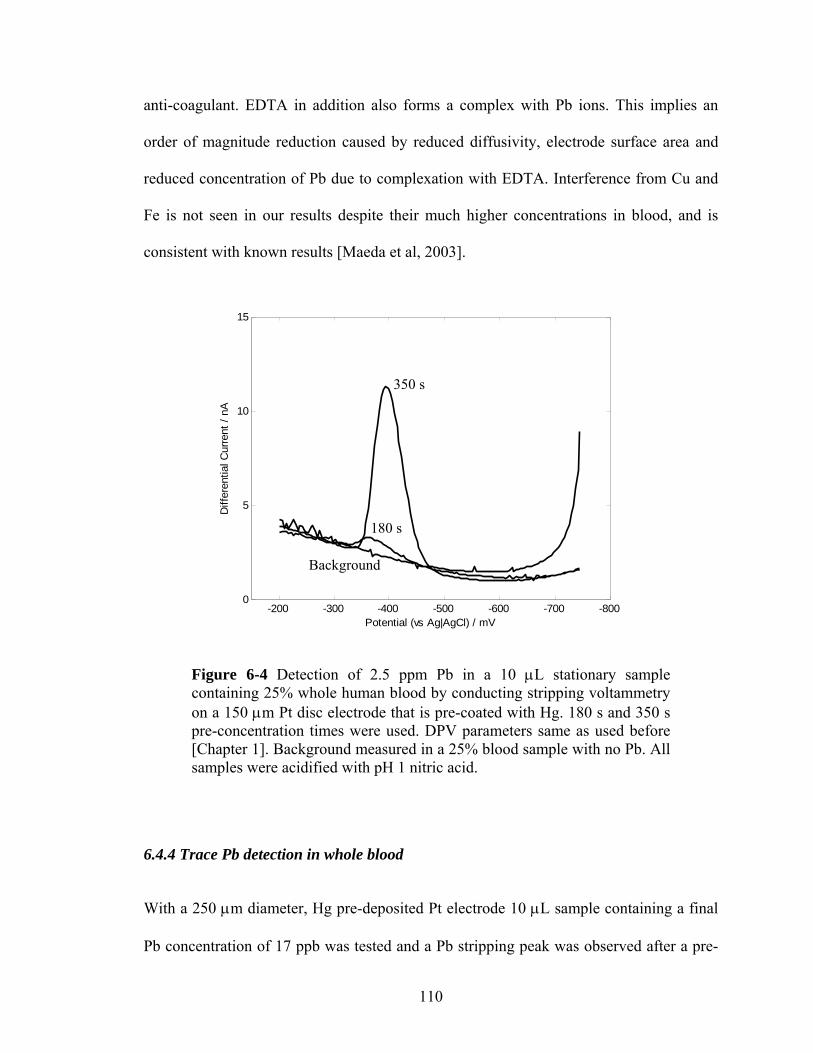
anti-coagulant. EDTA in addition also forms a complex with Pb ions. This implies an
order of magnitude reduction caused by reduced diffusivity, electrode surface area and
reduced concentration of Pb due to complexation with EDTA. Interference from Cu and
Fe is not seen in our results despite their much higher concentrations in blood, and is
consistent with known results [Maeda et al, 2003].
-800-700-600-500-400-300-2000
5
10
15
Potential (vs Ag|AgCl) / mV
Diff
eren
tial C
urre
nt /
nA
Background
350 s
180 s
Figure 6-4 Detection of 2.5 ppm Pb in a 10 μL stationary sample containing 25% whole human blood by conducting stripping voltammetry on a 150 μm Pt disc electrode that is pre-coated with Hg. 180 s and 350 s pre-concentration times were used. DPV parameters same as used before [Chapter 1]. Background measured in a 25% blood sample with no Pb. All samples were acidified with pH 1 nitric acid.
6.4.4 Trace Pb detection in whole blood
With a 250 μm diameter, Hg pre-deposited Pt electrode 10 μL sample containing a final
Pb concentration of 17 ppb was tested and a Pb stripping peak was observed after a pre-
110
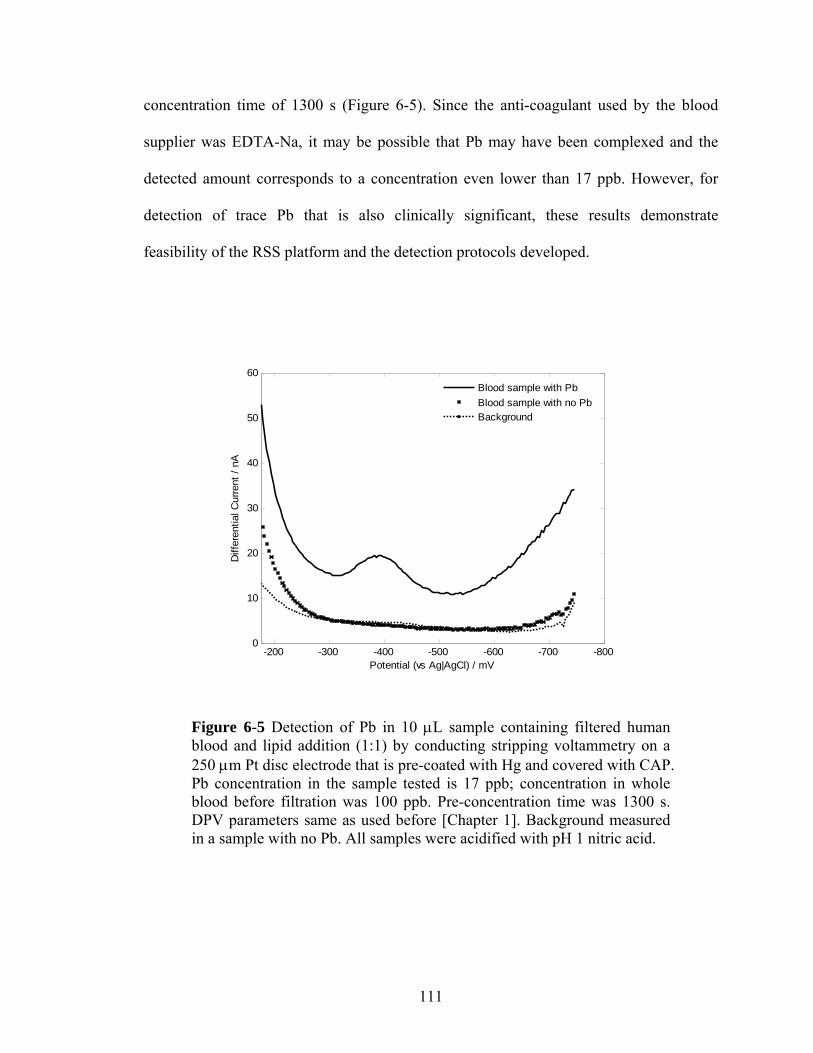
concentration time of 1300 s (Figure 6-5). Since the anti-coagulant used by the blood
supplier was EDTA-Na, it may be possible that Pb may have been complexed and the
detected amount corresponds to a concentration even lower than 17 ppb. However, for
detection of trace Pb that is also clinically significant, these results demonstrate
feasibility of the RSS platform and the detection protocols developed.
-800-700-600-500-400-300-2000
10
20
30
40
50
60
Potential (vs Ag|AgCl) / mV
Diff
eren
tial C
urre
nt /
nA
Blood sample with PbBlood sample with no PbBackground
Figure 6-5 Detection of Pb in 10 μL sample containing filtered human blood and lipid addition (1:1) by conducting stripping voltammetry on a 250 μm Pt disc electrode that is pre-coated with Hg and covered with CAP. Pb concentration in the sample tested is 17 ppb; concentration in whole blood before filtration was 100 ppb. Pre-concentration time was 1300 s. DPV parameters same as used before [Chapter 1]. Background measured in a sample with no Pb. All samples were acidified with pH 1 nitric acid.
111
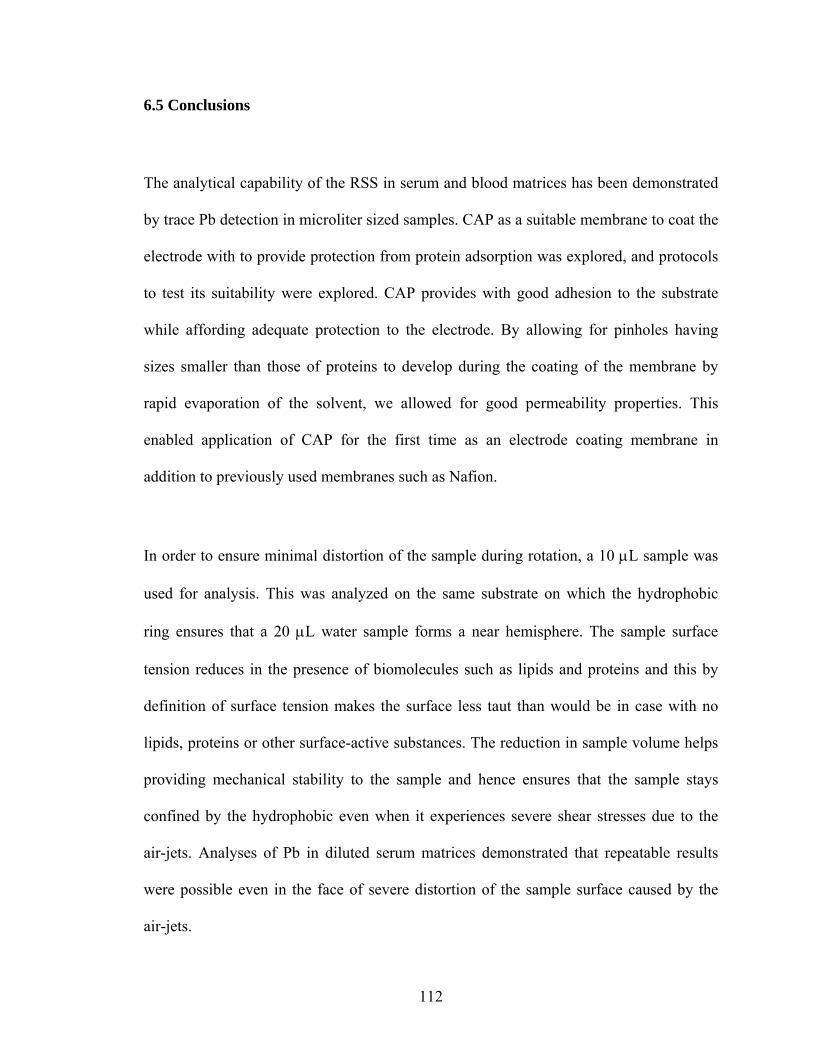
6.5 Conclusions
The analytical capability of the RSS in serum and blood matrices has been demonstrated
by trace Pb detection in microliter sized samples. CAP as a suitable membrane to coat the
electrode with to provide protection from protein adsorption was explored, and protocols
to test its suitability were explored. CAP provides with good adhesion to the substrate
while affording adequate protection to the electrode. By allowing for pinholes having
sizes smaller than those of proteins to develop during the coating of the membrane by
rapid evaporation of the solvent, we allowed for good permeability properties. This
enabled application of CAP for the first time as an electrode coating membrane in
addition to previously used membranes such as Nafion.
In order to ensure minimal distortion of the sample during rotation, a 10 μL sample was
used for analysis. This was analyzed on the same substrate on which the hydrophobic
ring ensures that a 20 μL water sample forms a near hemisphere. The sample surface
tension reduces in the presence of biomolecules such as lipids and proteins and this by
definition of surface tension makes the surface less taut than would be in case with no
lipids, proteins or other surface-active substances. The reduction in sample volume helps
providing mechanical stability to the sample and hence ensures that the sample stays
confined by the hydrophobic even when it experiences severe shear stresses due to the
air-jets. Analyses of Pb in diluted serum matrices demonstrated that repeatable results
were possible even in the face of severe distortion of the sample surface caused by the
air-jets.
112
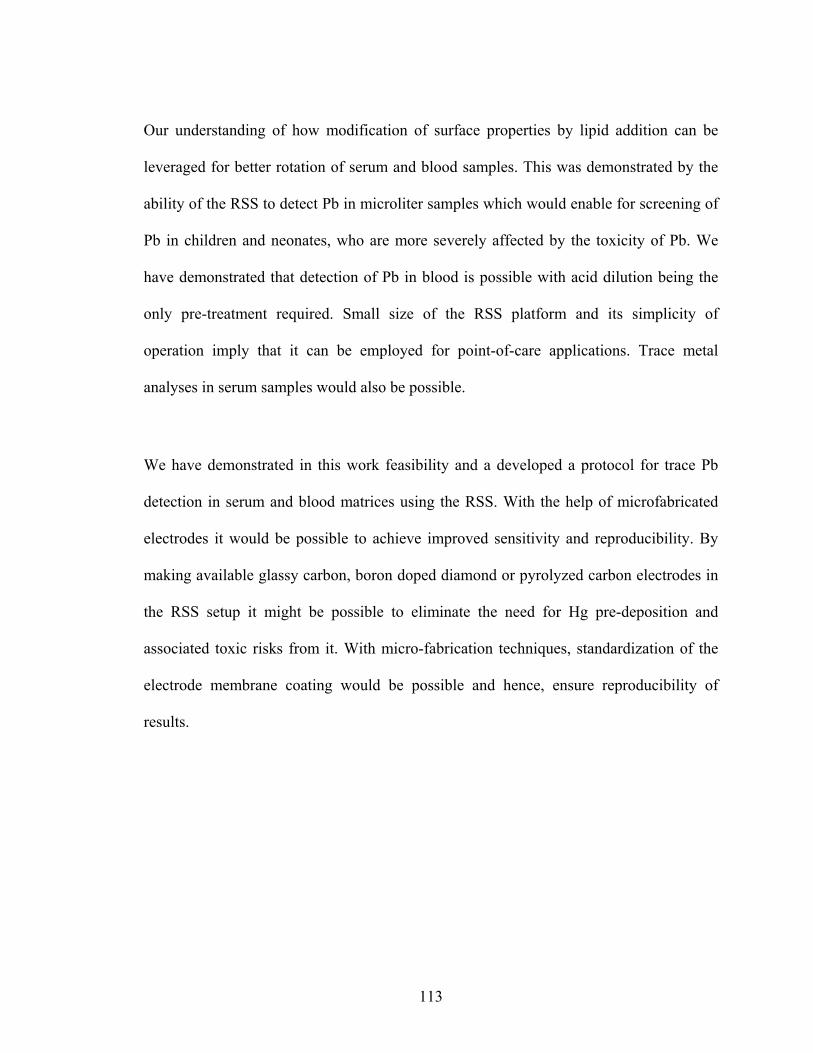
Our understanding of how modification of surface properties by lipid addition can be
leveraged for better rotation of serum and blood samples. This was demonstrated by the
ability of the RSS to detect Pb in microliter samples which would enable for screening of
Pb in children and neonates, who are more severely affected by the toxicity of Pb. We
have demonstrated that detection of Pb in blood is possible with acid dilution being the
only pre-treatment required. Small size of the RSS platform and its simplicity of
operation imply that it can be employed for point-of-care applications. Trace metal
analyses in serum samples would also be possible.
We have demonstrated in this work feasibility and a developed a protocol for trace Pb
detection in serum and blood matrices using the RSS. With the help of microfabricated
electrodes it would be possible to achieve improved sensitivity and reproducibility. By
making available glassy carbon, boron doped diamond or pyrolyzed carbon electrodes in
the RSS setup it might be possible to eliminate the need for Hg pre-deposition and
associated toxic risks from it. With micro-fabrication techniques, standardization of the
electrode membrane coating would be possible and hence, ensure reproducibility of
results.
113

Chapter 7
Summary and Future Work
114
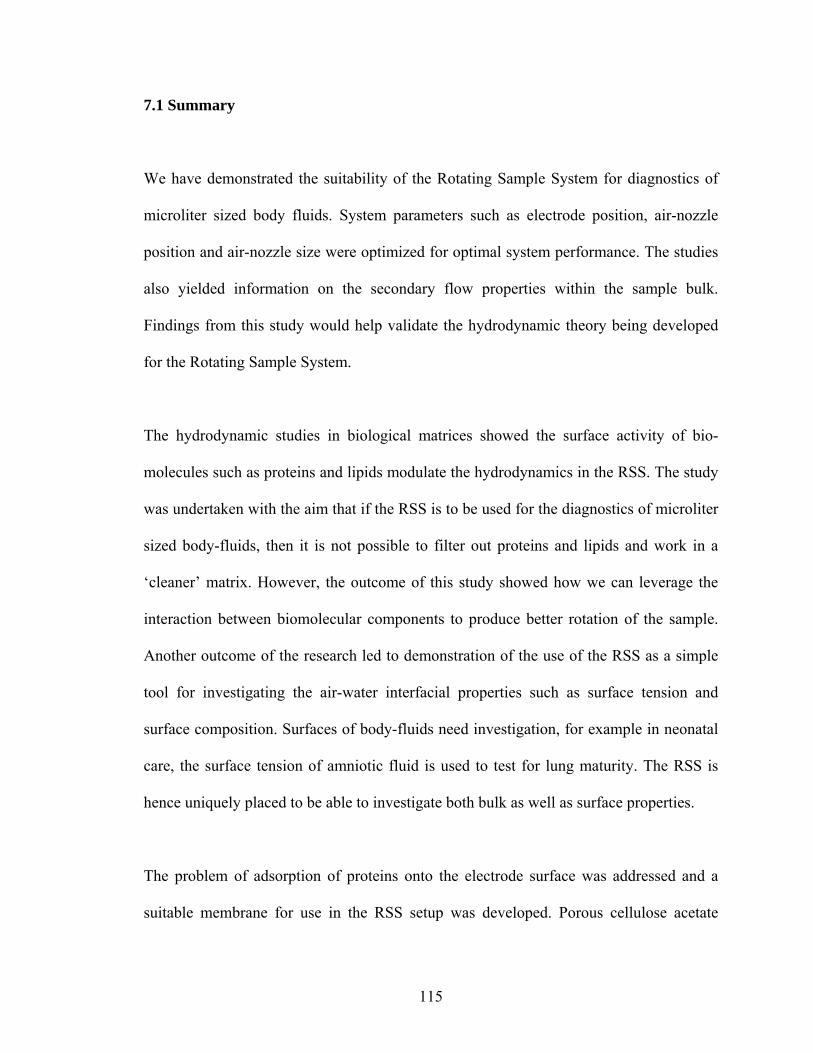
7.1 Summary
We have demonstrated the suitability of the Rotating Sample System for diagnostics of
microliter sized body fluids. System parameters such as electrode position, air-nozzle
position and air-nozzle size were optimized for optimal system performance. The studies
also yielded information on the secondary flow properties within the sample bulk.
Findings from this study would help validate the hydrodynamic theory being developed
for the Rotating Sample System.
The hydrodynamic studies in biological matrices showed the surface activity of bio-
molecules such as proteins and lipids modulate the hydrodynamics in the RSS. The study
was undertaken with the aim that if the RSS is to be used for the diagnostics of microliter
sized body-fluids, then it is not possible to filter out proteins and lipids and work in a
‘cleaner’ matrix. However, the outcome of this study showed how we can leverage the
interaction between biomolecular components to produce better rotation of the sample.
Another outcome of the research led to demonstration of the use of the RSS as a simple
tool for investigating the air-water interfacial properties such as surface tension and
surface composition. Surfaces of body-fluids need investigation, for example in neonatal
care, the surface tension of amniotic fluid is used to test for lung maturity. The RSS is
hence uniquely placed to be able to investigate both bulk as well as surface properties.
The problem of adsorption of proteins onto the electrode surface was addressed and a
suitable membrane for use in the RSS setup was developed. Porous cellulose acetate
115

hydrogen phthalate membrane was found as the most suitable candidate to coat the
electrode for electrochemical analyses of body-fluids. A simple electrochemical
technique to estimate protein adsorption at low acidic pH and accessible to the RSS setup
was developed. Efficient electrochemical desorption of proteins has been reported for the
first time in this work. By repeated cyclic voltammetry runs in an acidic medium, we
were able to desorb proteins from the electrode surface. This finding presents numerous
benefits for biomedical sensing and also in applications where protein adsorption poses a
problem (e.g. food and dairy industries).
As an example of the analytical capability of the RSS, and combining results from all of
the above works, trace Pb analyses were conducted in serum and human blood matrices.
Determination of Pb in non-biological samples yielded a limit-of-detection of 260 ppt.
Repeatability and reproducibility of Pb analyses articulate the robustness of this simple
system. Capability of detection of Pb in serum and whole blood samples was
demonstrated.
Analysis of small samples is challenging especially since variations and errors which can
usually be ignored in larger systems become significant. Analyzing small samples
requires a low tolerance of variation in system parameters, and this can be made available
with microfabrication technology. Analyses of biological samples have to deal with only
one interface i.e. their contact with the sample. With the RSS, there is another interface to
be factored in; this work has helped with a better understanding of it. Proof of concept of
116
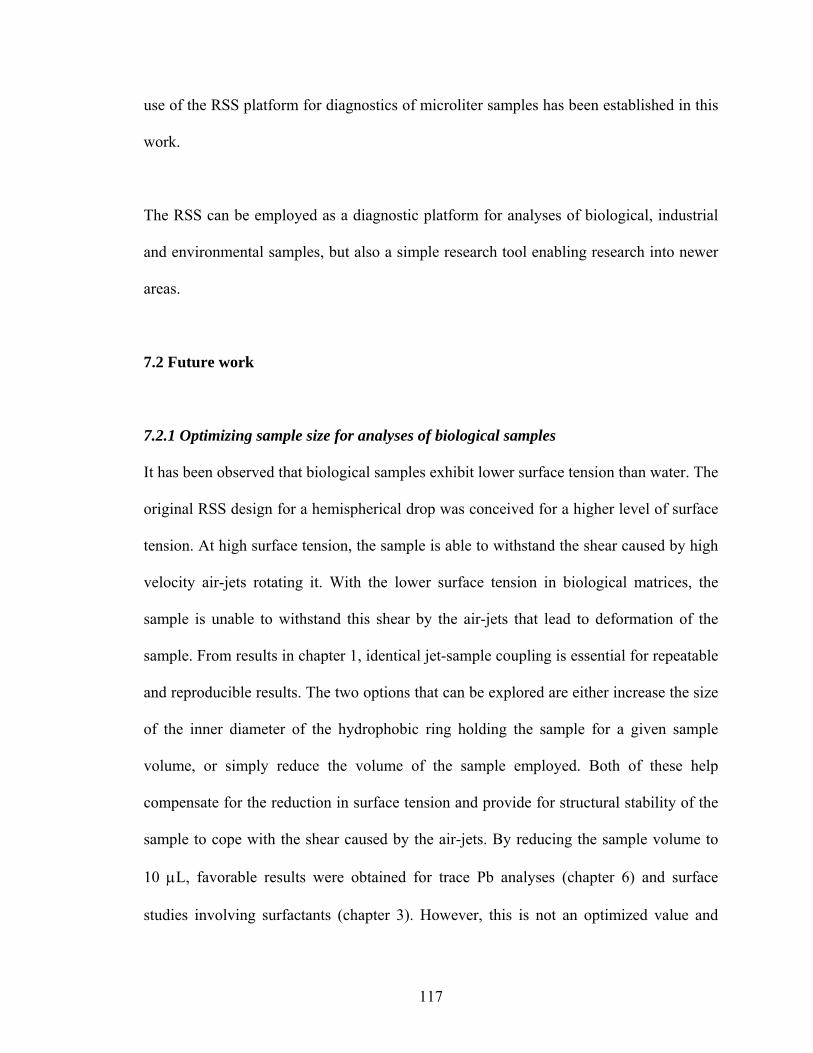
use of the RSS platform for diagnostics of microliter samples has been established in this
work.
The RSS can be employed as a diagnostic platform for analyses of biological, industrial
and environmental samples, but also a simple research tool enabling research into newer
areas.
7.2 Future work
7.2.1 Optimizing sample size for analyses of biological samples
It has been observed that biological samples exhibit lower surface tension than water. The
original RSS design for a hemispherical drop was conceived for a higher level of surface
tension. At high surface tension, the sample is able to withstand the shear caused by high
velocity air-jets rotating it. With the lower surface tension in biological matrices, the
sample is unable to withstand this shear by the air-jets that lead to deformation of the
sample. From results in chapter 1, identical jet-sample coupling is essential for repeatable
and reproducible results. The two options that can be explored are either increase the size
of the inner diameter of the hydrophobic ring holding the sample for a given sample
volume, or simply reduce the volume of the sample employed. Both of these help
compensate for the reduction in surface tension and provide for structural stability of the
sample to cope with the shear caused by the air-jets. By reducing the sample volume to
10 μL, favorable results were obtained for trace Pb analyses (chapter 6) and surface
studies involving surfactants (chapter 3). However, this is not an optimized value and
117
although lower volumes do help cope with the problem of reduced surface tension,
evaporation of the sample becomes an issue to deal with. Hence, future work would
require optimizing the size of the sample or inner diameter of the hydrophobic ring.
7.2.2 Interfacial study using the RSS
This work has opened up a whole area of analysis using the RSS viz. interface study.
Interfacial studies have shown how proteins and lipids compete to occupy the air-liquid
interface. From the hemoglobin-lipid and BSA-lipid studies, we have found that they
have dissimilar affinities for the interface. Protein-lipid interaction is widely studied since
this is the interaction occurring at the surface of a cell; hence the core of biological
research. The RSS platform could provide an enabling platform for basic research.
Quantitative information on surface composition could also be deduced. Interfacial
applications could also include testing of water quality to check for surfactant or other
surface impurities. The small size of the RSS would enable it to be employed as an on-
site diagnostic tool.
7.2.3 Desorption for precise protein patterning
Desorption of proteins could be engineered to help pattern proteins. It is possible to
fabricate micro/nano electrode patterns. By selectively desorbing of proteins or by
allowing selective adsorption patterns of proteins and also patterns of cells can be
possible to achieve. State-of-art in protein patterning is imprecise and involves complex
instrumentation. Chemotactic growth of neurons has been shown, but in order to achieve
directional growth it is essential to be able to switch off the chemotactic source. By
118
tethering this source to an electrode and then desorbing it, this can be achieved. This can
be adapted to the BioMEMS platform in our laboratory.
7.2.4 Micro-fabricated sensors for trace Pb analysis
We have demonstrated feasibility of trace Pb detection in non-biological matrices, serum
and human blood using home-made sensing substrates. Trace Pb analysis would require
microfabricated sensing substrates. We demonstrated in this work how smaller electrode
area afforded better detection sensitivities. However with analyses in biological samples,
there is loss of electrode area and reduced diffusivity. Hence, in order to compensate for
this, an increase in the electrode surface area without reducing the signal to noise ratio
would be required. This can be realized by employing an array of small electrodes. The
small electrodes ensure that there is no increase in the background signal, but at the same
time having several such small electrodes effectively provide with a larger surface area.
7.2.5 Engineering protein adsorption
Protein adsorption is limited by steric hindrances. From our results in chapter 2 it is clear
that the adsorbed protein layer does not completely block off the electrode and is non-
contiguous. Hence, it should be possible to find a suitable protein that would not
completely block the electrode. However, a monolayer of such a protein would help filter
out other proteins, but at the same time permit passage of the analyte to be analyzed.
Such ‘protein-based’ filter would ease the complications associated with fabrication of
polymer coating membranes. There is only monolayer coverage of proteins and would
automatically ensure uniformity of thickness. Ensuring uniformity of membrane
119

thickness is currently is the biggest problem facing conventional membranes used to coat
electrodes.
7.2.6 Enzyme activity loss due to adsorption
Proteins adsorb onto surfaces and undergo change in conformation. This is true of
enzymes too; however, change in conformation would lead to loss of activity. A unique
feature of the RSS is its high contact surface area to volume ratio. Hence, in the case of
RSS application for enzyme activity measurements it would be important to know the
kinetics of this loss of activity due to change in conformation of the enzyme. It would be
essential to prove that this change in conformation is much slower than the time required
for measuring enzyme activity using the RSS as a micro pH stat.
The above can be demonstrated by allowing the enzyme to adsorb onto the RSS substrate
from a solution containing the enzyme only. This solution is then replaced by a blank
solution to wash un-adsorbed enzyme molecules. After the ‘wash’ step, the adsorbed
enzyme is exposed to a solution containing its substrate. The activity of the enzyme
would need to be monitored against time to show how any change in conformation
affects the activity.
Also, due to the hemi-spherical nature of the sample, there exists a large surface area of
the sample where the enzyme is exposed to an air-liquid interface. Conformational
change can occur even at this interface due to the proclivity of enzymes and proteins to
migrate to this interface. Study of the effect of conformational change at the liquid-
substrate interface can also be used to provide an estimate of the kinetics of conformation
change. This would give us an idea as to how quickly the analysis would have to be
120
completed in without having to factor loss of enzyme activity due to conformation
change at the two interfaces.
It is known that there is no aggregation of protein molecules (except insulin). Hence, in
order to preempt enzyme adsorption, the RSS substrate could be pre-treated with a
protein solution allowing the protein to adsorb onto it. This protein monolayer would
prevent any adsorption of the enzyme molecule and any subsequent loss of activity due to
conformation change from adsorption. In order to preempt conformational change at the
air-liquid interface due to the migration of enzyme to this interface, we could include
protein and lipid additives that have a greater affinity to the air-liquid interface but do not
cause a change in conformation of the enzyme.
7.2.7 Kinetic measurements using the RSS
The RDE system has been used for measuring electrochemical reaction kinetics. The
basis of such measurements is that if mass-transport can be made fast enough (e.g.
rotation of electrode in RDE), then electrochemical measurements provides information
on the kinetics of electrochemical reactions. We have demonstrated favorable mass-
transport properties in the RSS, comparable to the RDE. Hence, it should be possible to
employ the RSS as a platform for reaction kinetic measurements.
121

Appendix A
Electrode Area and Sample Shape
The RSS hydrodynamic performance was evaluated on the basis of the diffusion layer
thickness (Equation 2, Chapter 1). Calculating the diffusion layer thickness requires
knowledge of the electrode active area, which could be different from the geometric of
the electrode area (given that the electrode is in the form of a circular disc).
Calculating electrode area
Electrode area was measured using two independent electrochemical techniques viz.
Chronoamperometry and Cyclic Voltammetry, and a comparison was made.
In chronoamperometry, the potential of the electrode in a 1mM potassium ferrocyanide
solution (with 0.1 M potassium nitrate as a background electrolyte) is switched from 500
mV (where no electrochemical reactions occur) to 0 mV, where reduction of ferrocyanide
takes place. This is done in an unstirred solution and the current is given by the Cottrell’s
equation [Bard, 2001]
⎟⎟⎠
⎞⎜⎜⎝
⎛+= erDt
AnFDCti 4)(
)( 2/1π (1)
where, where re is WE disc radius, A (cm2) the active surface, 1mM concentration C
(mol/cm3) of potassium ferricyanide with diffusion coefficient D (D = 7.3×10⁻⁶ cm2/s [2]).
Thus, the slope of a linear fit to the current versus inverse square root of time plot also
122
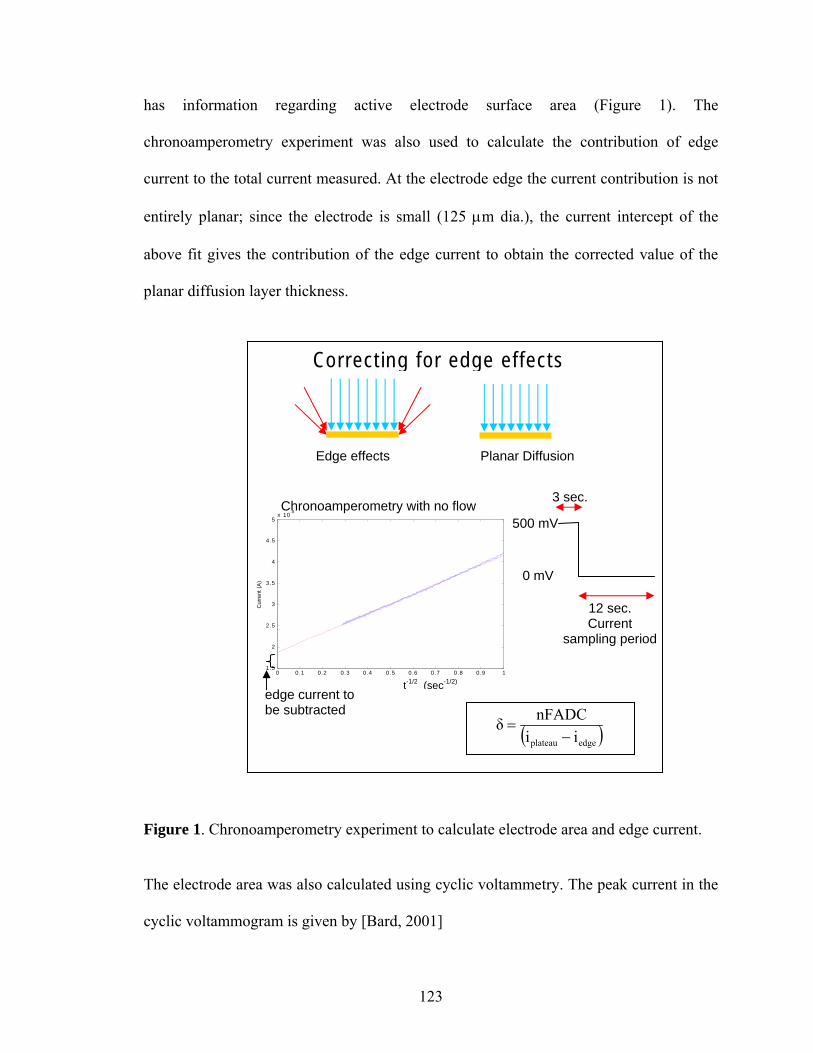
has information regarding active electrode surface area (Figure 1). The
chronoamperometry experiment was also used to calculate the contribution of edge
current to the total current measured. At the electrode edge the current contribution is not
entirely planar; since the electrode is small (125 μm dia.), the current intercept of the
above fit gives the contribution of the edge current to obtain the corrected value of the
planar diffusion layer thickness.
Planar Diffusion Edge effects
0 0.1 0.2 0.3 0.4 0.5 0.6 0.7 0.8 0.9 11.5
2
2.5
3
3.5
4
4.5
5x 10⁻⁸
Cur
rent
(A)
t-1/2 (sec-1/2)
edge current to be subtracted
Chronoamperometry with no flow
0 mV
500 mV
12 sec. Current
sampling period
3 sec.
Correcting for edge effects
( )edgeplateau iinFADCδ
−=
Figure 1. Chronoamperometry experiment to calculate electrode area and edge current.
The electrode area was also calculated using cyclic voltammetry. The peak current in the
cyclic voltammogram is given by [Bard, 2001]
123
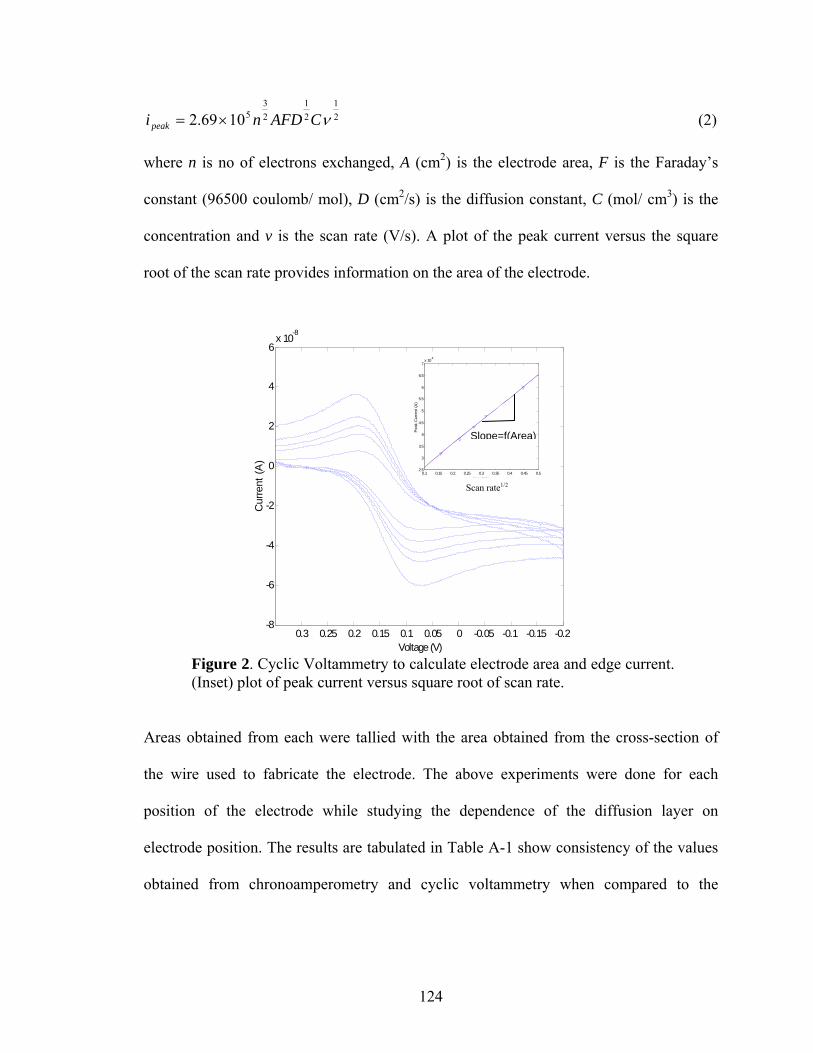
21
21
23
51069.2 νCAFDnipeak ×= (2)
where n is no of electrons exchanged, A (cm2) is the electrode area, F is the Faraday’s
constant (96500 coulomb/ mol), D (cm2/s) is the diffusion constant, C (mol/ cm3) is the
concentration and v is the scan rate (V/s). A plot of the peak current versus the square
root of the scan rate provides information on the area of the electrode.
-0.2-0.15-0.1-0.0500.050.10.150.20.250.3-8
-6
-4
-2
0
2
4
6x 10
-8
Voltage (V)
Cur
rent
(A)
0.1 0.15 0.2 0.25 0.3 0.35 0.4 0.45 0.52.5
3
3.5
4
4.5
5
5.5
6
6.5
7x 10
-8
P
eak
Cur
rent
(A)
Slope=f(Area)
Scan Rate
Scan rate1/2
Figure 2. Cyclic Voltammetry to calculate electrode area and edge current. (Inset) plot of peak current versus square root of scan rate.
Areas obtained from each were tallied with the area obtained from the cross-section of
the wire used to fabricate the electrode. The above experiments were done for each
position of the electrode while studying the dependence of the diffusion layer on
electrode position. The results are tabulated in Table A-1 show consistency of the values
obtained from chronoamperometry and cyclic voltammetry when compared to the
124
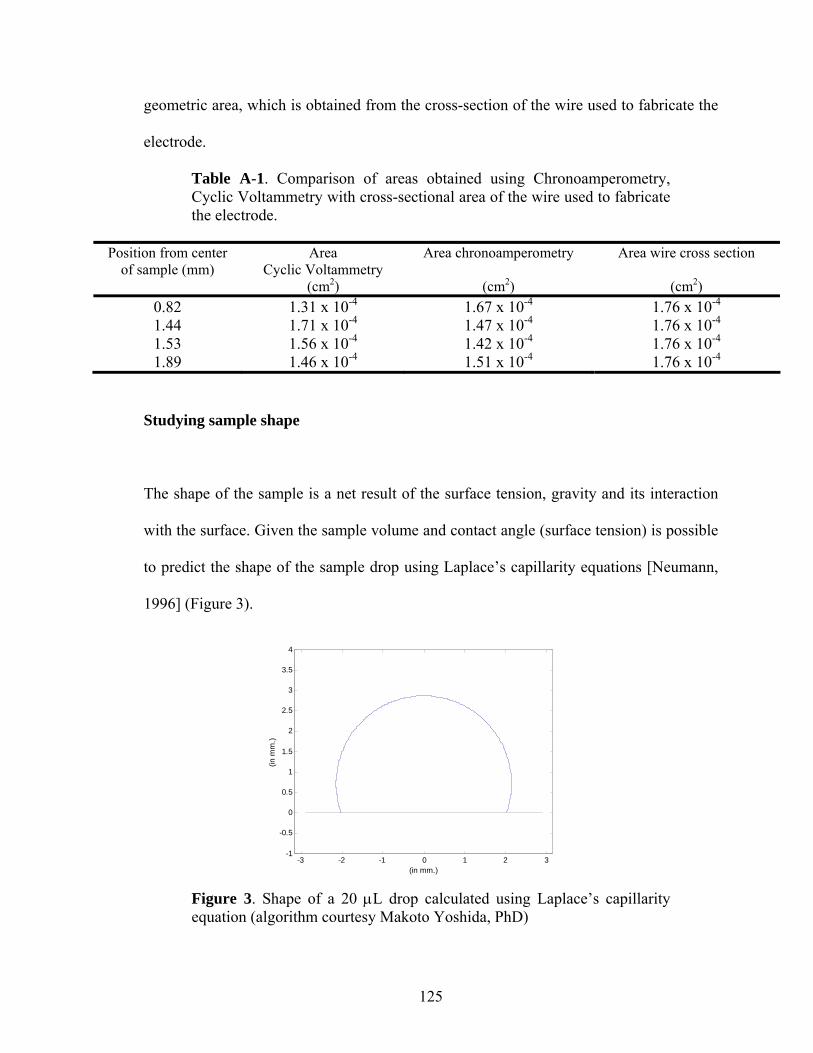
geometric area, which is obtained from the cross-section of the wire used to fabricate the
electrode.
Table A-1. Comparison of areas obtained using Chronoamperometry, Cyclic Voltammetry with cross-sectional area of the wire used to fabricate the electrode.
Position from center of sample (mm)
Area Area chronoamperometry Area wire cross section Cyclic Voltammetry
(cm2) (cm2) (cm2) 1.31 x 10⁻⁴ 1.67 x 10⁻⁴ 1.76 x 10⁻⁴ 0.82 1.71 x 10⁻⁴ 1.47 x 10⁻⁴ 1.76 x 10⁻⁴ 1.44 1.56 x 10⁻⁴ 1.42 x 10⁻⁴ 1.76 x 10⁻⁴ 1.53 1.46 x 10⁻⁴ 1.51 x 10⁻⁴ 1.76 x 10⁻⁴ 1.89
Studying sample shape
The shape of the sample is a net result of the surface tension, gravity and its interaction
with the surface. Given the sample volume and contact angle (surface tension) is possible
to predict the shape of the sample drop using Laplace’s capillarity equations [Neumann,
1996] (Figure 3).
-3 -2 -1 0 1 2 3-1
-0.5
0
0.5
1
1.5
2
2.5
3
3.5
4
(in mm.)
(in m
m.)
Figure 3. Shape of a 20 μL drop calculated using Laplace’s capillarity equation (algorithm courtesy Makoto Yoshida, PhD)
125
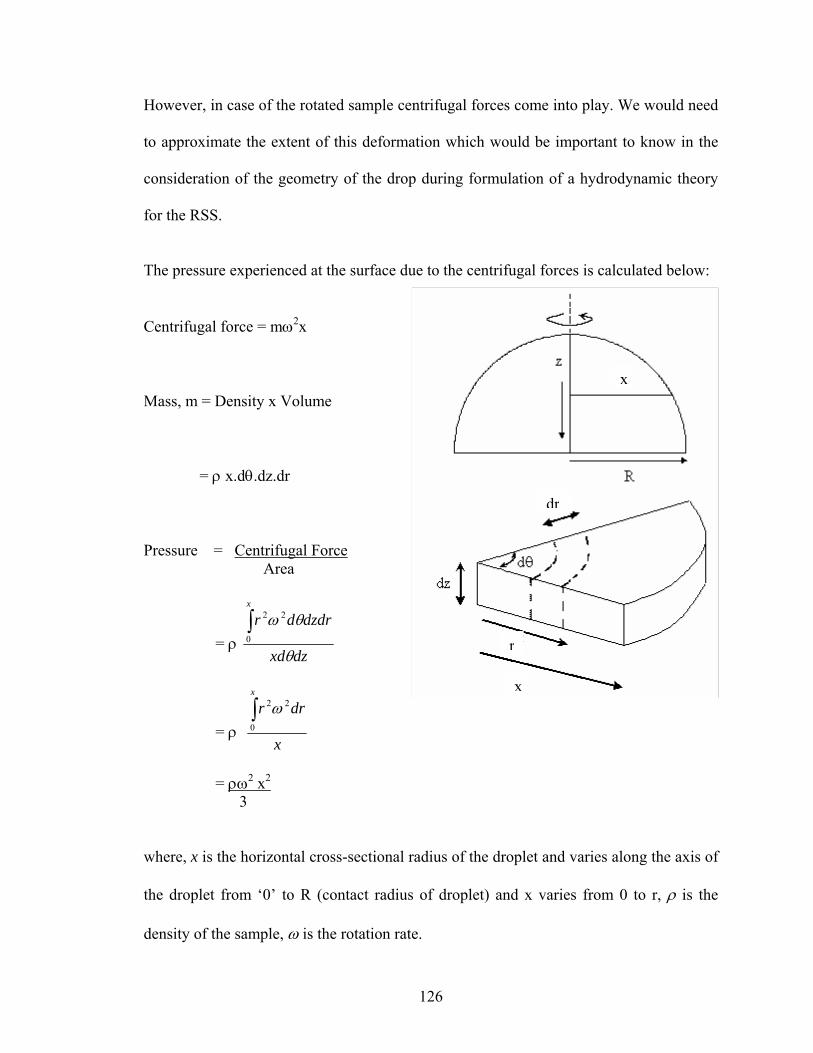
However, in case of the rotated sample centrifugal forces come into play. We would need
to approximate the extent of this deformation which would be important to know in the
consideration of the geometry of the drop during formulation of a hydrodynamic theory
for the RSS.
The pressure experienced at the surface due to the centrifugal forces is calculated below:
dr
x
x
r
Centrifugal force = mω2x
Mass, m = Density x Volume
= ρ x.dθ.dz.dr
Pressure = Centrifugal Force Area
dzxd
dzdrdrx
θ
θω∫0
22
= ρ
x
drrx
∫0
22ω = ρ
= ρω2 x2 3
where, x is the horizontal cross-sectional radius of the droplet and varies along the axis of
the droplet from ‘0’ to R (contact radius of droplet) and x varies from 0 to r, ρ is the
density of the sample, ω is the rotation rate.
126

Hence, accounting for centrifugal forces the Laplace’s capillarity equations [Neumann,
1996] can be written for a rotating drop as follows:
xsin
3xczb2
dsd 32
' φ−
γρω
++=φ (3)
φ= cosdsdx (4)
φ= sindsdz (5)
Graphical explanation of the terms in the above equation is given in figure 4
Figure 4. Definition of the coordinate system for fluid interface. At a point (ri,zi), the turning angle is φ. The arc length, s, is measured along the drop. R1 and R2 are the two principal radii of curvature; R1 turns in the plane of the paper, and R2 rotates in the plane perpendicular to the plane of the paper.
127

Equation (3) is obtained by including the pressure caused due to the centrifugal force to
the total pressure experienced at the interface.
With equations 3, 4 and 5 it would have been possible to estimate theoretically the shape
of the sample drop during rotation. However, the curvature b’ is a function of the rotation
and is unknown. This may be possible to evaluate by parameter estimation; but is a non-
trivial task.
Hence, we studied the images of rotated and stationary drops to find the deformation of
the drop during rotation. Subtraction between the images showed the differences between
the stationary and rotated drops. It revealed that during rotation there is lateral widening
of the drop (due to centrifugal forces) and dorsal flattening (effect of constant density
being maintained). This change in shape (Figure 5) is however minimal and hemi-
spherical geometry can be assumed for formulation of the theory
Figure 5. The change in sample drop shape during rotation is summarized by an overlay of the rotated drop (red) on the stationary drop; changes in shape are indicated by arrows
128
Appendix B
Lead Toxicity
Background
Early warnings of poisonous properties of Lead (Pb) extend as far as the second century
B.C. [Waldron, 1973]. The early victims of Pb were mainly Pb workers and wine
drinkers. Lead’s sweet flavor made it useful in wine-making. Lead-sweetened wine
contained as much as 20 mg of lead per liter and was an important drink of upper class
Romans. It is speculated that the synchronous decrease in fertility and increase in
psychosis among the Roman aristocracy implicated Pb poisoning in the fall of Rome
[Gilfillan, 1965]. It has been found that noted composer Ludwig Van Beethoven died of
Pb poisoning [CNN, 2000]. Recent analyses of Beethoven’s hair showed high amounts of
Pb, almost 100 times more than those found in people today. Beethoven’s health
problems such as chronic abdominal pain, gout and kidney stones are now being traced to
the toxic effect of Pb exposure.
Exposure to environmental Pb is a risk even as of today. Exposure occurs from breathing
air, drinking water, eating foods and swallowing or touching dust/dirt that contains Pb.
With the phasing out of Pb in gasoline (early 1970s), Pb in paints, and in soils and dust
have become the principal sources of exposure in the United States. Both children and
adults are susceptible to the health effects of Pb exposure. However, the damage is more
129

severe in case of children because of the developmental effects of Pb toxicity (even with
low but chronic Pb exposure). This is more serious of a problem in inner-city
neighborhoods due to the presence of Pb based paints.
The incomplete development of the blood-brain barrier in fetuses and neonates increases
the risk of Pb entry into the developing nervous system, which can result in prolonged or
permanent neurobehavioral disorders [American Academy of Pediatrics, 1993]. In
addition, children (infants and toddlers) are also likely to come into contact with lead-
contaminated soil/dust on carpets and floors. In addition absorption of Pb is considered
five to ten times greater in infants and young children than in adults [Alexander et al.,
1974, James et al., 1985]. Children are more sensitive to elevated Pb levels because their
brain, nervous systems and organ systems are still developing. Other than developmental
effects unique to children, the health effects experienced from adult exposures are similar
to those experienced by children, although the thresholds are generally higher.
Pb in the body
The absorption and biologic fate of Pb once it enters the human body depend on a variety
of factors. Children and pregnant women for example can absorb up to 70% of ingested
Pb, whereas adults typically ingest 20%. Most of the Pb absorbed in the body is excreted
either by the kidney (urine) or through biliary clearance (feces). Adults retain only about
1% of absorbed Pb, but children tend to retain more. Absorbed Pb that is not excreted is
130

exchanged primarily among three compartments: blood, soft tissue and mineralizing
tissues.
Pb in Bones and Teeth
Most of the Pb retained in the body is deposited in bones. Bones and teeth of adults
contain about 94% of the total Pb burden; this is about 73 % in children [Barry 1975]. Pb
is however not uniformly distributed and tends to accumulate in bone regions undergoing
active calcification at the time of exposure [Auf der Heide et al., 1992].
The biokinetics of Pb, the way it is taken up, distributed and stored throughout the body,
and its dynamic interchange between compartments of the body help explain why past
and current elevated exposures can lead to adverse health effects. An acute, high
exposure to Pb can lead to high short-term BLL (BLL - Blood Lead Level) and cause
symptoms of Pb poisoning; yet symptoms could appear in the absence of significant
current exposure because of past accumulation of Pb.
Pb in Blood
Blood carries only a fraction of the total Pb in the body; it serves as the initial recipient of
absorbed Pb and distributes it throughout the body. The half-life of Pb in blood is
estimated to be about 28 days [Griffin et al., 1975]. About 99% of Pb in blood is
associated with red blood cells with the remaining 1% residing in blood plasma [DeSilva,
1981]. However, Pb in blood (BLL) is an important measure of exposure to Pb.
131
Pb in Soft Tissue
Blood distributes Pb to various organs and tissues. Liver, lungs and kidneys have the
highest soft-tissue Pb concentrations immediately after exposure [Gerhardsson et al.,
1995]. Children retain more Pb in soft tissues than adults; selective accumulation of Pb in
the brain may occur in the hippocampus [Adrinel et al., 2004].
Physiological Effects of Pb
Pb performs no physiological function in the human body and ideally should not be
present in the body at all. Pb toxicity can potentially affect every organ system. On a
molecular level, proposed mechanisms for toxicity include biochemical processes; for e,g.
the ability of Pb to mimic actions of Calcium (affecting Ca related or dependent
processes) [Adrinel et al., 2004] and also complexation with proteins. The health effects
of Pb exposure are discussed below.
Hematologic effects
Pb inhibits the body’s ability to make hemoglobin by interfering with several enzymatic
steps in the heme pathway. Specifically Pb decreases heme biosynthesis by inhibiting δ-
aminolevulinic acid dehydratase (ALA-D) and ferrochelatase activity. Ferrochelatase,
which catalyzes the insertion of iron into protoporphyrin IX is quite sensitive to Pb
[Campagna et al., 1999]. A decrease in the activity of this enzyme results in the increase
of the substrate erythrocyte protoporphyrin (EP) in the blood cells. An increase in blood
and plasma δ-aminolevulinic acid and free EPs are associated with Pb exposure [EPA
132
1986a]. The EPA estimates that with BLLs at about 50 μg/dL (40 μg/dL in the case of
children), decrease in hemoglobin manifests. Acute Pb exposure also leads to hemolytic
anemia. In chronic exposure, Pb induces anemia by interfering with heme biosynthesis
and reducing blood cell survival. Pb exposure causes disturbances in heme metabolism
(Sakai et al., 2000). The heme synthesis pathway is involved with many other processes
in the body including neural, renal, endocrine and hepatic pathways.
Neurotoxic effects
Beethoven’s neurological illnesses before his death are now being traced to high Pb
levels found in his hair [CNN, 2000]. High Pb levels lead to elevated levels of δ-
aminolevulinic acid (ALA), which leads to several neurotoxic effects (Campagna et al.,
1999). Increased ALA levels cause to disturb the GABAergic system. Being the most
sensitive target of Pb exposure, children are most vulnerable to the neurologic effects of
Pb toxicity because their brains and nervous systems are still developing and the blood-
brain barrier is incomplete. In children acute exposure may produce encephalopathy and
its attendant signs (hyperirritability, ataxia, convulsions, stupor, coma or death). BLL of
about 70-80 μg/dL would indicate a serious risk. Children also suffer other neurologic
effects at much lower blood Pb levels such as a decrement in intelligence quotient (IQ).
There is also a probability of hearing impairment in children with increasing BLL and the
disruption of balance and impairment of peripheral nerve function; these effects may
begin as low as 10 μg/dL. Child neurologic effects may persist in adulthood, although
thresholds are much higher (BLL for Pb encephalopathy is approximately 460 μg/dL).
133
Renal effects
Kidneys are the primary exit route for Pb. Acute, high dose of Pb induced impairment of
proximal tubular function manifests in aminoaciduria, glycosuria and pyperphosphaturia.
These effects are reversible, however, continued repetitive exposure can lead to toxic
stress on the kidney, which if not relieved can lead to irreversible lead nephropathy. This
occurs at BLL of about 60 μg/dL; serum creatinine and creatinine clearance are used as
biomarkers of for damage from Pb. Since renal failure can contribute to the severity of
hypertension, there exits a correlation with Pb exposure. Pb exposure is also believed to
contribute greatly to the onset of ‘saturnine gout’, which may develop as a result of lead-
induced hyperuricemia due to decreased renal excretion of uric acid. It is believed that
renal disease is more frequent and more severe when associated with saturnine gout than
with primary gout [Batuman et al., 1981].
Endocrine effects
Studies have shown that Pb impedes vitamin D conversion into its hormonal form, 1,25-
dihydroxyvitamin D, which is largely responsible for the maintenance of extra cellular
calcium homeostasis. Diminished 1,25-dihydroxyvitamin D in turn may impair cell
growth, maturation, and tooth and bone development. This occurs with children having
BLL 60 μg/dL and above. In adults this poses a risk of lower bone densities and
osteoporosis. A weak negative correlation between duration of Pb exposure and thyroxin
and free thyroxin levels has been observed [ATSDR, 1999] suggesting adverse effect on
the thyroid with chronic Pb exposure.
134
Cardiovascular (Hypertension) effects
Low exposures (BLL~30 μg/dL) have shown only a low association of Pb exposure with
hypertension; however, greater exposures increase the risk for hypertensive heart disease
and cerebrovascular disease. Studies have reported an increase in blood pressure with an
increase in Pb exposure [Victery et al., 1988]. It is estimated that on a population mean,
with each doubling of blood Pb can account for a 1 to 2% variance in blood pressure.
Reproductive effects
Studies have shown that increased Pb exposure leads to abnormal sperm counts
[Alexander et al., 1996]; effects are manifest at BLL of 40 μg/dL. Long term exposure
has also shown to diminish sperm counts and total sperm motility. With pregnant women,
studies have indicated increased abortions, miscarriages and stillbirths [Nordstrom et al.,
1979].
Lead exposure
Most human exposure to Pb occurs through ingestion or inhalation. Pb based paints are a
major source of exposure for children. As Pb paint deteriorates it enters the body through
normal hand-to-mouth activity and inhalation [Sayre et al, 1974]. Pb exposure through
the combustion of gasoline has been reduced; however, industrial discharge does
contribute significantly to Pb exposure through inhalation. Atmospheric pollution
contributed to Pb in soil and water. Workers in Pb smelting, refining and manufacturing
industries are at highest risk for prolonged high levels of exposure. Pb occurs in water
135
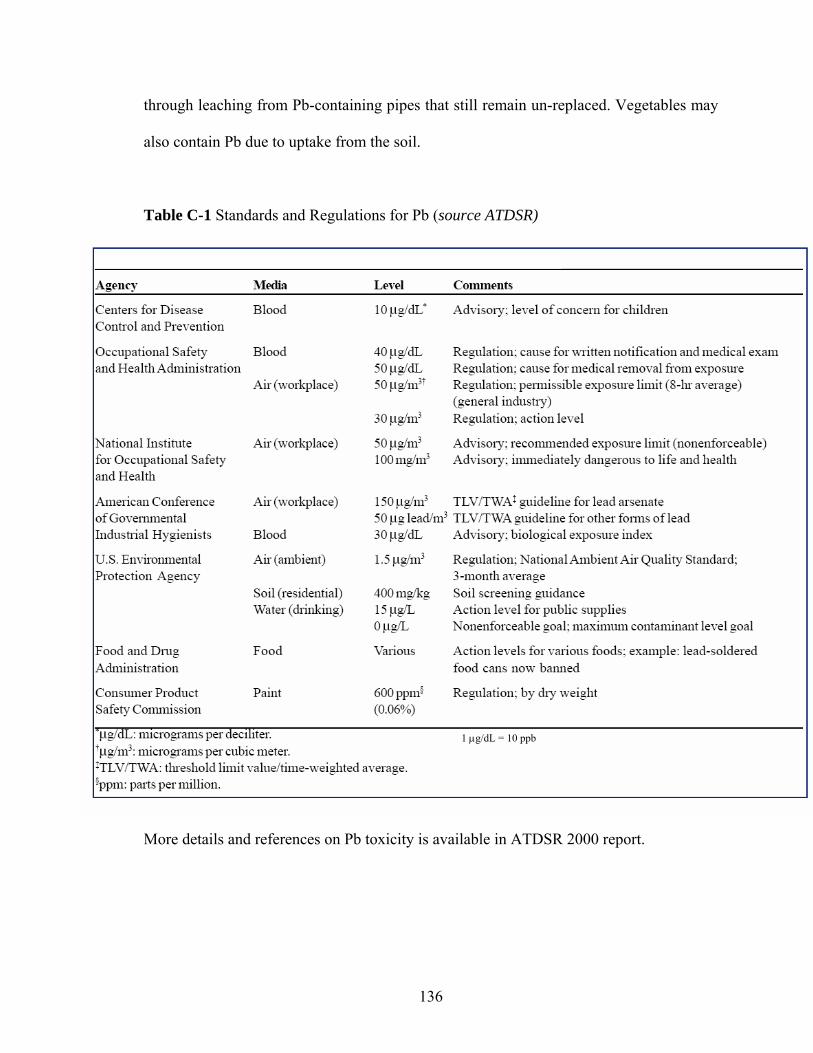
through leaching from Pb-containing pipes that still remain un-replaced. Vegetables may
also contain Pb due to uptake from the soil.
Table C-1 Standards and Regulations for Pb (source ATDSR)
1 μg/dL = 10 ppb
More details and references on Pb toxicity is available in ATDSR 2000 report.
136
Appendix C
Micro-pH stat for enzyme activity measurements
Background
A pH-stat is an instrument that is meant to maintain a pre-set pH in a physicochemical,
biochemical, or live biological preparation, despite ongoing reactions or metabolic
activity that tend to shift the pH away from the pre-set value. This is achieved in
conventional pH-stats by continuously monitoring the pH in the specimen while adding a
strong acid or base solution at a rate controlled by a feedback system so as to best
maintain the pre-set pH at all times.
There is a wide range of experimental problems in the area of biological sciences and
biotechnology where pH-stating is a required methodology, to obtain basic understanding
of the natural phenomena and processes involved, or to help control man-made processes
in an optimal fashion.
Conventionally available pH-stats can handle only relatively large sample volumes,
typically in the order of milliliters. This is because they operate on the principle of
mechanical (volumetric) delivery of finite volumes of reagents into the sample. The
process of pH-stating thus causes continuous sample dilution. This complicates
quantitative evaluation of the data. Switching between reagents of different
137
concentrations may be necessary to adapt to processes whose rates vary significantly in
time.
Introduction to pH-stating
One experimental methodology that has found important applications in an unusually
wide range of biological settings is the pH-stat technique. The first experiment involving
a crude pH-stating method was reported in 1923 by Knaffl-Lenz who measured the rate at
which esterase splits an ester into acid and alcohol by determining the quantity of base
required to keep the pH of the enzyme/substrate preparation constant. His manual
technique involved the observation of pH, and recording times and base quantities added,
till the pH became relatively constant around the desired value.
To date different instrumental embodiments of the pH-stat principle have been realized,
such as the pH-stat workstation made by Radiometer Analytical based on its TitraLab
series, the pH-stat titrator of the Titrino series by Metrohm, or the AUT-501 workstation
made by Analyticon. These instruments all involve the controlled volumetric addition of
an acid or base to the sample whose pH is to be maintained at a preset level. This addition
occurs by mechanical delivery of either reagent at a rate that ensures that the pH varies as
little as possible around the desired value. Continuous homogenization of the sample is
obviously a requirement. There is also a need for a pH sensing scheme, to feed the actual
pH back to the control unit that is to determine the optimum delivery rate at any instant
based on the actual (and recent) deviations of the observed pH from the set value.
138
Obviously, for pH-stating to make sense, some type of a reaction has to go on in the
sample whose pH otherwise would not tend to vary. The rate of this reaction is equivalent
to the acid or base delivery rate that fully compensates for the effects of the reaction on
sample pH. One aim of pH-stating is precisely the determination of such reaction rates,
and their variations over time. An example is the monitoring of the activity of an enzyme
whose operation would shift the pH up or down if no pH-stating took place [Taylor et al.,
1985]. Another possible aim is to maintain some type of optimal pH for the given
reaction. This is often needed when enzymatic reactions are studied, so for such systems
a pH-stat simultaneously achieves two separate aims. There are experimental settings,
however, where only one, or the other, effect of pH-stating is needed and used. In some
bioreactors, or in the culture of certain microorganisms, the only aim is to maintain the
right pH so as to achieve the highest efficiency for the reaction or culture [Kobayashi et
al., 2000], and precise monitoring of an overall reaction rate is not needed. An example
for the other aim is when pH-dependent operation of an enzyme system is to be assessed,
where pH-values other than optimal are maintained so that the reaction rate at those pH
levels can be measured [Yang et al., 1998].
In biology, pH-stating can be used to monitor any biochemical reaction that is
accompanied by the production or consumption of protons (more precisely, hydronium
ions) or hydroxyl ions. However, a pH-stat can be useful also when carbon dioxide, or
bicarbonate ions are affected [Ficara et al., 2003] since they participate in equilibria that
determine the pH of the sample.
139
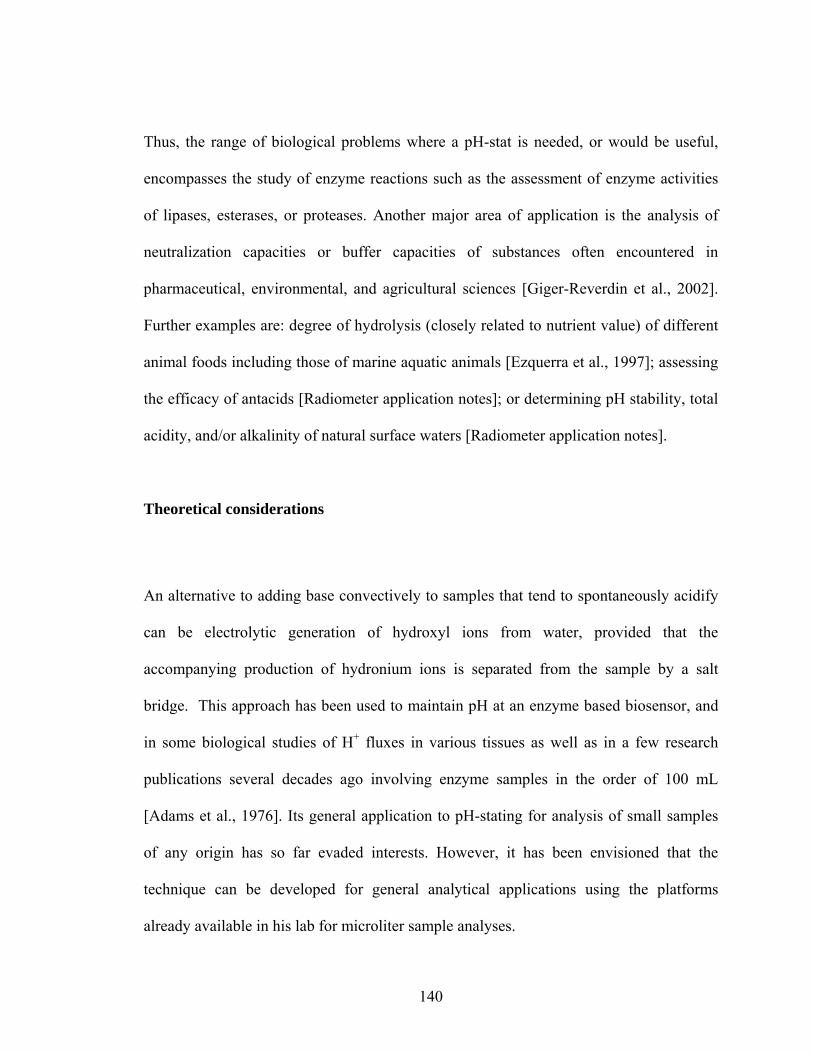
Thus, the range of biological problems where a pH-stat is needed, or would be useful,
encompasses the study of enzyme reactions such as the assessment of enzyme activities
of lipases, esterases, or proteases. Another major area of application is the analysis of
neutralization capacities or buffer capacities of substances often encountered in
pharmaceutical, environmental, and agricultural sciences [Giger-Reverdin et al., 2002].
Further examples are: degree of hydrolysis (closely related to nutrient value) of different
animal foods including those of marine aquatic animals [Ezquerra et al., 1997]; assessing
the efficacy of antacids [Radiometer application notes]; or determining pH stability, total
acidity, and/or alkalinity of natural surface waters [Radiometer application notes].
Theoretical considerations
An alternative to adding base convectively to samples that tend to spontaneously acidify
can be electrolytic generation of hydroxyl ions from water, provided that the
accompanying production of hydronium ions is separated from the sample by a salt
bridge. This approach has been used to maintain pH at an enzyme based biosensor, and
in some biological studies of H+ fluxes in various tissues as well as in a few research
publications several decades ago involving enzyme samples in the order of 100 mL
[Adams et al., 1976]. Its general application to pH-stating for analysis of small samples
of any origin has so far evaded interests. However, it has been envisioned that the
technique can be developed for general analytical applications using the platforms
already available in his lab for microliter sample analyses.
140
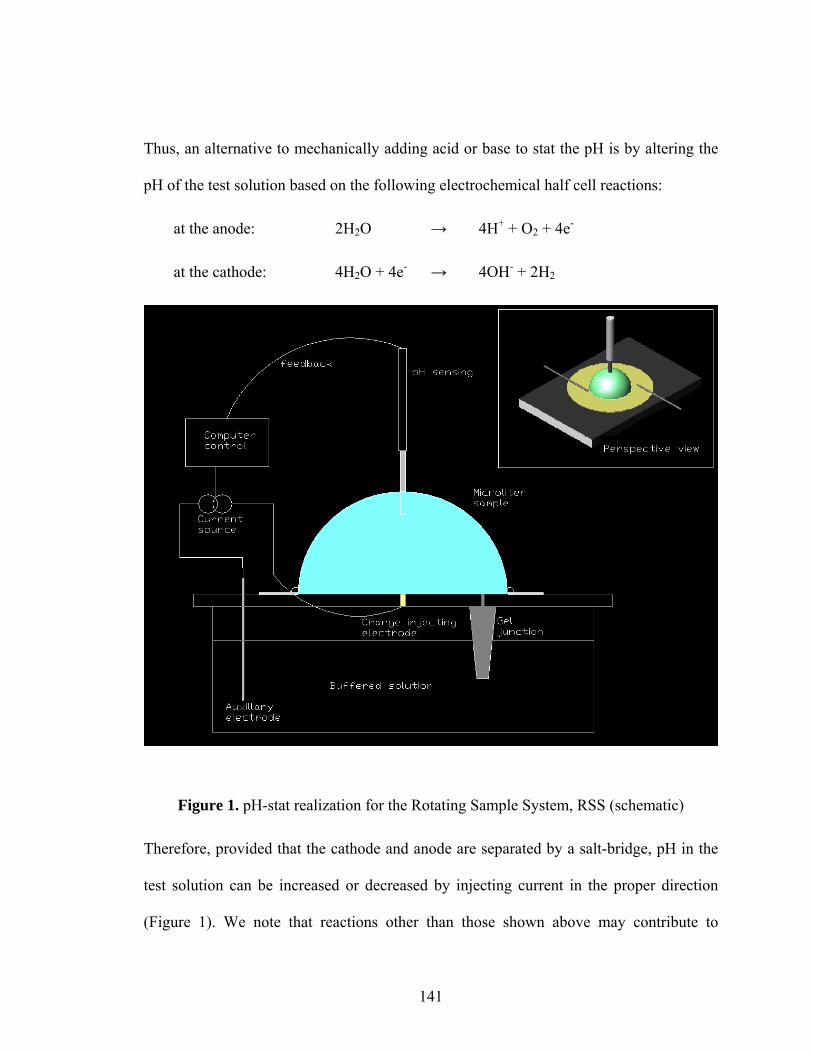
Thus, an alternative to mechanically adding acid or base to stat the pH is by altering the
pH of the test solution based on the following electrochemical half cell reactions:
at the anode: 2H2O → 4H+ + O2 + 4e-
at the cathode: 4H2O + 4e- → 4OH- + 2H2
Figure 1. pH-stat realization for the Rotating Sample System, RSS (schematic)
Therefore, provided that the cathode and anode are separated by a salt-bridge, pH in the
test solution can be increased or decreased by injecting current in the proper direction
(Figure 1). We note that reactions other than those shown above may contribute to
141
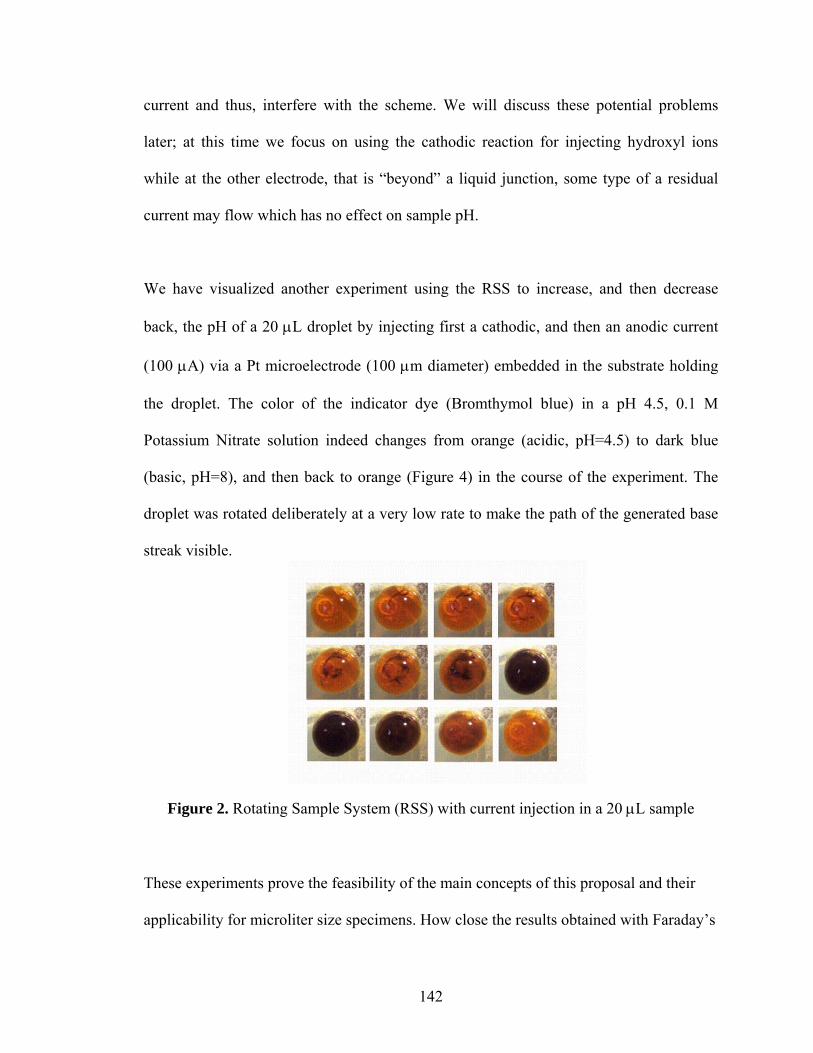
current and thus, interfere with the scheme. We will discuss these potential problems
later; at this time we focus on using the cathodic reaction for injecting hydroxyl ions
while at the other electrode, that is “beyond” a liquid junction, some type of a residual
current may flow which has no effect on sample pH.
We have visualized another experiment using the RSS to increase, and then decrease
back, the pH of a 20 μL droplet by injecting first a cathodic, and then an anodic current
(100 μA) via a Pt microelectrode (100 μm diameter) embedded in the substrate holding
the droplet. The color of the indicator dye (Bromthymol blue) in a pH 4.5, 0.1 M
Potassium Nitrate solution indeed changes from orange (acidic, pH=4.5) to dark blue
(basic, pH=8), and then back to orange (Figure 4) in the course of the experiment. The
droplet was rotated deliberately at a very low rate to make the path of the generated base
streak visible.
Figure 2. Rotating Sample System (RSS) with current injection in a 20 μL sample
These experiments prove the feasibility of the main concepts of this proposal and their
applicability for microliter size specimens. How close the results obtained with Faraday’s
142
law from current can be to the true base delivery will be tested in this project. In case of
little non-Faradaic current, a calibration-free system may become a reality.
Sensor design for pH stating
pH sensing is done potentiometrically, i.e. change in H+ concentration causes a change in
potential at the pH sensitive electrode, which is measured against a constant potential
electrode (the two constitute a pH sensing system). The pH stat proposed for microliter
samples employs coulometric addition of acid/base for enzyme activity measurements.
Due to finite resistance of the sample, the injection of current causes a voltage drop in the
sample known as the ‘iR’ drop. This voltage drop results in an artificial change in the pH
meter reading resulting in an error in pH measurement. A change in sensor design helped
mitigate this problem.
The original RSS setup (Figure 1-1, Chapter 1) had a single gel junction that connects the
compartment housing the working electrode and the compartment housing the counter
and reference electrodes. The micro pH electrode requires a reference electrode of its
own, which was originally placed in the same compartment as the counter electrode.
Current flow between the working and the counter electrodes causes an ‘iR’ drop in the
junction; this causes a fictitious change in the pH reading not indicative of a
corresponding change in sample pH. To overcome this ‘iR’ drop problem, we proposed
to use a system with two junctions, each connecting the sample with two separate
compartments housing the reference and the working electrode. We thus separated the
current path from the reference path (i.e. reference electrode for the pH electrode). When
143
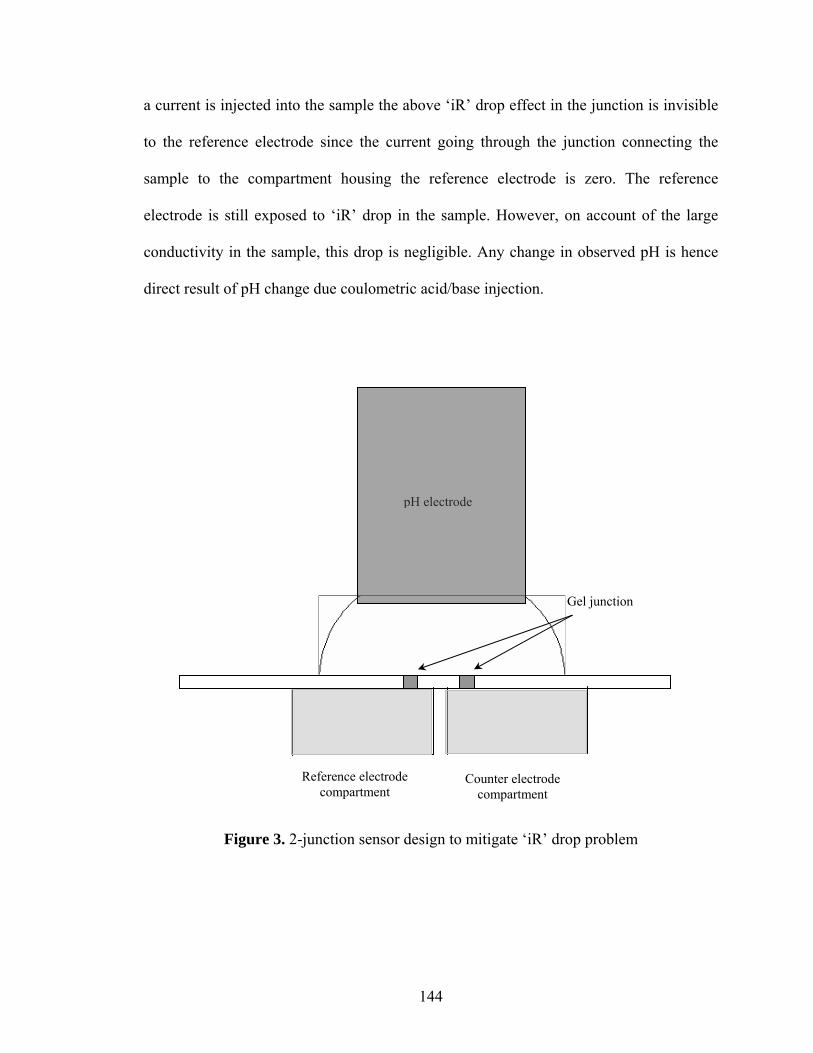
a current is injected into the sample the above ‘iR’ drop effect in the junction is invisible
to the reference electrode since the current going through the junction connecting the
sample to the compartment housing the reference electrode is zero. The reference
electrode is still exposed to ‘iR’ drop in the sample. However, on account of the large
conductivity in the sample, this drop is negligible. Any change in observed pH is hence
direct result of pH change due coulometric acid/base injection.
pH electrode
Reference electrode compartment
Counter electrode compartment
Gel junction
Figure 3. 2-junction sensor design to mitigate ‘iR’ drop problem
144
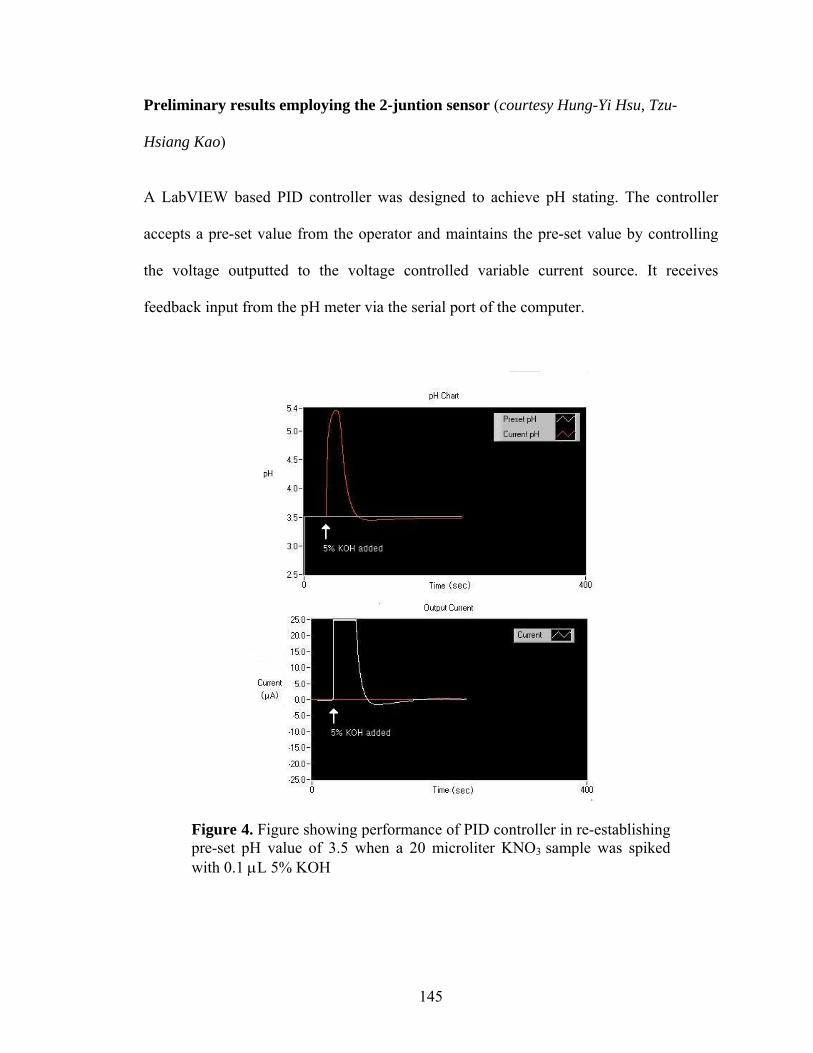
Preliminary results employing the 2-juntion sensor (courtesy Hung-Yi Hsu, Tzu-
Hsiang Kao)
A LabVIEW based PID controller was designed to achieve pH stating. The controller
accepts a pre-set value from the operator and maintains the pre-set value by controlling
the voltage outputted to the voltage controlled variable current source. It receives
feedback input from the pH meter via the serial port of the computer.
Figure 4. Figure showing performance of PID controller in re-establishing pre-set pH value of 3.5 when a 20 microliter KNO3 sample was spiked with 0.1 μL 5% KOH
145

The above figure shows how the controller helps correct the change in pH caused by
addition of 0.1 μL of 5% NaOH.
Hence, it has been shown that pH stating in microliter samples by coulometric injection
of acid/base is feasible.
146
BIBLIOGRAPHY
Adams, R. E., Betso, S. R. , Carr, P. W. : Electrochemical pH-stat and controlled current
coulometric acid-base analyzer. Anal. Chem., 1976, 48, 1989-1996.
Adrinel, V., Sandra, P. O., Lead (Pb(+2)) impairs long-term memory and blocks
learning-induced increases in hippocampal protein kinase C activity, Toxicology and
Applied Pharamacology, 2004, 200, 27-39.
Alexander, F. W., Clayton B. E., Delves, H. T., Mineral and trace-metal balances in
children receiving normal and synthetic diets, Quarterly J. Med, 1974, 43, 89-111.
Alexander, H., Checkoway, H., van Netten, C., Semen quality of men employed at a lead
smelter, Occup Environ Med, 1996, 53, 411-416.
American Academy of Pediatrics, Lead Poisoning: from screening to primary prevention,
Pediatrics, 1993, 92, 176-183.
Angerstein-Kozlowska, H., “Comprehensive Treatise of Electrochemistry”, Yeager, E.,
O’M Bocris, J., Conway, B. E., Sarangapani, S. (Eds.)Vol 9 , 1984, Plenum Press, New
York.
Analytical Methods Committee, Recommendations for the Definition, Estimation and
Use of the Detection Limit, Analyst, 1987, 112, 199-204.
Arnebrant, T., Wahlgren, M. C., Protein-surfactant interactions at solid surfaces, ACS
Symposium Series, 602(Proteins at Interfaces 2), 1995, 112-128.
147
Aschaffenburg , R., Ogston , A. G., Surface activity and proteins of milk, J. Dairy Res.,
1946, 14, 316-329.
Auf der Heide, A. C., Wittmers, L. E., Selected aspects of the spatial distribution of lead
in bone, Neurotoxicology, 1992, 13, 809-820.
Banks, C., Kruusma, J., Hyde, M., Sonoelectroanalysis: investigation of bismuth-film-
modified glassy carbon electrodes, Anal. Bioanal. Chem., 2004, 379, 277-282.
Baralkiewicz, D., Niedzielski, P., Siepak, J., Atomic absorption spectrometry as a method
for trace assays of metals in the environment, Ekologia i Technika, 1996, 4, 27-31.
Bard, A. J., Faulkner, L. R., “Electrochemical Methods”, 2001, John Wiley, New York,
New York.
Barry, P., A comparison of concentrations of lead in tissue, British J. Ind. Med, 1975, 32,
199-139.
Bartlett, P. N., Denualt, G., Sousa, M. F. B., A study of the preconcentration and
stripping voltammetry of Pb(II) at carbon electrodes, Analyst, 2000, 125, 1135-1138.
Batuman, V., Maesaka, J. K., Haddad, B., The role of lead in gout nephropathy, NEJM,
1981, 304, 520-523.
Biswas, S. C., Chattoraj, D. K., Kinetics of desorption of preadsorbed proteins from the
surface of silica and charcoal by various desorbing reagents,
http://preprint.chemweb.com/chemeng/0206003, 2005.
148
Brabec, V.; Schindlerova, I., Electrochemical behavior of proteins at graphite electrodes.
Part III. The effect of protein adsorption, Bioelectrochemistry and Bioenergetics, 1981, 8,
451-458.
Bradshaw, R., Peters, T., The amino acid sequence of peptide (1-24) of rat and human
serum albumins, J. Biol. Chem., 1969, 244, 5582-5589.
Brash. J. L., Horbett, T. A., Proteins at interface: An overview, ACS Symposium Series,
602(Proteins at Interfaces 2), 1995, 1-25.
Brihaye, C., Gillian, G., Duyckaerts, G., Determination of traces of metals by anodic
stripping voltammetry at a rotating glassy carbon ring-disc electrode. Part 3. Evaluation
of linear anodic stripping voltammetry with ring collection for the determination of
cadmium, lead and copper in pure water and high-purity sodium chloride, and of
cadmium, lead, copper, antimony and bismuth in sea water, Anal. Chim. Acta, 1983, 148,
51-57.
Bryant, H. L., A potassium ferricyanide method for determination of reducing substances
present in blood, J. Lab. and Clin. Med., 1929, 14, 1082-1086.
Burgess, D. J., Yoon, J. K., Sahin, O., A Novel Method of Determination of Protein
Stability, J. Parenteral Sci. Tech., 1992, 46, 150-155.
Campagna, D., Huel, G., Girard, F., Sahuquillo, J., Blot, P., Environmental lead exposure
and activity of d-aminolevulinic acid dehydratase (ALA-D) in maternal and cord blood,
Toxicology, 1999, 134, 143-152.
149
Carter, D. C., Ho, J. X., Structure of Serum Albumin, Adv. Protein Chem., 1994, 45, 153-
203.
Cha, C. S., Chen, J., Liu, P. F., Improvement of the adhesion of a Nafion modifying layer
on electrodes, J. of Electroanal. Chem., 1993, 345, 463-467.
Chang, H., Wu, C., Ding, S., Lin, I., Shun, I., Measurement of diffusion and partition
coefficients of ferrocyanide in protein-immobilized membranes, Anal. Chim. Acta, 2005,
532, 209-214.
Clark, A. J., Whitehead, L. A., Novel resonant-frequency sensor to detect the kinetics of
protein adsorption, Rev. Sci. Instrum., 2002, 73, 4339-4346.
CNN, 2000, http://archives.cnn.com/2000/HEALTH/10/17/beethoven.hair
Cooper, W. C., Cancer mortality patterns in the lead industry, Ann NY Acad Sci, 1976,
271, 250-259.
Cornelius, R. M., Wojciechowski, P. W., Brash, J. L., Measurement of protein adsorption
kinetics by an in situ, "real-time," solution depletion technique., J. of Colloid and
Interface Sci., 1992, 150), 121-33.
Courtney, H. S., Simpson, W. A., Beachey, E. H., Relationship of Critical Micelle
Concentrations of Bacterial Lipoteichoic Acids to Biological Activities, Infection and
Immunity, 1986, 51, 414-418.
Cserey, A., Gratzl, M., Rotating Sample System: An Equivalent of a Rotating Electrode
for Microliter Samples, Anal. Chem., 1997, 69, 3687-3692.
150
Cserey, A., “Novel Electrochemical Sensing Scheme for Cost-effective Diagnostics and
On-line Monitoring of Nitric Oxide”, 2001, Ph.D. theses, CWRU, Cleveland, Ohio.
Cserey, A., Gratzl, M., Stationary-state oxidized platinum microsensor for selective and
on-line monitoring of nitric oxide in biological preparations, Anal. Chem, 2001, 73, 3965-
3974.
DeSilva, P. E., Determination of lead in plasma and studies on its relationship to lead in
erythrocytes, Br J Ind Med, 1981, 38, 209-217.
Dow Corning, Data Sheet Triton X-100.
Duinker, J., Kramer, C., An experimental study on the speciation of dissolved Zn, Cd, Pb,
Cu in rive Rhine and North Sea water by differential pulsed stripping voltammetry,
Marine Chemistry, 1977, 5, 207-228.
Ernhart, C. B., Wolf, A. W., Kennard, M. J., Intrauterine exposure to low levels of lead:
the status of the neonate, Arch Environ Health, 1986, 41, 287-291.
Enhorning, G., Pulmonary surfactant function studied with the pulsating bubble
surfactometer (PBS) and the capillary surfactometer (CS), Comparative Biochemistry and
Physiology, Part A: Molecular & Integrative Physiology, 2001, 129A, 221-226.
Ezquerra, J. M., Garcia-Carreno, F. L., Civera, R., Haard, N. F.: pH-stat method to
predict protein digestibility in white shrimp (Penaeus vannamei), Aquaculture, 1997, 157,
251-262.
151
Fang, F., Szleifer, I., Kinetics and Thermodynamics of Protein adsorption: A Generalized
Molecular Theoretical Approach, Biophysical Journal, 2001, 80, 2568-2589.
Ficara, E., Rozzi, A.; Cortelezzi, P., Theory of pH-stat titration, Biotech. and
Bioengineering, 2003. 82, 28-37.
Fisher, L. R., Total internal reflection fluorescence spectroscopy of biomaterials
Editor(s): Davies, J., Surface Analytical Techniques for Probing Biomaterial Processes,
1996, 43-65.
Friis, E. P., Andersen, J. E. T., Madsen, L. L., Moller, P., Ulstrup, J., In situ STM and
AFM of the copper protein Pseudomonas aeruginosa azurin, J. of Electroanal. Chem.,
1997, 431, 35-38.
Gandhi, H., Modi, S., Jain, N., Bahadur, P., Mixed micelles of some metal dodecyl
sulfates and triton X-100 in aqueous media, J. of Surfactants and Detergents, 2001, 4,
359-365.
Geesey, G. G., Bryers, J. D., “Biofouling of engineered materials and systems,
Biofouling of engineered materials and systems, Editor(s): Bryers, James D.”, Biofilms II,
2000, 237-279
Geigy Pharmaceuticals, “Scientific Tables, 6th Edition”, 1962, Ben Johnson and
Company Ltd., Great Britain.
Gerhardsson, L., Endlyst, V., Lundstrom, N. G., Lead in tissues of dead lead smelter
workers, J Trace Elem Med Biol, 1995, 9, 136-143.
152
Giger-Reverdin, S., Duvaux-Ponter, C., Sauvant, D., Martin, O., Nunes do Prado, I.,
Muller, R.: Intrinsic buffering capacity of feedstuffs. Animal Feed Sci. and Tech., 2002
96, 83-102.
Gilfillan, S.C., Lead Poisoning and the Fall of Rome, Journal of Occupational Medicine,
1 (1965): 53-60.
Gonzalez, G., MacRitchie, F., Equilibrium Adsorption of Proteins, J. Colloid and
Interface Sci., 1970, 32, 55-61.
Gougerot, L, Nonfrothing of hemoglobin solutions in relation to surface properties,
Research (London), 1949, 257-261.
Goyer, R. A., Results of Lead research: prenatal exposure and neurological consequences,
Environ Health Prespect, 1996, 104, 1050-1054.
Graham, D. E., Philips, M. C., Proteins at Liquid Interfaces, J. Colloid and Interface Sci.,
1979, 70, 415-426.
Gratzl, M., Cserey, A., Shetty, G. N., unpublished results, CWRU, 2001-2003.
Griffin, T. B., Coulston, F., Wills, H., Biological and clinical effects of continuous
exposure to airborne particulate lead, Arhiv za Higijenu Rada i Toksikologijiu, 1975, 26,
191-208.
Gun'ko, V. M., Mikhailova, I. V., Zarko, V. I., Gerashchenko, I. I., Guzenko, N. V.,
Janusz, W., Leboda, R., Chibowski, S., Study of interaction of proteins with fumed silica
153

in aqueous suspensions by adsorption and photon correlation spectroscopy methods, J. of
Colloid and Interface Sci., 2003, 260, 56-69.
Guo, B., Anzai, J., Osa., T., Adsorption Behavior of Serum Albumin on Electrode
Surfaces and the Effects of Electrode Potential, Chem. Pharm. Bull., 1996, 44, 800-803.
Hansen, E. H., Wang, J., Determination of trace metal concentrations in complex
matrices, Dansk Kemi, 2002, 83, 49-52.
Ishida, K. P., Griffiths, P. R., Investigation of Polysaccharide Adsorption on Protein
Conditioning Films by Attenuated Total Reflection Infrared Spectrometry II. Thin
Copper Films, Journal of Colloid and Interface Science, 1999, 213, 513-524.
Jackson, D. R., Omanovic, S., Roscoe, S. G., Electrochemical Studies of the Adsorption
Behavior of Serum Proteins on Titanium, Langmuir, 2000, 16, 5449-5457.
Jaenicke, S., Sabarathinam, R. M., Fleet, B., Ginasingham, H., Determination of lead in
blood by hydrodynamic voltammetry in a flow-injection system with wall-jet detector,
Talanta, 1998, 45, 703-711.
James, H. M., Milburn, M. E., Blair, J. A., Effects of meals and meal times on uptake of
Lead from the gastrointestinal tract of humans, 1985, 4, 401-407.
Kashiwabara Y; Maeda H; Yamaguchi Y; Shimokawa H; Hisanaga S; Nakano H, Studies
on surface tension of amniotic fluid with special emphasis on evaluating fetal lung
maturity, Nippon Sanka Fujinka Gakkai zasshi, 1986, 38, 346-54.
154
Knaffl-Lenz, E.: Kinetics of ester splitting by liver lipase, Archiv fuer Experimentelle
Pathologie und Pharmakologie, 1923, 97, 242-61.
Kobayashi, G., Tanaka, K., Itoh, H., Tsuge, T., Sonomoto, K., Ishizaki, A.: Fermentative
production of P(3HB-co-3HV) from propionic acid by Alcaligenes eutrophus in fed-batch
culture with pH-stat continuous substrate feeding method. Biotech. Letters, 2000 22,
1067-1069.
Kragel, J.; Wustneck, R.; Husband, F.; Wilde, P. J.; Makievski, A. V.; Grigoriev, D. O.;
Li, J. B., Properties of mixed protein/surfactant adsorption layers, Colloids and Surfaces,
B: Biointerfaces, 1999, 12, 399-407.
Kruusma, J., Banks, C. E., Nei, L., Compton, R. G., Electroanalytical detection of zinc in
whole blood, Anal. Chim Acta, 2004, 510, 85-90.
Kruusma, J., Nei, L., Hardcastle, J., Compton, R. G., Lust., E., Keis, H.,
Sonoelectroanalysis: Anodic stripping voltammetric determination of Cadmium in whole
human blood, Electroanalysis, 2004, 16, 399-403.
Kruusma, J., Banks, C. E., Compton, R. G., Mercury-free sono-electroanalytical
detection of lead in human blood by use of Bismuth-film modified boron-doped
electrodes, Anal Bioanal Chem, 2004, 379, 700-706.
Langmuir, I., Waugh, D. F., Pressure-Soluble and Pressure Displaceable Components of
Monolayers of Native and Denatured Proteins, JACS, 1940, 62, 2771-2793.
155

Levich, V. J., “Physico-Chemical Hydrodynamics” 1952, Press of the Academy of
Sciences of the Soviet Union: Moscow.
Lockwood, C. E., Jay, M., Bummer, P. M., Foam fractionation of binary mixtures of
lysozyme and albumin, J. Pharm. Sciences, 2000, 89, 693-704.
Logothetidis, S., Gioti, M., Lousinian, S., Fotiadou, S., Haemocompatibility studies on
carbon-based thin films by ellipsometry, Thin Solid Films, 2005, 482, 126-132.
Lu, C. F., Nadarajah, A., Chittur, K., A Comprehensive Model of Multiprotein
Adsorption on Surfaces, J. Colloid Interf. Sci., 1994, 168, 152-161.
Lunkenheimer, K.; Wantke, K. D., Determination of the surface tension of surfactant
solutions applying the method of Lecomte du Nouy (ring tensiometer), Colloid and
Polymer Science, 1981, 259, 354-66.
Maeda, Y., Hashimoto, T., Satoh, K., Tryk, D. A., Fujishima, A., Response of conductive
diamond electrode to Pb+2/PbO2 redoc process in HNO3 aqueous solution, Hyomen
Gijutsu, 2003, 54, 64-68.
Maharaj, I. , Nairn, J. G., Campbell, J. B., Simple rapid method for the preparation of
enteric-coated microspheres, J. Pharm. Sci., 1984; 73, 39-42.
Mandal, A. B., Nair, B., Ramaswamy, D., Determination of the critical micelle
concentration of surfactants and the partition coefficient of an electrochemical probe by
using cyclic voltammetry, Langmuir, 1988, 4, 736-739.
156
Miller, B., Bruckenstein, S., Rotating Disc Electrode voltammetry using small sample
volumes, Anal Chem, 1974, 46, 2033-2035.
Moulin, A. M., O'Shea, S. J., Badley, R. A., Doyle, P., Welland, M. E., Measuring
surface-induced conformational changes in proteins, Langmuir, 1999, 15, 8776-8779.
Nadarajah, A., Lu, C. F., Chittur, K. K., Modelling the dynamics of Protein Adsorption,
ACS Symposium Series, 602(Proteins at Interfaces 2), 1995, 181-194.
Needleman, H., Lead Poisoning, Annu. Rev. Med., 2004, 55, 209-222.
Neumann, A. W., Spelt, J. K., “Applied Surface Thermodynamics”, 1996, Marcel Dekker
Inc., New York, New York.
Nordstrom, S., Beckman, L., Nordenson, I., Occupational and environmental risks in and
around a smelter in northern Sweden. V. Spontaneeous abortion among female
employees and decreased birth weight in their offspring, Hereditas, 1979, 90, 291-296.
Nylander, T., Kekicheff, P., Ninham , Barry, W., The Effect of Solution Behavior of
Insulin on Interactions between Adsorbed Layers of Insulin, J Colloid Interf. Sci., 1994,
164, 136-150.
Nylander, T., Protein-Lipid Interactions, D. Mobius, R. Miller Eds., 1998, Elsevier
Science, Amsterdam, Netherlands.
O'Connell, Kristen M. S.; Tamkun, Michael M., Targeting of voltage-gated potassium
channel isoforms to distinct cell surface microdomains, J. Cell Sci, 2005, 118, 2155-
2166.
157
Pieroni, G., Gargouri, Y., Sarda, L., Verger, R., Interactions of Lipases with Lipid
Monolayers. Facts and Questions, Advances in Colloid and Interface Science, 1990, 32,
341-378.
Poole, S., West, S. I., Walters, C. L., Protein-Protein Interactions: Their Importance in the
Foaming of Heterogeneous Protein Systems, J. Sci. Food Agric., 1984, 35, 701-711.
Poole, S., West, S. I., Fry, J. C., Lipid-tolerant Protein Foaming Systems Food
Hydrocolloids, 1986, 1, 45-55.
Poole, S., Review: The Foam- enhancing Properties of Basic Biopolymers, Int. Jour.
Food Sci. & Tech., 1989, 24, 121-137.
Prichard, E., MacKay, G. M., “Trace Analysis: A Structured Approach To Obtaining
Reliable Results”, 1996, The Royal Society of Chemistry: Cambridge.
Prins, A., Bos, M. A., Boerboom, F. J. G., van Kalsbeek, H. K. A. I., Proteins at Liquid
Interfaces, Mobius, D., Miller R. Eds., 1998, Elsevier Science, Amsterdam, Netherlands.
Rai , N., Chattopadhyaya , M. C., Investigations on protein adsorption on in-vivo sensor
membrane surfaces, Ind. J. Clin. Biochem., 2003, 18, 65-70.
Rosenbloom, A. J., Sipe, D. M., Shishkin, Y., Ke, Y., Devaty, R. P., Choyke, W. J.,
Nanoporous SiC: A Candidate Semi-Permeable Material for Biomedical Applications,
Biomedical Microdevices, 2004, 6, 261-267
Rosenfeldt, S., Wittemann, A., Ballauff, M., Breininger, E., Bolze, J., Dingenouts, N.,
Interaction of proteins with spherical polyelectrolyte brushes in solution as studied by
158
small-angle x-ray scattering, Physical Review E: Statistical, Nonlinear, and Soft Matter
Physics, 2004, 70, 061403/1-061403/10.
Rospendowski, B. N., Kelly, K., Wolf, C. R., Smith, W. E., Surface-enhanced resonance
Raman scattering from cytochromes P-450 adsorbed on citrate-reduced silver sols, JACS,
1991, 113, 1217-1225
Ross, S., Morrison, I. D., “Colloidal Systems and Interfaces”, 1988, John Wiley, New
York, New York.
Ruiz Budria, J.; Abbad Bara, J. M.; Fabre Gonzalez, E.; Higueras Sanz, M. T.; Serrano
Ostariz, J. L., Phospholipid surface tension: the diagnostic utility of amniotic fluid and
its lipid extract, and analysis of the value of precipitation with cold acetone, Clinical
Chemistry, 1989, 35, 800-803.
Sakai, T., Morita, Y., Araki, T., Kano, M., Yoshida, T., Relationship between delta-
aminolevulinic acid dehydratase genotypes and heme precursors in lead workers, Am J
Ind Med, 2000, 38, 355-360.
Sakata, S., Atassi, M. Z., Immunochemistry of serum albumin. X. five major antigenic
sites of human serum albumin are extrapolated from bovine albumin and confirmed by
synthetic peptides, Mol. Immun., 1980, 17, 139.
Sakoguchi, T., Kobayashi, K., Kimura, M., Hase, A., Shimozawa, M., Matsuoka, A.,
Influence of blood proteins on biomedical analysis. VI Effect of bovine serum albumin
on the color reaction of xanthurenic acid with 4-aminoantipyrine—inhibition of
159
antipyrine red production by bovine serum albumin, Chem. & Pharm. Bull., 1984, 32,
1219-1223.
Sayre, J. W., Charney, R. W., Vostal J., House and hand dust as potential source of
childhood lead exposure, Am J Dis Child, 1974, 127, 167-170.
Shin, J. H., Marxer, S. M., Schoenfisch, M. H., Nitric oxide-releasing sol-gel
particle/polyurethane glucose biosensors, Anal. Chem., 2004, 76, 4543-4549.
Silin, V. I., Vanderah, D., Gaigalas, D. A., Probing the bio-interface with surface
plasmon resonance, Recent Developments in Colloids & Interface Research, 2003, 1,
393-413.
Slack, S. M., Horbett, T. A., The Vroman effect: A critical review, ACS Symposium
Series, 602(Proteins at Interfaces 2), 1995, 112-128.
Small, Donald H.; Phillips, Michael, A technique to estimate the apparent surface
pressure of emulsion particles using apolipoproteins as probes, Advances in Colloid and
Interface Science, 1992, 411-418.
Soylak, M.; Elci, L.; Divrikli, U.; Saracoglu, S., Monitoring trace metal levels in
Kirsehir-Turkey: serum copper and zinc levels of healthy subjects, Fresenius Environ
Bull, 2001, 10, 329-330.
Spitael, J., Kinget, R., Naessens, K., Dissolution rate of cellulose acetate phthalate and
Brönsted catalysis law, Pharm Ind, 1980, 42, 846–849
160
Sprong, H., Sluijs, P., Meer, G., How Proteins Move Lipids and Lipids Move Proteins,
Nat. Rev., 2001, 2, 504-513.
Suzuki, H., Determination of critical micelle concentration of surfactant by ultraviolet
absorption spectra, J. Am. Oil Chemists Soc., 1970, 47, 272-277.
Taylor, F.: Flow-Through pH-Stat Method for Lipase Activity, Anal. Biochem., 1985 148,
149-153.
Tekutskaya, Y., Sofyina, L., Bender, L., Onishchenko, N., Methods and practice of
monitoring the concentrations of heavy metals in the biological media, Gigiena i
sanitariëiìa. Hygiáene et service sanitaire, 1999, 4, 72-74.
Teramoto, A., Takagi, Y., Hachimori, A., Abe, K., Interaction of albumin with
polysaccharides containing ionic groups, Polymers for Advanced Technologies, 1999, 10,
681-686.
Tilton, R. D., Robertson, C. R., Gast, A. P., Manipulation of hydrophobic interactions in
protein adsorption, Langmuir, 1991, 7, 2710-2718.
Tsujii, K., “Surface Activity Principles, Phenomena and Applications”, 1998, Academic
Press, San Diego, CA.
Verger, R., Pattus, F., Lipid-Protein Interactions in Monolayers, Chemistry and Physics
of Lipids, 1982, 30, 189-227.
Victery, W., Throler, H. A., Volpe, R., Summary of discussion sessions: symposium on
lead blood pressure relationships, environ Health Perspect, 1988, 78, 139-155.
161

Voet , D., Voet , J. G., Pratt , C. W., “Fundamentals of Biochemistry”, 1998, John Wiley,
New York, New York.
Waldron, H.A., Lead Poisoning in the Ancient World, Medical History, 17 (1973): 391-
399.
Wilson, C. E., Roscoe, S. G., Electrochemical quartz crystal nanobalance study of
adsorption/displacement phenomena of proteins and lipids on Pt, Langmuir, 2004, 20,
7547-7556.
Will, F. G., Knorr, C. A., Investigation of formation and removal of hydrogen and
oxygen coverage on platinum by a new, nonstationary method, Zeitschrift fuer
Elektrochemie und Angewandte Physikalische Chemie, 1960, 64, 258-69.
Wretlind, A., Parenteral Nutrition, Nutrition Rev., 1981, 39, 257-265.
Xie, Q., Xiang, C., Yuan, Y., Zhang, Y., Nie, L., Yao, S., A novel dual-impedance
analysis EQCM system- investigation of bovein serum albumin adsorption on gold and
platinum electrode and surfaces, J. Colloid and Interf. Sci., 2003, 262, 107-115.
Xie , H., Gratzl , M., Diffusional Titration of Metal Ions in Microliter Samples with
Potentiometric Indication, Anal. Chem., 1996, 68, 3665.
Yang, X., Chen, Y., Arosio, P., Chasteen, N. D., Reaction paths of iron oxidation and
hydrolysis in horse spleen and recombinant human ferritins. Biochem., 1998, 37, 9743-
9750.
162

Yang, H.; Etzel, M. R., Evaluation of Three Kinetic Equations in Models of Protein
Purification Using Ion-Exchange Membranes, Industrial & Engineering Chemistry
Research, 2003, 42, 890-896.
Yeager, E., O’Grady, W. E., Woo, M. Y. C., Hagans, P., Hydrogen Adsorption on single
crystal platinum, J. Electrochem. Soc., 1978, 125, 348-349.
Young , B. R., Pitt , W. G., Cooper, S. L., Protein adsorption on polymeric biomaterials I.
Adsorption isotherms, J. Colloid Interf. Sci., 1988, 124, 28-43.
Zolfaghari, A., Jerkiewicz, G., Fundamental thermodynamic aspects of the underpotential
deposition of hydrogen, semiconductors, and metals, ACS Symposium Series), 656(Solid-
Liquid Electrochemical Interfaces), 1997, 45-60.
163