bdnf gene effects on brain circuitry replicated in 455 twins
TRANSCRIPT

NeuroImage xxx (2011) xxx–xxx
YNIMG-07927; No. of pages: 7; 4C:
Contents lists available at ScienceDirect
NeuroImage
j ourna l homepage: www.e lsev ie r.com/ locate /yn img
BDNF gene effects on brain circuitry replicated in 455 twins
Ming-Chang Chiang a, Marina Barysheva a, Arthur W. Toga a, Sarah E. Medland b, Narelle K. Hansell b,Michael R. James b, Katie L. McMahon c, Greig I. de Zubicaray d, Nicholas G. Martin b, Margaret J. Wright b,Paul M. Thompson a,⁎a Laboratory of Neuro Imaging, Dept. of Neurology, UCLA School of Medicine, Los Angeles, CA, USAb Queensland Institute of Medical Research, Brisbane, Australiac University of Queensland, Centre for Advanced Imaging, Brisbane, Australiad University of Queensland, School of Psychology, Brisbane, Australia
⁎ Corresponding author. Laboratory of Neuro ImagiSchool of Medicine, 635 Charles E. Young Drive South90095-7332, USA. Fax: +1 310 206 5518.
E-mail address: [email protected] (P.M. Thom
1053-8119/$ – see front matter © 2010 Elsevier Inc. Aldoi:10.1016/j.neuroimage.2010.12.053
Please cite this article as: Chiang, M.-C., et aneuroimage.2010.12.053
a b s t r a c t
a r t i c l e i n f oArticle history:Received 2 September 2010Revised 24 November 2010Accepted 20 December 2010Available online xxxx
Keywords:BDNFTwinsDiffusion imagingCognitionImaging genomicsWhite matter
Brain-derived neurotrophic factor (BDNF) plays a key role in learning and memory, but its effects on the fiberarchitecture of the living brain are unknown. We genotyped 455 healthy adult twins and their non-twinsiblings (188 males/267 females; age: 23.7±2.1 years, mean±SD) and scanned them with high angularresolution diffusion tensor imaging (DTI), to assess how the BDNF Val66Met polymorphism affects whitematter microstructure. By applying genetic association analysis to every 3D point in the brain images, wefound that the Val-BDNF genetic variant was associated with lower white matter integrity in the splenium ofthe corpus callosum, left optic radiation, inferior fronto-occipital fasciculus, and superior corona radiata.Normal BDNF variation influenced the association between subjects' performance intellectual ability (asmeasured by Object Assembly subtest) and fiber integrity (as measured by fractional anisotropy; FA) in thecallosal splenium, and pons. BDNF gene may affect the intellectual performance by modulating the whitematter development. This combination of genetic association analysis and large-scale diffusion imagingdirectly relates a specific gene to the fiber microstructure of the living brain and to human intelligence.
ng, Dept. of Neurology, UCLA, Suite 225E, Los Angeles, CA
pson).
l rights reserved.
l., BDNF gene effects on brain circuitry replicat
© 2010 Elsevier Inc. All rights reserved.
Introduction
Growth factors play a crucial role in guiding brain developmentand connectivity, as they regulate neuronal differentiation andsurvival, and modulate the plasticity and function of neuronalsynapses. Among them, brain-derived neurotrophic factor (BDNF)is critically involved in learning and memory — it modulateshippocampal neurogenesis, synaptic transmission, and activity-induced long-term potentiation and depression (Poo, 2001). In alandmark study, Egan et al. (2003) showed that a common variant inthe BDNF gene, a methionine (Met) for valine (Val) substitution atcodon 66 in the 5′-proregion of the BDNF protein (Val66Met; dbSNPnumber rs6265), led to poorer episodic memory and hippocampalactivation in a cohort of 641 cognitively intact adults aged 25–45.This amino-acid substitution impairs intracellular trafficking andactivity-dependent release of the growth factor, without affecting itssynthesis (Chen et al., 2006). The Met allele occurs in around 20% of
Caucasians, and 40% of Asians (Shimizu et al., 2004), and is associatedwith gray matter volume deficits especially in the hippocampus andprefrontal cortex (Pezawas et al., 2004), and with impaired memoryeven in healthy young people (Hariri et al., 2003). Nevertheless,associations between the BDNF Val66Met polymorphism and thefiber integrity of the living brain are still unknown. This is of specialinterest, as white matter microstructure and intellectual ability werefound to be influenced by a partially overlapping set of genes (Chianget al., 2009).
To study how BDNF Val66Met polymorphism impacts brainmicrostructure, we acquired high angular resolution diffusion tensorimages (DTI) from 455 twins and their non-twin siblings. DTI is avariant of magnetic resonance imaging that is sensitive to thedirectionally constrained water diffusion in the brain, which occurspreferentially along axons. The fractional anisotropy (FA) of diffusionis a widely accepted index of themicrostructural integrity of the whitematter (Basser and Pierpaoli, 1996; Beaulieu, 2002). To evaluate theassociation between BDNF Val66Met genotype data and white matterintegrity measured by FA, we applied a general linkage-disequilibri-um test for quantitative traits (Abecasis et al., 2000) to each locationin 3D brain images. Given the BDNF's known effects on corticalstructure and function, we hypothesized that the BDNF Val66Metpolymorphismmay contribute to structural integrity of cerebral whitematter.
ed in 455 twins, NeuroImage (2011), doi:10.1016/j.
2 M.-C. Chiang et al. / NeuroImage xxx (2011) xxx–xxx
The influence of the BDNF gene on memory performance has beenwidely replicated (Hansell et al., 2007), but its association with full-scale IQ has not been detected (Egan et al., 2003). Similarly, anothercognition-related gene, the catechol-O-methyltransferase (COMT)gene, was also found to be associated with working memoryperformance, but not with IQ (Egan et al., 2001). Li et al. (2009)found that the COMT Val158Met polymorphism modulated theassociation between the white matter integrity and IQ — theregression slope for the FA against full-scale IQ was higher in Valhomozygotes than in Met carriers in the prefrontal regions and in thehippocampal formation, bilaterally. Based on this finding, weexpected that the gene effects on IQ might be due to indirectinteractions between the white matter integrity (or other brainstructural phenotypes) and IQ. This inability to detect a directcorrelation between these specific genes and IQ may be because IQ isa complex phenotype; the endophenotype strategy suggests that itmay be easier to identify gene effects if they are mediated by somebasic intermediate phenotypes that are readily measured in brainimages, e.g., the voxelwise FA in this study. Therefore, our secondhypothesis was that the BDNF Val66Met polymorphism mayinfluence intellectual performance via a modulating effect on whitematter architecture, similar to the COMT gene. This was anexploratory hypothesis, and we tested it by studying how BDNFgenotypes modulated the statistical association between the whitematter integrity and IQ at every point of the brain, that we previouslydetected in a subset of the subjects studied here (Chiang et al., 2009).
Methods
Subject description and genotyping
BDNF Val66Met polymorphism was identified as the rs6265 in thedbSNP public database (http://www.ncbi.nlm.nih.gov/projects/SNP/).Genotype data were available for 785 healthy adult twins and theirnon-twin siblings (385males/400 females) from 439 familieswith thefollowing ancestry: British Isles 76.2%, Northern Europe 12.6%,Mediterranean 5.4%, unknown 5.8%, and were determined usingprimer extension in the Sequenom Mass-Array system. Genotypingerror rate was b0.1%. The frequency of the BDNF Val allele was 81%,and was similar for all ancestral groups (British Isles: 82%, NorthernEurope: 77%, Mediterranean: 76%, unknown ancestry: 79%). Theprobability of correct zygosity assignment was N99.99% (Hansell et al.,2007). To find the association between image measures and BDNFgenotype data, we acquired DTI scans from 455 subjects (188 males/267 females; age: 23.7±2.1 years, mean±SD). BDNF genotypes were
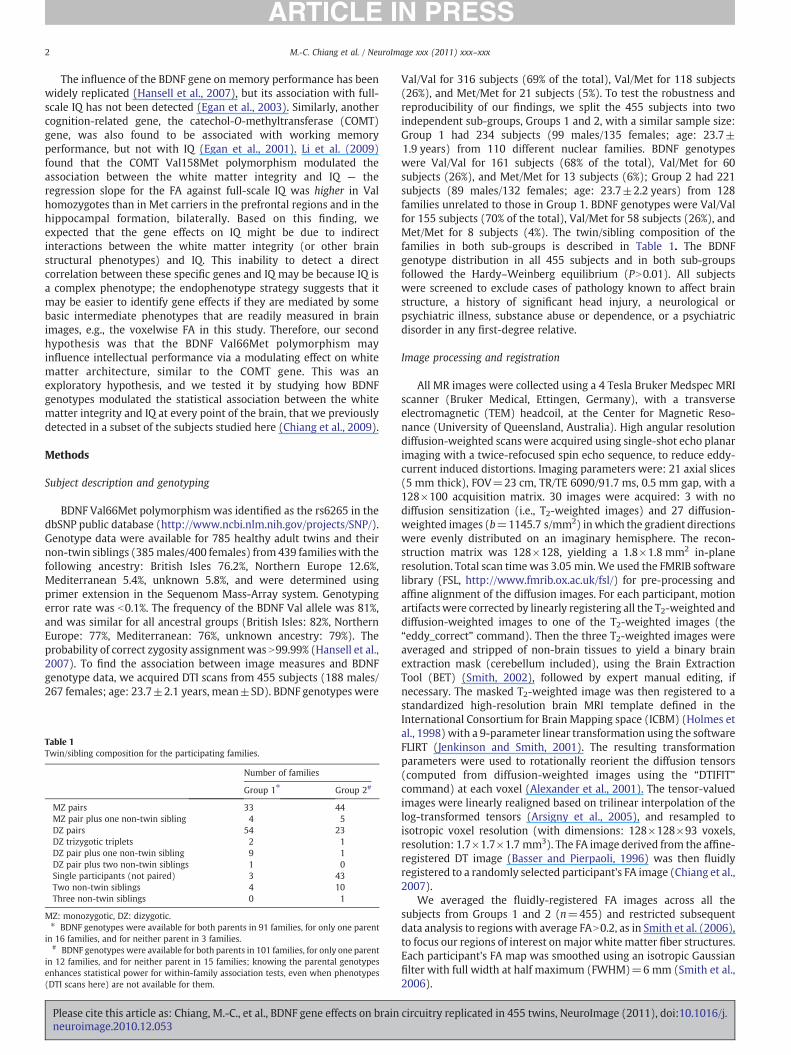
Table 1Twin/sibling composition for the participating families.
Number of families
Group 1⁎ Group 2#
MZ pairs 33 44MZ pair plus one non-twin sibling 4 5DZ pairs 54 23DZ trizygotic triplets 2 1DZ pair plus one non-twin sibling 9 1DZ pair plus two non-twin siblings 1 0Single participants (not paired) 3 43Two non-twin siblings 4 10Three non-twin siblings 0 1
MZ: monozygotic, DZ: dizygotic.⁎ BDNF genotypes were available for both parents in 91 families, for only one parent
in 16 families, and for neither parent in 3 families.# BDNF genotypes were available for both parents in 101 families, for only one parent
in 12 families, and for neither parent in 15 families; knowing the parental genotypesenhances statistical power for within-family association tests, even when phenotypes(DTI scans here) are not available for them.
Please cite this article as: Chiang, M.-C., et al., BDNF gene effects on brainneuroimage.2010.12.053
Val/Val for 316 subjects (69% of the total), Val/Met for 118 subjects(26%), and Met/Met for 21 subjects (5%). To test the robustness andreproducibility of our findings, we split the 455 subjects into twoindependent sub-groups, Groups 1 and 2, with a similar sample size:Group 1 had 234 subjects (99 males/135 females; age: 23.7±1.9 years) from 110 different nuclear families. BDNF genotypeswere Val/Val for 161 subjects (68% of the total), Val/Met for 60subjects (26%), and Met/Met for 13 subjects (6%); Group 2 had 221subjects (89 males/132 females; age: 23.7±2.2 years) from 128families unrelated to those in Group 1. BDNF genotypes were Val/Valfor 155 subjects (70% of the total), Val/Met for 58 subjects (26%), andMet/Met for 8 subjects (4%). The twin/sibling composition of thefamilies in both sub-groups is described in Table 1. The BDNFgenotype distribution in all 455 subjects and in both sub-groupsfollowed the Hardy–Weinberg equilibrium (PN0.01). All subjectswere screened to exclude cases of pathology known to affect brainstructure, a history of significant head injury, a neurological orpsychiatric illness, substance abuse or dependence, or a psychiatricdisorder in any first-degree relative.
Image processing and registration
All MR images were collected using a 4 Tesla Bruker Medspec MRIscanner (Bruker Medical, Ettingen, Germany), with a transverseelectromagnetic (TEM) headcoil, at the Center for Magnetic Reso-nance (University of Queensland, Australia). High angular resolutiondiffusion-weighted scans were acquired using single-shot echo planarimaging with a twice-refocused spin echo sequence, to reduce eddy-current induced distortions. Imaging parameters were: 21 axial slices(5 mm thick), FOV=23 cm, TR/TE 6090/91.7 ms, 0.5 mm gap, with a128×100 acquisition matrix. 30 images were acquired: 3 with nodiffusion sensitization (i.e., T2-weighted images) and 27 diffusion-weighted images (b=1145.7 s/mm2) inwhich the gradient directionswere evenly distributed on an imaginary hemisphere. The recon-struction matrix was 128×128, yielding a 1.8×1.8 mm2 in-planeresolution. Total scan timewas 3.05 min.We used the FMRIB softwarelibrary (FSL, http://www.fmrib.ox.ac.uk/fsl/) for pre-processing andaffine alignment of the diffusion images. For each participant, motionartifacts were corrected by linearly registering all the T2-weighted anddiffusion-weighted images to one of the T2-weighted images (the“eddy_correct” command). Then the three T2-weighted images wereaveraged and stripped of non-brain tissues to yield a binary brainextraction mask (cerebellum included), using the Brain ExtractionTool (BET) (Smith, 2002), followed by expert manual editing, ifnecessary. The masked T2-weighted image was then registered to astandardized high-resolution brain MRI template defined in theInternational Consortium for Brain Mapping space (ICBM) (Holmes etal., 1998) with a 9-parameter linear transformation using the softwareFLIRT (Jenkinson and Smith, 2001). The resulting transformationparameters were used to rotationally reorient the diffusion tensors(computed from diffusion-weighted images using the “DTIFIT”command) at each voxel (Alexander et al., 2001). The tensor-valuedimages were linearly realigned based on trilinear interpolation of thelog-transformed tensors (Arsigny et al., 2005), and resampled toisotropic voxel resolution (with dimensions: 128×128×93 voxels,resolution: 1.7×1.7×1.7 mm3). The FA image derived from the affine-registered DT image (Basser and Pierpaoli, 1996) was then fluidlyregistered to a randomly selected participant's FA image (Chiang et al.,2007).
We averaged the fluidly-registered FA images across all thesubjects from Groups 1 and 2 (n=455) and restricted subsequentdata analysis to regions with average FAN0.2, as in Smith et al. (2006),to focus our regions of interest on major white matter fiber structures.Each participant's FA map was smoothed using an isotropic Gaussianfilter with full width at half maximum (FWHM)=6 mm (Smith et al.,2006).
circuitry replicated in 455 twins, NeuroImage (2011), doi:10.1016/j.
3M.-C. Chiang et al. / NeuroImage xxx (2011) xxx–xxx
Association between diffusion anisotropy and BDNF polymorphisms
We followed the method of Abecasis et al. (2000) to analyzeassociations between the BDNF polymorphism and FA at each voxel.To eliminate spurious associations due to population stratification, theadditive genetic values that coded different variants of the BDNFpolymorphism (g; Val/Val=1, Val/Met=0, andMet/Met=−1) weredecomposed into orthogonal between-family (b) and within-family(w) components. For sibling j in family i, the FA value at each voxel(yij), after being adjusted for the age and sex effects using generallinear model, was modeled as yij=μ+ βbbi+βwwij, where μ is theoverall phenotypic mean value. bi is the between-family component,or the expected family average, of the additive genetic values of all thesiblings in family i. The within-family component for each participantis given by wij=gij−bi. The covariance matrix of FA for family i,denoted by Φi, was based on known genetic similarity betweenrelatives, written in terms of the different sources of variance:
Φijk =
σ2a + σ2
A + σ2C + σ2
E ; if j = k
σ2a + σ2
A + σ2C ; if j≠k; and j and k are MZ twins
πijkσ2a + 1= 2σ2
A + σ2C ; if j≠k; and j and k are not MZ twins
8>><>>:
Here σa2 is the variance due to the additive effects of the BDNF
polymorphism and σA2 is the variance due to the residual additive of all
other genes on the genome. σC2 and σE
2 are respectively the variances thatcome fromenvironmental factors that are commontoall familymembers,and that are unique for each individual (experimental errors are includedin σE
2). πijk is the expected proportion of alleles that arise from the sameancestor allele, i.e., identical by descent (IBD) for participants j and k. Theestimation of πijk is detailed by Haseman and Elston (1972).
The above association model was fitted using the maximum-likelihood method (Abecasis et al., 2000). βw≠0 indicates that thereis genuine association of the additive effect of the BDNF polymor-phism on FA, i.e., the genetic marker (the BDNF Val66Met polymor-phism) is either the trait locus for FA, or is considered to be in linkagedisequilibrium with the trait locus. The significance of the genuineassociation coefficient βw was determined by minus two times thisdifference between the full model and the restricted (βw wasexcluded) model, which is asymptotically distributed approximatelyas a chi-squared distribution with one degree of freedom.
Here the association between the BDNF gene and FAwas estimatedwith each voxel regarded as an independent unit; no tracking of whitematterfiberswas performed. Linking diffusionmeasures definedusingtractography (Behrens et al., 2007) with genotype data may elucidategenetic influences on cortical connectivity. Nevertheless, tract labelinghas not yet been fully automated and is labor intensive, so here weperformed association analysis using voxel-basedmethods.Moreover,we only considered BDNF gene effects on brain fiber architecture;contributions from other genes, or epistatic effects between BDNF andother genes were not included. Future genome-wide associationstudies (GWAS) (Benyamin et al., 2009) are warranted to study jointeffects of multiple genes on diffusion imaging measures.
How does BDNF polymorphism modify association between thewhite matter anisotropy and intellectual performance?
To study how the BDNF polymorphism influences intellectualperformance, we assessed the subjects' general intellectual ability atage 16 using the Multidimensional Aptitude Battery (MAB) (Jackson,1984), ameasure highly correlatedwith theWechslerAdult IntelligenceScale. The duration of education (in months) was recorded at the sametime. We examined three verbal (information, arithmetic, and vocab-ulary) and twoperformance (spatial and object assembly) IQ sub-scales.Each subtest gave a rawscore; verbal (VIQ), performance (PIQ), and full-scale (FIQ) intelligence quotient standardized scoreswere derived from
Please cite this article as: Chiang, M.-C., et al., BDNF gene effects on brainneuroimage.2010.12.053
these sub-scales. The IQ data were available in 440 subjects. There wasno difference in FIQ (Val/Val: 114.1±12.4, n=304; Val/Met: 114.6±12.8, n=116;Met/Met: 109.2±15.8, n=20;mean±SD) or in other IQsub-scales among the three genotype groups.
The BDNF polymorphismmay affect IQ via its modulatory effect onthe association between the brain white matter structure and IQ, i.e.,the regression slope (for FA versus IQ), may differ in people withdifferent BDNF genotypes. This was modeled by adding an interactionterm w⋅ IQ into FA–IQ regression, using the following moderatedregression equation:
FAij = μ + βIQ · IQij + βb · bi + βw · wij + βint · wij · IQij
� �:
The subjects' IQ and voxel FA values were adjusted for age and sex, andthe IQ score was further adjusted for the duration of school education.Positive interaction effect, i.e. βintN0, means that subjects with wijN0have a greater slope than subjects withwijb0 in FA regressed against theIQ score. This may be clearer if we consider the partial derivative of FAwith respect to IQ in the aboveequation, givenby∂FA/∂IQ=βIQ+βint ∙w;the slope of the regression for the FA on IQ is then shown to depend onw.The covariance matrix is identical to that in the previous section.
To eliminate the collinearity between the regressors, we usedprincipal component regression, where the design matrix of a linearregression is transformed into a matrix whose columns are theeigenvectors weighted by the eigenvalues of the original designmatrix, and thus are linearly independent of each other (Slinker andGlantz, 1985). The moderated regression equation above may bewritten in matrix form. For family i with ni members, yi=Xiβ; hereyi=[FAi,1 FAi,2 … FAi,ni]T, β=[μ βIQ βb βw βint]T, and Xi consists of fivecolumns that are ni-element vectors of values of 1, and values of IQ, bi,wij, and (IQij⋅wij) of all ni members (1≤ j≤ni), in order. Thesuperscript T indicates matrix transpose. Let the design matrix for
the total of n families be X = ∑n
i=1XTi Xi, and matrix V consists of
columns that are normalized eigenvectors of X. Given VVT= I (the
identity matrix), we may rewrite the regression equation
y = ∑n
i=1XTi yi = Xβ = XVð Þ VTβ
� �so that (XV) is the new design
matrix whose columns are linearly independent, and b=VTβ is thenew vector of the regression coefficients to obtain. We removed thecolumns of V that corresponded to eigenvalues of X that were smallerthan a pre-defined threshold (10−13 times the maximum eigenvalueof X), if any, to avoid singularity that may arise due to collinearitybetween columns of X.
The significance of the modulatory effect of BDNF polymorphismon FA and IQ, or βint, was determined by the Wald-type statistic(Vonesh and Carter, 1992). Given βint= l(b)=V(5)b, where V(5) is thefifth row of V, the null hypothesis βint=0 may be tested using theWald test statistic: T2= lT[LΩLT]−1l, where L(b)=[∂l(b)/∂b], and Ω isthe covariance matrix of b. We refer readers to Vonesh and Carter(1992) for the derivation ofΩ. T2 follows the F distribution F (1, n−q),where q=5 is the dimension of β.
We applied the above method to evaluate how the BDNFpolymorphism modulated the association between the FA andsubjects' VIQ, PIQ, and FIQ scores, as we hypothesized that thesethree IQ scores respectively reflected the subjects' verbal, perfor-mance, and overall intellectual performance. Moreover, we alsoestimated the BDNF interactions with FA and the object assembly(OBJ) sub-scale, as in our previous study (Chiang et al., 2009) wefound that the cross-trait correlation between the FA and FIQ, PIQ, andOBJ IQ scores was strongly mediated by overlapping genetic factors.
Correction for multiple comparisons
Given the very large number of tests performed (~80,000 voxels),we controlled for type I error due to multiple comparisons across
circuitry replicated in 455 twins, NeuroImage (2011), doi:10.1016/j.

Fig. 1. BDNF Val66Met polymorphism effects on white matter architecture, estimated based on all 455 subjects. The upper row shows the white matter regions where the Val-BDNFallele is associated with reduced FA (βwb0). Reduction in FA at each voxel is displayed as the percentage difference between those people with wN0 (an excess of the Val geneticvariant) and those with wb0 (an excess of the Met genetic variant), relative to the average FA across all 455 subjects. Only the voxel clusters that passed the topological FDR≤0.05threshold are displayed. The lower row shows the voxelwise P-value for βwb0, displayed on a log10 scale. L: left.
4 M.-C. Chiang et al. / NeuroImage xxx (2011) xxx–xxx
voxels using the topological false discovery rate (FDR) method(Chumbley et al., 2010; Chumbley and Friston, 2009). Chumbley etal. (2010) recently showed that the voxelwise FDR, which is still quitewidely used in statistical brain mapping, does not control adequatelyfor regional effects and recommended topological FDR, to providebetter assurance that the false positive rates are strictly controlled.The topological FDR method controls the expected proportion of falsepositive findings over all clusters, and it is not based on a test of theoverall volume of the set of supra-threshold voxels, at differentstatistical thresholds (as standard FDR is). A cluster was defined as aset of contiguous voxels where the size of the tested effect at everyvoxel surpassed a certain threshold. Here we set the threshold to ZN3,where Z was the standard Normal variate corresponding to thevoxelwise P-value (e.g., the P-maps derived from BDNF–FA associa-tions; note that this also defines a threshold in the P-maps). We thenused the FMRISTAT toolbox developed by Keith Worsley (http://www.math.mcgill.ca/keith/fmristat/) to compute the significanceP-value for each cluster, derived from the Gaussian random fieldtheory (Friston et al., 1994). This P-value indicates how improbable itis to detect any other clusters with a greater volume (i.e., containingmore voxels) than that cluster, based on the null hypothesis that thereis no tested effect but only Gaussian noise in the whole image field.P-values for all clusters were then inputted into the traditional FDRprocedure (Benjamini and Hochberg, 1995). Here we controlled theFDR of clusters within 5%, which means that only 5% of the clustersthat are declared to be significant tend, on average, to be false positivefindings. All computational processes were executed using a 306-node, dual-processor SUN Microsystems V20z cluster. Each computenode has a dual 64-bit 2.4 GHz AMD Opteron CPU.
Results
By associating BDNF genotype data with the white matteranisotropy in all 455 subjects, we found remarkable and widespread
Please cite this article as: Chiang, M.-C., et al., BDNF gene effects on brainneuroimage.2010.12.053
BDNF gene effects across the major white matter fibers. Fig. 1 showsthat the Val genetic variant of BDNF is associated with lower FA inseveral key white matter tracts (βwb0), such as the splenium of thecorpus callosum and left posterior thalamic radiation/optic radiation(z=−1 and z=5; in Montreal Neurological Institute (MNI)coordinates, expressed in mm), the junction of the genu of the corpuscallosum and the anterior corona radiata on the right (z=5), leftinferior fronto-occipital fasciculus (IFO)/inferior longitudinal fascicu-lus (ILF), midbrain (which contains corticobulbar and corticospinaltracts) and fornix bilaterally (z=−10), and superior corona radiataon the right (z=42). The FA in subjects whose Val allele exceededtheir expected family average (wN0; n=90) had up to 15% lower FAthan those whose Met allele exceeded their expected family average(wb0; n=80). In other words, the BDNF allele that is normallyconsidered favorable (Val, not Met) conferred a detectable andsystematic deficit in white matter anisotropy of up to 15% regionally.We also tested the BDNF–FA associations in the two sub-groupsrespectively, to detect brain regions where the BDNF effects wererobust enough to reproduce in smaller samples. Fig. 2 shows that theinfluences of the BDNF genewere significant in both Groups 1 and 2 inthe splenium of the corpus callosum and the left optic radiation. Thesetwo regions coincide the white matter regions where the strongestBDNF genotype effects (up to 15% FA reduction associated with theVal allele) were detected in n=455 subjects (see Fig. 1). Positiveassociations between the additive Val allele effect and FA (βwN0)were not significant.
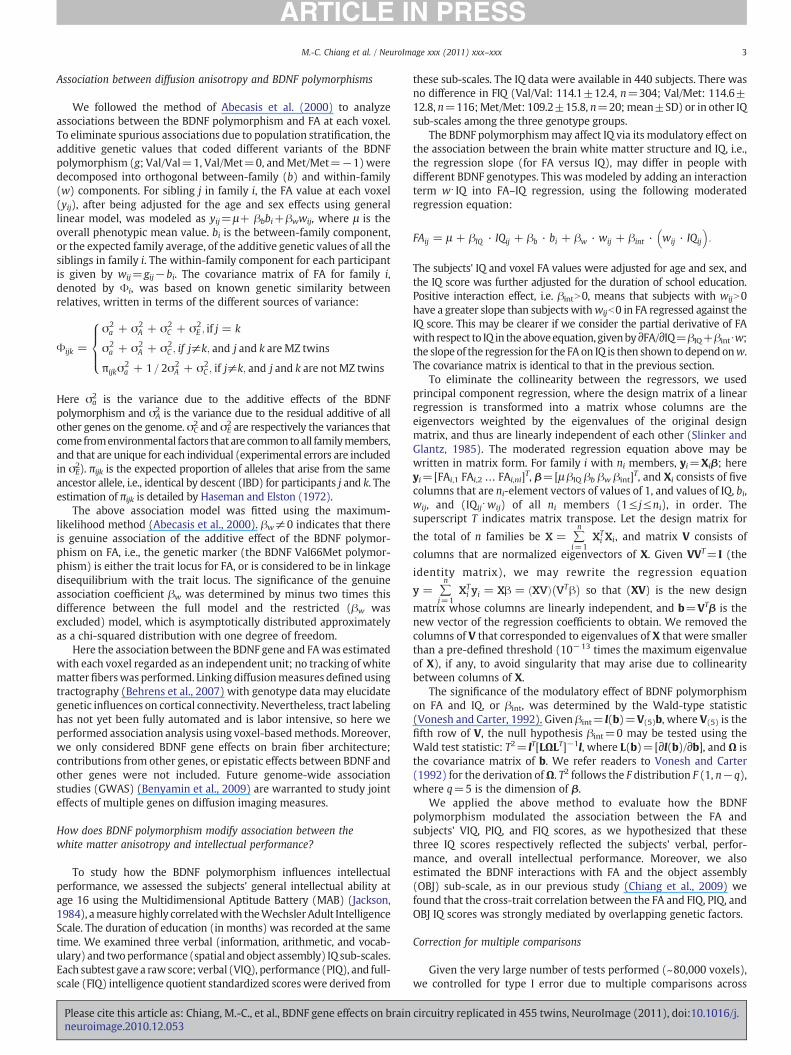
The BDNF polymorphism was not directly associated withintellectual performance, at least when measured using FIQ, VIQ,PIQ, or OBJ scores. However, the BDNF polymorphism may indirectlyinfluence intellectual performance in specific brain regions bymodulating the association between the white matter anisotropyand IQ. Fig. 3 shows this; the slope for the OBJ score regressed againstFA in subjects with wN0 (Val excess) was greater than thecorresponding slope in subjects with wb0 (i.e. βintN0), in the pons
circuitry replicated in 455 twins, NeuroImage (2011), doi:10.1016/j.

Fig. 2. Influence of the BDNF Val66Met polymorphism on the FA compared acrossdifferent subject groups. The upper and middle rows show the percentage reduction inaverage FA for those people with an excess of the Val genetic variant relative to thosewith an excess of the Met genetic variant (as displayed in Fig. 1), for Groups 1 and 2respectively. To better visualize the regions where the BDNF–FA association issignificant in both subject groups, we conjoined the two significance maps for βwb0by taking the larger P-value at every voxel that belongs to the intersection of thesignificant clusters (as shown in the upper two rows) of the two groups. Theconjunction P-maps are displayed on a log10 scale (lower row). MNI coordinates (mm)of the slices, in radiological orientation, are shown at the top. L: left.
5M.-C. Chiang et al. / NeuroImage xxx (2011) xxx–xxx
on the left (z=−21) and the splenium of the corpus callosum (z=2).The interaction effects of the BDNF polymorphism on the associationbetween the FA and FIQ, VIQ, or PIQ were not significant.
Discussion
In this paper, we mapped the influences of the BDNF Val66Metpolymorphism on the brain white matter architecture, extendinggenetic association analyses to 3D images. The Val allele was found tobe associated with up to 15% reduction in FA in major fiber tracts,especially in the splenium of the corpus callosum and the opticradiation on the left, the left IFO/ILF, and superior corona radiata.Moreover, the associations between the BDNF and FA were consistentin the two sub-groups of the subjects in the splenium of the corpuscallosum and the optic radiation on the left. Although these two sub-groups were not truly independent of each other as all subjects wererecruited from the same twin registry and their brain images acquiredusing the same MR scanner, testing BDNF–FA associations in thesetwo sub-groups might still help to support the consistency and
Please cite this article as: Chiang, M.-C., et al., BDNF gene effects on brainneuroimage.2010.12.053
robustness of the associations, assuming that the genetic determi-nants for white matter architecture are independent across families(Van Steen et al., 2005). In other words, the results are robust tosubsampling within same cohort, but further analysis of the newcohorts that were independently assessed from the outset will bevaluable as more large DTI datasets become available. Findings in thispaper are consistent with those in our previous study, where geneticinfluences accounted for around 80% of the variance in the FA in theseregions (Chiang et al., 2009). This suggests that BDNF is a keycandidate gene that influences white matter integrity.
In all brain regions affected by the BDNF polymorphism, theadditive effect of the Val allele was associated with a lower FA.Supporting the direction and validity of this effect, a recent conferenceabstract (Alam et al., 2010) reported significant BDNF genotype-dependent differences in the FA, largely restricted to the body of thecorpus callosum, where the Val allele was associated with a lower FA.In that study, DTI scans were collected from 85 young healthyvolunteers (mean age: 33.5±9.6 years; 46 men/39 women) — asample of around one fifth the size of that analyzed here. FA is usuallyconsidered as a measure of fiber myelination and organization(Beaulieu, 2002). Higher FA reflects greater myelination, and adirectional coherence in the myelinated fiber tracts (Beaulieu,2002), and has generally been linked with better functionalperformance (Chiang et al., 2009). Even so, lower FA does notnecessarily always imply lower white matter integrity, and mayreflect (1) larger axonal diameter, which results in increasedintracellular water content (Takahashi et al., 2002), (2) greater fiberbranching, or (3) higher intravoxel fiber crossing in, e.g., where theoptic radiation and corpus callosum fibers intermix (see Fig. 1) (Tuchet al., 2005). The above hypotheses may be tested by comparing theT1-weighted and DT images in the same subjects using voxel-basedmorphometry (Ashburner and Friston, 2000), where larger axonaldiameter or more extensive fiber branching reflected by lower FAmayalso be detectable as reduced white matter density. Tuch et al. (2005)showed that lower FA, at the junction of the optic radiation and corpuscallosum, was associated with a faster reaction time to visual stimuli.Schmithorst andWilke (2002) found that FA in the corona radiata andinternal capsule was lower in musicians than in non-musicians. Theyattributed this to the rearrangement of neural representations formotor control after intensive musical training. The associationbetween the lower FA and the Val BDNF allele in this study mayprovide another exception to the “higher FA is always better”hypothesis.
We found that BDNF variants significantly modulated theassociation between the FA and the OBJ sub-scale in the splenium ofthe corpus callosum, where the Val allele was associated with apositive FA–OBJ correlation, whereas the Met allele was associatedwith no correlation or with a negative correlation. The callosalsplenium interconnects bilateral primary visual and visual associationareas of the parietal and occipital cortex, and is relevant forvisuospatial memory (Rudge and Warrington, 1991). Positive corre-lation between the FA and IQ may support the theory that optimalintellectual performance typically requires high processing speed andshort reaction times, which are influenced by axonal myelinationlevels (Arbuthnott et al., 1980). Furthermore, the myelination ofwhite matter fibers may itself be enhanced by neuronal activity(Fields, 2005). On the other hand, negative correlation between the FAand IQ may reflect greater fiber crossing or branching that lowers FA,as in a broadly connected cognitive network (Tuch et al., 2005).Reduced FA in one brain region may also indicate that during thematuration or improvement of cognitive function, myelination maybe greater in other brain regions to optimize processing efficiency(Schmithorst andWilke, 2002). All these mechanisms may contributeto the association between the white matter architecture andintellectual performance, and the causal pathways are influenced bygenetic factors, including the BDNF gene. The interaction of the BDNF
circuitry replicated in 455 twins, NeuroImage (2011), doi:10.1016/j.
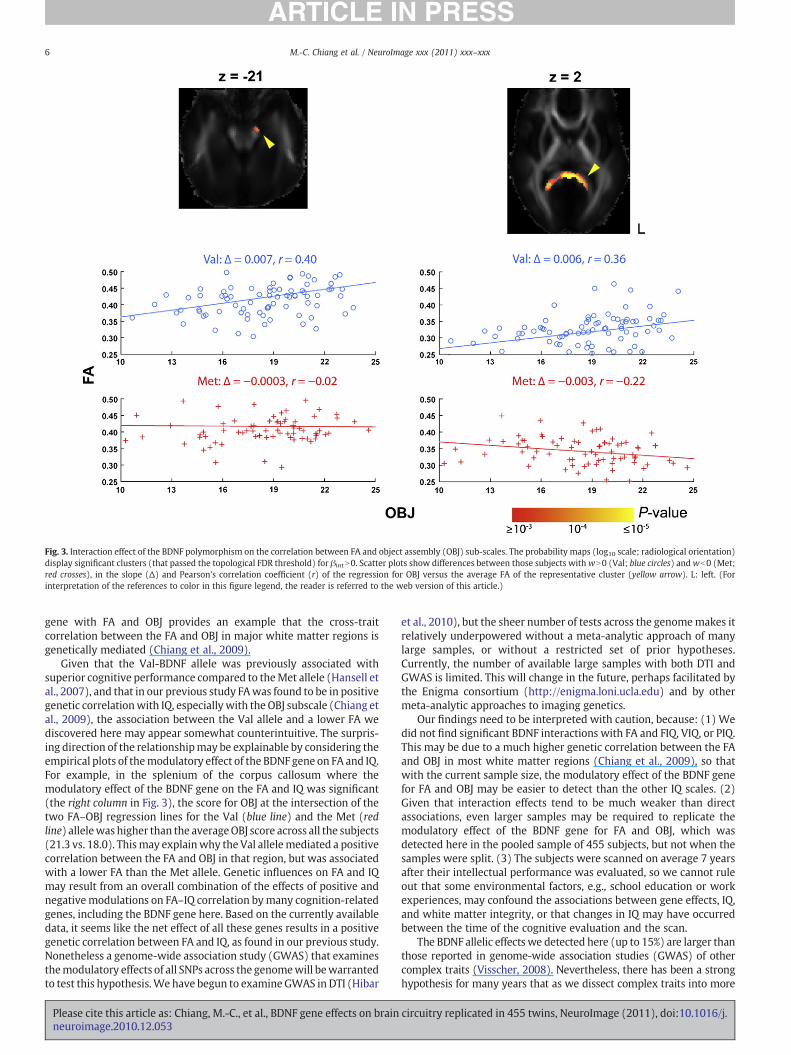
Fig. 3. Interaction effect of the BDNF polymorphism on the correlation between FA and object assembly (OBJ) sub-scales. The probability maps (log10 scale; radiological orientation)display significant clusters (that passed the topological FDR threshold) for βintN0. Scatter plots show differences between those subjects withwN0 (Val; blue circles) andwb0 (Met;red crosses), in the slope (Δ) and Pearson's correlation coefficient (r) of the regression for OBJ versus the average FA of the representative cluster (yellow arrow). L: left. (Forinterpretation of the references to color in this figure legend, the reader is referred to the web version of this article.)
6 M.-C. Chiang et al. / NeuroImage xxx (2011) xxx–xxx
gene with FA and OBJ provides an example that the cross-traitcorrelation between the FA and OBJ in major white matter regions isgenetically mediated (Chiang et al., 2009).
Given that the Val-BDNF allele was previously associated withsuperior cognitive performance compared to theMet allele (Hansell etal., 2007), and that in our previous study FAwas found to be in positivegenetic correlationwith IQ, especially with the OBJ subscale (Chiang etal., 2009), the association between the Val allele and a lower FA wediscovered here may appear somewhat counterintuitive. The surpris-ing direction of the relationshipmay be explainable by considering theempirical plots of themodulatory effect of the BDNF gene on FA and IQ.For example, in the splenium of the corpus callosum where themodulatory effect of the BDNF gene on the FA and IQ was significant(the right column in Fig. 3), the score for OBJ at the intersection of thetwo FA–OBJ regression lines for the Val (blue line) and the Met (redline) allelewas higher than the averageOBJ score across all the subjects(21.3 vs. 18.0). Thismay explainwhy the Val allelemediated a positivecorrelation between the FA and OBJ in that region, but was associatedwith a lower FA than the Met allele. Genetic influences on FA and IQmay result from an overall combination of the effects of positive andnegativemodulations on FA–IQ correlation bymany cognition-relatedgenes, including the BDNF gene here. Based on the currently availabledata, it seems like the net effect of all these genes results in a positivegenetic correlation between FA and IQ, as found in our previous study.Nonetheless a genome-wide association study (GWAS) that examinesthemodulatory effects of all SNPs across the genomewill bewarrantedto test this hypothesis.We have begun to examineGWAS in DTI (Hibar
Please cite this article as: Chiang, M.-C., et al., BDNF gene effects on brainneuroimage.2010.12.053
et al., 2010), but the sheer number of tests across the genomemakes itrelatively underpowered without a meta-analytic approach of manylarge samples, or without a restricted set of prior hypotheses.Currently, the number of available large samples with both DTI andGWAS is limited. This will change in the future, perhaps facilitated bythe Enigma consortium (http://enigma.loni.ucla.edu) and by othermeta-analytic approaches to imaging genetics.
Our findings need to be interpreted with caution, because: (1) Wedid not find significant BDNF interactions with FA and FIQ, VIQ, or PIQ.This may be due to a much higher genetic correlation between the FAand OBJ in most white matter regions (Chiang et al., 2009), so thatwith the current sample size, the modulatory effect of the BDNF genefor FA and OBJ may be easier to detect than the other IQ scales. (2)Given that interaction effects tend to be much weaker than directassociations, even larger samples may be required to replicate themodulatory effect of the BDNF gene for FA and OBJ, which wasdetected here in the pooled sample of 455 subjects, but not when thesamples were split. (3) The subjects were scanned on average 7 yearsafter their intellectual performance was evaluated, so we cannot ruleout that some environmental factors, e.g., school education or workexperiences, may confound the associations between gene effects, IQ,and white matter integrity, or that changes in IQ may have occurredbetween the time of the cognitive evaluation and the scan.
The BDNF allelic effects we detected here (up to 15%) are larger thanthose reported in genome-wide association studies (GWAS) of othercomplex traits (Visscher, 2008). Nevertheless, there has been a stronghypothesis for many years that as we dissect complex traits into more
circuitry replicated in 455 twins, NeuroImage (2011), doi:10.1016/j.

7M.-C. Chiang et al. / NeuroImage xxx (2011) xxx–xxx
and more basic endophenotypes, gene effects will become larger, andsomerecentwork supports this (Benyaminet al., 2009).We suggest thatthe phenotypeswe report here are just such fundamental elements andthat our findings of relatively large gene effects are not surprising. Evenso, the BDNF gene affects the cortical gray matter and intellectualperformance (Egan et al., 2003; Hariri et al., 2003; Pezawas et al., 2004),so it unquestionably plays a critical role in the aspects of white mattermicrostructure that are relevant for intellectual performance.
Acknowledgements
This study was supported by the National Institute of Child Healthand Human Development, USA, and the National Health and MedicalResearch Council, Australia. IQ data collection and zygosity typing wassupported by the Australian Research Council. Additional support foralgorithm development was provided by the NIA, NIBIB, and theNational Center for Research Resources. We are grateful to the twinsfor participating, to the radiographer, Matt Meredith, Centre forMagnetic Resonance, University of Queensland, for image acquisition,and research nurses, Marlene Grace and Ann Eldridge, QueenslandInstitute of Medical Research, for twin recruitment.
References
Abecasis, G.R., Cardon, L.R., Cookson, W.O., 2000. A general test of association forquantitative traits in nuclear families. Am. J. Hum. Genet. 66, 279–292.
Alam, T., Tost, H., Geramita, M., Rebsch, C., Bhaskar, K., Lemaitre, H., Barnett, A.,Dickinson, D., Weinberger, D., Marenco, S., 2010. Impact of the BDNF Val66Metpolymorphism on white matter tract integrity in healthy humans. 16th AnnualMeeting of the Organization of Human Brain Mapping, Barcelona, Spain, June 6-10.
Alexander, D.C., Pierpaoli, C., Basser, P.J., Gee, J.C., 2001. Spatial transformations ofdiffusion tensor magnetic resonance. IEEE Trans. Med. Imaging 20, 1131–1139.
Arbuthnott, E.R., Boyd, I.A., Kalu, K.U., 1980. Ultrastructural dimensions of myelinatedperipheral nerve fibres in the cat and their relation to conduction velocity. J.Physiol. 308, 125–157.
Arsigny, V., Fillard, P., Pennec, X., Ayache, N., 2005. Fast and simple calculus on tensorsin the log-Euclidean framework. Int. Conf. Med. Image Comput. Comput. Assist.Interv. MICCAI 8, 115–122.
Ashburner, J., Friston, K.J., 2000. Voxel-based morphometry—the methods. Neuroimage11, 805–821.
Basser, P.J., Pierpaoli, C., 1996. Microstructural and physiological features of tissueselucidated by quantitative-diffusion-tensor MRI. J. Magn. Reson. B 111, 209–219.
Beaulieu, C., 2002. The basis of anisotropic water diffusion in the nervous system—atechnical review. NMR Biomed. 15, 435–455.
Behrens, T.E., Berg, H.J., Jbabdi, S., Rushworth, M.F., Woolrich, M.W., 2007. Probabilisticdiffusion tractography with multiple fibre orientations: what can we gain?Neuroimage 34, 144–155.
Benjamini, Y., Hochberg, Y., 1995. Controlling the false discovery rate: a practical andpowerful approach to multiple testing. J. R. Statist. Soc. B. 57, 289–300.
Benyamin, B., McRae, A.F., Zhu, G., Gordon, S., Henders, A.K., Palotie, A., Peltonen, L.,Martin, N.G., Montgomery, G.W., Whitfield, J.B., Visscher, P.M., 2009. Variants in TFand HFE explain approximately 40% of genetic variation in serum-transferrin levels.Am. J. Hum. Genet. 84, 60–65.
Chen, Z.Y., Jing, D., Bath, K.G., Ieraci, A., Khan, T., Siao, C.J., Herrera, D.G., Toth, M., Yang,C., McEwen, B.S., Hempstead, B.L., Lee, F.S., 2006. Genetic variant BDNF (Val66Met)polymorphism alters anxiety-related behavior. Science 314, 140–143.
Chiang, M.C., Dutton, R.A., Hayashi, K.M., Lopez, O.L., Aizenstein, H.J., Toga, A.W., Becker,J.T., Thompson, P.M., 2007. 3D pattern of brain atrophy in HIV/AIDS visualized usingtensor-based morphometry. Neuroimage 34, 44–60.
Chiang, M.C., Barysheva, M., Shattuck, D.W., Lee, A.D., Madsen, S.K., Avedissian, C.,Klunder, A.D., Toga, A.W., McMahon, K.L., de Zubicaray, G.I., Wright, M.J., Srivastava,A., Balov, N., Thompson, P.M., 2009. Genetics of brain fiber architecture andintellectual performance. J. Neurosci. 29, 2212–2224.
Chumbley, J.R., Friston, K.J., 2009. False discovery rate revisited: FDR and topologicalinference using Gaussian random fields. Neuroimage 44, 62–70.
Chumbley, J., Worsley, K., Flandin, G., Friston, K., 2010. Topological FDR forneuroimaging. Neuroimage 49, 3057–3064.
Please cite this article as: Chiang, M.-C., et al., BDNF gene effects on brainneuroimage.2010.12.053
Egan, M.F., Goldberg, T.E., Kolachana, B.S., Callicott, J.H., Mazzanti, C.M., Straub, R.E.,Goldman, D., Weinberger, D.R., 2001. Effect of COMT Val108/158 Met genotype onfrontal lobe function and risk for schizophrenia. Proc. Natl Acad. Sci. USA 98,6917–6922.
Egan, M.F., Kojima, M., Callicott, J.H., Goldberg, T.E., Kolachana, B.S., Bertolino, A.,Zaitsev, E., Gold, B., Goldman, D., Dean, M., Lu, B., Weinberger, D.R., 2003. The BDNFval66met polymorphism affects activity-dependent secretion of BDNF and humanmemory and hippocampal function. Cell 112, 257–269.
Fields, R.D., 2005. Myelination: an overlooked mechanism of synaptic plasticity?Neuroscientist 11, 528–531.
Friston, K.J., Worseley, K.J., Frackowiak, R.S.J., Mazziotta, J.C., Evans, A.C., 1994. Assessingthe significance of focal activations using their spatial extent. Hum. Brain Mapp. 1,210–220.
Hansell, N.K., James, M.R., Duffy, D.L., Birley, A.J., Luciano, M., Geffen, G.M., Wright, M.J.,Montgomery, G.W., Martin, N.G., 2007. Effect of the BDNF V166M polymorphism onworking memory in healthy adolescents. Genes Brain Behav. 6, 260–268.
Hariri, A.R., Goldberg, T.E., Mattay, V.S., Kolachana, B.S., Callicott, J.H., Egan, M.F.,Weinberger, D.R., 2003. Brain-derived neurotrophic factor val66met polymor-phism affects human memory-related hippocampal activity and predicts memoryperformance. J. Neurosci. 23, 6690–6694.
Haseman, J.K., Elston, R.C., 1972. The investigation of linkage between a quantitativetrait and a marker locus. Behav. Genet. 2, 3–19.
Hibar, D., Stein, J.L., Jahanshad, N., Barysheva, M., Feng, A., Kogachi, S., McMahon, K.L., deZubicaray, G.I., Hansell, N.K., Martin, N.G., Wright, M.J., Toga, A.W., Thompson, P.,2010. Voxelwise genome-wide association of Diffusion Tensor Images identifiesputative novel variants influencing white matter integrity in 467 related youngadults. 40th Annual Meeting of the Society for Neuroscience, San Diego, CA,November 13-17.
Holmes, C.J., Hoge, R., Collins, L., Woods, R., Toga, A.W., Evans, A.C., 1998. Enhancementof MR images using registration for signal averaging. J. Comput. Assist. Tomogr. 22,324–333.
Jackson, D.N., 1984. MAB, Multidimensional Aptitude Battery: Manual. ResearchPsychologists Press, Port Hurton, Michigan.
Jenkinson, M., Smith, S., 2001. A global optimisation method for robust affineregistration of brain images. Med. Image Anal. 5, 143–156.
Li, J., Yu, C., Li, Y., Liu, B., Liu, Y., Shu, N., Song, M., Zhou, Y., Zhu, W., Li, K., Jiang, T., 2009.COMT val158met modulates association between brain white matter architectureand IQ. Am. J. Med. Genet. B Neuropsychiatr. Genet. 150B, 375–380.
Pezawas, L., Verchinski, B.A., Mattay, V.S., Callicott, J.H., Kolachana, B.S., Straub, R.E.,Egan, M.F., Meyer-Lindenberg, A., Weinberger, D.R., 2004. The brain-derivedneurotrophic factor val66met polymorphism and variation in human corticalmorphology. J. Neurosci. 24, 10099–10102.
Poo, M.M., 2001. Neurotrophins as synaptic modulators. Nat. Rev. Neurosci. 2, 24–32.Rudge, P., Warrington, E.K., 1991. Selective impairment of memory and visual
perception in splenial tumours. Brain 114 (Pt 1B), 349–360.Schmithorst, V.J., Wilke, M., 2002. Differences in white matter architecture between
musicians and non-musicians: a diffusion tensor imaging study. Neurosci. Lett. 321,57–60.
Shimizu, E., Hashimoto, K., Iyo, M., 2004. Ethnic difference of the BDNF 196 G/A(val66met) polymorphism frequencies: the possibility to explain ethnic mentaltraits. Am. J. Med. Genet. B Neuropsychiatr. Genet. 126B, 122–123.
Slinker, B.K., Glantz, S.A., 1985. Multiple regression for physiological data analysis: theproblem of multicollinearity. Am. J. Physiol. 249, R1–R12.
Smith, S.M., 2002. Fast robust automated brain extraction. Hum. Brain Mapp. 17,143–155.
Smith, S.M., Jenkinson, M., Johansen-Berg, H., Rueckert, D., Nichols, T.E., Mackay, C.E.,Watkins, K.E., Ciccarelli, O., Cader, M.Z., Matthews, P.M., Behrens, T.E., 2006. Tract-based spatial statistics: voxelwise analysis of multi-subject diffusion data. Neuro-image 31, 1487–1505.
Takahashi, M., Hackney, D.B., Zhang, G., Wehrli, S.L., Wright, A.C., O'Brien, W.T.,Uematsu, H., Wehrli, F.W., Selzer, M.E., 2002. Magnetic resonance microimaging ofintraaxonal water diffusion in live excised lamprey spinal cord. Proc. Natl Acad. Sci.USA 99, 16192–16196.
Tuch, D.S., Salat, D.H., Wisco, J.J., Zaleta, A.K., Hevelone, N.D., Rosas, H.D., 2005. Choicereaction time performance correlates with diffusion anisotropy in white matterpathways supporting visuospatial attention. Proc. Natl Acad. Sci. USA 102,12212–12217.
Van Steen, K., McQueen, M.B., Herbert, A., Raby, B., Lyon, H., Demeo, D.L., Murphy, A., Su,J., Datta, S., Rosenow, C., Christman, M., Silverman, E.K., Laird, N.M., Weiss, S.T.,Lange, C., 2005. Genomic screening and replication using the same data set infamily-based association testing. Nat. Genet. 37, 683–691.
Visscher, P.M., 2008. Sizing up human height variation. Nat. Genet. 40, 489–490.Vonesh, E.F., Carter, R.L., 1992. Mixed-effects nonlinear regression for unbalanced
repeated measures. Biometrics 48, 1–17.
circuitry replicated in 455 twins, NeuroImage (2011), doi:10.1016/j.