the circuitry of abulia: insights from functional connectivity mri
TRANSCRIPT

1
2
3
456
7
89101112
13141516171819
35
36
3738
39
40
41
42
43
44
45
46
47
48
49
50
51
52
53
54
NeuroImage: Clinical xxx (2014) xxx–xxx
YNICL-00360; No. of pages: 7; 4C:
Contents lists available at ScienceDirect
NeuroImage: Clinical
j ourna l homepage: www.e lsev ie r .com/ locate /yn ic l
The circuitry of abulia: Insights from functional connectivity MRI
OF
J.S. Siegela, A.Z. Snydera,b, N.V. Metcalfa, R.P. Fucetolaa, C.D. Hackera, J.S. Shimonyb,G.L. Shulmana, M. Corbettaa,b,c,*
aDepartment of Neurology, Washington University School of Medicine at Washington University, St. Louis, MO, USAbMallinckrodt Institute of Radiology, Washington University School of Medicine, Washington University, St. Louis, MO, USAcDepartment of Anatomy & Neurobiology, Washington University School of Medicine, Washington University, St. Louis, MO, USA
* Corresponding author at: Department of Neurology, WMedicine, Box 8111, 4525 Scott Ave, St. Louis, MO 63110,
E-mail address: [email protected] (J.S. Siegel), [email protected] (N.V. Metcalf), [email protected]@wusm.wustl.edu (C.D. Hacker), [email protected]@npg.wustl.edu (G.L. Shulman), [email protected]
http://dx.doi.org/10.1016/j.nicl.2014.09.0122213-1582/© 2014 Published by Elsevier Inc. This is an op
Please cite this article as: Siegel, J.S., et al., Thdx.doi.org/10.1016/j.nicl.2014.09.012
Oa b s t r a c t
a r t i c l e i n f o20
Article history:21
22Q223
24
25
26
27
28
29
30
31
ED P
RReceived 16 June 2014Received in revised form 18 September 2014Accepted 18 September 2014Available online xxxx
Keywords:AbuliaExecutive functionAnterior cingulateFunctional connectivityfMRIapathy
Background: Functional imaging and lesion studies have associated willed behavior with the anterior cingulatecortex (ACC). Abulia is a syndrome characterized by apathy and deficiency of motivated behavior. Abulia notonly is most frequently associated with ACC damage, but also occurs following damage to subcortical nuclei(striatum, globus pallidus, thalamic nuclei). We present resting state functional connectivity MRI (fcMRI) datafrom an individual who suffered a stroke leading to abulia. We hypothesized that, although structural imagingrevealed no damage to the patient3s ACC, fcMRI would uncover aberrant function in this region and in the rele-vant cortical networks.Methods:Resting state correlations in the patient3s graymatter were compared to those of age-matched controls.Using a novel method to identify abnormal patterns of functional connectivity in single subjects, we identifiedareas and networks with aberrant connectivity.Results: Networks associated with memory (default mode network) and executive function (cingulo-opercularnetwork)were abnormal. The patient3s anterior cingulatewas among the areas showing aberrant functional con-
32
33
34
Tnectivity. In a rescan 3 years later, deficits remained stable and fcMRI findings were replicated.Conclusions: These findings suggest that the aberrant functional connectivity mapping approach described maybe useful for linking stroke symptoms to disrupted network connectivity.
C© 2014 Published by Elsevier Inc. This is an open access article under the CC BY-NC-ND license(http://creativecommons.org/licenses/by-nc-nd/3.0/).
E55
56
57
58
59
60
61
62
63
64
65
66
67
68
69
UNCO
RR1. Introduction
Historically, neurologists have struggled to reconcile the principle offunctional localization and the observation that the relationship be-tween behavioral deficits and anatomical damage is only partial. Amore modern view is that functionality is represented in distributedfunctional systems and their internal connections. And a growingbody of evidence demonstrates that remote dysfunction can occur in re-gions functionally connected to – but outside of – the area of lesion.Resting state functional connectivity magnetic resonance imaging(fcMRI) can measure widely distributed brain networks and offers apromising avenue of investigation into ways in which injury anddisease affect the connectivity of the brain. Numerous studies havefound a correspondence between behavioral measures and brainconnectivity (Vaidya and Gordon, 2013). Moreover, previous stroke
70
71
72
73
74
75
76
ashington University School [email protected] (A.Z. Snyder),wustl.edu (R.P. Fucetola),ustl.edu (J.S. Shimony),du (M. Corbetta).
en access article under the CC BY-NC
e circuitry of abulia: Insights f
research has shown that deficits within attention networks are predic-tive of spatial neglect and that deficits in motor networks are predictiveof motor deficits (He, 2007; Carter, 2010; Van Meer, 2010). In thepresent case study of a patient with abulia following stroke, we employfcMRI to map functional abnormalities by comparison with age-matched controls.
Abulia is characterized by the lack of spontaneous, goal-directed be-havior. Clinically, it falls between apathy and akinetic mutism on a con-tinuum of disorders of drive and motivation (Barris and Schuman,1953). Abulia is most commonly associated with lesions of the anteriorcingulate cortex (ACC) (Cohen, 1999). This association is consistentwith neuroimaging evidence linking the ACC to the initiation of goal-directed behavior (Carter et al., 1999). However, abulia or some degreeof apathy is also caused by subcortical lesions of the anterior thalamus,caudate nucleus, globus pallidus, and internal capsule (for a review ofabulia see Vijayaraghavan et al., 2002; Ghoshal et al., 2011; Jorge et al.,2010). It is therefore likely that a more accurate functional localizationof abulia, and related deficits of willed behavior, involves a network-level dysfunction. A number of networks (fronto-parietal, cingulo-opercular, ventral attention network) have been recently described inrelation to executive control (Corbetta et al., 2008; Dosenbach, 2007;Seeley, 2007; Vincent et al., 2008).
-ND license (http://creativecommons.org/licenses/by-nc-nd/3.0/).
rom functional connectivity MRI, NeuroImage: Clinical (2014), http://
TED P
RO
OF
77
78
79
80
81
82
83
84
85
86
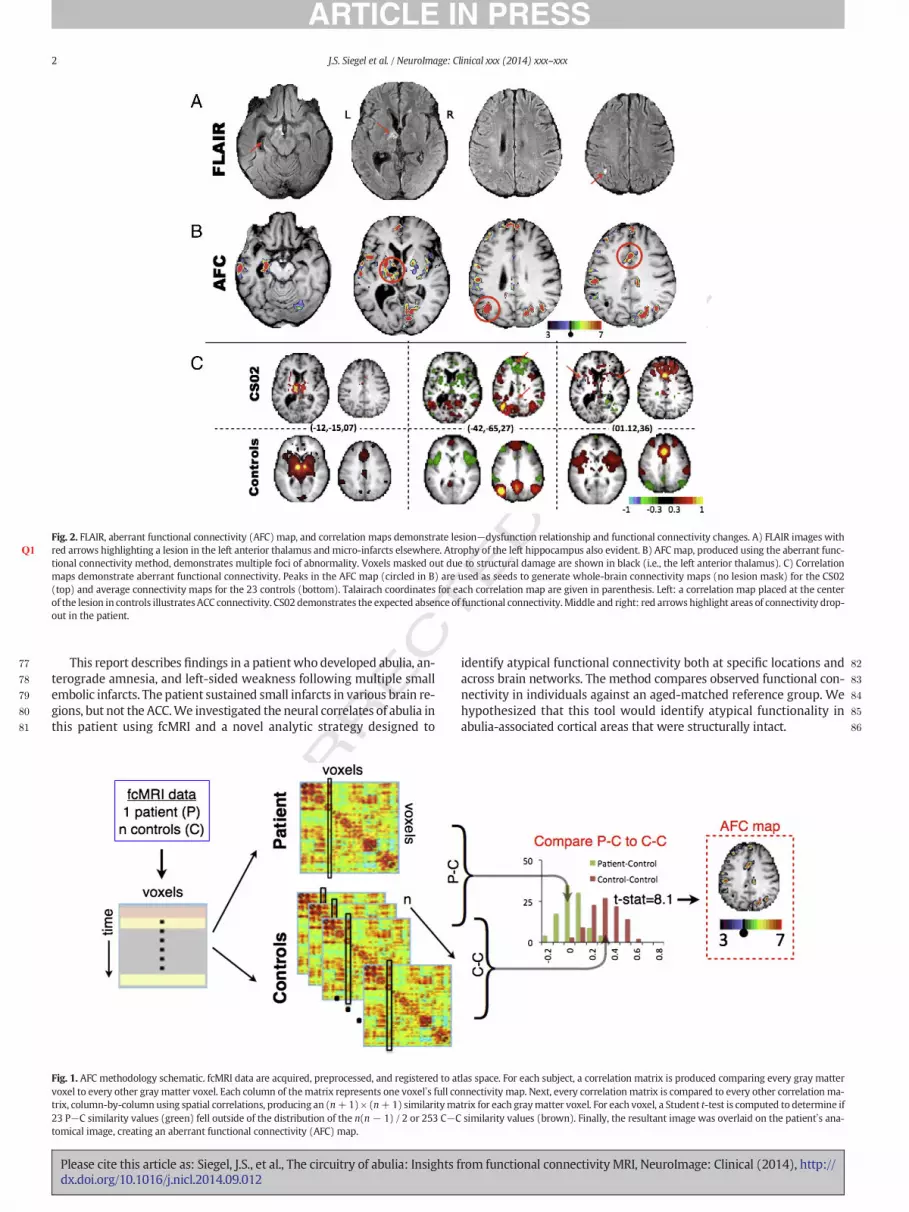
Fig. 2. FLAIR, aberrant functional connectivity (AFC) map, and correlation maps demonstrate lesion−dysfunction relationship and functional connectivity changes. A) FLAIR images withred arrows highlighting a lesion in the left anterior thalamus and micro-infarcts elsewhere. Atrophy of the leftQ1 hippocampus also evident. B) AFC map, produced using the aberrant func-tional connectivity method, demonstrates multiple foci of abnormality. Voxels masked out due to structural damage are shown in black (i.e., the left anterior thalamus). C) Correlationmaps demonstrate aberrant functional connectivity. Peaks in the AFC map (circled in B) are used as seeds to generate whole-brain connectivity maps (no lesion mask) for the CS02(top) and average connectivity maps for the 23 controls (bottom). Talairach coordinates for each correlation map are given in parenthesis. Left: a correlation map placed at the centerof the lesion in controls illustrates ACC connectivity. CS02 demonstrates the expected absence of functional connectivity.Middle and right: red arrows highlight areas of connectivity drop-out in the patient.
2 J.S. Siegel et al. / NeuroImage: Clinical xxx (2014) xxx–xxx
ECThis report describes findings in a patientwho developed abulia, an-
terograde amnesia, and left-sided weakness following multiple smallembolic infarcts. The patient sustained small infarcts in various brain re-gions, but not the ACC.We investigated the neural correlates of abulia inthis patient using fcMRI and a novel analytic strategy designed to
UNCO
RR
Fig. 1. AFC methodology schematic. fcMRI data are acquired, preprocessed, and registered to avoxel to every other gray matter voxel. Each column of thematrix represents one voxel3s full cotrix, column-by-columnusing spatial correlations, producing an (n+1)× (n+1) similarityma23 P−C similarity values (green) fell outside of the distribution of the n(n− 1) / 2 or 253 C−Ctomical image, creating an aberrant functional connectivity (AFC) map.
Please cite this article as: Siegel, J.S., et al., The circuitry of abulia: Insights fdx.doi.org/10.1016/j.nicl.2014.09.012
identify atypical functional connectivity both at specific locations andacross brain networks. The method compares observed functional con-nectivity in individuals against an aged-matched reference group. Wehypothesized that this tool would identify atypical functionality inabulia-associated cortical areas that were structurally intact.
tlas space. For each subject, a correlation matrix is produced comparing every gray matternnectivity map. Next, every correlation matrix is compared to every other correlationma-trix for each graymatter voxel. For each voxel, a Student t-test is computed to determine ifsimilarity values (brown). Finally, the resultant image was overlaid on the patient3s ana-
rom functional connectivity MRI, NeuroImage: Clinical (2014), http://

TED P
RO
OF
87
88
89
90
91
92
93
94
95
96
97
98Q3
99
100
101
102
103
104
105
106
107
108
109
110
111
112
113
114
115
116
117
118
119
120
121
122
123
124
125Q4
126
127
128
129
130
131
132
133
134
135
136
137
138
139
140
141
142
143
144
145
146
147
148
149
150
151
152
153
154
155
156
157
158
159
160
161
t1:1Table 1t1:2Neuropsychological data. Normalized scores are based on an age and demographic adjust-t1:3ed population with a mean of 50 and a standard deviation of 10. In rows in which twot1:4scores are given, the first is performance at scan 1 (2009) and the second is performancet1:5at scan 2 (2012). In all other rows, data were only available from 2012. Indices fort1:6which the patient fell outside the confidence interval of healthy controls are highlighted.t1:7D-KEFS = Delis−Kaplan executive function system; BVMT = brief visuospatial memoryt1:8test; HVLT = Hopkins verbal learning test.
t1:10Patient score
t1:11Self-rating Apathy 68t1:12Disinhibition 58t1:13Executive dysfunction 67t1:14Total Score 67t1:15Family rating Apathy 110t1:16Disinhibition 55t1:17Executive dysfunction 75t1:18Total score 85t1:19Executive function Animal naming 21, 33t1:20WISC-III mazes 48t1:21Iowa gambling test 41t1:22D-KEFS word context 47t1:23D-KEFS tower test 37t1:24D-KEFS letter fluency 33t1:25Category fluency 20t1:26Category switching 27t1:27Memory BVMT total immediate recall 53, 55t1:28BVMT learning 60, 47t1:29BVMT delayed recall 61, 57t1:30HVLT learning 33, 46t1:31HVLT total immediate recall 32, 29t1:32HVLT delayed recall 13, 18t1:33HVLT recognition hits −14, 17t1:34Spatial span forward 44, 49t1:35Spatial span backward 65, 45t1:36Motor Grip strength L hand (kg) 40, 41t1:37Grip strength R hand (kg) 56, 46t1:389-Hole peg L (pegs/second) 28, 21t1:399-Hole peg R (pegs/second) 63, 61t1:40Motricity index left leg −88, −97t1:41Motricity index right leg 53, 53t1:42Combined index FIM walk + timed walk 15, 15t1:43Language Word comprehension 59, 48t1:44Commands 53, 53t1:45Complex ideational material 60, 2t1:46Boston naming test 53, 53t1:47Oral reading of sentences 57, 57t1:48Comprehension of oral reading of sentences 53, 15t1:49Nonword reading 57, 57t1:50Stem completion 60, 60t1:51Attention Mesulam total misses 59, 45t1:52Posner RT 56, 55t1:53Posner accuracy 55, 55t1:54Posner RT VF effect 56, 57t1:55Posner RT validity effect 65, 67t1:56Social cognition Affect naming 50t1:57Prosody comprehension 57t1:58Pairs comprehension 50t1:59Faces immediate recognition 33t1:60Faces delayed recognition 43
3J.S. Siegel et al. / NeuroImage: Clinical xxx (2014) xxx–xxx
UNCO
RREC
2. Case history
A 38-year-old right-handed male lawyer (CS02) presented in theemergency room in December of 2005 with febrile illness and progres-sive unresponsiveness. The patient was hypoxemic and in septic shocksecondary to infectious endocarditis of the aortic and mitral valves. CTand MRI revealed multiple small embolic strokes as well as a left sub-dural hematoma. CS02 remained in a vegetative state for severalweeks. He underwent aortic and mitral valve replacement 6 weekspost-onset, and acute inpatient rehabilitation at the Rehabilitation Insti-tute of St. Louis for about 3weeks. He continued to show improvementsin cognitive function over the subsequent 3 months. FLAIR MRI imagestaken about 3 months post-onset (Fig. 2A) showed areas of hyper-intensity in the left hippocampal formation, anterior thalamus, and infe-rior parietal lobe. Other lesions were present in the right occipital lobe,bilateral basal ganglia, right motor cortex, and right cerebellum.
Subsequent evaluations indicated that the patient3s residual deficitsincluded abulia, anterograde amnesia, left motor weakness and lefthomonymous upper quadrantanopia. This clinical picture was stablefrom May 2006 through the dates of functional imaging and neuropsy-chological assessment in October 2009 and again in December 2012.
Before the illness, CS02 was a highly intelligent, successful district at-torney, with an active social life. He was passionate about history, base-ball, and was an excellent golfer. After his illness, he was unable toreturn to the practice of law or live independently. He currently liveswith his parents, manages his own finances, and spends his time readingandwatching television. He still enjoys playing golf and remains a skilledgolfer. He likes to exercise andwill participate in cardio-vascular trainingif brought to a gymnasium. He is well groomed and socially appropriate,but rarely speaks spontaneously. When addressed, he answers terselyand concretely. His emotional range is restricted with absent or minimalpositive or negative affect. He will engage in a game of catch as long asballs are thrown to him. He retains an excellent memory for past events,facts, and pictures, but he has trouble learning new verbal information.He retains an interest in baseball statistics,which he continues to acquire.
For the last 7 years (2006–2013), CS02 has been seen twice a year inthe Cognitive Neurology Clinic (Dr. Corbetta). CSO2 has been tried onmultiple medications in isolation or combination including dopaminer-gic agonists (L-Dopa; amantadine); stimulants (methylphenidate;nicotine); a cholinergic agent (donepezil); and, a nootropic agent(piracetam) with no significant change in his behavior.
3. Methods
3.1. Subjects and MRI acquisition and preprocessing
CS02, and 23 control subjects within 10 years of age of the patientandwithout any neurologic or psychiatric history were studied. All par-ticipants provided informed consent in accordancewith the Declarationof Helsinki. All study procedures were approved by the WashingtonUniversity School of Medicine (WUSM) Institutional Review Board.CS02, as well as 14 of the 23 control subjects, underwent a comprehen-sive neuropsychological and behavioral evaluation in the domains oflanguage, memory, attention, and motor function at the time of thefMRI. CS02 additionally underwent campimetry to identify visual fieldcuts. All structural and resting state scans were acquired on a SiemensTim-Trio 3 T Scanner. Scanning parameters were identical for both ofthe patient3s visits and for all controls. Following atlas transformationof all fMRI data, functional connectivity was assessed in CS02 and allcontrols within a mask that included gray matter voxels and excludedareas of lesion (see Supplementary methods).
3.2. Aberrant functional connectivity
Aberrant functional connectivity (AFC)mapping is a novel approachthat compares an individual (i.e., the patient) to healthy controls (see
Please cite this article as: Siegel, J.S., et al., The circuitry of abulia: Insights fdx.doi.org/10.1016/j.nicl.2014.09.012
Supplementary methods and Fig. 1 for a detailed description of this ap-proach). Voxel-wise correlationmatrices were computed by correlatingthe time series within each gray-matter voxel (excluding those lesionedin the patient) against all other gray-matter voxels. For each voxel in thepatient, the correlation map was compared to that of each control sub-ject using spatial correlation. This comparison generated a t-statisticmap representing the degree to which the patient differed from the ref-erence population. To evaluate statistical significance, the same analysiswas performed on the controls, treating each of the control subjectsas a surrogate patient. The resulting AFC maps were explored using a1) seed-based analysis and 2) a network-based analysis. In both cases,a t-score threshold (t = 4.8) was chosen to define ‘AFC+’ voxels basedon significance after multiple comparisons correction (p = 1.3e−6).
The Yeo (2011) seven-network cortical mapwas used to define net-works (Yeo, 2011). Six sub-networks were included: the default mode
rom functional connectivity MRI, NeuroImage: Clinical (2014), http://

T
162
163
164
165
166
167
168
169
170
171
172
173
174
175
176
177
178
179
180
181
182
183
184
185
186
187
188
189
190
191
192
193
194
195
196
197
198
199
200
201
202
203
204
205
206
207
208
209
210
211
212
213
214
215
216
217
218
219
220
221
222
223
224
225
226
227
228
229
230
231
232
233
234
235
4 J.S. Siegel et al. / NeuroImage: Clinical xxx (2014) xxx–xxx
EC
network (DMN), cingulo-opercular network (CON), motor network,dorsal attention network (DAN), fronto-parietal network (FPN), andvisual network. The seventh network was excluded as it is comprisedof ventral areas affected by susceptibility inhomogeneity artifact(Ojemann, 1997). TheAFCmapwas thresholded and voxelswere talliedaccording to network affiliation. In the region-based analysis, a peakfinding algorithm was applied to the AFC map to define spherical re-gions of interest (ROIs) that showed significant difference from controls(high AFC scores). ROIs were then used to generate correlation maps.Seed-based correlation maps enabled qualitative inspection of FCabnormalities.
A number of follow-up experimentswere run to validate the AFC re-sults. CS02was brought back for additional functional imaging and neu-ropsychological testing evaluation 3 years after the initial scan. Aftermasking out non-brain and lesioned voxels, spatial correlation betweenpairs of AFC maps was computed. Both fcMRI scans were split in halfand within-scan correlation (between AFC maps generated with datafrom halves of the scan) and between-scan (between AFC mapsgenerated 3 years apart) correlations were computed. Additionally, A2-flourodeoxy-D-glucose (FDG) positron emission tomography (PET)scan of CS02 was obtained using a Siemens EXACT 962 HR+ scannerwhile the patient was resting with his eyes closed.
4. Results
4.1. Neuropsychological evaluation identified abulia and anterogradeamnesia
The patient showed low scores on standardized measures of execu-tive functions, as well as anterograde verbal memory and left-sidedmotor deficits (Table 1). The patient self-reportedmild elevations in ap-athy and executive dysfunction, but collateral sources reported farmoresignificant apathy. On the basis of these results and clinical evaluation, adiagnosis was made of abulia and moderate anterograde amnesia.
4.2. Aberrant functional connectivity (AFC)
Quality control metrics confirmed that atlas registration, fMRI signalproperties, subject headmotion, and brain-wide functional connectivitywere within the range of the 23 controls (Table S1). The ‘patient’ corre-lation matrix was then compared to ‘control’ correlation matrices
UNCO
RR
Fig. 3. Left DMN, CON, andmotor networks show the largest degree of disruption. Voxels with sNetworks are additionally split by hemisphere (hemi-networks). In order to account for differegreater than 4.8. Light gray bars display CS02 AFC results averaged over visits 1 and 2.White baError lines represent upper 95% confidence intervals. Asterisks indicate hemi-networks in wdefault mode network (DMN), cingulo-opercular network (CON), motor network, dorsal attenof AFC+ voxels in the patient and controls is shown in the far right.
Please cite this article as: Siegel, J.S., et al., The circuitry of abulia: Insights fdx.doi.org/10.1016/j.nicl.2014.09.012
OO
F
(Fig. 1). The patient was individually compared to every control on acolumn-by-column basis using spatial correlation, thereby producing apatient-to-control (P−C) similarity image (1 × 34,428). The same com-parison was computed between every pair of controls, producingn ⋅ (n − 1) / 2 control-to-control C−C similarity images. For each ofthe 34,428 voxels, a Student t-test was computed comparing P−Cvalues to C−C values. The t-test was chosen after both groupswere shown to have normally distributed data (not shown). An imageof t-scores throughout the brain could then be overlaid on the patient3sanatomical image, creating an aberrant functional connectivitymap (AFC map). A t-score threshold (t = 4.8) was chosen to define‘AFC+’ voxels by calculating significance after multiple comparisons(p = 1.3e−6).
Inline Supplementary Table S1 can be found online at http://dx.doi.org/10.1016/j.nicl.2014.09.012.
Fig. 2B shows the patient3s AFC t-score map. Overall, the patientshowed greater number of AFC+ voxels than 22 out of the 23 controls(Fig. S1B). Areas of aberrant functional connectivity (AFC+) were ob-served near as well as distant to structural lesions. Regions showing ab-errant functional connectivity included the left hippocampus, leftthalamus surrounding the thalamic lesion, left inferior parietal lobule,and anterior cingulate cortex.
ED P
R
4.3. Seed-based correlation mapping
A subset of AFC+ regions (red circles in Fig. 2B) was selected to rep-resent resting state networks that, in subsequent analyses, were shownto be especially aberrant in this patient. These regionswere used to gen-erate correlations maps to elucidate changes to functional connectivitypatterns in AFC+ regions (Fig. 2C). The left panel in Fig. 2C shows thecorrelation map corresponding to a seed in the lesioned left thalamus.The result obtained in the controls demonstrates functional connectivi-ty with the anterior cingulate cortex in addition to the homotopic thal-amus. By comparison, the result obtained in CS02 demonstrates theexpected absence of functional connectivity. The middle panel showsmaps obtained with a seed in the inferior parietal lobule. Controlsshow a well-defined DMN including anticorrelations with the cingulo-opercular network (CON). CS02 shows a less well-defined DMN withabnormal anticorrelation between the IPL and the frontal pole. Theright panel shows maps obtained with a seed in the ACC. Controls
ignificant AFC scores are classified based on the seven-network parcellation of Yeo (2011).nce in network sizes, results are displayed as the percent of each network with AFC t-scorers represent the network breakdown of aberrant functional connectivity in the 23 controls.hich CS02 shows disruption outside of the 95% CI of controls. The parcellation includestion network (DAN), fronto-parietal network (FPN), and visual network. The total percent
rom functional connectivity MRI, NeuroImage: Clinical (2014), http://

T
OF
236
237
238
239
240
241
242
243
244
245
246
247
248
249
250
251
252
253
254
255
256
257
258
259
260
261
262
263
264
265
266
267
268
269
270
271
272
273
274
275
276
277Q6
278
279
280
281
282
283
284
285
286
287
288
289
290
291
292
293
294
295
296
297
298
299
300
301
302
303
304
305
306
307
308
309
310
311
312
313
Fig. 4. Reproducibility of AFC maps at 3 year follow up. A) A visual comparison of AFC results from visit 1 and visit 2. The Pearson correlation between AFC maps is 0.5937. B) Pearsoncorrelations for CS02 between AFC maps generated from half scans (‘within scan’) and AFCmaps generated 3 years apart (‘between scan’) are shown and spatial correlation between dif-ferent control subjects3 AFC maps (‘between subjects’) is given as a control. Correlations between halves were 0.81 and 0.80 for visits 1 and 2 respectively.
5J.S. Siegel et al. / NeuroImage: Clinical xxx (2014) xxx–xxx
UNCO
RREC
show awell-defined CON, with strong bilateral anterior insula function-al connectivity with the dorsal ACC. None of these features are evidentin CS02. Instead, CS02 shows diffuse connectivity with anterior portionsof the frontal lobe. For comparison, some single control subject correla-tion maps are shown in Fig. S3. Fig. S3 additionally shows connectivityfrom the AFC+ left anterior thalamus is disrupted for CS02 relativecontrols.
4.4. Network-based analysis
Distribution of AFC+ voxels across a seven network parcellationswas assessed. Results were averaged between the patient3s two visitsand compared to averages across the 23 controls (Yeo, 2011). Whenmeasured as percentage of network disrupted, the left default, bilateralcingulo-opercular, right motor network, and right visual networkshowed significant abnormality compared to controls (Fig. 3). In con-trols, roughly 5% of voxels were above the AFC+ threshold. On average,these were evenly distributed across the resting state networks.
4.5. Rescan and within-scan validation
The within-scan spatial correlation was 0.81 and 0.80 for visits oneand two respectively. The between-scan (3 years apart) spatial correla-tion was 0.60. Dominant patterns of aberrant functional connectivityremained qualitatively similar (Fig. 4A). For comparison, spatial correla-tion between control subjects3 AFCmapswasmeasured. Spatial correla-tion between pairs of controls was 0.01 (s.d. = 0.07), demonstratingthat within-scan and between-scan correlation for CS02 is well abovebetween-subject correlation (Fig. 4B). These results show that AFC re-sults in CS02 are consistent and reproducible.
AFC t-score distributions were generated for both scans ofCS02 (Fig. S1) and for controls. A t-test comparing rightward skew-ness between CS02 (both scans) and 23 controls yielded p = 0.0565(t = 1.6579, df = 23). This result means that the number of AFC+voxels throughout the brain of CS02 was greater than that of controls,although the difference did not reach statistical significance.
Inline Supplementary Fig. S1 can be found online at http://dx.doi.org/10.1016/j.nicl.2014.09.012.
4.6. Positron emission tomography
FDG PET scans were acquired to compare functional connectivity tometabolic activity (Fig. S2). No significant relationship between PET-FDG and AFC scores was observed (p-value = 0.274).
Please cite this article as: Siegel, J.S., et al., The circuitry of abulia: Insights fdx.doi.org/10.1016/j.nicl.2014.09.012
ED P
RO
Inline Supplementary Fig. S2 can be found online at http://dx.doi.org/10.1016/j.nicl.2014.09.012.
5. Discussion
Abulia not only is most commonly associated with lesions of the an-terior cingulate cortex (ACC), but also has been described in associationwith a variety of subcortical lesions (Vijayaraghavan et al., 2002;Ghoshal et al., 2011; Jorge et al., 2010). These observations raise thequestion of whether common circuitry is disrupted by both types of le-sion. It has been suggested that disconnections of limbic tractsprojecting from the anterior thalamus to the cingulatemight cause abu-lia (Mega and Cummings, 1994; Mega and Cohenour, 1997). This is thefirst study to directly support this hypothesis. Our findings suggest that,even in the absence of cingulate damage, abulia with anterograde am-nesia is associated with disruption of functional network organizationincluding the cingulate cortex. Furthermore, among the various recentlyproposed ‘executive’ networks (Corbetta et al., 2008; Dosenbach, 2007;Seeley, 2007; Vincent et al., 2008), AFC identified the cingulo-opercularnetwork asmost closely affected in a case inwhichmotivational behav-ior is severely disrupted.
5.1. Case summary — links to behavior
CS02 sustained multiple embolic strokes that resulted in profoundabulia, anterograde amnesia, left motor weakness, and left homony-mous upper quadrantanopia. Some of these deficits could be explainedin terms of focal damage (i.e., left hippocampal atrophy and anterogradeamnesia). With respect to abulia the link was less clear. We speculatethat the patient3s neurologic status is better characterized by network-level disruption of functional organization, and not just for abulia. Theassociation of right motor network AFC with left hemiparesis and ofright visual network AFC with a left visual field cut seems apparent.The resting state network correlates of abulia and amnesia likely involvemultiple networks and cannot be determined on the basis of a singlecase that is clinically complex. Possible implications of default modenetwork and cingulo-opercular network disruption are consideredbelow.
Some AFC+ peaks were adjacent to structural lesions; but others,such as left lateral posterior parietal cortex and dorsal ACC,were not. El-evated AFC scores could result from disconnection caused by damagedcortex or whitematter tracts, but correlationmaps fromAFC peaks sug-gest that this is not the case. For example, functional connections be-tween ACC and bilateral insula were disrupted despite the absence of
rom functional connectivity MRI, NeuroImage: Clinical (2014), http://

T
314
315
316
317
318
319
320
321
322
323
324
325
326
327
328
329
330
331
332
333
334
335
336
337
338
339
340
341
342
343
344
345
346
347
348
349
350
351
352
353
354
355
356
357
358
359
360
361
362
363
364
365
366
367
368
369
370
371
372
373
374
375
376
377
378
379
380
381
382
383
384
385
386
387
388
389
390
391
392
393
394
395
396
397
398
399
400
401
402
403
404
405
406
407
408
409
410
411
6 J.S. Siegel et al. / NeuroImage: Clinical xxx (2014) xxx–xxx
UNCO
RREC
direct damage to ACC, insula, or the interconnectingwhitematter tracts.Similar considerations apply to inferior parietal lobule and ventromedi-al prefrontal cortex (Fig. 2C).
5.2. Cingulo-opercular network (CON)
The CON includes the anterior cingulate, bilateral anterior insula,and bilateral anterior thalami (Corbetta et al., 2008; Dosenbach, 2007;Seeley, 2007; Vincent et al., 2008). This network is partially overlappingwith other networks putatively related to executive control: fronto-parietal, ventral attention network, and salience network. The CON isimplicated in task initiation, task switching, and conflict monitoring.FC strength between the ACC and the rest of the CON directly correlateswith performance on a range of executive function tasks involvingworking memory, attention, inhibitory control, fluency, and taskswitching (Onoda et al., 2012).
The anterior cingulate receives input from the anterior thalamus(Papez, 1937) and has been associated with willed action across a vari-ety of paradigms and a variety of imagingmodalities (Carter et al., 1999;Bush et al., 2000; Jahanshahi, 1998). Theoretical models of willed actionhave been formulated in terms of exploration of the environment(Swanson, 2000) and determining actions necessary to obtain desiredgoals (Carter et al., 1999; Luu et al., 2003). A recent report in patientswith implanted electrodes indicates that stimulation of dorsal ACC cor-tex leads to ‘feelings of strongmotivation andwillingness’ (Parvizi et al.,2013). Our patient demonstrates the converse; functional disruption ofthe ACC has led to an amotivational state. Together, these findings high-light the critical role of the ACC, and CO network, in willed action.
Inline Supplementary Fig. S3 can be found online at http://dx.doi.org/10.1016/j.nicl.2014.09.012.
5.3. Default mode network
TheDMN is implicated in introspection, prospection, social cognitionand memory (for a review see Buckner et al., 2008). Previous work hasshown that the hippocampus is functionally coupled within the DMN(Buckner et al., 2008), and DMN resting state functional connectivityhas consistently shown association with memory encoding and recall(Sestieri et al., 2011). Changes to DMN functional connectivity havebeen observed in amnesic patients (Hayes et al., 2012) and reducedDMN connectivity has been reported in patients with memory-associated conditions such as Alzheimer3s disease (Greicius et al.,2004). A prior study on a case of abulia and amnesia similarly found de-creased ipsilateral default network connectivity (Greicius et al., 2004).Interestingly, cases of left anterior thalamic lesions causing abulia ap-pear to consistently show comorbid memory deficit (Nishio et al.,2011). Our interpretation is that disruption of DMN functional connec-tivity is related to the patient3s anterograde amnesia. The patient3sDMN AFC was lateralized to the left hemisphere. Correspondingly,CS02 exhibits a verbal memory deficit, but not a visuospatial memorydeficit (Table 1) (Nishio et al., 2011).
5.4. Limitations and conclusions
This paper demonstrates the use of fcMRI in an individual. Chal-lenges to such an approach arise from normal individual variability inbrain function and brain anatomy. But recent work has shown that reli-able identification of resting state network topography within individ-uals is possible (Hacker et al., 2013; Mennes, 2010). To the extent thatnormality can be defined in resting state network terms, fcMRI can po-tentially offer a non-invasive tool for identifying disruption to functionand network structure. Not withstanding these advantages, a singlecase is insufficient to demonstrate a link between network dysfunctionand clinical deficit.
Our approach was inspired by Stufflebeam et al. (2011) who identi-fied epileptogenic foci in individuals by comparing each voxel3s local
Please cite this article as: Siegel, J.S., et al., The circuitry of abulia: Insights fdx.doi.org/10.1016/j.nicl.2014.09.012
ED P
RO
OF
and global connectedness to that of controls. Although conceptuallysimilar, our approach differs in that the spatial pattern of functional con-nectivity of a given region (functional connectivity ‘fingerprint’) is com-pared to controls. This strategy allows for the possibility that a region3sfunctional connectivity fingerprint may be altered despite no change insum connectedness. Further comparisons are needed to determine theextent to which ‘aberrant’ regions identified by these approaches differ.
The patient presented herein had multiple lesions and structuralchanges. Structural alterations make registration challenging.However, in our experience, adequate atlas transformation(misregistration b 2 mm) is possible even in cases with large lesionsprovided that the lesion is segmented and masked out of the registra-tion computations (He, 2007). AFC+ regions (Fig. S2) had normal FDGPET scores, suggesting that these regions were in gray matter, andtherefore, not identified as abnormal owing to misregistration.
Our patient3s total AFC score fell within the tail of the control distri-bution (Fig. S1B). However, we have not here demonstrated that thismeasure can reliably distinguish patients from controls. We attributethis limitation to the small sample size, limited signal to noise ratio offunctional connectivity data, and natural variability within the popula-tion (Mueller, 2013). A much larger subject sample would be neededto determine if the AFC approach can be used to differentiate affectedindividuals from thenormal population. Future technical improvementsin resting state fMRI (Uğurbil, 2013) most likely will contribute to mak-ing the AFC approach more robust.
Nevertheless, our AFC technique reproducibly localized aberrantfunctional connectivity within an individual (Fig. 4). We believe thatAFC has illuminated the pathophysiology of abulia in a patient withoutACC structural damage. Moreover, our results illustrate the utility offunctional imaging as a means of improving the understanding of neu-rologic deficits.
Uncited references
No citations were found for the following references: Vincent et al.(2006); Jones (2011); Kelley et al. (1998).
Acknowledgements
The authors disclose receipt of the followingfinancial support for theresearch and/or authorship of this article: this study was supportedby the National Institute of Health National Research Scienceaward 5T32GM007200-39, and National Institute of Mental Health5R01HD061117-07 and the National Institute of Health Medical Scien-tist training award 5T32GM007200-40. Additional thanks to LennyRamsey, Jonathan Power, Gagan Wig, and Tim Laumann for guidanceand code and Jennifer Rengachary for technical assistance (all inWashington University Department of Neurology).
Appendix A. Supplementary data
Supplementary data to this article can be found online at http://dx.doi.org/10.1016/j.nicl.2014.09.012.
References
Barris, R.W., Schuman, H.R., 1953. Bilateral anterior cingulate gyrus lesions. Syndrome ofthe anterior cingulate gyri. Neurology 3, 44–52. http://dx.doi.org/10.1212/WNL.3.1.4413013498.
Buckner, R.L., Andrews-Hanna, J.R., Schacter, D.L., 2008. The brain3s default network: anat-omy, function, and relevance to disease. Annals of the New York Academy of Sciences1124, 1–38. http://dx.doi.org/10.1196/annals.1440.01118400922.
Bush, G., Luu, P., Posner, M.I., 2000. Cognitive and emotional influences in anterior cingu-late cortex. Trends in Cognitive Sciences 4, 215–222. http://dx.doi.org/10.1016/S1364-6613(00)01483-210827444.
Carter, A.R., et al., 2010. Resting interhemispheric functional magnetic resonance imagingconnectivity predicts performance after stroke. Annals of Neurology 67, 365–375.http://dx.doi.org/10.1002/ana.2190520373348.
rom functional connectivity MRI, NeuroImage: Clinical (2014), http://

T
440441442443444445446447448449450451452453454455456457458459460461462463464465466467468469470Q8471472473474475476477478479480481482483484485486487488
489490491492493494495496497498499500501502503504505506507508509510511512513514515516517518519520521522523524525526527528529530531532533534Q9535536537538539540541
7J.S. Siegel et al. / NeuroImage: Clinical xxx (2014) xxx–xxx
REC
Carter, C.S., Botvinick, M.M., Cohen, J.D., 1999. The contribution of the anterior cingulatecortex to executive processes in cognition. Reviews in the Neurosciences 10,49–5710356991.
Cohen, R.A., et al., 1999. Alteration of intention and self-initiated action associated withbilateral anterior cingulotomy. Journal of Neuropsychiatry and Clinical Neurosciences11, 444–45310570756.
Corbetta, M., Patel, G., Shulman, G.L., 2008. The reorienting system of the human brain:from environment to theory of mind. Neuron 58, 306–324. http://dx.doi.org/10.1016/j.neuron.2008.04.01718466742.
Dosenbach, N.U.F., et al., 2007. Distinct brain networks for adaptive and stabletask control in humans. Proceedings of the National Academy of Sciences of theUnited States of America 104, 11073–11078. http://dx.doi.org/10.1073/pnas.070432010417576922.
Ghoshal, S., Gokhale, S., Rebovich, G., Caplan, L.R., 2011. The neurology of decreased activ-ity: abulia. Reviews in Neurological Diseases 8, e55–e6722249571.
Greicius, M.D., Srivastava, G., Reiss, A.L., Menon, V., 2004. Default-mode network activitydistinguishes Alzheimer3s disease from healthy aging: evidence from functionalMRI. Proceedings of the National Academy of Sciences of the United States ofAmerica 101, 4637–4642. http://dx.doi.org/10.1073/pnas.030862710115070770.
Hacker, C.D., Laumann, T.O., Szrama, N.P., Baldassarre, A., Snyder, A.Z., 2013. Resting statenetwork estimation in individual subjects. Neuroimage 82 (82), 616–633. http://dx.doi.org/10.1016/j.neuroimage.2013.05.10823735260.
Hayes, S.M., Salat, D.H., Verfaellie, M., Default Network Connectivity in Medial TemporalLobe Amnesia, 2012. Default network connectivity in medial temporal lobe amnesia.Journal of Neuroscience: the Official Journal of the Society for Neuroscience 32,14622–14629a. http://dx.doi.org/10.1523/JNEUROSCI.0700-12.201223077048.
He, B.J., et al., 2007. Breakdown of functional connectivity in frontoparietal networks un-derlies behavioral deficits in spatial neglect. Neuron 53, 905–918. http://dx.doi.org/10.1016/j.neuron.2007.02.01317359924.
Jahanshahi, M., 1998. Willed action and its impairments. Cognitive Neuropsychology 15,483–533. http://dx.doi.org/10.1080/02643299838100522448836.
Jones, D.T., 2011. Default mode network disruption secondary to a lesion in the anteriorthalamus. Archives of Neurology 68, 242–247. http://dx.doi.org/10.1001/archneurol.2010.25920937938.
Jorge, R.E., Starkstein, S.E., Robinson, R.G., 2010. Apathy following stroke. Canadian Journalof Psychiatry. Revue Canadienne de Psychiatrie 55, 350–35420540829.
Kelley, W.M., et al., 1998. Hemispheric specialization in human dorsal frontal cortex andmedial temporal lobe for verbal and nonverbal memory encoding. Neuron 20,927–936. http://dx.doi.org/10.1016/S0896-6273(00)80474-29620697.
Luu, P., Tucker, D.M., Derryberry, D., Reed, M., Poulsen, C., 2003. Electrophysiological re-sponses to errors and feedback in the process of action regulation. Psychological Sci-ence 14, 47–53. http://dx.doi.org/10.1111/1467-9280.0141712564753.
Mega, M.S., Cohenour, R.C., 1997. Akinetic mutism: disconnection of frontal–subcortical circuits. Neuropsychiatry, Neuropsychology, and Behavioral Neurology10, 254–2599359123.
Mega, M.S., Cummings, J.L., 1994. Frontal–subcortical circuits and neuropsychiatric disor-ders. Journal of Neuropsychiatry and Clinical Neurosciences 6, 358–3707841807.
Mennes, M., et al., 2010. Inter-individual differences in resting-state functional connectiv-ity predict task-induced BOLD activity. Neuroimage 50, 1690–1701. http://dx.doi.org/10.1016/j.neuroimage.2010.01.00220079856.
Mueller, S., et al., 2013. Individual variability in functional connectivity architecture of thehuman brain. Neuron 77, 586–595. http://dx.doi.org/10.1016/j.neuron.2012.12.02823395382.
Nishio, Y., Hashimoto, M., Ishii, K., Mori, E., 2011. Neuroanatomy of a neurobehavioraldisturbance in the left anterior thalamic infarction. Journal of Neurology,
UNCO
R
Please cite this article as: Siegel, J.S., et al., The circuitry of abulia: Insights fdx.doi.org/10.1016/j.nicl.2014.09.012
ED P
RO
OF
Neurosurgery, and Psychiatry 82, 1195–1200. http://dx.doi.org/10.1136/jnnp.2010.23646321515557.
Ojemann, J.G., et al., 1997. Anatomic localization and quantitative analysis ofgradient refocused Echo-planar fMRI susceptibility artifacts. Neuroimage 6,156–167. http://dx.doi.org/10.1006/nimg.1997.02899344820.
Onoda, K., Ishihara, M., Yamaguchi, S., 2012. Decreased functional connectivity by aging isassociated with cognitive decline. Journal of Cognitive Neuroscience 24, 2186–2198.http://dx.doi.org/10.1162/jocn_a_0026922784277.
Papez, J.W., 1937. A proposed mechanism of emotion. Archives of Neurology and Psychi-atry 38, 725–743. http://dx.doi.org/10.1001/archneurpsyc.1937.02260220069003.
Parvizi, J., Rangarajan, V., Shirer, W.R., Desai, N., Greicius, M.D., 2013. The will to persevereinduced by electrical stimulation of the human cingulate gyrus. Neuron 80,1359–1367. http://dx.doi.org/10.1016/j.neuron.2013.10.05724316296.
Power, J.D., et al., 2014. Methods to detect, characterize, and remove motionartifact in resting state fMRI. Neuroimage 84, 320–341. http://dx.doi.org/10.1016/j.neuroimage.2013.08.04823994314.
Seeley,W.W., et al., 2007. Dissociable intrinsic connectivity networks for salience process-ing and executive control. Journal of Neuroscience: the Official Journal of the Societyfor Neuroscience 27, 2349–2356. http://dx.doi.org/10.1523/JNEUROSCI.5587-06.200717329432.
Sestieri, C., Corbetta, M., Romani, G.L., Shulman, G.L., 2011. Episodic memoryretrieval, parietal cortex, and the default mode network: functional and topo-graphic analyses. Journal of Neuroscience: the Official Journal of the Society forNeuroscience 31, 4407–4420. http://dx.doi.org/10.1523/JNEUROSCI.3335-10.201121430142.
Stufflebeam, S.M., et al., 2011. Localization of focal epileptic discharges using functionalconnectivity magnetic resonance imaging. Journal of Neurosurgery 114, 1693–1697.http://dx.doi.org/10.3171/2011.1.JNS1048221351832.
Swanson, L.W., 2000. Cerebral hemisphere regulation of motivated behavior.Brain Research 886, 113–164. http://dx.doi.org/10.1016/S0006-8993(00)02905-X11119693.
Uğurbil, K., et al., 2013. Pushing spatial and temporal resolution for functional and diffu-sion MRI in the Human Connectome Project. Neuroimage 80, 80–104. http://dx.doi.org/10.1016/j.neuroimage.2013.05.01223702417.
Vaidya, C.J., Gordon, E.M., 2013. Phenotypic variability in resting-state functional connec-tivity: current status. Brain Connectivity 3, 99–120. http://dx.doi.org/10.1089/brain.2012.011023294010.
Van Meer, M.P., et al., 2010. Recovery of sensorimotor function after experimental strokecorrelates with restoration of resting-state interhemispheric functional connectivity.Journal of Neuroscience: the Official Journal of the Society for Neuroscience 30,3964–3972. http://dx.doi.org/10.1523/JNEUROSCI.5709-09.201020237267.
Vijayaraghavan, L., Krishnamoorthy, E.S., Brown, R.G., Trimble, M.R., 2002. Abulia: aDelphi survey of British neurologists and psychiatrists. Movement Disorders: OfficialJournal of the Movement Disorder Society 17, 1052–1057. http://dx.doi.org/10.1002/mds.1019412360558.
Vincent, J.L., et al., 2006. Coherent spontaneous activity identifies a hippocampal−parietalmemory network. Journal of Neurophysiology 96, 3517–3531. http://dx.doi.org/10.1152/jn.00048.200616899645.
Vincent, J.L., Kahn, I., Snyder, A.Z., Raichle, M.E., Buckner, R.L., 2008. Evidence for afrontoparietal control system revealed by intrinsic functional connectivity. Jour-nal of Neurophysiology 100, 3328–3342. http://dx.doi.org/10.1152/jn.90355.200818799601.
Yeo, B.T.T., et al., 2011. The organization of the human cerebral cortex estimated by intrin-sic functional connectivity. Journal of Neurophysiology 106, 1125–1165. http://dx.doi.org/10.1152/jn.00338.201121653723.
rom functional connectivity MRI, NeuroImage: Clinical (2014), http://