circuitry design for direct wind energy harvest system
TRANSCRIPT
Circuitry Design for Direct Wind Energy Harvest System
Yung Ting a, Chi-Yuan Chang a,b, Hariyanto Gunawan a
aDepartment of Mechanical Engineering, Chung Yuan Christian University, No. 200, Chung Pei Rd.,Chung Li 32023, Taiwan bInstitute of Nuclear Energy Research (INER), Longtan, Taoyuan, 325, Taiwan
Abstract – A wind energy harvest system by using piezoelectric
polyvinylidene fluoride (PVDF) is proposed and investigated in
this research. Nozzle accelerator is designed to collect wind from
environment and increase wind velocity. Using the wind induced
drag force to directly blow and vibrate the PVDF employed on
the subsequent duct is a simple structure of generating electricity
by means of piezoelectric direct effect. Battery-support pull-up
circuitry is designed to harvest very small amount of electricity
from PVDF.
Key words: energy harvest, PVDF
I. INTRODUCTION
New resources energy from environment becomes very
attractive in recent years. Many research works have been
searching alternative energy. Solar and wind resources are the
most feasible alternative resources to produce electric power.
As compared to solar energy, wind power has longer working
period and more cost effective [1]. Traditional wind power
energy utilizes wind turbine or wind generator to harvest wind
energy from the environment and convert into electrical
energy through electromagnetic device. Such a wind energy
generator system, however, is usually heavy and uneasy to
build. Instead of using this expansive generator, the aim of
this research is to investigate a small energy harvest system
using light piezoelectric material. Numerous studies make use
of piezoelectric material to convert mechanical vibration
energy into electrical energy [2]. To name a few, Mohammadi
and Stephen et al. investigated energy harvesting by means of
piezoelectric materials [3-5]. Kasyap et al., tried to obtain
energy from vibration of a cantilever beam attached with a
PZT [6]. Nevertheless, piezoelectric material structure is in
general hard and not flexible. Directly vibrating the
piezoelectric material is unlikely. Auxiliary mechanism is
usually required to indirectly vibrate the piezoelectric material
and generate electricity. Because of satisfactory flexibility of
piezoelectric polyvinylidene fluoride (hereinafter “PVDF”),
an attempt in this study is to develop a simple structure to
directly vibrate the PVDF. Also, with the assistance of using a
nozzle accelerator to increase the wind velocity and the
corresponding drag force, directly vibrate the PVDF to
generate electricity becomes more likely. Some research
works tried to harvest energy by using PVDF. Taylor et al.
converted hydrodynamic energy into electricity and gained
electric power of 1W using PVDF of large size
1321x152.4x0.4mm PVDF [7]. Parker implemented PVDF of
size 100x80x0.028mm into the shoe to harvest energy, which
could obtain electrical power of about 1.1mW [8]. As seen in
the above works, electricity gained from PVDF is very small.
Especially, smaller size of PVDF would generate less
electricity. How to design an appropriate circuitry design to
effectively harvest the electric power of PVDF is demanding.
II. WIND COLLECTOR
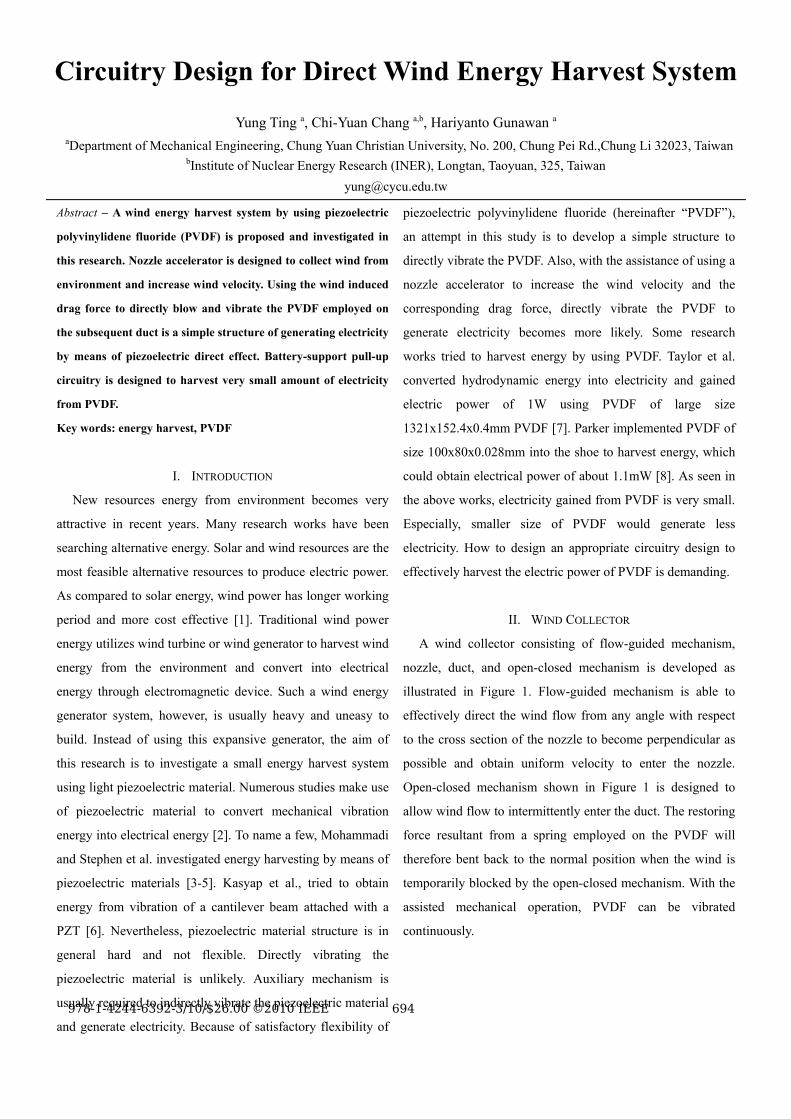
A wind collector consisting of flow-guided mechanism,
nozzle, duct, and open-closed mechanism is developed as
illustrated in Figure 1. Flow-guided mechanism is able to
effectively direct the wind flow from any angle with respect
to the cross section of the nozzle to become perpendicular as
possible and obtain uniform velocity to enter the nozzle.
Open-closed mechanism shown in Figure 1 is designed to
allow wind flow to intermittently enter the duct. The restoring
force resultant from a spring employed on the PVDF will
therefore bent back to the normal position when the wind is
temporarily blocked by the open-closed mechanism. With the
assisted mechanical operation, PVDF can be vibrated
continuously.
978-1-4244-6392-3/10/$26.00 ©2010 IEEE 694
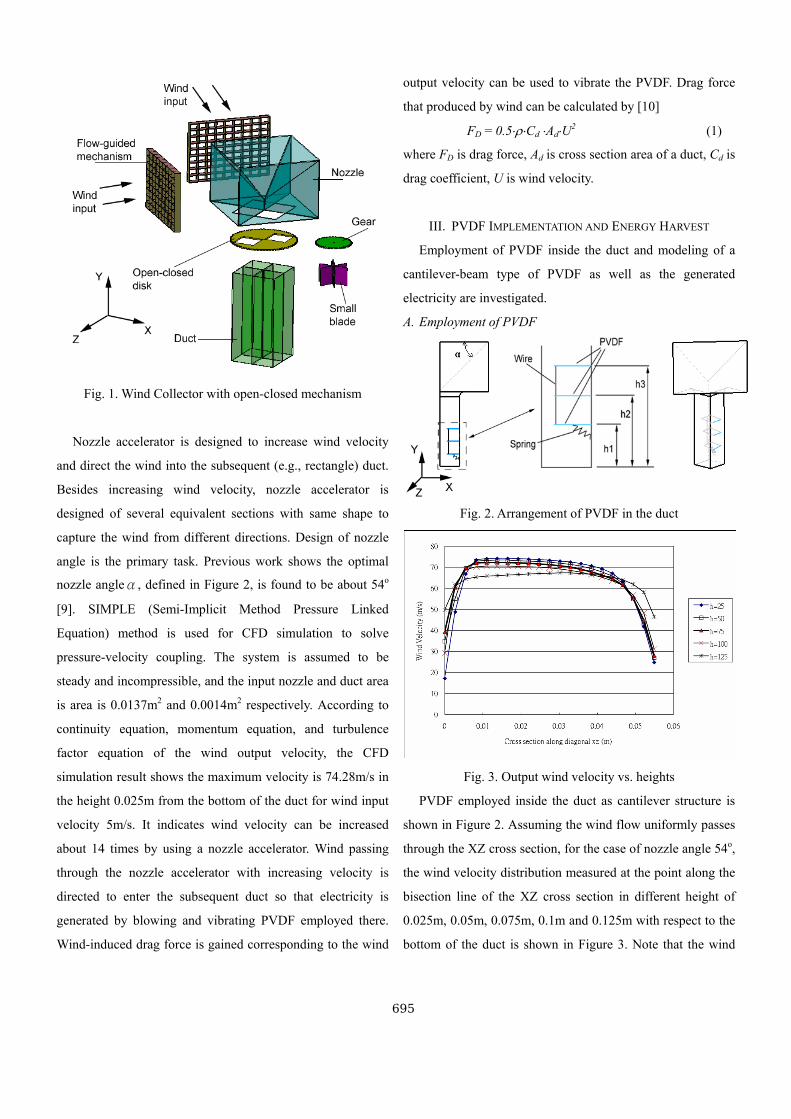
Fig. 1. Wind Collector with open-closed mechanism
Nozzle accelerator is designed to increase wind velocity
and direct the wind into the subsequent (e.g., rectangle) duct.
Besides increasing wind velocity, nozzle accelerator is
designed of several equivalent sections with same shape to
capture the wind from different directions. Design of nozzle
angle is the primary task. Previous work shows the optimal
nozzle angleα, defined in Figure 2, is found to be about 54o
[9]. SIMPLE (Semi-Implicit Method Pressure Linked
Equation) method is used for CFD simulation to solve
pressure-velocity coupling. The system is assumed to be
steady and incompressible, and the input nozzle and duct area
is area is 0.0137m2 and 0.0014m2 respectively. According to
continuity equation, momentum equation, and turbulence
factor equation of the wind output velocity, the CFD
simulation result shows the maximum velocity is 74.28m/s in
the height 0.025m from the bottom of the duct for wind input
velocity 5m/s. It indicates wind velocity can be increased
about 14 times by using a nozzle accelerator. Wind passing
through the nozzle accelerator with increasing velocity is
directed to enter the subsequent duct so that electricity is
generated by blowing and vibrating PVDF employed there.
Wind-induced drag force is gained corresponding to the wind
output velocity can be used to vibrate the PVDF. Drag force
that produced by wind can be calculated by [10]
FD = 0.5⋅ρ⋅Cd ⋅Ad⋅U2 (1)
where FD is drag force, Ad is cross section area of a duct, Cd is
drag coefficient, U is wind velocity.
III. PVDF IMPLEMENTATION AND ENERGY HARVEST
Employment of PVDF inside the duct and modeling of a
cantilever-beam type of PVDF as well as the generated
electricity are investigated.
A. Employment of PVDF
Fig. 2. Arrangement of PVDF in the duct
Fig. 3. Output wind velocity vs. heights
PVDF employed inside the duct as cantilever structure is
shown in Figure 2. Assuming the wind flow uniformly passes
through the XZ cross section, for the case of nozzle angle 54o,
the wind velocity distribution measured at the point along the
bisection line of the XZ cross section in different height of
0.025m, 0.05m, 0.075m, 0.1m and 0.125m with respect to the
bottom of the duct is shown in Figure 3. Note that the wind
695
velocity is low near the corner of the quarter section in the
duct. Therefore, PVDF should not be employed in these
regions.
B. Modeling
In Figure 4, the PVDF cantilever is assumed to be under
uniformly distributed loading. In reference to cantilever beam
theory, the deflection under uniform distribution load can be
calculated as [10]
EI
xxLLxqLx24
)46()(222 +−⋅
=δ (2)
where δ is deflection; q is uniform distribution load; L is
length of PVDF; x is location of the centroid distribution; E is
elastic modulus of PVDF, I is inertia moment (I=wt3/12), w
and t is the width and thickness of PVDF respectively.
Note that multilayer is designed for the PVDF. A stack PVDF
consisting of 10 layers is used in this study.
Response of PVDF can be calculated as [11]
δ⋅⎟⎠⎞
⎜⎝⎛= 31
2
83 h
LtV (3)
( ) 133312113131 cgccgh ⋅++= (4)
where V is electricity voltage; h31 is piezoelectric electric
displacement constant; g31 and g33 are piezoelectric constant
of PVDF; and c11, c12 and c13 are elastic stiffness constant of
PVDF.
Fig. 4. PVDF cantilever structure
C. Estimation of Electricity
For instance, concerning the maximum wind velocity of
74.28m/s. and parameters listed in Table 1 [12], drag force is
calculated about 3.53e-3 N/mm2 by using eq.(1).
TABLE I PARAMETERS
Symbol Description Value Units
Wind
ρ Air density 1.225 Kg/m3
CD Drag coefficient 1.05 --
Ad cross section area of
duct
0.0014 m2
U1 Wind input to nozzle 5 m/s
U2 Wind output from nozzle 74.28 m/s
Piezoelectric PVDF
W width 20 mm
L cantilever Length 60 mm
T Thickness 0.3 mm
E Young’s modulus 53 MPa
g31 Piezoelectric constant 0.198 Vm/N
g33 Piezoelectric constant -0.48 Vm/N
C11 Elastic stiffness constant 3.7 GN/m2
C12 Elastic stiffness constant 1.47 GN/m2
C13 Elastic stiffness constant 1.23 GN/m2
The drag force impacts the PVDF as uniformly distribution
load on the area of PVDF that causes deflection. The
deflection of PVDF is calculated as 5.3mm by using eq.(2)
with parameters listed in Table 1. The electricity voltage can
be estimated about 1.44V by using eq.(3) and (4) with
parameters are listed in Table 1.
IV. PULL-UP CIRCUIT DESIGN AND EXPERIMENT
A. Equivalent Circuit of Piezoelectric PVDF
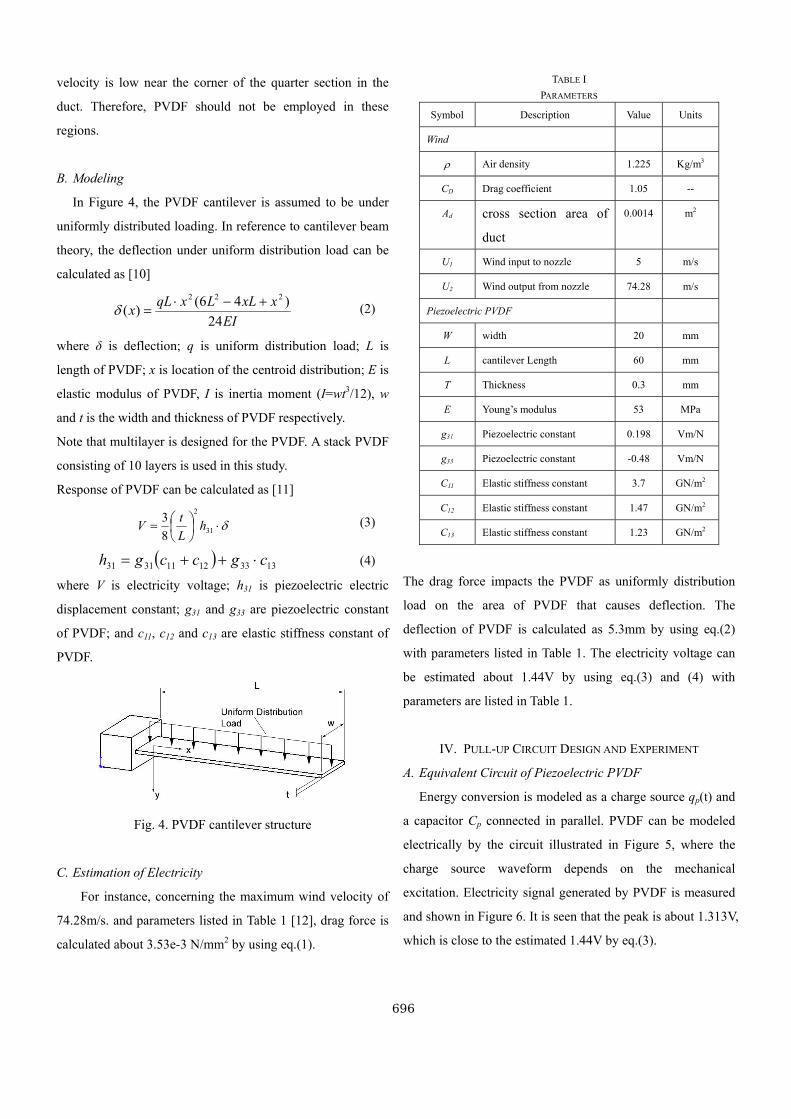
Energy conversion is modeled as a charge source qp(t) and
a capacitor Cp connected in parallel. PVDF can be modeled
electrically by the circuit illustrated in Figure 5, where the
charge source waveform depends on the mechanical
excitation. Electricity signal generated by PVDF is measured
and shown in Figure 6. It is seen that the peak is about 1.313V,
which is close to the estimated 1.44V by eq.(3).
696
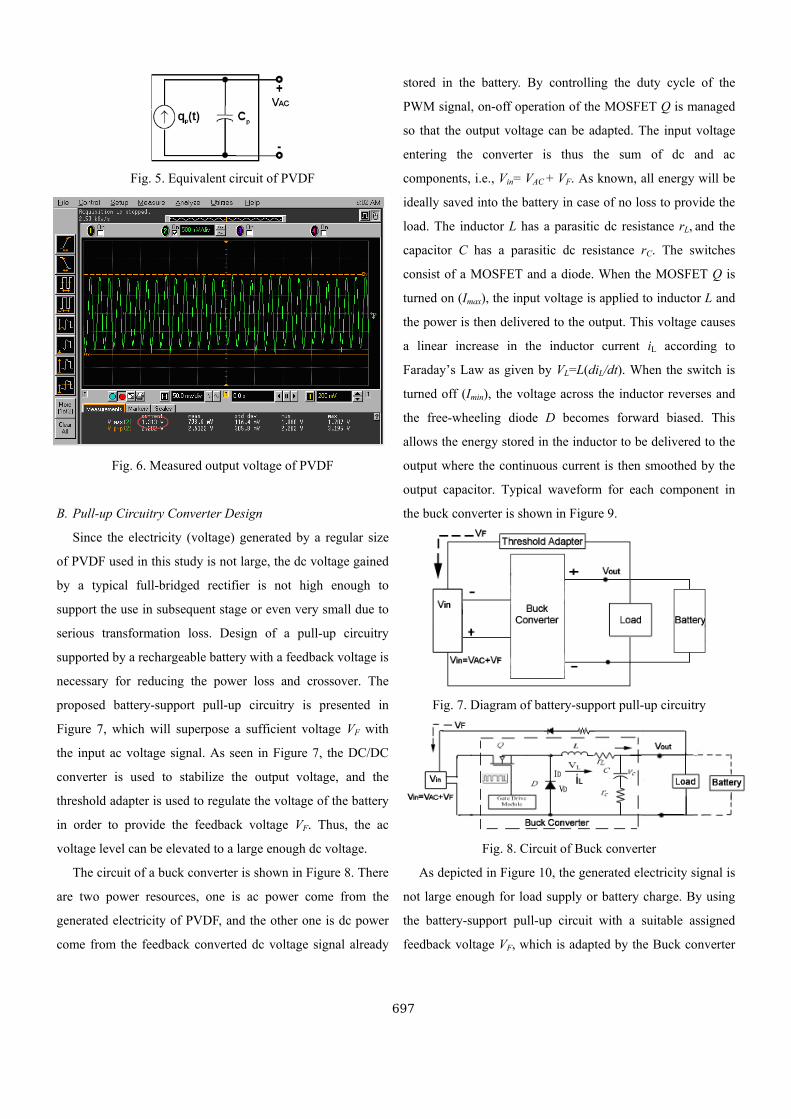
Fig. 5. Equivalent circuit of PVDF
Fig. 6. Measured output voltage of PVDF
B. Pull-up Circuitry Converter Design
Since the electricity (voltage) generated by a regular size
of PVDF used in this study is not large, the dc voltage gained
by a typical full-bridged rectifier is not high enough to
support the use in subsequent stage or even very small due to
serious transformation loss. Design of a pull-up circuitry
supported by a rechargeable battery with a feedback voltage is
necessary for reducing the power loss and crossover. The
proposed battery-support pull-up circuitry is presented in
Figure 7, which will superpose a sufficient voltage VF with
the input ac voltage signal. As seen in Figure 7, the DC/DC
converter is used to stabilize the output voltage, and the
threshold adapter is used to regulate the voltage of the battery
in order to provide the feedback voltage VF. Thus, the ac
voltage level can be elevated to a large enough dc voltage.
The circuit of a buck converter is shown in Figure 8. There
are two power resources, one is ac power come from the
generated electricity of PVDF, and the other one is dc power
come from the feedback converted dc voltage signal already
stored in the battery. By controlling the duty cycle of the
PWM signal, on-off operation of the MOSFET Q is managed
so that the output voltage can be adapted. The input voltage
entering the converter is thus the sum of dc and ac
components, i.e., Vin= VAC + VF. As known, all energy will be
ideally saved into the battery in case of no loss to provide the
load. The inductor L has a parasitic dc resistance rL, and the
capacitor C has a parasitic dc resistance rC. The switches
consist of a MOSFET and a diode. When the MOSFET Q is
turned on (Imax), the input voltage is applied to inductor L and
the power is then delivered to the output. This voltage causes
a linear increase in the inductor current iL according to
Faraday’s Law as given by VL=L(diL/dt). When the switch is
turned off (Imin), the voltage across the inductor reverses and
the free-wheeling diode D becomes forward biased. This
allows the energy stored in the inductor to be delivered to the
output where the continuous current is then smoothed by the
output capacitor. Typical waveform for each component in
the buck converter is shown in Figure 9.
Fig. 7. Diagram of battery-support pull-up circuitry
Fig. 8. Circuit of Buck converter
As depicted in Figure 10, the generated electricity signal is
not large enough for load supply or battery charge. By using
the battery-support pull-up circuit with a suitable assigned
feedback voltage VF, which is adapted by the Buck converter
697
based upon the battery’s voltage VB, the output can be
elevated to satisfy the application need.
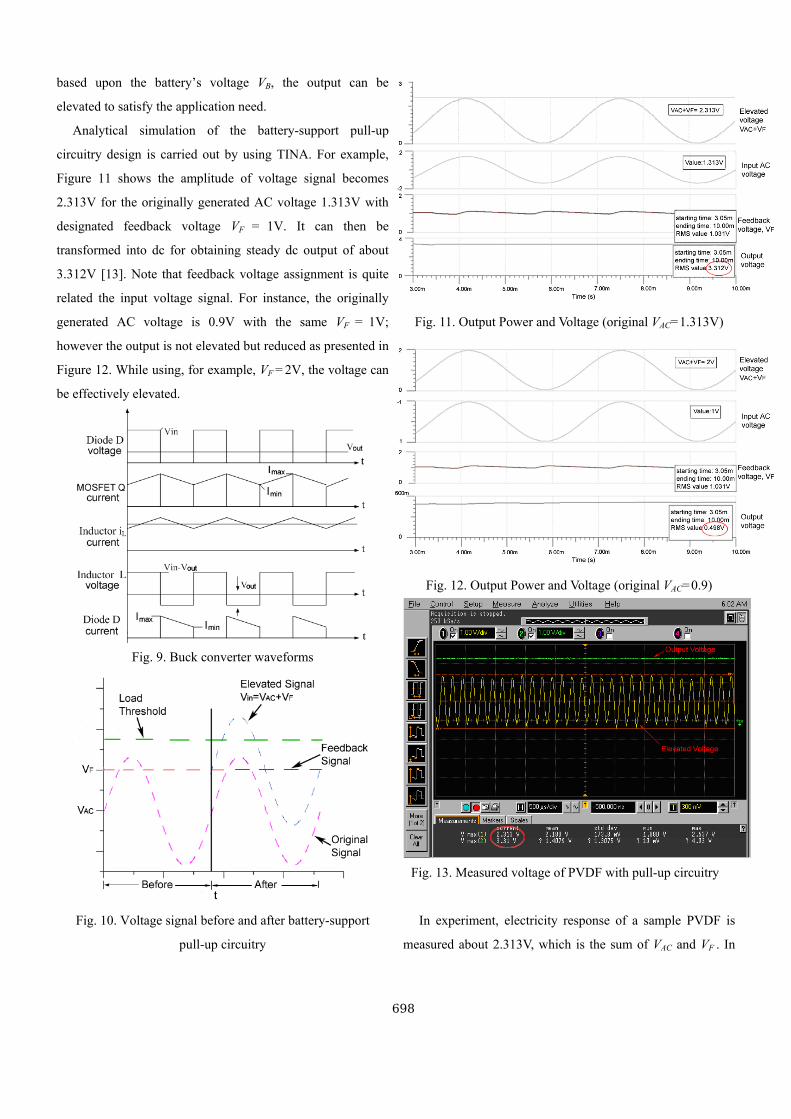
Analytical simulation of the battery-support pull-up
circuitry design is carried out by using TINA. For example,
Figure 11 shows the amplitude of voltage signal becomes
2.313V for the originally generated AC voltage 1.313V with
designated feedback voltage VF = 1V. It can then be
transformed into dc for obtaining steady dc output of about
3.312V [13]. Note that feedback voltage assignment is quite
related the input voltage signal. For instance, the originally
generated AC voltage is 0.9V with the same VF = 1V;
however the output is not elevated but reduced as presented in
Figure 12. While using, for example, VF = 2V, the voltage can
be effectively elevated.
Fig. 9. Buck converter waveforms
Fig. 10. Voltage signal before and after battery-support
pull-up circuitry
Fig. 11. Output Power and Voltage (original VAC=1.313V)
Fig. 12. Output Power and Voltage (original VAC=0.9)
Fig. 13. Measured voltage of PVDF with pull-up circuitry
In experiment, electricity response of a sample PVDF is
measured about 2.313V, which is the sum of VAC and VF . In
698
Figure 13, it is seen that the output voltage can be elevated to
3.31V by using battery-support pull-up circuitry. The output
voltage using simulation and experiment show the similar
output voltage which indicates both are with a close
approximation.
V. CONCLUSIONS
A nozzle accelerator is designed to collect wind in the
ambient environment and increase the wind speed. From
simulation results, about 14 times velocity increases and it
indicates the proposed wind accelerator is quite efficient.
Flexible PVDF employed in the appropriate position inside
the duct encountered with such wind velocity could have
larger displacement. Electrical power of PVDF may be small
and its voltage level is less than the threshold for application
need. The proposed battery-support pull-up circuitry design is
capable of elevating the voltage level of the generated
electricity signal so that the harvested small power can be
more likely either stored into the battery or used in the load.
Simulation and experiment results of battery-support pull-up
circuitry are both carried out to obtain a good agreement and
verify its good performance.
ACKNOWLEDGEMENTS
This research was founded by National Science Council
under the grant NSC98-2221-E-033-035-MY2, and the
CYCU Distinctive Research Area Project as grant
CYCU-98-CR-ME, and supported by Soundwide Technology
Corp.
REFERENCES
[1] http://www.FullEarth4EnergyReview.com
[2] R.A. Steven and H.A. Sodano, “A Review of Power Harvesting Using
Piezoelectric Materials”, Smart Mater. Struct. 16, 2007, pp.1-21.
[3] F. Mohammadi, A. Khan and R.B. Cass, “Power generation from
piezoelectric lead zirconate titanate fiber composites” Proc. Materials
Research Symp., 2003, pp. 736.
[4] N.G. Stephen, “On energy harvesting from ambient vibration,” J. Sound
Vib., 293, 2006, pp.409–25.
[5] J.Q. Liu., H.B. Fang, Z.Y. Xu., X.H. Mao, X.C. Shen, D. Chen, H. Liao,
and B.C. Cai, “A MEMS-based piezoelectric power generator array for
vibration energy harvesting,” J. Microelectronic, 39, 2008, pp.802-806.
[6] A. Kasyap, J.S. Lim, D. Johnson, S. Horowits, T. Nishida, K. Ngo, M.
Sheplak, L. Cattafesta, “Energy Reclamation from a Vibrating
Piezoceramic Composite Beam,” Ninth Int. Congress on Sound and
Vibration, ICSV9, 2002.
[7] G.W. Taylor, J.R. Burns, S.M. Kamman, W.B. Powers, and T.R. Welsh,
“The Energy Harvesting Eel: A Small Subsurface Ocean/River Power
Generator,” IEEE Journal of Oceanic Engineering, 26(4), 2001, pp.
539-547.
[8] M. Parker, “Ambient Energy Harvesting,” BS thesis, School of
Information Technology and Engineering, University of Queensland,
Brisbane, QLD, Oct. 2003.
[9] T. Hosoe, T. Kamiya, K. Yukita, Y. Goto, K. Ichiyanagi, T. Kasukabe,
“High-Efficient Utilization of Wind Power Generator Using the Wind
Collector,” IEEJ Transactions on Power and Energy, vol. 126(3),
2006, pp. 308-314.
[10] A. Revel and B.P. Huynh, “Characterizing Roof Ventilators,” 15th
Australasian Fluid Mechanics Conference, 2004.
[11] J.M. Gere and S.P. Timoshenko, “Mechanics of Materials,” 4th ed.
Boston: PWS Publishing Company, 1997.
[12] Y. Roh, V.V. Varadan, and V.K. Varadan, “Characterization of All the
Electic, Dielectric and Piezoelectric Constants of uniaxially oriented
poled PVDF films,” IEEE Transactions on Ultrasonics, Ferroelectics
and Frequency Control. 49(6), 2002, pp.836-847.
[13] J.C.P Liu, C. Tse, N.K. Poon, Y.M. Lai, M.H. Pong,“Synthesis of
input-rectifierless AC/DC converter,” IEEE Transactions on Power
Electronics, Vol. 19, 2004, pp. 179-182.
699